 Deutsch
 English
 Español
 Français
 Italiano
 Nederlands
 Polski
 Português
 Русский
 Türkçe
 Svenska
 Chinese
 Magyar
Recenzja Gigabyte GeForce RTX 4080 Super Gaming OC 16G: Wymienia ciosy z RX 7900 XTX za 200 USD mniej niż RTX 4080 non-Super

Do tej pory zrecenzowaliśmy kilka nowych kart graficznych z serii RTX 40 Super, w tym RTX 4070 Super Founders Edition, Gigabyte RTX 4070 Super Gaming OCoraz Asus TUF Gaming RTX 4070 Ti Super.
Teraz mamy z nami Gigabyte GeForce RTX 4080 Super Gaming OC 16G - odświeżenie w połowie cyklu życia, które w pełni zastępuje poprzedni odpowiednik RTX 4080.
Podczas gdy oryginalny RTX 4080 posiadał 9 728 rdzeni CUDA, nowy RTX 4080 Super w pełni maksymalizuje możliwości matrycy AD103, posiadając wszystkie 10 240 rdzeni CUDA pracujących z pełną wydajnością. Jest to tylko 5% wzrost liczby shaderów, co nie jest zbyt imponujące w przeciwieństwie do RTX 4070 Super (+21%) i RTX 4070 Super Ti (+10%). Pamięć VRAM pozostaje taka sama i wynosi 16 GB GDDR6X, ale ogólna przepustowość została nieznacznie zwiększona do 736,3 GB/s w porównaniu do 716,8 GB/s w RTX 4080 non-Super.
Cena detaliczna RTX 4080 Super wynosi 1000 USD w porównaniu do 200 USD wyższej ceny wywoławczej oryginału. Wersja RTX 4080 Super od Gigabyte dodaje kilka dodatkowych korzyści za symboliczną dopłatą 50 USD przy sugerowanej cenie detalicznej 1050 USD.
W Indiach ten procesor graficzny można obecnie nabyć w przedziale od 1 20 000 do 1 28 000 jenów, w zależności od sprzedawcy, i jest on objęty standardową trzyletnią gwarancją z możliwością przedłużenia o dodatkowy rok.
W niniejszej recenzji przyjrzymy się karcie Gigabyte RTX 4080 Super Gaming OC i sprawdzimy, czy rzekomy wzrost wydajności i cena są rozsądne, zwłaszcza w obliczu premiery Blackwell, która ma nastąpić jeszcze w tym roku.
Porównanie karty Gigabyte GeForce RTX 4080 Super Gaming OC 16G z innymi kartami graficznymi Nvidia
| Specyfikacja | RTX 4090 FE | Gigabyte RTX 4080 Super Gaming OC | RTX 4080 FE | Asus TUF RTX 4070 Ti Super | RTX 4070 Super FE | ZotacRTX 4070 AMP Airo | KFA2RTX 4060 Ti EX | RTX 3090 Ti FE | RTX 3090 FE | RTX 3080 Ti FE | RTX 3070 FE | Titan RTX |
|---|---|---|---|---|---|---|---|---|---|---|---|---|
| Chip | AD102 | AD103 | AD103 | AD103 | AD104 | AD104 | AD106 | GA102 | GA102 | GA102 | GA104 | TU102 |
| Proces FinFET | Niestandardowy 4N | Niestandardowy 4N | Niestandardowy 4N | Niestandardowy 4N | Niestandardowy 4N | Niestandardowy 4N | Niestandardowy 4N | 8 nm | 8 nm | 8 nm | 8 nm | 12 nm |
| Rdzenie CUDA | 16,384 | 10,240 | 9,728 | 8,448 | 7,168 | 5,888 | 4,352 | 10,752 | 10,496 | 10,240 | 5,888 | 4,608 |
| Jednostki tekstury | 512 | 320 | 304 | 264 | 224 | 184 | 136 | 336 | 328 | 320 | 184 | 288 |
| Rdzenie tensorowe | 512 4. gen. | 320 4. gen. | 304 4. gen. | 264 4. gen. | 224 4. gen. | 184 4. gen. | 136 4. gen. | 336 3. gen. | 328 3. gen. | 320 3. gen. | 184 3. gen. | 576 2. gen. |
| Rdzenie RT | 128 3. gen. | 80 3. gen. | 76 3. gen. | 66 3. gen. | 56 3. gen. | 46 3. gen. | 34 3. gen. | 84 2. gen. | 82 2. gen. | 80 2. gen. | 46 2. gen. | 72 |
| Zegar bazowy GPU | 2,235 MHz | 2,295 MHz | 2,205 MHz | 2,340 MHz | 1,980 MHz | 1,920 MHz | 2,310 MHz | 1,560 MHz | 1,395 MHz | 1,365 MHz | 1,500 MHz | 1,350 MHz |
| GPU Boost Clock | 2,520 MHz | 2,595 MHz | 2,505 MHz | 2,610 MHz | 2,475 MHz | 2,535 MHz | 2,535 MHz | 1,860 MHz | 1,695 MHz | 1,665 MHz | 1,750 MHz | 1,770 MHz |
| Magistrala pamięci | 384-bitowa | 256-bitowa | 256-bitowa | 256-bitowa | 192-bitowa | 192-bitowa | 128-bitowa | 384-bitowa | 384-bitowa | 384-bitowa | 256-bitowa | 384-bitowa |
| Przepustowość pamięci | 1 008 GB/s | 736,3 GB/s | 716,8 GB/s | 672 GB/s | 504 GB/s | 504 GB/s | 288 GB/s | 1 008 GB/s | 936 GB/s | 912 GB/s | 448 GB/s | 672 GB/s |
| Pamięć wideo | 24 GB GDDR6X | 16 GB GDDR6X | 16 GB GDDR6X | 16 GB GDDR6X | 12 GB GDDR6X | 12 GB GDDR6X | 8 GB GDDR6 | 24 GB GDDR6X | 24 GB GDDR6X | 12 GB GDDR6X | 8 GB GDDR6 | 24 GB GDDR6 |
| Pobór mocy | 450 W | 320 W | 320 W | 285 W | 220 W | 215 W | 160 W | 450 W | 350 W | 350 W | 220 W | 280 W |
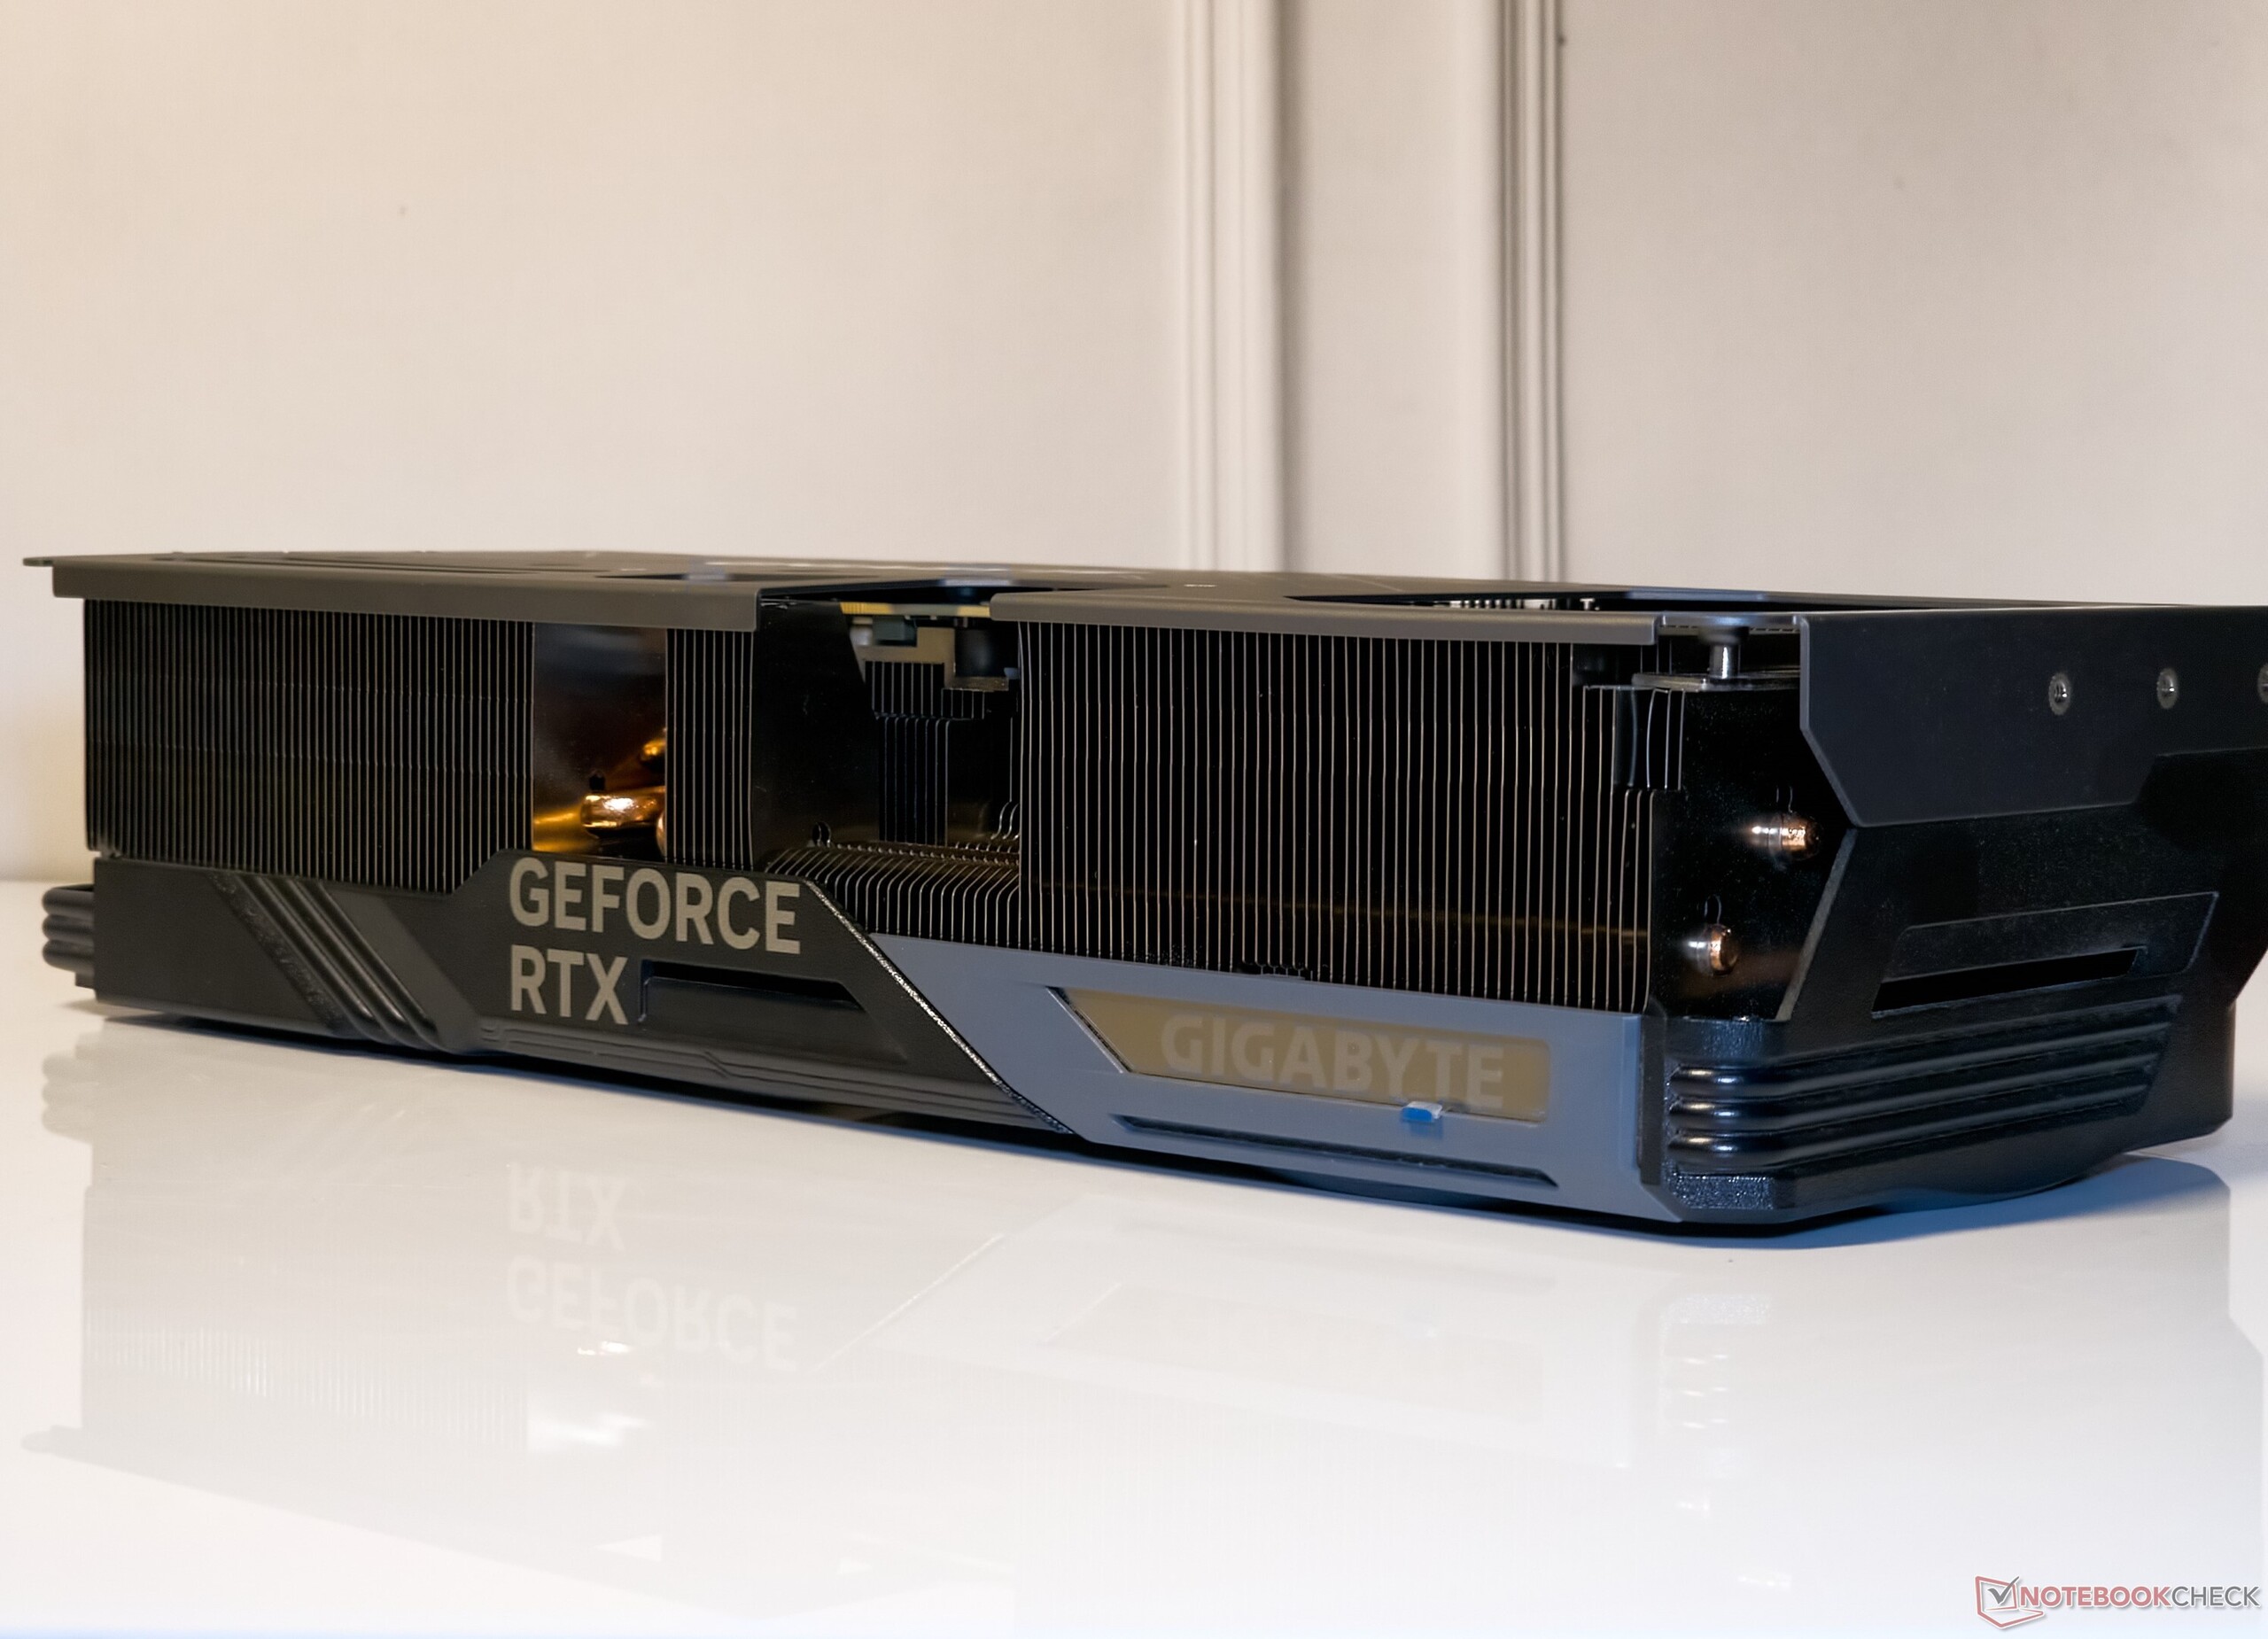
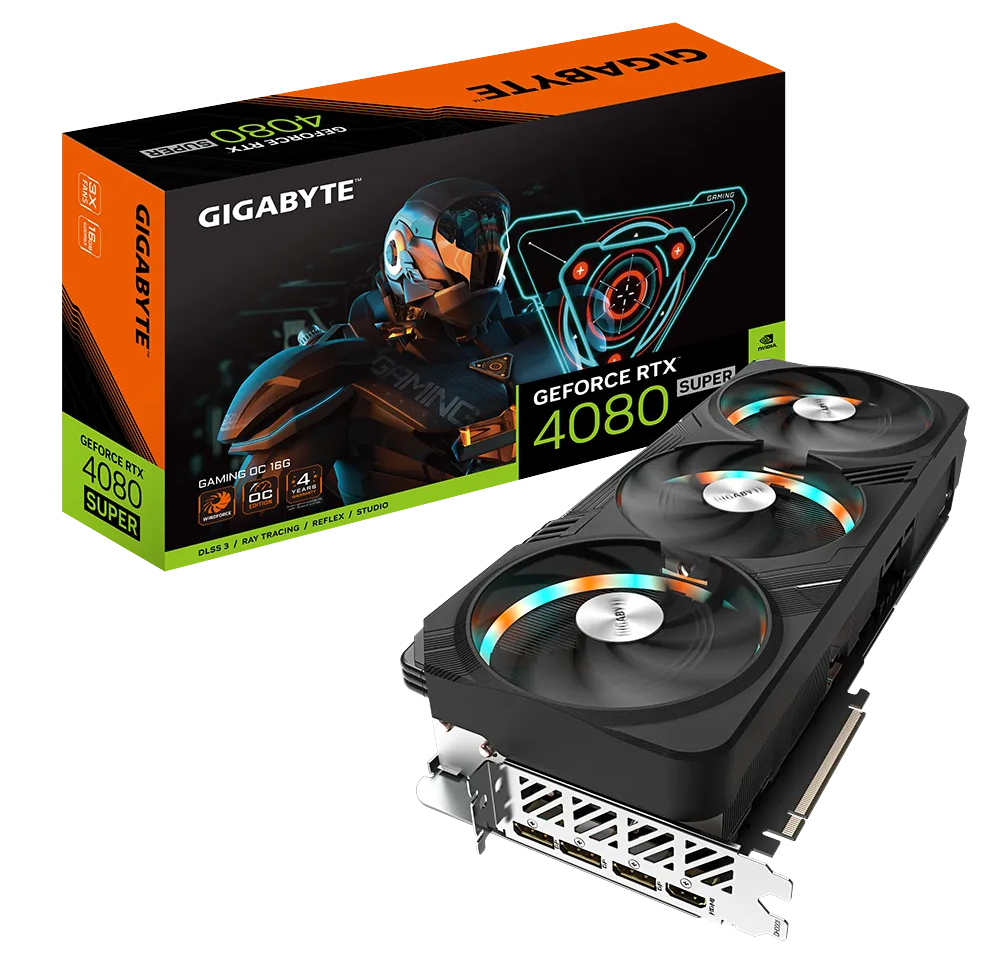
Gigabyte GeForce RTX 4080 Super Gaming OC z bliska
Gigabyte nie zmienił konstrukcji RTX 4080 Super Gaming OC 16G w porównaniu do swojego poprzednika. Przy wymiarach 342 x 150 x 75 mm i wadze około 1,74 kg, RTX 4080 Super Gaming OC zajmuje prawie trzy sloty PCIe na płycie, więc idealnie sprawdzi się w większej obudowie i na płycie głównej E-ATX.
Karta posiada plastikową, ale solidną osłonę przednią i metalową płytę tylną. Efekty RGB są podobne do tego, co widzieliśmy w przypadku RTX 4070 Super Gaming OC - świecące logo Gigabyte na górze i oświetlenie pierścieniowe wzdłuż obwodu każdego wentylatora.


Zawartość pudełka obejmuje skróconą instrukcję obsługi, kartę gwarancyjną, złącze zasilania 12VHPWR na 3x 8-pin, wsporniki i śruby.
RTX 4080 Super Gaming OC oferuje standardowy zestaw portów, w tym 3x DisplayPort 1.4-out i 1x HDMI 2.1a-out.
Jak to zwykle bywa w przypadku kart Gigabyte, do przełączania pomiędzy trybami BIOS OC i Silent służy przełącznik dual-BIOS.
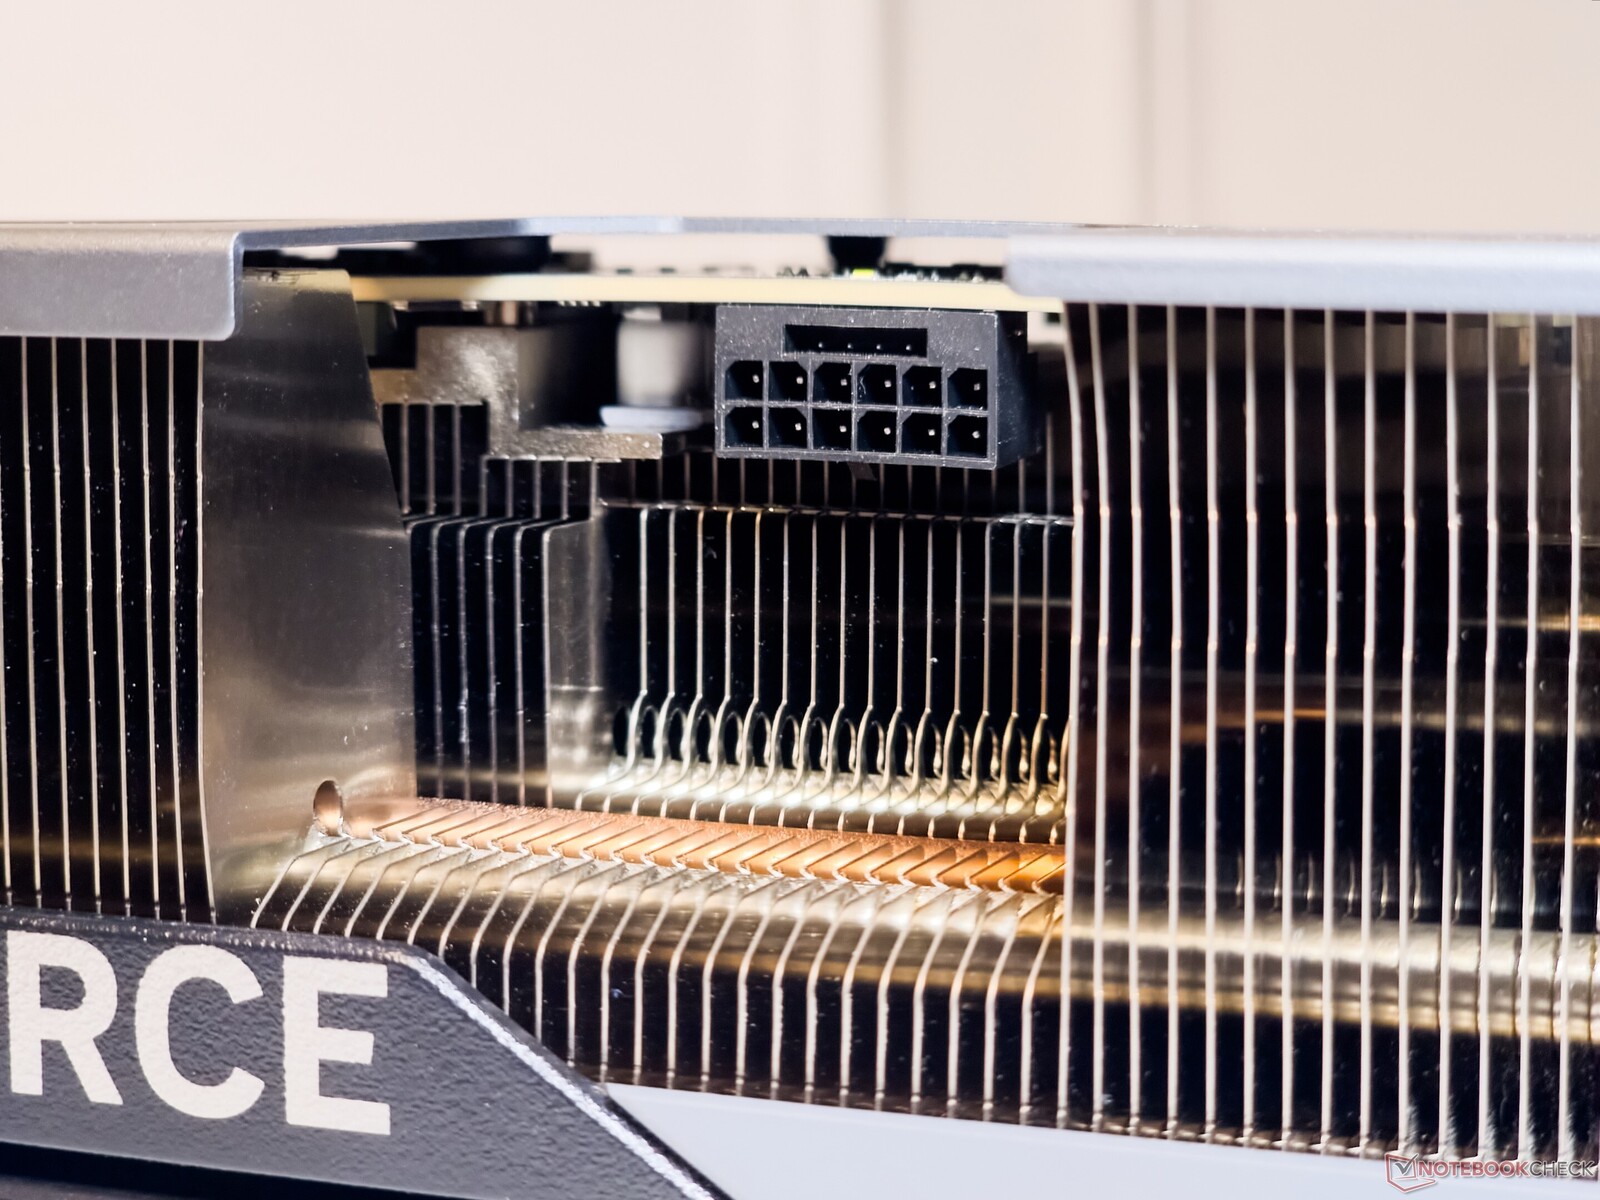
Zasilanie GPU jest obsługiwane przez domyślne złącze 12VHPWR. Nie mieliśmy żadnych problemów z dopasowaniem zasilacza do 16-pinowego złącza PCIe Gen 5. Jako środek zapobiegawczy, Gigabyte zapewnia również wskaźnik LED, który świeci, aby wskazać wszelkie problemy z połączeniem.


Karta Gigabyte GeForce RTX 4080 Super Gaming OC 16G może zwiększyć taktowanie do 2595 MHz i ma dodatkowy 25% zapas mocy, aby umożliwić zwiększenie TGP do 400 W.


Aspekty GPU, takie jak podkręcanie, krzywe wentylatorów i efekty RGB można kontrolować za pomocą Gigabyte Control Center.


Test porównawczy: RTX 4080 Super Gaming OC wraz z Core i9-13900K
Nasz system testowy nadal opiera się na procesorze Intel Core i9-13900K i platformie Z790, aby upewnić się, że karty nie są wąskim gardłem procesora. Konfiguracja obejmuje:
- Stanowisko testowe Cooler Master MasterFrame 700
- IntelCore i9-13900K z PL1=PL2
- Płyta główna Gigabyte Z790 Aorus Master
- Dysk SSD Gigabyte Aorus Gen4 2 TB NVMe
- Dysk SSD Sabrent Rocket 4 Plus Gen4 2 TB NVMe
- 2x 16 GB pamięci RAM Kingston Fury Renegade DDR5-6400 z timingami 32-39-39-80 przy 1,40 V
- MonitorMSI MAG 274UPF 4K 144 Hz
- Cooler Master MasterLiquid ML360L V2 ARGB AiO cooler
- W pełni modularny zasilacz Cooler Master MVE Gold V2 1250 ATX 3.0
Zastosowano system Windows 11 23H2 z najnowszymi łatkami oraz sterownik Nvidia Game Ready Driver w wersji 552.12.
W oparciu o nasze wewnętrzne testy, wydajność Core i9-13900K i chipsetu Z790 jest porównywalna z wydajnością procesora AMD Ryzen 9 7950X i konfiguracji X670E.
Chcielibyśmy podziękować firmie Cooler Master za dostarczenie stanowiska testowego, chłodnicy i zasilacza, firmie Gigabyte za płytę główną, procesor i dysk SSD, firmie Sabrent za dysk SSD, firmie MSI za monitor oraz firmie Kingston za pamięć.
Syntetyczne testy porównawcze: ogólny wzrost o 5% w porównaniu do RTX 4080
Łączna wydajność w syntetycznych testach porównawczych pokazuje, że RTX 4080 Super Gaming OC ma 5% przewagę nad RTX 4080 Founders Edition (FE), co odpowiada równoważnemu wzrostowi liczby rdzeni CUDA. Większe różnice pomiędzy tymi dwiema kartami zaobserwowano w 3DMark Port Royal (+7%) i 3DMark 11 Performance GPU (+11%).
RTX 4080 Super Gaming OC w dużej mierze pokrywa się z AMD Radeon RX 7900 XTX w ogólnych testach syntetycznych, ale ten drugi wykazuje przyzwoite zyski w 3DMark Fire Strike i Time Spy.
Wyniki Unigine wskazują na 2-5% wzrost w przypadku RTX 4080 Super Gaming OC w porównaniu do RTX 4080 Founders Edition.
Karta RTX 4090 Founders Edition nadal pozostaje kartą do pokonania z wynikami o 25% wyższymi niż RTX 4080 Super Gaming OC.
3DMark 11: 1280x720 Performance GPU
3DMark: 1920x1080 Fire Strike Graphics | 3840x2160 Fire Strike Ultra Graphics | Fire Strike Extreme Graphics | 2560x1440 Time Spy Graphics | 2560x1440 Port Royal Graphics | 2560x1440 Speed Way Score
Unigine Heaven 4.0: Extreme Preset DX11 | Extreme Preset OpenGL
Unigine Valley 1.0: 1920x1080 Extreme HD DirectX AA:x8 | 1920x1080 Extreme HD Preset OpenGL AA:x8
Unigine Superposition: 1280x720 720p Low | 1920x1080 1080p Extreme | 3840x2160 4k Optimized | 7680x4320 8k Optimized
| Performance Rating | |
| NVIDIA GeForce RTX 4090 Founders Edition | |
| AMD Radeon RX 7900 XTX | |
| Gigabyte GeForce RTX 4080 Super Gaming OC | |
| NVIDIA GeForce RTX 4080 Founders Edition | |
| AMD Radeon RX 7900 XT | |
| Asus TUF Gaming GeForce RTX 4070 Ti Super | |
| Gigabyte Aorus GeForce RTX 4070 Ti Master | |
| Asus TUF Gaming GeForce RTX 4070 Ti | |
| Average NVIDIA GeForce RTX 4070 Ti | |
| Gigabyte GeForce RTX 4070 Super Gaming OC 12G | |
| Average NVIDIA GeForce RTX 3080 Ti | |
| NVIDIA GeForce RTX 4070 Super Founders Edition | |
| Average NVIDIA GeForce RTX 3090 | |
| AMD Radeon RX 7800 XT | |
| Zotac Gaming GeForce RTX 4070 AMP Airo | |
| Average NVIDIA GeForce RTX 3080 -1! | |
| Average of class Desktop | |
| Sapphire Pulse Radeon RX 7700 XT | |
| Average NVIDIA Titan RTX | |
| Average NVIDIA GeForce RTX 4060 Ti 8G | |
| KFA2 GeForce RTX 4060 Ti EX, 16GB GDDR6 | |
| XFX Speedster QICK 308 Radeon RX 7600 Black Edition | |
| KFA2 GeForce RTX 4060 1-Click-OC 2X | |
| 3DMark / Speed Way Score | |
| NVIDIA GeForce RTX 4090 Founders Edition | |
| Gigabyte GeForce RTX 4080 Super Gaming OC | |
| NVIDIA GeForce RTX 4080 Founders Edition | |
| Average of class Desktop (4463 - 9928, n=12, last 2 years) | |
| Asus TUF Gaming GeForce RTX 4070 Ti Super | |
| AMD Radeon RX 7900 XTX | |
| Gigabyte Aorus GeForce RTX 4070 Ti Master | |
| Asus TUF Gaming GeForce RTX 4070 Ti | |
| Asus TUF Gaming GeForce RTX 4070 Ti (Quiet BIOS) | |
| Average NVIDIA GeForce RTX 4070 Ti (5392 - 5467, n=5) | |
| Gigabyte GeForce RTX 4070 Super Gaming OC 12G | |
| Average NVIDIA GeForce RTX 3080 Ti (5195 - 5223, n=2) | |
| Average NVIDIA GeForce RTX 3090 (5173 - 5227, n=3) | |
| NVIDIA GeForce RTX 4070 Super Founders Edition | |
| AMD Radeon RX 7900 XT | |
| Zotac Gaming GeForce RTX 4070 AMP Airo | |
| AMD Radeon RX 7800 XT | |
| Average NVIDIA Titan RTX (3182 - 3186, n=2) | |
| Average NVIDIA GeForce RTX 4060 Ti 8G (3158 - 3206, n=2) | |
| KFA2 GeForce RTX 4060 Ti EX, 16GB GDDR6 | |
| Sapphire Pulse Radeon RX 7700 XT | |
| KFA2 GeForce RTX 4060 1-Click-OC 2X | |
| XFX Speedster QICK 308 Radeon RX 7600 Black Edition | |
| Unigine Heaven 4.0 / Extreme Preset DX11 | |
| NVIDIA GeForce RTX 4090 Founders Edition | |
| Gigabyte GeForce RTX 4080 Super Gaming OC | |
| AMD Radeon RX 7900 XTX | |
| NVIDIA GeForce RTX 4080 Founders Edition | |
| AMD Radeon RX 7900 XT | |
| Gigabyte Aorus GeForce RTX 4070 Ti Master | |
| Asus TUF Gaming GeForce RTX 4070 Ti | |
| Average NVIDIA GeForce RTX 4070 Ti (312 - 319, n=4) | |
| Asus TUF Gaming GeForce RTX 4070 Ti Super | |
| Average NVIDIA GeForce RTX 3090 (272 - 315, n=11) | |
| Average NVIDIA GeForce RTX 3080 Ti (290 - 312, n=4) | |
| Gigabyte GeForce RTX 4070 Super Gaming OC 12G | |
| NVIDIA GeForce RTX 4070 Super Founders Edition | |
| Zotac Gaming GeForce RTX 4070 AMP Airo | |
| Average NVIDIA GeForce RTX 3080 (233 - 253, n=2) | |
| AMD Radeon RX 7800 XT | |
| Average NVIDIA Titan RTX (207 - 248, n=12) | |
| Average of class Desktop (4.5 - 472, n=21, last 2 years) | |
| Sapphire Pulse Radeon RX 7700 XT | |
| Average NVIDIA GeForce RTX 4060 Ti 8G (178.9 - 181.6, n=3) | |
| KFA2 GeForce RTX 4060 Ti EX, 16GB GDDR6 | |
| KFA2 GeForce RTX 4060 1-Click-OC 2X | |
| XFX Speedster QICK 308 Radeon RX 7600 Black Edition | |
| Unigine Heaven 4.0 / Extreme Preset OpenGL | |
| NVIDIA GeForce RTX 4090 Founders Edition | |
| Gigabyte GeForce RTX 4080 Super Gaming OC | |
| AMD Radeon RX 7900 XTX | |
| NVIDIA GeForce RTX 4080 Founders Edition | |
| AMD Radeon RX 7900 XT | |
| Asus TUF Gaming GeForce RTX 4070 Ti Super | |
| Gigabyte Aorus GeForce RTX 4070 Ti Master | |
| Average NVIDIA GeForce RTX 4070 Ti (291 - 297, n=4) | |
| Asus TUF Gaming GeForce RTX 4070 Ti | |
| Gigabyte GeForce RTX 4070 Super Gaming OC 12G | |
| NVIDIA GeForce RTX 4070 Super Founders Edition | |
| Average NVIDIA GeForce RTX 3080 Ti (264 - 282, n=4) | |
| Average NVIDIA GeForce RTX 3090 (188.2 - 284, n=10) | |
| AMD Radeon RX 7800 XT | |
| Average NVIDIA GeForce RTX 3080 (232 - 243, n=2) | |
| Zotac Gaming GeForce RTX 4070 AMP Airo | |
| Average NVIDIA Titan RTX (203 - 299, n=12) | |
| Sapphire Pulse Radeon RX 7700 XT | |
| Average of class Desktop (4 - 450, n=21, last 2 years) | |
| Average NVIDIA GeForce RTX 4060 Ti 8G (173 - 176, n=3) | |
| KFA2 GeForce RTX 4060 Ti EX, 16GB GDDR6 | |
| XFX Speedster QICK 308 Radeon RX 7600 Black Edition | |
| KFA2 GeForce RTX 4060 1-Click-OC 2X | |
| Unigine Valley 1.0 / Extreme HD DirectX | |
| NVIDIA GeForce RTX 4090 Founders Edition | |
| Gigabyte GeForce RTX 4080 Super Gaming OC | |
| NVIDIA GeForce RTX 4080 Founders Edition | |
| AMD Radeon RX 7900 XTX | |
| AMD Radeon RX 7900 XT | |
| Asus TUF Gaming GeForce RTX 4070 Ti Super | |
| Asus TUF Gaming GeForce RTX 4070 Ti | |
| Average NVIDIA GeForce RTX 3080 Ti (206 - 240, n=4) | |
| Average NVIDIA GeForce RTX 3090 (184.2 - 247, n=11) | |
| Average NVIDIA GeForce RTX 4070 Ti (208 - 230, n=4) | |
| Gigabyte GeForce RTX 4070 Super Gaming OC 12G | |
| NVIDIA GeForce RTX 4070 Super Founders Edition | |
| Gigabyte Aorus GeForce RTX 4070 Ti Master | |
| Zotac Gaming GeForce RTX 4070 AMP Airo | |
| AMD Radeon RX 7800 XT | |
| Average NVIDIA GeForce RTX 3080 (176.2 - 181.8, n=2) | |
| Average NVIDIA Titan RTX (135 - 191.4, n=12) | |
| Sapphire Pulse Radeon RX 7700 XT | |
| Average of class Desktop (3.7 - 292, n=21, last 2 years) | |
| Average NVIDIA GeForce RTX 4060 Ti 8G (128.3 - 131.2, n=3) | |
| KFA2 GeForce RTX 4060 Ti EX, 16GB GDDR6 | |
| KFA2 GeForce RTX 4060 1-Click-OC 2X | |
| XFX Speedster QICK 308 Radeon RX 7600 Black Edition | |
| Unigine Superposition / 720p Low | |
| Asus TUF Gaming GeForce RTX 4070 Ti | |
| NVIDIA GeForce RTX 4090 Founders Edition | |
| Gigabyte Aorus GeForce RTX 4070 Ti Master | |
| Average NVIDIA GeForce RTX 4070 Ti (48835 - 56396, n=4) | |
| Zotac Gaming GeForce RTX 4070 AMP Airo | |
| Gigabyte GeForce RTX 4080 Super Gaming OC | |
| NVIDIA GeForce RTX 4080 Founders Edition | |
| NVIDIA GeForce RTX 4070 Super Founders Edition | |
| Gigabyte GeForce RTX 4070 Super Gaming OC 12G | |
| Asus TUF Gaming GeForce RTX 4070 Ti Super | |
| Average NVIDIA GeForce RTX 3080 Ti (43163 - 50738, n=4) | |
| Average NVIDIA GeForce RTX 4060 Ti 8G (46504 - 47695, n=3) | |
| AMD Radeon RX 7900 XTX | |
| Average NVIDIA GeForce RTX 3090 (33329 - 54879, n=10) | |
| AMD Radeon RX 7900 XT | |
| KFA2 GeForce RTX 4060 1-Click-OC 2X | |
| AMD Radeon RX 7800 XT | |
| Sapphire Pulse Radeon RX 7700 XT | |
| KFA2 GeForce RTX 4060 Ti EX, 16GB GDDR6 | |
| XFX Speedster QICK 308 Radeon RX 7600 Black Edition | |
| Average NVIDIA Titan RTX (25622 - 50876, n=9) | |
| Average of class Desktop (2704 - 56132, n=19, last 2 years) | |
| Average NVIDIA GeForce RTX 3080 (30851 - 32183, n=2) | |
| Unigine Superposition / 1080p Extreme | |
| NVIDIA GeForce RTX 4090 Founders Edition | |
| AMD Radeon RX 7900 XTX | |
| Gigabyte GeForce RTX 4080 Super Gaming OC | |
| NVIDIA GeForce RTX 4080 Founders Edition | |
| AMD Radeon RX 7900 XT | |
| Gigabyte Aorus GeForce RTX 4070 Ti Master | |
| Asus TUF Gaming GeForce RTX 4070 Ti Super | |
| Asus TUF Gaming GeForce RTX 4070 Ti | |
| Average NVIDIA GeForce RTX 4070 Ti (12837 - 13448, n=4) | |
| Average NVIDIA GeForce RTX 3090 (11806 - 12694, n=11) | |
| Gigabyte GeForce RTX 4070 Super Gaming OC 12G | |
| Average NVIDIA GeForce RTX 3080 Ti (12038 - 12347, n=4) | |
| NVIDIA GeForce RTX 4070 Super Founders Edition | |
| Average NVIDIA GeForce RTX 3080 (10572 - 10822, n=2) | |
| AMD Radeon RX 7800 XT | |
| Average of class Desktop (286 - 21332, n=19, last 2 years) | |
| Zotac Gaming GeForce RTX 4070 AMP Airo | |
| Average NVIDIA Titan RTX (8916 - 9285, n=9) | |
| Sapphire Pulse Radeon RX 7700 XT | |
| KFA2 GeForce RTX 4060 Ti EX, 16GB GDDR6 | |
| Average NVIDIA GeForce RTX 4060 Ti 8G (7085 - 7833, n=3) | |
| XFX Speedster QICK 308 Radeon RX 7600 Black Edition | |
| KFA2 GeForce RTX 4060 1-Click-OC 2X | |
| Unigine Superposition / 4k Optimized | |
| NVIDIA GeForce RTX 4090 Founders Edition | |
| AMD Radeon RX 7900 XTX | |
| Gigabyte GeForce RTX 4080 Super Gaming OC | |
| NVIDIA GeForce RTX 4080 Founders Edition | |
| Asus TUF Gaming GeForce RTX 4070 Ti Super | |
| AMD Radeon RX 7900 XT | |
| Gigabyte Aorus GeForce RTX 4070 Ti Master | |
| Asus TUF Gaming GeForce RTX 4070 Ti | |
| Average NVIDIA GeForce RTX 4070 Ti (16889 - 17290, n=4) | |
| Average NVIDIA GeForce RTX 3090 (15794 - 16868, n=11) | |
| Average NVIDIA GeForce RTX 3080 Ti (16108 - 16412, n=4) | |
| Gigabyte GeForce RTX 4070 Super Gaming OC 12G | |
| NVIDIA GeForce RTX 4070 Super Founders Edition | |
| Average of class Desktop (559 - 33488, n=18, last 2 years) | |
| Average NVIDIA GeForce RTX 3080 (13984 - 14243, n=2) | |
| AMD Radeon RX 7800 XT | |
| Zotac Gaming GeForce RTX 4070 AMP Airo | |
| Average NVIDIA Titan RTX (11937 - 12644, n=9) | |
| Sapphire Pulse Radeon RX 7700 XT | |
| Average NVIDIA GeForce RTX 4060 Ti 8G (9579 - 9722, n=3) | |
| KFA2 GeForce RTX 4060 Ti EX, 16GB GDDR6 | |
| KFA2 GeForce RTX 4060 1-Click-OC 2X | |
| XFX Speedster QICK 308 Radeon RX 7600 Black Edition | |
| Unigine Superposition / 8k Optimized | |
| NVIDIA GeForce RTX 4090 Founders Edition | |
| AMD Radeon RX 7900 XTX | |
| Gigabyte GeForce RTX 4080 Super Gaming OC | |
| NVIDIA GeForce RTX 4080 Founders Edition | |
| Average NVIDIA GeForce RTX 3090 (6969 - 7521, n=11) | |
| Asus TUF Gaming GeForce RTX 4070 Ti Super | |
| Average NVIDIA GeForce RTX 3080 Ti (6920 - 7161, n=4) | |
| AMD Radeon RX 7900 XT | |
| Gigabyte Aorus GeForce RTX 4070 Ti Master | |
| Asus TUF Gaming GeForce RTX 4070 Ti | |
| Average NVIDIA GeForce RTX 4070 Ti (6380 - 6454, n=4) | |
| Average NVIDIA GeForce RTX 3080 (6243 - 6346, n=2) | |
| Gigabyte GeForce RTX 4070 Super Gaming OC 12G | |
| NVIDIA GeForce RTX 4070 Super Founders Edition | |
| Average of class Desktop (237 - 13008, n=18, last 2 years) | |
| Average NVIDIA Titan RTX (5255 - 5571, n=9) | |
| AMD Radeon RX 7800 XT | |
| Zotac Gaming GeForce RTX 4070 AMP Airo | |
| Sapphire Pulse Radeon RX 7700 XT | |
| Average NVIDIA GeForce RTX 4060 Ti 8G (3520 - 3571, n=3) | |
| KFA2 GeForce RTX 4060 Ti EX, 16GB GDDR6 | |
| KFA2 GeForce RTX 4060 1-Click-OC 2X | |
| XFX Speedster QICK 308 Radeon RX 7600 Black Edition | |
3DMark 11: 1280x720 Performance GPU
3DMark: 1920x1080 Fire Strike Graphics | 3840x2160 Fire Strike Ultra Graphics | Fire Strike Extreme Graphics | 2560x1440 Time Spy Graphics | 2560x1440 Port Royal Graphics | 2560x1440 Speed Way Score
Unigine Heaven 4.0: Extreme Preset DX11 | Extreme Preset OpenGL
Unigine Valley 1.0: 1920x1080 Extreme HD DirectX AA:x8 | 1920x1080 Extreme HD Preset OpenGL AA:x8
Unigine Superposition: 1280x720 720p Low | 1920x1080 1080p Extreme | 3840x2160 4k Optimized | 7680x4320 8k Optimized
| 3DMark 11 Performance | 57532 pkt. | |
| 3DMark Ice Storm Standard Score | 294683 pkt. | |
| 3DMark Cloud Gate Standard Score | 80761 pkt. | |
| 3DMark Fire Strike Score | 45427 pkt. | |
| 3DMark Fire Strike Extreme Score | 31385 pkt. | |
| 3DMark Time Spy Score | 27111 pkt. | |
Pomoc | ||
Wydajność obliczeniowa: Znaczący wzrost w stosunku do RX 7900 XTX
RTX 4080 Super Gaming OC jest w stanie ukończyć renderowanie Blendera CUDA Classroom o sekundę szybciej niż RTX 4080 FE i jest o około 3% szybszy w V-Ray 5 CUDA.
Wyniki LuxMark Sala są remisowe pomiędzy tymi dwoma GPU, a RTX 4080 Super Gaming OC uzyskuje w tym teście 62% przewagę nad RX 7900 XTX.
Chociaż zarówno RX 7900 XT i RX 7900 XTX osiągają dobre wyniki w większości testów ComputeMark, RTX 4080 Super Gaming OC uzyskuje znaczną przewagę w QJuliaRayTrace, która sprawia, że karta Gigabyte nieznacznie wyprzedza dwa flagowe modele AMD w tym benchmarku.
Blender: v3.3 Classroom CUDA | v3.3 Classroom OPTIX/RTX
LuxMark v2.0 64Bit: Room GPUs-only | Sala GPUs-only
ComputeMark v2.1: 1024x600 Normal, Score | 1024x600 Normal, QJuliaRayTrace | 1024x600 Normal, Mandel Scalar | 1024x600 Normal, Mandel Vector | 1024x600 Normal, Fluid 2DTexArr | 1024x600 Normal, Fluid 3DTex
| V-Ray 5 Benchmark / GPU CUDA | |
| NVIDIA GeForce RTX 4090 Founders Edition (5.0.1) | |
| Gigabyte GeForce RTX 4080 Super Gaming OC (5.0.1) | |
| NVIDIA GeForce RTX 4080 Founders Edition | |
| Asus TUF Gaming GeForce RTX 4070 Ti Super (5.0.1) | |
| Gigabyte Aorus GeForce RTX 4070 Ti Master (5.0.1) | |
| Asus TUF Gaming GeForce RTX 4070 Ti (5.0.1) | |
| Average NVIDIA GeForce RTX 4070 Ti (2278 - 2371, n=4) | |
| Gigabyte GeForce RTX 4070 Super Gaming OC 12G (5.0.1) | |
| NVIDIA GeForce RTX 4070 Super Founders Edition (5.0.1) | |
| Average NVIDIA GeForce RTX 3080 Ti (2045 - 2070, n=3) | |
| Average NVIDIA GeForce RTX 3090 (1616 - 2131, n=15) | |
| Zotac Gaming GeForce RTX 4070 AMP Airo (5.0.1) | |
| Average of class Desktop (13 - 4322, n=25, last 2 years) | |
| Average NVIDIA GeForce RTX 4060 Ti 8G (1375 - 1400, n=2) | |
| KFA2 GeForce RTX 4060 Ti EX, 16GB GDDR6 (5.0.1) | |
| KFA2 GeForce RTX 4060 1-Click-OC 2X (5.0.1) | |
| Average NVIDIA Titan RTX (668 - 1052, n=7) | |
| AMD Radeon RX 7800 XT (5.0.1) | |
| Sapphire Pulse Radeon RX 7700 XT (5.0.1) | |
| XFX Speedster QICK 308 Radeon RX 7600 Black Edition (5.0.1) | |
| V-Ray 5 Benchmark / GPU RTX | |
| NVIDIA GeForce RTX 4090 Founders Edition (5.0.1) | |
| Gigabyte GeForce RTX 4080 Super Gaming OC (5.0.1) | |
| NVIDIA GeForce RTX 4080 Founders Edition | |
| Average of class Desktop (1478 - 6019, n=16, last 2 years) | |
| Asus TUF Gaming GeForce RTX 4070 Ti Super (5.0.1) | |
| Gigabyte Aorus GeForce RTX 4070 Ti Master (5.0.1) | |
| Asus TUF Gaming GeForce RTX 4070 Ti (5.0.1) | |
| Average NVIDIA GeForce RTX 4070 Ti (3054 - 3221, n=4) | |
| Gigabyte GeForce RTX 4070 Super Gaming OC 12G (5.0.1) | |
| NVIDIA GeForce RTX 4070 Super Founders Edition (5.0.1) | |
| Average NVIDIA GeForce RTX 3090 (2551 - 2979, n=15) | |
| Average NVIDIA GeForce RTX 3080 Ti (2727 - 2883, n=3) | |
| Zotac Gaming GeForce RTX 4070 AMP Airo (5.0.1) | |
| AMD Radeon RX 7800 XT (5.0.1) | |
| Average NVIDIA GeForce RTX 4060 Ti 8G (1974 - 2024, n=2) | |
| KFA2 GeForce RTX 4060 Ti EX, 16GB GDDR6 (5.0.1) | |
| Sapphire Pulse Radeon RX 7700 XT (5.0.1) | |
| KFA2 GeForce RTX 4060 1-Click-OC 2X (5.0.1) | |
| Average NVIDIA Titan RTX (1246 - 1348, n=7) | |
| Blender / v3.3 Classroom CUDA | |
| KFA2 GeForce RTX 4060 1-Click-OC 2X (3.3.3) | |
| Average NVIDIA Titan RTX () | |
| Zotac Gaming GeForce RTX 4070 AMP Airo (3.3.3) | |
| Average NVIDIA GeForce RTX 3080 Ti (21 - 22, n=2) | |
| Average NVIDIA GeForce RTX 3090 (20 - 22, n=12) | |
| NVIDIA GeForce RTX 4070 Super Founders Edition (3.3.3) | |
| Gigabyte GeForce RTX 4070 Super Gaming OC 12G (3.3.3) | |
| Average NVIDIA GeForce RTX 4070 Ti (18 - 19, n=2) | |
| Gigabyte Aorus GeForce RTX 4070 Ti Master (3.3.2) | |
| Asus TUF Gaming GeForce RTX 4070 Ti Super (3.3.3) | |
| Average of class Desktop (10 - 23, n=15, last 2 years) | |
| NVIDIA GeForce RTX 4080 Founders Edition (3.3.3) | |
| Gigabyte GeForce RTX 4080 Super Gaming OC (3.3.3) | |
| Blender / v3.3 Classroom OPTIX/RTX | |
| KFA2 GeForce RTX 4060 1-Click-OC 2X (3.3.3) | |
| Average NVIDIA Titan RTX () | |
| KFA2 GeForce RTX 4060 Ti EX, 16GB GDDR6 (3.3.3) | |
| Average NVIDIA GeForce RTX 4060 Ti 8G (18 - 18, n=2) | |
| Average NVIDIA GeForce RTX 3080 Ti (14 - 15, n=2) | |
| Zotac Gaming GeForce RTX 4070 AMP Airo (3.3.3) | |
| Average NVIDIA GeForce RTX 3090 (13 - 14, n=12) | |
| Asus TUF Gaming GeForce RTX 4070 Ti (3.3.2) | |
| Average NVIDIA GeForce RTX 4070 Ti (11 - 12, n=4) | |
| Gigabyte Aorus GeForce RTX 4070 Ti Master (3.3.2) | |
| NVIDIA GeForce RTX 4070 Super Founders Edition (3.3.3) | |
| Gigabyte GeForce RTX 4070 Super Gaming OC 12G (3.3.3) | |
| Average of class Desktop (7 - 15, n=17, last 2 years) | |
| Asus TUF Gaming GeForce RTX 4070 Ti Super (3.3.3) | |
| NVIDIA GeForce RTX 4080 Founders Edition (3.3.3) | |
| NVIDIA GeForce RTX 4090 Founders Edition (3.3.0) | |
| Gigabyte GeForce RTX 4080 Super Gaming OC (3.3.3) | |
| LuxMark v2.0 64Bit / Room GPUs-only | |
| NVIDIA GeForce RTX 4090 Founders Edition | |
| Gigabyte GeForce RTX 4080 Super Gaming OC | |
| NVIDIA GeForce RTX 4080 Founders Edition | |
| Asus TUF Gaming GeForce RTX 4070 Ti Super | |
| Gigabyte Aorus GeForce RTX 4070 Ti Master | |
| Asus TUF Gaming GeForce RTX 4070 Ti | |
| NVIDIA GeForce RTX 4070 Super Founders Edition | |
| Gigabyte GeForce RTX 4070 Super Gaming OC 12G | |
| Average NVIDIA GeForce RTX 4070 Ti (7625 - 8436, n=4) | |
| Zotac Gaming GeForce RTX 4070 AMP Airo | |
| Average NVIDIA GeForce RTX 3080 Ti (5772 - 6464, n=4) | |
| Average NVIDIA GeForce RTX 3090 (5727 - 5985, n=9) | |
| Average of class Desktop (81 - 12730, n=21, last 2 years) | |
| AMD Radeon RX 7900 XTX | |
| Average NVIDIA GeForce RTX 3080 (5112 - 5198, n=2) | |
| Average NVIDIA Titan RTX (4643 - 4703, n=2) | |
| Average NVIDIA GeForce RTX 4060 Ti 8G (4558 - 4790, n=3) | |
| KFA2 GeForce RTX 4060 Ti EX, 16GB GDDR6 | |
| AMD Radeon RX 7900 XT | |
| KFA2 GeForce RTX 4060 1-Click-OC 2X | |
| AMD Radeon RX 7800 XT | |
| Sapphire Pulse Radeon RX 7700 XT | |
| XFX Speedster QICK 308 Radeon RX 7600 Black Edition | |
| LuxMark v2.0 64Bit / Sala GPUs-only | |
| NVIDIA GeForce RTX 4090 Founders Edition | |
| NVIDIA GeForce RTX 4080 Founders Edition | |
| Gigabyte GeForce RTX 4080 Super Gaming OC | |
| Gigabyte Aorus GeForce RTX 4070 Ti Master | |
| Asus TUF Gaming GeForce RTX 4070 Ti | |
| Asus TUF Gaming GeForce RTX 4070 Ti Super | |
| Average NVIDIA GeForce RTX 4070 Ti (17719 - 20305, n=4) | |
| Gigabyte GeForce RTX 4070 Super Gaming OC 12G | |
| NVIDIA GeForce RTX 4070 Super Founders Edition | |
| Average NVIDIA GeForce RTX 3080 Ti (14871 - 16438, n=4) | |
| Zotac Gaming GeForce RTX 4070 AMP Airo | |
| AMD Radeon RX 7900 XTX | |
| Average NVIDIA GeForce RTX 3090 (14590 - 15242, n=9) | |
| AMD Radeon RX 7900 XT | |
| Average NVIDIA GeForce RTX 3080 (12797 - 12980, n=2) | |
| Average of class Desktop (147 - 27828, n=21, last 2 years) | |
| Average NVIDIA GeForce RTX 4060 Ti 8G (11159 - 11281, n=3) | |
| KFA2 GeForce RTX 4060 Ti EX, 16GB GDDR6 | |
| Average NVIDIA Titan RTX (10799 - 10996, n=2) | |
| AMD Radeon RX 7800 XT | |
| KFA2 GeForce RTX 4060 1-Click-OC 2X | |
| Sapphire Pulse Radeon RX 7700 XT | |
| XFX Speedster QICK 308 Radeon RX 7600 Black Edition | |
| ComputeMark v2.1 / Normal, Score | |
| NVIDIA GeForce RTX 4090 Founders Edition | |
| Gigabyte GeForce RTX 4080 Super Gaming OC | |
| AMD Radeon RX 7900 XTX | |
| NVIDIA GeForce RTX 4080 Founders Edition | |
| AMD Radeon RX 7900 XT | |
| Asus TUF Gaming GeForce RTX 4070 Ti Super | |
| Gigabyte Aorus GeForce RTX 4070 Ti Master | |
| Average NVIDIA GeForce RTX 4070 Ti (51287 - 52251, n=4) | |
| Asus TUF Gaming GeForce RTX 4070 Ti | |
| Average NVIDIA GeForce RTX 3080 Ti (47377 - 48892, n=4) | |
| Gigabyte GeForce RTX 4070 Super Gaming OC 12G | |
| NVIDIA GeForce RTX 4070 Super Founders Edition | |
| Average NVIDIA GeForce RTX 3090 (44948 - 49118, n=9) | |
| AMD Radeon RX 7800 XT | |
| Zotac Gaming GeForce RTX 4070 AMP Airo | |
| Average NVIDIA GeForce RTX 3080 (39924 - 41594, n=2) | |
| Sapphire Pulse Radeon RX 7700 XT | |
| Average of class Desktop (476 - 90920, n=22, last 2 years) | |
| KFA2 GeForce RTX 4060 Ti EX, 16GB GDDR6 | |
| Average NVIDIA GeForce RTX 4060 Ti 8G (31884 - 32410, n=3) | |
| Average NVIDIA Titan RTX (27907 - 29830, n=3) | |
| XFX Speedster QICK 308 Radeon RX 7600 Black Edition | |
| KFA2 GeForce RTX 4060 1-Click-OC 2X | |
| ComputeMark v2.1 / Normal, Mandel Scalar | |
| NVIDIA GeForce RTX 4090 Founders Edition | |
| AMD Radeon RX 7900 XTX | |
| Gigabyte GeForce RTX 4080 Super Gaming OC | |
| NVIDIA GeForce RTX 4080 Founders Edition | |
| AMD Radeon RX 7900 XT | |
| Asus TUF Gaming GeForce RTX 4070 Ti Super | |
| Gigabyte Aorus GeForce RTX 4070 Ti Master | |
| Asus TUF Gaming GeForce RTX 4070 Ti | |
| Average NVIDIA GeForce RTX 4070 Ti (12126 - 12449, n=4) | |
| Gigabyte GeForce RTX 4070 Super Gaming OC 12G | |
| AMD Radeon RX 7800 XT | |
| Average NVIDIA GeForce RTX 3080 Ti (11049 - 11318, n=4) | |
| Average NVIDIA GeForce RTX 3090 (10650 - 11564, n=10) | |
| NVIDIA GeForce RTX 4070 Super Founders Edition | |
| Sapphire Pulse Radeon RX 7700 XT | |
| Average NVIDIA GeForce RTX 3080 (9554 - 9938, n=2) | |
| Zotac Gaming GeForce RTX 4070 AMP Airo | |
| Average of class Desktop (75 - 22731, n=22, last 2 years) | |
| KFA2 GeForce RTX 4060 Ti EX, 16GB GDDR6 | |
| Average NVIDIA GeForce RTX 4060 Ti 8G (7374 - 7511, n=3) | |
| XFX Speedster QICK 308 Radeon RX 7600 Black Edition | |
| Average NVIDIA Titan RTX (5977 - 6406, n=3) | |
| KFA2 GeForce RTX 4060 1-Click-OC 2X | |
| ComputeMark v2.1 / Normal, Mandel Vector | |
| NVIDIA GeForce RTX 4090 Founders Edition | |
| AMD Radeon RX 7900 XTX | |
| AMD Radeon RX 7900 XT | |
| Gigabyte GeForce RTX 4080 Super Gaming OC | |
| NVIDIA GeForce RTX 4080 Founders Edition | |
| Gigabyte Aorus GeForce RTX 4070 Ti Master | |
| Asus TUF Gaming GeForce RTX 4070 Ti Super | |
| Asus TUF Gaming GeForce RTX 4070 Ti | |
| Average NVIDIA GeForce RTX 4070 Ti (10541 - 10888, n=4) | |
| AMD Radeon RX 7800 XT | |
| Gigabyte GeForce RTX 4070 Super Gaming OC 12G | |
| Average NVIDIA GeForce RTX 3080 Ti (9513 - 9860, n=4) | |
| NVIDIA GeForce RTX 4070 Super Founders Edition | |
| Sapphire Pulse Radeon RX 7700 XT | |
| Average NVIDIA GeForce RTX 3090 (8038 - 10097, n=10) | |
| Zotac Gaming GeForce RTX 4070 AMP Airo | |
| Average NVIDIA GeForce RTX 3080 (7148 - 7540, n=2) | |
| Average of class Desktop (97 - 16942, n=22, last 2 years) | |
| Average NVIDIA GeForce RTX 4060 Ti 8G (6815 - 6929, n=3) | |
| KFA2 GeForce RTX 4060 Ti EX, 16GB GDDR6 | |
| XFX Speedster QICK 308 Radeon RX 7600 Black Edition | |
| Average NVIDIA Titan RTX (4944 - 5440, n=3) | |
| KFA2 GeForce RTX 4060 1-Click-OC 2X | |
| ComputeMark v2.1 / Normal, Fluid 2DTexArr | |
| AMD Radeon RX 7900 XTX | |
| NVIDIA GeForce RTX 4090 Founders Edition | |
| AMD Radeon RX 7900 XT | |
| Gigabyte GeForce RTX 4080 Super Gaming OC | |
| NVIDIA GeForce RTX 4080 Founders Edition | |
| Asus TUF Gaming GeForce RTX 4070 Ti Super | |
| Average NVIDIA GeForce RTX 3080 Ti (4453 - 4546, n=4) | |
| Average NVIDIA GeForce RTX 3090 (4344 - 4608, n=10) | |
| AMD Radeon RX 7800 XT | |
| Average NVIDIA GeForce RTX 3080 (4087 - 4159, n=2) | |
| Average NVIDIA Titan RTX (3691 - 3828, n=3) | |
| Average NVIDIA GeForce RTX 4070 Ti (3566 - 3724, n=4) | |
| Gigabyte GeForce RTX 4070 Super Gaming OC 12G | |
| NVIDIA GeForce RTX 4070 Super Founders Edition | |
| Gigabyte Aorus GeForce RTX 4070 Ti Master | |
| Asus TUF Gaming GeForce RTX 4070 Ti | |
| Zotac Gaming GeForce RTX 4070 AMP Airo | |
| Average of class Desktop (60 - 6800, n=22, last 2 years) | |
| Sapphire Pulse Radeon RX 7700 XT | |
| Average NVIDIA GeForce RTX 4060 Ti 8G (2044 - 2060, n=3) | |
| KFA2 GeForce RTX 4060 Ti EX, 16GB GDDR6 | |
| KFA2 GeForce RTX 4060 1-Click-OC 2X | |
| XFX Speedster QICK 308 Radeon RX 7600 Black Edition | |
| ComputeMark v2.1 / Normal, Fluid 3DTex | |
| NVIDIA GeForce RTX 4090 Founders Edition | |
| AMD Radeon RX 7900 XTX | |
| AMD Radeon RX 7900 XT | |
| Gigabyte GeForce RTX 4080 Super Gaming OC | |
| NVIDIA GeForce RTX 4080 Founders Edition | |
| Average NVIDIA GeForce RTX 3090 (5246 - 5520, n=10) | |
| Average NVIDIA GeForce RTX 3080 Ti (5312 - 5422, n=4) | |
| Asus TUF Gaming GeForce RTX 4070 Ti Super | |
| AMD Radeon RX 7800 XT | |
| Average NVIDIA GeForce RTX 3080 (4417 - 4450, n=2) | |
| Average NVIDIA Titan RTX (3877 - 4027, n=3) | |
| Average NVIDIA GeForce RTX 4070 Ti (3683 - 3789, n=4) | |
| Gigabyte Aorus GeForce RTX 4070 Ti Master | |
| NVIDIA GeForce RTX 4070 Super Founders Edition | |
| Asus TUF Gaming GeForce RTX 4070 Ti | |
| Gigabyte GeForce RTX 4070 Super Gaming OC 12G | |
| Average of class Desktop (65 - 10749, n=22, last 2 years) | |
| Zotac Gaming GeForce RTX 4070 AMP Airo | |
| Sapphire Pulse Radeon RX 7700 XT | |
| Average NVIDIA GeForce RTX 4060 Ti 8G (2088 - 2090, n=3) | |
| KFA2 GeForce RTX 4060 Ti EX, 16GB GDDR6 | |
| KFA2 GeForce RTX 4060 1-Click-OC 2X | |
| XFX Speedster QICK 308 Radeon RX 7600 Black Edition | |
Blender: v3.3 Classroom CUDA | v3.3 Classroom OPTIX/RTX
LuxMark v2.0 64Bit: Room GPUs-only | Sala GPUs-only
ComputeMark v2.1: 1024x600 Normal, Score | 1024x600 Normal, QJuliaRayTrace | 1024x600 Normal, Mandel Scalar | 1024x600 Normal, Mandel Vector | 1024x600 Normal, Fluid 2DTexArr | 1024x600 Normal, Fluid 3DTex
* ... im mniej tym lepiej
Wydajność w grach: RX 7900 XTX z przewagą w rastrze
Podczas gdy RTX 4090 wciąż pozostaje najbardziej pożądanym układem GPU dwa lata po premierze, nowy RTX 4080 Super jest flagowym produktem Nvidii dla graczy.
RTX 4080 Super Gaming OC wyprzedza RTX 4080 FE o 12% w skumulowanych testach gamingowych w rozdzielczości 1080p, 1440p i 4K Ultra, pokonując jednocześnie RTX 3090 średnio o 28%.
Karta RX 7900 XTX nadal utrzymuje 4% przewagę nad RTX 4080 Super Gaming OC, pomimo tego, że ta druga wykazuje dobre wyniki w testach F1 22, Borderlands 3i Final Fantasy XV.
RTX 4080 Super jest w stanie osiągnąć 100 klatek na sekundę w wielu tytułach AAA w rozdzielczości 4K Ultra. Korzystanie z upscalerów, takich jak DLSS, FSR i XeSS, jest zalecane w celu uzyskania płynniejszej rozgrywki w nowoczesnych tytułach z dużą ilością tekstur, takich jak Cyberpunk 2077 2.0 Phantom Libertyalan Wake 2 i Avatar: Frontiers of Pandora.
The Witcher 3: 3840x2160 Ultra Graphics & Postprocessing (HBAO+) | 3840x2160 High Graphics & Postprocessing (Nvidia HairWorks Off) | 1920x1080 Ultra Graphics & Postprocessing (HBAO+)
Metro Exodus: 3840x2160 Ultra Quality AF:16x | 2560x1440 Ultra Quality AF:16x | 1920x1080 Ultra Quality AF:16x
Control: 3840x2160 High Quality Preset (DX11) | 2560x1440 High Quality Preset (DX11) | 1920x1080 High Quality Preset (DX11)
Borderlands 3: 3840x2160 Badass Overall Quality (DX11) | 2560x1440 Badass Overall Quality (DX11) | 1920x1080 Badass Overall Quality (DX11)
Shadow of the Tomb Raider: 3840x2160 Highest Preset AA:T | 2560x1440 Highest Preset AA:T | 1920x1080 Highest Preset AA:T
F1 22: 3840x2160 Ultra High Preset AA:T AF:16x | 2560x1440 Ultra High Preset AA:T AF:16x | 1920x1080 Ultra High Preset AA:T AF:16x
Final Fantasy XV Benchmark: 3840x2160 High Quality | 2560x1440 High Quality | 1920x1080 High Quality
| Performance Rating | |
| NVIDIA GeForce RTX 4090 Founders Edition | |
| AMD Radeon RX 7900 XTX | |
| Gigabyte GeForce RTX 4080 Super Gaming OC | |
| AMD Radeon RX 7900 XT | |
| NVIDIA GeForce RTX 4080 Founders Edition | |
| Asus TUF Gaming GeForce RTX 4070 Ti Super -1! | |
| Asus TUF Gaming GeForce RTX 4070 Ti | |
| Gigabyte Aorus GeForce RTX 4070 Ti Master | |
| Average NVIDIA GeForce RTX 4070 Ti | |
| Gigabyte GeForce RTX 4070 Super Gaming OC 12G | |
| Average NVIDIA GeForce RTX 3080 Ti | |
| Average NVIDIA GeForce RTX 3090 | |
| NVIDIA GeForce RTX 4070 Super Founders Edition | |
| AMD Radeon RX 7800 XT | |
| Zotac Gaming GeForce RTX 4070 AMP Airo | |
| Average NVIDIA GeForce RTX 3080 | |
| Sapphire Pulse Radeon RX 7700 XT | |
| Average NVIDIA Titan RTX | |
| Average NVIDIA GeForce RTX 4060 Ti 8G | |
| KFA2 GeForce RTX 4060 Ti EX, 16GB GDDR6 | |
| KFA2 GeForce RTX 4060 1-Click-OC 2X | |
| XFX Speedster QICK 308 Radeon RX 7600 Black Edition | |
| The Witcher 3 / Ultra Graphics & Postprocessing (HBAO+) | |
| NVIDIA GeForce RTX 4090 Founders Edition | |
| AMD Radeon RX 7900 XTX | |
| Gigabyte GeForce RTX 4080 Super Gaming OC | |
| NVIDIA GeForce RTX 4080 Founders Edition | |
| AMD Radeon RX 7900 XT | |
| Asus TUF Gaming GeForce RTX 4070 Ti Super | |
| Asus TUF Gaming GeForce RTX 4070 Ti | |
| Average NVIDIA GeForce RTX 4070 Ti (92.4 - 98.3, n=4) | |
| Average NVIDIA GeForce RTX 3080 Ti (93.1 - 96.4, n=4) | |
| Gigabyte Aorus GeForce RTX 4070 Ti Master | |
| Average NVIDIA GeForce RTX 3090 (85.4 - 98.5, n=9) | |
| Gigabyte GeForce RTX 4070 Super Gaming OC 12G | |
| NVIDIA GeForce RTX 4070 Super Founders Edition | |
| Average NVIDIA GeForce RTX 3080 (78 - 85.7, n=2) | |
| AMD Radeon RX 7800 XT | |
| Zotac Gaming GeForce RTX 4070 AMP Airo | |
| Average NVIDIA Titan RTX () | |
| Sapphire Pulse Radeon RX 7700 XT | |
| Average NVIDIA GeForce RTX 4060 Ti 8G (53.9 - 54.3, n=3) | |
| KFA2 GeForce RTX 4060 Ti EX, 16GB GDDR6 | |
| XFX Speedster QICK 308 Radeon RX 7600 Black Edition | |
| KFA2 GeForce RTX 4060 1-Click-OC 2X | |
| The Witcher 3 / High Graphics & Postprocessing (Nvidia HairWorks Off) | |
| NVIDIA GeForce RTX 4090 Founders Edition | |
| Gigabyte GeForce RTX 4080 Super Gaming OC | |
| NVIDIA GeForce RTX 4080 Founders Edition | |
| AMD Radeon RX 7900 XTX | |
| AMD Radeon RX 7900 XT | |
| Average NVIDIA GeForce RTX 3080 Ti (149 - 156.8, n=4) | |
| Asus TUF Gaming GeForce RTX 4070 Ti | |
| Average NVIDIA GeForce RTX 3090 (128 - 160.2, n=13) | |
| Gigabyte Aorus GeForce RTX 4070 Ti Master | |
| Average NVIDIA GeForce RTX 4070 Ti (143 - 151.9, n=4) | |
| Gigabyte GeForce RTX 4070 Super Gaming OC 12G | |
| NVIDIA GeForce RTX 4070 Super Founders Edition | |
| Zotac Gaming GeForce RTX 4070 AMP Airo | |
| Average NVIDIA GeForce RTX 3080 (114 - 115, n=2) | |
| AMD Radeon RX 7800 XT | |
| Average NVIDIA Titan RTX (94 - 107.1, n=28) | |
| Sapphire Pulse Radeon RX 7700 XT | |
| Average NVIDIA GeForce RTX 4060 Ti 8G (78.5 - 80.4, n=3) | |
| KFA2 GeForce RTX 4060 Ti EX, 16GB GDDR6 | |
| KFA2 GeForce RTX 4060 1-Click-OC 2X | |
| XFX Speedster QICK 308 Radeon RX 7600 Black Edition | |
| The Witcher 3 / Ultra Graphics & Postprocessing (HBAO+) | |
| NVIDIA GeForce RTX 4090 Founders Edition | |
| AMD Radeon RX 7900 XTX | |
| AMD Radeon RX 7900 XT | |
| NVIDIA GeForce RTX 4080 Founders Edition | |
| Gigabyte GeForce RTX 4080 Super Gaming OC | |
| Asus TUF Gaming GeForce RTX 4070 Ti | |
| Average NVIDIA GeForce RTX 4070 Ti (217 - 230, n=4) | |
| Gigabyte Aorus GeForce RTX 4070 Ti Master | |
| Asus TUF Gaming GeForce RTX 4070 Ti Super | |
| Gigabyte GeForce RTX 4070 Super Gaming OC 12G | |
| NVIDIA GeForce RTX 4070 Super Founders Edition | |
| AMD Radeon RX 7800 XT | |
| Average NVIDIA GeForce RTX 3090 (160 - 192.6, n=17) | |
| Average NVIDIA GeForce RTX 3080 Ti (174 - 184.6, n=4) | |
| Zotac Gaming GeForce RTX 4070 AMP Airo | |
| Sapphire Pulse Radeon RX 7700 XT | |
| Average NVIDIA GeForce RTX 3080 (145 - 152, n=2) | |
| Average NVIDIA GeForce RTX 4060 Ti 8G (136.2 - 140.6, n=3) | |
| Average NVIDIA Titan RTX (124 - 150, n=28) | |
| KFA2 GeForce RTX 4060 Ti EX, 16GB GDDR6 | |
| XFX Speedster QICK 308 Radeon RX 7600 Black Edition | |
| KFA2 GeForce RTX 4060 1-Click-OC 2X | |
| Metro Exodus / Ultra Quality | |
| NVIDIA GeForce RTX 4090 Founders Edition | |
| AMD Radeon RX 7900 XTX | |
| Gigabyte GeForce RTX 4080 Super Gaming OC | |
| NVIDIA GeForce RTX 4080 Founders Edition | |
| AMD Radeon RX 7900 XT | |
| Gigabyte Aorus GeForce RTX 4070 Ti Master | |
| Asus TUF Gaming GeForce RTX 4070 Ti | |
| Asus TUF Gaming GeForce RTX 4070 Ti Super | |
| Average NVIDIA GeForce RTX 4070 Ti (81.2 - 85, n=4) | |
| Gigabyte GeForce RTX 4070 Super Gaming OC 12G | |
| Average NVIDIA GeForce RTX 3080 Ti (74.2 - 77.1, n=4) | |
| Average NVIDIA GeForce RTX 3090 (70.6 - 77.3, n=12) | |
| NVIDIA GeForce RTX 4070 Super Founders Edition | |
| AMD Radeon RX 7800 XT | |
| Zotac Gaming GeForce RTX 4070 AMP Airo | |
| Average NVIDIA GeForce RTX 3080 (64.1 - 65.9, n=2) | |
| Sapphire Pulse Radeon RX 7700 XT | |
| Average NVIDIA Titan RTX (51.3 - 57.9, n=27) | |
| Average NVIDIA GeForce RTX 4060 Ti 8G (48.4 - 49.3, n=3) | |
| KFA2 GeForce RTX 4060 Ti EX, 16GB GDDR6 | |
| KFA2 GeForce RTX 4060 1-Click-OC 2X | |
| XFX Speedster QICK 308 Radeon RX 7600 Black Edition | |
| Metro Exodus / Ultra Quality | |
| NVIDIA GeForce RTX 4090 Founders Edition | |
| AMD Radeon RX 7900 XTX | |
| Gigabyte GeForce RTX 4080 Super Gaming OC | |
| AMD Radeon RX 7900 XT | |
| Gigabyte Aorus GeForce RTX 4070 Ti Master | |
| Asus TUF Gaming GeForce RTX 4070 Ti | |
| Asus TUF Gaming GeForce RTX 4070 Ti Super | |
| Average NVIDIA GeForce RTX 4070 Ti (126.7 - 132.3, n=4) | |
| NVIDIA GeForce RTX 4080 Founders Edition | |
| Gigabyte GeForce RTX 4070 Super Gaming OC 12G | |
| NVIDIA GeForce RTX 4070 Super Founders Edition | |
| Average NVIDIA GeForce RTX 3080 Ti (110 - 118, n=4) | |
| Average NVIDIA GeForce RTX 3090 (102 - 118.2, n=12) | |
| Zotac Gaming GeForce RTX 4070 AMP Airo | |
| AMD Radeon RX 7800 XT | |
| Average NVIDIA GeForce RTX 3080 (92.2 - 97.4, n=2) | |
| Sapphire Pulse Radeon RX 7700 XT | |
| Average NVIDIA Titan RTX (69 - 92.9, n=26) | |
| Average NVIDIA GeForce RTX 4060 Ti 8G (78.9 - 80.1, n=3) | |
| KFA2 GeForce RTX 4060 Ti EX, 16GB GDDR6 | |
| XFX Speedster QICK 308 Radeon RX 7600 Black Edition | |
| KFA2 GeForce RTX 4060 1-Click-OC 2X | |
| Metro Exodus / Ultra Quality | |
| NVIDIA GeForce RTX 4090 Founders Edition | |
| AMD Radeon RX 7900 XTX | |
| Gigabyte GeForce RTX 4080 Super Gaming OC | |
| AMD Radeon RX 7900 XT | |
| Asus TUF Gaming GeForce RTX 4070 Ti | |
| Gigabyte Aorus GeForce RTX 4070 Ti Master | |
| Average NVIDIA GeForce RTX 4070 Ti (155.6 - 161.4, n=4) | |
| Asus TUF Gaming GeForce RTX 4070 Ti Super | |
| Gigabyte GeForce RTX 4070 Super Gaming OC 12G | |
| NVIDIA GeForce RTX 4080 Founders Edition | |
| NVIDIA GeForce RTX 4070 Super Founders Edition | |
| Average NVIDIA GeForce RTX 3080 Ti (131 - 144.2, n=5) | |
| Average NVIDIA GeForce RTX 3090 (108 - 145, n=12) | |
| Zotac Gaming GeForce RTX 4070 AMP Airo | |
| AMD Radeon RX 7800 XT | |
| Sapphire Pulse Radeon RX 7700 XT | |
| Average NVIDIA GeForce RTX 3080 (111 - 116, n=2) | |
| Average NVIDIA Titan RTX (73 - 116, n=27) | |
| Average NVIDIA GeForce RTX 4060 Ti 8G (100.6 - 101.8, n=3) | |
| KFA2 GeForce RTX 4060 Ti EX, 16GB GDDR6 | |
| XFX Speedster QICK 308 Radeon RX 7600 Black Edition | |
| KFA2 GeForce RTX 4060 1-Click-OC 2X | |
| Control / High Quality Preset (DX11) | |
| NVIDIA GeForce RTX 4090 Founders Edition | |
| AMD Radeon RX 7900 XTX | |
| Gigabyte GeForce RTX 4080 Super Gaming OC | |
| AMD Radeon RX 7900 XT | |
| NVIDIA GeForce RTX 4080 Founders Edition | |
| Asus TUF Gaming GeForce RTX 4070 Ti Super | |
| Average NVIDIA GeForce RTX 4070 Ti (63.8 - 66.2, n=4) | |
| Asus TUF Gaming GeForce RTX 4070 Ti | |
| Gigabyte Aorus GeForce RTX 4070 Ti Master | |
| Average NVIDIA GeForce RTX 3080 Ti (63.9 - 64.9, n=3) | |
| Average NVIDIA GeForce RTX 3090 (61.3 - 66, n=5) | |
| AMD Radeon RX 7800 XT | |
| Gigabyte GeForce RTX 4070 Super Gaming OC 12G | |
| NVIDIA GeForce RTX 4070 Super Founders Edition | |
| Average NVIDIA GeForce RTX 3080 (56.2 - 56.7, n=2) | |
| Zotac Gaming GeForce RTX 4070 AMP Airo | |
| Average NVIDIA Titan RTX (45.2 - 47.3, n=3) | |
| Sapphire Pulse Radeon RX 7700 XT | |
| KFA2 GeForce RTX 4060 Ti EX, 16GB GDDR6 | |
| Average NVIDIA GeForce RTX 4060 Ti 8G (34.3 - 37.3, n=3) | |
| XFX Speedster QICK 308 Radeon RX 7600 Black Edition | |
| KFA2 GeForce RTX 4060 1-Click-OC 2X | |
| Control / High Quality Preset (DX11) | |
| NVIDIA GeForce RTX 4090 Founders Edition | |
| AMD Radeon RX 7900 XTX | |
| AMD Radeon RX 7900 XT | |
| Gigabyte GeForce RTX 4080 Super Gaming OC | |
| Asus TUF Gaming GeForce RTX 4070 Ti | |
| Gigabyte Aorus GeForce RTX 4070 Ti Master | |
| Asus TUF Gaming GeForce RTX 4070 Ti Super | |
| Average NVIDIA GeForce RTX 3080 Ti (122 - 125.5, n=3) | |
| Average NVIDIA GeForce RTX 4070 Ti (100 - 130.6, n=4) | |
| Average NVIDIA GeForce RTX 3090 (115.8 - 123.7, n=5) | |
| AMD Radeon RX 7800 XT | |
| NVIDIA GeForce RTX 4080 Founders Edition | |
| Gigabyte GeForce RTX 4070 Super Gaming OC 12G | |
| NVIDIA GeForce RTX 4070 Super Founders Edition | |
| Average NVIDIA GeForce RTX 3080 (105 - 106, n=2) | |
| Zotac Gaming GeForce RTX 4070 AMP Airo | |
| Sapphire Pulse Radeon RX 7700 XT | |
| Average NVIDIA Titan RTX (89 - 93.6, n=3) | |
| Average NVIDIA GeForce RTX 4060 Ti 8G (69.2 - 75.3, n=3) | |
| KFA2 GeForce RTX 4060 Ti EX, 16GB GDDR6 | |
| XFX Speedster QICK 308 Radeon RX 7600 Black Edition | |
| KFA2 GeForce RTX 4060 1-Click-OC 2X | |
| Control / High Quality Preset (DX11) | |
| AMD Radeon RX 7900 XTX | |
| NVIDIA GeForce RTX 4090 Founders Edition | |
| AMD Radeon RX 7900 XT | |
| Gigabyte GeForce RTX 4080 Super Gaming OC | |
| Asus TUF Gaming GeForce RTX 4070 Ti | |
| Gigabyte Aorus GeForce RTX 4070 Ti Master | |
| Average NVIDIA GeForce RTX 4070 Ti (196.6 - 202, n=4) | |
| Asus TUF Gaming GeForce RTX 4070 Ti Super | |
| AMD Radeon RX 7800 XT | |
| Average NVIDIA GeForce RTX 3080 Ti (181 - 190.7, n=3) | |
| Gigabyte GeForce RTX 4070 Super Gaming OC 12G | |
| Average NVIDIA GeForce RTX 3090 (172.2 - 189.2, n=5) | |
| NVIDIA GeForce RTX 4070 Super Founders Edition | |
| NVIDIA GeForce RTX 4080 Founders Edition | |
| Zotac Gaming GeForce RTX 4070 AMP Airo | |
| Sapphire Pulse Radeon RX 7700 XT | |
| Average NVIDIA GeForce RTX 3080 (151 - 155, n=2) | |
| Average NVIDIA Titan RTX (135 - 141.9, n=3) | |
| Average NVIDIA GeForce RTX 4060 Ti 8G (115.7 - 120.2, n=3) | |
| KFA2 GeForce RTX 4060 Ti EX, 16GB GDDR6 | |
| XFX Speedster QICK 308 Radeon RX 7600 Black Edition | |
| KFA2 GeForce RTX 4060 1-Click-OC 2X | |
| Borderlands 3 / Badass Overall Quality (DX11) | |
| NVIDIA GeForce RTX 4090 Founders Edition | |
| Gigabyte GeForce RTX 4080 Super Gaming OC | |
| NVIDIA GeForce RTX 4080 Founders Edition | |
| AMD Radeon RX 7900 XTX | |
| Asus TUF Gaming GeForce RTX 4070 Ti Super | |
| Gigabyte Aorus GeForce RTX 4070 Ti Master | |
| AMD Radeon RX 7900 XT | |
| Asus TUF Gaming GeForce RTX 4070 Ti | |
| Average NVIDIA GeForce RTX 4070 Ti (71.9 - 74.9, n=4) | |
| Average NVIDIA GeForce RTX 3090 (68 - 75.3, n=13) | |
| Average NVIDIA GeForce RTX 3080 Ti (71.2 - 74, n=4) | |
| Gigabyte GeForce RTX 4070 Super Gaming OC 12G | |
| NVIDIA GeForce RTX 4070 Super Founders Edition | |
| Average NVIDIA GeForce RTX 3080 (61.5 - 61.9, n=2) | |
| Zotac Gaming GeForce RTX 4070 AMP Airo | |
| AMD Radeon RX 7800 XT | |
| Sapphire Pulse Radeon RX 7700 XT | |
| Average NVIDIA Titan RTX (46 - 52.8, n=29) | |
| Average NVIDIA GeForce RTX 4060 Ti 8G (43.1 - 43.7, n=3) | |
| KFA2 GeForce RTX 4060 Ti EX, 16GB GDDR6 | |
| XFX Speedster QICK 308 Radeon RX 7600 Black Edition | |
| KFA2 GeForce RTX 4060 1-Click-OC 2X | |
| Borderlands 3 / Badass Overall Quality (DX11) | |
| NVIDIA GeForce RTX 4090 Founders Edition | |
| Gigabyte GeForce RTX 4080 Super Gaming OC | |
| NVIDIA GeForce RTX 4080 Founders Edition | |
| AMD Radeon RX 7900 XTX | |
| Asus TUF Gaming GeForce RTX 4070 Ti Super | |
| Gigabyte Aorus GeForce RTX 4070 Ti Master | |
| Asus TUF Gaming GeForce RTX 4070 Ti | |
| Average NVIDIA GeForce RTX 4070 Ti (134.3 - 142, n=4) | |
| AMD Radeon RX 7900 XT | |
| Gigabyte GeForce RTX 4070 Super Gaming OC 12G | |
| NVIDIA GeForce RTX 4070 Super Founders Edition | |
| Average NVIDIA GeForce RTX 3080 Ti (114 - 130.2, n=4) | |
| Average NVIDIA GeForce RTX 3090 (105 - 131.6, n=13) | |
| Zotac Gaming GeForce RTX 4070 AMP Airo | |
| AMD Radeon RX 7800 XT | |
| Average NVIDIA GeForce RTX 3080 (95.7 - 103, n=2) | |
| Sapphire Pulse Radeon RX 7700 XT | |
| Average NVIDIA Titan RTX (74 - 93.1, n=29) | |
| Average NVIDIA GeForce RTX 4060 Ti 8G (83.9 - 85.2, n=3) | |
| KFA2 GeForce RTX 4060 Ti EX, 16GB GDDR6 | |
| XFX Speedster QICK 308 Radeon RX 7600 Black Edition | |
| KFA2 GeForce RTX 4060 1-Click-OC 2X | |
| Borderlands 3 / Badass Overall Quality (DX11) | |
| NVIDIA GeForce RTX 4090 Founders Edition | |
| Asus TUF Gaming GeForce RTX 4070 Ti | |
| Gigabyte GeForce RTX 4080 Super Gaming OC | |
| Gigabyte Aorus GeForce RTX 4070 Ti Master | |
| AMD Radeon RX 7900 XTX | |
| Average NVIDIA GeForce RTX 4070 Ti (171.4 - 186.9, n=4) | |
| NVIDIA GeForce RTX 4080 Founders Edition | |
| Asus TUF Gaming GeForce RTX 4070 Ti Super | |
| AMD Radeon RX 7900 XT | |
| Gigabyte GeForce RTX 4070 Super Gaming OC 12G | |
| NVIDIA GeForce RTX 4070 Super Founders Edition | |
| Zotac Gaming GeForce RTX 4070 AMP Airo | |
| Average NVIDIA GeForce RTX 3080 Ti (129 - 164.9, n=4) | |
| Average NVIDIA GeForce RTX 3090 (117 - 170.1, n=13) | |
| AMD Radeon RX 7800 XT | |
| Sapphire Pulse Radeon RX 7700 XT | |
| Average NVIDIA GeForce RTX 3080 (117 - 128, n=2) | |
| Average NVIDIA GeForce RTX 4060 Ti 8G (121.5 - 123.5, n=3) | |
| KFA2 GeForce RTX 4060 Ti EX, 16GB GDDR6 | |
| Average NVIDIA Titan RTX (77.2 - 128.7, n=29) | |
| XFX Speedster QICK 308 Radeon RX 7600 Black Edition | |
| KFA2 GeForce RTX 4060 1-Click-OC 2X | |
| Shadow of the Tomb Raider / Highest Preset | |
| NVIDIA GeForce RTX 4090 Founders Edition | |
| AMD Radeon RX 7900 XTX | |
| Gigabyte GeForce RTX 4080 Super Gaming OC | |
| NVIDIA GeForce RTX 4080 Founders Edition | |
| AMD Radeon RX 7900 XT | |
| Asus TUF Gaming GeForce RTX 4070 Ti Super | |
| Gigabyte Aorus GeForce RTX 4070 Ti Master | |
| Asus TUF Gaming GeForce RTX 4070 Ti | |
| Average NVIDIA GeForce RTX 4070 Ti (102.7 - 104.9, n=4) | |
| Gigabyte GeForce RTX 4070 Super Gaming OC 12G | |
| Average NVIDIA GeForce RTX 3090 (89.3 - 99.7, n=12) | |
| Average NVIDIA GeForce RTX 3080 Ti (93 - 98.6, n=3) | |
| NVIDIA GeForce RTX 4070 Super Founders Edition | |
| Average NVIDIA GeForce RTX 3080 (83.9 - 87.9, n=2) | |
| Zotac Gaming GeForce RTX 4070 AMP Airo | |
| AMD Radeon RX 7800 XT | |
| Average NVIDIA Titan RTX (59 - 71.1, n=24) | |
| Sapphire Pulse Radeon RX 7700 XT | |
| KFA2 GeForce RTX 4060 Ti EX, 16GB GDDR6 | |
| Average NVIDIA GeForce RTX 4060 Ti 8G (58.1 - 58.7, n=3) | |
| KFA2 GeForce RTX 4060 1-Click-OC 2X | |
| XFX Speedster QICK 308 Radeon RX 7600 Black Edition | |
| Shadow of the Tomb Raider / Highest Preset | |
| NVIDIA GeForce RTX 4090 Founders Edition | |
| AMD Radeon RX 7900 XTX | |
| Gigabyte GeForce RTX 4080 Super Gaming OC | |
| Asus TUF Gaming GeForce RTX 4070 Ti Super | |
| Gigabyte Aorus GeForce RTX 4070 Ti Master | |
| AMD Radeon RX 7900 XT | |
| Asus TUF Gaming GeForce RTX 4070 Ti | |
| Average NVIDIA GeForce RTX 4070 Ti (195.9 - 204, n=4) | |
| NVIDIA GeForce RTX 4080 Founders Edition | |
| Gigabyte GeForce RTX 4070 Super Gaming OC 12G | |
| Average NVIDIA GeForce RTX 3090 (137 - 172.3, n=12) | |
| NVIDIA GeForce RTX 4070 Super Founders Edition | |
| Average NVIDIA GeForce RTX 3080 Ti (157 - 173.3, n=3) | |
| Zotac Gaming GeForce RTX 4070 AMP Airo | |
| AMD Radeon RX 7800 XT | |
| Average NVIDIA GeForce RTX 3080 (147 - 152, n=2) | |
| Sapphire Pulse Radeon RX 7700 XT | |
| Average NVIDIA GeForce RTX 4060 Ti 8G (119.3 - 121.2, n=3) | |
| KFA2 GeForce RTX 4060 Ti EX, 16GB GDDR6 | |
| Average NVIDIA Titan RTX (98 - 128, n=23) | |
| KFA2 GeForce RTX 4060 1-Click-OC 2X | |
| XFX Speedster QICK 308 Radeon RX 7600 Black Edition | |
| Shadow of the Tomb Raider / Highest Preset | |
| NVIDIA GeForce RTX 4090 Founders Edition | |
| AMD Radeon RX 7900 XTX | |
| AMD Radeon RX 7900 XT | |
| Asus TUF Gaming GeForce RTX 4070 Ti | |
| Gigabyte Aorus GeForce RTX 4070 Ti Master | |
| Average NVIDIA GeForce RTX 4070 Ti (263 - 280, n=4) | |
| Gigabyte GeForce RTX 4080 Super Gaming OC | |
| Asus TUF Gaming GeForce RTX 4070 Ti Super | |
| Gigabyte GeForce RTX 4070 Super Gaming OC 12G | |
| NVIDIA GeForce RTX 4070 Super Founders Edition | |
| Zotac Gaming GeForce RTX 4070 AMP Airo | |
| NVIDIA GeForce RTX 4080 Founders Edition | |
| AMD Radeon RX 7800 XT | |
| Average NVIDIA GeForce RTX 3080 Ti (178 - 238, n=3) | |
| Average NVIDIA GeForce RTX 3090 (145 - 240, n=14) | |
| Sapphire Pulse Radeon RX 7700 XT | |
| KFA2 GeForce RTX 4060 Ti EX, 16GB GDDR6 | |
| Average NVIDIA GeForce RTX 4060 Ti 8G (181.6 - 184, n=3) | |
| Average NVIDIA GeForce RTX 3080 (177 - 185, n=2) | |
| Average NVIDIA Titan RTX (106 - 178.8, n=24) | |
| KFA2 GeForce RTX 4060 1-Click-OC 2X | |
| XFX Speedster QICK 308 Radeon RX 7600 Black Edition | |
The Witcher 3: 3840x2160 Ultra Graphics & Postprocessing (HBAO+) | 3840x2160 High Graphics & Postprocessing (Nvidia HairWorks Off) | 1920x1080 Ultra Graphics & Postprocessing (HBAO+)
Metro Exodus: 3840x2160 Ultra Quality AF:16x | 2560x1440 Ultra Quality AF:16x | 1920x1080 Ultra Quality AF:16x
Control: 3840x2160 High Quality Preset (DX11) | 2560x1440 High Quality Preset (DX11) | 1920x1080 High Quality Preset (DX11)
Borderlands 3: 3840x2160 Badass Overall Quality (DX11) | 2560x1440 Badass Overall Quality (DX11) | 1920x1080 Badass Overall Quality (DX11)
Shadow of the Tomb Raider: 3840x2160 Highest Preset AA:T | 2560x1440 Highest Preset AA:T | 1920x1080 Highest Preset AA:T
F1 22: 3840x2160 Ultra High Preset AA:T AF:16x | 2560x1440 Ultra High Preset AA:T AF:16x | 1920x1080 Ultra High Preset AA:T AF:16x
Final Fantasy XV Benchmark: 3840x2160 High Quality | 2560x1440 High Quality | 1920x1080 High Quality
Wydajność śledzenia promieni
Gry takie jak Metro Exodus (edycja bez ulepszeń), Controli Far Cry 6 rX 7900 XTX zdołał nieznacznie pokonać RTX 4080 Super Gaming OC w natywnym ray tracingu w rozdzielczości 1080p Ultra.
Mając to na uwadze, RTX 4080 Super Gaming OC zdołał uzyskać od 3 do 17% przewagi nad RTX 4080 FE w natywnym ray tracingu.
| Alan Wake 2 | |
| 3840x2160 High Preset + High Ray Tracing + Quality DLSS + FG | |
| Gigabyte GeForce RTX 4080 Super Gaming OC | |
| NVIDIA GeForce RTX 4080 Founders Edition | |
| Asus TUF Gaming GeForce RTX 4070 Ti Super | |
| Average of class Desktop (28.9 - 77.6, n=5, last 2 years) | |
| Gigabyte GeForce RTX 4070 Super Gaming OC 12G | |
| NVIDIA GeForce RTX 4070 Super Founders Edition | |
| 1920x1080 High Preset + High Ray Tracing | |
| Gigabyte GeForce RTX 4080 Super Gaming OC | |
| Asus TUF Gaming GeForce RTX 4070 Ti Super | |
| NVIDIA GeForce RTX 4080 Founders Edition | |
| Gigabyte GeForce RTX 4070 Super Gaming OC 12G | |
| NVIDIA GeForce RTX 4070 Super Founders Edition | |
| Average of class Desktop (4.7 - 77.7, n=6, last 2 years) | |
| Average NVIDIA GeForce RTX 3090 (49.8 - 52, n=2) | |
| Average NVIDIA Titan RTX () | |
| Sapphire Pulse Radeon RX 7700 XT | |
| XFX Speedster QICK 308 Radeon RX 7600 Black Edition | |
| low | med. | high | ultra | QHD | 4K DLSS | 4K FSR | 4K | |
| GTA V (2015) | 188.2 | 188 | 186.9 | 165.4 | 164.6 | 163.6 | ||
| The Witcher 3 (2015) | 470 | 241 | 196.2 | 186.4 | ||||
| Dota 2 Reborn (2015) | 273 | 245 | 236 | 222 | 214 | |||
| Final Fantasy XV Benchmark (2018) | 235 | 236 | 225 | 193.5 | 117.8 | |||
| X-Plane 11.11 (2018) | 236 | 207 | 154.9 | 132.2 | ||||
| Far Cry 5 (2018) | 206 | 202 | 193 | 134 | ||||
| Strange Brigade (2018) | 626 | 519 | 501 | 480 | 389 | 197.3 | ||
| Shadow of the Tomb Raider (2018) | 271 | 262 | 224 | 127.5 | ||||
| Metro Exodus (2019) | 203 | 169.4 | 144.9 | 97.7 | ||||
| Control (2019) | 221 | 206 | 145 | 86.4 | 76.5 | |||
| Borderlands 3 (2019) | 184.4 | 186.3 | 161.6 | 97.6 | ||||
| Mafia Definitive Edition (2020) | 248 | 232 | 202 | 111.4 | ||||
| Watch Dogs Legion (2020) | 149 | 144.5 | 127 | 80.5 | ||||
| Far Cry 6 (2021) | 212 | 194.4 | 179.8 | 162.8 | 99.3 | |||
| Dying Light 2 (2022) | 217 | 165.9 | 123.7 | 65 | ||||
| Cyberpunk 2077 1.6 (2022) | 209 | 208 | 198.4 | 187.8 | 127.9 | 63 | ||
| Ghostwire Tokyo (2022) | 299 | 298 | 247 | 120 | ||||
| F1 22 (2022) | 368 | 166.4 | 112.9 | 59.2 | ||||
| F1 23 (2023) | 393 | 165.4 | 108.3 | 94.5 | 54.5 | |||
| Baldur's Gate 3 (2023) | 245 | 237 | 232 | 186.8 | 160.7 | 97.6 | ||
| Cyberpunk 2077 2.0 Phantom Liberty (2023) | 197.5 | 198.3 | 186.9 | 173.8 | 121.7 | 55.6 | ||
| Assassin's Creed Mirage (2023) | 243 | 191 | 158 | 135 | 101 | |||
| Alan Wake 2 (2023) | 130.1 | 122.4 | 90.1 | 77.6 | 53.5 | |||
| Avatar Frontiers of Pandora (2023) | 158.9 | 128.8 | 90.1 | 81.1 | 48.4 | |||
| Skull & Bones (2024) | 205 | 172 | 137 | 114 | 105 | 101 | 78 |
Emisje: Wyższy poziom hałasu, ale względnie bezproblemowe działanie pod obciążeniem
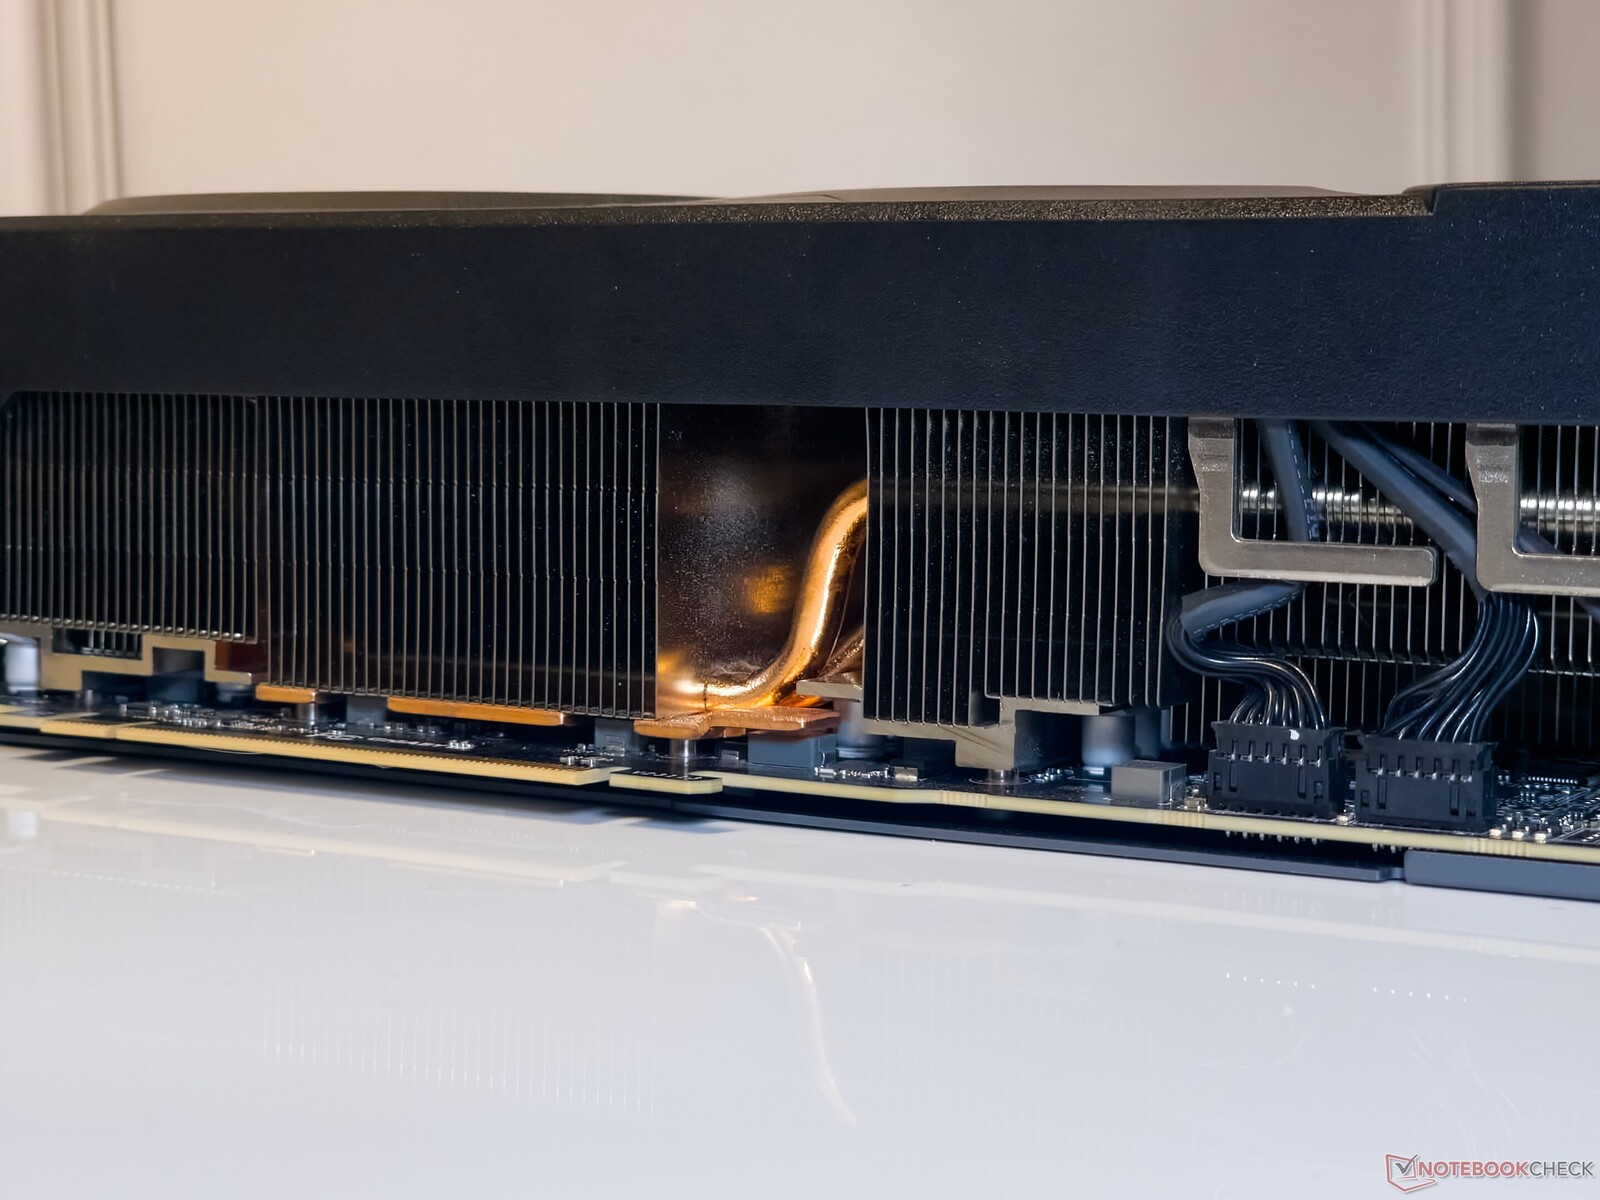
RTX 4080 Super Gaming OC wykorzystuje system chłodzenia WindForce firmy Gigabyte, który składa się z trzech naprzemiennie obracających się wentylatorów 110 mm i dziewięciu rurek cieplnych wraz z miedzianą płytką bezpośredniego kontaktu.
Według Gigabyte, wentylatory z łożyskami ślizgowymi wykorzystują grafenowy nano-smar, który rzekomo pomaga wydłużyć żywotność, podobnie jak w przypadku wentylatorów z podwójnymi łożyskami kulkowymi.
Metalowa płyta tylna posiada duże wycięcie do odprowadzania powietrza, które w rzeczywistości jest przedłużeniem radiatora.
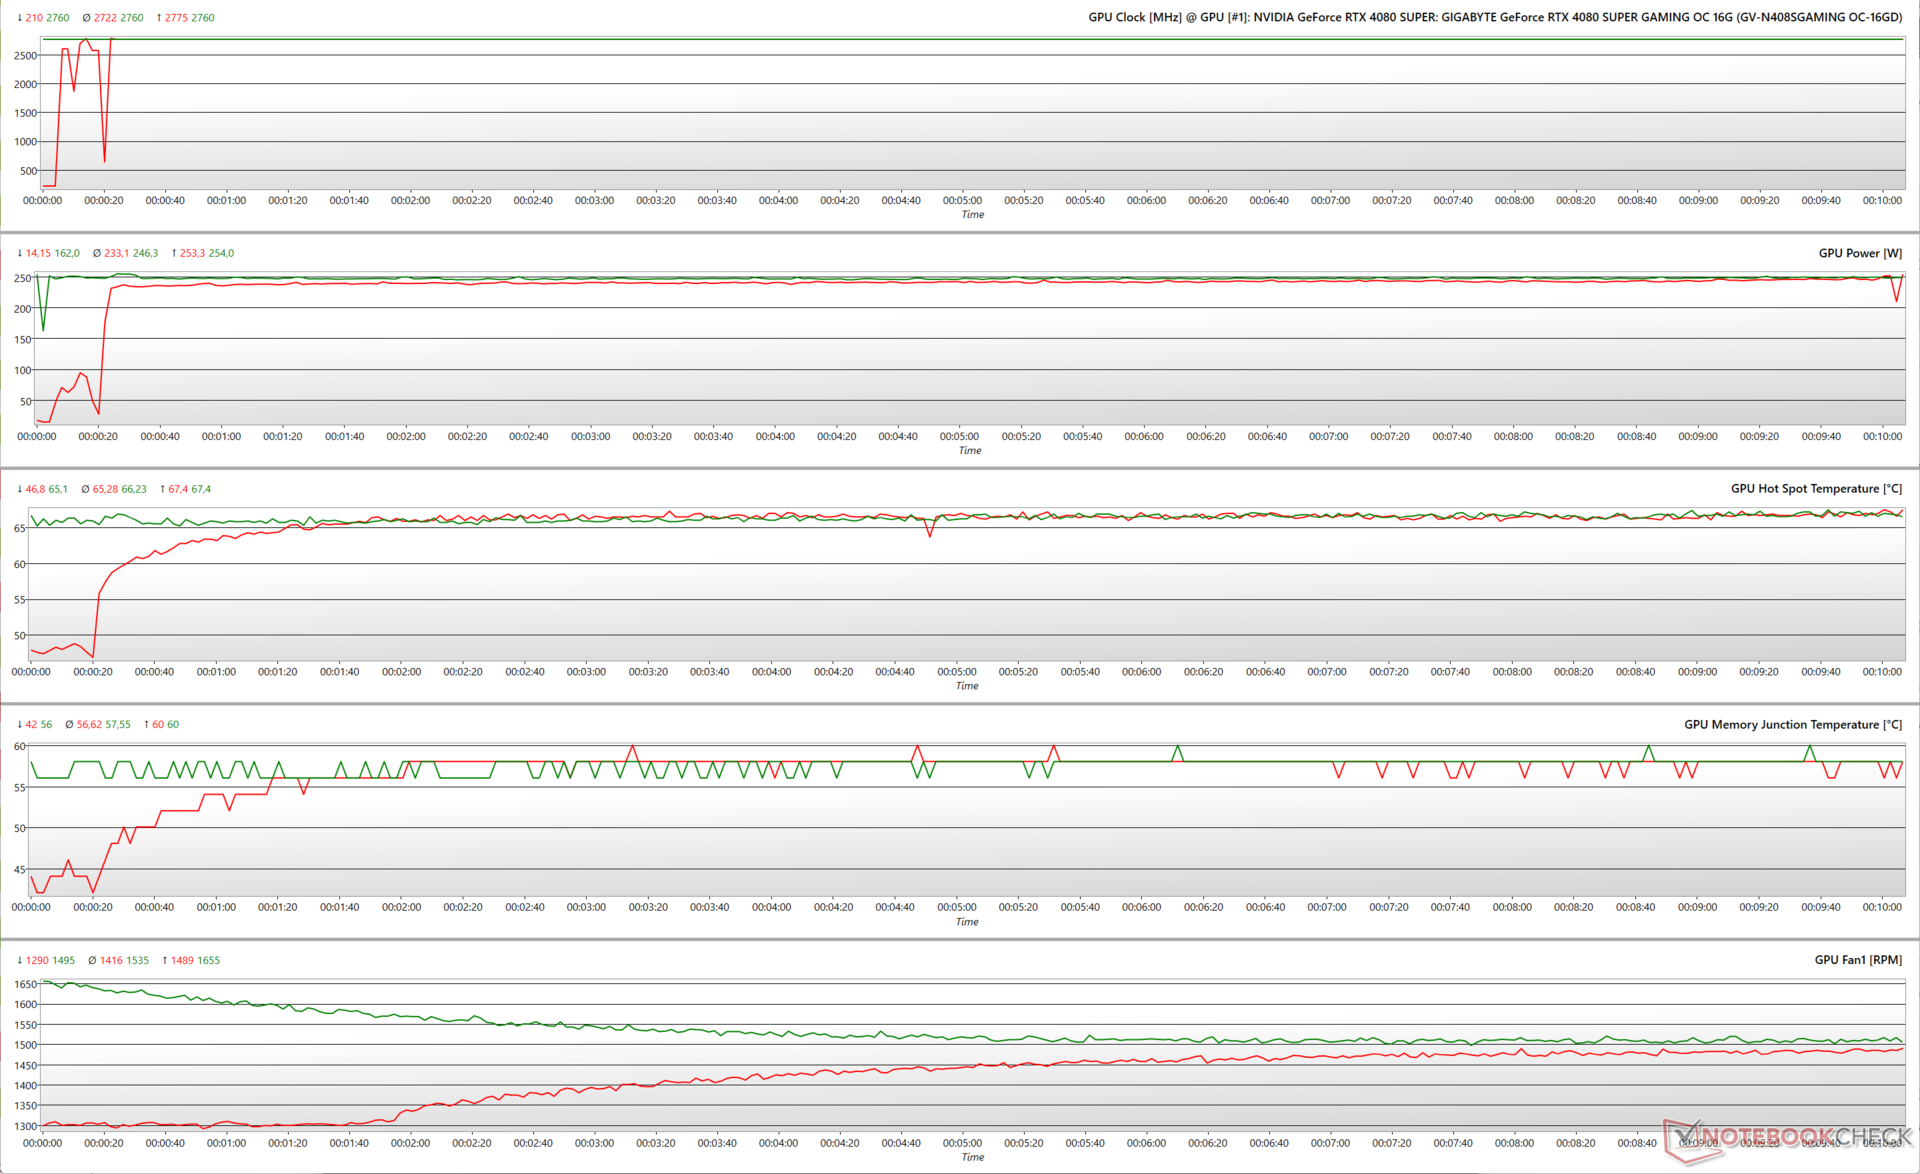
Testy warunków skrajnych
Podkręcając RTX 4080 Super Gaming OC za pomocą FurMark (1280 x 720, bez AA), GPU wykorzystuje dostępne 320 W TGP przy 100% docelowej mocy (PT). Skutkuje to średnim taktowaniem boost wynoszącym 2 458 MHz i temperaturami hotspotów zbliżonymi do 75 °C.
Przy 125% PT, GPU jest w stanie wykorzystać tylko 383 W z teoretycznie dostępnych 400 W. Zaobserwowano to również wcześniej w przypadku RTX 4070 Super Gaming OC.
Widzimy, że GPU osiąga średnie taktowanie 2634 MHz, a temperatura hotspotu odpowiednio wzrasta do 84°C.
Podczas pracy The Witcher 3 w rozdzielczości 1080p Ultra, RTX 4080 Super Gaming OC udaje się utrzymać stałe taktowanie 2760 MHz przy 100% PT, zużywając przy tym 254 W.
Jak to zwykle bywa w przypadku kart Ada, zwiększenie docelowej mocy w obciążeniach gamingowych nie przynosi żadnych widocznych korzyści. Parametry takie jak prędkość zegara, pobór mocy i temperatury hotspotów są identyczne w stresie The Witcher 3 nawet przy 125% PT.

Wykres Witcher 3 FPS
System chłodzenia WindForce firmy Gigabyte wydaje się działać dobrze, aby złagodzić wszelkie obawy związane z dławieniem. Nie zaobserwowaliśmy żadnych spadków klatek podczas testów obciążeniowych z The Witcher 3 w rozdzielczości 1080p Ultra i 4K Ultra.
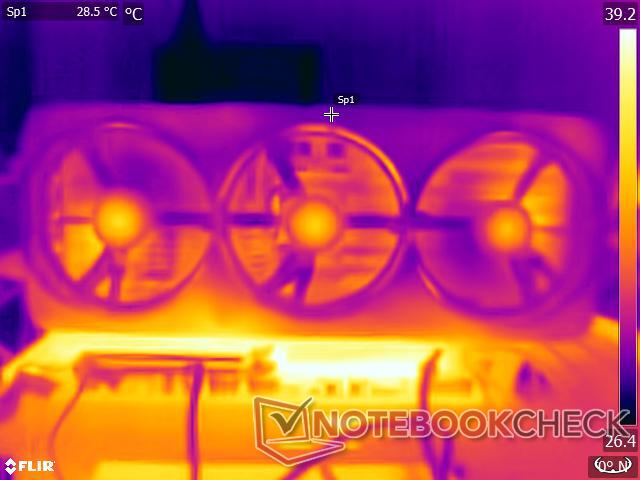
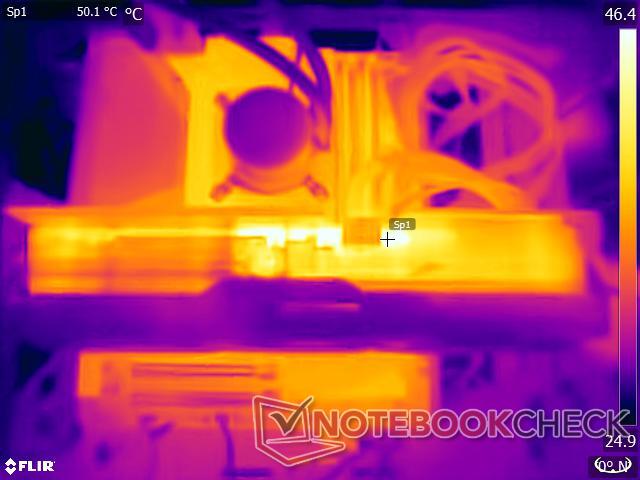
Temperatury powierzchni
Temperatury powierzchni pod obciążeniem są w większości przypadków znośne. Przy temperaturze otoczenia 23 °C, przednia plastikowa osłona pozostaje stosunkowo chłodna (28,5 °C), podczas gdy metalowy panel tylny osiąga prawie 48 °C.
Obszar w pobliżu złącza 12VHPWR również staje się dość ciepły, osiągając 50 °C.

Poziomy hałasu

RTX 4080 Super Gaming OC ma głośniejszy profil hałasu w porównaniu do tego, co zaobserwowaliśmy wcześniej w przypadku RTX 4070 Super Gaming OC.
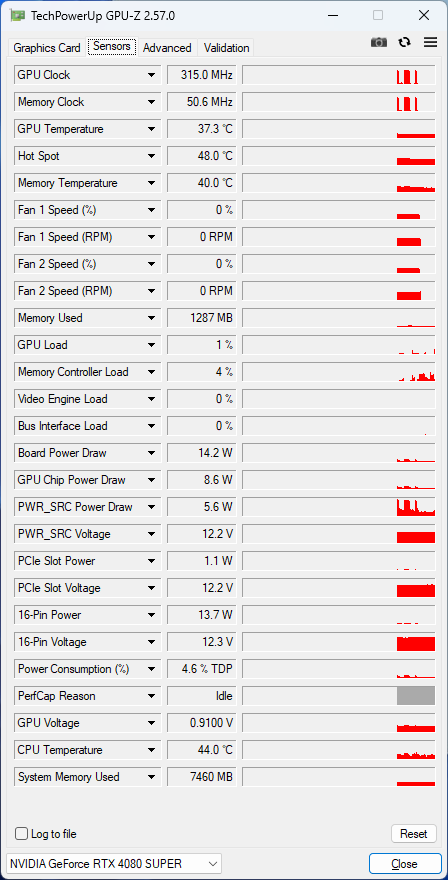
To powiedziawszy, wentylatory całkowicie zatrzymują się w trybie bezczynności i zaczynają się obracać dopiero po osiągnięciu przez rdzeń temperatury 55 °C, zgodnie z domyślną krzywą wentylatorów.
Użytkownicy mogą wybrać między trybami BIOS OC i Silent VBIOS, ale podczas testów nie zaobserwowaliśmy żadnych znaczących różnic między nimi. Przełącznik VBIOS wydaje się w zasadzie zbędny, gdyż krzywe wentylatorów można łatwo dostosować do własnych upodobań w aplikacji Gigabyte Control Center.
Niemniej jednak, zarejestrowaliśmy maksymalny poziom ciśnienia akustycznego (SPL) wynoszący 54,21 dB(A) podczas obciążania GPU za pomocą FurMark w trybie BIOS OC przy 125% PT.
Poziom hałasu podczas grania w The Witcher 3 w rozdzielczości 1080p Ultra utrzymywał się poniżej 50 dB(A) SPL we wszystkich testowanych trybach.
| Stress Test | VBIOSMode / Power Target | Max. Prędkość obrotowa wentylatora (RPM) | Hałas wentylatora dB(A) |
| FurMark 1280 x 720, bez AA | BIOS OC / 100% | 1,937 | 49.37 |
| FurMark 1280 x 720, bez AA | Cichy BIOS / 100% | 1,997 | 50.09 |
| FurMark 1280 x 720, bez AA | BIOS OC / 125% | 2,326 | 54.21 |
| FurMark 1280 x 720, bez AA | Silent BIOS / 125% | 2,302 | 54.10 |
| Witcher 3 1080p Ultra | BIOS OC / 100% | 1,814 | 48.24 |
| Witcher 3 1080p Ultra | Silent BIOS / 100% | 1,801 | 48.66 |
| Witcher 3 1080p Ultra | BIOS OC / 125% | 1,866 | 49.29 |
| Witcher 3 1080p Ultra | Silent BIOS / 125% | 1,813 | 49.13 |
Zarządzanie energią: Porównywalne do RTX 4080 FE przy 100% PT
RTX 4080 Super Gaming OC nie jest najbardziej oszczędny, jeśli chodzi o pobór mocy, biorąc pod uwagę potężną matrycę AD103, ale nadal jest o 20% bardziej ekonomiczny w porównaniu do RX 7900 XTX.
Pobór mocy karty Gigabyte podczas testów FurMark i The Witcher 3 jest porównywalny z RTX 4080 FE przy 100% PT, będąc jednocześnie o 6% mniej wydajnym niż ten drugi.
Pobór mocy podczas grania w The Witcher 3 w rozdzielczości 1080p Ultra jest tylko nieznacznie wyższy, przechodząc od 100% do 125% PT, w porównaniu do bardziej zauważalnej 15% różnicy w FurMark.
Power Consumption: External monitor
| 1280x720 FurMark 1.19 GPU Stress Test (external Monitor) | |
| 1920x1080 The Witcher 3 ultra (external Monitor) | |
* ... im mniej tym lepiej
Za
Przeciw
Werdykt: Przyrostowe korzyści z pełnego AD103 przy obniżonej cenie sugerowanej

Gigabyte GeForce RTX 4080 Super Gaming OC 16G w pełni zastępuje swojego poprzednika RTX 4080 za niższą cenę wywoławczą, oferując jednocześnie 5% więcej jednostek cieniujących, nominalny wzrost o 45 MHz i nieco szybszą pamięć. Gigabyte zachował wszystkie znane aspekty wariantu ostatniej generacji - konstrukcję z trzema gniazdami, konfigurację WindForce z trzema wentylatorami i dziewięcioma rurkami cieplnymi oraz przyzwoite RGB.
Ogólnie rzecz biorąc, karcie Gigabyte udało się wyprzedzić model RTX 4080 Founders Edition w syntetykach odpowiadających wzrostowi liczby shaderów. Delty były zaskakująco szersze w testach gamingowych, ale dokładne zyski, jeśli w ogóle, będą zależeć od samej gry i rozdzielczości, w której grasz.
Karta RTX 4090 Founders Edition (1599 USD w Best Buy) nadal prowadzi na listach przebojów, a Nvidia ma niewielką motywację do wprowadzenia na rynek RTX 4090 Ti lub Super, ponieważ Team Red wydaje się nonszalancko podchodzić do wszelkich prób zakłócenia flagowego status quo.
Gigabyte RTX 4080 Super Gaming OC 16G oferuje świetną wydajność w grach 4K, która staje się jeszcze lepsza dzięki obsłudze nowszych technologii DLSS. Wzrost o 50 USD w stosunku do RTX 4080 Super FE nie jest całkowicie zmarnowany, ale AMD Radeon RX 7900 XTX jest równie kompetentną ofertą, jeśli chcą Państwo zaoszczędzić trochę więcej pieniędzy"
Wygląda na to, że Nvidia dobrze rozegrała swoje karty (gra słów zamierzona), obniżając sugerowaną cenę detaliczną RTX 4080 FE o 200 USD. Idealnie byłoby, gdyby była to cena już w 2022 roku, ale minęło trochę czasu, zanim pojawił się AMD Radeon RX 7900 XTX (od 926 USD na Amazon), aby zaoferować jakiekolwiek pozory konkurencji.
Obie karty świetnie sprawdzają się w grach z wysoką częstotliwością odświeżania 1440p i natywnym 4K 60 fps, ale RX 7900 XTX wydaje się być ogólnie lepszym wyborem pod względem stosunku jakości do ceny w tym segmencie.
RTX 4080 Super Gaming OC oferuje jednak korzyści, które obecnie mogą zaoferować tylko karty Nvidii. Obejmują one lepszą ogólną wydajność ray tracingu wraz z obsługą technologii generowania klatek DLSS 3 i rekonstrukcji promieni DLSS 3.5, a także znacznie lepszą wydajność energetyczną.
Gigabyte oferuje przyzwoity zestaw funkcji za dodatkowe 50 USD marży, takich jak wysoce wydajny cooler, podwójny przełącznik VBIOS, dobra estetyka, wsporniki zapobiegające zwisaniu GPU i czteroletnia gwarancja.
Ale czy w tym momencie jest sens wydawać tysiąc dolarów na nowy procesor graficzny? Być może nie. Karta graficzna RTX 4070 Super (od 600 USD na Amazon) jest już zdolna do przyzwoitego grania w rozdzielczości 4K z pewną pomocą skalowania w górę, a rozsądne może być poczekanie i sprawdzenie, co nadchodzące procesory graficzne Nvidia Blackwell i AMD RDNA 4 mają do zaoferowania jeszcze w tym roku.
Oryginalny RTX 4080 non-Super został oficjalnie wycofany z rynku, ale nie jest złym pomysłem polowanie na świetne okazje na lokalnym rynku.
Cena i dostępność
Karta Gigabyte GeForce RTX 4080 Super Gaming OC 16G została oficjalnie wyceniona na 1050 USD sugerowanej ceny detalicznej, ale obecnie można ją kupić za 1100 USD zarówno na Amazon US, jak i Best Buy US.
Karta nie jest jeszcze dostępna na Amazon India, ale ceny w lokalnych sklepach detalicznych mogą wahać się od 1,20,000 do 1,28,000 jenów.
Transparency
The present review sample was made available to the author as a loan by the manufacturer or a shop for the purposes of review. The lender had no influence on this review, nor did the manufacturer receive a copy of this review before publication. There was no obligation to publish this review.
Pricecompare

