 Deutsch
 English
 Español
 Français
 Italiano
 Nederlands
 Polski
 Português
 Русский
 Türkçe
 Svenska
 Chinese
 Magyar
Recenzja Microsoft Surface Laptop 7 13.8 Copilot+ - Dzięki Snapdragonowi X Elite wreszcie poważnym konkurentem MacBooka Air?
Oprócz Surface Pro, Microsoft wyposaża teraz również Surface Laptop w nowe procesory Snapdragon firmy Qualcomm. Teraz, w siódmej generacji, ponownie dostępne są dwa rozmiary (13,8 i 15 cali), ale najpierw przyjrzymy się modelowi 13,8-calowemu. Cena podstawowa z procesorem Snapdragon X Plus (10 rdzeni, 16 GB pamięci RAM i 256 GB SSD) wynosi 1069 USD; nasza konfiguracja testowa z Snapdragon X Elite (12 rdzeni), 16 GB pamięci RAM i dyskiem SSD o pojemności 512 GB kosztuje 1 669 USD.
Potencjalni konkurenci w porównaniu
Rating | Version | Date | Model | Weight | Height | Size | Resolution | Price |
|---|---|---|---|---|---|---|---|---|
| 86.2 % | v8 | 07/2024 | Microsoft Surface Laptop 7 13.8 Copilot+ SD X Elite X1E-80-100, Adreno X1-85 3.8 TFLOPS | 1.3 kg | 17.5 mm | 13.80" | 2304x1536 | |
| 90.1 % | v7 (old) | 05/2024 | Lenovo ThinkBook 13x G4 21KR0008GE Ultra 5 125H, Arc 7-Core | 1.2 kg | 12.9 mm | 13.50" | 2880x1920 | |
| 86.5 % | v7 (old) | 05/2024 | Dell XPS 13 9340 Core Ultra 7 Ultra 7 155H, Arc 8-Core | 1.2 kg | 15.3 mm | 13.40" | 1920x1200 | |
| 92.4 % | v7 (old) | 03/2024 | Apple MacBook Air 13 M3 10C GPU M3, M3 10-Core GPU | 1.2 kg | 11.3 mm | 13.60" | 2560x1664 | |
| 87.5 % | v7 (old) | 10/2023 | Framework Laptop 13.5 Ryzen 7 7840U R7 7840U, Radeon 780M | 1.3 kg | 15.85 mm | 13.50" | 2256x1504 | |
| 91.9 % | v7 (old) | 07/2023 | HP Dragonfly G4 i7-1365U, Iris Xe G7 96EUs | 1.1 kg | 16.3 mm | 13.50" | 1920x1280 |
Uwaga: Niedawno zaktualizowaliśmy nasz system oceny i wyniki wersji 8 nie są porównywalne z wynikami wersji 7. Więcej informacji znajdą Państwo tutaj .
Obudowa - metalowa obudowa z możliwością konserwacji

Nic nie zmieniło się w konstrukcji Surface Laptop 7. generacji, a z zewnątrz nie będą Państwo w stanie stwierdzić, czy mają do czynienia z nowym modelem Snapdragona. Widać to dopiero po nowym przycisku Copilot. Metalowa obudowa jest nadal wspaniale wykonana, a Microsoft oferuje laptopa w kolorach czarnym, platynowym, szaro-beżowym lub szafirowo-niebieskim, który jest kolorem naszego recenzowanego urządzenia. W zależności od tego, jak pada światło, szafirowo-niebieski model jest bardzo efektowny i podoba nam się. Co więcej, nie ma żadnych problemów z odciskami palców.
Stabilność jest bardzo dobra przy minimalnym ugięciu wymagającym dużego nacisku. Nie byliśmy jednak w stanie sprowokować żadnych skrzypiących dźwięków. Zawiasy są w zasadzie dobrze skalibrowane, ale nie da się uniknąć lekkiego chybotania podczas regulacji kąta otwarcia (maksymalnie 135 stopni). Nie ma problemów, gdy ziemia się trzęsie (na przykład podczas podróży pociągiem). Jedną z nowości w urządzeniach 7. generacji jest opcja konserwacji, ponieważ pokrywa nie jest już przyklejana (więcej na ten temat za chwilę).


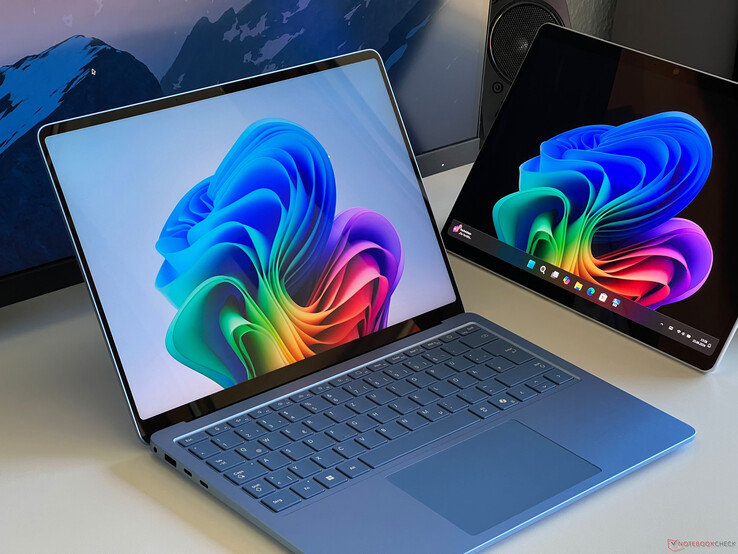
Surface Laptop 13.8 nie jest szczególnie smukłym czy lekkim urządzeniem. Przy wadze nieco ponad 1,3 kg i grubości 17,5 mm z tyłu, mamy do czynienia z najgrubszym laptopem w tym porównaniu. Niemniej jednak laptop jest ogólnie bardzo kompaktowy i można go łatwo przechowywać w plecaku. W bezpośrednim porównaniu z MacBook Air 13 M3 (patrz poniższe zdjęcia) można zauważyć, jak gruby jest Surface Laptop i że ma nieco większą powierzchnię. Dostarczony 39-watowy zasilacz waży 213 gramów.


Funkcje - USB 4 i Wi-Fi 7
Microsoft nadal decyduje się na port Surface Connect, przez który urządzenie może być również standardowo ładowane (możliwe jest również ładowanie przez USB-C). Ponadto dostępne są dwa interfejsy USB 4.0 i zwykły port USB-A. Trzeba będzie jednak obejść się bez czytnika kart.


Komunikacja
Procesor Snapdragon jest wyposażony w moduł Wi-Fi FastConnect 7800, który obsługuje również nowy standard Wi-Fi 7, a także Bluetooth 5.4. W naszej recenzji z routerem referencyjnym Asus prędkość transferu była wysoka i stabilna, jednak wydajność wysyłania nie jest tak wysoka jak w przypadku MacBook Air lub ThinkBook 13x.
| Networking | |
| Microsoft Surface Laptop 7 13.8 Copilot+ | |
| iperf3 transmit AXE11000 |
|
| iperf3 receive AXE11000 |
|
| iperf3 transmit AXE11000 6GHz |
|
| iperf3 receive AXE11000 6GHz |
|
| Lenovo ThinkBook 13x G4 21KR0008GE | |
| iperf3 transmit AXE11000 |
|
| iperf3 receive AXE11000 |
|
| Dell XPS 13 9340 Core Ultra 7 | |
| iperf3 transmit AXE11000 |
|
| iperf3 receive AXE11000 |
|
| Apple MacBook Air 13 M3 10C GPU | |
| iperf3 transmit AXE11000 |
|
| iperf3 receive AXE11000 |
|
| Framework Laptop 13.5 Ryzen 7 7840U | |
| iperf3 transmit AXE11000 |
|
| iperf3 receive AXE11000 |
|
| iperf3 transmit AXE11000 6GHz |
|
| iperf3 receive AXE11000 6GHz |
|
| HP Dragonfly G4 | |
| iperf3 transmit AXE11000 |
|
| iperf3 receive AXE11000 |
|
| iperf3 transmit AXE11000 6GHz |
|
| iperf3 receive AXE11000 6GHz |
|
Kamera internetowa
Microsoft zdecydował się na kamerę internetową 1080p, która oczywiście obsługuje również obecne efekty Studio. Pod względem jakości wyniki są przyzwoite, ale nieporównywalne z bardzo dobrymi kamerami znajdującymi się w Surface Pro 2-w-1. Na pokładzie nie ma mechanicznej/elektronicznej migawki, ale jest czujnik podczerwieni do rozpoznawania twarzy za pomocą Windows Hello.


Konserwacja
W tej sekcji nastąpiła znaczna poprawa w porównaniu do starych modeli, ponieważ podstawa Surface Laptop 7 jest teraz przykręcona, a nie przyklejona. Cztery śruby (Torx T5) są ukryte, ale łatwo dostępne pod gumowymi nóżkami. Wewnątrz, wentylator, bateria i kompaktowy dysk SSD M.2 2230 są również łatwo dostępne. Pamięć RAM i Wi-Fi są jednak przylutowane.


Gwarancja
Producent oferuje 12-miesięczną gwarancję. W Niemczech istnieje oczywiście również dodatkowa ustawowa dwuletnia ochrona. Pod nazwą Microsoft Complete producent oferuje rozszerzoną gwarancję na dwa, trzy lub cztery lata (+ 149 USD, 219 USD lub 249 USD). Oczywiście obejmuje ona również przypadkowe uszkodzenia. Serwis na miejscu nie jest wliczony w cenę, co oznacza, że urządzenie będzie musiało zostać wysłane do naprawy.
Urządzenia wejściowe - ekran dotykowy i dotykowy panel dotykowy
Klawiatura Surface Laptop 7 zapewnia wygodne pisanie. W poprzednich modelach klawisze wydawały się nieco chwiejne, jednak tutaj już tak nie jest. Skok klawiszy jest wystarczający, a punkt nacisku przyjemny, co oznacza, że nawet dłuższe teksty można wygodnie kompilować. Chociaż układ z nowym przyciskiem Copilot nie oferuje żadnych niespodzianek, klawisze strzałek są bardzo małe. Białe podświetlenie oferuje trzy poziomy intensywności, ale nie można go automatycznie aktywować za pomocą czujnika.


Nowy Surface Laptop jest domem dla haptycznego touchpada widocznego w Surface Studio 2. Nie posiada on żadnych ruchomych części, a sprzężenie zwrotne kliknięcia jest generowane przez silniki wibracyjne. Oznacza to, że gdziekolwiek klikniemy touchpadem, otrzymamy takie samo sprzężenie zwrotne (które jest przyjemnie ciche). W praktyce sprawdza się to znakomicie w połączeniu z gładką powierzchnią (12 x 8 cm). Ponadto, jest też pojemnościowy ekran dotykowy, który działa bez zarzutu.
Wyświetlacz - panel IPS o rozdzielczości 600 cd/m²

Microsoft pozostawił podstawowe właściwości wyświetlacza bez zmian (dostawca: Sharp), ponieważ po raz kolejny mamy do czynienia z ekranem dotykowym IPS o proporcjach 3:2 i rozdzielczości 2 304 x 1 536 pikseli. Przy przekątnej 13,8 cala wyświetlacz jest wystarczająco ostry, a subiektywna jakość obrazu jest dobra, ponieważ panel obsługuje częstotliwość 120 Hz. Jednak jakość wyświetlacza Surface Laptop nie osiąga wyżyn osiąganych przez panele OLED i opcję OLED widoczną w Surface Pro byłaby z pewnością interesująca. Niemniej jednak, w porównaniu do MacBooka Airwysoka częstotliwość jest zaletą.
Jasność wzrosła i obecnie wynosi średnio prawie 600 cd/m². Oznacza to, że cierpi na tym wartość czerni, która przy 0,43 cd/m² jest nieco za wysoka. Maksymalny współczynnik kontrastu nadal oscyluje wokół ~ 1400:1. Obsługiwane są treści HDR, ale maksymalna jasność pozostaje niezmieniona. Nigdzie nie widać migotania PWM, a czasy reakcji są niezauważalne. Ponadto, krwawienie światła nie stanowi żadnego problemu pomimo wysokiej jasności. Zarówno jasność, jak i temperaturę kolorów można dostosować do oświetlenia otoczenia za pomocą czujnika.
| |||||||||||||||||||||||||
rozświetlenie: 94 %
na akumulatorze: 603 cd/m²
kontrast: 1409:1 (czerń: 0.43 cd/m²)
ΔE Color 1.3 | 0.5-29.43 Ø4.94
ΔE Greyscale 2.1 | 0.5-98 Ø5.2
87.3% AdobeRGB 1998 (Argyll 2.2.0 3D)
98.2% sRGB (Argyll 2.2.0 3D)
97.8% Display P3 (Argyll 2.2.0 3D)
Gamma: 2.16
| Microsoft Surface Laptop 7 13.8 Copilot+ LQ138P1JX61, IPS, 2304x1536, 13.8" | Lenovo ThinkBook 13x G4 21KR0008GE LEN135WQ+, IPS, 2880x1920, 13.5" | Dell XPS 13 9340 Core Ultra 7 SHP1593, IPS, 1920x1200, 13.4" | Apple MacBook Air 13 M3 10C GPU IPS, 2560x1664, 13.6" | Framework Laptop 13.5 Ryzen 7 7840U BOE CQ NE135FBM-N41, IPS, 2256x1504, 13.5" | HP Dragonfly G4 Chi Mei CMN13C0, IPS, 1920x1280, 13.5" | |
|---|---|---|---|---|---|---|
| Display | -19% | -16% | 1% | -16% | -16% | |
| Display P3 Coverage | 97.8 | 65.5 -33% | 69.4 -29% | 98.4 1% | 69 -29% | 68.4 -30% |
| sRGB Coverage | 98.2 | 97.3 -1% | 97.8 0% | 99.9 2% | 99.1 1% | 98.3 0% |
| AdobeRGB 1998 Coverage | 87.3 | 67.7 -22% | 71.7 -18% | 87.9 1% | 71.1 -19% | 70.4 -19% |
| Response Times | 28% | -35% | -23% | -56% | -53% | |
| Response Time Grey 50% / Grey 80% * | 38.9 ? | 27.3 ? 30% | 43.2 ? -11% | 34.5 ? 11% | 50.4 ? -30% | 48.8 ? -25% |
| Response Time Black / White * | 17.4 ? | 12.8 ? 26% | 27.6 ? -59% | 27.2 ? -56% | 31.5 ? -81% | 31.3 ? -80% |
| PWM Frequency | ||||||
| Screen | -12% | -53% | -9% | -33% | -25% | |
| Brightness middle | 606 | 539 -11% | 429 -29% | 525 -13% | 436 -28% | 408.8 -33% |
| Brightness | 592 | 513 -13% | 407 -31% | 506 -15% | 416 -30% | 399 -33% |
| Brightness Distribution | 94 | 89 -5% | 90 -4% | 92 -2% | 89 -5% | 90 -4% |
| Black Level * | 0.43 | 0.38 12% | 0.28 35% | 0.42 2% | 0.36 16% | 0.32 26% |
| Contrast | 1409 | 1418 1% | 1532 9% | 1250 -11% | 1211 -14% | 1278 -9% |
| Colorchecker dE 2000 * | 1.3 | 1.4 -8% | 2.6 -100% | 1.4 -8% | 1.81 -39% | 2.02 -55% |
| Colorchecker dE 2000 max. * | 2.1 | 3.5 -67% | 6.6 -214% | 2.8 -33% | 4.73 -125% | 3.84 -83% |
| Greyscale dE 2000 * | 2.1 | 2.2 -5% | 4 -90% | 2 5% | 2.9 -38% | 2.3 -10% |
| Gamma | 2.16 102% | 2.19 100% | 2.23 99% | 2.2 100% | 2.27 97% | 2.2 100% |
| CCT | 6842 95% | 6710 97% | 7332 89% | 6876 95% | 6784 96% | 6203 105% |
| Colorchecker dE 2000 calibrated * | 0.7 | 1.4 | 0.45 | 0.61 | ||
| Total Average (Program / Settings) | -1% /
-7% | -35% /
-42% | -10% /
-9% | -35% /
-32% | -31% /
-27% |
* ... im mniej tym lepiej


Sprawdziliśmy panel za pomocą profesjonalnego oprogramowania CalMAN, a Microsoft dostarczył dwa profile: Vivid i sRGB. Standardowo aktywny jest profil Vivid, który obejmuje większą przestrzeń barw P3. Oba profile są bardzo dokładne, a kalibracja nie jest konieczna, ponieważ obecnie nie jesteśmy w stanie jej przeprowadzić. Nasze oprogramowanie i1Profiler jest obecnie niekompatybilne z systemem ARM. Dzięki pełnemu pokryciu przestrzeni barw P3 i sRGB, edycja zarówno zdjęć, jak i filmów przebiega bezproblemowo.


Display Response Times
| ↔ Response Time Black to White | ||
|---|---|---|
| 17.4 ms ... rise ↗ and fall ↘ combined | ↗ 5.7 ms rise |  |
| ↘ 11.7 ms fall | ||
| The screen shows good response rates in our tests, but may be too slow for competitive gamers. In comparison, all tested devices range from 0.1 (minimum) to 240 (maximum) ms. » 35 % of all devices are better. This means that the measured response time is better than the average of all tested devices (21.1 ms). | ||
| ↔ Response Time 50% Grey to 80% Grey | ||
| 38.9 ms ... rise ↗ and fall ↘ combined | ↗ 17.6 ms rise |  |
| ↘ 21.3 ms fall | ||
| The screen shows slow response rates in our tests and will be unsatisfactory for gamers. In comparison, all tested devices range from 0.165 (minimum) to 636 (maximum) ms. » 55 % of all devices are better. This means that the measured response time is worse than the average of all tested devices (33.1 ms). | ||
Screen Flickering / PWM (Pulse-Width Modulation)
| Screen flickering / PWM not detected |  | ||
In comparison: 53 % of all tested devices do not use PWM to dim the display. If PWM was detected, an average of 17212 (minimum: 5 - maximum: 3846000) Hz was measured. | |||


Ekran dotykowy jest bardzo odblaskowy i na zewnątrz można napotkać problemy z odbiciami. Wysoka jasność może to nieco zrekompensować, ale pod tym względem mniej odblaskowy ekran, taki jak ten widoczny na ekranie dotykowym obecnego Huawei Matebook X Pro, jest bardziej odpowiedni Huawei Matebook X Pro jest zaletą. Nie ma żadnych ograniczeń, jeśli chodzi o stabilność kąta widzenia.

Wydajność - Snapdragon X Elite z dwurdzeniowym turbo
Nowy Surface Laptop 7 13.8 dostępny jest albo z procesorem Snapdragon X Plus (X1P-64-100), albo Snapdragon X Elite (X1E-80-100). Standardowo zainstalowano w nim 16 GB pamięci RAM (LPDDR5x-8448), a obecnie dostępna jest również konfiguracja z 32 GB RAM w cenie 1 999 USD. Dodatkowo, dopłaty za więcej pamięci SSD są bardzo wysokie.
Przeprowadziliśmy nasz normalny kurs testowy, jednak nie każdy program jest kompatybilny, a wiele testów nie ma również natywnej aplikacji ARM. Ponieważ w codziennym użytkowaniu będą mieli Państwo do czynienia z emulacją, pokażemy również te wyniki.
Warunki testu
Microsoft nie zapewnia swoim urządzeniom własnych profili energetycznych, ale zamiast tego oferuje tryby wydajności systemu Windows. Zawsze były one nazywane inaczej na urządzeniach Surface: Zalecany (reprezentuje Najlepszą Oszczędność Energii), Lepsza Wydajność (reprezentuje Zrównoważony), a także Najlepsza Wydajność. Przeprowadziliśmy następujące testy porównawcze i pomiary, używając standardowo trybu Najlepsza wydajność.
Procesor - Snapdragon X1E-80-100
Snapdragon X Elite X1E-80-100 jest stosowany w droższych z nowych modeli Surface Laptop. Ma on taktowanie do 3,4 GHz na wszystkich 12 rdzeniach, a także obsługuje dwurdzeniowe turbo do 4,0 GHz. Więcej szczegółów technicznych można znaleźć w naszym artykule analitycznym. Podobnie jak w przypadku Surface Pro, zakładamy TDP między 23-30 watów, a wyniki obu urządzeń Microsoft są porównywalne. W benchmarkach CPU szczególnie interesujące są zarówno natywne testy Cinebench 2024, jak i Geekbench 6. Jest to obszar, w którym procesor Snapdragon również osiąga lepsze wyniki niż bezpośredni konkurent wyposażony w procesory AMD i Intel. Apple pasywnie chłodzony układ M3 jest wolniejszy w testach wielordzeniowych, ale cieszy się przewagą w testach jednordzeniowych. W trybie bateryjnym wydajność pozostała niezmienna. The Snapdragon X Plus w urządzeniu Surface Pro (a zatem porównywalny z Surface Laptop) jest tylko o 7-13% wolniejszy w obu testach natywnych.
Geekbench 6.2: Multi-Core | Single-Core
Cinebench R23: Multi Core | Single Core
Cinebench R20: CPU (Multi Core) | CPU (Single Core)
Cinebench R15: CPU Multi 64Bit | CPU Single 64Bit
Blender: v2.79 BMW27 CPU
7-Zip 18.03: 7z b 4 | 7z b 4 -mmt1
Geekbench 5.5: Multi-Core | Single-Core
HWBOT x265 Benchmark v2.2: 4k Preset
LibreOffice : 20 Documents To PDF
R Benchmark 2.5: Overall mean
| Cinebench 2024 / CPU Multi Core | |
| Microsoft Surface Laptop 7 13.8 Copilot+ | |
| Microsoft Surface Pro OLED Copilot+ | |
| Average Qualcomm Snapdragon X Elite X1E-80-100 (621 - 927, n=5) | |
| Microsoft Surface Pro Copilot+ | |
| Dell XPS 13 9340 Core Ultra 7 | |
| Average of class Subnotebook (148 - 1162, n=42, last 2 years) | |
| Apple MacBook Air 13 M3 10C GPU | |
| Lenovo ThinkBook 13x G4 21KR0008GE | |
| Cinebench 2024 / CPU Single Core | |
| Apple MacBook Air 13 M3 10C GPU | |
| Microsoft Surface Pro OLED Copilot+ | |
| Microsoft Surface Laptop 7 13.8 Copilot+ | |
| Average Qualcomm Snapdragon X Elite X1E-80-100 (122 - 123, n=5) | |
| Microsoft Surface Pro Copilot+ | |
| Average of class Subnotebook (35 - 142, n=25, last 2 years) | |
| Dell XPS 13 9340 Core Ultra 7 | |
| Lenovo ThinkBook 13x G4 21KR0008GE | |
| Geekbench 6.2 / Multi-Core | |
| Microsoft Surface Pro OLED Copilot+ | |
| Average Qualcomm Snapdragon X Elite X1E-80-100 (14234 - 14646, n=5) | |
| Microsoft Surface Laptop 7 13.8 Copilot+ | |
| Microsoft Surface Pro Copilot+ | |
| Apple MacBook Air 13 M3 10C GPU | |
| Dell XPS 13 9340 Core Ultra 7 | |
| Average of class Subnotebook (2244 - 15220, n=52, last 2 years) | |
| Framework Laptop 13.5 Ryzen 7 7840U | |
| Lenovo ThinkBook 13x G4 21KR0008GE | |
| Geekbench 6.2 / Single-Core | |
| Apple MacBook Air 13 M3 10C GPU | |
| Microsoft Surface Pro OLED Copilot+ | |
| Microsoft Surface Laptop 7 13.8 Copilot+ | |
| Average Qualcomm Snapdragon X Elite X1E-80-100 (2751 - 2845, n=5) | |
| Framework Laptop 13.5 Ryzen 7 7840U | |
| Average of class Subnotebook (960 - 3130, n=47, last 2 years) | |
| Microsoft Surface Pro Copilot+ | |
| Dell XPS 13 9340 Core Ultra 7 | |
| Lenovo ThinkBook 13x G4 21KR0008GE | |
| Cinebench R23 / Multi Core | |
| Framework Laptop 13.5 Ryzen 7 7840U | |
| Dell XPS 13 9340 Core Ultra 7 | |
| Average of class Subnotebook (1555 - 21812, n=60, last 2 years) | |
| Apple MacBook Air 13 M3 10C GPU | |
| Microsoft Surface Laptop 7 13.8 Copilot+ | |
| Microsoft Surface Pro OLED Copilot+ | |
| Lenovo ThinkBook 13x G4 21KR0008GE | |
| Average Qualcomm Snapdragon X Elite X1E-80-100 (6772 - 10028, n=5) | |
| Microsoft Surface Pro Copilot+ | |
| HP Dragonfly G4 | |
| Cinebench R23 / Single Core | |
| Apple MacBook Air 13 M3 10C GPU | |
| HP Dragonfly G4 | |
| Dell XPS 13 9340 Core Ultra 7 | |
| Average of class Subnotebook (358 - 2001, n=60, last 2 years) | |
| Framework Laptop 13.5 Ryzen 7 7840U | |
| Lenovo ThinkBook 13x G4 21KR0008GE | |
| Microsoft Surface Pro OLED Copilot+ | |
| Microsoft Surface Laptop 7 13.8 Copilot+ | |
| Average Qualcomm Snapdragon X Elite X1E-80-100 (1273 - 1321, n=5) | |
| Microsoft Surface Pro Copilot+ | |
| Cinebench R20 / CPU (Multi Core) | |
| Framework Laptop 13.5 Ryzen 7 7840U | |
| Dell XPS 13 9340 Core Ultra 7 | |
| Average of class Subnotebook (579 - 8541, n=56, last 2 years) | |
| Microsoft Surface Laptop 7 13.8 Copilot+ | |
| Lenovo ThinkBook 13x G4 21KR0008GE | |
| Microsoft Surface Pro OLED Copilot+ | |
| Average Qualcomm Snapdragon X Elite X1E-80-100 (2539 - 3802, n=5) | |
| Microsoft Surface Pro Copilot+ | |
| HP Dragonfly G4 | |
| Cinebench R20 / CPU (Single Core) | |
| HP Dragonfly G4 | |
| Dell XPS 13 9340 Core Ultra 7 | |
| Lenovo ThinkBook 13x G4 21KR0008GE | |
| Framework Laptop 13.5 Ryzen 7 7840U | |
| Average of class Subnotebook (128 - 790, n=56, last 2 years) | |
| Microsoft Surface Laptop 7 13.8 Copilot+ | |
| Microsoft Surface Pro OLED Copilot+ | |
| Average Qualcomm Snapdragon X Elite X1E-80-100 (470 - 495, n=5) | |
| Microsoft Surface Pro Copilot+ | |
| Cinebench R15 / CPU Multi 64Bit | |
| Microsoft Surface Pro OLED Copilot+ | |
| Dell XPS 13 9340 Core Ultra 7 | |
| Framework Laptop 13.5 Ryzen 7 7840U | |
| Microsoft Surface Laptop 7 13.8 Copilot+ | |
| Average of class Subnotebook (327 - 3345, n=62, last 2 years) | |
| Microsoft Surface Pro Copilot+ | |
| Average Qualcomm Snapdragon X Elite X1E-80-100 (1476 - 2249, n=5) | |
| Lenovo ThinkBook 13x G4 21KR0008GE | |
| HP Dragonfly G4 | |
| Cinebench R15 / CPU Single 64Bit | |
| HP Dragonfly G4 | |
| Dell XPS 13 9340 Core Ultra 7 | |
| Framework Laptop 13.5 Ryzen 7 7840U | |
| Microsoft Surface Pro OLED Copilot+ | |
| Average of class Subnotebook (72.4 - 307, n=57, last 2 years) | |
| Lenovo ThinkBook 13x G4 21KR0008GE | |
| Microsoft Surface Laptop 7 13.8 Copilot+ | |
| Average Qualcomm Snapdragon X Elite X1E-80-100 (230 - 248, n=5) | |
| Microsoft Surface Pro Copilot+ | |
| Blender / v2.79 BMW27 CPU | |
| Apple MacBook Air 13 M3 10C GPU | |
| HP Dragonfly G4 | |
| Microsoft Surface Pro Copilot+ | |
| Average Qualcomm Snapdragon X Elite X1E-80-100 (339 - 510, n=5) | |
| Lenovo ThinkBook 13x G4 21KR0008GE | |
| Average of class Subnotebook (159 - 2271, n=60, last 2 years) | |
| Microsoft Surface Pro OLED Copilot+ | |
| Microsoft Surface Laptop 7 13.8 Copilot+ | |
| Dell XPS 13 9340 Core Ultra 7 | |
| Framework Laptop 13.5 Ryzen 7 7840U | |
| 7-Zip 18.03 / 7z b 4 | |
| Framework Laptop 13.5 Ryzen 7 7840U | |
| Dell XPS 13 9340 Core Ultra 7 | |
| Average of class Subnotebook (11775 - 77867, n=53, last 2 years) | |
| Microsoft Surface Laptop 7 13.8 Copilot+ | |
| Microsoft Surface Pro OLED Copilot+ | |
| Average Qualcomm Snapdragon X Elite X1E-80-100 (34299 - 45905, n=5) | |
| Microsoft Surface Pro Copilot+ | |
| HP Dragonfly G4 | |
| 7-Zip 18.03 / 7z b 4 -mmt1 | |
| Framework Laptop 13.5 Ryzen 7 7840U | |
| HP Dragonfly G4 | |
| Average of class Subnotebook (2669 - 6403, n=55, last 2 years) | |
| Dell XPS 13 9340 Core Ultra 7 | |
| Microsoft Surface Pro OLED Copilot+ | |
| Microsoft Surface Laptop 7 13.8 Copilot+ | |
| Average Qualcomm Snapdragon X Elite X1E-80-100 (5242 - 5359, n=5) | |
| Lenovo ThinkBook 13x G4 21KR0008GE | |
| Microsoft Surface Pro Copilot+ | |
| Geekbench 5.5 / Multi-Core | |
| Dell XPS 13 9340 Core Ultra 7 | |
| Apple MacBook Air 13 M3 10C GPU | |
| Framework Laptop 13.5 Ryzen 7 7840U | |
| Lenovo ThinkBook 13x G4 21KR0008GE | |
| Average of class Subnotebook (2557 - 14728, n=56, last 2 years) | |
| HP Dragonfly G4 | |
| Geekbench 5.5 / Single-Core | |
| Apple MacBook Air 13 M3 10C GPU | |
| Framework Laptop 13.5 Ryzen 7 7840U | |
| HP Dragonfly G4 | |
| Dell XPS 13 9340 Core Ultra 7 | |
| Average of class Subnotebook (621 - 2350, n=56, last 2 years) | |
| Lenovo ThinkBook 13x G4 21KR0008GE | |
| HWBOT x265 Benchmark v2.2 / 4k Preset | |
| Framework Laptop 13.5 Ryzen 7 7840U | |
| Dell XPS 13 9340 Core Ultra 7 | |
| Average of class Subnotebook (0.97 - 25.1, n=55, last 2 years) | |
| Lenovo ThinkBook 13x G4 21KR0008GE | |
| HP Dragonfly G4 | |
| Microsoft Surface Laptop 7 13.8 Copilot+ | |
| Microsoft Surface Pro OLED Copilot+ | |
| Microsoft Surface Pro Copilot+ | |
| Average Qualcomm Snapdragon X Elite X1E-80-100 (4.74 - 7.23, n=5) | |
| LibreOffice / 20 Documents To PDF | |
| Microsoft Surface Laptop 7 13.8 Copilot+ | |
| Average Qualcomm Snapdragon X Elite X1E-80-100 (51.7 - 98.5, n=5) | |
| Microsoft Surface Pro Copilot+ | |
| Average of class Subnotebook (38.5 - 220, n=55, last 2 years) | |
| Microsoft Surface Pro OLED Copilot+ | |
| Lenovo ThinkBook 13x G4 21KR0008GE | |
| Dell XPS 13 9340 Core Ultra 7 | |
| HP Dragonfly G4 | |
| Framework Laptop 13.5 Ryzen 7 7840U | |
| R Benchmark 2.5 / Overall mean | |
| Microsoft Surface Pro Copilot+ | |
| Average Qualcomm Snapdragon X Elite X1E-80-100 (0.63 - 0.67, n=5) | |
| Microsoft Surface Pro OLED Copilot+ | |
| Microsoft Surface Laptop 7 13.8 Copilot+ | |
| Average of class Subnotebook (0.413 - 1.456, n=55, last 2 years) | |
| Lenovo ThinkBook 13x G4 21KR0008GE | |
| Dell XPS 13 9340 Core Ultra 7 | |
| HP Dragonfly G4 | |
| Framework Laptop 13.5 Ryzen 7 7840U | |
* ... im mniej tym lepiej
AIDA64: FP32 Ray-Trace | FPU Julia | CPU SHA3 | CPU Queen | FPU SinJulia | FPU Mandel | CPU AES | CPU ZLib | FP64 Ray-Trace | CPU PhotoWorxx
| Performance Rating | |
| Framework Laptop 13.5 Ryzen 7 7840U | |
| Dell XPS 13 9340 Core Ultra 7 | |
| Average of class Subnotebook | |
| Lenovo ThinkBook 13x G4 21KR0008GE | |
| Microsoft Surface Laptop 7 13.8 Copilot+ | |
| Microsoft Surface Pro OLED Copilot+ | |
| Average Qualcomm Snapdragon X Elite X1E-80-100 | |
| HP Dragonfly G4 | |
| AIDA64 / FP32 Ray-Trace | |
| Framework Laptop 13.5 Ryzen 7 7840U | |
| Average of class Subnotebook (1141 - 32888, n=55, last 2 years) | |
| Dell XPS 13 9340 Core Ultra 7 | |
| Lenovo ThinkBook 13x G4 21KR0008GE | |
| Microsoft Surface Laptop 7 13.8 Copilot+ | |
| HP Dragonfly G4 | |
| Average Qualcomm Snapdragon X Elite X1E-80-100 (2184 - 7339, n=5) | |
| Microsoft Surface Pro OLED Copilot+ | |
| AIDA64 / FPU Julia | |
| Framework Laptop 13.5 Ryzen 7 7840U | |
| Dell XPS 13 9340 Core Ultra 7 | |
| Average of class Subnotebook (6838 - 123315, n=55, last 2 years) | |
| Lenovo ThinkBook 13x G4 21KR0008GE | |
| HP Dragonfly G4 | |
| Microsoft Surface Laptop 7 13.8 Copilot+ | |
| Average Qualcomm Snapdragon X Elite X1E-80-100 (5687 - 26391, n=5) | |
| Microsoft Surface Pro OLED Copilot+ | |
| AIDA64 / CPU SHA3 | |
| Framework Laptop 13.5 Ryzen 7 7840U | |
| Microsoft Surface Laptop 7 13.8 Copilot+ | |
| Dell XPS 13 9340 Core Ultra 7 | |
| Average of class Subnotebook (444 - 5287, n=55, last 2 years) | |
| Average Qualcomm Snapdragon X Elite X1E-80-100 (2607 - 2949, n=5) | |
| Microsoft Surface Pro OLED Copilot+ | |
| Lenovo ThinkBook 13x G4 21KR0008GE | |
| HP Dragonfly G4 | |
| AIDA64 / CPU Queen | |
| Framework Laptop 13.5 Ryzen 7 7840U | |
| Average of class Subnotebook (11579 - 115682, n=55, last 2 years) | |
| Lenovo ThinkBook 13x G4 21KR0008GE | |
| Dell XPS 13 9340 Core Ultra 7 | |
| HP Dragonfly G4 | |
| Microsoft Surface Pro OLED Copilot+ | |
| Microsoft Surface Laptop 7 13.8 Copilot+ | |
| Average Qualcomm Snapdragon X Elite X1E-80-100 (68253 - 69762, n=5) | |
| AIDA64 / FPU SinJulia | |
| Framework Laptop 13.5 Ryzen 7 7840U | |
| Dell XPS 13 9340 Core Ultra 7 | |
| Average of class Subnotebook (744 - 18418, n=55, last 2 years) | |
| Lenovo ThinkBook 13x G4 21KR0008GE | |
| HP Dragonfly G4 | |
| Microsoft Surface Pro OLED Copilot+ | |
| Microsoft Surface Laptop 7 13.8 Copilot+ | |
| Average Qualcomm Snapdragon X Elite X1E-80-100 (1521 - 2357, n=5) | |
| AIDA64 / FPU Mandel | |
| Framework Laptop 13.5 Ryzen 7 7840U | |
| Average of class Subnotebook (3366 - 65433, n=55, last 2 years) | |
| Dell XPS 13 9340 Core Ultra 7 | |
| Lenovo ThinkBook 13x G4 21KR0008GE | |
| HP Dragonfly G4 | |
| Microsoft Surface Pro OLED Copilot+ | |
| Microsoft Surface Laptop 7 13.8 Copilot+ | |
| Average Qualcomm Snapdragon X Elite X1E-80-100 (10117 - 15669, n=5) | |
| AIDA64 / CPU AES | |
| Framework Laptop 13.5 Ryzen 7 7840U | |
| Microsoft Surface Pro OLED Copilot+ | |
| Dell XPS 13 9340 Core Ultra 7 | |
| Average of class Subnotebook (638 - 161430, n=55, last 2 years) | |
| Microsoft Surface Laptop 7 13.8 Copilot+ | |
| Average Qualcomm Snapdragon X Elite X1E-80-100 (39956 - 71089, n=5) | |
| Lenovo ThinkBook 13x G4 21KR0008GE | |
| HP Dragonfly G4 | |
| AIDA64 / CPU ZLib | |
| Framework Laptop 13.5 Ryzen 7 7840U | |
| Dell XPS 13 9340 Core Ultra 7 | |
| Microsoft Surface Pro OLED Copilot+ | |
| Average of class Subnotebook (166.9 - 1379, n=55, last 2 years) | |
| Microsoft Surface Laptop 7 13.8 Copilot+ | |
| Average Qualcomm Snapdragon X Elite X1E-80-100 (398 - 802, n=5) | |
| Lenovo ThinkBook 13x G4 21KR0008GE | |
| HP Dragonfly G4 | |
| AIDA64 / FP64 Ray-Trace | |
| Framework Laptop 13.5 Ryzen 7 7840U | |
| Average of class Subnotebook (610 - 17495, n=55, last 2 years) | |
| Dell XPS 13 9340 Core Ultra 7 | |
| Lenovo ThinkBook 13x G4 21KR0008GE | |
| Microsoft Surface Laptop 7 13.8 Copilot+ | |
| Average Qualcomm Snapdragon X Elite X1E-80-100 (2581 - 4044, n=5) | |
| HP Dragonfly G4 | |
| Microsoft Surface Pro OLED Copilot+ | |
| AIDA64 / CPU PhotoWorxx | |
| Dell XPS 13 9340 Core Ultra 7 | |
| Lenovo ThinkBook 13x G4 21KR0008GE | |
| Average of class Subnotebook (6569 - 53954, n=55, last 2 years) | |
| Microsoft Surface Pro OLED Copilot+ | |
| Microsoft Surface Laptop 7 13.8 Copilot+ | |
| HP Dragonfly G4 | |
| Average Qualcomm Snapdragon X Elite X1E-80-100 (28474 - 38707, n=5) | |
| Framework Laptop 13.5 Ryzen 7 7840U | |
Wydajność systemu
W codziennych sytuacjach Surface Laptop jest bardzo responsywny i tutaj nie widać żadnej różnicy w stosunku do konkurencji. Niemniej jednak należy pamiętać, że wersje ARM nie są dostępne dla każdej aplikacji lub sterownika. W porównaniu do laptopów z procesorami AMD/Intel, są Państwo ograniczeni, zwłaszcza jeśli chodzi o starsze urządzenia peryferyjne, które wymagają własnych sterowników (na przykład drukarki, skanery, zewnętrzne karty dźwiękowe itp.)
WebXPRT 3: Overall
WebXPRT 4: Overall
Mozilla Kraken 1.1: Total
| CrossMark / Overall | |
| Apple MacBook Air 13 M3 10C GPU | |
| Framework Laptop 13.5 Ryzen 7 7840U | |
| Dell XPS 13 9340 Core Ultra 7 | |
| HP Dragonfly G4 | |
| Average of class Subnotebook (365 - 1971, n=55, last 2 years) | |
| Lenovo ThinkBook 13x G4 21KR0008GE | |
| Microsoft Surface Pro OLED Copilot+ | |
| Microsoft Surface Laptop 7 13.8 Copilot+ | |
| Average Qualcomm Snapdragon X Elite X1E-80-100, Qualcomm SD X Adreno X1-85 3.8 TFLOPS (1356 - 1443, n=5) | |
| CrossMark / Productivity | |
| Apple MacBook Air 13 M3 10C GPU | |
| Framework Laptop 13.5 Ryzen 7 7840U | |
| HP Dragonfly G4 | |
| Dell XPS 13 9340 Core Ultra 7 | |
| Average of class Subnotebook (364 - 1875, n=55, last 2 years) | |
| Lenovo ThinkBook 13x G4 21KR0008GE | |
| Microsoft Surface Pro OLED Copilot+ | |
| Microsoft Surface Laptop 7 13.8 Copilot+ | |
| Average Qualcomm Snapdragon X Elite X1E-80-100, Qualcomm SD X Adreno X1-85 3.8 TFLOPS (1271 - 1375, n=5) | |
| CrossMark / Creativity | |
| Apple MacBook Air 13 M3 10C GPU | |
| Dell XPS 13 9340 Core Ultra 7 | |
| Framework Laptop 13.5 Ryzen 7 7840U | |
| HP Dragonfly G4 | |
| Lenovo ThinkBook 13x G4 21KR0008GE | |
| Average of class Subnotebook (385 - 2210, n=55, last 2 years) | |
| Microsoft Surface Pro OLED Copilot+ | |
| Average Qualcomm Snapdragon X Elite X1E-80-100, Qualcomm SD X Adreno X1-85 3.8 TFLOPS (1492 - 1537, n=5) | |
| Microsoft Surface Laptop 7 13.8 Copilot+ | |
| CrossMark / Responsiveness | |
| Framework Laptop 13.5 Ryzen 7 7840U | |
| Microsoft Surface Pro OLED Copilot+ | |
| Dell XPS 13 9340 Core Ultra 7 | |
| HP Dragonfly G4 | |
| Apple MacBook Air 13 M3 10C GPU | |
| Average of class Subnotebook (312 - 1899, n=55, last 2 years) | |
| Microsoft Surface Laptop 7 13.8 Copilot+ | |
| Average Qualcomm Snapdragon X Elite X1E-80-100, Qualcomm SD X Adreno X1-85 3.8 TFLOPS (1237 - 1401, n=5) | |
| Lenovo ThinkBook 13x G4 21KR0008GE | |
| WebXPRT 3 / Overall | |
| Apple MacBook Air 13 M3 10C GPU | |
| Average Qualcomm Snapdragon X Elite X1E-80-100, Qualcomm SD X Adreno X1-85 3.8 TFLOPS (430 - 455, n=5) | |
| Microsoft Surface Pro OLED Copilot+ | |
| Microsoft Surface Laptop 7 13.8 Copilot+ | |
| Framework Laptop 13.5 Ryzen 7 7840U | |
| HP Dragonfly G4 | |
| Average of class Subnotebook (156 - 448, n=56, last 2 years) | |
| Dell XPS 13 9340 Core Ultra 7 | |
| Lenovo ThinkBook 13x G4 21KR0008GE | |
| WebXPRT 4 / Overall | |
| Apple MacBook Air 13 M3 10C GPU | |
| Average Qualcomm Snapdragon X Elite X1E-80-100, Qualcomm SD X Adreno X1-85 3.8 TFLOPS (295 - 324, n=5) | |
| Microsoft Surface Laptop 7 13.8 Copilot+ | |
| Microsoft Surface Pro OLED Copilot+ | |
| HP Dragonfly G4 | |
| Dell XPS 13 9340 Core Ultra 7 | |
| Framework Laptop 13.5 Ryzen 7 7840U | |
| Average of class Subnotebook (132 - 325, n=53, last 2 years) | |
| Lenovo ThinkBook 13x G4 21KR0008GE | |
| Mozilla Kraken 1.1 / Total | |
| Lenovo ThinkBook 13x G4 21KR0008GE | |
| Average of class Subnotebook (363 - 1104, n=61, last 2 years) | |
| Dell XPS 13 9340 Core Ultra 7 | |
| Framework Laptop 13.5 Ryzen 7 7840U | |
| HP Dragonfly G4 | |
| Average Qualcomm Snapdragon X Elite X1E-80-100, Qualcomm SD X Adreno X1-85 3.8 TFLOPS (391 - 422, n=5) | |
| Microsoft Surface Pro OLED Copilot+ | |
| Microsoft Surface Laptop 7 13.8 Copilot+ | |
| Apple MacBook Air 13 M3 10C GPU | |
* ... im mniej tym lepiej
| AIDA64 / Memory Copy | |
| Dell XPS 13 9340 Core Ultra 7 | |
| Lenovo ThinkBook 13x G4 21KR0008GE | |
| Average of class Subnotebook (14916 - 108756, n=55, last 2 years) | |
| Microsoft Surface Pro OLED Copilot+ | |
| Framework Laptop 13.5 Ryzen 7 7840U | |
| Microsoft Surface Laptop 7 13.8 Copilot+ | |
| Average Qualcomm Snapdragon X Elite X1E-80-100 (44795 - 63495, n=5) | |
| HP Dragonfly G4 | |
| AIDA64 / Memory Read | |
| Microsoft Surface Pro OLED Copilot+ | |
| Microsoft Surface Laptop 7 13.8 Copilot+ | |
| Average Qualcomm Snapdragon X Elite X1E-80-100 (58855 - 125604, n=5) | |
| Dell XPS 13 9340 Core Ultra 7 | |
| Lenovo ThinkBook 13x G4 21KR0008GE | |
| Average of class Subnotebook (15948 - 122210, n=55, last 2 years) | |
| Framework Laptop 13.5 Ryzen 7 7840U | |
| HP Dragonfly G4 | |
| AIDA64 / Memory Write | |
| Framework Laptop 13.5 Ryzen 7 7840U | |
| Dell XPS 13 9340 Core Ultra 7 | |
| Average of class Subnotebook (16513 - 112837, n=55, last 2 years) | |
| HP Dragonfly G4 | |
| Lenovo ThinkBook 13x G4 21KR0008GE | |
| Microsoft Surface Pro OLED Copilot+ | |
| Microsoft Surface Laptop 7 13.8 Copilot+ | |
| Average Qualcomm Snapdragon X Elite X1E-80-100 (37270 - 45265, n=5) | |
| AIDA64 / Memory Latency | |
| Lenovo ThinkBook 13x G4 21KR0008GE | |
| Dell XPS 13 9340 Core Ultra 7 | |
| Average of class Subnotebook (7.4 - 187.8, n=55, last 2 years) | |
| HP Dragonfly G4 | |
| Framework Laptop 13.5 Ryzen 7 7840U | |
| Average Qualcomm Snapdragon X Elite X1E-80-100 (7.4 - 8.8, n=5) | |
| Microsoft Surface Pro OLED Copilot+ | |
| Microsoft Surface Laptop 7 13.8 Copilot+ | |
* ... im mniej tym lepiej
Opóźnienia DPC
Nie byliśmy w stanie przeprowadzić naszego standardowego testu opóźnień, ponieważ aplikacja LatencyMon nie uruchamia się na systemach ARM. Podczas odtwarzania wideo 4K z YouTube, nie było przynajmniej żadnych problemów ze spadkiem klatek.
Pamięć masowa
Microsoft zainstalował dysk SSD M.2 2230, który można z łatwością wymienić. Nasze urządzenie testowe zawiera wersję 512 GB, Samsung PM9B1, chociaż po początkowej instalacji będą Państwo mieli do dyspozycji tylko 416 GB. Przy prędkości do 3,6 GB/s, wydajność dysku SSD jest absolutnie wystarczająca do codziennego użytku, a ponadto prędkości transferu są stabilne, nawet w okresach długotrwałego obciążenia. Dodatkowe testy porównawcze dysków SSD można znaleźć tutaj.

* ... im mniej tym lepiej
Continuous Performance Read: DiskSpd Read Loop, Queue Depth 8
Karta graficzna - Adreno X1-85
Obecnie dostępne są dwa warianty Adreno-X1-85-GPU a w połączeniu z X1E-80-100 wykorzystywana jest wolniejsza wersja o częstotliwości taktowania 1,2 GHz (3,8 TFLOPS). W rzeczywistych sytuacjach iGPU jest więcej niż wystarczające i nie ma żadnych problemów, nawet podczas odtwarzania filmów w wysokiej rozdzielczości. Gdy spojrzymy na natywny benchmark GPU, WildLife Extreme Unlimited, Surface Laptop plasuje się pomiędzy Intel Arc Graphics z 8 rdzeniami, jak również AMD Radeon 780M.
Jak na razie jest dobrze, ale gdy tylko spróbują Państwo zagrać w gry, zaczynają się problemy. Istnieje bardzo niewiele natywnych gier ARM i w naszych testach nieustannie napotykaliśmy na problemy. Czasami gry nawet się nie uruchamiały(Far Cry 5, Prince of Persia The Lost Crown, Witcher 3, F1 23 i F1 24), a czasami pojawiały się błędy graficzne / awarie przy wyższych ustawieniach(Shadow of the Tomb Raider, Total War Pharaoh) lub po prostu występowały regularne awarie w grze(Cyberpunk 2077). W przyszłości sytuacja powinna ulec poprawie, ale każdy kto chce okazjonalnie pograć w niektóre gry powinien unikać laptopów ze Snapdragonem.
Wydajność GPU pozostawała stabilna zarówno w okresach długotrwałego obciążenia, jak i w trybie bateryjnym. Dodatkowe benchmarki GPU są dostępne tutaj.
| 3DMark 11 Performance | 6855 pkt. | |
| 3DMark Fire Strike Score | 5727 pkt. | |
| 3DMark Time Spy Score | 1868 pkt. | |
| 3DMark Steel Nomad Score | 476 pkt. | |
| 3DMark Steel Nomad Light Score | 2005 pkt. | |
| 3DMark Steel Nomad Light Unlimited Score | 1932 pkt. | |
Pomoc | ||
| Blender / v3.3 Classroom METAL | |
| Average of class Subnotebook (129 - 237, n=3, last 2 years) | |
| Apple MacBook Air 13 M3 10C GPU | |
| Blender / v3.3 Classroom CPU | |
| HP Dragonfly G4 | |
| Lenovo ThinkBook 13x G4 21KR0008GE | |
| Average Qualcomm SD X Adreno X1-85 3.8 TFLOPS (545 - 899, n=9) | |
| Microsoft Surface Pro OLED Copilot+ | |
| Microsoft Surface Laptop 7 13.8 Copilot+ | |
| Average of class Subnotebook (241 - 1127, n=57, last 2 years) | |
| Apple MacBook Air 13 M3 10C GPU | |
| Dell XPS 13 9340 Core Ultra 7 | |
| Framework Laptop 13.5 Ryzen 7 7840U | |
* ... im mniej tym lepiej
| Cyberpunk 2077 2.1 Phantom Liberty - 1920x1080 Ultra Preset (FSR off) | |
| Average of class Subnotebook (10.3 - 31.4, n=27, last 2 years) | |
| Lenovo ThinkBook 13x G4 21KR0008GE | |
| Microsoft Surface Laptop 7 13.8 Copilot+ | |
| Microsoft Surface Pro OLED Copilot+ | |
| GTA V - 1920x1080 Highest Settings possible AA:4xMSAA + FX AF:16x | |
| Microsoft Surface Laptop 7 13.8 Copilot+ | |
| Average of class Subnotebook (7.81 - 67.5, n=52, last 2 years) | |
| Lenovo ThinkBook 13x G4 21KR0008GE | |
| Dell XPS 13 9340 Core Ultra 7 | |
| HP Dragonfly G4 | |
| Baldur's Gate 3 - 1920x1080 Ultra Preset | |
| Average of class Subnotebook (12.1 - 31.1, n=26, last 2 years) | |
| Apple MacBook Air 13 M3 10C GPU | |
| Microsoft Surface Laptop 7 13.8 Copilot+ | |
| Microsoft Surface Pro OLED Copilot+ | |
Cyberpunk 2077 ultra FPS diagram
| low | med. | high | ultra | |
| GTA V (2015) | 100.6 | 96.3 | 50 | 21.5 |
| Dota 2 Reborn (2015) | 85.9 | 65.7 | 61.7 | 53.2 |
| Final Fantasy XV Benchmark (2018) | 57.3 | 24.9 | 15.8 | |
| X-Plane 11.11 (2018) | 37.8 | |||
| Strange Brigade (2018) | 137 | 51 | 43 | 36 |
| Shadow of the Tomb Raider (2018) | 60 | 25 | 23 | |
| F1 22 (2022) | 57 | 50.1 | 38 | |
| Baldur's Gate 3 (2023) | 24.7 | 20.3 | 17.5 | 17 |
| Cyberpunk 2077 2.1 Phantom Liberty (2023) | 22.7 | 18.9 | 16.4 | 14.3 |
| Total War Pharaoh (2023) | 87.6 | 55.2 |
Emisje - bardzo ciche w codziennych sytuacjach
Emisja hałasu
Wentylator Surface Laptop 13.8 jest generalnie niesłyszalny w codziennym użytkowaniu. Pozostaje wyłączony przez długi czas, a przy 26 dB(A) pod niewielkim obciążeniem pozostaje również bardzo cichy. Podczas grania udało nam się wydobyć z urządzenia maksymalnie 31,5 dB(A). Wentylator szybko osiągnął najwyższy poziom około 40 dB(A) przy pełnym obciążeniu procesora i podczas testu warunków skrajnych. Nie byliśmy w stanie wykryć żadnych innych odgłosów elektronicznych.
Hałas
| luz |
| 23.8 / 23.8 / 23.8 dB |
| obciążenie |
| 26 / 40.3 dB |
 | ||
30 dB cichy 40 dB(A) słyszalny 50 dB(A) irytujący |
||
min: | ||
| Microsoft Surface Laptop 7 13.8 Copilot+ Adreno X1-85 3.8 TFLOPS, SD X Elite X1E-80-100, Samsung MZ9L4512HBLU-00BMV | Lenovo ThinkBook 13x G4 21KR0008GE Arc 7-Core, Ultra 5 125H, Samsung PM9C1a MZAL8512HDLU | Dell XPS 13 9340 Core Ultra 7 Arc 8-Core, Ultra 7 155H, Micron 2550 512GB | Apple MacBook Air 13 M3 10C GPU M3 10-Core GPU, M3, Apple SSD AP0512Z | Framework Laptop 13.5 Ryzen 7 7840U Radeon 780M, R7 7840U, WD PC SN740 512GB SDDPNQD-512G | HP Dragonfly G4 Iris Xe G7 96EUs, i7-1365U, Micron 3400 MTFDKBA512TFH 512GB | |
|---|---|---|---|---|---|---|
| Noise | -9% | -12% | -8% | -0% | ||
| off / environment * | 23.8 | 24.5 -3% | 25.1 -5% | 22.6 5% | 23.3 2% | |
| Idle Minimum * | 23.8 | 24.5 -3% | 25.1 -5% | 22.6 5% | 23.5 1% | |
| Idle Average * | 23.8 | 24.5 -3% | 25.1 -5% | 22.6 5% | 23.5 1% | |
| Idle Maximum * | 23.8 | 27.1 -14% | 25.1 -5% | 24.2 -2% | 26.8 -13% | |
| Load Average * | 26 | 33.3 -28% | 37.4 -44% | 35.8 -38% | 27.2 -5% | |
| Cyberpunk 2077 ultra * | 31.5 | |||||
| Load Maximum * | 40.3 | 40.7 -1% | 42.5 -5% | 48.9 -21% | 35 13% | |
| Witcher 3 ultra * | 36.8 | 42.5 | 46.5 | 32.7 |
* ... im mniej tym lepiej
Temperatura
W stanie spoczynku i podczas niewymagających zadań, metalowa obudowa prawie się nie nagrzewa. Podczas grania, a w szczególności przy dużym obciążeniu procesora, szybko się to zmienia i zmierzyliśmy do 47 °C na podstawie urządzenia. Jest to już nieprzyjemne ze względu na metalową obudowę i w tego typu sytuacjach należy unikać umieszczania laptopa na kolanach. Podobnie, klawiatura robi się nieprzyjemnie ciepła, co może prowadzić do ograniczeń podczas pisania.
(-) The maximum temperature on the upper side is 47.1 °C / 117 F, compared to the average of 36.1 °C / 97 F, ranging from 21.4 to 281 °C for the class Subnotebook.
(±) The bottom heats up to a maximum of 44.6 °C / 112 F, compared to the average of 39.4 °C / 103 F
(+) In idle usage, the average temperature for the upper side is 24.3 °C / 76 F, compared to the device average of 30.8 °C / 87 F.
(-) 3: The average temperature for the upper side is 40.9 °C / 106 F, compared to the average of 30.8 °C / 87 F for the class Subnotebook.
(+) The palmrests and touchpad are reaching skin temperature as a maximum (35.8 °C / 96.4 F) and are therefore not hot.
(-) The average temperature of the palmrest area of similar devices was 28.3 °C / 82.9 F (-7.5 °C / -13.5 F).


| Microsoft Surface Laptop 7 13.8 Copilot+ Qualcomm Snapdragon X Elite X1E-80-100, Qualcomm SD X Adreno X1-85 3.8 TFLOPS | Lenovo ThinkBook 13x G4 21KR0008GE Intel Core Ultra 5 125H, Intel Arc 7-Core iGPU | Dell XPS 13 9340 Core Ultra 7 Intel Core Ultra 7 155H, Intel Arc 8-Core iGPU | Apple MacBook Air 13 M3 10C GPU Apple M3, Apple M3 10-Core GPU | Framework Laptop 13.5 Ryzen 7 7840U AMD Ryzen 7 7840U, AMD Radeon 780M | HP Dragonfly G4 Intel Core i7-1365U, Intel Iris Xe Graphics G7 96EUs | |
|---|---|---|---|---|---|---|
| Heat | -2% | 2% | 7% | -8% | -1% | |
| Maximum Upper Side * | 47.1 | 43.1 8% | 41 13% | 44.3 6% | 42 11% | 38.6 18% |
| Maximum Bottom * | 44.6 | 39.2 12% | 43.5 2% | 43.4 3% | 47.4 -6% | 40.4 9% |
| Idle Upper Side * | 24.7 | 28.3 -15% | 25.3 -2% | 22.3 10% | 28.8 -17% | 28.2 -14% |
| Idle Bottom * | 24.5 | 28 -14% | 25.5 -4% | 22.1 10% | 29.6 -21% | 29 -18% |
* ... im mniej tym lepiej
Głośniki
Głośniki stereo dobrze spełniają swoje zadanie i ogólnie jakość dźwięku jest podobna do tej z Dell XPS 13 9340 ale odrobinę gorsza niż MacBook Air 13 M3 a zwłaszcza ThinkBook 13x G4. Chociaż można to zauważyć tylko w bezpośrednim porównaniu.
Microsoft Surface Laptop 7 13.8 Copilot+ audio analysis
(±) | speaker loudness is average but good (81.8 dB)
Bass 100 - 315 Hz
(±) | reduced bass - on average 12.7% lower than median
(±) | linearity of bass is average (9.8% delta to prev. frequency)
Mids 400 - 2000 Hz
(+) | balanced mids - only 4.1% away from median
(+) | mids are linear (2.4% delta to prev. frequency)
Highs 2 - 16 kHz
(+) | balanced highs - only 2.1% away from median
(+) | highs are linear (2.5% delta to prev. frequency)
Overall 100 - 16.000 Hz
(+) | overall sound is linear (12.1% difference to median)
Compared to same class
» 13% of all tested devices in this class were better, 4% similar, 84% worse
» The best had a delta of 5%, average was 19%, worst was 53%
Compared to all devices tested
» 8% of all tested devices were better, 2% similar, 90% worse
» The best had a delta of 4%, average was 25%, worst was 134%
Lenovo ThinkBook 13x G4 21KR0008GE audio analysis
(+) | speakers can play relatively loud (83.8 dB)
Bass 100 - 315 Hz
(±) | reduced bass - on average 9% lower than median
(±) | linearity of bass is average (8% delta to prev. frequency)
Mids 400 - 2000 Hz
(+) | balanced mids - only 2.4% away from median
(+) | mids are linear (2.9% delta to prev. frequency)
Highs 2 - 16 kHz
(+) | balanced highs - only 3.2% away from median
(+) | highs are linear (3.4% delta to prev. frequency)
Overall 100 - 16.000 Hz
(+) | overall sound is linear (8.6% difference to median)
Compared to same class
» 2% of all tested devices in this class were better, 1% similar, 97% worse
» The best had a delta of 5%, average was 19%, worst was 53%
Compared to all devices tested
» 2% of all tested devices were better, 1% similar, 98% worse
» The best had a delta of 4%, average was 25%, worst was 134%
Dell XPS 13 9340 Core Ultra 7 audio analysis
(+) | speakers can play relatively loud (83.2 dB)
Bass 100 - 315 Hz
(-) | nearly no bass - on average 17% lower than median
(±) | linearity of bass is average (9.3% delta to prev. frequency)
Mids 400 - 2000 Hz
(+) | balanced mids - only 2.1% away from median
(+) | mids are linear (4.7% delta to prev. frequency)
Highs 2 - 16 kHz
(+) | balanced highs - only 2.5% away from median
(+) | highs are linear (4.6% delta to prev. frequency)
Overall 100 - 16.000 Hz
(+) | overall sound is linear (11.6% difference to median)
Compared to same class
» 11% of all tested devices in this class were better, 3% similar, 86% worse
» The best had a delta of 5%, average was 19%, worst was 53%
Compared to all devices tested
» 6% of all tested devices were better, 2% similar, 92% worse
» The best had a delta of 4%, average was 25%, worst was 134%
Apple MacBook Air 13 M3 10C GPU audio analysis
(+) | speakers can play relatively loud (83.2 dB)
Bass 100 - 315 Hz
(±) | reduced bass - on average 13.3% lower than median
(±) | linearity of bass is average (11.3% delta to prev. frequency)
Mids 400 - 2000 Hz
(+) | balanced mids - only 0.4% away from median
(+) | mids are linear (1.6% delta to prev. frequency)
Highs 2 - 16 kHz
(+) | balanced highs - only 4.5% away from median
(+) | highs are linear (1.9% delta to prev. frequency)
Overall 100 - 16.000 Hz
(+) | overall sound is linear (10.7% difference to median)
Compared to same class
» 7% of all tested devices in this class were better, 3% similar, 90% worse
» The best had a delta of 5%, average was 19%, worst was 53%
Compared to all devices tested
» 4% of all tested devices were better, 1% similar, 94% worse
» The best had a delta of 4%, average was 25%, worst was 134%
Zarządzanie energią - Zwiększona wydajność
Zużycie energii
Nowy Surface Laptop jest szczególnie wydajny w trybie bezczynności przy minimalnej jasności ekranu, ale oczywiście przy wysokiej jasności, 600 cd/m² daje o sobie znać. Pod obciążeniem zużycie energii wynosi maksymalnie 41 watów, a podczas grania liczba ta wynosi zaledwie 39 watów. Dołączony 39-watowy zasilacz jest wystarczający, aby sprostać zapotrzebowaniu na moc, ale w tym przypadku brakuje mu możliwości jednoczesnego ładowania baterii. Microsoft powinien był przynajmniej dostarczyć wersje Snapdragon X Elite z mocniejszym zasilaczem.
| wyłączony / stan wstrzymania | |
| luz | |
| obciążenie |
|
| Microsoft Surface Laptop 7 13.8 Copilot+ SD X Elite X1E-80-100, Adreno X1-85 3.8 TFLOPS, Samsung MZ9L4512HBLU-00BMV, IPS, 2304x1536, 13.8" | Lenovo ThinkBook 13x G4 21KR0008GE Ultra 5 125H, Arc 7-Core, Samsung PM9C1a MZAL8512HDLU, IPS, 2880x1920, 13.5" | Dell XPS 13 9340 Core Ultra 7 Ultra 7 155H, Arc 8-Core, Micron 2550 512GB, IPS, 1920x1200, 13.4" | Apple MacBook Air 13 M3 10C GPU M3, M3 10-Core GPU, Apple SSD AP0512Z, IPS, 2560x1664, 13.6" | Framework Laptop 13.5 Ryzen 7 7840U R7 7840U, Radeon 780M, WD PC SN740 512GB SDDPNQD-512G, IPS, 2256x1504, 13.5" | HP Dragonfly G4 i7-1365U, Iris Xe G7 96EUs, Micron 3400 MTFDKBA512TFH 512GB, IPS, 1920x1280, 13.5" | Average Qualcomm SD X Adreno X1-85 3.8 TFLOPS | Average of class Subnotebook | |
|---|---|---|---|---|---|---|---|---|
| Power Consumption | -96% | -66% | -22% | -58% | -63% | -44% | -86% | |
| Idle Minimum * | 1.4 | 5.4 -286% | 3.8 -171% | 1.95 -39% | 4 -186% | 4.1 -193% | 3.57 ? -155% | 4.6 ? -229% |
| Idle Average * | 6.3 | 7.8 -24% | 7 -11% | 8.7 -38% | 6.5 -3% | 7.5 -19% | 6.74 ? -7% | 7.86 ? -25% |
| Idle Maximum * | 7.6 | 8.9 -17% | 7.3 4% | 8.9 -17% | 6.8 11% | 8.2 -8% | 7.67 ? -1% | 9.65 ? -27% |
| Load Average * | 26.9 | 49.4 -84% | 52.6 -96% | 34.3 -28% | 48 -78% | 35.5 -32% | 30.3 ? -13% | 47.8 ? -78% |
| Cyberpunk 2077 ultra * | 38.5 | |||||||
| Load Maximum * | 40.7 | 68.8 -69% | 62.7 -54% | 35.4 13% | 55.2 -36% | 66.5 -63% | 59.4 ? -46% | 69.8 ? -71% |
| Witcher 3 ultra * | 44.4 | 38.3 | 28.6 | 52.3 | 37.5 |
* ... im mniej tym lepiej
Power consumption Cyberpunk 2077 / stress test
Power consumption with an external monitor
Żywotność baterii
Czasy pracy na baterii 55 Wh są jednocześnie bardzo dobre, ale nie wybitne. W teście Wi-Fi, przy 150 d/m² (co stanowi 57% maksymalnej jasności recenzowanego urządzenia), udało nam się uzyskać nieco ponad 14 godzin przy 60 Hz i 13 godzin przy 120 Hz. Przy pełnej jasności liczby te skracają się do 7 godzin i 47 minut (60 Hz) oraz 7 godzin i 27 minut (120 Hz). Oznacza to, że Surface Laptop pozostaje w tyle zarówno za MacBookiem Air, jak i HP Dragonfly G4.
Przy 19 godzinach i 41 minutach w teście wideo, laptop Microsoftu wypadł bardzo dobrze, ale jest pokonany w tym scenariuszu, na przykład przez ThinkBook 13x G4. Natomiast pod obciążeniem światła gasną po 80 minutach. Przy włączonym urządzeniu pełny cykl ładowania z 39-watowym zasilaczem trwa 139 minut (80% po 82 minutach), a z 65-watowym - 111 minut (80% po 58 minutach).


| Microsoft Surface Laptop 7 13.8 Copilot+ SD X Elite X1E-80-100, Adreno X1-85 3.8 TFLOPS, 54 Wh | Lenovo ThinkBook 13x G4 21KR0008GE Ultra 5 125H, Arc 7-Core, 74 Wh | Dell XPS 13 9340 Core Ultra 7 Ultra 7 155H, Arc 8-Core, 55 Wh | Apple MacBook Air 13 M3 10C GPU M3, M3 10-Core GPU, 52.6 Wh | Framework Laptop 13.5 Ryzen 7 7840U R7 7840U, Radeon 780M, 61 Wh | HP Dragonfly G4 i7-1365U, Iris Xe G7 96EUs, 68 Wh | Average of class Subnotebook | |
|---|---|---|---|---|---|---|---|
| Czasy pracy | 10% | 14% | 36% | -15% | 76% | 1% | |
| H.264 | 1181 | 1229 4% | 1053 -11% | 1044 -12% | 887 ? -25% | ||
| WiFi v1.3 | 852 | 684 -20% | 769 -10% | 914 7% | 726 -15% | 954 12% | 706 ? -17% |
| Load | 80 | 116 45% | 131 64% | 171 114% | 192 140% | 116.2 ? 45% |
Za
Przeciw
Werdykt - Dobry laptop z problemami z kompatybilnością

Nowy Surface Laptop Copilot+ to w zasadzie dobry laptop, ale są pewne ograniczenia, o których klienci powinni wiedzieć. Zasadniczo nowy procesor Snapdragon oferuje dobrą wydajność, a wersja ARM systemu Windows również działa bardzo dobrze. Dlatego też nie powinni Państwo zauważyć żadnej różnicy między urządzeniem ARM a procesorami opartymi na AMD lub Intel, jeśli chodzi o codzienne użytkowanie. Istnieją jednak ograniczenia kompatybilności, ponieważ nie każda aplikacja działa, a w szczególności występują problemy ze starszymi wersjami oprogramowania lub programami, które wymagają specjalnych sterowników. Dotyczy to również gier, gdzie występuje wiele problemów. Ponadto pod pełnym obciążeniem można zauważyć, że niewielki układ chłodzenia laptopa staje się znacznie głośniejszy i gorący.
Jeśli chodzi o sam sprzęt, mamy tylko podstawy do niewielkiej krytyki, ponieważ metalowa obudowa jest wysokiej jakości i można ją łatwo otworzyć. Urządzenia wejściowe są bardzo dobre, IPS robi wrażenie oprócz silnych odbić, a żywotność baterii jest również bardzo dobra, biorąc pod uwagę pojemność baterii. Jednak, jak zwykle, zależy to od tego, jak go używasz, ponieważ jeśli mocno naciskasz urządzenie, bateria wyczerpie się po mniej niż 1,5 godziny. Niektórzy konkurenci również radzą sobie z dłuższymi czasami pracy.
Nowy Surface Laptop 13.8 Copilot+ to bardzo dobry komputer dla codziennych użytkowników, którzy korzystają z aktualnych wersji oprogramowania i nie chcą grać w gry. Jednak tańsza, podstawowa wersja ze Snapdragonem X Plus ma znacznie więcej sensu w tym scenariuszu.
Jeśli są Państwo w stanie poradzić sobie z ograniczeniami, nadal polecamy podstawowy wariant ze Snapdragonem X Plus. Specyfikacje są mniej więcej identyczne i, w naszej analizie nasza analizazauważyliśmy już, że Snapdragon X Plus nie działa wyraźnie wolniej w codziennych sytuacjach. Dysk SSD o pojemności 256 GB można łatwo wymienić, co oznacza, że można uniknąć wysokich dopłat Microsoftu (250 USD za aktualizację z 256 do 512 GB).
W porównaniu do Apple MacBook Air 13surface Laptop oferuje pewne zalety, na przykład rozszerzenie SSD, nieco jaśniejszy ekran dotykowy 120 Hz lub port USB-A, który jest nadal istotny w codziennym użytkowaniu. Jeśli chodzi o żywotność baterii, sytuacja jest wyrównana, ale MacBook Air jest znacznie smuklejszy i nadal ma dużą zaletę w postaci pasywnego chłodzenia.
Porównanie z innymi obecnymi laptopami z systemem Windows również nie wypada korzystnie dla Surface Laptop, ponieważ cena recenzowanego urządzenia jest wysoka i poza nieco cichszymi wentylatorami w codziennych sytuacjach, a także dodatkową funkcją Copilot+ AI (która jest jednak ograniczona czasowo i wkrótce będzie dostępna w nadchodzących laptopach Zen5 i Lunar Lake), nie ma prawdziwych argumentów za laptopem z systemem Windows z procesorem ARM. Dzięki standardowemu modemowi 5G można by uzyskać przewagę, ale Microsoft zdecydował się nie wdrażać tego w swoim Surface Laptop.
Cena i dostępność
Nowy Surface Laptop 13 Copilot+ ze Snapdragonem X Elite można zamówić na Amazonie za 1 669 USD. Podstawowy model ze Snapdragonem X Plus i dyskiem SSD 256 GB kosztuje 1 069 USD.
Uwaga: Niedawno zaktualizowaliśmy nasz system oceny i wyniki wersji 8 nie są porównywalne z wynikami wersji 7. Więcej informacji znajdą Państwo tutaj .
Microsoft Surface Laptop 7 13.8 Copilot+
-
04/07/2024 v8
Andreas Osthoff
 Total Sustainability Score:
 Transparency
The present review sample was made available to the author as a loan by the manufacturer or a shop for the purposes of review. The lender had no influence on this review, nor did the manufacturer receive a copy of this review before publication. There was no obligation to publish this review.
Price comparison

