 Deutsch
 English
 Español
 Français
 Italiano
 Nederlands
 Polski
 Português
 Русский
 Türkçe
 Svenska
 Chinese
 Magyar
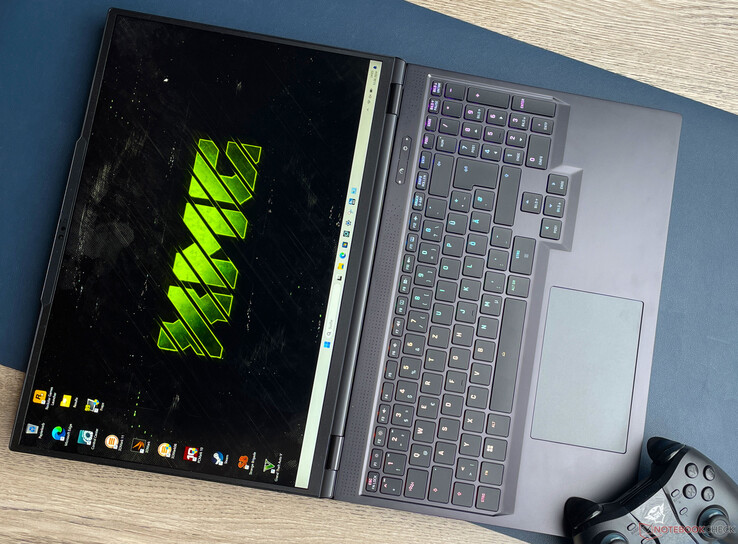
Recenzja XMG Neo 16 (Early 24): Pełna moc RTX 4090 w kompaktowym laptopie do gier
Dzięki Neo 16 Schenker obsługuje segment high-end, a zatem nie ma półśrodków: Core i9, GeForce RTX 4090 i 32 GB pamięci RAM wyposażają laptopa w wymagające scenariusze aplikacji (streaming, rendering, gry). Ma to jednak swoją cenę: Za recenzowany model trzeba będzie wyłożyć około 4000 dolarów (aktualny kurs dolara do euro), choć tańsze warianty można dostać już od 2000 dolarów. Podstawę stanowi płyta główna Tongfang (GM6IX9B). Konkurentami są na przykład Razer Blade 16, Medion Medion Erazer Beast X40 i Asus ROG Strix Scar 17.
Urządzenie jest podobne do modelu 2023, ale ma kilka nowych funkcji: Jaśniejszy wyświetlacz, ulepszony system chłodzenia i większy kąt otwarcia. (Opcjonalna) klawiatura mechaniczna znaleziona w poprzedniku nie jest częścią oferty modelu 2024.
Potencjalni konkurenci w porównaniu
Rating | Version | Date | Model | Weight | Height | Size | Resolution | Best Price |
|---|---|---|---|---|---|---|---|---|
| 85.5 % | v8 (new) | 06/2024 | SCHENKER XMG Neo 16 (Early 24) i9-14900HX, NVIDIA GeForce RTX 4090 Laptop GPU | 2.5 kg | 26.6 mm | 16.00" | 2560x1600 | |
| 91.1 % | v7 (old) | 02/2024 | Razer Blade 16 2024, RTX 4090 i9-14900HX, NVIDIA GeForce RTX 4090 Laptop GPU | 2.5 kg | 22 mm | 16.00" | 2560x1600 | |
| 89.2 % | v7 (old) | 02/2024 | Medion Erazer Beast X40 2024 i9-14900HX, NVIDIA GeForce RTX 4090 Laptop GPU | 2.9 kg | 36 mm | 17.00" | 2560x1600 | |
| 87.2 % | v7 (old) | 08/2023 | Asus ROG Strix Scar 17 G733PYV-LL053X R9 7945HX3D, NVIDIA GeForce RTX 4090 Laptop GPU | 2.9 kg | 28.3 mm | 17.30" | 2560x1440 |
Obudowa - laptop XMG posiada aluminiową obudowę
Obudowa modelu 2023 nie jest używana w obecnym modelu Neo. Nowa obudowa ma więcej wspólnego z obudową widzianą w najnowszych laptopach XMG - to krok w dobrym kierunku: Zamiast mieszanki plastiku i metalu, producent zdecydował się na obudowę wykonaną w całości z metalu (wyjątek: ramki wyświetlacza są wykonane z tworzywa sztucznego). Obudowa jest tak stabilna, jak można się spodziewać. Podstawę i pokrywę można skręcić tylko nieznacznie. Pokrywa umożliwia otwarcie pod kątem do 180 stopni (model 2023: 135 stopni). Ułatwia to przeglądanie treści w obecności kilku osób. Ciasne zawiasy utrzymują pokrywę bezpiecznie na miejscu i pod niemal każdym kątem. Możliwe jest otwarcie urządzenia jedną ręką.
Przyciągające wzrok elementy wzornictwa nie są nigdzie widoczne, co oznacza, że matowy czarny komputer ma dość poważną sylwetkę. Kolorowe podświetlenie zapewniają - oprócz podświetlanych klawiszy (RGB) - definiowane przez użytkownika, indywidualnie dostosowywane paski LED.


Najnowszy Neo 16 wydaje się nieco bardziej kompaktowy niż poprzednik, ale jeśli chodzi o wagę, laptopów nie da się od siebie odróżnić. Tylko Blade 16 oferuje większą kompaktowość - i to przy niemal identycznej wadze.
Funkcje - USB 4 na pokładzie
Cztery z pięciu portów USB w Neo 16 (3x USB-A, 2x USB-C) działają zgodnie ze standardem USB 3.2 Gen 1. Jedynie port USB-C z tyłu zapewnia obsługę standardu Thunderbolt 4 (USB 4), w tym Power Delivery i trybu Display Alt. Łącznie dostępne są dwa wyjścia wideo (1x HDMI, 1x DP). Ofertę uzupełniają gniazdo audio i port Gigabit Ethernet (2,5 GBit/s).
Rozstaw portów USB (prawy: 12 mm, lewy: 8 mm) wydaje się być odpowiednio proporcjonalny: Jednocześnie można podłączyć dwa typowej wielkości pendrive'y (złącza) (patrz zdjęcia w galerii). Wyjścia wideo i złącza zasilania znajdują się z tyłu urządzenia. Związane z nimi kable biegną do tyłu, a zatem nie przeszkadzają.


Czytnik kart SD
Czytnik kart SD (referencja: AV PRO microSD 128 GB V60) należy do średnio szybkich modeli: Prędkości transferu na poziomie 76 MB/s (transfer 250 zdjęć jpg, 5 MB na plik) i 87 MB/s (kopiowanie dużych bloków danych) można określić jako akceptowalne. W przypadku Razer Blade 16 pokazuje, że możliwe są znacznie wyższe wartości.
| SD Card Reader | |
| average JPG Copy Test (av. of 3 runs) | |
| Razer Blade 16 2024, RTX 4090 | |
| Average of class Gaming (19 - 202, n=97, last 2 years) | |
| Medion Erazer Beast X40 2024 (AV PRO microSD 128 GB V60) | |
| SCHENKER XMG Neo 16 (Early 24) (AV PRO microSD 128 GB V60) | |
| SCHENKER XMG Neo 16 E23 (AV PRO microSD 128 GB V60) | |
| maximum AS SSD Seq Read Test (1GB) | |
| Razer Blade 16 2024, RTX 4090 | |
| Average of class Gaming (25.8 - 269, n=94, last 2 years) | |
| Medion Erazer Beast X40 2024 (AV PRO microSD 128 GB V60) | |
| SCHENKER XMG Neo 16 (Early 24) (AV PRO microSD 128 GB V60) | |
| SCHENKER XMG Neo 16 E23 (AV PRO microSD 128 GB V60) | |
Komunikacja
W optymalnych warunkach (brak urządzeń Wi-Fi w pobliżu, niewielka odległość między laptopem a komputerem serwera) można osiągnąć dobre lub doskonałe prędkości transmisji danych - umożliwia to układ WiFi 6E (Intel AX211). Za połączenia przewodowe odpowiada kontroler Realtek Gigabit Ethernet (RTL8125, 2,5 GBit/s).
| Networking | |
| iperf3 transmit AXE11000 | |
| SCHENKER XMG Neo 16 E23 | |
| Razer Blade 16 2024, RTX 4090 | |
| Average of class Gaming (469 - 1793, n=155, last 2 years) | |
| Average Intel Wi-Fi 6E AX211 (464 - 1861, n=202) | |
| SCHENKER XMG Neo 16 (Early 24) | |
| Medion Erazer Beast X40 2024 | |
| iperf3 receive AXE11000 | |
| SCHENKER XMG Neo 16 (Early 24) | |
| SCHENKER XMG Neo 16 E23 | |
| Medion Erazer Beast X40 2024 | |
| Razer Blade 16 2024, RTX 4090 | |
| Average Intel Wi-Fi 6E AX211 (582 - 1890, n=202) | |
| Average of class Gaming (685 - 1890, n=158, last 2 years) | |
Kamera internetowa
Kamerka internetowa (2,1 MP) zapewnia przeciętną jakość i zapewnia wsparcie dla Windows Hello. Do tego dochodzi mechaniczna migawka.
 NVIDIA GeForce RTX 4090 Laptop GPU, i9-14900HX, Samsung 990 Pro 1 TB")
 NVIDIA GeForce RTX 4090 Laptop GPU, i9-14900HX, Samsung 990 Pro 1 TB")
Akcesoria
Do laptopa dołączona jest pamięć USB (sterowniki, instrukcje), naklejki i podkładka pod mysz. Opcjonalnym akcesorium jest zewnętrzne chłodzenie wodne https://www.xmg.gg/xmg-oasis-mk2/ ($230).


Konserwacja
Po odkręceniu wszystkich śrub na podstawie urządzenia, pokrywę podstawy można oddzielić za pomocą plektronu lub płaskiej szpatułki. Daje to dostęp do banków pamięci RAM (oba są zajęte), wentylatorów i baterii. Dysk SSD i sloty SSD (PCIe 4, M.2 2280) oraz moduł Wi-Fi są przykryte dodatkowymi, przykręcanymi płytkami.


Gwarancja
W UE Schenker oferuje dwuletnią podstawową gwarancję obejmującą usługę odbioru i 6-miesięczną usługę szybkiej naprawy (naprawa w ciągu 48 godzin). Za 36-miesięczną gwarancję zapłacą Państwo od około 100 do 160 USD - w zależności od wybranego okresu szybkiej naprawy.
Urządzenia wejściowe - klawiatura z indywidualnym podświetleniem klawiszy
Klawiatura
Wcześniej można było zamówić zeszłoroczny Neo 16 z opcjonalną klawiaturą mechaniczną, ale obecny model ma tylko klawiaturę typu chiclet. Klawiatura zajmuje całą szerokość laptopa, a na pokładzie znajduje się również klawiatura numeryczna i indywidualne podświetlenie klawiszy (RGB). Wklęsłe, zakrzywione klawisze oferują średni skok, dobrze zdefiniowany punkt nacisku i bardzo przyjemny opór. Klawiatura nie ugina się podczas pisania. Zauważalne jest to, jak wygodne w użyciu są niecentryczne, pełnowymiarowe klawisze strzałek - to poprawa w stosunku do zeszłorocznego modelu.
Panel dotykowy
Alternatywą dla myszy jest multidotykowy clickpad (około 12,3 x 7,7 cm), którego gładkie powierzchnie sprawiają, że wykonywanie gestów machnięcia jest tak proste, jak to tylko możliwe. Oferuje on krótki skok i wyraźny punkt nacisku.

Wyświetlacz - Schenker zdecydował się na jasny panel IPS
Zainstalowanemu 16-calowemu wyświetlaczowi (2560 x 1600 pikseli) nie brakuje niczego pod względem jasności (~ 500 cd/m²), ale kontrast (1.000:1) mógłby być wyższy. Jeśli chodzi o ten obszar Blade 16's Blade 16 oferuje lepszy ogólny pakiet - dzięki swojej konstrukcji zapewnia wspaniałe wartości czerni i kontrastu. Ogólnie rzecz biorąc, wartości osiągane przez Neo 16 są więcej niż wystarczające, aby móc korzystać z urządzenia w pomieszczeniach. Na zewnątrz wyświetlacz jest czytelny, o ile słońce nie jest zbyt jasne. Niektóre pozytywne aspekty to fakt, że bardzo czuły, stabilny pod kątem widzenia panel 16:10, 240 Hz (IPS, G-Sync) nie wykazuje żadnych oznak migotania PWM niezależnie od ustawienia jasności. Alternatywne opcje wyświetlania nie są dostępne.


| |||||||||||||||||||||||||
rozświetlenie: 85 %
na akumulatorze: 530 cd/m²
kontrast: 1000:1 (czerń: 0.53 cd/m²)
ΔE Color 3.21 | 0.5-29.43 Ø4.99, calibrated: 1.44
ΔE Greyscale 4.2 | 0.57-98 Ø5.2
70.6% AdobeRGB 1998 (Argyll 2.2.0 3D)
98% sRGB (Argyll 2.2.0 3D)
70.2% Display P3 (Argyll 2.2.0 3D)
Gamma: 2.226
| SCHENKER XMG Neo 16 (Early 24) BOE NE160QDM-NZA, IPS, 2560x1600, 16.00 | Razer Blade 16 2024, RTX 4090 Samsung SDC41AB (ATNA60DL03-0), OLED, 2560x1600, 16.00 | Medion Erazer Beast X40 2024 BOE NE170QDM-NZ1, IPS, 2560x1600, 17.00 | SCHENKER XMG Neo 16 E23 BOE0AF0 NE160QDM-NZ1, IPS, 2560x1600, 16.00 | |
|---|---|---|---|---|
| Display | 26% | -1% | -2% | |
| Display P3 Coverage | 70.2 | 99.1 41% | 68.1 -3% | 67.3 -4% |
| sRGB Coverage | 98 | 99.9 2% | 99.5 2% | 96.7 -1% |
| AdobeRGB 1998 Coverage | 70.6 | 95.6 35% | 69 -2% | 68.9 -2% |
| Response Times | 95% | -20% | -49% | |
| Response Time Grey 50% / Grey 80% * | 11.2 ? | 0.24 ? 98% | 11.7 ? -4% | 14.5 ? -29% |
| Response Time Black / White * | 5.1 ? | 0.4 ? 92% | 6.9 ? -35% | 8.6 ? -69% |
| PWM Frequency | 960 | |||
| Screen | 251% | 25% | 15% | |
| Brightness middle | 530 | 418 -21% | 422 -20% | 372 -30% |
| Brightness | 497 | 420 -15% | 388 -22% | 349 -30% |
| Brightness Distribution | 85 | 98 15% | 87 2% | 88 4% |
| Black Level * | 0.53 | 0.02 96% | 0.42 21% | 0.32 40% |
| Contrast | 1000 | 20900 1990% | 1005 1% | 1163 16% |
| Colorchecker dE 2000 * | 3.21 | 1.07 67% | 1.42 56% | 2.06 36% |
| Colorchecker dE 2000 max. * | 5.8 | 4.04 30% | 1.97 66% | 3 48% |
| Colorchecker dE 2000 calibrated * | 1.44 | 1.07 26% | 0.7 51% | 1.5 -4% |
| Greyscale dE 2000 * | 4.2 | 1.12 73% | 1.2 71% | 1.9 55% |
| Gamma | 2.226 99% | 2.29 96% | 2.078 106% | 2.312 95% |
| CCT | 6448 101% | 6417 101% | 6581 99% | 6747 96% |
| Total Average (Program / Settings) | 124% /
181% | 1% /
13% | -12% /
2% |
* ... im mniej tym lepiej
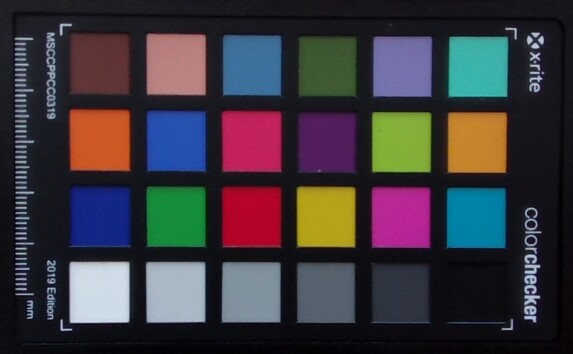
Po wyjęciu z pudełka wyświetlacz zapewnia przyzwoite odwzorowanie kolorów: Przy DeltaE wynoszącym 3,2, odchylenie po prostu mija się z wartością docelową (DeltaE < 3). Kalibracja zmniejsza to do 1,44 - to dobry wynik. Ze wszystkich standardowych przestrzeni kolorów (AdobeRGB, sRGB, DCI P3) panel - podobnie jak Erazer Beast X40 może wyświetlać tylko przestrzeń sRGB prawie w całości. Wyświetlanie wszystkich trzech przestrzeni kolorów jest zarezerwowane dla panelu OLED znajdującego się w Blade 16.
Stworzony przez nas profil kolorów można pobrać i używać bezpłatnie. Link można znaleźć w polu informacyjnym wyświetlacza.


Display Response Times
| ↔ Response Time Black to White | ||
|---|---|---|
| 5.1 ms ... rise ↗ and fall ↘ combined | ↗ 1.6 ms rise |  |
| ↘ 3.5 ms fall | ||
| The screen shows very fast response rates in our tests and should be very well suited for fast-paced gaming. In comparison, all tested devices range from 0.1 (minimum) to 240 (maximum) ms. » 13 % of all devices are better. This means that the measured response time is better than the average of all tested devices (21.3 ms). | ||
| ↔ Response Time 50% Grey to 80% Grey | ||
| 11.2 ms ... rise ↗ and fall ↘ combined | ↗ 5.2 ms rise |  |
| ↘ 6 ms fall | ||
| The screen shows good response rates in our tests, but may be too slow for competitive gamers. In comparison, all tested devices range from 0.2 (minimum) to 636 (maximum) ms. » 20 % of all devices are better. This means that the measured response time is better than the average of all tested devices (33.5 ms). | ||
Screen Flickering / PWM (Pulse-Width Modulation)
| Screen flickering / PWM not detected |  | ||
In comparison: 53 % of all tested devices do not use PWM to dim the display. If PWM was detected, an average of 17655 (minimum: 5 - maximum: 3846000) Hz was measured. | |||


Wydajność - Raptor Lake i Ada Lovelace zapewniają tonę mocy
Neo 16 (Early 24) skierowany jest do graczy, twórców i generalnie wszystkich grup użytkowników wymagających dużej mocy obliczeniowej. Każdy wariant specyfikacji wyposażony jest w procesor Core i9 14900HX, a paleta GPU waha się od RTX 4060 do RTX 4090 - nasz model to RTX 4090. Indywidualne konfiguracje i zakup laptopa możliwe są za pośrednictwem strony Bestware.com (język niemiecki). Recenzowane przez nas urządzenie można nabyć za około 4000 USD, przy czym model podstawowy (RTX 4060) kosztuje około 2000 USD. Opcjonalnie dostępne chłodzenie wodne (Oasis MK2) jest dołączone do modeli RTX 4080 lub RTX 4090 Neo 16.


Warunki testu
Można wybrać jeden z trzech trybów wydajności specyficznych dla producenta (patrz tabela). Podczas testu korzystaliśmy z trybów "Overboost" (benchmarki) i "Balanced" (test baterii). Tryb GPU był ustawiony na "Hybrid" (= Optimus). Poszczególnymi profilami można zarządzać za pośrednictwem Centrum sterowania. Oznacza to, że można dostosować limit mocy CPU, TGP GPU i/lub górny limit temperatury. Oddzielny przycisk (obok przycisku zasilania) umożliwia szybkie przełączanie między trybami.
Mieliśmy do dyspozycji opcjonalne, zewnętrzne chłodzenie wodne (Oasis Mk2), ale nie korzystaliśmy z niego podczas testów. Niemniej jednak dokonaliśmy pewnych pomiarów niezależnie od oficjalnych testów (proszę zobaczyć tabelę porównawczą).
| Overboost | Enthusiast | Balanced | |
|---|---|---|---|
| Limit mocy 1 (HWInfo) | 205 Watt | 205 Watt | 205 Watt |
| Limit mocy 2 (HWInfo) | 205 Watt | 205 Watt | 205 Watt |
| Hałas (Witcher 3) | 54 dB(A) | 51 dB(A) | 32 dB(A) |
| Wydajność (Witcher 3) | 214fps | 198fps | 30fps (blokada) |


Procesor
Laptop jest napędzany przez Core i9 14900HX (Raptor Lake) - inne procesory nie są dostępne. Core i9 oferuje całe 24 rdzenie (8P + 16E = 32 wątki) przy maksymalnej prędkości 5,8 GHz (P) i 4,1 GHz (E). Ciągłe obciążenie wielowątkowe (pętla CB15) skutkuje stale, ale nieznacznie spadającą wydajnością (Overboost) - zastosowanie chłodzenia wodnego Oasis niweluje ten efekt. Pozostałe dwa tryby zasilania zapewniają stałą wydajność nawet bez chłodzenia wodnego - oczywiście na niskim poziomie.
"Overboost" zapewnia ponadprzeciętne wartości CPU, a "Enthusiast" jest nieco poniżej średniej - dotyczy to głównie wydajności wielowątkowej. W każdym z trzech profili wydajność jednowątkowa jest na podobnie wysokim poziomie. Opcjonalne chłodzenie wodne (Oasis) zapewnia niewielki wzrost wydajności.


Cinebench R15 Multi Continuous Test


| CPU Performance Rating - Percent | |
| SCHENKER XMG Neo 16 (Early 24) | |
| SCHENKER XMG Neo 16 (Early 24) | |
| Asus ROG Strix Scar 17 G733PYV-LL053X | |
| Asus ROG Strix Scar 16 G634JZR | |
| Average Intel Core i9-14900HX | |
| Razer Blade 16 2024, RTX 4090 | |
| Lenovo Legion Pro 7 RTX4090 -2! | |
| SCHENKER XMG Neo 16 E23 -2! | |
| Medion Erazer Beast X40 2024 | |
| Lenovo Legion 9 16IRX9, RTX 4090 | |
| Average of class Gaming | |
| Alienware x16 R2 P120F | |
| Cinebench R23 | |
| Multi Core | |
| SCHENKER XMG Neo 16 (Early 24) | |
| SCHENKER XMG Neo 16 (Early 24) (Overboost, Oasis) | |
| Asus ROG Strix Scar 17 G733PYV-LL053X | |
| Lenovo Legion 9 16IRX9, RTX 4090 | |
| Lenovo Legion Pro 7 RTX4090 | |
| Asus ROG Strix Scar 16 G634JZR | |
| Average Intel Core i9-14900HX (20702 - 36249, n=26) | |
| SCHENKER XMG Neo 16 E23 | |
| Razer Blade 16 2024, RTX 4090 | |
| Medion Erazer Beast X40 2024 | |
| Average of class Gaming (5668 - 36249, n=212, last 2 years) | |
| Alienware x16 R2 P120F | |
| Single Core | |
| Medion Erazer Beast X40 2024 | |
| SCHENKER XMG Neo 16 (Early 24) | |
| SCHENKER XMG Neo 16 (Early 24) (Overboost, Oasis) | |
| Asus ROG Strix Scar 16 G634JZR | |
| Average Intel Core i9-14900HX (1720 - 2235, n=26) | |
| Razer Blade 16 2024, RTX 4090 | |
| SCHENKER XMG Neo 16 E23 | |
| Lenovo Legion Pro 7 RTX4090 | |
| Asus ROG Strix Scar 17 G733PYV-LL053X | |
| Average of class Gaming (1136 - 2235, n=210, last 2 years) | |
| Lenovo Legion 9 16IRX9, RTX 4090 | |
| Alienware x16 R2 P120F | |
| Cinebench R20 | |
| CPU (Multi Core) | |
| SCHENKER XMG Neo 16 (Early 24) (Overboost, Oasis, Overboost, Oasis) | |
| SCHENKER XMG Neo 16 (Early 24) | |
| Asus ROG Strix Scar 17 G733PYV-LL053X | |
| Lenovo Legion 9 16IRX9, RTX 4090 | |
| Lenovo Legion Pro 7 RTX4090 | |
| Asus ROG Strix Scar 16 G634JZR | |
| Average Intel Core i9-14900HX (8427 - 13832, n=26) | |
| SCHENKER XMG Neo 16 E23 | |
| Razer Blade 16 2024, RTX 4090 | |
| Medion Erazer Beast X40 2024 | |
| Average of class Gaming (2179 - 13832, n=210, last 2 years) | |
| Alienware x16 R2 P120F | |
| CPU (Single Core) | |
| Medion Erazer Beast X40 2024 | |
| SCHENKER XMG Neo 16 (Early 24) (Overboost, Oasis, Overboost, Oasis) | |
| SCHENKER XMG Neo 16 (Early 24) | |
| Asus ROG Strix Scar 16 G634JZR | |
| Average Intel Core i9-14900HX (657 - 859, n=26) | |
| Razer Blade 16 2024, RTX 4090 | |
| SCHENKER XMG Neo 16 E23 | |
| Lenovo Legion Pro 7 RTX4090 | |
| Asus ROG Strix Scar 17 G733PYV-LL053X | |
| Average of class Gaming (439 - 855, n=210, last 2 years) | |
| Lenovo Legion 9 16IRX9, RTX 4090 | |
| Alienware x16 R2 P120F | |
| Cinebench R15 | |
| CPU Multi 64Bit | |
| Asus ROG Strix Scar 17 G733PYV-LL053X | |
| SCHENKER XMG Neo 16 (Early 24) (Overboost, Oasis) | |
| SCHENKER XMG Neo 16 (Early 24) | |
| Lenovo Legion 9 16IRX9, RTX 4090 | |
| Asus ROG Strix Scar 16 G634JZR | |
| Lenovo Legion Pro 7 RTX4090 | |
| SCHENKER XMG Neo 16 E23 | |
| Average Intel Core i9-14900HX (3263 - 5589, n=26) | |
| Razer Blade 16 2024, RTX 4090 | |
| Medion Erazer Beast X40 2024 | |
| Average of class Gaming (905 - 5663, n=214, last 2 years) | |
| Alienware x16 R2 P120F | |
| CPU Single 64Bit | |
| SCHENKER XMG Neo 16 (Early 24) (Overboost, Oasis) | |
| Asus ROG Strix Scar 16 G634JZR | |
| Medion Erazer Beast X40 2024 | |
| Asus ROG Strix Scar 17 G733PYV-LL053X | |
| Razer Blade 16 2024, RTX 4090 | |
| SCHENKER XMG Neo 16 (Early 24) | |
| Average Intel Core i9-14900HX (247 - 320, n=26) | |
| SCHENKER XMG Neo 16 E23 | |
| Lenovo Legion Pro 7 RTX4090 | |
| Average of class Gaming (198 - 318, n=213, last 2 years) | |
| Lenovo Legion 9 16IRX9, RTX 4090 | |
| Alienware x16 R2 P120F | |
| Blender - v2.79 BMW27 CPU | |
| Average of class Gaming (87 - 555, n=205, last 2 years) | |
| Alienware x16 R2 P120F | |
| Medion Erazer Beast X40 2024 | |
| SCHENKER XMG Neo 16 E23 | |
| Average Intel Core i9-14900HX (91 - 164, n=26) | |
| Razer Blade 16 2024, RTX 4090 | |
| Asus ROG Strix Scar 16 G634JZR | |
| Lenovo Legion 9 16IRX9, RTX 4090 | |
| Lenovo Legion Pro 7 RTX4090 | |
| Asus ROG Strix Scar 17 G733PYV-LL053X | |
| SCHENKER XMG Neo 16 (Early 24) | |
| SCHENKER XMG Neo 16 (Early 24) (Overboost, Oasis) | |
| 7-Zip 18.03 | |
| 7z b 4 | |
| SCHENKER XMG Neo 16 (Early 24) (Overboost, Oasis) | |
| Asus ROG Strix Scar 17 G733PYV-LL053X | |
| SCHENKER XMG Neo 16 (Early 24) | |
| Lenovo Legion 9 16IRX9, RTX 4090 | |
| Lenovo Legion Pro 7 RTX4090 | |
| Asus ROG Strix Scar 16 G634JZR | |
| Razer Blade 16 2024, RTX 4090 | |
| SCHENKER XMG Neo 16 E23 | |
| Average Intel Core i9-14900HX (87555 - 136645, n=26) | |
| Medion Erazer Beast X40 2024 | |
| Average of class Gaming (23795 - 140932, n=208, last 2 years) | |
| Alienware x16 R2 P120F | |
| 7z b 4 -mmt1 | |
| Asus ROG Strix Scar 17 G733PYV-LL053X | |
| Asus ROG Strix Scar 16 G634JZR | |
| SCHENKER XMG Neo 16 (Early 24) (Overboost, Oasis) | |
| SCHENKER XMG Neo 16 (Early 24) | |
| Medion Erazer Beast X40 2024 | |
| SCHENKER XMG Neo 16 E23 | |
| Average Intel Core i9-14900HX (5452 - 7508, n=26) | |
| Razer Blade 16 2024, RTX 4090 | |
| Lenovo Legion Pro 7 RTX4090 | |
| Average of class Gaming (4502 - 7581, n=208, last 2 years) | |
| Lenovo Legion 9 16IRX9, RTX 4090 | |
| Alienware x16 R2 P120F | |
| Geekbench 6.2 | |
| Multi-Core | |
| SCHENKER XMG Neo 16 (Early 24) (6.2.1, Overboost, Oasis) | |
| SCHENKER XMG Neo 16 (Early 24) (6.2.1) | |
| Asus ROG Strix Scar 16 G634JZR (6.2.1) | |
| Average Intel Core i9-14900HX (15849 - 19665, n=26) | |
| Razer Blade 16 2024, RTX 4090 (6.2.1) | |
| Lenovo Legion 9 16IRX9, RTX 4090 (6.2.1) | |
| Asus ROG Strix Scar 17 G733PYV-LL053X | |
| Medion Erazer Beast X40 2024 (6.2.1) | |
| Average of class Gaming (5340 - 19665, n=88, last 2 years) | |
| Alienware x16 R2 P120F (6.2.1) | |
| Single-Core | |
| SCHENKER XMG Neo 16 (Early 24) (6.2.1) | |
| SCHENKER XMG Neo 16 (Early 24) (6.2.1, Overboost, Oasis) | |
| Medion Erazer Beast X40 2024 (6.2.1) | |
| Asus ROG Strix Scar 16 G634JZR (6.2.1) | |
| Average Intel Core i9-14900HX (2419 - 3129, n=26) | |
| Razer Blade 16 2024, RTX 4090 (6.2.1) | |
| Asus ROG Strix Scar 17 G733PYV-LL053X | |
| Average of class Gaming (1599 - 3129, n=88, last 2 years) | |
| Lenovo Legion 9 16IRX9, RTX 4090 (6.2.1) | |
| Alienware x16 R2 P120F (6.2.1) | |
| Geekbench 5.5 | |
| Multi-Core | |
| SCHENKER XMG Neo 16 (Early 24) (Overboost, Oasis) | |
| SCHENKER XMG Neo 16 (Early 24) | |
| Lenovo Legion 9 16IRX9, RTX 4090 | |
| Asus ROG Strix Scar 16 G634JZR | |
| SCHENKER XMG Neo 16 E23 | |
| Lenovo Legion Pro 7 RTX4090 | |
| Asus ROG Strix Scar 17 G733PYV-LL053X | |
| Average Intel Core i9-14900HX (8618 - 23194, n=26) | |
| Razer Blade 16 2024, RTX 4090 | |
| Medion Erazer Beast X40 2024 | |
| Average of class Gaming (4557 - 23194, n=213, last 2 years) | |
| Alienware x16 R2 P120F | |
| Single-Core | |
| Asus ROG Strix Scar 16 G634JZR | |
| SCHENKER XMG Neo 16 (Early 24) (Overboost, Oasis) | |
| SCHENKER XMG Neo 16 (Early 24) | |
| Medion Erazer Beast X40 2024 | |
| Asus ROG Strix Scar 17 G733PYV-LL053X | |
| Razer Blade 16 2024, RTX 4090 | |
| Average Intel Core i9-14900HX (1669 - 2210, n=26) | |
| SCHENKER XMG Neo 16 E23 | |
| Lenovo Legion Pro 7 RTX4090 | |
| Average of class Gaming (1196 - 2210, n=213, last 2 years) | |
| Lenovo Legion 9 16IRX9, RTX 4090 | |
| Alienware x16 R2 P120F | |
| HWBOT x265 Benchmark v2.2 - 4k Preset | |
| SCHENKER XMG Neo 16 (Early 24) (Overboost, Oasis) | |
| Asus ROG Strix Scar 17 G733PYV-LL053X | |
| SCHENKER XMG Neo 16 (Early 24) | |
| Lenovo Legion Pro 7 RTX4090 | |
| Asus ROG Strix Scar 16 G634JZR | |
| SCHENKER XMG Neo 16 E23 | |
| Lenovo Legion 9 16IRX9, RTX 4090 | |
| Average Intel Core i9-14900HX (22.7 - 38.9, n=26) | |
| Razer Blade 16 2024, RTX 4090 | |
| Medion Erazer Beast X40 2024 | |
| Average of class Gaming (6.72 - 38.9, n=209, last 2 years) | |
| Alienware x16 R2 P120F | |
| LibreOffice - 20 Documents To PDF | |
| Lenovo Legion 9 16IRX9, RTX 4090 (6.3.4.2) | |
| Average of class Gaming (31.4 - 96.6, n=205, last 2 years) | |
| Asus ROG Strix Scar 16 G634JZR (6.3.4.2) | |
| Razer Blade 16 2024, RTX 4090 (6.3.4.2) | |
| Alienware x16 R2 P120F (6.3.4.2) | |
| Average Intel Core i9-14900HX (31.4 - 85.1, n=26) | |
| Medion Erazer Beast X40 2024 (6.3.4.2) | |
| Lenovo Legion Pro 7 RTX4090 | |
| Asus ROG Strix Scar 17 G733PYV-LL053X | |
| SCHENKER XMG Neo 16 E23 | |
| SCHENKER XMG Neo 16 (Early 24) (6.3.4.2) | |
| SCHENKER XMG Neo 16 (Early 24) (6.3.4.2, Overboost, Oasis) | |
| R Benchmark 2.5 - Overall mean | |
| Alienware x16 R2 P120F | |
| Lenovo Legion 9 16IRX9, RTX 4090 | |
| Average of class Gaming (0.3609 - 0.658, n=208, last 2 years) | |
| Asus ROG Strix Scar 17 G733PYV-LL053X | |
| Lenovo Legion Pro 7 RTX4090 | |
| Average Intel Core i9-14900HX (0.3609 - 0.4859, n=26) | |
| SCHENKER XMG Neo 16 (Early 24) (Overboost, Oasis, Overboost, Oasis) | |
| Razer Blade 16 2024, RTX 4090 | |
| SCHENKER XMG Neo 16 E23 | |
| Medion Erazer Beast X40 2024 | |
| Asus ROG Strix Scar 16 G634JZR | |
| SCHENKER XMG Neo 16 (Early 24) | |
* ... im mniej tym lepiej
AIDA64: FP32 Ray-Trace | FPU Julia | CPU SHA3 | CPU Queen | FPU SinJulia | FPU Mandel | CPU AES | CPU ZLib | FP64 Ray-Trace | CPU PhotoWorxx
| Performance Rating | |
| Asus ROG Strix Scar 17 G733PYV-LL053X | |
| SCHENKER XMG Neo 16 (Early 24) | |
| SCHENKER XMG Neo 16 (Early 24) | |
| Asus ROG Strix Scar 16 G634JZR | |
| Lenovo Legion 9 16IRX9, RTX 4090 | |
| Lenovo Legion Pro 7 RTX4090 | |
| Average Intel Core i9-14900HX | |
| Razer Blade 16 2024, RTX 4090 | |
| SCHENKER XMG Neo 16 E23 | |
| Medion Erazer Beast X40 2024 | |
| Average of class Gaming | |
| Alienware x16 R2 P120F | |
| AIDA64 / FP32 Ray-Trace | |
| Asus ROG Strix Scar 17 G733PYV-LL053X (v6.88.6413 Beta) | |
| SCHENKER XMG Neo 16 (Early 24) (v6.92.6600, Overboost, Oasis) | |
| SCHENKER XMG Neo 16 (Early 24) (v6.92.6600) | |
| Lenovo Legion 9 16IRX9, RTX 4090 (v6.92.6600) | |
| Lenovo Legion Pro 7 RTX4090 (v6.85.6300) | |
| Asus ROG Strix Scar 16 G634JZR (v6.92.6600) | |
| Average Intel Core i9-14900HX (17244 - 33474, n=25) | |
| Razer Blade 16 2024, RTX 4090 (v6.92.6600) | |
| SCHENKER XMG Neo 16 E23 (v6.75.6100) | |
| Average of class Gaming (4986 - 60169, n=205, last 2 years) | |
| Medion Erazer Beast X40 2024 (v6.92.6600) | |
| Alienware x16 R2 P120F (v6.92.6600) | |
| AIDA64 / FPU Julia | |
| Asus ROG Strix Scar 17 G733PYV-LL053X (v6.88.6413 Beta) | |
| SCHENKER XMG Neo 16 (Early 24) (v6.92.6600, Overboost, Oasis) | |
| SCHENKER XMG Neo 16 (Early 24) (v6.92.6600) | |
| Lenovo Legion 9 16IRX9, RTX 4090 (v6.92.6600) | |
| Lenovo Legion Pro 7 RTX4090 (v6.85.6300) | |
| Average Intel Core i9-14900HX (88537 - 166040, n=25) | |
| Razer Blade 16 2024, RTX 4090 (v6.92.6600) | |
| Asus ROG Strix Scar 16 G634JZR (v6.92.6600) | |
| SCHENKER XMG Neo 16 E23 (v6.75.6100) | |
| Medion Erazer Beast X40 2024 (v6.92.6600) | |
| Average of class Gaming (25360 - 252486, n=205, last 2 years) | |
| Alienware x16 R2 P120F (v6.92.6600) | |
| AIDA64 / CPU SHA3 | |
| Asus ROG Strix Scar 17 G733PYV-LL053X (v6.88.6413 Beta) | |
| SCHENKER XMG Neo 16 (Early 24) (v6.92.6600, Overboost, Oasis) | |
| SCHENKER XMG Neo 16 (Early 24) (v6.92.6600) | |
| Lenovo Legion 9 16IRX9, RTX 4090 (v6.92.6600) | |
| Lenovo Legion Pro 7 RTX4090 (v6.85.6300) | |
| Asus ROG Strix Scar 16 G634JZR (v6.92.6600) | |
| Average Intel Core i9-14900HX (4267 - 7979, n=25) | |
| Razer Blade 16 2024, RTX 4090 (v6.92.6600) | |
| SCHENKER XMG Neo 16 E23 (v6.75.6100) | |
| Medion Erazer Beast X40 2024 (v6.92.6600) | |
| Average of class Gaming (1339 - 10389, n=205, last 2 years) | |
| Alienware x16 R2 P120F (v6.92.6600) | |
| AIDA64 / CPU Queen | |
| Asus ROG Strix Scar 17 G733PYV-LL053X (v6.88.6413 Beta) | |
| SCHENKER XMG Neo 16 (Early 24) (v6.92.6600) | |
| SCHENKER XMG Neo 16 (Early 24) (v6.92.6600, Overboost, Oasis) | |
| Asus ROG Strix Scar 16 G634JZR (v6.92.6600) | |
| Average Intel Core i9-14900HX (118405 - 148966, n=25) | |
| Razer Blade 16 2024, RTX 4090 (v6.92.6600) | |
| SCHENKER XMG Neo 16 E23 (v6.75.6100) | |
| Lenovo Legion Pro 7 RTX4090 (v6.85.6300) | |
| Medion Erazer Beast X40 2024 (v6.92.6600) | |
| Lenovo Legion 9 16IRX9, RTX 4090 (v6.92.6600) | |
| Average of class Gaming (41257 - 200651, n=205, last 2 years) | |
| Alienware x16 R2 P120F (v6.92.6600) | |
| AIDA64 / FPU SinJulia | |
| Asus ROG Strix Scar 17 G733PYV-LL053X (v6.88.6413 Beta) | |
| SCHENKER XMG Neo 16 (Early 24) (v6.92.6600, Overboost, Oasis) | |
| SCHENKER XMG Neo 16 (Early 24) (v6.92.6600) | |
| Lenovo Legion 9 16IRX9, RTX 4090 (v6.92.6600) | |
| Asus ROG Strix Scar 16 G634JZR (v6.92.6600) | |
| Razer Blade 16 2024, RTX 4090 (v6.92.6600) | |
| Average Intel Core i9-14900HX (12217 - 18517, n=25) | |
| Lenovo Legion Pro 7 RTX4090 (v6.85.6300) | |
| SCHENKER XMG Neo 16 E23 (v6.75.6100) | |
| Medion Erazer Beast X40 2024 (v6.92.6600) | |
| Average of class Gaming (3925 - 32988, n=205, last 2 years) | |
| Alienware x16 R2 P120F (v6.92.6600) | |
| AIDA64 / FPU Mandel | |
| Asus ROG Strix Scar 17 G733PYV-LL053X (v6.88.6413 Beta) | |
| SCHENKER XMG Neo 16 (Early 24) (v6.92.6600, Overboost, Oasis) | |
| SCHENKER XMG Neo 16 (Early 24) (v6.92.6600) | |
| Lenovo Legion 9 16IRX9, RTX 4090 (v6.92.6600) | |
| Lenovo Legion Pro 7 RTX4090 (v6.85.6300) | |
| Asus ROG Strix Scar 16 G634JZR (v6.92.6600) | |
| Razer Blade 16 2024, RTX 4090 (v6.92.6600) | |
| Average Intel Core i9-14900HX (43302 - 83662, n=25) | |
| SCHENKER XMG Neo 16 E23 (v6.75.6100) | |
| Average of class Gaming (12321 - 134044, n=205, last 2 years) | |
| Medion Erazer Beast X40 2024 | |
| Alienware x16 R2 P120F (v6.92.6600) | |
| AIDA64 / CPU AES | |
| Asus ROG Strix Scar 17 G733PYV-LL053X (v6.88.6413 Beta) | |
| Asus ROG Strix Scar 16 G634JZR (v6.92.6600) | |
| SCHENKER XMG Neo 16 E23 (v6.75.6100) | |
| SCHENKER XMG Neo 16 (Early 24) (v6.92.6600, Overboost, Oasis) | |
| SCHENKER XMG Neo 16 (Early 24) (v6.92.6600) | |
| Average Intel Core i9-14900HX (86964 - 241777, n=25) | |
| Lenovo Legion 9 16IRX9, RTX 4090 (v6.92.6600) | |
| Lenovo Legion Pro 7 RTX4090 (v6.85.6300) | |
| Razer Blade 16 2024, RTX 4090 (v6.92.6600) | |
| Average of class Gaming (19065 - 328679, n=205, last 2 years) | |
| Medion Erazer Beast X40 2024 (v6.92.6600) | |
| Alienware x16 R2 P120F (v6.92.6600) | |
| AIDA64 / CPU ZLib | |
| SCHENKER XMG Neo 16 (Early 24) (v6.92.6600, Overboost, Oasis) | |
| SCHENKER XMG Neo 16 (Early 24) (v6.92.6600) | |
| Asus ROG Strix Scar 17 G733PYV-LL053X (v6.88.6413 Beta) | |
| Lenovo Legion 9 16IRX9, RTX 4090 (v6.92.6600) | |
| Lenovo Legion Pro 7 RTX4090 (v6.85.6300) | |
| Razer Blade 16 2024, RTX 4090 (v6.92.6600) | |
| Asus ROG Strix Scar 16 G634JZR (v6.92.6600) | |
| Average Intel Core i9-14900HX (1265 - 2292, n=25) | |
| SCHENKER XMG Neo 16 E23 (v6.75.6100) | |
| Medion Erazer Beast X40 2024 (v6.92.6600) | |
| Alienware x16 R2 P120F (v6.92.6600) | |
| Average of class Gaming (269 - 2409, n=205, last 2 years) | |
| AIDA64 / FP64 Ray-Trace | |
| Asus ROG Strix Scar 17 G733PYV-LL053X (v6.88.6413 Beta) | |
| SCHENKER XMG Neo 16 (Early 24) (v6.92.6600, Overboost, Oasis) | |
| SCHENKER XMG Neo 16 (Early 24) (v6.92.6600) | |
| Lenovo Legion 9 16IRX9, RTX 4090 (v6.92.6600) | |
| Lenovo Legion Pro 7 RTX4090 (v6.85.6300) | |
| Asus ROG Strix Scar 16 G634JZR (v6.92.6600) | |
| Razer Blade 16 2024, RTX 4090 (v6.92.6600) | |
| Average Intel Core i9-14900HX (9170 - 18349, n=25) | |
| SCHENKER XMG Neo 16 E23 (v6.75.6100) | |
| Medion Erazer Beast X40 2024 (v6.92.6600) | |
| Average of class Gaming (2540 - 31796, n=205, last 2 years) | |
| Alienware x16 R2 P120F (v6.92.6600) | |
| AIDA64 / CPU PhotoWorxx | |
| Lenovo Legion 9 16IRX9, RTX 4090 (v6.92.6600) | |
| Alienware x16 R2 P120F (v6.92.6600) | |
| Lenovo Legion Pro 7 RTX4090 (v6.85.6300) | |
| Asus ROG Strix Scar 16 G634JZR (v6.92.6600) | |
| Razer Blade 16 2024, RTX 4090 (v6.92.6600) | |
| SCHENKER XMG Neo 16 (Early 24) (v6.92.6600, Overboost, Oasis) | |
| SCHENKER XMG Neo 16 (Early 24) (v6.92.6600) | |
| Medion Erazer Beast X40 2024 (v6.92.6600) | |
| SCHENKER XMG Neo 16 E23 (v6.75.6100) | |
| Average Intel Core i9-14900HX (33960 - 54702, n=25) | |
| Average of class Gaming (10805 - 60161, n=206, last 2 years) | |
| Asus ROG Strix Scar 17 G733PYV-LL053X (v6.88.6413 Beta) | |
Wydajność systemu
Zdradza to już lista specyfikacji: Mocy obliczeniowej nie brakuje - potwierdzają to chociażby bardzo dobre wyniki w PCMark. Gry, streaming i rendering powinny być głównymi obszarami operacyjnymi tego szybkiego komputera. Prędkości transferu pamięci RAM są na normalnym poziomie dla pamięci DDR5 5600 RAM.

CrossMark: Overall | Productivity | Creativity | Responsiveness
WebXPRT 3: Overall
WebXPRT 4: Overall
Mozilla Kraken 1.1: Total
| PCMark 10 / Score | |
| Asus ROG Strix Scar 17 G733PYV-LL053X | |
| SCHENKER XMG Neo 16 (Early 24) | |
| Medion Erazer Beast X40 2024 | |
| Average Intel Core i9-14900HX, NVIDIA GeForce RTX 4090 Laptop GPU (8230 - 9234, n=10) | |
| Razer Blade 16 2024, RTX 4090 | |
| SCHENKER XMG Neo 16 E23 | |
| Lenovo Legion 9 16IRX9, RTX 4090 | |
| Lenovo Legion Pro 7 RTX4090 | |
| Asus ROG Strix Scar 16 G634JZR | |
| Average of class Gaming (5442 - 9852, n=185, last 2 years) | |
| Alienware x16 R2 P120F | |
| PCMark 10 / Essentials | |
| Asus ROG Strix Scar 16 G634JZR | |
| Asus ROG Strix Scar 17 G733PYV-LL053X | |
| Average Intel Core i9-14900HX, NVIDIA GeForce RTX 4090 Laptop GPU (10871 - 11628, n=10) | |
| Lenovo Legion Pro 7 RTX4090 | |
| SCHENKER XMG Neo 16 (Early 24) | |
| Lenovo Legion 9 16IRX9, RTX 4090 | |
| SCHENKER XMG Neo 16 E23 | |
| Razer Blade 16 2024, RTX 4090 | |
| Medion Erazer Beast X40 2024 | |
| Average of class Gaming (8829 - 12334, n=184, last 2 years) | |
| Alienware x16 R2 P120F | |
| PCMark 10 / Productivity | |
| Medion Erazer Beast X40 2024 | |
| SCHENKER XMG Neo 16 (Early 24) | |
| Razer Blade 16 2024, RTX 4090 | |
| Asus ROG Strix Scar 17 G733PYV-LL053X | |
| Average Intel Core i9-14900HX, NVIDIA GeForce RTX 4090 Laptop GPU (9951 - 11759, n=10) | |
| Lenovo Legion 9 16IRX9, RTX 4090 | |
| SCHENKER XMG Neo 16 E23 | |
| Average of class Gaming (6662 - 14612, n=184, last 2 years) | |
| Lenovo Legion Pro 7 RTX4090 | |
| Alienware x16 R2 P120F | |
| Asus ROG Strix Scar 16 G634JZR | |
| PCMark 10 / Digital Content Creation | |
| Asus ROG Strix Scar 17 G733PYV-LL053X | |
| Asus ROG Strix Scar 16 G634JZR | |
| SCHENKER XMG Neo 16 (Early 24) | |
| Medion Erazer Beast X40 2024 | |
| Average Intel Core i9-14900HX, NVIDIA GeForce RTX 4090 Laptop GPU (13219 - 16462, n=10) | |
| SCHENKER XMG Neo 16 E23 | |
| Lenovo Legion Pro 7 RTX4090 | |
| Lenovo Legion 9 16IRX9, RTX 4090 | |
| Razer Blade 16 2024, RTX 4090 | |
| Alienware x16 R2 P120F | |
| Average of class Gaming (6462 - 18475, n=184, last 2 years) | |
| CrossMark / Overall | |
| SCHENKER XMG Neo 16 (Early 24) | |
| Razer Blade 16 2024, RTX 4090 | |
| Medion Erazer Beast X40 2024 | |
| Average Intel Core i9-14900HX, NVIDIA GeForce RTX 4090 Laptop GPU (1877 - 2344, n=10) | |
| SCHENKER XMG Neo 16 E23 | |
| Asus ROG Strix Scar 17 G733PYV-LL053X | |
| Asus ROG Strix Scar 16 G634JZR | |
| Lenovo Legion 9 16IRX9, RTX 4090 | |
| Average of class Gaming (1247 - 2344, n=162, last 2 years) | |
| Alienware x16 R2 P120F | |
| CrossMark / Productivity | |
| SCHENKER XMG Neo 16 (Early 24) | |
| Medion Erazer Beast X40 2024 | |
| Razer Blade 16 2024, RTX 4090 | |
| Average Intel Core i9-14900HX, NVIDIA GeForce RTX 4090 Laptop GPU (1738 - 2162, n=10) | |
| SCHENKER XMG Neo 16 E23 | |
| Asus ROG Strix Scar 17 G733PYV-LL053X | |
| Asus ROG Strix Scar 16 G634JZR | |
| Average of class Gaming (1299 - 2204, n=162, last 2 years) | |
| Lenovo Legion 9 16IRX9, RTX 4090 | |
| Alienware x16 R2 P120F | |
| CrossMark / Creativity | |
| SCHENKER XMG Neo 16 (Early 24) | |
| SCHENKER XMG Neo 16 E23 | |
| Razer Blade 16 2024, RTX 4090 | |
| Asus ROG Strix Scar 17 G733PYV-LL053X | |
| Average Intel Core i9-14900HX, NVIDIA GeForce RTX 4090 Laptop GPU (2195 - 2660, n=10) | |
| Asus ROG Strix Scar 16 G634JZR | |
| Medion Erazer Beast X40 2024 | |
| Lenovo Legion 9 16IRX9, RTX 4090 | |
| Average of class Gaming (1275 - 2660, n=162, last 2 years) | |
| Alienware x16 R2 P120F | |
| CrossMark / Responsiveness | |
| SCHENKER XMG Neo 16 (Early 24) | |
| Medion Erazer Beast X40 2024 | |
| Average Intel Core i9-14900HX, NVIDIA GeForce RTX 4090 Laptop GPU (1478 - 2327, n=10) | |
| Razer Blade 16 2024, RTX 4090 | |
| Lenovo Legion 9 16IRX9, RTX 4090 | |
| Asus ROG Strix Scar 16 G634JZR | |
| SCHENKER XMG Neo 16 E23 | |
| Average of class Gaming (1030 - 2330, n=162, last 2 years) | |
| Asus ROG Strix Scar 17 G733PYV-LL053X | |
| Alienware x16 R2 P120F | |
| WebXPRT 3 / Overall | |
| Asus ROG Strix Scar 17 G733PYV-LL053X | |
| SCHENKER XMG Neo 16 (Early 24) | |
| SCHENKER XMG Neo 16 E23 | |
| Razer Blade 16 2024, RTX 4090 | |
| Medion Erazer Beast X40 2024 | |
| Average Intel Core i9-14900HX, NVIDIA GeForce RTX 4090 Laptop GPU (279 - 339, n=9) | |
| Asus ROG Strix Scar 16 G634JZR | |
| Average of class Gaming (215 - 480, n=186, last 2 years) | |
| Lenovo Legion 9 16IRX9, RTX 4090 | |
| Lenovo Legion Pro 7 RTX4090 | |
| Alienware x16 R2 P120F | |
| WebXPRT 4 / Overall | |
| Asus ROG Strix Scar 17 G733PYV-LL053X | |
| Asus ROG Strix Scar 16 G634JZR | |
| SCHENKER XMG Neo 16 (Early 24) | |
| SCHENKER XMG Neo 16 E23 | |
| Medion Erazer Beast X40 2024 | |
| Average Intel Core i9-14900HX, NVIDIA GeForce RTX 4090 Laptop GPU (246 - 309, n=7) | |
| Lenovo Legion Pro 7 RTX4090 | |
| Average of class Gaming (157.9 - 328, n=168, last 2 years) | |
| Lenovo Legion 9 16IRX9, RTX 4090 | |
| Alienware x16 R2 P120F | |
| Mozilla Kraken 1.1 / Total | |
| Alienware x16 R2 P120F | |
| Lenovo Legion 9 16IRX9, RTX 4090 | |
| Average of class Gaming (421 - 737, n=197, last 2 years) | |
| Lenovo Legion Pro 7 RTX4090 | |
| Average Intel Core i9-14900HX, NVIDIA GeForce RTX 4090 Laptop GPU (428 - 535, n=10) | |
| SCHENKER XMG Neo 16 E23 | |
| Razer Blade 16 2024, RTX 4090 | |
| Asus ROG Strix Scar 16 G634JZR | |
| Medion Erazer Beast X40 2024 | |
| SCHENKER XMG Neo 16 (Early 24) | |
| Asus ROG Strix Scar 17 G733PYV-LL053X | |
* ... im mniej tym lepiej
| PCMark 10 Score | 9017 pkt. | |
Pomoc | ||
| AIDA64 / Memory Copy | |
| Alienware x16 R2 P120F | |
| Lenovo Legion 9 16IRX9, RTX 4090 | |
| SCHENKER XMG Neo 16 (Early 24) | |
| Asus ROG Strix Scar 16 G634JZR | |
| Razer Blade 16 2024, RTX 4090 | |
| SCHENKER XMG Neo 16 (Early 24) | |
| Lenovo Legion Pro 7 RTX4090 | |
| Medion Erazer Beast X40 2024 | |
| Average Intel Core i9-14900HX (56992 - 83392, n=25) | |
| SCHENKER XMG Neo 16 E23 | |
| Average of class Gaming (21842 - 94222, n=205, last 2 years) | |
| Asus ROG Strix Scar 17 G733PYV-LL053X | |
| AIDA64 / Memory Read | |
| Asus ROG Strix Scar 16 G634JZR | |
| SCHENKER XMG Neo 16 (Early 24) | |
| Lenovo Legion Pro 7 RTX4090 | |
| SCHENKER XMG Neo 16 (Early 24) | |
| Razer Blade 16 2024, RTX 4090 | |
| Medion Erazer Beast X40 2024 | |
| Alienware x16 R2 P120F | |
| Average Intel Core i9-14900HX (54443 - 87507, n=25) | |
| SCHENKER XMG Neo 16 E23 | |
| Lenovo Legion 9 16IRX9, RTX 4090 | |
| Average of class Gaming (23681 - 90647, n=205, last 2 years) | |
| Asus ROG Strix Scar 17 G733PYV-LL053X | |
| AIDA64 / Memory Write | |
| Lenovo Legion 9 16IRX9, RTX 4090 | |
| SCHENKER XMG Neo 16 (Early 24) | |
| SCHENKER XMG Neo 16 (Early 24) | |
| Asus ROG Strix Scar 16 G634JZR | |
| Medion Erazer Beast X40 2024 | |
| Lenovo Legion Pro 7 RTX4090 | |
| Razer Blade 16 2024, RTX 4090 | |
| Average Intel Core i9-14900HX (51387 - 80589, n=25) | |
| Alienware x16 R2 P120F | |
| SCHENKER XMG Neo 16 E23 | |
| Average of class Gaming (22986 - 103259, n=205, last 2 years) | |
| Asus ROG Strix Scar 17 G733PYV-LL053X | |
| AIDA64 / Memory Latency | |
| Alienware x16 R2 P120F | |
| Lenovo Legion 9 16IRX9, RTX 4090 | |
| Average of class Gaming (59.5 - 152.5, n=203, last 2 years) | |
| Asus ROG Strix Scar 17 G733PYV-LL053X | |
| SCHENKER XMG Neo 16 E23 | |
| Lenovo Legion Pro 7 RTX4090 | |
| Average Intel Core i9-14900HX (76.1 - 105, n=25) | |
| Razer Blade 16 2024, RTX 4090 | |
| Medion Erazer Beast X40 2024 | |
| Asus ROG Strix Scar 16 G634JZR | |
| SCHENKER XMG Neo 16 (Early 24) | |
| SCHENKER XMG Neo 16 (Early 24) | |
* ... im mniej tym lepiej
Opóźnienia DPC
Standardowy test Latency Monitor (surfowanie po Internecie, odtwarzanie wideo 4k, wysokie obciążenie Prime95) ujawnił pewne anomalie. System nie wydaje się być odpowiedni do edycji wideo i audio w czasie rzeczywistym. Przyszłe aktualizacje oprogramowania mogą mieć na to wpływ.


| DPC Latencies / LatencyMon - interrupt to process latency (max), Web, Youtube, Prime95 | |
| SCHENKER XMG Neo 16 E23 | |
| SCHENKER XMG Neo 16 (Early 24) | |
| Razer Blade 16 2024, RTX 4090 | |
| Medion Erazer Beast X40 2024 | |
| Asus ROG Strix Scar 17 G733PYV-LL053X | |
* ... im mniej tym lepiej
Pamięć masowa
Jak zwykle Schenker oferuje klientom szeroki wybór dysków SSD w swoim sklepie internetowym - wewnątrz Neo jest miejsce na dwa. Oferowana jest obsługa RAID 0/1. Dysk SSD Samsung w recenzowanym urządzeniu (1 TB, PCIe 4, M.2 2280) zapewnia dobre prędkości transferu. Jedną z pozytywnych cech jest brak dławienia termicznego.


| Drive Performance Rating - Percent | |
| SCHENKER XMG Neo 16 (Early 24) | |
| Average Samsung 990 Pro 1 TB | |
| Medion Erazer Beast X40 2024 | |
| Razer Blade 16 2024, RTX 4090 | |
| Average of class Gaming | |
| Asus ROG Strix Scar 17 G733PYV-LL053X | |
| SCHENKER XMG Neo 16 E23 | |
* ... im mniej tym lepiej
Continuous Performance: DiskSpd Read Loop, Queue Depth 8
Karta graficzna
Obecnie GeForce RTX 4090 zapewnia najwyższą wydajność wśród mobilnych procesorów graficznych Nvidii. akcelerator pikseli charakteryzuje się 9 728 jednostkami cieniującymi, 256-bitową magistralą oraz szybką pamięcią RAM GDDR6 (16 384 MB). Maksymalne TGP wynosi 175 watów (150 watów + 25 watów Dynamic Boost) - więcej nie jest możliwe.
Wyniki benchmarków są powyżej (Overboost) i poniżej (Enthusiast, Balanced) dotychczasowej średniej RTX 4090. Chłodzenie wodne Oasis pomaga osiągnąć niewielki wzrost wydajności. W każdym razie, główny konkurent, czyli Blade 16jest trzymany na dystans. Przełączanie między dGPU a Optimus nie wymaga restartu: Advanced Optimus jest obsługiwany.


| 3DMark Performance Rating - Percent | |
| SCHENKER XMG Neo 16 (Early 24) | |
| SCHENKER XMG Neo 16 (Early 24) | |
| SCHENKER XMG Neo 16 E23 | |
| Asus ROG Strix Scar 17 G733PYV-LL053X | |
| Average NVIDIA GeForce RTX 4090 Laptop GPU | |
| Lenovo Legion Pro 7 RTX4090 | |
| Razer Blade 16 2024, RTX 4090 | |
| Medion Erazer Beast X40 2024 | |
| Lenovo Legion 9 16IRX9, RTX 4090 | |
| Asus ROG Strix Scar 16 G634JZR | |
| Alienware x16 R2 P120F | |
| Average of class Gaming | |
| 3DMark 11 - 1280x720 Performance GPU | |
| SCHENKER XMG Neo 16 (Early 24) (Overboost, Oasis) | |
| SCHENKER XMG Neo 16 E23 | |
| SCHENKER XMG Neo 16 (Early 24) | |
| Razer Blade 16 2024, RTX 4090 | |
| Average NVIDIA GeForce RTX 4090 Laptop GPU (56764 - 73027, n=40) | |
| Medion Erazer Beast X40 2024 | |
| Lenovo Legion 9 16IRX9, RTX 4090 | |
| Asus ROG Strix Scar 17 G733PYV-LL053X | |
| Lenovo Legion Pro 7 RTX4090 | |
| Asus ROG Strix Scar 16 G634JZR | |
| Alienware x16 R2 P120F | |
| Average of class Gaming (1029 - 72178, n=206, last 2 years) | |
| 3DMark | |
| 1920x1080 Fire Strike Graphics | |
| SCHENKER XMG Neo 16 (Early 24) | |
| SCHENKER XMG Neo 16 (Early 24) (Overboost, Oasis) | |
| Asus ROG Strix Scar 17 G733PYV-LL053X | |
| SCHENKER XMG Neo 16 E23 | |
| Average NVIDIA GeForce RTX 4090 Laptop GPU (41210 - 53059, n=37) | |
| Razer Blade 16 2024, RTX 4090 | |
| Lenovo Legion Pro 7 RTX4090 | |
| Medion Erazer Beast X40 2024 | |
| Lenovo Legion 9 16IRX9, RTX 4090 | |
| Alienware x16 R2 P120F | |
| Asus ROG Strix Scar 16 G634JZR | |
| Average of class Gaming (781 - 53059, n=213, last 2 years) | |
| 2560x1440 Time Spy Graphics | |
| SCHENKER XMG Neo 16 (Early 24) (Overboost, Oasis) | |
| SCHENKER XMG Neo 16 E23 | |
| SCHENKER XMG Neo 16 (Early 24) | |
| Asus ROG Strix Scar 17 G733PYV-LL053X | |
| Lenovo Legion Pro 7 RTX4090 | |
| Average NVIDIA GeForce RTX 4090 Laptop GPU (17620 - 23292, n=39) | |
| Medion Erazer Beast X40 2024 | |
| Lenovo Legion 9 16IRX9, RTX 4090 | |
| Razer Blade 16 2024, RTX 4090 | |
| Asus ROG Strix Scar 16 G634JZR | |
| Alienware x16 R2 P120F | |
| Average of class Gaming (224 - 22717, n=209, last 2 years) | |
| 3DMark 06 Standard Score | 62889 pkt. | |
| 3DMark 11 Performance | 43829 pkt. | |
| 3DMark Fire Strike Score | 38597 pkt. | |
| 3DMark Time Spy Score | 20588 pkt. | |
| 3DMark Steel Nomad Score | 5102 pkt. | |
Pomoc | ||
| Geekbench 5.5 | |
| OpenCL Score | |
| SCHENKER XMG Neo 16 (Early 24) (Overboost, Oasis) | |
| SCHENKER XMG Neo 16 (Early 24) | |
| SCHENKER XMG Neo 16 E23 | |
| Asus ROG Strix Scar 17 G733PYV-LL053X | |
| Medion Erazer Beast X40 2024 | |
| Average NVIDIA GeForce RTX 4090 Laptop GPU (6841 - 237138, n=37) | |
| Razer Blade 16 2024, RTX 4090 | |
| Lenovo Legion 9 16IRX9, RTX 4090 | |
| Lenovo Legion Pro 7 RTX4090 | |
| Asus ROG Strix Scar 16 G634JZR | |
| Alienware x16 R2 P120F | |
| Average of class Gaming (5039 - 237138, n=212, last 2 years) | |
| Vulkan Score 5.5 | |
| SCHENKER XMG Neo 16 (Early 24) | |
| Medion Erazer Beast X40 2024 | |
| Razer Blade 16 2024, RTX 4090 | |
| Lenovo Legion 9 16IRX9, RTX 4090 | |
| Asus ROG Strix Scar 17 G733PYV-LL053X | |
| SCHENKER XMG Neo 16 (Early 24) (Overboost, Oasis) | |
| Average NVIDIA GeForce RTX 4090 Laptop GPU (1952 - 163089, n=34) | |
| Alienware x16 R2 P120F | |
| Lenovo Legion Pro 7 RTX4090 | |
| Asus ROG Strix Scar 16 G634JZR | |
| Average of class Gaming (1952 - 163089, n=208, last 2 years) | |
| SCHENKER XMG Neo 16 E23 | |
| Geekbench 6.2 | |
| GPU Vulkan 6.2 | |
| Razer Blade 16 2024, RTX 4090 (6.2.1) | |
| Medion Erazer Beast X40 2024 (6.2.1) | |
| SCHENKER XMG Neo 16 (Early 24) (6.2.1) | |
| Asus ROG Strix Scar 17 G733PYV-LL053X | |
| SCHENKER XMG Neo 16 (Early 24) (6.2.1, Overboost, Oasis) | |
| Lenovo Legion 9 16IRX9, RTX 4090 (6.2.1) | |
| Average NVIDIA GeForce RTX 4090 Laptop GPU (9584 - 196201, n=16) | |
| Alienware x16 R2 P120F (6.2.1) | |
| Asus ROG Strix Scar 16 G634JZR (6.2.1) | |
| Average of class Gaming (4286 - 196201, n=85, last 2 years) | |
| GPU OpenCL | |
| Medion Erazer Beast X40 2024 (6.2.1) | |
| SCHENKER XMG Neo 16 (Early 24) (6.2.1, Overboost, Oasis) | |
| Asus ROG Strix Scar 17 G733PYV-LL053X | |
| SCHENKER XMG Neo 16 (Early 24) (6.2.1) | |
| Lenovo Legion 9 16IRX9, RTX 4090 (6.2.1) | |
| Average NVIDIA GeForce RTX 4090 Laptop GPU (159127 - 209521, n=18) | |
| Razer Blade 16 2024, RTX 4090 (6.2.1) | |
| Asus ROG Strix Scar 16 G634JZR (6.2.1) | |
| Alienware x16 R2 P120F (6.2.1) | |
| Average of class Gaming (4321 - 207373, n=87, last 2 years) | |
* ... im mniej tym lepiej
Wydajność w grach
Komputer XMG został zaprojektowany do obsługi gier w rozdzielczości QHD przy maksymalnych ustawieniach. Liczba klatek na sekundę jest powyżej średniej dla RTX 4090 (Overboost), a chłodzenie wodne nieznacznie zwiększa wydajność. Funkcje GPU, Frame Generation i DLSS 3, pozwoliłyby na wyższe rozdzielczości przy maksymalnych ustawieniach i z ray tracingiem - aczkolwiek tylko w grach, które oferują te funkcje.
| Performance Rating - Percent | |
| Asus ROG Strix Scar 17 G733PYV-LL053X | |
| SCHENKER XMG Neo 16 (Early 24) | |
| SCHENKER XMG Neo 16 (Early 24) | |
| SCHENKER XMG Neo 16 E23 | |
| Medion Erazer Beast X40 2024 | |
| Lenovo Legion Pro 7 RTX4090 | |
| Average NVIDIA GeForce RTX 4090 Laptop GPU | |
| Asus ROG Strix Scar 16 G634JZR | |
| Razer Blade 16 2024, RTX 4090 | |
| Lenovo Legion 9 16IRX9, RTX 4090 | |
| Alienware x16 R2 P120F -1! | |
| Average of class Gaming | |
| The Witcher 3 - 1920x1080 Ultra Graphics & Postprocessing (HBAO+) | |
| SCHENKER XMG Neo 16 (Early 24) | |
| SCHENKER XMG Neo 16 (Early 24) (Overboost, Oasis) | |
| SCHENKER XMG Neo 16 E23 | |
| Asus ROG Strix Scar 17 G733PYV-LL053X | |
| Medion Erazer Beast X40 2024 | |
| Lenovo Legion 9 16IRX9, RTX 4090 | |
| Lenovo Legion Pro 7 RTX4090 | |
| Razer Blade 16 2024, RTX 4090 | |
| Average NVIDIA GeForce RTX 4090 Laptop GPU (139.2 - 216, n=35) | |
| Asus ROG Strix Scar 16 G634JZR | |
| Alienware x16 R2 P120F | |
| Average of class Gaming (13.1 - 216, n=203, last 2 years) | |
| GTA V - 1920x1080 Highest Settings possible AA:4xMSAA + FX AF:16x | |
| Asus ROG Strix Scar 17 G733PYV-LL053X | |
| SCHENKER XMG Neo 16 (Early 24) (Overboost, Oasis) | |
| SCHENKER XMG Neo 16 (Early 24) | |
| SCHENKER XMG Neo 16 E23 | |
| Lenovo Legion Pro 7 RTX4090 | |
| Medion Erazer Beast X40 2024 | |
| Average NVIDIA GeForce RTX 4090 Laptop GPU (91.1 - 167.7, n=38) | |
| Asus ROG Strix Scar 16 G634JZR | |
| Razer Blade 16 2024, RTX 4090 | |
| Lenovo Legion 9 16IRX9, RTX 4090 | |
| Average of class Gaming (6.38 - 167.7, n=191, last 2 years) | |
| Final Fantasy XV Benchmark - 1920x1080 High Quality | |
| SCHENKER XMG Neo 16 (Early 24) (1.3, Overboost, Oasis) | |
| SCHENKER XMG Neo 16 (Early 24) (1.3) | |
| SCHENKER XMG Neo 16 E23 (1.3) | |
| Lenovo Legion Pro 7 RTX4090 (1.3) | |
| Medion Erazer Beast X40 2024 (1.3) | |
| Asus ROG Strix Scar 17 G733PYV-LL053X (1.3) | |
| Asus ROG Strix Scar 16 G634JZR (1.3) | |
| Average NVIDIA GeForce RTX 4090 Laptop GPU (122.2 - 201, n=38) | |
| Lenovo Legion 9 16IRX9, RTX 4090 (1.3) | |
| Alienware x16 R2 P120F (1.3) | |
| Razer Blade 16 2024, RTX 4090 (1.3) | |
| Average of class Gaming (9.13 - 201, n=204, last 2 years) | |
| Strange Brigade - 1920x1080 ultra AA:ultra AF:16 | |
| Asus ROG Strix Scar 17 G733PYV-LL053X (1.47.22.14 D3D12) | |
| SCHENKER XMG Neo 16 (Early 24) (1.47.22.14 D3D12, Overboost, Oasis) | |
| SCHENKER XMG Neo 16 (Early 24) (1.47.22.14 D3D12) | |
| SCHENKER XMG Neo 16 E23 (1.47.22.14 D3D12) | |
| Medion Erazer Beast X40 2024 (1.47.22.14 D3D12) | |
| Lenovo Legion 9 16IRX9, RTX 4090 (1.47.22.14 D3D12) | |
| Razer Blade 16 2024, RTX 4090 (1.47.22.14 D3D12) | |
| Average NVIDIA GeForce RTX 4090 Laptop GPU (233 - 421, n=37) | |
| Lenovo Legion Pro 7 RTX4090 (1.47.22.14 D3D12) | |
| Asus ROG Strix Scar 16 G634JZR (1.47.22.14 D3D12) | |
| Alienware x16 R2 P120F (1.47.22.14 D3D12) | |
| Average of class Gaming (14.6 - 421, n=202, last 2 years) | |
| Dota 2 Reborn - 1920x1080 ultra (3/3) best looking | |
| Asus ROG Strix Scar 17 G733PYV-LL053X | |
| SCHENKER XMG Neo 16 (Early 24) | |
| SCHENKER XMG Neo 16 (Early 24) (Overboost, Oasis) | |
| Medion Erazer Beast X40 2024 | |
| Razer Blade 16 2024, RTX 4090 | |
| SCHENKER XMG Neo 16 E23 | |
| Lenovo Legion Pro 7 RTX4090 | |
| Asus ROG Strix Scar 16 G634JZR | |
| Average NVIDIA GeForce RTX 4090 Laptop GPU (115.7 - 220, n=40) | |
| Lenovo Legion 9 16IRX9, RTX 4090 | |
| Average of class Gaming (33.2 - 220, n=211, last 2 years) | |
| Alienware x16 R2 P120F | |
| X-Plane 11.11 - 1920x1080 high (fps_test=3) | |
| Asus ROG Strix Scar 17 G733PYV-LL053X | |
| Razer Blade 16 2024, RTX 4090 | |
| SCHENKER XMG Neo 16 (Early 24) | |
| Medion Erazer Beast X40 2024 | |
| Asus ROG Strix Scar 16 G634JZR | |
| SCHENKER XMG Neo 16 (Early 24) (v6.92.6600, Overboost, Oasis) | |
| Lenovo Legion Pro 7 RTX4090 | |
| SCHENKER XMG Neo 16 E23 | |
| Average NVIDIA GeForce RTX 4090 Laptop GPU (77.8 - 166.2, n=44) | |
| Lenovo Legion 9 16IRX9, RTX 4090 | |
| Average of class Gaming (31.5 - 166.2, n=217, last 2 years) | |
| Alienware x16 R2 P120F | |
| F1 24 | |
| 1920x1080 Ultra High Preset AA:T AF:16x | |
| SCHENKER XMG Neo 16 (Early 24) (1119215) | |
| Average NVIDIA GeForce RTX 4090 Laptop GPU (113.6 - 127, n=3) | |
| XMG Neo 16 E23 | |
| Lenovo Legion 9 16IRX9, RTX 4090 (1118244) | |
| Average of class Gaming (60.6 - 127, n=4, last 2 years) | |
| 2560x1440 Ultra High Preset AA:T AF:16x | |
| SCHENKER XMG Neo 16 (Early 24) (1119215) | |
| XMG Neo 16 E23 | |
| Average NVIDIA GeForce RTX 4090 Laptop GPU (72.1 - 84.7, n=3) | |
| Lenovo Legion 9 16IRX9, RTX 4090 (1118244) | |
| Average of class Gaming (59.1 - 84.7, n=3, last 2 years) | |
| 2560x1440 Ultra High Preset + Quality DLSS AF:16x | |
| SCHENKER XMG Neo 16 (Early 24) (1119215) | |
| Average NVIDIA GeForce RTX 4090 Laptop GPU () | |
| Average of class Gaming (86.3 - 129.5, n=2, last 2 years) | |
| Senua's Saga Hellblade 2 | |
| 1920x1080 High Preset | |
| SCHENKER XMG Neo 16 (Early 24) | |
| Average of class Gaming (last 2 years) | |
| Average NVIDIA GeForce RTX 4090 Laptop GPU (74 - 78.8, n=2) | |
| XMG Neo 16 E23 | |
| 2560x1440 High Preset | |
| SCHENKER XMG Neo 16 (Early 24) | |
| Average of class Gaming (last 2 years) | |
| Average NVIDIA GeForce RTX 4090 Laptop GPU (51.8 - 57.3, n=2) | |
| XMG Neo 16 E23 | |
| 2560x1440 High Preset + Quality DLSS | |
| SCHENKER XMG Neo 16 (Early 24) | |
| Average NVIDIA GeForce RTX 4090 Laptop GPU () | |
| Average of class Gaming (last 2 years) | |
| Horizon Forbidden West | |
| 1920x1080 Very High Preset AA:T | |
| SCHENKER XMG Neo 16 (Early 24) | |
| Average NVIDIA GeForce RTX 4090 Laptop GPU (93.7 - 125.2, n=2) | |
| Average of class Gaming (30.2 - 125.2, n=7, last 2 years) | |
| 2560x1440 Very High Preset AA:T | |
| SCHENKER XMG Neo 16 (Early 24) | |
| Average NVIDIA GeForce RTX 4090 Laptop GPU (75.2 - 98, n=2) | |
| Average of class Gaming (24.1 - 98, n=7, last 2 years) | |
| Alone in the Dark | |
| 1920x1080 Cinematic Preset | |
| SCHENKER XMG Neo 16 (Early 24) | |
| Average NVIDIA GeForce RTX 4090 Laptop GPU (141 - 189.9, n=2) | |
| Average of class Gaming (13.6 - 189.9, n=5, last 2 years) | |
| 2560x1440 Cinematic Preset | |
| SCHENKER XMG Neo 16 (Early 24) | |
| Average NVIDIA GeForce RTX 4090 Laptop GPU (99 - 133.6, n=2) | |
| Average of class Gaming (64.7 - 133.6, n=4, last 2 years) | |
Użyliśmy Witcher 3 do sprawdzenia stabilności liczby klatek na sekundę: Gra (maksymalne ustawienia, FHD) działała przez około 1 godzinę, postać w grze nie była poruszana i nie zaobserwowaliśmy żadnych spadków liczby klatek na sekundę.
Witcher 3 FPS diagram


| low | med. | high | ultra | QHD | |
| GTA V (2015) | 187.6 | 187.4 | 185.7 | 159.3 | 156 |
| The Witcher 3 (2015) | 643 | 562.3 | 412.7 | 214 | 169.4 |
| Dota 2 Reborn (2015) | 248 | 221 | 210 | 194.6 | |
| Final Fantasy XV Benchmark (2018) | 233 | 225 | 196.9 | 162.5 | |
| X-Plane 11.11 (2018) | 208 | 184.2 | 144.5 | ||
| Far Cry 5 (2018) | 194 | 184 | 172 | 156 | |
| Strange Brigade (2018) | 579 | 444 | 397 | 403 | 305 |
| Cyberpunk 2077 2.1 Phantom Liberty (2023) | 168.5 | 157.8 | 138 | 131.5 | 93.8 |
| Alan Wake 2 (2023) | 128.5 | 128 | 123.3 | 87.1 | |
| Alone in the Dark (2024) | 219 | 217 | 216 | 189.9 | 133.6 |
| Horizon Forbidden West (2024) | 165.4 | 160.5 | 126.2 | 125.2 | 98 |
| Senua's Saga Hellblade 2 (2024) | 122.3 | 103.3 | 78.8 | 57.3 | |
| F1 24 (2024) | 346 | 369 | 302 | 127 | 84.7 |
Emisje - laptop XMG ma emisje specyficzne dla swojej klasy
Emisja hałasu
Możliwe jest osiągnięcie poziomu hałasu do 56 dB(A), ale podczas grania wartość ta jest nieco niższa (Overboost). Znacznie niższy poziom hałasu można osiągnąć przy użyciu "Balanced" - kosztem wydajności. W grach byłoby to możliwe. W codziennym użytkowaniu (biuro, Internet) i w trybie bezczynności, komputer generalnie pracuje cicho - niezależnie od aktywnego trybu wydajności.
Korzystanie z zewnętrznego chłodzenia wodnego powoduje pewien hałas: Pompa pracuje bardzo cicho, a wentylatory są znacznie bardziej zauważalne. Patrząc subiektywnie, uważamy, że poziom hałasu przy użyciu zewnętrznego chłodzenia wodnego jest przyjemniejszy, ale niekoniecznie cichszy.
Od czasu do czasu z wnętrza laptopa wydobywają się elektroniczne trzaski - na przykład podczas testu Diskspd. Przypuszczalnie jest to spowodowane dyskiem SSD.
Hałas
| luz |
| 28 / 29 / 31 dB |
| obciążenie |
| 51 / 56 dB |
 | ||
30 dB cichy 40 dB(A) słyszalny 50 dB(A) irytujący |
||
min: | ||
| SCHENKER XMG Neo 16 (Early 24) NVIDIA GeForce RTX 4090 Laptop GPU, i9-14900HX, Samsung 990 Pro 1 TB | Razer Blade 16 2024, RTX 4090 NVIDIA GeForce RTX 4090 Laptop GPU, i9-14900HX, Samsung PM9A1 MZVL22T0HBLB | Medion Erazer Beast X40 2024 NVIDIA GeForce RTX 4090 Laptop GPU, i9-14900HX, Phison E18-1TB-PHISON-SSD-BICS5 | Asus ROG Strix Scar 17 G733PYV-LL053X NVIDIA GeForce RTX 4090 Laptop GPU, R9 7945HX3D, SK hynix PC801 HFS001TEJ9X101N | SCHENKER XMG Neo 16 E23 NVIDIA GeForce RTX 4090 Laptop GPU, i9-13900HX, Crucial P5 Plus 1TB CT1000P5PSSD8 | |
|---|---|---|---|---|---|
| Noise | 14% | 3% | 3% | -12% | |
| off / environment * | 26 | 23 12% | 25 4% | 23 12% | 25 4% |
| Idle Minimum * | 28 | 23 18% | 28 -0% | 23 18% | 31 -11% |
| Idle Average * | 29 | 23 21% | 29 -0% | 27.7 4% | 33 -14% |
| Idle Maximum * | 31 | 27.66 11% | 32 -3% | 34.7 -12% | 42 -35% |
| Load Average * | 51 | 43.76 14% | 48 6% | 53.4 -5% | 58 -14% |
| Witcher 3 ultra * | 54 | 46.81 13% | 50 7% | 53.4 1% | 57 -6% |
| Load Maximum * | 56 | 50.37 10% | 52 7% | 53.4 5% | 59 -5% |
* ... im mniej tym lepiej
Temperatura
Laptop wyraźnie nagrzewa się pod obciążeniem (test obciążeniowy i test Witcher 3 ): W niektórych obszarach temperatury osiągają niekiedy ponad 50°C. Niemniej jednak na podpórce pod nadgarstki temperatury pozostają na umiarkowanym poziomie. W codziennym użytkowaniu (biuro, internet) wartości oscylują w zielonej strefie.
Test Witcher 3 podkreśla efekt opcjonalnego chłodzenia wodnego: Temperatura GPU różni się o około 17 °C (80,7 °C vs 63,4 °C).
(-) The maximum temperature on the upper side is 47 °C / 117 F, compared to the average of 40.4 °C / 105 F, ranging from 21.2 to 68.8 °C for the class Gaming.
(-) The bottom heats up to a maximum of 56 °C / 133 F, compared to the average of 43.2 °C / 110 F
(+) In idle usage, the average temperature for the upper side is 26 °C / 79 F, compared to the device average of 33.9 °C / 93 F.
(-) Playing The Witcher 3, the average temperature for the upper side is 42.4 °C / 108 F, compared to the device average of 33.9 °C / 93 F.
(+) The palmrests and touchpad are reaching skin temperature as a maximum (35 °C / 95 F) and are therefore not hot.
(-) The average temperature of the palmrest area of similar devices was 28.9 °C / 84 F (-6.1 °C / -11 F).
| SCHENKER XMG Neo 16 (Early 24) Intel Core i9-14900HX, NVIDIA GeForce RTX 4090 Laptop GPU | Razer Blade 16 2024, RTX 4090 Intel Core i9-14900HX, NVIDIA GeForce RTX 4090 Laptop GPU | Medion Erazer Beast X40 2024 Intel Core i9-14900HX, NVIDIA GeForce RTX 4090 Laptop GPU | Asus ROG Strix Scar 17 G733PYV-LL053X AMD Ryzen 9 7945HX3D, NVIDIA GeForce RTX 4090 Laptop GPU | SCHENKER XMG Neo 16 E23 Intel Core i9-13900HX, NVIDIA GeForce RTX 4090 Laptop GPU | |
|---|---|---|---|---|---|
| Heat | 2% | -7% | 8% | 1% | |
| Maximum Upper Side * | 47 | 45 4% | 47 -0% | 40.1 15% | 50 -6% |
| Maximum Bottom * | 56 | 45 20% | 54 4% | 46.7 17% | 51 9% |
| Idle Upper Side * | 27 | 29 -7% | 30 -11% | 26.5 2% | 28 -4% |
| Idle Bottom * | 27 | 30 -11% | 32 -19% | 27.7 -3% | 26 4% |
* ... im mniej tym lepiej
Test warunków skrajnych
Ekstremalny scenariusz testu warunków skrajnych (Prime95 i Furmark w trybie ciągłym) sprawdza stabilność systemu pod pełnym obciążeniem. Prędkość procesora spada w ciągu pierwszej minuty testu z około 4,3 do 4,5 GHz (P) i 3,5 do 3,6 GHz (E) do 2,5 GHz (P) i 2,3 GHz (E). W tym samym czasie prędkość GPU wzrasta z punktu początkowego 1600 MHz do ponad 2000 MHz.


Głośniki
Głośnikom stereo brakuje basów. Poza tym generują one przeważnie przyzwoity dźwięk. Lepszą jakość można uzyskać używając słuchawek lub zewnętrznych głośników.
SCHENKER XMG Neo 16 (Early 24) audio analysis
(+) | speakers can play relatively loud (86 dB)
Bass 100 - 315 Hz
(-) | nearly no bass - on average 16.3% lower than median
(±) | linearity of bass is average (8.6% delta to prev. frequency)
Mids 400 - 2000 Hz
(+) | balanced mids - only 3% away from median
(+) | mids are linear (3.6% delta to prev. frequency)
Highs 2 - 16 kHz
(+) | balanced highs - only 2.5% away from median
(+) | highs are linear (4.9% delta to prev. frequency)
Overall 100 - 16.000 Hz
(+) | overall sound is linear (12.4% difference to median)
Compared to same class
» 13% of all tested devices in this class were better, 4% similar, 83% worse
» The best had a delta of 6%, average was 18%, worst was 132%
Compared to all devices tested
» 8% of all tested devices were better, 2% similar, 90% worse
» The best had a delta of 4%, average was 25%, worst was 134%
Razer Blade 16 2024, RTX 4090 audio analysis
(±) | speaker loudness is average but good (81.16 dB)
Bass 100 - 315 Hz
(±) | reduced bass - on average 8.2% lower than median
(±) | linearity of bass is average (7.4% delta to prev. frequency)
Mids 400 - 2000 Hz
(+) | balanced mids - only 3.3% away from median
(+) | mids are linear (5.9% delta to prev. frequency)
Highs 2 - 16 kHz
(+) | balanced highs - only 1.6% away from median
(+) | highs are linear (3.1% delta to prev. frequency)
Overall 100 - 16.000 Hz
(+) | overall sound is linear (9.2% difference to median)
Compared to same class
» 3% of all tested devices in this class were better, 1% similar, 96% worse
» The best had a delta of 6%, average was 18%, worst was 132%
Compared to all devices tested
» 2% of all tested devices were better, 1% similar, 97% worse
» The best had a delta of 4%, average was 25%, worst was 134%
Zarządzanie energią - Schenker Neo zapewnia przyzwoitą żywotność baterii
Zużycie energii
Pobór mocy jest na normalnym poziomie dla zainstalowanego tutaj sprzętu. Test Witcher 3 i test obciążeniowy przebiegły z nieznacznie spadającym poborem mocy. Zasilacz (330 W) jest odpowiedniej wielkości.
| wyłączony / stan wstrzymania | |
| luz | |
| obciążenie |
|
| SCHENKER XMG Neo 16 (Early 24) i9-14900HX, NVIDIA GeForce RTX 4090 Laptop GPU, Samsung 990 Pro 1 TB, IPS, 2560x1600, 16.00 | Razer Blade 16 2024, RTX 4090 i9-14900HX, NVIDIA GeForce RTX 4090 Laptop GPU, Samsung PM9A1 MZVL22T0HBLB, OLED, 2560x1600, 16.00 | Medion Erazer Beast X40 2024 i9-14900HX, NVIDIA GeForce RTX 4090 Laptop GPU, Phison E18-1TB-PHISON-SSD-BICS5, IPS, 2560x1600, 17.00 | Asus ROG Strix Scar 17 G733PYV-LL053X R9 7945HX3D, NVIDIA GeForce RTX 4090 Laptop GPU, SK hynix PC801 HFS001TEJ9X101N, IPS, 2560x1440, 17.30 | SCHENKER XMG Neo 16 E23 i9-13900HX, NVIDIA GeForce RTX 4090 Laptop GPU, Crucial P5 Plus 1TB CT1000P5PSSD8, IPS, 2560x1600, 16.00 | Average of class Gaming | |
|---|---|---|---|---|---|---|
| Power Consumption | -22% | -1% | -23% | -9% | -19% | |
| Idle Minimum * | 6 | 16.9 -182% | 7 -17% | 15.4 -157% | 8 -33% | 13.5 ? -125% |
| Idle Average * | 16 | 17.8 -11% | 15 6% | 21.6 -35% | 18 -13% | 19 ? -19% |
| Idle Maximum * | 28 | 19.6 30% | 33 -18% | 22.2 21% | 28 -0% | 26.9 ? 4% |
| Load Average * | 130 | 128 2% | 134 -3% | 116.7 10% | 133 -2% | 110.1 ? 15% |
| Witcher 3 ultra * | 302 | 243 20% | 280 7% | 262 13% | 294 3% | |
| Load Maximum * | 361 | 328 9% | 294 19% | 327.1 9% | 399 -11% | 253 ? 30% |
* ... im mniej tym lepiej
Power consumption Witcher 3 / stress test
Power consumption with an external monitor
Żywotność baterii
W testach Wi-Fi i wideo (ładowanie stron internetowych za pomocą skryptu, a także krótki film Big Buck Bunny (kodowanie H.264, FHD) w pętli), 16-calowa maszyna osiągnęła czasy pracy 5 godzin 50 minut i 6 godzin 58 minut. Podsumowując, są to przyzwoite wyniki.

| SCHENKER XMG Neo 16 (Early 24) i9-14900HX, NVIDIA GeForce RTX 4090 Laptop GPU, 99.8 Wh | Razer Blade 16 2024, RTX 4090 i9-14900HX, NVIDIA GeForce RTX 4090 Laptop GPU, 95.2 Wh | Medion Erazer Beast X40 2024 i9-14900HX, NVIDIA GeForce RTX 4090 Laptop GPU, 99.8 Wh | Asus ROG Strix Scar 17 G733PYV-LL053X R9 7945HX3D, NVIDIA GeForce RTX 4090 Laptop GPU, 90 Wh | SCHENKER XMG Neo 16 E23 i9-13900HX, NVIDIA GeForce RTX 4090 Laptop GPU, 99 Wh | Average of class Gaming | |
|---|---|---|---|---|---|---|
| Czasy pracy | -11% | 7% | -34% | -2% | -9% | |
| Reader / Idle | 600 | 551 ? -8% | ||||
| H.264 | 418 | 456 9% | 302 -28% | 349 -17% | 399 ? -5% | |
| WiFi v1.3 | 350 | 329 -6% | 374 7% | 287 -18% | 399 14% | 370 ? 6% |
| Load | 122 | 79 -35% | 55 -55% | 85.7 ? -30% | ||
| Witcher 3 ultra | 84 | 77 ? |
Za
Przeciw
Werdykt - Wysokiej klasy kula ognia

Neo 16 zapewnia to, co obiecuje: Sprzęt (Core i9, RTX 4090) z górnego końca skali wydajności umożliwia edycję wideo, renderowanie, strumieniowanie i oczywiście granie w rozdzielczości QHD. Oczekiwaną wysoką emisję można zredukować do bardziej umiarkowanego poziomu, wybierając odpowiedni tryb wydajności.
Dzięki XMG Neo 16 (Early 24) Schenker dostarcza mnóstwo mocy w kompaktowej obudowie.
Każdy, kto szuka bezkompromisowego rozwiązania, będzie musiał sięgnąć po opcjonalnie dostępne zewnętrzne chłodzenie wodne (230 USD): Pomaga to osiągnąć niewielki wzrost wydajności i niższą emisję spalin. Niemniej jednak, laptop jest wtedy przywiązany do stacjonarnej lokalizacji.
Matowy, 16-calowy wyświetlacz o proporcjach 16:10 (2560 x 1600 pikseli, sRGB, IPS, 240 Hz) w dużej mierze zrobił dobre wrażenie, a jego wysoka jasność jest szczególnie przyjemnym punktem. Jest jednak miejsce na poprawę kontrastu i pokrycia przestrzeni barw. Dwa gniazda na dyski SSD (PCIe 4) wraz z obsługą RAID 0/1 zapewniają mnóstwo przestrzeni dyskowej i krótki czas ładowania.
Pojedyncze ładowanie baterii (99,8 Wh) wystarcza na rzeczywisty czas pracy wynoszący około 6 do 7 godzin, co jest przyzwoitym wynikiem. Pozytywne: Baterię można ładować za pomocą ładowarki USB-C (100 W, 20 V, 5 A) - port TB4 obsługuje Power Delivery, co oznacza, że zasilacz (330 W) teoretycznie może pozostać w domu.
Jedną z alternatyw może być Razer Blade 16 (2024). Ten komputer oferuje nieco mniejszą moc obliczeniową, ale w przeciwieństwie do Neo, oferuje wyższy kontrast i bardziej żywy wyświetlacz OLED na pokładzie.
Cena i dostępność
XMG Neo 16 (Early 24) można indywidualnie skonfigurować i zakupić w sklepie internetowym Schenker (w języku niemieckim), a ceny odpowiadają kursowi wymiany dolar/euro w momencie przeprowadzania testów. Testowany przez nas model kosztował około 4000 dolarów. Modele klasy podstawowej (z RTX 4060) zaczynają się od około 2000 USD. Schenker podał, że będą one dostępne pod koniec czerwca (RTX 4090) i w połowie lipca (RTX 4060/70/80). Opcjonalne chłodzenie wodne będzie kosztować około 230 dolarów.
SCHENKER XMG Neo 16 (Early 24)
-
19/06/2024 v8 (new)
Sascha Mölck
 Total Sustainability Score:
 Transparency
The present review sample was made available to the author as a loan by the manufacturer or a shop for the purposes of review. The lender had no influence on this review, nor did the manufacturer receive a copy of this review before publication. There was no obligation to publish this review.
Pricecompare

