 Deutsch
 English
 Español
 Français
 Italiano
 Nederlands
 Polski
 Português
 Русский
 Türkçe
 Svenska
 Chinese
 Magyar
Recenzja laptopa Asus ROG Strix Scar 16 (2024): Ognista wydajność i blask mini LED w przystępnej cenie
 w recenzji")
Na targach CES 2024 firma Asus zmodernizowała całą swoją linię laptopów. Wśród wariantów do gier 2024, sprawdziliśmy ROG Zephyrus G14, ROG Zephyrus G16oraz ROG Strix Scar 18 do tej pory. Dziś przyjrzymy się nowemu modelowi ROG Strix Scar 16.
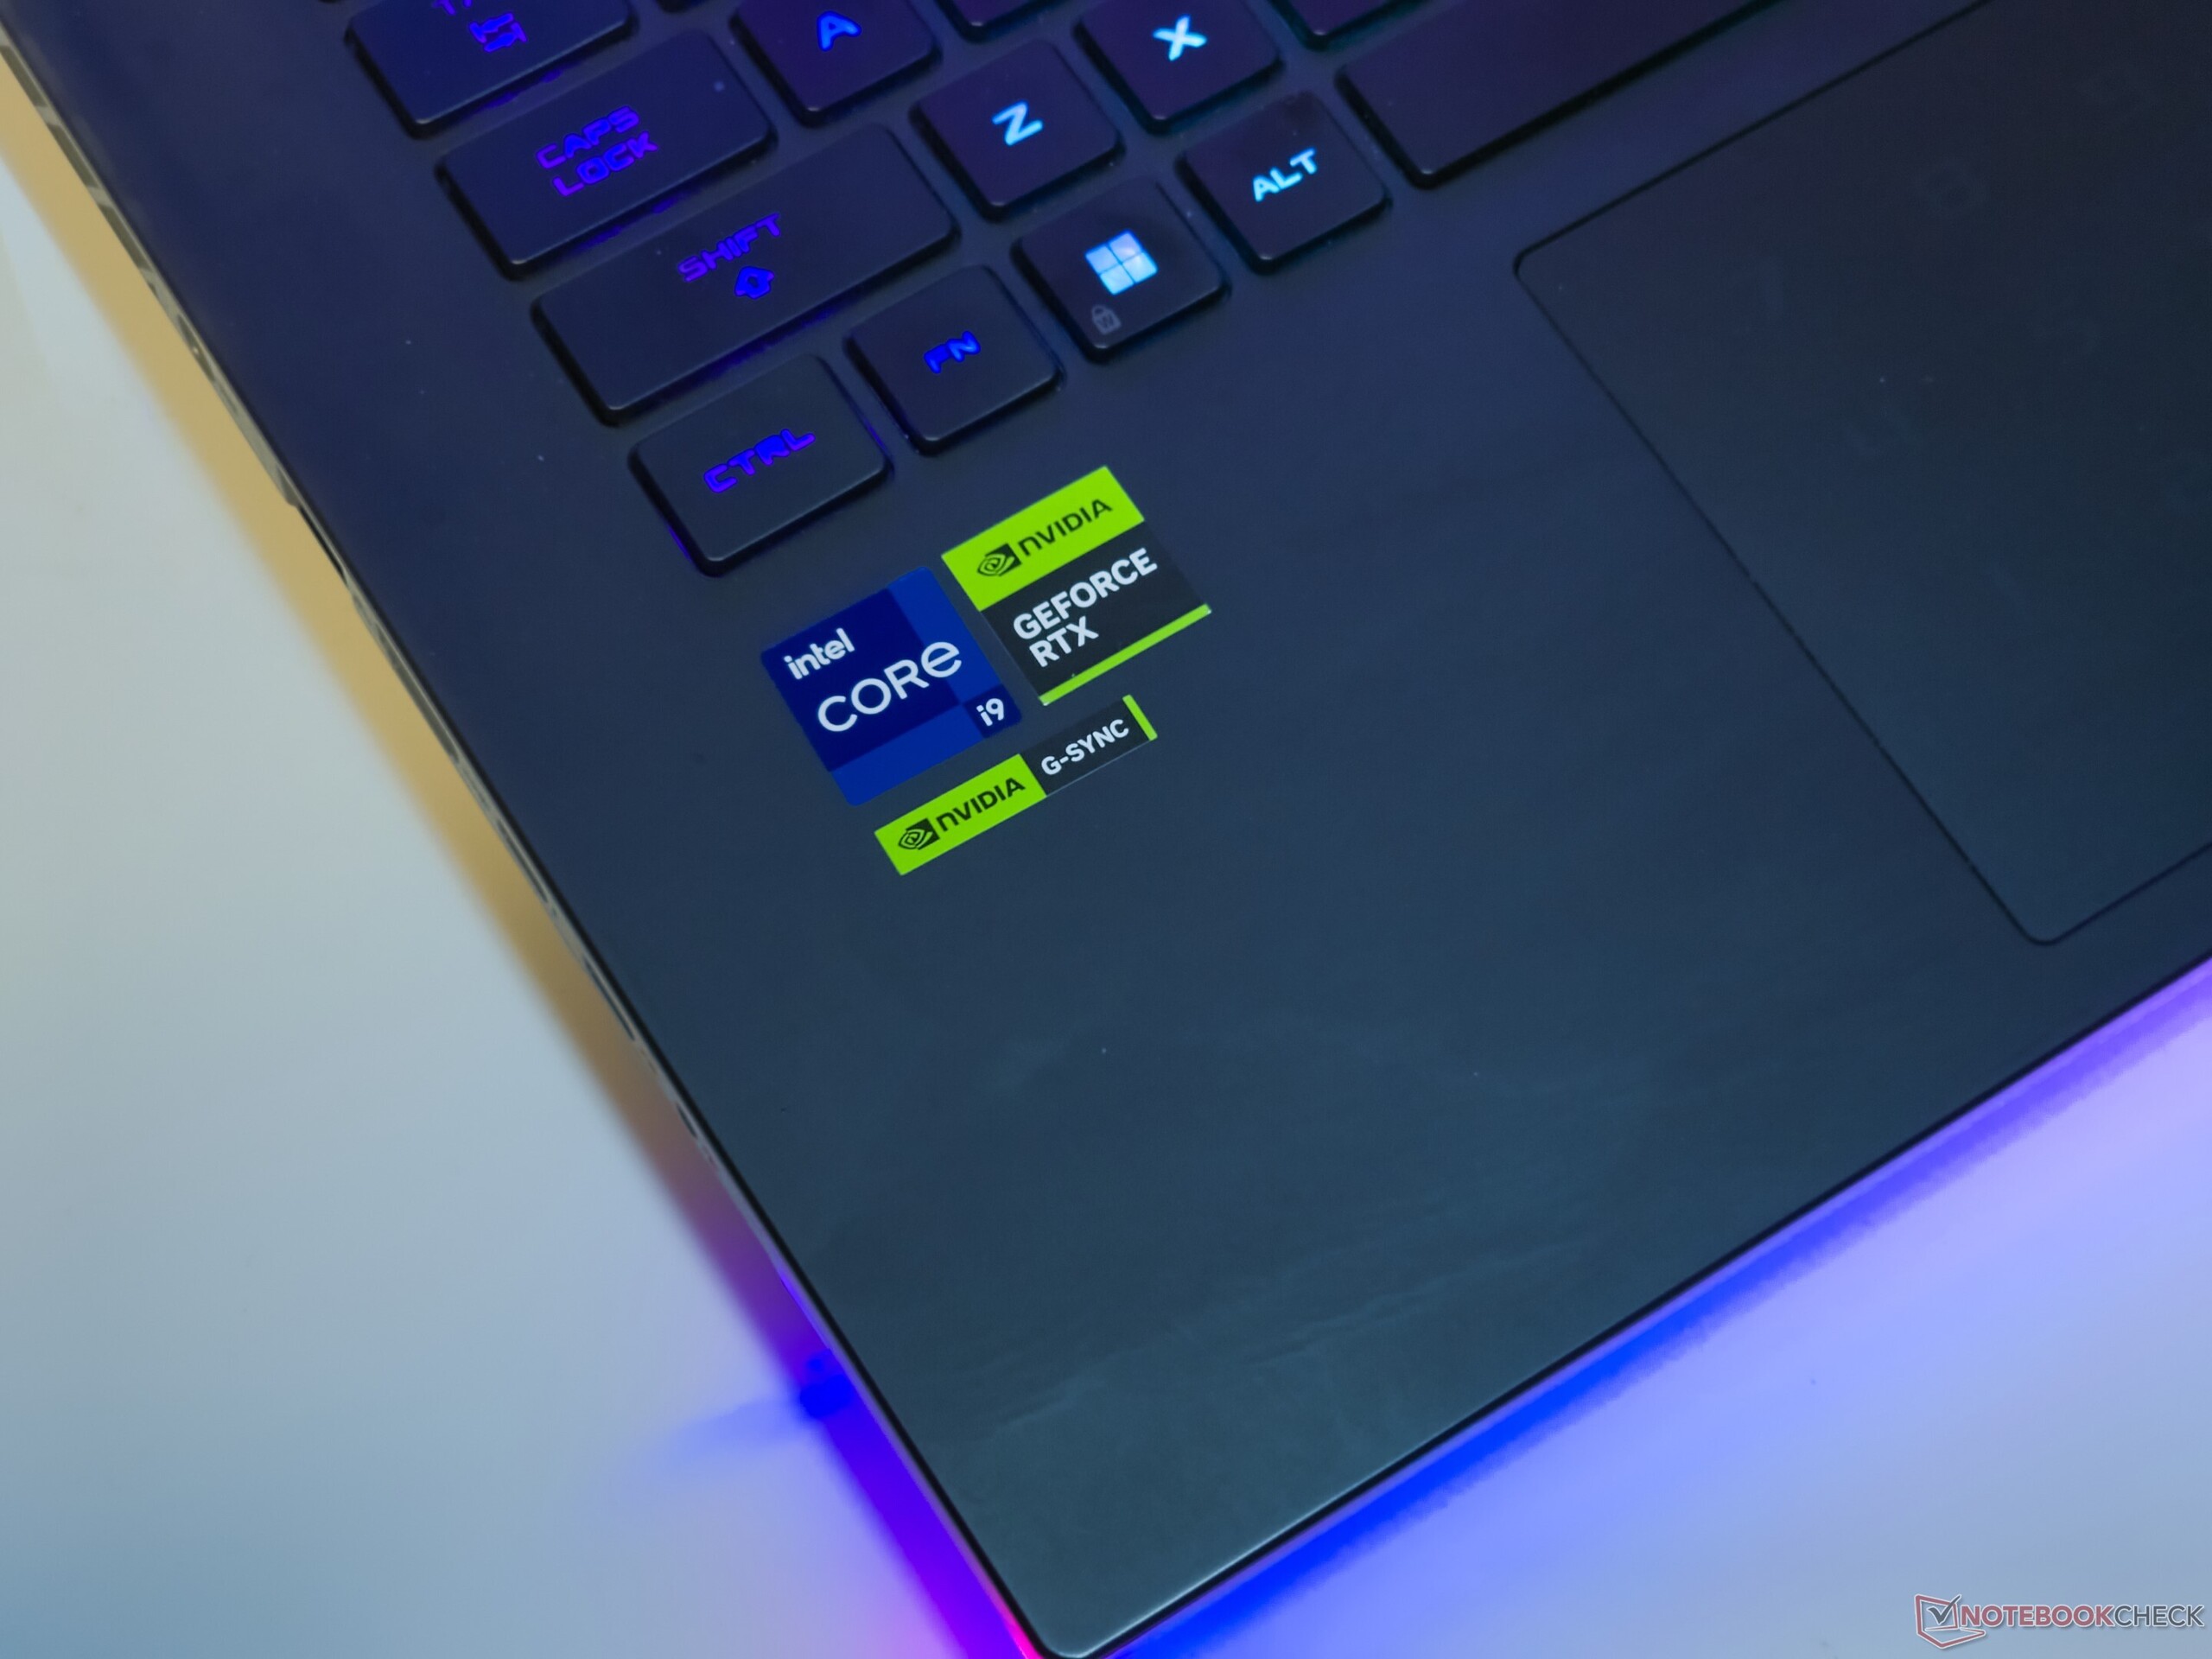
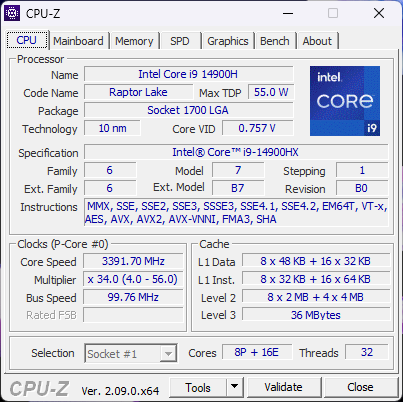
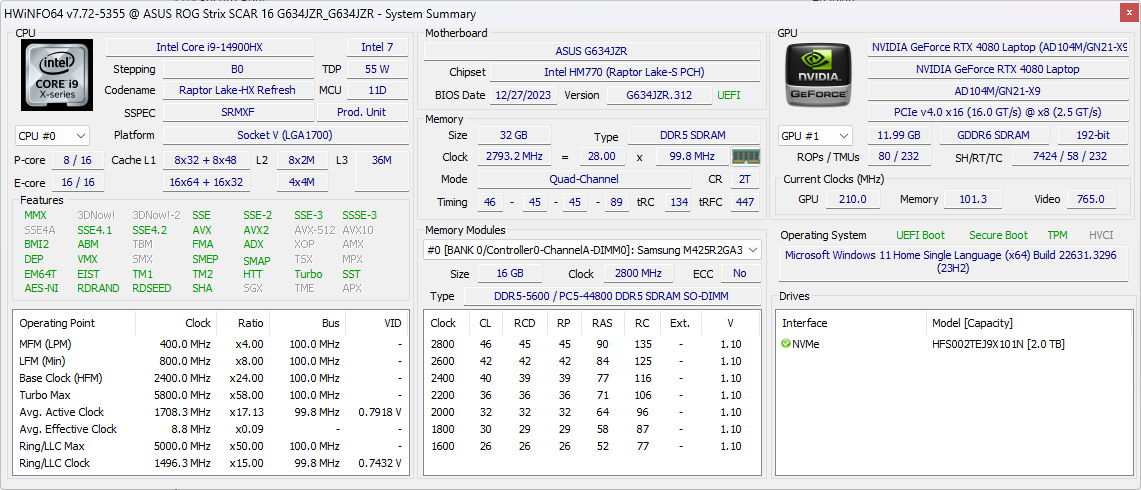
ROG Strix Scar 16 jest skierowany do graczy z wyższej półki i ma niezbędny sprzęt do uruchomienia. Nasze urządzenie testowe oparte jest na Intel Core i9-14900HX Raptor Lake-HX uzupełniony o 175 W procesor Karta graficzna Nvidia GeForce RTX 4080 Laptop GPU.
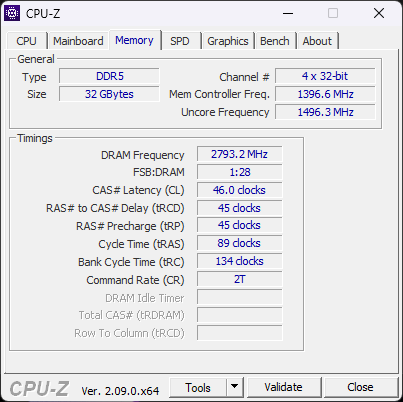
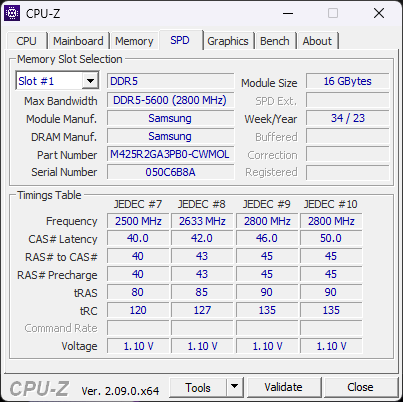
Inne warte uwagi specyfikacje obejmują 32 GB pamięci RAM DDR5-5600, 2 TB NVMe SSD i wyświetlacz QHD + 240 Hz mini-LED G-Sync, które razem nie mają żadnych skrupułów, by zrobić dziurę w portfelu w wysokości 2 89 990 ₹ (~ 3 473 USD).
Potencjalni konkurenci w porównaniu
Rating | Date | Model | Weight | Height | Size | Resolution | Best Price |
|---|---|---|---|---|---|---|---|
| 87.6 % | 04/2024 | Asus ROG Strix Scar 16 G634JZR i9-14900HX, NVIDIA GeForce RTX 4080 Laptop GPU | 2.7 kg | 30.4 mm | 16.00" | 2560x1600 | |
| 87.2 % | 08/2023 | Asus ROG Strix Scar 17 G733PYV-LL053X R9 7945HX3D, NVIDIA GeForce RTX 4090 Laptop GPU | 2.9 kg | 28.3 mm | 17.30" | 2560x1440 | |
| 88.4 % | 03/2023 | Asus ROG Strix G16 G614JZ i9-13980HX, NVIDIA GeForce RTX 4080 Laptop GPU | 2.4 kg | 30.4 mm | 16.00" | 2560x1600 | |
| 89.5 % | 03/2024 | Lenovo Legion Pro 7 16IRX9H i9-14900HX, NVIDIA GeForce RTX 4080 Laptop GPU | 2.7 kg | 21.95 mm | 16.00" | 2560x1600 | |
| 86.7 % | 02/2024 | HP Omen 16 (2024) i9-14900HX, NVIDIA GeForce RTX 4080 Laptop GPU | 2.4 kg | 23.5 mm | 16.10" | 2560x1440 | |
| 88 % | 02/2024 | MSI Vector 16 HX A14V i9-14900HX, NVIDIA GeForce RTX 4080 Laptop GPU | 2.7 kg | 28.55 mm | 16.00" | 2560x1600 | |
| 90.2 % | 03/2024 | Alienware m16 R2 Ultra 7 155H, NVIDIA GeForce RTX 4070 Laptop GPU | 2.5 kg | 23.5 mm | 16.00" | 2560x1600 |
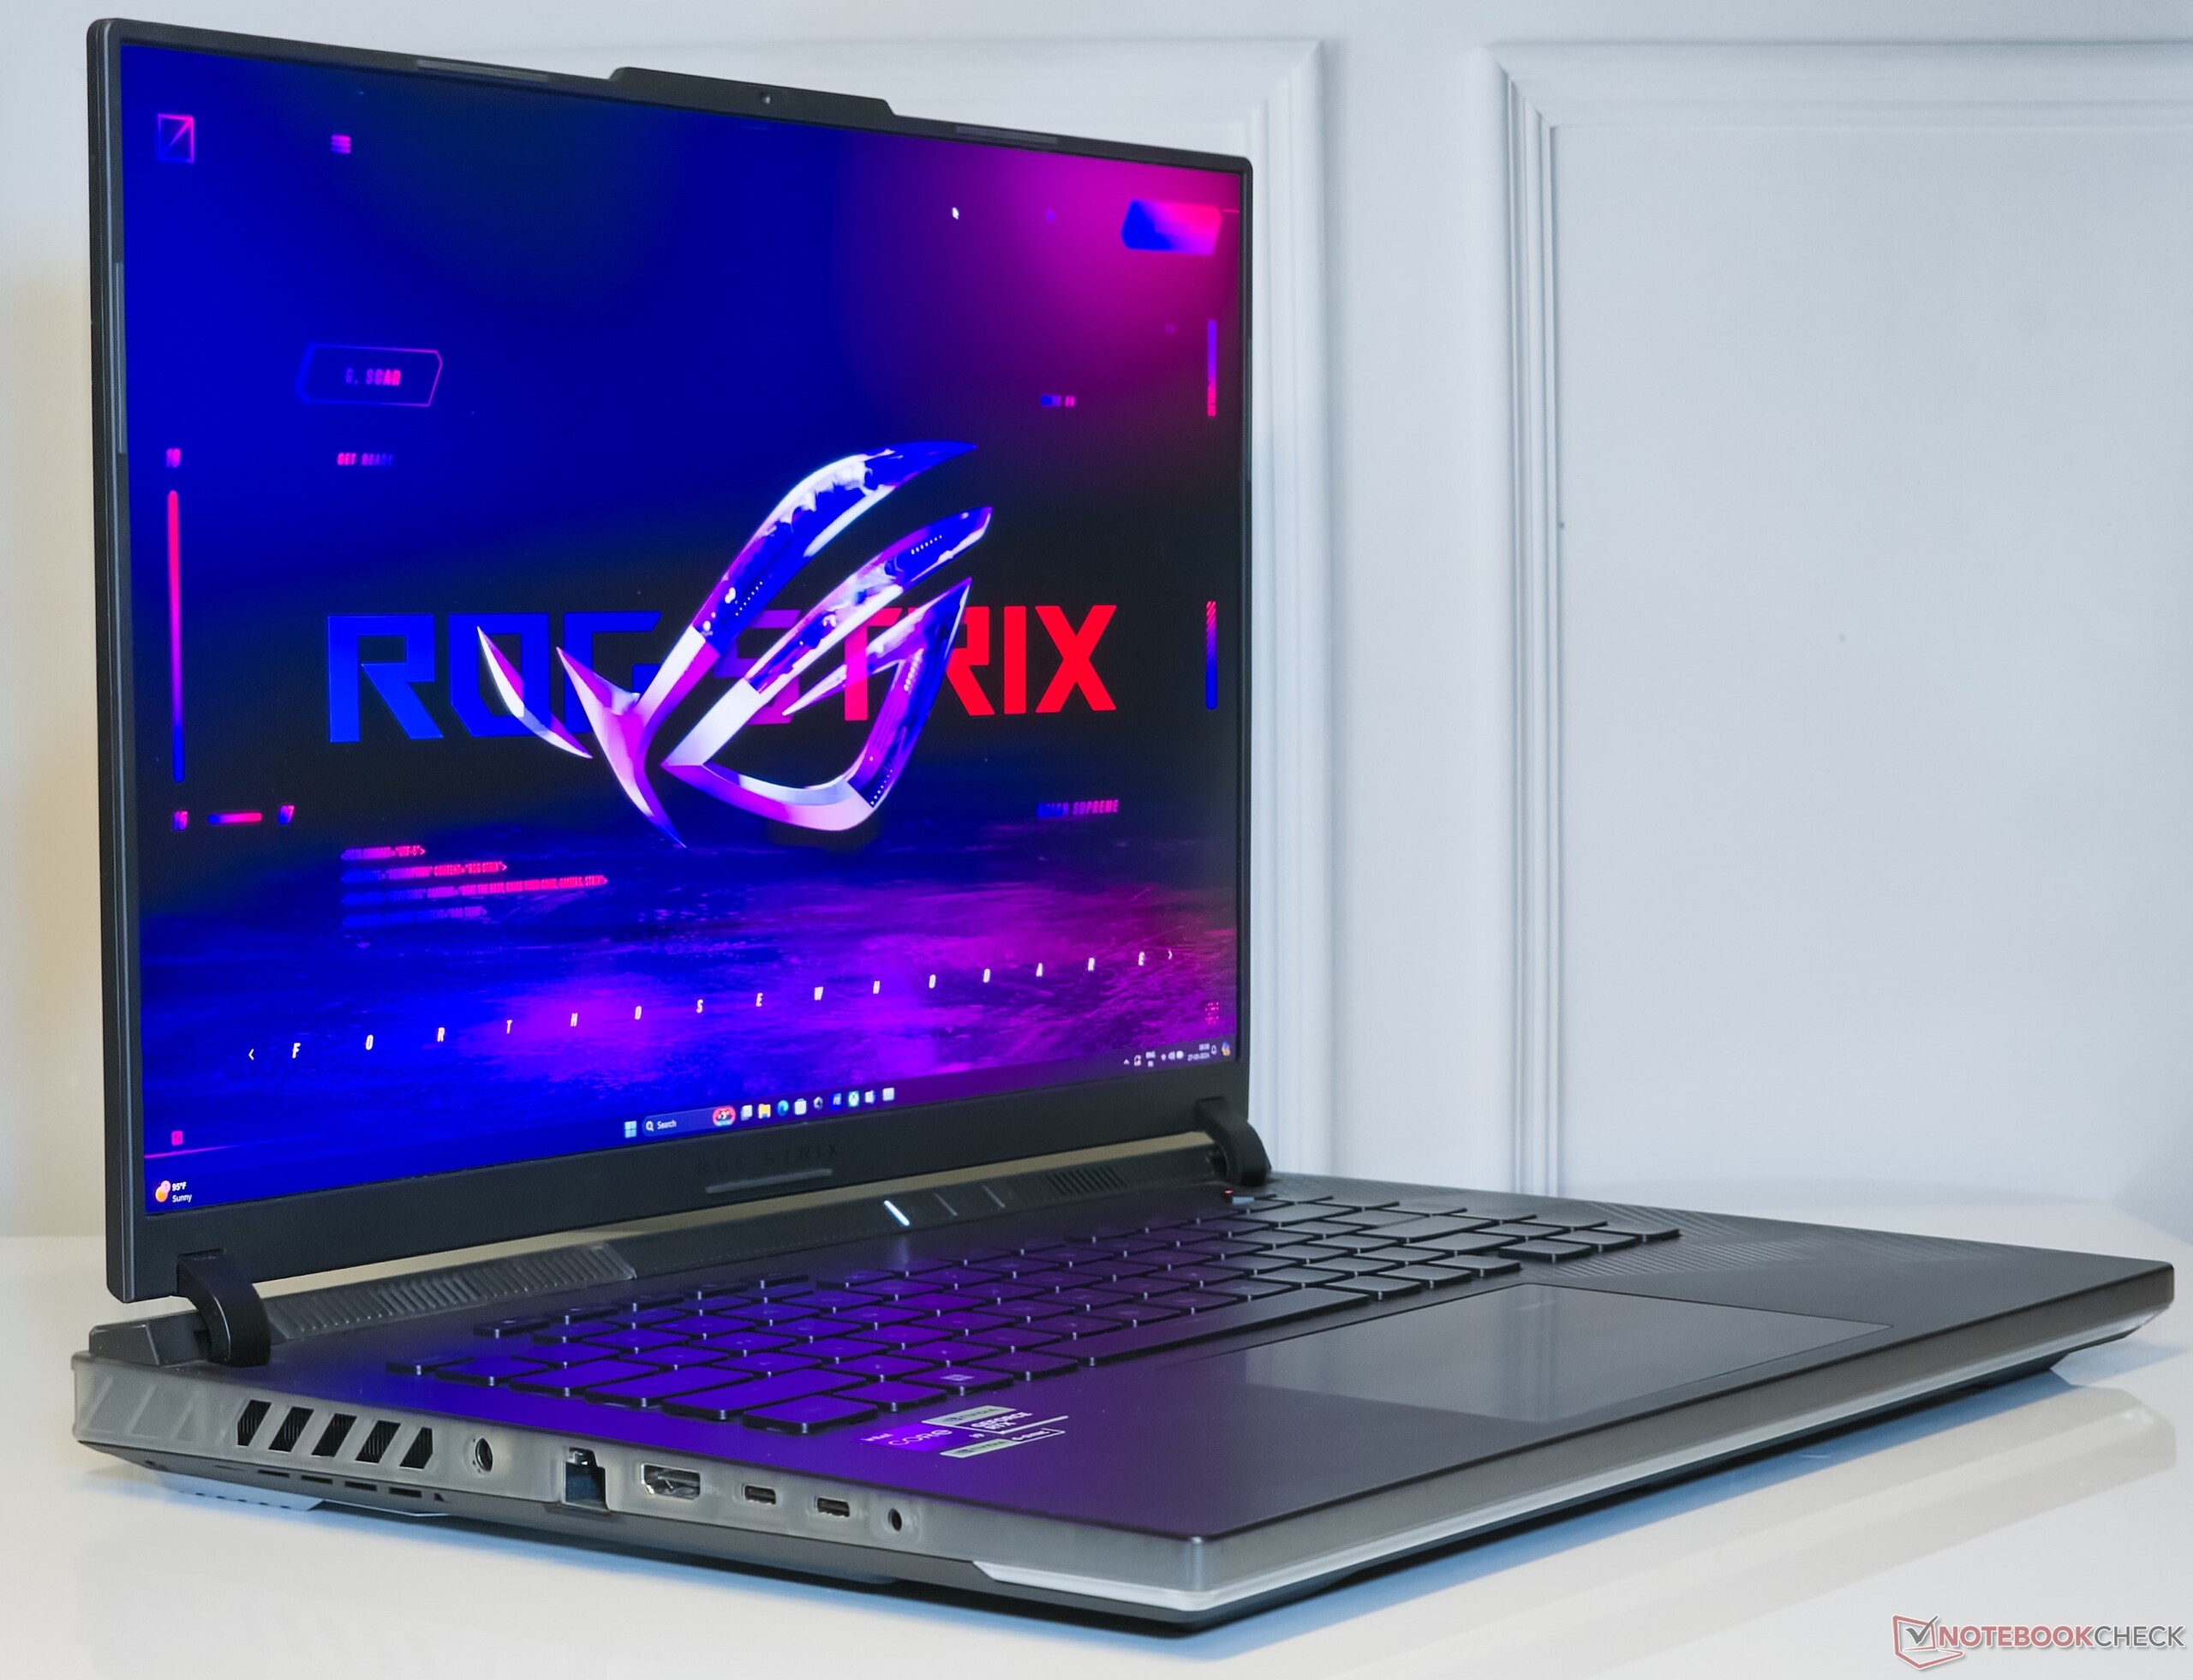
Podwozie: Głównie plastikowe z półprzezroczystym peek-a-boo
Tegoroczny ROG Strix Scar 16 ma znajomy język projektowania, który widzieliśmy już wcześniej w przypadku scar 15 z 2022 r ale jest teraz o 350 g cięższy i waży 2,65 kg.
Obudowa nie ugina się, mimo że jest wykonana z tworzywa sztucznego. Aluminiowa pokrywa z matowym wykończeniem wydawała się również dość solidna ze stabilnymi zawiasami.
Pokrywę można otworzyć jednym palcem bez przesuwania laptopa po biurku, czemu dodatkowo zapobiega gumowana podstawa.
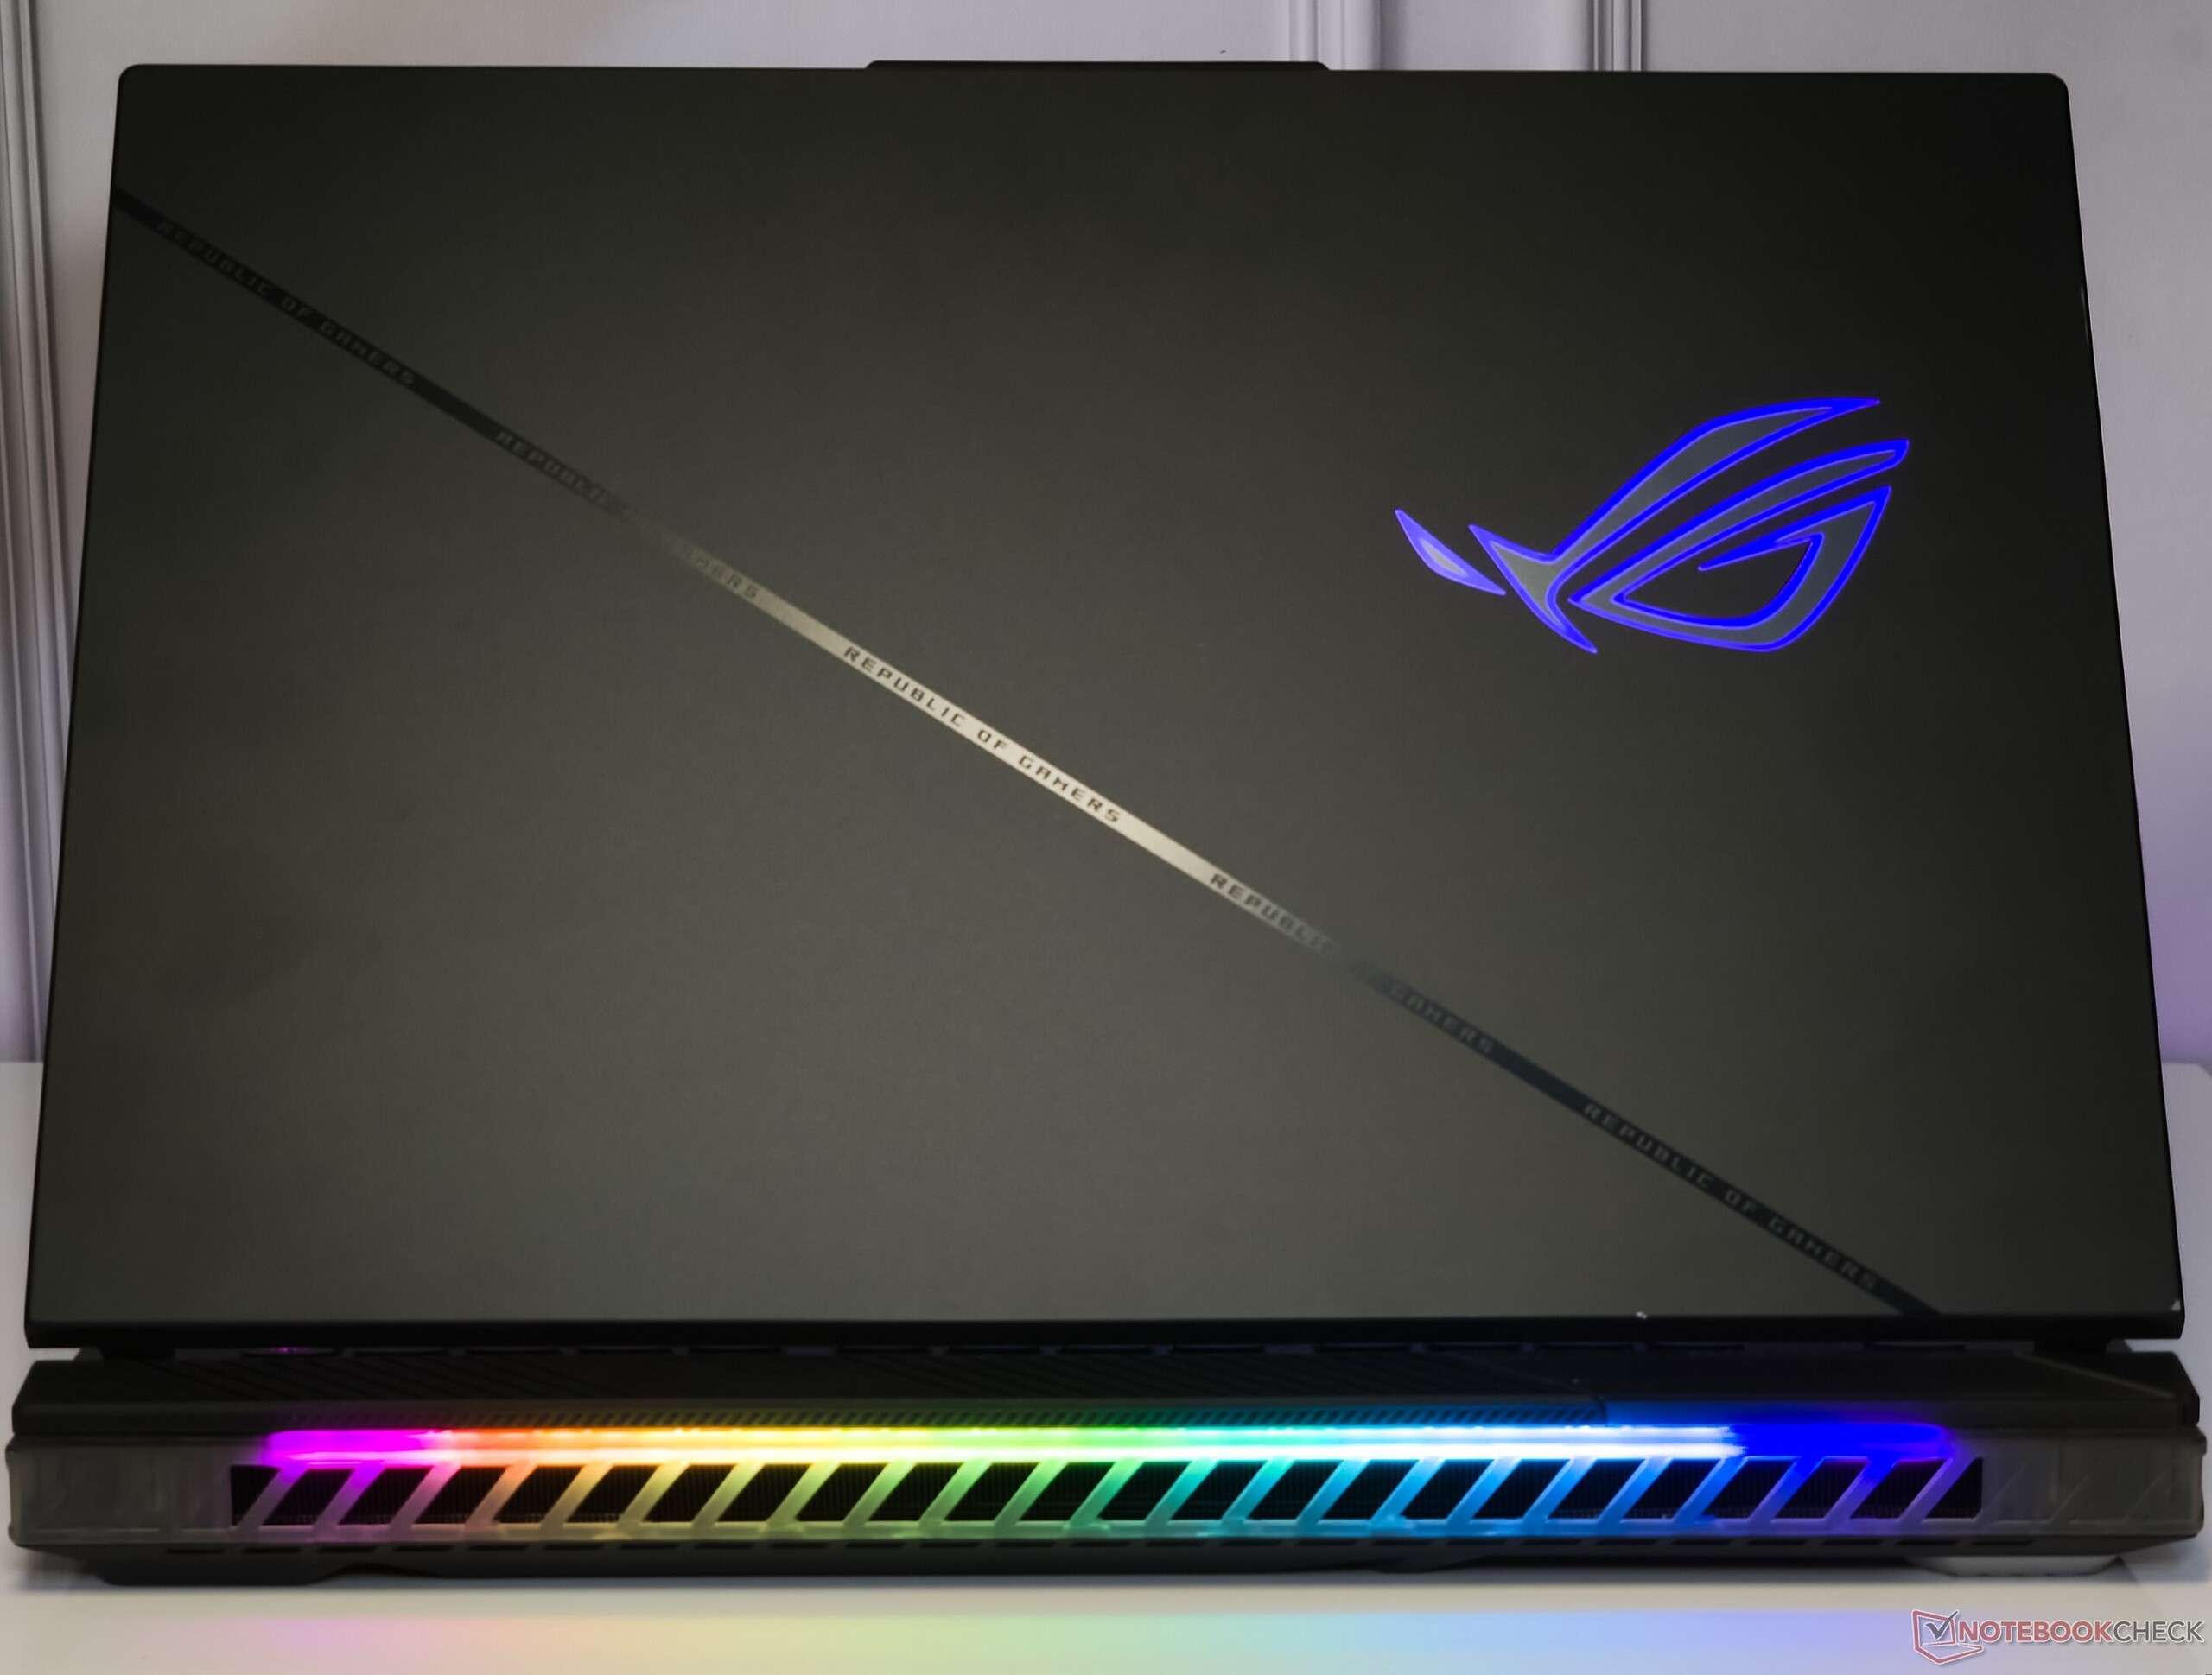
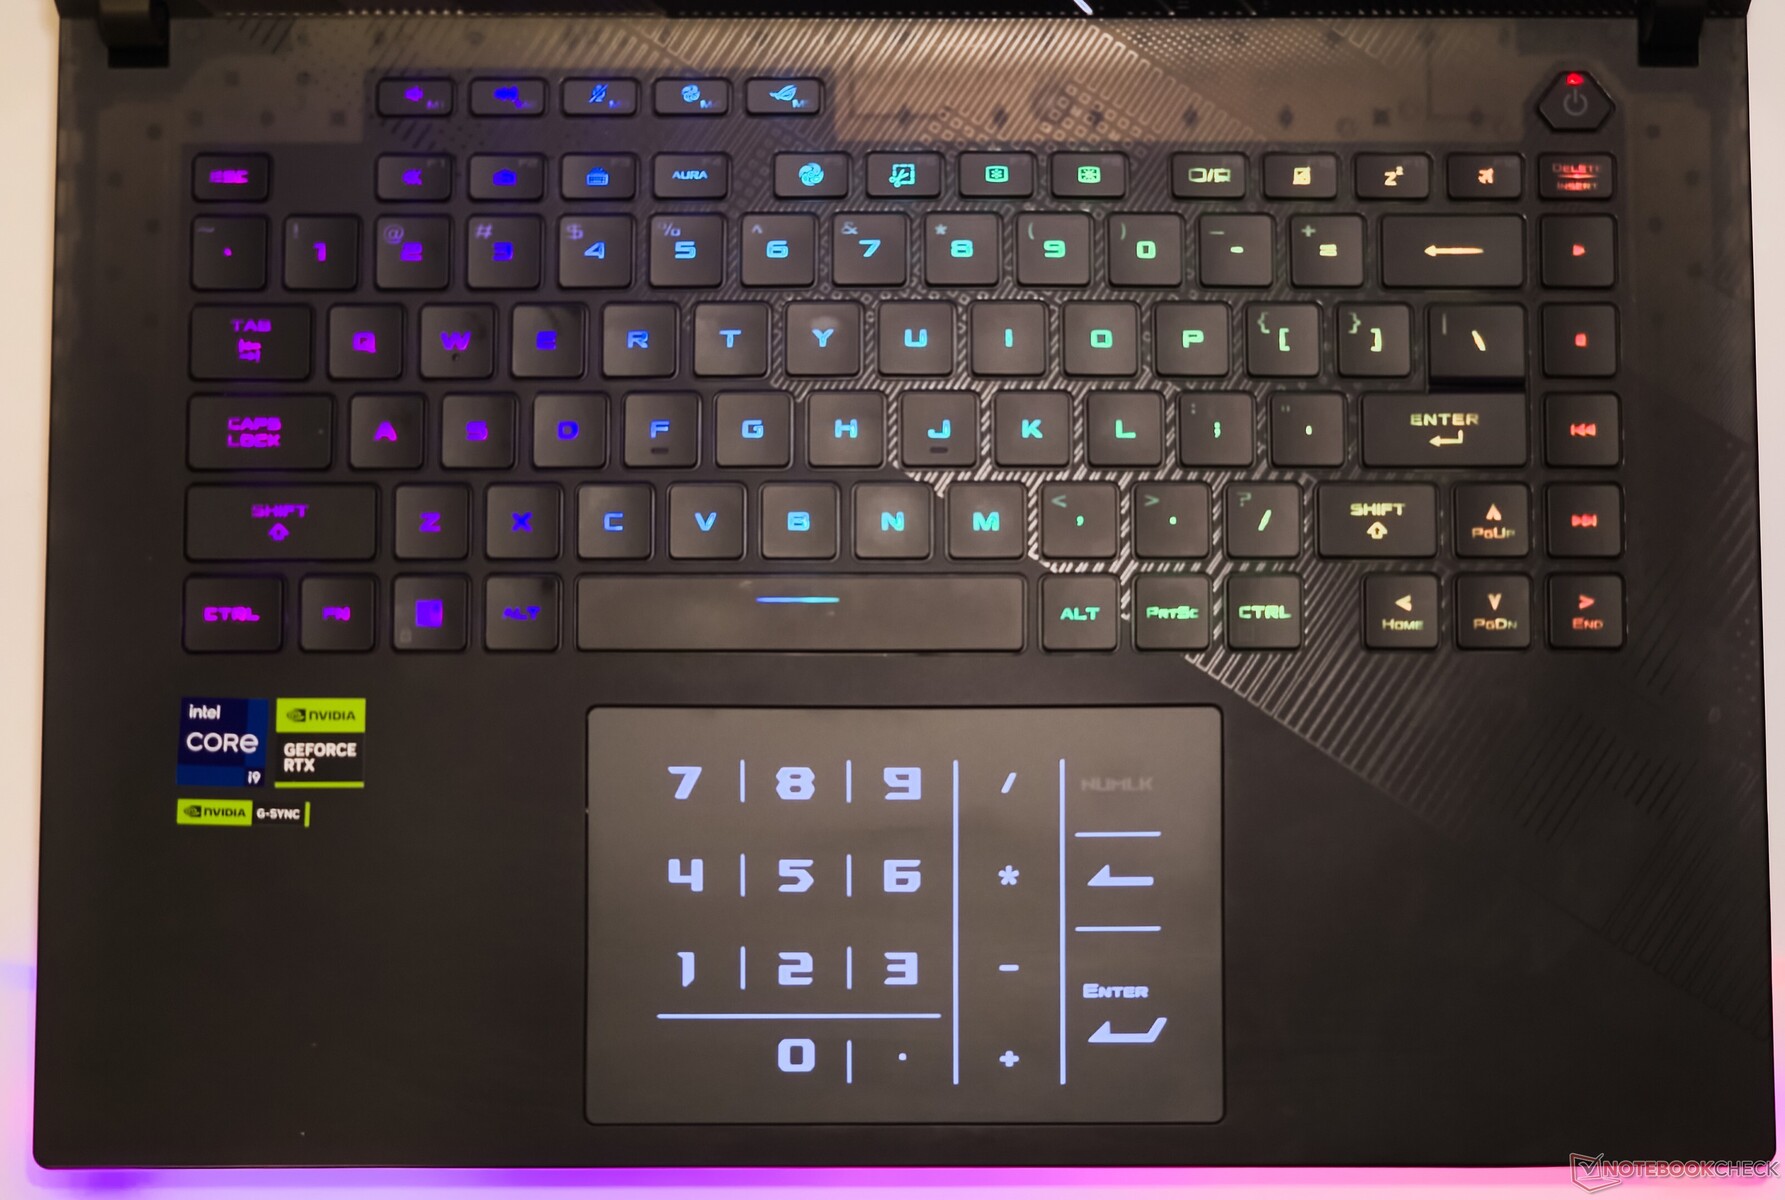
Uważni obserwatorzy serii Scar zauważą, że na klawiaturze nie ma już białego ukośnego paska z logo ROG.
Górna część klawiatury pozostaje półprzezroczysta jak poprzednio, oferując wgląd w znajdujące się pod nią elementy wewnętrzne. Asus zrobił jednak niewiele, aby uczynić klawiaturę odporną na odciski palców i tłuszcz.
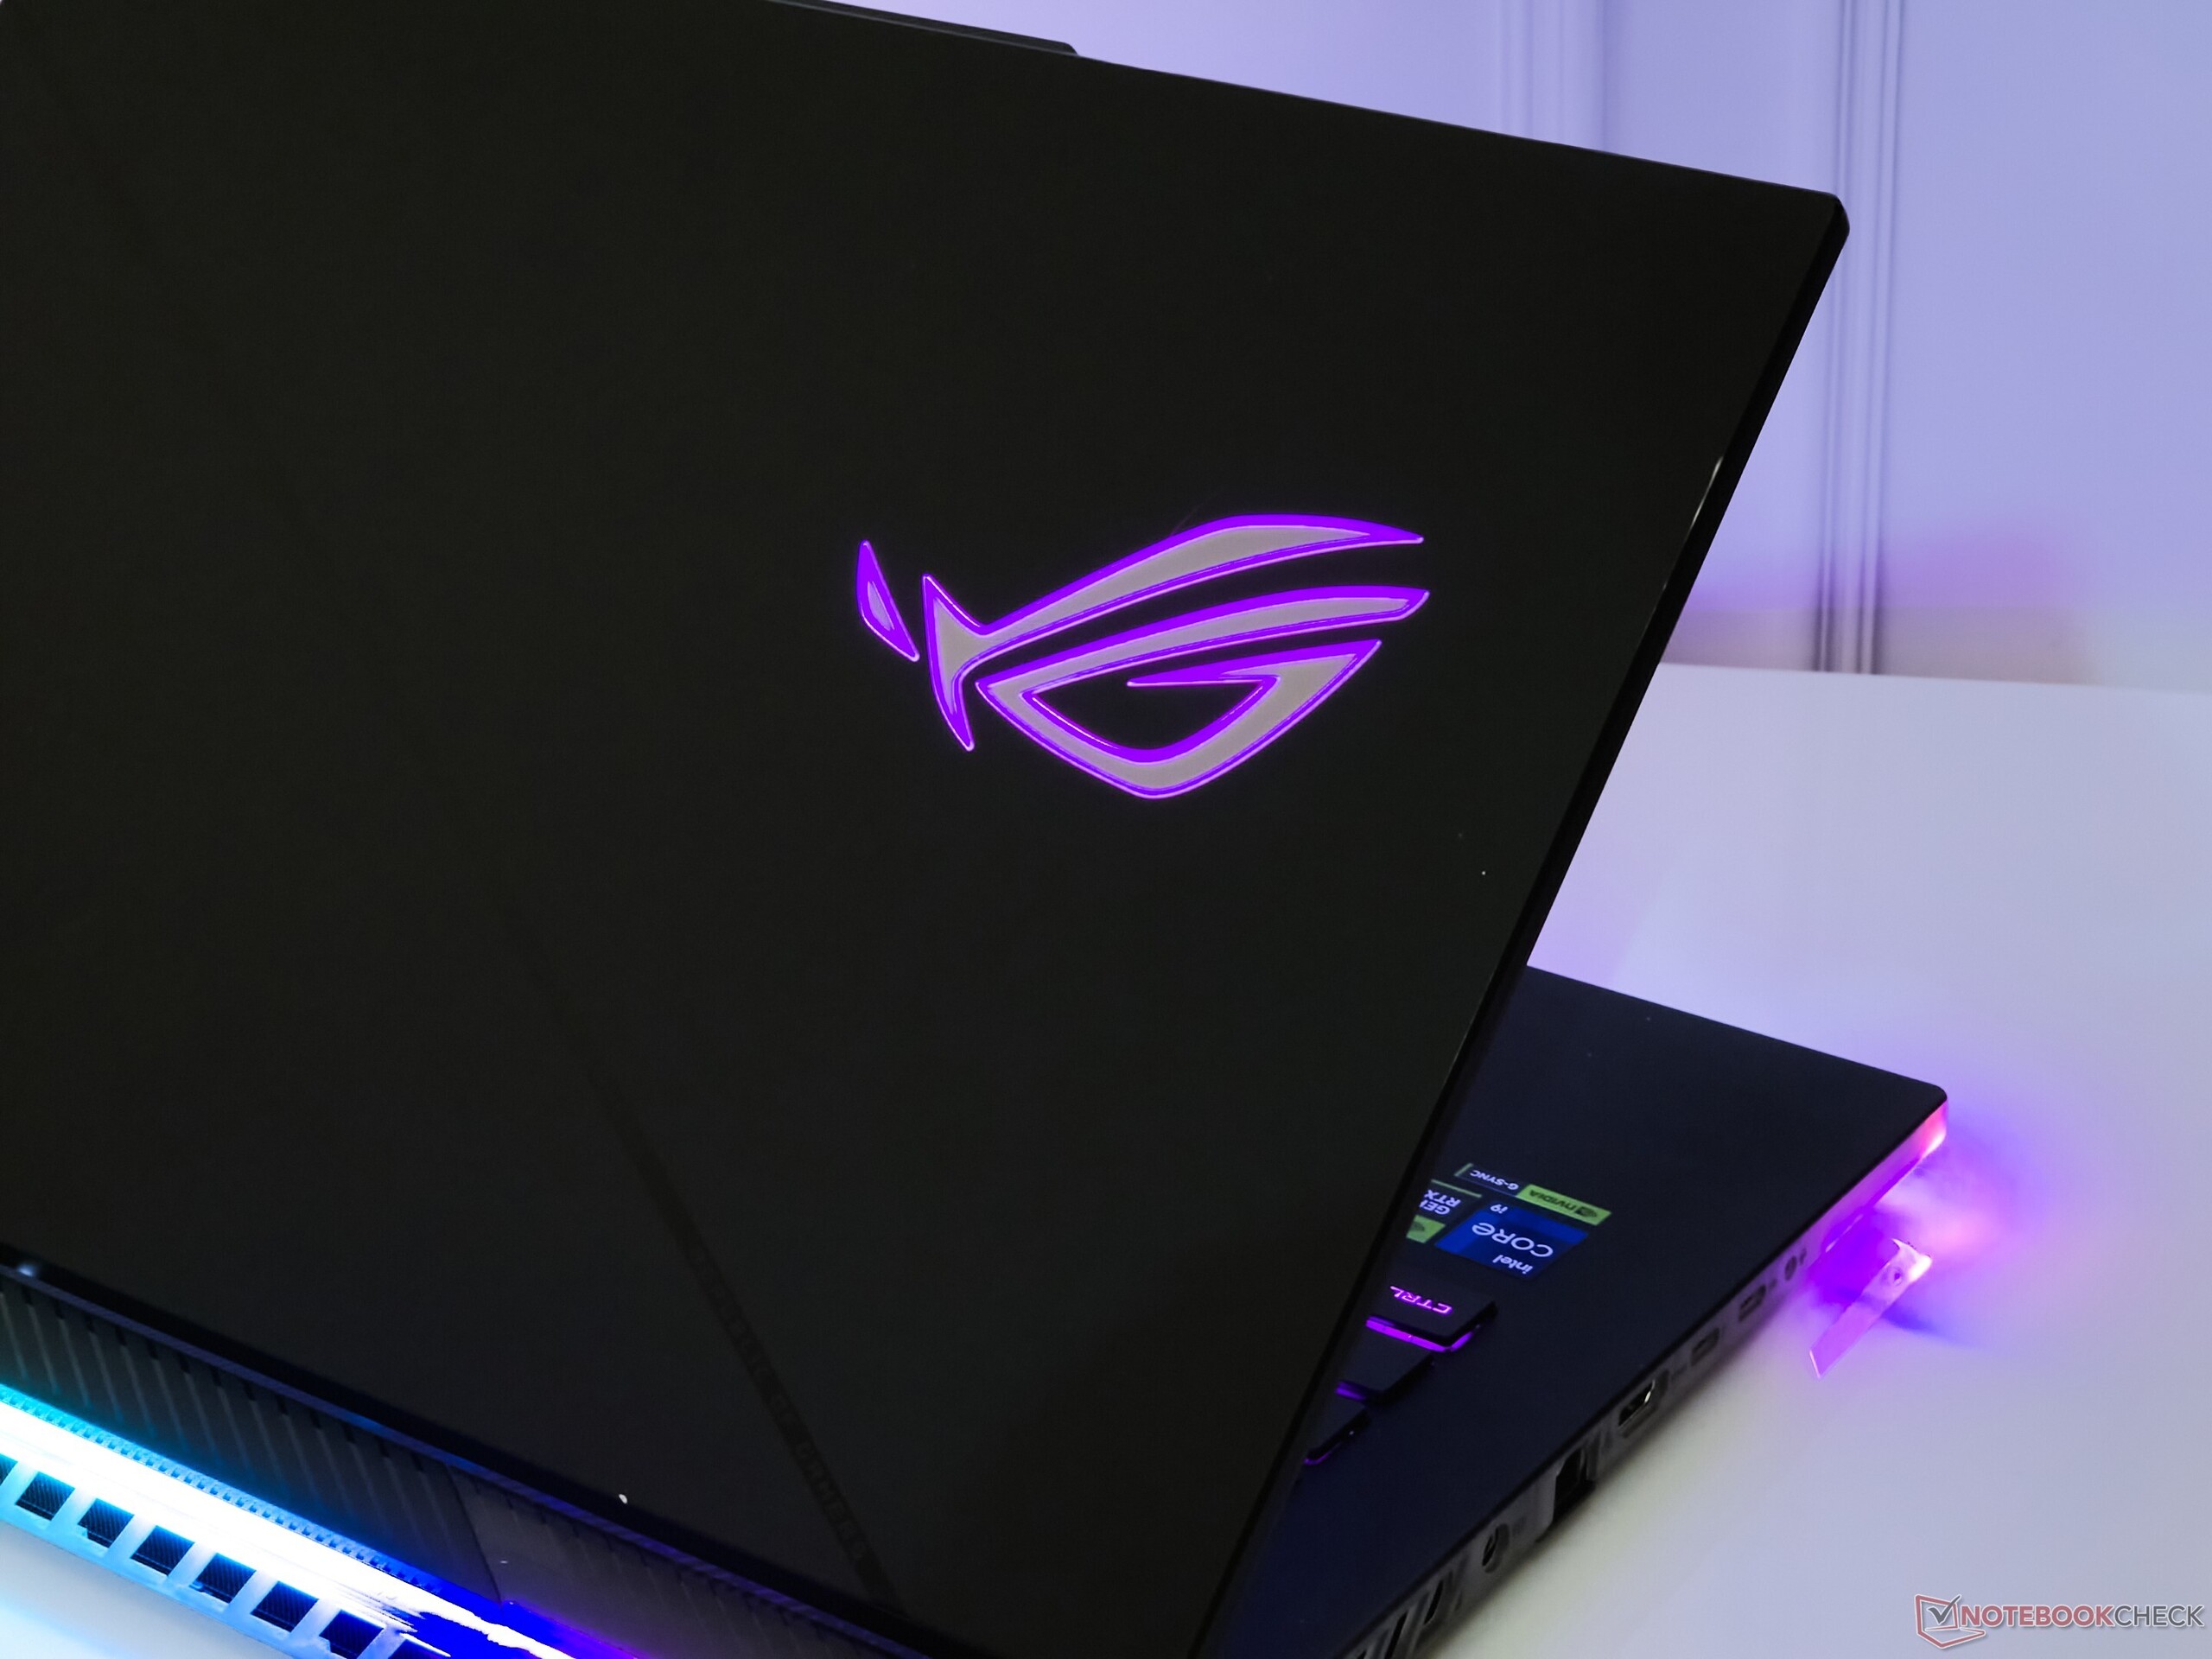
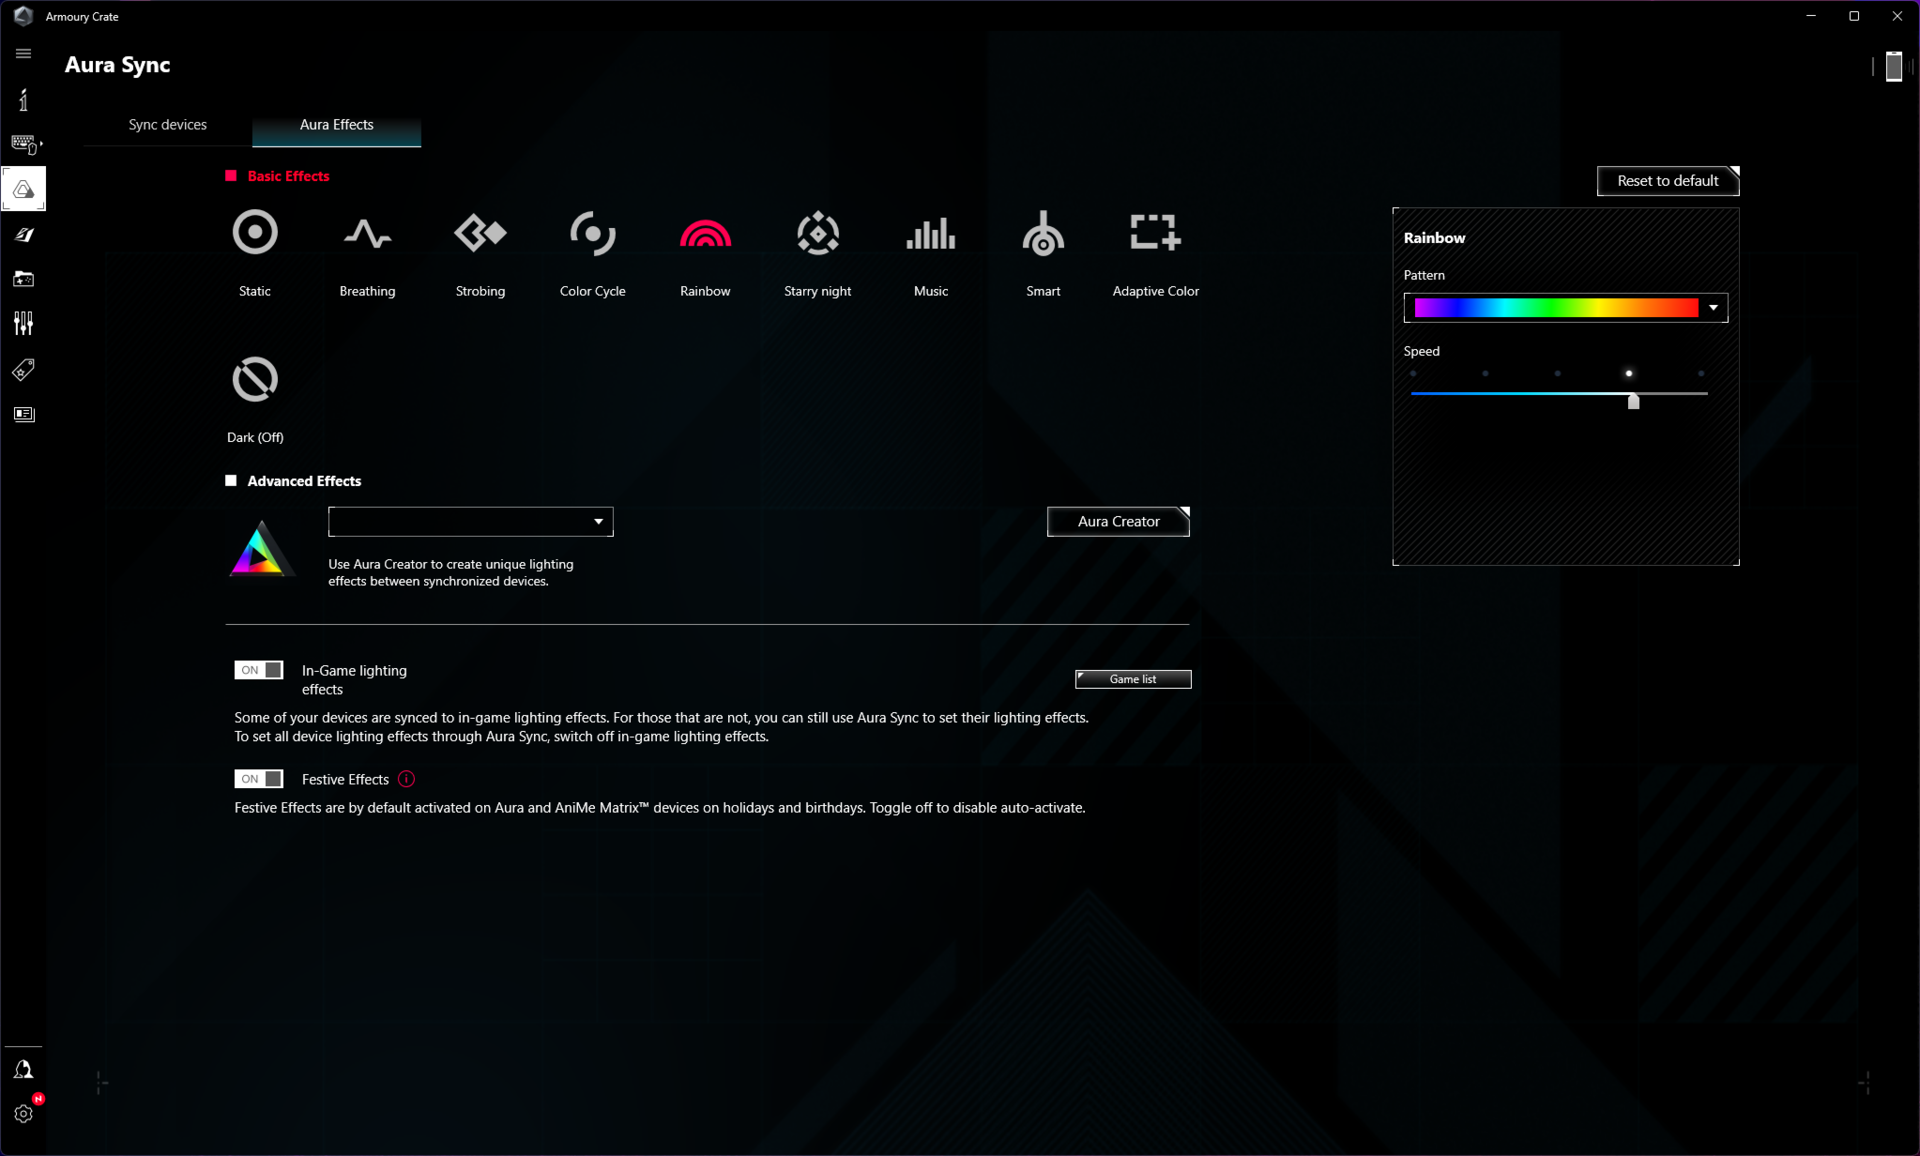
Klawiatura Scar 16, podstawa, tył i logo ROG są podświetlone w kolorach RGB, które można kontrolować i dostosowywać za pomocą Armory Crate. Nie ma jednak widocznego sposobu na indywidualne podświetlenie tych obszarów - albo wszystkie RGB, albo żadne.
Zgodnie z etosem Scar, Asus pozwala na niestandardowe projektowanie i drukowanie 3D ROG Armor caps dla odrobiny personalizacji.
Łączność: Przeciętne Wi-Fi 5 i zasilanie USB 100 W
ROG Strix Scar 16 wykorzystuje ten sam układ portów i funkcjonalność, co zeszłoroczna iteracja. Asus nie oferuje już ROG Keystone, który od dawna był cechą charakterystyczną serii Scar, niezależnie od jego wątpliwej użyteczności.
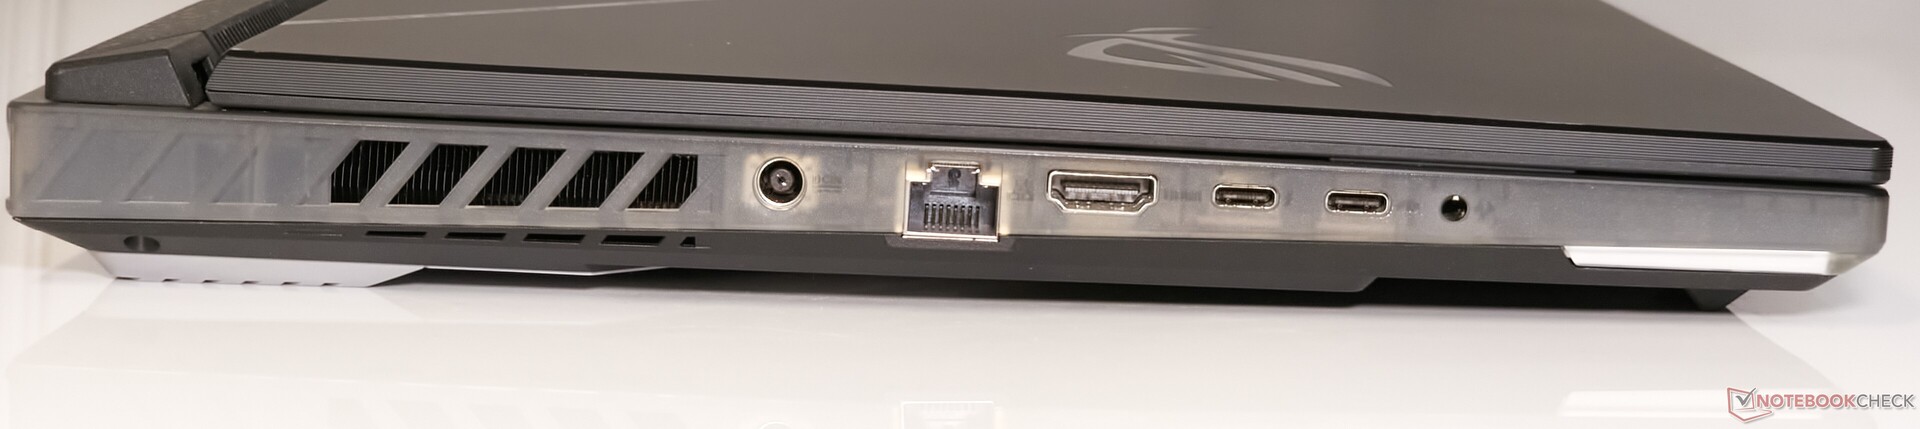
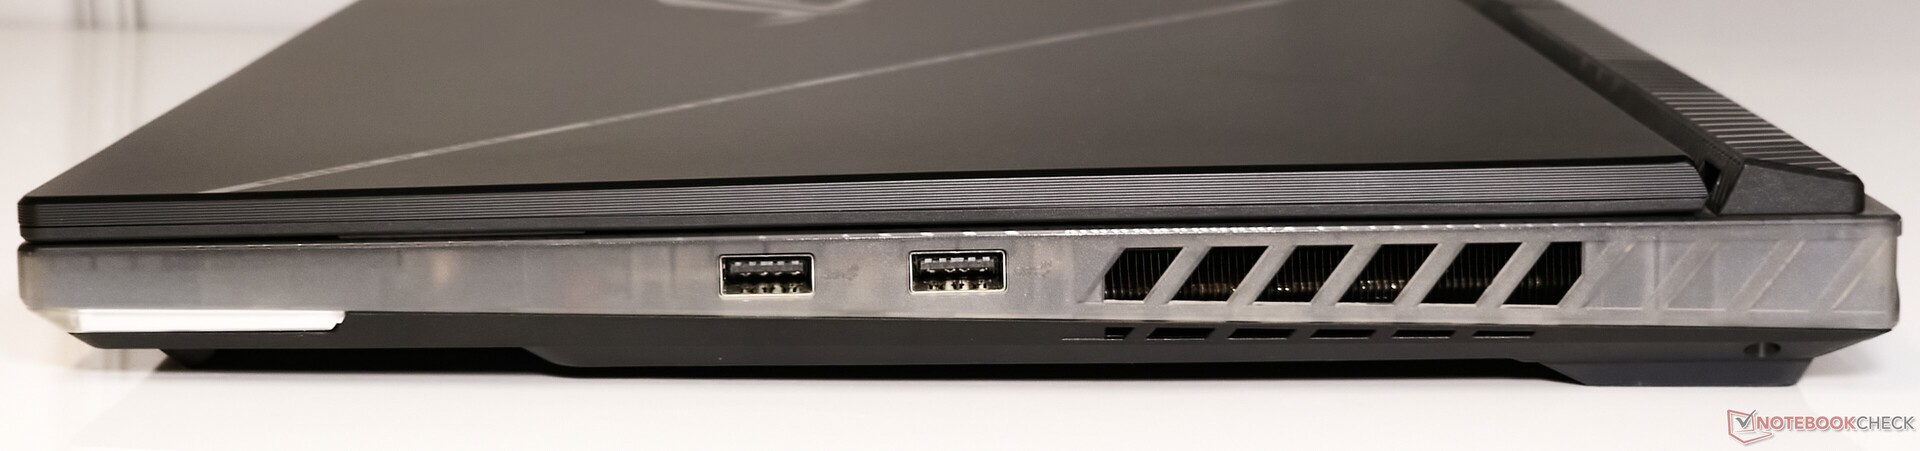
Rozmieszczenie portów jest nierównomierne. Z wyjątkiem dwóch portów USB 3.2 Gen2 Type-A po prawej stronie, wszystkie dodatkowe porty znajdują się po lewej stronie. Porty są jednak wygodnie rozmieszczone i nie stanowią przeszkody w podłączaniu wielu urządzeń peryferyjnych.
Dostępne są dwa porty USB Type-C, z których jeden to Thunderbolt 4. Port Thunderbolt 4 umożliwia wyjście DisplayPort 1.4, ale nie umożliwia ładowania. Z kolei port USB 3.2 Gen2 Type-C oferuje nie tylko wyjście DisplayPort, ale także 100 W mocy.
Tył jest w pełni zarezerwowany na umieszczenie aparatu chłodzącego i jako taki jest pozbawiony jakichkolwiek portów.
Komunikacja
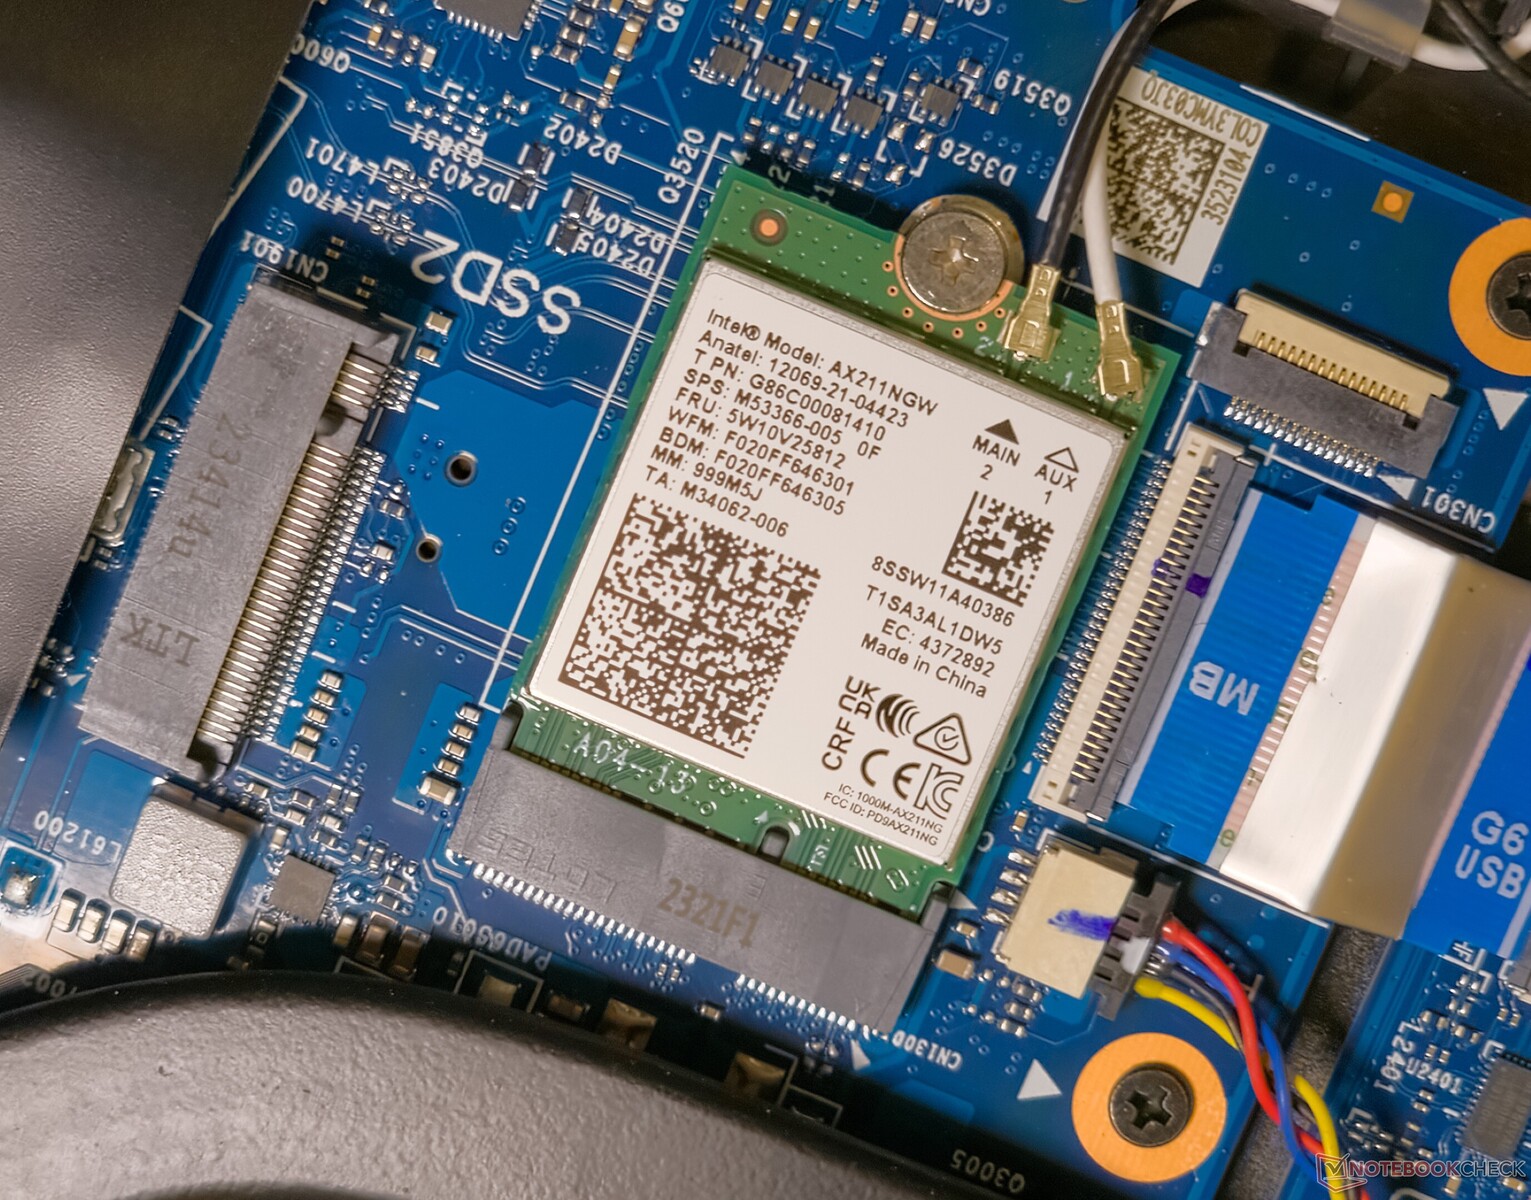
Laptopy w 2024 roku powoli podążają za trendem Wi-Fi 7, choć wsparcie dla tego standardu ma pojawić się dopiero, gdy system Windows 11 24H2 zacznie być wdrażany jeszcze w tym roku. Scar 16 radzi sobie zatem ze zwykłym układem Intel Wi-Fi AX211.
Testy Scar 16 z naszym referencyjnym routerem Asus ROG Rapture GT-AXE11000 wykazały stosunkowo niższą przepustowość w paśmie Wi-Fi 5 w porównaniu do konkurencji. Wydajność jest jednak dość stabilna, bez większych spadków prędkości.
Wydajność w Wi-Fi 6E była znacznie lepsza z prędkościami nadawania i odbioru odpowiednio do 1,5 Gb/s i 1,74 Gb/s, ale zaobserwowaliśmy chwilowe dławienie podczas testu nadawania.
| Networking / iperf3 transmit AXE11000 | |
| Asus ROG Strix G16 G614JZ | |
| HP Omen 16 (2024) | |
| Lenovo Legion Pro 7 16IRX9H | |
| Average of class Gaming (469 - 1793, n=152, last 2 years) | |
| Average Intel Wi-Fi 6E AX211 (464 - 1861, n=188) | |
| Alienware m16 R2 | |
| MSI Vector 16 HX A14V | |
| Asus ROG Strix Scar 16 G634JZR | |
| Networking / iperf3 receive AXE11000 | |
| HP Omen 16 (2024) | |
| Lenovo Legion Pro 7 16IRX9H | |
| Asus ROG Strix G16 G614JZ | |
| Average of class Gaming (685 - 1890, n=158, last 2 years) | |
| Average Intel Wi-Fi 6E AX211 (582 - 1890, n=188) | |
| MSI Vector 16 HX A14V | |
| Alienware m16 R2 | |
| Asus ROG Strix Scar 16 G634JZR | |
| Networking / iperf3 transmit AXE11000 6GHz | |
| Asus ROG Strix Scar 16 G634JZR | |
| Average of class Gaming (648 - 1878, n=77, last 2 years) | |
| MSI Vector 16 HX A14V | |
| Alienware m16 R2 | |
| Average Intel Wi-Fi 6E AX211 (632 - 1851, n=174) | |
| Networking / iperf3 receive AXE11000 6GHz | |
| Asus ROG Strix Scar 16 G634JZR | |
| Average of class Gaming (853 - 1857, n=79, last 2 years) | |
| Average Intel Wi-Fi 6E AX211 (883 - 1857, n=173) | |
| Alienware m16 R2 | |
| MSI Vector 16 HX A14V | |
Kamera internetowa
W przeciwieństwie do Scar 15, który zawierał zewnętrzną kamerę internetową ROG Eye 1080p jako akcesorium w skrzynce odbiorczej, Scar 16 zadowala się konwencjonalnym zintegrowanym czujnikiem 720p.
Jakość obrazu nie jest wyjątkowa pod żadnym względem, ale pozwala na okazjonalną rozmowę wideo lub dwie. Obserwujemy duże odchylenia kolorów w odcieniach niebieskiego, a ogólna ostrość nie wydaje się odpowiednia.


Bezpieczeństwo
Scar 16 nie posiada żadnej formy uwierzytelniania biometrycznego. Moduł TPM 2.0 jest obecny, aby spełnić wymagania systemu Windows 11.
Akcesoria i gwarancja
W pudełku znajduje się konfigurowalna czapka pancerza. Poza nią nie ma żadnych innych akcesoriów.
Asus oferuje standardową roczną gwarancję na Scar 16 w Indiach. Przedłużenie gwarancji można nabyć za pośrednictwem preinstalowanej aplikacji MyAsus w ciągu 180 dni od zakupu.
Kupujący mogą również wybierać spośród kilku opcji gwarancji https://asuspromo.in/terms od ₹999 (12 USD) za roczne przedłużenie do ₹4,999 (60 USD), które obejmuje dwuletnie przedłużenie i trzyletnią ochronę przed przypadkowymi uszkodzeniami.
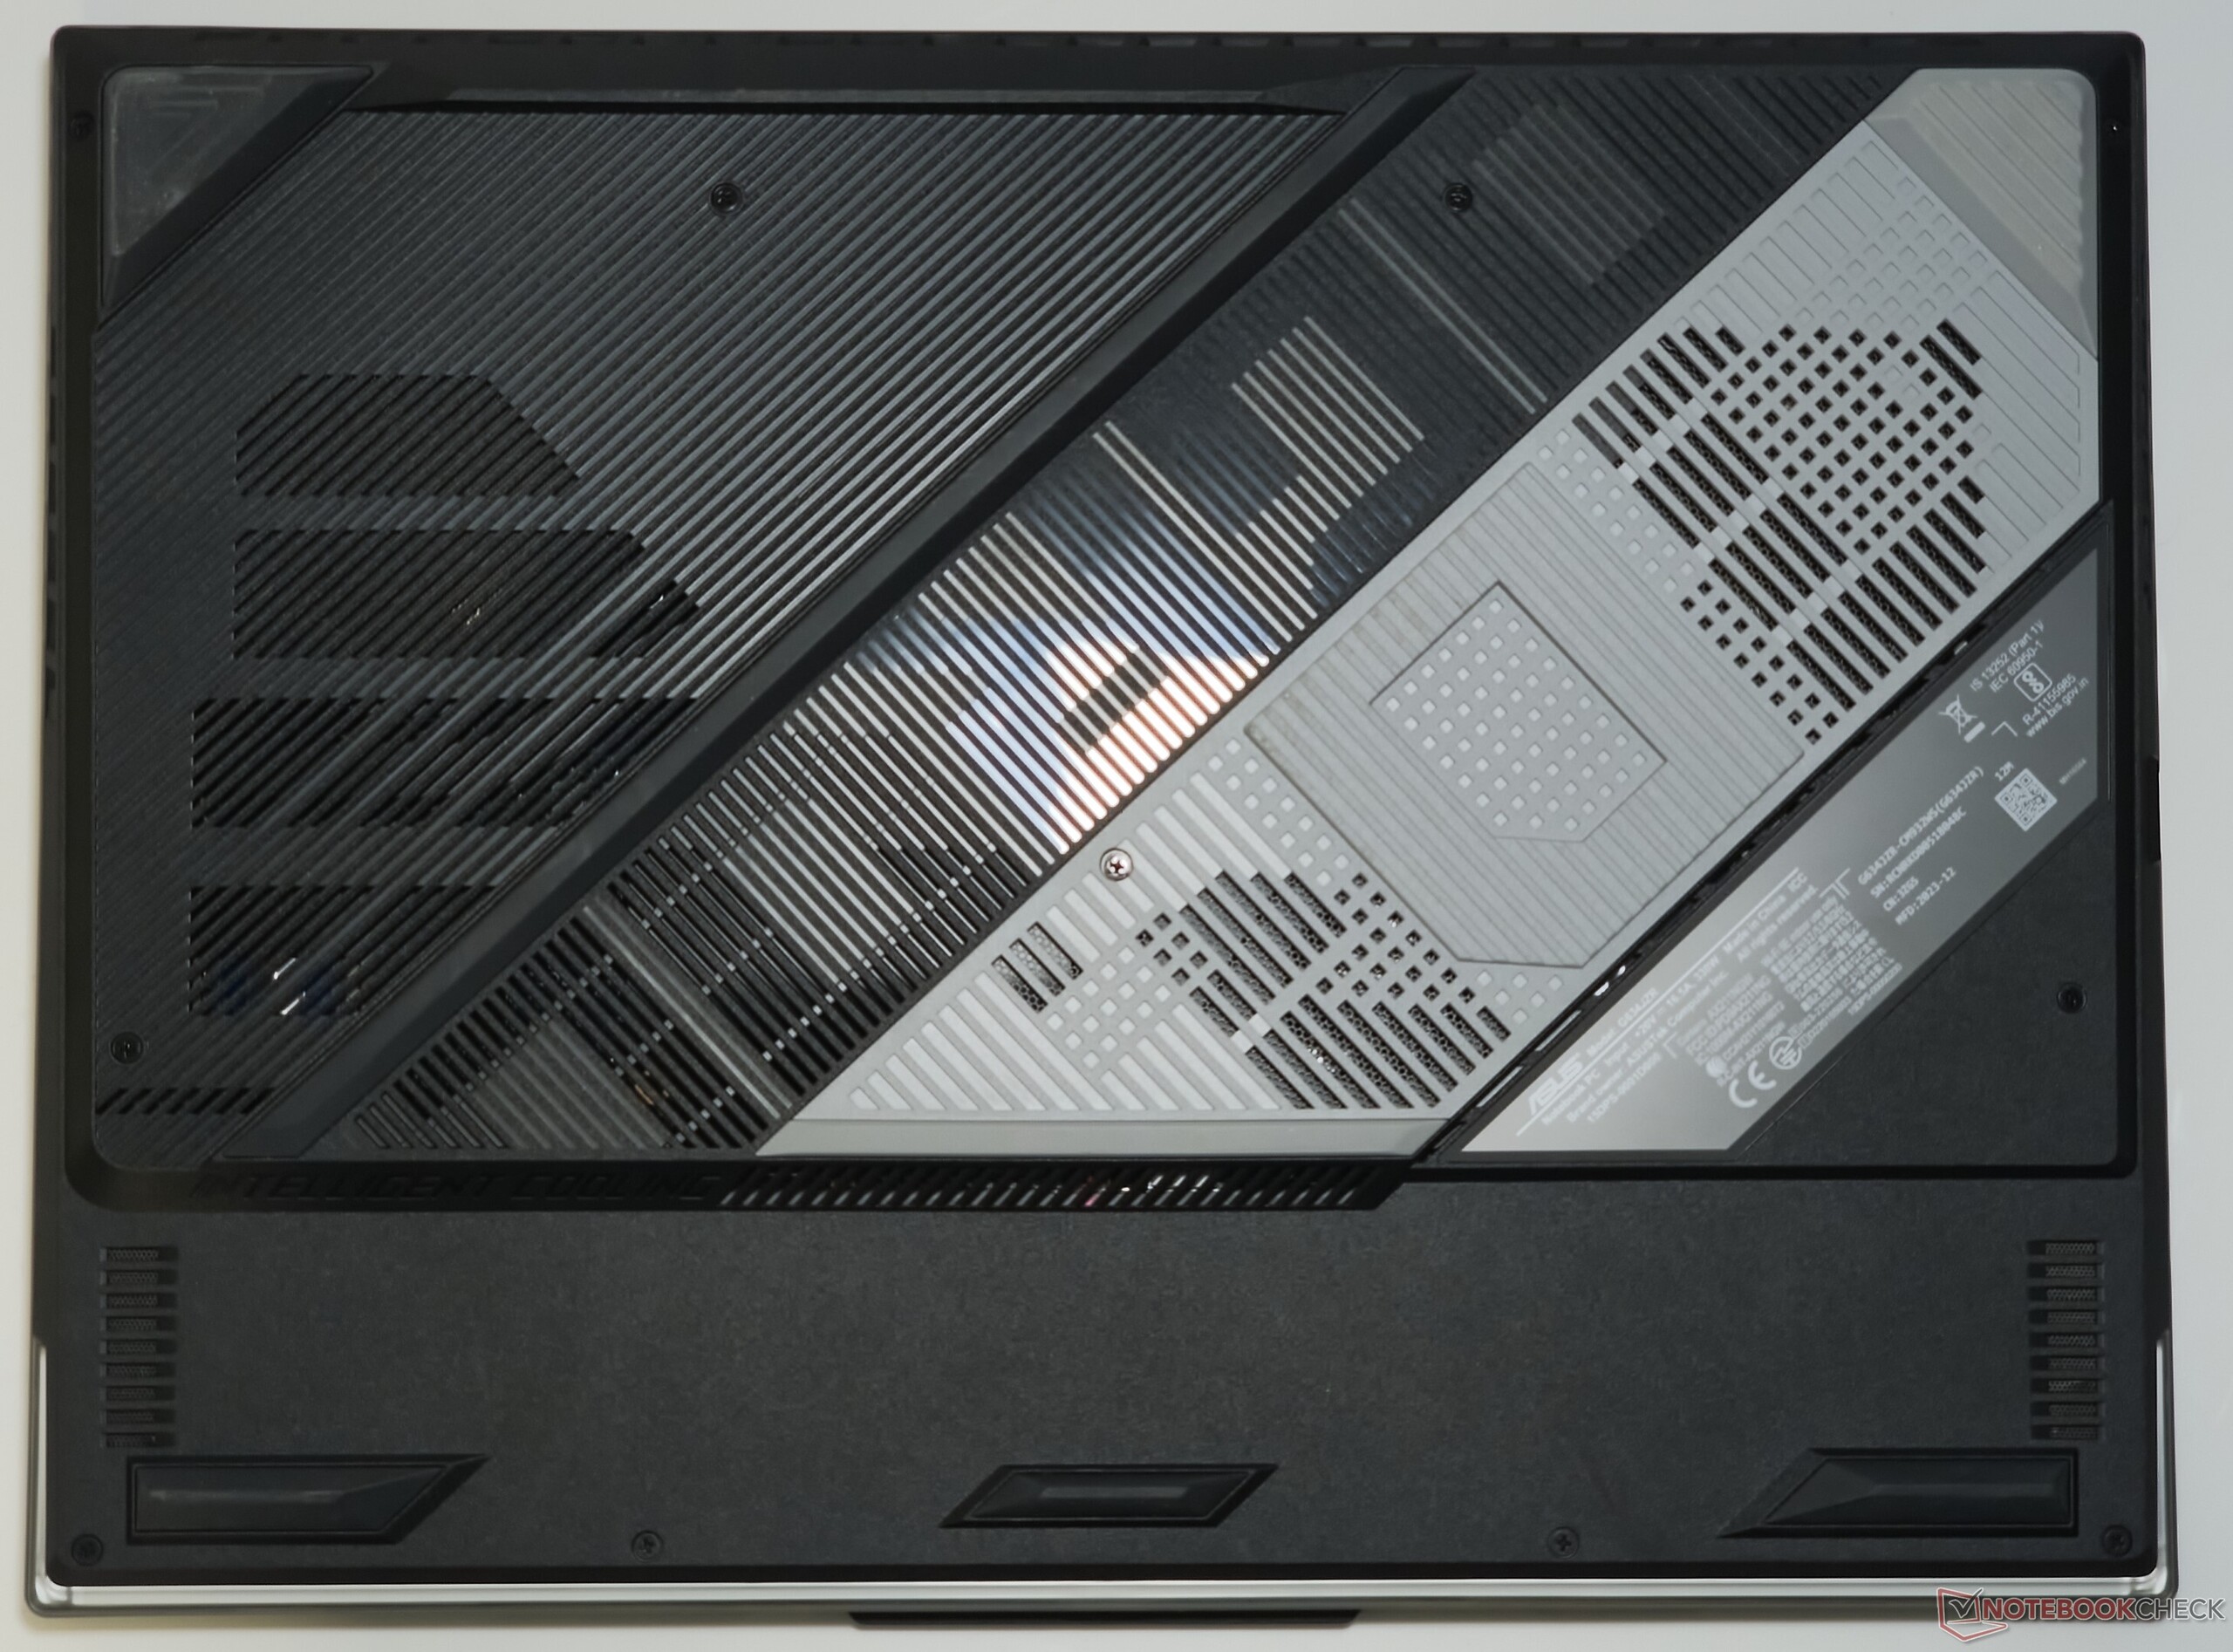
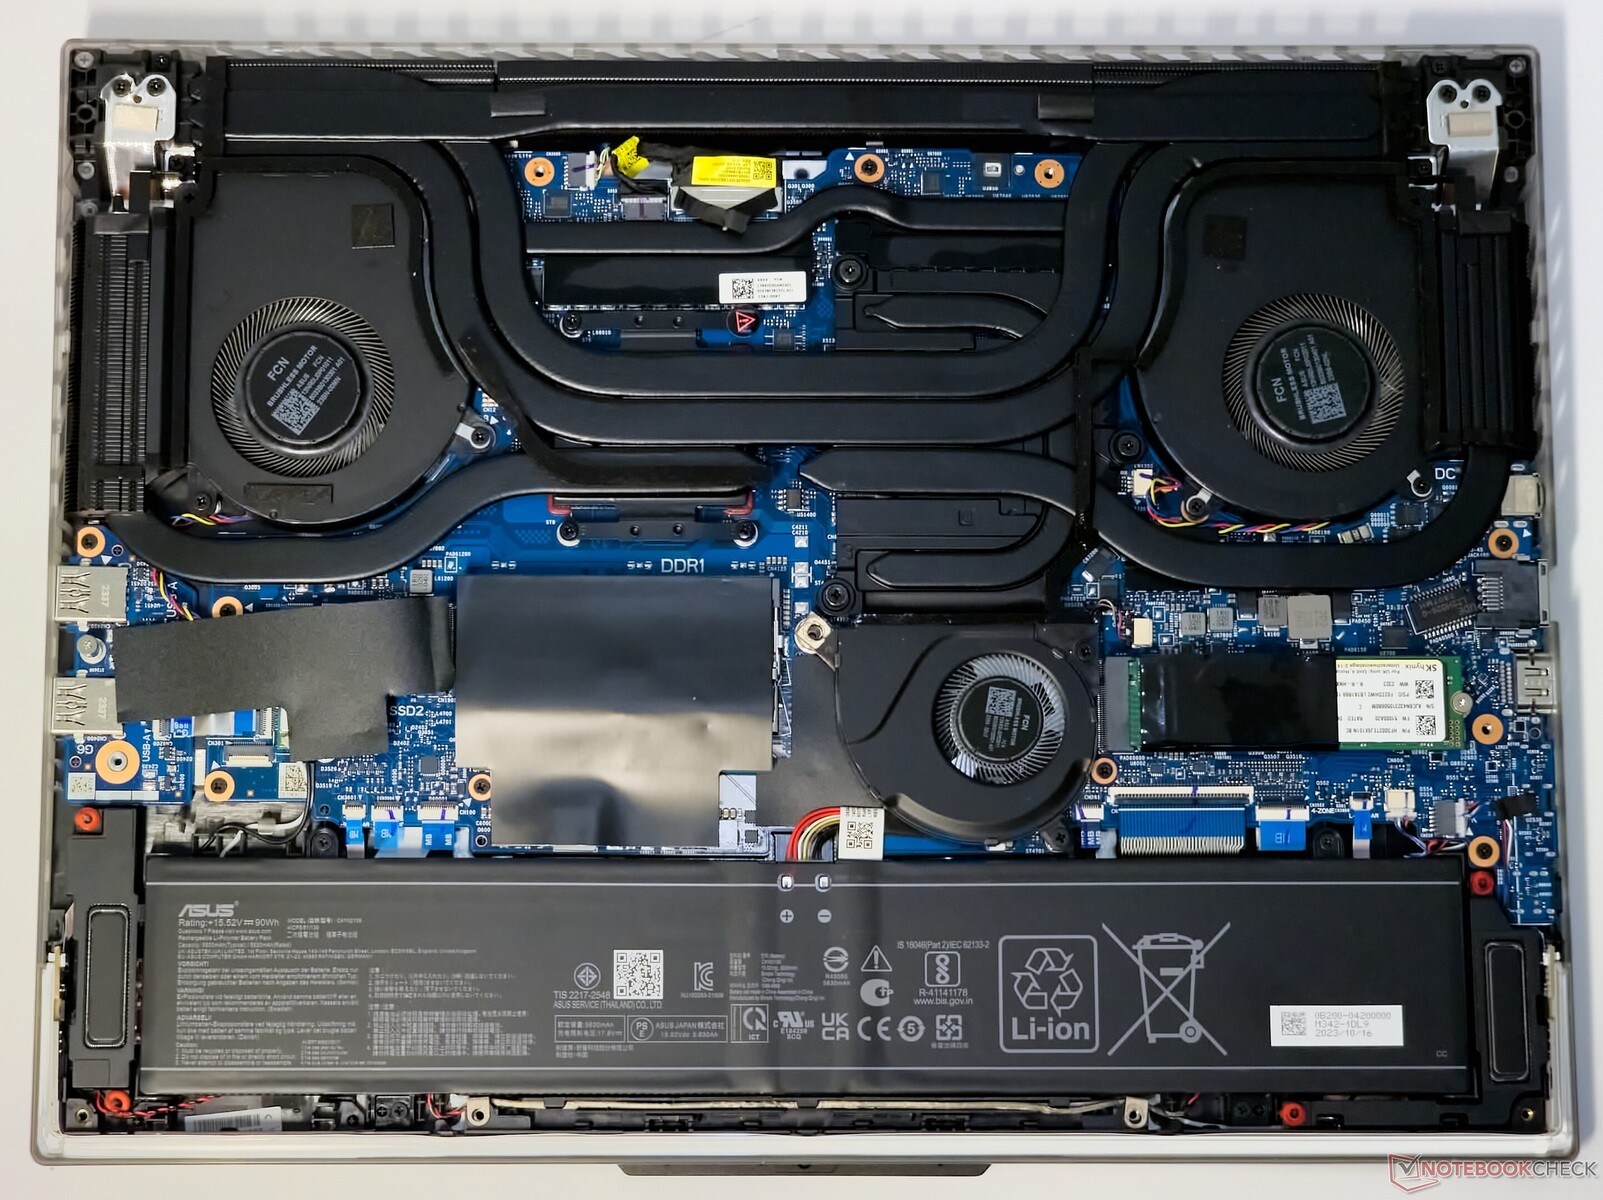
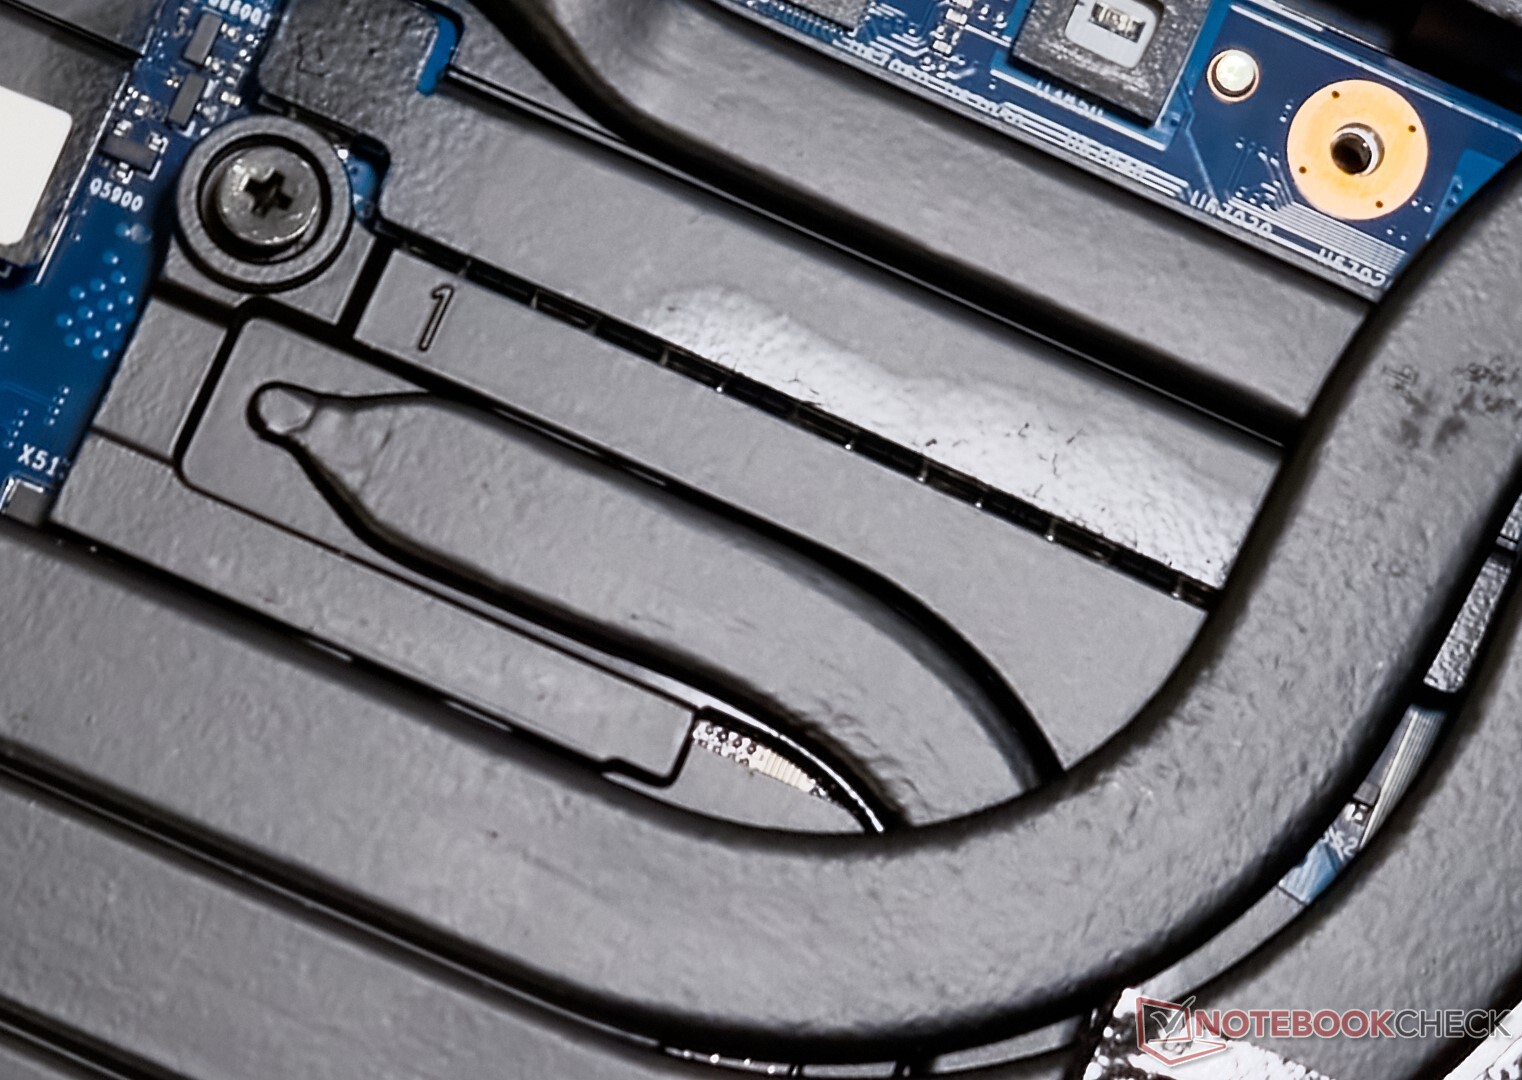
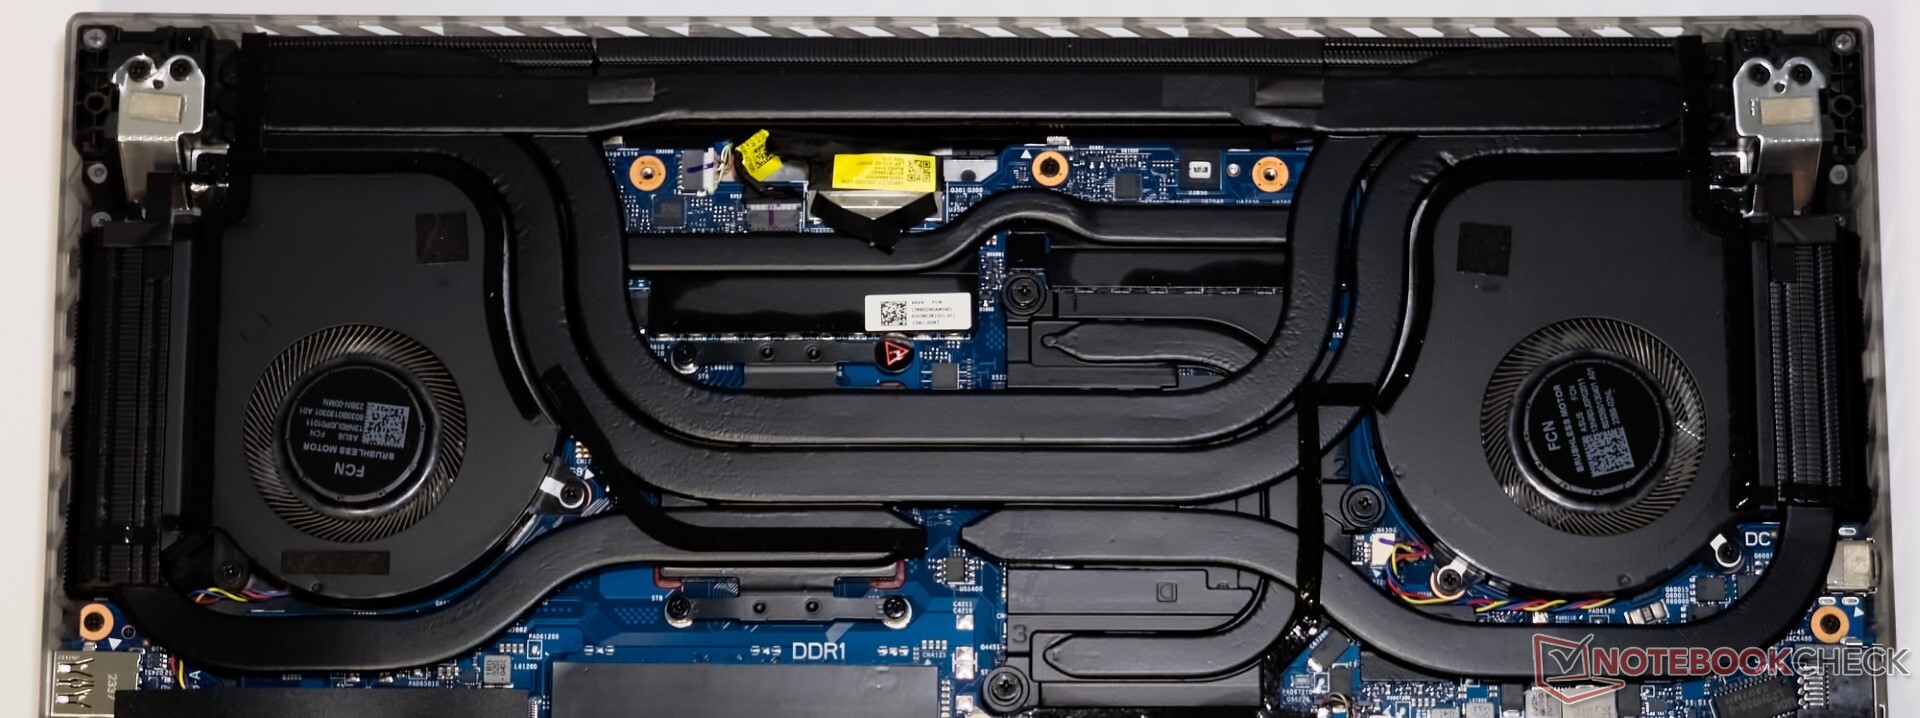
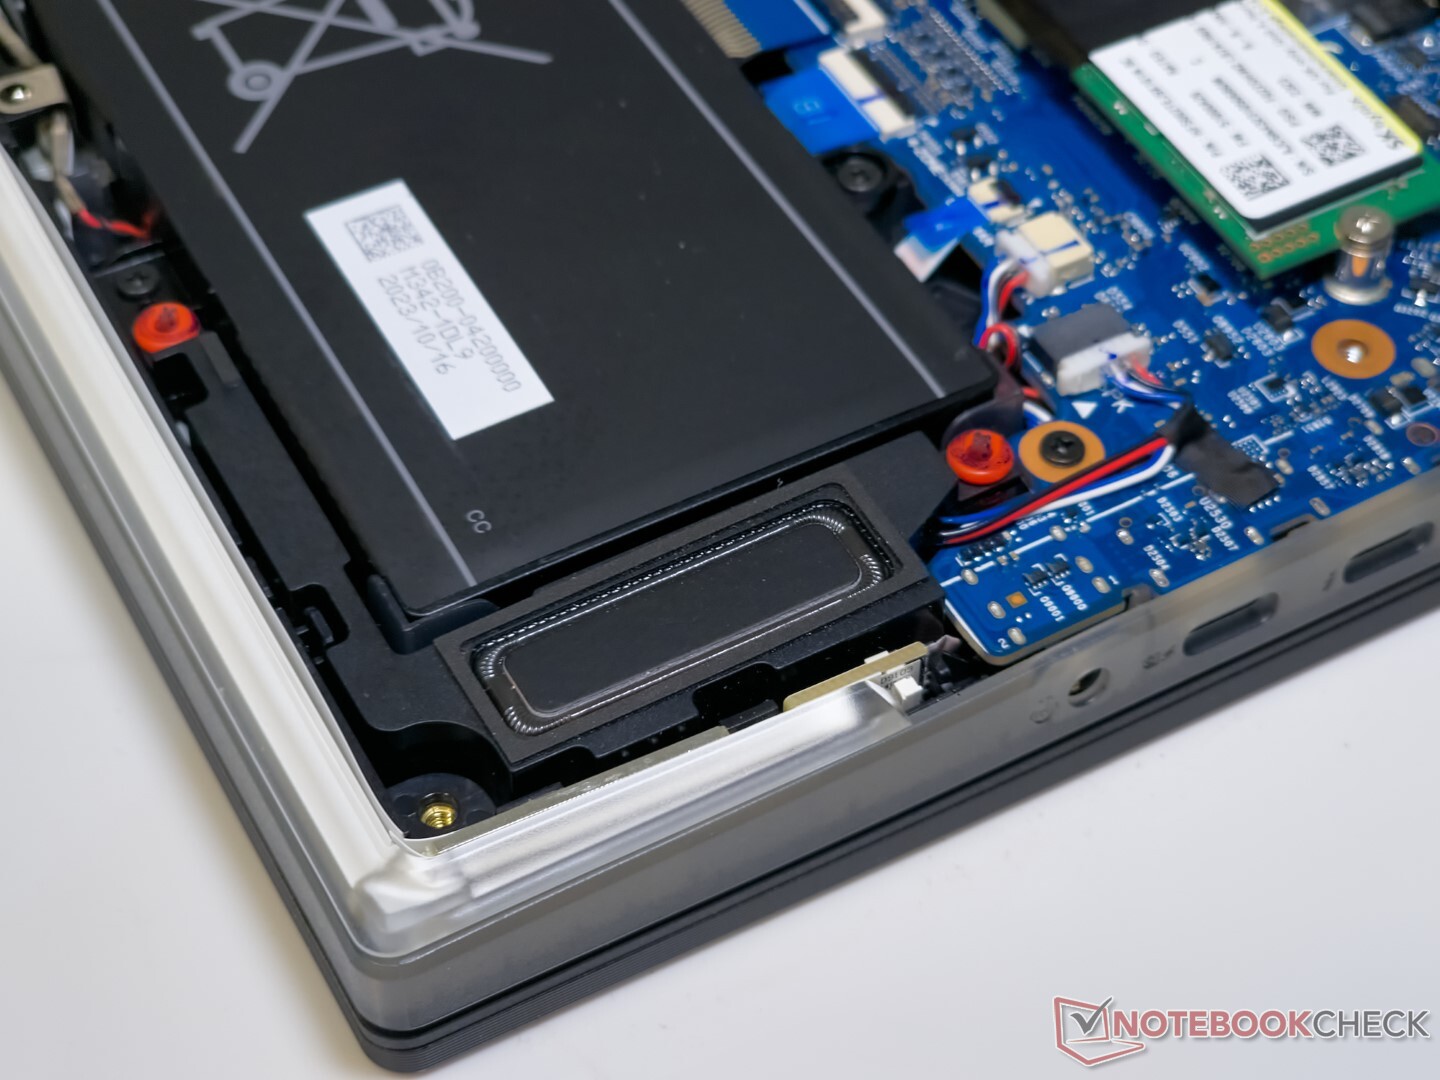
Konserwacja
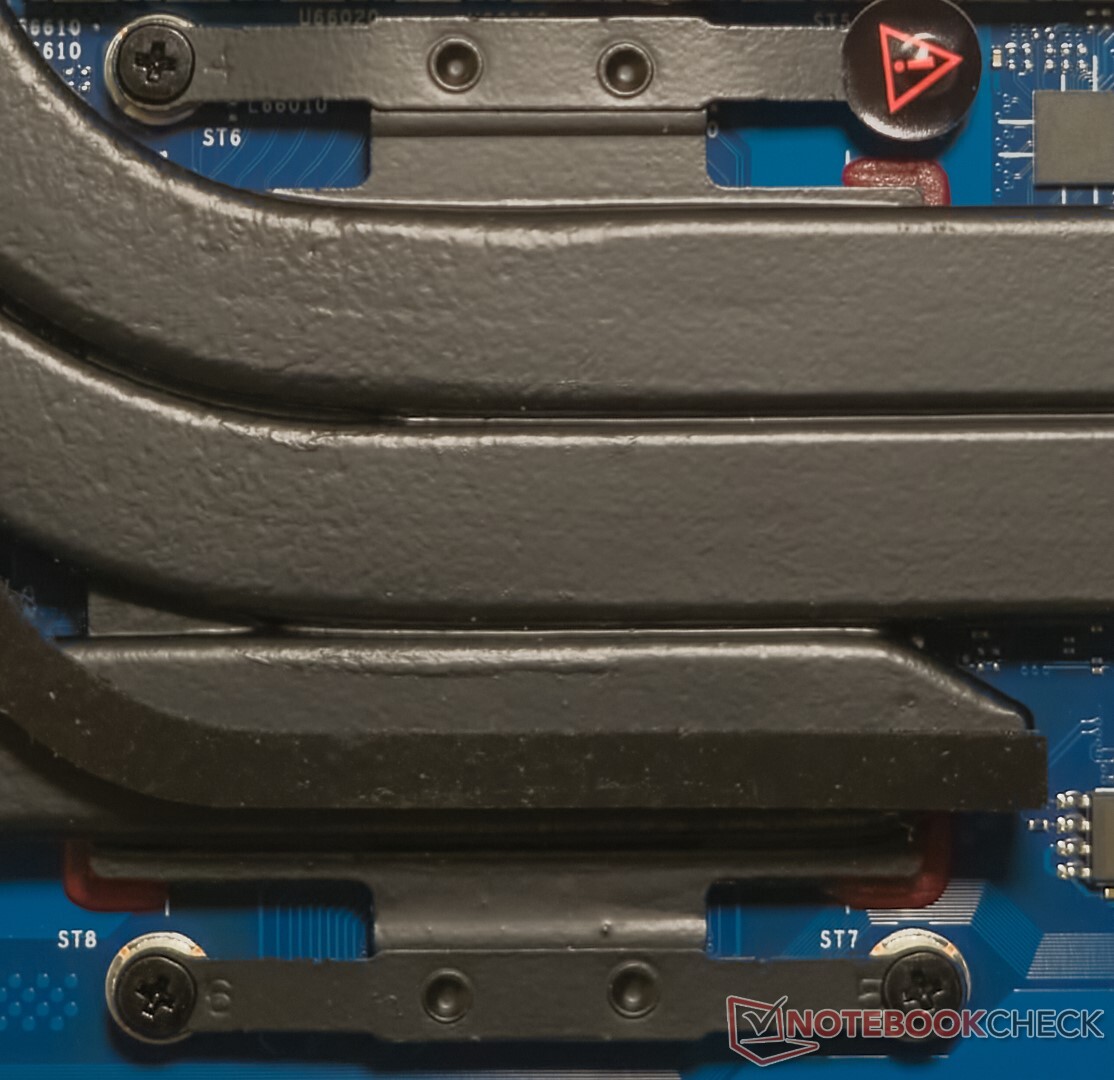
Odkręcenie 11 śrub PH0 i podważenie tylnego panelu odsłania skomplikowany układ wewnętrzny Scar 16. Czujnik optyczny na płycie głównej działa jako zabezpieczenie, zapobiegając włączeniu lub wyłączeniu laptopa, jeśli jest on już włączony po zdjęciu dolnego panelu. Aby ponownie uruchomić komputer, należy z powrotem założyć dolny panel i podłączyć laptopa do zasilacza.
Pasek LED RGB nie jest już częścią tylnego panelu, więc żegnajcie obawy o delikatne kable taśmowe, które mogą pęknąć podczas podważania pokrywy.
Pamięć RAM, dysk SSD i kartę WLAN można wymienić w razie potrzeby. Baterię można również odkręcić i wymienić.
Urządzenia wejściowe: Poręczny wirtualny numpad, ale F1-F12 pozostaje niepodświetlony
Klawiatura
Klawiatura Scar 16 oferuje ogólnie dobre wrażenia z pisania, ale sprzężenie zwrotne mogłoby być wyraźniejsze. Osoby korzystające z notebooków innych niż ASUS ROG mogą potrzebować trochę czasu, aby przyzwyczaić się do krótkiego prawego klawisza Shift i pionowego ułożenia klawiszy multimedialnych po prawej stronie.
Standardowo dla laptopów ROG, górny rząd umożliwia programowanie funkcji makro za pośrednictwem Armory Crate. Godne pochwały jest to, że Asus zapewnia pełnowymiarowe klawisze strzałek. Istnieją dedykowane klawisze do przełączania między ustawieniami oświetlenia RGB i profilami wydajności.
RGB dla każdego klawisza można dostosować za pomocą Armory Crate. Jednak litery F1-F12 nadal pozostają ciemne.
Panel dotykowy
Touchpad o wymiarach 8,5 cm x 13 cm oferuje płynne przesuwanie z obsługą gestów systemu Windows Precision. Touchpad oferuje dobrą wyczuwalność, a kliknięcia są responsywne w rogach.
Miękki przełącznik Num lock w prawym górnym rogu touchpada uruchamia wirtualną klawiaturę numeryczną, która przydaje się podczas liczenia. Może on zostać przypadkowo uruchomiony podczas przesuwania, ale generalnie nie przeszkadza w normalnym użytkowaniu.
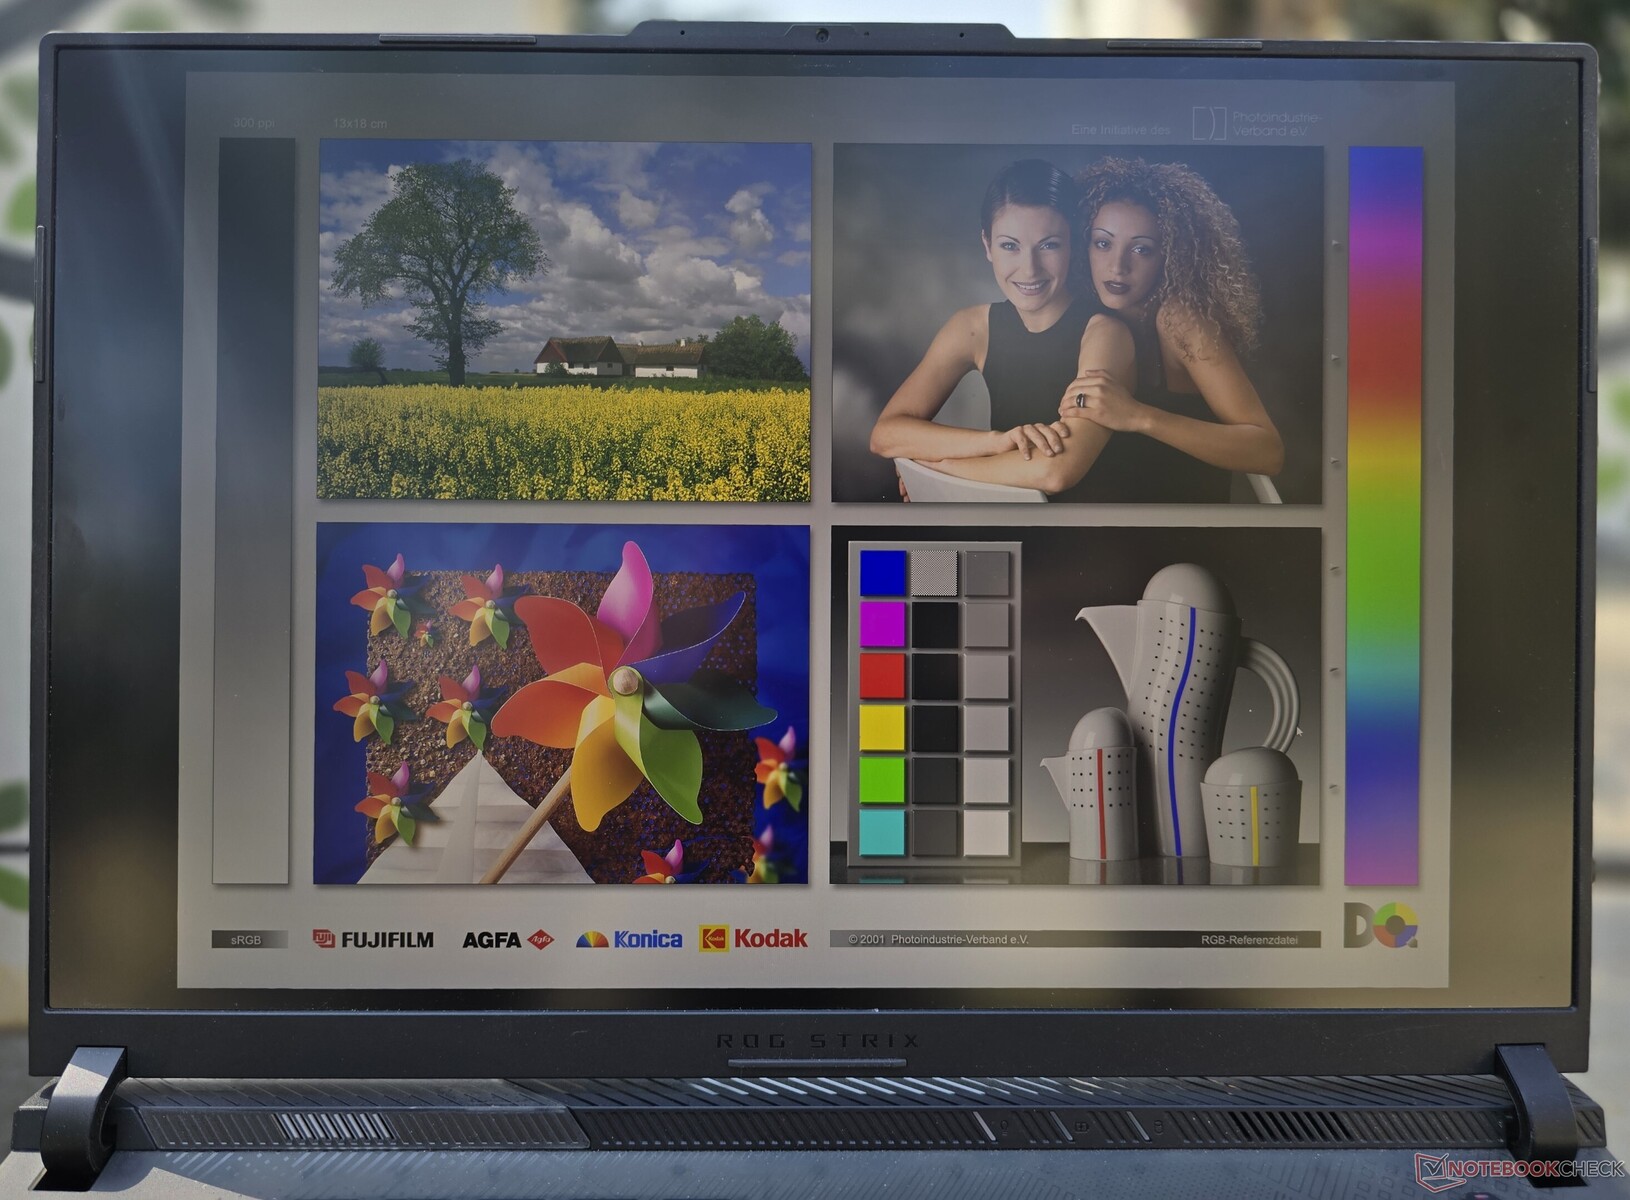
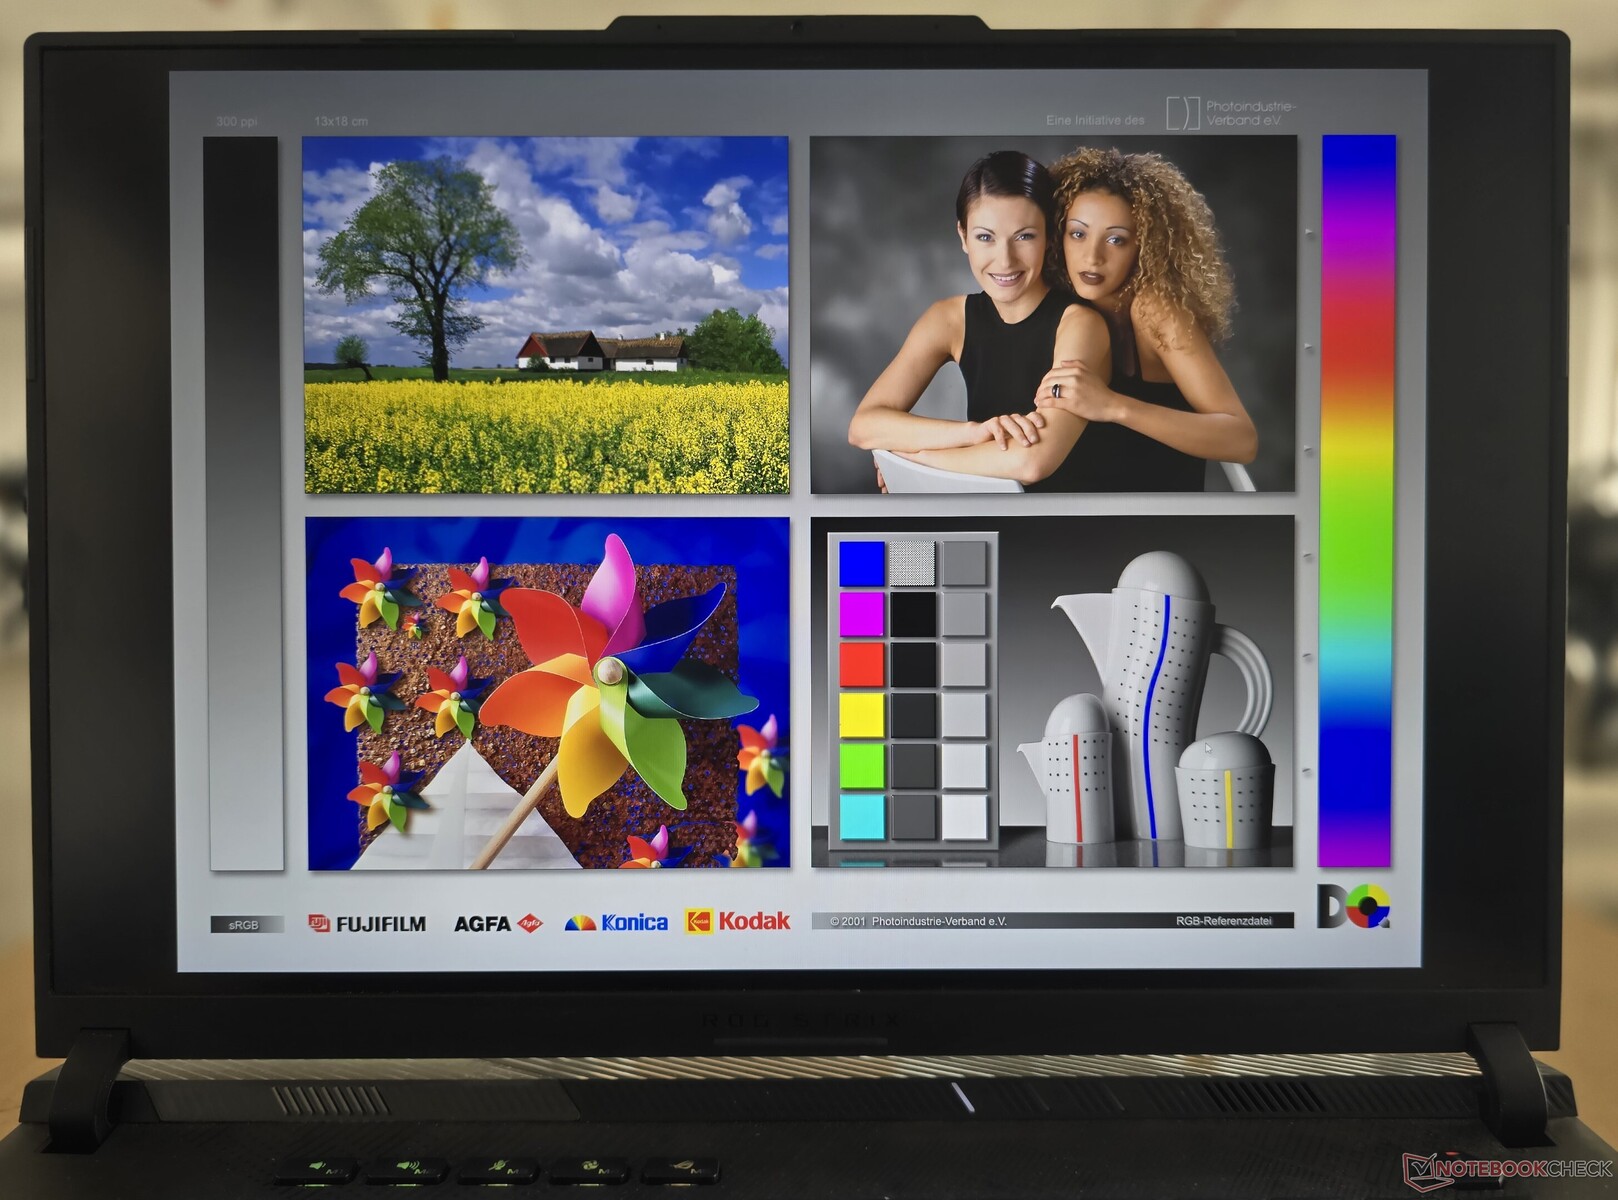
Wyświetlacz: panel 240 Hz QHD+ G-Sync HDR z wysokim PWM
ROG Strix Scar 16 jest wyposażony w panel 2560 x 1600 16:10 mini LED "Nebula HDR", który według Asusa ma 2048 stref przyciemniania. Wyświetlacz 240 Hz obsługuje HDR10, Dolby Vision, Nvidia G-Sync, a także posiada walidację Pantone.
Armory Crate umożliwia przełączanie między podświetleniem jednostrefowym i wielostrefowym. Pierwszy z nich jest domyślnym trybem pracy i pozwala na bardziej równomierne oświetlenie dla dokładnego odwzorowania kolorów.
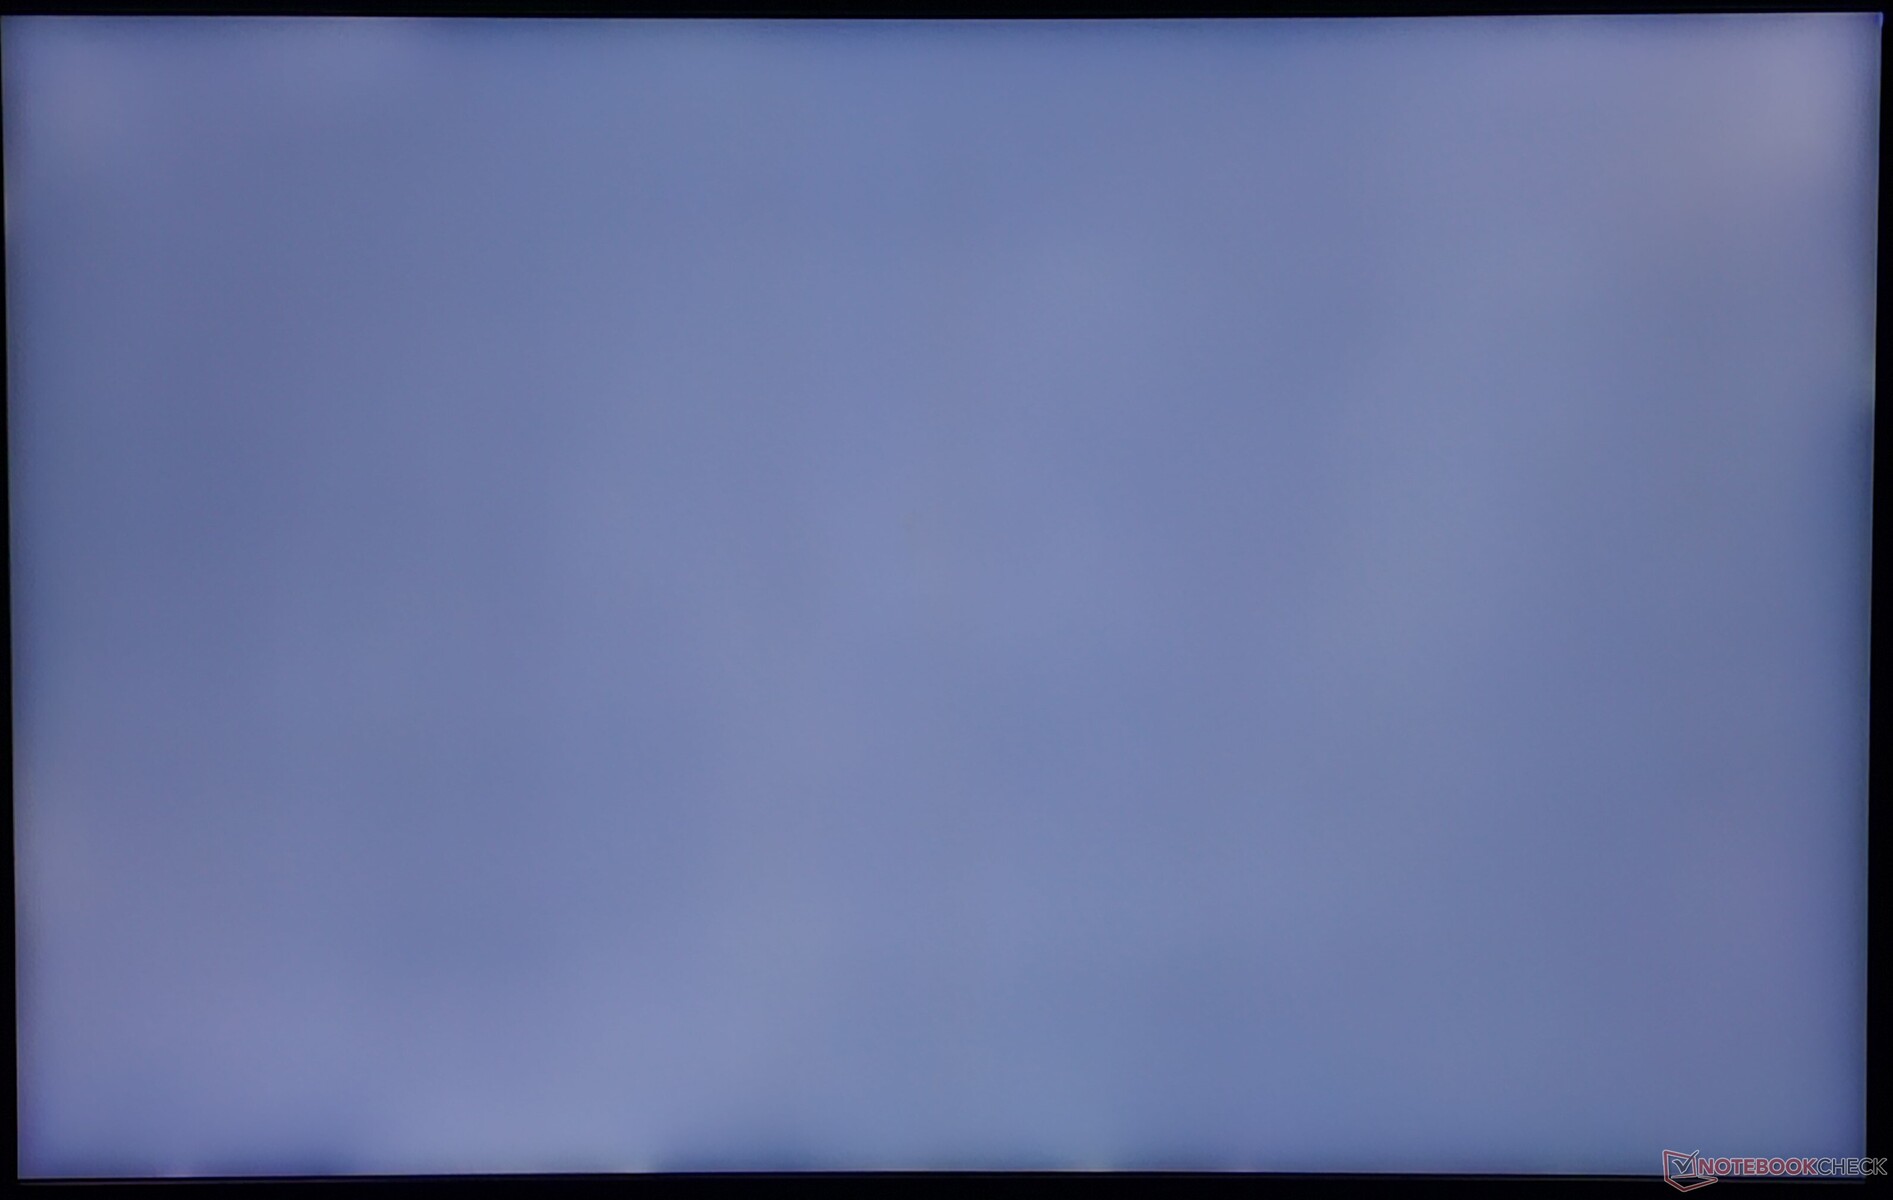
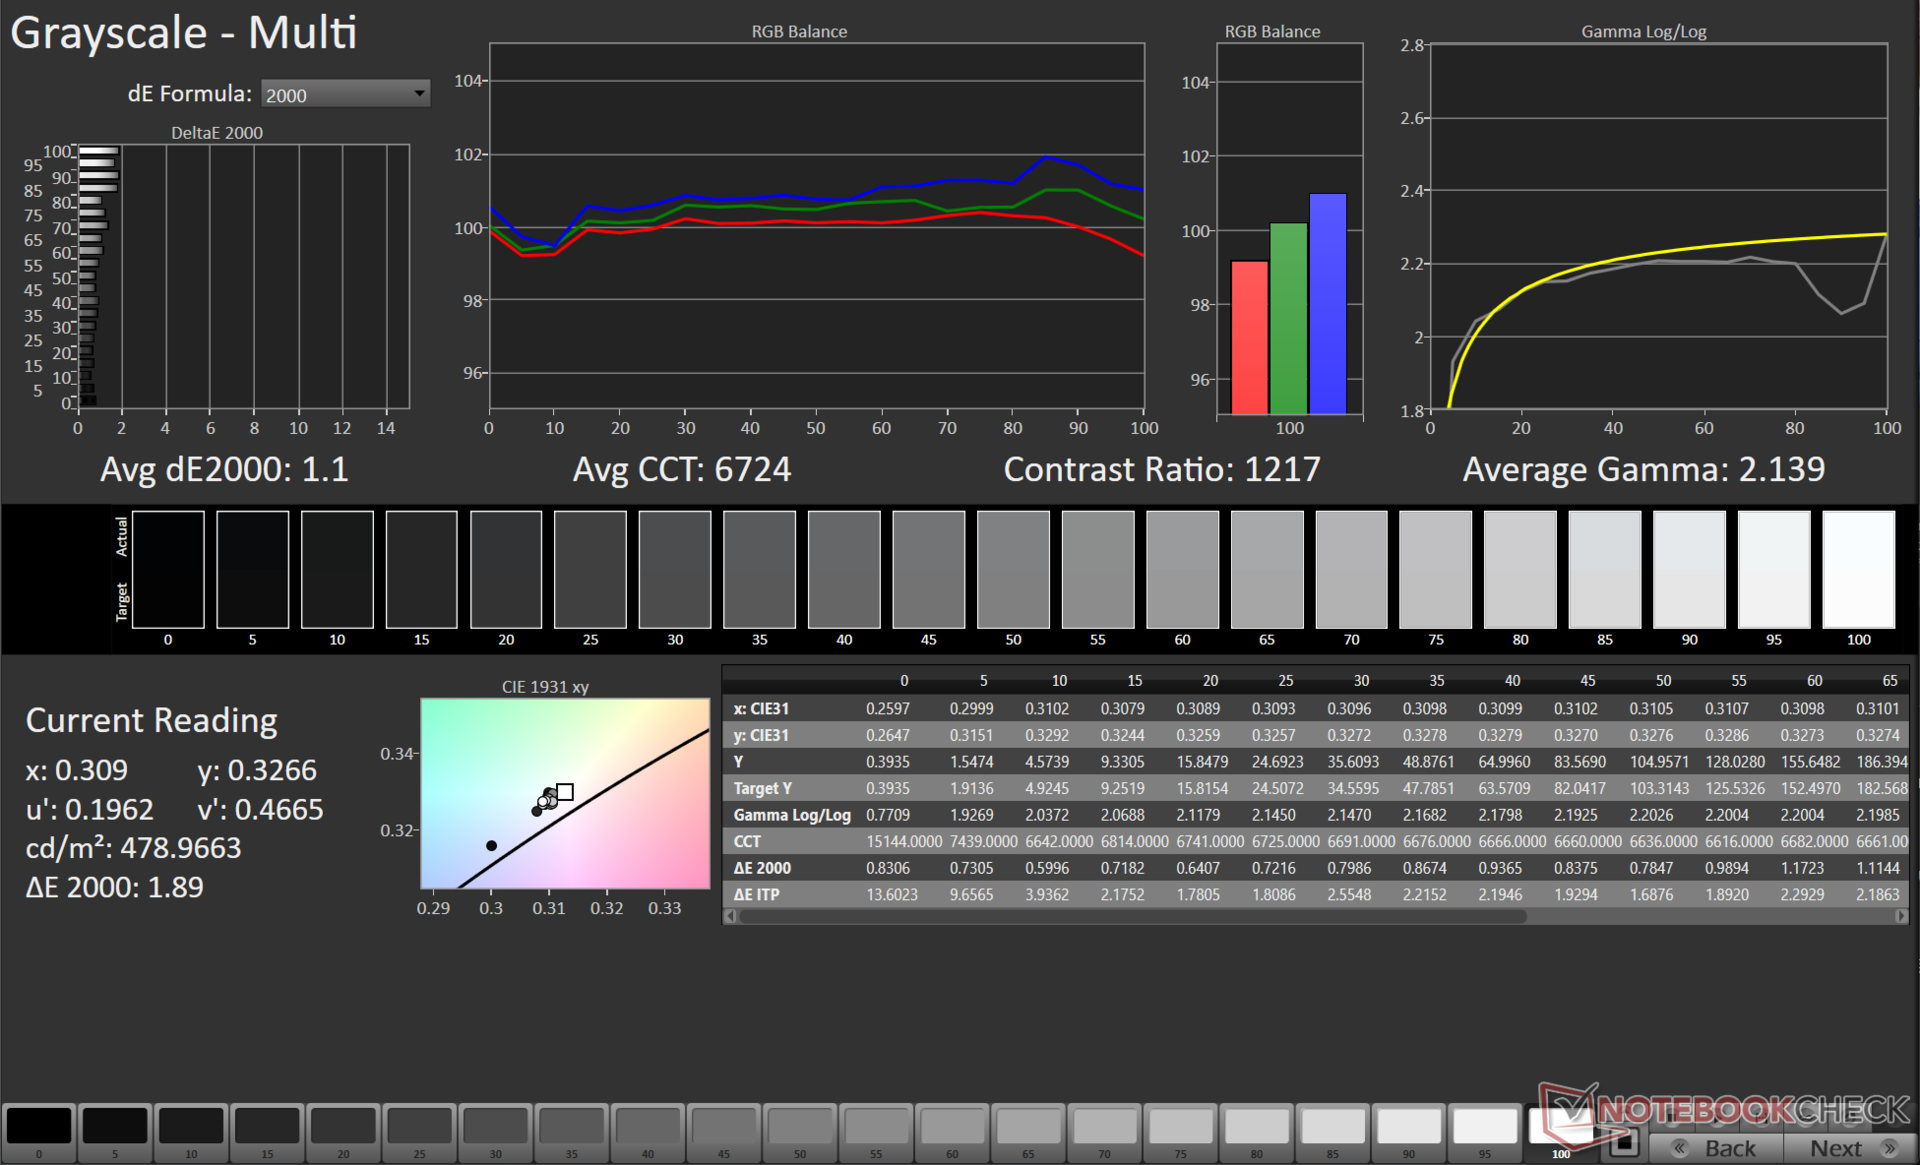
W tym trybie wyświetlacz Scar 16 wykazał dobry rozkład jasności na poziomie 94% w naszych pomiarach SDR, przy szczytowej jasności 503 nitów. Zmierzyliśmy współczynnik kontrastu 1225:1, który jest dobry, ale będą Państwo chcieli przełączyć przełącznik wielostrefowy, jeśli potrzebują Państwo jeszcze głębszej czerni.
Proszę odnieść się do naszego Recenzja ROG Scar 18 (2024) w której zastosowano podobny panel Nebula HDR mini LED, aby dowiedzieć się, jakich wartości można oczekiwać od wielostrefowego podświetlenia.
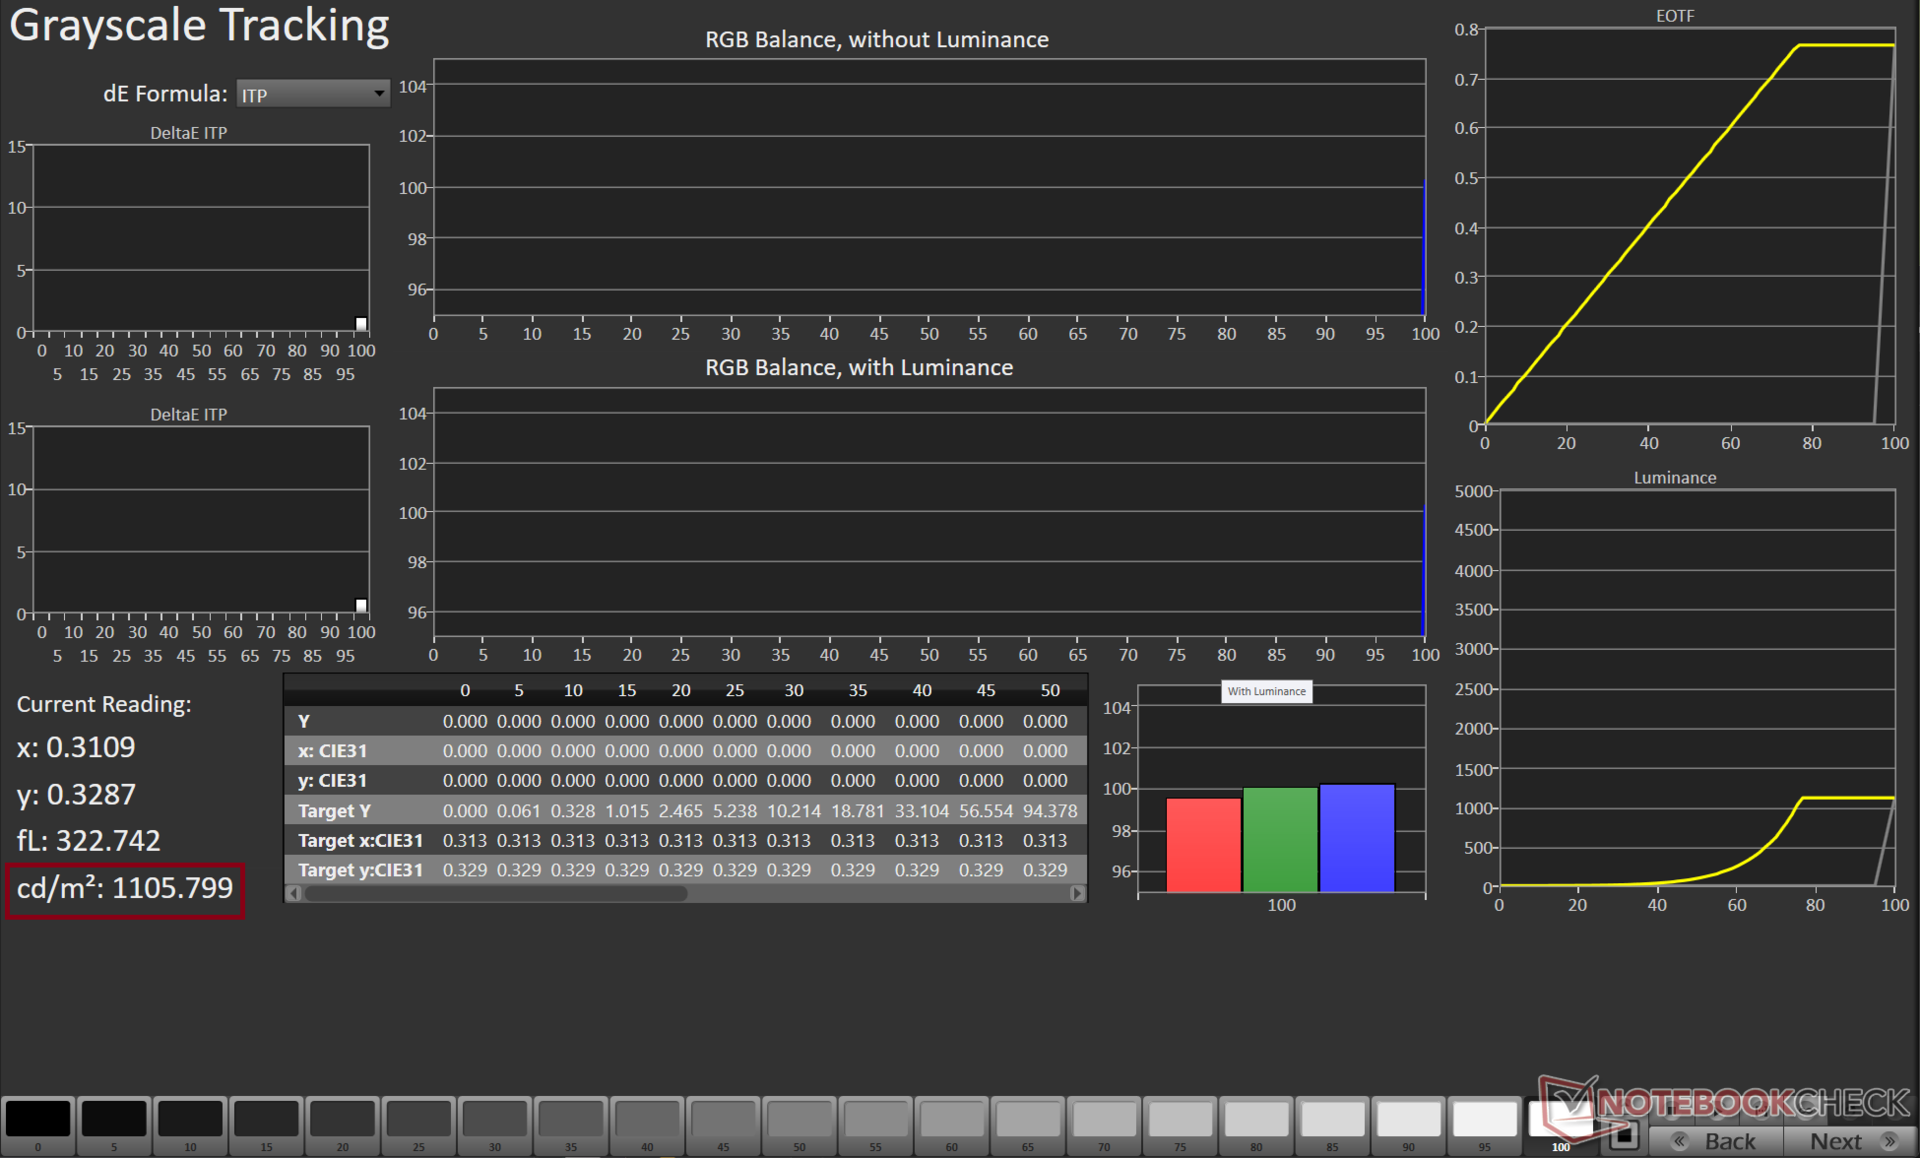
Asus reklamuje 1100 nitów szczytowej jasności HDR i stwierdziliśmy, że twierdzenie to jest prawdziwe, gdy zmierzono je przy rozmiarze okna 49%.
Krwawienie podświetlenia jest tylko minimalnie widoczne wzdłuż dolnej ramki wyświetlacza.

| |||||||||||||||||||||||||
rozświetlenie: 94 %
na akumulatorze: 291 cd/m²
kontrast: 1225:1 (czerń: 0.4 cd/m²)
ΔE Color 1.08 | 0.5-29.43 Ø5, calibrated: 0.9
ΔE Greyscale 1.1 | 0.57-98 Ø5.3
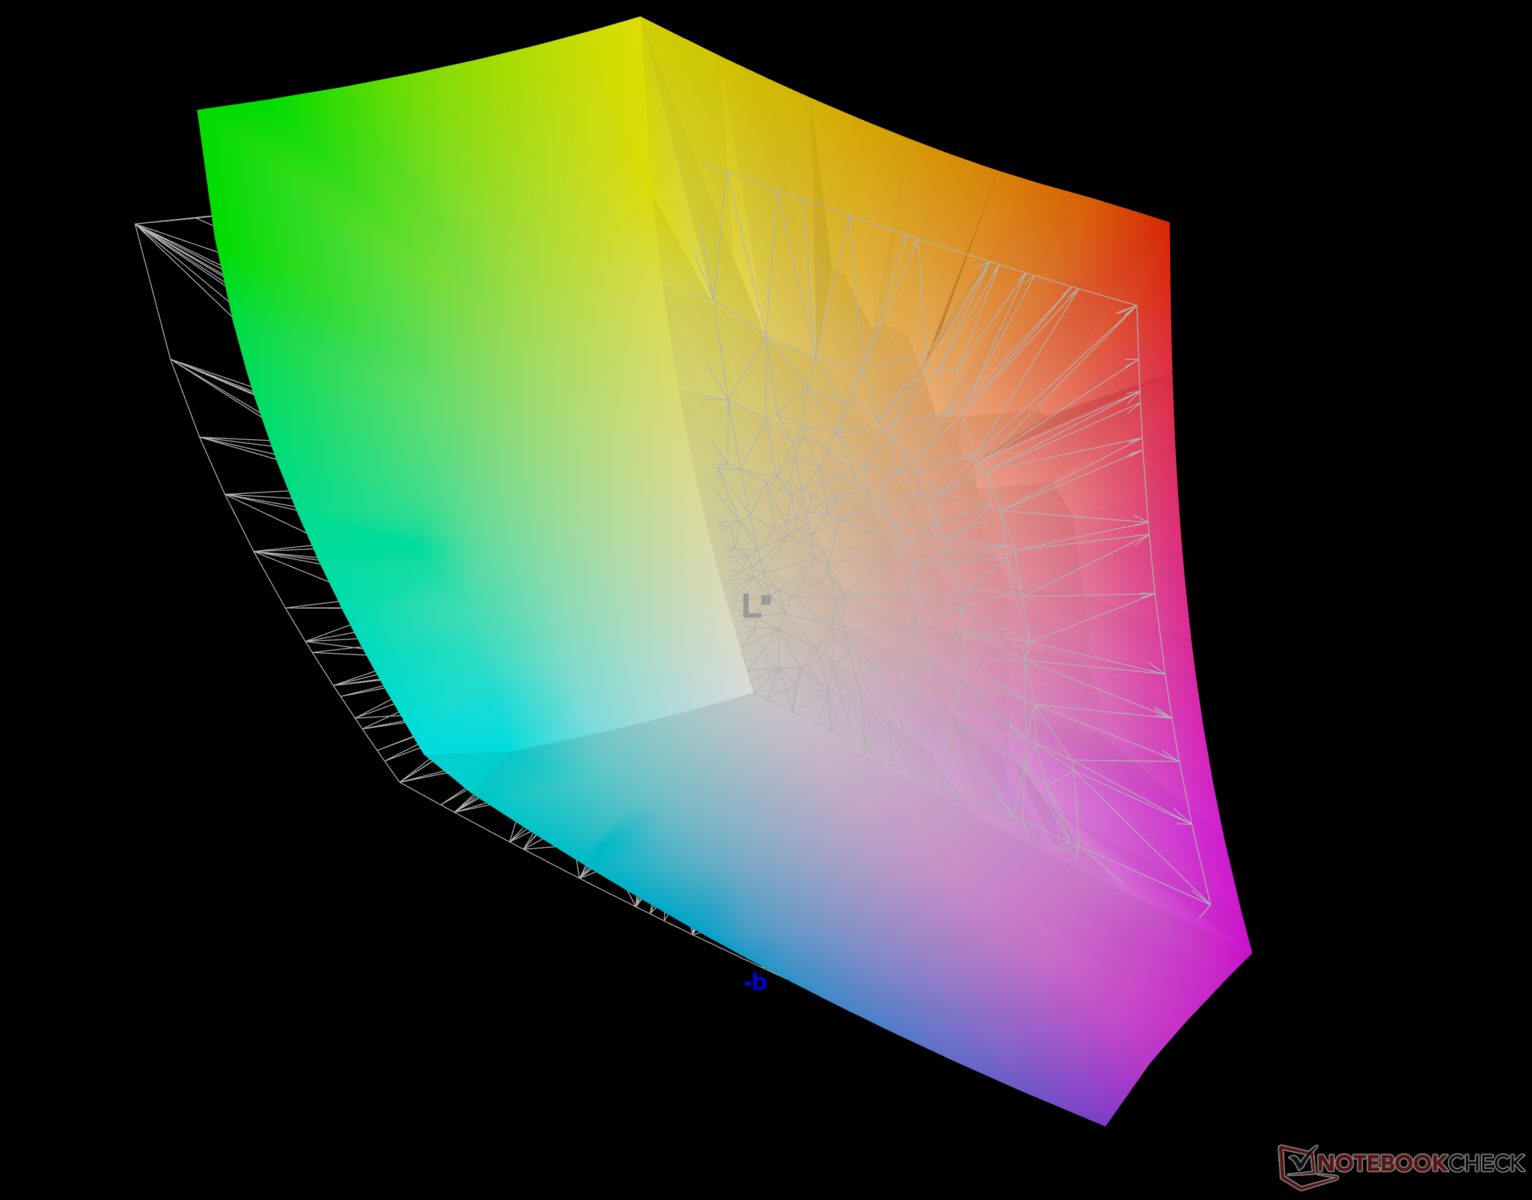
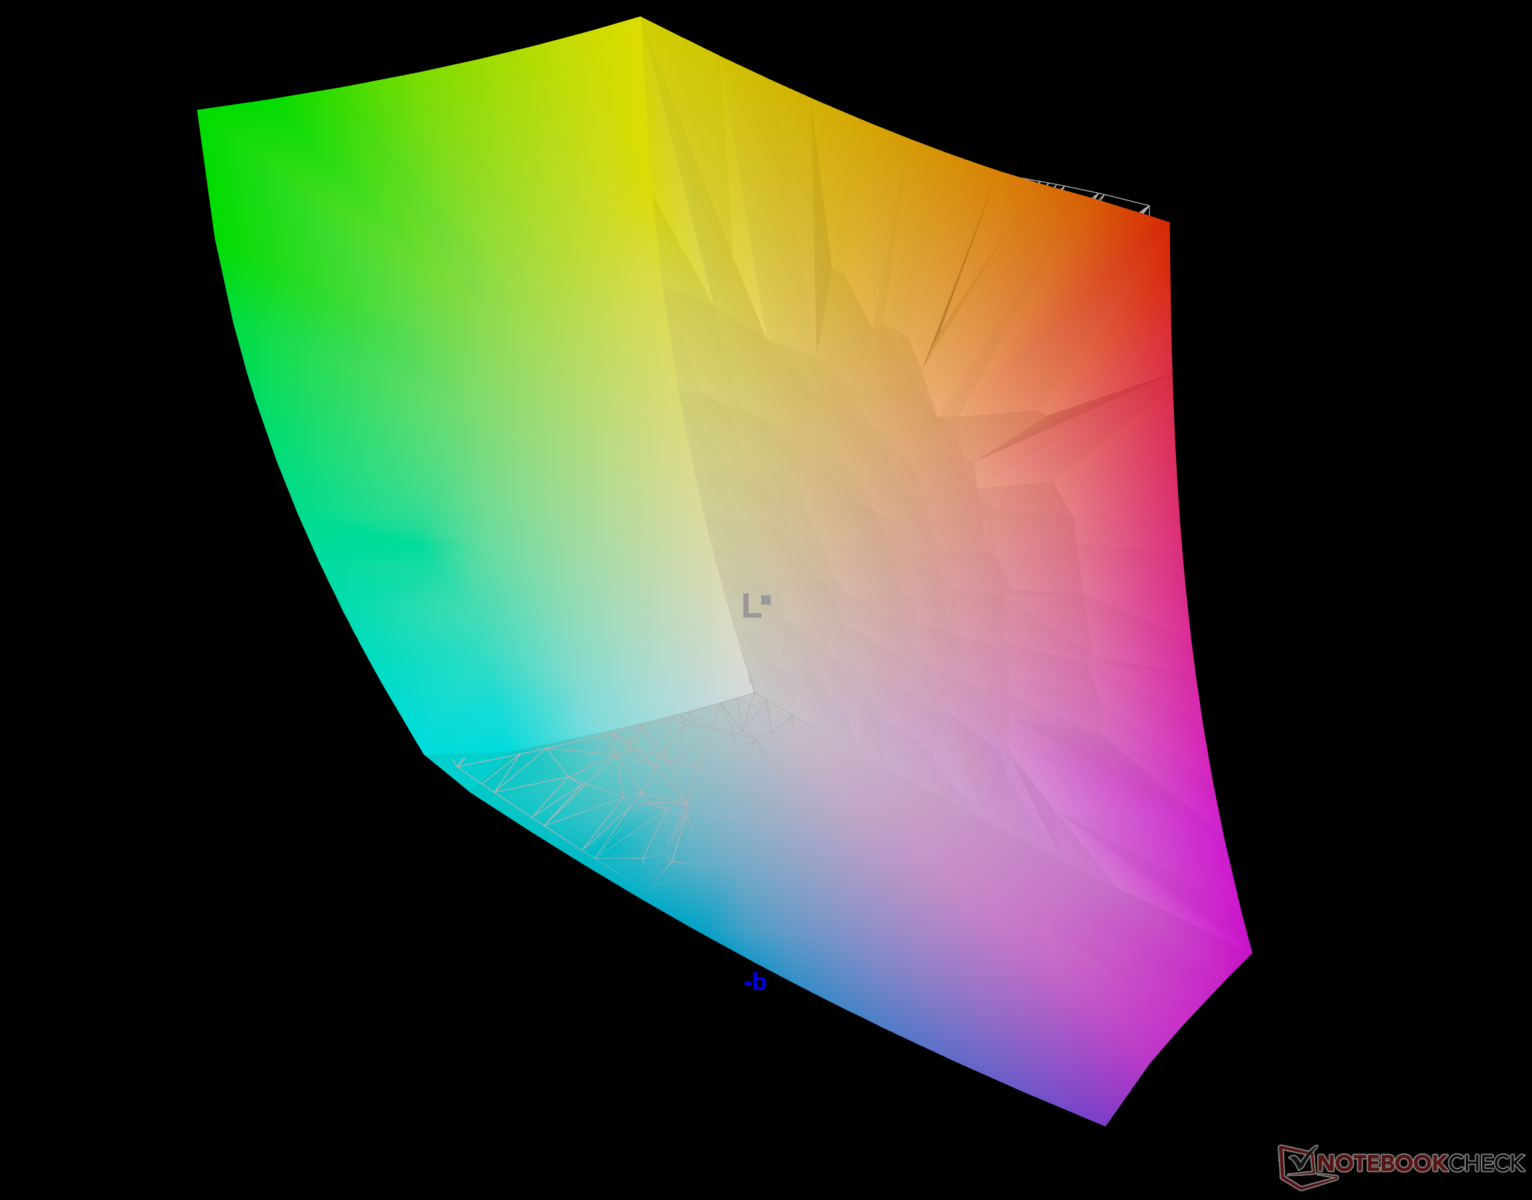
90.8% AdobeRGB 1998 (Argyll 2.2.0 3D)
100% sRGB (Argyll 2.2.0 3D)
99.8% Display P3 (Argyll 2.2.0 3D)
Gamma: 2.13
| Asus ROG Strix Scar 16 G634JZR BOE NE160QDM-NM7, Mini LED, 2560x1600, 16.00 | Asus ROG Strix G16 G614JZ TL160ADMP03-0, IPS, 2560x1600, 16.00 | Lenovo Legion Pro 7 16IRX9H BOE CQ NE16QDM-NZB, IPS, 2560x1600, 16.00 | HP Omen 16 (2024) BOE BOE0B7D, IPS, 2560x1440, 16.10 | MSI Vector 16 HX A14V Chi Mei N160GME-GTB, IPS, 2560x1600, 16.00 | Alienware m16 R2 BOE NE16NYH, IPS, 2560x1600, 16.00 | |
|---|---|---|---|---|---|---|
| Display | -3% | -2% | -18% | -3% | -17% | |
| Display P3 Coverage | 99.8 | 97 -3% | 98.5 -1% | 68.6 -31% | 95.4 -4% | 71 -29% |
| sRGB Coverage | 100 | 99.9 0% | 99.9 0% | 98.6 -1% | 99.7 0% | 100 0% |
| AdobeRGB 1998 Coverage | 90.8 | 84.9 -6% | 86.7 -5% | 70.6 -22% | 85.4 -6% | 71.4 -21% |
| Response Times | 18% | -54% | -86% | -12% | 1% | |
| Response Time Grey 50% / Grey 80% * | 5 ? | 5.1 ? -2% | 12.6 ? -152% | 14.1 ? -182% | 5.7 ? -14% | 5.7 ? -14% |
| Response Time Black / White * | 10.4 ? | 6.6 ? 37% | 5.8 ? 44% | 9.3 ? 11% | 11.4 ? -10% | 8.7 ? 16% |
| PWM Frequency | 2040 ? | |||||
| Screen | -34% | -1% | -46% | -70% | -27% | |
| Brightness middle | 490 | 470 -4% | 487 -1% | 292 -40% | 557.2 14% | 345.8 -29% |
| Brightness | 487 | 459 -6% | 460 -6% | 291 -40% | 506 4% | 337 -31% |
| Brightness Distribution | 94 | 93 -1% | 88 -6% | 85 -10% | 83 -12% | 87 -7% |
| Black Level * | 0.4 | 0.42 -5% | 0.42 -5% | 0.24 40% | 0.41 -3% | 0.3 25% |
| Contrast | 1225 | 1119 -9% | 1160 -5% | 1217 -1% | 1359 11% | 1153 -6% |
| Colorchecker dE 2000 * | 1.08 | 1.86 -72% | 1.12 -4% | 2.36 -119% | 2.91 -169% | 1.99 -84% |
| Colorchecker dE 2000 max. * | 2.38 | 3.87 -63% | 2.26 5% | 4.08 -71% | 5.94 -150% | 3.52 -48% |
| Colorchecker dE 2000 calibrated * | 0.9 | 0.93 -3% | 0.54 40% | 0.93 -3% | 1.63 -81% | 0.62 31% |
| Greyscale dE 2000 * | 1.1 | 2.7 -145% | 1.4 -27% | 3 -173% | 3.8 -245% | 2.1 -91% |
| Gamma | 2.13 103% | 2.246 98% | 2.242 98% | 2.101 105% | 2.23 99% | 2.32 95% |
| CCT | 6724 97% | 6711 97% | 6809 95% | 5976 109% | 6408 101% | 6369 102% |
| Total Average (Program / Settings) | -6% /
-20% | -19% /
-9% | -50% /
-46% | -28% /
-48% | -14% /
-21% |
* ... im mniej tym lepiej
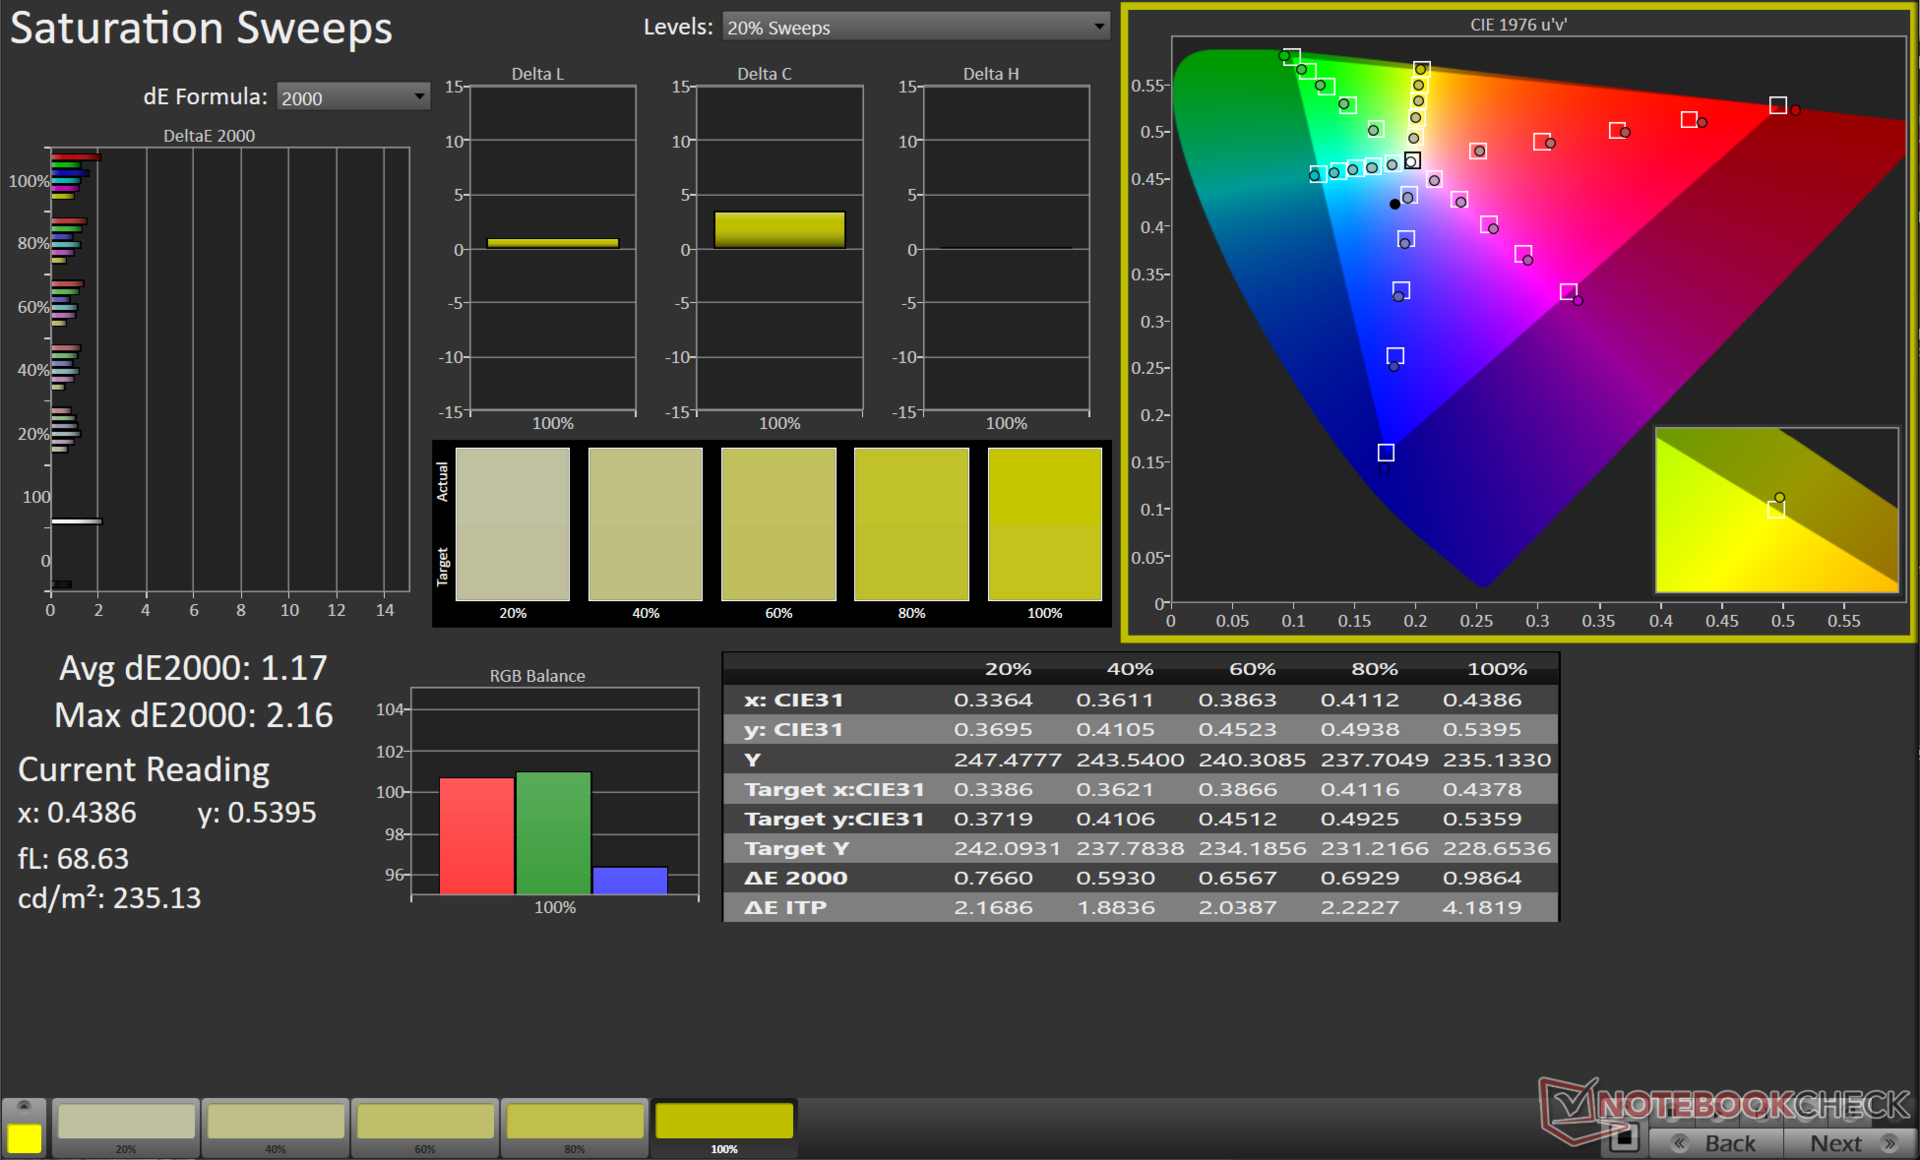
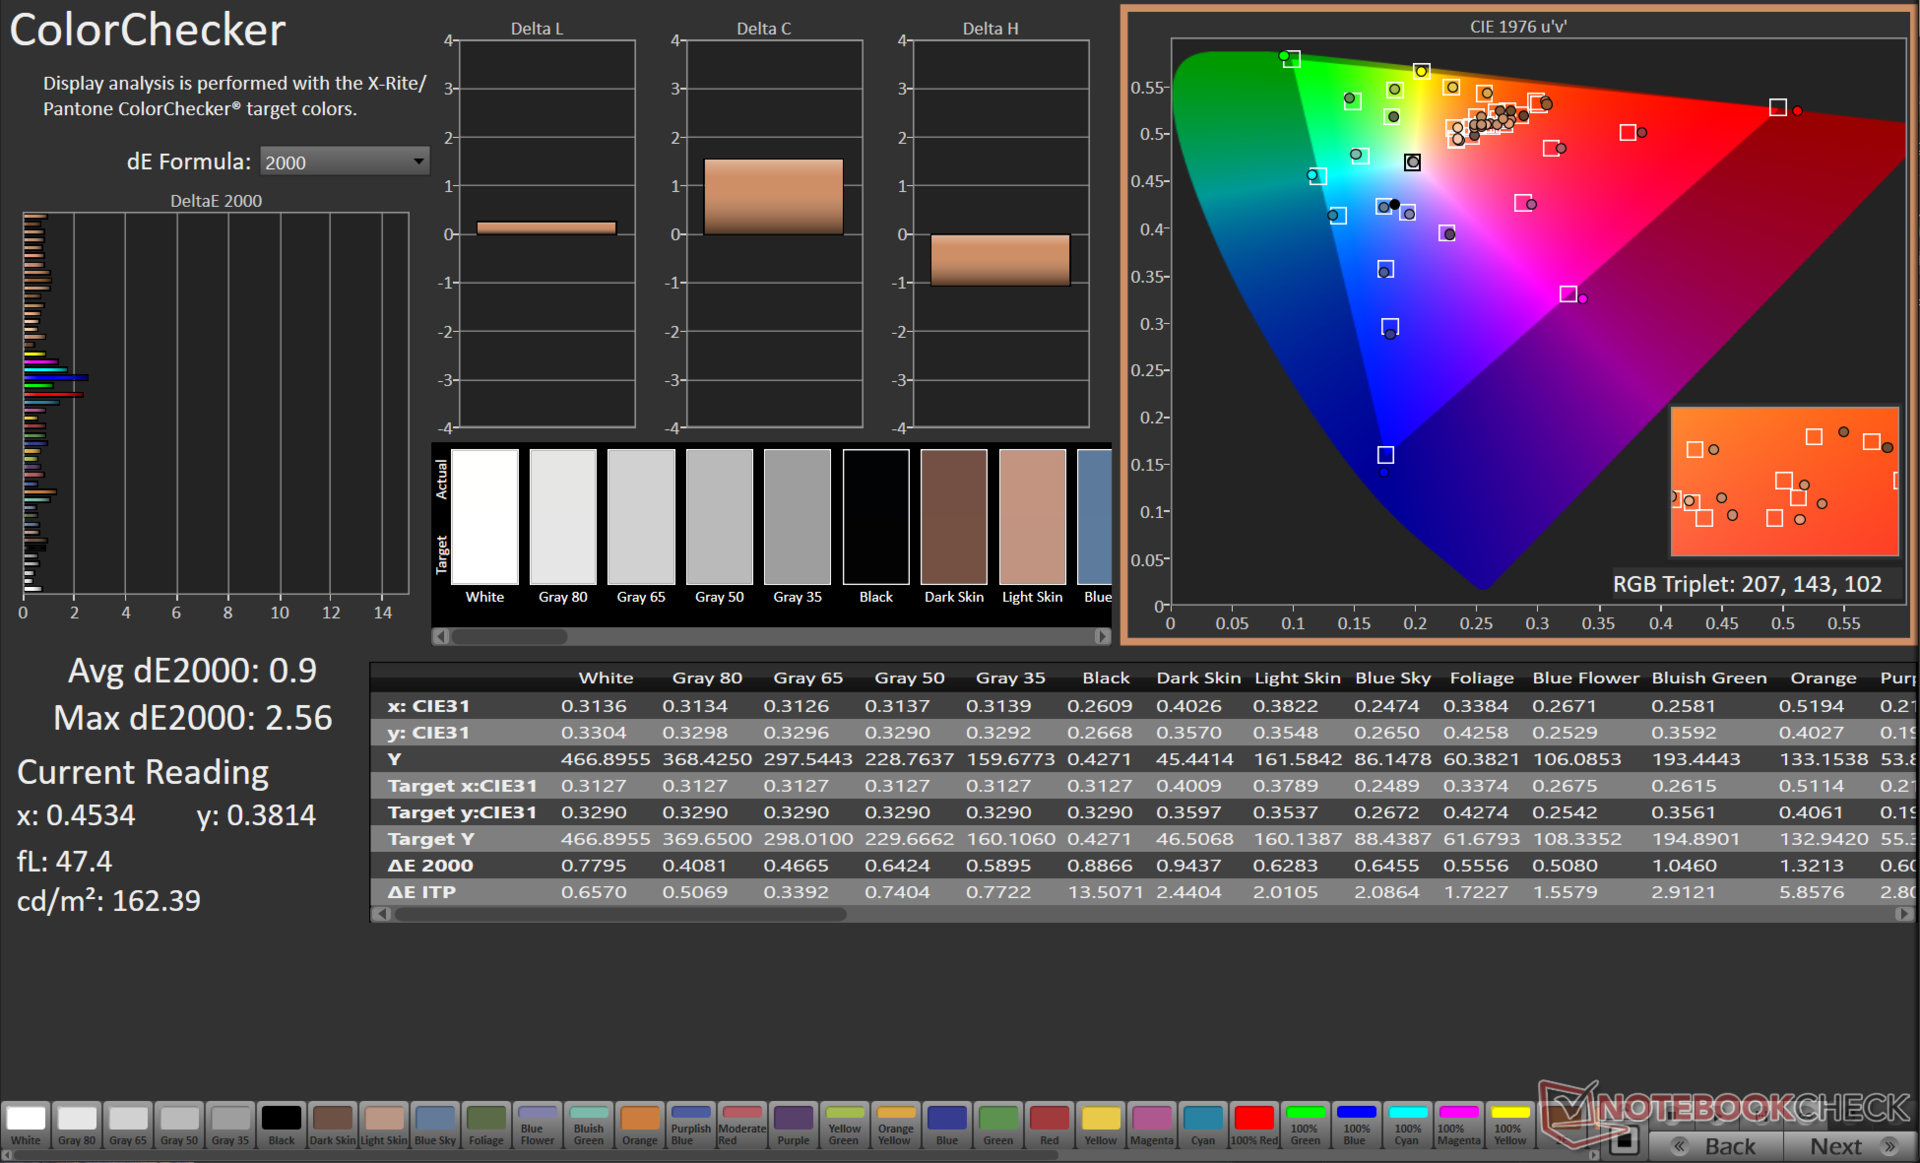
Wyświetlacz Scar 16 w pełni pokrywa przestrzenie barw sRGB i Display P3. Pokrycie Adobe RGB jest również dobre i wynosi prawie 91%, dzięki czemu Scar 16 jest bardzo przydatny zarówno do konsumpcji multimediów, jak i tworzenia treści.

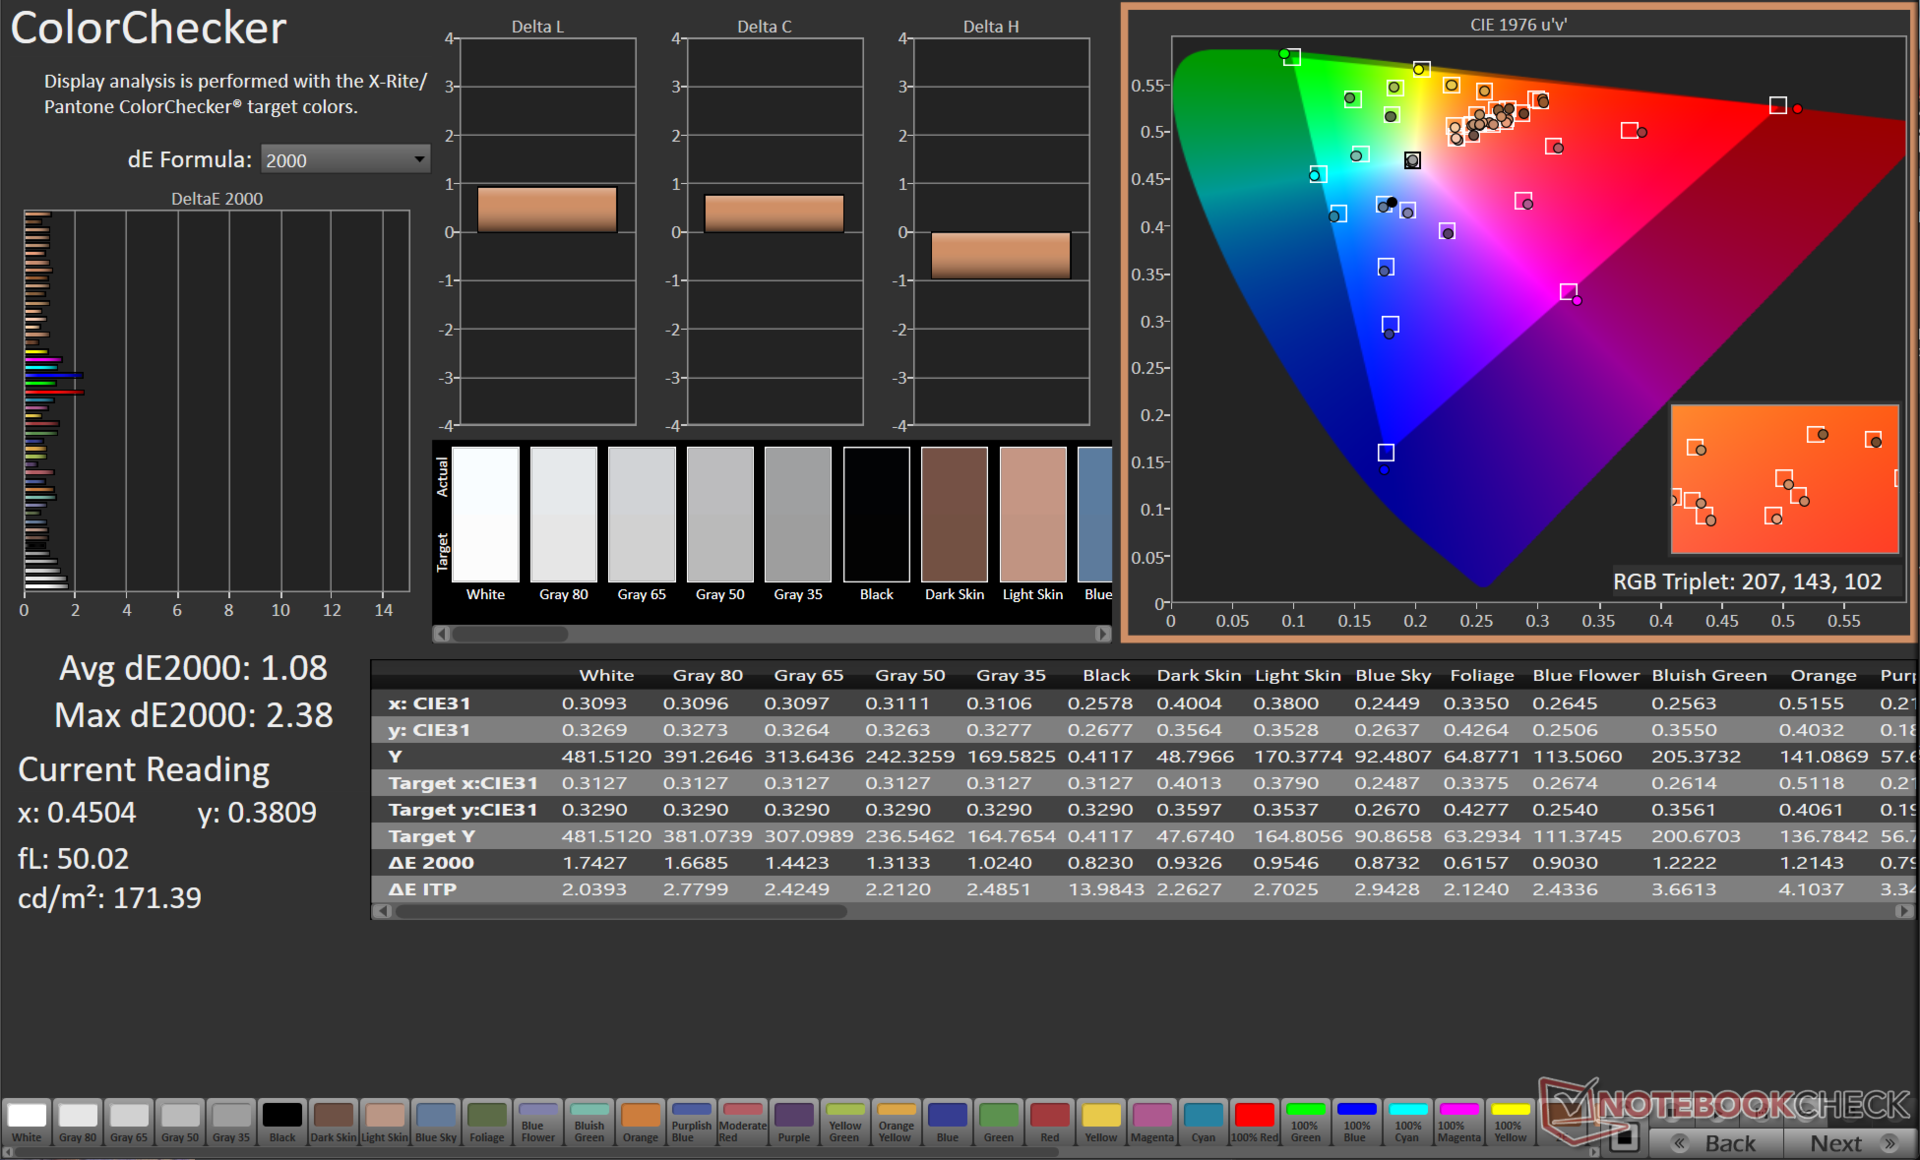
Wyświetlacz Scar 16 jest dobrze skalibrowany po wyjęciu z pudełka, a średnie wartości skali szarości i ColorChecker Delta E 2000 wynoszą odpowiednio 1,1 i 1,08.
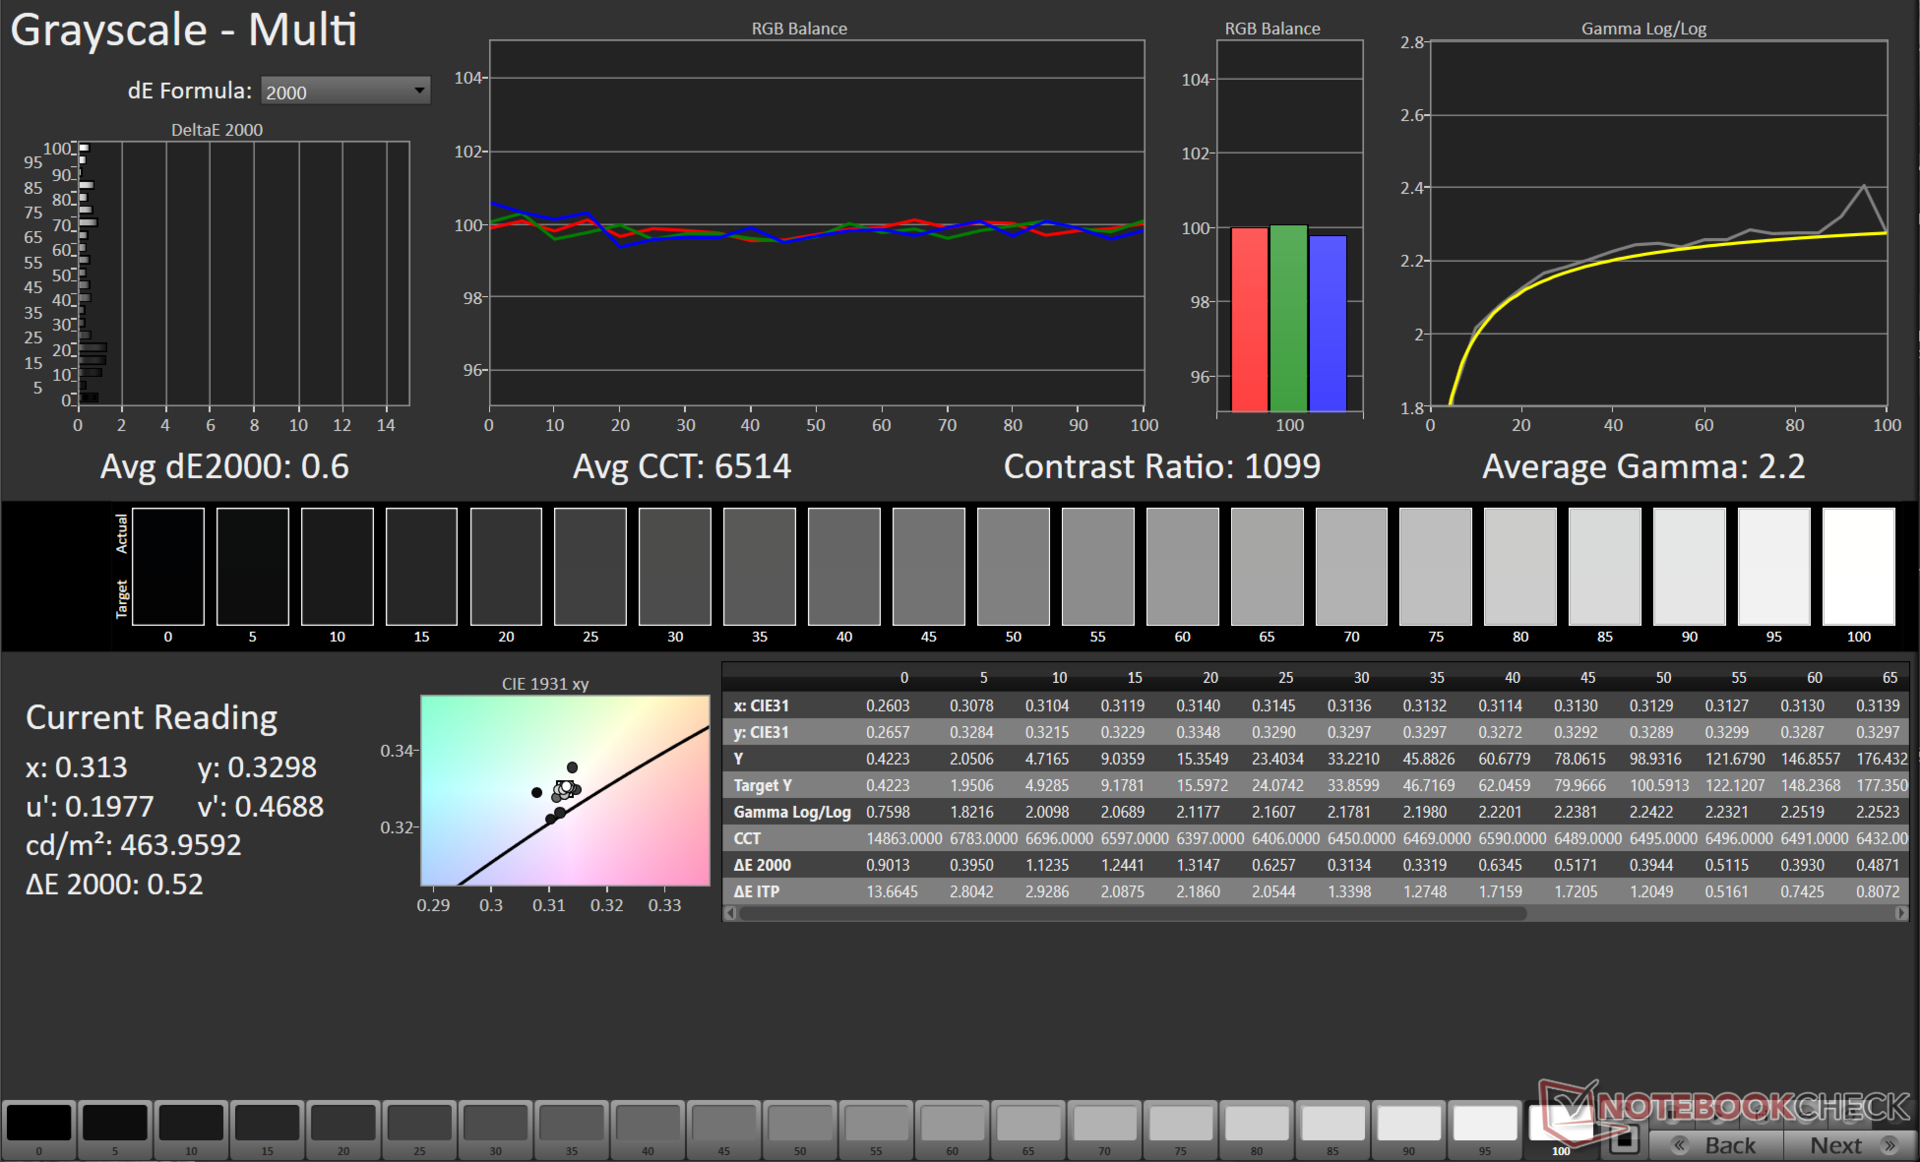
Nasza procedura kalibracji w przestrzeni kolorów Display P3 przy użyciu spektrofotometru X-Rite i1Basic Pro 3 i oprogramowania Calman Ultimate firmy Portrait Displays dodatkowo zawęża te odpowiednie wartości do 0,6 i 0,9.

Display Response Times
| ↔ Response Time Black to White | ||
|---|---|---|
| 10.4 ms ... rise ↗ and fall ↘ combined | ↗ 3 ms rise |  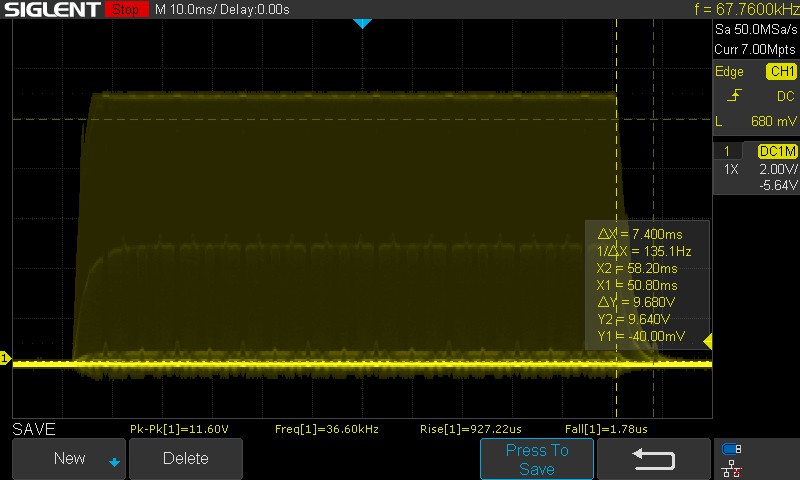 |
| ↘ 7.4 ms fall | ||
| The screen shows good response rates in our tests, but may be too slow for competitive gamers. In comparison, all tested devices range from 0.1 (minimum) to 240 (maximum) ms. » 23 % of all devices are better. This means that the measured response time is better than the average of all tested devices (21.5 ms). | ||
| ↔ Response Time 50% Grey to 80% Grey | ||
| 5 ms ... rise ↗ and fall ↘ combined | ↗ 2 ms rise | 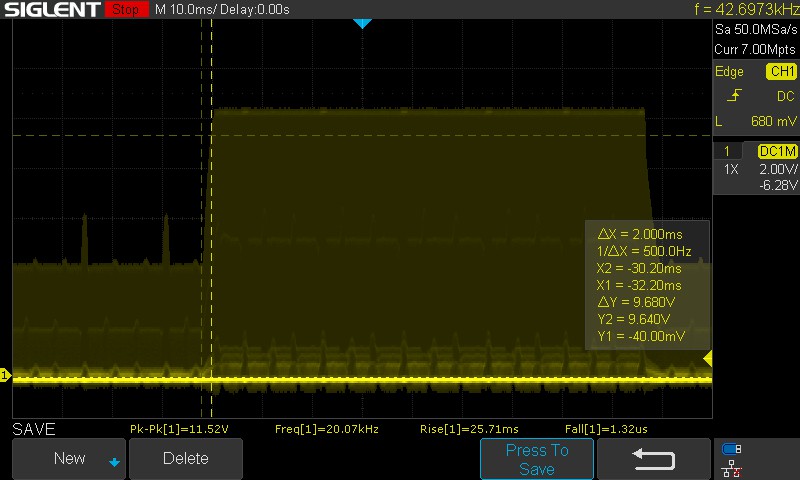 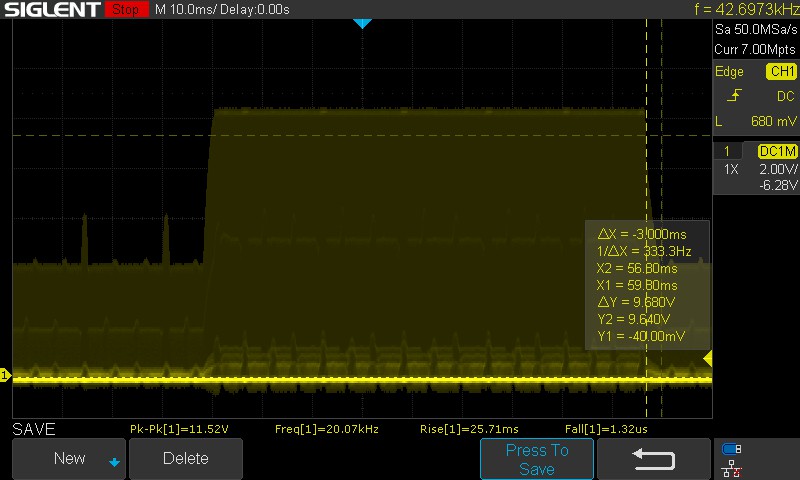 |
| ↘ 3 ms fall | ||
| The screen shows very fast response rates in our tests and should be very well suited for fast-paced gaming. In comparison, all tested devices range from 0.2 (minimum) to 636 (maximum) ms. » 12 % of all devices are better. This means that the measured response time is better than the average of all tested devices (33.7 ms). | ||
Musieliśmy ręcznie oszacować czasy reakcji ze względu na PWM w tle z mini panelem LED. Szacowane czasy reakcji wydają się przyzwoite jak na laptopa do gier.
Asus reklamuje czas reakcji na poziomie 3 ms, ale zmierzyliśmy 5 ms przy przejściach od 50% szarości do 80% szarości. Opcja overdrive panelu nie jest oferowana.
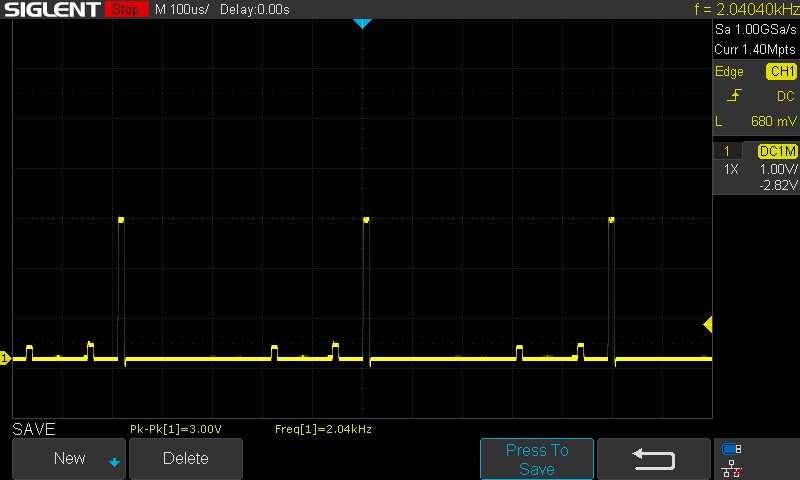
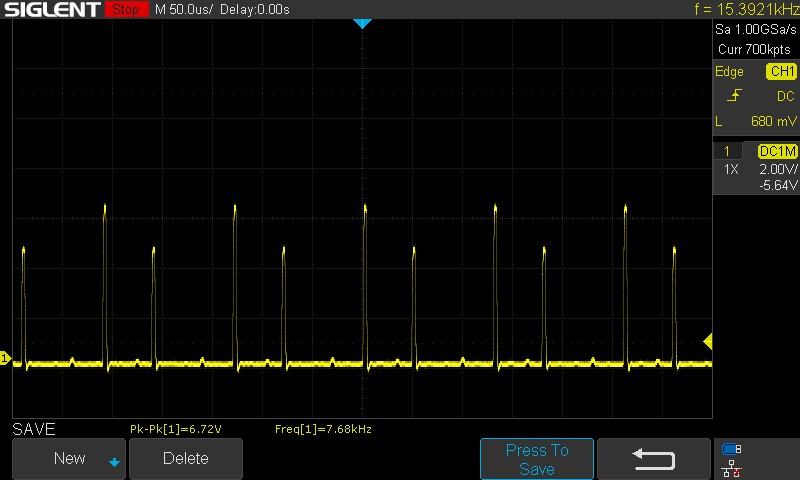
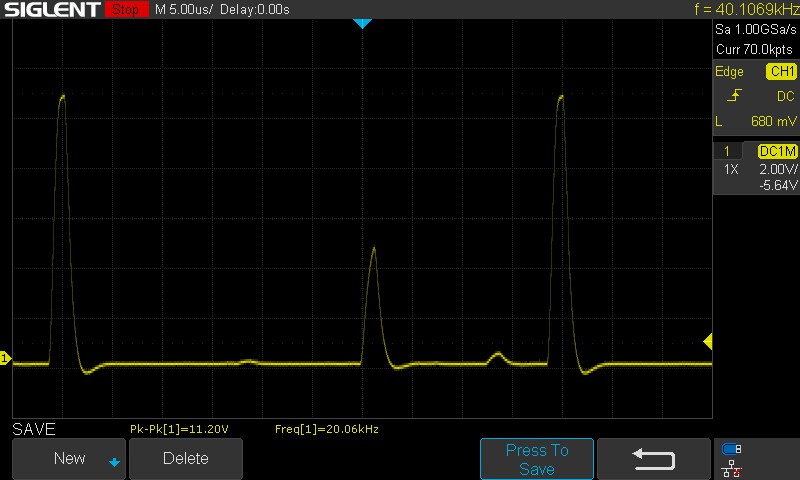
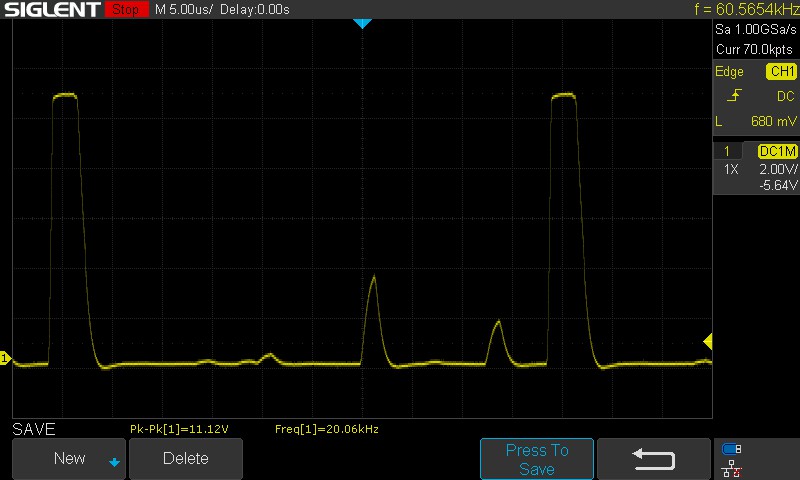
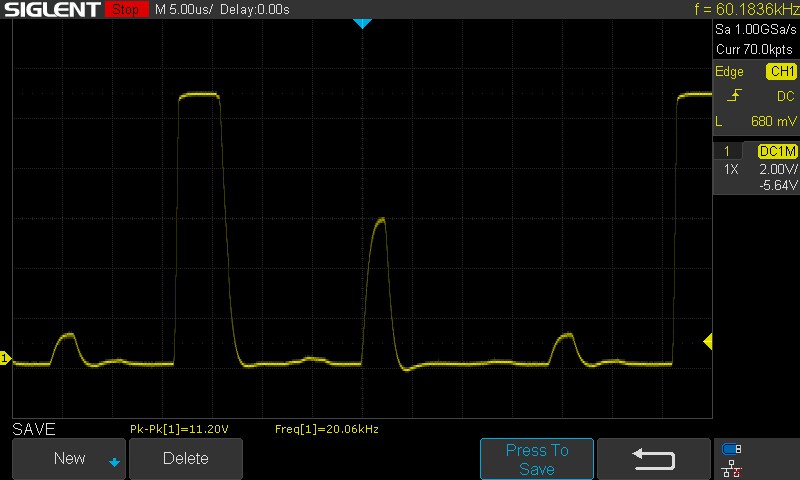
Screen Flickering / PWM (Pulse-Width Modulation)
| Screen flickering / PWM detected | 2040 Hz | ≤ 10 % brightness setting | 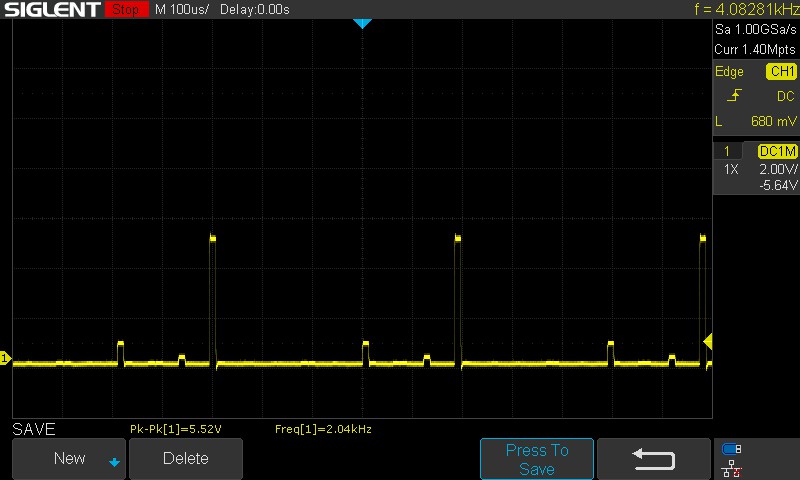 |
The display backlight flickers at 2040 Hz (worst case, e.g., utilizing PWM) Flickering detected at a brightness setting of 10 % and below. There should be no flickering or PWM above this brightness setting. The frequency of 2040 Hz is quite high, so most users sensitive to PWM should not notice any flickering. In comparison: 53 % of all tested devices do not use PWM to dim the display. If PWM was detected, an average of 17908 (minimum: 5 - maximum: 3846000) Hz was measured. | |||
Zarejestrowaliśmy częstotliwość PWM wynoszącą 2,04 kHZ przy suwaku jasności systemu Windows ustawionym na 10%. Od 50% do 100% jasności, wartość ta wzrasta do 20,06 kHz. Zmierzone wartości są dość wysokie, a zatem nie powinny powodować zmęczenia oczu nawet przy niższych poziomach jasności.
Proszę zapoznać się z naszym artykułem "Dlaczego PWM to taki ból głowy", aby uzyskać więcej informacji. Mamy również Ranking PWM na której znajdą Państwo pomiary częstotliwości wszystkich recenzowanych urządzeń.

Oglądanie na zewnątrz jest ogólnie w porządku, ale rażące słońce może powodować problemy z czytelnością treści na ekranie. Kąty widzenia są dość stabilne, bez zauważalnej utraty jasności lub informacji o kolorze w skrajnych przypadkach.

Wydajność: Core i9-14900HX wykazuje niewielki wzrost w porównaniu do Core i9-13980HX
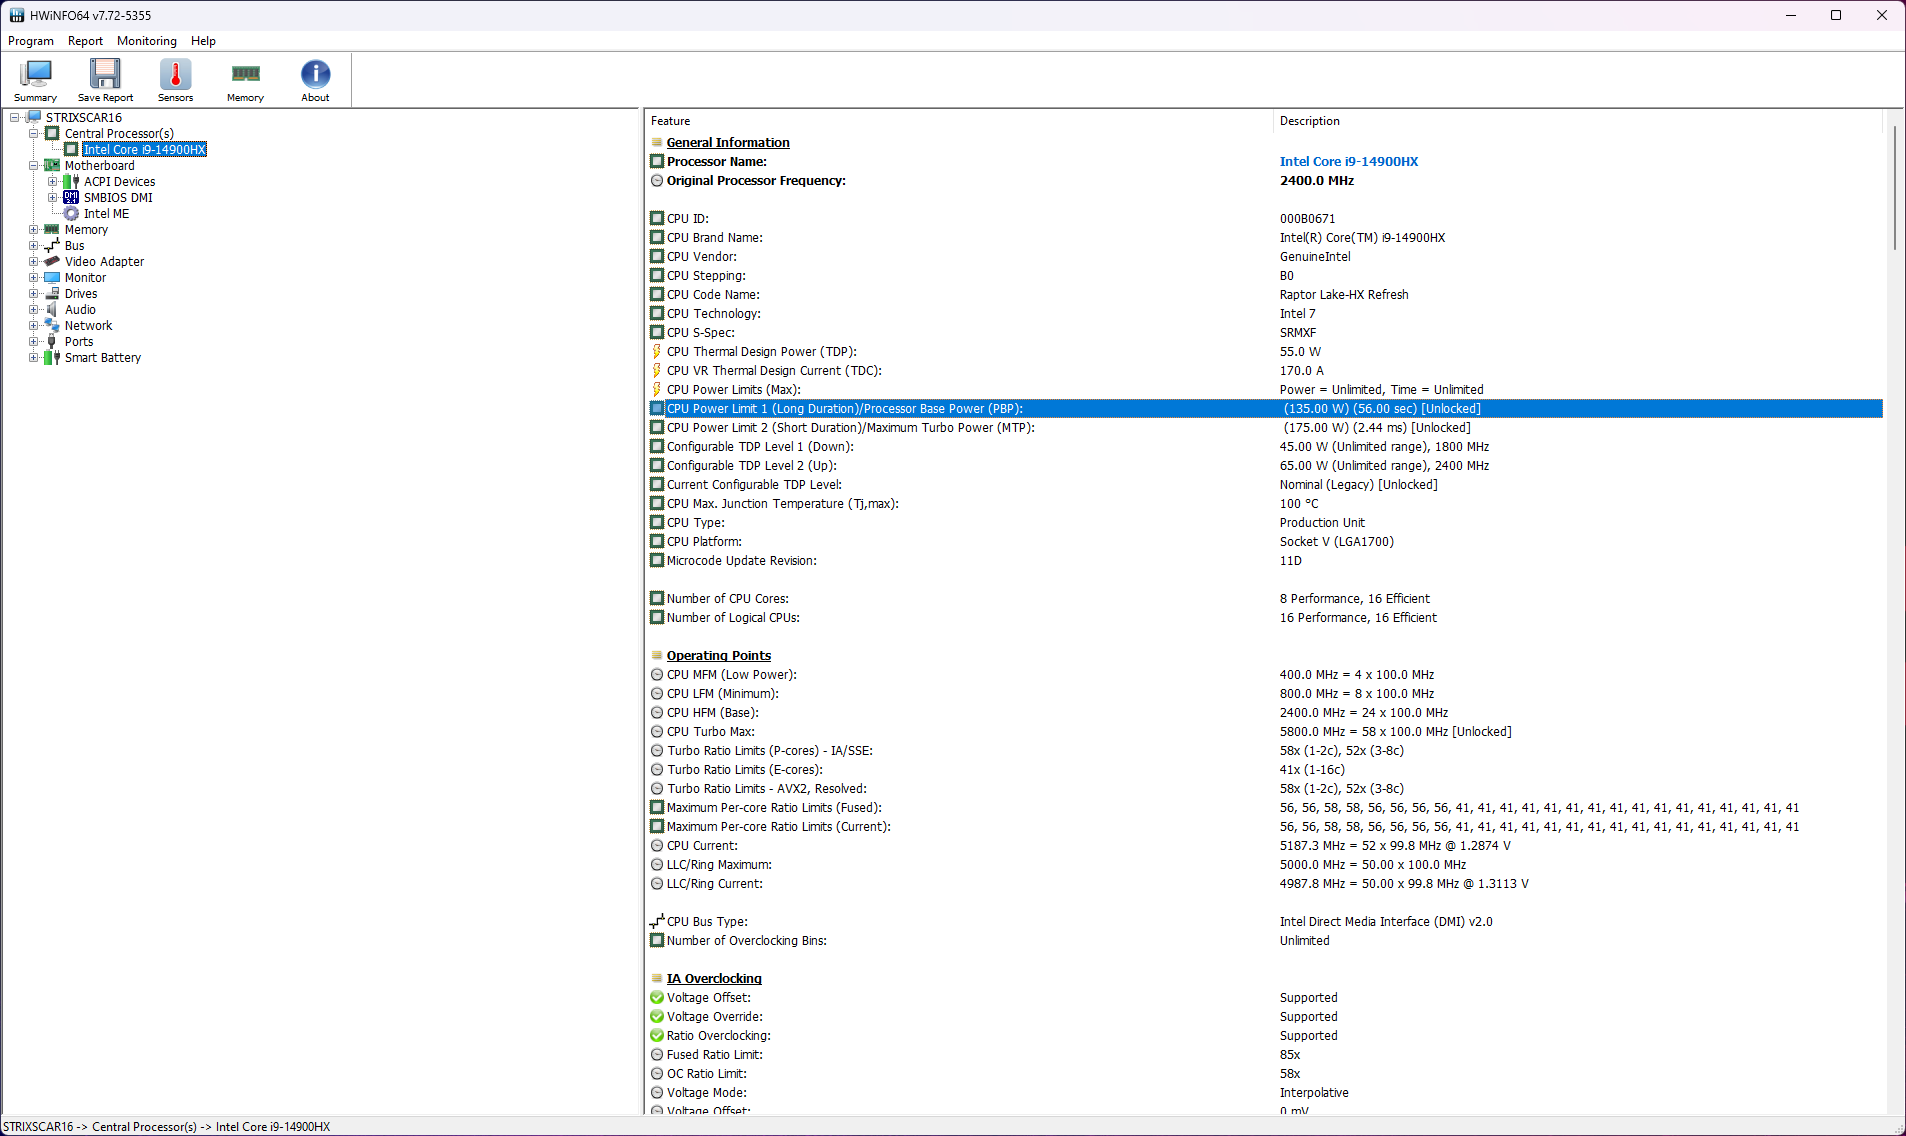
Asus oferuje ROG Strix Scar 16 w dwóch konfiguracjach, obie z Intel Core i9-14900HX procesorami. Jednostki SKU różnią się tylko GPU, z wyborem między Nvidia GeForce RTX 4080 i RTX 4090 GPU do laptopóws.
Warunki testowania
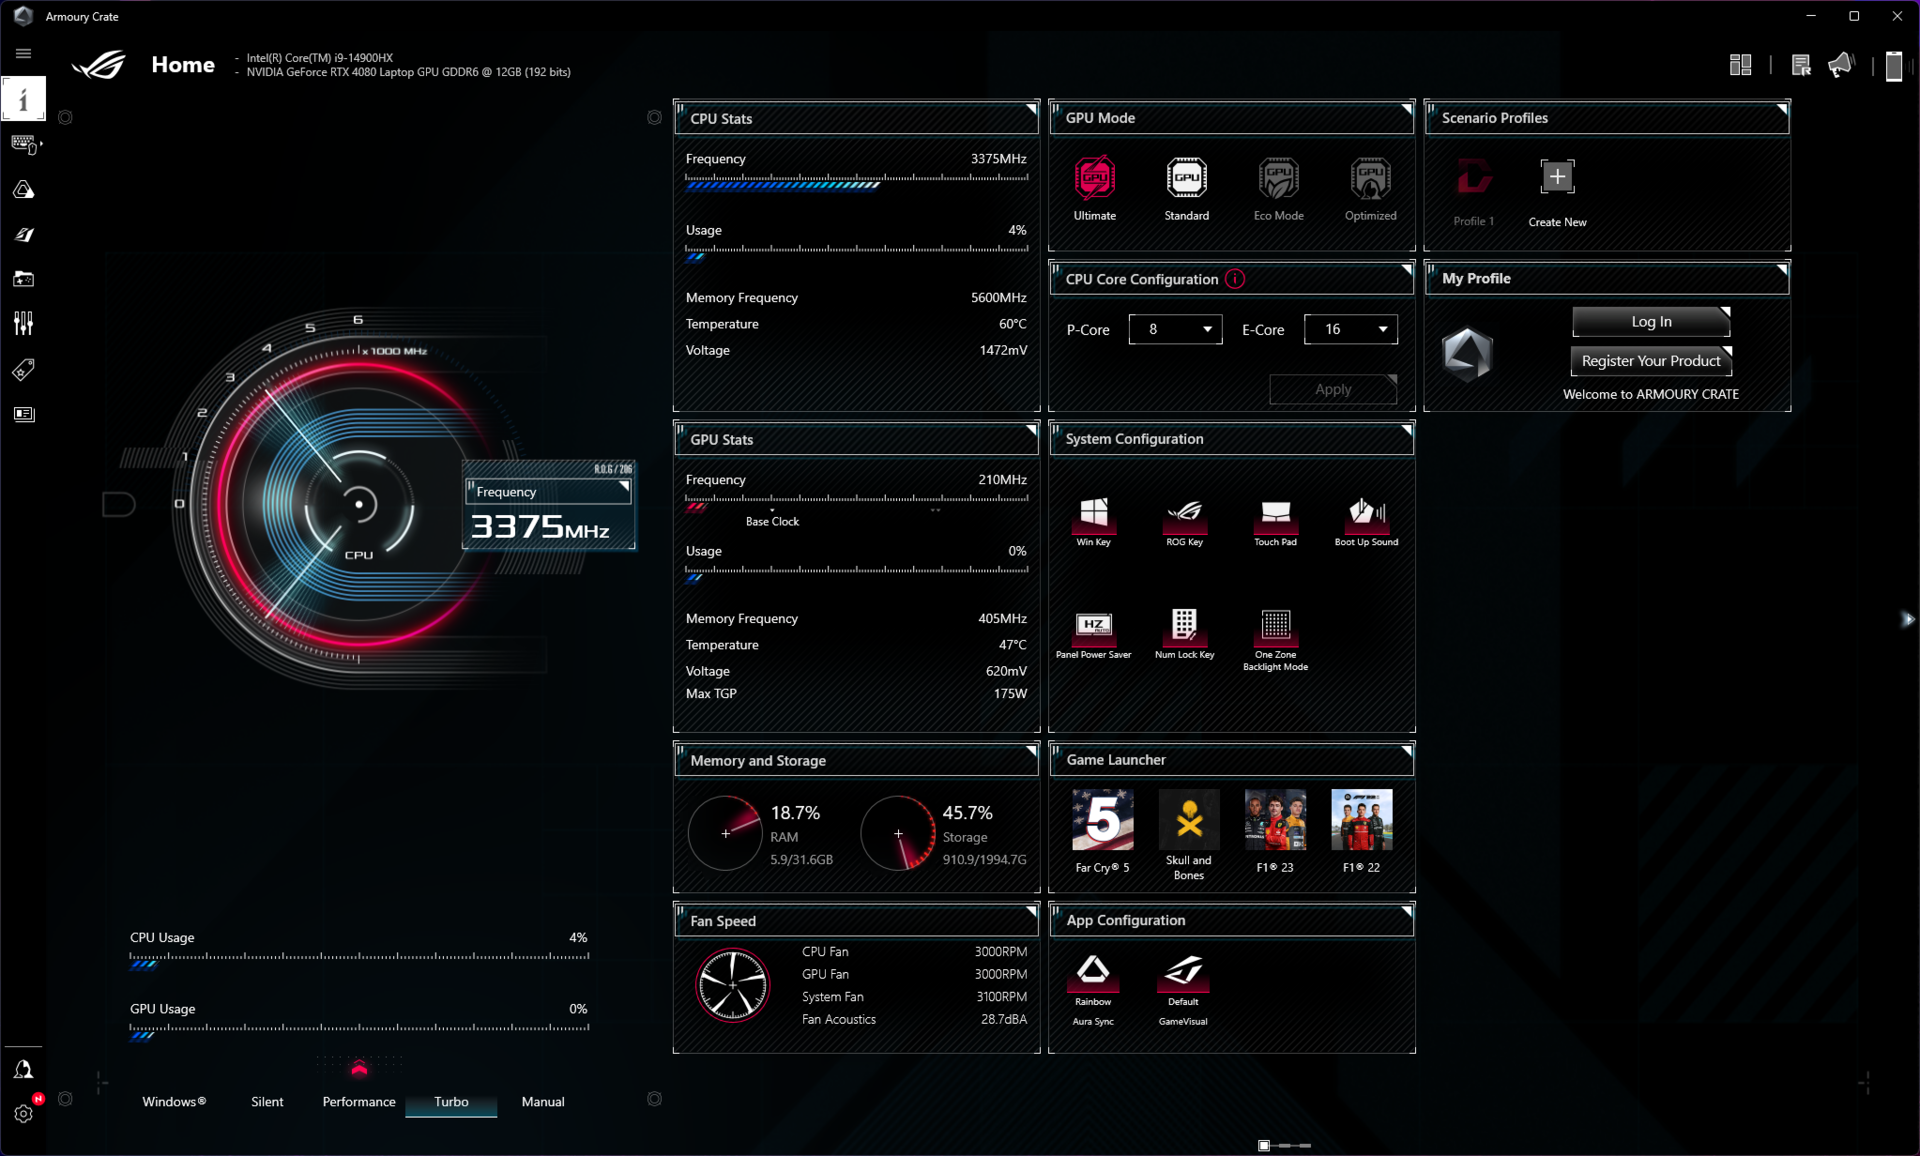
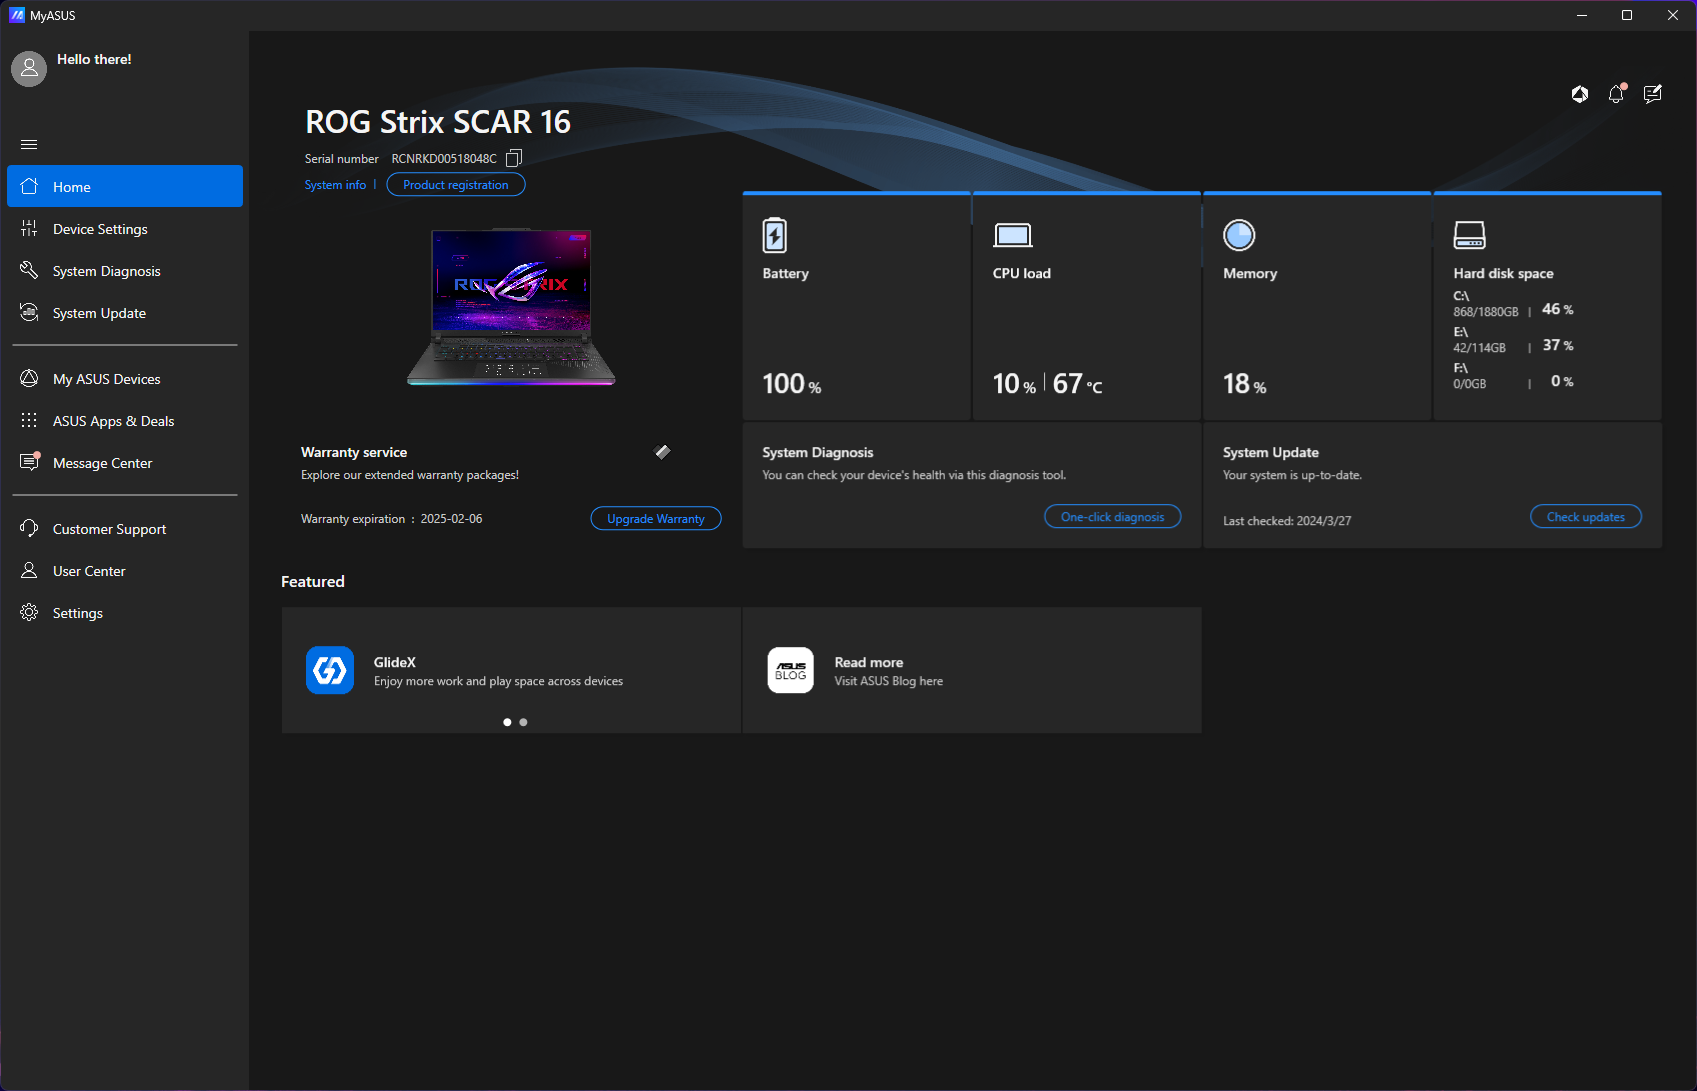
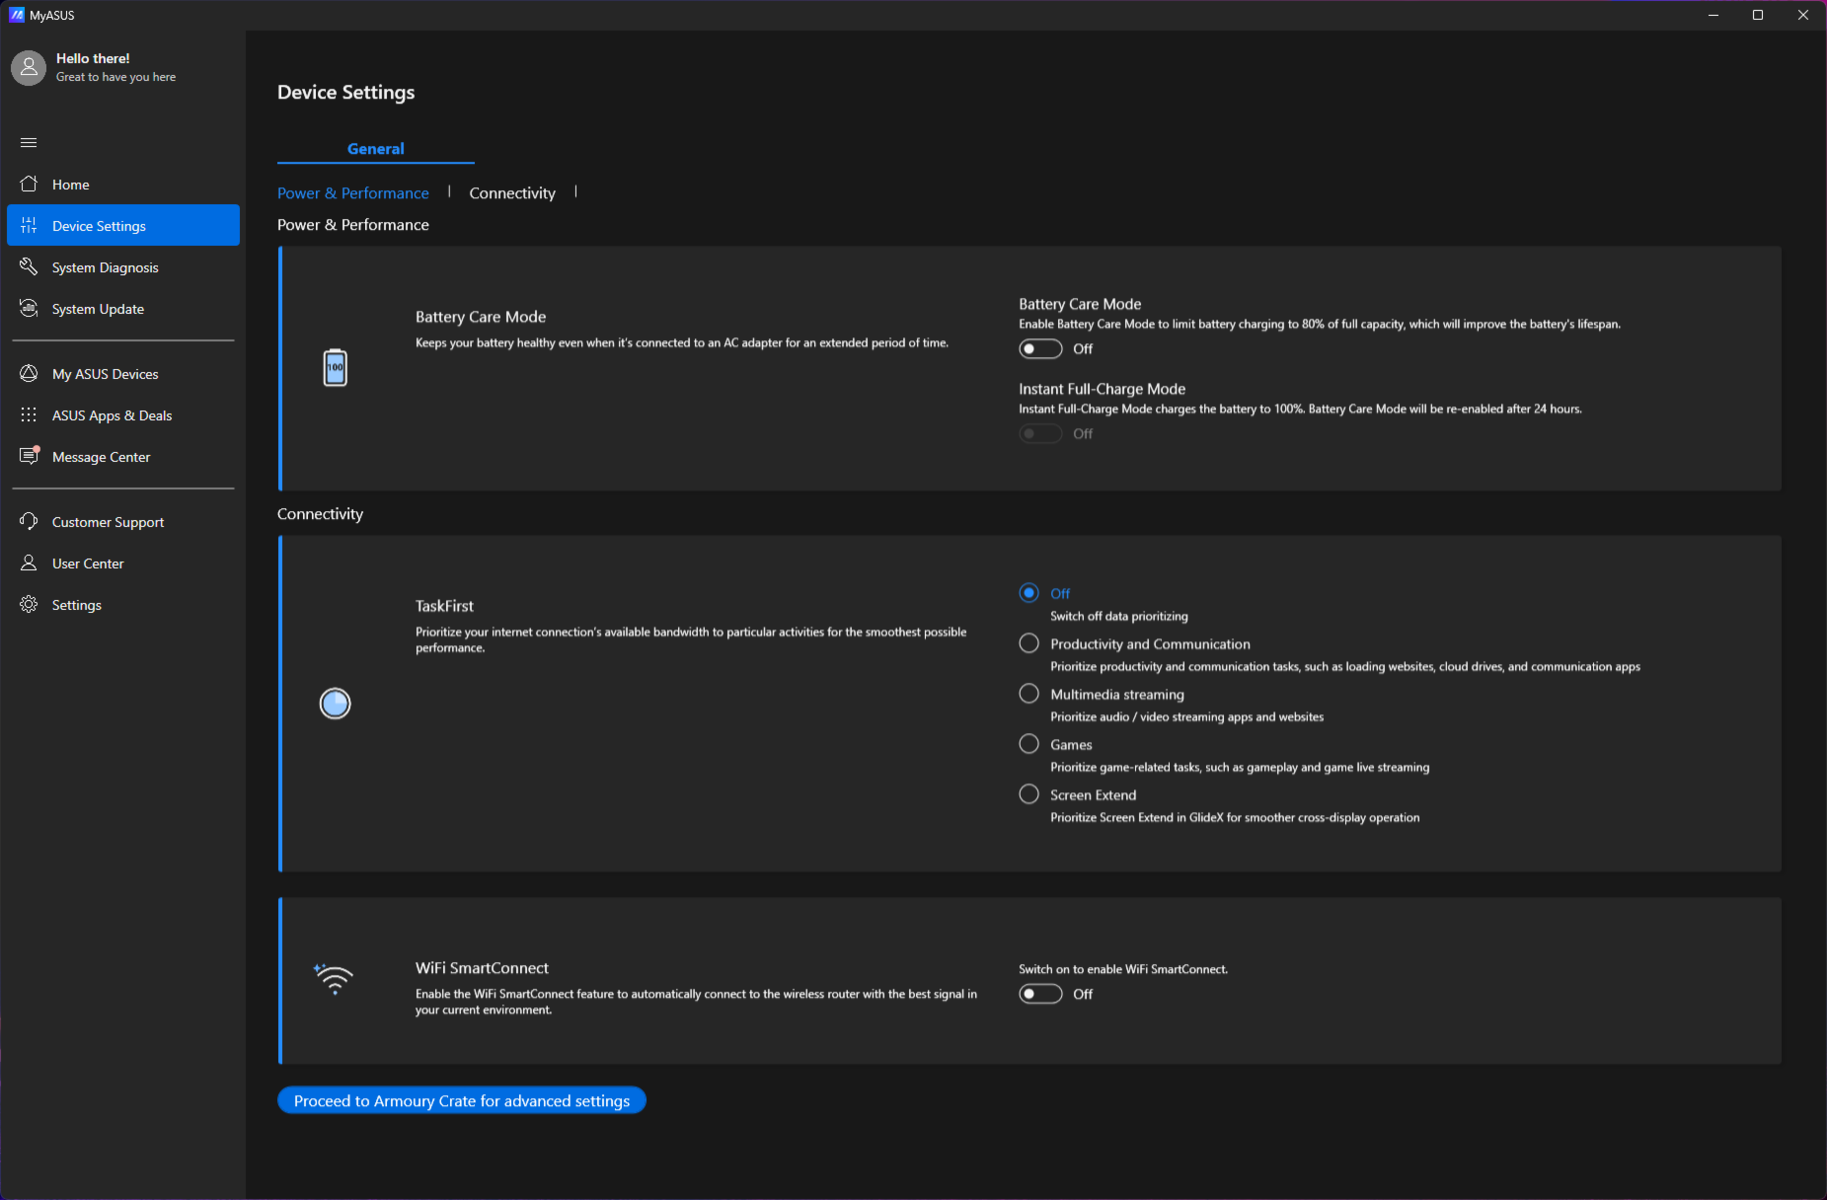
Tuning wydajności można przeprowadzić za pomocą Armory Crate. Asus dołącza również aplikację MyAsus, która oferuje funkcje pomocnicze, takie jak aktualizacje systemu, diagnostyka itp.
Scar 16 oferuje trzy podstawowe profile zasilania do wyboru: Silent, Performance i Turbo. Możliwe jest również korzystanie z planów zasilania systemu Windows zamiast tych dostępnych w Armory Crate. Dodatkowo dostępny jest tryb ręczny, który pozwala na konfigurację do 140 W PL1.
| Tryb wydajności | PL1 (PBP) / Tau | PL2 (MTP) / Tau | Cinebench R15 Multi score | Cinebench R15 Multi score (30 pętli) |
|---|---|---|---|---|
| Cisza | 70 W / 56 s | 100 W / 2,44 ms | 3904 (-15,14%) | 3435 (-20,98%) |
| Wydajność | 107 W / 56 s | 120 W / 2,44 ms | 4208 (-8,54%) | 4182 (-3,79%) |
| Turbo | 135 W / 56 s | 175 W / 2,44 ms | 4601 (100%) | 4347 (100%) |
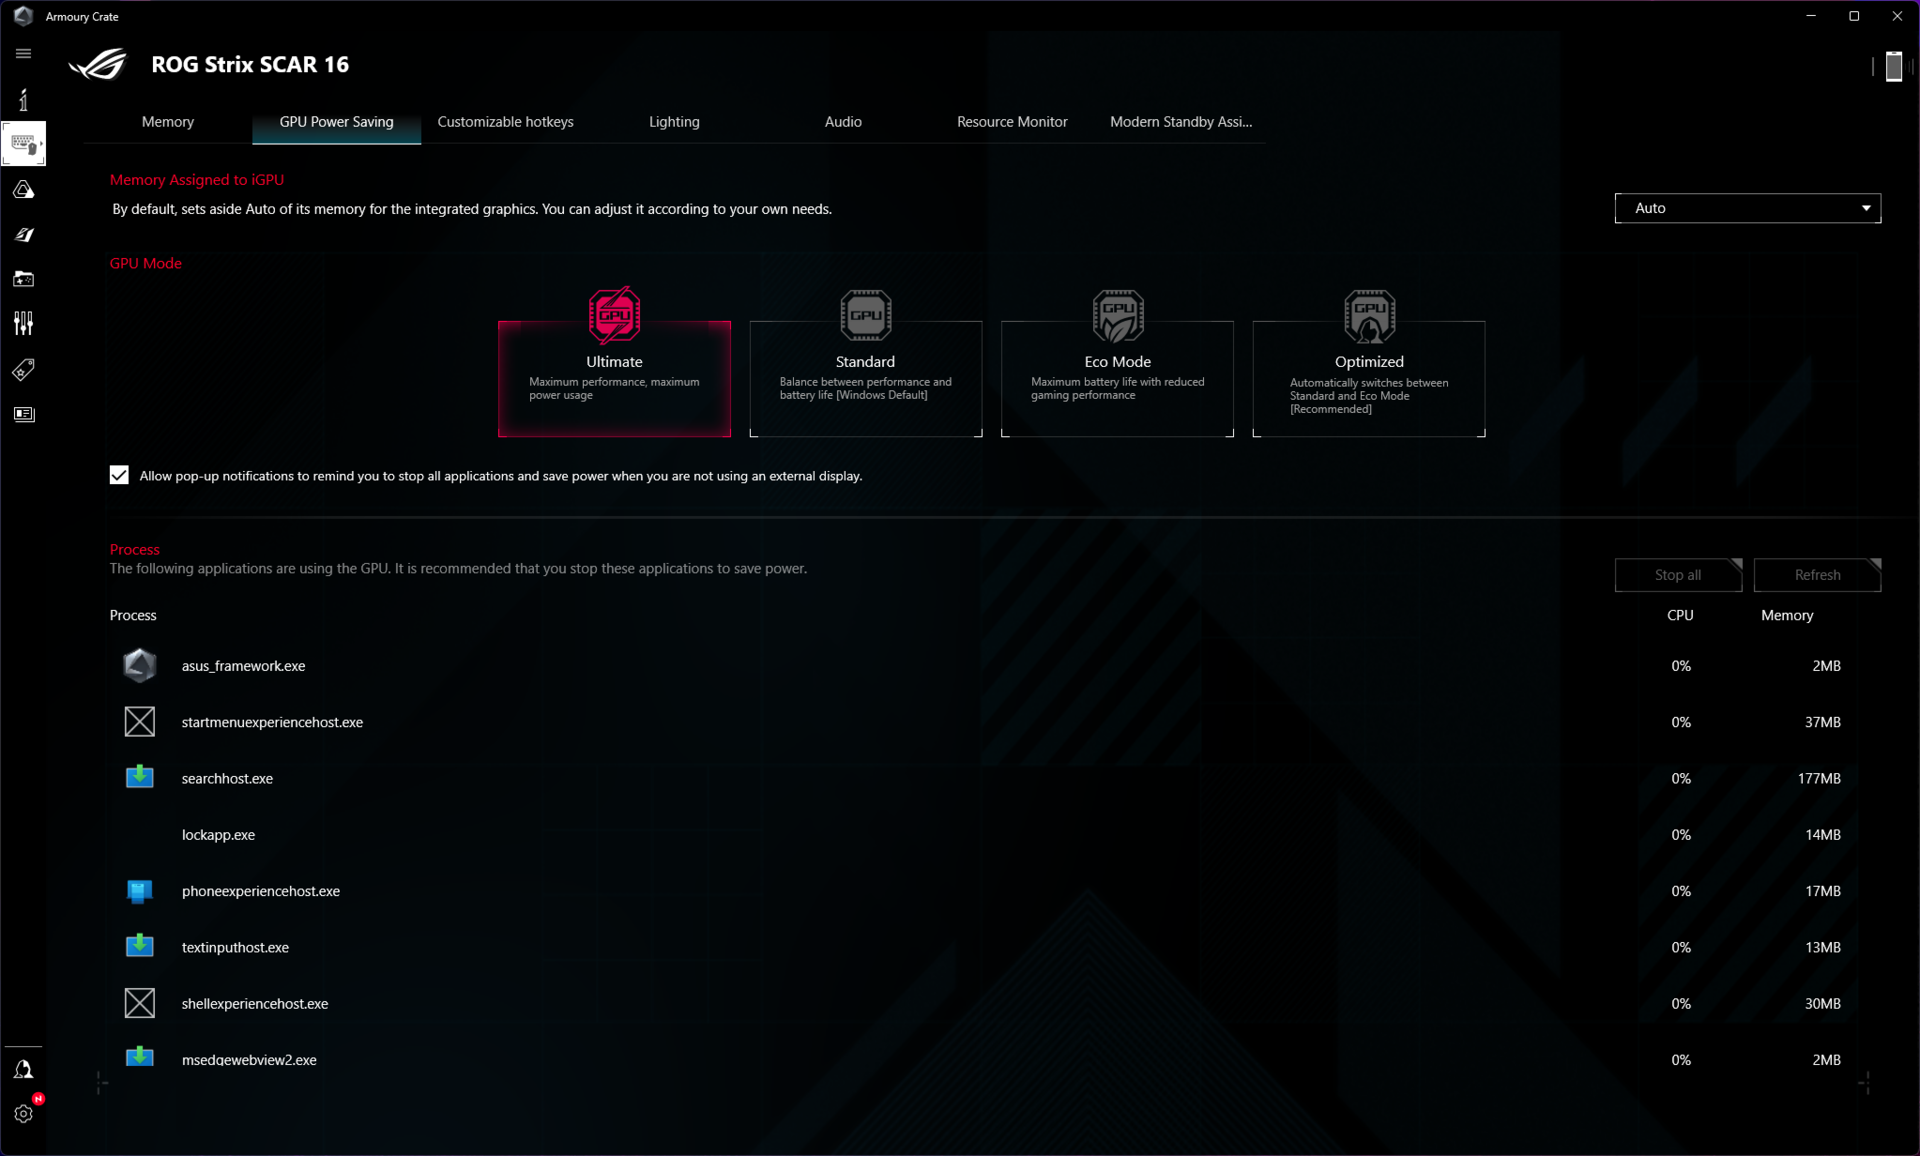
Obsługiwany jest tryb Nvidia Advanced Optimus, ale Asus oferuje również sprzętowy tryb MUX. Wszystkie testy porównawcze przeprowadziliśmy w trybie Turbo z MUX ustawionym na RTX 4080 dGPU.
Testy baterii zostały przeprowadzone w trybie cichym z włączonym MSHybrid.
Procesor
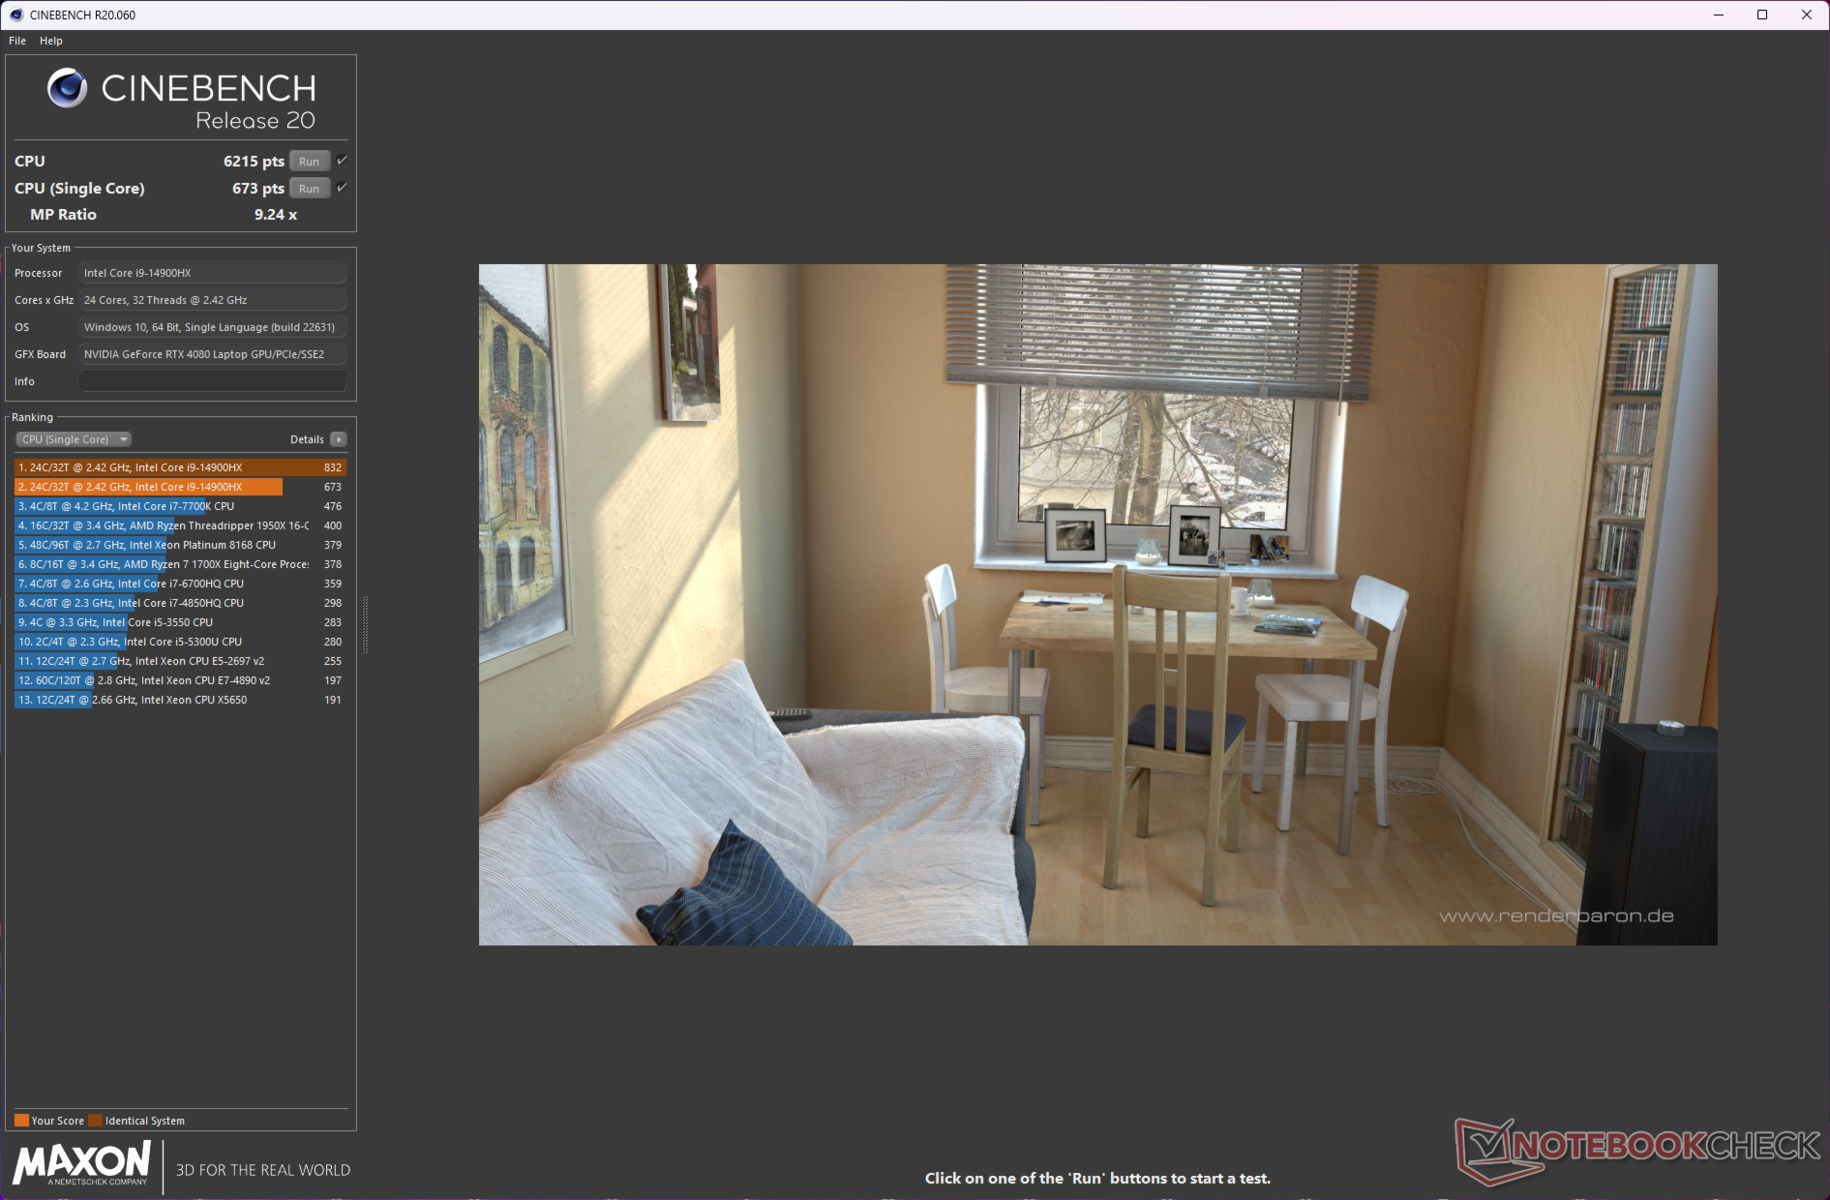
Core i9-14900HX jest dość podobny do Core i9-13980HX z 24 rdzeniami (8P + 16E) i 32 wątkami, ale z przyspieszeniem 5,8 GHz.
Raptor Lake-HX 14. generacji nie jest znaczącym ulepszeniem, a wzrost wydajności względem Core i9-13980HX mieści się w granicach błędu. Wydajność jednordzeniowa Scar 16 jest na równi z innymi laptopami z Core i9-14900HX w porównaniu.
Jednakże MSI Vector 16 HX z tym samym procesorem ma zauważalną przewagę w trybie wielordzeniowym ze względu na wyższą moc 184 W PL2. I odwrotnie, HP Omen 16core i9-14900HX o mocy 130 W PL2 plasuje się w tych testach za Scar 16.
Cinebench R15 Multi Loop
Cinebench R23: Multi Core | Single Core
Cinebench R20: CPU (Multi Core) | CPU (Single Core)
Cinebench R15: CPU Multi 64Bit | CPU Single 64Bit
Blender: v2.79 BMW27 CPU
7-Zip 18.03: 7z b 4 | 7z b 4 -mmt1
Geekbench 6.2: Multi-Core | Single-Core
Geekbench 5.5: Multi-Core | Single-Core
HWBOT x265 Benchmark v2.2: 4k Preset
LibreOffice : 20 Documents To PDF
R Benchmark 2.5: Overall mean
| CPU Performance Rating | |
| Lenovo Legion Pro 7 16IRX9H | |
| Asus ROG Strix Scar 17 G733PYV-LL053X | |
| Asus ROG Strix Scar 16 G634JZR | |
| MSI Vector 16 HX A14V | |
| Average Intel Core i9-14900HX | |
| Asus ROG Strix G16 G614JZ -2! | |
| HP Omen 16 (2024) | |
| Average of class Gaming | |
| Alienware m16 R2 -1! | |
| Cinebench R23 / Multi Core | |
| MSI Vector 16 HX A14V | |
| Asus ROG Strix Scar 17 G733PYV-LL053X | |
| Lenovo Legion Pro 7 16IRX9H | |
| Asus ROG Strix Scar 16 G634JZR | |
| Asus ROG Strix G16 G614JZ | |
| Average Intel Core i9-14900HX (20702 - 32996, n=23) | |
| HP Omen 16 (2024) | |
| Average of class Gaming (2435 - 34613, n=232, last 2 years) | |
| Alienware m16 R2 | |
| Cinebench R23 / Single Core | |
| Lenovo Legion Pro 7 16IRX9H | |
| HP Omen 16 (2024) | |
| MSI Vector 16 HX A14V | |
| Asus ROG Strix Scar 16 G634JZR | |
| Average Intel Core i9-14900HX (2043 - 2235, n=23) | |
| Asus ROG Strix G16 G614JZ | |
| Asus ROG Strix Scar 17 G733PYV-LL053X | |
| Average of class Gaming (527 - 2235, n=230, last 2 years) | |
| Alienware m16 R2 | |
| Cinebench R20 / CPU (Multi Core) | |
| Asus ROG Strix Scar 17 G733PYV-LL053X | |
| Lenovo Legion Pro 7 16IRX9H | |
| MSI Vector 16 HX A14V | |
| Asus ROG Strix Scar 16 G634JZR | |
| Asus ROG Strix G16 G614JZ | |
| Average Intel Core i9-14900HX (8427 - 12419, n=23) | |
| HP Omen 16 (2024) | |
| Average of class Gaming (930 - 13769, n=230, last 2 years) | |
| Alienware m16 R2 | |
| Cinebench R20 / CPU (Single Core) | |
| HP Omen 16 (2024) | |
| Asus ROG Strix Scar 16 G634JZR | |
| MSI Vector 16 HX A14V | |
| Average Intel Core i9-14900HX (779 - 859, n=23) | |
| Lenovo Legion Pro 7 16IRX9H | |
| Asus ROG Strix G16 G614JZ | |
| Asus ROG Strix Scar 17 G733PYV-LL053X | |
| Average of class Gaming (169 - 855, n=230, last 2 years) | |
| Alienware m16 R2 | |
| Cinebench R15 / CPU Multi 64Bit | |
| Asus ROG Strix Scar 17 G733PYV-LL053X | |
| Asus ROG Strix Scar 16 G634JZR | |
| Asus ROG Strix G16 G614JZ | |
| Asus ROG Strix G16 G614JZ | |
| Lenovo Legion Pro 7 16IRX9H | |
| MSI Vector 16 HX A14V | |
| Average Intel Core i9-14900HX (3263 - 4875, n=23) | |
| HP Omen 16 (2024) | |
| Average of class Gaming (400 - 5663, n=234, last 2 years) | |
| Alienware m16 R2 | |
| Cinebench R15 / CPU Single 64Bit | |
| Asus ROG Strix Scar 16 G634JZR | |
| Lenovo Legion Pro 7 16IRX9H | |
| Asus ROG Strix Scar 17 G733PYV-LL053X | |
| HP Omen 16 (2024) | |
| Average Intel Core i9-14900HX (287 - 320, n=23) | |
| MSI Vector 16 HX A14V | |
| Asus ROG Strix G16 G614JZ | |
| Asus ROG Strix G16 G614JZ | |
| Average of class Gaming (79.2 - 318, n=233, last 2 years) | |
| Alienware m16 R2 | |
| Blender / v2.79 BMW27 CPU | |
| Average of class Gaming (87 - 1259, n=228, last 2 years) | |
| HP Omen 16 (2024) | |
| Average Intel Core i9-14900HX (102 - 164, n=23) | |
| Asus ROG Strix Scar 16 G634JZR | |
| Asus ROG Strix G16 G614JZ | |
| Lenovo Legion Pro 7 16IRX9H | |
| MSI Vector 16 HX A14V | |
| Asus ROG Strix Scar 17 G733PYV-LL053X | |
| 7-Zip 18.03 / 7z b 4 | |
| Asus ROG Strix Scar 17 G733PYV-LL053X | |
| Lenovo Legion Pro 7 16IRX9H | |
| MSI Vector 16 HX A14V | |
| Asus ROG Strix Scar 16 G634JZR | |
| Asus ROG Strix G16 G614JZ | |
| Average Intel Core i9-14900HX (87555 - 127108, n=23) | |
| HP Omen 16 (2024) | |
| Average of class Gaming (11386 - 140932, n=229, last 2 years) | |
| Alienware m16 R2 | |
| 7-Zip 18.03 / 7z b 4 -mmt1 | |
| Asus ROG Strix Scar 17 G733PYV-LL053X | |
| Asus ROG Strix Scar 16 G634JZR | |
| Lenovo Legion Pro 7 16IRX9H | |
| HP Omen 16 (2024) | |
| MSI Vector 16 HX A14V | |
| Average Intel Core i9-14900HX (6206 - 7508, n=23) | |
| Asus ROG Strix G16 G614JZ | |
| Average of class Gaming (2685 - 7581, n=229, last 2 years) | |
| Alienware m16 R2 | |
| Geekbench 6.2 / Multi-Core | |
| Asus ROG Strix Scar 16 G634JZR | |
| Lenovo Legion Pro 7 16IRX9H | |
| MSI Vector 16 HX A14V | |
| Average Intel Core i9-14900HX (15849 - 18643, n=23) | |
| Asus ROG Strix Scar 17 G733PYV-LL053X | |
| HP Omen 16 (2024) | |
| Average of class Gaming (5340 - 18590, n=76, last 2 years) | |
| Alienware m16 R2 | |
| Geekbench 6.2 / Single-Core | |
| HP Omen 16 (2024) | |
| Lenovo Legion Pro 7 16IRX9H | |
| Asus ROG Strix Scar 16 G634JZR | |
| MSI Vector 16 HX A14V | |
| Average Intel Core i9-14900HX (2800 - 3095, n=23) | |
| Asus ROG Strix Scar 17 G733PYV-LL053X | |
| Average of class Gaming (1599 - 3095, n=76, last 2 years) | |
| Alienware m16 R2 | |
| Geekbench 5.5 / Multi-Core | |
| Asus ROG Strix Scar 16 G634JZR | |
| MSI Vector 16 HX A14V | |
| Lenovo Legion Pro 7 16IRX9H | |
| Asus ROG Strix Scar 17 G733PYV-LL053X | |
| Average Intel Core i9-14900HX (8618 - 21606, n=23) | |
| Asus ROG Strix G16 G614JZ | |
| HP Omen 16 (2024) | |
| Average of class Gaming (1946 - 22200, n=234, last 2 years) | |
| Alienware m16 R2 | |
| Geekbench 5.5 / Single-Core | |
| Asus ROG Strix Scar 16 G634JZR | |
| HP Omen 16 (2024) | |
| Asus ROG Strix Scar 17 G733PYV-LL053X | |
| MSI Vector 16 HX A14V | |
| Lenovo Legion Pro 7 16IRX9H | |
| Average Intel Core i9-14900HX (1669 - 2210, n=23) | |
| Asus ROG Strix G16 G614JZ | |
| Average of class Gaming (158 - 2210, n=234, last 2 years) | |
| Alienware m16 R2 | |
| HWBOT x265 Benchmark v2.2 / 4k Preset | |
| Asus ROG Strix Scar 17 G733PYV-LL053X | |
| Lenovo Legion Pro 7 16IRX9H | |
| MSI Vector 16 HX A14V | |
| Asus ROG Strix Scar 16 G634JZR | |
| Asus ROG Strix G16 G614JZ | |
| Average Intel Core i9-14900HX (22.7 - 34.4, n=23) | |
| HP Omen 16 (2024) | |
| Average of class Gaming (3 - 37.6, n=232, last 2 years) | |
| Alienware m16 R2 | |
| LibreOffice / 20 Documents To PDF | |
| Alienware m16 R2 | |
| Average of class Gaming (32.8 - 332, n=226, last 2 years) | |
| Asus ROG Strix Scar 16 G634JZR | |
| Asus ROG Strix G16 G614JZ | |
| MSI Vector 16 HX A14V | |
| HP Omen 16 (2024) | |
| Average Intel Core i9-14900HX (33.9 - 85.1, n=23) | |
| Asus ROG Strix Scar 17 G733PYV-LL053X | |
| Lenovo Legion Pro 7 16IRX9H | |
| R Benchmark 2.5 / Overall mean | |
| Alienware m16 R2 | |
| Average of class Gaming (0.3609 - 4.47, n=229, last 2 years) | |
| Asus ROG Strix Scar 17 G733PYV-LL053X | |
| Asus ROG Strix G16 G614JZ | |
| Lenovo Legion Pro 7 16IRX9H | |
| MSI Vector 16 HX A14V | |
| Average Intel Core i9-14900HX (0.3609 - 0.4225, n=23) | |
| HP Omen 16 (2024) | |
| Asus ROG Strix Scar 16 G634JZR | |
* ... im mniej tym lepiej
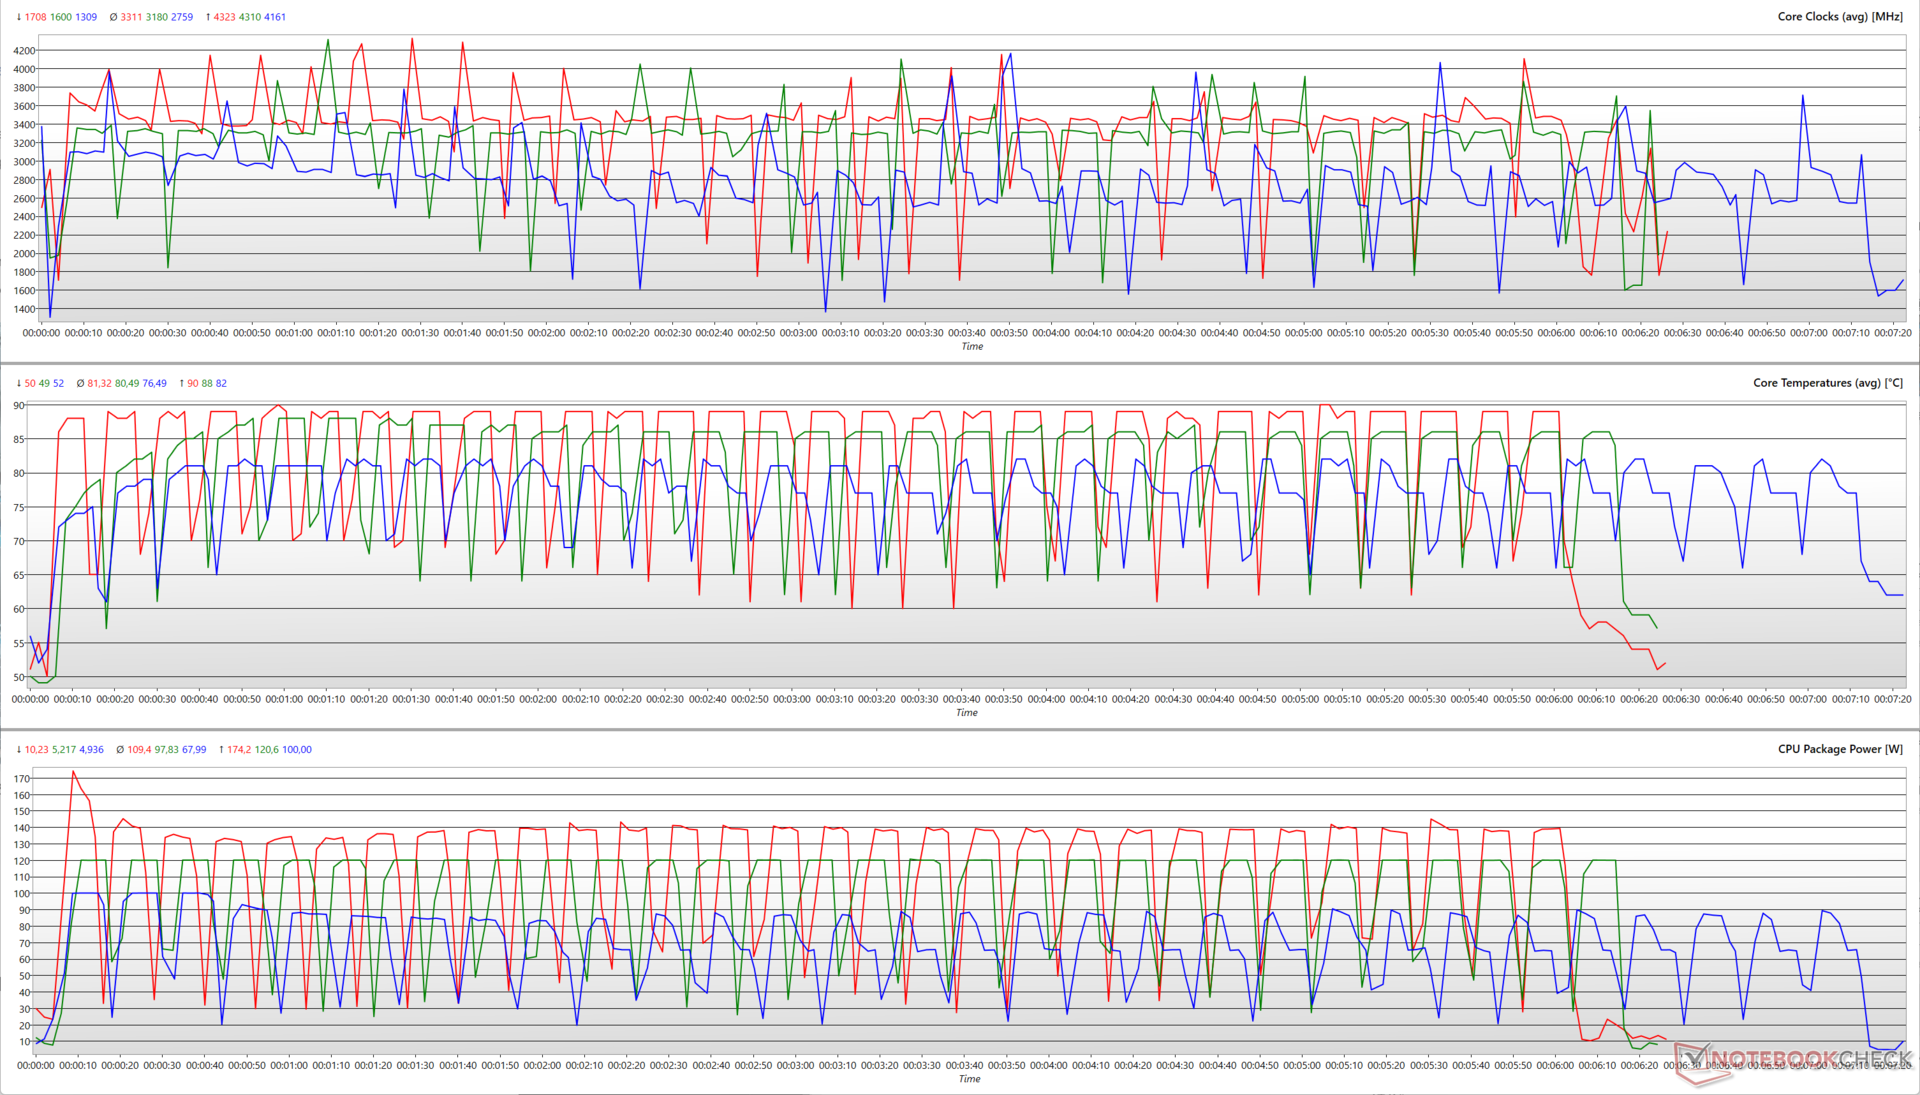
Uruchomienie wielordzeniowego Cinebench R15 dla 30 pętli pokazuje, że Core i9-14900HX jest w stanie wykorzystać pełny limit PL2 dozwolony w każdym trybie. W profilu Turbo, Core i9-14900HX jest w stanie osiągnąć 4,3 GHz boost przy 174 W, po czym osiąga średnie taktowanie 3,3 GHz przy 109 W.
Niemniej jednak, procesor jest w stanie osiągnąć podobne taktowanie przy 120 W w trybie Performance, podczas gdy średnie zegary oscylują na poziomie 3,18 GHz przy 97,8 W średniej mocy pakietu.
W trybie cichym średni pobór mocy pakietu wynosi 68 W przy średnich zegarach 2,76 GHz. Procesor jest w stanie osiągnąć maksymalne taktowanie 4,16 GHz przy 100 W w tym trybie.
Wyniki Cinebench R20 na zasilaniu bateryjnym spadły odpowiednio o 19,78% i 46,44% w trybie jednordzeniowym i wielordzeniowym.
AIDA64: FP32 Ray-Trace | FPU Julia | CPU SHA3 | CPU Queen | FPU SinJulia | FPU Mandel | CPU AES | CPU ZLib | FP64 Ray-Trace | CPU PhotoWorxx
| Performance Rating | |
| Asus ROG Strix Scar 17 G733PYV-LL053X | |
| MSI Vector 16 HX A14V | |
| Lenovo Legion Pro 7 16IRX9H | |
| Asus ROG Strix Scar 16 G634JZR | |
| Asus ROG Strix G16 G614JZ | |
| Average Intel Core i9-14900HX | |
| HP Omen 16 (2024) | |
| Average of class Gaming | |
| Alienware m16 R2 | |
| AIDA64 / FP32 Ray-Trace | |
| Asus ROG Strix Scar 17 G733PYV-LL053X | |
| MSI Vector 16 HX A14V | |
| Lenovo Legion Pro 7 16IRX9H | |
| Asus ROG Strix G16 G614JZ | |
| Asus ROG Strix Scar 16 G634JZR | |
| Average Intel Core i9-14900HX (17244 - 29351, n=22) | |
| Average of class Gaming (3069 - 60169, n=225, last 2 years) | |
| Alienware m16 R2 | |
| HP Omen 16 (2024) | |
| AIDA64 / FPU Julia | |
| Asus ROG Strix Scar 17 G733PYV-LL053X | |
| MSI Vector 16 HX A14V | |
| Lenovo Legion Pro 7 16IRX9H | |
| Asus ROG Strix G16 G614JZ | |
| Average Intel Core i9-14900HX (88537 - 148888, n=22) | |
| Asus ROG Strix Scar 16 G634JZR | |
| Average of class Gaming (18567 - 252486, n=225, last 2 years) | |
| Alienware m16 R2 | |
| HP Omen 16 (2024) | |
| AIDA64 / CPU SHA3 | |
| Asus ROG Strix Scar 17 G733PYV-LL053X | |
| Lenovo Legion Pro 7 16IRX9H | |
| MSI Vector 16 HX A14V | |
| Asus ROG Strix Scar 16 G634JZR | |
| Asus ROG Strix G16 G614JZ | |
| Average Intel Core i9-14900HX (4267 - 7229, n=22) | |
| HP Omen 16 (2024) | |
| Average of class Gaming (629 - 10389, n=225, last 2 years) | |
| Alienware m16 R2 | |
| AIDA64 / CPU Queen | |
| Asus ROG Strix Scar 17 G733PYV-LL053X | |
| Asus ROG Strix Scar 16 G634JZR | |
| Lenovo Legion Pro 7 16IRX9H | |
| Asus ROG Strix G16 G614JZ | |
| MSI Vector 16 HX A14V | |
| Average Intel Core i9-14900HX (118405 - 148773, n=22) | |
| HP Omen 16 (2024) | |
| Average of class Gaming (15371 - 200651, n=225, last 2 years) | |
| Alienware m16 R2 | |
| AIDA64 / FPU SinJulia | |
| Asus ROG Strix Scar 17 G733PYV-LL053X | |
| Asus ROG Strix G16 G614JZ | |
| Lenovo Legion Pro 7 16IRX9H | |
| MSI Vector 16 HX A14V | |
| Asus ROG Strix Scar 16 G634JZR | |
| Average Intel Core i9-14900HX (12217 - 18256, n=22) | |
| HP Omen 16 (2024) | |
| Average of class Gaming (2137 - 32988, n=225, last 2 years) | |
| Alienware m16 R2 | |
| AIDA64 / FPU Mandel | |
| Asus ROG Strix Scar 17 G733PYV-LL053X | |
| MSI Vector 16 HX A14V | |
| Lenovo Legion Pro 7 16IRX9H | |
| Asus ROG Strix G16 G614JZ | |
| Asus ROG Strix Scar 16 G634JZR | |
| Average Intel Core i9-14900HX (43302 - 72594, n=22) | |
| Average of class Gaming (10291 - 134044, n=225, last 2 years) | |
| Alienware m16 R2 | |
| HP Omen 16 (2024) | |
| AIDA64 / CPU AES | |
| Asus ROG Strix Scar 17 G733PYV-LL053X | |
| Asus ROG Strix Scar 16 G634JZR | |
| Average Intel Core i9-14900HX (86964 - 241777, n=22) | |
| Lenovo Legion Pro 7 16IRX9H | |
| MSI Vector 16 HX A14V | |
| Asus ROG Strix G16 G614JZ | |
| Average of class Gaming (19065 - 328679, n=225, last 2 years) | |
| HP Omen 16 (2024) | |
| Alienware m16 R2 | |
| AIDA64 / CPU ZLib | |
| Lenovo Legion Pro 7 16IRX9H | |
| MSI Vector 16 HX A14V | |
| Asus ROG Strix Scar 17 G733PYV-LL053X | |
| Asus ROG Strix G16 G614JZ | |
| Asus ROG Strix Scar 16 G634JZR | |
| Average Intel Core i9-14900HX (1265 - 2149, n=22) | |
| HP Omen 16 (2024) | |
| Average of class Gaming (150.9 - 2409, n=225, last 2 years) | |
| Alienware m16 R2 | |
| AIDA64 / FP64 Ray-Trace | |
| Asus ROG Strix Scar 17 G733PYV-LL053X | |
| MSI Vector 16 HX A14V | |
| Lenovo Legion Pro 7 16IRX9H | |
| Asus ROG Strix G16 G614JZ | |
| Asus ROG Strix Scar 16 G634JZR | |
| Average Intel Core i9-14900HX (9170 - 16128, n=22) | |
| Average of class Gaming (1518 - 31796, n=225, last 2 years) | |
| Alienware m16 R2 | |
| HP Omen 16 (2024) | |
| AIDA64 / CPU PhotoWorxx | |
| Asus ROG Strix Scar 16 G634JZR | |
| HP Omen 16 (2024) | |
| MSI Vector 16 HX A14V | |
| Average Intel Core i9-14900HX (33960 - 51118, n=22) | |
| Lenovo Legion Pro 7 16IRX9H | |
| Alienware m16 R2 | |
| Asus ROG Strix G16 G614JZ | |
| Average of class Gaming (10805 - 60161, n=226, last 2 years) | |
| Asus ROG Strix Scar 17 G733PYV-LL053X | |
Więcej informacji i porównań wydajności można znaleźć w naszym dedykowanym artykule Intel Core i9-14900HX strona.
Wydajność systemu
Scar 16 pozostaje nieco w tyle za Lenovo Legion Pro 7 w testach PCMark 10 i CrossMark. Biorąc to pod uwagę, laptop jest dość responsywny w codziennych zadaniach i nie ma zbyt wielu obciążeń, które mogłyby ograniczać jego wydajność.
CrossMark: Overall | Productivity | Creativity | Responsiveness
AIDA64: Memory Copy | Memory Read | Memory Write | Memory Latency
WebXPRT 3: Overall
WebXPRT 4: Overall
Mozilla Kraken 1.1: Total
| PCMark 10 / Score | |
| Asus ROG Strix Scar 17 G733PYV-LL053X | |
| Lenovo Legion Pro 7 16IRX9H | |
| HP Omen 16 (2024) | |
| MSI Vector 16 HX A14V | |
| Average Intel Core i9-14900HX, NVIDIA GeForce RTX 4080 Laptop GPU (7703 - 8923, n=4) | |
| Alienware m16 R2 | |
| Asus ROG Strix Scar 16 G634JZR | |
| Average of class Gaming (5235 - 9852, n=198, last 2 years) | |
| Asus ROG Strix G16 G614JZ | |
| PCMark 10 / Essentials | |
| Asus ROG Strix G16 G614JZ | |
| Lenovo Legion Pro 7 16IRX9H | |
| Asus ROG Strix Scar 16 G634JZR | |
| Asus ROG Strix Scar 17 G733PYV-LL053X | |
| Average Intel Core i9-14900HX, NVIDIA GeForce RTX 4080 Laptop GPU (11255 - 11706, n=4) | |
| MSI Vector 16 HX A14V | |
| HP Omen 16 (2024) | |
| Average of class Gaming (8300 - 12334, n=197, last 2 years) | |
| Alienware m16 R2 | |
| PCMark 10 / Productivity | |
| HP Omen 16 (2024) | |
| Lenovo Legion Pro 7 16IRX9H | |
| Asus ROG Strix Scar 17 G733PYV-LL053X | |
| MSI Vector 16 HX A14V | |
| Average Intel Core i9-14900HX, NVIDIA GeForce RTX 4080 Laptop GPU (6662 - 11410, n=4) | |
| Average of class Gaming (6662 - 11833, n=197, last 2 years) | |
| Alienware m16 R2 | |
| Asus ROG Strix G16 G614JZ | |
| Asus ROG Strix Scar 16 G634JZR | |
| PCMark 10 / Digital Content Creation | |
| Asus ROG Strix Scar 17 G733PYV-LL053X | |
| Asus ROG Strix Scar 16 G634JZR | |
| MSI Vector 16 HX A14V | |
| Average Intel Core i9-14900HX, NVIDIA GeForce RTX 4080 Laptop GPU (14466 - 16027, n=4) | |
| HP Omen 16 (2024) | |
| Lenovo Legion Pro 7 16IRX9H | |
| Alienware m16 R2 | |
| Average of class Gaming (6462 - 18475, n=197, last 2 years) | |
| Asus ROG Strix G16 G614JZ | |
| CrossMark / Overall | |
| Lenovo Legion Pro 7 16IRX9H | |
| HP Omen 16 (2024) | |
| Average Intel Core i9-14900HX, NVIDIA GeForce RTX 4080 Laptop GPU (2037 - 2334, n=4) | |
| MSI Vector 16 HX A14V | |
| Asus ROG Strix G16 G614JZ | |
| Asus ROG Strix Scar 17 G733PYV-LL053X | |
| Asus ROG Strix Scar 16 G634JZR | |
| Average of class Gaming (1247 - 2334, n=171, last 2 years) | |
| Alienware m16 R2 | |
| CrossMark / Productivity | |
| Lenovo Legion Pro 7 16IRX9H | |
| HP Omen 16 (2024) | |
| Average Intel Core i9-14900HX, NVIDIA GeForce RTX 4080 Laptop GPU (1874 - 2204, n=4) | |
| Asus ROG Strix G16 G614JZ | |
| MSI Vector 16 HX A14V | |
| Asus ROG Strix Scar 17 G733PYV-LL053X | |
| Asus ROG Strix Scar 16 G634JZR | |
| Average of class Gaming (1299 - 2204, n=171, last 2 years) | |
| Alienware m16 R2 | |
| CrossMark / Creativity | |
| Lenovo Legion Pro 7 16IRX9H | |
| MSI Vector 16 HX A14V | |
| Asus ROG Strix Scar 17 G733PYV-LL053X | |
| Average Intel Core i9-14900HX, NVIDIA GeForce RTX 4080 Laptop GPU (2327 - 2500, n=4) | |
| Asus ROG Strix G16 G614JZ | |
| HP Omen 16 (2024) | |
| Asus ROG Strix Scar 16 G634JZR | |
| Average of class Gaming (1275 - 2514, n=171, last 2 years) | |
| Alienware m16 R2 | |
| CrossMark / Responsiveness | |
| Lenovo Legion Pro 7 16IRX9H | |
| HP Omen 16 (2024) | |
| Average Intel Core i9-14900HX, NVIDIA GeForce RTX 4080 Laptop GPU (1756 - 2254, n=4) | |
| Asus ROG Strix G16 G614JZ | |
| MSI Vector 16 HX A14V | |
| Asus ROG Strix Scar 16 G634JZR | |
| Average of class Gaming (1030 - 2330, n=171, last 2 years) | |
| Asus ROG Strix Scar 17 G733PYV-LL053X | |
| Alienware m16 R2 | |
| AIDA64 / Memory Copy | |
| HP Omen 16 (2024) | |
| Asus ROG Strix Scar 16 G634JZR | |
| Average Intel Core i9-14900HX, NVIDIA GeForce RTX 4080 Laptop GPU (78053 - 79244, n=5) | |
| Lenovo Legion Pro 7 16IRX9H | |
| MSI Vector 16 HX A14V | |
| Alienware m16 R2 | |
| Asus ROG Strix G16 G614JZ | |
| Average of class Gaming (21842 - 92565, n=225, last 2 years) | |
| Asus ROG Strix Scar 17 G733PYV-LL053X | |
| AIDA64 / Memory Read | |
| Asus ROG Strix Scar 16 G634JZR | |
| HP Omen 16 (2024) | |
| Average Intel Core i9-14900HX, NVIDIA GeForce RTX 4080 Laptop GPU (85898 - 87507, n=5) | |
| Lenovo Legion Pro 7 16IRX9H | |
| MSI Vector 16 HX A14V | |
| Alienware m16 R2 | |
| Asus ROG Strix G16 G614JZ | |
| Average of class Gaming (24879 - 90647, n=225, last 2 years) | |
| Asus ROG Strix Scar 17 G733PYV-LL053X | |
| AIDA64 / Memory Write | |
| HP Omen 16 (2024) | |
| Asus ROG Strix Scar 16 G634JZR | |
| MSI Vector 16 HX A14V | |
| Average Intel Core i9-14900HX, NVIDIA GeForce RTX 4080 Laptop GPU (71763 - 77715, n=5) | |
| Lenovo Legion Pro 7 16IRX9H | |
| Alienware m16 R2 | |
| Average of class Gaming (21619 - 103259, n=225, last 2 years) | |
| Asus ROG Strix G16 G614JZ | |
| Asus ROG Strix Scar 17 G733PYV-LL053X | |
| AIDA64 / Memory Latency | |
| Alienware m16 R2 | |
| Asus ROG Strix Scar 17 G733PYV-LL053X | |
| Asus ROG Strix G16 G614JZ | |
| Average of class Gaming (59.5 - 152.5, n=222, last 2 years) | |
| HP Omen 16 (2024) | |
| Average Intel Core i9-14900HX, NVIDIA GeForce RTX 4080 Laptop GPU (79.7 - 84.6, n=5) | |
| MSI Vector 16 HX A14V | |
| Asus ROG Strix Scar 16 G634JZR | |
| Lenovo Legion Pro 7 16IRX9H | |
| WebXPRT 3 / Overall | |
| Asus ROG Strix Scar 17 G733PYV-LL053X | |
| Lenovo Legion Pro 7 16IRX9H | |
| Asus ROG Strix G16 G614JZ | |
| Average Intel Core i9-14900HX, NVIDIA GeForce RTX 4080 Laptop GPU (310 - 345, n=4) | |
| HP Omen 16 (2024) | |
| MSI Vector 16 HX A14V | |
| Asus ROG Strix Scar 16 G634JZR | |
| Average of class Gaming (215 - 480, n=194, last 2 years) | |
| Alienware m16 R2 | |
| WebXPRT 4 / Overall | |
| Asus ROG Strix Scar 17 G733PYV-LL053X | |
| Lenovo Legion Pro 7 16IRX9H | |
| Asus ROG Strix G16 G614JZ | |
| HP Omen 16 (2024) | |
| Asus ROG Strix Scar 16 G634JZR | |
| Average Intel Core i9-14900HX, NVIDIA GeForce RTX 4080 Laptop GPU (300 - 316, n=4) | |
| MSI Vector 16 HX A14V | |
| Average of class Gaming (157.9 - 328, n=163, last 2 years) | |
| Alienware m16 R2 | |
| Mozilla Kraken 1.1 / Total | |
| Alienware m16 R2 | |
| Average of class Gaming (421 - 824, n=209, last 2 years) | |
| Asus ROG Strix G16 G614JZ | |
| MSI Vector 16 HX A14V | |
| Asus ROG Strix Scar 16 G634JZR | |
| Average Intel Core i9-14900HX, NVIDIA GeForce RTX 4080 Laptop GPU (437 - 443, n=4) | |
| Lenovo Legion Pro 7 16IRX9H | |
| HP Omen 16 (2024) | |
| Asus ROG Strix Scar 17 G733PYV-LL053X | |
* ... im mniej tym lepiej
| PCMark 8 Home Score Accelerated v2 | 5883 pkt. | |
| PCMark 10 Score | 7703 pkt. | |
Pomoc | ||
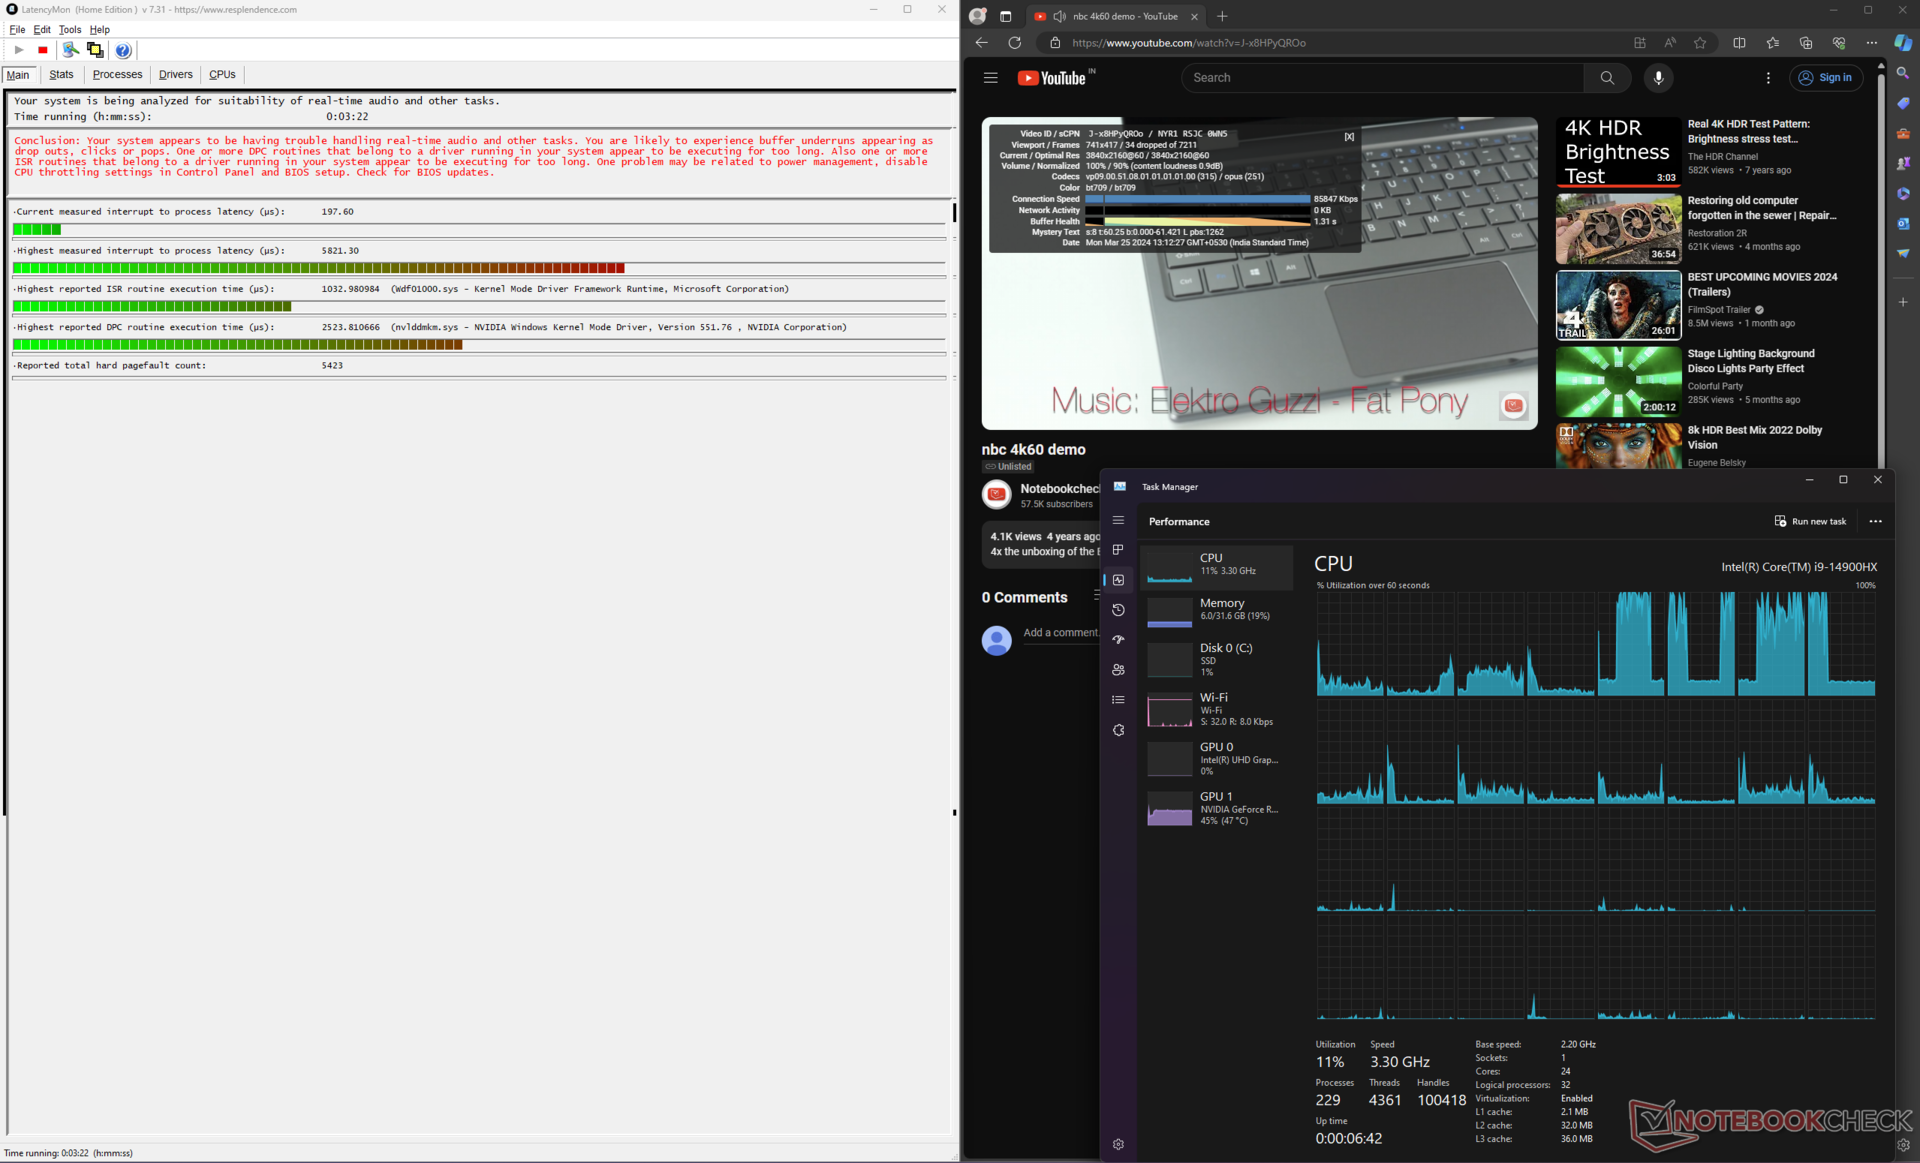
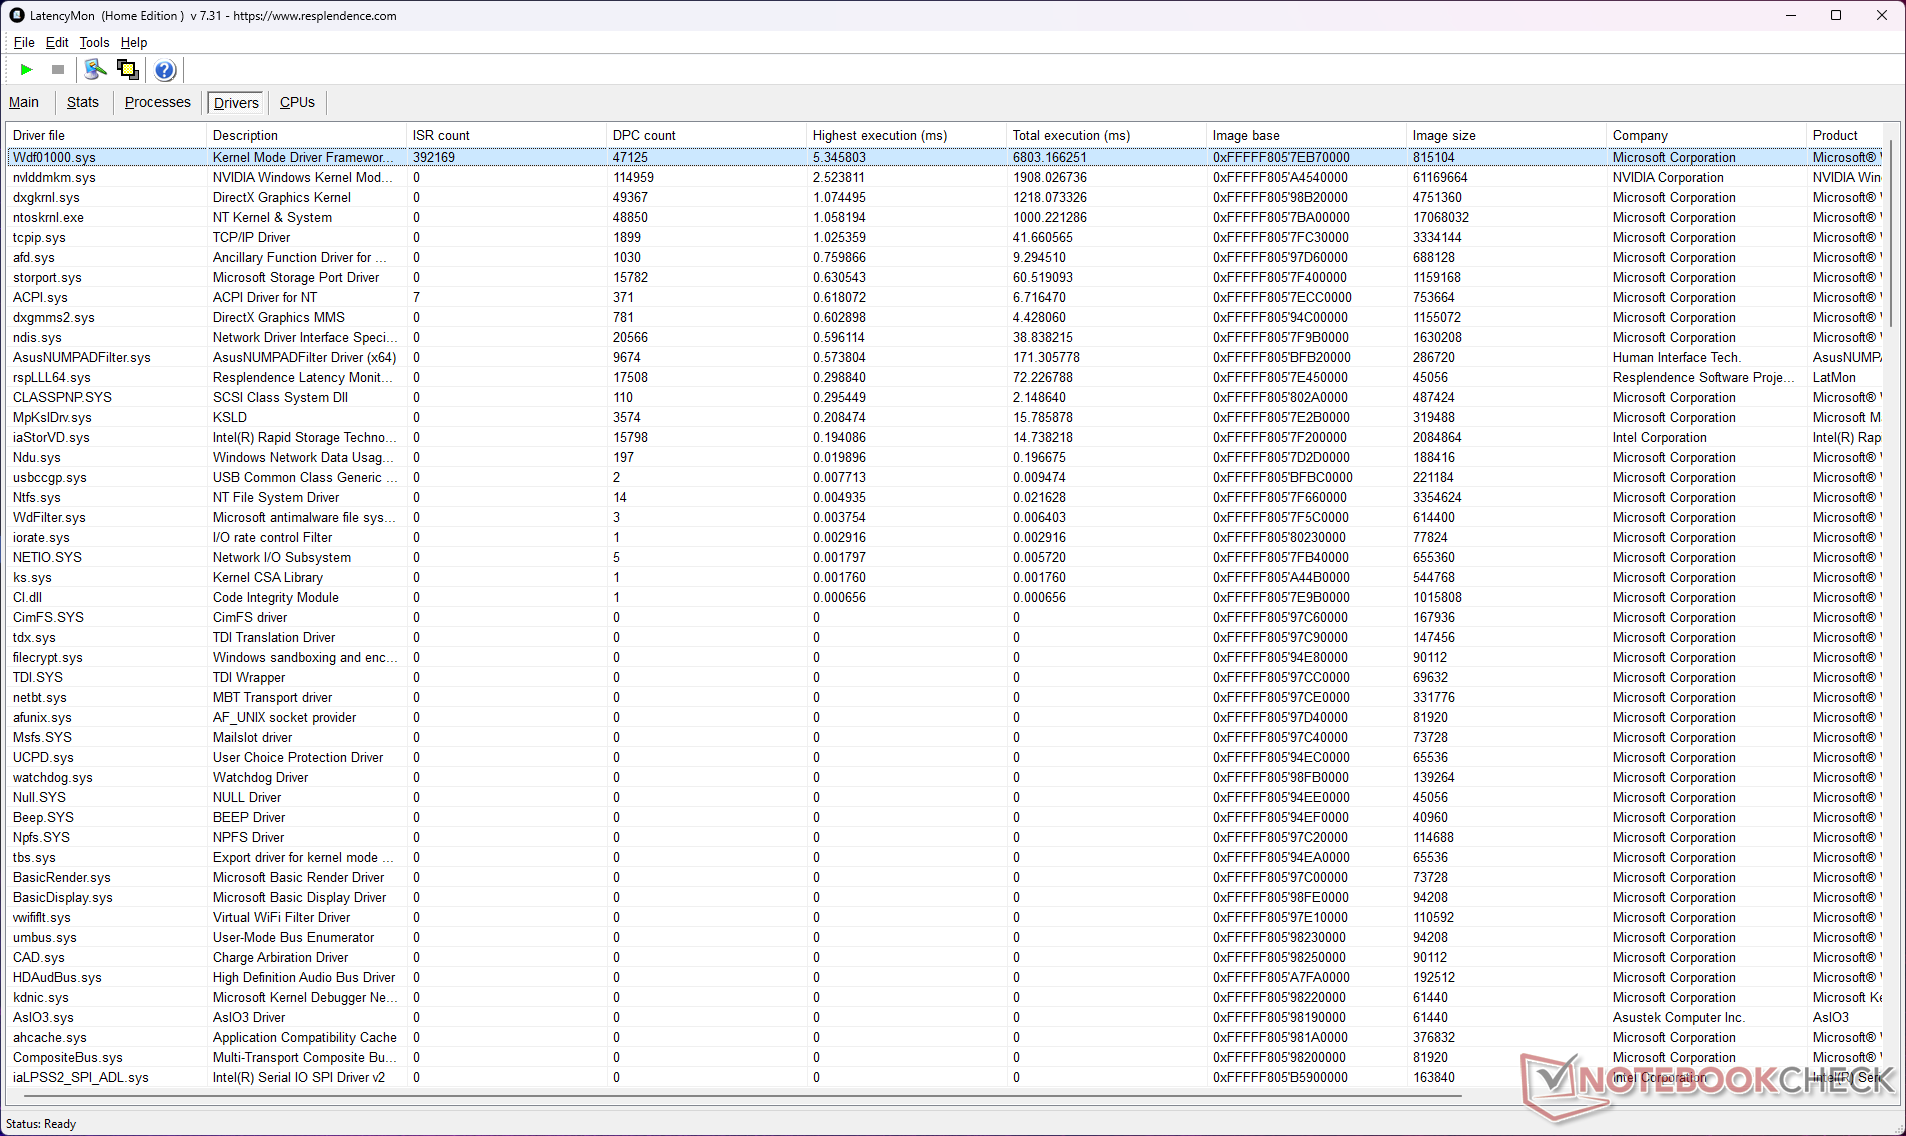
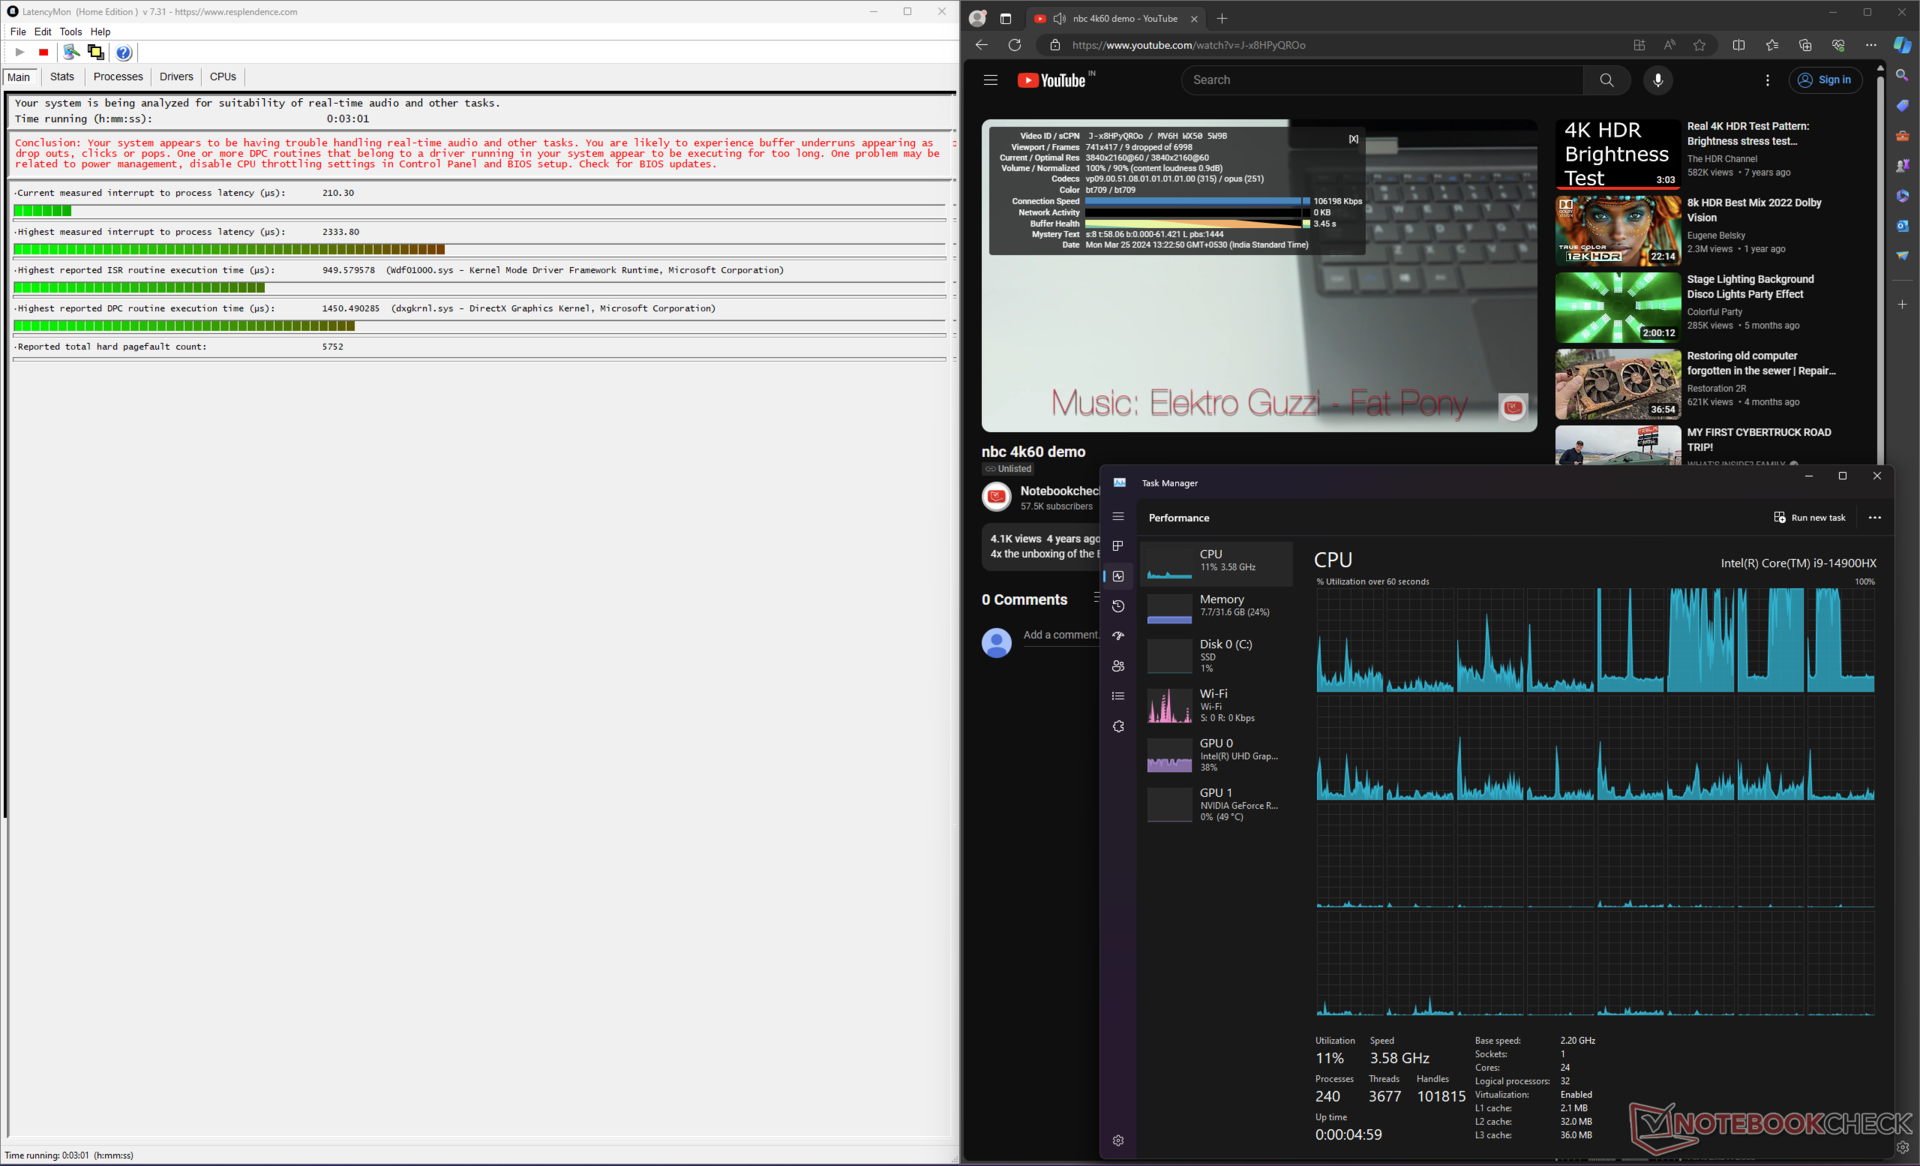
Opóźnienie DPC
Opóźnienie DPC jest wyższe przy włączonym dGPU MUX. Przełączenie na iGPU zmniejsza opóźnienie z 5821,30 µs do 2333,80 µs, co nadal jest wysoką wartością. Może to stanowić problem, jeśli zajmują się Państwo edycją audio lub wideo w czasie rzeczywistym.
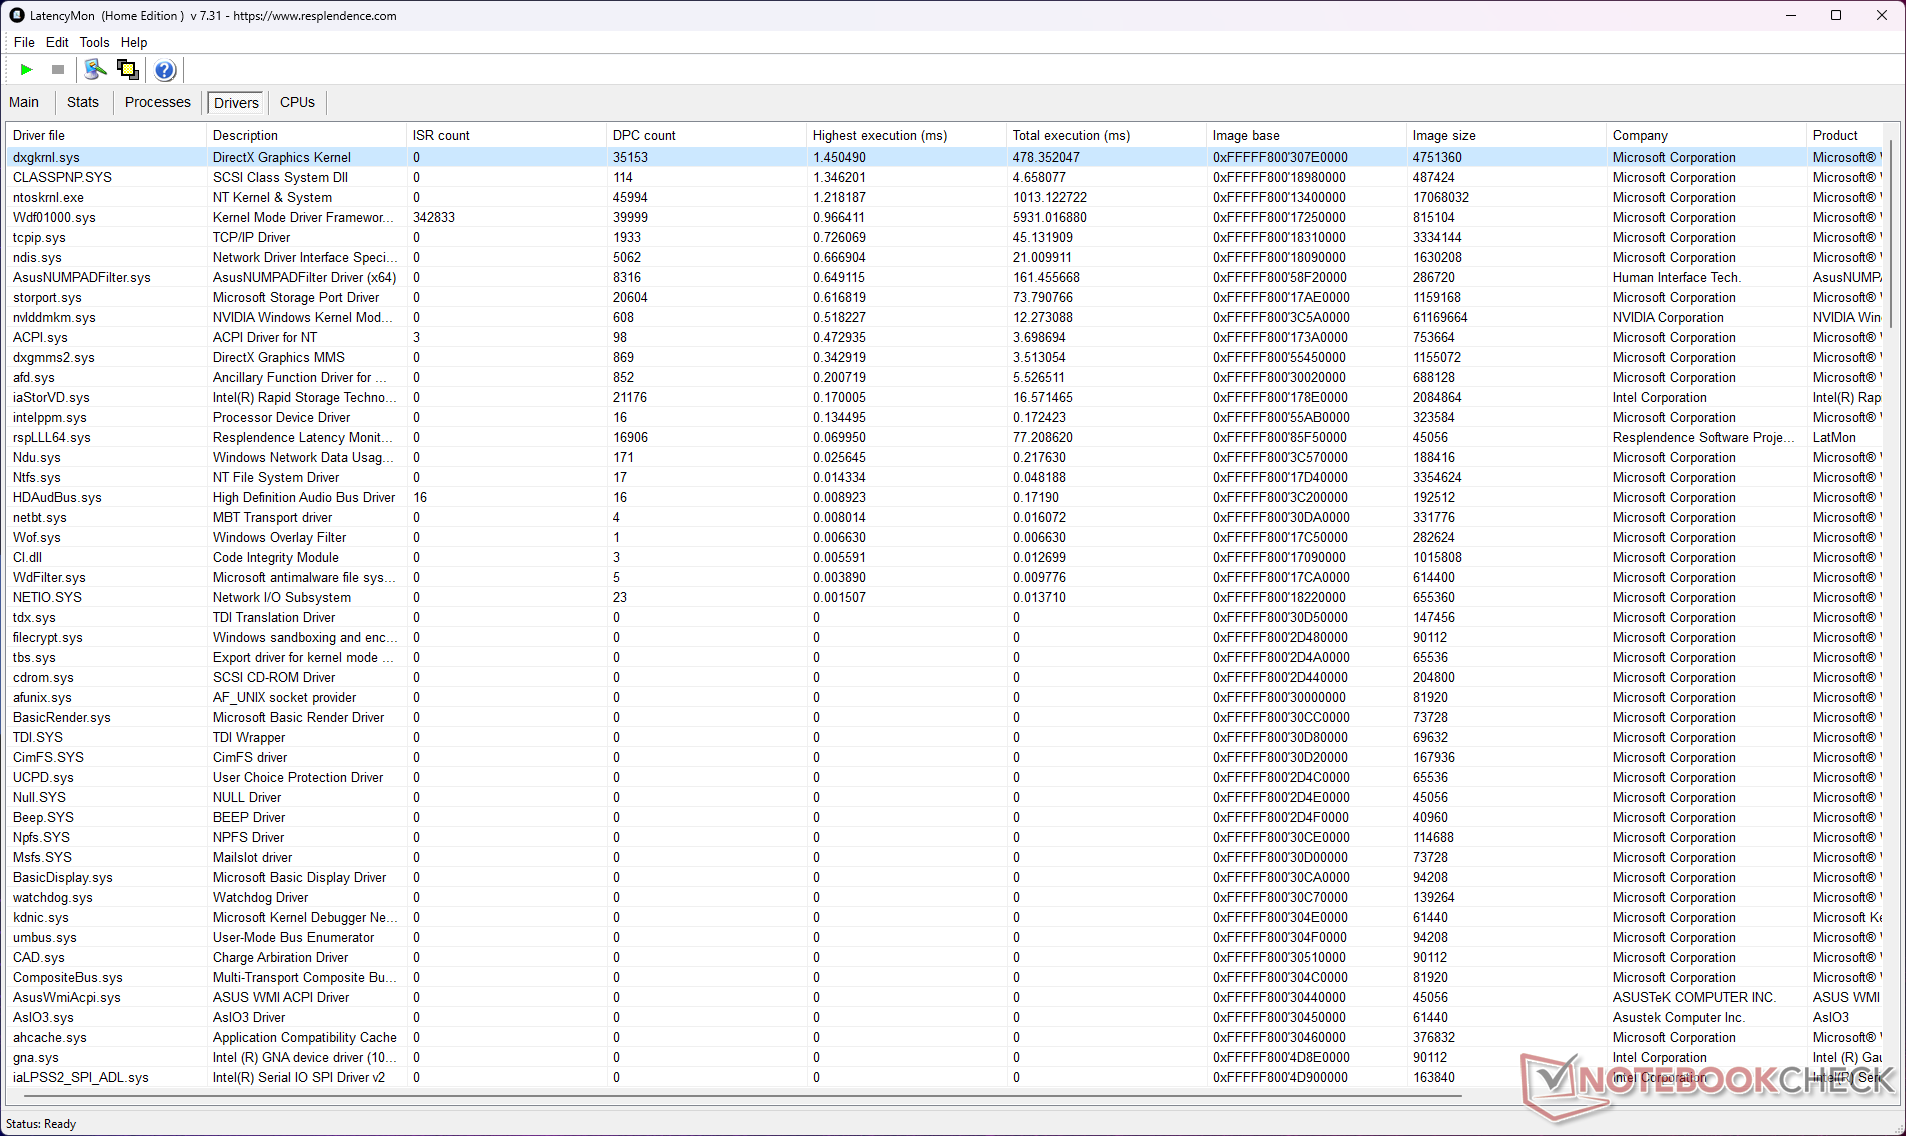
| DPC Latencies / LatencyMon - interrupt to process latency (max), Web, Youtube, Prime95 | |
| Asus ROG Strix Scar 16 G634JZR | |
| Asus ROG Strix G16 G614JZ | |
| Alienware m16 R2 | |
| MSI Vector 16 HX A14V | |
| Lenovo Legion Pro 7 16IRX9H | |
| HP Omen 16 (2024) | |
| Asus ROG Strix Scar 17 G733PYV-LL053X | |
* ... im mniej tym lepiej
Nasz Ranking opóźnień DPC znajdą Państwo przegląd zmierzonych opóźnień w recenzowanych urządzeniach.
Urządzenia pamięci masowej
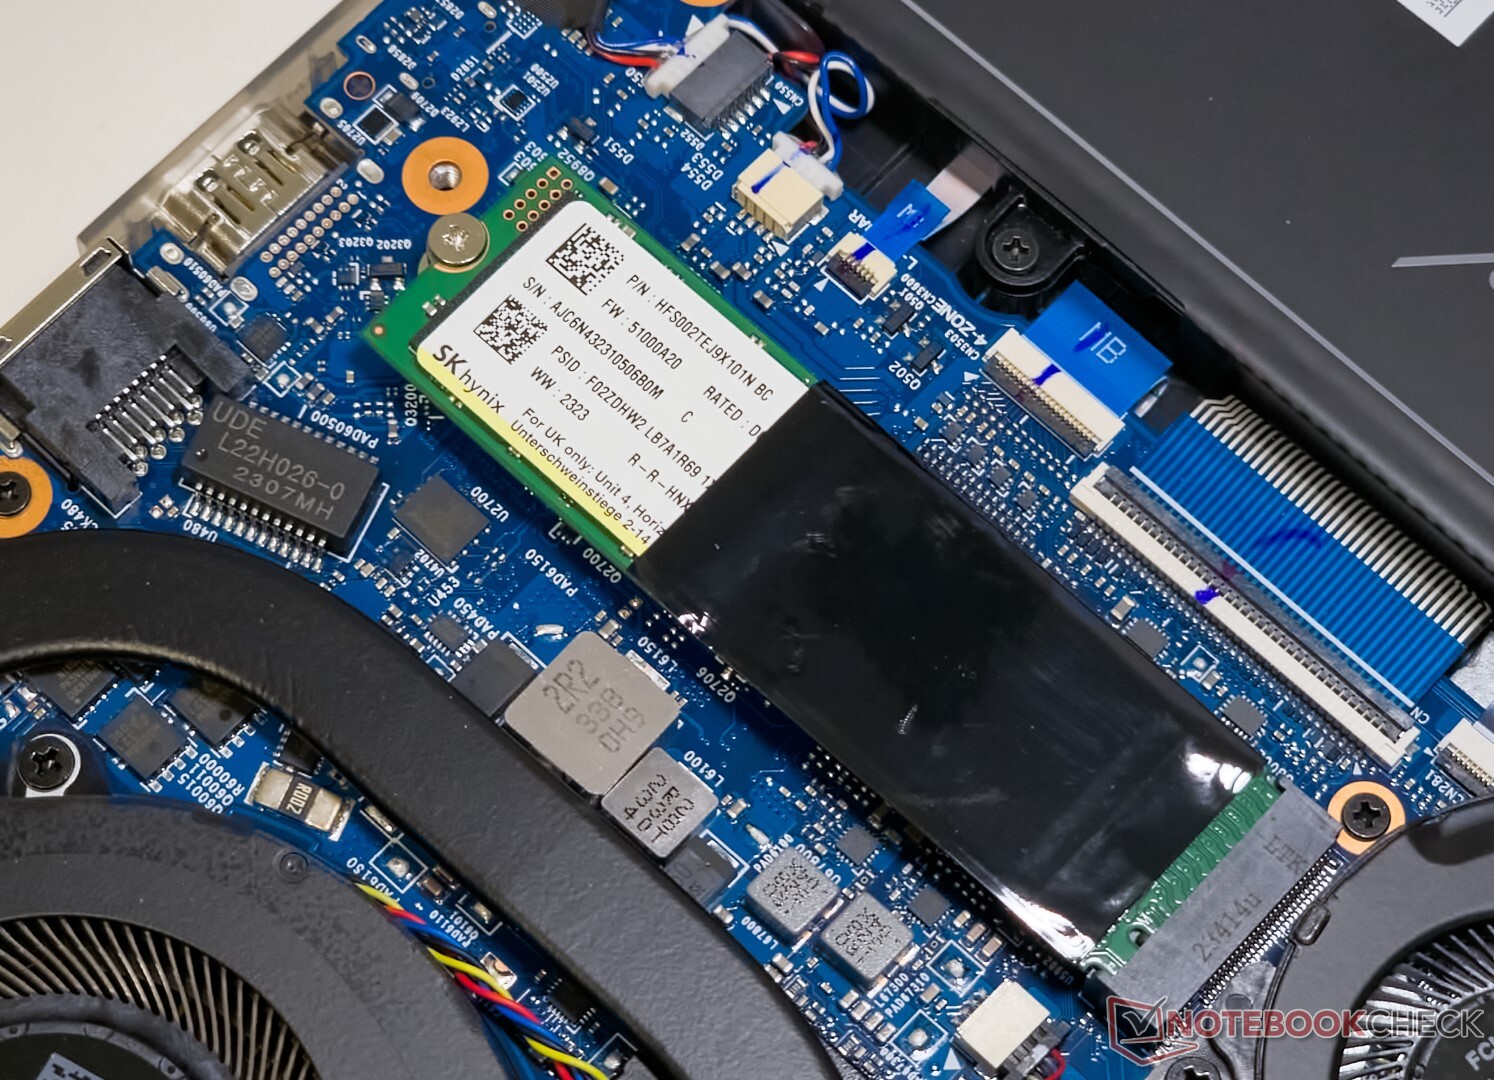
Nasz egzemplarz Scar 16 został wyposażony w dysk SSD Sk hynix PC801 2 TB PCIe Gen 4 NVMe.
Wydajność dysku SSD bije na głowę sekwencyjne odczyty i kilka testów 4k, ale łączna wydajność jest w zasięgu Alienware m16 R2samsung PM9A1.
Dodatkową pamięć masową można dodać za pomocą gniazda rozszerzeń dla innego dysku SSD M.2. Nie ma jednak możliwości instalacji 2,5-calowych dysków SATA.

* ... im mniej tym lepiej
Dławienie dysku: Pętla odczytu DiskSpd, głębokość kolejki 8
Wydajność dysku spada po 14. uruchomieniu podczas testu pętli odczytu DiskSpd przy głębokości kolejki wynoszącej 8, ale pozostaje stabilna.
Więcej porównań wydajności pamięci masowej można znaleźć w naszych Testy porównawcze dysków SSD i HDD strona.
Wydajność GPU
Scar 16 jest wyposażony w 175 W GPU Nvidia GeForce RTX 4080 Laptop. Ogólna wydajność 3DMark jest porównywalna z innymi laptopami wyposażonymi w tę kartę, ale ustępuje Lenovo Legion Pro 7 o 6%.
HP Omen 16 z procesorem graficznym RTX 4080 o mocy 140 W jest o 24% gorszy od Strix Scar 16 pod względem skumulowanej wydajności w 3DMark.
RTX 4080 w Scar 16 plasuje go tuż za Asus ROG Strix Scar 17 z GPU RTX 4090 Laptop w Blender Classroom Optix, aczkolwiek z 15% marginesem - ten wzrasta do 18% w Blender Classroom CUDA.
Z drugiej strony, procesor Blender Classroom Core i9-14900HX w Scar 16 jest na równi z procesorami Legion Pro 7 i Vector 16 HX, ale Scar 17 AMD Ryzen 9 7945HX3D jest w stanie ukończyć renderowanie o 20% szybciej.
| 3DMark 11 Performance | 42772 pkt. | |
| 3DMark Ice Storm Standard Score | 284572 pkt. | |
| 3DMark Cloud Gate Standard Score | 64579 pkt. | |
| 3DMark Fire Strike Score | 32183 pkt. | |
| 3DMark Fire Strike Extreme Score | 21288 pkt. | |
| 3DMark Time Spy Score | 18822 pkt. | |
Pomoc | ||
| Blender / v3.3 Classroom OPTIX/RTX | |
| Average of class Gaming (9 - 142, n=182, last 2 years) | |
| Alienware m16 R2 | |
| HP Omen 16 (2024) | |
| Average NVIDIA GeForce RTX 4080 Laptop GPU (13 - 20, n=18) | |
| Asus ROG Strix G16 G614JZ | |
| MSI Vector 16 HX A14V | |
| Lenovo Legion Pro 7 16IRX9H | |
| Asus ROG Strix Scar 16 G634JZR | |
| Asus ROG Strix Scar 17 G733PYV-LL053X | |
| Blender / v3.3 Classroom CUDA | |
| Average of class Gaming (16 - 175, n=189, last 2 years) | |
| Alienware m16 R2 | |
| HP Omen 16 (2024) | |
| Average NVIDIA GeForce RTX 4080 Laptop GPU (21 - 28, n=19) | |
| Asus ROG Strix G16 G614JZ | |
| MSI Vector 16 HX A14V | |
| Asus ROG Strix Scar 16 G634JZR | |
| Lenovo Legion Pro 7 16IRX9H | |
| Asus ROG Strix Scar 17 G733PYV-LL053X | |
| Blender / v3.3 Classroom CPU | |
| Average of class Gaming (138 - 962, n=201, last 2 years) | |
| Alienware m16 R2 | |
| HP Omen 16 (2024) | |
| Average NVIDIA GeForce RTX 4080 Laptop GPU (177 - 337, n=19) | |
| Asus ROG Strix G16 G614JZ | |
| Asus ROG Strix Scar 16 G634JZR | |
| Lenovo Legion Pro 7 16IRX9H | |
| MSI Vector 16 HX A14V | |
| Asus ROG Strix Scar 17 G733PYV-LL053X | |
* ... im mniej tym lepiej
Wydajność w grach
Różnica w wydajności między Legion Pro 7 i Strix Scar 16 znika w skumulowanej wydajności w grach 1080p Ultra.
Scar 16 może z łatwością przekroczyć granicę 100 klatek na sekundę w 1440p Ultra w starszych tytułach. Laptop poradzi sobie z większością współczesnych gier AAA przy 60 klatkach na sekundę w tej rozdzielczości, a można osiągnąć nawet wyższą liczbę klatek na sekundę z pomocą upscalerów.
| The Witcher 3 - 1920x1080 Ultra Graphics & Postprocessing (HBAO+) | |
| Asus ROG Strix Scar 17 G733PYV-LL053X | |
| Lenovo Legion Pro 7 16IRX9H | |
| Asus ROG Strix Scar 16 G634JZR | |
| MSI Vector 16 HX A14V | |
| Asus ROG Strix G16 G614JZ | |
| HP Omen 16 (2024) | |
| Alienware m16 R2 | |
| Average of class Gaming (8.61 - 216, n=227, last 2 years) | |
| GTA V - 1920x1080 Highest Settings possible AA:4xMSAA + FX AF:16x | |
| Asus ROG Strix Scar 17 G733PYV-LL053X | |
| Lenovo Legion Pro 7 16IRX9H | |
| Asus ROG Strix G16 G614JZ | |
| Asus ROG Strix Scar 16 G634JZR | |
| MSI Vector 16 HX A14V | |
| HP Omen 16 (2024) | |
| Average of class Gaming (6.38 - 167.7, n=218, last 2 years) | |
Wykres Witcher 3 FPS
Masywny system chłodzenia Scar 16 jest w stanie zapewnić stosunkowo niską wydajność w grach. Nie zaobserwowaliśmy żadnych drastycznych spadków klatek podczas obciążania The Witcher 3 w rozdzielczości 1080p Ultra.
| low | med. | high | ultra | QHD | |
| GTA V (2015) | 187.3 | 187.1 | 182.6 | 139 | 130.1 |
| The Witcher 3 (2015) | 581 | 513 | 365 | 185.6 | 140.1 |
| Dota 2 Reborn (2015) | 247 | 216 | 192.7 | 177.4 | |
| Final Fantasy XV Benchmark (2018) | 228 | 207 | 178 | 138.1 | |
| X-Plane 11.11 (2018) | 211 | 184.3 | 141.3 | ||
| Far Cry 5 (2018) | 183 | 168 | 164 | 157 | 157 |
| Strange Brigade (2018) | 499 | 402 | 373 | 337 | 240 |
| F1 22 (2022) | 323 | 334 | 287 | 117.1 | 76.6 |
| F1 23 (2023) | 310 | 326 | 295 | 111.3 | 70 |
| Cyberpunk 2077 2.0 Phantom Liberty (2023) | 170.4 | 159.8 | 141.3 | 123.1 | 77.6 |
| Avatar Frontiers of Pandora (2023) | 141.4 | 131.6 | 115.2 | 88.3 | 59.3 |
| Skull & Bones (2024) | 155 | 168 | 144 | 115 | 91 |
Proszę odnieść się do naszego dedykowanego GPU Nvidia GeForce RTX 4080 do laptopów aby uzyskać więcej informacji na temat wydajności i testów porównawczych w grach.
Emisje: Wysoka temperatura powierzchni i hałas pomimo 3 wentylatorów i 7 rurek cieplnych
Hałas systemowy
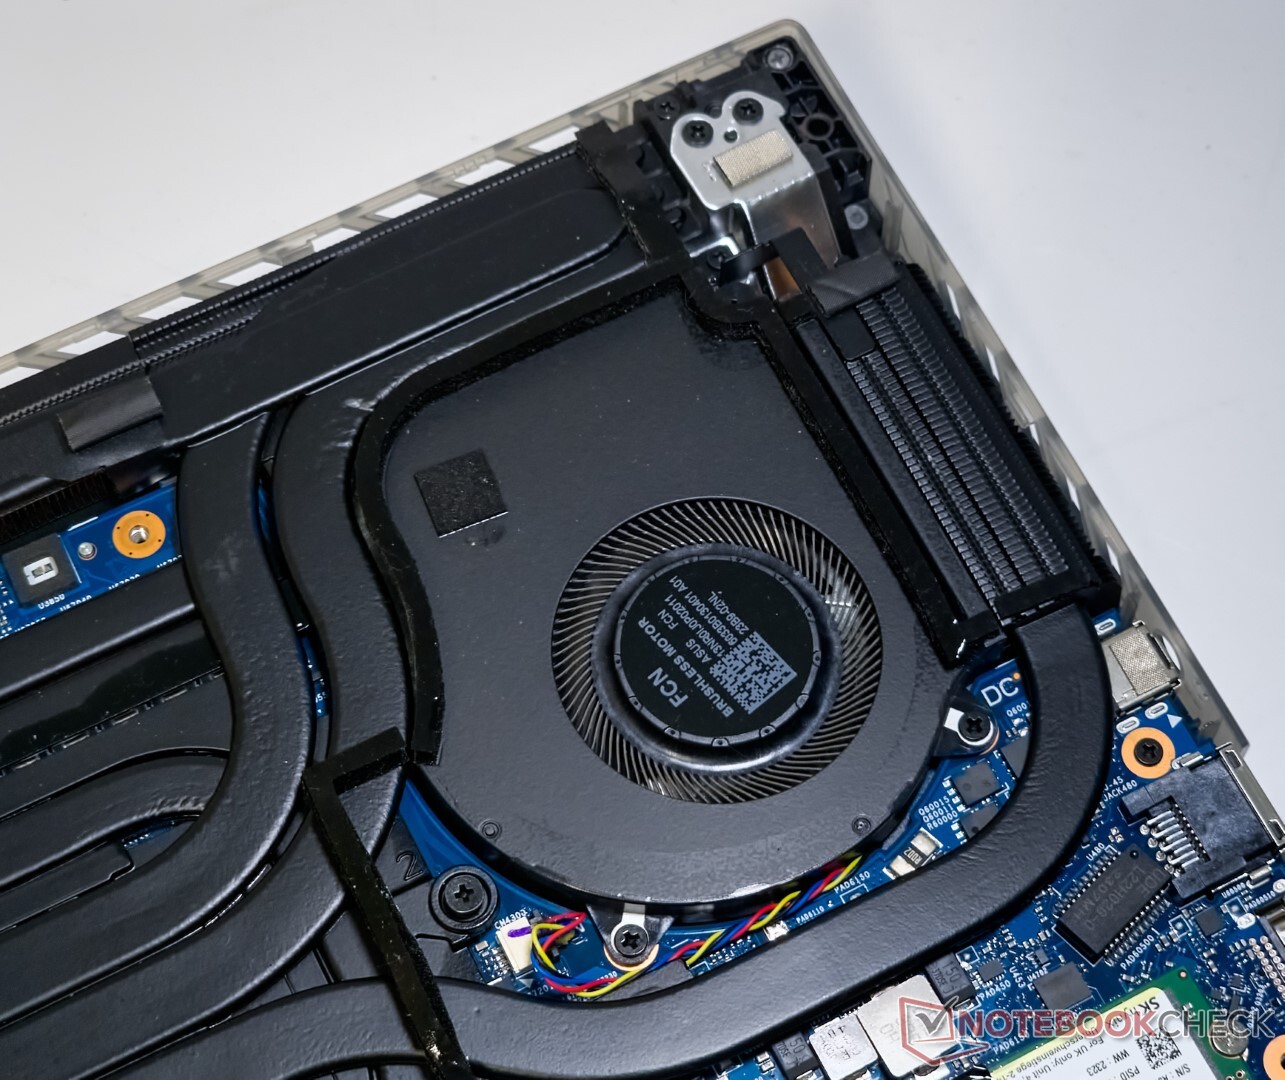
Co ciekawe, Asus umieścił trzeci wentylator na VRAM oprócz tych podłączonych do CPU i GPU.
Wygląda na to, że Scar 16 nie egzekwuje żadnych sztywnych limitów emisji hałasu w każdym profilu zasilania. W rezultacie emisja hałasu wentylatora w trybie Turbo może sięgać nawet 58 db(A) przy maksymalnym obciążeniu.
Tryb Performance również generuje wysoki poziom hałasu. Tryb cichy jest stosunkowo bardziej znośny, ale kosztem zauważalnego spadku wydajności w grach.
Niemniej jednak, wentylatory są całkowicie wyłączone w trybie cichym, gdy są bezczynne i podczas mniej intensywnych obciążeń, takich jak pakiet Office lub zwykłe przeglądanie stron internetowych.
Hałas
| luz |
| 29.75 / 29.75 / 29.75 dB |
| obciążenie |
| 54.85 / 58 dB |
 | ||
30 dB cichy 40 dB(A) słyszalny 50 dB(A) irytujący |
||
min: | ||
| Tryb wydajności | Bezczynność dB(A) | Średnie obciążenie dB(A) | Maksymalne obciążenie dB(A) | Witcher 3 1080p Ultra dB(A) |
|---|---|---|---|---|
| Cichy | 21.07 | 37.50 | 46.56 | 46.32 / 133 fps |
| Wydajność | 21.07 | 54.03 | 54.02 | 54.08 / 174 fps |
| Turbo | 29.75 | 54.85 | 58 | 57.75 / 177 fps |
| Asus ROG Strix Scar 16 G634JZR i9-14900HX, NVIDIA GeForce RTX 4080 Laptop GPU | Asus ROG Strix Scar 17 G733PYV-LL053X R9 7945HX3D, NVIDIA GeForce RTX 4090 Laptop GPU | Asus ROG Strix G16 G614JZ i9-13980HX, NVIDIA GeForce RTX 4080 Laptop GPU | Lenovo Legion Pro 7 16IRX9H i9-14900HX, NVIDIA GeForce RTX 4080 Laptop GPU | HP Omen 16 (2024) i9-14900HX, NVIDIA GeForce RTX 4080 Laptop GPU | MSI Vector 16 HX A14V i9-14900HX, NVIDIA GeForce RTX 4080 Laptop GPU | Alienware m16 R2 Ultra 7 155H, NVIDIA GeForce RTX 4070 Laptop GPU | |
|---|---|---|---|---|---|---|---|
| Noise | 3% | 5% | -4% | 5% | -8% | 10% | |
| off / environment * | 21.07 | 23 -9% | 25 -19% | 24 -14% | 25 -19% | 23.2 -10% | 24.7 -17% |
| Idle Minimum * | 29.75 | 23 23% | 26 13% | 25 16% | 29 3% | 33.5 -13% | 25.3 15% |
| Idle Average * | 29.75 | 27.7 7% | 28 6% | 30 -1% | 30 -1% | 33.5 -13% | 25.3 15% |
| Idle Maximum * | 29.75 | 34.7 -17% | 30 -1% | 45 -51% | 31 -4% | 33.5 -13% | 25.3 15% |
| Load Average * | 54.85 | 53.4 3% | 48 12% | 50 9% | 46 16% | 52.1 5% | 31.7 42% |
| Witcher 3 ultra * | 57.8 | 53.4 8% | 49 15% | 54 7% | 47 19% | 62 -7% | 53.8 7% |
| Load Maximum * | 58 | 53.4 8% | 52 10% | 56 3% | 47 19% | 62 -7% | 62 -7% |
* ... im mniej tym lepiej
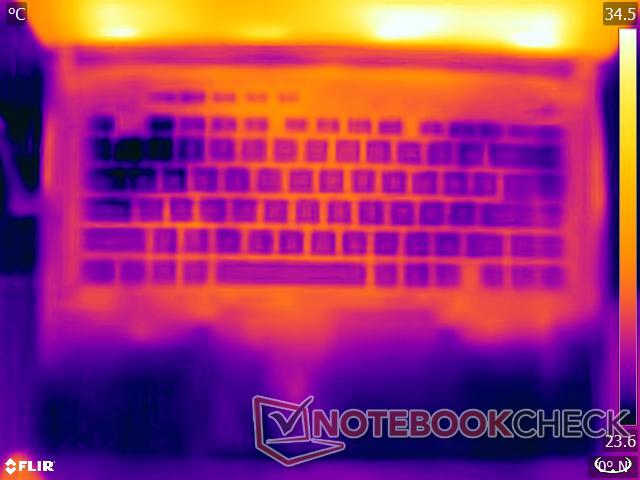
Temperatura
ROG Strix Scar 16 jest wyposażona w siedem ciepłowodów i system chłodzenia z trzema wentylatorami. Tym razem Asus poszedł na całość i zastosował ciekły metal Conductonaut Extreme zarówno dla CPU, jak i GPU.
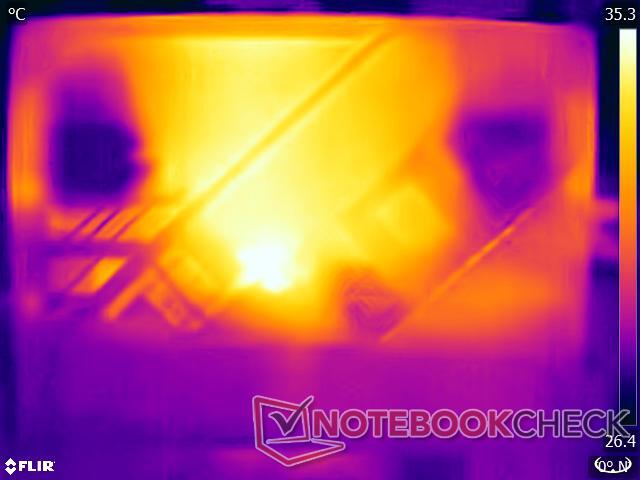
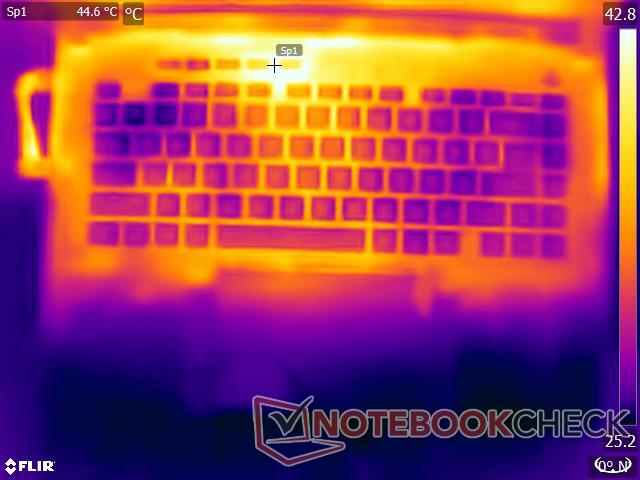
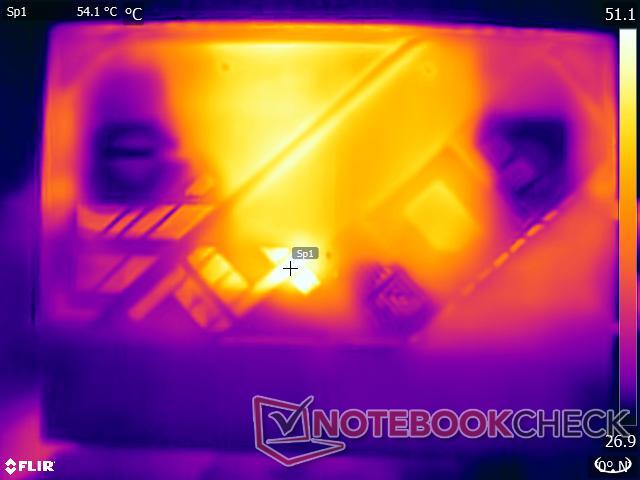
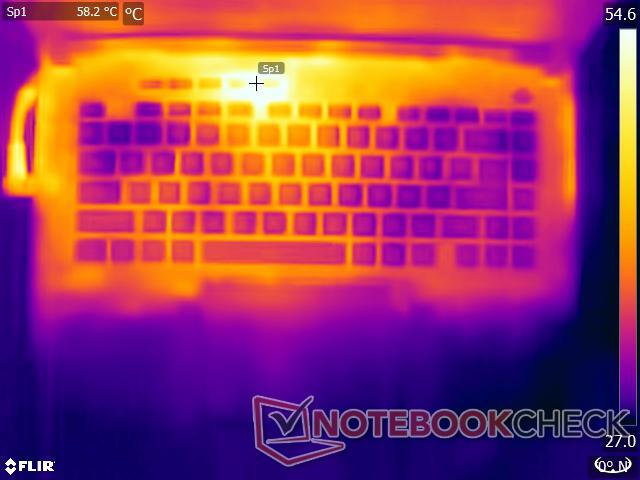
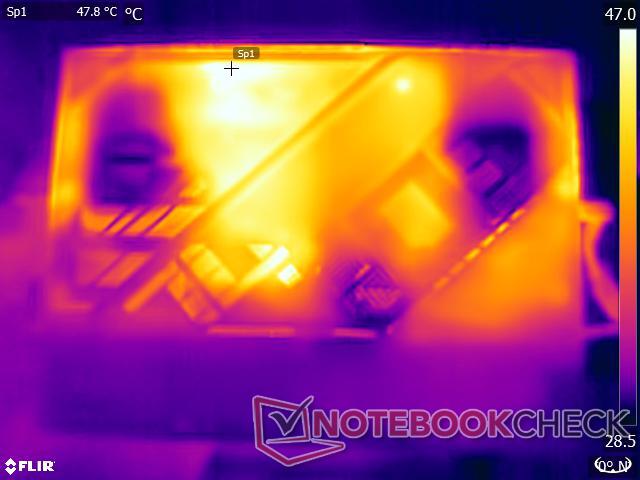
Podczas gdy solidna aparatura chłodząca i obecność otworów wylotowych z trzech stron pomagają w skutecznym chłodzeniu komponentów, prowadzą one również do większego rozpraszania ciepła, o czym świadczą wysokie odczyty temperatury powierzchni pod obciążeniem.
Zauważyliśmy kilka gorących punktów powyżej 55°C na górnej stronie podczas testów obciążeniowych z The Witcher 3 w rozdzielczości 1080p Ultra.
W praktyce, biorąc pod uwagę wagę i temperatury powierzchni, Scar 16 lepiej sprawdza się jako maszyna biurkowa. Biorąc to pod uwagę, laptop nie powinien powodować dużego dyskomfortu podczas korzystania z niego na kolanach w profilu Silent, pod warunkiem, że nie jest poddawany dużym obciążeniom.
(-) The maximum temperature on the upper side is 47.8 °C / 118 F, compared to the average of 40.4 °C / 105 F, ranging from 21.2 to 68.8 °C for the class Gaming.
(-) The bottom heats up to a maximum of 52.2 °C / 126 F, compared to the average of 43.2 °C / 110 F
(+) In idle usage, the average temperature for the upper side is 30.9 °C / 88 F, compared to the device average of 33.8 °C / 93 F.
(-) Playing The Witcher 3, the average temperature for the upper side is 42.9 °C / 109 F, compared to the device average of 33.8 °C / 93 F.
(±) The palmrests and touchpad can get very hot to the touch with a maximum of 39.2 °C / 102.6 F.
(-) The average temperature of the palmrest area of similar devices was 28.9 °C / 84 F (-10.3 °C / -18.6 F).
| Asus ROG Strix Scar 16 G634JZR i9-14900HX, NVIDIA GeForce RTX 4080 Laptop GPU | Asus ROG Strix Scar 17 G733PYV-LL053X R9 7945HX3D, NVIDIA GeForce RTX 4090 Laptop GPU | Asus ROG Strix G16 G614JZ i9-13980HX, NVIDIA GeForce RTX 4080 Laptop GPU | Lenovo Legion Pro 7 16IRX9H i9-14900HX, NVIDIA GeForce RTX 4080 Laptop GPU | HP Omen 16 (2024) i9-14900HX, NVIDIA GeForce RTX 4080 Laptop GPU | MSI Vector 16 HX A14V i9-14900HX, NVIDIA GeForce RTX 4080 Laptop GPU | Alienware m16 R2 Ultra 7 155H, NVIDIA GeForce RTX 4070 Laptop GPU | |
|---|---|---|---|---|---|---|---|
| Heat | 15% | -2% | -5% | 9% | 23% | -7% | |
| Maximum Upper Side * | 47.8 | 40.1 16% | 54 -13% | 46 4% | 47 2% | 36.4 24% | 44.8 6% |
| Maximum Bottom * | 52.2 | 46.7 11% | 55 -5% | 49 6% | 57 -9% | 35.6 32% | 48 8% |
| Idle Upper Side * | 32.4 | 26.5 18% | 29 10% | 38 -17% | 25 23% | 26.6 18% | 37.2 -15% |
| Idle Bottom * | 33 | 27.7 16% | 33 -0% | 37 -12% | 26 21% | 27 18% | 42 -27% |
* ... im mniej tym lepiej
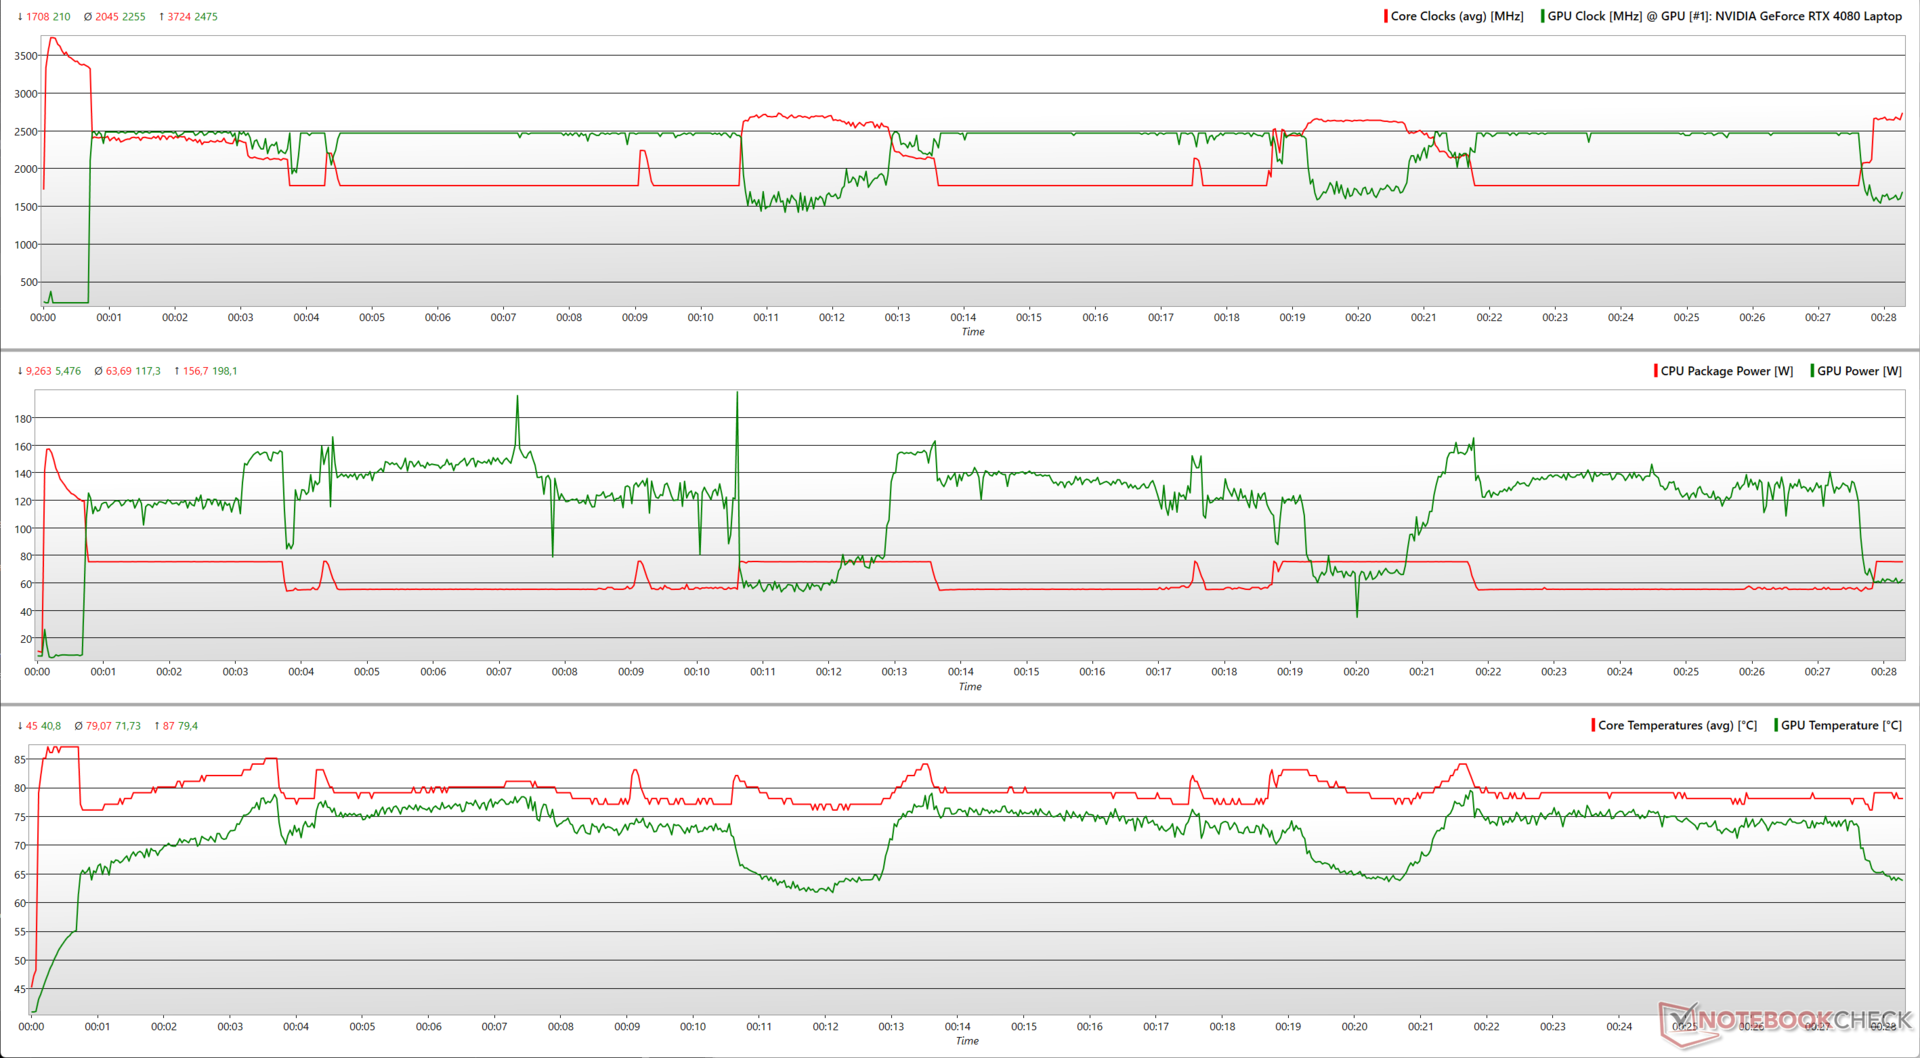
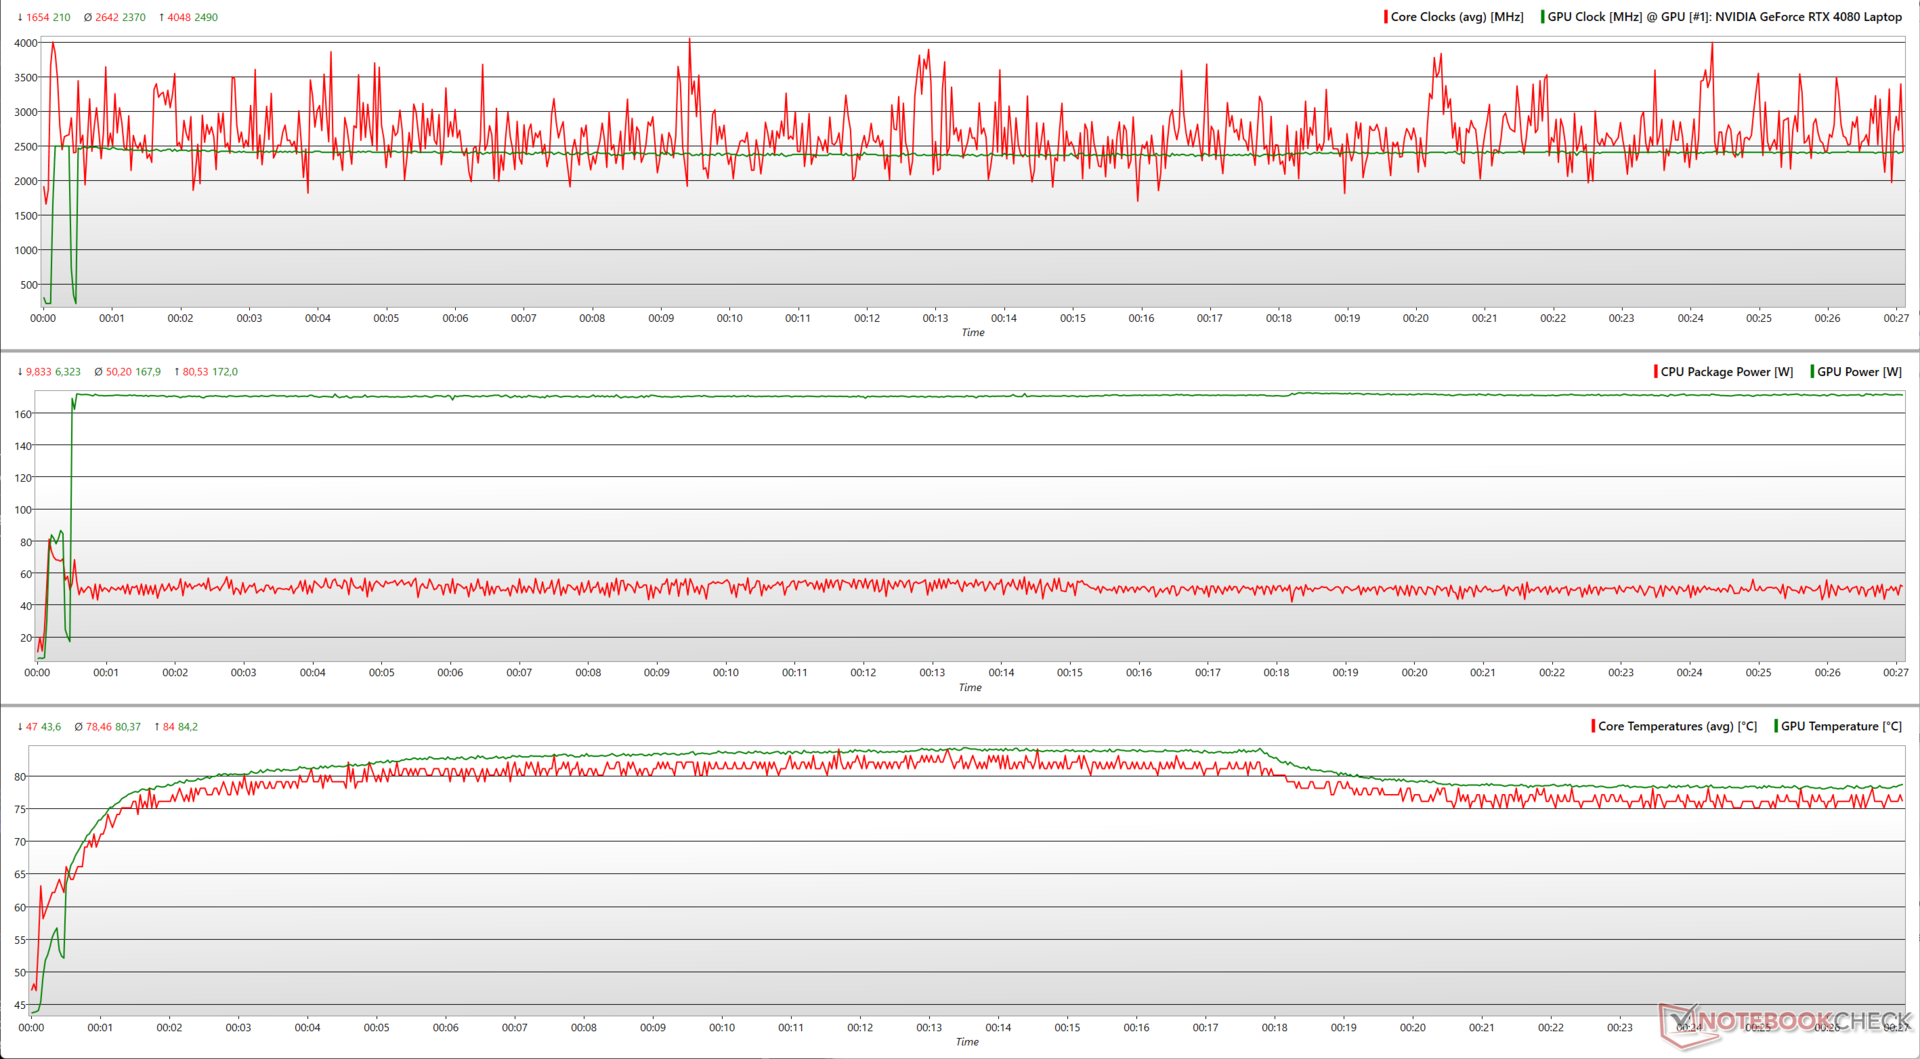
Test warunków skrajnych
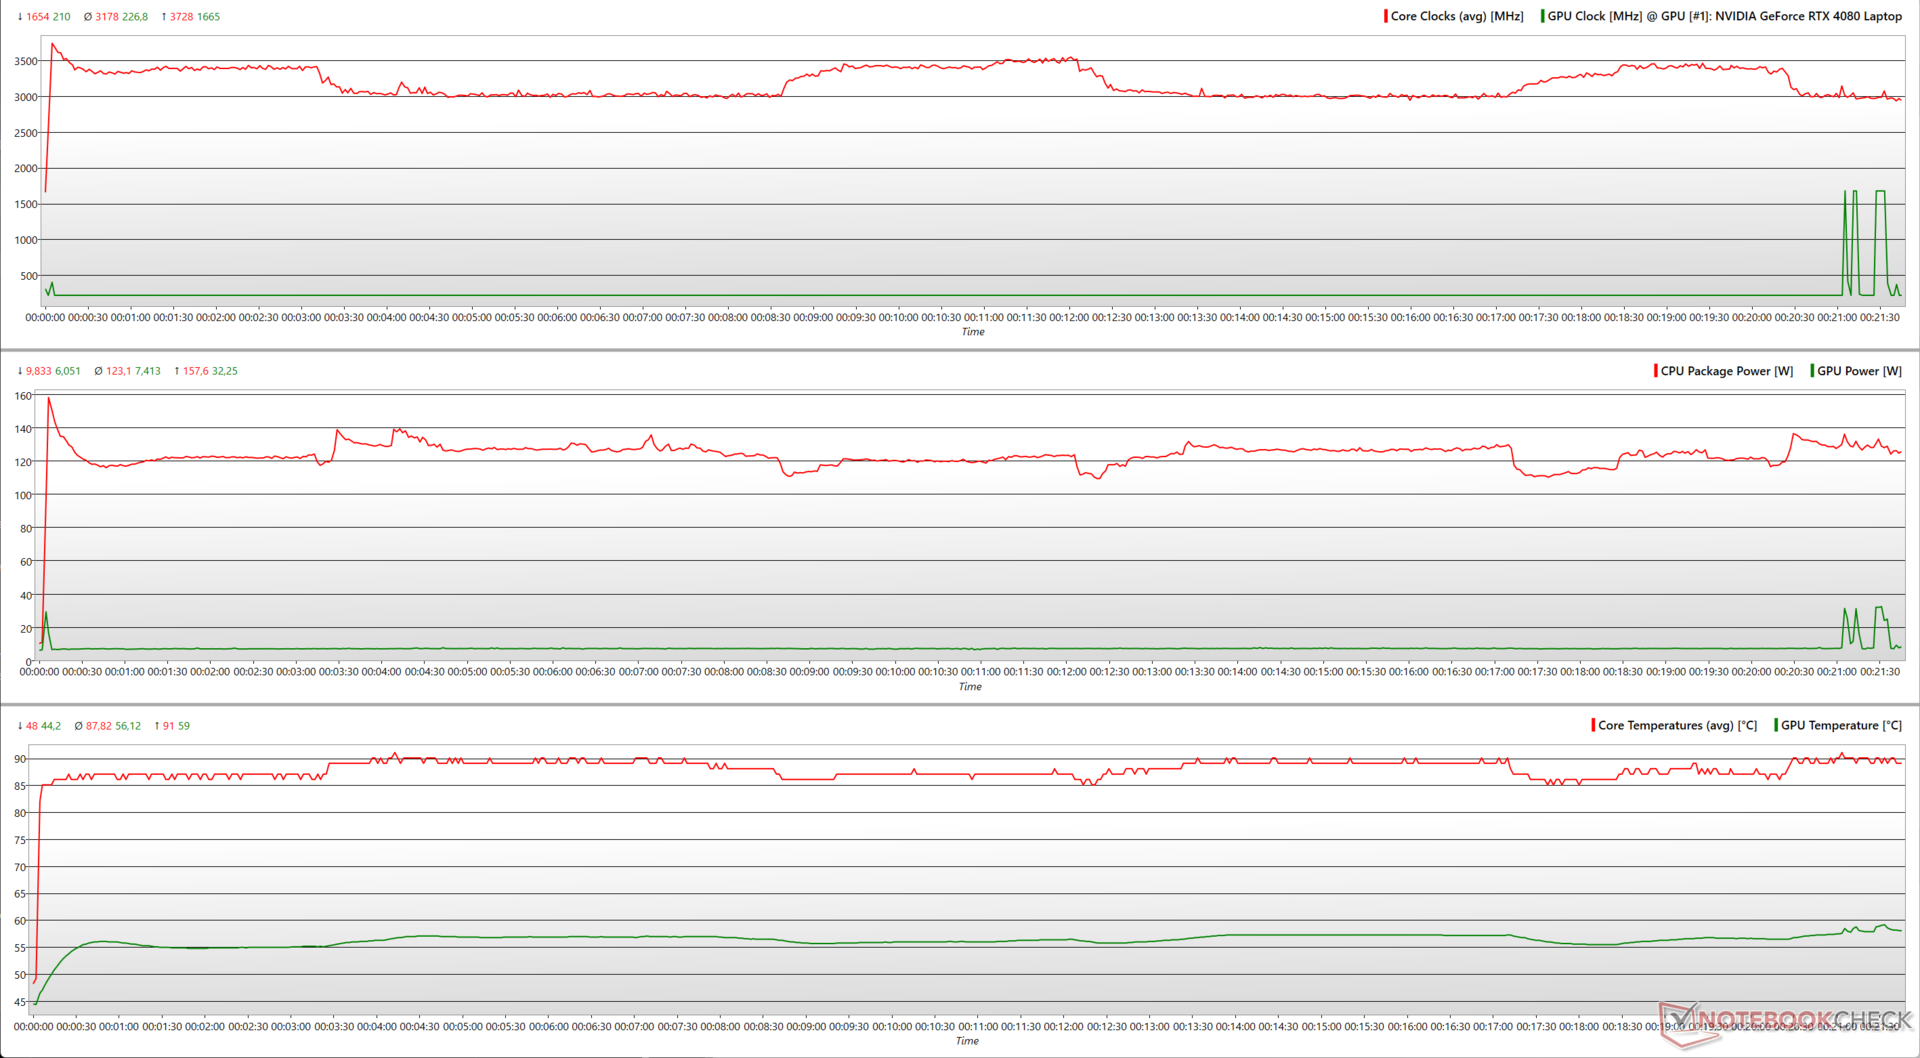
Obciążając Scar 16 za pomocą Prime95 in-place large FFTs sam Core i9-14900HX zużywa do 158 W przy zegarach sięgających 3,7 GHz, ale nie da się tego długo utrzymać. Częstotliwość spada do ~3 GHz, gdy temperatura rdzenia osiąga 90°C. Rdzenie otrzymują chwilę wytchnienia i są w stanie zwiększyć częstotliwość do 3,5 GHz, gdy temperatura spadnie do ~87 °C.
Dodając FurMark (1280 x 720, bez AA) widzimy, że RTX 4080 w Scar 16 pobiera chwilowe 198 W. Laptop może średnio wykorzystać łączną moc 181 W zarówno z CPU, jak i GPU.
Zaobserwowaliśmy jednak walkę o zasilanie, gdy CPU musiał zmniejszyć moc, aby GPU mógł zwiększyć moc i odwrotnie.
| Test obciążeniowy | Taktowanie CPU (GHz) | Taktowanie GPU (MHz) | Średnia temperatura CPU (°C) | Średnia temperatura GPU (°C) |
| System w stanie spoczynku | 1.6 | 210 | 41 | 37.5 |
| Prime95 | 3.0 | 210 | 87 | 56 |
| Prime95 + FurMark | 2.7 | 1,500 | 78 | 70.4 |
| The Witcher 3 1080p Ultra | 2.4 | 2,460 | 78 | 80.2 |
Stresowanie Scar 16 z The Witcher 3 przy 1080p Ultra prezentuje bardziej rzeczywiste zachowanie. Core i9-14900HX może czasami osiągnąć 4 GHz, zużywając przy tym 81 W. Z drugiej strony, RTX 4080 działa z dobrze utrzymanym taktowaniem 2500 MHz, zużywając przy tym ~ 170 W.
Głośniki
Scar 16 wykorzystuje poczwórny układ głośników z dwoma głośnikami wysokotonowymi w pobliżu podstawy pokrywy i dwoma głośnikami niskotonowymi skierowanymi w dół. Asus zapewnia wsparcie dla Hi-Res Audio i Dolby Atmos.
Głośność na poziomie 79 db(A) jest wystarczająca dla średniej wielkości pomieszczenia. Pasmo przenoszenia basów jest zadowalające, ale mogłoby być lepsze, biorąc pod uwagę obecność dedykowanych głośników niskotonowych. Średnie i wysokie tony są reprodukowane dość dobrze.
Obecność gniazda combo audio 3,5 mm i Bluetooth 5.3 oznacza, że użytkownicy mogą podłączyć znacznie bardziej wydajne zewnętrzne urządzenia audio.
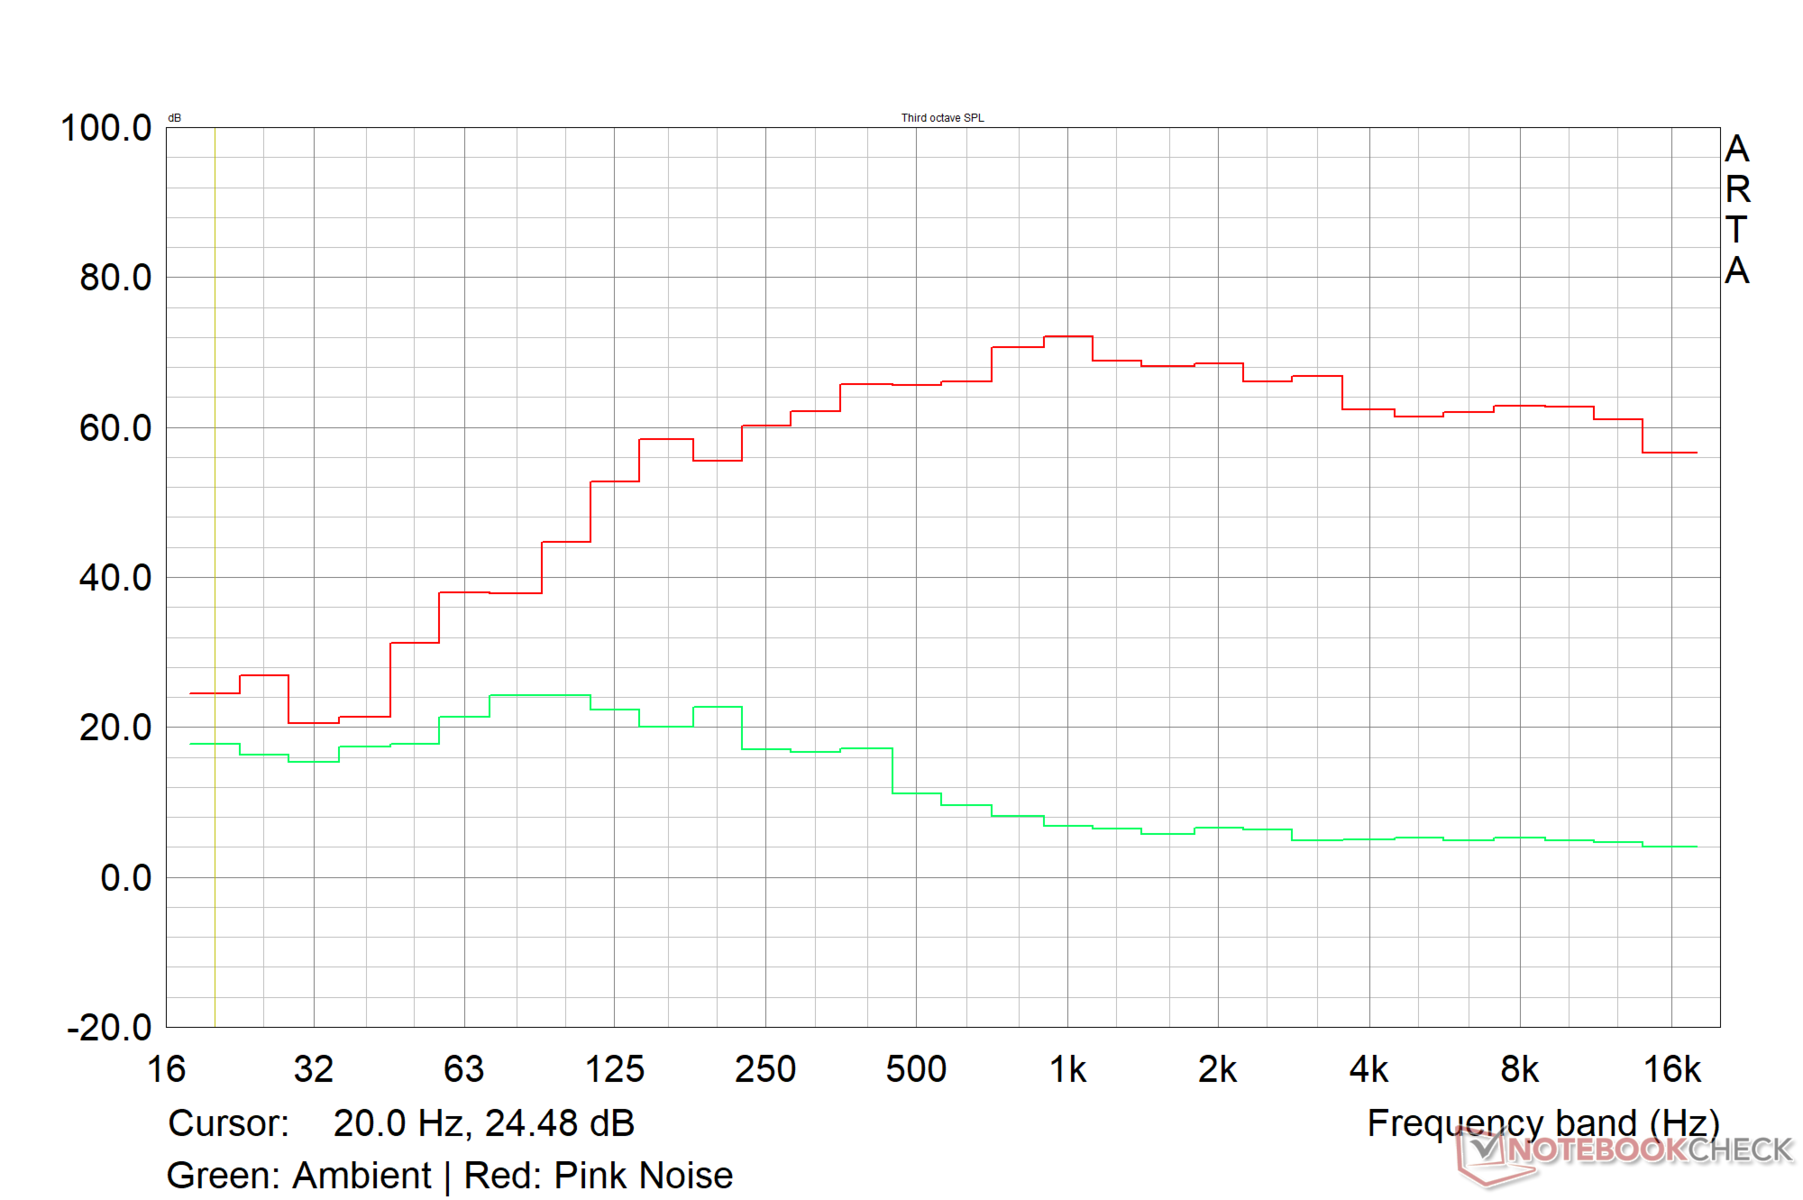
Asus ROG Strix Scar 16 G634JZR audio analysis
(±) | speaker loudness is average but good (79 dB)
Bass 100 - 315 Hz
(±) | reduced bass - on average 7.1% lower than median
(±) | linearity of bass is average (9% delta to prev. frequency)
Mids 400 - 2000 Hz
(±) | higher mids - on average 5.5% higher than median
(+) | mids are linear (3.3% delta to prev. frequency)
Highs 2 - 16 kHz
(+) | balanced highs - only 1.4% away from median
(+) | highs are linear (2.6% delta to prev. frequency)
Overall 100 - 16.000 Hz
(+) | overall sound is linear (9.8% difference to median)
Compared to same class
» 4% of all tested devices in this class were better, 2% similar, 95% worse
» The best had a delta of 6%, average was 18%, worst was 132%
Compared to all devices tested
» 3% of all tested devices were better, 1% similar, 96% worse
» The best had a delta of 4%, average was 25%, worst was 134%
Apple MacBook Pro 16 2021 M1 Pro audio analysis
(+) | speakers can play relatively loud (84.7 dB)
Bass 100 - 315 Hz
(+) | good bass - only 3.8% away from median
(+) | bass is linear (5.2% delta to prev. frequency)
Mids 400 - 2000 Hz
(+) | balanced mids - only 1.3% away from median
(+) | mids are linear (2.1% delta to prev. frequency)
Highs 2 - 16 kHz
(+) | balanced highs - only 1.9% away from median
(+) | highs are linear (2.7% delta to prev. frequency)
Overall 100 - 16.000 Hz
(+) | overall sound is linear (4.6% difference to median)
Compared to same class
» 0% of all tested devices in this class were better, 0% similar, 100% worse
» The best had a delta of 5%, average was 18%, worst was 45%
Compared to all devices tested
» 0% of all tested devices were better, 0% similar, 100% worse
» The best had a delta of 4%, average was 25%, worst was 134%
Zarządzanie energią: Zgodnie z oczekiwaniami dla sprzętu na pokładzie
Zużycie energii
Scar 16 zużywa nieco więcej energii w porównaniu do ROG Strix G16 z procesorem Core i9-13980HX. Omen 16 z podobną konfiguracją jest ogólnie o około 8% bardziej oszczędny niż Scar 16 ze względu na niższą moc CPU i GPU.
Vector 16 HX ma identyczny pobór mocy pod obciążeniem, choć wykazuje znacznie wyższy pobór mocy w stanie spoczynku.
Dostarczony zasilacz o mocy 330 W jest w stanie zapewnić odpowiednie zasilanie laptopa przy maksymalnym obciążeniu.
| wyłączony / stan wstrzymania | |
| luz | |
| obciążenie |
|
| Asus ROG Strix Scar 16 G634JZR i9-14900HX, NVIDIA GeForce RTX 4080 Laptop GPU, Mini LED, 2560x1600, 16.00 | Asus ROG Strix Scar 17 G733PYV-LL053X R9 7945HX3D, NVIDIA GeForce RTX 4090 Laptop GPU, IPS, 2560x1440, 17.30 | Asus ROG Strix G16 G614JZ i9-13980HX, NVIDIA GeForce RTX 4080 Laptop GPU, IPS, 2560x1600, 16.00 | Lenovo Legion Pro 7 16IRX9H i9-14900HX, NVIDIA GeForce RTX 4080 Laptop GPU, IPS, 2560x1600, 16.00 | HP Omen 16 (2024) i9-14900HX, NVIDIA GeForce RTX 4080 Laptop GPU, IPS, 2560x1440, 16.10 | MSI Vector 16 HX A14V i9-14900HX, NVIDIA GeForce RTX 4080 Laptop GPU, IPS, 2560x1600, 16.00 | Alienware m16 R2 Ultra 7 155H, NVIDIA GeForce RTX 4070 Laptop GPU, IPS, 2560x1600, 16.00 | Average NVIDIA GeForce RTX 4080 Laptop GPU | Average of class Gaming | |
|---|---|---|---|---|---|---|---|---|---|
| Power Consumption | -8% | 3% | -20% | 8% | -16% | 16% | -18% | -3% | |
| Idle Minimum * | 10.71 | 15.4 -44% | 10 7% | 16 -49% | 9 16% | 15.8 -48% | 8.1 24% | 16.2 ? -51% | 13.9 ? -30% |
| Idle Average * | 14.75 | 21.6 -46% | 16 -8% | 21 -42% | 16 -8% | 23.3 -58% | 13 12% | 21.4 ? -45% | 19.2 ? -30% |
| Idle Maximum * | 30 | 22.2 26% | 27 10% | 36 -20% | 35 -17% | 30 -0% | 40.3 -34% | 33.7 ? -12% | 27 ? 10% |
| Load Average * | 135 | 116.7 14% | 129 4% | 132 2% | 129 4% | 123.9 8% | 79 41% | 118.8 ? 12% | 111.4 ? 17% |
| Witcher 3 ultra * | 286 | 262 8% | 247 14% | 267 7% | 150.8 47% | 285 -0% | 188.1 34% | ||
| Load Maximum * | 307 | 327.1 -7% | 342 -11% | 360 -17% | 285 7% | 306 -0% | 254.9 17% | 293 ? 5% | 251 ? 18% |
* ... im mniej tym lepiej
Power Consumption: The Witcher 3 / Stress test
Power Consumption: External monitor
Żywotność baterii
W profilu cichym z włączonym MSHybrid i częstotliwością odświeżania 60 Hz, Scar 16 wytrzymuje do 7:14 godzin w naszym standardowym teście przeglądania sieci Wi-Fi przy jasności 150 nitów. Czas ten wzrasta do 7,5 godziny w teście pętli H.264 1080p przy tym samym poziomie jasności z wyłączonymi wszystkimi radiami.
Granie przez długie godziny na baterii ze Scar 16 to mrzonka, ponieważ laptop ledwo wytrzymuje godzinę podczas grania w The Witcher 3 1080p Ultra przy 150 nitach.
| Asus ROG Strix Scar 16 G634JZR i9-14900HX, NVIDIA GeForce RTX 4080 Laptop GPU, 90 Wh | Asus ROG Strix Scar 17 G733PYV-LL053X R9 7945HX3D, NVIDIA GeForce RTX 4090 Laptop GPU, 90 Wh | Asus ROG Strix G16 G614JZ i9-13980HX, NVIDIA GeForce RTX 4080 Laptop GPU, 90 Wh | Lenovo Legion Pro 7 16IRX9H i9-14900HX, NVIDIA GeForce RTX 4080 Laptop GPU, 99.9 Wh | HP Omen 16 (2024) i9-14900HX, NVIDIA GeForce RTX 4080 Laptop GPU, 83 Wh | MSI Vector 16 HX A14V i9-14900HX, NVIDIA GeForce RTX 4080 Laptop GPU, 90 Wh | Alienware m16 R2 Ultra 7 155H, NVIDIA GeForce RTX 4070 Laptop GPU, 90 Wh | Average of class Gaming | |
|---|---|---|---|---|---|---|---|---|
| Czasy pracy | -20% | 31% | -14% | -19% | 21% | 15% | 20% | |
| H.264 | 451 | 302 -33% | 400 ? -11% | |||||
| WiFi v1.3 | 434 | 287 -34% | 583 34% | 373 -14% | 352 -19% | 332 -24% | 483 11% | 367 ? -15% |
| Witcher 3 ultra | 57 | 80.6 ? 41% | ||||||
| Load | 51 | 55 8% | 65 27% | 84 65% | 60 18% | 84.3 ? 65% | ||
| Reader / Idle | 641 | 758 | 543 ? |
Za
Przeciw
Werdykt: Zwyczajowa iteracyjna aktualizacja dla entuzjastów gier
Asus trzyma się wypróbowanej i przetestowanej formuły, która odróżnia Scar 16 od konkurencji. W tym sensie tegoroczny Asus ROG Strix Scar 16 jest jedynie ewolucyjnym, ale nie rewolucyjnym ulepszeniem w stosunku do poprzedniej generacji.
Asus oferuje wysokiej klasy wyświetlacz mini LED G-Sync HDR w modelu Scar 16. Wyświetlacz o wysokiej częstotliwości PWM 240 Hz prezentuje doskonałą charakterystykę kolorów i doskonale nadaje się również do krytycznych dla kolorów przepływów pracy, aczkolwiek w trybie jednostrefowego podświetlenia. Nie jest to niestety dobrze udokumentowane.
Asus ROG Strix Scar 16 spełnia niemal wszystkie wymagania stawiane 16-calowemu laptopowi dla entuzjastów gier w 2024 roku. Jego rówieśnicy oferują jednak podobne funkcje i wydajność za niższą cenę wywoławczą.
Pod względem wydajności, ROG Strix Scar 16 może konkurować z innymi laptopami z procesorami Core i9-14900HX i RTX 4080.
Wprowadzone przez Asusa poprawki chłodzenia pozwalają Scar 16 wykorzystać łączną moc 180 W zarówno z CPU, jak i GPU pod obciążeniem. Jednak tak duże obciążenie laptopa nieuchronnie skutkuje wysokimi temperaturami powierzchni i emisją hałasu wentylatora.
Niektóre zastrzeżenia, którymi chcielibyśmy się zająć, obejmują lepszą wydajność Wi-Fi 5 i bardziej sprawiedliwy rozkład portów po obu stronach. Dodatkowo, włączenie kamery internetowej 1080p do tego modelu nie powinno być zbyt wymagające dla Asusa w 2024 roku.
Jeśli szukają Państwo 16-calowej gamingowej potęgi z około 3,00,00 ₹ (~ 3000 USD) do stracenia, Asus ROG Strix Scar 16 prawie idealnie pasuje do tego rachunku. Nie jest to jednak najbardziej idealna okazja.
Lenovo Legion Pro 7 ma smuklejszy profil, większą baterię (z krótszym czasem pracy) i znacznie lepszą kamerę internetową 1080p, a jednocześnie działa nieco lepiej po stronie procesora.
Model MSI Vector 16 HX, choć pozbawiony niektórych dodatków RGB i G-Sync, ma nieco niższą cenę i w większości aspektów dorównuje wydajności Scar 16.
Cena i dostępność
W Indiach, Asus ROG Strix Scar 16 (2024) z RTX 4080 jest oficjalnie wyceniony na 2 89 990 jenów, ale obecnie jest dostępny w sprzedaży detalicznej za 3 04 490 jenów na Amazon India, podczas gdy wersja RTX 40 90 jest dostępna w wyznaczonej cenie 3 29 990 jenów.
Testowany ROG Strix Scar 16 (2024) z dyskiem SSD 1 TB i RTX 4080 można nabyć za 2 900 USD na Amazon US i Best Buy US, podczas gdy wariant RT X 4090 kosztuje 3 625 USD.
Asus ROG Strix Scar 16 G634JZR
-
22/04/2024 v7
Vaidyanathan Subramaniam
Transparency
The present review sample was made available to the author as a loan by the manufacturer or a shop for the purposes of review. The lender had no influence on this review, nor did the manufacturer receive a copy of this review before publication. There was no obligation to publish this review.
Pricecompare

