 Deutsch
 English
 Español
 Français
 Italiano
 Nederlands
 Polski
 Português
 Русский
 Türkçe
 Svenska
 Chinese
 Magyar
Recenzja laptopa HP EliteBook Ultra G1q 14: Wysokie oczekiwania wobec Windows na ARM

HP EliteBook Ultra G1p 14 był jednym z wielu modeli laptopów ujawnionych podczas wydarzenia Microsoft Surface w zeszłym miesiącu w Seattle. Zapowiedź ta była szczególnie ważna, ponieważ oznaczała początek trzeciej próby przeniesienia systemu Windows na platformy ARM. Tym razem jednak twórca systemu Windows ma wsparcie procesora Snapdragon firmy Qualcomm gotowego do obsługi sztucznej inteligencji oraz głównych producentów, takich jak HP, Dell, Lenovo i Asus, aby popchnąć platformę do przodu.
Naszą dzisiejszą recenzją jest biznesowy EliteBook Ultra G1p 14 z SoC Snapdragon X Elite X1E-78-100, 16 GB pamięci RAM LPDDR5x-8400 i 512 GB SSD w cenie detalicznej 1700 USD. W chwili pisania tego tekstu nie są dostępne żadne inne jednostki SKU. Powiązany, ale oddzielny model HP o nazwie OmniBook X 14 ma bardzo podobną specyfikację za 500 USD mniej i jest bardziej zorientowany na konsumenta.
Zalecamy zapoznanie się z naszej recenzji Asus Vivobook S 15 który jest wyposażony w ten sam procesor Qualcomm ARM co nasz HP. Nasze doświadczenia z oprogramowaniem między tymi dwoma laptopami są zatem bardzo podobne.
Więcej recenzji HP:
Potenziali concorrenti a confrontos
Rating | Version | Date | Model | Weight | Height | Size | Resolution | Best Price |
|---|---|---|---|---|---|---|---|---|
| 82.3 % | v8 (new) | 07/2024 | HP EliteBook Ultra G1q 14 Snapdragon X Elite X1E-78-100, SD X Adreno X1-85 3.8 TFLOPS GPU | 1.3 kg | 11.2 mm | 14.00" | 2240x1400 | |
| 83.3 % | v8 (new) | 06/2024 | Asus Vivobook S 15 OLED Snapdragon Snapdragon X Elite X1E-78-100, SD X Adreno X1-85 3.8 TFLOPS GPU | 1.4 kg | 15.9 mm | 15.60" | 2880x1620 | |
| 89.4 % | v7 (old) | 03/2023 | HP Dragonfly Pro 2023 R7 7736U, Radeon 680M | 1.5 kg | 18.3 mm | 14.00" | 1920x1200 | |
| 88.3 % | v7 (old) | 04/2024 | Dell Latitude 9450 2-in-1 Ultra 7 165U, Graphics 4-Core | 1.6 kg | 16.28 mm | 14.00" | 2560x1600 | |
| 90.8 % | v7 (old) | 02/2024 | Lenovo ThinkPad X1 Carbon G12 Ultra 7 155H, Arc 8-Core | 1.1 kg | 14.96 mm | 14.00" | 2880x1800 | |
| 92.8 % | v7 (old) | 11/2023 | Apple MacBook Pro 14 2023 M3 Max Apple M3 Max 16-Core, M3 Max 40-Core GPU | 1.6 kg | 15.5 mm | 14.20" | 3024x1964 |
Uwaga: Niedawno zaktualizowaliśmy nasz system oceny i wyniki wersji 8 nie są porównywalne z wynikami wersji 7. Więcej informacji znajdą Państwo tutaj .
Etui - Odpowiedzialne wykonanie z aluminium i tworzyw sztucznych pochodzących z recyklingu
EliteBook Ultra G1q 14 może i ma nowy, fantazyjny procesor ARM, ale jego obudowa wydaje się być mocno inspirowana zeszłorocznym, napędzanym przez AMD modelem Dragonfly Pro. Wszystko, od koloru obudowy, układu klawiatury, konstrukcji zawiasów i wizualnych akcentów, bardziej przypomina 14-calową serię Dragonfly niż 14-calową EliteBook 1040 niż seria EliteBook 1040. Oznacza to, że maszyna Qualcomm jest równie wysokiej jakości pomimo super lekkiej i cienkiej konstrukcji.
Niestety, małe zawiasy są najsłabszym aspektem sztywnej obudowy. Zauważyliśmy to również w naszej recenzji Dragonfly Pro i nieco rozczarowujące jest to, że ten sam problem występuje w EliteBook Ultra G1q 14. Sztywność zawiasów po prostu nie jest zbyt duża przy szerszych kątach, a pokrywa ma tendencję do dość zauważalnego chwiania się podczas dostosowywania kątów. Mamy lepsze poczucie długowieczności z bardziej napiętych zawiasów Dell Latitude 9450 dla porównania.

Rozmiar i waga to najważniejsze cechy EliteBook Ultra G1q 14, ponieważ model ten jest zauważalnie cieńszy i lżejszy niż wielu jego konkurentów, w tym Latitude 9450 2-w-1, XPS 14 9440lub MacBook Pro 14. Użytkownicy mogą jednak wybrać jeszcze lżejszy model, decydując się na ThinkPad X1 Carbon G12 lub LG Gram 14 więc nasza maszyna oparta na Qualcomm niekoniecznie jest najlżejsza.


Łączność
System zawiera port USB-A, podczas gdy większość innych 14-calowych subnotebooków go nie oferuje, w tym nawet własna seria Dragonfly HP. USB4 jest na szczęście obsługiwane w celu zapewnienia kompatybilności z szerszą gamą stacji dokujących i monitorów.
W przeciwieństwie do Latitude 9440 2-in-1 lub ThinkPad X1 Carbon G12 nie ma blokady Kensington.


Kamera internetowa
Czujnik 5 MP jest standardowo wyposażony w podczerwień do logowania bez użycia rąk i fizyczny suwak zapewniający prywatność. Dla porównania, niektóre inne laptopy HP, takie jak Dragonfly Folio G3 mają czujniki 8 MP.


Konserwacja
Dolny panel jest zabezpieczony tylko czterema śrubami Torx, co zapewnia stosunkowo łatwy serwis. Możliwości rozbudowy są jednak ograniczone do slotu M.2 2280 PCIe4 SSD i modułu M.2 WLAN, gdyż pamięć RAM jest wlutowana. Konstrukcja chłodzenia z pojedynczym wentylatorem jest podobna do większości innych modeli EliteBook, takich jak EliteBook 845, podczas gdy modele Dragonfly zazwyczaj wykorzystują konstrukcje z dwoma wentylatorami.

Akcesoria i gwarancja
W pudełku detalicznym nie ma żadnych dodatków poza zasilaczem sieciowym i dokumentacją. Etui ochronne byłoby miłe dla oka, biorąc pod uwagę cenę wywoławczą tego modelu.
Trzyletnia gwarancja producenta jest standardem wraz z roczną ochroną oprogramowania HP Wolf Security Pro. Dłuższa gwarancja podstawowa jest kluczowym czynnikiem odróżniającym konsumencki OmniBook X 14 od biznesowego EliteBooka Ultra G1q 14.
Urządzenia wejściowe - znajome uczucie ważki
Klawiatura
Układ klawiatury jest bardziej podobny do Dragonfly Pro niż do EliteBook 845 zwłaszcza pod względem rozmiaru klawiszy i czcionki. Skok jest bardzo płytki, wliczając w to klawisze spacji i Enter, którym przydałoby się mocniejsze sprzężenie zwrotne.
Wszystkie klawisze i symbole są podświetlane, gdy aktywne jest podświetlenie.
Panel dotykowy
Powierzchnia jest nieco szersza niż w przypadku Dragonfly Pro (12,5 x 8 cm w porównaniu do 12,0 x 8 cm), aby była jeszcze bardziej przestronna dla wygodnego wprowadzania wielodotykowego. Trakcja jest płynna, z niewielką lepkością podczas szybowania z mniejszą prędkością dla lepszej dokładności. Sprzężenie zwrotne podczas naciskania na powierzchnię jest również ostrzejsze, mocniejsze i głośniejsze niż w serii XPS lub Lenovo IdeaPad. Jest to jeden z bardziej satysfakcjonujących i niezawodnych clickpadów dostępnych na rynku, przynajmniej jeśli nie brać pod uwagę trackpadów z dedykowanymi przyciskami.


Wyświetlacz - Standardowy 60 Hz IPS
Choć procesor może być wyjątkowy, ekran dotykowy jest dość przeciętny. Panel IPS oferuje pełne kolory sRGB, rozdzielczość poniżej QHD i szybszy czas reakcji czerni i bieli oraz szarości niż 14-calowy panel w Dragonfly Pro. Poza tym brakuje mu funkcji, które można znaleźć w bardziej zaawansowanych panelach, takich jak obsługa HDR, wyższe częstotliwości odświeżania i Windows VRR.


| |||||||||||||||||||||||||
rozświetlenie: 87 %
na akumulatorze: 341.4 cd/m²
kontrast: 875:1 (czerń: 0.39 cd/m²)
ΔE Color 5.63 | 0.5-29.43 Ø4.98
ΔE Greyscale 8.8 | 0.57-98 Ø5.2
Gamma: 2.14
| HP EliteBook Ultra G1q 14 IPS, 2240x1400, 14.00 | Asus Vivobook S 15 OLED Snapdragon ATNA56AC03-0, OLED, 2880x1620, 15.60 | HP Dragonfly Pro 2023 AU Optronics AUOA49A, IPS, 1920x1200, 14.00 | Dell Latitude 9450 2-in-1 AU Optronics B140QAN, IPS, 2560x1600, 14.00 | Lenovo ThinkPad X1 Carbon G12 Samsung ATNA40YK20-0, OLED, 2880x1800, 14.00 | Apple MacBook Pro 14 2023 M3 Max Mini-LED, 3024x1964, 14.20 | |
|---|---|---|---|---|---|---|
| Display | ||||||
| Display P3 Coverage | 76.6 | 80.6 | 99.7 | 99.2 | ||
| sRGB Coverage | 100 | 100 | 100 | |||
| AdobeRGB 1998 Coverage | 77.4 | 80.1 | 98.2 | |||
| Response Times | 97% | -145% | -130% | 96% | -297% | |
| Response Time Grey 50% / Grey 80% * | 22.8 ? | 0.61 ? 97% | 65.6 ? -188% | 59.6 ? -161% | 0.91 ? 96% | 80.8 ? -254% |
| Response Time Black / White * | 17.9 ? | 0.67 ? 96% | 36 ? -101% | 35.6 ? -99% | 0.76 ? 96% | 78.8 ? -340% |
| PWM Frequency | 240 ? | 240.3 | 14878 ? | |||
| Screen | 306% | 45% | 48% | 50% | 68% | |
| Brightness middle | 341.4 | 378 11% | 425.9 25% | 501.4 47% | 417 22% | 610 79% |
| Brightness | 315 | 379 20% | 405 29% | 491 56% | 417 32% | 600 90% |
| Brightness Distribution | 87 | 98 13% | 87 0% | 88 1% | 98 13% | 96 10% |
| Black Level * | 0.39 | 0.02 95% | 0.26 33% | 0.32 18% | ||
| Contrast | 875 | 18900 2060% | 1638 87% | 1567 79% | ||
| Colorchecker dE 2000 * | 5.63 | 1 82% | 2.81 50% | 2.52 55% | 1.26 78% | 1.7 70% |
| Colorchecker dE 2000 max. * | 11.94 | 2.6 78% | 4.91 59% | 4.87 59% | 3.6 70% | 2.3 81% |
| Greyscale dE 2000 * | 8.8 | 1.2 86% | 2.2 75% | 2.8 68% | 1.3 85% | 2.1 76% |
| Gamma | 2.14 103% | 2.19 100% | 2.04 108% | 2.17 101% | 2.27 97% | 2.22 99% |
| CCT | 6034 108% | 6460 101% | 6688 97% | 6270 104% | 6355 102% | 6874 95% |
| Colorchecker dE 2000 calibrated * | 0.49 | 0.45 | 0.68 | |||
| Total Average (Program / Settings) | 202% /
264% | -50% /
7% | -41% /
12% | 73% /
62% | -115% /
-24% |
* ... im mniej tym lepiej
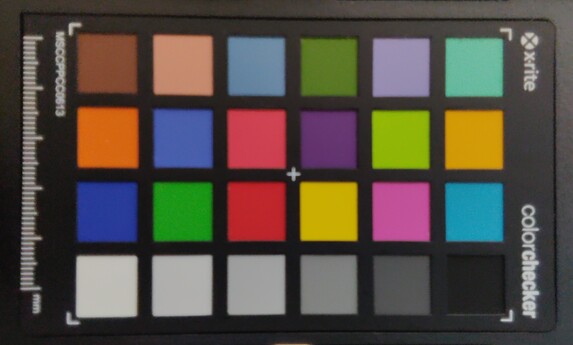
Średnie wartości deltaE dla skali szarości i kolorów mogłyby być lepsze i wynosić odpowiednio 8,8 i 5,63 po wyjęciu z pudełka, co sugeruje, że system nie został fabrycznie skalibrowany. W szczególności temperatura barwowa jest nieco zbyt ciepła i wynosi ~6000K. Kalibracja może również okazać się trudna, ponieważ oprogramowanie do kolorymetru, takie jak i1Profiler, może nie działać poprawnie.


Display Response Times
| ↔ Response Time Black to White | ||
|---|---|---|
| 17.9 ms ... rise ↗ and fall ↘ combined | ↗ 10.3 ms rise |  |
| ↘ 7.6 ms fall | ||
| The screen shows good response rates in our tests, but may be too slow for competitive gamers. In comparison, all tested devices range from 0.1 (minimum) to 240 (maximum) ms. » 35 % of all devices are better. This means that the measured response time is better than the average of all tested devices (21.3 ms). | ||
| ↔ Response Time 50% Grey to 80% Grey | ||
| 22.8 ms ... rise ↗ and fall ↘ combined | ↗ 9.3 ms rise |  |
| ↘ 13.5 ms fall | ||
| The screen shows good response rates in our tests, but may be too slow for competitive gamers. In comparison, all tested devices range from 0.2 (minimum) to 636 (maximum) ms. » 29 % of all devices are better. This means that the measured response time is better than the average of all tested devices (33.5 ms). | ||
Screen Flickering / PWM (Pulse-Width Modulation)
| Screen flickering / PWM not detected |  | ||
In comparison: 53 % of all tested devices do not use PWM to dim the display. If PWM was detected, an average of 17629 (minimum: 5 - maximum: 3846000) Hz was measured. | |||
Maksymalna jasność wynosząca od 350 do 400 nitów jest niższa niż w Macbooku Pro 14 lub EliteBooku 830, gdzie poziomy jasności mogą osiągnąć odpowiednio 600 nitów lub 1000 nitów. Podczas gdy ~350 nitów jest świetne dla środowisk wewnętrznych, oświetlenie zewnętrzne i warunki będą przytłaczać ekran EliteBook Ultra.


Wydajność - dobra po wyjściu z bramki, ale niewystarczająca


Warunki testowania
Przed uruchomieniem poniższych testów porównawczych ustawiliśmy system Windows w tryb wydajności. Wiele benchmarków musi być emulowanych w celu uruchomienia, w tym 3DMark, co może utrudnić bezpośrednie porównania z układami Intela lub AMD.
Procesor
Surowa wydajność wielordzeniowa jest na równi z konkurencją Core Ultra 7 165U w najlepszym przypadku będąc około 15 do 20 procent w tyle za Ryzen 7 7840U lub 8840U. Wyniki stają się jeszcze gorsze w przypadku operacji jednordzeniowych, gdzie nasz Snapdragon X Elite X1E-78-100 może być nawet o 35 do 40 procent wolniejszy niż wspomniane wcześniej alternatywy Intela i AMD. Podobne wyniki można znaleźć porównując układ Qualcomm do Apple M2 lub nowszymi.
Wydajność spada z czasem, gdy jest obciążona, ponieważ wysokie częstotliwości taktowania są nie do utrzymania przez długi czas. Chociaż nie jest to rzadkością, spadek wydajności jest bardziej stromy w porównaniu do wielu alternatyw Core-U lub Ryzen-U. Przykładowo, podczas uruchamiania CineBench R15 xT w pętli, początkowy wynik 2175 punktów spadłby o 27 procent po sześciu pętlach, w porównaniu do zaledwie 12 procent w przypadku zeszłorocznego modelu AMD powered Dragonfly Pro. Podejrzewamy, że wynika to z mniejszego rozwiązania chłodzącego konstrukcji EliteBook Ultra G1q, ponieważ większy Vivobook S 15 OLED z tym samym procesorem Qualcomm może konsekwentnie utrzymywać wyższe wyniki w podobnych warunkach testowych.
Cinebench R15 Multi Loop
Cinebench R23: Multi Core | Single Core
Cinebench R20: CPU (Multi Core) | CPU (Single Core)
Cinebench R15: CPU Multi 64Bit | CPU Single 64Bit
Blender: v2.79 BMW27 CPU
7-Zip 18.03: 7z b 4 | 7z b 4 -mmt1
Geekbench 6.2: Multi-Core | Single-Core
Geekbench 5.5: Multi-Core | Single-Core
HWBOT x265 Benchmark v2.2: 4k Preset
LibreOffice : 20 Documents To PDF
R Benchmark 2.5: Overall mean
| CPU Performance Rating | |
| Apple MacBook Pro 14 2023 M3 Max -5! | |
| Asus ZenBook 14X UX3404VC -2! | |
| Lenovo Yoga Pro 7 14APH G8 | |
| Huawei MateBook X Pro 2024 | |
| MSI Stealth 14 Studio A13V -2! | |
| Apple MacBook Pro 14 2023 M3 Pro -5! | |
| Asus Zenbook 14 OLED UM3406HA | |
| Apple MacBook Pro 14 2023 M2 Pro -8! | |
| Dell Inspiron 14 7445 2-in-1 | |
| Lenovo ThinkPad X1 Carbon G12 | |
| Lenovo ThinkPad T14 G3-21AJS00400 -2! | |
| HP Dragonfly Pro 2023 -4! | |
| Dell Latitude 9450 2-in-1 | |
| Apple MacBook Pro 14 2021 M1 Max 24-Core GPU -7! | |
| Acer TravelMate P4 TMP414-53-58XQ | |
| Asus Vivobook S 15 OLED Snapdragon | |
| Average Qualcomm Snapdragon X Elite X1E-78-100 | |
| HP EliteBook 1040 G10 818N7EA | |
| HP EliteBook Ultra G1q 14 -2! | |
| Cinebench R20 / CPU (Multi Core) | |
| MSI Stealth 14 Studio A13V | |
| Lenovo Yoga Pro 7 14APH G8 | |
| Apple MacBook Pro 14 2023 M3 Max | |
| Asus ZenBook 14X UX3404VC | |
| Huawei MateBook X Pro 2024 | |
| Lenovo ThinkPad X1 Carbon G12 | |
| Asus Zenbook 14 OLED UM3406HA | |
| Dell Inspiron 14 7445 2-in-1 | |
| Lenovo ThinkPad T14 G3-21AJS00400 | |
| Dell Latitude 9450 2-in-1 | |
| HP EliteBook Ultra G1q 14 | |
| Average Qualcomm Snapdragon X Elite X1E-78-100 (4033 - 4128, n=2) | |
| Apple MacBook Pro 14 2023 M2 Pro | |
| Asus Vivobook S 15 OLED Snapdragon | |
| Apple MacBook Pro 14 2023 M3 Pro | |
| Acer TravelMate P4 TMP414-53-58XQ | |
| HP EliteBook 1040 G10 818N7EA | |
| Apple MacBook Pro 14 2021 M1 Max 24-Core GPU | |
| Cinebench R20 / CPU (Single Core) | |
| Asus ZenBook 14X UX3404VC | |
| Lenovo ThinkPad T14 G3-21AJS00400 | |
| Huawei MateBook X Pro 2024 | |
| Dell Inspiron 14 7445 2-in-1 | |
| Lenovo Yoga Pro 7 14APH G8 | |
| Asus Zenbook 14 OLED UM3406HA | |
| Dell Latitude 9450 2-in-1 | |
| Lenovo ThinkPad X1 Carbon G12 | |
| HP EliteBook 1040 G10 818N7EA | |
| MSI Stealth 14 Studio A13V | |
| Acer TravelMate P4 TMP414-53-58XQ | |
| Apple MacBook Pro 14 2023 M3 Pro | |
| Apple MacBook Pro 14 2023 M3 Max | |
| Apple MacBook Pro 14 2023 M2 Pro | |
| Asus Vivobook S 15 OLED Snapdragon | |
| Average Qualcomm Snapdragon X Elite X1E-78-100 (416 - 420, n=2) | |
| HP EliteBook Ultra G1q 14 | |
| Apple MacBook Pro 14 2021 M1 Max 24-Core GPU | |
| Cinebench R15 / CPU Single 64Bit | |
| Apple MacBook Pro 14 2023 M3 Pro | |
| Lenovo Yoga Pro 7 14APH G8 | |
| Apple MacBook Pro 14 2023 M3 Max | |
| Dell Inspiron 14 7445 2-in-1 | |
| Asus Zenbook 14 OLED UM3406HA | |
| Asus ZenBook 14X UX3404VC | |
| Huawei MateBook X Pro 2024 | |
| Dell Latitude 9450 2-in-1 | |
| HP EliteBook 1040 G10 818N7EA | |
| Lenovo ThinkPad X1 Carbon G12 | |
| HP Dragonfly Pro 2023 | |
| Lenovo ThinkPad T14 G3-21AJS00400 | |
| MSI Stealth 14 Studio A13V | |
| Acer TravelMate P4 TMP414-53-58XQ | |
| Apple MacBook Pro 14 2023 M2 Pro | |
| Apple MacBook Pro 14 2021 M1 Max 24-Core GPU | |
| Asus Vivobook S 15 OLED Snapdragon | |
| Average Qualcomm Snapdragon X Elite X1E-78-100 (208 - 210, n=2) | |
| HP EliteBook Ultra G1q 14 | |
| Blender / v2.79 BMW27 CPU | |
| HP EliteBook 1040 G10 818N7EA | |
| Apple MacBook Pro 14 2023 M3 Pro | |
| HP EliteBook Ultra G1q 14 | |
| Acer TravelMate P4 TMP414-53-58XQ | |
| Average Qualcomm Snapdragon X Elite X1E-78-100 (313 - 356, n=2) | |
| Lenovo ThinkPad T14 G3-21AJS00400 | |
| Asus Vivobook S 15 OLED Snapdragon | |
| Dell Latitude 9450 2-in-1 | |
| HP Dragonfly Pro 2023 | |
| Lenovo ThinkPad X1 Carbon G12 | |
| Huawei MateBook X Pro 2024 | |
| Dell Inspiron 14 7445 2-in-1 | |
| Lenovo Yoga Pro 7 14APH G8 | |
| Asus Zenbook 14 OLED UM3406HA | |
| Asus ZenBook 14X UX3404VC | |
| Apple MacBook Pro 14 2023 M3 Max | |
| Apple MacBook Pro 14 2021 M1 Max 24-Core GPU | |
| MSI Stealth 14 Studio A13V | |
Cinebench R23: Multi Core | Single Core
Cinebench R20: CPU (Multi Core) | CPU (Single Core)
Cinebench R15: CPU Multi 64Bit | CPU Single 64Bit
Blender: v2.79 BMW27 CPU
7-Zip 18.03: 7z b 4 | 7z b 4 -mmt1
Geekbench 6.2: Multi-Core | Single-Core
Geekbench 5.5: Multi-Core | Single-Core
HWBOT x265 Benchmark v2.2: 4k Preset
LibreOffice : 20 Documents To PDF
R Benchmark 2.5: Overall mean
* ... im mniej tym lepiej
AIDA64: FP32 Ray-Trace | FPU Julia | CPU SHA3 | CPU Queen | FPU SinJulia | FPU Mandel | CPU AES | CPU ZLib | FP64 Ray-Trace | CPU PhotoWorxx
| Performance Rating | |
| Lenovo ThinkPad X1 Carbon G12 | |
| Dell Latitude 9450 2-in-1 | |
| Asus Vivobook S 15 OLED Snapdragon | |
| Average Qualcomm Snapdragon X Elite X1E-78-100 | |
| HP EliteBook Ultra G1q 14 | |
| AIDA64 / FP32 Ray-Trace | |
| Dell Latitude 9450 2-in-1 | |
| Lenovo ThinkPad X1 Carbon G12 | |
| HP EliteBook Ultra G1q 14 | |
| Average Qualcomm Snapdragon X Elite X1E-78-100 (7801 - 8083, n=2) | |
| Asus Vivobook S 15 OLED Snapdragon | |
| AIDA64 / FPU Julia | |
| Dell Latitude 9450 2-in-1 | |
| Lenovo ThinkPad X1 Carbon G12 | |
| HP EliteBook Ultra G1q 14 | |
| Average Qualcomm Snapdragon X Elite X1E-78-100 (21914 - 24109, n=2) | |
| Asus Vivobook S 15 OLED Snapdragon | |
| AIDA64 / CPU SHA3 | |
| Asus Vivobook S 15 OLED Snapdragon | |
| Average Qualcomm Snapdragon X Elite X1E-78-100 (3187 - 3249, n=2) | |
| HP EliteBook Ultra G1q 14 | |
| Dell Latitude 9450 2-in-1 | |
| Lenovo ThinkPad X1 Carbon G12 | |
| AIDA64 / CPU Queen | |
| Lenovo ThinkPad X1 Carbon G12 | |
| Asus Vivobook S 15 OLED Snapdragon | |
| Average Qualcomm Snapdragon X Elite X1E-78-100 (67909 - 67959, n=2) | |
| HP EliteBook Ultra G1q 14 | |
| Dell Latitude 9450 2-in-1 | |
| AIDA64 / FPU SinJulia | |
| Lenovo ThinkPad X1 Carbon G12 | |
| Dell Latitude 9450 2-in-1 | |
| Asus Vivobook S 15 OLED Snapdragon | |
| Average Qualcomm Snapdragon X Elite X1E-78-100 (1518 - 1880, n=2) | |
| HP EliteBook Ultra G1q 14 | |
| AIDA64 / FPU Mandel | |
| Dell Latitude 9450 2-in-1 | |
| Lenovo ThinkPad X1 Carbon G12 | |
| Asus Vivobook S 15 OLED Snapdragon | |
| Average Qualcomm Snapdragon X Elite X1E-78-100 (14459 - 14598, n=2) | |
| HP EliteBook Ultra G1q 14 | |
| AIDA64 / CPU AES | |
| HP EliteBook Ultra G1q 14 | |
| Lenovo ThinkPad X1 Carbon G12 | |
| Average Qualcomm Snapdragon X Elite X1E-78-100 (56088 - 64583, n=2) | |
| Asus Vivobook S 15 OLED Snapdragon | |
| Dell Latitude 9450 2-in-1 | |
| AIDA64 / CPU ZLib | |
| Lenovo ThinkPad X1 Carbon G12 | |
| HP EliteBook Ultra G1q 14 | |
| Dell Latitude 9450 2-in-1 | |
| Average Qualcomm Snapdragon X Elite X1E-78-100 (658 - 745, n=2) | |
| Asus Vivobook S 15 OLED Snapdragon | |
| AIDA64 / FP64 Ray-Trace | |
| Dell Latitude 9450 2-in-1 | |
| Lenovo ThinkPad X1 Carbon G12 | |
| Asus Vivobook S 15 OLED Snapdragon | |
| Average Qualcomm Snapdragon X Elite X1E-78-100 (2957 - 4166, n=2) | |
| HP EliteBook Ultra G1q 14 | |
| AIDA64 / CPU PhotoWorxx | |
| Dell Latitude 9450 2-in-1 | |
| Lenovo ThinkPad X1 Carbon G12 | |
| Asus Vivobook S 15 OLED Snapdragon | |
| Average Qualcomm Snapdragon X Elite X1E-78-100 (27950 - 37638, n=2) | |
| HP EliteBook Ultra G1q 14 | |
Wydajność systemu
Oczywiście kilka z naszych typowych aplikacji testowych nie działałoby w środowisku ARM, czego należy się spodziewać:
- Far Cry 5: Nie uruchamia się
- X-Plane: Tylko na niskich ustawieniach; zawiesza się na średnich i wysokich ustawieniach
- Baldur's Gate 3: Nie uruchamia się w trybie DX12
- HWiNFO64: Wersja ARM wkrótce
- i1Profiler: Nie rozpoznaje kolorymetru
- LatencyMon: Brak wersji ARM
- 3DMark06: Błąd SysInfo; można obejść
- Geekbench 6.2: Nie uruchamia się
Warto wspomnieć, że większość z powyższych aplikacji służy do przeprowadzania testów porównawczych, których większość nabywców nie będzie uruchamiać. Aplikacje codziennego użytku, takie jak przeglądarki, odtwarzacze wideo i pakiet Microsoft Office, działają bez problemów.
| Model laptopa | Wynik w programie Word | Wynik Excel | Wynik PowerPoint | Wynik Edge | Wynik łączny |
| EliteBook Ultra G1q 14 (Snapdragon X Elite X1E-78-100) | 8191 | 24856 | 11731 | 12557 | 13159 |
| Latitude 7350 (Core Ultra 5 135U) | 5710 (-30%) | 18505 (-26%) | 10244 (-30%) | 12767 (-13%) | 10842 (-18%) |
PCMark 10 Standard jest również niekompatybilny z ARM, więc zamiast tego uruchomiliśmy PCMark 10 Applications. Nasze wyniki w powyższej tabeli byłyby wyższe niż te, które odnotowaliśmy na Latitude 7350 wyposażonym w Core Ultra 5 135U, co sugeruje, że maszyna Qualcomm jest bardziej porównywalna z serią Core Ultra 7 niż SKU z niższej półki, jeśli chodzi o codzienne zastosowania.
Co ciekawe, wyniki WebXPRT i Kraken byłyby znacznie niższe na naszym HP niż na naszym systemie Asus, pomimo ponownego przeprowadzenia testów.


WebXPRT 3: Overall
WebXPRT 4: Overall
Mozilla Kraken 1.1: Total
| WebXPRT 3 / Overall | |
| Asus Zenbook 14 OLED UM3406HA | |
| Apple MacBook Pro 14 2023 M3 Pro | |
| Asus Vivobook S 15 OLED Snapdragon | |
| Apple MacBook Pro 14 2023 M3 Max | |
| Apple MacBook Pro 14 2023 M2 Pro | |
| Asus ZenBook 14X UX3404VC | |
| Dell Inspiron 14 7445 2-in-1 | |
| Lenovo Yoga Pro 7 14APH G8 | |
| Lenovo ThinkPad X1 Carbon G12 | |
| Huawei MateBook X Pro 2024 | |
| Lenovo ThinkPad T14 G3-21AJS00400 | |
| Dell Latitude 9450 2-in-1 | |
| MSI Stealth 14 Studio A13V | |
| Average Qualcomm Snapdragon X Elite X1E-78-100, Qualcomm Snapdragon X Adreno X1-85 (3.8 TFLOPS) (134.1 - 419, n=2) | |
| HP EliteBook 1040 G10 818N7EA | |
| HP Dragonfly Pro 2023 | |
| HP EliteBook Ultra G1q 14 | |
| WebXPRT 4 / Overall | |
| Asus Vivobook S 15 OLED Snapdragon | |
| Asus ZenBook 14X UX3404VC | |
| Huawei MateBook X Pro 2024 | |
| Lenovo ThinkPad X1 Carbon G12 | |
| Dell Inspiron 14 7445 2-in-1 | |
| Dell Latitude 9450 2-in-1 | |
| Apple MacBook Pro 14 2023 M2 Pro | |
| Lenovo Yoga Pro 7 14APH G8 | |
| Asus Zenbook 14 OLED UM3406HA | |
| Lenovo ThinkPad T14 G3-21AJS00400 | |
| MSI Stealth 14 Studio A13V | |
| HP EliteBook 1040 G10 818N7EA | |
| Average Qualcomm Snapdragon X Elite X1E-78-100, Qualcomm Snapdragon X Adreno X1-85 (3.8 TFLOPS) (114.2 - 285, n=2) | |
| HP Dragonfly Pro 2023 | |
| HP EliteBook Ultra G1q 14 | |
WebXPRT 3: Overall
WebXPRT 4: Overall
Mozilla Kraken 1.1: Total
* ... im mniej tym lepiej
| AIDA64 / Memory Copy | |
| Dell Latitude 9450 2-in-1 | |
| Lenovo ThinkPad X1 Carbon G12 | |
| Asus Vivobook S 15 OLED Snapdragon | |
| Average Qualcomm Snapdragon X Elite X1E-78-100 (45988 - 61071, n=2) | |
| HP EliteBook Ultra G1q 14 | |
| AIDA64 / Memory Read | |
| Asus Vivobook S 15 OLED Snapdragon | |
| Average Qualcomm Snapdragon X Elite X1E-78-100 (60078 - 115323, n=2) | |
| Lenovo ThinkPad X1 Carbon G12 | |
| HP EliteBook Ultra G1q 14 | |
| Dell Latitude 9450 2-in-1 | |
| AIDA64 / Memory Write | |
| Lenovo ThinkPad X1 Carbon G12 | |
| Dell Latitude 9450 2-in-1 | |
| Asus Vivobook S 15 OLED Snapdragon | |
| Average Qualcomm Snapdragon X Elite X1E-78-100 (37763 - 43206, n=2) | |
| HP EliteBook Ultra G1q 14 | |
| AIDA64 / Memory Latency | |
| Dell Latitude 9450 2-in-1 | |
| Lenovo ThinkPad X1 Carbon G12 | |
| Asus Vivobook S 15 OLED Snapdragon | |
| Average Qualcomm Snapdragon X Elite X1E-78-100 (7.8 - 8.1, n=2) | |
| HP EliteBook Ultra G1q 14 | |
* ... im mniej tym lepiej
Urządzenia pamięci masowej
Nasze urządzenie jest dostarczane z SK hynix PC801 HFS512GEJ9X101N który jest powszechnie stosowanym dyskiem PCIe4 x4 w innych modelach z wyższej półki, takich jak Lenovo Yoga 9 14IRP G8 lub EliteBook 840 G9. Niestety, ten w naszym EliteBook Ultra G1q 14 ma tendencję do dławienia, jak pokazują poniższe wyniki testu pętli DiskSpd. Szybkość transferu była stała przez pierwsze kilka minut, a następnie spadła do 3500 MB/s.


| Drive Performance Rating - Percent | |
| HP EliteBook Ultra G1q 14 | |
| Lenovo ThinkPad X1 Carbon G12 | |
| HP Dragonfly Pro 2023 | |
| Dell Latitude 9450 2-in-1 | |
| Asus Vivobook S 15 OLED Snapdragon | |
* ... im mniej tym lepiej
Disk Throttling: DiskSpd Read Loop, Queue Depth 8
Wydajność GPU
wyniki 3DMark z naszego Snapdragon X Adreno są bardziej porównywalne do Arc 4 lub starszych Iris Xe 96 EUs niż Arc 8 lub Radeon 680M/780M. Oznacza to, że najnowsze zintegrowane procesory graficzne od Intela i AMD mogą być od 50 do 80 procent szybsze niż rozwiązania Qualcomm pod względem mocy obliczeniowej.
| Profil mocy | Wynik fizyki | Wynik grafiki | Wynik łączny |
| Tryb wydajności | 18921 | 5569 | 2250 |
| Tryb zrównoważony | 18781 (-1%) | 5574 (-0%) | 2301 (-0%) |
| Zasilanie bateryjne | 6013 (-68%) | 5573 (-0%) | 1885 (-16%) |
Wydaje się, że nie ma deficytu wydajności podczas pracy w trybie zrównoważonym zamiast w trybie wydajności, jak pokazuje nasza tabela wyników Fire Strike powyżej. Jednak praca na zasilaniu bateryjnym znacząco obniża wydajność procesora, w przeciwieństwie do większości subnotebooków z procesorami Core-U lub Ryzen-U, gdzie mniejsze spadki wydajności są bardziej powszechne. The Lenovo ThinkBook 14 2-w-1 G4na przykład, nie doświadczyłby żadnego deficytu pomiędzy trybami Wydajności i Baterii. Nie doświadczyliśmy również większych spadków wydajności podczas uruchamiania Asusa VivoBook z procesorem ARM na zasilaniu bateryjnym. HP twierdzi, że wkrótce pojawi się aktualizacja BIOS-u (F.07), która rozwiąże ten problem.


| 3DMark 11 Performance | 5372 pkt. | |
| 3DMark Cloud Gate Standard Score | 18704 pkt. | |
| 3DMark Fire Strike Score | 5346 pkt. | |
| 3DMark Time Spy Score | 1799 pkt. | |
Pomoc | ||
* ... im mniej tym lepiej
Wydajność w grach
Użytkownicy zainteresowani komputerem PC z systemem Windows opartym na architekturze ARM do gier nie są we właściwym miejscu, ponieważ ten układ Snapdragon nie został zaprojektowany z myślą o graczach. Mając to na uwadze, Qualcomm notorycznie chwalił się możliwością uruchomienia Baldur's Gate 3 w rozdzielczości 1080p i 30 FPS, co natychmiast przyciągnęło uwagę większości recenzentów. Bez pomocy FSR jesteśmy jednak w stanie uzyskać średnio tylko 23 FPS i 35 FPS odpowiednio na ustawieniach 1080p Low i 720p Low. Wydajność w innych grach byłaby podobnie rozczarowująca z wynikami, które byłyby znacznie wolniejsze niż w przypadku konkurencyjnego Arc 8 lub Radeona 680M, zgodnie z przewidywaniami syntetycznych wyników 3DMark powyżej.
Być może najgorszym i najbardziej zauważalnym obecnie problemem jest nierówne tempo wyświetlania klatek lub ich przeskakiwanie, którego doświadczyliśmy w większości testowanych gier. Nawet jeśli średnia liczba klatek na sekundę jest przyzwoita, jak w Tiny Tina's Wonderlands, przeskoki klatek zdarzają się znacznie częściej niż w przypadku alternatywy Intela lub AMD, aż do momentu rozproszenia uwagi. Qualcomm zdecydowanie ma przed sobą długą drogę, zanim ich sterowniki staną się tak dojrzałe jak konkurencja.
| Performance Rating - Percent | |
| Apple MacBook Pro 14 2023 M3 Max -4! | |
| Lenovo ThinkPad X1 Carbon G12 | |
| HP Dragonfly Pro 2023 -1! | |
| Dell Latitude 9450 2-in-1 -1! | |
| Asus Vivobook S 15 OLED Snapdragon -1! | |
| HP EliteBook Ultra G1q 14 | |
| The Witcher 3 - 1920x1080 Ultra Graphics & Postprocessing (HBAO+) | |
| Apple MacBook Pro 14 2023 M3 Max | |
| Lenovo ThinkPad X1 Carbon G12 | |
| HP Dragonfly Pro 2023 | |
| Asus Vivobook S 15 OLED Snapdragon | |
| Dell Latitude 9450 2-in-1 | |
| HP EliteBook Ultra G1q 14 | |
| Final Fantasy XV Benchmark - 1920x1080 High Quality | |
| Lenovo ThinkPad X1 Carbon G12 | |
| HP Dragonfly Pro 2023 | |
| Dell Latitude 9450 2-in-1 | |
| Asus Vivobook S 15 OLED Snapdragon | |
| HP EliteBook Ultra G1q 14 | |
| Strange Brigade - 1920x1080 ultra AA:ultra AF:16 | |
| Lenovo ThinkPad X1 Carbon G12 | |
| HP Dragonfly Pro 2023 | |
| Asus Vivobook S 15 OLED Snapdragon | |
| Dell Latitude 9450 2-in-1 | |
| HP EliteBook Ultra G1q 14 | |
| Dota 2 Reborn - 1920x1080 ultra (3/3) best looking | |
| Lenovo ThinkPad X1 Carbon G12 | |
| HP Dragonfly Pro 2023 | |
| Dell Latitude 9450 2-in-1 | |
| Asus Vivobook S 15 OLED Snapdragon | |
| HP EliteBook Ultra G1q 14 | |
| Tiny Tina's Wonderlands - 1920x1080 High Preset (DX12) | |
| Lenovo ThinkPad X1 Carbon G12 | |
| HP EliteBook Ultra G1q 14 | |
| Tiny Tina's Wonderlands | |
| 1280x720 Lowest Preset (DX12) | |
| Dell Inspiron 14 7445 2-in-1 | |
| Lenovo ThinkPad X1 Carbon G12 | |
| HP EliteBook Ultra G1q 14 | |
| Average Qualcomm Snapdragon X Adreno X1-85 (3.8 TFLOPS) () | |
| Dell Latitude 9450 2-in-1 | |
| 1920x1080 Low Preset (DX12) | |
| Lenovo ThinkPad X1 Carbon G12 | |
| Dell Inspiron 14 7445 2-in-1 | |
| HP EliteBook Ultra G1q 14 | |
| Average Qualcomm Snapdragon X Adreno X1-85 (3.8 TFLOPS) () | |
| 1920x1080 Medium Preset (DX12) | |
| Lenovo ThinkPad X1 Carbon G12 | |
| Dell Inspiron 14 7445 2-in-1 | |
| HP EliteBook Ultra G1q 14 | |
| Average Qualcomm Snapdragon X Adreno X1-85 (3.8 TFLOPS) () | |
| 1920x1080 High Preset (DX12) | |
| Lenovo ThinkPad X1 Carbon G12 | |
| Dell Inspiron 14 7445 2-in-1 | |
| HP EliteBook Ultra G1q 14 | |
| Average Qualcomm Snapdragon X Adreno X1-85 (3.8 TFLOPS) () | |
| 1920x1080 Badass Preset (DX12) | |
| Lenovo ThinkPad X1 Carbon G12 | |
| Dell Inspiron 14 7445 2-in-1 | |
| HP EliteBook Ultra G1q 14 | |
| Average Qualcomm Snapdragon X Adreno X1-85 (3.8 TFLOPS) () | |
Witcher 3 FPS Chart
| low | med. | high | ultra | |
| The Witcher 3 (2015) | 109.2 | 70.9 | 39.7 | 17.5 |
| Dota 2 Reborn (2015) | 77.9 | 60.9 | 55.9 | 49.3 |
| Final Fantasy XV Benchmark (2018) | 51 | 23 | 14.3 | |
| X-Plane 11.11 (2018) | 36.4 | |||
| Strange Brigade (2018) | 114.3 | 43.6 | 36.7 | 32 |
| Tiny Tina's Wonderlands (2022) | 41.5 | 30.8 | 20.6 | 16.8 |
| F1 22 (2022) | 57.6 | 51 | 36.2 | 27 |
| Baldur's Gate 3 (2023) | 23.1 | 19.6 | 17.1 | 16.6 |
| Cyberpunk 2077 2.1 Phantom Liberty (2023) | 22.1 | 18.3 |
Emisje - ledwo słyszalne
Hałas systemowy
Szum wentylatora jest cichszy niż w większości innych 14-calowych subnotebooków. Wewnętrzny wentylator ma tendencję do stabilizowania się na poziomie zaledwie 25 dB(A) podczas przeglądania stron internetowych lub strumieniowania wideo na cichym tle 23,4 dB(A), aby być zasadniczo niesłyszalnym podczas użytkowania. W najgorszym przypadku system pozostanie nieco poniżej 35 dB(A) podczas grania lub wykonywania bardzo wymagających zadań, co nadal jest zauważalnie cichsze niż większość tradycyjnych alternatyw, takich jak MacBook Pro 14 lub ThinkPad X1 Carbon G12.


Hałas
| luz |
| 23.4 / 23.4 / 24.3 dB |
| obciążenie |
| 25 / 34.8 dB |
 | ||
30 dB cichy 40 dB(A) słyszalny 50 dB(A) irytujący |
||
min: | ||
| HP EliteBook Ultra G1q 14 SD X Adreno X1-85 3.8 TFLOPS GPU, Snapdragon X Elite X1E-78-100, SK hynix PC801 HFS512GEJ9X101N BF | Asus Vivobook S 15 OLED Snapdragon SD X Adreno X1-85 3.8 TFLOPS GPU, Snapdragon X Elite X1E-78-100, Micron 2400 MTFDKBA1T0QFM | HP Dragonfly Pro 2023 Radeon 680M, R7 7736U, PSEIB512GABBMC0 | Dell Latitude 9450 2-in-1 Graphics 4-Core, Ultra 7 165U | Lenovo ThinkPad X1 Carbon G12 Arc 8-Core, Ultra 7 155H, Kioxia XG8 KXG8AZNV1T02 | Apple MacBook Pro 14 2023 M3 Max M3 Max 40-Core GPU, Apple M3 Max 16-Core, Apple SSD AP2048Z | |
|---|---|---|---|---|---|---|
| Noise | -11% | -7% | -18% | -9% | -13% | |
| off / environment * | 23.4 | 24.3 -4% | 23 2% | 23.9 -2% | 23.8 -2% | 24.8 -6% |
| Idle Minimum * | 23.4 | 24.3 -4% | 23 2% | 23.9 -2% | 24 -3% | 24.8 -6% |
| Idle Average * | 23.4 | 24.3 -4% | 23 2% | 23.9 -2% | 24 -3% | 24.8 -6% |
| Idle Maximum * | 24.3 | 26.2 -8% | 23 5% | 23.9 2% | 24 1% | 24.8 -2% |
| Load Average * | 25 | 32.5 -30% | 27.8 -11% | 36.4 -46% | 31.5 -26% | 25.8 -3% |
| Witcher 3 ultra * | 30.6 | 40.6 -33% | 44.7 -46% | 37.8 -24% | 43.4 -42% | |
| Load Maximum * | 34.8 | 39.8 -14% | 40.3 -16% | 44.7 -28% | 37.8 -9% | 43.4 -25% |
| Cyberpunk 2077 ultra * | 35.2 |
* ... im mniej tym lepiej
Temperatura
Lewa połowa systemu jest zawsze cieplejsza niż prawa ze względu na asymetryczne rozwiązanie chłodzenia. Gorący punkt w pobliżu klawiszy WASD może osiągnąć ponad 40 C, gdy jest obciążony, w porównaniu do prawej strony klawiatury, która może być o prawie 10 C chłodniejsza. Różnice temperatur między obiema połówkami obudowy są zauważalne podczas użytkowania, ale nigdy nie są niekomfortowe.
Średnie temperatury powierzchni są dość zbliżone do tego, co zarejestrowaliśmy na Dragonfly Pro, co sugeruje, że EliteBook Ultra G1q nie działa ani chłodniej, ani cieplej, pomimo znacznych różnic między płytami głównymi.


(±) The maximum temperature on the upper side is 40.8 °C / 105 F, compared to the average of 35.9 °C / 97 F, ranging from 21.4 to 59 °C for the class Subnotebook.
(±) The bottom heats up to a maximum of 40.4 °C / 105 F, compared to the average of 39.4 °C / 103 F
(+) In idle usage, the average temperature for the upper side is 27.8 °C / 82 F, compared to the device average of 30.7 °C / 87 F.
(+) The palmrests and touchpad are cooler than skin temperature with a maximum of 28.2 °C / 82.8 F and are therefore cool to the touch.
(±) The average temperature of the palmrest area of similar devices was 28.3 °C / 82.9 F (+0.1 °C / 0.1 F).


| HP EliteBook Ultra G1q 14 Qualcomm Snapdragon X Elite X1E-78-100, Qualcomm Snapdragon X Adreno X1-85 (3.8 TFLOPS) | Asus Vivobook S 15 OLED Snapdragon Qualcomm Snapdragon X Elite X1E-78-100, Qualcomm Snapdragon X Adreno X1-85 (3.8 TFLOPS) | HP Dragonfly Pro 2023 AMD Ryzen 7 7736U, AMD Radeon 680M | Dell Latitude 9450 2-in-1 Intel Core Ultra 7 165U, Intel Graphics 4-Cores iGPU (Arc) | Lenovo ThinkPad X1 Carbon G12 Intel Core Ultra 7 155H, Intel Arc 8-Core iGPU | Apple MacBook Pro 14 2023 M3 Max Apple M3 Max 16-Core, Apple M3 Max 40-Core GPU | |
|---|---|---|---|---|---|---|
| Heat | -2% | 14% | 11% | -0% | 9% | |
| Maximum Upper Side * | 40.8 | 43.6 -7% | 38.6 5% | 35.4 13% | 44.2 -8% | 45.9 -13% |
| Maximum Bottom * | 40.4 | 53.1 -31% | 42.8 -6% | 37.8 6% | 41.2 -2% | 42.1 -4% |
| Idle Upper Side * | 32.2 | 26.7 17% | 22.2 31% | 27.2 16% | 29.4 9% | 23.4 27% |
| Idle Bottom * | 31.2 | 27.2 13% | 23.6 24% | 28.2 10% | 31.2 -0% | 23.8 24% |
* ... im mniej tym lepiej
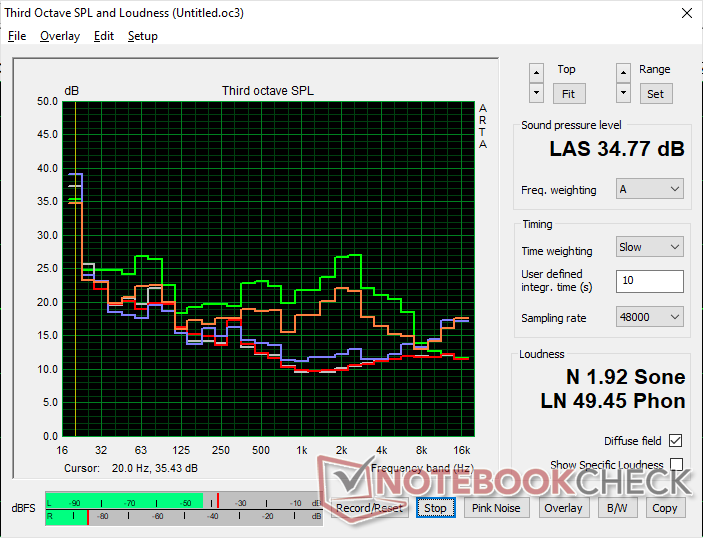
Głośniki


HP EliteBook Ultra G1q 14 audio analysis
(+) | speakers can play relatively loud (91.2 dB)
Bass 100 - 315 Hz
(-) | nearly no bass - on average 21.6% lower than median
(±) | linearity of bass is average (7.1% delta to prev. frequency)
Mids 400 - 2000 Hz
(+) | balanced mids - only 1.4% away from median
(+) | mids are linear (3.6% delta to prev. frequency)
Highs 2 - 16 kHz
(+) | balanced highs - only 4.2% away from median
(+) | highs are linear (4.5% delta to prev. frequency)
Overall 100 - 16.000 Hz
(+) | overall sound is linear (14.4% difference to median)
Compared to same class
» 25% of all tested devices in this class were better, 6% similar, 70% worse
» The best had a delta of 5%, average was 19%, worst was 53%
Compared to all devices tested
» 15% of all tested devices were better, 4% similar, 81% worse
» The best had a delta of 4%, average was 25%, worst was 134%
Apple MacBook Pro 16 2021 M1 Pro audio analysis
(+) | speakers can play relatively loud (84.7 dB)
Bass 100 - 315 Hz
(+) | good bass - only 3.8% away from median
(+) | bass is linear (5.2% delta to prev. frequency)
Mids 400 - 2000 Hz
(+) | balanced mids - only 1.3% away from median
(+) | mids are linear (2.1% delta to prev. frequency)
Highs 2 - 16 kHz
(+) | balanced highs - only 1.9% away from median
(+) | highs are linear (2.7% delta to prev. frequency)
Overall 100 - 16.000 Hz
(+) | overall sound is linear (4.6% difference to median)
Compared to same class
» 0% of all tested devices in this class were better, 0% similar, 100% worse
» The best had a delta of 5%, average was 18%, worst was 45%
Compared to all devices tested
» 0% of all tested devices were better, 0% similar, 100% worse
» The best had a delta of 4%, average was 25%, worst was 134%
Zarządzanie energią
Zużycie energii
Urządzenia ARM są dobrze znane ze swojego energooszczędnego zachowania i EliteBook Ultra G1q 14 nie jest inny. Praca na biegu jałowym na pulpicie wymaga od 3 W do 6 W w zależności od poziomu jasności, co jest wartością niższą niż w przypadku większości innych subnotebooków. Podobnie, uruchamianie bardziej wymagających obciążeń, takich jak gry, pobierałoby tylko około 24 W w porównaniu do 35 W do 55 W na zasilanych przez Core U Latitude 9450 2-w-1. EliteBook Ultra G1q 14 może być ogólnie wolniejszą maszyną, ale przynajmniej jego poziomy zużycia są niższe, aby to zrekompensować.


| wyłączony / stan wstrzymania | |
| luz | |
| obciążenie |
|
| HP EliteBook Ultra G1q 14 Snapdragon X Elite X1E-78-100, SD X Adreno X1-85 3.8 TFLOPS GPU, SK hynix PC801 HFS512GEJ9X101N BF, IPS, 2240x1400, 14.00 | Asus Vivobook S 15 OLED Snapdragon Snapdragon X Elite X1E-78-100, SD X Adreno X1-85 3.8 TFLOPS GPU, Micron 2400 MTFDKBA1T0QFM, OLED, 2880x1620, 15.60 | HP Dragonfly Pro 2023 R7 7736U, Radeon 680M, PSEIB512GABBMC0, IPS, 1920x1200, 14.00 | Dell Latitude 9450 2-in-1 Ultra 7 165U, Graphics 4-Core, , IPS, 2560x1600, 14.00 | Lenovo ThinkPad X1 Carbon G12 Ultra 7 155H, Arc 8-Core, Kioxia XG8 KXG8AZNV1T02, OLED, 2880x1800, 14.00 | Apple MacBook Pro 14 2023 M3 Max Apple M3 Max 16-Core, M3 Max 40-Core GPU, Apple SSD AP2048Z, Mini-LED, 3024x1964, 14.20 | |
|---|---|---|---|---|---|---|
| Power Consumption | -29% | -46% | -52% | -74% | -148% | |
| Idle Minimum * | 2.5 | 4.4 -76% | 3.2 -28% | 3.2 -28% | 3.9 -56% | 2.6 -4% |
| Idle Average * | 5.7 | 6.2 -9% | 5.4 5% | 6.4 -12% | 5.8 -2% | 11.8 -107% |
| Idle Maximum * | 5.8 | 7.5 -29% | 5.6 3% | 10.8 -86% | 16 -176% | 12.2 -110% |
| Load Average * | 24.2 | 33.6 -39% | 42.2 -74% | 54.6 -126% | 46.1 -90% | 99.9 -313% |
| Witcher 3 ultra * | 23.1 | 29.9 -29% | 60 -160% | 35.5 -54% | 50.4 -118% | 92.5 -300% |
| Cyberpunk 2077 ultra * | 33.5 | 39 -16% | ||||
| Load Maximum * | 66.4 | 69.3 -4% | 82 -23% | 70.2 -6% | 67.4 -2% | 101.7 -53% |
* ... im mniej tym lepiej
Power Consumption Witcher 3 / Stresstest
Power Consumption external Monitor
Żywotność baterii

Bateria o pojemności 59 Wh jest podobna do bardziej tradycyjnych laptopów z systemem Windows, takich jak Dell Latitude 9450 2-w-1 lub Lenovo ThinkPad X1 Carbon G12. Żywotność baterii jest doskonała, jak można się spodziewać po maszynie opartej na ARM, ale jest porównywalna tylko z innymi nowoczesnymi alternatywami opartymi na Ryzen-U lub Core-U, takimi jak Dragonfly Pro lub wspomniany Dell. Właściciele mogą oczekiwać około 13 godzin rzeczywistego przeglądania na pełnym naładowaniu.
Ładowanie od zera zajmuje nieco ponad dwie godziny przy użyciu dołączonego zasilacza sieciowego, co jest przeciętnym wynikiem dla subnotebooka.
| HP EliteBook Ultra G1q 14 Snapdragon X Elite X1E-78-100, SD X Adreno X1-85 3.8 TFLOPS GPU, 59 Wh | Asus Vivobook S 15 OLED Snapdragon Snapdragon X Elite X1E-78-100, SD X Adreno X1-85 3.8 TFLOPS GPU, 70 Wh | HP Dragonfly Pro 2023 R7 7736U, Radeon 680M, 65 Wh | Dell Latitude 9450 2-in-1 Ultra 7 165U, Graphics 4-Core, 60 Wh | Lenovo ThinkPad X1 Carbon G12 Ultra 7 155H, Arc 8-Core, 57 Wh | Apple MacBook Pro 14 2023 M3 Max Apple M3 Max 16-Core, M3 Max 40-Core GPU, 72.6 Wh | |
|---|---|---|---|---|---|---|
| Czasy pracy | -12% | 13% | 8% | -33% | -13% | |
| Reader / Idle | 1222 | 1393 14% | 1300 6% | 1069 -13% | ||
| WiFi v1.3 | 792 | 783 -1% | 777 -2% | 815 3% | 466 -41% | 911 15% |
| Load | 124 | 97 -22% | 158 27% | 143 15% | 70 -44% | 73 -41% |
| H.264 | 885 | 1077 |
Za
Przeciw
Werdykt - Dobry początek, ale niewystarczający

Jeśli chcą Państwo przekonać laika do wyboru systemu Windows na ARM zamiast tradycyjnych alternatyw z Apple lub innych, będzie on musiał wyróżniać się w kilku kategoriach, w tym w wydajności, cenie, czasie pracy na baterii i obudowie. Przyjrzyjmy się każdej z nich:
Wydajność. Wydajność jest porównywalna do Core Ultra 7 155U/165U w najlepszym przypadku, a w najgorszym jest tak wolna jak starszy Core i7-1165G7, szczególnie jeśli chodzi o operacje jednordzeniowe. Wydajność graficzna jest również rozczarowująca w porównaniu do najnowszych zintegrowanych rozwiązań Arc i Radeon, odpowiednio od Intela i AMD.
Cena. Za 1700 USD, HP EliteBook Ultra G1q 14 kosztuje mniej więcej tyle samo, co inne biznesowe subnotebooki Core Ultra 7, takie jak Dell Latitude 7350 lub Lenovo ThinkPad X1 Carbon.
Żywotność baterii. Czasy pracy są doskonałe i dłuższe niż w przypadku większości subnotebooków Intela lub AMD ze względu na wysoką wydajność w przeliczeniu na wat. Niemniej jednak dostępne są alternatywy Intel i AMD o porównywalnych wynikach, w tym 2023 Dragonfly Pro lub Dell Latitude 9450 2-w-1.
Format. Niewielki rozmiar, przenośna waga i cichy wentylator to najważniejsze cechy urządzenia HP Qualcomm. Jednak modele takie jak LG Gram 14, Samsung Galaxy Book4 Prolub ThinkPad X1 Carbon G12 mogą być mniejsze lub nawet lżejsze.
Wyzwanie związane z EliteBook Ultra G1q 14 nie polega na tym, że jest to zła maszyna, ale na tym, że obecna konkurencja maszyn Intel / AMD jest niezwykle trudna. Nabywcy mają już do wyboru kilka doskonałych subnotebooków (w tym z własnego portfolio HP), które mogą dorównać lub przewyższyć funkcje i możliwości EliteBook Ultra G1q 14, zwłaszcza jeśli chodzi o kompatybilność. W związku z tym trudniej jest polecić EliteBook Ultra G1q 14 w porównaniu z wieloma wyżej wymienionymi alternatywami dla zdecydowanej większości użytkowników.
EliteBook Ultra G1q 14 to dobry początek dla Qualcomm, ale będzie musiał zrobić znacznie więcej, ponieważ najnowsze układy Intela i AMD są o krok do przodu w tej samej cenie.
Wiele niedociągnięć EliteBook Ultra G1q 14 można by wybaczyć, gdyby został wprowadzony na rynek w znacznie niższej cenie początkowej niż konkurencja. Niestety, kosztuje on mniej więcej tyle samo, nie oferując przy tym żadnych większych korzyści, jeśli chodzi o wydajność lub funkcje. To świetny początek, ale Qualcomm i producenci komputerów mają przed sobą długą drogę, zanim Windows na ARM przekona użytkowników do wykonania skoku.
Cena i dostępność
HP wysyła teraz EliteBook Ultra G1q 14 za 1699 dolarów.
HP EliteBook Ultra G1q 14
-
02/07/2024 v8 (new)
Allen Ngo
 Total Sustainability Score:
 Transparency
The present review sample was made available to the author as a loan by the manufacturer or a shop for the purposes of review. The lender had no influence on this review, nor did the manufacturer receive a copy of this review before publication. There was no obligation to publish this review.
Price comparison

