Notebookcheck Logo

Recenzja laptopa SCHENKER XMG Core 15 (M24): Wysokiej klasy maszyna do gier w metalowej obudowie z Niemiec

Bardziej przystępny cenowo Fusion 15. Nowy XMG Core 15 jest umieszczony w tej samej, wysokiej jakości i stylowej metalowej obudowie, co XMG Focus 15. To sprawia, że jest potencjalnie interesujący dla twórców, a jednocześnie kosztuje nieco mniej niż Fusion. Sprawdzamy, gdzie Schenker obniżył koszty i czy nowy Core 15 jest dobrą wskazówką dla twórców i graczy zwracających uwagę na cenę.
AMD Business Gaming Geforce Laptop / Notebook Nvidia Ryzen (Zen)

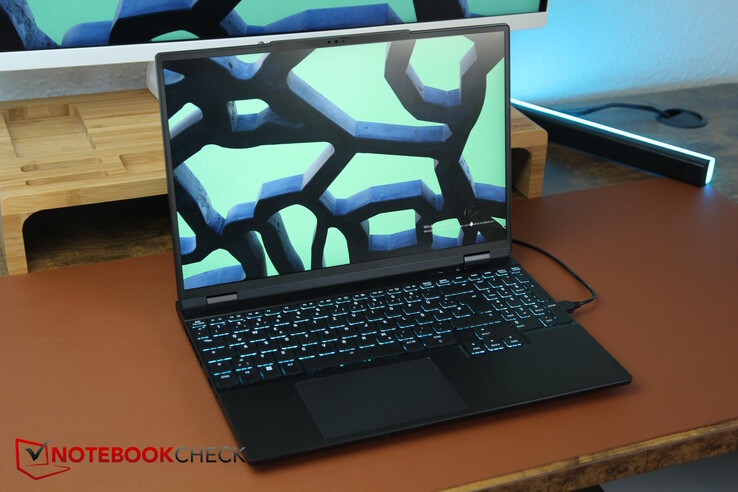
Według Schenkera, obecny Core 15 jest nieco okrojoną wersją Fusion 15. Zaletą jest znacznie niższa cena, jednak pomimo tego Core 15 zachowuje elegancką metalową obudowę, która nadaje mu dobry wygląd i styl. Producent nazywa go "Undercover Gaming", ponieważ aluminiowa obudowa powinna spodobać się również twórcom, niekoniecznie krzycząc laptopem do gier.

Niemniej jednak, Core 15 jest nie tylko okrojony, ale także zmienia kilka rzeczy. Na przykład procesor laptopa to AMD Ryzen obecnej generacji zamiast procesora Intel Gen14 HX, co nieco obniża cenę, ale w żadnym wypadku nie jest gorsze.

Ponieważ nie ma już praktycznie żadnych 15-calowych laptopów wyposażonych w aktualny procesor, porównujemy 15,3-calowy Core 15 z 16-calowymi laptopami do gier i multimediów, które są wyposażone w RTX 4060 takimi jak Dell G16, Lenovo Lenovo Legion 5i 16 G9jak również HP Victus 16. Ponadto, oczywiście, dokonaliśmy porównań z Fusion 15, a także przyjrzeliśmy się temu, co zmieniło się od zeszłego roku Schenker XMG Pro 15 E23.

Proszę uważać: Nasz nowy system oceniania to V8, co oznacza, że wyniki są teraz niższe. W starym systemie oceny V7, Core 15 uzyskał między 88 a 89 procent. Mogą Państwo dowiedzieć się, co nowego tutaj.

SCHENKER XMG Core 15 (M24)
Procesor
AMD Ryzen 7 8845HS 8 x 3.8 - 5.1 GHz, 90 W PL2 / Short Burst, 80 W PL1 / Sustained, Hawk Point-HS (Zen 4)
Karta grafiki
NVIDIA GeForce RTX 4060 Laptop GPU, 140 W TDP ( including 25 W Dynamic Boost), Geforce 555.85, Optimus + MUX
Pamięć
32 MB 
, 2x 16 GB Kingston DDR5-5600
Matryca
15.30 cali 16:10, 2560 x 1600 pikseli 197 PPI, BOE NJ NE153QDM-NZ1 (BOE0C8E), IPS, sRGB, refleksująca: nie, 240 Hz, Adaptive Sync
Chipset
AMD Promontory/Bixby FCH
Dysk twardy
Samsung 990 Pro 1 TB, 1024 GB 
, PCIe 4, M.2 2280, 894 GB wolne miejsce
Karta dźwiękowa
Conexant SN6140
Złącza
4 USB 3.0, 1 USB 3.1 Gen2, USB-C Power Delivery (PD), 1 HDMI, 2 DisplayPort, 1 blokada Kensingtona, gniazda audio: 3.5 mm headset, czytnik kart: Full SD, SDXC, SDHC
Łączność
Realtek Semiconductor RTL8168/8111 PCI-E Gigabit Ethernet NIC (10/100/1000MBit/s), Intel Wi-Fi 6E AX210 (a/b/g/h/n = Wi-Fi 4/ac = Wi-Fi 5/ax = Wi-Fi 6/), Bluetooth Bluetooth 5.2
Gabaryty
wysokość x szerokość x głębokość (mm): 21.9 x 342.5 x 245
Akumulator
99.8 Wh litowo-polimerowy
System operacyjny
Microsoft Windows 11 Pro
Camera
kamerka: Full HD Webcam
Primary Camera: 2.1 MPix
Inne
głośniki: Stereo, klawiatura: Chiclet, podświetlanie klawiatury: tak, USB Driver Stick, Mousepad, 24 miesiące(y) gwarancji, Pickup & Return
Waga
2.052 kg, zasilacz: 617 g
Cena
1650 Euro
Note: The manufacturer may use components from different suppliers including display panels, drives or memory sticks with similar specifications.


Potencjalni konkurenci w porównaniu

Rating
Date
Model
Weight
Height
Size
Resolution
Best Price
83.4 %
06/2024
SCHENKER XMG Core 15 (M24)
R7 8845HS, NVIDIA GeForce RTX 4060 Laptop GPU
2.1 kg21.9 mm15.30"2560x1600
89.1 %
02/2024
Lenovo Legion 5 16IRX G9
i7-14650HX, NVIDIA GeForce RTX 4060 Laptop GPU
2.4 kg25.2 mm16.00"2560x1600
84.3 %
05/2024
HP Victus 16 (2024)
i7-14700HX, NVIDIA GeForce RTX 4060 Laptop GPU
2.4 kg23.9 mm16.10"1920x1080
85.5 %
02/2024
Dell G16, i7-13650HX, RTX 4060
i7-13650HX, NVIDIA GeForce RTX 4060 Laptop GPU
2.8 kg25.65 mm16.00"2560x1600
88.9 %
05/2024
SCHENKER XMG Fusion 15 (Early 24)
i9-14900HX, NVIDIA GeForce RTX 4070 Laptop GPU
2.1 kg21.9 mm15.30"2560x1600
86.2 %
07/2023
SCHENKER XMG Pro 15 (E23)
i9-13900HX, NVIDIA GeForce RTX 4060 Laptop GPU
2.4 kg24.9 mm15.60"2560x1440

Obudowa i funkcje: Stylowa aluminiowa obudowa

Ponieważ dokładnie przetestowaliśmy już funkcje wizualne, odsyłamy Państwa do naszej recenzji Recenzja XMG Fusion 15 aby uzyskać więcej informacji na temat obudowy, konserwacji, portów i urządzeń wejściowych. Tutaj wymienimy tylko zmiany w tych aspektach.

Porównanie rozmiarów

W chwili obecnej 15-calowe maszyny do gier z aktualnym procesorem wydają się niemal wymarłe, a jedną z unikalnych cech Core 15 jest jego nietypowy format 15,3 cala. Producent argumentuje, że obecne 16-calowe laptopy są niewiele większe, co oznacza, że można teraz uzyskać większy wyświetlacz w prawie tej samej obudowie.

W przypadku Core 15 można jednak zauważyć, że niektórzy z 16-calowych konkurentów są zauważalnie więksi. Co więcej, są one również grubsze i cięższe. To ostatnie ma miejsce pomimo tego, że konkurencja wykorzystuje znacznie więcej plastiku. Jest to obszar, w którym Core 15 zdobywa punkt dodatni za mobilność.

Porównanie rozmiarów

369 mm 259.4 mm 23.9 mm 2.4 kg359.7 mm 262.3 mm 25.2 mm 2.4 kg357 mm 289 mm 25.65 mm 2.8 kg350 mm 240 mm 24.9 mm 2.4 kg342.5 mm 245 mm 21.9 mm 2.1 kg342.5 mm 245 mm 21.9 mm 2.1 kg297 mm 210 mm 1 mm 5.7 g

Porty

W przeciwieństwie do Fusion wyposażonego w procesor Intela, AMD Core nie ma Thunderbolt 4 i USB 4. Zamiast tego otrzymują Państwo tylko USB-C 3.2 Gen 2, chociaż oferuje on Power Delivery o mocy do 100 W (20 V, 5 A).

Jest jedna dodatkowa przewaga nad Fusion: Wraz z Core otrzymują Państwo dedykowany mini DisplayPort, którego nie ma w Fusion.

Jedna interesująca uwaga: na początku 2023 roku nasz niedawno recenzowany Core 15 był nadal wyposażony w złącze wodne do zewnętrznego chłodzenia, które nosiło nazwę XMG Oasis. Porty te są teraz nieobecne w nowszym i smuklejszym Core 15 i wygląda na to, że XMG zrezygnowało z eksperymentowania z tą serią produkcyjną.

Po lewej: Kensington, USB-A (5 Gb/s), USB-C (5 Gb/s bez dodatkowych funkcji), gniazdo słuchawkowe 3,5 mm
Po prawej stronie: Czytnik SD, 2x USB-A (5 Gb/s)
Tył: MiniDP 1.4 (kompatybilny z G-Sync), USB-C 3.2 Gen2 (10 Gb/s, DP 1.4a, Power Delivery), HDMI 2.1 (kompatybilny z G-Sync), LAN, zasilanie
Przód: brak portów
Przód: brak portów

Czytnik kart SD

AS SSD
AS SSD

Czytnik SD obsługuje pełnowymiarowe karty, jednak nie ma mechanizmu blokującego, co oznacza, że karty wystają.

Niestety, wydajność i tak już przeciętnego czytnika kart znajdującego się w Fusion 15 ponownie spadła o połowę, co oznacza, że Core 15 należy do jednych z najwolniejszych w tej kategorii.

SD Card Reader
average JPG Copy Test (av. of 3 runs)
Average of class Gaming
  (19 - 202, n=98, last 2 years)
96.9 MB/s +153%
SCHENKER XMG Pro 15 (E23)
Intel Core i9-13900HX
82.4 (81.16min - 84.2max) MB/s +115%
SCHENKER XMG Fusion 15 (Early 24)
Intel Core i9-14900HX (AV PRO microSD 128 GB V60)
81 MB/s +111%
SCHENKER XMG Core 15 (M24)
AMD Ryzen 7 8845HS
38.3 (33.53min - 39.96max) MB/s
Lenovo Legion 5 16IRX G9
Intel Core i7-14650HX
27.1 MB/s -29%
maximum AS SSD Seq Read Test (1GB)
Average of class Gaming
  (25.8 - 269, n=95, last 2 years)
120.8 MB/s +189%
SCHENKER XMG Pro 15 (E23)
Intel Core i9-13900HX
90.9 MB/s +117%
SCHENKER XMG Fusion 15 (Early 24)
Intel Core i9-14900HX (AV PRO microSD 128 GB V60)
82 MB/s +96%
SCHENKER XMG Core 15 (M24)
AMD Ryzen 7 8845HS
41.86 MB/s
Lenovo Legion 5 16IRX G9
Intel Core i7-14650HX
28.8 MB/s -31%

Komunikacja

Producent poinformował nas po otrzymaniu laptopa, że nasz model recenzencki został przypadkowo wyposażony w procesor Intel AX211 WiF, podobnie jak Fusion 15. W rzeczywistości tak nie jest w przypadku Core 15.

Zwykle Intel AX200 jest standardem w Core 15, a za jedyne dodatkowe 15 dolarów otrzymują Państwo AMD Wi-Fi 6E RZ616 z Wi-Fi 6E. Jednak obecnie nie jesteśmy w stanie przetestować jego prędkości.

Networking
iperf3 transmit AXE11000
Dell G16, i7-13650HX, RTX 4060
Intel Wi-Fi 6 AX201
1570 (808min - 1639max) MBit/s +30%
Lenovo Legion 5 16IRX G9
Intel Wi-Fi 6E AX211
1489 (1329min, 1338.28P1 - 1686max) MBit/s +23%
SCHENKER XMG Fusion 15 (Early 24)
Intel Wi-Fi 6E AX211
1444 (1378min - 1489max) MBit/s +20%
Average of class Gaming
  (469 - 1793, n=154, last 2 years)
1258 MBit/s +4%
SCHENKER XMG Core 15 (M24)
Intel Wi-Fi 6E AX210
1208 (557min - 1301max) MBit/s
Average Intel Wi-Fi 6E AX210
  (565 - 1584, n=19)
1122 MBit/s -7%
SCHENKER XMG Pro 15 (E23)
Intel Wi-Fi 6E AX211
939 (475min - 965max) MBit/s -22%
HP Victus 16 (2024)
Realtek RTL8852BE
776 (487min - 929max) MBit/s -36%
iperf3 receive AXE11000
SCHENKER XMG Fusion 15 (Early 24)
Intel Wi-Fi 6E AX211
1632 (1454min - 1700max) MBit/s +14%
Dell G16, i7-13650HX, RTX 4060
Intel Wi-Fi 6 AX201
1585 (1273min - 1662max) MBit/s +11%
SCHENKER XMG Core 15 (M24)
Intel Wi-Fi 6E AX210
1433 (616min - 1532max) MBit/s
Lenovo Legion 5 16IRX G9
Intel Wi-Fi 6E AX211
1398 (1327min, 1333.09P1 - 1464max) MBit/s -2%
Average of class Gaming
  (685 - 1890, n=158, last 2 years)
1391 MBit/s -3%
Average Intel Wi-Fi 6E AX210
  (715 - 1711, n=19)
1222 MBit/s -15%
HP Victus 16 (2024)
Realtek RTL8852BE
978 (960min - 990max) MBit/s -32%
SCHENKER XMG Pro 15 (E23)
Intel Wi-Fi 6E AX211
941 (471min - 948max) MBit/s -34%
05010015020025030035040045050055060065070075080085090095010001050110011501200125013001350140014501500155016001650Tooltip
SCHENKER XMG Core 15 (M24) Intel Wi-Fi 6E AX210; iperf3 transmit AXE11000; iperf 3.1.3: Ø1189 (557-1301)
Lenovo Legion 5 16IRX G9 Intel Wi-Fi 6E AX211; iperf3 transmit AXE11000: Ø1489 (1329-1686)
HP Victus 16 (2024) Realtek RTL8852BE; iperf3 transmit AXE11000; iperf 3.1.3: Ø776 (487-929)
Dell G16, i7-13650HX, RTX 4060 Intel Wi-Fi 6 AX201; iperf3 transmit AXE11000; iperf 3.1.3: Ø1543 (808-1639)
SCHENKER XMG Core 15 (M24) Intel Wi-Fi 6E AX210; iperf3 receive AXE11000; iperf 3.1.3: Ø1411 (616-1532)
Lenovo Legion 5 16IRX G9 Intel Wi-Fi 6E AX211; iperf3 receive AXE11000: Ø1398 (1327-1464)
HP Victus 16 (2024) Realtek RTL8852BE; iperf3 receive AXE11000; iperf 3.1.3: Ø978 (960-990)
Dell G16, i7-13650HX, RTX 4060 Intel Wi-Fi 6 AX201; iperf3 receive AXE11000; iperf 3.1.3: Ø1585 (1273-1662)
ColorChecker
15 ∆E
13.8 ∆E
12 ∆E
12.5 ∆E
10.3 ∆E
7.2 ∆E
17.1 ∆E
9.6 ∆E
13 ∆E
12.2 ∆E
9.1 ∆E
14.9 ∆E
8.8 ∆E
9.2 ∆E
6.6 ∆E
10.8 ∆E
10.6 ∆E
4.4 ∆E
9.1 ∆E
8.9 ∆E
9.7 ∆E
12.7 ∆E
13.5 ∆E
11.8 ∆E
ColorChecker SCHENKER XMG Core 15 (M24): 10.95 ∆E min: 4.41 - max: 17.12 ∆E

Urządzenia wejściowe - maksymalnie wykorzystane miejsce

W przeciwieństwie do Fusion 15, Core 15 nie posiada indywidualnego podświetlenia klawiszy RGB. Zamiast tego ma tylko jedną strefę podświetlenia. Chociaż nie pozwala to na tak wiele opcjonalnych ustawień LED, wszystko jest nadal widoczne.

Klawiatura nie posiada również funkcji N key rollover, a także anti-ghostingu, przynajmniej według arkusza danych. Niemniej jednak klawisz, za pomocą którego można przełączać profile wydajności, znajduje się na pokładzie.

Klawiatura
Klawiatura
Panel dotykowy
Panel dotykowy
oświetlenie 1-strefowe
Krótkie i średnie podróże z dobrym sprzężeniem zwrotnym

Wyświetlacz - 500 nitów, sRGB, 1600p

Brak zauważalnego krwawienia podświetlenia
Matowe subpiksele
Matowe subpiksele

Core wykorzystuje ten sam panel co Fusion. Chociaż zmierzyliśmy znacznie wyższą jasność (600 w porównaniu do 460 nitów), odbywa się to kosztem poziomu czerni, w wyniku czego cierpi kontrast.

Przy minimalnej jasności podświetlenie wyświetlacza jest również zbyt jasne, ale nadal jest oświetlone dość równomiernie.

Przy około 45 procentach jasności (150 nitów) zmierzyliśmy 150 nitów. Przy ciemniejszym wyświetlaczu, dokładność kolorów i, co jest oczywiste, poziom czerni są nieco lepsze

Niestety, nie ma alternatywnych opcji wyświetlania, ale wyświetlacz jest jasny, ma wystarczająco szybki czas reakcji, brak PWM i, podobnie, krwawienie podświetlenia również nie jest zauważalne.

575
cd/m²
580
cd/m²
599
cd/m²
596
cd/m²
635
cd/m²
610
cd/m²
595
cd/m²
630
cd/m²
615
cd/m²
podświetlenie ekranu
BOE NJ NE153QDM-NZ1 (BOE0C8E) tested with X-Rite i1Pro 3
maksimum: 635 cd/m² (Nits) średnia: 603.9 cd/m² Minimum: 30.2 cd/m²
rozświetlenie: 91 %
na akumulatorze: 635 cd/m²
kontrast: 992:1 (czerń: 0.64 cd/m²)
ΔE Color 1.89 | 0.5-29.43 Ø4.99, calibrated: 1.14
ΔE Greyscale 2.53 | 0.57-98 Ø5.2
74.6% AdobeRGB 1998 (Argyll 2.2.0 3D)
100% sRGB (Argyll 2.2.0 3D)
73.2% Display P3 (Argyll 2.2.0 3D)
Gamma: 2.36
SCHENKER XMG Core 15 (M24)
BOE NJ NE153QDM-NZ1 (BOE0C8E), IPS, 2560x1600, 15.30
Lenovo Legion 5 16IRX G9
NE160QDM-NZ3, IPS, 2560x1600, 16.00
HP Victus 16 (2024)
Chi Mei CMN163E, IPS, 1920x1080, 16.10
Dell G16, i7-13650HX, RTX 4060
Chi Mei CMN161D (160GME), IPS, 2560x1600, 16.00
SCHENKER XMG Fusion 15 (Early 24)
BOE NJ NE153QDM-NZ1, IPS, 2560x1600, 15.30
SCHENKER XMG Pro 15 (E23)
BOE0AD1, IPS, 2560x1440, 15.60
Display
-1%
-42%
-5%
0%
16%
Display P3 Coverage
73.2
72.4
-1%
41.3
-44%
67.5
-8%
73.5
0%
97.8
34%
sRGB Coverage
100
100
0%
61.7
-38%
98.5
-1%
100
0%
99.9
0%
AdobeRGB 1998 Coverage
74.6
74.1
-1%
42.7
-43%
69.3
-7%
75
1%
85.4
14%
Response Times
-13%
-151%
4%
46%
-25%
Response Time Grey 50% / Grey 80% *
9.6 ?(4.6, 5)
12.5 ?(6.1, 6.4)
-30%
28.6 ?(13.3, 15.3)
-198%
7.6 ?(3.8, 3.8)
21%
5 ?(2.3, 2.7)
48%
14 ?(6.6, 7.4)
-46%
Response Time Black / White *
9.2 ?(4.6, 4.6)
8.7 ?(4.6, 4.1)
5%
18.7 ?(9.6, 9.1)
-103%
10.4 ?(5.8, 4.6)
-13%
5.2 ?(1.5, 3.7)
43%
9.6 ?(4.2, 5.4)
-4%
PWM Frequency
Screen
22%
-114%
-29%
-11%
-24%
Brightness middle
635
526
-17%
287
-55%
369
-42%
491
-23%
322
-49%
Brightness
604
500
-17%
288
-52%
344
-43%
460
-24%
301
-50%
Brightness Distribution
91
87
-4%
86
-5%
89
-2%
89
-2%
85
-7%
Black Level *
0.64
0.33
48%
0.19
70%
0.26
59%
0.47
27%
0.36
44%
Contrast
992
1594
61%
1511
52%
1419
43%
1045
5%
894
-10%
Colorchecker dE 2000 *
1.89
1.2
37%
5.46
-189%
3.04
-61%
2.16
-14%
1.98
-5%
Colorchecker dE 2000 max. *
3.14
2.1
33%
20.36
-548%
5.56
-77%
4.44
-41%
5.24
-67%
Colorchecker dE 2000 calibrated *
1.14
1
12%
3.52
-209%
2.35
-106%
1.14
-0%
1.98
-74%
Greyscale dE 2000 *
2.53
1.3
49%
4.8
-90%
3.38
-34%
3.3
-30%
2.44
4%
Gamma
2.36 93%
2.23 99%
2.108 104%
2.47 89%
2.204 100%
2.42 91%
CCT
6434 101%
6391 102%
6442 101%
6040 108%
6286 103%
6984 93%
Total Average (Program / Settings)
3% / 13%
-102% / -104%
-10% / -19%
12% / -1%
-11% / -15%

* ... im mniej tym lepiej

Pokrycie przestrzeni kolorów

Podobnie jak w przypadku Fusion 15, sRGB jest w pełni pokryty, a P3 i AdobeRGB wynoszą około 73 do 75 procent.
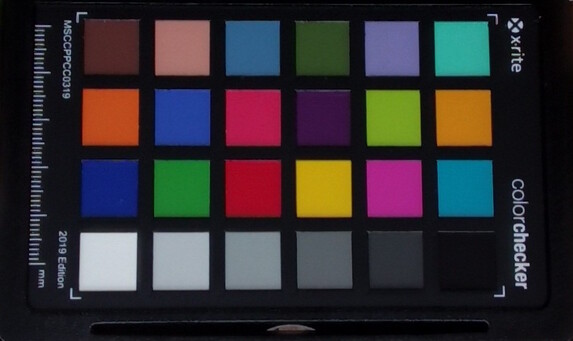
sRGB
sRGB
DisplayP3
DisplayP3
AdobeRGB
AdobeRGB

Dokładność kolorów

Po wyjęciu z pudełka panel jest przyzwoicie skalibrowany, z wartościami DeltaE poniżej 3. Niemniej jednak, wartość czerni jest znacznie za wysoka. Zmniejszenie jasności do 150 nitów nie tylko poprawia sytuację, ale także nieznacznie obniża wartości DeltaE.

Ręczna kalibracja przy natywnej, maksymalnej jasności działa cuda pomimo już przyzwoitych wartości i zauważalnie udaje się zminimalizować odchylenia. Dlatego też panel można bardzo dobrze skalibrować, co prowadzi do bardzo dobrej dokładności kolorów, przynajmniej w sRGB. Przy maksymalnej jasności wartość czerni nadal jest zbyt wysoka, co powoduje pogorszenie kontrastu.

Skale szarości
Skale szarości
Nasycenie
Nasycenie
ColorChecker
ColorChecker
Skala szarości przy 150 nitach
Nasycenie przy 150 nitach
ColorChecker przy 150 nitach
Skale szarości po kalibracji
Nasycenie po kalibracji
ColorChecker po kalibracji

Display Response Times

Display response times show how fast the screen is able to change from one color to the next. Slow response times can lead to afterimages and can cause moving objects to appear blurry (ghosting). Gamers of fast-paced 3D titles should pay special attention to fast response times.
       Response Time Black to White
9.2 ms ... rise ↗ and fall ↘ combined↗ 4.6 ms rise
↘ 4.6 ms fall
The screen shows fast response rates in our tests and should be suited for gaming.
In comparison, all tested devices range from 0.1 (minimum) to 240 (maximum) ms. » 20 % of all devices are better.
This means that the measured response time is better than the average of all tested devices (21.4 ms).
       Response Time 50% Grey to 80% Grey
9.6 ms ... rise ↗ and fall ↘ combined↗ 4.6 ms rise
↘ 5 ms fall
The screen shows fast response rates in our tests and should be suited for gaming.
In comparison, all tested devices range from 0.2 (minimum) to 636 (maximum) ms. » 18 % of all devices are better.
This means that the measured response time is better than the average of all tested devices (33.5 ms).

Screen Flickering / PWM (Pulse-Width Modulation)

To dim the screen, some notebooks will simply cycle the backlight on and off in rapid succession - a method called Pulse Width Modulation (PWM) . This cycling frequency should ideally be undetectable to the human eye. If said frequency is too low, users with sensitive eyes may experience strain or headaches or even notice the flickering altogether.
Screen flickering / PWM not detected

In comparison: 53 % of all tested devices do not use PWM to dim the display. If PWM was detected, an average of 17664 (minimum: 5 - maximum: 3846000) Hz was measured.

0 procent jasności
0 procent jasności
25 procent jasności
25 procent jasności
50 procent jasności
50 procent jasności
75 procent jasności
75 procent jasności
100 procent jasności

Wysoka jasność i matowy wyświetlacz sprawiają, że nie będą mieli Państwo problemów z korzystaniem z urządzenia w cieniu, a wyświetlane treści pozostaną bardzo czytelne. Kontrast mógłby być jednak nieco wyższy i należy unikać bezpośredniego światła słonecznego.

W cieniu, patrząc bezpośrednio z przodu
Szeroki kąt widzenia w cieniu
Dobra stabilność kąta widzenia

Wydajność - 20% wolniej niż Fusion z HX i RTX 4070

Z Ryzen 7 8845HS, RTX 4060 i 32 GB pamięci RAM, XMG Core 15 pozycjonuje się jako laptop do gier średniej klasy i jest również sprzedawany jako taki. Jego czarna, stosunkowo smukła, stylowa i w pełni aluminiowa obudowa nadaje laptopowi dyskretny wygląd, który może również uczynić go interesującym dla twórców treści. Tym bardziej szkoda, że Schenker nie oferuje żadnych dodatkowych opcji wyświetlania, ponieważ dobrze skalibrowany ekran może "tylko" wyświetlać sRGB. Może to być niepotrzebne kryterium dla edytorów zdjęć, a zwłaszcza wideo. Dlatego też chcielibyśmy zobaczyć w przyszłości opcje DisplayP3.

Warunki testu

W ogólnym Centrum Kontroli (Tulpar używa na przykład tego samego CC) oferowane są 3 wstępnie ustawione profile wydajności (Balanced, Enthusiast, Overboost) oraz profil ręczny. W tym ostatnim można aktywować podkręcenie wentylatora i zdefiniować docelową temperaturę procesora, krzywe wentylatora (i nie tylko). W ustawieniach ogólnych za pośrednictwem MUX, GPU można przełączyć z trybu hybrydowego na dGPU, co następnie wymaga ponownego uruchomienia komputera.

W naszych testach wydajności wybraliśmy tryb Overboost, a w teście baterii użyliśmy trybu Balanced. Przedstawiamy również wartości wydajności dla pozostałych trybów.

Menu główne Control Center
Profile wydajności
Profile wydajności
Profil ręczny
Profil ręczny
Ręczny profil wentylatora

Procesor

Cinebench R15: Overboost
Cinebench R15: Entuzjasta
Cinebench R15: Zrównoważony
Cinebench R15: Bateria

Wszystkie jednostki SKU Core 15 są wyposażone w ten sam procesor. Procesor AMD Ryzen 7 8845HS to drugi najszybszy procesor z serii Hawk Point z architekturą Zen 4. Posiada on 8 rdzeni i hiperwątkowość, co oznacza, że może przetwarzać 16 wątków jednocześnie. Bazowe taktowanie rdzeni wynosi 3,8 GHz i można je indywidualnie podkręcać do 5,1 GHz.

W teście ciągłym Cinebench R15 nasz AMD Core 15 wypadł bardzo konsekwentnie, ale głównie na poziomie nieco niższym niż laptopy wyposażone w procesor Intel Gen14 HX. Nie jest to zaskakujące, ponieważ procesor AMD tylko przez krótki czas pobiera maksymalnie 90 W i 80 W przez dłuższy czas. W przypadku procesora Intela w Fusion 15 wartości te wynoszą 140 W i 105 W. Jedynie Dell G16 spada poniżej stałego poziomu wydajności Ryzena 7 obserwowanego w Core po lepszej wydajności początkowej.

We wszystkich testach procesorów, nasz Ryzen 7 jest całkowicie na celowniku. Niestety jednak, nasz Core ponownie zajmuje ostatnie miejsce, ponieważ jego konkurenci Intel HX są po prostu nieco mocniejsi. Niemniej jednak przepaść za Dell G16 lub HP Victus 16 jest naprawdę minimalna. Legion 5i lub Fusion 15 z procesorem Intela cieszą się znaczną przewagą.

Z dala od ściany, w teście wielordzeniowym Cinebench R15 odnotowano spadek wydajności o około 35 procent.

Profil wydajności/wartość zmierzona Wynik Cinebench R15 w pierwszym uruchomieniu Pobór mocy procesora w W
Overboost 2,908 stale 80 - 94
Entuzjasta 2,749 krótko 90, potem 65
Balanced 2,277 krótko 59, potem 35
Bateria 1,909 krótko 30, potem 25

Cinebench R15 Multi Continuous Test

019539058578097511701365156017551950214523402535273029253120331535103705Tooltip
SCHENKER XMG Core 15 (M24) AMD Ryzen 7 8845HS: Ø2849 (2832.66-2908.03)
Lenovo Legion 5 16IRX G9 Intel Core i7-14650HX: Ø3471 (3409.19-3799.39)
HP Victus 16 (2024) Intel Core i7-14700HX: Ø2658 (2509.88-3812.18)
SCHENKER XMG Fusion 15 (Early 24) Intel Core i9-14900HX: Ø3246 (3155.57-3458.12)
CPU Performance Rating: Percent
Cinebench R23: Multi Core | Single Core
Cinebench R20: CPU (Multi Core) | CPU (Single Core)
Cinebench R15: CPU Multi 64Bit | CPU Single 64Bit
Blender: v2.79 BMW27 CPU
7-Zip 18.03: 7z b 4 | 7z b 4 -mmt1
Geekbench 6.2: Multi-Core | Single-Core
Geekbench 5.5: Multi-Core | Single-Core
HWBOT x265 Benchmark v2.2: 4k Preset
LibreOffice : 20 Documents To PDF
R Benchmark 2.5: Overall mean
CPU Performance Rating
SCHENKER XMG Fusion 15 (Early 24)
Intel Core i9-14900HX
84.4 pt
Lenovo Legion 5 16IRX G9
Intel Core i7-14650HX
82.1 pt
SCHENKER XMG Pro 15 (E23) -2!
Intel Core i9-13900HX
76 pt
Average of class Gaming
 
72 pt
HP Victus 16 (2024)
Intel Core i7-14700HX
71.7 pt
Dell G16, i7-13650HX, RTX 4060
Intel Core i7-13650HX
70 pt
SCHENKER XMG Core 15 (M24)
AMD Ryzen 7 8845HS
69.9 pt
Average AMD Ryzen 7 8845HS
 
66.5 pt
Cinebench R23 / Multi Core
SCHENKER XMG Pro 15 (E23)
Intel Core i9-13900HX
24574 Points +36%
Lenovo Legion 5 16IRX G9
Intel Core i7-14650HX
24455 Points +36%
HP Victus 16 (2024)
Intel Core i7-14700HX
23887 Points +32%
SCHENKER XMG Fusion 15 (Early 24)
Intel Core i9-14900HX
23124 Points +28%
Average of class Gaming
  (5668 - 36249, n=213, last 2 years)
20652 Points +14%
Dell G16, i7-13650HX, RTX 4060
Intel Core i7-13650HX
20557 Points +14%
SCHENKER XMG Core 15 (M24)
AMD Ryzen 7 8845HS
18037 Points
Average AMD Ryzen 7 8845HS
  (15889 - 18037, n=3)
16685 Points -7%
Cinebench R23 / Single Core
SCHENKER XMG Fusion 15 (Early 24)
Intel Core i9-14900HX
2043 Points +15%
Lenovo Legion 5 16IRX G9
Intel Core i7-14650HX
1963 Points +11%
Dell G16, i7-13650HX, RTX 4060
Intel Core i7-13650HX
1881 Points +6%
SCHENKER XMG Pro 15 (E23)
Intel Core i9-13900HX
1867 Points +5%
Average of class Gaming
  (1136 - 2235, n=211, last 2 years)
1846 Points +4%
SCHENKER XMG Core 15 (M24)
AMD Ryzen 7 8845HS
1775 Points
Average AMD Ryzen 7 8845HS
  (1716 - 1783, n=3)
1758 Points -1%
HP Victus 16 (2024)
Intel Core i7-14700HX
1702 Points -4%
Cinebench R20 / CPU (Multi Core)
Lenovo Legion 5 16IRX G9
Intel Core i7-14650HX
9349 Points +33%
SCHENKER XMG Pro 15 (E23)
Intel Core i9-13900HX
9250 Points +32%
HP Victus 16 (2024)
Intel Core i7-14700HX
9244 Points +32%
SCHENKER XMG Fusion 15 (Early 24)
Intel Core i9-14900HX
8465 Points +20%
Average of class Gaming
  (2179 - 13832, n=211, last 2 years)
7853 Points +12%
Dell G16, i7-13650HX, RTX 4060
Intel Core i7-13650HX
7821 Points +11%
SCHENKER XMG Core 15 (M24)
AMD Ryzen 7 8845HS
7026 Points
Average AMD Ryzen 7 8845HS
  (6231 - 7026, n=3)
6534 Points -7%
Cinebench R20 / CPU (Single Core)
SCHENKER XMG Fusion 15 (Early 24)
Intel Core i9-14900HX
779 Points +13%
Lenovo Legion 5 16IRX G9
Intel Core i7-14650HX
754 Points +9%
SCHENKER XMG Pro 15 (E23)
Intel Core i9-13900HX
722 Points +5%
Dell G16, i7-13650HX, RTX 4060
Intel Core i7-13650HX
721 Points +4%
Average of class Gaming
  (439 - 855, n=211, last 2 years)
710 Points +3%
SCHENKER XMG Core 15 (M24)
AMD Ryzen 7 8845HS
690 Points
Average AMD Ryzen 7 8845HS
  (677 - 691, n=3)
686 Points -1%
HP Victus 16 (2024)
Intel Core i7-14700HX
651 Points -6%
Cinebench R15 / CPU Multi 64Bit
SCHENKER XMG Pro 15 (E23)
Intel Core i9-13900HX
3913 (3186.24min - 3913.13max) Points +35%
HP Victus 16 (2024)
Intel Core i7-14700HX
3812 Points +31%
Lenovo Legion 5 16IRX G9
Intel Core i7-14650HX
3799 (3409.19min - 3799.39max) Points +31%
SCHENKER XMG Fusion 15 (Early 24)
Intel Core i9-14900HX
3458 Points +19%
Average of class Gaming
  (905 - 5663, n=215, last 2 years)
3247 Points +12%
Dell G16, i7-13650HX, RTX 4060
Intel Core i7-13650HX
3015 (2802.3min - 3015.45max) Points +4%
SCHENKER XMG Core 15 (M24)
AMD Ryzen 7 8845HS
2908 (2832.66min - 2908.03max) Points
Average AMD Ryzen 7 8845HS
  (2537 - 2908, n=3)
2667 Points -8%
Cinebench R15 / CPU Single 64Bit
Lenovo Legion 5 16IRX G9
Intel Core i7-14650HX
287 Points +3%
SCHENKER XMG Fusion 15 (Early 24)
Intel Core i9-14900HX
287 Points +3%
SCHENKER XMG Core 15 (M24)
AMD Ryzen 7 8845HS
280 Points
Average AMD Ryzen 7 8845HS
  (274 - 280, n=3)
278 Points -1%
Average of class Gaming
  (198 - 318, n=214, last 2 years)
272 Points -3%
Dell G16, i7-13650HX, RTX 4060
Intel Core i7-13650HX
269 Points -4%
SCHENKER XMG Pro 15 (E23)
Intel Core i9-13900HX
247 Points -12%
HP Victus 16 (2024)
Intel Core i7-14700HX
238 Points -15%
Blender / v2.79 BMW27 CPU
Average AMD Ryzen 7 8845HS
  (179 - 216, n=3)
197.3 Seconds * -10%
Average of class Gaming
  (87 - 555, n=206, last 2 years)
182.3 Seconds * -2%
SCHENKER XMG Core 15 (M24)
AMD Ryzen 7 8845HS
179 Seconds *
HP Victus 16 (2024)
Intel Core i7-14700HX
173 Seconds * +3%
Dell G16, i7-13650HX, RTX 4060
Intel Core i7-13650HX
165 Seconds * +8%
SCHENKER XMG Pro 15 (E23)
Intel Core i9-13900HX
148 Seconds * +17%
Lenovo Legion 5 16IRX G9
Intel Core i7-14650HX
141 Seconds * +21%
SCHENKER XMG Fusion 15 (Early 24)
Intel Core i9-14900HX
138 Seconds * +23%
7-Zip 18.03 / 7z b 4
SCHENKER XMG Fusion 15 (Early 24)
Intel Core i9-14900HX
97929 MIPS +31%
Lenovo Legion 5 16IRX G9
Intel Core i7-14650HX
93686 MIPS +25%
SCHENKER XMG Pro 15 (E23)
Intel Core i9-13900HX
90675 MIPS +21%
HP Victus 16 (2024)
Intel Core i7-14700HX
84799 MIPS +14%
Average of class Gaming
  (23795 - 140932, n=209, last 2 years)
81067 MIPS +9%
Dell G16, i7-13650HX, RTX 4060
Intel Core i7-13650HX
76328 MIPS +2%
SCHENKER XMG Core 15 (M24)
AMD Ryzen 7 8845HS
74664 MIPS
Average AMD Ryzen 7 8845HS
  (65072 - 74664, n=3)
70156 MIPS -6%
7-Zip 18.03 / 7z b 4 -mmt1
SCHENKER XMG Fusion 15 (Early 24)
Intel Core i9-14900HX
7508 MIPS +14%
Lenovo Legion 5 16IRX G9
Intel Core i7-14650HX
6695 MIPS +2%
SCHENKER XMG Core 15 (M24)
AMD Ryzen 7 8845HS
6571 MIPS
Average AMD Ryzen 7 8845HS
  (6274 - 6644, n=3)
6496 MIPS -1%
SCHENKER XMG Pro 15 (E23)
Intel Core i9-13900HX
6340 MIPS -4%
Average of class Gaming
  (4502 - 7581, n=209, last 2 years)
6211 MIPS -5%
Dell G16, i7-13650HX, RTX 4060
Intel Core i7-13650HX
5944 MIPS -10%
HP Victus 16 (2024)
Intel Core i7-14700HX
5641 MIPS -14%
Geekbench 6.2 / Multi-Core
SCHENKER XMG Fusion 15 (Early 24)
Intel Core i9-14900HX
16196 Points +16%
Lenovo Legion 5 16IRX G9
Intel Core i7-14650HX
16010 Points +14%
HP Victus 16 (2024)
Intel Core i7-14700HX
14807 Points +6%
Average of class Gaming
  (5340 - 19665, n=88, last 2 years)
14314 Points +2%
SCHENKER XMG Core 15 (M24)
AMD Ryzen 7 8845HS
14014 Points
Dell G16, i7-13650HX, RTX 4060
Intel Core i7-13650HX
13711 Points -2%
Average AMD Ryzen 7 8845HS
  (11073 - 14014, n=7)
12778 Points -9%
Geekbench 6.2 / Single-Core
SCHENKER XMG Fusion 15 (Early 24)
Intel Core i9-14900HX
3081 Points +15%
Lenovo Legion 5 16IRX G9
Intel Core i7-14650HX
2761 Points +3%
SCHENKER XMG Core 15 (M24)
AMD Ryzen 7 8845HS
2686 Points
Average of class Gaming
  (1599 - 3129, n=88, last 2 years)
2656 Points -1%
Average AMD Ryzen 7 8845HS
  (2540 - 2698, n=5)
2629 Points -2%
Dell G16, i7-13650HX, RTX 4060
Intel Core i7-13650HX
2562 Points -5%
HP Victus 16 (2024)
Intel Core i7-14700HX
2378 Points -11%
Geekbench 5.5 / Multi-Core
SCHENKER XMG Pro 15 (E23)
Intel Core i9-13900HX
17614 Points +38%
SCHENKER XMG Fusion 15 (Early 24)
Intel Core i9-14900HX
17214 Points +35%
Lenovo Legion 5 16IRX G9
Intel Core i7-14650HX
16810 Points +32%
HP Victus 16 (2024)
Intel Core i7-14700HX
16732 Points +31%
Average of class Gaming
  (4557 - 23194, n=214, last 2 years)
14249 Points +12%
SCHENKER XMG Core 15 (M24)
AMD Ryzen 7 8845HS
12726 Points
Dell G16, i7-13650HX, RTX 4060
Intel Core i7-13650HX
12509 Points -2%
Average AMD Ryzen 7 8845HS
  (11802 - 12726, n=4)
12169 Points -4%
Geekbench 5.5 / Single-Core
SCHENKER XMG Fusion 15 (Early 24)
Intel Core i9-14900HX
2107 Points +7%
SCHENKER XMG Core 15 (M24)
AMD Ryzen 7 8845HS
1971 Points
Average AMD Ryzen 7 8845HS
  (1875 - 1991, n=4)
1949 Points -1%
Lenovo Legion 5 16IRX G9
Intel Core i7-14650HX
1933 Points -2%
Dell G16, i7-13650HX, RTX 4060
Intel Core i7-13650HX
1866 Points -5%
Average of class Gaming
  (1196 - 2210, n=214, last 2 years)
1845 Points -6%
SCHENKER XMG Pro 15 (E23)
Intel Core i9-13900HX
1818 Points -8%
HP Victus 16 (2024)
Intel Core i7-14700HX
1700 Points -14%
HWBOT x265 Benchmark v2.2 / 4k Preset
Lenovo Legion 5 16IRX G9
Intel Core i7-14650HX
25.6 fps +13%
SCHENKER XMG Fusion 15 (Early 24)
Intel Core i9-14900HX
24 fps +6%
SCHENKER XMG Pro 15 (E23)
Intel Core i9-13900HX
23.5 fps +4%
SCHENKER XMG Core 15 (M24)
AMD Ryzen 7 8845HS
22.7 fps
Average of class Gaming
  (6.72 - 38.9, n=210, last 2 years)
22.3 fps -2%
HP Victus 16 (2024)
Intel Core i7-14700HX
22 fps -3%
Average AMD Ryzen 7 8845HS
  (18.6 - 22.7, n=3)
20.6 fps -9%
Dell G16, i7-13650HX, RTX 4060
Intel Core i7-13650HX
20.1 fps -11%
LibreOffice / 20 Documents To PDF
HP Victus 16 (2024)
Intel Core i7-14700HX
55.3 s * -12%
Dell G16, i7-13650HX, RTX 4060
Intel Core i7-13650HX
53.4 s * -9%
SCHENKER XMG Pro 15 (E23)
Intel Core i9-13900HX
51.1 s * -4%
SCHENKER XMG Core 15 (M24)
AMD Ryzen 7 8845HS
49.2 s *
Average of class Gaming
  (31.4 - 96.6, n=206, last 2 years)
48 s * +2%
Average AMD Ryzen 7 8845HS
  (47.1 - 49.2, n=3)
47.9 s * +3%
Lenovo Legion 5 16IRX G9
Intel Core i7-14650HX
43.8 s * +11%
SCHENKER XMG Fusion 15 (Early 24)
Intel Core i9-14900HX
38.9 s * +21%
R Benchmark 2.5 / Overall mean
HP Victus 16 (2024)
Intel Core i7-14700HX
0.4896 sec * -12%
SCHENKER XMG Pro 15 (E23)
Intel Core i9-13900HX
0.4564 sec * -4%
Average of class Gaming
  (0.3609 - 0.658, n=209, last 2 years)
0.4465 sec * -2%
Average AMD Ryzen 7 8845HS
  (0.4383 - 0.4464, n=3)
0.4413 sec * -1%
SCHENKER XMG Core 15 (M24)
AMD Ryzen 7 8845HS
0.4383 sec *
Dell G16, i7-13650HX, RTX 4060
Intel Core i7-13650HX
0.4217 sec * +4%
Dell G16, i7-13650HX, RTX 4060
Intel Core i7-13650HX
0.4217 sec * +4%
Lenovo Legion 5 16IRX G9
Intel Core i7-14650HX
0.4195 sec * +4%
SCHENKER XMG Fusion 15 (Early 24)
Intel Core i9-14900HX
0.365 sec * +17%

* ... im mniej tym lepiej

Cinebench R15 CPU Multi 64Bit
2908 Points
Cinebench R15 OpenGL 64Bit
229 fps
Cinebench R15 Ref. Match 64Bit
99.6 %
Cinebench R15 CPU Single 64Bit
280 Points
Pomoc
Performance Rating
SCHENKER XMG Fusion 15 (Early 24)
Intel Core i9-14900HX, NVIDIA GeForce RTX 4070 Laptop GPU
87.9 pt
SCHENKER XMG Core 15 (M24)
AMD Ryzen 7 8845HS, NVIDIA GeForce RTX 4060 Laptop GPU
87.6 pt
Average AMD Ryzen 7 8845HS
 
82.2 pt
SCHENKER XMG Pro 15 (E23)
Intel Core i9-13900HX, NVIDIA GeForce RTX 4060 Laptop GPU
77.8 pt
Average of class Gaming
 
76.7 pt
Lenovo Legion 5 16IRX G9
Intel Core i7-14650HX, NVIDIA GeForce RTX 4060 Laptop GPU
70.7 pt
Dell G16, i7-13650HX, RTX 4060
Intel Core i7-13650HX, NVIDIA GeForce RTX 4060 Laptop GPU
70.2 pt
HP Victus 16 (2024)
Intel Core i7-14700HX, NVIDIA GeForce RTX 4060 Laptop GPU
69.5 pt
AIDA64 / FP32 Ray-Trace
SCHENKER XMG Core 15 (M24)
AMD Ryzen 7 8845HS, NVIDIA GeForce RTX 4060 Laptop GPU
29544 KRay/s
Average AMD Ryzen 7 8845HS
  (25916 - 29544, n=3)
27140 KRay/s -8%
SCHENKER XMG Fusion 15 (Early 24)
Intel Core i9-14900HX, NVIDIA GeForce RTX 4070 Laptop GPU
20224 KRay/s -32%
Average of class Gaming
  (4986 - 60169, n=206, last 2 years)
20198 KRay/s -32%
Lenovo Legion 5 16IRX G9
Intel Core i7-14650HX, NVIDIA GeForce RTX 4060 Laptop GPU
19044 KRay/s -36%
Dell G16, i7-13650HX, RTX 4060
Intel Core i7-13650HX, NVIDIA GeForce RTX 4060 Laptop GPU
18836 KRay/s -36%
SCHENKER XMG Pro 15 (E23)
Intel Core i9-13900HX, NVIDIA GeForce RTX 4060 Laptop GPU
17906 KRay/s -39%
HP Victus 16 (2024)
Intel Core i7-14700HX, NVIDIA GeForce RTX 4060 Laptop GPU
16932 KRay/s -43%
AIDA64 / FPU Julia
SCHENKER XMG Core 15 (M24)
AMD Ryzen 7 8845HS, NVIDIA GeForce RTX 4060 Laptop GPU
125873 Points
Average AMD Ryzen 7 8845HS
  (109747 - 125873, n=3)
115216 Points -8%
SCHENKER XMG Fusion 15 (Early 24)
Intel Core i9-14900HX, NVIDIA GeForce RTX 4070 Laptop GPU
104545 Points -17%
Average of class Gaming
  (25360 - 252486, n=206, last 2 years)
100701 Points -20%
SCHENKER XMG Pro 15 (E23)
Intel Core i9-13900HX, NVIDIA GeForce RTX 4060 Laptop GPU
95763 Points -24%
Lenovo Legion 5 16IRX G9
Intel Core i7-14650HX, NVIDIA GeForce RTX 4060 Laptop GPU
95271 Points -24%
Dell G16, i7-13650HX, RTX 4060
Intel Core i7-13650HX, NVIDIA GeForce RTX 4060 Laptop GPU
93053 Points -26%
HP Victus 16 (2024)
Intel Core i7-14700HX, NVIDIA GeForce RTX 4060 Laptop GPU
86338 Points -31%
AIDA64 / CPU SHA3
SCHENKER XMG Fusion 15 (Early 24)
Intel Core i9-14900HX, NVIDIA GeForce RTX 4070 Laptop GPU
5293 MB/s +2%
SCHENKER XMG Core 15 (M24)
AMD Ryzen 7 8845HS, NVIDIA GeForce RTX 4060 Laptop GPU
5180 MB/s
Average AMD Ryzen 7 8845HS
  (4627 - 5180, n=3)
4834 MB/s -7%
SCHENKER XMG Pro 15 (E23)
Intel Core i9-13900HX, NVIDIA GeForce RTX 4060 Laptop GPU
4747 MB/s -8%
Average of class Gaming
  (1339 - 10389, n=206, last 2 years)
4613 MB/s -11%
Dell G16, i7-13650HX, RTX 4060
Intel Core i7-13650HX, NVIDIA GeForce RTX 4060 Laptop GPU
4256 MB/s -18%
Lenovo Legion 5 16IRX G9
Intel Core i7-14650HX, NVIDIA GeForce RTX 4060 Laptop GPU
4214 MB/s -19%
HP Victus 16 (2024)
Intel Core i7-14700HX, NVIDIA GeForce RTX 4060 Laptop GPU
4008 MB/s -23%
AIDA64 / CPU Queen
SCHENKER XMG Pro 15 (E23)
Intel Core i9-13900HX, NVIDIA GeForce RTX 4060 Laptop GPU
133669 Points +7%
SCHENKER XMG Fusion 15 (Early 24)
Intel Core i9-14900HX, NVIDIA GeForce RTX 4070 Laptop GPU
131076 Points +5%
HP Victus 16 (2024)
Intel Core i7-14700HX, NVIDIA GeForce RTX 4060 Laptop GPU
129836 Points +4%
SCHENKER XMG Core 15 (M24)
AMD Ryzen 7 8845HS, NVIDIA GeForce RTX 4060 Laptop GPU
124695 Points
Average AMD Ryzen 7 8845HS
  (114899 - 124695, n=3)
118559 Points -5%
Average of class Gaming
  (41257 - 200651, n=206, last 2 years)
113353 Points -9%
Dell G16, i7-13650HX, RTX 4060
Intel Core i7-13650HX, NVIDIA GeForce RTX 4060 Laptop GPU
108955 Points -13%
Lenovo Legion 5 16IRX G9
Intel Core i7-14650HX, NVIDIA GeForce RTX 4060 Laptop GPU
101500 Points -19%
AIDA64 / FPU SinJulia
SCHENKER XMG Core 15 (M24)
AMD Ryzen 7 8845HS, NVIDIA GeForce RTX 4060 Laptop GPU
15519 Points
Average AMD Ryzen 7 8845HS
  (14876 - 15519, n=3)
15112 Points -3%
SCHENKER XMG Fusion 15 (Early 24)
Intel Core i9-14900HX, NVIDIA GeForce RTX 4070 Laptop GPU
13913 Points -10%
Average of class Gaming
  (3925 - 32988, n=206, last 2 years)
12660 Points -18%
SCHENKER XMG Pro 15 (E23)
Intel Core i9-13900HX, NVIDIA GeForce RTX 4060 Laptop GPU
12458 Points -20%
Lenovo Legion 5 16IRX G9
Intel Core i7-14650HX, NVIDIA GeForce RTX 4060 Laptop GPU
11913 Points -23%
HP Victus 16 (2024)
Intel Core i7-14700HX, NVIDIA GeForce RTX 4060 Laptop GPU
11704 Points -25%
Dell G16, i7-13650HX, RTX 4060
Intel Core i7-13650HX, NVIDIA GeForce RTX 4060 Laptop GPU
10802 Points -30%
AIDA64 / FPU Mandel
SCHENKER XMG Core 15 (M24)
AMD Ryzen 7 8845HS, NVIDIA GeForce RTX 4060 Laptop GPU
67367 Points
Average AMD Ryzen 7 8845HS
  (58597 - 67367, n=3)
61576 Points -9%
Average of class Gaming
  (12321 - 134044, n=206, last 2 years)
51089 Points -24%
SCHENKER XMG Fusion 15 (Early 24)
Intel Core i9-14900HX, NVIDIA GeForce RTX 4070 Laptop GPU
51088 Points -24%
Lenovo Legion 5 16IRX G9
Intel Core i7-14650HX, NVIDIA GeForce RTX 4060 Laptop GPU
47097 Points -30%
Dell G16, i7-13650HX, RTX 4060
Intel Core i7-13650HX, NVIDIA GeForce RTX 4060 Laptop GPU
45501 Points -32%
SCHENKER XMG Pro 15 (E23)
Intel Core i9-13900HX, NVIDIA GeForce RTX 4060 Laptop GPU
44710 Points -34%
HP Victus 16 (2024)
Intel Core i7-14700HX, NVIDIA GeForce RTX 4060 Laptop GPU
42125 Points -37%
AIDA64 / CPU AES
SCHENKER XMG Fusion 15 (Early 24)
Intel Core i9-14900HX, NVIDIA GeForce RTX 4070 Laptop GPU
190740 MB/s +107%
Average of class Gaming
  (19065 - 328679, n=206, last 2 years)
110516 MB/s +20%
SCHENKER XMG Pro 15 (E23)
Intel Core i9-13900HX, NVIDIA GeForce RTX 4060 Laptop GPU
92203 MB/s 0%
SCHENKER XMG Core 15 (M24)
AMD Ryzen 7 8845HS, NVIDIA GeForce RTX 4060 Laptop GPU
92092 MB/s
Lenovo Legion 5 16IRX G9
Intel Core i7-14650HX, NVIDIA GeForce RTX 4060 Laptop GPU
86485 MB/s -6%
Dell G16, i7-13650HX, RTX 4060
Intel Core i7-13650HX, NVIDIA GeForce RTX 4060 Laptop GPU
85224 MB/s -7%
HP Victus 16 (2024)
Intel Core i7-14700HX, NVIDIA GeForce RTX 4060 Laptop GPU
82161 MB/s -11%
Average AMD Ryzen 7 8845HS
  (67393 - 92092, n=3)
81686 MB/s -11%
AIDA64 / CPU ZLib
SCHENKER XMG Fusion 15 (Early 24)
Intel Core i9-14900HX, NVIDIA GeForce RTX 4070 Laptop GPU
1485 MB/s +88%
SCHENKER XMG Pro 15 (E23)
Intel Core i9-13900HX, NVIDIA GeForce RTX 4060 Laptop GPU
1410 MB/s +79%
Lenovo Legion 5 16IRX G9
Intel Core i7-14650HX, NVIDIA GeForce RTX 4060 Laptop GPU
1289 MB/s +64%
Average of class Gaming
  (269 - 2409, n=206, last 2 years)
1278 MB/s +62%
Dell G16, i7-13650HX, RTX 4060
Intel Core i7-13650HX, NVIDIA GeForce RTX 4060 Laptop GPU
1237 MB/s +57%
HP Victus 16 (2024)
Intel Core i7-14700HX, NVIDIA GeForce RTX 4060 Laptop GPU
1177 MB/s +49%
Average AMD Ryzen 7 8845HS
  (627 - 1048, n=3)
821 MB/s +4%
SCHENKER XMG Core 15 (M24)
AMD Ryzen 7 8845HS, NVIDIA GeForce RTX 4060 Laptop GPU
788 MB/s
AIDA64 / FP64 Ray-Trace
SCHENKER XMG Core 15 (M24)
AMD Ryzen 7 8845HS, NVIDIA GeForce RTX 4060 Laptop GPU
15911 KRay/s
Average AMD Ryzen 7 8845HS
  (13875 - 15911, n=3)
14561 KRay/s -8%
SCHENKER XMG Fusion 15 (Early 24)
Intel Core i9-14900HX, NVIDIA GeForce RTX 4070 Laptop GPU
11009 KRay/s -31%
Average of class Gaming
  (2540 - 31796, n=206, last 2 years)
10914 KRay/s -31%
Dell G16, i7-13650HX, RTX 4060
Intel Core i7-13650HX, NVIDIA GeForce RTX 4060 Laptop GPU
10344 KRay/s -35%
Lenovo Legion 5 16IRX G9
Intel Core i7-14650HX, NVIDIA GeForce RTX 4060 Laptop GPU
10316 KRay/s -35%
SCHENKER XMG Pro 15 (E23)
Intel Core i9-13900HX, NVIDIA GeForce RTX 4060 Laptop GPU
9779 KRay/s -39%
HP Victus 16 (2024)
Intel Core i7-14700HX, NVIDIA GeForce RTX 4060 Laptop GPU
9029 KRay/s -43%
AIDA64 / CPU PhotoWorxx
SCHENKER XMG Pro 15 (E23)
Intel Core i9-13900HX, NVIDIA GeForce RTX 4060 Laptop GPU
50064 MPixel/s +20%
SCHENKER XMG Fusion 15 (Early 24)
Intel Core i9-14900HX, NVIDIA GeForce RTX 4070 Laptop GPU
47411 MPixel/s +14%
SCHENKER XMG Core 15 (M24)
AMD Ryzen 7 8845HS, NVIDIA GeForce RTX 4060 Laptop GPU
41668 MPixel/s
Average AMD Ryzen 7 8845HS
  (39002 - 41668, n=3)
40305 MPixel/s -3%
HP Victus 16 (2024)
Intel Core i7-14700HX, NVIDIA GeForce RTX 4060 Laptop GPU
39448 MPixel/s -5%
Average of class Gaming
  (10805 - 60161, n=207, last 2 years)
38236 MPixel/s -8%
Dell G16, i7-13650HX, RTX 4060
Intel Core i7-13650HX, NVIDIA GeForce RTX 4060 Laptop GPU
36170 MPixel/s -13%
Lenovo Legion 5 16IRX G9
Intel Core i7-14650HX, NVIDIA GeForce RTX 4060 Laptop GPU
33763 MPixel/s -19%

Wydajność systemu

Podczas gdy nasz system testowy pozostaje nieco w tyle pod względem wyniku czystego procesora, prowadzi konkurencję HX w PCMark 10. Jeśli chodzi o najważniejsze elementy, wynik plasuje się w środku stawki, ale pod względem produktywności wysuwa się na prowadzenie i jest jednym z liderów w dziedzinie tworzenia treści.

W CrossMark Dell G16 wypada nieco gorzej, a pozostali konkurenci są nieco przed naszym AMD Core 15.

PCMark 10 / Score
SCHENKER XMG Core 15 (M24)
NVIDIA GeForce RTX 4060 Laptop GPU, R7 8845HS, Samsung 990 Pro 1 TB
8822 Points
Average AMD Ryzen 7 8845HS, NVIDIA GeForce RTX 4060 Laptop GPU
  ()
8822 Points 0%
SCHENKER XMG Fusion 15 (Early 24)
NVIDIA GeForce RTX 4070 Laptop GPU, i9-14900HX, Samsung 990 Pro 1 TB
8522 Points -3%
Average of class Gaming
  (5442 - 9852, n=186, last 2 years)
7660 Points -13%
Lenovo Legion 5 16IRX G9
NVIDIA GeForce RTX 4060 Laptop GPU, i7-14650HX, Samsung PM9A1 MZVL21T0HCLR
7645 Points -13%
HP Victus 16 (2024)
NVIDIA GeForce RTX 4060 Laptop GPU, i7-14700HX, Kioxia XG8 KXG80ZNV512G
7528 Points -15%
SCHENKER XMG Pro 15 (E23)
NVIDIA GeForce RTX 4060 Laptop GPU, i9-13900HX, Crucial P5 Plus 1TB CT1000P5PSSD8
7521 Points -15%
Dell G16, i7-13650HX, RTX 4060
NVIDIA GeForce RTX 4060 Laptop GPU, i7-13650HX, WD PC SN740 SDDPNQD-1T00
7449 Points -16%
PCMark 10 / Essentials
SCHENKER XMG Fusion 15 (Early 24)
NVIDIA GeForce RTX 4070 Laptop GPU, i9-14900HX, Samsung 990 Pro 1 TB
11815 Points +17%
SCHENKER XMG Pro 15 (E23)
NVIDIA GeForce RTX 4060 Laptop GPU, i9-13900HX, Crucial P5 Plus 1TB CT1000P5PSSD8
11458 Points +14%
Lenovo Legion 5 16IRX G9
NVIDIA GeForce RTX 4060 Laptop GPU, i7-14650HX, Samsung PM9A1 MZVL21T0HCLR
10804 Points +7%
HP Victus 16 (2024)
NVIDIA GeForce RTX 4060 Laptop GPU, i7-14700HX, Kioxia XG8 KXG80ZNV512G
10778 Points +7%
Average of class Gaming
  (8829 - 12334, n=185, last 2 years)
10775 Points +7%
SCHENKER XMG Core 15 (M24)
NVIDIA GeForce RTX 4060 Laptop GPU, R7 8845HS, Samsung 990 Pro 1 TB
10061 Points
Average AMD Ryzen 7 8845HS, NVIDIA GeForce RTX 4060 Laptop GPU
  ()
10061 Points 0%
Dell G16, i7-13650HX, RTX 4060
NVIDIA GeForce RTX 4060 Laptop GPU, i7-13650HX, WD PC SN740 SDDPNQD-1T00
9532 Points -5%
PCMark 10 / Productivity
SCHENKER XMG Core 15 (M24)
NVIDIA GeForce RTX 4060 Laptop GPU, R7 8845HS, Samsung 990 Pro 1 TB
14612 Points
Average AMD Ryzen 7 8845HS, NVIDIA GeForce RTX 4060 Laptop GPU
  ()
14612 Points 0%
SCHENKER XMG Fusion 15 (Early 24)
NVIDIA GeForce RTX 4070 Laptop GPU, i9-14900HX, Samsung 990 Pro 1 TB
10731 Points -27%
SCHENKER XMG Pro 15 (E23)
NVIDIA GeForce RTX 4060 Laptop GPU, i9-13900HX, Crucial P5 Plus 1TB CT1000P5PSSD8
10510 Points -28%
Dell G16, i7-13650HX, RTX 4060
NVIDIA GeForce RTX 4060 Laptop GPU, i7-13650HX, WD PC SN740 SDDPNQD-1T00
10070 Points -31%
HP Victus 16 (2024)
NVIDIA GeForce RTX 4060 Laptop GPU, i7-14700HX, Kioxia XG8 KXG80ZNV512G
9910 Points -32%
Average of class Gaming
  (6662 - 14612, n=185, last 2 years)
9799 Points -33%
Lenovo Legion 5 16IRX G9
NVIDIA GeForce RTX 4060 Laptop GPU, i7-14650HX, Samsung PM9A1 MZVL21T0HCLR
9241 Points -37%
PCMark 10 / Digital Content Creation
SCHENKER XMG Fusion 15 (Early 24)
NVIDIA GeForce RTX 4070 Laptop GPU, i9-14900HX, Samsung 990 Pro 1 TB
13247 Points +5%
SCHENKER XMG Core 15 (M24)
NVIDIA GeForce RTX 4060 Laptop GPU, R7 8845HS, Samsung 990 Pro 1 TB
12674 Points
Average AMD Ryzen 7 8845HS, NVIDIA GeForce RTX 4060 Laptop GPU
  ()
12674 Points 0%
Lenovo Legion 5 16IRX G9
NVIDIA GeForce RTX 4060 Laptop GPU, i7-14650HX, Samsung PM9A1 MZVL21T0HCLR
12144 Points -4%
Dell G16, i7-13650HX, RTX 4060
NVIDIA GeForce RTX 4060 Laptop GPU, i7-13650HX, WD PC SN740 SDDPNQD-1T00
11686 Points -8%
Average of class Gaming
  (6462 - 18475, n=185, last 2 years)
11660 Points -8%
HP Victus 16 (2024)
NVIDIA GeForce RTX 4060 Laptop GPU, i7-14700HX, Kioxia XG8 KXG80ZNV512G
10841 Points -14%
SCHENKER XMG Pro 15 (E23)
NVIDIA GeForce RTX 4060 Laptop GPU, i9-13900HX, Crucial P5 Plus 1TB CT1000P5PSSD8
9588 Points -24%
CrossMark / Overall
SCHENKER XMG Fusion 15 (Early 24)
NVIDIA GeForce RTX 4070 Laptop GPU, i9-14900HX, Samsung 990 Pro 1 TB
2203 Points +17%
Lenovo Legion 5 16IRX G9
NVIDIA GeForce RTX 4060 Laptop GPU, i7-14650HX, Samsung PM9A1 MZVL21T0HCLR
2092 Points +11%
SCHENKER XMG Pro 15 (E23)
NVIDIA GeForce RTX 4060 Laptop GPU, i9-13900HX, Crucial P5 Plus 1TB CT1000P5PSSD8
1957 Points +4%
HP Victus 16 (2024)
NVIDIA GeForce RTX 4060 Laptop GPU, i7-14700HX, Kioxia XG8 KXG80ZNV512G
1923 Points +2%
SCHENKER XMG Core 15 (M24)
NVIDIA GeForce RTX 4060 Laptop GPU, R7 8845HS, Samsung 990 Pro 1 TB
1889 Points
Average AMD Ryzen 7 8845HS, NVIDIA GeForce RTX 4060 Laptop GPU
  ()
1889 Points 0%
Average of class Gaming
  (1247 - 2344, n=162, last 2 years)
1885 Points 0%
Dell G16, i7-13650HX, RTX 4060
NVIDIA GeForce RTX 4060 Laptop GPU, i7-13650HX, WD PC SN740 SDDPNQD-1T00
1842 Points -2%
CrossMark / Productivity
SCHENKER XMG Fusion 15 (Early 24)
NVIDIA GeForce RTX 4070 Laptop GPU, i9-14900HX, Samsung 990 Pro 1 TB
2109 Points +18%
Lenovo Legion 5 16IRX G9
NVIDIA GeForce RTX 4060 Laptop GPU, i7-14650HX, Samsung PM9A1 MZVL21T0HCLR
1938 Points +8%
SCHENKER XMG Pro 15 (E23)
NVIDIA GeForce RTX 4060 Laptop GPU, i9-13900HX, Crucial P5 Plus 1TB CT1000P5PSSD8
1798 Points +1%
Average of class Gaming
  (1299 - 2204, n=162, last 2 years)
1791 Points 0%
SCHENKER XMG Core 15 (M24)
NVIDIA GeForce RTX 4060 Laptop GPU, R7 8845HS, Samsung 990 Pro 1 TB
1789 Points
Average AMD Ryzen 7 8845HS, NVIDIA GeForce RTX 4060 Laptop GPU
  ()
1789 Points 0%
HP Victus 16 (2024)
NVIDIA GeForce RTX 4060 Laptop GPU, i7-14700HX, Kioxia XG8 KXG80ZNV512G
1782 Points 0%
Dell G16, i7-13650HX, RTX 4060
NVIDIA GeForce RTX 4060 Laptop GPU, i7-13650HX, WD PC SN740 SDDPNQD-1T00
1730 Points -3%
CrossMark / Creativity
SCHENKER XMG Fusion 15 (Early 24)
NVIDIA GeForce RTX 4070 Laptop GPU, i9-14900HX, Samsung 990 Pro 1 TB
2358 Points +12%
Lenovo Legion 5 16IRX G9
NVIDIA GeForce RTX 4060 Laptop GPU, i7-14650HX, Samsung PM9A1 MZVL21T0HCLR
2336 Points +11%
SCHENKER XMG Pro 15 (E23)
NVIDIA GeForce RTX 4060 Laptop GPU, i9-13900HX, Crucial P5 Plus 1TB CT1000P5PSSD8
2212 Points +5%
HP Victus 16 (2024)
NVIDIA GeForce RTX 4060 Laptop GPU, i7-14700HX, Kioxia XG8 KXG80ZNV512G
2107 Points 0%
SCHENKER XMG Core 15 (M24)
NVIDIA GeForce RTX 4060 Laptop GPU, R7 8845HS, Samsung 990 Pro 1 TB
2102 Points
Average AMD Ryzen 7 8845HS, NVIDIA GeForce RTX 4060 Laptop GPU
  ()
2102 Points 0%
Average of class Gaming
  (1275 - 2660, n=162, last 2 years)
2058 Points -2%
Dell G16, i7-13650HX, RTX 4060
NVIDIA GeForce RTX 4060 Laptop GPU, i7-13650HX, WD PC SN740 SDDPNQD-1T00
2020 Points -4%
CrossMark / Responsiveness
SCHENKER XMG Fusion 15 (Early 24)
NVIDIA GeForce RTX 4070 Laptop GPU, i9-14900HX, Samsung 990 Pro 1 TB
2049 Points +27%
Lenovo Legion 5 16IRX G9
NVIDIA GeForce RTX 4060 Laptop GPU, i7-14650HX, Samsung PM9A1 MZVL21T0HCLR
1889 Points +17%
HP Victus 16 (2024)
NVIDIA GeForce RTX 4060 Laptop GPU, i7-14700HX, Kioxia XG8 KXG80ZNV512G
1835 Points +14%
SCHENKER XMG Pro 15 (E23)
NVIDIA GeForce RTX 4060 Laptop GPU, i9-13900HX, Crucial P5 Plus 1TB CT1000P5PSSD8
1749 Points +8%
Average of class Gaming
  (1030 - 2330, n=162, last 2 years)
1696 Points +5%
Dell G16, i7-13650HX, RTX 4060
NVIDIA GeForce RTX 4060 Laptop GPU, i7-13650HX, WD PC SN740 SDDPNQD-1T00
1686 Points +5%
SCHENKER XMG Core 15 (M24)
NVIDIA GeForce RTX 4060 Laptop GPU, R7 8845HS, Samsung 990 Pro 1 TB
1613 Points
Average AMD Ryzen 7 8845HS, NVIDIA GeForce RTX 4060 Laptop GPU
  ()
1613 Points 0%
WebXPRT 3 / Overall
SCHENKER XMG Fusion 15 (Early 24)
NVIDIA GeForce RTX 4070 Laptop GPU, i9-14900HX, Samsung 990 Pro 1 TB
342 Points +12%
SCHENKER XMG Pro 15 (E23)
NVIDIA GeForce RTX 4060 Laptop GPU, i9-13900HX, Crucial P5 Plus 1TB CT1000P5PSSD8
323 Points +6%
Lenovo Legion 5 16IRX G9
NVIDIA GeForce RTX 4060 Laptop GPU, i7-14650HX, Samsung PM9A1 MZVL21T0HCLR
311 Points +2%
SCHENKER XMG Core 15 (M24)
NVIDIA GeForce RTX 4060 Laptop GPU, R7 8845HS, Samsung 990 Pro 1 TB
305 Points
Average AMD Ryzen 7 8845HS, NVIDIA GeForce RTX 4060 Laptop GPU
  ()
305 Points 0%
Average of class Gaming
  (215 - 480, n=187, last 2 years)
301 Points -1%
HP Victus 16 (2024)
NVIDIA GeForce RTX 4060 Laptop GPU, i7-14700HX, Kioxia XG8 KXG80ZNV512G
276 Points -10%
Dell G16, i7-13650HX, RTX 4060
NVIDIA GeForce RTX 4060 Laptop GPU, i7-13650HX, WD PC SN740 SDDPNQD-1T00
268 Points -12%
WebXPRT 4 / Overall
SCHENKER XMG Fusion 15 (Early 24)
NVIDIA GeForce RTX 4070 Laptop GPU, i9-14900HX, Samsung 990 Pro 1 TB
301 Points +14%
Lenovo Legion 5 16IRX G9
NVIDIA GeForce RTX 4060 Laptop GPU, i7-14650HX, Samsung PM9A1 MZVL21T0HCLR
283 Points +7%
SCHENKER XMG Pro 15 (E23)
NVIDIA GeForce RTX 4060 Laptop GPU, i9-13900HX, Crucial P5 Plus 1TB CT1000P5PSSD8
281 Points +6%
SCHENKER XMG Core 15 (M24)
NVIDIA GeForce RTX 4060 Laptop GPU, R7 8845HS, Samsung 990 Pro 1 TB
264 Points
Average AMD Ryzen 7 8845HS, NVIDIA GeForce RTX 4060 Laptop GPU
  ()
264 Points 0%
Average of class Gaming
  (157.9 - 328, n=168, last 2 years)
263 Points 0%
HP Victus 16 (2024)
NVIDIA GeForce RTX 4060 Laptop GPU, i7-14700HX, Kioxia XG8 KXG80ZNV512G
251 Points -5%
Mozilla Kraken 1.1 / Total
HP Victus 16 (2024)
NVIDIA GeForce RTX 4060 Laptop GPU, i7-14700HX, Kioxia XG8 KXG80ZNV512G
542 ms * -9%
SCHENKER XMG Pro 15 (E23)
NVIDIA GeForce RTX 4060 Laptop GPU, i9-13900HX, Crucial P5 Plus 1TB CT1000P5PSSD8
516 ms * -4%
Average of class Gaming
  (421 - 737, n=198, last 2 years)
516 ms * -4%
Dell G16, i7-13650HX, RTX 4060
NVIDIA GeForce RTX 4060 Laptop GPU, i7-13650HX, WD PC SN740 SDDPNQD-1T00
507 ms * -2%
SCHENKER XMG Core 15 (M24)
NVIDIA GeForce RTX 4060 Laptop GPU, R7 8845HS, Samsung 990 Pro 1 TB
496 ms *
Average AMD Ryzen 7 8845HS, NVIDIA GeForce RTX 4060 Laptop GPU
  ()
496 ms * -0%
Lenovo Legion 5 16IRX G9
NVIDIA GeForce RTX 4060 Laptop GPU, i7-14650HX, Samsung PM9A1 MZVL21T0HCLR
486 ms * +2%
SCHENKER XMG Fusion 15 (Early 24)
NVIDIA GeForce RTX 4070 Laptop GPU, i9-14900HX, Samsung 990 Pro 1 TB
431 ms * +13%

* ... im mniej tym lepiej

PCMark 10 Score
8822 pkt.
Pomoc
AIDA64 / Memory Copy
SCHENKER XMG Fusion 15 (Early 24)
Intel Core i9-14900HX, NVIDIA GeForce RTX 4070 Laptop GPU
77669 MB/s +12%
SCHENKER XMG Pro 15 (E23)
Intel Core i9-13900HX, NVIDIA GeForce RTX 4060 Laptop GPU
76591 MB/s +10%
SCHENKER XMG Core 15 (M24)
AMD Ryzen 7 8845HS, NVIDIA GeForce RTX 4060 Laptop GPU
69523 MB/s
Average AMD Ryzen 7 8845HS
  (67777 - 69523, n=3)
68941 MB/s -1%
HP Victus 16 (2024)
Intel Core i7-14700HX, NVIDIA GeForce RTX 4060 Laptop GPU
66599 MB/s -4%
Average of class Gaming
  (21842 - 94222, n=206, last 2 years)
61524 MB/s -12%
Lenovo Legion 5 16IRX G9
Intel Core i7-14650HX, NVIDIA GeForce RTX 4060 Laptop GPU
59727 MB/s -14%
Dell G16, i7-13650HX, RTX 4060
Intel Core i7-13650HX, NVIDIA GeForce RTX 4060 Laptop GPU
59266 MB/s -15%
AIDA64 / Memory Read
SCHENKER XMG Fusion 15 (Early 24)
Intel Core i9-14900HX, NVIDIA GeForce RTX 4070 Laptop GPU
85867 MB/s +41%
SCHENKER XMG Pro 15 (E23)
Intel Core i9-13900HX, NVIDIA GeForce RTX 4060 Laptop GPU
84877 MB/s +39%
HP Victus 16 (2024)
Intel Core i7-14700HX, NVIDIA GeForce RTX 4060 Laptop GPU
81049 MB/s +33%
Lenovo Legion 5 16IRX G9
Intel Core i7-14650HX, NVIDIA GeForce RTX 4060 Laptop GPU
71455 MB/s +17%
Dell G16, i7-13650HX, RTX 4060
Intel Core i7-13650HX, NVIDIA GeForce RTX 4060 Laptop GPU
67305 MB/s +10%
Average of class Gaming
  (23681 - 90647, n=206, last 2 years)
65502 MB/s +7%
SCHENKER XMG Core 15 (M24)
AMD Ryzen 7 8845HS, NVIDIA GeForce RTX 4060 Laptop GPU
61095 MB/s
Average AMD Ryzen 7 8845HS
  (50572 - 61095, n=3)
57558 MB/s -6%
AIDA64 / Memory Write
Average AMD Ryzen 7 8845HS
  (86677 - 93239, n=3)
89127 MB/s +2%
SCHENKER XMG Core 15 (M24)
AMD Ryzen 7 8845HS, NVIDIA GeForce RTX 4060 Laptop GPU
87466 MB/s
SCHENKER XMG Pro 15 (E23)
Intel Core i9-13900HX, NVIDIA GeForce RTX 4060 Laptop GPU
75215 MB/s -14%
SCHENKER XMG Fusion 15 (Early 24)
Intel Core i9-14900HX, NVIDIA GeForce RTX 4070 Laptop GPU
72287 MB/s -17%
HP Victus 16 (2024)
Intel Core i7-14700HX, NVIDIA GeForce RTX 4060 Laptop GPU
65204 MB/s -25%
Average of class Gaming
  (22986 - 103259, n=206, last 2 years)
63545 MB/s -27%
Dell G16, i7-13650HX, RTX 4060
Intel Core i7-13650HX, NVIDIA GeForce RTX 4060 Laptop GPU
58028 MB/s -34%
Lenovo Legion 5 16IRX G9
Intel Core i7-14650HX, NVIDIA GeForce RTX 4060 Laptop GPU
51138 MB/s -42%
AIDA64 / Memory Latency
HP Victus 16 (2024)
Intel Core i7-14700HX, NVIDIA GeForce RTX 4060 Laptop GPU
96.4 ns * -13%
Average AMD Ryzen 7 8845HS
  (85.6 - 101.8, n=3)
92 ns * -7%
Average of class Gaming
  (59.5 - 152.5, n=204, last 2 years)
90.9 ns * -6%
Dell G16, i7-13650HX, RTX 4060
Intel Core i7-13650HX, NVIDIA GeForce RTX 4060 Laptop GPU
90.8 ns * -6%
Lenovo Legion 5 16IRX G9
Intel Core i7-14650HX, NVIDIA GeForce RTX 4060 Laptop GPU
89.8 ns * -5%
SCHENKER XMG Core 15 (M24)
AMD Ryzen 7 8845HS, NVIDIA GeForce RTX 4060 Laptop GPU
85.6 ns *
SCHENKER XMG Pro 15 (E23)
Intel Core i9-13900HX, NVIDIA GeForce RTX 4060 Laptop GPU
84.1 ns * +2%
SCHENKER XMG Fusion 15 (Early 24)
Intel Core i9-14900HX, NVIDIA GeForce RTX 4070 Laptop GPU
83.1 ns * +3%

* ... im mniej tym lepiej

Opóźnienia DPC

Podczas otwierania przeglądarki występują minimalne opóźnienia, które nie stanowią jeszcze żadnego problemu. Gdy otwartych jest wiele kart przeglądarki, wartość opóźnienia nieco wzrasta. Dotyczy to również naszego odtwarzania wideo 4K/60fps z YouTube, a przy 62 procentach, współczynnik obciążenia wewnętrznego GPU wydaje się być dość wysoki. Rezultatem są dwie upuszczone klatki, a także niechlubne drugie miejsce w rankingu opóźnień.

Test YouTube
Test YouTube
LatencyMon Main
LatencyMon Main
Lista sterowników LatencyMon
DPC Latencies / LatencyMon - interrupt to process latency (max), Web, Youtube, Prime95
Lenovo Legion 5 16IRX G9
NVIDIA GeForce RTX 4060 Laptop GPU, i7-14650HX, Samsung PM9A1 MZVL21T0HCLR
2024.9 μs * -93%
SCHENKER XMG Core 15 (M24)
NVIDIA GeForce RTX 4060 Laptop GPU, R7 8845HS, Samsung 990 Pro 1 TB
1051.8 μs *
Dell G16, i7-13650HX, RTX 4060
NVIDIA GeForce RTX 4060 Laptop GPU, i7-13650HX, WD PC SN740 SDDPNQD-1T00
996.5 μs * +5%
SCHENKER XMG Pro 15 (E23)
NVIDIA GeForce RTX 4060 Laptop GPU, i9-13900HX, Crucial P5 Plus 1TB CT1000P5PSSD8
873.9 μs * +17%
HP Victus 16 (2024)
NVIDIA GeForce RTX 4060 Laptop GPU, i7-14700HX, Kioxia XG8 KXG80ZNV512G
853.9 μs * +19%
SCHENKER XMG Fusion 15 (Early 24)
NVIDIA GeForce RTX 4070 Laptop GPU, i9-14900HX, Samsung 990 Pro 1 TB
698.6 μs * +34%

* ... im mniej tym lepiej

Pamięć masowa

W naszym recenzowanym modelu Schenker zamontował szybki dysk Samsung 990 Pro z 1 TB pamięci masowej, a Core 15 można wyposażyć w dyski SSD sześciu różnych firm, w tym różne modele tego producenta.

W zależności od użytego oprogramowania testowego (CrystalDiskMark 6, AS SSD, Disksdp) dysk SSD radzi sobie lepiej lub gorzej, ale ogólnie rzecz biorąc, 990 Pro pozostaje bardzo szybkim dyskiem SSD PCIe 4.0 NVMe, który wykazał również bardzo stały wysoki poziom wydajności w naszym modelu testowym z uruchomioną pętlą Diskspd.

Crystaldiskmark 6
Crystaldiskmark 6
AS SSD
AS SSD
Kopia AS SSD
Kopia AS SSD
Samsung 990 Pro 1 TB
CDM 5/6 Read Seq Q32T1: 7112 MB/s
CDM 5/6 Write Seq Q32T1: 6886 MB/s
CDM 5/6 Read 4K Q32T1: 437 MB/s
CDM 5/6 Write 4K Q32T1: 423 MB/s
CDM 5/6 Read 4K: 61.9 MB/s
CDM 5/6 Write 4K: 100.1 MB/s
CDM 6 Write 4K Q8T8: 390 MB/s
CDM 6 Read 4K Q8T8: 1334 MB/s
Drive Performance Rating - Percent
SCHENKER XMG Fusion 15 (Early 24)
Samsung 990 Pro 1 TB
92.8 pt
Lenovo Legion 5 16IRX G9
Samsung PM9A1 MZVL21T0HCLR
86.6 pt
Average Samsung 990 Pro 1 TB
 
85.7 pt
HP Victus 16 (2024)
Kioxia XG8 KXG80ZNV512G
72.5 pt
SCHENKER XMG Core 15 (M24)
Samsung 990 Pro 1 TB
71.8 pt
Dell G16, i7-13650HX, RTX 4060
WD PC SN740 SDDPNQD-1T00
70.4 pt
Average of class Gaming
 
70.2 pt
SCHENKER XMG Pro 15 (E23)
Crucial P5 Plus 1TB CT1000P5PSSD8
70 pt
DiskSpd
seq read
Lenovo Legion 5 16IRX G9
Samsung PM9A1 MZVL21T0HCLR
4182 (4112.68min - 4181.96max) MB/s +23%
SCHENKER XMG Pro 15 (E23)
Crucial P5 Plus 1TB CT1000P5PSSD8
3972 (3827.09min - 3972.22max) MB/s +17%
Dell G16, i7-13650HX, RTX 4060
WD PC SN740 SDDPNQD-1T00
3748 (1761.44min - 3748.03max) MB/s +11%
SCHENKER XMG Fusion 15 (Early 24)
Samsung 990 Pro 1 TB
3645 (3579.03min - 3644.85max) MB/s +8%
Average of class Gaming
  (1319 - 7045, n=187, last 2 years)
3511 MB/s +4%
HP Victus 16 (2024)
Kioxia XG8 KXG80ZNV512G
3469 (3344.35min - 3469.11max) MB/s +2%
SCHENKER XMG Core 15 (M24)
Samsung 990 Pro 1 TB
3390 (3342.47min - 3389.7max) MB/s
Average Samsung 990 Pro 1 TB
  (2809 - 4234, n=13)
3332 MB/s -2%
seq write
Average Samsung 990 Pro 1 TB
  (3637 - 5842, n=13)
4842 MB/s +15%
Dell G16, i7-13650HX, RTX 4060
WD PC SN740 SDDPNQD-1T00
4403 (1750.56min - 4402.76max) MB/s +5%
SCHENKER XMG Fusion 15 (Early 24)
Samsung 990 Pro 1 TB
4342 (4320.81min - 4342.28max) MB/s +3%
SCHENKER XMG Pro 15 (E23)
Crucial P5 Plus 1TB CT1000P5PSSD8
4251 (4012.48min - 4251.35max) MB/s +1%
SCHENKER XMG Core 15 (M24)
Samsung 990 Pro 1 TB
4209 (4104.55min - 4209.16max) MB/s
Lenovo Legion 5 16IRX G9
Samsung PM9A1 MZVL21T0HCLR
4064 (3527.07min - 4064.49max) MB/s -3%
HP Victus 16 (2024)
Kioxia XG8 KXG80ZNV512G
3895 (3747.67min - 3894.8max) MB/s -7%
Average of class Gaming
  (535 - 9307, n=187, last 2 years)
3779 MB/s -10%
seq q8 t1 read
Average Samsung 990 Pro 1 TB
  (7011 - 7148, n=13)
7102 MB/s +1%
SCHENKER XMG Core 15 (M24)
Samsung 990 Pro 1 TB
7058 (5789.19min - 7057.97max) MB/s
SCHENKER XMG Fusion 15 (Early 24)
Samsung 990 Pro 1 TB
7011 (6063.46min - 7010.81max) MB/s -1%
HP Victus 16 (2024)
Kioxia XG8 KXG80ZNV512G
6933 (6552.34min - 6933.16max) MB/s -2%
SCHENKER XMG Pro 15 (E23)
Crucial P5 Plus 1TB CT1000P5PSSD8
6677 (5800.93min - 6677.12max) MB/s -5%
Lenovo Legion 5 16IRX G9
Samsung PM9A1 MZVL21T0HCLR
6651 (5971.64min - 6651.33max) MB/s -6%
Average of class Gaming
  (2594 - 16089, n=187, last 2 years)
6330 MB/s -10%
Dell G16, i7-13650HX, RTX 4060
WD PC SN740 SDDPNQD-1T00
5226 (4792.98min - 5226.07max) MB/s -26%
seq q8 t1 write
SCHENKER XMG Core 15 (M24)
Samsung 990 Pro 1 TB
6898 (6891.45min - 6898.33max) MB/s
SCHENKER XMG Fusion 15 (Early 24)
Samsung 990 Pro 1 TB
6897 MB/s 0%
Average Samsung 990 Pro 1 TB
  (6531 - 6898, n=13)
6791 MB/s -2%
SCHENKER XMG Pro 15 (E23)
Crucial P5 Plus 1TB CT1000P5PSSD8
5004 (4799.12min - 5003.59max) MB/s -27%
Lenovo Legion 5 16IRX G9
Samsung PM9A1 MZVL21T0HCLR
4952 (4919.08min - 4952.42max) MB/s -28%
Average of class Gaming
  (539 - 14571, n=187, last 2 years)
4784 MB/s -31%
Dell G16, i7-13650HX, RTX 4060
WD PC SN740 SDDPNQD-1T00
4536 (3842.06min - 4535.88max) MB/s -34%
HP Victus 16 (2024)
Kioxia XG8 KXG80ZNV512G
4392 (3922.93min - 4391.65max) MB/s -36%
4k q1 t1 read
Lenovo Legion 5 16IRX G9
Samsung PM9A1 MZVL21T0HCLR
83.9 (83.66min - 83.86max) MB/s +7%
SCHENKER XMG Core 15 (M24)
Samsung 990 Pro 1 TB
78.5 (76.33min - 78.49max) MB/s
Average Samsung 990 Pro 1 TB
  (55.3 - 84.5, n=13)
73.9 MB/s -6%
SCHENKER XMG Fusion 15 (Early 24)
Samsung 990 Pro 1 TB
71.8 MB/s -9%
Average of class Gaming
  (30.6 - 95.9, n=187, last 2 years)
67.1 MB/s -15%
SCHENKER XMG Pro 15 (E23)
Crucial P5 Plus 1TB CT1000P5PSSD8
64.8 (63.71min - 64.77max) MB/s -17%
Dell G16, i7-13650HX, RTX 4060
WD PC SN740 SDDPNQD-1T00
62.1 (58.49min - 62.08max) MB/s -21%
HP Victus 16 (2024)
Kioxia XG8 KXG80ZNV512G
46.2 (45.32min - 46.24max) MB/s -41%
4k q1 t1 write
SCHENKER XMG Fusion 15 (Early 24)
Samsung 990 Pro 1 TB
290 (278.05min - 290.22max) MB/s +82%
HP Victus 16 (2024)
Kioxia XG8 KXG80ZNV512G
251 (249.24min - 250.87max) MB/s +58%
Dell G16, i7-13650HX, RTX 4060
WD PC SN740 SDDPNQD-1T00
246 (245.02min - 245.66max) MB/s +55%
Lenovo Legion 5 16IRX G9
Samsung PM9A1 MZVL21T0HCLR
246 (236.18min - 245.56max) MB/s +55%
Average Samsung 990 Pro 1 TB
  (146.3 - 343, n=13)
237 MB/s +49%
Average of class Gaming
  (66.6 - 397, n=187, last 2 years)
222 MB/s +39%
SCHENKER XMG Pro 15 (E23)
Crucial P5 Plus 1TB CT1000P5PSSD8
200 (196.37min - 200.15max) MB/s +26%
SCHENKER XMG Core 15 (M24)
Samsung 990 Pro 1 TB
159.2 (158.4min - 159.24max) MB/s
4k q32 t16 read
SCHENKER XMG Fusion 15 (Early 24)
Samsung 990 Pro 1 TB
4915 (4860.82min - 4914.87max) MB/s +312%
Lenovo Legion 5 16IRX G9
Samsung PM9A1 MZVL21T0HCLR
4010 (4002.81min - 4009.85max) MB/s +236%
HP Victus 16 (2024)
Kioxia XG8 KXG80ZNV512G
3330 (3310.23min - 3329.64max) MB/s +179%
Average Samsung 990 Pro 1 TB
  (818 - 4923, n=13)
3318 MB/s +178%
SCHENKER XMG Pro 15 (E23)
Crucial P5 Plus 1TB CT1000P5PSSD8
2852 (2785.11min - 2852.4max) MB/s +139%
Dell G16, i7-13650HX, RTX 4060
WD PC SN740 SDDPNQD-1T00
2620 (1053.51min - 2619.8max) MB/s +120%
Average of class Gaming
  (417 - 6172, n=187, last 2 years)
2616 MB/s +119%
SCHENKER XMG Core 15 (M24)
Samsung 990 Pro 1 TB
1192 (1160.39min - 1192.45max) MB/s
4k q32 t16 write
SCHENKER XMG Fusion 15 (Early 24)
Samsung 990 Pro 1 TB
3406 (3365.94min - 3405.88max) MB/s +597%
Dell G16, i7-13650HX, RTX 4060
WD PC SN740 SDDPNQD-1T00
2918 (2441.74min - 2917.63max) MB/s +497%
Average Samsung 990 Pro 1 TB
  (413 - 4683, n=13)
2678 MB/s +448%
SCHENKER XMG Pro 15 (E23)
Crucial P5 Plus 1TB CT1000P5PSSD8
2654 (2528.72min - 2653.61max) MB/s +443%
Lenovo Legion 5 16IRX G9
Samsung PM9A1 MZVL21T0HCLR
2646 (2422.02min - 2645.88max) MB/s +441%
HP Victus 16 (2024)
Kioxia XG8 KXG80ZNV512G
2405 (937.07min - 2405.2max) MB/s +392%
Average of class Gaming
  (162.3 - 4869, n=187, last 2 years)
2149 MB/s +339%
SCHENKER XMG Core 15 (M24)
Samsung 990 Pro 1 TB
489 (473.86min - 489.4max) MB/s
AS SSD
Score Total
SCHENKER XMG Fusion 15 (Early 24)
Samsung 990 Pro 1 TB
9475 Points +43%
Lenovo Legion 5 16IRX G9
Samsung PM9A1 MZVL21T0HCLR
8677 Points +31%
Average Samsung 990 Pro 1 TB
  (5405 - 10265, n=13)
8390 Points +27%
HP Victus 16 (2024)
Kioxia XG8 KXG80ZNV512G
7423 Points +12%
Average of class Gaming
  (2271 - 13854, n=176, last 2 years)
6817 Points +3%
SCHENKER XMG Core 15 (M24)
Samsung 990 Pro 1 TB
6614 Points
SCHENKER XMG Pro 15 (E23)
Crucial P5 Plus 1TB CT1000P5PSSD8
6430 Points -3%
Dell G16, i7-13650HX, RTX 4060
WD PC SN740 SDDPNQD-1T00
5239 Points -21%
Score Read
SCHENKER XMG Fusion 15 (Early 24)
Samsung 990 Pro 1 TB
3530 Points +88%
Lenovo Legion 5 16IRX G9
Samsung PM9A1 MZVL21T0HCLR
3242 Points +73%
HP Victus 16 (2024)
Kioxia XG8 KXG80ZNV512G
3007 Points +61%
Average Samsung 990 Pro 1 TB
  (1349 - 4721, n=13)
2993 Points +60%
SCHENKER XMG Pro 15 (E23)
Crucial P5 Plus 1TB CT1000P5PSSD8
2549 Points +36%
Average of class Gaming
  (760 - 4721, n=176, last 2 years)
2490 Points +33%
SCHENKER XMG Core 15 (M24)
Samsung 990 Pro 1 TB
1873 Points
Dell G16, i7-13650HX, RTX 4060
WD PC SN740 SDDPNQD-1T00
1648 Points -12%
Score Write
SCHENKER XMG Fusion 15 (Early 24)
Samsung 990 Pro 1 TB
4145 Points +8%
Average Samsung 990 Pro 1 TB
  (2308 - 4684, n=13)
4001 Points +4%
SCHENKER XMG Core 15 (M24)
Samsung 990 Pro 1 TB
3848 Points
Lenovo Legion 5 16IRX G9
Samsung PM9A1 MZVL21T0HCLR
3846 Points 0%
Average of class Gaming
  (515 - 7208, n=176, last 2 years)
3120 Points -19%
HP Victus 16 (2024)
Kioxia XG8 KXG80ZNV512G
2919 Points -24%
Dell G16, i7-13650HX, RTX 4060
WD PC SN740 SDDPNQD-1T00
2751 Points -29%
SCHENKER XMG Pro 15 (E23)
Crucial P5 Plus 1TB CT1000P5PSSD8
2602 Points -32%
Seq Read
SCHENKER XMG Fusion 15 (Early 24)
Samsung 990 Pro 1 TB
5760.15 MB/s +9%
Lenovo Legion 5 16IRX G9
Samsung PM9A1 MZVL21T0HCLR
5413 MB/s +2%
SCHENKER XMG Core 15 (M24)
Samsung 990 Pro 1 TB
5283 MB/s
HP Victus 16 (2024)
Kioxia XG8 KXG80ZNV512G
5247.63 MB/s -1%
Average Samsung 990 Pro 1 TB
  (4362 - 5760, n=13)
5191 MB/s -2%
Average of class Gaming
  (2260 - 12763, n=176, last 2 years)
4921 MB/s -7%
Dell G16, i7-13650HX, RTX 4060
WD PC SN740 SDDPNQD-1T00
4491 MB/s -15%
SCHENKER XMG Pro 15 (E23)
Crucial P5 Plus 1TB CT1000P5PSSD8
3333.37 MB/s -37%
Seq Write
SCHENKER XMG Fusion 15 (Early 24)
Samsung 990 Pro 1 TB
5243.63 MB/s +44%
Average Samsung 990 Pro 1 TB
  (3376 - 5612, n=13)
4757 MB/s +30%
HP Victus 16 (2024)
Kioxia XG8 KXG80ZNV512G
4617.83 MB/s +27%
Dell G16, i7-13650HX, RTX 4060
WD PC SN740 SDDPNQD-1T00
4260 MB/s +17%
Lenovo Legion 5 16IRX G9
Samsung PM9A1 MZVL21T0HCLR
3979 MB/s +9%
Average of class Gaming
  (495 - 11316, n=176, last 2 years)
3665 MB/s +1%
SCHENKER XMG Core 15 (M24)
Samsung 990 Pro 1 TB
3646 MB/s
SCHENKER XMG Pro 15 (E23)
Crucial P5 Plus 1TB CT1000P5PSSD8
2633.33 MB/s -28%
4K Read
Lenovo Legion 5 16IRX G9
Samsung PM9A1 MZVL21T0HCLR
81.2 MB/s +6%
SCHENKER XMG Core 15 (M24)
Samsung 990 Pro 1 TB
76.7 MB/s
Average Samsung 990 Pro 1 TB
  (59.3 - 76.8, n=13)
70 MB/s -9%
Average of class Gaming
  (30.4 - 112.1, n=176, last 2 years)
65.9 MB/s -14%
SCHENKER XMG Fusion 15 (Early 24)
Samsung 990 Pro 1 TB
63.85 MB/s -17%
SCHENKER XMG Pro 15 (E23)
Crucial P5 Plus 1TB CT1000P5PSSD8
59.24 MB/s -23%
Dell G16, i7-13650HX, RTX 4060
WD PC SN740 SDDPNQD-1T00
55.5 MB/s -28%
HP Victus 16 (2024)
Kioxia XG8 KXG80ZNV512G
51.41 MB/s -33%
4K Write
SCHENKER XMG Fusion 15 (Early 24)
Samsung 990 Pro 1 TB
242.28 MB/s +41%
Average Samsung 990 Pro 1 TB
  (172.3 - 306, n=13)
224 MB/s +30%
HP Victus 16 (2024)
Kioxia XG8 KXG80ZNV512G
218.1 MB/s +27%
Dell G16, i7-13650HX, RTX 4060
WD PC SN740 SDDPNQD-1T00
211 MB/s +22%
Average of class Gaming
  (108.8 - 512, n=176, last 2 years)
209 MB/s +21%
Lenovo Legion 5 16IRX G9
Samsung PM9A1 MZVL21T0HCLR
194.6 MB/s +13%
SCHENKER XMG Core 15 (M24)
Samsung 990 Pro 1 TB
172.3 MB/s
SCHENKER XMG Pro 15 (E23)
Crucial P5 Plus 1TB CT1000P5PSSD8
165.94 MB/s -4%
4K-64 Read
SCHENKER XMG Fusion 15 (Early 24)
Samsung 990 Pro 1 TB
2982.47 MB/s +135%
Lenovo Legion 5 16IRX G9
Samsung PM9A1 MZVL21T0HCLR
2619 MB/s +107%
HP Victus 16 (2024)
Kioxia XG8 KXG80ZNV512G
2430.71 MB/s +92%
Average Samsung 990 Pro 1 TB
  (787 - 3164, n=13)
2339 MB/s +84%
SCHENKER XMG Pro 15 (E23)
Crucial P5 Plus 1TB CT1000P5PSSD8
2156.47 MB/s +70%
Average of class Gaming
  (442 - 3475, n=176, last 2 years)
1927 MB/s +52%
SCHENKER XMG Core 15 (M24)
Samsung 990 Pro 1 TB
1268 MB/s
Dell G16, i7-13650HX, RTX 4060
WD PC SN740 SDDPNQD-1T00
1143 MB/s -10%
4K-64 Write
SCHENKER XMG Fusion 15 (Early 24)
Samsung 990 Pro 1 TB
3413.79 MB/s +3%
SCHENKER XMG Core 15 (M24)
Samsung 990 Pro 1 TB
3311 MB/s
Average Samsung 990 Pro 1 TB
  (1592 - 3975, n=13)
3311 MB/s 0%
Lenovo Legion 5 16IRX G9
Samsung PM9A1 MZVL21T0HCLR
3253 MB/s -2%
Average of class Gaming
  (277 - 5909, n=176, last 2 years)
2547 MB/s -23%
HP Victus 16 (2024)
Kioxia XG8 KXG80ZNV512G
2238.92 MB/s -32%
SCHENKER XMG Pro 15 (E23)
Crucial P5 Plus 1TB CT1000P5PSSD8
2172.75 MB/s -34%
Dell G16, i7-13650HX, RTX 4060
WD PC SN740 SDDPNQD-1T00
2114 MB/s -36%
Access Time Read
HP Victus 16 (2024)
Kioxia XG8 KXG80ZNV512G
0.137 ms * -315%
Average of class Gaming
  (0.016 - 0.379, n=175, last 2 years)
0.05424 ms * -64%
SCHENKER XMG Pro 15 (E23)
Crucial P5 Plus 1TB CT1000P5PSSD8
0.053 ms * -61%
SCHENKER XMG Fusion 15 (Early 24)
Samsung 990 Pro 1 TB
0.05 ms * -52%
Average Samsung 990 Pro 1 TB
  (0.018 - 0.074, n=13)
0.03731 ms * -13%
Dell G16, i7-13650HX, RTX 4060
WD PC SN740 SDDPNQD-1T00
0.035 ms * -6%
SCHENKER XMG Core 15 (M24)
Samsung 990 Pro 1 TB
0.033 ms *
Lenovo Legion 5 16IRX G9
Samsung PM9A1 MZVL21T0HCLR
0.021 ms * +36%
Access Time Write
Average of class Gaming
  (0.011 - 1.028, n=176, last 2 years)
0.04702 ms * -104%
SCHENKER XMG Pro 15 (E23)
Crucial P5 Plus 1TB CT1000P5PSSD8
0.024 ms * -4%
SCHENKER XMG Core 15 (M24)
Samsung 990 Pro 1 TB
0.023 ms *
Average Samsung 990 Pro 1 TB
  (0.012 - 0.053, n=13)
0.02069 ms * +10%
Lenovo Legion 5 16IRX G9
Samsung PM9A1 MZVL21T0HCLR
0.02 ms * +13%
SCHENKER XMG Fusion 15 (Early 24)
Samsung 990 Pro 1 TB
0.019 ms * +17%
HP Victus 16 (2024)
Kioxia XG8 KXG80ZNV512G
0.019 ms * +17%
Dell G16, i7-13650HX, RTX 4060
WD PC SN740 SDDPNQD-1T00
0.018 ms * +22%

* ... im mniej tym lepiej

Continuous Performance Read: DiskSpd Read Loop, Queue Depth 8

036072010801440180021602520288032403600396043204680504054005760612064806840Tooltip
SCHENKER XMG Core 15 (M24) Samsung 990 Pro 1 TB; diskspd 2.0.17 f: Ø7120 (6339.48-7142.87)
Lenovo Legion 5 16IRX G9 Samsung PM9A1 MZVL21T0HCLR; diskspd 2.0.17 f: Ø4118 (3284.7-6662.02)
HP Victus 16 (2024) Kioxia XG8 KXG80ZNV512G; diskspd 2.0.17 f: Ø5625 (4912.19-6954.3)
Dell G16, i7-13650HX, RTX 4060 WD PC SN740 SDDPNQD-1T00; diskspd 2.0.17 f: Ø2397 (880.89-5167.17)

Karta graficzna

An Nvidia Geforce RTX 4060 służy jako procesor graficzny, jednak za dodatkowe 200 USD Core 15 jest również wyposażony w RTX 4070 taki jak ten w Fusion 15.

W testach 3DMark, Core 15 radzi sobie wyjątkowo dobrze. We wszystkich testach, nawet Fusion wyposażony w RTX 4070 cieszy się tylko 8-procentową przewagą, a Core 15 zajmuje drugie miejsce, przed konkurencją opartą na 4060.

Wydajność w grach nie jest tak dobra, jak wyniki 3DMark, ale jest to całkowicie związane z tytułami wymagającymi dużej mocy obliczeniowej procesora, takimi jak DOTA 2 Reborn lub X-Plane. Odkładając te tytuły na bok, jeśli chodzi o gry intensywnie wykorzystujące procesor, Core 15 widzi oko w oko z najlepszymi urządzeniami porównawczymi RTX 4060. Ten ostatni uruchamia wszystkie tytuły w rozdzielczości Full HD przy ponad 60 klatkach na sekundę i nie sprawia żadnych problemów nawet w natywnej rozdzielczości QHD, choć tytuły takie jak Cyberpunk 2077 okazjonalnie spadają poniżej poziomu 60 klatek na sekundę.

Wykres Witcher 3 pokazuje bardzo stabilną wydajność przez ponad godzinę w typowym dla gier rytmie dzień/noc. W tym obszarze wydajność jest również na tym samym poziomie, co konkurencja RTX 4060. Poniższa tabela przedstawia wyniki odnoszące się do różnych profili wydajności, przy czym jedyną niespójność można znaleźć w trybie zrównoważonym. Przez pierwsze kilka minut wyświetla on taką samą wydajność jak w trybie entuzjastycznym, przy czym liczba klatek na sekundę i zużycie energii spadają na krótko i udaje im się utrzymać na poziomie trybu bateryjnego.

W trybie bateryjnym wydajność 3D spada w Fire Strike o około 39 procent.

Profil wydajności/wartość Witcher 3 FPS (Start - po 5 min) Prędkość GPU Pobór mocy GPU Głośność Zużycie energii
Overboost 103 - 101 2,720 MHz 108.5 W 50.96 dB 167 W
Enthusiast 97 - 92 2,640 MHz 102.7 49 dB 156 W
Zrównoważony 97 - 65 1,880 MHz 47.86 W Początkowo 39.75, następnie po kilku minutach stałe 31 dB Początkowo 154, następnie 67 W
3DMark Performance Rating - Percent
SCHENKER XMG Fusion 15 (Early 24) -1!
NVIDIA GeForce RTX 4070 Laptop GPU, Intel Core i9-14900HX
100 pt
SCHENKER XMG Core 15 (M24)
NVIDIA GeForce RTX 4060 Laptop GPU, AMD Ryzen 7 8845HS
92.9 pt
Average of class Gaming
 
92.2 pt
Lenovo Legion 5 16IRX G9 -1!
NVIDIA GeForce RTX 4060 Laptop GPU, Intel Core i7-14650HX
86.7 pt
Dell G16, i7-13650HX, RTX 4060
NVIDIA GeForce RTX 4060 Laptop GPU, Intel Core i7-13650HX
81.5 pt
HP Victus 16 (2024) -1!
NVIDIA GeForce RTX 4060 Laptop GPU, Intel Core i7-14700HX
80.7 pt
Average NVIDIA GeForce RTX 4060 Laptop GPU
 
80.1 pt
SCHENKER XMG Pro 15 (E23)
NVIDIA GeForce RTX 4060 Laptop GPU, Intel Core i9-13900HX
79.6 pt
3DMark 11 - 1280x720 Performance GPU
SCHENKER XMG Fusion 15 (Early 24)
NVIDIA GeForce RTX 4070 Laptop GPU, Intel Core i9-14900HX
44902 Points +15%
Average of class Gaming
  (1029 - 72178, n=207, last 2 years)
42022 Points +8%
SCHENKER XMG Core 15 (M24)
NVIDIA GeForce RTX 4060 Laptop GPU, AMD Ryzen 7 8845HS
38912 Points
Lenovo Legion 5 16IRX G9
NVIDIA GeForce RTX 4060 Laptop GPU, Intel Core i7-14650HX
37410 Points -4%
SCHENKER XMG Pro 15 (E23)
NVIDIA GeForce RTX 4060 Laptop GPU, Intel Core i9-13900HX
36220 Points -7%
Dell G16, i7-13650HX, RTX 4060
NVIDIA GeForce RTX 4060 Laptop GPU, Intel Core i7-13650HX
36185 Points -7%
HP Victus 16 (2024)
NVIDIA GeForce RTX 4060 Laptop GPU, Intel Core i7-14700HX
35045 Points -10%
Average NVIDIA GeForce RTX 4060 Laptop GPU
  (28136 - 38912, n=42)
34554 Points -11%
3DMark
1280x720 Cloud Gate Standard Graphics
SCHENKER XMG Core 15 (M24)
NVIDIA GeForce RTX 4060 Laptop GPU, AMD Ryzen 7 8845HS
175780 Points
Average NVIDIA GeForce RTX 4060 Laptop GPU
  (81407 - 180228, n=25)
148035 Points -16%
Average of class Gaming
  (15902 - 193851, n=127, last 2 years)
139920 Points -20%
Dell G16, i7-13650HX, RTX 4060
NVIDIA GeForce RTX 4060 Laptop GPU, Intel Core i7-13650HX
131829 Points -25%
SCHENKER XMG Pro 15 (E23)
NVIDIA GeForce RTX 4060 Laptop GPU, Intel Core i9-13900HX
122538 Points -30%
1920x1080 Fire Strike Graphics
SCHENKER XMG Fusion 15 (Early 24)
NVIDIA GeForce RTX 4070 Laptop GPU, Intel Core i9-14900HX
31274 Points +5%
Average of class Gaming
  (781 - 53059, n=214, last 2 years)
30319 Points +2%
SCHENKER XMG Core 15 (M24)
NVIDIA GeForce RTX 4060 Laptop GPU, AMD Ryzen 7 8845HS
29656 Points
Lenovo Legion 5 16IRX G9
NVIDIA GeForce RTX 4060 Laptop GPU, Intel Core i7-14650HX
27474 Points -7%
Dell G16, i7-13650HX, RTX 4060
NVIDIA GeForce RTX 4060 Laptop GPU, Intel Core i7-13650HX
26952 Points -9%
HP Victus 16 (2024)
NVIDIA GeForce RTX 4060 Laptop GPU, Intel Core i7-14700HX
26844 Points -9%
SCHENKER XMG Pro 15 (E23)
NVIDIA GeForce RTX 4060 Laptop GPU, Intel Core i9-13900HX
26769 Points -10%
Average NVIDIA GeForce RTX 4060 Laptop GPU
  (20533 - 29656, n=39)
25441 Points -14%
2560x1440 Time Spy Graphics
SCHENKER XMG Fusion 15 (Early 24)
NVIDIA GeForce RTX 4070 Laptop GPU, Intel Core i9-14900HX
12682 Points +11%
Average of class Gaming
  (224 - 22717, n=210, last 2 years)
12507 Points +9%
SCHENKER XMG Core 15 (M24)
NVIDIA GeForce RTX 4060 Laptop GPU, AMD Ryzen 7 8845HS
11451 Points
Lenovo Legion 5 16IRX G9
NVIDIA GeForce RTX 4060 Laptop GPU, Intel Core i7-14650HX
11267 Points -2%
Dell G16, i7-13650HX, RTX 4060
NVIDIA GeForce RTX 4060 Laptop GPU, Intel Core i7-13650HX
10680 Points -7%
SCHENKER XMG Pro 15 (E23)
NVIDIA GeForce RTX 4060 Laptop GPU, Intel Core i9-13900HX
10429 Points -9%
HP Victus 16 (2024)
NVIDIA GeForce RTX 4060 Laptop GPU, Intel Core i7-14700HX
9937 Points -13%
Average NVIDIA GeForce RTX 4060 Laptop GPU
  (7484 - 11451, n=41)
9860 Points -14%
3DMark 11 Performance
34005 pkt.
3DMark Cloud Gate Standard Score
69309 pkt.
3DMark Fire Strike Score
26988 pkt.
3DMark Time Spy Score
11597 pkt.
Pomoc
Blender
v3.3 Classroom OPTIX/RTX
SCHENKER XMG Pro 15 (E23)
NVIDIA GeForce RTX 4060 Laptop GPU, Intel Core i9-13900HX
24 Seconds * -26%
Dell G16, i7-13650HX, RTX 4060
NVIDIA GeForce RTX 4060 Laptop GPU, Intel Core i7-13650HX
24 Seconds * -26%
Average NVIDIA GeForce RTX 4060 Laptop GPU
  (19 - 28, n=38)
23.1 Seconds * -22%
Lenovo Legion 5 16IRX G9
NVIDIA GeForce RTX 4060 Laptop GPU, Intel Core i7-14650HX
23 Seconds * -21%
Average of class Gaming
  (9 - 142, n=183, last 2 years)
22.7 Seconds * -19%
HP Victus 16 (2024)
NVIDIA GeForce RTX 4060 Laptop GPU, Intel Core i7-14700HX
22 Seconds * -16%
SCHENKER XMG Fusion 15 (Early 24)
NVIDIA GeForce RTX 4070 Laptop GPU, Intel Core i9-14900HX
21 Seconds * -11%
SCHENKER XMG Core 15 (M24)
NVIDIA GeForce RTX 4060 Laptop GPU, AMD Ryzen 7 8845HS
19 Seconds *
v3.3 Classroom CUDA
Dell G16, i7-13650HX, RTX 4060
NVIDIA GeForce RTX 4060 Laptop GPU, Intel Core i7-13650HX
49 Seconds * -26%
SCHENKER XMG Pro 15 (E23)
NVIDIA GeForce RTX 4060 Laptop GPU, Intel Core i9-13900HX
44 Seconds * -13%
Average NVIDIA GeForce RTX 4060 Laptop GPU
  (39 - 53, n=38)
43.6 Seconds * -12%
Lenovo Legion 5 16IRX G9
NVIDIA GeForce RTX 4060 Laptop GPU, Intel Core i7-14650HX
41 Seconds * -5%
HP Victus 16 (2024)
NVIDIA GeForce RTX 4060 Laptop GPU, Intel Core i7-14700HX
41 Seconds * -5%
SCHENKER XMG Core 15 (M24)
NVIDIA GeForce RTX 4060 Laptop GPU, AMD Ryzen 7 8845HS
39 Seconds *
Average of class Gaming
  (16 - 175, n=190, last 2 years)
38.7 Seconds * +1%
SCHENKER XMG Fusion 15 (Early 24)
NVIDIA GeForce RTX 4070 Laptop GPU, Intel Core i9-14900HX
32 Seconds * +18%
v3.3 Classroom CPU
HP Victus 16 (2024)
NVIDIA GeForce RTX 4060 Laptop GPU, Intel Core i7-14700HX
312 Seconds * -8%
Average NVIDIA GeForce RTX 4060 Laptop GPU
  (189 - 452, n=38)
312 Seconds * -8%
Average of class Gaming
  (138 - 962, n=203, last 2 years)
310 Seconds * -8%
SCHENKER XMG Core 15 (M24)
NVIDIA GeForce RTX 4060 Laptop GPU, AMD Ryzen 7 8845HS
288 Seconds *
Dell G16, i7-13650HX, RTX 4060
NVIDIA GeForce RTX 4060 Laptop GPU, Intel Core i7-13650HX
272 Seconds * +6%
SCHENKER XMG Pro 15 (E23)
NVIDIA GeForce RTX 4060 Laptop GPU, Intel Core i9-13900HX
263 Seconds * +9%
Lenovo Legion 5 16IRX G9
NVIDIA GeForce RTX 4060 Laptop GPU, Intel Core i7-14650HX
247 Seconds * +14%
SCHENKER XMG Fusion 15 (Early 24)
NVIDIA GeForce RTX 4070 Laptop GPU, Intel Core i9-14900HX
243 Seconds * +16%

* ... im mniej tym lepiej

Performance Rating - Percent
SCHENKER XMG Fusion 15 (Early 24)
Intel Core i9-14900HX, NVIDIA GeForce RTX 4070 Laptop GPU
96.5 pt
Lenovo Legion 5 16IRX G9
Intel Core i7-14650HX, NVIDIA GeForce RTX 4060 Laptop GPU
86.4 pt
SCHENKER XMG Pro 15 (E23) -1!
Intel Core i9-13900HX, NVIDIA GeForce RTX 4060 Laptop GPU
85.6 pt
Average of class Gaming
 
84.1 pt
Dell G16, i7-13650HX, RTX 4060
Intel Core i7-13650HX, NVIDIA GeForce RTX 4060 Laptop GPU
82 pt
SCHENKER XMG Core 15 (M24)
AMD Ryzen 7 8845HS, NVIDIA GeForce RTX 4060 Laptop GPU
80 pt
HP Victus 16 (2024)
Intel Core i7-14700HX, NVIDIA GeForce RTX 4060 Laptop GPU
76.6 pt
The Witcher 3 - 1920x1080 Ultra Graphics & Postprocessing (HBAO+)
SCHENKER XMG Pro 15 (E23)
Intel Core i9-13900HX, NVIDIA GeForce RTX 4060 Laptop GPU
159.7 fps +43%
SCHENKER XMG Fusion 15 (Early 24)
Intel Core i9-14900HX, NVIDIA GeForce RTX 4070 Laptop GPU
128 (110min) fps +15%
Average of class Gaming
  (13.1 - 216, n=204, last 2 years)
121.7 fps +9%
SCHENKER XMG Core 15 (M24)
AMD Ryzen 7 8845HS, NVIDIA GeForce RTX 4060 Laptop GPU
111.7 fps
Dell G16, i7-13650HX, RTX 4060
Intel Core i7-13650HX, NVIDIA GeForce RTX 4060 Laptop GPU
108 fps -3%
HP Victus 16 (2024)
Intel Core i7-14700HX, NVIDIA GeForce RTX 4060 Laptop GPU
99.9 (85min) fps -11%
Lenovo Legion 5 16IRX G9
Intel Core i7-14650HX, NVIDIA GeForce RTX 4060 Laptop GPU
97.2 (93min, 94P1) fps -13%
GTA V - 1920x1080 Highest Settings possible AA:4xMSAA + FX AF:16x
SCHENKER XMG Fusion 15 (Early 24)
Intel Core i9-14900HX, NVIDIA GeForce RTX 4070 Laptop GPU
137.6 (8.45min, 90.9P1) fps +18%
Lenovo Legion 5 16IRX G9
Intel Core i7-14650HX, NVIDIA GeForce RTX 4060 Laptop GPU
120.2 (4.33min, 76.9P1) fps +3%
Dell G16, i7-13650HX, RTX 4060
Intel Core i7-13650HX, NVIDIA GeForce RTX 4060 Laptop GPU
117.4 (3.75min, 76.9P1) fps +1%
SCHENKER XMG Core 15 (M24)
AMD Ryzen 7 8845HS, NVIDIA GeForce RTX 4060 Laptop GPU
116.7 (5.3min, 76.9P1) fps
HP Victus 16 (2024)
Intel Core i7-14700HX, NVIDIA GeForce RTX 4060 Laptop GPU
110.2 (8.03min, 76.9P1) fps -6%
Average of class Gaming
  (6.38 - 167.7, n=192, last 2 years)
109.5 fps -6%
SCHENKER XMG Pro 15 (E23)
Intel Core i9-13900HX, NVIDIA GeForce RTX 4060 Laptop GPU
107.2 (3.65min, 71.4P1) fps -8%
Final Fantasy XV Benchmark - 1920x1080 High Quality
SCHENKER XMG Fusion 15 (Early 24)
Intel Core i9-14900HX, NVIDIA GeForce RTX 4070 Laptop GPU
124.6 fps +16%
Average of class Gaming
  (9.13 - 201, n=205, last 2 years)
114.9 fps +7%
SCHENKER XMG Core 15 (M24)
AMD Ryzen 7 8845HS, NVIDIA GeForce RTX 4060 Laptop GPU
107.2 fps
Lenovo Legion 5 16IRX G9
Intel Core i7-14650HX, NVIDIA GeForce RTX 4060 Laptop GPU
106.3 fps -1%
Dell G16, i7-13650HX, RTX 4060
Intel Core i7-13650HX, NVIDIA GeForce RTX 4060 Laptop GPU
103.7 fps -3%
HP Victus 16 (2024)
Intel Core i7-14700HX, NVIDIA GeForce RTX 4060 Laptop GPU
98.1 fps -8%
Strange Brigade - 1920x1080 ultra AA:ultra AF:16
Average of class Gaming
  (14.6 - 421, n=203, last 2 years)
217 fps +6%
SCHENKER XMG Fusion 15 (Early 24)
Intel Core i9-14900HX, NVIDIA GeForce RTX 4070 Laptop GPU
214 (38.2min, 161.4P1) fps +5%
Lenovo Legion 5 16IRX G9
Intel Core i7-14650HX, NVIDIA GeForce RTX 4060 Laptop GPU
210 fps +3%
SCHENKER XMG Core 15 (M24)
AMD Ryzen 7 8845HS, NVIDIA GeForce RTX 4060 Laptop GPU
204 (141.8min, 149.7P1) fps
Dell G16, i7-13650HX, RTX 4060
Intel Core i7-13650HX, NVIDIA GeForce RTX 4060 Laptop GPU
194.9 (18.1min, 141.1P1) fps -4%
SCHENKER XMG Pro 15 (E23)
Intel Core i9-13900HX, NVIDIA GeForce RTX 4060 Laptop GPU
183.3 (43.8min, 135P1) fps -10%
HP Victus 16 (2024)
Intel Core i7-14700HX, NVIDIA GeForce RTX 4060 Laptop GPU
179 (76.4min, 130.3P1) fps -12%
Dota 2 Reborn - 1920x1080 ultra (3/3) best looking
SCHENKER XMG Fusion 15 (Early 24)
Intel Core i9-14900HX, NVIDIA GeForce RTX 4070 Laptop GPU
182.1 (158.8min) fps +35%
Lenovo Legion 5 16IRX G9
Intel Core i7-14650HX, NVIDIA GeForce RTX 4060 Laptop GPU
168.7 (146.8min) fps +25%
SCHENKER XMG Pro 15 (E23)
Intel Core i9-13900HX, NVIDIA GeForce RTX 4060 Laptop GPU
154.3 (130.7min) fps +14%
HP Victus 16 (2024)
Intel Core i7-14700HX, NVIDIA GeForce RTX 4060 Laptop GPU
149.7 (130.4min) fps +11%
Dell G16, i7-13650HX, RTX 4060
Intel Core i7-13650HX, NVIDIA GeForce RTX 4060 Laptop GPU
149 (130min) fps +10%
Average of class Gaming
  (33.2 - 220, n=212, last 2 years)
146 fps +8%
SCHENKER XMG Core 15 (M24)
AMD Ryzen 7 8845HS, NVIDIA GeForce RTX 4060 Laptop GPU
135.2 (117.4min) fps
X-Plane 11.11 - 1920x1080 high (fps_test=3)
SCHENKER XMG Fusion 15 (Early 24)
Intel Core i9-14900HX, NVIDIA GeForce RTX 4070 Laptop GPU
136.9 fps +41%
Lenovo Legion 5 16IRX G9
Intel Core i7-14650HX, NVIDIA GeForce RTX 4060 Laptop GPU
130.9 fps +35%
Dell G16, i7-13650HX, RTX 4060
Intel Core i7-13650HX, NVIDIA GeForce RTX 4060 Laptop GPU
114.9 fps +18%
SCHENKER XMG Pro 15 (E23)
Intel Core i9-13900HX, NVIDIA GeForce RTX 4060 Laptop GPU
111 fps +14%
Average of class Gaming
  (31.5 - 166.2, n=218, last 2 years)
104.3 fps +7%
HP Victus 16 (2024)
Intel Core i7-14700HX, NVIDIA GeForce RTX 4060 Laptop GPU
100.3 fps +3%
SCHENKER XMG Core 15 (M24)
AMD Ryzen 7 8845HS, NVIDIA GeForce RTX 4060 Laptop GPU
97.2 fps
Cyberpunk 2077 2.1 Phantom Liberty
1920x1080 Ultra Preset (FSR off)
SCHENKER XMG Core 15 (M24)
AMD Ryzen 7 8845HS, NVIDIA GeForce RTX 4060 Laptop GPU
93.1 (78.7min) fps
Average of class Gaming
  (6.76 - 144.7, n=55, last 2 years)
89.9 fps -3%
SCHENKER XMG Fusion 15 (Early 24)
Intel Core i9-14900HX, NVIDIA GeForce RTX 4070 Laptop GPU
87 (55.2min) fps -7%
Lenovo Legion 5 16IRX G9
Intel Core i7-14650HX, NVIDIA GeForce RTX 4060 Laptop GPU
81.8 (19.5min) fps -12%
Average NVIDIA GeForce RTX 4060 Laptop GPU
  (56.7 - 93.1, n=16)
71.7 fps -23%
Dell G16, i7-13650HX, RTX 4060
Intel Core i7-13650HX, NVIDIA GeForce RTX 4060 Laptop GPU
69.8 (60.3min) fps -25%
HP Victus 16 (2024)
Intel Core i7-14700HX, NVIDIA GeForce RTX 4060 Laptop GPU
67.1 (20.8min) fps -28%
2560x1440 Ultra Preset (FSR off)
Average of class Gaming
  (32.7 - 103.9, n=46, last 2 years)
66 fps +37%
SCHENKER XMG Fusion 15 (Early 24)
Intel Core i9-14900HX, NVIDIA GeForce RTX 4070 Laptop GPU
52.6 (39.5min) fps +9%
Lenovo Legion 5 16IRX G9
Intel Core i7-14650HX, NVIDIA GeForce RTX 4060 Laptop GPU
49.7 (26.6min) fps +3%
SCHENKER XMG Core 15 (M24)
AMD Ryzen 7 8845HS, NVIDIA GeForce RTX 4060 Laptop GPU
48.2 (40.8min) fps
Dell G16, i7-13650HX, RTX 4060
Intel Core i7-13650HX, NVIDIA GeForce RTX 4060 Laptop GPU
45.6 (38.6min) fps -5%
Average NVIDIA GeForce RTX 4060 Laptop GPU
  (32.9 - 51.8, n=11)
44 fps -9%
1920x1080 Ray Tracing Ultra Preset (DLSS off)
Average of class Gaming
  (11.9 - 77.7, n=36, last 2 years)
49.9 fps +33%
SCHENKER XMG Fusion 15 (Early 24)
Intel Core i9-14900HX, NVIDIA GeForce RTX 4070 Laptop GPU
43.8 (34.3min) fps +17%
SCHENKER XMG Core 15 (M24)
AMD Ryzen 7 8845HS, NVIDIA GeForce RTX 4060 Laptop GPU
37.4 (31.9min) fps
Average NVIDIA GeForce RTX 4060 Laptop GPU
  (26.1 - 37.4, n=9)
32.3 fps -14%
HP Victus 16 (2024)
Intel Core i7-14700HX, NVIDIA GeForce RTX 4060 Laptop GPU
32 (24.5min) fps -14%
Far Cry 5
1920x1080 High Preset AA:T
SCHENKER XMG Fusion 15 (Early 24)
Intel Core i9-14900HX, NVIDIA GeForce RTX 4070 Laptop GPU
166 (121min) fps +21%
Lenovo Legion 5 16IRX G9
Intel Core i7-14650HX, NVIDIA GeForce RTX 4060 Laptop GPU
155 fps +13%
Dell G16, i7-13650HX, RTX 4060
Intel Core i7-13650HX, NVIDIA GeForce RTX 4060 Laptop GPU
141 fps +3%
SCHENKER XMG Core 15 (M24)
AMD Ryzen 7 8845HS, NVIDIA GeForce RTX 4060 Laptop GPU
137 fps
Average of class Gaming
  (23 - 232, n=110, last 2 years)
136.7 fps 0%
Average NVIDIA GeForce RTX 4060 Laptop GPU
  (104 - 158, n=27)
130.9 fps -4%
1920x1080 Ultra Preset AA:T
SCHENKER XMG Fusion 15 (Early 24)
Intel Core i9-14900HX, NVIDIA GeForce RTX 4070 Laptop GPU
157 (109min) fps +23%
Lenovo Legion 5 16IRX G9
Intel Core i7-14650HX, NVIDIA GeForce RTX 4060 Laptop GPU
147 fps +15%
Dell G16, i7-13650HX, RTX 4060
Intel Core i7-13650HX, NVIDIA GeForce RTX 4060 Laptop GPU
135 fps +5%
SCHENKER XMG Core 15 (M24)
AMD Ryzen 7 8845HS, NVIDIA GeForce RTX 4060 Laptop GPU
128 fps
Average of class Gaming
  (21 - 218, n=117, last 2 years)
128 fps 0%
Average NVIDIA GeForce RTX 4060 Laptop GPU
  (95 - 148, n=28)
123.3 fps -4%
2560x1440 Ultra Preset AA:T
SCHENKER XMG Fusion 15 (Early 24)
Intel Core i9-14900HX, NVIDIA GeForce RTX 4070 Laptop GPU
124 (102min) fps +15%
Average of class Gaming
  (14 - 194, n=88, last 2 years)
115.8 fps +7%
Lenovo Legion 5 16IRX G9
Intel Core i7-14650HX, NVIDIA GeForce RTX 4060 Laptop GPU
111 fps +3%
SCHENKER XMG Core 15 (M24)
AMD Ryzen 7 8845HS, NVIDIA GeForce RTX 4060 Laptop GPU
108 fps
Dell G16, i7-13650HX, RTX 4060
Intel Core i7-13650HX, NVIDIA GeForce RTX 4060 Laptop GPU
105 fps -3%
Average NVIDIA GeForce RTX 4060 Laptop GPU
  (71 - 111, n=21)
95 fps -12%

Witcher 3 FPS diagram

0102030405060708090100Tooltip
SCHENKER XMG Core 15 (M24) R7 8845HS, NVIDIA GeForce RTX 4060 Laptop GPU: Ø101 (96-106)
Lenovo Legion 5 16IRX G9 i7-14650HX, NVIDIA GeForce RTX 4060 Laptop GPU: Ø97.2 (93-102)
HP Victus 16 (2024) i7-14700HX, NVIDIA GeForce RTX 4060 Laptop GPU: Ø96.1 (91-101)
Dell G16, i7-13650HX, RTX 4060 i7-13650HX, NVIDIA GeForce RTX 4060 Laptop GPU: Ø105.6 (100-109)
low med. high ultraQHD4K
GTA V (2015) 185 180.5 174.7 116.7 91.7
The Witcher 3 (2015) 402.5 337.4 215.5 111.7 83.4
Dota 2 Reborn (2015) 165.2 150.9 145.4 135.2 131.5
Final Fantasy XV Benchmark (2018) 225 153.7 107.2 79.4
X-Plane 11.11 (2018) 143.5 125.1 97.2 90.7
Far Cry 5 (2018) 162 142 137 128 108
Strange Brigade (2018) 434 305 242 204 136.3
Baldur's Gate 3 (2023) 160.3 125.7 110.7 105.5 72.2
Cyberpunk 2077 2.1 Phantom Liberty (2023) 136.1 107.2 91 93.1 48.2
Skull & Bones (2024) 146 127 101 73 57

Emisje i energia - gorący temat, ale ekonomiczny

Emisja hałasu

Podczas bezczynności na pulpicie, wentylatory pozostają w większości nieaktywne. Jednak nawet przy najmniejszym codziennym obciążeniu, takim jak otwieranie przeglądarki i surfowanie po sieci, są one aktywowane, a następnie szumią z cichą głośnością 27 dB. Z takim poziomem głośności będą mieli Państwo zazwyczaj do czynienia.

Przy dużym obciążeniu głośność wentylatora może wzrosnąć nawet do 52 dB, ale po zakończeniu okresu obciążenia wentylatory bardzo szybko się uspokajają. Potem jednak przez dłuższy czas nie jest już cicho, nawet podczas pracy na biegu jałowym.

Dla porównania, HP Victus i Dell G16 są nieco cichsze podczas grania, a wraz ze wzrostem głośności Legion 5, Core 15 plasuje się gdzieś pomiędzy tymi dwoma urządzeniami.

Hałas

luz
23 / 23 / 23 dB
obciążenie
38.92 / 52.09 dB
  red to green bar
 
 
30 dB
cichy
40 dB(A)
słyszalny
50 dB(A)
irytujący
 
min: dark, med: mid, max: light   Earthworks M23R, Arta (odległość 15 cm)   environment noise: 23 dB(A)
dB(A) 0102030405060708090Deep BassMiddle BassHigh BassLower RangeMidsHigher MidsLower HighsMid HighsUpper HighsSuper Highs2026.224.826.22520.723.420.73122.128.222.1403016.530503722.1376325.923.825.98022.212.322.210025.919.725.912521.814.921.816024.51124.520026.316.526.325028.914.728.931531.712.431.740034.110.934.1500359.235630367.83680036.98.736.9100039.48.639.4125041.3941.3160042.79.842.7200043.110.143.1250041.31141.3315040.711.240.7400041.611.741.650004011.8406300381238800034.212.134.21000029.712.129.71250026.812.526.81600022.511.122.5SPL52.12352.1N7.90.47.9median 35median 11.2median 35Delta7.21.97.237.540.441.53939.441.438.938.337.632.630.131.528.330.229.227.129.428.531.928.126.828.728.126.926.525.326.83835.433.833.933.533.431.630.731.231.432.329.530.632.530.131.52928.632.729.731.330.430.831.830.829.626.334.127.626.222.227.326.125.324.823.329.728.727.725.526.425.425.823.72431.83128.124.927.128.122.522.322.431.930.828.121.725.722.621.119.520.633.833.130.521.828.923.92218.620.437.434.83424.331.826.223.120.723.736.435.933.522.130.322.921.617.22538.938.335.422.732.424.622.514.420.840.2383620.83223.721.911.619.539.438.835.519.431.222.820.19.919.143.440.137.42034.124.421.59.91944.242.139.72035.125.322.19.718.644.442.138.81935.624.622.19.8184441.638.618.834.924.5221017.444.6423919.335.424.521.810.31844.341.838.718.534.522.620.610.817.743.640.53717.13222.219.211.214.542.939.936.514.232.219.315.511.613.44542.33914.834.317.814.911.613.145.643.138.714.43216.613.81212.844.541.536.715.829.616.5131212.840.336.831.814.224.614.112.612.113.236.833.227.814.620.313.912.611.91332.128.122.714.216.513.21311.412.255.753.149.830.445.534.6322429.310.89.27.31.45.32.11.50.51.2median 40.3median 38.8median 36median 19.3median 32median 22.9median 21.5median 11.6median 185.24.64.73.34.13.63.534.4hearing rangehide median Fan NoiseSCHENKER XMG Core 15 (M24)Lenovo Legion 5 16IRX G9
SCHENKER XMG Core 15 (M24)
NVIDIA GeForce RTX 4060 Laptop GPU, R7 8845HS, Samsung 990 Pro 1 TB
Lenovo Legion 5 16IRX G9
NVIDIA GeForce RTX 4060 Laptop GPU, i7-14650HX, Samsung PM9A1 MZVL21T0HCLR
HP Victus 16 (2024)
NVIDIA GeForce RTX 4060 Laptop GPU, i7-14700HX, Kioxia XG8 KXG80ZNV512G
Dell G16, i7-13650HX, RTX 4060
NVIDIA GeForce RTX 4060 Laptop GPU, i7-13650HX, WD PC SN740 SDDPNQD-1T00
SCHENKER XMG Fusion 15 (Early 24)
NVIDIA GeForce RTX 4070 Laptop GPU, i9-14900HX, Samsung 990 Pro 1 TB
SCHENKER XMG Pro 15 (E23)
NVIDIA GeForce RTX 4060 Laptop GPU, i9-13900HX, Crucial P5 Plus 1TB CT1000P5PSSD8
Noise
-14%
-13%
3%
-18%
-9%
off / environment *
23
24
-4%
25
-9%
23
-0%
25
-9%
24
-4%
Idle Minimum *
23
24
-4%
28
-22%
23
-0%
27
-17%
24
-4%
Idle Average *
23
28.8
-25%
29
-26%
23
-0%
28
-22%
24
-4%
Idle Maximum *
23
32
-39%
33
-43%
27.96
-22%
33
-43%
24
-4%
Load Average *
38.92
45.5
-17%
45
-16%
27.96
28%
52
-34%
53.65
-38%
Witcher 3 ultra *
50.96
53.1
-4%
43
16%
47.89
6%
51
-0%
53.53
-5%
Cyberpunk 2077 ultra *
52.06
Load Maximum *
52.09
55.7
-7%
48
8%
47.89
8%
53
-2%
53.65
-3%

* ... im mniej tym lepiej

Temperatura

Core 15 nie pozostaje tak naprawdę chłodny, a metalowa obudowa nagrzewa się dość mocno, stając się dodatkowym źródłem ciepła, zwłaszcza na podstawie urządzenia. Podkładki pod nadgarstki pozostają stosunkowo chłodne.

Nawet w trybie bezczynności z wyłączonymi wentylatorami, przy około 35 °C, robi się dość ciepło, ale w rozsądnych granicach. Podczas grania hotspot na podstawie urządzenia, centralnie przy wyświetlaczu, rozgrzewa się do 55°C, a w teście obciążeniowym osiąga nieco ponad 60°C. To właśnie w tym obszarze konkurencji udaje się pozostać nieco chłodniejszym, nawet Fusion 15 z mocniejszym GPU. Może to mieć również wpływ na konfigurację RTX 4070, skutkując możliwym dławieniem termicznym.

 46 °C51 °C46 °C 
 47 °C52 °C47 °C 
 32 °C34 °C31 °C 
maks. w ogóle: 52 °C
średnia: 42.9 °C
49 °C61 °C49 °C
37 °C45 °C41 °C
31 °C35 °C34 °C
maks. w ogóle: 61 °C
średnia: 42.4 °C
zasilacz  57 °C | temperatura otoczenia 22 °C | Fluke t3000FC (calibrated), Fluke 62 Mini
(-) The average temperature for the upper side under maximal load is 42.9 °C / 109 F, compared to the average of 33.9 °C / 93 F for the devices in the class Gaming.
(-) The maximum temperature on the upper side is 52 °C / 126 F, compared to the average of 40.4 °C / 105 F, ranging from 21.2 to 68.8 °C for the class Gaming.
(-) The bottom heats up to a maximum of 61 °C / 142 F, compared to the average of 43.2 °C / 110 F
(±) In idle usage, the average temperature for the upper side is 32.7 °C / 91 F, compared to the device average of 33.9 °C / 93 F.
(-) Playing The Witcher 3, the average temperature for the upper side is 39.2 °C / 103 F, compared to the device average of 33.9 °C / 93 F.
(+) The palmrests and touchpad are reaching skin temperature as a maximum (34 °C / 93.2 F) and are therefore not hot.
(-) The average temperature of the palmrest area of similar devices was 28.9 °C / 84 F (-5.1 °C / -9.2 F).
Witcher 3 top
Witcher 3 top
Witcher 3 ZASILACZ
Witcher 3 ZASILACZ
Witcher 3 podstawa
Witcher 3 podstawa
Test warunków skrajnych top
Test obciążeniowy zasilacza
Podstawa testu warunków skrajnych
SCHENKER XMG Core 15 (M24)
AMD Ryzen 7 8845HS, NVIDIA GeForce RTX 4060 Laptop GPU
Lenovo Legion 5 16IRX G9
Intel Core i7-14650HX, NVIDIA GeForce RTX 4060 Laptop GPU
HP Victus 16 (2024)
Intel Core i7-14700HX, NVIDIA GeForce RTX 4060 Laptop GPU
Dell G16, i7-13650HX, RTX 4060
Intel Core i7-13650HX, NVIDIA GeForce RTX 4060 Laptop GPU
SCHENKER XMG Fusion 15 (Early 24)
Intel Core i9-14900HX, NVIDIA GeForce RTX 4070 Laptop GPU
SCHENKER XMG Pro 15 (E23)
Intel Core i9-13900HX, NVIDIA GeForce RTX 4060 Laptop GPU
Heat
18%
21%
5%
16%
12%
Maximum Upper Side *
52
40.4
22%
50
4%
49
6%
48
8%
50
4%
Maximum Bottom *
61
43.8
28%
50
18%
58
5%
56
8%
50
18%
Idle Upper Side *
35
30.3
13%
25
29%
35
-0%
28
20%
33
6%
Idle Bottom *
39
35.3
9%
26
33%
35
10%
29
26%
32
18%

* ... im mniej tym lepiej

Głośniki

Tony wysokie i średnie są liniowe i zrównoważone, ale basy są ledwo słyszalne, a głośniki mogłyby być głośniejsze. Podłączenie analogowego sprzętu audio można uzyskać za pomocą portu słuchawkowego 3,5 mm.

dB(A) 0102030405060708090Deep BassMiddle BassHigh BassLower RangeMidsHigher MidsLower HighsMid HighsUpper HighsSuper Highs2025.924.825.92524.123.424.13120.628.220.6402616.5265029.822.129.86327.823.827.88018.112.318.110025.719.725.712531.514.931.516047114720058.316.558.325065.914.765.93156812.46840067.510.967.5500739.27363072.77.872.7800688.768100066.68.666.6125069.1969.1160068.69.868.6200065.610.165.6250063.81163.8315066.211.266.2400064.111.764.1500063.411.863.4630064.41264.4800062.912.162.91000062.112.162.11250063.412.563.41600058.611.158.6SPL79.12379.1N47.90.447.9median 64.4median 11.2median 64.4Delta4.61.94.626.325.821.422.12624.925.127.622.532.523.448.72655.818.860.922.167.2267019.372.317.674.217.774.319.575.31571.711.871.311.27410.574.21072.710.17210.67210.97511.374.811.671.71269.71269.612.371.112.669.61270.111.269.824.784.70.666.6median 12median 71.73.42.2hearing rangehide median Pink NoiseSCHENKER XMG Core 15 (M24)Apple MacBook Pro 16 2021 M1 Pro
Frequency diagram (checkboxes can be checked and unchecked to compare devices)
SCHENKER XMG Core 15 (M24) audio analysis

(±) | speaker loudness is average but good (79.12 dB)
Bass 100 - 315 Hz
(-) | nearly no bass - on average 16.7% lower than median
(-) | bass is not linear (15.7% delta to prev. frequency)
Mids 400 - 2000 Hz
(+) | balanced mids - only 4.5% away from median
(+) | mids are linear (4.4% delta to prev. frequency)
Highs 2 - 16 kHz
(+) | balanced highs - only 1% away from median
(+) | highs are linear (2.7% delta to prev. frequency)
Overall 100 - 16.000 Hz
(+) | overall sound is linear (13.7% difference to median)
Compared to same class
» 20% of all tested devices in this class were better, 6% similar, 74% worse
» The best had a delta of 6%, average was 18%, worst was 132%
Compared to all devices tested
» 12% of all tested devices were better, 3% similar, 84% worse
» The best had a delta of 4%, average was 25%, worst was 134%

Apple MacBook Pro 16 2021 M1 Pro audio analysis

(+) | speakers can play relatively loud (84.7 dB)
Bass 100 - 315 Hz
(+) | good bass - only 3.8% away from median
(+) | bass is linear (5.2% delta to prev. frequency)
Mids 400 - 2000 Hz
(+) | balanced mids - only 1.3% away from median
(+) | mids are linear (2.1% delta to prev. frequency)
Highs 2 - 16 kHz
(+) | balanced highs - only 1.9% away from median
(+) | highs are linear (2.7% delta to prev. frequency)
Overall 100 - 16.000 Hz
(+) | overall sound is linear (4.6% difference to median)
Compared to same class
» 0% of all tested devices in this class were better, 0% similar, 100% worse
» The best had a delta of 5%, average was 18%, worst was 45%
Compared to all devices tested
» 0% of all tested devices were better, 0% similar, 100% worse
» The best had a delta of 4%, average was 25%, worst was 134%

Zużycie energii

Zasilacz stał się sporo mniejszy

Core 15 jest nieco bardziej oszczędny niż konkurencja, zwłaszcza w trybie bezczynności - to bardzo dobrze. Zużycie energii pozostaje również umiarkowane podczas grania.

W teście obciążeniowym tymczasowo zmierzyliśmy wartości zużycia do 286 W, które teoretycznie mogłyby nieco przytłoczyć 240 W zasilacz. Niemniej jednak, te szczyty obciążenia są naprawdę tylko tymczasowe. Podczas grania zmierzyliśmy średnie zużycie energii na poziomie zaledwie 167 W i jest to coś, z czym zasilacz powinien sobie poradzić przez cały czas.

Mówiąc o zasilaczu, wydaje się, że Schenker wprowadził tutaj ulepszenia, zmniejszając jego wymiary. Zamiast masywnego zasilacza Chicony o mocy 240 W, producent zdecydował się na jednostkę o mocy 240 W, ale w znacznie mniejszej obudowie. Jest to bardzo korzystne z punktu widzenia mobilności.

Pobór mocy
wyłączony / stan wstrzymaniadarklight 0.1 / 5.5 W
luzdarkmidlight 9.3 / 12.9 / 12.8 W
obciążenie midlight / 286 W
 color bar
Legenda: min: dark, med: mid, max: light        Metrahit Energy
Currently we use the Metrahit Energy, a professional single phase power quality and energy measurement digital multimeter, for our measurements. Find out more about it here. All of our test methods can be found here.
SCHENKER XMG Core 15 (M24)
R7 8845HS, NVIDIA GeForce RTX 4060 Laptop GPU, Samsung 990 Pro 1 TB, IPS, 2560x1600, 15.30
Lenovo Legion 5 16IRX G9
i7-14650HX, NVIDIA GeForce RTX 4060 Laptop GPU, Samsung PM9A1 MZVL21T0HCLR, IPS, 2560x1600, 16.00
HP Victus 16 (2024)
i7-14700HX, NVIDIA GeForce RTX 4060 Laptop GPU, Kioxia XG8 KXG80ZNV512G, IPS, 1920x1080, 16.10
Dell G16, i7-13650HX, RTX 4060
i7-13650HX, NVIDIA GeForce RTX 4060 Laptop GPU, WD PC SN740 SDDPNQD-1T00, IPS, 2560x1600, 16.00
SCHENKER XMG Fusion 15 (Early 24)
i9-14900HX, NVIDIA GeForce RTX 4070 Laptop GPU, Samsung 990 Pro 1 TB, IPS, 2560x1600, 15.30
SCHENKER XMG Pro 15 (E23)
i9-13900HX, NVIDIA GeForce RTX 4060 Laptop GPU, Crucial P5 Plus 1TB CT1000P5PSSD8, IPS, 2560x1440, 15.60
Average NVIDIA GeForce RTX 4060 Laptop GPU
 
Average of class Gaming
 
Power Consumption
-36%
-13%
-13%
-20%
-100%
-25%
-48%
Idle Minimum *
9.3
15.4
-66%
9
3%
11
-18%
8
14%
21.6
-132%
12.4 ?(3 - 33, n=35)
-33%
Idle Average *
12.9
19.7
-53%
15
-16%
14.8
-15%
14
-9%
29
-125%
16.5 ?(6.9 - 35, n=35)
-28%
Idle Maximum *
12.8
20.7
-62%
23
-80%
16.8
-31%
26
-103%
42.7
-234%
21.2 ?(7.6 - 45, n=35)
-66%
Witcher 3 ultra *
167
191.3
-15%
143.7
14%
185
-11%
192.7
-15%
189
-13%
Load Maximum *
286
246.6
14%
241
16%
255
11%
244
15%
269
6%
212 ?(99 - 364, n=35)
26%
Load Average *
102.6
123
103.7
118
190

* ... im mniej tym lepiej

Power consumption Witcher 3 / stress test

0153045607590105120135150165180195210225240255270285Tooltip
SCHENKER XMG Core 15 (M24); Witcher 3 ultra: Ø167 (157.56-189.18)
SCHENKER XMG Core 15 (M24); 1280x720 Prime95 28.10 and Furmark 1.25: Ø201 (136.84-285.87)
SCHENKER XMG Core 15 (M24); Idle 150cd/m2: Ø11.8 (6.0221-29.196)

Power consumption with an external monitor

0102030405060708090100110120130140150160170180Tooltip
SCHENKER XMG Core 15 (M24); Prime95 V2810 Stress (external Monitor): Ø147.2 (141.63-157.1)
SCHENKER XMG Core 15 (M24); Cinebench R15 Multi (external Monitor): Ø144.2 (134.74-147.95)
SCHENKER XMG Core 15 (M24); Cinebench R23 Multi (external Monitor): Ø135.5 (70.23-154.3)
SCHENKER XMG Core 15 (M24); 1280x720 FurMark 1.19 GPU Stress Test (external Monitor): Ø172.9 (162.14-186.55)
SCHENKER XMG Core 15 (M24); 1920x1080 The Witcher 3 ultra (external Monitor): Ø155.5 (148.2-160.29)
SCHENKER XMG Core 15 (M24); Idle 1min (external Monitor): Ø14.4 (11.906-18.002)

Żywotność baterii

Standardowo Schenker zainstalował baterię o pojemności 80 Wh. Jednak za dodatkową dopłatą w wysokości około 70 USD urządzenie można skonfigurować z większą baterią 99,8 Wh, którą można znaleźć w naszym modelu testowym.

Core 15 działa przez około 7 godzin w teście Wi-Fi lub wideo przy zmniejszonej jasności 150 nitów. Jeśli ustawimy jasność na maksimum, światła zgasną po mniej niż 5 godzinach w teście Wi-Fi. Ogólnie rzecz biorąc, mamy tutaj do czynienia z bardzo dobrym czasem pracy na baterii, mimo że Legion wydaje się być w stanie zapewnić podobną wydajność z baterią 80 Wh.

Wydajność akumulatora
WiFi Websurfing
7h 00min
WiFi Websurfing max. Brightness
4h 52min
Blu-ray
0h 00min
Big Buck Bunny H.264 1080p
7h 37min
obciążenie
2h 31min
SCHENKER XMG Core 15 (M24)
R7 8845HS, NVIDIA GeForce RTX 4060 Laptop GPU, 99.8 Wh
Lenovo Legion 5 16IRX G9
i7-14650HX, NVIDIA GeForce RTX 4060 Laptop GPU, 80 Wh
HP Victus 16 (2024)
i7-14700HX, NVIDIA GeForce RTX 4060 Laptop GPU, 83 Wh
Dell G16, i7-13650HX, RTX 4060
i7-13650HX, NVIDIA GeForce RTX 4060 Laptop GPU, 86 Wh
SCHENKER XMG Fusion 15 (Early 24)
i9-14900HX, NVIDIA GeForce RTX 4070 Laptop GPU, 99.8 Wh
SCHENKER XMG Pro 15 (E23)
i9-13900HX, NVIDIA GeForce RTX 4060 Laptop GPU, 80 Wh
Average of class Gaming
 
Czasy pracy
-13%
22%
-26%
18%
-21%
-23%
H.264
457
576
26%
381
-17%
602
32%
WiFi v1.3
420
444
6%
511
22%
378
-10%
480
14%
343.1
-18%
Load
151
46
-70%
76
-50%
164
9%
115
-24%
Reader / Idle
911

Za

+ wysokiej jakości, stylowa metalowa obudowa
+ jasny, wiernie odwzorowujący kolory wyświetlacz sRGB
+ 2 dyski SSD i 2 gniazda pamięci RAM
+ Power Delivery

Przeciw

- brak Thunderbolt
- powolny czytnik SD
- nagrzewa się pod obciążeniem

Werdykt - Dobry i niedrogi z potencjalnie ulepszonym chłodzeniem

XMG Core 15 M24, dostarczony przez firmę Schenker

Core 15 kosztuje co najmniej 200 dolarów mniej niż Fusion 15. Wiąże się to z koniecznością rezygnacji z Thunderbolt i mocniejszego procesora. To ostatnie skutkuje zauważalną różnicą w wydajności procesora wynoszącą prawie 20 procent. Nie jest to jednak coś, co można zauważyć w większości gier 3D. Fusion może być o 20 procent szybszy w tym obszarze, ale wynika to z jego RTX 4070. Wariant RTX 4060 powinien być równie szybki.

Spodobało nam się wykonanie Core z metalową obudową, a także dobre opcje rozbudowy pod względem pamięci RAM i dysków SSD. Klawiatura, wydajność 3D i żywotność baterii są również przyzwoite.

"Jedynym" zarzutem jest duża ilość ciepła wytwarzanego na metalowej powierzchni podstawy pod dużym obciążeniem. Jest to obszar, w którym producent powinien wprowadzić przyszłe ulepszenia i być może zoptymalizować system chłodzenia.

XMG Core 15 to potężny gracz 3D z dobrą jakością wykonania, która obejmuje metalową obudowę, która robi się nieco zbyt gorąca pod obciążeniem.

Alternatywą, której warto się przyjrzeć, jest zeszłoroczny XMG Pro 15. Zeszłoroczny procesor HX jest nadal szybszy niż procesor AMD, a ponadto Pro ma również Thunderbolt 4. Legion 5i jest również możliwą alternatywą, szczególnie w tańszym wariancie Campuspoint.

Cena i dostępność

W sklepie Schenker w Niemczech ceny Core 15 zaczynają się od około 1500 USD (aktualny kurs wymiany). Ze względu na większą baterię, Wi-Fi 6E, więcej pamięci RAM i dysk SSD Samsung 990 Pro, nasz recenzowany model kosztuje około 1700 USD. Dla porównania, ceny Fusion 15 zaczynają się od około 1600 USD.

SCHENKER XMG Core 15 (M24) - 19/06/2024 v8 (new)
Christian Hintze

Wykonanie
83 / 98 → 85%
Klawiatura
81%
Myszka
85%
Komunikacja
64 / 80 → 80%
Waga
63 / 10-68 → 91%
Akumulator
71 / 95 → 75%
Wyświetlacz
87%
Wydajność w grach
87%
Wydajność w programach użytkowych
87%
AI Performance
96%
Temperatura
80 / 95 → 84%
Hałas
75 / 90 → 84%
Głośniki
73%
Kamerka
36 / 75 → 48%
Średnio
61%
83%
Gaming - Ważona średnia
CO2 Emissions
No Data
Materials
0%
Packaging
25%
Power Use
71.1%
Repairability
55%
Software Updates
Total Sustainability Score: 0%

Transparency

The present review sample was made available to the author as a loan by the manufacturer or a shop for the purposes of review. The lender had no influence on this review, nor did the manufacturer receive a copy of this review before publication. There was no obligation to publish this review.

Pricecompare

Please share our article, every link counts!
> laptopy testy i recenzje notebooki > Laptopy > Recenzja laptopa SCHENKER XMG Core 15 (M24): Wysokiej klasy maszyna do gier w metalowej obudowie z Niemiec
Christian Hintze, 2024-06-20 (Update: 2024-06-20)