Notebookcheck Logo

Recenzja mini-PC Geekom GT13 Pro - stylowa alternatywa dla NUC z procesorem Intel Core i9-13900H, 32 GB pamięci RAM DDR4 i dyskiem SSD 2 TB

Minimalistyczny mini-PC! GT13 Pro firmy Geekom jest kontynuacją istniejącej gamy modeli o stylowym wyglądzie. Procesor Intel Core i9-13900H obiecuje wiele, ale w tej szczegółowej recenzji przyjrzymy się bliżej, jak dobrze ten wysokiej klasy SoC radzi sobie w małej obudowie o pojemności 0,5 litra. Dzięki 32 GB pamięci RAM i dyskowi SSD o pojemności 2 TB, mini PC jest dobrze wyposażony, co znajduje również odzwierciedlenie w połączeniach z dwoma portami USB4.
Mini PC Desktop Intel Raptor Lake Thunderbolt

Wraz z Geekom GT13 Pro, producent ma w swoim portfolio bardzo wydajny mini-PC oparty na procesorach Intela. Niestety Geekom korzysta tylko z procesorów Raptor Lake H, choć Intel niedawno wprowadził na rynek nowsze układy Meteor Lake. W najlepszej konfiguracji jest to Intel Core i9-13900H który jest sparowany z 32 GB pamięci RAM i dyskiem SSD o pojemności 2 TB. Jeśli chodzi o cenę, trzeba głęboko sięgnąć do kieszeni, ponieważ ostateczny rachunek wynosi 930 euro. Za jedyne 721 euro Geekom GT13 Pro oparty na Intel Core i7-13620H jest znacznie tańszy. Dzięki 32 GB pamięci RAM tańszy model ma taką samą ilość pamięci roboczej, chociaż pamięć masowa jest tylko o połowę mniejsza i wynosi 1 TB.

Przyjrzyjmy się bliżej, jak dobrze Geekom GT13 Pro radzi sobie na tle innych wydajnych mini-PC. Jednak ze względu na cenę, oczekiwania są już bardzo wysokie. W poniższej tabeli zebraliśmy przegląd urządzeń porównawczych, które towarzyszą Geekom w tej recenzji.

Geekom GT13 Pro
Procesor
Intel Core i9-13900H 14 x 1.9 - 5.4 GHz, 64 W PL2 / Short Burst, 35 W PL1 / Sustained, Raptor Lake-H
Karta grafiki
Intel Iris Xe Graphics G7 96EUs, rdzeń: 1500 MHz, 31.0.101.5522 DCH
Pamięć
32 GB 
, DDR4-3200, 2 von 2 belegt, max. 64 GB
Chipset
Intel Alder Lake-P PCH
Dysk twardy
Acer N7000, 2048 GB 
, 1800 GB wolne miejsce
Karta dźwiękowa
Intel Raptor Lake-P/U/H PCH - cAVS
Złącza
1 USB 2.0, 3 USB 3.1 Gen2, 2 USB 4.0 40 Gbps, 2 Thunderbolt, USB-C Power Delivery (PD), 2 HDMI, 2 DisplayPort, 1 złącze stacji dokującej, gniazda audio: 3.5mm Klinke, czytnik kart: SD-Card (Full-Size)
Łączność
Intel Ethernet Controller I225-V (10/100/1000/2500MBit/s), MediaTek Wi-Fi 6E MT7922 160MHz Wireless LAN Card (a/b/g/n = Wi-Fi 4/ac = Wi-Fi 5/ax = Wi-Fi 6/ Wi-Fi 6E 6 GHz), Bluetooth 5.2
Gabaryty
wysokość x szerokość x głębokość (mm): 37 x 112.4 x 112.4
System operacyjny
Microsoft Windows 11 Pro
Inne
120-Watt-Power-Adapter, 36 miesiące(y) gwarancji
Waga
440 g, zasilacz: 249 g
Cena
930 EUR
Note: The manufacturer may use components from different suppliers including display panels, drives or memory sticks with similar specifications.


Potencjalni konkurenci w porównaniu

Date
Version
Model
Memory
Weight
Height
price
06/2024
v8 (new)Geekom GT13 Pro
i9-13900H, Iris Xe G7 96EUs
32768 MB440 g37 mm930 EUR
06/2024
v8 (new)Aoostar GEM12
R7 8845HS, Radeon 780M
32768 MB653 g60 mm649 US-Dollar
05/2024
v7 (old)Minisforum AtomMan X7 Ti
Ultra 9 185H, Arc 8-Core
32768 MB863 g48.6 mm959 Euro
05/2024
v7 (old)Geekom A8
R9 8945HS, Radeon 780M
32768 MB432 g38 mm949 EUR
04/2024
v7 (old)Geekom XT12 Pro
i9-12900H, Iris Xe G7 96EUs
32768 MB545 g37 mm899 EUR
04/2024
v7 (old)Acemagic F2A
Ultra 7 155H, Arc 8-Core
32768 MB768 g57 mm1199 EUR
12/2023
v7 (old)Minisforum EliteMini UM780 XTX
R7 7840HS, Radeon 780M
32768 MB750 g52.3 mm879 EUR
08/2023
v7 (old)Khadas Mind
i7-1360P, Iris Xe G7 96EUs
32768 MB438 g20 mm

Uwaga: Zaktualizowaliśmy nasz system oceniania i wyniki wersji 8 nie są porównywalne z wynikami wersji 7 dostępnej tutaj.

Geekom GT13 Pro
Geekom GT13 Pro
Geekom GT13 Pro
Geekom GT13 Pro
Geekom GT13 Pro
Geekom GT13 Pro
Geekom GT13 Pro
Geekom GT13 Pro
Geekom GT13 Pro
Geekom GT13 Pro
Geekom GT13 Pro
Geekom GT13 Pro
Geekom GT13 Pro i zasilacz (19 V; 6,32 A)
Zasilacz (19 V; 6,32 A)
Geekom GT13 Pro - DDR4-RAM

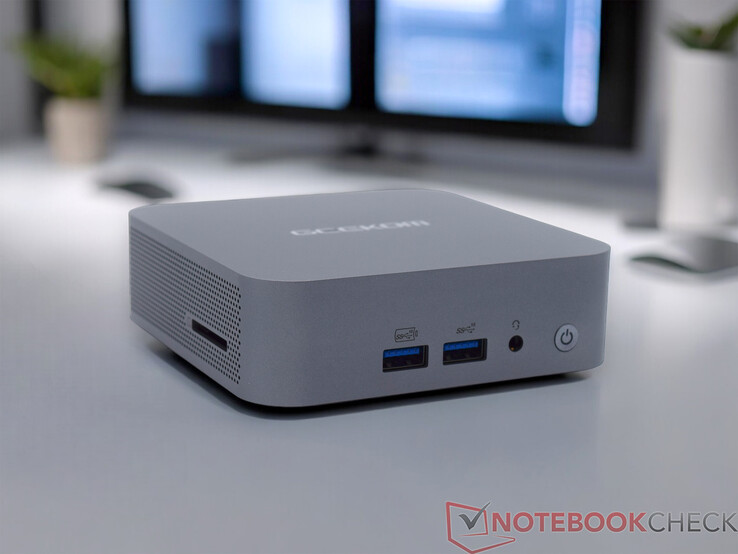
Obudowa - obudowa o pojemności 0,5 l wykonana z aluminium w innym kolorze

Ci, którzy czytali już nasze testy Geekom A7 lub Geekom A8zauważą wiele podobieństw, patrząc na Geekom GT13 Pro. I tak, urządzenia są podobne na zewnątrz. Geekom GT13 Pro wyróżnia się wizualnie tylko dzięki innej kolorystyce. W przeciwieństwie do dwóch srebrnych urządzeń, obudowa skopiowanego wariantu Intela jest ciemnoszara. Sam Geekom nazywa ten kolor bazaltową szarością. Subiektywnie, podoba nam się ten projekt nieco bardziej. Ostatecznie Geekom GT13 Pro ma te same zalety i wady. Doskonałe wykonanie i dobór materiałów to z pewnością argumenty przemawiające na korzyść urządzenia Geekom. Mini-PC ma również niezwykle kompaktową konstrukcję, co niekoniecznie jest zaletą pod względem wbudowanego chłodzenia. Nasza próbka testowa waży zaledwie 440 gramów i jest jednym z najlżejszych urządzeń w tym zestawieniu. Zasilacz waży kolejne 249 gramów.

Porównanie rozmiarów

146 mm 146 mm 57 mm 768 g145 mm 145 mm 48.6 mm 863 g130 mm 130 mm 60 mm 653 g130 mm 126 mm 52.3 mm 750 g146 mm 105 mm 20 mm 438 g117 mm 112 mm 37 mm 545 g112 mm 112 mm 38 mm 432 g112.4 mm 112.4 mm 37 mm 440 g210 mm 148 mm 1 mm 2.9 g

Wyposażenie - Dobry wybór, w tym 2x USB4

Wielokrotnie przekonaliśmy się już, że Geekom oferuje wiele opcji łączności pomimo swojej niezwykle kompaktowej konstrukcji. Geekom GT13 Pro nie jest wyjątkiem i oferuje wiele opcji łączności zewnętrznej. Cztery porty USB-A to wystarczająca liczba, zwłaszcza że istnieją dwa bardziej nowoczesne interfejsy z USB4, które można wykorzystać do ogromnego rozszerzenia zakresu zastosowań mini-PC. Przyjrzymy się również wydajności z zewnętrzną kartą graficzną. Geekom GT13 Pro może obsługiwać do czterech wyświetlaczy 4K jednocześnie. Możliwe jest również sterowanie wyświetlaczem 8K. Nie można zapomnieć o szybkim czytniku kart SD, który znajduje się po lewej stronie i należy go pozytywnie wyróżnić.

Zewnętrzne złącza w Geekom GT13 Pro (Źródło: Geekom)
SD Card Reader
average JPG Copy Test (av. of 3 runs)
Khadas Mind
Intel Core i7-1360P (AV Pro SD microSD 128 GB V60)
181.79 MB/s +5%
Geekom A5
AMD Ryzen 7 5800H (AV Pro SD microSD 128 GB V60)
176.8 MB/s +2%
Geekom A8
AMD Ryzen 9 8945HS (AV Pro SD microSD 128 GB V60)
174.57 MB/s +1%
Geekom GT13 Pro
Intel Core i9-13900H (AV Pro SD microSD 128 GB V60)
172.63 MB/s
Geekom Mini IT13
Intel Core i9-13900H
154.449 MB/s -11%
Geekom Mini IT12
Intel Core i7-1260P (AV Pro SD microSD 128 GB V60)
129.2 MB/s -25%
Average of class Mini PC
  (15.1 - 181.8, n=21, last 2 years)
86.8 MB/s -50%
Zotac ZBOX Magnus EN173070C
Intel Core i7-11800H (AV Pro SD microSD 128 GB V60)
65 MB/s -62%
maximum AS SSD Seq Read Test (1GB)
Khadas Mind
Intel Core i7-1360P (AV Pro SD microSD 128 GB V60)
200.48 MB/s +12%
Geekom A8
AMD Ryzen 9 8945HS (AV Pro SD microSD 128 GB V60)
182.85 MB/s +2%
Geekom A5
AMD Ryzen 7 5800H (AV Pro SD microSD 128 GB V60)
182.5 MB/s +2%
Geekom Mini IT13
Intel Core i9-13900H
180.4 MB/s 0%
Geekom GT13 Pro
Intel Core i9-13900H (AV Pro SD microSD 128 GB V60)
179.64 MB/s
Geekom Mini IT12
Intel Core i7-1260P (AV Pro SD microSD 128 GB V60)
176.8 MB/s -2%
Average of class Mini PC
  (18.2 - 200, n=21, last 2 years)
98.2 MB/s -45%
Zotac ZBOX Magnus EN173070C
Intel Core i7-11800H (AV Pro SD microSD 128 GB V60)
69.9 MB/s -61%

Komunikacja

Moduł WLAN
Moduł WLAN

W Geekom GT13 Pro natknęliśmy się na ten sam moduł radiowy, który jest również używany w Geekom A8. Moduł WLAN MediaTek Wi-Fi 6E MT7922 umożliwia pracę w zakresie częstotliwości 2,4 GHz, a także 5 GHz i 6 GHz. Nasze pomiary są ograniczone do pasm częstotliwości 5 i 6 GHz. Udokumentowaliśmy jedynie niewielkie różnice w wydajności w połączeniu z naszym routerem testowym Asus ROG Rapture GT-AXE11000. Niestety, Geekom nie zawiera nowoczesnego modułu Wi-Fi. Zarówno moduł Acemagic F2A jak i Minisforum AtomMan X7 Ti mogą konsekwentnie zapewniać nieco lepsze wyniki dzięki Intel Wi-Fi 7 BE200. Geekom GT13 Pro posiada również gniazdo RJ45. Możliwy jest tutaj transfer danych z prędkością do 2,5 GBit/s.

Networking
iperf3 receive AXE11000 6GHz
Acemagic F2A
Intel Wi-Fi 7 BE200 320MHz
1770 (1584min - 1790max) MBit/s +12%
Minisforum AtomMan X7 Ti
Intel Wi-Fi 7 BE200 320MHz
1761 (1734min - 1774max) MBit/s +11%
Geekom GT13 Pro
MediaTek Wi-Fi 6E MT7922 160MHz Wireless LAN Card
1583 (1557min - 1611max) MBit/s
Geekom A8
MediaTek Wi-Fi 6E MT7922 160MHz Wireless LAN Card
1458 (1382min - 1500max) MBit/s -8%
Khadas Mind
Intel Wi-Fi 6E AX211
1445 (1342min - 1468max) MBit/s -9%
Average MediaTek Wi-Fi 6E MT7922 160MHz Wireless LAN Card
  (860 - 1771, n=31)
1444 MBit/s -9%
Average of class Mini PC
  (390 - 1771, n=46, last 2 years)
1258 MBit/s -21%
Geekom XT12 Pro
MediaTek Wi-Fi 6E MT7922 160MHz Wireless LAN Card
1152 (576min - 1273max) MBit/s -27%
iperf3 transmit AXE11000 6GHz
Acemagic F2A
Intel Wi-Fi 7 BE200 320MHz
1615 (767min - 1670max) MBit/s +13%
Minisforum AtomMan X7 Ti
Intel Wi-Fi 7 BE200 320MHz
1562 (1198min - 1713max) MBit/s +9%
Average MediaTek Wi-Fi 6E MT7922 160MHz Wireless LAN Card
  (875 - 1775, n=30)
1461 MBit/s +2%
Geekom GT13 Pro
MediaTek Wi-Fi 6E MT7922 160MHz Wireless LAN Card
1429 (1392min - 1511max) MBit/s
Geekom A8
MediaTek Wi-Fi 6E MT7922 160MHz Wireless LAN Card
1356 (669min - 1390max) MBit/s -5%
Khadas Mind
Intel Wi-Fi 6E AX211
1348 (1293min - 1402max) MBit/s -6%
Geekom XT12 Pro
MediaTek Wi-Fi 6E MT7922 160MHz Wireless LAN Card
1315 (691min - 1352max) MBit/s -8%
Average of class Mini PC
  (432 - 1775, n=47, last 2 years)
1213 MBit/s -15%
iperf3 receive AXE11000
Minisforum AtomMan X7 Ti
Intel Wi-Fi 7 BE200 320MHz
1599 (802min - 1683max) MBit/s +14%
Average MediaTek Wi-Fi 6E MT7922 160MHz Wireless LAN Card
  (848 - 1775, n=44)
1444 MBit/s +3%
Geekom GT13 Pro
MediaTek Wi-Fi 6E MT7922 160MHz Wireless LAN Card
1398 (1261min - 1453max) MBit/s
Geekom A8
MediaTek Wi-Fi 6E MT7922 160MHz Wireless LAN Card
1101 (606min - 1257max) MBit/s -21%
Khadas Mind
Intel Wi-Fi 6E AX211
1059 (937min - 1173max) MBit/s -24%
Minisforum EliteMini UM780 XTX
Intel Killer Wi-Fi 6E AX1675x (210NGW)
934 (915min - 943max) MBit/s -33%
Average of class Mini PC
  (192.9 - 1796, n=98, last 2 years)
921 MBit/s -34%
Geekom XT12 Pro
MediaTek Wi-Fi 6E MT7922 160MHz Wireless LAN Card
892 (460min - 921max) MBit/s -36%
Acemagic F2A
Intel Wi-Fi 7 BE200 320MHz
838 (728min - 926max) MBit/s -40%
Aoostar GEM12
Intel Wi-Fi 6 AX200
740 (676min - 758max) MBit/s -47%
iperf3 transmit AXE11000
Minisforum AtomMan X7 Ti
Intel Wi-Fi 7 BE200 320MHz
1566 (904min - 1695max) MBit/s +37%
Average MediaTek Wi-Fi 6E MT7922 160MHz Wireless LAN Card
  (358 - 1785, n=44)
1347 MBit/s +18%
Geekom GT13 Pro
MediaTek Wi-Fi 6E MT7922 160MHz Wireless LAN Card
1146 (846min - 1308max) MBit/s
Khadas Mind
Intel Wi-Fi 6E AX211
1108 (703min - 1199max) MBit/s -3%
Geekom A8
MediaTek Wi-Fi 6E MT7922 160MHz Wireless LAN Card
1105 (489min - 1222max) MBit/s -4%
Average of class Mini PC
  (184.1 - 1776, n=98, last 2 years)
852 MBit/s -26%
Aoostar GEM12
Intel Wi-Fi 6 AX200
736 (369min - 756max) MBit/s -36%
Minisforum EliteMini UM780 XTX
Intel Killer Wi-Fi 6E AX1675x (210NGW)
729 (668min - 784max) MBit/s -36%
Acemagic F2A
Intel Wi-Fi 7 BE200 320MHz
709 (369min - 977max) MBit/s -38%
Geekom XT12 Pro
MediaTek Wi-Fi 6E MT7922 160MHz Wireless LAN Card
589 (295min - 624max) MBit/s -49%
0501001502002503003504004505005506006507007508008509009501000105011001150120012501300135014001450150015501600165017001750Tooltip
Geekom GT13 Pro MediaTek Wi-Fi 6E MT7922 160MHz Wireless LAN Card; iperf3 transmit AXE11000 6GHz; iperf 3.1.3: Ø1429 (1373-1511)
Minisforum AtomMan X7 Ti Intel Wi-Fi 7 BE200 320MHz; iperf3 transmit AXE11000 6GHz; iperf 3.1.3: Ø1562 (1198-1713)
Acemagic F2A Intel Wi-Fi 7 BE200 320MHz; iperf3 transmit AXE11000 6GHz; iperf 3.1.3: Ø1590 (767-1670)
Geekom GT13 Pro MediaTek Wi-Fi 6E MT7922 160MHz Wireless LAN Card; iperf3 receive AXE11000 6GHz; iperf 3.1.3: Ø1582 (1557-1611)
Minisforum AtomMan X7 Ti Intel Wi-Fi 7 BE200 320MHz; iperf3 receive AXE11000 6GHz; iperf 3.1.3: Ø1760 (1734-1774)
Acemagic F2A Intel Wi-Fi 7 BE200 320MHz; iperf3 receive AXE11000 6GHz; iperf 3.1.3: Ø1769 (1584-1790)
Geekom GT13 Pro MediaTek Wi-Fi 6E MT7922 160MHz Wireless LAN Card; iperf3 receive AXE11000; iperf 3.1.3: Ø1397 (1261-1453)
Minisforum AtomMan X7 Ti Intel Wi-Fi 7 BE200 320MHz; iperf3 receive AXE11000; iperf 3.1.3: Ø1572 (802-1683)
Acemagic F2A Intel Wi-Fi 7 BE200 320MHz; iperf3 receive AXE11000; iperf 3.1.3: Ø838 (728-926)
Geekom GT13 Pro MediaTek Wi-Fi 6E MT7922 160MHz Wireless LAN Card; iperf3 transmit AXE11000; iperf 3.1.3: Ø1146 (846-1308)
Minisforum AtomMan X7 Ti Intel Wi-Fi 7 BE200 320MHz; iperf3 transmit AXE11000; iperf 3.1.3: Ø1566 (904-1695)
Acemagic F2A Intel Wi-Fi 7 BE200 320MHz; iperf3 transmit AXE11000; iperf 3.1.3: Ø695 (369-977)

Akcesoria

Geekom GT13 Pro jest dostarczany ze 120-watowym zasilaczem. W pudełku znajdziemy również kabel HDMI oraz płytkę montażową VESA. Producent dołącza również niewielką instrukcję obsługi, w której opisano m.in. opcje połączeń oraz instalację pamięci RAM i dysku SSD. Geekom dostarcza produkt w niewielkim kartonowym pudełku. Ilość plastiku można by jeszcze zminimalizować, gdyż kabel HDMI i płytka montażowa VESA pakowane są osobno.

Zakres dostawy Geekom GT13 Pro

Konserwacja

Geekom GT13 Pro jest zawsze sprzedawany razem z pamięcią RAM i dyskiem SSD. Oznacza to, że urządzenie niekoniecznie musi być otwierane, aby zainstalować brakujące komponenty sprzętowe, jak ma to miejsce w przypadku wariantów barebone. Jeśli mimo to trzeba dostać się do wnętrza, można otworzyć Geekom GT13 Pro od spodu. Cztery śruby ukryte są pod przyklejonymi gumowymi nóżkami, które zabezpieczają plastikową pokrywę. W tym miejscu należy zachować ostrożność, aby nie uszkodzić kabla anteny WLAN. Pod plastikową pokrywą znajduje się kolejna metalowa płytka, którą również należy zdjąć, jeśli chcemy uzyskać dostęp do dysku SSD lub pamięci RAM. Można również wymienić moduł WLAN. Aby dostać się do układu chłodzenia, który producent reklamuje jako IceBlast 1.5, należy całkowicie wyjąć płytę z obudowy, co w praktyce nie stanowi większego wyzwania.

Geekom GT13 Pro zdemontowany
Geekom GT13 Pro z otwartym spodem
Pusta obudowa Geekom GT13 Pro
Płytka drukowana Geekom GT13 Pro
Płytka drukowana z jednostką chłodzącą Geekom GT13 Pro

Wydajność - procesor Intel Raptor Lake z maksymalnie 14 rdzeniami

Geekom GT13 Pro jest dostępny w dwóch wersjach. Topowy model z procesorem Intel Core i9-13900H wyposażony w 14 rdzeni zapewnia dobrą wydajność wielowątkową. Jeśli chcą Państwo nieco bardziej obciążyć swój portfel, można również kupić stylowy mini-PC z procesorem Intel Core i7-13620H. Dzięki 10 rdzeniom i 16 wątkom procesor ten powinien również dobrze radzić sobie z codziennym użytkowaniem. w zestawie zawsze znajduje się 32 GB pamięci RAM DDR4, co stanowi solidną podstawę do radzenia sobie z zadaniami wymagającymi dużej ilości pamięci.

CPU-Z
CPU-Z
CPU-Z
CPU-Z
CPU-Z
CPU-Z
GPU-Z
GPU-Z
HWiNFO
Narzędzie Intel Extreme Tuning Utility

Warunki testu

We wszystkich testach wydajności Geekom GT13 Pro używamy planu zasilania "maksymalna wydajność". Odchylenia od tego planu wystąpiły tylko w pomiarach zużycia energii i hałasu zgodnie z naszymi kryteriami testowymi Kryteria testowe. Limity mocy producenta dla Intel Core i9-13900H są zdefiniowane jako 64 waty (PL2) i 35 watów (PL1).

Procesor

Intel Core i9-13900H (Źródło: Geekom)

Najwyższej klasy Geekom GT13 Pro jest wyposażony w procesor Intel Core i9-13900H. W rankingu wydajności widzimy jednak, że nasza próbka testowa plasuje się dopiero w połowie stawki. Ze względu na niską wydajność chłodzenia, która idzie w parze z niezwykle kompaktową konstrukcją, SoC może pracować tylko z minimalnym TDP wynoszącym zaledwie 35 watów przy ciągłym obciążeniu. Ma to najpoważniejsze skutki w wielowątkowych testach porównawczych, w których Intel Core i9-13900H czasami zapewnia od 20 do 30 procent niższą wydajność niż ta, którą udokumentowaliśmy średnio dla tego procesora do tej pory.

W celu uzyskania dalszych porównań i testów porównawczych, proszę odnieść się do naszej Tabela porównawcza procesorów.

Cinebench R15
Cinebench R15
Cinebench R20
Cinebench R20
Cinebench R23
Cinebench R23
Cinebench 2024
Cinebench 2024
Performance Rating - Percent
Geekom A8
AMD Ryzen 9 8945HS
57.7 pt
Minisforum EliteMini UM780 XTX
AMD Ryzen 7 7840HS
57.1 pt
Minisforum AtomMan X7 Ti
Intel Core Ultra 9 185H
56.7 pt
Aoostar GEM12
AMD Ryzen 7 8845HS
56.5 pt
Average Intel Core i9-13900H
 
55.9 pt
Acemagic F2A
Intel Core Ultra 7 155H
55.4 pt
Geekom GT13 Pro
Intel Core i9-13900H
53.5 pt
Geekom XT12 Pro
Intel Core i9-12900H
51.7 pt
Khadas Mind
Intel Core i7-1360P
51.6 pt
Cinebench 2024
CPU Multi Core
Minisforum AtomMan X7 Ti
Intel Core Ultra 9 185H
1067 Points +52%
Acemagic F2A
Intel Core Ultra 7 155H
1022 Points +45%
Geekom A8
AMD Ryzen 9 8945HS
967 Points +38%
Minisforum EliteMini UM780 XTX
AMD Ryzen 7 7840HS
956 Points +36%
Aoostar GEM12
AMD Ryzen 7 8845HS
933 Points +33%
Average Intel Core i9-13900H
  (703 - 818, n=2)
761 Points +8%
Geekom GT13 Pro
Intel Core i9-13900H
703 Points
Geekom XT12 Pro
Intel Core i9-12900H
578 Points -18%
Khadas Mind
Intel Core i7-1360P
560 Points -20%
CPU Single Core
Khadas Mind
Intel Core i7-1360P
113 Points +9%
Minisforum AtomMan X7 Ti
Intel Core Ultra 9 185H
110 Points +6%
Geekom XT12 Pro
Intel Core i9-12900H
108 Points +4%
Geekom A8
AMD Ryzen 9 8945HS
108 Points +4%
Aoostar GEM12
AMD Ryzen 7 8845HS
107 Points +3%
Minisforum EliteMini UM780 XTX
AMD Ryzen 7 7840HS
106 Points +2%
Acemagic F2A
Intel Core Ultra 7 155H
106 Points +2%
Geekom GT13 Pro
Intel Core i9-13900H
104 Points
Average Intel Core i9-13900H
  (101 - 104, n=2)
102.5 Points -1%
Cinebench R23
Multi Core
Acemagic F2A
Intel Core Ultra 7 155H
18497 Points +42%
Minisforum AtomMan X7 Ti
Intel Core Ultra 9 185H
18016 Points +38%
Average Intel Core i9-13900H
  (13015 - 20385, n=27)
16992 Points +31%
Geekom A8
AMD Ryzen 9 8945HS
16795 Points +29%
Minisforum EliteMini UM780 XTX
AMD Ryzen 7 7840HS
16706 Points +28%
Aoostar GEM12
AMD Ryzen 7 8845HS
16130 Points +24%
Geekom GT13 Pro
Intel Core i9-13900H
13015 Points
Geekom XT12 Pro
Intel Core i9-12900H
11036 Points -15%
Khadas Mind
Intel Core i7-1360P
9859 Points -24%
Single Core
Average Intel Core i9-13900H
  (1297 - 2054, n=25)
1894 Points +10%
Khadas Mind
Intel Core i7-1360P
1877 Points +9%
Minisforum AtomMan X7 Ti
Intel Core Ultra 9 185H
1851 Points +8%
Geekom A8
AMD Ryzen 9 8945HS
1825 Points +6%
Geekom XT12 Pro
Intel Core i9-12900H
1824 Points +6%
Aoostar GEM12
AMD Ryzen 7 8845HS
1783 Points +4%
Minisforum EliteMini UM780 XTX
AMD Ryzen 7 7840HS
1779 Points +4%
Acemagic F2A
Intel Core Ultra 7 155H
1771 Points +3%
Geekom GT13 Pro
Intel Core i9-13900H
1715 Points
Cinebench R15
CPU Single 64Bit
Geekom A8
AMD Ryzen 9 8945HS
287 Points +17%
Minisforum EliteMini UM780 XTX
AMD Ryzen 7 7840HS
279 Points +14%
Aoostar GEM12
AMD Ryzen 7 8845HS
279 Points +14%
Khadas Mind
Intel Core i7-1360P
270 Points +10%
Average Intel Core i9-13900H
  (211 - 297, n=25)
270 Points +10%
Minisforum AtomMan X7 Ti
Intel Core Ultra 9 185H
268 Points +9%
Acemagic F2A
Intel Core Ultra 7 155H
258 Points +5%
Geekom XT12 Pro
Intel Core i9-12900H
251 Points +2%
Geekom GT13 Pro
Intel Core i9-13900H
245 Points
CPU Multi 64Bit
Minisforum AtomMan X7 Ti
Intel Core Ultra 9 185H
2746 Points +22%
Acemagic F2A
Intel Core Ultra 7 155H
2738 Points +21%
Average Intel Core i9-13900H
  (2061 - 3100, n=25)
2685 Points +19%
Geekom A8
AMD Ryzen 9 8945HS
2640 Points +17%
Minisforum EliteMini UM780 XTX
AMD Ryzen 7 7840HS
2608 Points +15%
Aoostar GEM12
AMD Ryzen 7 8845HS
2537 Points +12%
Geekom GT13 Pro
Intel Core i9-13900H
2260 Points
Geekom XT12 Pro
Intel Core i9-12900H
2121 Points -6%
Khadas Mind
Intel Core i7-1360P
1642 Points -27%
Cinebench R20
CPU (Single Core)
Khadas Mind
Intel Core i7-1360P
724 Points +10%
Average Intel Core i9-13900H
  (428 - 792, n=24)
723 Points +10%
Minisforum AtomMan X7 Ti
Intel Core Ultra 9 185H
715 Points +8%
Geekom A8
AMD Ryzen 9 8945HS
711 Points +8%
Geekom XT12 Pro
Intel Core i9-12900H
701 Points +6%
Aoostar GEM12
AMD Ryzen 7 8845HS
691 Points +5%
Minisforum EliteMini UM780 XTX
AMD Ryzen 7 7840HS
690 Points +5%
Acemagic F2A
Intel Core Ultra 7 155H
679 Points +3%
Geekom GT13 Pro
Intel Core i9-13900H
659 Points
CPU (Multi Core)
Minisforum AtomMan X7 Ti
Intel Core Ultra 9 185H
7196 Points +44%
Acemagic F2A
Intel Core Ultra 7 155H
7188 Points +43%
Average Intel Core i9-13900H
  (4960 - 7716, n=24)
6599 Points +32%
Geekom A8
AMD Ryzen 9 8945HS
6591 Points +31%
Minisforum EliteMini UM780 XTX
AMD Ryzen 7 7840HS
6509 Points +30%
Aoostar GEM12
AMD Ryzen 7 8845HS
6346 Points +27%
Geekom GT13 Pro
Intel Core i9-13900H
5013 Points
Geekom XT12 Pro
Intel Core i9-12900H
4294 Points -14%
Khadas Mind
Intel Core i7-1360P
3820 Points -24%
Cinebench R11.5
CPU Single 64Bit
Geekom A8
AMD Ryzen 9 8945HS
3.45 Points +16%
Minisforum EliteMini UM780 XTX
AMD Ryzen 7 7840HS
3.33 Points +12%
Aoostar GEM12
AMD Ryzen 7 8845HS
3.32 Points +11%
Khadas Mind
Intel Core i7-1360P
3.27 Points +10%
Minisforum AtomMan X7 Ti
Intel Core Ultra 9 185H
3.27 Points +10%
Acemagic F2A
Intel Core Ultra 7 155H
3.13 Points +5%
Geekom XT12 Pro
Intel Core i9-12900H
2.99 Points 0%
Average Intel Core i9-13900H
  (2.98 - 3, n=2)
2.99 Points 0%
Geekom GT13 Pro
Intel Core i9-13900H
2.98 Points
CPU Multi 64Bit
Minisforum AtomMan X7 Ti
Intel Core Ultra 9 185H
33.95 Points +24%
Acemagic F2A
Intel Core Ultra 7 155H
33.49 Points +22%
Geekom A8
AMD Ryzen 9 8945HS
31.31 Points +14%
Minisforum EliteMini UM780 XTX
AMD Ryzen 7 7840HS
30.25 Points +10%
Aoostar GEM12
AMD Ryzen 7 8845HS
29.76 Points +8%
Average Intel Core i9-13900H
  (27.5 - 29.7, n=2)
28.6 Points +4%
Geekom GT13 Pro
Intel Core i9-13900H
27.48 Points
Geekom XT12 Pro
Intel Core i9-12900H
21.11 Points -23%
Khadas Mind
Intel Core i7-1360P
19.54 Points -29%
Cinebench R10
Rendering Single CPUs 64Bit
Khadas Mind
Intel Core i7-1360P
15227 Points +10%
Geekom A8
AMD Ryzen 9 8945HS
14561 Points +5%
Minisforum AtomMan X7 Ti
Intel Core Ultra 9 185H
14374 Points +4%
Minisforum EliteMini UM780 XTX
AMD Ryzen 7 7840HS
14177 Points +3%
Aoostar GEM12
AMD Ryzen 7 8845HS
14163 Points +2%
Acemagic F2A
Intel Core Ultra 7 155H
13938 Points +1%
Geekom GT13 Pro
Intel Core i9-13900H
13820 Points
Average Intel Core i9-13900H
  (13752 - 13820, n=2)
13786 Points 0%
Geekom XT12 Pro
Intel Core i9-12900H
13378 Points -3%
Rendering Multiple CPUs 64Bit
Acemagic F2A
Intel Core Ultra 7 155H
95005 Points +20%
Geekom A8
AMD Ryzen 9 8945HS
90144 Points +14%
Minisforum AtomMan X7 Ti
Intel Core Ultra 9 185H
88902 Points +13%
Minisforum EliteMini UM780 XTX
AMD Ryzen 7 7840HS
87064 Points +10%
Aoostar GEM12
AMD Ryzen 7 8845HS
85872 Points +9%
Average Intel Core i9-13900H
  (79014 - 79856, n=2)
79435 Points +1%
Geekom GT13 Pro
Intel Core i9-13900H
79014 Points
Geekom XT12 Pro
Intel Core i9-12900H
69621 Points -12%
Khadas Mind
Intel Core i7-1360P
61639 Points -22%
Blender - v2.79 BMW27 CPU
Khadas Mind
Intel Core i7-1360P
324 Seconds * -24%
Geekom XT12 Pro
Intel Core i9-12900H
296 Seconds * -13%
Geekom GT13 Pro
Intel Core i9-13900H
262 Seconds *
Average Intel Core i9-13900H
  (166 - 268, n=23)
203 Seconds * +23%
Aoostar GEM12
AMD Ryzen 7 8845HS
197 Seconds * +25%
Geekom A8
AMD Ryzen 9 8945HS
196 Seconds * +25%
Minisforum EliteMini UM780 XTX
AMD Ryzen 7 7840HS
192 Seconds * +27%
Acemagic F2A
Intel Core Ultra 7 155H
178 Seconds * +32%
Minisforum AtomMan X7 Ti
Intel Core Ultra 9 185H
171 Seconds * +35%
wPrime 2.10
32m
Khadas Mind
Intel Core i7-1360P
4.957 s * -41%
Geekom XT12 Pro
Intel Core i9-12900H
4.111 s * -17%
Acemagic F2A
Intel Core Ultra 7 155H
3.523 s * -0%
Geekom GT13 Pro
Intel Core i9-13900H
3.518 s *
Average Intel Core i9-13900H
  (3.14 - 3.52, n=2)
3.33 s * +5%
Minisforum AtomMan X7 Ti
Intel Core Ultra 9 185H
3.254 s * +8%
Aoostar GEM12
AMD Ryzen 7 8845HS
2.703 s * +23%
Minisforum EliteMini UM780 XTX
AMD Ryzen 7 7840HS
2.626 s * +25%
Geekom A8
AMD Ryzen 9 8945HS
2.563 s * +27%
1024m
Minisforum AtomMan X7 Ti
Intel Core Ultra 9 185H
441.275 s * -7%
Geekom GT13 Pro
Intel Core i9-13900H
412.775 s *
Average Intel Core i9-13900H
  (179.5 - 413, n=2)
296 s * +28%
Khadas Mind
Intel Core i7-1360P
240.083 s * +42%
Geekom XT12 Pro
Intel Core i9-12900H
202.68 s * +51%
Acemagic F2A
Intel Core Ultra 7 155H
139.617 s * +66%
Aoostar GEM12
AMD Ryzen 7 8845HS
98.896 s * +76%
Minisforum EliteMini UM780 XTX
AMD Ryzen 7 7840HS
72.819 s * +82%
Geekom A8
AMD Ryzen 9 8945HS
67.933 s * +84%
X264 HD Benchmark 4.0
Pass 1
Minisforum AtomMan X7 Ti
Intel Core Ultra 9 185H
335.5 (329min - 340max) fps +12%
Acemagic F2A
Intel Core Ultra 7 155H
325 (323min - 328max) fps +8%
Geekom GT13 Pro
Intel Core i9-13900H
300.5 (288min - 319max) fps
Minisforum EliteMini UM780 XTX
AMD Ryzen 7 7840HS
298 (288min - 300max) fps -1%
Geekom A8
AMD Ryzen 9 8945HS
298 (297min - 305max) fps -1%
Average Intel Core i9-13900H
  (284 - 301, n=2)
292 fps -3%
Aoostar GEM12
AMD Ryzen 7 8845HS
289 (286min - 292max) fps -4%
Khadas Mind
Intel Core i7-1360P
273 (264min - 275max) fps -9%
Geekom XT12 Pro
Intel Core i9-12900H
262 (259min - 282max) fps -13%
Pass 2
Minisforum AtomMan X7 Ti
Intel Core Ultra 9 185H
158.2 (157.4min - 158.8max) fps +39%
Acemagic F2A
Intel Core Ultra 7 155H
154.15 (153.8min - 154.3max) fps +35%
Geekom A8
AMD Ryzen 9 8945HS
150.65 (150.4min - 154.2max) fps +32%
Minisforum EliteMini UM780 XTX
AMD Ryzen 7 7840HS
149.3 (148.8min - 149.8max) fps +31%
Aoostar GEM12
AMD Ryzen 7 8845HS
143.7 (143min - 145.2max) fps +26%
Average Intel Core i9-13900H
  (114 - 138.6, n=2)
126.3 fps +11%
Geekom GT13 Pro
Intel Core i9-13900H
113.95 (106.5min - 136.6max) fps
Khadas Mind
Intel Core i7-1360P
94.7 (87.4min - 101.7max) fps -17%
Geekom XT12 Pro
Intel Core i9-12900H
92.2 (91min - 114.5max) fps -19%
WinRAR - Result
Average Intel Core i9-13900H
  (6800 - 9303, n=2)
8052 KB/s +18%
Geekom XT12 Pro
Intel Core i9-12900H
7945 KB/s +17%
Minisforum AtomMan X7 Ti
Intel Core Ultra 9 185H
7940 KB/s +17%
Geekom A8
AMD Ryzen 9 8945HS
7843 KB/s +15%
Acemagic F2A
Intel Core Ultra 7 155H
7723 KB/s +14%
Minisforum EliteMini UM780 XTX
AMD Ryzen 7 7840HS
7699 KB/s +13%
Aoostar GEM12
AMD Ryzen 7 8845HS
7327 KB/s +8%
Geekom GT13 Pro
Intel Core i9-13900H
6800 KB/s
Khadas Mind
Intel Core i7-1360P
6079 KB/s -11%
TrueCrypt
AES Mean 100MB
Geekom A8
AMD Ryzen 9 8945HS
15.4 GB/s +17%
Minisforum EliteMini UM780 XTX
AMD Ryzen 7 7840HS
14.9 GB/s +13%
Aoostar GEM12
AMD Ryzen 7 8845HS
14.4 GB/s +9%
Average Intel Core i9-13900H
  (13.2 - 14.8, n=2)
14 GB/s +6%
Geekom GT13 Pro
Intel Core i9-13900H
13.2 GB/s
Minisforum AtomMan X7 Ti
Intel Core Ultra 9 185H
11.3 GB/s -14%
Geekom XT12 Pro
Intel Core i9-12900H
11.2 GB/s -15%
Acemagic F2A
Intel Core Ultra 7 155H
10.6 GB/s -20%
Khadas Mind
Intel Core i7-1360P
9.5 GB/s -28%
Twofish Mean 100MB
Average Intel Core i9-13900H
  (2.4 - 2.5, n=2)
2.45 GB/s +2%
Geekom GT13 Pro
Intel Core i9-13900H
2.4 GB/s
Minisforum EliteMini UM780 XTX
AMD Ryzen 7 7840HS
2.1 GB/s -12%
Geekom A8
AMD Ryzen 9 8945HS
2 GB/s -17%
Aoostar GEM12
AMD Ryzen 7 8845HS
2 GB/s -17%
Geekom XT12 Pro
Intel Core i9-12900H
1.9 GB/s -21%
Minisforum AtomMan X7 Ti
Intel Core Ultra 9 185H
1.8 GB/s -25%
Khadas Mind
Intel Core i7-1360P
1.7 GB/s -29%
Acemagic F2A
Intel Core Ultra 7 155H
1.7 GB/s -29%
Serpent Mean 100MB
Geekom A8
AMD Ryzen 9 8945HS
1.4 GB/s +17%
Minisforum EliteMini UM780 XTX
AMD Ryzen 7 7840HS
1.3 GB/s +8%
Aoostar GEM12
AMD Ryzen 7 8845HS
1.3 GB/s +8%
Average Intel Core i9-13900H
  (1.2 - 1.4, n=2)
1.3 GB/s +8%
Geekom GT13 Pro
Intel Core i9-13900H
1.2 GB/s
Geekom XT12 Pro
Intel Core i9-12900H
1.1 GB/s -8%
Minisforum AtomMan X7 Ti
Intel Core Ultra 9 185H
1.1 GB/s -8%
Acemagic F2A
Intel Core Ultra 7 155H
1 GB/s -17%
Khadas Mind
Intel Core i7-1360P
0.935 GB/s -22%
Geekbench 5.5
Multi-Core
Minisforum AtomMan X7 Ti
Intel Core Ultra 9 185H
13392 Points +19%
Average Intel Core i9-13900H
  (9094 - 15410, n=25)
12693 Points +12%
Acemagic F2A
Intel Core Ultra 7 155H
12662 Points +12%
Geekom A8
AMD Ryzen 9 8945HS
12481 Points +11%
Minisforum EliteMini UM780 XTX
AMD Ryzen 7 7840HS
12177 Points +8%
Aoostar GEM12
AMD Ryzen 7 8845HS
12143 Points +8%
Geekom GT13 Pro
Intel Core i9-13900H
11283 Points
Geekom XT12 Pro
Intel Core i9-12900H
10028 Points -11%
Khadas Mind
Intel Core i7-1360P
9159 Points -19%
Single-Core
Geekom A8
AMD Ryzen 9 8945HS
1996 Points +8%
Aoostar GEM12
AMD Ryzen 7 8845HS
1958 Points +6%
Minisforum EliteMini UM780 XTX
AMD Ryzen 7 7840HS
1943 Points +6%
Average Intel Core i9-13900H
  (1140 - 2043, n=25)
1903 Points +3%
Minisforum AtomMan X7 Ti
Intel Core Ultra 9 185H
1856 Points +1%
Geekom GT13 Pro
Intel Core i9-13900H
1841 Points
Khadas Mind
Intel Core i7-1360P
1824 Points -1%
Geekom XT12 Pro
Intel Core i9-12900H
1790 Points -3%
Acemagic F2A
Intel Core Ultra 7 155H
1746 Points -5%
Geekbench 5.0
5.0 Multi-Core
Minisforum AtomMan X7 Ti
Intel Core Ultra 9 185H
13228 Points +18%
Average Intel Core i9-13900H
  (11168 - 14172, n=7)
12512 Points +12%
Acemagic F2A
Intel Core Ultra 7 155H
12438 Points +11%
Geekom A8
AMD Ryzen 9 8945HS
12386 Points +11%
Aoostar GEM12
AMD Ryzen 7 8845HS
12086 Points +8%
Minisforum EliteMini UM780 XTX
AMD Ryzen 7 7840HS
11933 Points +7%
Geekom GT13 Pro
Intel Core i9-13900H
11168 Points
Geekom XT12 Pro
Intel Core i9-12900H
9892 Points -11%
Khadas Mind
Intel Core i7-1360P
9000 Points -19%
5.0 Single-Core
Geekom A8
AMD Ryzen 9 8945HS
1906 Points +5%
Minisforum EliteMini UM780 XTX
AMD Ryzen 7 7840HS
1900 Points +5%
Aoostar GEM12
AMD Ryzen 7 8845HS
1900 Points +5%
Khadas Mind
Intel Core i7-1360P
1826 Points +1%
Minisforum AtomMan X7 Ti
Intel Core Ultra 9 185H
1821 Points +1%
Average Intel Core i9-13900H
  (1654 - 1958, n=7)
1819 Points 0%
Geekom GT13 Pro
Intel Core i9-13900H
1810 Points
Geekom XT12 Pro
Intel Core i9-12900H
1710 Points -6%
Acemagic F2A
Intel Core Ultra 7 155H
1708 Points -6%
Geekbench 4.4
64 Bit Single-Core Score
Geekom A8
AMD Ryzen 9 8945HS
8178 Points +5%
Khadas Mind
Intel Core i7-1360P
8084 Points +4%
Minisforum EliteMini UM780 XTX
AMD Ryzen 7 7840HS
8048 Points +3%
Aoostar GEM12
AMD Ryzen 7 8845HS
8034 Points +3%
Average Intel Core i9-13900H
  (7253 - 8498, n=8)
8025 Points +3%
Geekom GT13 Pro
Intel Core i9-13900H
7787 Points
Geekom XT12 Pro
Intel Core i9-12900H
7635 Points -2%
Minisforum AtomMan X7 Ti
Intel Core Ultra 9 185H
7602 Points -2%
Acemagic F2A
Intel Core Ultra 7 155H
6927 Points -11%
64 Bit Multi-Core Score
Geekom A8
AMD Ryzen 9 8945HS
49269 Points +18%
Minisforum EliteMini UM780 XTX
AMD Ryzen 7 7840HS
48743 Points +16%
Minisforum AtomMan X7 Ti
Intel Core Ultra 9 185H
47960 Points +15%
Aoostar GEM12
AMD Ryzen 7 8845HS
47777 Points +14%
Average Intel Core i9-13900H
  (41851 - 54848, n=8)
47697 Points +14%
Acemagic F2A
Intel Core Ultra 7 155H
45250 Points +8%
Geekom GT13 Pro
Intel Core i9-13900H
41851 Points
Geekom XT12 Pro
Intel Core i9-12900H
37359 Points -11%
Khadas Mind
Intel Core i7-1360P
33052 Points -21%
3DMark 11 - 1280x720 Performance Physics
Geekom A8
AMD Ryzen 9 8945HS
22978 Points +25%
Minisforum EliteMini UM780 XTX
AMD Ryzen 7 7840HS
22960 Points +25%
Average Intel Core i9-13900H
  (15540 - 25420, n=26)
21972 Points +20%
Minisforum AtomMan X7 Ti
Intel Core Ultra 9 185H
21875 Points +19%
Aoostar GEM12
AMD Ryzen 7 8845HS
21762 Points +18%
Acemagic F2A
Intel Core Ultra 7 155H
20846 Points +13%
Geekom GT13 Pro
Intel Core i9-13900H
18383 Points
Geekom XT12 Pro
Intel Core i9-12900H
16634 Points -10%
Khadas Mind
Intel Core i7-1360P
15245 Points -17%
7-Zip 18.03
7z b 4
Minisforum EliteMini UM780 XTX
AMD Ryzen 7 7840HS
72684 MIPS +39%
Minisforum AtomMan X7 Ti
Intel Core Ultra 9 185H
71934 MIPS +37%
Geekom A8
AMD Ryzen 9 8945HS
71874 MIPS +37%
Aoostar GEM12
AMD Ryzen 7 8845HS
70733 MIPS +35%
Average Intel Core i9-13900H
  (45045 - 79032, n=24)
66867 MIPS +27%
Acemagic F2A
Intel Core Ultra 7 155H
66438 MIPS +27%
Geekom GT13 Pro
Intel Core i9-13900H
52479 MIPS
Geekom XT12 Pro
Intel Core i9-12900H
47146 MIPS -10%
Khadas Mind
Intel Core i7-1360P
43201 MIPS -18%
7z b 4 -mmt1
Geekom A8
AMD Ryzen 9 8945HS
6668 MIPS +5%
Aoostar GEM12
AMD Ryzen 7 8845HS
6644 MIPS +5%
Minisforum EliteMini UM780 XTX
AMD Ryzen 7 7840HS
6563 MIPS +4%
Geekom GT13 Pro
Intel Core i9-13900H
6321 MIPS
Average Intel Core i9-13900H
  (3665 - 6600, n=24)
6064 MIPS -4%
Khadas Mind
Intel Core i7-1360P
5904 MIPS -7%
Geekom XT12 Pro
Intel Core i9-12900H
5881 MIPS -7%
Minisforum AtomMan X7 Ti
Intel Core Ultra 9 185H
5560 MIPS -12%
Acemagic F2A
Intel Core Ultra 7 155H
5485 MIPS -13%
HWBOT x265 Benchmark v2.2 - 4k Preset
Minisforum EliteMini UM780 XTX
AMD Ryzen 7 7840HS
20.9 fps +48%
Minisforum AtomMan X7 Ti
Intel Core Ultra 9 185H
20.9 fps +48%
Geekom A8
AMD Ryzen 9 8945HS
20.9 fps +48%
Aoostar GEM12
AMD Ryzen 7 8845HS
20.5 fps +45%
Acemagic F2A
Intel Core Ultra 7 155H
19.6 fps +39%
Average Intel Core i9-13900H
  (14.1 - 22.3, n=24)
18.7 fps +33%
Geekom GT13 Pro
Intel Core i9-13900H
14.1 fps
Geekom XT12 Pro
Intel Core i9-12900H
12.3 fps -13%
Khadas Mind
Intel Core i7-1360P
11.4 fps -19%
R Benchmark 2.5 - Overall mean
Acemagic F2A
Intel Core Ultra 7 155H
0.4652 sec * -6%
Geekom XT12 Pro
Intel Core i9-12900H
0.4632 sec * -5%
Minisforum AtomMan X7 Ti
Intel Core Ultra 9 185H
0.4627 sec * -5%
Average Intel Core i9-13900H
  (0.4052 - 0.723, n=24)
0.4484 sec * -2%
Khadas Mind
Intel Core i7-1360P
0.4463 sec * -2%
Geekom GT13 Pro
Intel Core i9-13900H
0.4395 sec *
Aoostar GEM12
AMD Ryzen 7 8845HS
0.4392 sec * -0%
Minisforum EliteMini UM780 XTX
AMD Ryzen 7 7840HS
0.4354 sec * +1%
Geekom A8
AMD Ryzen 9 8945HS
0.4346 sec * +1%
LibreOffice - 20 Documents To PDF
Minisforum EliteMini UM780 XTX
AMD Ryzen 7 7840HS
53.9 s * -37%
Geekom A8
AMD Ryzen 9 8945HS
49.9 s * -27%
Minisforum AtomMan X7 Ti
Intel Core Ultra 9 185H
49.5 s * -26%
Average Intel Core i9-13900H
  (34.4 - 82.8, n=24)
47.6 s * -21%
Aoostar GEM12
AMD Ryzen 7 8845HS
47.5 s * -21%
Acemagic F2A
Intel Core Ultra 7 155H
44.5 s * -13%
Khadas Mind
Intel Core i7-1360P
40.9 s * -4%
Geekom XT12 Pro
Intel Core i9-12900H
39.6 s * -1%
Geekom GT13 Pro
Intel Core i9-13900H
39.4 s *
WebXPRT 3 - Overall
Minisforum EliteMini UM780 XTX
AMD Ryzen 7 7840HS
324 Points +7%
Khadas Mind
Intel Core i7-1360P
316 Points +4%
Geekom A8
AMD Ryzen 9 8945HS
316 Points +4%
Geekom GT13 Pro
Intel Core i9-13900H
304 Points
Average Intel Core i9-13900H
  (171.4 - 340, n=19)
303 Points 0%
Aoostar GEM12
AMD Ryzen 7 8845HS
300 Points -1%
Geekom XT12 Pro
Intel Core i9-12900H
291 Points -4%
Acemagic F2A
Intel Core Ultra 7 155H
276 Points -9%
Minisforum AtomMan X7 Ti
Intel Core Ultra 9 185H
264 Points -13%
Mozilla Kraken 1.1 - Total
Acemagic F2A
Intel Core Ultra 7 155H
535 ms * -3%
Minisforum AtomMan X7 Ti
Intel Core Ultra 9 185H
532 ms * -3%
Minisforum EliteMini UM780 XTX
AMD Ryzen 7 7840HS
517 ms * -0%
Aoostar GEM12
AMD Ryzen 7 8845HS
517 ms * -0%
Geekom GT13 Pro
Intel Core i9-13900H
517 ms *
Geekom XT12 Pro
Intel Core i9-12900H
511 ms * +1%
Geekom A8
AMD Ryzen 9 8945HS
505 ms * +2%
Average Intel Core i9-13900H
  (456 - 828, n=23)
505 ms * +2%
Khadas Mind
Intel Core i7-1360P
502 ms * +3%
3DMark
1920x1080 Fire Strike Physics
Minisforum EliteMini UM780 XTX
AMD Ryzen 7 7840HS
28906 Points +22%
Geekom A8
AMD Ryzen 9 8945HS
27732 Points +17%
Average Intel Core i9-13900H
  (17733 - 32664, n=28)
26770 Points +13%
Aoostar GEM12
AMD Ryzen 7 8845HS
26194 Points +11%
Minisforum AtomMan X7 Ti
Intel Core Ultra 9 185H
26038 Points +10%
Acemagic F2A
Intel Core Ultra 7 155H
25043 Points +6%
Geekom GT13 Pro
Intel Core i9-13900H
23626 Points
Geekom XT12 Pro
Intel Core i9-12900H
22242 Points -6%
Khadas Mind
Intel Core i7-1360P
18564 Points -21%
2560x1440 Time Spy CPU
Average Intel Core i9-13900H
  (7863 - 13726, n=26)
11616 Points +24%
Minisforum AtomMan X7 Ti
Intel Core Ultra 9 185H
11481 Points +23%
Geekom A8
AMD Ryzen 9 8945HS
11298 Points +21%
Minisforum EliteMini UM780 XTX
AMD Ryzen 7 7840HS
11159 Points +19%
Aoostar GEM12
AMD Ryzen 7 8845HS
10824 Points +16%
Acemagic F2A
Intel Core Ultra 7 155H
10014 Points +7%
Geekom GT13 Pro
Intel Core i9-13900H
9347 Points
Geekom XT12 Pro
Intel Core i9-12900H
7985 Points -15%
Khadas Mind
Intel Core i7-1360P
7942 Points -15%
Super Pi mod 1.5 XS 1M - 1M
Minisforum EliteMini UM780 XTX
AMD Ryzen 7 7840HS
8.774 s * -18%
Geekom XT12 Pro
Intel Core i9-12900H
7.454 s * -0%
Geekom GT13 Pro
Intel Core i9-13900H
7.445 s *
Aoostar GEM12
AMD Ryzen 7 8845HS
7.331 s * +2%
Acemagic F2A
Intel Core Ultra 7 155H
7.168 s * +4%
Geekom A8
AMD Ryzen 9 8945HS
7.045 s * +5%
Average Intel Core i9-13900H
  (6.16 - 7.45, n=2)
6.8 s * +9%
Khadas Mind
Intel Core i7-1360P
6.784 s * +9%
Minisforum AtomMan X7 Ti
Intel Core Ultra 9 185H
6.751 s * +9%
Super Pi mod 1.5 XS 2M - 2M
Minisforum EliteMini UM780 XTX
AMD Ryzen 7 7840HS
21.271 s * -31%
Aoostar GEM12
AMD Ryzen 7 8845HS
18.138 s * -12%
Geekom A8
AMD Ryzen 9 8945HS
17.549 s * -8%
Geekom XT12 Pro
Intel Core i9-12900H
16.424 s * -1%
Geekom GT13 Pro
Intel Core i9-13900H
16.234 s *
Acemagic F2A
Intel Core Ultra 7 155H
16.125 s * +1%
Average Intel Core i9-13900H
  (13.8 - 16.2, n=2)
15 s * +8%
Minisforum AtomMan X7 Ti
Intel Core Ultra 9 185H
14.879 s * +8%
Khadas Mind
Intel Core i7-1360P
14.771 s * +9%
Super Pi Mod 1.5 XS 32M - 32M
Minisforum EliteMini UM780 XTX
AMD Ryzen 7 7840HS
724.411 s * -74%
Aoostar GEM12
AMD Ryzen 7 8845HS
665.289 s * -60%
Geekom A8
AMD Ryzen 9 8945HS
624.748 s * -50%
Geekom GT13 Pro
Intel Core i9-13900H
417.103 s *
Geekom XT12 Pro
Intel Core i9-12900H
396.475 s * +5%
Acemagic F2A
Intel Core Ultra 7 155H
394.754 s * +5%
Khadas Mind
Intel Core i7-1360P
384.074 s * +8%
Average Intel Core i9-13900H
  (350 - 417, n=2)
384 s * +8%
Minisforum AtomMan X7 Ti
Intel Core Ultra 9 185H
304.446 s * +27%

* ... im mniej tym lepiej

Cinebench R10 Rendering Single 32Bit
9550
Cinebench R10 Shading 64Bit
15509 Points
Cinebench R10 Rendering Multiple CPUs 64Bit
79014 Points
Cinebench R10 Rendering Single CPUs 64Bit
13820 Points
Cinebench R10 Shading 32Bit
14766
Cinebench R10 Rendering Multiple CPUs 32Bit
53438
Cinebench R11.5 CPU Multi 32Bit
24.38 Points
Cinebench R11.5 OpenGL 32Bit
96.79 fps
Cinebench R11.5 CPU Single 64Bit
2.98 Points
Cinebench R11.5 CPU Multi 64Bit
27.48 Points
Cinebench R11.5 OpenGL 64Bit
98.43 fps
Cinebench R11.5 CPU Single 32Bit
2.66 Points
Cinebench R15 CPU Single 64Bit
245 Points
Cinebench R15 Ref. Match 64Bit
97.8 %
Cinebench R15 OpenGL 64Bit
103.95 fps
Cinebench R15 CPU Multi 64Bit
2260 Points
Pomoc
Performance Rating
Minisforum EliteMini UM780 XTX
AMD Ryzen 7 7840HS, Radeon 780M
98 pt
Minisforum Venus Series UM790 Pro
AMD Ryzen 9 7940HS, Radeon 780M
92.2 pt
ACEMagician Ace Magician AM08 Pro
AMD Ryzen 9 6900HX, Radeon 680M
68.8 pt
Geekom AS 6, R9 6900HX
AMD Ryzen 9 6900HX, Radeon 680M
68.6 pt
Geekom GT13 Pro
Intel Core i9-13900H, Iris Xe G7 96EUs
56.6 pt
Intel NUC 13 Pro Desk Edition Kit
Intel Core i7-1360P, Iris Xe G7 96EUs
51.9 pt
Khadas Mind
Intel Core i7-1360P, Iris Xe G7 96EUs
49.6 pt
Average of class Mini PC
 
49 pt
Geekom Mini IT12
Intel Core i7-1260P, Iris Xe G7 96EUs
42.3 pt
AIDA64 / FP32 Ray-Trace
Minisforum EliteMini UM780 XTX
AMD Ryzen 7 7840HS, Radeon 780M
26889 KRay/s +129%
Minisforum Venus Series UM790 Pro
AMD Ryzen 9 7940HS, Radeon 780M
26146 KRay/s +123%
Geekom AS 6, R9 6900HX
AMD Ryzen 9 6900HX, Radeon 680M
14418 KRay/s +23%
ACEMagician Ace Magician AM08 Pro
AMD Ryzen 9 6900HX, Radeon 680M
14406 KRay/s +23%
Geekom GT13 Pro
Intel Core i9-13900H, Iris Xe G7 96EUs
11735 KRay/s
Intel NUC 13 Pro Desk Edition Kit
Intel Core i7-1360P, Iris Xe G7 96EUs
11188 KRay/s -5%
Average of class Mini PC
  (561 - 27538, n=110, last 2 years)
10577 KRay/s -10%
Khadas Mind
Intel Core i7-1360P, Iris Xe G7 96EUs
9567 KRay/s -18%
Geekom Mini IT12
Intel Core i7-1260P, Iris Xe G7 96EUs
7933 KRay/s -32%
AIDA64 / FPU Julia
Minisforum Venus Series UM790 Pro
AMD Ryzen 9 7940HS, Radeon 780M
116269 Points +97%
Minisforum EliteMini UM780 XTX
AMD Ryzen 7 7840HS, Radeon 780M
113684 Points +92%
ACEMagician Ace Magician AM08 Pro
AMD Ryzen 9 6900HX, Radeon 680M
91475 Points +55%
Geekom AS 6, R9 6900HX
AMD Ryzen 9 6900HX, Radeon 680M
89540 Points +52%
Geekom GT13 Pro
Intel Core i9-13900H, Iris Xe G7 96EUs
59094 Points
Intel NUC 13 Pro Desk Edition Kit
Intel Core i7-1360P, Iris Xe G7 96EUs
56942 Points -4%
Average of class Mini PC
  (3604 - 116903, n=110, last 2 years)
54977 Points -7%
Khadas Mind
Intel Core i7-1360P, Iris Xe G7 96EUs
47763 Points -19%
Geekom Mini IT12
Intel Core i7-1260P, Iris Xe G7 96EUs
40251 Points -32%
AIDA64 / CPU SHA3
Minisforum EliteMini UM780 XTX
AMD Ryzen 7 7840HS, Radeon 780M
4953 MB/s +82%
Minisforum Venus Series UM790 Pro
AMD Ryzen 9 7940HS, Radeon 780M
4890 MB/s +80%
ACEMagician Ace Magician AM08 Pro
AMD Ryzen 9 6900HX, Radeon 680M
3117 MB/s +15%
Geekom AS 6, R9 6900HX
AMD Ryzen 9 6900HX, Radeon 680M
3065 MB/s +13%
Geekom GT13 Pro
Intel Core i9-13900H, Iris Xe G7 96EUs
2718 MB/s
Intel NUC 13 Pro Desk Edition Kit
Intel Core i7-1360P, Iris Xe G7 96EUs
2669 MB/s -2%
Khadas Mind
Intel Core i7-1360P, Iris Xe G7 96EUs
2430 MB/s -11%
Average of class Mini PC
  (225 - 5096, n=110, last 2 years)
2409 MB/s -11%
Geekom Mini IT12
Intel Core i7-1260P, Iris Xe G7 96EUs
2006 MB/s -26%
AIDA64 / CPU Queen
Minisforum Venus Series UM790 Pro
AMD Ryzen 9 7940HS, Radeon 780M
119569 Points +27%
Minisforum EliteMini UM780 XTX
AMD Ryzen 7 7840HS, Radeon 780M
117103 Points +25%
ACEMagician Ace Magician AM08 Pro
AMD Ryzen 9 6900HX, Radeon 680M
99180 Points +6%
Geekom GT13 Pro
Intel Core i9-13900H, Iris Xe G7 96EUs
93952 Points
Geekom AS 6, R9 6900HX
AMD Ryzen 9 6900HX, Radeon 680M
93870 Points 0%
Intel NUC 13 Pro Desk Edition Kit
Intel Core i7-1360P, Iris Xe G7 96EUs
86881 Points -8%
Geekom Mini IT12
Intel Core i7-1260P, Iris Xe G7 96EUs
73765 Points -21%
Average of class Mini PC
  (8172 - 119802, n=110, last 2 years)
71745 Points -24%
Khadas Mind
Intel Core i7-1360P, Iris Xe G7 96EUs
65324 Points -30%
AIDA64 / FPU SinJulia
Minisforum Venus Series UM790 Pro
AMD Ryzen 9 7940HS, Radeon 780M
15312 Points +91%
Minisforum EliteMini UM780 XTX
AMD Ryzen 7 7840HS, Radeon 780M
15145 Points +89%
ACEMagician Ace Magician AM08 Pro
AMD Ryzen 9 6900HX, Radeon 680M
12642 Points +58%
Geekom AS 6, R9 6900HX
AMD Ryzen 9 6900HX, Radeon 680M
11771 Points +47%
Geekom GT13 Pro
Intel Core i9-13900H, Iris Xe G7 96EUs
8026 Points
Average of class Mini PC
  (408 - 15525, n=110, last 2 years)
7606 Points -5%
Intel NUC 13 Pro Desk Edition Kit
Intel Core i7-1360P, Iris Xe G7 96EUs
7246 Points -10%
Khadas Mind
Intel Core i7-1360P, Iris Xe G7 96EUs
5734 Points -29%
Geekom Mini IT12
Intel Core i7-1260P, Iris Xe G7 96EUs
5567 Points -31%
AIDA64 / FPU Mandel
Minisforum Venus Series UM790 Pro
AMD Ryzen 9 7940HS, Radeon 780M
62219 Points +114%
Minisforum EliteMini UM780 XTX
AMD Ryzen 7 7840HS, Radeon 780M
60809 Points +109%
ACEMagician Ace Magician AM08 Pro
AMD Ryzen 9 6900HX, Radeon 680M
50025 Points +72%
Geekom AS 6, R9 6900HX
AMD Ryzen 9 6900HX, Radeon 680M
49558 Points +70%
Geekom GT13 Pro
Intel Core i9-13900H, Iris Xe G7 96EUs
29138 Points
Average of class Mini PC
  (1958 - 62378, n=110, last 2 years)
28988 Points -1%
Intel NUC 13 Pro Desk Edition Kit
Intel Core i7-1360P, Iris Xe G7 96EUs
28019 Points -4%
Khadas Mind
Intel Core i7-1360P, Iris Xe G7 96EUs
22832 Points -22%
Geekom Mini IT12
Intel Core i7-1260P, Iris Xe G7 96EUs
19857 Points -32%
AIDA64 / CPU AES
Minisforum EliteMini UM780 XTX
AMD Ryzen 7 7840HS, Radeon 780M
170745 MB/s +66%
ACEMagician Ace Magician AM08 Pro
AMD Ryzen 9 6900HX, Radeon 680M
124515 MB/s +21%
Geekom AS 6, R9 6900HX
AMD Ryzen 9 6900HX, Radeon 680M
119363 MB/s +16%
Geekom GT13 Pro
Intel Core i9-13900H, Iris Xe G7 96EUs
102677 MB/s
Minisforum Venus Series UM790 Pro
AMD Ryzen 9 7940HS, Radeon 780M
86346 MB/s -16%
Khadas Mind
Intel Core i7-1360P, Iris Xe G7 96EUs
80041 MB/s -22%
Average of class Mini PC
  (3691 - 177158, n=110, last 2 years)
78664 MB/s -23%
Geekom Mini IT12
Intel Core i7-1260P, Iris Xe G7 96EUs
74716 MB/s -27%
Intel NUC 13 Pro Desk Edition Kit
Intel Core i7-1360P, Iris Xe G7 96EUs
53328 MB/s -48%
AIDA64 / CPU ZLib
Minisforum Venus Series UM790 Pro
AMD Ryzen 9 7940HS, Radeon 780M
1114 MB/s +41%
Minisforum EliteMini UM780 XTX
AMD Ryzen 7 7840HS, Radeon 780M
1075 MB/s +36%
Geekom GT13 Pro
Intel Core i9-13900H, Iris Xe G7 96EUs
789 MB/s
Intel NUC 13 Pro Desk Edition Kit
Intel Core i7-1360P, Iris Xe G7 96EUs
775 MB/s -2%
Geekom AS 6, R9 6900HX
AMD Ryzen 9 6900HX, Radeon 680M
754 MB/s -4%
Khadas Mind
Intel Core i7-1360P, Iris Xe G7 96EUs
671 MB/s -15%
Average of class Mini PC
  (74.8 - 1233, n=110, last 2 years)
615 MB/s -22%
ACEMagician Ace Magician AM08 Pro
AMD Ryzen 9 6900HX, Radeon 680M
578 MB/s -27%
Geekom Mini IT12
Intel Core i7-1260P, Iris Xe G7 96EUs
575 MB/s -27%
AIDA64 / FP64 Ray-Trace
Minisforum Venus Series UM790 Pro
AMD Ryzen 9 7940HS, Radeon 780M
14472 KRay/s +133%
Minisforum EliteMini UM780 XTX
AMD Ryzen 7 7840HS, Radeon 780M
14284 KRay/s +130%
ACEMagician Ace Magician AM08 Pro
AMD Ryzen 9 6900HX, Radeon 680M
7680 KRay/s +24%
Geekom AS 6, R9 6900HX
AMD Ryzen 9 6900HX, Radeon 680M
7551 KRay/s +22%
Geekom GT13 Pro
Intel Core i9-13900H, Iris Xe G7 96EUs
6205 KRay/s
Intel NUC 13 Pro Desk Edition Kit
Intel Core i7-1360P, Iris Xe G7 96EUs
5957 KRay/s -4%
Average of class Mini PC
  (308 - 14722, n=110, last 2 years)
5651 KRay/s -9%
Khadas Mind
Intel Core i7-1360P, Iris Xe G7 96EUs
4975 KRay/s -20%
Geekom Mini IT12
Intel Core i7-1260P, Iris Xe G7 96EUs
4156 KRay/s -33%
AIDA64 / CPU PhotoWorxx
Khadas Mind
Intel Core i7-1360P, Iris Xe G7 96EUs
43544 MPixel/s +54%
Minisforum EliteMini UM780 XTX
AMD Ryzen 7 7840HS, Radeon 780M
40460 MPixel/s +43%
Minisforum Venus Series UM790 Pro
AMD Ryzen 9 7940HS, Radeon 780M
32647 MPixel/s +15%
Geekom AS 6, R9 6900HX
AMD Ryzen 9 6900HX, Radeon 680M
30049 MPixel/s +6%
ACEMagician Ace Magician AM08 Pro
AMD Ryzen 9 6900HX, Radeon 680M
30038 MPixel/s +6%
Intel NUC 13 Pro Desk Edition Kit
Intel Core i7-1360P, Iris Xe G7 96EUs
29263 MPixel/s +4%
Geekom GT13 Pro
Intel Core i9-13900H, Iris Xe G7 96EUs
28269 MPixel/s
Geekom Mini IT12
Intel Core i7-1260P, Iris Xe G7 96EUs
28118 MPixel/s -1%
Average of class Mini PC
  (4408 - 45560, n=110, last 2 years)
25426 MPixel/s -10%

Cinebench R15 Multi loop

Spojrzenie na ciągłą pętlę Cinebench R15 pokazuje, że znacznie lepszy wynik można osiągnąć na początku. Podczas pierwszego uruchomienia Intel Core i9-13900H jest w stanie utrzymać wartość PL2 (64 W) nieco dłużej niż w kolejnych przebiegach. Jednakże, z kilkoma wyjątkami, SoC zapewnia następnie stabilną wydajność przy maksymalnie 35 watach.

Metryki procesora podczas pętli Cinebench R15
0135270405540675810945108012151350148516201755189020252160229524302565Tooltip
Geekom GT13 Pro Intel Core i9-13900H, Intel Core i9-13900H: Ø1776 (1688.48-2326.12)
Minisforum EliteMini UM780 XTX AMD Ryzen 7 7840HS, AMD Ryzen 7 7840HS: Ø2605 (2564.1-2649.53)
Minisforum Venus Series UM790 Pro AMD Ryzen 9 7940HS, AMD Ryzen 9 7940HS: Ø2646 (2612.16-2667.2)
Geekom AS 6, R9 6900HX AMD Ryzen 9 6900HX, AMD Ryzen 9 6900HX: Ø1878 (1825.15-2068.58)
Intel NUC 13 Pro Desk Edition Kit Intel Core i7-1360P, Intel Core i7-1360P: Ø1753 (1686.77-2083.33)
Geekom Mini IT12 Intel Core i7-1260P, Intel Core i7-1260P: Ø1280 (1241-1619.37)
ACEMagician Ace Magician AM08 Pro AMD Ryzen 9 6900HX, AMD Ryzen 9 6900HX: Ø2050 (2014.91-2082.68)
Khadas Mind Intel Core i7-1360P, Intel Core i7-1360P: Ø1443 (1386.82-1627.54)

Wydajność systemu

Ogólnie rzecz biorąc, Geekom GT13 Pro całkiem dobrze radzi sobie z testami systemowymi. Jednak system testowy ma trudności z utrzymaniem się na tle swoich konkurentów. Najprawdopodobniej przyczyniają się do tego spadki wydajności, które częściowo wynikają z własnej winy. Niemniej jednak wydajność w codziennych zadaniach jest na dobrym poziomie. Hojna pamięć robocza i szybka pamięć masowa sprawiają, że system jest subiektywnie wydajny.

PCMark 10 / Score
Geekom A8, AMD Ryzen 9 8945HS
AMD Radeon 780M, Acer N5000
7705 Points +30%
Minisforum EliteMini UM780 XTX, AMD Ryzen 7 7840HS
AMD Radeon 780M, Kingston OM8PGP41024Q-A0
7526 Points +27%
Minisforum AtomMan X7 Ti, Intel Core Ultra 9 185H
Intel Arc 8-Core iGPU, Kingston OM8PGP41024Q-A0
7510 Points +26%
Aoostar GEM12, AMD Ryzen 7 8845HS
AMD Radeon 780M, Crucial P3 Plus CT1000P3PSSD8
7431 Points +25%
Acemagic F2A, Intel Core Ultra 7 155H
Intel Arc 8-Core iGPU, Kingston OM8SEP1024Q-A0
7120 Points +20%
Geekom XT12 Pro, Intel Core i9-12900H
Intel Iris Xe Graphics G7 96EUs, Lexar SSD NM7A1 1TB
6295 Points +6%
Geekom GT13 Pro, Intel Core i9-13900H
Intel Iris Xe Graphics G7 96EUs, Acer N7000
5944 Points
Khadas Mind, Intel Core i7-1360P
Intel Iris Xe Graphics G7 96EUs, WD PC SN740 SDDPTQD-1T00
5937 Points 0%
PCMark 10 / Essentials
Geekom A8, AMD Ryzen 9 8945HS
AMD Radeon 780M, Acer N5000
11333 Points +10%
Geekom XT12 Pro, Intel Core i9-12900H
Intel Iris Xe Graphics G7 96EUs, Lexar SSD NM7A1 1TB
11273 Points +9%
Acemagic F2A, Intel Core Ultra 7 155H
Intel Arc 8-Core iGPU, Kingston OM8SEP1024Q-A0
11125 Points +8%
Minisforum AtomMan X7 Ti, Intel Core Ultra 9 185H
Intel Arc 8-Core iGPU, Kingston OM8PGP41024Q-A0
11030 Points +7%
Minisforum EliteMini UM780 XTX, AMD Ryzen 7 7840HS
AMD Radeon 780M, Kingston OM8PGP41024Q-A0
11011 Points +6%
Aoostar GEM12, AMD Ryzen 7 8845HS
AMD Radeon 780M, Crucial P3 Plus CT1000P3PSSD8
10822 Points +5%
Khadas Mind, Intel Core i7-1360P
Intel Iris Xe Graphics G7 96EUs, WD PC SN740 SDDPTQD-1T00
10761 Points +4%
Geekom GT13 Pro, Intel Core i9-13900H
Intel Iris Xe Graphics G7 96EUs, Acer N7000
10347 Points
PCMark 10 / Productivity
Geekom A8, AMD Ryzen 9 8945HS
AMD Radeon 780M, Acer N5000
11082 Points +51%
Minisforum EliteMini UM780 XTX, AMD Ryzen 7 7840HS
AMD Radeon 780M, Kingston OM8PGP41024Q-A0
10832 Points +48%
Minisforum AtomMan X7 Ti, Intel Core Ultra 9 185H
Intel Arc 8-Core iGPU, Kingston OM8PGP41024Q-A0
10484 Points +43%
Aoostar GEM12, AMD Ryzen 7 8845HS
AMD Radeon 780M, Crucial P3 Plus CT1000P3PSSD8
10482 Points +43%
Acemagic F2A, Intel Core Ultra 7 155H
Intel Arc 8-Core iGPU, Kingston OM8SEP1024Q-A0
8901 Points +22%
Khadas Mind, Intel Core i7-1360P
Intel Iris Xe Graphics G7 96EUs, WD PC SN740 SDDPTQD-1T00
8161 Points +12%
Geekom XT12 Pro, Intel Core i9-12900H
Intel Iris Xe Graphics G7 96EUs, Lexar SSD NM7A1 1TB
8114 Points +11%
Geekom GT13 Pro, Intel Core i9-13900H
Intel Iris Xe Graphics G7 96EUs, Acer N7000
7319 Points
CrossMark / Overall
Aoostar GEM12, AMD Ryzen 7 8845HS
AMD Radeon 780M, Crucial P3 Plus CT1000P3PSSD8
1939 Points +10%
Geekom A8, AMD Ryzen 9 8945HS
AMD Radeon 780M, Acer N5000
1866 Points +6%
Geekom XT12 Pro, Intel Core i9-12900H
Intel Iris Xe Graphics G7 96EUs, Lexar SSD NM7A1 1TB
1860 Points +5%
Acemagic F2A, Intel Core Ultra 7 155H
Intel Arc 8-Core iGPU, Kingston OM8SEP1024Q-A0
1802 Points +2%
Geekom GT13 Pro, Intel Core i9-13900H
Intel Iris Xe Graphics G7 96EUs, Acer N7000
1766 Points
Minisforum EliteMini UM780 XTX, AMD Ryzen 7 7840HS
AMD Radeon 780M, Kingston OM8PGP41024Q-A0
1761 Points 0%
Minisforum AtomMan X7 Ti, Intel Core Ultra 9 185H
Intel Arc 8-Core iGPU, Kingston OM8PGP41024Q-A0
1675 Points -5%
Khadas Mind, Intel Core i7-1360P
Intel Iris Xe Graphics G7 96EUs, WD PC SN740 SDDPTQD-1T00
1564 Points -11%
CrossMark / Responsiveness
Geekom XT12 Pro, Intel Core i9-12900H
Intel Iris Xe Graphics G7 96EUs, Lexar SSD NM7A1 1TB
1919 Points +7%
Aoostar GEM12, AMD Ryzen 7 8845HS
AMD Radeon 780M, Crucial P3 Plus CT1000P3PSSD8
1849 Points +3%
Geekom GT13 Pro, Intel Core i9-13900H
Intel Iris Xe Graphics G7 96EUs, Acer N7000
1790 Points
Acemagic F2A, Intel Core Ultra 7 155H
Intel Arc 8-Core iGPU, Kingston OM8SEP1024Q-A0
1700 Points -5%
Khadas Mind, Intel Core i7-1360P
Intel Iris Xe Graphics G7 96EUs, WD PC SN740 SDDPTQD-1T00
1528 Points -15%
Geekom A8, AMD Ryzen 9 8945HS
AMD Radeon 780M, Acer N5000
1494 Points -17%
Minisforum AtomMan X7 Ti, Intel Core Ultra 9 185H
Intel Arc 8-Core iGPU, Kingston OM8PGP41024Q-A0
1378 Points -23%
Minisforum EliteMini UM780 XTX, AMD Ryzen 7 7840HS
AMD Radeon 780M, Kingston OM8PGP41024Q-A0
1361 Points -24%
CrossMark / Creativity
Geekom A8, AMD Ryzen 9 8945HS
AMD Radeon 780M, Acer N5000
2127 Points +19%
Minisforum EliteMini UM780 XTX, AMD Ryzen 7 7840HS
AMD Radeon 780M, Kingston OM8PGP41024Q-A0
2040 Points +14%
Aoostar GEM12, AMD Ryzen 7 8845HS
AMD Radeon 780M, Crucial P3 Plus CT1000P3PSSD8
2040 Points +14%
Acemagic F2A, Intel Core Ultra 7 155H
Intel Arc 8-Core iGPU, Kingston OM8SEP1024Q-A0
1929 Points +8%
Minisforum AtomMan X7 Ti, Intel Core Ultra 9 185H
Intel Arc 8-Core iGPU, Kingston OM8PGP41024Q-A0
1883 Points +5%
Geekom XT12 Pro, Intel Core i9-12900H
Intel Iris Xe Graphics G7 96EUs, Lexar SSD NM7A1 1TB
1870 Points +5%
Geekom GT13 Pro, Intel Core i9-13900H
Intel Iris Xe Graphics G7 96EUs, Acer N7000
1789 Points
Khadas Mind, Intel Core i7-1360P
Intel Iris Xe Graphics G7 96EUs, WD PC SN740 SDDPTQD-1T00
1600 Points -11%
CrossMark / Productivity
Aoostar GEM12, AMD Ryzen 7 8845HS
AMD Radeon 780M, Crucial P3 Plus CT1000P3PSSD8
1872 Points +8%
Geekom XT12 Pro, Intel Core i9-12900H
Intel Iris Xe Graphics G7 96EUs, Lexar SSD NM7A1 1TB
1831 Points +5%
Geekom A8, AMD Ryzen 9 8945HS
AMD Radeon 780M, Acer N5000
1764 Points +2%
Geekom GT13 Pro, Intel Core i9-13900H
Intel Iris Xe Graphics G7 96EUs, Acer N7000
1736 Points
Acemagic F2A, Intel Core Ultra 7 155H
Intel Arc 8-Core iGPU, Kingston OM8SEP1024Q-A0
1717 Points -1%
Minisforum EliteMini UM780 XTX, AMD Ryzen 7 7840HS
AMD Radeon 780M, Kingston OM8PGP41024Q-A0
1656 Points -5%
Minisforum AtomMan X7 Ti, Intel Core Ultra 9 185H
Intel Arc 8-Core iGPU, Kingston OM8PGP41024Q-A0
1589 Points -8%
Khadas Mind, Intel Core i7-1360P
Intel Iris Xe Graphics G7 96EUs, WD PC SN740 SDDPTQD-1T00
1541 Points -11%
AIDA64 / Memory Copy
Minisforum AtomMan X7 Ti
Intel Core Ultra 9 185H, Arc 8-Core
71990 MB/s +57%
Geekom A8
AMD Ryzen 9 8945HS, Radeon 780M
68603 MB/s +50%
Aoostar GEM12
AMD Ryzen 7 8845HS, Radeon 780M
67777 MB/s +48%
Minisforum EliteMini UM780 XTX
AMD Ryzen 7 7840HS, Radeon 780M
67039 MB/s +47%
Khadas Mind
Intel Core i7-1360P, Iris Xe G7 96EUs
65299 MB/s +43%
Acemagic F2A
Intel Core Ultra 7 155H, Arc 8-Core
62397 MB/s +36%
Geekom XT12 Pro
Intel Core i9-12900H, Iris Xe G7 96EUs
45792 MB/s 0%
Geekom GT13 Pro
Intel Core i9-13900H, Iris Xe G7 96EUs
45721 MB/s
Average of class Mini PC
  (6481 - 71990, n=110, last 2 years)
44087 MB/s -4%
AIDA64 / Memory Read
Minisforum AtomMan X7 Ti
Intel Core Ultra 9 185H, Arc 8-Core
75449 MB/s +64%
Acemagic F2A
Intel Core Ultra 7 155H, Arc 8-Core
64323 MB/s +40%
Minisforum EliteMini UM780 XTX
AMD Ryzen 7 7840HS, Radeon 780M
61867 MB/s +35%
Geekom A8
AMD Ryzen 9 8945HS, Radeon 780M
61710 MB/s +34%
Aoostar GEM12
AMD Ryzen 7 8845HS, Radeon 780M
61006 MB/s +33%
Khadas Mind
Intel Core i7-1360P, Iris Xe G7 96EUs
60668 MB/s +32%
Geekom XT12 Pro
Intel Core i9-12900H, Iris Xe G7 96EUs
48963 MB/s +6%
Geekom GT13 Pro
Intel Core i9-13900H, Iris Xe G7 96EUs
45995 MB/s
Average of class Mini PC
  (6914 - 75449, n=110, last 2 years)
44555 MB/s -3%
AIDA64 / Memory Write
Geekom A8
AMD Ryzen 9 8945HS, Radeon 780M
86974 MB/s +90%
Minisforum EliteMini UM780 XTX
AMD Ryzen 7 7840HS, Radeon 780M
86693 MB/s +90%
Aoostar GEM12
AMD Ryzen 7 8845HS, Radeon 780M
86677 MB/s +90%
Khadas Mind
Intel Core i7-1360P, Iris Xe G7 96EUs
74777 MB/s +64%
Minisforum AtomMan X7 Ti
Intel Core Ultra 9 185H, Arc 8-Core
70596 MB/s +54%
Acemagic F2A
Intel Core Ultra 7 155H, Arc 8-Core
65057 MB/s +42%
Average of class Mini PC
  (6862 - 89318, n=110, last 2 years)
48119 MB/s +5%
Geekom XT12 Pro
Intel Core i9-12900H, Iris Xe G7 96EUs
47201 MB/s +3%
Geekom GT13 Pro
Intel Core i9-13900H, Iris Xe G7 96EUs
45733 MB/s
AIDA64 / Memory Latency
Acemagic F2A
Intel Core Ultra 7 155H, Arc 8-Core
149 ns * -97%
Minisforum AtomMan X7 Ti
Intel Core Ultra 9 185H, Arc 8-Core
146.1 ns * -93%
Minisforum EliteMini UM780 XTX
AMD Ryzen 7 7840HS, Radeon 780M
92 ns * -21%
Geekom A8
AMD Ryzen 9 8945HS, Radeon 780M
91.2 ns * -20%
Khadas Mind
Intel Core i7-1360P, Iris Xe G7 96EUs
90.5 ns * -19%
Aoostar GEM12
AMD Ryzen 7 8845HS, Radeon 780M
88.6 ns * -17%
Average of class Mini PC
  (44.9 - 154.6, n=110, last 2 years)
88.1 ns * -16%
Geekom GT13 Pro
Intel Core i9-13900H, Iris Xe G7 96EUs
75.8 ns *
Geekom XT12 Pro
Intel Core i9-12900H, Iris Xe G7 96EUs
74.7 ns * +1%

* ... im mniej tym lepiej

Opóźnienia DPC

Niestety, Geekom GT13 Pro nie osiąga optymalnych opóźnień DPC. Udokumentowaliśmy już zwiększone opóźnienia podczas surfowania po Internecie, które ponownie nieznacznie wzrastają podczas odtwarzania testowego wideo 4K. Tylko dwie upuszczone klatki są w porządku i w żaden sposób nie obniżają jakości jako klienta przesyłania strumieniowego. W tym samym czasie iGPU jest obciążone w około 45 procentach.

Maksymalne opóźnienie podczas otwierania wielu kart przeglądarki i odtwarzania materiałów wideo 4K
Maksymalne opóźnienie po dziesięciu sekundach Prime95
Sterowniki uszeregowane według najdłuższego czasu wykonania
DPC Latencies / LatencyMon - interrupt to process latency (max), Web, Youtube, Prime95
Acemagic F2A
Arc 8-Core, Ultra 7 155H, Kingston OM8SEP1024Q-A0
2724 μs * -78%
Geekom XT12 Pro
Iris Xe G7 96EUs, i9-12900H, Lexar SSD NM7A1 1TB
2151 μs * -40%
Geekom A8
Radeon 780M, R9 8945HS, Acer N5000
2097.9 μs * -37%
Minisforum AtomMan X7 Ti
Arc 8-Core, Ultra 9 185H, Kingston OM8PGP41024Q-A0
2069.2 μs * -35%
Geekom GT13 Pro
Iris Xe G7 96EUs, i9-13900H, Acer N7000
1533.4 μs *
Minisforum EliteMini UM780 XTX
Radeon 780M, R7 7840HS, Kingston OM8PGP41024Q-A0
1178.9 μs * +23%
Aoostar GEM12
Radeon 780M, R7 8845HS, Crucial P3 Plus CT1000P3PSSD8
1001.9 μs * +35%
Khadas Mind
Iris Xe G7 96EUs, i7-1360P, WD PC SN740 SDDPTQD-1T00
962 μs * +37%

* ... im mniej tym lepiej

Pamięć masowa

Acer N7000 2 TB SSD
Acer N7000 2 TB SSD

Dzięki 2 TB przestrzeni dyskowej, Geekom GT13 Pro jest doskonale wyposażony i oferuje wystarczającą ilość miejsca na wiele aplikacji. Zainstalowany dysk SSD firmy Acer jest imponujący pod względem wydajności. Udokumentowane wyniki są wystarczające, aby umieścić go za Aoostar GEM12 zajmując drugie miejsce w naszym rankingu. Dysk SSD ma jednak problemy z utrzymaniem wysokiej wydajności przy ciągłym obciążeniu. Choć producent zainstalował pasywne chłodzenie dysku SSD, to ostatecznie nie wystarcza ono do utrzymania stabilnej wydajności. W porównaniu do wartości początkowych, szybkość odczytu spada o prawie 50 procent. Nie jest to jednak całkowita porażka, co widać na wykresie ciągłej wydajności. Przy nieco poniżej 4000 MB/s, Acer N7000 jest nadal szybszy niż urządzenia pamięci masowej innych mini-PC. W Geekom GT13 Pro można zainstalować łącznie dwa dyski SSD. Należy jednak zauważyć, że drugie gniazdo M.2 obsługuje tylko dyski SSD SATA o długości 42 milimetrów.

W celu uzyskania dalszych porównań i testów porównawczych, proszę odnieść się do naszej Tabela porównawcza.

AS SSD
AS SSD
CDM 3
CDM 3
CDM 5
CDM 5
CDM 6
CDM 6
CDI
CDI
Acer N7000
Sequential Read: 4580 MB/s
Sequential Write: 4435 MB/s
512K Read: 2185 MB/s
512K Write: 3457 MB/s
4K Read: 71.73 MB/s
4K Write: 333.5 MB/s
4K QD32 Read: 1047 MB/s
4K QD32 Write: 779.3 MB/s
Drive Performance Rating - Percent
Aoostar GEM12
Crucial P3 Plus CT1000P3PSSD8
89 pt
Geekom GT13 Pro
Acer N7000
77 pt
Khadas Mind
WD PC SN740 SDDPTQD-1T00
75.4 pt
Geekom XT12 Pro
Lexar SSD NM7A1 1TB
65.8 pt
Minisforum EliteMini UM780 XTX
Kingston OM8PGP41024Q-A0
60.1 pt
Minisforum AtomMan X7 Ti
Kingston OM8PGP41024Q-A0
58.1 pt
Geekom A8
Acer N5000
55.2 pt
Acemagic F2A
Kingston OM8SEP1024Q-A0
45.7 pt
Average of class Mini PC
 
42.5 pt
DiskSpd
seq read
Geekom GT13 Pro
Acer N7000
4357 (4314.26min - 4356.72max) MB/s
Khadas Mind
WD PC SN740 SDDPTQD-1T00
3628 (3596.13min - 3627.65max) MB/s -17%
Geekom A8
Acer N5000
3114 (3080.09min - 3114.48max) MB/s -29%
Aoostar GEM12
Crucial P3 Plus CT1000P3PSSD8
3108 (3065.99min - 3107.56max) MB/s -29%
Minisforum EliteMini UM780 XTX
Kingston OM8PGP41024Q-A0
2896 (2845min - 2896.04max) MB/s -34%
Minisforum AtomMan X7 Ti
Kingston OM8PGP41024Q-A0
2315 (2293.84min - 2315.26max) MB/s -47%
Geekom XT12 Pro
Lexar SSD NM7A1 1TB
2178 (2158.39min - 2177.68max) MB/s -50%
Average of class Mini PC
  (233 - 4357, n=109, last 2 years)
2112 MB/s -52%
Acemagic F2A
Kingston OM8SEP1024Q-A0
1674 (1242.56min - 1673.54max) MB/s -62%
seq write
Aoostar GEM12
Crucial P3 Plus CT1000P3PSSD8
4619 (4584.79min - 4619.39max) MB/s +2%
Geekom GT13 Pro
Acer N7000
4544 (4380.79min - 4543.83max) MB/s
Khadas Mind
WD PC SN740 SDDPTQD-1T00
4121 (3696.6min - 4120.84max) MB/s -9%
Minisforum EliteMini UM780 XTX
Kingston OM8PGP41024Q-A0
3736 (3562.44min - 3735.53max) MB/s -18%
Minisforum AtomMan X7 Ti
Kingston OM8PGP41024Q-A0
3386 (3076.94min - 3385.64max) MB/s -25%
Geekom A8
Acer N5000
3271 (3235.73min - 3270.93max) MB/s -28%
Geekom XT12 Pro
Lexar SSD NM7A1 1TB
2341 (2252.02min - 2341.4max) MB/s -48%
Average of class Mini PC
  (222 - 5595, n=109, last 2 years)
2190 MB/s -52%
Acemagic F2A
Kingston OM8SEP1024Q-A0
1348 (1117.85min - 1347.87max) MB/s -70%
seq q8 t1 read
Geekom GT13 Pro
Acer N7000
7007 (6166.72min - 7006.62max) MB/s
Aoostar GEM12
Crucial P3 Plus CT1000P3PSSD8
5213 (4500.71min - 5212.95max) MB/s -26%
Khadas Mind
WD PC SN740 SDDPTQD-1T00
5168 (4831.21min - 5167.59max) MB/s -26%
Minisforum EliteMini UM780 XTX
Kingston OM8PGP41024Q-A0
4821 (4521.88min - 4820.93max) MB/s -31%
Geekom A8
Acer N5000
4800 (4387.45min - 4800.17max) MB/s -31%
Geekom XT12 Pro
Lexar SSD NM7A1 1TB
4769 (3791.02min - 4769.24max) MB/s -32%
Minisforum AtomMan X7 Ti
Kingston OM8PGP41024Q-A0
4676 (4310.07min - 4675.81max) MB/s -33%
Average of class Mini PC
  (236 - 8430, n=109, last 2 years)
3303 MB/s -53%
Acemagic F2A
Kingston OM8SEP1024Q-A0
3194 (2810.81min - 3194.17max) MB/s -54%
seq q8 t1 write
Geekom GT13 Pro
Acer N7000
5261 (5018.9min - 5261.3max) MB/s
Aoostar GEM12
Crucial P3 Plus CT1000P3PSSD8
4754 (4738.27min - 4754.03max) MB/s -10%
Khadas Mind
WD PC SN740 SDDPTQD-1T00
4212 (3767.95min - 4212.34max) MB/s -20%
Geekom A8
Acer N5000
4081 (3987.52min - 4081.49max) MB/s -22%
Minisforum EliteMini UM780 XTX
Kingston OM8PGP41024Q-A0
3910 (3902.59min - 3909.87max) MB/s -26%
Minisforum AtomMan X7 Ti
Kingston OM8PGP41024Q-A0
3729 (3700.15min - 3728.95max) MB/s -29%
Geekom XT12 Pro
Lexar SSD NM7A1 1TB
3255 (2485.13min - 3254.57max) MB/s -38%
Average of class Mini PC
  (228 - 6669, n=109, last 2 years)
2387 MB/s -55%
Acemagic F2A
Kingston OM8SEP1024Q-A0
2212 (1222.43min - 2212.27max) MB/s -58%
4k q1 t1 read
Geekom GT13 Pro
Acer N7000
85.3 (82.57min - 85.32max) MB/s
Khadas Mind
WD PC SN740 SDDPTQD-1T00
83.7 (81.47min - 83.67max) MB/s -2%
Aoostar GEM12
Crucial P3 Plus CT1000P3PSSD8
78.7 (78.09min - 78.69max) MB/s -8%
Minisforum EliteMini UM780 XTX
Kingston OM8PGP41024Q-A0
64.9 (64.71min - 64.94max) MB/s -24%
Geekom XT12 Pro
Lexar SSD NM7A1 1TB
64.1 (56.32min - 64.06max) MB/s -25%
Minisforum AtomMan X7 Ti
Kingston OM8PGP41024Q-A0
63.5 (59.81min - 63.5max) MB/s -26%
Geekom A8
Acer N5000
54.4 (52.17min - 54.39max) MB/s -36%
Average of class Mini PC
  (5.67 - 86.6, n=109, last 2 years)
52.9 MB/s -38%
Acemagic F2A
Kingston OM8SEP1024Q-A0
47.3 (47.07min - 47.31max) MB/s -45%
4k q1 t1 write
Geekom GT13 Pro
Acer N7000
327 (306.06min - 326.78max) MB/s
Khadas Mind
WD PC SN740 SDDPTQD-1T00
301 (296.91min - 301.44max) MB/s -8%
Geekom XT12 Pro
Lexar SSD NM7A1 1TB
279 (237.61min - 279.08max) MB/s -15%
Aoostar GEM12
Crucial P3 Plus CT1000P3PSSD8
274 (271.38min - 273.89max) MB/s -16%
Minisforum EliteMini UM780 XTX
Kingston OM8PGP41024Q-A0
196.1 (183.94min - 196.13max) MB/s -40%
Average of class Mini PC
  (22 - 435, n=109, last 2 years)
191.5 MB/s -41%
Acemagic F2A
Kingston OM8SEP1024Q-A0
187.2 (181.54min - 187.2max) MB/s -43%
Minisforum AtomMan X7 Ti
Kingston OM8PGP41024Q-A0
184.4 (177.6min - 184.36max) MB/s -44%
Geekom A8
Acer N5000
169.3 (157.77min - 169.29max) MB/s -48%
4k q32 t16 read
Geekom GT13 Pro
Acer N7000
3593 (3380.17min - 3593.41max) MB/s
Aoostar GEM12
Crucial P3 Plus CT1000P3PSSD8
3197 (3174.44min - 3196.85max) MB/s -11%
Khadas Mind
WD PC SN740 SDDPTQD-1T00
2300 (2238.78min - 2299.5max) MB/s -36%
Acemagic F2A
Kingston OM8SEP1024Q-A0
1824 (1239.47min - 1824.09max) MB/s -49%
Geekom A8
Acer N5000
1558 (1523.21min - 1557.75max) MB/s -57%
Minisforum EliteMini UM780 XTX
Kingston OM8PGP41024Q-A0
1557 (1529.87min - 1556.79max) MB/s -57%
Geekom XT12 Pro
Lexar SSD NM7A1 1TB
1452 (1402.67min - 1451.9max) MB/s -60%
Average of class Mini PC
  (26.1 - 3593, n=109, last 2 years)
1169 MB/s -67%
Minisforum AtomMan X7 Ti
Kingston OM8PGP41024Q-A0
1143 (1091.01min - 1142.98max) MB/s -68%
4k q32 t16 write
Aoostar GEM12
Crucial P3 Plus CT1000P3PSSD8
3639 (3534.46min - 3639.09max) MB/s +378%
Khadas Mind
WD PC SN740 SDDPTQD-1T00
2441 (2189.1min - 2441.28max) MB/s +220%
Geekom XT12 Pro
Lexar SSD NM7A1 1TB
1499 (1114.25min - 1499.4max) MB/s +97%
Acemagic F2A
Kingston OM8SEP1024Q-A0
1434 (1410.26min - 1433.71max) MB/s +88%
Average of class Mini PC
  (30.2 - 3983, n=109, last 2 years)
1153 MB/s +51%
Geekom GT13 Pro
Acer N7000
762 (700.88min - 761.76max) MB/s
Geekom A8
Acer N5000
600 (492.7min - 600.03max) MB/s -21%
Minisforum EliteMini UM780 XTX
Kingston OM8PGP41024Q-A0
565 (557.67min - 564.75max) MB/s -26%
Minisforum AtomMan X7 Ti
Kingston OM8PGP41024Q-A0
497 (467.49min - 497.28max) MB/s -35%
AS SSD
Score Total
Aoostar GEM12
Crucial P3 Plus CT1000P3PSSD8
10021 Points +47%
Geekom GT13 Pro
Acer N7000
6798 Points
Khadas Mind
WD PC SN740 SDDPTQD-1T00
6460 Points -5%
Geekom XT12 Pro
Lexar SSD NM7A1 1TB
5975 Points -12%
Minisforum EliteMini UM780 XTX
Kingston OM8PGP41024Q-A0
5863 Points -14%
Geekom A8
Acer N5000
5132 Points -25%
Minisforum AtomMan X7 Ti
Kingston OM8PGP41024Q-A0
4987 Points -27%
Acemagic F2A
Kingston OM8SEP1024Q-A0
4412 Points -35%
Average of class Mini PC
  (151.3 - 10021, n=107, last 2 years)
3750 Points -45%
Score Read
Aoostar GEM12
Crucial P3 Plus CT1000P3PSSD8
3741 Points +31%
Geekom GT13 Pro
Acer N7000
2866 Points
Khadas Mind
WD PC SN740 SDDPTQD-1T00
2658 Points -7%
Geekom XT12 Pro
Lexar SSD NM7A1 1TB
2119 Points -26%
Minisforum EliteMini UM780 XTX
Kingston OM8PGP41024Q-A0
1738 Points -39%
Geekom A8
Acer N5000
1643 Points -43%
Acemagic F2A
Kingston OM8SEP1024Q-A0
1561 Points -46%
Minisforum AtomMan X7 Ti
Kingston OM8PGP41024Q-A0
1482 Points -48%
Average of class Mini PC
  (61 - 3741, n=107, last 2 years)
1412 Points -51%
Score Write
Aoostar GEM12
Crucial P3 Plus CT1000P3PSSD8
4371 Points +74%
Minisforum EliteMini UM780 XTX
Kingston OM8PGP41024Q-A0
3294 Points +31%
Minisforum AtomMan X7 Ti
Kingston OM8PGP41024Q-A0
2807 Points +12%
Geekom XT12 Pro
Lexar SSD NM7A1 1TB
2777 Points +10%
Geekom A8
Acer N5000
2735 Points +9%
Geekom GT13 Pro
Acer N7000
2516 Points
Khadas Mind
WD PC SN740 SDDPTQD-1T00
2447 Points -3%
Acemagic F2A
Kingston OM8SEP1024Q-A0
2082 Points -17%
Average of class Mini PC
  (88 - 4371, n=107, last 2 years)
1663 Points -34%
Seq Read
Geekom GT13 Pro
Acer N7000
4546 MB/s
Khadas Mind
WD PC SN740 SDDPTQD-1T00
4496 MB/s -1%
Geekom XT12 Pro
Lexar SSD NM7A1 1TB
4349.85 MB/s -4%
Aoostar GEM12
Crucial P3 Plus CT1000P3PSSD8
4317 MB/s -5%
Minisforum EliteMini UM780 XTX
Kingston OM8PGP41024Q-A0
3822 MB/s -16%
Minisforum AtomMan X7 Ti
Kingston OM8PGP41024Q-A0
3779 MB/s -17%
Geekom A8
Acer N5000
3741 MB/s -18%
Acemagic F2A
Kingston OM8SEP1024Q-A0
3010 MB/s -34%
Average of class Mini PC
  (291 - 6620, n=107, last 2 years)
2888 MB/s -36%
Seq Write
Khadas Mind
WD PC SN740 SDDPTQD-1T00
4258 MB/s +26%
Aoostar GEM12
Crucial P3 Plus CT1000P3PSSD8
4188 MB/s +24%
Geekom XT12 Pro
Lexar SSD NM7A1 1TB
3936.64 MB/s +17%
Geekom GT13 Pro
Acer N7000
3374 MB/s
Minisforum EliteMini UM780 XTX
Kingston OM8PGP41024Q-A0
2463 MB/s -27%
Acemagic F2A
Kingston OM8SEP1024Q-A0
2369 MB/s -30%
Minisforum AtomMan X7 Ti
Kingston OM8PGP41024Q-A0
2285 MB/s -32%
Average of class Mini PC
  (240 - 5783, n=107, last 2 years)
2046 MB/s -39%
Geekom A8
Acer N5000
1897 MB/s -44%
4K Read
Aoostar GEM12
Crucial P3 Plus CT1000P3PSSD8
89.3 MB/s +7%
Geekom GT13 Pro
Acer N7000
83.4 MB/s
Geekom XT12 Pro
Lexar SSD NM7A1 1TB
80.89 MB/s -3%
Khadas Mind
WD PC SN740 SDDPTQD-1T00
76.3 MB/s -9%
Minisforum AtomMan X7 Ti
Kingston OM8PGP41024Q-A0
63.3 MB/s -24%
Minisforum EliteMini UM780 XTX
Kingston OM8PGP41024Q-A0
61.9 MB/s -26%
Average of class Mini PC
  (6.08 - 104.3, n=107, last 2 years)
56.9 MB/s -32%
Geekom A8
Acer N5000
50.3 MB/s -40%
Acemagic F2A
Kingston OM8SEP1024Q-A0
41.8 MB/s -50%
4K Write
Geekom XT12 Pro
Lexar SSD NM7A1 1TB
316.33 MB/s +7%
Geekom GT13 Pro
Acer N7000
296 MB/s
Khadas Mind
WD PC SN740 SDDPTQD-1T00
258 MB/s -13%
Minisforum AtomMan X7 Ti
Kingston OM8PGP41024Q-A0
238 MB/s -20%
Aoostar GEM12
Crucial P3 Plus CT1000P3PSSD8
221 MB/s -25%
Minisforum EliteMini UM780 XTX
Kingston OM8PGP41024Q-A0
208 MB/s -30%
Acemagic F2A
Kingston OM8SEP1024Q-A0
196.9 MB/s -33%
Geekom A8
Acer N5000
171.7 MB/s -42%
Average of class Mini PC
  (30.9 - 366, n=107, last 2 years)
171.7 MB/s -42%
4K-64 Read
Aoostar GEM12
Crucial P3 Plus CT1000P3PSSD8
3220 MB/s +38%
Geekom GT13 Pro
Acer N7000
2328 MB/s
Khadas Mind
WD PC SN740 SDDPTQD-1T00
2132 MB/s -8%
Geekom XT12 Pro
Lexar SSD NM7A1 1TB
1602.91 MB/s -31%
Minisforum EliteMini UM780 XTX
Kingston OM8PGP41024Q-A0
1293 MB/s -44%
Acemagic F2A
Kingston OM8SEP1024Q-A0
1218 MB/s -48%
Geekom A8
Acer N5000
1218 MB/s -48%
Average of class Mini PC
  (23.4 - 3220, n=107, last 2 years)
1066 MB/s -54%
Minisforum AtomMan X7 Ti
Kingston OM8PGP41024Q-A0
1041 MB/s -55%
4K-64 Write
Aoostar GEM12
Crucial P3 Plus CT1000P3PSSD8
3731 MB/s +98%
Minisforum EliteMini UM780 XTX
Kingston OM8PGP41024Q-A0
2840 MB/s +51%
Geekom A8
Acer N5000
2374 MB/s +26%
Minisforum AtomMan X7 Ti
Kingston OM8PGP41024Q-A0
2340 MB/s +24%
Geekom XT12 Pro
Lexar SSD NM7A1 1TB
2066.57 MB/s +10%
Geekom GT13 Pro
Acer N7000
1883 MB/s
Khadas Mind
WD PC SN740 SDDPTQD-1T00
1763 MB/s -6%
Acemagic F2A
Kingston OM8SEP1024Q-A0
1649 MB/s -12%
Average of class Mini PC
  (32.8 - 3731, n=107, last 2 years)
1287 MB/s -32%
Access Time Read
Minisforum EliteMini UM780 XTX
Kingston OM8PGP41024Q-A0
0.127 ms * -0%
Geekom GT13 Pro
Acer N7000
0.127 ms *
Average of class Mini PC
  (0.022 - 0.489, n=107, last 2 years)
0.1019 ms * +20%
Khadas Mind
WD PC SN740 SDDPTQD-1T00
0.094 ms * +26%
Aoostar GEM12
Crucial P3 Plus CT1000P3PSSD8
0.076 ms * +40%
Geekom A8
Acer N5000
0.069 ms * +46%
Minisforum AtomMan X7 Ti
Kingston OM8PGP41024Q-A0
0.067 ms * +47%
Geekom XT12 Pro
Lexar SSD NM7A1 1TB
0.049 ms * +61%
Acemagic F2A
Kingston OM8SEP1024Q-A0
0.046 ms * +64%
Access Time Write
Acemagic F2A
Kingston OM8SEP1024Q-A0
0.126 ms * -114%
Average of class Mini PC
  (0.016 - 0.765, n=107, last 2 years)
0.121 ms * -105%
Geekom A8
Acer N5000
0.072 ms * -22%
Geekom XT12 Pro
Lexar SSD NM7A1 1TB
0.059 ms * -0%
Geekom GT13 Pro
Acer N7000
0.059 ms *
Minisforum EliteMini UM780 XTX
Kingston OM8PGP41024Q-A0
0.022 ms * +63%
Minisforum AtomMan X7 Ti
Kingston OM8PGP41024Q-A0
0.02 ms * +66%
Aoostar GEM12
Crucial P3 Plus CT1000P3PSSD8
0.017 ms * +71%
Khadas Mind
WD PC SN740 SDDPTQD-1T00
0.016 ms * +73%

* ... im mniej tym lepiej

Continuous read: DiskSpd Read Loop, Queue Depth 8

035571010651420177521302485284031953550390542604615497053255680603563906745Tooltip
Geekom GT13 Pro Acer N7000; diskspd 2.0.17 f: Ø5377 (3710.83-7006.62)
Aoostar GEM12 Crucial P3 Plus CT1000P3PSSD8; diskspd 2.0.17 f: Ø5121 (4152.57-5218.34)
Minisforum AtomMan X7 Ti Kingston OM8PGP41024Q-A0; diskspd 2.0.17 f: Ø4683 (3872.18-4767.25)
Geekom A8 Acer N5000; diskspd 2.0.17 f: Ø4786 (4324.07-4802.27)
Geekom XT12 Pro Lexar SSD NM7A1 1TB; diskspd 2.0.17 f: Ø1764 (1425.22-4795.56)
Acemagic F2A Kingston OM8SEP1024Q-A0; diskspd 2.0.17 f: Ø1320 (771.89-3141.95)
Minisforum EliteMini UM780 XTX Kingston OM8PGP41024Q-A0; diskspd 2.0.17 f: Ø4795 (3366.33-4823.24)
Khadas Mind WD PC SN740 SDDPTQD-1T00: Ø5222 (4952.01-5235.75)

Karta graficzna

Wybór procesora ma znaczący wpływ na wydajność 3D. Geekom zdecydował się na procesor Intel Core i9-13900HiGPU to tylko Intel Iris Xe Graphics G7. Niemniej jednak karta graficzna z 96 EU jest używana na najwyższym poziomie konfiguracji. Jednak Intel Iris Xe Graphics G7 nie nadąża już za nowszymi iGPU modeli Meteor Lake. W rankingu widzimy prawie dwie klasy. Wszystkie urządzenia wyposażone w Intel Iris Xe Graphics G7 znajdują się w dolnej jednej trzeciej. Wydajność pomiędzy urządzeniami jest niemal identyczna. Wszystkie inne urządzenia, które mogą konkurować z nowocześniejszymi i wydajniejszymi iGPU (Intel Arc 8 i AMD Radeon 780) mogą wyraźnie się od nich odróżnić.

W celu uzyskania dalszych porównań i testów porównawczych, proszę odnieść się do naszej Tabela porównawcza GPU.

3DMark Performance Rating - Percent
Geekom A8
AMD Radeon 780M, AMD Ryzen 9 8945HS
96.8 pt
Minisforum EliteMini UM780 XTX
AMD Radeon 780M, AMD Ryzen 7 7840HS
95.6 pt
Aoostar GEM12
AMD Radeon 780M, AMD Ryzen 7 8845HS
94.6 pt
Acemagic F2A
Intel Arc 8-Core iGPU, Intel Core Ultra 7 155H
93.9 pt
Minisforum AtomMan X7 Ti
Intel Arc 8-Core iGPU, Intel Core Ultra 9 185H
92.3 pt
Geekom GT13 Pro
Intel Iris Xe Graphics G7 96EUs, Intel Core i9-13900H
59.1 pt
Khadas Mind
Intel Iris Xe Graphics G7 96EUs, Intel Core i7-1360P
55.8 pt
Geekom XT12 Pro
Intel Iris Xe Graphics G7 96EUs, Intel Core i9-12900H
55.3 pt
3DMark 11 - 1280x720 Performance GPU
Geekom A8
AMD Radeon 780M, AMD Ryzen 9 8945HS
13533 Points +82%
Aoostar GEM12
AMD Radeon 780M, AMD Ryzen 7 8845HS
13410 Points +81%
Minisforum EliteMini UM780 XTX
AMD Radeon 780M, AMD Ryzen 7 7840HS
13347 Points +80%
Acemagic F2A
Intel Arc 8-Core iGPU, Intel Core Ultra 7 155H
12085 Points +63%
Minisforum AtomMan X7 Ti
Intel Arc 8-Core iGPU, Intel Core Ultra 9 185H
11691 Points +57%
Geekom GT13 Pro
Intel Iris Xe Graphics G7 96EUs, Intel Core i9-13900H
7424 Points
Geekom XT12 Pro
Intel Iris Xe Graphics G7 96EUs, Intel Core i9-12900H
6975 Points -6%
Khadas Mind
Intel Iris Xe Graphics G7 96EUs, Intel Core i7-1360P
6722 Points -9%
3DMark
2560x1440 Time Spy Graphics
Acemagic F2A
Intel Arc 8-Core iGPU, Intel Core Ultra 7 155H
3205 Points +90%
Minisforum AtomMan X7 Ti
Intel Arc 8-Core iGPU, Intel Core Ultra 9 185H
3193 Points +89%
Geekom A8
AMD Radeon 780M, AMD Ryzen 9 8945HS
2901 Points +72%
Aoostar GEM12
AMD Radeon 780M, AMD Ryzen 7 8845HS
2846 Points +68%
Minisforum EliteMini UM780 XTX
AMD Radeon 780M, AMD Ryzen 7 7840HS
2832 Points +68%
Geekom GT13 Pro
Intel Iris Xe Graphics G7 96EUs, Intel Core i9-13900H
1690 Points
Khadas Mind
Intel Iris Xe Graphics G7 96EUs, Intel Core i7-1360P
1680 Points -1%
Geekom XT12 Pro
Intel Iris Xe Graphics G7 96EUs, Intel Core i9-12900H
1581 Points -6%
1920x1080 Fire Strike Graphics
Geekom A8
AMD Radeon 780M, AMD Ryzen 9 8945HS
8354 Points +44%
Minisforum EliteMini UM780 XTX
AMD Radeon 780M, AMD Ryzen 7 7840HS
8348 Points +44%
Aoostar GEM12
AMD Radeon 780M, AMD Ryzen 7 8845HS
8007 Points +38%
Acemagic F2A
Intel Arc 8-Core iGPU, Intel Core Ultra 7 155H
7710 Points +33%
Minisforum AtomMan X7 Ti
Intel Arc 8-Core iGPU, Intel Core Ultra 9 185H
7599 Points +31%
Geekom GT13 Pro
Intel Iris Xe Graphics G7 96EUs, Intel Core i9-13900H
5812 Points
Khadas Mind
Intel Iris Xe Graphics G7 96EUs, Intel Core i7-1360P
5461 Points -6%
Geekom XT12 Pro
Intel Iris Xe Graphics G7 96EUs, Intel Core i9-12900H
5421 Points -7%
Unigine Heaven 4.0
Extreme Preset OpenGL
Aoostar GEM12
AMD Radeon 780M, AMD Ryzen 7 8845HS
34.6 fps +38%
Minisforum EliteMini UM780 XTX
AMD Radeon 780M, AMD Ryzen 7 7840HS
34.5 fps +37%
Acemagic F2A
Intel Arc 8-Core iGPU, Intel Core Ultra 7 155H
31.6 fps +26%
Minisforum AtomMan X7 Ti
Intel Arc 8-Core iGPU, Intel Core Ultra 9 185H
29.7 fps +18%
Geekom A8
AMD Radeon 780M, AMD Ryzen 9 8945HS
27.3 fps +9%
Khadas Mind
Intel Iris Xe Graphics G7 96EUs, Intel Core i7-1360P
25.2 fps 0%
Geekom GT13 Pro
Intel Iris Xe Graphics G7 96EUs, Intel Core i9-13900H
25.1 fps
Geekom XT12 Pro
Intel Iris Xe Graphics G7 96EUs, Intel Core i9-12900H
21.8 fps -13%
Extreme Preset DX11
Aoostar GEM12
AMD Radeon 780M, AMD Ryzen 7 8845HS
36.3 fps +40%
Minisforum EliteMini UM780 XTX
AMD Radeon 780M, AMD Ryzen 7 7840HS
35.5 fps +37%
Minisforum AtomMan X7 Ti
Intel Arc 8-Core iGPU, Intel Core Ultra 9 185H
33.2 fps +28%
Geekom A8
AMD Radeon 780M, AMD Ryzen 9 8945HS
32.8 fps +26%
Acemagic F2A
Intel Arc 8-Core iGPU, Intel Core Ultra 7 155H
32.7 fps +26%
Geekom GT13 Pro
Intel Iris Xe Graphics G7 96EUs, Intel Core i9-13900H
26 fps
Khadas Mind
Intel Iris Xe Graphics G7 96EUs, Intel Core i7-1360P
25.6 fps -2%
Geekom XT12 Pro
Intel Iris Xe Graphics G7 96EUs, Intel Core i9-12900H
22.7 fps -13%
Unigine Valley 1.0
1920x1080 Extreme HD DirectX AA:x8
Aoostar GEM12
AMD Radeon 780M, AMD Ryzen 7 8845HS
24.5 fps +62%
Minisforum EliteMini UM780 XTX
AMD Radeon 780M, AMD Ryzen 7 7840HS
24 fps +59%
Geekom A8
AMD Radeon 780M, AMD Ryzen 9 8945HS
19.1 fps +26%
Minisforum AtomMan X7 Ti
Intel Arc 8-Core iGPU, Intel Core Ultra 9 185H
18.5 fps +23%
Khadas Mind
Intel Iris Xe Graphics G7 96EUs, Intel Core i7-1360P
17.2 fps +14%
Acemagic F2A
Intel Arc 8-Core iGPU, Intel Core Ultra 7 155H
17.1 fps +13%
Geekom GT13 Pro
Intel Iris Xe Graphics G7 96EUs, Intel Core i9-13900H
15.1 fps
Geekom XT12 Pro
Intel Iris Xe Graphics G7 96EUs, Intel Core i9-12900H
13.3 fps -12%
1920x1080 Extreme HD Preset OpenGL AA:x8
Minisforum AtomMan X7 Ti
Intel Arc 8-Core iGPU, Intel Core Ultra 9 185H
32.4 fps +106%
Aoostar GEM12
AMD Radeon 780M, AMD Ryzen 7 8845HS
21 fps +34%
Minisforum EliteMini UM780 XTX
AMD Radeon 780M, AMD Ryzen 7 7840HS
20.8 fps +32%
Khadas Mind
Intel Iris Xe Graphics G7 96EUs, Intel Core i7-1360P
20.4 fps +30%
Acemagic F2A
Intel Arc 8-Core iGPU, Intel Core Ultra 7 155H
18.3 fps +17%
Geekom GT13 Pro
Intel Iris Xe Graphics G7 96EUs, Intel Core i9-13900H
15.7 fps
Geekom A8
AMD Radeon 780M, AMD Ryzen 9 8945HS
15.2 fps -3%
Geekom XT12 Pro
Intel Iris Xe Graphics G7 96EUs, Intel Core i9-12900H
13.9 fps -11%
Unigine Superposition
1280x720 720p Low
Aoostar GEM12
AMD Radeon 780M, AMD Ryzen 7 8845HS
12174 Points +84%
Minisforum EliteMini UM780 XTX
AMD Radeon 780M, AMD Ryzen 7 7840HS
12023 Points +82%
Geekom A8
AMD Radeon 780M, AMD Ryzen 9 8945HS
10702 Points +62%
Acemagic F2A
Intel Arc 8-Core iGPU, Intel Core Ultra 7 155H
10491 Points +58%
Minisforum AtomMan X7 Ti
Intel Arc 8-Core iGPU, Intel Core Ultra 9 185H
10102 Points +53%
Geekom GT13 Pro
Intel Iris Xe Graphics G7 96EUs, Intel Core i9-13900H
6619 Points
Khadas Mind
Intel Iris Xe Graphics G7 96EUs, Intel Core i7-1360P
6265 Points -5%
Geekom XT12 Pro
Intel Iris Xe Graphics G7 96EUs, Intel Core i9-12900H
5950 Points -10%
1920x1080 1080p High
Minisforum EliteMini UM780 XTX
AMD Radeon 780M, AMD Ryzen 7 7840HS
3648 Points +58%
Aoostar GEM12
AMD Radeon 780M, AMD Ryzen 7 8845HS
3592 Points +56%
Acemagic F2A
Intel Arc 8-Core iGPU, Intel Core Ultra 7 155H
3391 Points +47%
Geekom A8
AMD Radeon 780M, AMD Ryzen 9 8945HS
3387 Points +47%
Minisforum AtomMan X7 Ti
Intel Arc 8-Core iGPU, Intel Core Ultra 9 185H
3341 Points +45%
Geekom GT13 Pro
Intel Iris Xe Graphics G7 96EUs, Intel Core i9-13900H
2306 Points
Khadas Mind
Intel Iris Xe Graphics G7 96EUs, Intel Core i7-1360P
2279 Points -1%
Geekom XT12 Pro
Intel Iris Xe Graphics G7 96EUs, Intel Core i9-12900H
2035 Points -12%
1920x1080 1080p Extreme
Acemagic F2A
Intel Arc 8-Core iGPU, Intel Core Ultra 7 155H
1920 Points +71%
Minisforum AtomMan X7 Ti
Intel Arc 8-Core iGPU, Intel Core Ultra 9 185H
1812 Points +61%
Minisforum EliteMini UM780 XTX
AMD Radeon 780M, AMD Ryzen 7 7840HS
1800 Points +60%
Aoostar GEM12
AMD Radeon 780M, AMD Ryzen 7 8845HS
1737 Points +55%
Geekom A8
AMD Radeon 780M, AMD Ryzen 9 8945HS
1585 Points +41%
Geekom GT13 Pro
Intel Iris Xe Graphics G7 96EUs, Intel Core i9-13900H
1124 Points
Khadas Mind
Intel Iris Xe Graphics G7 96EUs, Intel Core i7-1360P
1101 Points -2%
Geekom XT12 Pro
Intel Iris Xe Graphics G7 96EUs, Intel Core i9-12900H
1042 Points -7%
ComputeMark v2.1
1024x600 Normal, Score
Minisforum EliteMini UM780 XTX
AMD Radeon 780M, AMD Ryzen 7 7840HS
10102 Points +177%
Aoostar GEM12
AMD Radeon 780M, AMD Ryzen 7 8845HS
9494 Points +160%
Geekom A8
AMD Radeon 780M, AMD Ryzen 9 8945HS
8909 Points +144%
Acemagic F2A
Intel Arc 8-Core iGPU, Intel Core Ultra 7 155H
7480 Points +105%
Minisforum AtomMan X7 Ti
Intel Arc 8-Core iGPU, Intel Core Ultra 9 185H
6270 Points +72%
Geekom GT13 Pro
Intel Iris Xe Graphics G7 96EUs, Intel Core i9-13900H
3650 Points
Khadas Mind
Intel Iris Xe Graphics G7 96EUs, Intel Core i7-1360P
3605 Points -1%
Geekom XT12 Pro
Intel Iris Xe Graphics G7 96EUs, Intel Core i9-12900H
3390 Points -7%
1024x600 Normal, Fluid 3DTex
Geekom A8
AMD Radeon 780M, AMD Ryzen 9 8945HS
492 Points +72%
Aoostar GEM12
AMD Radeon 780M, AMD Ryzen 7 8845HS
483 Points +69%
Minisforum AtomMan X7 Ti
Intel Arc 8-Core iGPU, Intel Core Ultra 9 185H
469 Points +64%
Minisforum EliteMini UM780 XTX
AMD Radeon 780M, AMD Ryzen 7 7840HS
468 Points +64%
Acemagic F2A
Intel Arc 8-Core iGPU, Intel Core Ultra 7 155H
427 Points +49%
Khadas Mind
Intel Iris Xe Graphics G7 96EUs, Intel Core i7-1360P
385 Points +35%
Geekom GT13 Pro
Intel Iris Xe Graphics G7 96EUs, Intel Core i9-13900H
286 Points
Geekom XT12 Pro
Intel Iris Xe Graphics G7 96EUs, Intel Core i9-12900H
231 Points -19%
1024x600 Normal, Fluid 2DTexArr
Geekom A8
AMD Radeon 780M, AMD Ryzen 9 8945HS
492 Points +67%
Minisforum EliteMini UM780 XTX
AMD Radeon 780M, AMD Ryzen 7 7840HS
488 Points +66%
Aoostar GEM12
AMD Radeon 780M, AMD Ryzen 7 8845HS
481 Points +64%
Minisforum AtomMan X7 Ti
Intel Arc 8-Core iGPU, Intel Core Ultra 9 185H
462 Points +57%
Acemagic F2A
Intel Arc 8-Core iGPU, Intel Core Ultra 7 155H
422 Points +44%
Khadas Mind
Intel Iris Xe Graphics G7 96EUs, Intel Core i7-1360P
354 Points +20%
Geekom GT13 Pro
Intel Iris Xe Graphics G7 96EUs, Intel Core i9-13900H
294 Points
Geekom XT12 Pro
Intel Iris Xe Graphics G7 96EUs, Intel Core i9-12900H
246 Points -16%
1024x600 Normal, Mandel Vector
Minisforum EliteMini UM780 XTX
AMD Radeon 780M, AMD Ryzen 7 7840HS
2637 Points +202%
Aoostar GEM12
AMD Radeon 780M, AMD Ryzen 7 8845HS
2477 Points +184%
Geekom A8
AMD Radeon 780M, AMD Ryzen 9 8945HS
2356 Points +170%
Acemagic F2A
Intel Arc 8-Core iGPU, Intel Core Ultra 7 155H
1961 Points +125%
Minisforum AtomMan X7 Ti
Intel Arc 8-Core iGPU, Intel Core Ultra 9 185H
1620 Points +86%
Geekom GT13 Pro
Intel Iris Xe Graphics G7 96EUs, Intel Core i9-13900H
873 Points
Geekom XT12 Pro
Intel Iris Xe Graphics G7 96EUs, Intel Core i9-12900H
860 Points -1%
Khadas Mind
Intel Iris Xe Graphics G7 96EUs, Intel Core i7-1360P
830 Points -5%
1024x600 Normal, Mandel Scalar
Minisforum EliteMini UM780 XTX
AMD Radeon 780M, AMD Ryzen 7 7840HS
2757 Points +210%
Aoostar GEM12
AMD Radeon 780M, AMD Ryzen 7 8845HS
2519 Points +184%
Geekom A8
AMD Radeon 780M, AMD Ryzen 9 8945HS
2345 Points +164%
Acemagic F2A
Intel Arc 8-Core iGPU, Intel Core Ultra 7 155H
1594 Points +80%
Minisforum AtomMan X7 Ti
Intel Arc 8-Core iGPU, Intel Core Ultra 9 185H
1274 Points +43%
Geekom GT13 Pro
Intel Iris Xe Graphics G7 96EUs, Intel Core i9-13900H
888 Points
Geekom XT12 Pro
Intel Iris Xe Graphics G7 96EUs, Intel Core i9-12900H
872 Points -2%
Khadas Mind
Intel Iris Xe Graphics G7 96EUs, Intel Core i7-1360P
864 Points -3%
1024x600 Normal, QJuliaRayTrace
Minisforum EliteMini UM780 XTX
AMD Radeon 780M, AMD Ryzen 7 7840HS
3752 Points +186%
Aoostar GEM12
AMD Radeon 780M, AMD Ryzen 7 8845HS
3535 Points +170%
Geekom A8
AMD Radeon 780M, AMD Ryzen 9 8945HS
3225 Points +146%
Acemagic F2A
Intel Arc 8-Core iGPU, Intel Core Ultra 7 155H
3076 Points +135%
Minisforum AtomMan X7 Ti
Intel Arc 8-Core iGPU, Intel Core Ultra 9 185H
2444 Points +87%
Geekom GT13 Pro
Intel Iris Xe Graphics G7 96EUs, Intel Core i9-13900H
1310 Points
Geekom XT12 Pro
Intel Iris Xe Graphics G7 96EUs, Intel Core i9-12900H
1182 Points -10%
Khadas Mind
Intel Iris Xe Graphics G7 96EUs, Intel Core i7-1360P
1174 Points -10%
LuxMark v2.0 64Bit
Room GPUs-only
Geekom A8
AMD Radeon 780M, AMD Ryzen 9 8945HS
1173 Samples/s +80%
Minisforum EliteMini UM780 XTX
AMD Radeon 780M, AMD Ryzen 7 7840HS
807 Samples/s +24%
Aoostar GEM12
AMD Radeon 780M, AMD Ryzen 7 8845HS
801 Samples/s +23%
Geekom GT13 Pro
Intel Iris Xe Graphics G7 96EUs, Intel Core i9-13900H
651 Samples/s
Minisforum AtomMan X7 Ti
Intel Arc 8-Core iGPU, Intel Core Ultra 9 185H
640 Samples/s -2%
Acemagic F2A
Intel Arc 8-Core iGPU, Intel Core Ultra 7 155H
549 Samples/s -16%
Sala GPUs-only
Minisforum AtomMan X7 Ti
Intel Arc 8-Core iGPU, Intel Core Ultra 9 185H
2732 Samples/s +30%
Acemagic F2A
Intel Arc 8-Core iGPU, Intel Core Ultra 7 155H
2319 Samples/s +10%
Geekom GT13 Pro
Intel Iris Xe Graphics G7 96EUs, Intel Core i9-13900H
2104 Samples/s
Minisforum EliteMini UM780 XTX
AMD Radeon 780M, AMD Ryzen 7 7840HS
1546 Samples/s -27%
Aoostar GEM12
AMD Radeon 780M, AMD Ryzen 7 8845HS
1496 Samples/s -29%
Geekom A8
AMD Radeon 780M, AMD Ryzen 9 8945HS
991 Samples/s -53%
Affinity Photo 2 - Combined (Single / Multi GPU)
Minisforum AtomMan X7 Ti
Intel Arc 8-Core iGPU, Intel Core Ultra 9 185H
5308 Points +19%
Acemagic F2A
Intel Arc 8-Core iGPU, Intel Core Ultra 7 155H
4928 Points +10%
Geekom GT13 Pro
Intel Iris Xe Graphics G7 96EUs, Intel Core i9-13900H
4460 Points
Geekom XT12 Pro
Intel Iris Xe Graphics G7 96EUs, Intel Core i9-12900H
3830 Points -14%
Khadas Mind
Intel Iris Xe Graphics G7 96EUs, Intel Core i7-1360P
3724 Points -17%
Aoostar GEM12
AMD Radeon 780M, AMD Ryzen 7 8845HS
1709 Points -62%
Geekom A8
AMD Radeon 780M, AMD Ryzen 9 8945HS
1512 Points -66%
Minisforum EliteMini UM780 XTX
AMD Radeon 780M, AMD Ryzen 7 7840HS
1399 Points -69%
Photoshop PugetBench - GPU Score
Geekom A8
AMD Radeon 780M, AMD Ryzen 9 8945HS
114.5 Points +30%
Aoostar GEM12
AMD Radeon 780M, AMD Ryzen 7 8845HS
103.4 Points +17%
Acemagic F2A
Intel Arc 8-Core iGPU, Intel Core Ultra 7 155H
98 Points +11%
Minisforum AtomMan X7 Ti
Intel Arc 8-Core iGPU, Intel Core Ultra 9 185H
92.3 Points +4%
Geekom GT13 Pro
Intel Iris Xe Graphics G7 96EUs, Intel Core i9-13900H
88.4 Points
Geekom XT12 Pro
Intel Iris Xe Graphics G7 96EUs, Intel Core i9-12900H
79.4 Points -10%
Premiere Pro PugetBench - GPU 0.9
Acemagic F2A
Intel Arc 8-Core iGPU, Intel Core Ultra 7 155H
16.8 Points +107%
Aoostar GEM12
AMD Radeon 780M, AMD Ryzen 7 8845HS
11.4 Points +41%
Geekom A8
AMD Radeon 780M, AMD Ryzen 9 8945HS
11.2 Points +38%
Geekom GT13 Pro
Intel Iris Xe Graphics G7 96EUs, Intel Core i9-13900H
8.1 Points
Geekom XT12 Pro
Intel Iris Xe Graphics G7 96EUs, Intel Core i9-12900H
7.6 Points -6%
Khadas Mind
Intel Iris Xe Graphics G7 96EUs, Intel Core i7-1360P
7.2 Points -11%
Minisforum AtomMan X7 Ti
Intel Arc 8-Core iGPU, Intel Core Ultra 9 185H
6.8 Points -16%
DaVinci Resolve PugetBench - GPU Effects 0.93
Aoostar GEM12
AMD Radeon 780M, AMD Ryzen 7 8845HS
20 Points +67%
Acemagic F2A
Intel Arc 8-Core iGPU, Intel Core Ultra 7 155H
17 Points +42%
Geekom GT13 Pro
Intel Iris Xe Graphics G7 96EUs, Intel Core i9-13900H
12 Points
Geekom XT12 Pro
Intel Iris Xe Graphics G7 96EUs, Intel Core i9-12900H
11 Points -8%
Geekom GT13 Pro, Intel Iris Xe Graphics G7 96EUs
i9-13900H
Geekom XT12 Pro, Intel Iris Xe Graphics G7 96EUs
i9-12900H
Khadas Mind, Intel Iris Xe Graphics G7 96EUs
i7-1360P
Aoostar GEM12, AMD Radeon 780M
R7 8845HS
Minisforum AtomMan X7 Ti, Intel Arc 8-Core iGPU
Ultra 9 185H
Geekom A8, AMD Radeon 780M
R9 8945HS
Acemagic F2A, Intel Arc 8-Core iGPU
Ultra 7 155H
Minisforum EliteMini UM780 XTX, AMD Radeon 780M
R7 7840HS
Average of class Mini PC
 
SPECviewperf 12
-5%
-9%
662%
20%
674%
26%
725%
434%
1900x1060 3ds Max (3dsmax-05)
41.4
40.1
-3%
37.8
-9%
85.7
107%
49.7
20%
87.4
111%
49.8
20%
85
105%
1900x1060 Catia (catia-04)
38.6
37.1
-4%
39.4
2%
86.6
124%
51.3
33%
86.4
124%
48.2
25%
89.8
133%
1900x1060 Creo (creo-01)
28.2
26.9
-5%
7.37
-74%
53.3
89%
22.7
-20%
55.1
95%
23.1
-18%
51.1
81%
1900x1060 Energy (energy-01)
0.41
0.4
-2%
0.46
12%
18.4
4388%
0.67
63%
19
4534%
0.91
122%
20.1
4802%
1900x1060 Maya (maya-04)
42.4
38.3
-10%
41.3
-3%
67.3
59%
58
37%
75
77%
54.9
29%
73.4
73%
1900x1060 Medical (medical-01)
12.2
11.8
-3%
12
-2%
51.4
321%
15.9
30%
47.7
291%
16.9
39%
61.7
406%
1900x1060 Showcase (showcase-01)
19.1
16.6
-13%
21.2
11%
30.3
59%
19.9
4%
25.8
35%
18.2
-5%
30.1
58%
1900x1060 Solidworks (sw-03)
46.6
45.3
-3%
41.6
-11%
114
145%
43
-8%
106
127%
42.7
-8%
113
142%
SPECviewperf 13
-5%
-3%
165%
13%
160%
14%
186%
94%
3ds Max (3dsmax-06)
41.2
40.1
-3%
39
-5%
82.4
100%
48.5
18%
85.8
108%
46.4
13%
86.1
109%
Catia (catia-05)
54.7
51.3
-6%
57.1
4%
124
127%
76.8
40%
126
130%
71.6
31%
132
141%
Creo (creo-02)
42.7
41.1
-4%
37.5
-12%
90.7
112%
29.3
-31%
92.8
117%
29.6
-31%
93.6
119%
Energy (energy-02)
4.62
4.5
-3%
4.34
-6%
22.2
381%
5.27
14%
22.6
389%
5.69
23%
25.8
458%
Maya (maya-05)
51.6
47.5
-8%
46.3
-10%
109
111%
62.5
21%
103
100%
59.5
15%
108
109%
Medical (medical-02)
15.6
14.4
-8%
16
3%
70.5
352%
25
60%
69.2
344%
29.7
90%
79.8
412%
Showcase (showcase-02)
19.1
17.3
-9%
21.4
12%
29.9
57%
19.9
4%
24.2
27%
18.2
-5%
30
57%
Solidworks (sw-04)
58.3
57.1
-2%
53.7
-8%
104
78%
45.6
-22%
97.3
67%
44.8
-23%
107
84%
SPECviewperf 2020
-2%
-1%
309%
38%
367%
29%
288%
185%
3840x2160 Medical (medical-03)
2.69
3.49
30%
2.67
-1%
11.2
316%
4.23
57%
10.9
305%
5.05
88%
12
346%
3840x2160 Energy (energy-03)
3.17
3.05
-4%
2.97
-6%
19.9
528%
6.03
90%
31
878%
4.61
45%
15.4
386%
3840x2160 Creo (creo-03)
16.3
14.8
-9%
16.9
4%
33.4
105%
18.5
13%
35.6
118%
17.9
10%
31.4
93%
3840x2160 CATIA (catia-06)
8.53
7.78
-9%
8.82
3%
23.2
172%
11.1
30%
24.6
188%
10
17%
24.4
186%
3840x2160 3ds Max (3dsmax-07)
10.3
9.69
-6%
10.1
-2%
20.4
98%
14.9
45%
21
104%
12.9
25%
21
104%
3840x2160 Siemens NX (snx-04)
6.62
6.29
-5%
6.01
-9%
64.1
868%
6.24
-6%
65.9
895%
5.7
-14%
61.5
829%
3840x2160 Maya (maya-06)
27.3
23.9
-12%
27.8
2%
47.7
75%
37.7
38%
50.1
84%
35.4
30%
47.2
73%
Total Average (Program / Settings)
-4% / -4%
-4% / -5%
379% / 381%
24% / 23%
400% / 402%
23% / 23%
400% / 405%
238% / 240%
3DMark 05 Standard
43190 pkt.
3DMark 06 Standard Score
33774 pkt.
3DMark Vantage P Result
28241 pkt.
3DMark 11 Performance
8027 pkt.
3DMark Ice Storm Standard Score
147975 pkt.
3DMark Cloud Gate Standard Score
27505 pkt.
3DMark Fire Strike Score
5420 pkt.
3DMark Fire Strike Extreme Score
2573 pkt.
3DMark Time Spy Score
1926 pkt.
3DMark Steel Nomad Score
186 pkt.
3DMark Steel Nomad Light Score
1283 pkt.
Pomoc

Wydajność w grach

Wiele współczesnych gier przeciąża procesor graficzny Intel Iris Xe. Niemniej jednak widzimy, że w niektórych grach nadal można osiągnąć grywalną liczbę klatek na sekundę, jeśli poświęci się poziom szczegółowości. Niemniej jednak nie możemy zaświadczyć, że Geekom GT13 Pro nadaje się do gier w tej konfiguracji. Zauważalnie wyższą wydajność 3D można uzyskać dzięki Geekom A8 lub Aoostar GEM12. Alternatywnie, mogą Państwo również spojrzeć na Minisforum AtomMan X7 Ti który otrzymał znacznie wydajniejsze iGPU z SoC Intel Meteor Lake.

Cyberpunk 2077 2.1 Phantom Liberty
1920x1080 Low Preset (FSR off)
Geekom A8
Radeon 780M, R9 8945HS, Acer N5000
44 (37.6min) fps +142%
Aoostar GEM12
Radeon 780M, R7 8845HS, Crucial P3 Plus CT1000P3PSSD8
42.4 (35.7min) fps +133%
Minisforum AtomMan X7 Ti
Arc 8-Core, Ultra 9 185H, Kingston OM8PGP41024Q-A0
34.3 (29.1min) fps +88%
Acemagic F2A
Arc 8-Core, Ultra 7 155H, Kingston OM8SEP1024Q-A0
29.5 (24.1min) fps +62%
Geekom GT13 Pro
Iris Xe G7 96EUs, i9-13900H, Acer N7000
18.2 (14.7min) fps
Geekom XT12 Pro
Iris Xe G7 96EUs, i9-12900H, Lexar SSD NM7A1 1TB
16.4 (13.6min) fps -10%
1920x1080 High Preset (FSR off)
Aoostar GEM12
Radeon 780M, R7 8845HS, Crucial P3 Plus CT1000P3PSSD8
26.3 (22.2min) fps +105%
Minisforum AtomMan X7 Ti
Arc 8-Core, Ultra 9 185H, Kingston OM8PGP41024Q-A0
24 (20.6min) fps +88%
Geekom A8
Radeon 780M, R9 8945HS, Acer N5000
22.4 (15.6min) fps +75%
Acemagic F2A
Arc 8-Core, Ultra 7 155H, Kingston OM8SEP1024Q-A0
20.4 (13.8min) fps +59%
Geekom GT13 Pro
Iris Xe G7 96EUs, i9-13900H, Acer N7000
12.8 (10.9min) fps
Geekom XT12 Pro
Iris Xe G7 96EUs, i9-12900H, Lexar SSD NM7A1 1TB
11.5 (10min) fps -10%
Baldur's Gate 3
1920x1080 Low Preset
Aoostar GEM12
Radeon 780M, R7 8845HS, Crucial P3 Plus CT1000P3PSSD8
38.6 (26.3min, 27.1P0.1, 29.9P1) fps +114%
Geekom GT13 Pro
Iris Xe G7 96EUs, i9-13900H, Acer N7000
18 (5.95min, 5.96P0.1, 6.91P1) fps
1920x1080 High Preset
Aoostar GEM12
Radeon 780M, R7 8845HS, Crucial P3 Plus CT1000P3PSSD8
24.7 (16.6min, 17.1P0.1, 19.4P1) fps +111%
Geekom GT13 Pro
Iris Xe G7 96EUs, i9-13900H, Acer N7000
11.7 (3.43min, 3.51P0.1, 3.99P1) fps
Borderlands 3
1280x720 Very Low Overall Quality (DX11)
Geekom A8
Radeon 780M, R9 8945HS, Acer N5000
102.5 fps +88%
Aoostar GEM12
Radeon 780M, R7 8845HS, Crucial P3 Plus CT1000P3PSSD8
100.3 fps +84%
Minisforum EliteMini UM780 XTX
Radeon 780M, R7 7840HS, Kingston OM8PGP41024Q-A0
97.3 fps +79%
Minisforum AtomMan X7 Ti
Arc 8-Core, Ultra 9 185H, Kingston OM8PGP41024Q-A0
93 fps +71%
Acemagic F2A
Arc 8-Core, Ultra 7 155H, Kingston OM8SEP1024Q-A0
68.5 fps +26%
Geekom GT13 Pro
Iris Xe G7 96EUs, i9-13900H, Acer N7000
54.4 fps
Khadas Mind
Iris Xe G7 96EUs, i7-1360P, WD PC SN740 SDDPTQD-1T00
50.7 fps -7%
Geekom XT12 Pro
Iris Xe G7 96EUs, i9-12900H, Lexar SSD NM7A1 1TB
49.2 fps -10%
1920x1080 High Overall Quality (DX11)
Minisforum EliteMini UM780 XTX
Radeon 780M, R7 7840HS, Kingston OM8PGP41024Q-A0
33.3 fps +99%
Aoostar GEM12
Radeon 780M, R7 8845HS, Crucial P3 Plus CT1000P3PSSD8
31.7 fps +90%
Minisforum AtomMan X7 Ti
Arc 8-Core, Ultra 9 185H, Kingston OM8PGP41024Q-A0
28.7 fps +72%
Geekom A8
Radeon 780M, R9 8945HS, Acer N5000
27.8 fps +66%
Acemagic F2A
Arc 8-Core, Ultra 7 155H, Kingston OM8SEP1024Q-A0
27.7 fps +66%
Geekom GT13 Pro
Iris Xe G7 96EUs, i9-13900H, Acer N7000
16.7 fps
Khadas Mind
Iris Xe G7 96EUs, i7-1360P, WD PC SN740 SDDPTQD-1T00
15.3 fps -8%
Geekom XT12 Pro
Iris Xe G7 96EUs, i9-12900H, Lexar SSD NM7A1 1TB
14.9 fps -11%
GTA V
1024x768 Lowest Settings possible
Geekom A8
Radeon 780M, R9 8945HS, Acer N5000
166.9 (5.05min, 125P1) fps +39%
Aoostar GEM12
Radeon 780M, R7 8845HS, Crucial P3 Plus CT1000P3PSSD8
165.1 (4.83min, 125P1) fps +38%
Minisforum EliteMini UM780 XTX
Radeon 780M, R7 7840HS, Kingston OM8PGP41024Q-A0
164.4 (4.9min, 111.1P1) fps +37%
Minisforum AtomMan X7 Ti
Arc 8-Core, Ultra 9 185H, Kingston OM8PGP41024Q-A0
163.6 (4.63min, 111.1P1) fps +37%
Acemagic F2A
Arc 8-Core, Ultra 7 155H, Kingston OM8SEP1024Q-A0
161 (4.76min, 100P1) fps +35%
Geekom GT13 Pro
Iris Xe G7 96EUs, i9-13900H, Acer N7000
119.7 (7.51min, 66.7P1) fps
Khadas Mind
Iris Xe G7 96EUs, i7-1360P, WD PC SN740 SDDPTQD-1T00
112.7 (9.9min, 71.4P1) fps -6%
1920x1080 High/On (Advanced Graphics Off) AA:2xMSAA + FX AF:8x
Minisforum EliteMini UM780 XTX
Radeon 780M, R7 7840HS, Kingston OM8PGP41024Q-A0
66.9 (3.09min, 45.5P1) fps +204%
Aoostar GEM12
Radeon 780M, R7 8845HS, Crucial P3 Plus CT1000P3PSSD8
65.3 (4.57min, 45.5P1) fps +197%
Geekom A8
Radeon 780M, R9 8945HS, Acer N5000
64.7 (4.56min, 31.3P1) fps +194%
Minisforum AtomMan X7 Ti
Arc 8-Core, Ultra 9 185H, Kingston OM8PGP41024Q-A0
41.2 (3.12min, 30.3P1) fps +87%
Acemagic F2A
Arc 8-Core, Ultra 7 155H, Kingston OM8SEP1024Q-A0
31.3 (2.94min, 22.7P1) fps +42%
Khadas Mind
Iris Xe G7 96EUs, i7-1360P, WD PC SN740 SDDPTQD-1T00
23.6 (10.9min, 18.2P1) fps +7%
Geekom GT13 Pro
Iris Xe G7 96EUs, i9-13900H, Acer N7000
22 (6.3min, 16.4P1) fps
Far Cry 5
1280x720 Low Preset AA:T
Geekom A8
Radeon 780M, R9 8945HS, Acer N5000
88 (77min) fps +52%
Minisforum EliteMini UM780 XTX
Radeon 780M, R7 7840HS, Kingston OM8PGP41024Q-A0
87 (75min) fps +50%
Aoostar GEM12
Radeon 780M, R7 8845HS, Crucial P3 Plus CT1000P3PSSD8
84 (73min) fps +45%
Minisforum AtomMan X7 Ti
Arc 8-Core, Ultra 9 185H, Kingston OM8PGP41024Q-A0
79 (39min) fps +36%
Acemagic F2A
Arc 8-Core, Ultra 7 155H, Kingston OM8SEP1024Q-A0
69 (25min) fps +19%
Geekom GT13 Pro
Iris Xe G7 96EUs, i9-13900H, Acer N7000
58 (52min) fps
Khadas Mind
Iris Xe G7 96EUs, i7-1360P, WD PC SN740 SDDPTQD-1T00
54 (44min) fps -7%
Geekom XT12 Pro
Iris Xe G7 96EUs, i9-12900H, Lexar SSD NM7A1 1TB
50 (45min) fps -14%
1920x1080 High Preset AA:T
Minisforum EliteMini UM780 XTX
Radeon 780M, R7 7840HS, Kingston OM8PGP41024Q-A0
47 (42min) fps +68%
Aoostar GEM12
Radeon 780M, R7 8845HS, Crucial P3 Plus CT1000P3PSSD8
45 (39min) fps +61%
Minisforum AtomMan X7 Ti
Arc 8-Core, Ultra 9 185H, Kingston OM8PGP41024Q-A0
42 (34min) fps +50%
Geekom A8
Radeon 780M, R9 8945HS, Acer N5000
42 (33min) fps +50%
Acemagic F2A
Arc 8-Core, Ultra 7 155H, Kingston OM8SEP1024Q-A0
37 (30min) fps +32%
Geekom GT13 Pro
Iris Xe G7 96EUs, i9-13900H, Acer N7000
28 (20min) fps
Khadas Mind
Iris Xe G7 96EUs, i7-1360P, WD PC SN740 SDDPTQD-1T00
26 (23min) fps -7%
Geekom XT12 Pro
Iris Xe G7 96EUs, i9-12900H, Lexar SSD NM7A1 1TB
23 (21min) fps -18%
Far Cry New Dawn
1280x720 Low Preset
Geekom A8
Radeon 780M, R9 8945HS, Acer N5000
76 (58min) fps +46%
Minisforum EliteMini UM780 XTX
Radeon 780M, R7 7840HS, Kingston OM8PGP41024Q-A0
75 (58min) fps +44%
Aoostar GEM12
Radeon 780M, R7 8845HS, Crucial P3 Plus CT1000P3PSSD8
72 (54min) fps +38%
Minisforum AtomMan X7 Ti
Arc 8-Core, Ultra 9 185H, Kingston OM8PGP41024Q-A0
69 (2min) fps +33%
Acemagic F2A
Arc 8-Core, Ultra 7 155H, Kingston OM8SEP1024Q-A0
65 (11min) fps +25%
Geekom GT13 Pro
Iris Xe G7 96EUs, i9-13900H, Acer N7000
52 (39min) fps
Khadas Mind
Iris Xe G7 96EUs, i7-1360P, WD PC SN740 SDDPTQD-1T00
49 (32min) fps -6%
Geekom XT12 Pro
Iris Xe G7 96EUs, i9-12900H, Lexar SSD NM7A1 1TB
47 (31min) fps -10%
1920x1080 High Preset
Minisforum EliteMini UM780 XTX
Radeon 780M, R7 7840HS, Kingston OM8PGP41024Q-A0
45 (37min) fps +55%
Geekom A8
Radeon 780M, R9 8945HS, Acer N5000
44 (37min) fps +52%
Aoostar GEM12
Radeon 780M, R7 8845HS, Crucial P3 Plus CT1000P3PSSD8
41 (32min) fps +41%
Minisforum AtomMan X7 Ti
Arc 8-Core, Ultra 9 185H, Kingston OM8PGP41024Q-A0
39 (25min) fps +34%
Acemagic F2A
Arc 8-Core, Ultra 7 155H, Kingston OM8SEP1024Q-A0
37 (25min) fps +28%
Geekom GT13 Pro
Iris Xe G7 96EUs, i9-13900H, Acer N7000
29 (23min) fps
Khadas Mind
Iris Xe G7 96EUs, i7-1360P, WD PC SN740 SDDPTQD-1T00
27 (20min) fps -7%
Geekom XT12 Pro
Iris Xe G7 96EUs, i9-12900H, Lexar SSD NM7A1 1TB
24 (18min) fps -17%
Dota 2 Reborn
1280x720 min (0/3) fastest
Minisforum EliteMini UM780 XTX
Radeon 780M, R7 7840HS, Kingston OM8PGP41024Q-A0
161.5 (141.6min) fps +47%
Geekom A8
Radeon 780M, R9 8945HS, Acer N5000
159.7 (142.1min) fps +45%
Aoostar GEM12
Radeon 780M, R7 8845HS, Crucial P3 Plus CT1000P3PSSD8
152.7 (134.2min) fps +39%
Geekom GT13 Pro
Iris Xe G7 96EUs, i9-13900H, Acer N7000
109.8 (85min) fps
Minisforum AtomMan X7 Ti
Arc 8-Core, Ultra 9 185H, Kingston OM8PGP41024Q-A0
106.5 (61min) fps -3%
Geekom XT12 Pro
Iris Xe G7 96EUs, i9-12900H, Lexar SSD NM7A1 1TB
106.3 (81.7min) fps -3%
Khadas Mind
Iris Xe G7 96EUs, i7-1360P, WD PC SN740 SDDPTQD-1T00
104.2 (79.7min) fps -5%
Acemagic F2A
Arc 8-Core, Ultra 7 155H, Kingston OM8SEP1024Q-A0
103.2 (59.8min) fps -6%
1920x1080 high (2/3)
Minisforum EliteMini UM780 XTX
Radeon 780M, R7 7840HS, Kingston OM8PGP41024Q-A0
97.45 (86.9min) fps +49%
Geekom A8
Radeon 780M, R9 8945HS, Acer N5000
88.3 (74.1min) fps +35%
Aoostar GEM12
Radeon 780M, R7 8845HS, Crucial P3 Plus CT1000P3PSSD8
86.6 (72.2min) fps +32%
Minisforum AtomMan X7 Ti
Arc 8-Core, Ultra 9 185H, Kingston OM8PGP41024Q-A0
79 (48.2min) fps +21%
Acemagic F2A
Arc 8-Core, Ultra 7 155H, Kingston OM8SEP1024Q-A0
77.3 (52.5min) fps +18%
Geekom GT13 Pro
Iris Xe G7 96EUs, i9-13900H, Acer N7000
65.5 (56.1min) fps
Khadas Mind
Iris Xe G7 96EUs, i7-1360P, WD PC SN740 SDDPTQD-1T00
61.7 (51.7min) fps -6%
Geekom XT12 Pro
Iris Xe G7 96EUs, i9-12900H, Lexar SSD NM7A1 1TB
61.3 (54.1min) fps -6%
F1 2020
1280x720 Ultra Low Preset
Minisforum EliteMini UM780 XTX
Radeon 780M, R7 7840HS, Kingston OM8PGP41024Q-A0
201 (180min) fps +114%
Geekom A8
Radeon 780M, R9 8945HS, Acer N5000
197.3 (171min) fps +110%
Aoostar GEM12
Radeon 780M, R7 8845HS, Crucial P3 Plus CT1000P3PSSD8
184.7 (163min) fps +97%
Minisforum AtomMan X7 Ti
Arc 8-Core, Ultra 9 185H, Kingston OM8PGP41024Q-A0
139.1 (126min) fps +48%
Geekom GT13 Pro
Iris Xe G7 96EUs, i9-13900H, Acer N7000
93.8 (83min) fps
Geekom XT12 Pro
Iris Xe G7 96EUs, i9-12900H, Lexar SSD NM7A1 1TB
84.5 (74min) fps -10%
1920x1080 High Preset AA:T AF:16x
Minisforum EliteMini UM780 XTX
Radeon 780M, R7 7840HS, Kingston OM8PGP41024Q-A0
79.3 (67min) fps +105%
Geekom A8
Radeon 780M, R9 8945HS, Acer N5000
76.4 (67min) fps +97%
Aoostar GEM12
Radeon 780M, R7 8845HS, Crucial P3 Plus CT1000P3PSSD8
73.6 (62min) fps +90%
Minisforum AtomMan X7 Ti
Arc 8-Core, Ultra 9 185H, Kingston OM8PGP41024Q-A0
60.5 (51min) fps +56%
Geekom GT13 Pro
Iris Xe G7 96EUs, i9-13900H, Acer N7000
38.7 (32min) fps
Geekom XT12 Pro
Iris Xe G7 96EUs, i9-12900H, Lexar SSD NM7A1 1TB
34.2 (29min) fps -12%
GRID Legends
1280x720 Low Preset
Minisforum EliteMini UM780 XTX
Radeon 780M, R7 7840HS, Kingston OM8PGP41024Q-A0
150.6 (52.6min) fps +115%
Geekom A8
Radeon 780M, R9 8945HS, Acer N5000
141.4 (2.69min) fps +102%
Aoostar GEM12
Radeon 780M, R7 8845HS, Crucial P3 Plus CT1000P3PSSD8
136.2 (6.48min) fps +95%
Minisforum AtomMan X7 Ti
Arc 8-Core, Ultra 9 185H, Kingston OM8PGP41024Q-A0
86.6 (7.26min) fps +24%
Acemagic F2A
Arc 8-Core, Ultra 7 155H, Kingston OM8SEP1024Q-A0
80 (35min) fps +14%
Geekom GT13 Pro
Iris Xe G7 96EUs, i9-13900H, Acer N7000
69.9 (30min) fps
Khadas Mind
Iris Xe G7 96EUs, i7-1360P, WD PC SN740 SDDPTQD-1T00
53.5 (25.6min) fps -23%
1920x1080 High Preset
Minisforum EliteMini UM780 XTX
Radeon 780M, R7 7840HS, Kingston OM8PGP41024Q-A0
68.8 (34.8min) fps +123%
Aoostar GEM12
Radeon 780M, R7 8845HS, Crucial P3 Plus CT1000P3PSSD8
62.3 (30.5min) fps +102%
Geekom A8
Radeon 780M, R9 8945HS, Acer N5000
56.4 (21.6min) fps +83%
Minisforum AtomMan X7 Ti
Arc 8-Core, Ultra 9 185H, Kingston OM8PGP41024Q-A0
44.8 (29.3min) fps +45%
Acemagic F2A
Arc 8-Core, Ultra 7 155H, Kingston OM8SEP1024Q-A0
41.7 (24min) fps +35%
Geekom GT13 Pro
Iris Xe G7 96EUs, i9-13900H, Acer N7000
30.8 (20.2min) fps
Khadas Mind
Iris Xe G7 96EUs, i7-1360P, WD PC SN740 SDDPTQD-1T00
27.1 (19.2min) fps -12%
Shadow of the Tomb Raider
1280x720 Lowest Preset
Acemagic F2A
Arc 8-Core, Ultra 7 155H, Kingston OM8SEP1024Q-A0
131.4 fps +130%
Minisforum EliteMini UM780 XTX
Radeon 780M, R7 7840HS, Kingston OM8PGP41024Q-A0
109.2 fps +91%
Aoostar GEM12
Radeon 780M, R7 8845HS, Crucial P3 Plus CT1000P3PSSD8
103.8 fps +82%
Minisforum AtomMan X7 Ti
Arc 8-Core, Ultra 9 185H, Kingston OM8PGP41024Q-A0
79.3 fps +39%
Geekom A8
Radeon 780M, R9 8945HS, Acer N5000
65.9 fps +15%
Geekom GT13 Pro
Iris Xe G7 96EUs, i9-13900H, Acer N7000
57.1 fps
Khadas Mind
Iris Xe G7 96EUs, i7-1360P, WD PC SN740 SDDPTQD-1T00
43.7 fps -23%
Geekom XT12 Pro
Iris Xe G7 96EUs, i9-12900H, Lexar SSD NM7A1 1TB
39.6 fps -31%
1920x1080 High Preset AA:SM
Acemagic F2A
Arc 8-Core, Ultra 7 155H, Kingston OM8SEP1024Q-A0
49.5 fps +137%
Minisforum EliteMini UM780 XTX
Radeon 780M, R7 7840HS, Kingston OM8PGP41024Q-A0
41.2 fps +97%
Aoostar GEM12
Radeon 780M, R7 8845HS, Crucial P3 Plus CT1000P3PSSD8
39.5 fps +89%
Minisforum AtomMan X7 Ti
Arc 8-Core, Ultra 9 185H, Kingston OM8PGP41024Q-A0
35.8 fps +71%
Geekom A8
Radeon 780M, R9 8945HS, Acer N5000
23.4 fps +12%
Khadas Mind
Iris Xe G7 96EUs, i7-1360P, WD PC SN740 SDDPTQD-1T00
22.5 fps +8%
Geekom GT13 Pro
Iris Xe G7 96EUs, i9-13900H, Acer N7000
20.9 fps
Geekom XT12 Pro
Iris Xe G7 96EUs, i9-12900H, Lexar SSD NM7A1 1TB
18.8 fps -10%

FPS chart

05101520Tooltip
Geekom GT13 Pro i9-13900H, Iris Xe G7 96EUs: Ø11.1 (5.97-12.3)
Aoostar GEM12 R7 8845HS, Radeon 780M: Ø21.7 (20.1-23.3)
low med. high ultra
GTA V (2015) 119.7 97.4 22 9.07
Dota 2 Reborn (2015) 109.8 80.2 65.5 58.6
Final Fantasy XV Benchmark (2018) 45.1 25.3 18.2
Far Cry 5 (2018) 58 30 28 27
Strange Brigade (2018) 98.7 42.5 33.8 26.9
Shadow of the Tomb Raider (2018) 57.1 22.2 20.9 18
Far Cry New Dawn (2019) 52 31 29 27
Metro Exodus (2019) 38.5 19.1 14.2 11.2
Total War: Three Kingdoms (2019) 100.3 39.6 30.2 22.2
Borderlands 3 (2019) 54.4 26.5 16.7 12.7
F1 2020 (2020) 93.8 49.1 38.7 24.9
F1 2021 (2021) 105.6 52.2 39.9 29.4
GRID Legends (2022) 58.8 40.2 30.8 27.9
Tiny Tina's Wonderlands (2022) 34 26.4 16.7 13.2
F1 22 (2022) 46.3 43.1 31.2 24.9
F1 23 (2023) 43.2 39.4 28 21.9
Baldur's Gate 3 (2023) 18 14 11.7 11.2
Cyberpunk 2077 2.1 Phantom Liberty (2023) 18.2 14.7 12.8 11.5
Total War Pharaoh (2023) 68.9 48.8 34.8 30.9
Prince of Persia The Lost Crown (2024) 132.8 93.4 87.8
F1 24 (2024) 40.4 35.4 25.6 20.4

Sprawdzenie wydajności Geekom GT13 Pro z Razer Core X

Razer Core X z Nvidia GeForce RTX 3060 Ti

Geekom GT13 Pro umożliwia korzystanie z zewnętrznych kart graficznych, które można podłączyć przez USB4. Przyjrzeliśmy się bliżej wydajności w połączeniu z Razer Core X i Nvidia GeForce RTX 3060 Ti. Zgodnie z oczekiwaniami, wydajność 3D może zostać znacznie zwiększona. Dzięki tej kombinacji mini-PC obejmuje szeroki zakres zadań i nadaje się zarówno do gier, jak i edycji wideo. Wydajność karty graficznej Nvidia GeForce RTX 3060 Ti, która jest podłączona tylko przez USB4, nie może nadążyć za wydajnością konwencjonalnego komputera stacjonarnego. Dostępna przepustowość do komunikacji z zewnętrzną kartą graficzną jest dostępna tylko z prędkością PCIe x4 3.0.

Geekom GT13 Pro z Razer Core X i Nvidia GeForce RTX 3060 Ti

Performance Rating - Percent
Geekom A8 (Nvidia GeForce RTX 3060 Ti FE @TB3)
AMD Ryzen 9 8945HS
99.2 pt
Geekom GT13 Pro (Nvidia GeForce RTX 3060 Ti FE @TB3)
Intel Core i9-13900H
98 pt
Geekom XT12 Pro (Nvidia GeForce RTX 3060 Ti FE @TB3)
Intel Core i9-12900H
95.4 pt
3DMark 11 - 1280x720 Performance GPU
Geekom A8 (Nvidia GeForce RTX 3060 Ti FE @TB3)
AMD Ryzen 9 8945HS
34666 Points +367%
Geekom GT13 Pro (Nvidia GeForce RTX 3060 Ti FE @TB3)
Intel Core i9-13900H
33219 Points +347%
Geekom XT12 Pro (Nvidia GeForce RTX 3060 Ti FE @TB3)
Intel Core i9-12900H
32654 Points +340%

7424 Points
3DMark
2560x1440 Time Spy Graphics
Geekom A8 (Nvidia GeForce RTX 3060 Ti FE @TB3)
AMD Ryzen 9 8945HS
11182 Points +562%
Geekom GT13 Pro (Nvidia GeForce RTX 3060 Ti FE @TB3)
Intel Core i9-13900H
11085 Points +556%
Geekom XT12 Pro (Nvidia GeForce RTX 3060 Ti FE @TB3)
Intel Core i9-12900H
11062 Points +555%

1690 Points
1920x1080 Fire Strike Graphics
Geekom GT13 Pro (Nvidia GeForce RTX 3060 Ti FE @TB3)
Intel Core i9-13900H
25468 Points +338%
Geekom A8 (Nvidia GeForce RTX 3060 Ti FE @TB3)
AMD Ryzen 9 8945HS
25462 Points +338%
Geekom XT12 Pro (Nvidia GeForce RTX 3060 Ti FE @TB3)
Intel Core i9-12900H
24796 Points +327%

5812 Points
3840x2160 Fire Strike Ultra Graphics
Geekom GT13 Pro (Nvidia GeForce RTX 3060 Ti FE @TB3)
Intel Core i9-13900H
7139 Points +471%
Geekom XT12 Pro (Nvidia GeForce RTX 3060 Ti FE @TB3)
Intel Core i9-12900H
7047 Points +463%
Geekom A8 (Nvidia GeForce RTX 3060 Ti FE @TB3)
AMD Ryzen 9 8945HS
7044 Points +463%

1251 Points
Unigine Superposition
1280x720 720p Low
Geekom GT13 Pro (Nvidia GeForce RTX 3060 Ti FE @TB3)
Intel Core i9-13900H
34168 Points +416%
Geekom A8 (Nvidia GeForce RTX 3060 Ti FE @TB3)
AMD Ryzen 9 8945HS
33894 Points +412%
Geekom XT12 Pro (Nvidia GeForce RTX 3060 Ti FE @TB3)
Intel Core i9-12900H
31903 Points +382%

6619 Points
1920x1080 1080p High
Geekom GT13 Pro (Nvidia GeForce RTX 3060 Ti FE @TB3)
Intel Core i9-13900H
15240 Points +561%
Geekom A8 (Nvidia GeForce RTX 3060 Ti FE @TB3)
AMD Ryzen 9 8945HS
15076 Points +554%
Geekom XT12 Pro (Nvidia GeForce RTX 3060 Ti FE @TB3)
Intel Core i9-12900H
14853 Points +544%

2306 Points
1920x1080 1080p Extreme
Geekom GT13 Pro (Nvidia GeForce RTX 3060 Ti FE @TB3)
Intel Core i9-13900H
7193 Points +540%
Geekom XT12 Pro (Nvidia GeForce RTX 3060 Ti FE @TB3)
Intel Core i9-12900H
7089 Points +531%
Geekom A8 (Nvidia GeForce RTX 3060 Ti FE @TB3)
AMD Ryzen 9 8945HS
7055 Points +528%

1124 Points
3840x2160 4k Optimized
Geekom GT13 Pro (Nvidia GeForce RTX 3060 Ti FE @TB3)
Intel Core i9-13900H
9419 Points
Geekom XT12 Pro (Nvidia GeForce RTX 3060 Ti FE @TB3)
Intel Core i9-12900H
9240 Points
Geekom A8 (Nvidia GeForce RTX 3060 Ti FE @TB3)
AMD Ryzen 9 8945HS
9205 Points
7680x4320 8k Optimized
Geekom GT13 Pro (Nvidia GeForce RTX 3060 Ti FE @TB3)
Intel Core i9-13900H
4079 Points
Geekom XT12 Pro (Nvidia GeForce RTX 3060 Ti FE @TB3)
Intel Core i9-12900H
4042 Points
Geekom A8 (Nvidia GeForce RTX 3060 Ti FE @TB3)
AMD Ryzen 9 8945HS
4013 Points
Unigine Valley 1.0
1920x1080 Extreme HD DirectX AA:x8
Geekom XT12 Pro (Nvidia GeForce RTX 3060 Ti FE @TB3)
Intel Core i9-12900H
144.5 fps +857%
Geekom GT13 Pro (Nvidia GeForce RTX 3060 Ti FE @TB3)
Intel Core i9-13900H
143.9 fps +853%
Geekom A8 (Nvidia GeForce RTX 3060 Ti FE @TB3)
AMD Ryzen 9 8945HS
141.6 fps +838%

15.1 fps
1920x1080 Extreme HD Preset OpenGL AA:x8
Geekom GT13 Pro (Nvidia GeForce RTX 3060 Ti FE @TB3)
Intel Core i9-13900H
138.6 fps +783%
Geekom XT12 Pro (Nvidia GeForce RTX 3060 Ti FE @TB3)
Intel Core i9-12900H
138.2 fps +780%
Geekom A8 (Nvidia GeForce RTX 3060 Ti FE @TB3)
AMD Ryzen 9 8945HS
137.5 fps +776%

15.7 fps
Unigine Heaven 4.0
Extreme Preset OpenGL
Geekom A8 (Nvidia GeForce RTX 3060 Ti FE @TB3)
AMD Ryzen 9 8945HS
174.9 fps +597%
Geekom GT13 Pro (Nvidia GeForce RTX 3060 Ti FE @TB3)
Intel Core i9-13900H
173.6 fps +592%
Geekom XT12 Pro (Nvidia GeForce RTX 3060 Ti FE @TB3)
Intel Core i9-12900H
172.1 fps +586%

25.1 fps
Extreme Preset DX11
Geekom GT13 Pro (Nvidia GeForce RTX 3060 Ti FE @TB3)
Intel Core i9-13900H
163.6 fps +529%
Geekom A8 (Nvidia GeForce RTX 3060 Ti FE @TB3)
AMD Ryzen 9 8945HS
163.2 fps +528%
Geekom XT12 Pro (Nvidia GeForce RTX 3060 Ti FE @TB3)
Intel Core i9-12900H
162.5 fps +525%

26 fps
ComputeMark v2.1
1024x600 Normal, Score
Geekom GT13 Pro (Nvidia GeForce RTX 3060 Ti FE @TB3)
Intel Core i9-13900H
28156 Points +671%
Geekom A8 (Nvidia GeForce RTX 3060 Ti FE @TB3)
AMD Ryzen 9 8945HS
27929 Points +665%
Geekom XT12 Pro (Nvidia GeForce RTX 3060 Ti FE @TB3)
Intel Core i9-12900H
25975 Points +612%

3650 Points
1024x600 Normal, Fluid 3DTex
Geekom GT13 Pro (Nvidia GeForce RTX 3060 Ti FE @TB3)
Intel Core i9-13900H
2719 Points +851%
Geekom A8 (Nvidia GeForce RTX 3060 Ti FE @TB3)
AMD Ryzen 9 8945HS
2687 Points +840%
Geekom XT12 Pro (Nvidia GeForce RTX 3060 Ti FE @TB3)
Intel Core i9-12900H
2527 Points +784%

286 Points
1024x600 Normal, Fluid 2DTexArr
Geekom GT13 Pro (Nvidia GeForce RTX 3060 Ti FE @TB3)
Intel Core i9-13900H
2663 Points +806%
Geekom A8 (Nvidia GeForce RTX 3060 Ti FE @TB3)
AMD Ryzen 9 8945HS
2622 Points +792%
Geekom XT12 Pro (Nvidia GeForce RTX 3060 Ti FE @TB3)
Intel Core i9-12900H
2463 Points +738%

294 Points
1024x600 Normal, Mandel Vector
Geekom GT13 Pro (Nvidia GeForce RTX 3060 Ti FE @TB3)
Intel Core i9-13900H
5769 Points +561%
Geekom A8 (Nvidia GeForce RTX 3060 Ti FE @TB3)
AMD Ryzen 9 8945HS
5742 Points +558%
Geekom XT12 Pro (Nvidia GeForce RTX 3060 Ti FE @TB3)
Intel Core i9-12900H
5342 Points +512%

873 Points
1024x600 Normal, Mandel Scalar
Geekom GT13 Pro (Nvidia GeForce RTX 3060 Ti FE @TB3)
Intel Core i9-13900H
6335 Points +613%
Geekom A8 (Nvidia GeForce RTX 3060 Ti FE @TB3)
AMD Ryzen 9 8945HS
6283 Points +608%
Geekom XT12 Pro (Nvidia GeForce RTX 3060 Ti FE @TB3)
Intel Core i9-12900H
5881 Points +562%

888 Points
1024x600 Normal, QJuliaRayTrace
Geekom GT13 Pro (Nvidia GeForce RTX 3060 Ti FE @TB3)
Intel Core i9-13900H
10671 Points +715%
Geekom A8 (Nvidia GeForce RTX 3060 Ti FE @TB3)
AMD Ryzen 9 8945HS
10594 Points +709%
Geekom XT12 Pro (Nvidia GeForce RTX 3060 Ti FE @TB3)
Intel Core i9-12900H
9762 Points +645%

1310 Points
DaVinci Resolve PugetBench - GPU Effects 0.93
Geekom A8 (Nvidia GeForce RTX 3060 Ti FE @TB3)
AMD Ryzen 9 8945HS
72 Points +500%
Geekom XT12 Pro (Nvidia GeForce RTX 3060 Ti FE @TB3)
Intel Core i9-12900H
69 Points +475%
Geekom GT13 Pro (Nvidia GeForce RTX 3060 Ti FE @TB3)
Intel Core i9-13900H
69 Points +475%

12 Points
Photoshop PugetBench - GPU Score
Geekom A8 (Nvidia GeForce RTX 3060 Ti FE @TB3)
AMD Ryzen 9 8945HS
100.6 Points +14%
Geekom XT12 Pro (Nvidia GeForce RTX 3060 Ti FE @TB3)
Intel Core i9-12900H
93.7 Points +6%

88.4 Points
Geekom GT13 Pro (Nvidia GeForce RTX 3060 Ti FE @TB3)
Intel Core i9-13900H
81.6 Points -8%
Premiere Pro PugetBench - GPU 0.9
Geekom A8 (Nvidia GeForce RTX 3060 Ti FE @TB3)
AMD Ryzen 9 8945HS
55.8 Points +589%
Geekom GT13 Pro (Nvidia GeForce RTX 3060 Ti FE @TB3)
Intel Core i9-13900H
48 Points +493%
Geekom XT12 Pro (Nvidia GeForce RTX 3060 Ti FE @TB3)
Intel Core i9-12900H
45.6 Points +463%

8.1 Points
low med. high ultraQHD4K DLSS4K
GTA V (2015) 182.1 178 170.7 103.6 91.6 103.8
Dota 2 Reborn (2015) 180.5 157.2 146.6 133.3 108.6
Final Fantasy XV Benchmark (2018) 188 142.7 98.6 78 48.3
X-Plane 11.11 (2018) 151.3 135 106.6 95.4
Far Cry 5 (2018) 160 138 132 121 99 58
Strange Brigade (2018) 214 160.5 156.8 152.9 130.2 84.5
Shadow of the Tomb Raider (2018) 118.5 101 100.8 98.5 85.9 49.6
Far Cry New Dawn (2019) 138 119 115 104 93 60
Metro Exodus (2019) 144.8 91.6 69.6 52.5 45.8 33.7
Total War: Three Kingdoms (2019) 300.4 145.6 95 70.1 49.3 26.7
Borderlands 3 (2019) 155.8 132.4 104.8 84.6 64.6 38.3
F1 2020 (2020) 207 127.8 128.9 105.5 90.6 61.4
F1 2021 (2021) 143.5 110.1 69.1 51.7 48.1 41.4
Far Cry 6 (2021) 78 65 53.9 46.9 45.8
GRID Legends (2022) 119.2 99.7 84 70.9 64.7 51
Tiny Tina's Wonderlands (2022) 178.2 138.7 100.2 81.4 61.7 36.1
F1 22 (2022) 61.4 56.1 43.2 27.6 26.2 19.6
F1 23 (2023) 67.9 66.2 54.6 33.3 31.9 10.3
Baldur's Gate 3 (2023) 113.4 90.8 78.9 79 61.4 54.7 36.9
Cyberpunk 2077 2.1 Phantom Liberty (2023) 85.3 80.4 71.3 63.9 44.9 22.1
Assassin's Creed Mirage (2023) 88 82 77 63 59 56
Avatar Frontiers of Pandora (2023) 53 49 43 30 23 9.7
Skull & Bones (2024) 83 77 64 54 45 31
F1 24 (2024) 77.3 72.8 61.3 42 36.5 28.9 19.6
Geekom GT13 Pro, Intel Iris Xe Graphics G7 96EUs
i9-13900H
Geekom GT13 Pro (Nvidia GeForce RTX 3060 Ti FE @TB3),
i9-13900H
Geekom A8 (Nvidia GeForce RTX 3060 Ti FE @TB3),
R9 8945HS
Minisforum MS-01 (Nvidia GeForce RTX 3060 Ti FE @TB3),
i9-13900H
Geekom XT12 Pro (Nvidia GeForce RTX 3060 Ti FE @TB3),
i9-12900H
SPECviewperf 12
679%
674%
687%
630%
1900x1060 3ds Max (3dsmax-05)
41.4
147
255%
146
253%
147
255%
124
200%
1900x1060 Catia (catia-04)
38.6
116
201%
112
190%
116
201%
95.2
147%
1900x1060 Creo (creo-01)
28.2
62.9
123%
62.9
123%
64.2
128%
53.5
90%
1900x1060 Energy (energy-01)
0.41
13.4
3168%
13.3
3144%
13.4
3168%
13.4
3168%
1900x1060 Maya (maya-04)
42.4
228
438%
235
454%
235
454%
182
329%
1900x1060 Medical (medical-01)
12.2
73.4
502%
74.8
513%
76.4
526%
74.4
510%
1900x1060 Showcase (showcase-01)
19.1
149
680%
141
638%
149
680%
123
544%
1900x1060 Solidworks (sw-03)
46.6
77.2
66%
81.6
75%
84.6
82%
71.7
54%
SPECviewperf 13
386%
374%
385%
311%
3ds Max (3dsmax-06)
41.2
147
257%
145
252%
147
257%
124
201%
Catia (catia-05)
54.7
164
200%
163
198%
163
198%
135
147%
Creo (creo-02)
42.7
232
443%
231
441%
231
441%
194
354%
Energy (energy-02)
4.62
25.9
461%
25.9
461%
25.9
461%
24
419%
Maya (maya-05)
51.6
363
603%
351
580%
361
600%
298
478%
Medical (medical-02)
15.6
65.2
318%
64.1
311%
64.9
316%
56.7
263%
Showcase (showcase-02)
19.1
151
691%
141
638%
150
685%
125
554%
Solidworks (sw-04)
58.3
127
118%
125
114%
129
121%
102
75%
SPECviewperf 2020
390%
518%
436%
327%
3840x2160 Medical (medical-03)
2.69
10.8
301%
10.8
301%
10.8
301%
11.8
339%
3840x2160 Energy (energy-03)
3.17
21
562%
50.3
1487%
31.1
881%
18.9
496%
3840x2160 Creo (creo-03)
16.3
76.4
369%
76.6
370%
76.8
371%
62.7
285%
3840x2160 CATIA (catia-06)
8.53
40.1
370%
38.8
355%
39.7
365%
32.8
285%
3840x2160 3ds Max (3dsmax-07)
10.3
47.3
359%
45.9
346%
47.6
362%
40
288%
3840x2160 Siemens NX (snx-04)
6.62
16.5
149%
16.6
151%
16.6
151%
15.2
130%
3840x2160 Maya (maya-06)
27.3
196
618%
195
614%
197
622%
155
468%
Total Average (Program / Settings)
485% / 489%
522% / 522%
503% / 505%
423% / 427%

Emisje - IceBlast 1.5 szybko osiąga swój limit

Emisja hałasu

Pod względem chłodzenia, Geekom GT13 Pro jest bardzo ograniczony ze względu na swoją konstrukcję. Niemniej jednak, mini-PC jest nadal wyjątkowo cichy na biegu jałowym, chociaż mały wentylator może być wyraźnie słyszalny pod obciążeniem. W teście zmierzyliśmy maksymalny poziom ciśnienia akustycznego wynoszący 48,5 dB(A). GT13 Pro osiąga ten poziom hałasu tylko przez krótki czas, dopóki wartość PL2 jest osiągnięta. Przy dłuższym obciążeniu SoC działa z limitem PL1, co oznacza, że głośność spada wtedy do około 39 dB(A). Jeśli nie ma stałego obciążenia, które symulujemy na przykład za pomocą Prime95, wentylator działa bardzo nerwowo. Poziom ciśnienia akustycznego przy średnim obciążeniu waha się w naszej próbce testowej od 38 do 44 dB(A).

Hałas

luz
27.9 / 27.9 / 28 dB
obciążenie
43.8 / 48.5 dB
  red to green bar
 
 
30 dB
cichy
40 dB(A)
słyszalny
50 dB(A)
irytujący
 
min: dark, med: mid, max: light   Earthworks M23R (odległość 15 cm)   environment noise: 24.3 dB(A)
dB(A) 0102030405060708090Deep BassMiddle BassHigh BassLower RangeMidsHigher MidsLower HighsMid HighsUpper HighsSuper Highs2036.733.235.638.931.831.838.72530.931.431.333.43030.133.13134.236.137.738.537.831.238.24024.324.627.226.223.423.930.55034.935.535.334.33533.828.46330.825.824.727.328.624.525.98026.726.926.226.326.924.427.210025.725.322.622.422.821.524.812528.124.619.919.819.112.22416025.324.115.615.615.29.92220027.832.417.117.61812.523.325028.527.413.714.614.19.62331528.425.214.213.314.39.625.940029.32614.714.716.39.424.550029.826.613.613.713.78.724.263031.829.313.513.513.89.126.480034.431.213.613.713.410.129.2100038.533.61515.215.112.228.7125039.334.816.215.815.910.429.7160039.134.615.615.315.210.728.6200039.634.919.118.818.711.528.7250040.234.720.120.220.411.828.2315034.428.813.613.513.312.623.5400035.231.113.913.613.51325500035.528.714.113.513.413.320.5630030.123.314.213.813.813.617800025.218.31413.813.713.514.8100002216.714.21413.913.814.61250017.616.414.314.214.113.915.31600014.616.113.913.713.713.815.3SPL48.543.82827.927.924.338.4N5.94.20.90.90.90.52.7median 29.8median 27.4median 14.2median 14.2median 14.1median 12.2median 24.2Delta4.84.21.21.41.31.85.2hearing rangehide median Fan NoiseGeekom GT13 Pro
Geekom GT13 Pro
i9-13900H, Iris Xe G7 96EUs
Aoostar GEM12
R7 8845HS, Radeon 780M
Minisforum AtomMan X7 Ti
Ultra 9 185H, Arc 8-Core
Geekom A8
R9 8945HS, Radeon 780M
Geekom XT12 Pro
i9-12900H, Iris Xe G7 96EUs
Acemagic F2A
Ultra 7 155H, Arc 8-Core
Minisforum EliteMini UM780 XTX
R7 7840HS, Radeon 780M
Khadas Mind
i7-1360P, Iris Xe G7 96EUs
Noise
9%
1%
4%
2%
2%
6%
-13%
off / environment *
24.3
24.3
-0%
24.1
1%
24.4
-0%
25.4
-5%
24.9
-2%
24.8
-2%
25.2
-4%
Idle Minimum *
27.9
27.5
1%
29.8
-7%
24.5
12%
28
-0%
25.4
9%
28.5
-2%
34.4
-23%
Idle Average *
27.9
27.6
1%
29.9
-7%
24.7
11%
28.1
-1%
25.7
8%
28.5
-2%
34.4
-23%
Idle Maximum *
28
27.6
1%
30
-7%
24.7
12%
28.5
-2%
25.7
8%
28.7
-3%
34.5
-23%
Load Average *
43.8
36
18%
37.3
15%
48.5
-11%
39.6
10%
47.8
-9%
32.4
26%
44.7
-2%
Cyberpunk 2077 ultra *
45.4
35.4
22%
Load Maximum *
48.5
38.2
21%
43.5
10%
49.2
-1%
44.2
9%
49
-1%
39.6
18%
50.4
-4%
Witcher 3 ultra *
35.4
40.2
47
47.2
45.23
32.7
49

* ... im mniej tym lepiej

Temperatura

Obudowa Geekom GT13 Pro nagrzewa się zauważalnie zarówno na biegu jałowym, jak i pod obciążeniem. Pod obciążeniem temperatury powierzchni ponownie nieznacznie rosną. Jednak 50°C nie jest jeszcze osiągnięte. W przypadku Intel Core i9-13900H odnotowujemy stosunkowo wysokie temperatury, co wynika ze słabej wentylacji kompaktowego układu chłodzenia. Przy 100 °C SoC osiąga maksymalną wartość, którą sam Intel podaje w specyfikacji. Ważne jest, aby wiedzieć, że 100 °C jest osiągane tylko przez krótki czas. Temperatura procesora spada nieznacznie, gdy PL1 działa z maksymalną mocą 35 watów. Średnio temperatura Intel Core i9-13900H oscyluje wokół 90 °C.

Test warunków skrajnych Prime95, solo
Test obciążeniowy FurMark, solo
Prime95 i test warunków skrajnych FurMark
Test obciążeniowy Geekom GT13 Pro (górna strona)
Test obciążeniowy Geekom GT13 Pro (spód)
Test obciążeniowy Geekom GT13 Pro (tył)
Zasilacz podczas testu warunków skrajnych
w stresie
 47.9 °C46.8 °C48.2 °C 
 39.3 °C41.7 °C38.5 °C 
 37.7 °C38.4 °C38.1 °C 
maks. w ogóle: 48.2 °C
średnia: 41.8 °C
42.4 °C42.4 °C39.8 °C
38.1 °C45.7 °C34.7 °C
39.8 °C35.9 °C32.4 °C
maks. w ogóle: 45.7 °C
średnia: 39 °C
zasilacz  40.6 °C | temperatura otoczenia 21.3 °C | Fluke t3000FC (calibrated)
(-) The average temperature for the upper side under maximal load is 41.8 °C / 107 F, compared to the average of 32 °C / 90 F for the devices in the class Mini PC.
(-) The maximum temperature on the upper side is 48.2 °C / 119 F, compared to the average of 35.5 °C / 96 F, ranging from 24 to 69.5 °C for the class Mini PC.
(-) The bottom heats up to a maximum of 45.7 °C / 114 F, compared to the average of 36.3 °C / 97 F
(-) In idle usage, the average temperature for the upper side is 38.2 °C / 101 F, compared to the device average of 32 °C / 90 F.

Zarządzanie energią

Mini-PC są generalnie ekonomiczne i wymagają znacznie mniej energii niż konwencjonalne komputery stacjonarne. Niemniej jednak istnieją różnice między mini-PC pod względem zużycia energii. Przy poborze mocy od 7,9 do 22,3 W, Geekom GT13 Pro nie jest szczególnie oszczędny w trybie bezczynności w porównaniu do swoich konkurentów. Przy średnim obciążeniu nasze urządzenie testowe wymaga 57 watów, a 120-watowy zasilacz musi zapewnić 93,4 wata w szczycie.

Pobór mocy
wyłączony / stan wstrzymaniadarklight 1.6 / 1.9 W
luzdarkmidlight 7.9 / 10.3 / 22.3 W
obciążenie midlight 57.44 / 93.4 W
 color bar
Legenda: min: dark, med: mid, max: light        Metrahit Energy
Currently we use the Metrahit Energy, a professional single phase power quality and energy measurement digital multimeter, for our measurements. Find out more about it here. All of our test methods can be found here.
Geekom GT13 Pro
i9-13900H, Iris Xe G7 96EUs
Aoostar GEM12
R7 8845HS, Radeon 780M
Minisforum AtomMan X7 Ti
Ultra 9 185H, Arc 8-Core
Geekom A8
R9 8945HS, Radeon 780M
Geekom XT12 Pro
i9-12900H, Iris Xe G7 96EUs
Acemagic F2A
Ultra 7 155H, Arc 8-Core
Minisforum EliteMini UM780 XTX
R7 7840HS, Radeon 780M
Khadas Mind
i7-1360P, Iris Xe G7 96EUs
Average Intel Iris Xe Graphics G7 96EUs
 
Average of class Mini PC
 
Power Consumption
1%
3%
31%
15%
1%
2%
18%
30%
3%
Idle Minimum *
7.9
8.2
-4%
8.2
-4%
3.2
59%
5.7
28%
9.1
-15%
8.5
-8%
7.8
1%
Idle Average *
10.3
10
3%
12.1
-17%
4.9
52%
9.5
8%
10.3
-0%
10.5
-2%
10.9
-6%
8.57 ?(3.8 - 63, n=189)
17%
Idle Maximum *
22.3
14.6
35%
14
37%
6.8
70%
16.5
26%
14.4
35%
12.9
42%
11.8
47%
Load Average *
57.44
73.9
-29%
53.1
8%
71.3
-24%
53.3
7%
54.9
4%
67.2
-17%
39.2
32%
Load Maximum *
93.4
95.3
-2%
100.4
-7%
93.2
-0%
87.8
6%
110.4
-18%
97.2
-4%
76.4
18%

* ... im mniej tym lepiej

Efficiency overview

Power Consumption / Cinebench R15 Multi Efficiency (external Monitor)
Geekom A8
35.8 Points per Watt +44%
Minisforum AtomMan X7 Ti
31.2 Points per Watt +26%
Acemagic F2A
26.6 Points per Watt +7%
Geekom GT13 Pro
24.8 Points per Watt
Geekom XT12 Pro
24.7 Points per Watt 0%
Power Consumption / Cinebench R23 Single Power Efficiency - external Monitor
Geekom A8
61.7 Points per Watt +14%
Minisforum AtomMan X7 Ti
55.6 Points per Watt +2%
Geekom GT13 Pro
54.3 Points per Watt
Acemagic F2A
54.2 Points per Watt 0%
Geekom XT12 Pro
37.1 Points per Watt -32%
Power Consumption / Cinebench R23 Multi Power Efficiency - external Monitor
Geekom A8
251 Points per Watt +20%
Geekom GT13 Pro
210 Points per Watt
Minisforum AtomMan X7 Ti
205 Points per Watt -2%
Acemagic F2A
183.7 Points per Watt -13%
Geekom XT12 Pro
182.7 (48.6min, 48.7P1 - 81.3max) Points per Watt -13%

Power consumtion with external monitor

0102030405060708090100110Tooltip
Geekom GT13 Pro i9-13900H, Iris Xe G7 96EUs; Idle 1min (external Monitor): Ø17.4 (12.6-22.4)
Aoostar GEM12 R7 8845HS, Radeon 780M; Idle 1min (external Monitor): Ø10 (9.28-14.3)
Minisforum AtomMan X7 Ti Ultra 9 185H, Arc 8-Core; Idle 1min (external Monitor): Ø12.2 (10.9-14.1)
Acemagic F2A Ultra 7 155H, Arc 8-Core; Idle 1min (external Monitor): Ø10.4 (9.08-14.4)
Aoostar GEM12 R7 8845HS, Radeon 780M; 1920x1080 The Witcher 3 ultra (external Monitor): Ø79.6 (76-85.2)
Minisforum AtomMan X7 Ti Ultra 9 185H, Arc 8-Core; 1920x1080 The Witcher 3 ultra (external Monitor): Ø43.8 (42.6-45.7)
Acemagic F2A Ultra 7 155H, Arc 8-Core; 1920x1080 The Witcher 3 ultra (external Monitor): Ø48.4 (45.6-52.4)
Geekom GT13 Pro i9-13900H, Iris Xe G7 96EUs; 1280x720 Prime95 28.10 and Furmark 1.25: Ø60.2 (57-86.6)
Aoostar GEM12 R7 8845HS, Radeon 780M; 1280x720 Prime95 28.10 and Furmark 1.25: Ø84.4 (83.6-85.1)
Minisforum AtomMan X7 Ti Ultra 9 185H, Arc 8-Core; 1280x720 Prime95 28.10 and Furmark 1.25: Ø91.8 (87.6-95.4)
Acemagic F2A Ultra 7 155H, Arc 8-Core; 1280x720 Prime95 28.10 and Furmark 1.25: Ø92.2 (78.7-114)
Geekom GT13 Pro i9-13900H, Iris Xe G7 96EUs; Cyberpunk 2077 FHD ultra no FSR - external Monitor: Ø55.9 (54.2-59.2)
Aoostar GEM12 R7 8845HS, Radeon 780M; Cyberpunk 2077 FHD ultra no FSR - external Monitor: Ø79.9 (75.5-83.5)

Power consumtion with external monitor

0102030405060708090100110Tooltip
Geekom GT13 Pro i9-13900H, Iris Xe G7 96EUs; Prime95 V2810 Stress (external Monitor): Ø59.5 (53.5-84.7)
Aoostar GEM12 R7 8845HS, Radeon 780M; Prime95 V2810 Stress (external Monitor): Ø83.6 (80.7-95.3)
Minisforum AtomMan X7 Ti Ultra 9 185H, Arc 8-Core; Prime95 V2810 Stress (external Monitor): Ø98.1 (94.2-100.4)
Acemagic F2A Ultra 7 155H, Arc 8-Core; Prime95 V2810 Stress (external Monitor): Ø99.6 (92-110.4)
Geekom GT13 Pro i9-13900H, Iris Xe G7 96EUs; Cinebench R15 Multi (external Monitor): Ø91.2 (88.5-93.4)
Aoostar GEM12 R7 8845HS, Radeon 780M; Cinebench R15 Multi (external Monitor): Ø82.1 (74.2-89.2)
Minisforum AtomMan X7 Ti Ultra 9 185H, Arc 8-Core; Cinebench R15 Multi (external Monitor): Ø88 (87.7-88.3)
Acemagic F2A Ultra 7 155H, Arc 8-Core; Cinebench R15 Multi (external Monitor): Ø103 (99.2-107)
Geekom GT13 Pro i9-13900H, Iris Xe G7 96EUs; Cinebench R23 Single (external Monitor): Ø31.6 (29-59.5)
Aoostar GEM12 R7 8845HS, Radeon 780M; Cinebench R23 Single (external Monitor): Ø34 (31.1-57.1)
Minisforum AtomMan X7 Ti Ultra 9 185H, Arc 8-Core; Cinebench R23 Single (external Monitor): Ø33.3 (28.9-63)
Acemagic F2A Ultra 7 155H, Arc 8-Core; Cinebench R23 Single (external Monitor): Ø32.7 (19.4-55.3)
Geekom GT13 Pro i9-13900H, Iris Xe G7 96EUs; Cinebench R23 Multi (external Monitor): Ø62.1 (50.4-89.7)
Aoostar GEM12 R7 8845HS, Radeon 780M; Cinebench R23 Multi (external Monitor): Ø75.3 (72.3-87.5)
Minisforum AtomMan X7 Ti Ultra 9 185H, Arc 8-Core; Cinebench R23 Multi (external Monitor): Ø87.7 (87.3-88.3)
Acemagic F2A Ultra 7 155H, Arc 8-Core; Cinebench R23 Multi (external Monitor): Ø100.7 (97.2-108.6)
Geekom GT13 Pro i9-13900H, Iris Xe G7 96EUs; 1280x720 FurMark 1.19 GPU Stress Test (external Monitor): Ø54.6 (51.3-69.7)
Aoostar GEM12 R7 8845HS, Radeon 780M; 1280x720 FurMark 1.19 GPU Stress Test (external Monitor): Ø83.1 (79.2-88.5)
Minisforum AtomMan X7 Ti Ultra 9 185H, Arc 8-Core; 1280x720 FurMark 1.19 GPU Stress Test (external Monitor): Ø50.3 (47.7-65.3)
Acemagic F2A Ultra 7 155H, Arc 8-Core; 1280x720 FurMark 1.19 GPU Stress Test (external Monitor): Ø49.7 (47.3-60.6)

Za

+ niezwykle kompaktowa i wytrzymała obudowa o pojemności 0,5 l
+ wysokiej jakości materiały
+ szybki WLAN
+ 2x USB4
+ maksymalnie cztery ekrany mogą być używane jednocześnie
+ stosunkowo niskie zużycie energii
+ pojemny dysk SSD z 2 TB przestrzeni dyskowej
+ Czytnik kart SD z obsługą UHS
+ 36 miesięcy gwarancji

Przeciw

- Jednostka chłodząca działa szybko na granicy
- wyraźnie słyszalny pod obciążeniem
- niskie wykorzystanie Turbo procesora
- stosunkowo drogi

Werdykt - świetny wygląd i przeciętna wydajność w cenie premium

Recenzja Geekom GT13 Pro - dostarczona przez Geekom

Producent sprzedaje stylowy i bardzo kompaktowy komputer jako Geekom GT13 Pro. Intel Core i9-13900H to potężny SoC, który nie jest oparty na obecnej architekturze Meteor Lake. Zasadniczo procesor zapewnia odpowiednią wydajność, jeśli ciągłe obciążenia niekoniecznie są generowane. Ze względu na niewielką konstrukcję, Intel Core i9-13900H może pracować tylko przy bardzo niskim zużyciu energii.

Geekom GT13 Pro to stylowy, wydajny mini-PC, który imponuje świetnymi funkcjami. Niestety, cena nie do końca odpowiada wydajności Geekom GT13 Pro.

Wizualnie, Geekom GT13 Pro imponuje swoim stylowym wyglądem. Wygląd nie jest całkowicie nowy, ponieważ Geekom A7 i Geekom A8 są już oparte na tej samej obudowie. Jeśli chodzi o kolorystykę, Geekom przyjmuje inne podejście do GT13 Pro, odróżniając go od swoich odpowiedników AMD. Łączność jest jedną z mocnych stron Geekom GT13 Pro i jest nawet nieco lepsza niż w przypadku wyżej wymienionych wewnętrznych konkurentów. Dwa porty USB4 są dobre i mogą mieć znaczenie w praktyce, jeśli trzeba podłączyć wiele urządzeń zewnętrznych. Geekom GT13 Pro doskonale zdał test z zewnętrzną kartą graficzną, choć i tutaj konkurenci nie wypadli najgorzej. Geekom nie powinien tracić z oczu możliwości zaoferowania interfejsu OCuLink, aby nie stracić kontaktu z niektórymi przeciwnikami. Dopóki Thunderbolt 5 nie będzie dostępny, interfejs OCuLink jest obecnie lepszą opcją, jeśli chodzi o obsługę zewnętrznych kart graficznych.

Kompaktowa konstrukcja jest stylowa, a wybrane materiały są również wysokiej jakości. Niemniej jednak Geekom musi zadać sobie pytanie, czy koncepcja jest właściwa, jeśli chodzi o pomieszczenie bardzo wydajnych komponentów na bardzo małej przestrzeni. Obudowa oferuje ograniczony przepływ powietrza, co utrudnia chłodzenie procesora. Ostatecznie oznacza to, że Geekom GT13 Pro jest wyraźnie słyszalny pod obciążeniem. Minisforum i Aoostar pokazują swoimi urządzeniami, że nawet potężne komponenty mogą być chłodzone znacznie ciszej.

Na koniec musimy jeszcze raz spojrzeć na cenę: W czasie testów Geekom GT13 Pro kosztował w naszej konfiguracji 930 euro. Oznacza to, że GT13 Pro naprawdę nie jest okazją i prawdopodobnie będzie miał trudności z konkurowaniem z konkurentami, z których niektórzy są znacznie tańsi.

Ceny i dostępność

Geekom GT13 Pro można zamówić w naszej konfiguracji testowej w Geekom lub Amazon. Cena wynosi tutaj 930 euro. Obecnie obowiązuje pięcioprocentowy rabat przy użyciu następujących kodów: Sklep Geekom: "NBCGT13", Amazon: "NBCGT130612".

Geekom GT13 Pro - 21/06/2024 v8 (new)
Sebastian Bade

Wykonanie
87 / 98 → 89%
Komunikacja
71 / 81 → 88%
Waga
84%
Wydajność w grach
27 / 80 → 34%
Wydajność w programach użytkowych
80 / 92 → 87%
Workstation
24%
AI Performance
80%
Temperatura
81%
Hałas
75%
Średnio
53%
72%
Mini PC - Ważona średnia
CO2 Emissions
No Data
Materials
0%
Packaging
50%
Power Use
62.7%
Repairability
50%
Software Updates
39%
Total Sustainability Score: 33.6%

Transparency

The present review sample was given to the author by the manufacturer free of charge for the purposes of review. There was no third-party influence on this review, nor did the manufacturer receive a copy of this review before publication. There was no obligation to publish this review.

Please share our article, every link counts!
> laptopy testy i recenzje notebooki > Laptopy > Recenzja mini-PC Geekom GT13 Pro - stylowa alternatywa dla NUC z procesorem Intel Core i9-13900H, 32 GB pamięci RAM DDR4 i dyskiem SSD 2 TB
Sebastian Bade, 2024-06-23 (Update: 2024-06-23)