Recenzje laptopów Intel Graphics 4-Core iGPU (Arc) z kartą graficzną
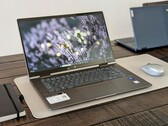
Recenzja konwertowalnego HP Envy x360 15 Core Ultra 7: Rozczarowujący jak na swoją cenę
Envy x360 15 to średniej klasy laptop konwertowalny od HP, a mimo to wydaje się zbyt skromny, biorąc pod uwagę cenę wywoławczą wynoszącą 1200 USD. Niektóre aspe...
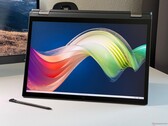
Intel Core Ultra 7 155U | Intel Graphics 4-Core iGPU (Arc) | 15.60" | 1.9 kgRecenzja Lenovo ThinkPad L13 2 w 1 G5 - biznesowy tablet 2 w 1 z matowym ekranem dotykowym
ThinkPad L13 2-in-1 to kompaktowe urządzenie biznesowe wyposażone w matowy ekran dotykowy. Dołączony rysik można łatwo przechowywać wewnątrz obudowy.
Intel Core Ultra 5 125U | Intel Graphics 4-Core iGPU (Arc) | 13.30" | 1.3 kgRecenzja Acer Aspire Spin 14: Szalony świat laptopów 2 w 1
Wraz z Aspire Spin 14, Acer oferuje urządzenie 2 w 1, które nadaje się do różnych celów. Dokładnie przetestowaliśmy 14-calowy model oparty na procesorze Intela,...
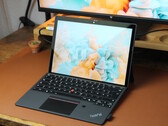
Intel Core Ultra 5 115U | Intel Graphics 4-Core iGPU (Arc) | 14.00" | 1.6 kgRecenzja Lenovo ThinkPad X12 Detachable G2: Wszechstronna hybryda laptopa i tabletu do codziennego użytku biznesowego
Lenovo ThinkPad X12 G2 business Windows detachable został zaprojektowany z myślą o wyjątkowej elastyczności. Pozwala użytkownikom na pracę w trybie laptopa lub ...
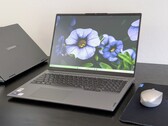
Intel Core Ultra 5 134U | Intel Graphics 4-Core iGPU (Arc) | 12.30" | 1.1 kgRecenzja laptopa Lenovo ThinkBook 16 G7 IML: Niedrogi, ale profesjonalny
Jeśli nie potrzebują Państwo wszystkich wymyślnych i drogich funkcji tradycyjnego ThinkPada, to ThinkBook 16 G7 może zaoszczędzić mnóstwo gotówki, szczególnie w...
Intel Core Ultra 5 125U | Intel Graphics 4-Core iGPU (Arc) | 16.00" | 1.8 kgLenovo ThinkPad X13 2-in-1 Gen 5: Intel Core Ultra 7 165U, 13.30", 1.3 kg
Recenzja » Recenzja laptopa Lenovo ThinkPad X13 2-w-1 Gen 5: Wydajny następca konwertowalnej Yogi
Lenovo ThinkPad E14 G6: Intel Core Ultra 7 155U, 14.00", 1.5 kg
Recenzja » Recenzja laptopa Lenovo ThinkPad E14 G6: Naprawiono wiele problemów z E14 G5
Lenovo ThinkPad T16 Gen 3 21MN005XGE: Intel Core Ultra 5 125U, 16.00", 2 kg
Recenzja » Recenzja laptopa Lenovo ThinkPad T16 Gen 3: Duży ekran, duża bateria, ale niska wydajność
Dell Latitude 7450 2-in-1: Intel Core Ultra 7 165U, 14.00", 1.5 kg
Recenzja » Recenzja laptopa 2 w 1 Dell Latitude 7450: Wszechstronny biznesowy laptop konwertowalny, który sprawdza się na większości frontów
Dell Latitude 7350 Detachable: Intel Core Ultra 7 164U, 13.00", 0.9 kg
Recenzja » Debiut wydajności Core Ultra 7 164U: Recenzja Dell Latitude 7350 Detachable
Lenovo ThinkPad T14 G5 21ML005JGE: Intel Core Ultra 7 155U, 14.00", 1.5 kg
Recenzja » Recenzja laptopa Lenovo ThinkPad T14 Gen 5 Intel: Rozszerzalna pamięć RAM powraca do serii T
Lenovo Yoga 7 2-in-1 14IML9: Intel Core Ultra 5 125U, 14.00", 1.6 kg
Recenzja » Recenzja konwertowalnego Lenovo Yoga 7 2-w-1 14IML9: Klasa za mniej niż 700 dolarów
Lenovo ThinkPad T14s Gen 5 21LS001PGE: Intel Core Ultra 5 125U, 14.00", 1.3 kg
Recenzja » Recenzja laptopa Lenovo ThinkPad T14s Gen 5: ThinkPad T klasy premium z procesorem Intel Core Ultra
Dell Latitude 13 7350: Intel Core Ultra 5 135U, 13.30", 1.1 kg
Recenzja » Debiut wydajności Core Ultra 5 135U: Recenzja laptopa Dell Latitude 13 7350
HP Envy x360 2-in-1 14-fc0078TU: Intel Core Ultra 5 125U, 14.00", 1.4 kg
Recenzja » Recenzja laptopa HP Envy x360 2-w-1 14 (2024): Konwertowalny laptop klasy niemal premium, który sprawia, że chcemy więcej
Lenovo ThinkPad X1 2in1 G9 21KE004AGE: Intel Core Ultra 7 165U, 14.00", 1.3 kg
Recenzja » Recenzja Lenovo ThinkPad X1 2in1 G9 - Wysokiej klasy biznesowy kabriolet z wyświetlaczem OLED 120 Hz i bez przycisków TrackPoint
Lenovo ThinkBook 14 2-in-1 G4 IML: Intel Core Ultra 5 125U, 14.00", 1.6 kg
Recenzja » Recenzja Lenovo ThinkBook 14 2-w-1 G4 IML: Nowy elegancki wygląd z Meteor Lake-U
Lenovo Yoga 7 2-in-1 16IML9: Intel Core Ultra 5 125U, 16.00", 2.1 kg
Recenzja » Debiut wydajności Core Ultra 5 125U: Recenzja konwertowalnego Lenovo Yoga 7 2-w-1 16IML9
Lenovo Yoga Book 9 13IMU9: Intel Core Ultra 7 155U, 13.30", 1.4 kg
Recenzja » Recenzja Lenovo Yoga Book 9 13IMU9 2 w 1 z dwoma ekranami: Core Ultra 7 155U i Arc 4 to mieszana torba
Dell Latitude 9450 2-in-1: Intel Core Ultra 7 165U, 14.00", 1.6 kg
Recenzja » Debiut wydajności Core Ultra 7 165U: Recenzja Dell Latitude 9450 2-w-1
Acer Swift Go 14 OLED SFG14-73, Ultra 5 125U: Intel Core Ultra 5 125U, 14.00", 1.3 kg
Zewnętrzna recenzja » Acer Swift Go 14 OLED SFG14-73, Ultra 5 125U
Lenovo ThinkPad L13 G5: Intel Core Ultra 5 125U, 13.30", 1.2 kg
Zewnętrzna recenzja » Lenovo ThinkPad L13 G5
HP EliteBook 640 G11: Intel Core Ultra 7 155U, 14.00", 1.4 kg
Zewnętrzna recenzja » HP EliteBook 640 G11
HP Pavilion 16-af0075ng: Intel Core Ultra 5 125U, 16.00", 1.8 kg
Zewnętrzna recenzja » HP Pavilion 16-af0075ng
Lenovo ThinkPad E14 G6: Intel Core Ultra 7 155U, 14.00", 1.5 kg
Zewnętrzna recenzja » Lenovo ThinkPad E14 G6
Acer Chromebook Plus Spin 714-1H, Ultra 5 115U: Intel Core Ultra 5 115U, 14.00", 1.5 kg
Zewnętrzna recenzja » Acer Chromebook Plus Spin 714-1H, Ultra 5 115U
Asus ExpertBook CX5403, Ultra 5 115U: Intel Core Ultra 5 115U, 14.00", 1.4 kg
Zewnętrzna recenzja » Asus ExpertBook CX5403, Ultra 5 115U
Acer Swift Lite 14 AI SFL14-51M, Ultra 5 125U: Intel Core Ultra 5 125U, 14.00", 1.3 kg
Zewnętrzna recenzja » Acer Swift Lite 14 AI SFL14-51M, Ultra 5 125U
HP Probook 440 G11: Intel Core Ultra 5 125U, 14.00", 1.4 kg
Zewnętrzna recenzja » HP Probook 440 G11
HP Pavilion 16-af0000ng: Intel Core Ultra 5 125U, 16.00", 1.8 kg
Zewnętrzna recenzja » HP Pavilion 16-af0000ng
HP EliteBook 830 G11: Intel Core Ultra 7 155U, 13.30", 1.3 kg
Zewnętrzna recenzja » HP EliteBook 830 G11
HP EliteBook 840 G11: Intel Core Ultra 7 155U, 14.00", 1.4 kg
Zewnętrzna recenzja » HP EliteBook 840 G11
HP EliteBook 660 G11: Intel Core Ultra 7 155U, 16.00", 1.7 kg
Zewnętrzna recenzja » HP EliteBook 660 G11
Lenovo ThinkPad T14 G5, Ultra 5 125U: Intel Core Ultra 5 125U, 14.00", 1.4 kg
Zewnętrzna recenzja » Lenovo ThinkPad T14 G5, Ultra 5 125U
Lenovo ThinkPad X12 Detachable G2: Intel Core Ultra 5 134U, 12.30", 1.1 kg
Zewnętrzna recenzja » Lenovo ThinkPad X12 Detachable G2
Acer TravelMate P4 Spin 14 TMP414RN-54: Intel Core Ultra 5 125U, 14.00", 1.5 kg
Zewnętrzna recenzja » Acer TravelMate P4 Spin 14 TMP414RN-54
Lenovo ThinkPad T16 Gen 3 21MN005XGE: Intel Core Ultra 5 125U, 16.00", 2 kg
Zewnętrzna recenzja » Lenovo ThinkPad T16 Gen 3 21MN005XGE
Lenovo ThinkBook 14 G7 IML, Ultra 5 125U: Intel Core Ultra 5 125U, 14.00", 1.4 kg
Zewnętrzna recenzja » Lenovo ThinkBook 14 G7 IML, Ultra 5 125U
HP ProBook 460 G11: Intel Core Ultra 5 125U, 16.00", 1.7 kg
Zewnętrzna recenzja » HP ProBook 460 G11
Lenovo ThinkPad L14 G5: Intel Core Ultra 7 155U, 14.00", 1.4 kg
Zewnętrzna recenzja » Lenovo ThinkPad L14 G5
HP EliteBook 860 G11: Intel Core Ultra 7 155U, 16.00", 1.7 kg
Zewnętrzna recenzja » HP EliteBook 860 G11
Acer Swift Lite 14 AI SFL14-51M: Intel Core Ultra 7 155U, 14.00", 1.3 kg
Zewnętrzna recenzja » Acer Swift Lite 14 AI SFL14-51M
Dell Latitude 7450 2-in-1: Intel Core Ultra 7 155U, 14.00", 1.1 kg
Zewnętrzna recenzja » Dell Latitude 7450 2-in-1
Asus ExpertBook CX5403, Ultra 5 125U: Intel Core Ultra 5 125U, 14.00", 1.4 kg
Zewnętrzna recenzja » Asus ExpertBook CX5403, Core 5 125U
Lenovo ThinkBook 14 IML G4: Intel Core Ultra 5 125U, 14.00", 1.6 kg
Zewnętrzna recenzja » Lenovo ThinkBook 14 IML G4
Lenovo ThinkBook 14 2-in-1 G4 IML, Ultra 7 155U: Intel Core Ultra 7 155U, 14.00", 1.6 kg
Zewnętrzna recenzja » Lenovo ThinkBook 14 2-in-1 G4 IML, Ultra 7 155U
Lenovo ThinkPad L16 G1, Ultra 5 125U: Intel Core Ultra 5 125U, 16.00", 1.8 kg
Zewnętrzna recenzja » Lenovo ThinkPad L16 G1, Ultra 5 125U
HP Pavilion 16-af0000: Intel Core Ultra 7 155U, 16.00", 1.8 kg
Zewnętrzna recenzja » HP Pavilion 16-af0000
Asus ExpertBook B5404CMA: Intel Core Ultra 7 155U, 14.00", 1.4 kg
Zewnętrzna recenzja » Asus ExpertBook B5404CMA
HP Envy x360 14-fc0000: Intel Core Ultra 5 125U, 14.00", 1.4 kg
Zewnętrzna recenzja » HP Envy x360 14-fc0000
Asus Zenbook S 13 UX5304MA: Intel Core Ultra 7 155U, 13.30", 1 kg
Zewnętrzna recenzja » Asus Zenbook S 13 UX5304MA
Lenovo ThinkPad X13 2-in-1 G5: Intel Core Ultra 7 155U, 13.30", 1.3 kg
Zewnętrzna recenzja » Lenovo ThinkPad X13 2-in-1 G5
Lenovo ThinkPad T14 G5 21ML005JGE: Intel Core Ultra 7 155U, 14.00", 1.5 kg
Zewnętrzna recenzja » Lenovo ThinkPad T14 G5 21ML005JGE
Dell Latitude 5450: Intel Core Ultra 7 155U, 14.00", 1.4 kg
Zewnętrzna recenzja » Dell Latitude 5450
Dell Latitude 5550: Intel Core Ultra 7 155U, 15.60", 1.6 kg
Zewnętrzna recenzja » Dell Latitude 5550
Dell Latitude 9450 2-in-1: Intel Core Ultra 7 165U, 14.00", 1.6 kg
Zewnętrzna recenzja » Dell Latitude 9450 2-in-1
Asus ExpertBook CX5403: Intel Core Ultra 7 155U, 14.00", 1.4 kg
Zewnętrzna recenzja » Asus ExpertBook CX5403
Dell Latitude 7350 Detachable 2024: Intel Core Ultra 7 164U, 13.30", 0.9 kg
Zewnętrzna recenzja » Dell Latitude 7350 Detachable 2024
Dell Latitude 13 7350, Ultra 7 165U: Intel Core Ultra 7 165U, 13.30", 1.3 kg
Zewnętrzna recenzja » Dell Latitude 13 7350, Ultra 7 165U
Lenovo ThinkBook 14 2-in-1 G4 IML: Intel Core Ultra 5 125U, 14.00", 1.6 kg
Zewnętrzna recenzja » Lenovo ThinkBook 14 2-in-1 G4 IML
Acer Aspire Vero AV16-51P, Ultra 5 125U: Intel Core Ultra 5 125U, 16.00", 1.8 kg
Zewnętrzna recenzja » Acer Aspire Vero AV16-51P, Ultra 5 125U
Dell Latitude 7450: Intel Core Ultra 7 165U, 14.00", 1.5 kg
Zewnętrzna recenzja » Dell Latitude 7450
Acer Chromebook Plus Spin 714-1H: Intel Core Ultra 5 125U, 14.00", 1.5 kg
Zewnętrzna recenzja » Acer Chromebook Plus Spin 714-1H
Dell Latitude 13 7350: Intel Core Ultra 5 135U, 13.30", 1.1 kg
Zewnętrzna recenzja » Dell Latitude 13 7350
Lenovo ThinkPad X1 2in1 G9 21KE004AGE: Intel Core Ultra 7 165U, 14.00", 1.3 kg
Zewnętrzna recenzja » Lenovo ThinkPad X1 2in1 G9 21KE004AGE
HP Envy x360 14-fc: Intel Core Ultra 7 155U, 14.00", 1.4 kg
Zewnętrzna recenzja » HP Envy x360 14-fc
Acer Aspire Vero AV16-51P: Intel Core Ultra 7 155U, 16.00", 1.8 kg
Zewnętrzna recenzja » Acer Aspire Vero AV16-51P
Asus ZenBook S13 OLED UX5304MA: Intel Core Ultra 7 155U, 13.30", 1 kg
Zewnętrzna recenzja » Asus ZenBook S13 OLED UX5304MA
Lenovo Yoga 7 16IML9: Intel Core Ultra 5 125U, 16.00", 2 kg
Zewnętrzna recenzja » Lenovo Yoga 7 16IML9
Lenovo Yoga Book 9 13IMU9: Intel Core Ultra 7 155U, 13.30", 1.4 kg
Zewnętrzna recenzja » Lenovo Yoga Book 9 13IMU9
Microsoft Surface Pro 10: Intel Core Ultra 5 135U, 13.00", 0.9 kg
Zewnętrzna recenzja » Microsoft Surface Pro 10
Lenovo ThinkPad T14 G5 21ML005JGE: Intel Core Ultra 7 155U, 14.00", 1.5 kg
» Lenovo ThinkPad T14 G5: niemal idealny laptop biznesowy