Notebookcheck Logo

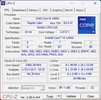
Intel Core i9-14900

Intel i9-14900

Intel Core i9-14900 to wysokiej klasy procesor oparty na architekturze Raptor-Lake. Jego bazowa częstotliwość taktowania wynosi 2,0 GHz, a w optymalnych warunkach może osiągnąć nawet 5,8 GHz. W porównaniu z topowym modelem (Intel Core i9-14900K) 32 wątki dzielą się na 8 P i 16 E-Kerne. Osiem wydajnych rdzeni (P-Core) posiada funkcję Hyperthreading, dzięki czemu w sumie mogą być obsługiwane 32 wątki. W przypadku modeli innych niż K należy zwrócić uwagę na procesor sparsamen. Jeśli chodzi o wydajność, istnieje możliwość ustawienia pamięci DDR4 lub DDR5.

Wydajność

W porównaniu do Intel Core i9-14900K, Core i9-14900 oferuje taką samą liczbę fizycznych zasobów. Ze względu na wyższą wydajność Intel Core i9-14900 oferuje jednak nieco niższą wydajność. Einsatzzweck jest w pierwszej linii kompatybilny z komputerami PC, które oferują jedynie ograniczone możliwości.

Wydajność graficzna

Podobnie jak Intel Core i9-14900K, Intel Core i9-14900 oferuje zintegrowaną wydajność graficzną. Podstawą jest tutaj architektura Intel Iris Xe. Pod względem technicznym Intel UHD Graphics 770 w niczym nie ustępuje Intelowi

Leistungsaufnahme

Intel Core i9-14900 ma TDP na poziomie 65 W, co jest wartością PL1. Im Boost kann die Leistung des Prozessors auf bis zu 219 Watt ansteigen (PL2). Wadą jest jednak bardzo dobra wydajność. W porównaniu do Intel Core i9-13900, nie ma żadnych ograniczeń w zakresie wydajności.

Nazwa roboczaRaptor Lake
SeriaIntel Raptor Lake-R

Rodzina: Raptor Lake-R Raptor Lake

Intel Core i9-14900K3.2 - 6 GHz24 / 32 cores36 MB L3
Intel Core i7-14700K2.5 - 5.6 GHz20 / 28 cores33 MB L3
Intel Core i9-14900 « 2 - 5.8 GHz24 / 32 cores36 MB L3
Intel Core i7-147001.5 - 5.4 GHz20 / 28 cores33 MB L3
Intel Core i5-14600K3.5 - 5.3 GHz14 / 20 cores24 MB L3
Intel Core i5-145002.6 - 5 GHz14 / 20 cores24 MB L3
Intel Core i5-14500T1.7 - 4.8 GHz14 / 20 cores24 MB L3
Taktowanie2000 - 5800 MHz
Pamięć 2. poziomu32 MB
Pamięć 3. poziomu36 MB
Liczba rdzeni / wątków24 / 32
8 x 5.8 GHz Intel Raptor Cove P-Core
16 x 4.3 GHz Intel Gracemont E-Core
TDP (Thermal Design Power)65 W
TDP Turbo PL2219 W
Technologia wytwarzania10 nm
Rozmiar procesora257 mm2
Maks. temperatura100 °C
GniazdoLGA 1700
GPUIntel UHD Graphics 770 (300 - 1650 MHz)
64-bityobsługa 64-bitów
Architecturex86
Najniższa cena$549 U.S.
Data premiery08/01/2024
Odnośnik do produktu (zewn.)www.intel.de

Testy

Performance Rating - CB R15 + R20 + 7-Zip + X265 + Blender + 3DM11 CPU
47.2 pt (79%)
Cinebench 2024 - Cinebench 2024 CPU Single Core
129 Points (72%)
Cinebench 2024 - Cinebench 2024 CPU Multi Core
1245 Points (23%)
Cinebench R23 - Cinebench R23 Single Core
2212 Points (94%)
74.4 -97%
...
2081 -6%
2116 -4%
Intel Core Ultra 5 245K
2132 -4%
2150 -3%
2160 -2%
2184 -1%
2202 0%
2209 0%
2211 0%
Intel Core i9-14900
2212
2213 0%
2221 0%
2238 1%
2253 2%
2263 2%
2270 3%
Intel Core Ultra 9 285K
2348 6%
0%
100%
Cinebench R20 - Cinebench R20 CPU (Single Core)
846 Points (94%)
Cinebench R20 - Cinebench R20 CPU (Multi Core)
11291 Points (28%)
Cinebench R15 - Cinebench R15 CPU Multi 64 Bit
4793 Points (30%)
31 -99%
...
4061 -15%
4320 -10%
AMD Ryzen 9 5950X
4324 -10%
AMD Ryzen Threadripper 2970WX
4376 -9%
4437 -7%
4508 -6%
4522 -6%
4565 -5%
4724 -1%
Intel Core i9-14900
4793
4818 1%
5008 4%
5035 5%
5374 12%
5563 16%
5600 17%
5798 21%
5974 25%
6103 27%
...
15842 231%
0%
100%
02505007501000125015001750200022502500275030003250350037504000425045004750Tooltip
Cinebench R15 - Cinebench R15 CPU Single 64 Bit
315 Points (88%)
19 -94%
...
303.6 -4%
305.2 -3%
305.9 -3%
307 -3%
308 -2%
311 -1%
313.5 0%
313.7 0%
314.1 0%
Intel Core i9-14900
315
316 0%
Intel Core Ultra 5 245K
322 2%
322.2 2%
324.5 3%
326 3%
AMD Ryzen 7 9800X3D
328 4%
342 9%
344 9%
346 10%
...
Intel Core Ultra 9 285K
355.5 13%
0%
100%
Cinebench R11.5 - Cinebench R11.5 CPU Multi 64 Bit
56.6 Points (73%)
Cinebench R11.5 - Cinebench R11.5 CPU Single 64 Bit
3.8 Points (90%)
Cinebench R10 - Cinebench R10 Rend. Single (32bit)
12284 pkt. (74%)
Cinebench R10 - Cinebench R10 Rend. Multi (32bit)
82492 pkt. (60%)
Cinebench R10 - Cinebench R10 Rend. Multi (64bit)
121768 Points (78%)
Cinebench R10 - Cinebench R10 Rend. Single (64bit)
17590 Points (21%)
wPrime 2.10 - wPrime 2.0 1024m *
85.6 s (1%)
wPrime 2.10 - wPrime 2.0 32m *
2.4 s (0%)
WinRAR - WinRAR 4.0
12359 pkt. (20%)
7-Zip 18.03 - 7-Zip 18.03 Multi Thread 4 runs
101652 MIPS (58%)
7-Zip 18.03 - 7-Zip 18.03 Single Thread 4 runs
7276 MIPS (86%)
X264 HD Benchmark 4.0 - x264 Pass 2
222 fps (74%)
X264 HD Benchmark 4.0 - x264 Pass 1
358.5 fps (83%)
HWBOT x265 Benchmark v2.2 - HWBOT x265 4k Preset
31.6 fps (56%)
0510152025303540Tooltip
TrueCrypt - TrueCrypt Serpent
2.4 GB/s (71%)
TrueCrypt - TrueCrypt Twofish
4.9 GB/s (84%)
TrueCrypt - TrueCrypt AES
18.5 GB/s (48%)
Blender - Blender 3.3 Classroom CPU *
263 Seconds (3%)
Blender - Blender 2.79 BMW27 CPU *
131 Seconds (1%)
R Benchmark 2.5 - R Benchmark 2.5 *
0.4 sec (8%)
3DMark 06 - CPU - 3DMark 06 - CPU
18728 Points (40%)
Super Pi mod 1.5 XS 1M - Super Pi mod 1.5 XS 1M *
5.8 s (1%)
Super Pi mod 1.5 XS 2M - Super Pi mod 1.5 XS 2M *
12.6 s (1%)
Super Pi Mod 1.5 XS 32M - Super Pi mod 1.5 XS 32M *
303.4 s (1%)
3DMark Vantage - 3DM Vant. Perf. CPU no Physx
93183 Points (72%)
3DMark 11 - 3DM11 Performance Physics
28622 Points (72%)
3DMark - 3DMark Ice Storm Physics
88787 Points (72%)
3DMark - 3DMark Ice Storm Extreme Physics
90442 Points (73%)
3DMark - 3DMark Ice Storm Unlimited Physics
93001 Points (77%)
3DMark - 3DMark Cloud Gate Physics
20179 Points (51%)
3DMark - 3DMark Fire Strike Standard Physics
42316 Points (75%)
3DMark - 3DMark Time Spy CPU
19492 Points (82%)
Geekbench 6.3 - Geekbench 6.3 Single-Core
3022 pkt. (77%)
Geekbench 6.0 - Geekbench 6.0 Single-Core
3105 pkt. (99%)
Geekbench 6.0 - Geekbench 6.0 Multi-Core
21003 pkt. (86%)
Geekbench 5.5 - Geekbench 5.1 - 5.5 64 Bit Single-Core
2140 pkt. (84%)
Geekbench 5.5 - Geekbench 5.1 - 5.5 64 Bit Multi-Core
17395 pkt. (31%)
Geekbench 5.0 - Geekbench 5.0 64 Bit Single-Core
2077 pkt. (9%)
Geekbench 5.0 - Geekbench 5.0 64 Bit Multi-Core
17218 pkt. (54%)
Geekbench 4.4 - Geekbench 4.1 - 4.4 64 Bit Single-Core
9143 pkt. (91%)
Geekbench 4.4 - Geekbench 4.1 - 4.4 64 Bit Multi-Core
67178 pkt. (67%)
Mozilla Kraken 1.1 - Kraken 1.1 Total Score *
436 ms (1%)
CrossMark - CrossMark Overall
2133 Points (80%)
Power Consumption - Prime95 Power Consumption - external Monitor *
145.5 Watt (25%)
0153045607590105120135150165180195210225240255270Tooltip
Power Consumption - Cinebench R15 Multi Power Consumption - external Monitor *
253 Watt (46%)
0153045607590105120135150165180195210225240255270285Tooltip
Power Consumption - Idle Power Consumption - external Monitor *
29.9 Watt (20%)
051015202530Tooltip
Power Consumption - Cinebench R15 Multi Power Efficiency - external Monitor
18.9 Points per Watt (14%)
- Zakres wyników testów referencyjnych dla tej karty graficznej
red legend - Średnia wartość wyników testów referencyjnych dla tej karty graficzne
* Smaller numbers mean a higher performance

v1.28
log 15. 23:58:33

#0 ran 0s before starting gpusingle class +0s ... 0s

#1 no ids found in url (should be separated by "_") +0s ... 0s

#2 not redirecting to Ajax server +0s ... 0s

#3 did not recreate cache, as it is less than 5 days old! Created at Mon, 13 Jan 2025 05:33:32 +0100 +0.001s ... 0.001s

#4 no comparison url found in template nbc.compare_page_2 needed +0.008s ... 0.008s

#5 no comparison url found in template nbc.compare_page_2 needed +0s ... 0.009s

#6 no comparison url found in template nbc.compare_page_2 needed +0s ... 0.009s

#7 no comparison url found in template nbc.compare_page_2 needed +0s ... 0.009s

#8 no comparison url found in template nbc.compare_page_2 needed +0s ... 0.009s

#9 no comparison url found in template nbc.compare_page_2 needed +0s ... 0.01s

#10 composed specs +0.001s ... 0.01s

#11 did output specs +0s ... 0.011s

#12 getting avg benchmarks for device 18150 +0.018s ... 0.029s

#13 got single benchmarks 18150 +0.01s ... 0.039s

#14 got avg benchmarks for devices +0s ... 0.039s

#15 min, max, avg, median took s +1.114s ... 1.153s

#16 no comparison url found in template nbc.compare_page_2 needed +0s ... 1.153s

#17 return log +0s ... 1.153s

Please share our article, every link counts!
Mail Logo

Inne procesory tej serii Raptor Lake-R

» Intel Core i9-14900K
   24x 3.2 GHz - 6 GHz
» Intel Core i7-14700K
   20x 2.5 GHz - 5.6 GHz
» Intel Core i9-14900
   24x 2 GHz - 5.8 GHz
» Intel Core i7-14700
   20x 1.5 GHz - 5.4 GHz
» Intel Core i5-14600K
   14x 3.5 GHz - 5.3 GHz
» Intel Core i5-14500
   14x 2.6 GHz - 5 GHz
» Intel Core i5-14500T
   14x 1.7 GHz - 4.8 GHz

Porównywalne CPU

+ Intel Core i7-14700K
   20x 2.5 GHz - 5.6 GHz
+ AMD Ryzen 9 7900X
   12x 4.7 GHz - 5.6 GHz
+ Intel Core i7-13700K
   16x 3.4 GHz - 5.4 GHz
+ AMD Ryzen Threadripper PRO 3975WX
   32x 3.5 GHz - 4.2 GHz
+ Apple M4 Pro (14 cores)
   14x 2.59 GHz - 4.51 GHz
» Intel Core i9-14900
   24x 2 GHz - 5.8 GHz
- AMD Ryzen 7 9700X
   8x 3.8 GHz - 5.5 GHz
- AMD Ryzen 9 7900
   12x 3.7 GHz - 5.4 GHz
- Intel Core i7-14700
   20x 1.5 GHz - 5.4 GHz
- Intel Core i9-12900K
   16x 3.2 GHz - 5.2 GHz
- Intel Core Ultra 5 245K
   14x 3.6 GHz - 5.2 GHz
Klaus Hinum (Update: 2024-10-13)