Intel Core i5-13500
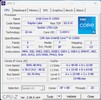
Intel Core i5-13500 to szybszy i bardziej oszczędny procesor do komputerów stacjonarnych oparty na architekturze Raptor-Lake, która została zaprezentowana w październiku 2022 roku. Procesor oferuje bazową częstotliwość taktowania 2,5 GHz i osiąga maks. 4,8 GHz w trybie Turbo. Hybrydowa architektura procesora z technologią Alder-Lake pojawia się również w procesorach Raptor-Lake. W porównaniu do Intel Core i5-12500, Intel Core i5-13500 oferuje więcej mocy obliczeniowej, dzięki czemu można uzyskać wyższą wydajność. W sumie Intel Core i5-13500 może obsługiwać równolegle do 20 wątków. Wydajne rdzenie (P-Cores) są wyposażone w technologię Hyperthreading, która umożliwia wykorzystanie energooszczędnych rdzeni (E-Cores).
Wydajność
Intel Core i5-13500 w porównaniu do Intel Core i5-12500 cechuje się wyższą wydajnością ze względu na większą liczbę fizycznych recesorów. Oba procesory składają się z 6 P-Kerne, przy czym tylko Intel Core i5-13500 jest wyposażony w 8 E-Kerne.
Grafikeinheit
Podobnie jak Intel Core i5-12600K, Intel Core i5-13500 oferuje zintegrowaną wydajność graficzną. Podstawą jest tutaj architektura Intel Iris Xe. Nowe układy Intel UHD Graphics 770 charakteryzują się znacznie lepszymi parametrami technicznymi.
Leistungsaufnahme
TDP procesora Intel Core i5-13500 wynosi 65 W, z opcją obniżenia do 154 W w trybie Turbo. W porównaniu do Intel Core i5-12500, pobór energii jest znacznie wyższy.
Seria Intel Raptor Lake-S Nazwa robocza Raptor Lake Rodzina: Raptor Lake-S Raptor Lake Taktowanie 2500 - 4800 MHz Pamięć 2. poziomu 11.5 MB Pamięć 3. poziomu 24 MB Liczba rdzeni / wątków 14 / 20 6 x 4.8 GHz Intel Raptor Cove P-Core 8 x 3.5 GHz Intel Gracemont E-Core TDP (Thermal Design Power) 65 W TDP Turbo PL2 154 W Technologia wytwarzania 10 nm Rozmiar procesora 215 mm2 Maks. temperatura 100 °C Gniazdo LGA 1700 Cechy Intel UHD Graphics 770, DDR5 4800 MT/s, DDR4 3200 MT/s GPU Intel UHD Graphics 770 (300 - 1550 MHz)64-bity obsługa 64-bitów Architecture x86 Data premiery 04/01/2023 Odnośnik do produktu (zewn.) www.intel.de
Testy Performance Rating - CB R15 + R20 + 7-Zip + X265 + Blender + 3DM11 CPU
38.3 pt (64%)
...
AMD Ryzen 9 5900X
...
Cinebench 2024 - Cinebench 2024 CPU Single Core
107 Points (60%)
...
Apple M1
...
Cinebench 2024 - Cinebench 2024 CPU Multi Core
822 Points (15%)
...
Apple M1 Pro
...
Cinebench R23 - Cinebench R23 Multi Core
14573 Points (14%)
...
...
Cinebench R23 - Cinebench R23 Single Core
1780 Points (76%)
...
...
Intel Core Ultra 9 285K
Cinebench R20 - Cinebench R20 CPU (Single Core)
685 Points (76%)
...
...
Cinebench R20 - Cinebench R20 CPU (Multi Core)
5633 Points (14%)
...
AMD Ryzen Threadripper 2920X
...
Cinebench R15 - Cinebench R15 CPU Multi 64 Bit
2405 Points (15%)
...
Intel Core i9-10910
Intel Core i9-10850K
...
0 125 250 375 500 625 750 875 1000 1125 1250 1375 1500 1625 1750 1875 2000 2125 2250 2375 Tooltip HP Elite Mini 800 G9-5M9T9EA: Ø2153 (1959.73-2450.98)
Cinebench R15 - Cinebench R15 CPU Single 64 Bit
256 Points (72%)
...
AMD Ryzen 9 5900X
AMD Ryzen 5 5600X
...
Intel Core Ultra 9 285K
Cinebench R11.5 - Cinebench R11.5 CPU Multi 64 Bit
28.4 Points (37%)
...
AMD Ryzen Threadripper 2950X
Intel Core i9-10850K
Intel Core i9-10900K
AMD Ryzen 7 5800X
...
Cinebench R11.5 - Cinebench R11.5 CPU Single 64 Bit
3.1 Points (74%)
...
AMD Ryzen 9 5950X
AMD Ryzen 7 5800X
AMD Ryzen 9 5900X
...
Intel Core Ultra 9 285K
Cinebench R10 - Cinebench R10 Rend. Single (32bit)
8875 pkt. (54%)
...
Intel Core i7-1185G7
AMD Ryzen 7 9800X3D
Intel Core i5-11500B
...
Cinebench R10 - Cinebench R10 Rend. Multi (32bit)
49300 pkt. (36%)
...
AMD Ryzen Threadripper 2920X
Intel Core i9-7900X
Intel Core i7-10700K
...
Cinebench R10 - Cinebench R10 Rend. Multi (64bit)
79625 Points (51%)
...
AMD Ryzen Threadripper 2920X
AMD Ryzen Threadripper 2950X
Intel Core i9-10850K
AMD Ryzen 9 3900X
Intel Core i9-10900K
AMD Ryzen 7 5800X
...
Intel Core Ultra 9 285K
Cinebench R10 - Cinebench R10 Rend. Single (64bit)
14282 Points (17%)
...
Intel Core i7-1265U
...
Intel Core Ultra 9 285K
wPrime 2.10 - wPrime 2.0 1024m *
100.7 s (1%)
...
Intel Core i7-6950X
AMD Ryzen 7 2700X
AMD Ryzen 7 4800U
AMD Ryzen 7 1800X
Intel Xeon W-10885M
AMD Ryzen 7 PRO 4750U
AMD Ryzen 7 1700X
...
wPrime 2.10 - wPrime 2.0 32m *
4 s (1%)
...
Intel Core i9-10885H
AMD Ryzen 5 5600X
AMD Ryzen 7 PRO 4750U
Intel Core i9-9900K
Intel Core i5-12400F
AMD Ryzen 7 4800HS
AMD Ryzen 9 3950X
Intel Core i7-8086K
AMD Ryzen Threadripper 2970WX
AMD Ryzen Threadripper 2950X
...
Transmeta Crusoe TM-5800
7704 pkt. (12%)
...
AMD Ryzen 7 3700X
AMD Ryzen 9 3900X
Intel Core i9-9900K
Intel Core i5-12400F
...
7-Zip 18.03 - 7-Zip 18.03 Multi Thread 4 runs
55528 MIPS (32%)
...
Intel Core i7-10700K
Intel Core i9-9900KS
AMD Ryzen 5 5600X
...
7-Zip 18.03 - 7-Zip 18.03 Single Thread 4 runs
5887 MIPS (69%)
...
Intel Core i9-10850K
...
AMD Ryzen 7 9800X3D
X264 HD Benchmark 4.0 - x264 Pass 2
134.6 fps (45%)
...
AMD Ryzen Threadripper 2920X
AMD Ryzen 9 3900
AMD Ryzen Threadripper 1950X
...
Intel Core Ultra 9 285K
X264 HD Benchmark 4.0 - x264 Pass 1
306 fps (71%)
...
AMD Ryzen 5 5600X
...
Intel Core Ultra 9 285K
HWBOT x265 Benchmark v2.2 - HWBOT x265 4k Preset
16.3 fps (29%)
...
AMD Ryzen 7 3800XT
Intel Core i9-9900KS
Intel Core i7-10700K
Intel Core i9-10910
AMD Ryzen Threadripper 1950X
...
0 5 10 15 20 Tooltip HP Elite Mini 800 G9-5M9T9EA: Ø16.5 (0.54-20.6)
TrueCrypt - TrueCrypt Serpent
1.3 GB/s (38%)
...
AMD Ryzen 7 5800X
Intel Core i7-6950X
...
TrueCrypt - TrueCrypt Twofish
2.3 GB/s (40%)
...
AMD Ryzen 9 3900
Intel Core i9-10850K
Intel Core i9-10900K
AMD Ryzen Threadripper 2920X
...
TrueCrypt - TrueCrypt AES
12 GB/s (31%)
...
AMD Ryzen 7 3700X
Intel Core i9-7900X
Intel Core i9-9900KS
AMD Ryzen Threadripper 2970WX
...
Blender - Blender 3.3 Classroom CPU *
399 Seconds (5%)
...
...
Intel Celeron J4125
Blender - Blender 2.79 BMW27 CPU *
223 Seconds (2%)
...
Intel Core i7-10700K
AMD Ryzen 7 3800XT
Intel Core i9-9900KS
...
R Benchmark 2.5 - R Benchmark 2.5 *
0.4 sec (10%)
...
AMD Ryzen 7 5800X
...
3DMark 06 - CPU - 3DMark 06 - CPU
14875 Points (32%)
...
AMD Ryzen 5 5600X
AMD Ryzen 9 3900X
Intel Core i9-9900KS
Intel Core i7-12700
...
Super Pi mod 1.5 XS 1M - Super Pi mod 1.5 XS 1M *
7.8 s (2%)
...
Intel Core i7-10850H
Intel Core i5-9600K
Intel Core i7-9700K
Intel Xeon W-10885M
Intel Core i7-10610U
Intel Core i5-10600K
Intel Core i9-10980HK
...
Super Pi mod 1.5 XS 2M - Super Pi mod 1.5 XS 2M *
17.2 s (1%)
...
Intel Core i9-9900K
AMD Ryzen 7 9800X3D
Intel Xeon W-10885M
Intel Core i7-10700K
Intel Core i7-1160G7
Intel Core i9-10980HK
Intel Core i7-10700
...
3DMark Vantage - 3DM Vant. Perf. CPU no Physx
69725 Points (54%)
...
AMD Ryzen 7 3700X
Intel Core i7-12700
...
Intel Core Ultra 9 285K
3DMark 11 - 3DM11 Performance Physics
18026 Points (45%)
...
Intel Core i9-9900K
AMD Ryzen Threadripper 1950X
Intel Core i7-10700K
AMD Ryzen 7 3700X
Intel Core i9-10910
...
AMD Ryzen 7 9800X3D
3DMark - 3DMark Ice Storm Physics
84456 Points (69%)
...
AMD Ryzen 7 3800XT
Intel Core i7-9700K
AMD Ryzen 9 5900X
...
3DMark - 3DMark Ice Storm Extreme Physics
83392 Points (68%)
...
Intel Core i5-12400F
AMD Ryzen 7 3800XT
AMD Ryzen 9 5900X
Intel Core i7-9700K
...
3DMark - 3DMark Ice Storm Unlimited Physics
81778 Points (68%)
...
Intel Core i5-9600K
AMD Ryzen 9 5950X
AMD Ryzen 7 3700X
...
Intel Core Ultra 5 245K
3DMark - 3DMark Cloud Gate Physics
17891 Points (45%)
...
AMD Ryzen 9 3950X
Intel Core i9-9900K
AMD Ryzen 9 3900X
...
Intel Core Ultra 9 285K
3DMark - 3DMark Fire Strike Standard Physics
26263 Points (47%)
...
AMD Ryzen 5 5600X
AMD Ryzen 9 3900
AMD Ryzen Threadripper 2950X
...
Intel Core Ultra 9 285K
3DMark - 3DMark Time Spy CPU
9655 Points (41%)
...
Intel Core i9-10980HK
Intel Core i7-6950X
Intel Core i5-12400F
AMD Ryzen Threadripper 1950X
...
Geekbench 6.3 - Geekbench 6.3 Single-Core
2483 pkt. (63%)
...
Apple M1 Pro
...
Geekbench 6.3 - Geekbench 6.3 Multi-Core
10348 pkt. (41%)
...
Apple M2
...
Geekbench 5.5 - Geekbench 5.1 - 5.5 64 Bit Single-Core
1805 pkt. (71%)
...
AMD Ryzen Z1
...
Geekbench 5.5 - Geekbench 5.1 - 5.5 64 Bit Multi-Core
10322 pkt. (18%)
...
AMD Ryzen 9 3900
Intel Core i9-10910
AMD Ryzen Threadripper 2970WX
AMD Ryzen 7 5800X
...
Geekbench 5.0 - Geekbench 5.0 64 Bit Single-Core
1749 pkt. (8%)
...
...
Geekbench 5.0 - Geekbench 5.0 64 Bit Multi-Core
10213 pkt. (32%)
...
Intel Core i5-12400F
AMD Ryzen 9 3900
...
AMD Ryzen Threadripper PRO 3995WX
Geekbench 4.4 - Geekbench 4.1 - 4.4 64 Bit Single-Core
7379 pkt. (74%)
...
AMD Ryzen 7 5800X
Intel Core i7-1265U
Intel Core i5-12400F
...
Geekbench 4.4 - Geekbench 4.1 - 4.4 64 Bit Multi-Core
39094 pkt. (39%)
...
Intel Core i7-6950X
Intel Core i9-7900X
AMD Ryzen 9 3900
Intel Core i9-10900K
...
Mozilla Kraken 1.1 - Kraken 1.1 Total Score *
519 ms (1%)
...
Intel Core i7-12700
...
Apple S7
WebXPRT 4 - WebXPRT 4 Score
254 Points (71%)
...
...
WebXPRT 3 - WebXPRT 3 Score
266 Points (49%)
...
Apple M1
AMD Ryzen 9 5900X
Intel Core i7-1265U
...
CrossMark - CrossMark Overall
1549 Points (59%)
...
Apple M2
Intel Core i7-1265U
AMD Ryzen 7 5800X
Apple M1 Pro
Intel Core i5-1245U
AMD Ryzen 9 5900X
...
Intel Core Ultra 9 285K
Power Consumption - Prime95 Power Consumption - external Monitor *
98.7 Watt (17%)
...
Intel Core i7-10750H
AMD Ryzen 3 1200
AMD Ryzen 3 2200G
Intel Core i5-10300H
Intel Core i7-10870H
Intel Core i7-10875H
Intel Core i5-10500H
Intel Core i5-10200H
...
AMD Ryzen Threadripper PRO 3975WX
0 10 20 30 40 50 60 70 80 90 100 110 120 Tooltip HP Elite Mini 800 G9-5M9T9EA: Ø98.7 (93.7-122.2)
Power Consumption - Cinebench R15 Multi Power Consumption - external Monitor *
121 Watt (22%)
...
Intel Core i5-8500T
Intel Core i7-10875H
Intel Core i7-8700
Intel Core i5-10500H
Intel Core i5-9400F
Intel Core i5-10400F
Intel Core i7-7700K
AMD Ryzen 3 3100
...
0 10 20 30 40 50 60 70 80 90 100 110 120 Tooltip HP Elite Mini 800 G9-5M9T9EA: Ø121 (119.8-121.8)
Power Consumption - Idle Power Consumption - external Monitor *
7.9 Watt (5%)
...
...
0 1 2 3 4 5 6 7 8 9 10 11 12 13 Tooltip HP Elite Mini 800 G9-5M9T9EA: Ø7.91 (4.15-13.2)
Power Consumption - Cinebench R15 Multi Power Efficiency - external Monitor
19.9 Points per Watt (15%)
...
Intel Core i9-9900T
Intel Core i5-1230U
Intel Core i7-1160G7
Intel Core i5-1035G7
...
Intel Core i5-10200H
- Zakres wyników testów referencyjnych dla tej karty graficznej
- Średnia wartość wyników testów referencyjnych dla tej karty graficzne
* Smaller numbers mean a higher performance
v1.28
log 16. 04:39:04
#0 ran 0s before starting gpusingle class +0s ... 0s
#1 no ids found in url (should be separated by "_") +0s ... 0s
#2 not redirecting to Ajax server +0s ... 0s
#3 did not recreate cache, as it is less than 5 days old! Created at Fri, 15 Nov 2024 15:27:19 +0100 +0.001s ... 0.001s
#4 no comparison url found in template nbc.compare_page_2 needed +0.002s ... 0.003s
#5 no comparison url found in template nbc.compare_page_2 needed +0s ... 0.004s
#6 no comparison url found in template nbc.compare_page_2 needed +0s ... 0.004s
#7 no comparison url found in template nbc.compare_page_2 needed +0s ... 0.004s
#8 composed specs +0.001s ... 0.005s
#9 did output specs +0s ... 0.005s
#10 getting avg benchmarks for device 17901 +0.019s ... 0.024s
#11 got single benchmarks 17901 +0.009s ... 0.033s
#12 got avg benchmarks for devices +0s ... 0.033s
#13 min, max, avg, median took s +1.012s ... 1.044s
#14 no comparison url found in template nbc.compare_page_2 needed +0s ... 1.045s
#15 return log +0s ... 1.045s
Please share our article, every link counts!
Inne procesory tej serii Raptor Lake-S Porównywalne CPU + Apple M4 Pro (12 cores) 12x
+ AMD Ryzen 9 5900X 12x 3.7 GHz - 4.8 GHz
+ Intel Core i9-10980XE 18x 3 GHz - 4.6 GHz
+ Intel Core i9-9980XE 18x 3 GHz - 4.4 GHz
- Intel Core i7-12700 12x 3.3 GHz - 4.9 GHz
Klaus Hinum (Update: 2024-10-13)