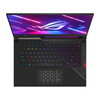
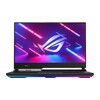
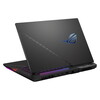
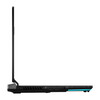
Recenzja Asus ROG Strix Scar 15 G533zm: Nowoczesny laptop do gier RTX 3060 z wieloma mocnymi stronami

Obecnie mamy do przetestowania dwa modele Asus ROG Strix Scar 15. W tym artykule skupimy się na RTX 3060 podczas gdy recenzja wersji RTX 3070 Ti zostanie opublikowana równolegle. Oprócz RTX 3060, nasz SKU jest wyposażony w potężny procesor Alder Lake i9-12900H CPU, 16 GB pamięci RAM i wyświetlacz QHD 240 Hz.
W zeszłym roku recenzowaliśmy poprzedni model Scar 15 z kartą graficzną RTX 3080więc bardziej sensowne jest porównanie naszej jednostki testowej z jej rodzeństwem RTX 3070 Ti. Ponadto zdecydowaliśmy się uwzględnić w naszym porównaniu inne 15-calowe laptopy do gier z tym samym GPU, takie jak Asus TUF Gaming F15i MSI Pulse GL66 i Alienware m15 R5. Chociaż porównanie obejmuje również Lenovo Legion 5 z kartą Radeon RX6600Mto laptop ten nie znajduje się w tym samym przedziale cenowym co Strix Scar, biorąc pod uwagę, że nasza recenzowana konfiguracja została wyceniona na około 2000 euro (2170 USD), podczas gdy Legion kosztuje nieco ponad 1000 euro (1085 USD).
Aby zapoznać się z sekcjami dotyczącymi obudowy, konserwacji, urządzeń wejściowych i nie tylko, proszę odnieść się do naszej głównej recenzji Asus ROG Strix Scar z RTX 3070 Ti.
Porównanie możliwych alternatyw
Ocena | Data | Model | Waga | Wysokość | Rozmiar | Rezolucja | Cena |
|---|---|---|---|---|---|---|---|
| 89.2 % v7 (old) | 11/2024 | Asus ROG Strix Scar 15 G533zm i9-12900H, GeForce RTX 3060 Laptop GPU | 2.3 kg | 27.2 mm | 15.60" | 2560x1440 | |
| 86.3 % v7 (old) | Asus ROG Strix Scar 15 G533ZW-LN106WS i9-12900H, GeForce RTX 3070 Ti Laptop GPU | 2.3 kg | 27.2 mm | 15.60" | 2560x1440 | ||
| 87.2 % v7 (old) | Asus TUF Gaming F15 FX507ZM i7-12700H, GeForce RTX 3060 Laptop GPU | 2.1 kg | 24.95 mm | 15.60" | 1920x1080 | ||
| 80.7 % v7 (old) | MSI Pulse GL66 12UEK i9-12900H, GeForce RTX 3060 Laptop GPU | 2.3 kg | 25 mm | 15.60" | 1920x1080 | ||
| 84.7 % v7 (old) | Alienware m15 R5 Ryzen Edition R7 5800H, GeForce RTX 3060 Laptop GPU | 2.5 kg | 22.85 mm | 15.60" | 1920x1080 | ||
| 82.6 % v7 (old) | Lenovo Legion 5 15ACH6A-82NW0010GE R5 5600H, Radeon RX 6600M | 2.5 kg | 25.75 mm | 15.60" | 1920x1080 |
Obudowa - atrakcyjny wygląd laptopa do gier
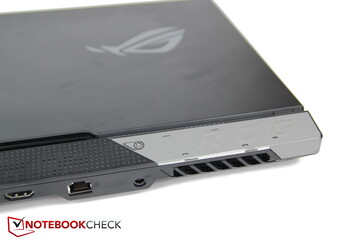
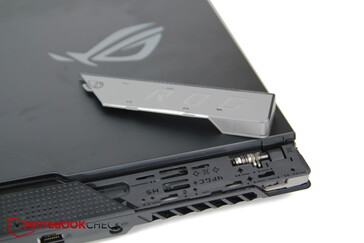
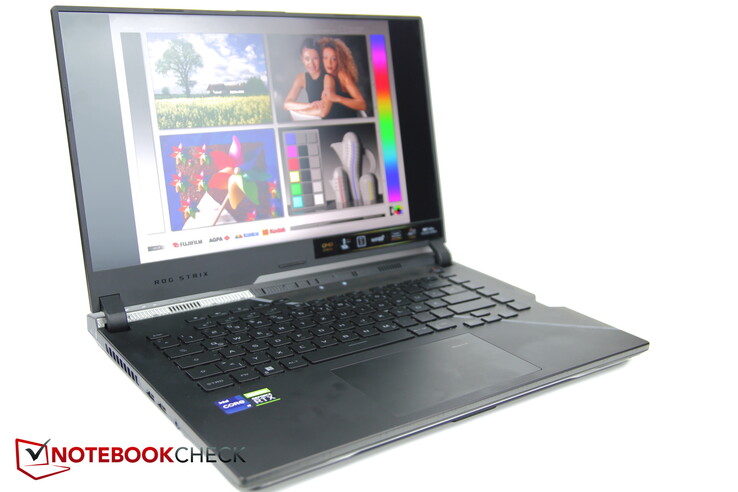
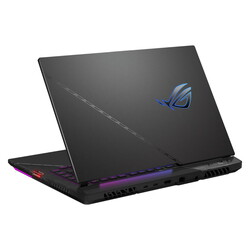
Dość unikalna filozofia projektowania przenika cały ROG Scar, czyniąc go atrakcyjnym laptopem dla graczy. Dzięki ukośnym liniom, wymiennej płycie na tylnej pokrywie, subtelnym akcentom kolorystycznym i elementom RGB, producent stworzył wyrazisty styl gamingowy bez nadmiernie jaskrawego oświetlenia, które miga i świeci.
Na przykład, pasek świetlny biegnie przez cały przód, ale jest lekko zagłębiony, dzięki czemu wydaje się mniej widoczny. Ten pasek świetlny można również zsynchronizować z klawiaturą i logo ROG na górnej stronie.
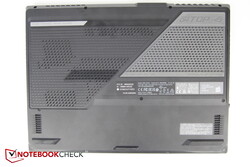
Na spodzie znajdują się szerokie, gumowe nóżki w jaskrawym kolorze, dodające kontrastu do przeważnie czarnej obudowy.
Pomimo niemal całkowicie plastikowej konstrukcji, Strix Scar 15 sprawia wrażenie dość solidnego. Wyświetlacz nie hałasuje przy przekręcaniu, a podstawa tylko lekko skrzypi.
Wyświetlacz jest bezpiecznie utrzymywany na miejscu przez dwa zawiasy, nie wykazując prawie żadnego chybotania podczas przenoszenia.
Porównanie rozmiarów
Ogólnie rzecz biorąc, Scar 15 jest nieznacznie grubszy, ale o ułamek mniejszy niż niektórzy z jego konkurentów. Jest również stosunkowo lekki; na przykład modele Alienware i Legion są cięższe, a tylko TUF Gaming F15 jest nieco lżejszy.
Specyfikacja - Thunderbolt 4, Keystone, ale bez kamery internetowej
Strix jest wyposażony w dwa porty USB-C, z których jeden obsługuje Thunderbolt 4, a drugi USB 3.2 Gen 2; oba oferują funkcjonalność DisplayPort. Pokazuje to, że laptop ma dość nowoczesne funkcje. Wejścia/wyjścia są dobrze rozmieszczone po lewej stronie i z tyłu urządzenia.
Po prawej stronie znajduje się tylko gniazdo Keystone. Keystone jest czymś w rodzaju małego urządzenia pamięci masowej i przełącznika w jednym. Na przykład, może być używany do przechowywania ustawień i przenoszenia ich do laptopów, które obsługują tę funkcję (lista kompatybilnych modeli jest dostarczana przez Asusa)). Może również działać jako klucz bezpieczeństwa w Strix Scar: po skonfigurowaniu laptop włączy się tylko z włożonym Keystone. Innym zastosowaniem jest umożliwienie szybkiego dostępu do programów. Użytkownicy mogą poinstruować laptopa, aby automatycznie otwierał określony program, taki jak gra, po podłączeniu Keystone. Laptop może być również zaprogramowany do wykonywania kombinacji działań, takich jak przełączanie w tryb wysokiej wydajności wentylatora i jednoczesne uruchamianie Cyberpunk. Wybór należy do użytkownika.
W urządzeniu Asusa brakuje jednak jednej rzeczy - kamery internetowej. Czyni to Scar Strix jednym z niewielu (gamingowych) laptopów bez kamery internetowej.
Łączność
| Networking | |
| iperf3 transmit AX12 | |
| Alienware m15 R5 Ryzen Edition | |
| Przeciętny Intel Wi-Fi 6E AX211 (1003 - 1501, n=4) | |
| Asus TUF Gaming F15 FX507ZM | |
| Lenovo Legion 5 15ACH6A-82NW0010GE | |
| MSI Pulse GL66 12UEK | |
| iperf3 receive AX12 | |
| Asus TUF Gaming F15 FX507ZM | |
| Przeciętny Intel Wi-Fi 6E AX211 (1178 - 1623, n=4) | |
| Alienware m15 R5 Ryzen Edition | |
| Lenovo Legion 5 15ACH6A-82NW0010GE | |
| MSI Pulse GL66 12UEK | |
| iperf3 receive AXE11000 6GHz | |
| Asus ROG Strix Scar 15 G533ZW-LN106WS | |
| Asus ROG Strix Scar 15 G533zm | |
| Przeciętny Intel Wi-Fi 6E AX211 (700 - 1857, n=217) | |
| Średnia w klasie Gaming (853 - 1788, n=56, ostatnie 2 lata) | |
| iperf3 transmit AXE11000 6GHz | |
| Asus ROG Strix Scar 15 G533ZW-LN106WS | |
| Średnia w klasie Gaming (648 - 2355, n=56, ostatnie 2 lata) | |
| Asus ROG Strix Scar 15 G533zm | |
| Przeciętny Intel Wi-Fi 6E AX211 (385 - 1851, n=217) | |
Urządzenia wejściowe - Przycisk touchpada może się lekko zacinać
Panel dotykowy
Wyświetlacz - QHD z 240 Hz i Dolby Vision Atmos
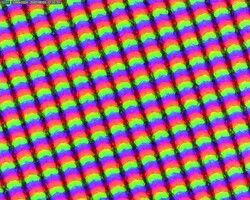
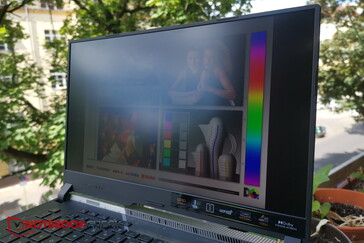
Wyświetlacz QHD IPS (2560 x 1440 pikseli) wyprodukowany przez BOE może pochwalić się dość szybkim czasem reakcji, wysoką częstotliwością odświeżania 240 Hz i doskonałym pokryciem kolorów, zdolnym do reprodukcji niemal całej gamy sRGB i AdobeRGB.
Panel charakteryzuje się średnią jasnością szczytową na poziomie 300 nitów i całkiem dobrym rozkładem jasności wynoszącym 89%. Jednak poziom czerni i kontrast są raczej przeciętne.
Laptop nie wykorzystuje PWM do regulacji jasności, a krwawienie ekranu jest niewielkie.
| |||||||||||||||||||||||||
rozświetlenie: 89 %
na akumulatorze: 357 cd/m²
kontrast: 1026:1 (czerń: 0.34 cd/m²)
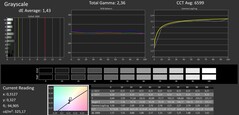
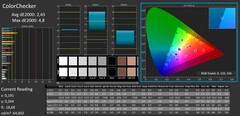
ΔE Color 3.44 | 0.5-29.43 Ø4.87, calibrated: 2.43
ΔE Greyscale 3.34 | 0.5-98 Ø5.1
84.1% AdobeRGB 1998 (Argyll 2.2.0 3D)
99.6% sRGB (Argyll 2.2.0 3D)
95% Display P3 (Argyll 2.2.0 3D)
Gamma: 2.5
| Asus ROG Strix Scar 15 G533zm BOE CQ NE156QHM-NZ2 (BOE0A55), IPS, 2560x1440, 15.6" | Asus ROG Strix Scar 15 G533ZW-LN106WS BOE CQ NE156QHM-NZ2, IPS-level, 2560x1440, 15.6" | Asus TUF Gaming F15 FX507ZM TL156VDXP0101, IPS, 1920x1080, 15.6" | MSI Pulse GL66 12UEK AU Optronics B156HAN08.4 (AUOAF90), IPS, 1920x1080, 15.6" | Alienware m15 R5 Ryzen Edition B156HAN, IPS, 1920x1080, 15.6" | Lenovo Legion 5 15ACH6A-82NW0010GE LGD06A5, IPS, 1920x1080, 15.6" | |
|---|---|---|---|---|---|---|
| Display | 0% | -17% | -51% | -13% | ||
| Display P3 Coverage | 95 | 96.2 1% | 66.4 -30% | 39 -59% | 71.1 -25% | |
| sRGB Coverage | 99.6 | 99.9 0% | 97 -3% | 58.4 -41% | 99.1 -1% | |
| AdobeRGB 1998 Coverage | 84.1 | 84.5 0% | 68.5 -19% | 40.3 -52% | 72.3 -14% | |
| Response Times | 14% | -4% | -333% | 30% | -45% | |
| Response Time Grey 50% / Grey 80% * | 6.4 ? | 7.86 ? -23% 4.21 ? 34% | 5.6 ? 12% | 38.8 ? -506% | 4 ? 37% | 15 ? -134% |
| Response Time Black / White * | 10.8 ? | 7.5 ? 31% | 12.8 ? -19% | 28 ? -159% | 8.4 ? 22% | 6 ? 44% |
| PWM Frequency | ||||||
| Screen | -14% | 23% | 15% | 14% | 2% | |
| Brightness middle | 349 | 346 -1% | 353.7 1% | 248 -29% | 329 -6% | 371 6% |
| Brightness | 333 | 329 -1% | 340 2% | 245 -26% | 321 -4% | 328 -2% |
| Brightness Distribution | 89 | 91 2% | 89 0% | 86 -3% | 92 3% | 85 -4% |
| Black Level * | 0.34 | 0.59 -74% | 0.34 -0% | 0.13 62% | 0.27 21% | 0.32 6% |
| Contrast | 1026 | 586 -43% | 1040 1% | 1908 86% | 1219 19% | 1159 13% |
| Colorchecker dE 2000 * | 3.44 | 3.06 11% | 1.74 49% | 3.14 9% | 2.78 19% | 3.25 6% |
| Colorchecker dE 2000 max. * | 5.78 | 5.81 -1% | 3.63 37% | 5.82 -1% | 4.88 16% | 6.33 -10% |
| Colorchecker dE 2000 calibrated * | 2.43 | 2.57 -6% | 0.5 79% | 3.14 -29% | 1.63 33% | 1.11 54% |
| Greyscale dE 2000 * | 3.34 | 2.1 37% | 1.2 64% | 2.5 25% | 4.94 -48% | |
| Gamma | 2.5 88% | 2.12 104% | 2.3 96% | 2.49 88% | 2.106 104% | 2.45 90% |
| CCT | 6641 98% | 7021 93% | 6257 104% | 6468 100% | 6201 105% | 6064 107% |
| Color Space (Percent of AdobeRGB 1998) | 76 | |||||
| Color Space (Percent of sRGB) | 99 | |||||
| Całkowita średnia (program / ustawienia) | 0% /
-5% | 1% /
11% | -123% /
-49% | 22% /
17% | -19% /
-8% |
* ... im mniej tym lepiej
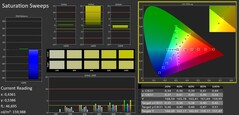
Korzystając z narzędzia do kalibracji kolorów Calman firmy Portrait Displays, od razu po wyjęciu z pudełka zmierzyliśmy normalne do umiarkowanych różnice w kolorach, przy czym wyświetlacz miał bardziej pomarańczowy odcień. Dzięki naszej kalibracji udało nam się znacznie zmniejszyć różnice w kolorach.
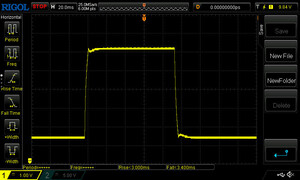
Wyświetl czasy reakcji
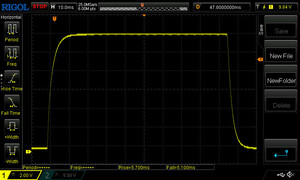
| ↔ Czas reakcji od czerni do bieli | ||
|---|---|---|
| 10.8 ms ... wzrost ↗ i spadek ↘ łącznie | ↗ 5.7 ms wzrost | |
| ↘ 5.1 ms upadek | ||
| W naszych testach ekran wykazuje dobry współczynnik reakcji, ale może być zbyt wolny dla graczy rywalizujących ze sobą. Dla porównania, wszystkie testowane urządzenia wahają się od 0.1 (minimum) do 240 (maksimum) ms. » 26 % wszystkich urządzeń jest lepszych. Oznacza to, że zmierzony czas reakcji jest lepszy od średniej wszystkich testowanych urządzeń (20.8 ms). | ||
| ↔ Czas reakcji 50% szarości do 80% szarości | ||
| 6.4 ms ... wzrost ↗ i spadek ↘ łącznie | ↗ 3 ms wzrost | |
| ↘ 3.4 ms upadek | ||
| W naszych testach ekran wykazuje bardzo szybką reakcję i powinien bardzo dobrze nadawać się do szybkich gier. Dla porównania, wszystkie testowane urządzenia wahają się od 0.165 (minimum) do 636 (maksimum) ms. » 16 % wszystkich urządzeń jest lepszych. Oznacza to, że zmierzony czas reakcji jest lepszy od średniej wszystkich testowanych urządzeń (32.5 ms). | ||
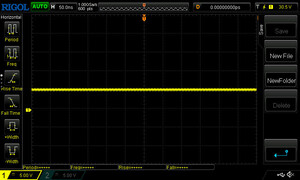
Migotanie ekranu / PWM (modulacja szerokości impulsu)
| Migotanie ekranu/nie wykryto PWM | |||
Dla porównania: 53 % wszystkich testowanych urządzeń nie używa PWM do przyciemniania wyświetlacza. Jeśli wykryto PWM, zmierzono średnio 8516 (minimum: 5 - maksimum: 343500) Hz. | |||
Wydajność - Dobra wydajność w grach dzięki karcie graficznej RTX 3060 o mocy 140 W
Procesor Core i9-12900H jest jednym z najlepszych w swojej klasie sprzętowej. Chociaż RTX 3060 powinna poradzić sobie ze wszystkimi grami w rozdzielczości FHD, może mieć trudności z bardzo wymagającymi grami w natywnej rozdzielczości QHD wyświetlacza. Asus dołączył również szybką pamięć RAM DDR5. Ogólnie rzecz biorąc, Strix Scar to laptop do gier wyższej klasy średniej, który może spodobać się również niektórym edytorom zdjęć i wideo.
Warunki testu
Naszym zdaniem Asus przesadził ze swoim oprogramowaniem. Notebooki do gier Asus są dostarczane z oprogramowaniem Armoury Crate, które jest dodatkiem do programu MyASUS, który jest również preinstalowany na zwykłych laptopach. Armoury Crate pozwala dostosować profile wentylatorów i wydajności, a my użyliśmy trybu Turbo, aby osiągnąć najlepsze możliwe wyniki benchmarków w naszych testach. Z drugiej strony, MyASUS zawiera ustawienia dotyczące sposobu ładowania baterii, opcji Wi-Fi i sposobów kontaktowania się z obsługą klienta. Asus mógłby rozważyć połączenie tych dwóch programów, aby uniknąć niepotrzebnego rozrostu oprogramowania dla swoich klientów.
Procesor
Asus zdecydował się wyposażyć większość modeli w high-endowe procesory Intel Core i9-12900Hktóry posiada 6 rdzeni Performance (P) i 8 Efficiency (E), zdolnych do obsługi 20 wątków jednocześnie. Każdy rdzeń P może pracować z częstotliwością do 5 GHz. Zarówno Strix G533zm, jak i G533zw są dostępne z nieco mniej wydajnymi procesorami i7-12700H.
W naszym teście pętli Cinebench R15, procesor zapewnił świetną wydajność, zgodnie z oczekiwaniami, przewyższając zarówno i7-12700H w Asus TUF Gaming F15, jak i układy Ryzen poprzedniej generacji. Słabiej wypadł jedynie w teście Cinebench R20.
Przełączenie na zasilanie bateryjne spowodowało, że wynik Cinebench R15 spadł do 1,752.
Cinebench R15 Multi sustained load
Cinebench R23: Multi Core | Single Core
Cinebench R20: CPU (Multi Core) | CPU (Single Core)
Cinebench R15: CPU Multi 64Bit | CPU Single 64Bit
Blender: v2.79 BMW27 CPU
7-Zip 18.03: 7z b 4 | 7z b 4 -mmt1
Geekbench 5.5: Multi-Core | Single-Core
HWBOT x265 Benchmark v2.2: 4k Preset
LibreOffice : 20 Documents To PDF
R Benchmark 2.5: Overall mean
| CPU Performance Rating | |
| Średnia w klasie Gaming | |
| Asus ROG Strix Scar 15 G533ZW-LN106WS | |
| Asus ROG Strix Scar 15 G533zm | |
| MSI Pulse GL66 12UEK | |
| Asus TUF Gaming F15 FX507ZM | |
| Przeciętny Intel Core i9-12900H | |
| Alienware m15 R5 Ryzen Edition | |
| Lenovo Legion 5 15ACH6A-82NW0010GE | |
| Cinebench R23 / Multi Core | |
| Średnia w klasie Gaming (5668 - 39652, n=151, ostatnie 2 lata) | |
| Asus ROG Strix Scar 15 G533ZW-LN106WS | |
| Asus TUF Gaming F15 FX507ZM | |
| MSI Pulse GL66 12UEK | |
| Asus ROG Strix Scar 15 G533zm | |
| Przeciętny Intel Core i9-12900H (7359 - 19648, n=28) | |
| Alienware m15 R5 Ryzen Edition | |
| Lenovo Legion 5 15ACH6A-82NW0010GE | |
| Cinebench R23 / Single Core | |
| Asus ROG Strix Scar 15 G533ZW-LN106WS | |
| MSI Pulse GL66 12UEK | |
| Średnia w klasie Gaming (1136 - 2252, n=151, ostatnie 2 lata) | |
| Przeciętny Intel Core i9-12900H (1634 - 1930, n=28) | |
| Asus ROG Strix Scar 15 G533zm | |
| Asus TUF Gaming F15 FX507ZM | |
| Alienware m15 R5 Ryzen Edition | |
| Lenovo Legion 5 15ACH6A-82NW0010GE | |
| Cinebench R20 / CPU (Multi Core) | |
| Średnia w klasie Gaming (2179 - 15517, n=151, ostatnie 2 lata) | |
| Asus ROG Strix Scar 15 G533ZW-LN106WS | |
| Asus TUF Gaming F15 FX507ZM | |
| MSI Pulse GL66 12UEK | |
| Przeciętny Intel Core i9-12900H (2681 - 7471, n=28) | |
| Asus ROG Strix Scar 15 G533zm | |
| Alienware m15 R5 Ryzen Edition | |
| Lenovo Legion 5 15ACH6A-82NW0010GE | |
| Cinebench R20 / CPU (Single Core) | |
| MSI Pulse GL66 12UEK | |
| Asus ROG Strix Scar 15 G533zm | |
| Asus ROG Strix Scar 15 G533ZW-LN106WS | |
| Średnia w klasie Gaming (439 - 866, n=151, ostatnie 2 lata) | |
| Przeciętny Intel Core i9-12900H (624 - 738, n=28) | |
| Asus TUF Gaming F15 FX507ZM | |
| Alienware m15 R5 Ryzen Edition | |
| Lenovo Legion 5 15ACH6A-82NW0010GE | |
| Cinebench R15 / CPU Multi 64Bit | |
| Średnia w klasie Gaming (905 - 6074, n=154, ostatnie 2 lata) | |
| Asus ROG Strix Scar 15 G533zm | |
| Asus ROG Strix Scar 15 G533ZW-LN106WS | |
| Asus TUF Gaming F15 FX507ZM | |
| MSI Pulse GL66 12UEK | |
| Przeciętny Intel Core i9-12900H (1395 - 3077, n=28) | |
| Alienware m15 R5 Ryzen Edition | |
| Lenovo Legion 5 15ACH6A-82NW0010GE | |
| Cinebench R15 / CPU Single 64Bit | |
| MSI Pulse GL66 12UEK | |
| Średnia w klasie Gaming (191.9 - 343, n=151, ostatnie 2 lata) | |
| Asus ROG Strix Scar 15 G533zm | |
| Asus ROG Strix Scar 15 G533ZW-LN106WS | |
| Przeciętny Intel Core i9-12900H (235 - 277, n=29) | |
| Asus TUF Gaming F15 FX507ZM | |
| Alienware m15 R5 Ryzen Edition | |
| Lenovo Legion 5 15ACH6A-82NW0010GE | |
| Blender / v2.79 BMW27 CPU | |
| Lenovo Legion 5 15ACH6A-82NW0010GE | |
| Alienware m15 R5 Ryzen Edition | |
| Przeciętny Intel Core i9-12900H (160 - 451, n=28) | |
| MSI Pulse GL66 12UEK | |
| Asus TUF Gaming F15 FX507ZM | |
| Średnia w klasie Gaming (81 - 555, n=144, ostatnie 2 lata) | |
| Asus ROG Strix Scar 15 G533ZW-LN106WS | |
| Asus ROG Strix Scar 15 G533zm | |
| 7-Zip 18.03 / 7z b 4 | |
| Średnia w klasie Gaming (23795 - 144064, n=149, ostatnie 2 lata) | |
| Asus ROG Strix Scar 15 G533zm | |
| Asus ROG Strix Scar 15 G533ZW-LN106WS | |
| Asus TUF Gaming F15 FX507ZM | |
| MSI Pulse GL66 12UEK | |
| Przeciętny Intel Core i9-12900H (34684 - 76677, n=28) | |
| Alienware m15 R5 Ryzen Edition | |
| Lenovo Legion 5 15ACH6A-82NW0010GE | |
| 7-Zip 18.03 / 7z b 4 -mmt1 | |
| Średnia w klasie Gaming (4199 - 7573, n=149, ostatnie 2 lata) | |
| MSI Pulse GL66 12UEK | |
| Asus ROG Strix Scar 15 G533zm | |
| Asus ROG Strix Scar 15 G533ZW-LN106WS | |
| Przeciętny Intel Core i9-12900H (5302 - 6289, n=28) | |
| Alienware m15 R5 Ryzen Edition | |
| Asus TUF Gaming F15 FX507ZM | |
| Lenovo Legion 5 15ACH6A-82NW0010GE | |
| Geekbench 5.5 / Multi-Core | |
| Średnia w klasie Gaming (4557 - 25855, n=148, ostatnie 2 lata) | |
| Asus ROG Strix Scar 15 G533ZW-LN106WS | |
| Asus ROG Strix Scar 15 G533zm | |
| Asus TUF Gaming F15 FX507ZM | |
| Przeciętny Intel Core i9-12900H (8519 - 14376, n=31) | |
| MSI Pulse GL66 12UEK | |
| Alienware m15 R5 Ryzen Edition | |
| Lenovo Legion 5 15ACH6A-82NW0010GE | |
| Geekbench 5.5 / Single-Core | |
| Średnia w klasie Gaming (986 - 2423, n=148, ostatnie 2 lata) | |
| Asus ROG Strix Scar 15 G533ZW-LN106WS | |
| MSI Pulse GL66 12UEK | |
| Asus ROG Strix Scar 15 G533zm | |
| Przeciętny Intel Core i9-12900H (1631 - 1897, n=31) | |
| Asus TUF Gaming F15 FX507ZM | |
| Alienware m15 R5 Ryzen Edition | |
| Lenovo Legion 5 15ACH6A-82NW0010GE | |
| HWBOT x265 Benchmark v2.2 / 4k Preset | |
| Średnia w klasie Gaming (6.72 - 42.9, n=148, ostatnie 2 lata) | |
| Asus ROG Strix Scar 15 G533zm | |
| Asus ROG Strix Scar 15 G533ZW-LN106WS | |
| Asus TUF Gaming F15 FX507ZM | |
| MSI Pulse GL66 12UEK | |
| Przeciętny Intel Core i9-12900H (8.05 - 22.5, n=28) | |
| Alienware m15 R5 Ryzen Edition | |
| Lenovo Legion 5 15ACH6A-82NW0010GE | |
| LibreOffice / 20 Documents To PDF | |
| Alienware m15 R5 Ryzen Edition | |
| Lenovo Legion 5 15ACH6A-82NW0010GE | |
| Asus TUF Gaming F15 FX507ZM | |
| Średnia w klasie Gaming (19 - 96.6, n=147, ostatnie 2 lata) | |
| Przeciętny Intel Core i9-12900H (36.8 - 59.8, n=28) | |
| MSI Pulse GL66 12UEK | |
| Asus ROG Strix Scar 15 G533zm | |
| Asus ROG Strix Scar 15 G533ZW-LN106WS | |
| R Benchmark 2.5 / Overall mean | |
| Lenovo Legion 5 15ACH6A-82NW0010GE | |
| Alienware m15 R5 Ryzen Edition | |
| Asus TUF Gaming F15 FX507ZM | |
| Przeciętny Intel Core i9-12900H (0.4218 - 0.506, n=28) | |
| Średnia w klasie Gaming (0.3609 - 0.759, n=150, ostatnie 2 lata) | |
| Asus ROG Strix Scar 15 G533zm | |
| Asus ROG Strix Scar 15 G533ZW-LN106WS | |
| MSI Pulse GL66 12UEK | |
* ... im mniej tym lepiej
AIDA64: FP32 Ray-Trace | FPU Julia | CPU SHA3 | CPU Queen | FPU SinJulia | FPU Mandel | CPU AES | CPU ZLib | FP64 Ray-Trace | CPU PhotoWorxx
| Performance Rating | |
| Średnia w klasie Gaming | |
| Alienware m15 R5 Ryzen Edition | |
| Asus ROG Strix Scar 15 G533zm | |
| Asus ROG Strix Scar 15 G533ZW-LN106WS | |
| Przeciętny Intel Core i9-12900H | |
| Asus TUF Gaming F15 FX507ZM | |
| MSI Pulse GL66 12UEK | |
| Lenovo Legion 5 15ACH6A-82NW0010GE | |
| AIDA64 / FP32 Ray-Trace | |
| Średnia w klasie Gaming (4986 - 81639, n=147, ostatnie 2 lata) | |
| Alienware m15 R5 Ryzen Edition | |
| Lenovo Legion 5 15ACH6A-82NW0010GE | |
| Przeciętny Intel Core i9-12900H (4074 - 18289, n=28) | |
| Asus ROG Strix Scar 15 G533zm | |
| Asus ROG Strix Scar 15 G533ZW-LN106WS | |
| Asus TUF Gaming F15 FX507ZM | |
| MSI Pulse GL66 12UEK | |
| AIDA64 / FPU Julia | |
| Średnia w klasie Gaming (25360 - 252486, n=147, ostatnie 2 lata) | |
| Alienware m15 R5 Ryzen Edition | |
| Lenovo Legion 5 15ACH6A-82NW0010GE | |
| Przeciętny Intel Core i9-12900H (22307 - 93236, n=28) | |
| Asus ROG Strix Scar 15 G533zm | |
| Asus ROG Strix Scar 15 G533ZW-LN106WS | |
| Asus TUF Gaming F15 FX507ZM | |
| MSI Pulse GL66 12UEK | |
| AIDA64 / CPU SHA3 | |
| Średnia w klasie Gaming (1339 - 10389, n=147, ostatnie 2 lata) | |
| Asus ROG Strix Scar 15 G533zm | |
| Asus ROG Strix Scar 15 G533ZW-LN106WS | |
| Asus TUF Gaming F15 FX507ZM | |
| MSI Pulse GL66 12UEK | |
| Alienware m15 R5 Ryzen Edition | |
| Przeciętny Intel Core i9-12900H (1378 - 4215, n=28) | |
| Lenovo Legion 5 15ACH6A-82NW0010GE | |
| AIDA64 / CPU Queen | |
| Średnia w klasie Gaming (50699 - 200651, n=147, ostatnie 2 lata) | |
| Asus ROG Strix Scar 15 G533zm | |
| MSI Pulse GL66 12UEK | |
| Asus ROG Strix Scar 15 G533ZW-LN106WS | |
| Przeciętny Intel Core i9-12900H (78172 - 111241, n=28) | |
| Asus TUF Gaming F15 FX507ZM | |
| Alienware m15 R5 Ryzen Edition | |
| Lenovo Legion 5 15ACH6A-82NW0010GE | |
| AIDA64 / FPU SinJulia | |
| Średnia w klasie Gaming (4800 - 32988, n=147, ostatnie 2 lata) | |
| Alienware m15 R5 Ryzen Edition | |
| Asus ROG Strix Scar 15 G533zm | |
| Asus ROG Strix Scar 15 G533ZW-LN106WS | |
| MSI Pulse GL66 12UEK | |
| Asus TUF Gaming F15 FX507ZM | |
| Przeciętny Intel Core i9-12900H (5709 - 10410, n=28) | |
| Lenovo Legion 5 15ACH6A-82NW0010GE | |
| AIDA64 / FPU Mandel | |
| Średnia w klasie Gaming (12321 - 134044, n=147, ostatnie 2 lata) | |
| Alienware m15 R5 Ryzen Edition | |
| Lenovo Legion 5 15ACH6A-82NW0010GE | |
| Przeciętny Intel Core i9-12900H (11257 - 45581, n=28) | |
| Asus ROG Strix Scar 15 G533zm | |
| Asus TUF Gaming F15 FX507ZM | |
| Asus ROG Strix Scar 15 G533ZW-LN106WS | |
| MSI Pulse GL66 12UEK | |
| AIDA64 / CPU AES | |
| Alienware m15 R5 Ryzen Edition | |
| Asus ROG Strix Scar 15 G533zm | |
| Asus ROG Strix Scar 15 G533ZW-LN106WS | |
| Średnia w klasie Gaming (19065 - 328679, n=147, ostatnie 2 lata) | |
| MSI Pulse GL66 12UEK | |
| Lenovo Legion 5 15ACH6A-82NW0010GE | |
| Przeciętny Intel Core i9-12900H (31935 - 151546, n=28) | |
| Asus TUF Gaming F15 FX507ZM | |
| AIDA64 / CPU ZLib | |
| Średnia w klasie Gaming (373 - 2531, n=147, ostatnie 2 lata) | |
| Asus ROG Strix Scar 15 G533ZW-LN106WS | |
| Asus ROG Strix Scar 15 G533zm | |
| Asus TUF Gaming F15 FX507ZM | |
| MSI Pulse GL66 12UEK | |
| Przeciętny Intel Core i9-12900H (449 - 1193, n=28) | |
| Alienware m15 R5 Ryzen Edition | |
| Lenovo Legion 5 15ACH6A-82NW0010GE | |
| AIDA64 / FP64 Ray-Trace | |
| Średnia w klasie Gaming (2540 - 43430, n=147, ostatnie 2 lata) | |
| Alienware m15 R5 Ryzen Edition | |
| Lenovo Legion 5 15ACH6A-82NW0010GE | |
| Przeciętny Intel Core i9-12900H (2235 - 10511, n=28) | |
| Asus ROG Strix Scar 15 G533zm | |
| Asus ROG Strix Scar 15 G533ZW-LN106WS | |
| Asus TUF Gaming F15 FX507ZM | |
| MSI Pulse GL66 12UEK | |
| AIDA64 / CPU PhotoWorxx | |
| Średnia w klasie Gaming (10805 - 60161, n=147, ostatnie 2 lata) | |
| Asus ROG Strix Scar 15 G533ZW-LN106WS | |
| Przeciętny Intel Core i9-12900H (20960 - 48269, n=29) | |
| Asus ROG Strix Scar 15 G533zm | |
| Asus TUF Gaming F15 FX507ZM | |
| MSI Pulse GL66 12UEK | |
| Lenovo Legion 5 15ACH6A-82NW0010GE | |
| Alienware m15 R5 Ryzen Edition | |
Wydajność systemu
CrossMark: Overall | Productivity | Creativity | Responsiveness
| PCMark 10 / Score | |
| Asus ROG Strix Scar 15 G533ZW-LN106WS | |
| Asus ROG Strix Scar 15 G533zm | |
| Średnia w klasie Gaming (5776 - 9852, n=133, ostatnie 2 lata) | |
| Przeciętny Intel Core i9-12900H, NVIDIA GeForce RTX 3060 Laptop GPU (7135 - 7861, n=4) | |
| Asus TUF Gaming F15 FX507ZM | |
| MSI Pulse GL66 12UEK | |
| Lenovo Legion 5 15ACH6A-82NW0010GE | |
| Alienware m15 R5 Ryzen Edition | |
| PCMark 10 / Essentials | |
| Asus ROG Strix Scar 15 G533zm | |
| Przeciętny Intel Core i9-12900H, NVIDIA GeForce RTX 3060 Laptop GPU (10380 - 11198, n=4) | |
| Średnia w klasie Gaming (9057 - 12600, n=133, ostatnie 2 lata) | |
| Asus ROG Strix Scar 15 G533ZW-LN106WS | |
| Lenovo Legion 5 15ACH6A-82NW0010GE | |
| Asus TUF Gaming F15 FX507ZM | |
| MSI Pulse GL66 12UEK | |
| Alienware m15 R5 Ryzen Edition | |
| PCMark 10 / Productivity | |
| Asus ROG Strix Scar 15 G533zm | |
| Asus ROG Strix Scar 15 G533ZW-LN106WS | |
| Przeciętny Intel Core i9-12900H, NVIDIA GeForce RTX 3060 Laptop GPU (9751 - 10486, n=4) | |
| Średnia w klasie Gaming (6662 - 14612, n=133, ostatnie 2 lata) | |
| MSI Pulse GL66 12UEK | |
| Lenovo Legion 5 15ACH6A-82NW0010GE | |
| Asus TUF Gaming F15 FX507ZM | |
| Alienware m15 R5 Ryzen Edition | |
| PCMark 10 / Digital Content Creation | |
| Średnia w klasie Gaming (6807 - 18475, n=133, ostatnie 2 lata) | |
| Asus ROG Strix Scar 15 G533ZW-LN106WS | |
| Asus TUF Gaming F15 FX507ZM | |
| Asus ROG Strix Scar 15 G533zm | |
| Przeciętny Intel Core i9-12900H, NVIDIA GeForce RTX 3060 Laptop GPU (9741 - 11226, n=4) | |
| Lenovo Legion 5 15ACH6A-82NW0010GE | |
| MSI Pulse GL66 12UEK | |
| Alienware m15 R5 Ryzen Edition | |
| CrossMark / Overall | |
| MSI Pulse GL66 12UEK | |
| Asus ROG Strix Scar 15 G533ZW-LN106WS | |
| Asus ROG Strix Scar 15 G533zm | |
| Przeciętny Intel Core i9-12900H, NVIDIA GeForce RTX 3060 Laptop GPU (1789 - 2096, n=4) | |
| Średnia w klasie Gaming (1247 - 2344, n=114, ostatnie 2 lata) | |
| CrossMark / Productivity | |
| MSI Pulse GL66 12UEK | |
| Asus ROG Strix Scar 15 G533ZW-LN106WS | |
| Asus ROG Strix Scar 15 G533zm | |
| Przeciętny Intel Core i9-12900H, NVIDIA GeForce RTX 3060 Laptop GPU (1677 - 2062, n=4) | |
| Średnia w klasie Gaming (1299 - 2204, n=114, ostatnie 2 lata) | |
| CrossMark / Creativity | |
| Asus ROG Strix Scar 15 G533zm | |
| Asus ROG Strix Scar 15 G533ZW-LN106WS | |
| Przeciętny Intel Core i9-12900H, NVIDIA GeForce RTX 3060 Laptop GPU (2032 - 2125, n=4) | |
| MSI Pulse GL66 12UEK | |
| Średnia w klasie Gaming (1275 - 2660, n=114, ostatnie 2 lata) | |
| CrossMark / Responsiveness | |
| MSI Pulse GL66 12UEK | |
| Asus ROG Strix Scar 15 G533ZW-LN106WS | |
| Asus ROG Strix Scar 15 G533zm | |
| Przeciętny Intel Core i9-12900H, NVIDIA GeForce RTX 3060 Laptop GPU (1486 - 2230, n=4) | |
| Średnia w klasie Gaming (1030 - 2330, n=114, ostatnie 2 lata) | |
| PCMark 10 Score | 7861 pkt. | |
Pomoc | ||
| AIDA64 / Memory Copy | |
| Średnia w klasie Gaming (21750 - 97515, n=147, ostatnie 2 lata) | |
| Asus ROG Strix Scar 15 G533ZW-LN106WS | |
| Przeciętny Intel Core i9-12900H (34438 - 74264, n=28) | |
| Asus TUF Gaming F15 FX507ZM | |
| Asus ROG Strix Scar 15 G533zm | |
| MSI Pulse GL66 12UEK | |
| Alienware m15 R5 Ryzen Edition | |
| Lenovo Legion 5 15ACH6A-82NW0010GE | |
| AIDA64 / Memory Read | |
| Średnia w klasie Gaming (22956 - 102937, n=147, ostatnie 2 lata) | |
| Asus ROG Strix Scar 15 G533ZW-LN106WS | |
| Przeciętny Intel Core i9-12900H (36365 - 74642, n=28) | |
| Asus TUF Gaming F15 FX507ZM | |
| Asus ROG Strix Scar 15 G533zm | |
| MSI Pulse GL66 12UEK | |
| Alienware m15 R5 Ryzen Edition | |
| Lenovo Legion 5 15ACH6A-82NW0010GE | |
| AIDA64 / Memory Write | |
| Średnia w klasie Gaming (22297 - 108954, n=147, ostatnie 2 lata) | |
| Asus ROG Strix Scar 15 G533ZW-LN106WS | |
| Przeciętny Intel Core i9-12900H (32276 - 67858, n=28) | |
| Asus ROG Strix Scar 15 G533zm | |
| Asus TUF Gaming F15 FX507ZM | |
| MSI Pulse GL66 12UEK | |
| Alienware m15 R5 Ryzen Edition | |
| Lenovo Legion 5 15ACH6A-82NW0010GE | |
| AIDA64 / Memory Latency | |
| Asus ROG Strix Scar 15 G533zm | |
| Asus ROG Strix Scar 15 G533ZW-LN106WS | |
| Średnia w klasie Gaming (59.5 - 259, n=147, ostatnie 2 lata) | |
| MSI Pulse GL66 12UEK | |
| Lenovo Legion 5 15ACH6A-82NW0010GE | |
| Przeciętny Intel Core i9-12900H (74.7 - 118.1, n=27) | |
| Alienware m15 R5 Ryzen Edition | |
| Asus TUF Gaming F15 FX507ZM | |
* ... im mniej tym lepiej
Opóźnienie DPC
LatencyMon natychmiast zgłaszał problemy po uruchomieniu przeglądarki. Otwarcie kilku kart pogorszyło problemy. Wartości opóźnienia wzrosły jeszcze bardziej podczas odtwarzania naszego filmu testowego YouTube w rozdzielczości 4K i 60 fps. Niemniej jednak, wideo działało bez żadnych spadków klatek.
| DPC Latencies / LatencyMon - interrupt to process latency (max), Web, Youtube, Prime95 | |
| Asus ROG Strix Scar 15 G533zm | |
| MSI Pulse GL66 12UEK | |
| Asus ROG Strix Scar 15 G533ZW-LN106WS | |
| Lenovo Legion 5 15ACH6A-82NW0010GE | |
| Asus TUF Gaming F15 FX507ZM | |
| Alienware m15 R5 Ryzen Edition | |
* ... im mniej tym lepiej
Pamięć masowa
Asus wyposażył swój komputer w całkiem nowy dysk SSD PCIe 4.0 NVMe o pojemności 1 TB wyprodukowany przez firmę Micron. Pomimo zapewnienia doskonałych prędkości transferu, dysk nie wykorzystał w pełni prędkości oferowanych przez stosunkowo nowy standard. Niemniej jednak, w większości przypadków zapewniał najlepszą wydajność w porównaniu z dyskami w konkurencyjnych laptopach. Jego wydajność jest również doskonała przy długotrwałym obciążeniu.
| Drive Performance Rating - Percent | |
| Asus ROG Strix Scar 15 G533ZW-LN106WS | |
| Asus ROG Strix Scar 15 G533zm | |
| Średnia w klasie Gaming | |
| MSI Pulse GL66 12UEK | |
| Asus TUF Gaming F15 FX507ZM | |
| Lenovo Legion 5 15ACH6A-82NW0010GE | |
| Alienware m15 R5 Ryzen Edition | |
| Global Average -3 | |
| DiskSpd | |
| seq read | |
| Średnia w klasie Gaming (1319 - 7045, n=130, ostatnie 2 lata) | |
| Asus ROG Strix Scar 15 G533zm | |
| Asus ROG Strix Scar 15 G533ZW-LN106WS | |
| Asus TUF Gaming F15 FX507ZM | |
| Global Average -3 (113.3 - 7045, n=1813) | |
| MSI Pulse GL66 12UEK | |
| Lenovo Legion 5 15ACH6A-82NW0010GE | |
| Alienware m15 R5 Ryzen Edition | |
| seq write | |
| Asus ROG Strix Scar 15 G533zm | |
| Asus ROG Strix Scar 15 G533ZW-LN106WS | |
| Średnia w klasie Gaming (535 - 9307, n=130, ostatnie 2 lata) | |
| MSI Pulse GL66 12UEK | |
| Asus TUF Gaming F15 FX507ZM | |
| Global Average -3 (43 - 9459, n=1813) | |
| Alienware m15 R5 Ryzen Edition | |
| Lenovo Legion 5 15ACH6A-82NW0010GE | |
| seq q8 t1 read | |
| Asus ROG Strix Scar 15 G533ZW-LN106WS | |
| Asus ROG Strix Scar 15 G533zm | |
| Średnia w klasie Gaming (2594 - 16089, n=130, ostatnie 2 lata) | |
| Global Average -3 (114.5 - 16089, n=1813) | |
| MSI Pulse GL66 12UEK | |
| Asus TUF Gaming F15 FX507ZM | |
| Alienware m15 R5 Ryzen Edition | |
| Lenovo Legion 5 15ACH6A-82NW0010GE | |
| seq q8 t1 write | |
| Asus ROG Strix Scar 15 G533ZW-LN106WS | |
| Asus ROG Strix Scar 15 G533zm | |
| Średnia w klasie Gaming (539 - 14571, n=130, ostatnie 2 lata) | |
| MSI Pulse GL66 12UEK | |
| Global Average -3 (46.7 - 14571, n=1813) | |
| Asus TUF Gaming F15 FX507ZM | |
| Alienware m15 R5 Ryzen Edition | |
| Lenovo Legion 5 15ACH6A-82NW0010GE | |
| 4k q1 t1 read | |
| Asus ROG Strix Scar 15 G533ZW-LN106WS | |
| MSI Pulse GL66 12UEK | |
| Asus TUF Gaming F15 FX507ZM | |
| Asus ROG Strix Scar 15 G533zm | |
| Średnia w klasie Gaming (32.6 - 95.9, n=130, ostatnie 2 lata) | |
| Lenovo Legion 5 15ACH6A-82NW0010GE | |
| Global Average -3 (0.67 - 361, n=1813) | |
| Alienware m15 R5 Ryzen Edition | |
| 4k q1 t1 write | |
| MSI Pulse GL66 12UEK | |
| Asus ROG Strix Scar 15 G533ZW-LN106WS | |
| Asus ROG Strix Scar 15 G533zm | |
| Średnia w klasie Gaming (78 - 397, n=130, ostatnie 2 lata) | |
| Asus TUF Gaming F15 FX507ZM | |
| Global Average -3 (1.23 - 435, n=1812) | |
| Lenovo Legion 5 15ACH6A-82NW0010GE | |
| Alienware m15 R5 Ryzen Edition | |
| 4k q32 t16 read | |
| Asus ROG Strix Scar 15 G533ZW-LN106WS | |
| Asus ROG Strix Scar 15 G533zm | |
| Średnia w klasie Gaming (417 - 6172, n=130, ostatnie 2 lata) | |
| Asus TUF Gaming F15 FX507ZM | |
| MSI Pulse GL66 12UEK | |
| Global Average -3 (1.03 - 6172, n=1812) | |
| Alienware m15 R5 Ryzen Edition | |
| Lenovo Legion 5 15ACH6A-82NW0010GE | |
| 4k q32 t16 write | |
| Asus ROG Strix Scar 15 G533ZW-LN106WS | |
| MSI Pulse GL66 12UEK | |
| Asus ROG Strix Scar 15 G533zm | |
| Asus TUF Gaming F15 FX507ZM | |
| Średnia w klasie Gaming (162.3 - 4869, n=130, ostatnie 2 lata) | |
| Global Average -3 (1.5 - 5171, n=1812) | |
| Lenovo Legion 5 15ACH6A-82NW0010GE | |
| Alienware m15 R5 Ryzen Edition | |
| AS SSD | |
| Score Total | |
| Asus ROG Strix Scar 15 G533ZW-LN106WS | |
| Asus ROG Strix Scar 15 G533zm | |
| Średnia w klasie Gaming (2271 - 13854, n=124, ostatnie 2 lata) | |
| Asus TUF Gaming F15 FX507ZM | |
| MSI Pulse GL66 12UEK | |
| Alienware m15 R5 Ryzen Edition | |
| Global Average -3 (19 - 13854, n=3479) | |
| Lenovo Legion 5 15ACH6A-82NW0010GE | |
| Score Read | |
| Asus ROG Strix Scar 15 G533ZW-LN106WS | |
| Asus ROG Strix Scar 15 G533zm | |
| Średnia w klasie Gaming (776 - 4721, n=124, ostatnie 2 lata) | |
| Asus TUF Gaming F15 FX507ZM | |
| MSI Pulse GL66 12UEK | |
| Alienware m15 R5 Ryzen Edition | |
| Global Average -3 (6 - 4721, n=3480) | |
| Lenovo Legion 5 15ACH6A-82NW0010GE | |
| Score Write | |
| Asus ROG Strix Scar 15 G533ZW-LN106WS | |
| Średnia w klasie Gaming (515 - 7208, n=124, ostatnie 2 lata) | |
| Asus ROG Strix Scar 15 G533zm | |
| Asus TUF Gaming F15 FX507ZM | |
| MSI Pulse GL66 12UEK | |
| Global Average -3 (4 - 7208, n=3480) | |
| Lenovo Legion 5 15ACH6A-82NW0010GE | |
| Alienware m15 R5 Ryzen Edition | |
| Seq Read | |
| Asus ROG Strix Scar 15 G533ZW-LN106WS | |
| Średnia w klasie Gaming (2260 - 12763, n=124, ostatnie 2 lata) | |
| Asus ROG Strix Scar 15 G533zm | |
| MSI Pulse GL66 12UEK | |
| Asus TUF Gaming F15 FX507ZM | |
| Alienware m15 R5 Ryzen Edition | |
| Global Average -3 (193.2 - 12763, n=3697) | |
| Lenovo Legion 5 15ACH6A-82NW0010GE | |
| Seq Write | |
| Asus ROG Strix Scar 15 G533ZW-LN106WS | |
| Średnia w klasie Gaming (495 - 11316, n=124, ostatnie 2 lata) | |
| MSI Pulse GL66 12UEK | |
| Asus TUF Gaming F15 FX507ZM | |
| Asus ROG Strix Scar 15 G533zm | |
| Global Average -3 (52.2 - 11316, n=3700) | |
| Lenovo Legion 5 15ACH6A-82NW0010GE | |
| Alienware m15 R5 Ryzen Edition | |
| 4K Read | |
| MSI Pulse GL66 12UEK | |
| Asus ROG Strix Scar 15 G533ZW-LN106WS | |
| Asus TUF Gaming F15 FX507ZM | |
| Asus ROG Strix Scar 15 G533zm | |
| Średnia w klasie Gaming (27.8 - 112.1, n=124, ostatnie 2 lata) | |
| Lenovo Legion 5 15ACH6A-82NW0010GE | |
| Global Average -3 (6.08 - 314, n=3689) | |
| Alienware m15 R5 Ryzen Edition | |
| 4K Write | |
| MSI Pulse GL66 12UEK | |
| Asus ROG Strix Scar 15 G533ZW-LN106WS | |
| Asus ROG Strix Scar 15 G533zm | |
| Średnia w klasie Gaming (79.4 - 512, n=124, ostatnie 2 lata) | |
| Asus TUF Gaming F15 FX507ZM | |
| Lenovo Legion 5 15ACH6A-82NW0010GE | |
| Global Average -3 (13.3 - 512, n=3689) | |
| Alienware m15 R5 Ryzen Edition | |
| 4K-64 Read | |
| Asus ROG Strix Scar 15 G533ZW-LN106WS | |
| Asus ROG Strix Scar 15 G533zm | |
| Asus TUF Gaming F15 FX507ZM | |
| Średnia w klasie Gaming (451 - 3475, n=124, ostatnie 2 lata) | |
| MSI Pulse GL66 12UEK | |
| Alienware m15 R5 Ryzen Edition | |
| Global Average -3 (13.1 - 3600, n=3688) | |
| Lenovo Legion 5 15ACH6A-82NW0010GE | |
| 4K-64 Write | |
| Asus ROG Strix Scar 15 G533ZW-LN106WS | |
| Średnia w klasie Gaming (277 - 5909, n=124, ostatnie 2 lata) | |
| Asus ROG Strix Scar 15 G533zm | |
| Asus TUF Gaming F15 FX507ZM | |
| MSI Pulse GL66 12UEK | |
| Lenovo Legion 5 15ACH6A-82NW0010GE | |
| Global Average -3 (13.7 - 5909, n=3686) | |
| Alienware m15 R5 Ryzen Edition | |
| Access Time Read | |
| Global Average -3 (0.012 - 33, n=3620) | |
| Alienware m15 R5 Ryzen Edition | |
| Lenovo Legion 5 15ACH6A-82NW0010GE | |
| Średnia w klasie Gaming (0.016 - 0.379, n=123, ostatnie 2 lata) | |
| MSI Pulse GL66 12UEK | |
| Asus TUF Gaming F15 FX507ZM | |
| Asus ROG Strix Scar 15 G533zm | |
| Asus ROG Strix Scar 15 G533ZW-LN106WS | |
| Access Time Write | |
| Global Average -3 (0.011 - 60.7, n=3662) | |
| Alienware m15 R5 Ryzen Edition | |
| MSI Pulse GL66 12UEK | |
| Asus TUF Gaming F15 FX507ZM | |
| Średnia w klasie Gaming (0.011 - 1.028, n=124, ostatnie 2 lata) | |
| Lenovo Legion 5 15ACH6A-82NW0010GE | |
| Asus ROG Strix Scar 15 G533zm | |
| Asus ROG Strix Scar 15 G533ZW-LN106WS | |
* ... im mniej tym lepiej
Sustained load Read: DiskSpd Read Loop, Queue Depth 8
Karta graficzna
The Nividia GeForce RTX 3060 zajmuje przestrzeń pomiędzy średnim i wysokim segmentem. Jego TGP może wynosić od 60 do 115 watów, a konfiguracja zasilania ma trwały wpływ na wydajność 3D karty. RTX 3060 w Strix Scar ma dostęp do pełnych 115 watów i może wzrosnąć do 140 watów z 25-watowym Dynamic Boost.
W syntetycznych testach porównawczych 3D, GPU wypadł nieco lepiej niż przeciętny RTX 3060 z naszej bazy danych, ale Lenovo Legion 5 i Asus TUF Gaming F15 są marginalnie szybsze niż Strix Scar. RTX 3070 Ti w Scar 15 G533zw jest o około 35% mocniejszy.
Na zasilaniu bateryjnym wydajność 3D laptopa spadła o około 67% w nowym teście Fire Strike, uzyskując wynik graficzny wynoszący zaledwie 7 168 zamiast zwykłych 21 671.
| 3DMark Performance Rating - Percent | |
| Średnia w klasie Gaming | |
| Asus ROG Strix Scar 15 G533ZW-LN106WS | |
| Lenovo Legion 5 15ACH6A-82NW0010GE | |
| Asus TUF Gaming F15 FX507ZM | |
| Asus ROG Strix Scar 15 G533zm | |
| Alienware m15 R5 Ryzen Edition | |
| Przeciętny NVIDIA GeForce RTX 3060 Laptop GPU | |
| MSI Pulse GL66 12UEK | |
| 3DMark 11 - 1280x720 Performance GPU | |
| Średnia w klasie Gaming (10741 - 72178, n=143, ostatnie 2 lata) | |
| Asus ROG Strix Scar 15 G533ZW-LN106WS | |
| Lenovo Legion 5 15ACH6A-82NW0010GE | |
| Asus TUF Gaming F15 FX507ZM | |
| Asus ROG Strix Scar 15 G533zm | |
| Alienware m15 R5 Ryzen Edition | |
| Przeciętny NVIDIA GeForce RTX 3060 Laptop GPU (13799 - 30772, n=43) | |
| MSI Pulse GL66 12UEK | |
| 3DMark | |
| 1920x1080 Fire Strike Graphics | |
| Średnia w klasie Gaming (2913 - 56116, n=155, ostatnie 2 lata) | |
| Asus ROG Strix Scar 15 G533ZW-LN106WS | |
| Lenovo Legion 5 15ACH6A-82NW0010GE | |
| Asus TUF Gaming F15 FX507ZM | |
| Asus ROG Strix Scar 15 G533zm | |
| Przeciętny NVIDIA GeForce RTX 3060 Laptop GPU (16354 - 23109, n=49) | |
| Alienware m15 R5 Ryzen Edition | |
| MSI Pulse GL66 12UEK | |
| 2560x1440 Time Spy Graphics | |
| Średnia w klasie Gaming (2295 - 24599, n=151, ostatnie 2 lata) | |
| Asus ROG Strix Scar 15 G533ZW-LN106WS | |
| Asus TUF Gaming F15 FX507ZM | |
| Alienware m15 R5 Ryzen Edition | |
| Lenovo Legion 5 15ACH6A-82NW0010GE | |
| Asus ROG Strix Scar 15 G533zm | |
| Przeciętny NVIDIA GeForce RTX 3060 Laptop GPU (6285 - 9235, n=49) | |
| MSI Pulse GL66 12UEK | |
| 3DMark 11 Performance | 27156 pkt. | |
| 3DMark Fire Strike Score | 19296 pkt. | |
| 3DMark Time Spy Score | 8606 pkt. | |
Pomoc | ||
Wydajność w grach
Niestety, Optimus ogranicza Strixa do uruchamiania gier DirectX 11 przy zaledwie 60 klatkach na sekundę. Jest to ogólny problem dotykający niektóre laptopy z Optimusem. Poza graniem w te gry na zewnętrznym monitorze, jedynym obejściem jest włączenie przełącznika MUX i bezpośrednie korzystanie z dGPU.
Strix 15 oferuje w większości najlepszą wydajność spośród urządzeń w naszym porównaniu. Tylko TUF Gaming F15 jest marginalnie szybszy w niektórych grach.
Odłączenie Strixa spowodowało, że liczba klatek na sekundę ustabilizowała się na poziomie 30 fps w grach Witcher 3 w trybie Ultra, a wentylatory pozostawały przyjemnie ciche przez cały czas.
| The Witcher 3 | |
| 1366x768 Medium Graphics & Postprocessing | |
| Średnia w klasie Gaming (168.5 - 592, n=70, ostatnie 2 lata) | |
| Asus ROG Strix Scar 15 G533ZW-LN106WS | |
| Asus ROG Strix Scar 15 G533ZW-LN106WS | |
| Asus TUF Gaming F15 FX507ZM | |
| Asus ROG Strix Scar 15 G533zm | |
| MSI Pulse GL66 12UEK | |
| Przeciętny NVIDIA GeForce RTX 3060 Laptop GPU (204 - 296, n=33) | |
| Lenovo Legion 5 15ACH6A-82NW0010GE | |
| 1920x1080 High Graphics & Postprocessing (Nvidia HairWorks Off) | |
| Średnia w klasie Gaming (40.1 - 424, n=86, ostatnie 2 lata) | |
| Asus ROG Strix Scar 15 G533ZW-LN106WS | |
| Asus TUF Gaming F15 FX507ZM | |
| Asus ROG Strix Scar 15 G533zm | |
| Przeciętny NVIDIA GeForce RTX 3060 Laptop GPU (81 - 186.8, n=41) | |
| Alienware m15 R5 Ryzen Edition | |
| Lenovo Legion 5 15ACH6A-82NW0010GE | |
| MSI Pulse GL66 12UEK | |
| 1920x1080 Ultra Graphics & Postprocessing (HBAO+) | |
| Średnia w klasie Gaming (18.4 - 214, n=119, ostatnie 2 lata) | |
| Asus ROG Strix Scar 15 G533ZW-LN106WS | |
| Asus TUF Gaming F15 FX507ZM | |
| Asus ROG Strix Scar 15 G533zm | |
| Lenovo Legion 5 15ACH6A-82NW0010GE | |
| MSI Pulse GL66 12UEK | |
| Przeciętny NVIDIA GeForce RTX 3060 Laptop GPU (58.2 - 91.5, n=48) | |
| Alienware m15 R5 Ryzen Edition | |
| Far Cry 5 | |
| 1920x1080 Medium Preset AA:T | |
| Średnia w klasie Gaming (38 - 248, n=66, ostatnie 2 lata) | |
| Asus ROG Strix Scar 15 G533ZW-LN106WS | |
| Asus ROG Strix Scar 15 G533zm | |
| MSI Pulse GL66 12UEK | |
| Asus TUF Gaming F15 FX507ZM | |
| Przeciętny NVIDIA GeForce RTX 3060 Laptop GPU (88 - 135, n=25) | |
| Alienware m15 R5 Ryzen Edition | |
| Lenovo Legion 5 15ACH6A-82NW0010GE | |
| 1920x1080 High Preset AA:T | |
| Asus ROG Strix Scar 15 G533ZW-LN106WS | |
| Średnia w klasie Gaming (35 - 232, n=74, ostatnie 2 lata) | |
| Asus ROG Strix Scar 15 G533zm | |
| MSI Pulse GL66 12UEK | |
| Asus TUF Gaming F15 FX507ZM | |
| Przeciętny NVIDIA GeForce RTX 3060 Laptop GPU (85 - 129, n=29) | |
| Alienware m15 R5 Ryzen Edition | |
| Lenovo Legion 5 15ACH6A-82NW0010GE | |
| 1920x1080 Ultra Preset AA:T | |
| Asus ROG Strix Scar 15 G533ZW-LN106WS | |
| Średnia w klasie Gaming (34 - 218, n=76, ostatnie 2 lata) | |
| Asus ROG Strix Scar 15 G533zm | |
| Asus TUF Gaming F15 FX507ZM | |
| MSI Pulse GL66 12UEK | |
| Przeciętny NVIDIA GeForce RTX 3060 Laptop GPU (80 - 120, n=31) | |
| Alienware m15 R5 Ryzen Edition | |
| Lenovo Legion 5 15ACH6A-82NW0010GE | |
| GTA V | |
| 1920x1080 Normal/Off AF:4x | |
| Asus TUF Gaming F15 FX507ZM | |
| Asus ROG Strix Scar 15 G533zm | |
| Asus ROG Strix Scar 15 G533ZW-LN106WS | |
| Średnia w klasie Gaming (101.7 - 187.7, n=86, ostatnie 2 lata) | |
| Przeciętny NVIDIA GeForce RTX 3060 Laptop GPU (146 - 183.7, n=33) | |
| Alienware m15 R5 Ryzen Edition | |
| Lenovo Legion 5 15ACH6A-82NW0010GE | |
| 1920x1080 High/On (Advanced Graphics Off) AA:2xMSAA + FX AF:8x | |
| Asus ROG Strix Scar 15 G533ZW-LN106WS | |
| Średnia w klasie Gaming (24.2 - 187.1, n=112, ostatnie 2 lata) | |
| Asus ROG Strix Scar 15 G533zm | |
| Asus TUF Gaming F15 FX507ZM | |
| Przeciętny NVIDIA GeForce RTX 3060 Laptop GPU (120 - 179.4, n=42) | |
| Alienware m15 R5 Ryzen Edition | |
| Lenovo Legion 5 15ACH6A-82NW0010GE | |
| 1920x1080 Highest Settings possible AA:4xMSAA + FX AF:16x | |
| Asus ROG Strix Scar 15 G533ZW-LN106WS | |
| Średnia w klasie Gaming (12.1 - 168.2, n=132, ostatnie 2 lata) | |
| Asus ROG Strix Scar 15 G533zm | |
| Asus TUF Gaming F15 FX507ZM | |
| Przeciętny NVIDIA GeForce RTX 3060 Laptop GPU (69.2 - 109.8, n=46) | |
| Alienware m15 R5 Ryzen Edition | |
| Lenovo Legion 5 15ACH6A-82NW0010GE | |
| Final Fantasy XV Benchmark | |
| 1920x1080 Standard Quality | |
| Średnia w klasie Gaming (33.5 - 232, n=119, ostatnie 2 lata) | |
| Asus ROG Strix Scar 15 G533ZW-LN106WS | |
| Asus TUF Gaming F15 FX507ZM | |
| Asus ROG Strix Scar 15 G533zm | |
| Przeciętny NVIDIA GeForce RTX 3060 Laptop GPU (70.4 - 133.5, n=37) | |
| Lenovo Legion 5 15ACH6A-82NW0010GE | |
| Alienware m15 R5 Ryzen Edition | |
| 1920x1080 High Quality | |
| Średnia w klasie Gaming (19.2 - 201, n=144, ostatnie 2 lata) | |
| Asus ROG Strix Scar 15 G533ZW-LN106WS | |
| Asus TUF Gaming F15 FX507ZM | |
| Asus ROG Strix Scar 15 G533zm | |
| Przeciętny NVIDIA GeForce RTX 3060 Laptop GPU (55 - 100.9, n=42) | |
| Lenovo Legion 5 15ACH6A-82NW0010GE | |
| Alienware m15 R5 Ryzen Edition | |
| 2560x1440 High Quality | |
| Średnia w klasie Gaming (32.5 - 169.2, n=100, ostatnie 2 lata) | |
| Asus ROG Strix Scar 15 G533ZW-LN106WS | |
| Asus ROG Strix Scar 15 G533zm | |
| Przeciętny NVIDIA GeForce RTX 3060 Laptop GPU (41.1 - 73.7, n=25) | |
| Strange Brigade | |
| 1920x1080 medium AA:medium AF:4 | |
| Średnia w klasie Gaming (58.5 - 495, n=109, ostatnie 2 lata) | |
| Asus ROG Strix Scar 15 G533ZW-LN106WS | |
| Asus TUF Gaming F15 FX507ZM | |
| Asus ROG Strix Scar 15 G533zm | |
| Przeciętny NVIDIA GeForce RTX 3060 Laptop GPU (154.9 - 242, n=38) | |
| Lenovo Legion 5 15ACH6A-82NW0010GE | |
| Alienware m15 R5 Ryzen Edition | |
| 1920x1080 high AA:high AF:8 | |
| Średnia w klasie Gaming (49.4 - 460, n=120, ostatnie 2 lata) | |
| Asus ROG Strix Scar 15 G533ZW-LN106WS | |
| Asus TUF Gaming F15 FX507ZM | |
| Asus ROG Strix Scar 15 G533zm | |
| Lenovo Legion 5 15ACH6A-82NW0010GE | |
| Przeciętny NVIDIA GeForce RTX 3060 Laptop GPU (115.6 - 192.1, n=41) | |
| Alienware m15 R5 Ryzen Edition | |
| 1920x1080 ultra AA:ultra AF:16 | |
| Średnia w klasie Gaming (38.9 - 420, n=140, ostatnie 2 lata) | |
| Asus ROG Strix Scar 15 G533ZW-LN106WS | |
| Asus TUF Gaming F15 FX507ZM | |
| Asus ROG Strix Scar 15 G533zm | |
| Lenovo Legion 5 15ACH6A-82NW0010GE | |
| Przeciętny NVIDIA GeForce RTX 3060 Laptop GPU (102.2 - 166.3, n=43) | |
| Alienware m15 R5 Ryzen Edition | |
| 2560x1440 ultra AA:ultra AF:16 | |
| Średnia w klasie Gaming (52.8 - 330, n=93, ostatnie 2 lata) | |
| Asus ROG Strix Scar 15 G533ZW-LN106WS | |
| Przeciętny NVIDIA GeForce RTX 3060 Laptop GPU (75.4 - 118.4, n=17) | |
| X-Plane 11.11 | |
| 1280x720 low (fps_test=1) | |
| Asus TUF Gaming F15 FX507ZM | |
| Średnia w klasie Gaming (39 - 221, n=147, ostatnie 2 lata) | |
| Asus ROG Strix Scar 15 G533zm | |
| MSI Pulse GL66 12UEK | |
| Przeciętny NVIDIA GeForce RTX 3060 Laptop GPU (83.6 - 157.1, n=48) | |
| Alienware m15 R5 Ryzen Edition | |
| Lenovo Legion 5 15ACH6A-82NW0010GE | |
| 1920x1080 med (fps_test=2) | |
| Asus TUF Gaming F15 FX507ZM | |
| Średnia w klasie Gaming (38.9 - 193.1, n=147, ostatnie 2 lata) | |
| Asus ROG Strix Scar 15 G533zm | |
| MSI Pulse GL66 12UEK | |
| Przeciętny NVIDIA GeForce RTX 3060 Laptop GPU (73 - 138.3, n=48) | |
| Alienware m15 R5 Ryzen Edition | |
| Lenovo Legion 5 15ACH6A-82NW0010GE | |
| 1920x1080 high (fps_test=3) | |
| Asus TUF Gaming F15 FX507ZM | |
| Średnia w klasie Gaming (32.8 - 166.2, n=151, ostatnie 2 lata) | |
| MSI Pulse GL66 12UEK | |
| Asus ROG Strix Scar 15 G533zm | |
| Przeciętny NVIDIA GeForce RTX 3060 Laptop GPU (61.9 - 109.3, n=48) | |
| Alienware m15 R5 Ryzen Edition | |
| Lenovo Legion 5 15ACH6A-82NW0010GE | |
Witcher 3 działał dość stabilnie przez cały godzinny okres testowy, z jedynie niewielkim spadkiem liczby klatek na sekundę.
Witcher 3 FPS chart
| low | med. | high | ultra | QHD | |
|---|---|---|---|---|---|
| GTA V (2015) | 186.2 | 181.6 | 166.9 | 105 | 80.5 |
| The Witcher 3 (2015) | 400 | 290 | 165 | 88.7 | |
| Dota 2 Reborn (2015) | 182.6 | 167.7 | 159.1 | 151.4 | |
| Final Fantasy XV Benchmark (2018) | 178.9 | 117.2 | 87.5 | 65.1 | |
| X-Plane 11.11 (2018) | 145.8 | 123.9 | 99.8 | ||
| Far Cry 5 (2018) | 160 | 129 | 123 | 117 | 92 |
| Strange Brigade (2018) | 398 | 216 | 176.4 | 153 | |
| Cyberpunk 2077 1.6 (2022) | 120 | 118 | 63 | 63 |
Emisje - fajne, ale niekoniecznie ciche
Emisja hałasu
W trybie Turbo, wewnętrzne wentylatory regularnie obracają się dość głośno przez kilka sekund, po czym powracają do bezczynności. Asus może rozważyć uczynienie systemu chłodzenia mniej agresywnym w przyszłej aktualizacji. To powiedziawszy, wentylatory zwykle nie obracają się w trybie cichym.
Asus Strix Scar niekoniecznie jest cichy pod obciążeniem. Podczas gier i testów obciążeniowych, Asus TUF i MSI Pulse były podobnie głośne, podczas gdy Lenovo Legion i Alienware pozostały cichsze.
Podczas uruchamiania niektórych obciążeń (np. Witcher 3), zauważyliśmy również delikatne elektroniczne pikanie dochodzące z urządzenia, ale były one obecne tylko tymczasowo.
Hałas
| luz |
| 23 / 23 / 37.75 dB |
| obciążenie |
| 45.35 / 56.22 dB |
 | ||
30 dB cichy 40 dB(A) słyszalny 50 dB(A) irytujący |
||
min: | ||
| Asus ROG Strix Scar 15 G533zm GeForce RTX 3060 Laptop GPU, i9-12900H | Asus ROG Strix Scar 15 G533ZW-LN106WS GeForce RTX 3070 Ti Laptop GPU, i9-12900H, Samsung PM9A1 MZVL22T0HBLB | Asus TUF Gaming F15 FX507ZM GeForce RTX 3060 Laptop GPU, i7-12700H, SK Hynix HFM001TD3JX013N | MSI Pulse GL66 12UEK GeForce RTX 3060 Laptop GPU, i9-12900H, Micron 2450 512GB MTFDKBA512TFK | Alienware m15 R5 Ryzen Edition GeForce RTX 3060 Laptop GPU, R7 5800H, Toshiba KBG40ZNS512G NVMe | Lenovo Legion 5 15ACH6A-82NW0010GE Radeon RX 6600M, R5 5600H, Micron 2210 MTFDHBA512QFD | |
|---|---|---|---|---|---|---|
| Noise | -26% | 6% | 0% | 2% | -4% | |
| wyłączone / środowisko * | 23 | 26.86 -17% | 23.2 -1% | 23 -0% | 24 -4% | 25 -9% |
| Idle Minimum * | 23 | 39.07 -70% | 23.6 -3% | 23 -0% | 24 -4% | 25 -9% |
| Idle Average * | 23 | 39.07 -70% | 23.6 -3% | 27 -17% | 25 -9% | 25 -9% |
| Idle Maximum * | 37.75 | 39.07 -3% | 25.4 33% | 27 28% | 35 7% | 34.5 9% |
| Load Average * | 45.35 | 53.34 -18% | 38 16% | 48.2 -6% | 44 3% | 51.1 -13% |
| Witcher 3 ultra * | 55.48 | 56.6 -2% | 54.1 2% | 56.9 -3% | 48 13% | |
| Load Maximum * | 56.22 | 56.6 -1% | 57.2 -2% | 56.94 -1% | 50 11% | 51.3 9% |
* ... im mniej tym lepiej
Temperatura
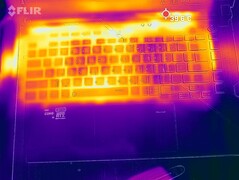
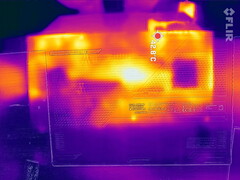
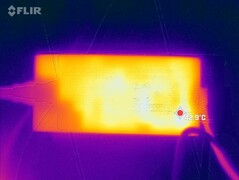
Laptop do gier Asus jest w stanie utrzymać stosunkowo niską temperaturę zarówno na biegu jałowym, jak i pod obciążeniem. Na przykład Alienware działa znacznie goręcej pomimo wystającego systemu chłodzenia. Strix Scar ma słyszalnie bardziej agresywną krzywą wentylatora, co pomaga utrzymać temperatury powierzchni na rozsądnym poziomie.
(±) Maksymalna temperatura w górnej części wynosi 43 °C / 109 F, w porównaniu do średniej 40.4 °C / 105 F , począwszy od 21.2 do 68.8 °C dla klasy Gaming.
(-) Dno nagrzewa się maksymalnie do 47 °C / 117 F, w porównaniu do średniej 43.2 °C / 110 F
(+) W stanie bezczynności średnia temperatura górnej części wynosi 29.2 °C / 85 F, w porównaniu ze średnią temperaturą urządzenia wynoszącą 33.9 °C / ### class_avg_f### F.
(±) Podczas gry w Wiedźmina 3 średnia temperatura górnej części wynosi 32.9 °C / 91 F, w porównaniu do średniej temperatury urządzenia wynoszącej 33.9 °C / ## #class_avg_f### F.
(+) Podpórki pod nadgarstki i touchpad są chłodniejsze niż temperatura skóry i maksymalnie 25 °C / 77 F i dlatego są chłodne w dotyku.
(+) Średnia temperatura obszaru podparcia dłoni w podobnych urządzeniach wynosiła 28.9 °C / 84 F (+3.9 °C / 7 F).
| Asus ROG Strix Scar 15 G533zm Intel Core i9-12900H, NVIDIA GeForce RTX 3060 Laptop GPU | Asus ROG Strix Scar 15 G533ZW-LN106WS Intel Core i9-12900H, NVIDIA GeForce RTX 3070 Ti Laptop GPU | Asus TUF Gaming F15 FX507ZM Intel Core i7-12700H, NVIDIA GeForce RTX 3060 Laptop GPU | MSI Pulse GL66 12UEK Intel Core i9-12900H, NVIDIA GeForce RTX 3060 Laptop GPU | Alienware m15 R5 Ryzen Edition AMD Ryzen 7 5800H, NVIDIA GeForce RTX 3060 Laptop GPU | Lenovo Legion 5 15ACH6A-82NW0010GE AMD Ryzen 5 5600H, AMD Radeon RX 6600M | |
|---|---|---|---|---|---|---|
| Heat | -10% | -11% | -11% | -22% | 3% | |
| Maximum Upper Side * | 43 | 42.6 1% | 44.4 -3% | 50 -16% | 62 -44% | 39.9 7% |
| Maximum Bottom * | 47 | 50.2 -7% | 48.8 -4% | 47 -0% | 61 -30% | 43.8 7% |
| Idle Upper Side * | 32 | 36.2 -13% | 37.8 -18% | 36 -13% | 36 -13% | 34.1 -7% |
| Idle Bottom * | 33 | 40.2 -22% | 39.6 -20% | 38 -15% | 33 -0% | 31.7 4% |
* ... im mniej tym lepiej
Test warunków skrajnych
Podczas testu obciążeniowego TDP osiągnęło około 95 watów przez kilka sekund, po czym spadło do nominalnych 45 watów. W tym samym czasie częstotliwość taktowania procesora spadła średnio do około 2,3 GHz, a temperatura rdzenia oscylowała wokół 76°C (168,8°F).
Zegar GPU działał z częstotliwością około 1,6 GHz z niewielkimi wahaniami. Zegar pamięci pracował z absolutnie stałą częstotliwością 1750 MHz. Temperatury GPU były jednak stosunkowo wysokie i wynosiły około 81°C (177,8°F), co jednak nadal mieści się w bezpiecznym zakresie i wskazuje, że nadwyżka mocy została dobrze wykorzystana. Cała karta pobierała średnio 109 watów.
| TaktowanieCPU (GHz) | Taktowanie GPU (MHz) | Średnia temperatura CPU (°C) | Średnia temperatura GPU (°C) | |
| Prime95 + FurMark Stress | 2.3 | 1.600 | 76 | 81 |
Głośniki
Głośniki nie są wystarczająco głośne nawet przy maksymalnej głośności. To powiedziawszy, są przynajmniej w stanie wytworzyć przyzwoity bas jak na głośniki laptopa. Z drugiej strony, wysokie tony nie są tak imponujące jak w konkurencyjnych urządzeniach.
Do dyspozycji użytkowników jest gniazdo audio combo do podłączania zewnętrznych analogowych urządzeń audio.
Asus ROG Strix Scar 15 G533zm analiza dźwięku
(±) | głośność głośnika jest średnia, ale dobra (79.48 dB)
Bas 100 - 315 Hz
(+) | dobry bas - tylko 3.5% od mediany
(+) | bas jest liniowy (4.6% delta do poprzedniej częstotliwości)
Średnie 400 - 2000 Hz
(±) | wyższe średnie - średnio 5.6% wyższe niż mediana
(+) | średnie są liniowe (4.8% delta do poprzedniej częstotliwości)
Wysokie 2–16 kHz
(±) | obniżone maksima - średnio 6.8% niższe od mediany
(±) | liniowość wysokich wartości jest średnia (8.2% delta do poprzedniej częstotliwości)
Ogólnie 100 - 16.000 Hz
(+) | ogólny dźwięk jest liniowy (14.7% różnicy w stosunku do mediany)
W porównaniu do tej samej klasy
» 27% wszystkich testowanych urządzeń w tej klasie było lepszych, 7% podobnych, 66% gorszych
» Najlepszy miał deltę 6%, średnia wynosiła ###średnia###%, najgorsza wynosiła 132%
W porównaniu do wszystkich testowanych urządzeń
» 17% wszystkich testowanych urządzeń było lepszych, 4% podobnych, 79% gorszych
» Najlepszy miał deltę 4%, średnia wynosiła ###średnia###%, najgorsza wynosiła 134%
Asus TUF Gaming F15 FX507ZM analiza dźwięku
(±) | głośność głośnika jest średnia, ale dobra (76.7 dB)
Bas 100 - 315 Hz
(±) | zredukowany bas - średnio 13.7% niższy od mediany
(±) | liniowość basu jest średnia (10.1% delta do poprzedniej częstotliwości)
Średnie 400 - 2000 Hz
(±) | wyższe średnie - średnio 5.2% wyższe niż mediana
(+) | średnie są liniowe (4.9% delta do poprzedniej częstotliwości)
Wysokie 2–16 kHz
(+) | zrównoważone maksima - tylko 4.1% od mediany
(±) | liniowość wysokich wartości jest średnia (8.6% delta do poprzedniej częstotliwości)
Ogólnie 100 - 16.000 Hz
(±) | liniowość ogólnego dźwięku jest średnia (15.9% różnicy w stosunku do mediany)
W porównaniu do tej samej klasy
» 36% wszystkich testowanych urządzeń w tej klasie było lepszych, 7% podobnych, 58% gorszych
» Najlepszy miał deltę 6%, średnia wynosiła ###średnia###%, najgorsza wynosiła 132%
W porównaniu do wszystkich testowanych urządzeń
» 23% wszystkich testowanych urządzeń było lepszych, 5% podobnych, 72% gorszych
» Najlepszy miał deltę 4%, średnia wynosiła ###średnia###%, najgorsza wynosiła 134%
Zarządzanie energią - Przyzwoita żywotność baterii
Zużycie energii
Ogólnie rzecz biorąc, pomimo tego, że Asus Strix Scar 15 nie jest szczególnie energooszczędny, nie jest również zbyt problematyczny pod tym względem. Zużywa on nieco więcej energii niż jego konkurenci w energooszczędnym trybie bezczynności, a także podczas grania. Niemniej jednak jego przejściowe szczytowe zużycie energii wynoszące 221 W nie jest wyższe niż w przypadku rywali i mieści się w granicach 240-watowej ładowarki.
| luz | |
| obciążenie |
|
Legenda:
min: | |
| Asus ROG Strix Scar 15 G533zm i9-12900H, GeForce RTX 3060 Laptop GPU, , IPS, 2560x1440, 15.6" | Asus ROG Strix Scar 15 G533ZW-LN106WS i9-12900H, GeForce RTX 3070 Ti Laptop GPU, Samsung PM9A1 MZVL22T0HBLB, IPS-level, 2560x1440, 15.6" | Asus TUF Gaming F15 FX507ZM i7-12700H, GeForce RTX 3060 Laptop GPU, SK Hynix HFM001TD3JX013N, IPS, 1920x1080, 15.6" | MSI Pulse GL66 12UEK i9-12900H, GeForce RTX 3060 Laptop GPU, Micron 2450 512GB MTFDKBA512TFK, IPS, 1920x1080, 15.6" | Alienware m15 R5 Ryzen Edition R7 5800H, GeForce RTX 3060 Laptop GPU, Toshiba KBG40ZNS512G NVMe, IPS, 1920x1080, 15.6" | Lenovo Legion 5 15ACH6A-82NW0010GE R5 5600H, Radeon RX 6600M, Micron 2210 MTFDHBA512QFD, IPS, 1920x1080, 15.6" | Przeciętny NVIDIA GeForce RTX 3060 Laptop GPU | Średnia w klasie Gaming | |
|---|---|---|---|---|---|---|---|---|
| Power Consumption | 7% | 9% | 28% | 1% | 8% | 7% | -11% | |
| Idle Minimum * | 13 | 7.56 42% | 6.3 52% | 7 46% | 11 15% | 10 23% | 10.4 ? 20% | 13.4 ? -3% |
| Idle Average * | 17 | 13.5 21% | 9.8 42% | 13 24% | 14 18% | 13.2 22% | 14.5 ? 15% | 18.9 ? -11% |
| Idle Maximum * | 17 | 16.87 1% | 26.5 -56% | 13.7 19% | 25 -47% | 15.6 8% | 21.4 ? -26% | 26.3 ? -55% |
| Load Average * | 135 | 128.9 5% | 103.8 23% | 48.4 64% | 123 9% | 178 -32% | 109.3 ? 19% | 102.7 ? 24% |
| Witcher 3 ultra * | 195 | 196.2 -1% | 189 3% | 148 24% | 176 10% | 181 7% | ||
| Load Maximum * | 221 | 274.86 -24% | 241.9 -9% | 244 -10% | 226 -2% | 180 19% | 206 ? 7% | 244 ? -10% |
* ... im mniej tym lepiej
Power consumption Witcher 3 / stress test
Power consumption with external monitor
Żywotność baterii
Asus wyposażył laptopa w dużą baterię o pojemności 90 Wh, która w naszych testach, przeprowadzonych przy zmniejszonej jasności ekranu, była w stanie zapewnić znakomite 8,5 godziny odtwarzania wideo i 9 godzin przeglądania Internetu.
| Asus ROG Strix Scar 15 G533zm i9-12900H, GeForce RTX 3060 Laptop GPU, 90 Wh | Asus ROG Strix Scar 15 G533ZW-LN106WS i9-12900H, GeForce RTX 3070 Ti Laptop GPU, 90 Wh | Asus TUF Gaming F15 FX507ZM i7-12700H, GeForce RTX 3060 Laptop GPU, 90 Wh | MSI Pulse GL66 12UEK i9-12900H, GeForce RTX 3060 Laptop GPU, 53.5 Wh | Alienware m15 R5 Ryzen Edition R7 5800H, GeForce RTX 3060 Laptop GPU, 86 Wh | Lenovo Legion 5 15ACH6A-82NW0010GE R5 5600H, Radeon RX 6600M, 80 Wh | Średnia w klasie Gaming | |
|---|---|---|---|---|---|---|---|
| Czasy pracy | -17% | -40% | -16% | -16% | 12% | -16% | |
| H.264 | 518 | 510 -2% | 237 -54% | 525 1% | 447 ? -14% | ||
| WiFi v1.3 | 551 | 501.4 -9% | 285 -48% | 306 -44% | 552 0% | 387 ? -30% | |
| Witcher 3 ultra | 80 | 70 -12% | 96 20% | 74.7 ? -7% | |||
| Load | 95 | 52 -45% | 66 -31% | 116 22% | 55 -42% | 118 24% | 84.5 ? -11% |
| Reader / Idle | 947 | 881 | 770 | 585 ? |
Za
Przeciw
Werdykt - Imponujący laptop do gier za 1 999 euro
Wyposażony w kartę graficzną RTX 3060, model G533zm Asus ROG Strix Scar 15 jest również wysoce kompetentnym i świetnym laptopem do gier o doskonałej jakości wykonania. Oferuje on nowoczesne wejścia/wyjścia, fantastyczne wrażenia podczas pisania, potężny sprzęt i opcje personalizacji. Co więcej, jego wyświetlacz wyróżnia się świetnym czasem reakcji, doskonałym pokryciem kolorów oraz solidnym kontrastem i jasnością. W porównaniu z modelem RTX 3070 Ti (G533zw) i bezpośrednimi konkurentami, G533zm działa stosunkowo chłodno.
Nie mamy żadnych prawdziwych zastrzeżeń do laptopa. Jego poziom hałasu mógłby wymagać pewnej optymalizacji, ale poza tym jest całkiem rozsądny. W związku z tym można zadać sobie pytanie, czy konieczne jest parowanie RTX 3060 z szybkim, ale gorącym i9-12900H, podczas gdy i7-12700H prawdopodobnie poradziłby sobie z tym zadaniem. W naszym egzemplarzu recenzenckim lewy przycisk touchpada czasami nieco się zacinał, choć drugi model Scar nie miał tego problemu.
Za około 2000 euro (2170 USD) gracze otrzymują doskonałego laptopa o świetnej wydajności, wielu mocnych stronach i niewielu wadach.
Choć nie jest to może zbyt wygórowana cena za laptopa do gier z RTX 3060, to jednak 2000 euro (2170 USD) jest raczej rozsądną kwotą, biorąc pod uwagę wiele pozytywnych aspektów i prawie nieistniejące wady. Ci, którzy chcą zainwestować mniej pieniędzy, mogą również rozważyć Asus TUF Gaming F15. Ten laptop ma mniej funkcji, ale oferuje doskonałą wydajność, kosztując przy tym około 400 EUR (U
Cena i dostępność
Recenzowana konfiguracja jest obecnie dostępna na stronie Cyberport w cenie €1,999 (US$2,166). Na Amazon można również znaleźć model o niższej specyfikacji z mniejszą ilością pamięci i wyświetlaczem FHD za około 1600 USD.
Asus ROG Strix Scar 15 G533zm
- 30/04/2024 v7 (old)
Christian Hintze


