Notebookcheck Logo
Intel Core Ultra 5 245K in review

Recenzja Intel Core Ultra 5 245K: Idealna równowaga między mocą i wydajnością?

Przekleństwo i błogosławieństwo jednocześnie!

Intel rozpoczyna nową erę z procesorami Arrow Lake dla sektora komputerów stacjonarnych. Nowy schemat nazewnictwa, nowa architektura i niższe zużycie energii to tylko niektóre z głównych zmian. Z niniejszej recenzji dowiedzą się Państwo, jakie jeszcze zmiany zostały wprowadzone oraz jak dobrze procesor Intel Core Ultra 5 245K sprawdza się w codziennym użytkowaniu i w grach.
Sebastian Bade (tłumaczenie DeepL / Ninh Duy) Published 🇺🇸 🇩🇪 ...
CPU Intel Desktop Gaming

Werdykt: Wydajny procesor zapewniający produktywność

Intel Core Ultra 5 245K prezentuje się w naszym teście jako wszechstronny i wydajny procesor, który oferuje wysoką wydajność zarówno w grach, jak i aplikacjach kreatywnych.

Dzięki hybrydowej architekturze, składającej się z wydajnych rdzeni Lion Cove Performance (rdzenie P) i rdzeni Skymont Efficiency (rdzenie E), układ oferuje doskonałą równowagę pomiędzy mocą obliczeniową a efektywnością energetyczną.

Ta ostatnia została znacznie poprawiona w porównaniu do poprzedniego modelu, co jest ważnym krokiem, aby nie stracić całkowicie kontaktu z ofertą AMD.

Pod względem wydajności, Core Ultra 5 245K jest szczególnie imponujący w testach czystej wydajności procesora. Jego wydajność w grach jest jednak nieco gorsza niż starszego modelu Intel Core i5-14600K.

Niemniej jednak, oferowana wydajność jest wystarczająca do płynnego uruchamiania wszystkich nowoczesnych gier. Jeśli chodzi o łączność, Core Ultra 5 245K obsługuje obecne standardy, takie jak PCIe 5.0 i DDR5 RAM, co zapewnia szybki transfer danych i jest przyszłościowe.

Umożliwia to wyposażenie systemu w najnowsze dyski SSD i karty graficzne, co jest szczególnie korzystne dla graczy i kreatywnych profesjonalistów.

Jako innowację, Intel wprowadza nową architekturę opartą na gnieździe Socket LGA 1851. Oznacza to, że prosta aktualizacja procesora z poprzedniej generacji nie jest możliwa.

Intel Core Ultra 5 245K okazuje się być ekonomicznym, wszechstronnym procesorem w średnim segmencie wydajności. Dzięki solidnej wydajności w grach, dobrym możliwościom wielozadaniowym i wsparciu dla nowoczesnych technologii, takich jak NPU, jest to doskonały wybór dla użytkowników poszukujących dobrej równowagi między ceną a wydajnością. Na szczególną uwagę zasługuje energooszczędność procesora.

Za

+ doskonała wydajność aplikacji
+ wyjątkowa wydajność jedno- i wielordzeniowa
+ PCI Express 5.0
+ znacznie większa wydajność niż w poprzednich generacjach
+ zintegrowana jednostka NPU
+ łatwe chłodzenie
+ modułowa struktura - konstrukcja chiplet

Przeciw

- wymagana nowa płyta główna
- Wydajność w grach gorsza od poprzednika

Cena i dostępność

Intel Core Ultra 5 245K można zamówić w Galaxus za 359 euro. Jego bezpośredni poprzednik, Intel Core i5-14600K, jest już dostępny w Amazon (DE) za 295 euro i Amazon US za 254 USD.

Amazon Logo
$223.99
Intel® CoreTM i5-14600K New Gaming Desktop Processor 14 (6 P-cores + 8 E-cores) with Integrated Graphics - Unlocked
Bestpreis 320.99€ nullprozentshop.de
Intel Core Ultra 5 245K, 6C+8c/14T, 4.20-5.20GHz, boxed ohne Kühler (BX80768245K)
2. 320.99 € ARLT Computer
3. 320.99 € notebooksbilliger.de
4. 321.31 € Caseking.de
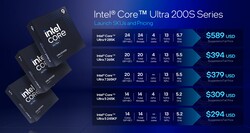
Procesory Intel Arrow Lake-S. (Źródło obrazu: Intel)

Linia Arrow Lake-S reprezentuje kolejną generację procesorów Intel dla komputerów stacjonarnych i bazuje na nowym gnieździe LGA 1851. Oznacza to, że nie tylko modele Raptor Lake, ale również wprowadzone trzy lata temu gniazdo LGA 1700 odchodzą do lamusa.

Nowe procesory Arrow Lake S bazują na hybrydowej architekturze z połączeniem wydajnych rdzeni Performance (rdzenie P) i nieco słabszych rdzeni Efficiency (rdzenie E). Ta hybrydowa architektura, która została po raz pierwszy wprowadzona w Alder Lake, jest dalej optymalizowana w Arrow Lake, aby ostatecznie zapewnić lepszą efektywność energetyczną.

W przypadku Arrow Lake-S, Intel koncentruje się na znacznym wzroście wydajności zarówno w obszarze jedno-, jak i wielordzeniowym. W niniejszej recenzji przyjrzymy się krok po kroku, co dokładnie to oznacza, gdyż nie wszystkie aplikacje skorzystają na nowej architekturze. Wsparcie dla pamięci RAM DDR4 zostało całkowicie usunięte, co oznacza, że wszystkie płyty główne LGA 1851 korzystają teraz z pamięci RAM DDR5.

Ponadto, zintegrowana jednostka graficzna została ulepszona i jest teraz oparta na architekturze Intel Xe. Może to zapewnić zauważalny wzrost wydajności, zwłaszcza w małych systemach, w których nie ma miejsca na dedykowaną kartę graficzną.

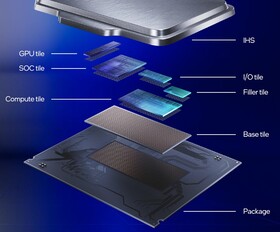
Intel Arrow-Lake-S: Opakowanie (Źródło obrazu: Intel)
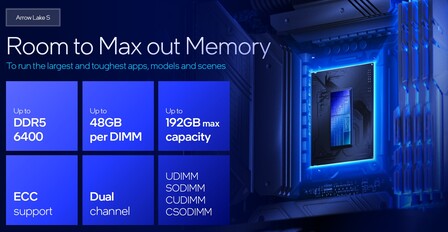
Obsługa pamięci RAM DDR5 (Źródło obrazu: Intel)
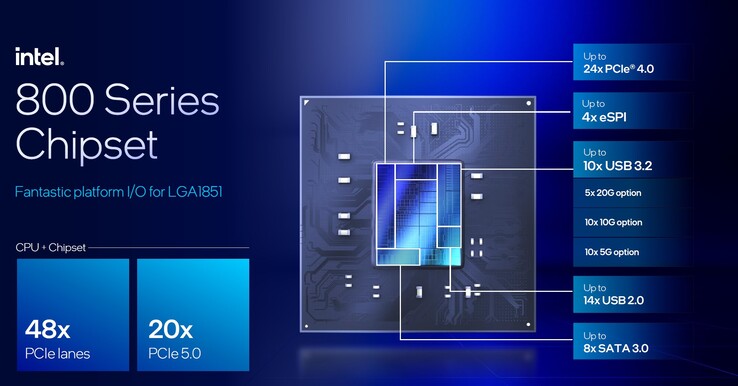
Chipset Intel serii 800 (Źródło obrazu: Intel)
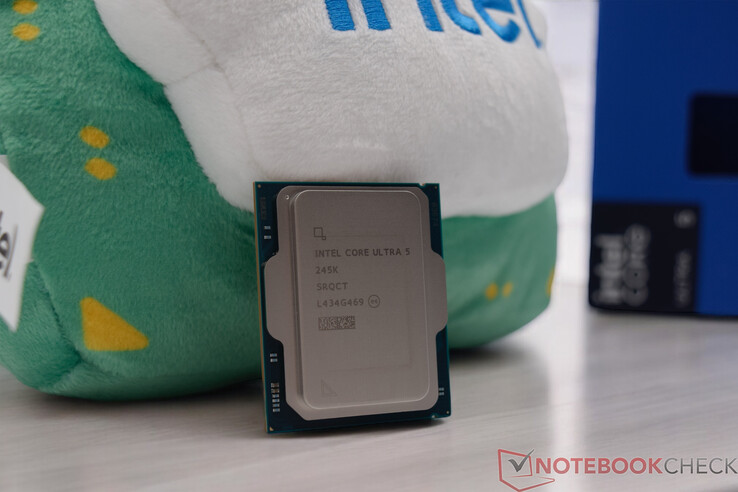
Intel Core Ultra 5 245K
Procesor
Intel Core Ultra 5 245K 14 x 3.6 - 5.2 GHz, 159 W PL2 / Short Burst, 159 W PL1 / Sustained, Arrow Lake-S
Karta grafiki
NVIDIA GeForce RTX 4090 - 24 GB VRAM, rdzeń: 2610 MHz, pamięć: 1313 MHz, 450 W TDP, 565.9
Pamięć
32 GB 
, DDR5-6000 MT/s
Chipset
Intel Z890 (Arrow Lake-S PCH)
Dysk twardy
Kingston KC3000 2048G SKC3000D2048G, 2048 GB 
System operacyjny
Microsoft Windows 11 Pro
Cena
309 USD
Amazon
Note: The manufacturer may use components from different suppliers including display panels, drives or memory sticks with similar specifications.


Do testów i testów porównawczych wykorzystaliśmy następujący system:

  • Streacom BC1 V2 Open Benchtable
  • Intel Core Ultra 5 245K
  • Asus TUF Gaming Z890-PLUS Wi-Fi, BIOS: 0407
  • Własne chłodzenie wodne (pompa: Watercool WCP D5, chłodnica: EK MO-RA3 420 Pro)
  • Palit GeForce RTX 4090 GameRock OC
  • EVGA SuperNOVA P+ 1600W
  • G.Skill Trident Z5 Neo DDR5-6000 2x 16 GB, EXPO (DDR5-6000 CL30-38-38-96)
  • Kingston KC3000 2 TB, M.2 2280 (OS + syntetyczne testy porównawcze)
  • Intel SSD DC P4618 - 6,4 TB (gry)
  • Microsoft Windows 11 Professional 64-bit (wersja 24H2)

Porównanie procesorów Intel Arrow Lake S

Model Rdzenie /
Wątki
Taktowanie P-Core / Turbo Taktowanie E-Core / Turbo TBMT 3.0 Pamięć podręczna L2 Intel Smart Cache iGPU (4 rdzenie Xe) NPU PBP MTP Cena (RRP)
Intel Core Ultra 9 285K 24 (8P + 16E) /24 3,7 GHz / 5,5 GHz 3,2 GHz / 4,6 GHz 5,6 GHz 40 MB 36 MB 2,0 GHz 13 TOPS 125 W 250 W 589 USD
Intel Core Ultra 7 265K 20 (8P + 12E) /20 3,9 GHz / 5,4 GHz 3,3 GHz / 4,6 GHz 5,6 GHz 36 MB 30 MB ,.0 GHz 13 TOPS 125 W 250 W 394 USD
Intel Core Ultra 7 265KF 20 (8P + 12E) /20 3,9 GHz / 5,4 GHz 3,3 GHz / 4,6 GHz 5,6 GHz 36 MB 30 MB - 13 TOPS 125 W 250 W 379 USD
Intel Core Ultra 5 245K 14 (6P + 8E) /14 3,9 GHz / 5,4 GHz 4,2 GHz / 5,2 GHz 5,2 GHz 26MB 24 MB 1,9 GHz 13 TOPS 125 W 159 W 309 USD
Intel Core Ultra 5 245KF 14 (6P + 8E) /14 3,9 GHz / 5,4 GHz 4,2 GHz / 5,2 GHz 5,2 GHz 26 MB 24 MB - 13 TOPS 125 W 159 W 294 USD
Intel Core Ultra 5 245K
Zestaw Intel Arrow Lake S
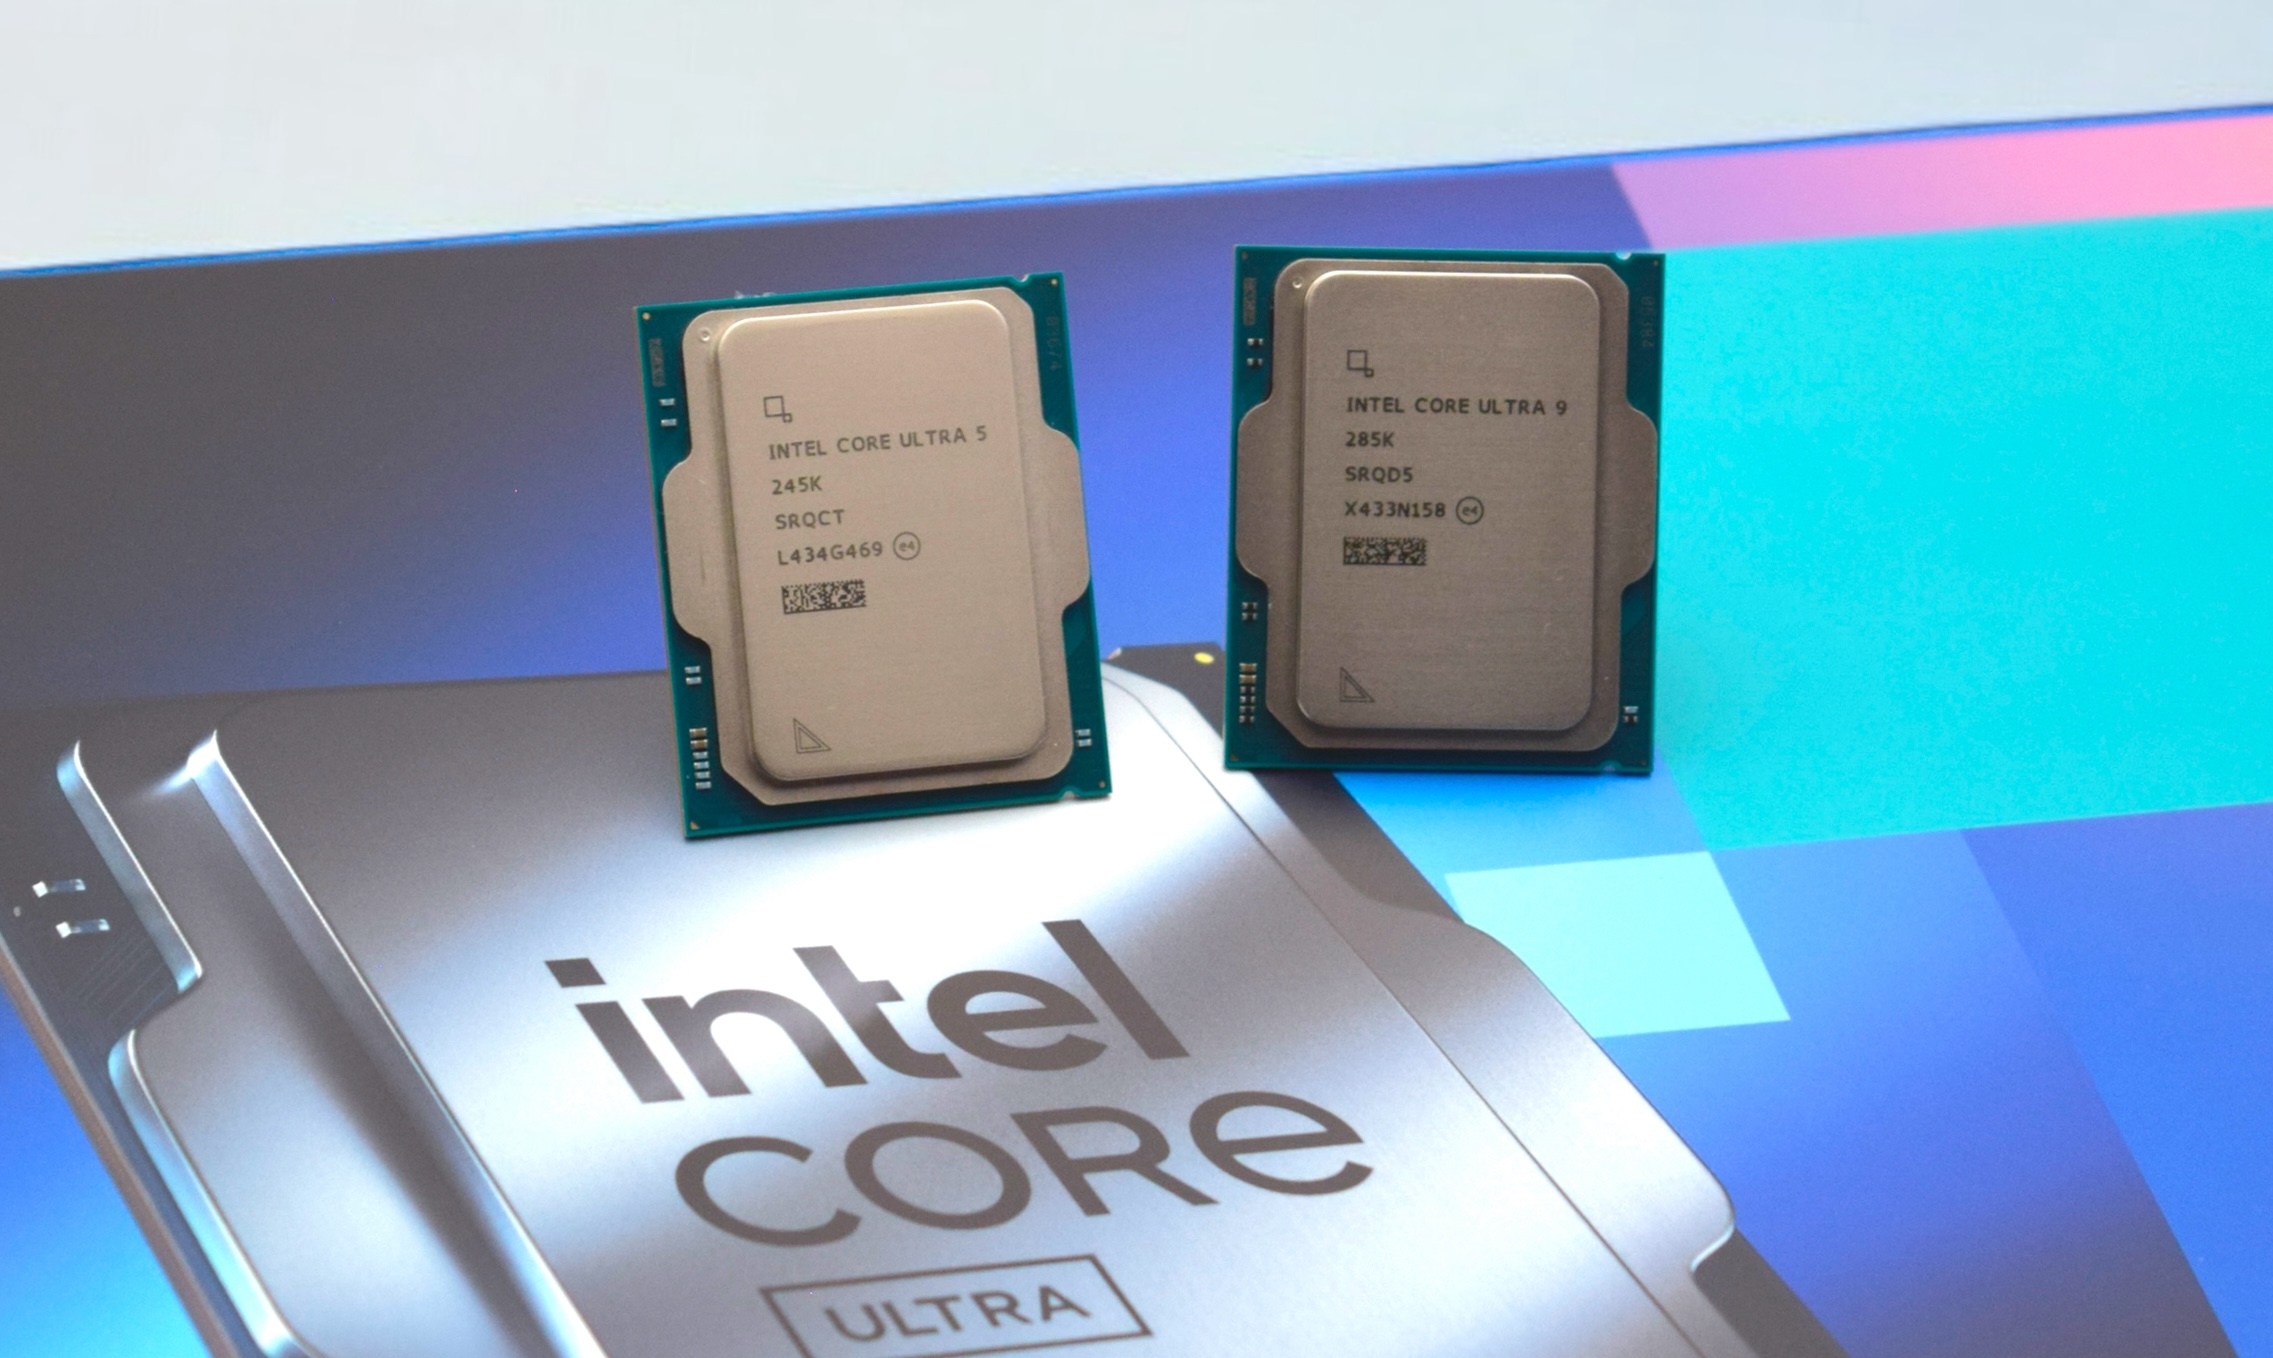
Intel Core Ultra 9 285K i Intel Core Ultra 5 245K
Intel Core Ultra 5 245K
Chłodnica MO-RA3 420 Pro z pompą Watercool WCP-D5
Kingston KC3000 2 TB
Intel SSD DC P4618 - 6,4 TB

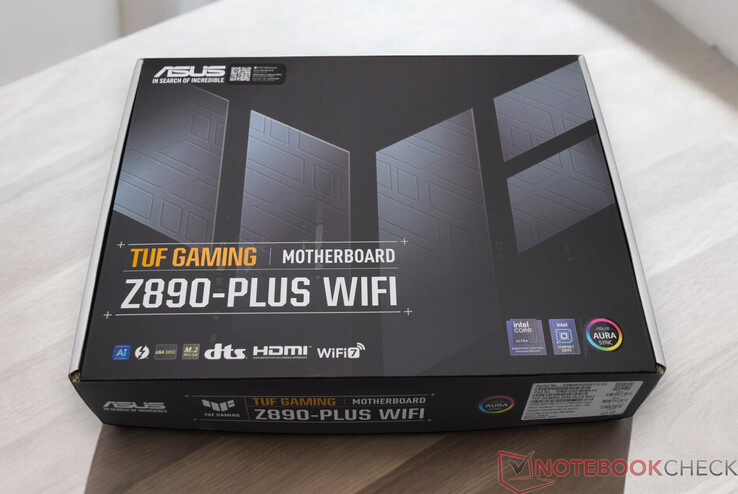
Asus TUF Gaming Z890-PLUS Wi-Fi

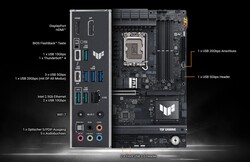
Asus TUF Gaming Z890-PLUS Wi-Fi: Połączenia (Źródło obrazu: Asus)

Jak już wspomniano, wszystkie procesory Arrow Lake-S wykorzystują nowe gniazdo, co oznacza, że wprowadzono również nowy chipset. Asus dostarczył nam do testów płytę główną TUF Gaming Z890-PLUS Wi-Fi.

Chipset Z890 jest wlutowany w płytę główną, co oznacza, że wraz z procesorem dostępnych jest łącznie 48 linii PCIe.

Asus TUF Gaming Z890-PLUS Wi-Fi jest częścią serii TUF firmy Asus. Dominująca czerń płyty głównej została wzbogacona kilkoma srebrnymi akcentami, choć z przodu nie ma żadnych podświetlanych elementów.

Oświetlenie RGB nie jest jednak całkowicie nieobecne, ponieważ z tyłu znajduje się kilka diod LED, które świecą się również, gdy system nie jest włączony. Można to jednak wyłączyć w BIOS-ie.

Asus TUF Gaming Z890-PLUS Wi-Fi obsługuje pamięć RAM DDR5 o wysokim taktowaniu do 8600 MT/s i więcej. Przy pełnym obciążeniu wszystkich czterech slotów RAM możliwe jest zainstalowanie do 192 GB pamięci. Należy jednak zwrócić uwagę na kompatybilność, więc warto wcześniej sprawdzić QVL (Qualified Vendor List) odpowiedniej płyty głównej.

Płyta główna oferuje szeroką gamę połączeń, w tym kilka portów USB 3 i port USB 4.0. Dostępna jest również sieć 2.5G LAN dla przewodowego połączenia sieciowego, chociaż najnowszy standard Wi-Fi 7 jest oferowany dla sieci bezprzewodowej.

Na całej płycie znajdują się różne radiatory, które z jednej strony charakteryzują wygląd, ale przede wszystkim mają na celu odprowadzanie ciepła. Szczególną cechą, o której warto wspomnieć, jest to, że przynajmniej radiator dysku SSD nad gniazdem karty graficznej można szybko i bez użycia narzędzi usunąć.

Kartę graficzną można również bezproblemowo odblokować i wyjąć z gniazda za pomocą Q-release. Niestety ten beznarzędziowy demontaż nie jest kompletny, gdyż radiator w dolnej części jest przykręcony.

Asus TUF Gaming Z890-PLUS Wi-Fi jest notowany na Amazonie za 378 euro, a na Amazonie US za 320 dolarów. Oznacza to, że producent pobiera obecnie prawie 140 euro więcej niż trzeba by zapłacić za Asus TUF Gaming Z790-Plus Wi-Fi.

Bestpreis 314.9€ ASUS
ASUS TUF Gaming Z890-Plus WIFI (90MB1IQ0-M0EAY0)
2. 315 € nullprozentshop.de
3. 315 € notebooksbilliger.de
4. 315.99 € playox.de
Asus TUF Gaming Z890-PLUS Wi-Fi
Antena WLAN Asus TUF Gaming Z890-PLUS Wi-Fi

Warunki testu

Wszystkie testy wydajności przeprowadziliśmy przy użyciu profilu energetycznego Ultimate Performance. W BIOS-ie wybraliśmy również domyślne ustawienia Intela.

Oznacza to, że Intel Core Ultra 5 245K działa zgodnie ze specyfikacją dostarczoną przez producenta. Jako jednostkę chłodzącą wykorzystaliśmy niestandardowy system chłodzenia wodnego, który był już używany w tej samej formie do poprzednich testów wydajności procesora.

Testy porównawcze procesora

Przyjrzyjmy się teraz wydajności Intel Core Ultra 5 245K w surowych benchmarkach CPU. Od razu widać, że nowy procesor Arrow Lake-S nie jest w stanie odróżnić się od swojego poprzednika.

W porównaniu wydajności, Intel Core Ultra 5 245K plasuje się na równi z Intel Core i5-14600K. Oba procesory mają 14 fizycznych jednostek obliczeniowych, które są podzielone na 6 rdzeni P i 8 E. Intel całkowicie zrezygnował jednak z hyperthreadingu w swoich najnowszych procesorach.

Niemniej jednak, Intelowi udało się osiągnąć identyczną wydajność w średnim porównaniu wydajności procesora w porównaniu do Intel Core i5-14600K można osiągnąć. Jeśli cofniemy się jeszcze dalej na osi czasu, Intel Core Ultra 5 245K może nawet konkurować z byłym flagowym modelem z 2021 roku, czyli Intel Core i9-12900K.

W pojedynku z AMD, Intel Core Ultra 5 245K osiąga wydajność na poziomie AMD Ryzen 7 9700Xktóry jest procesorem 8C/16T.

Zasadniczo Intel Core Ultra 5 245K zapewnia imponującą wydajność, która przy poborze mocy 159 W jest niższa niż w modelach Core i5 poprzednich generacji. Oznacza to, że procesor nie tylko działa znacznie wydajniej, ale jest też łatwiejszy do schłodzenia.

Więcej testów porównawczych procesorów znajdą Państwo tutaj.

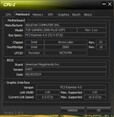
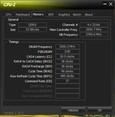
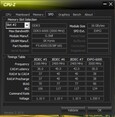
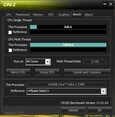
CPU-Z
CPU-Z
CPU-Z
CPU-Z
CPU-Z
CPU-Z
Performance Rating - Percent
AMD Ryzen 9 9950X
Ryzen 9 9950X, 4300 MHz
82.1 pt
Intel Core i9-14900K
i9-14900K, 3200 MHz
81.9 pt
Intel Core i9-13900K
i9-13900K, 3000 MHz
79.6 pt
Intel Core Ultra 9 285K
Core Ultra 9 285K, 3200 MHz
79.4 pt
AMD Ryzen 9 7950X
R9 7950X, 4500 MHz
78.2 pt
AMD Ryzen 9 7950X3D
R9 7950X3D, 4200 MHz
78.1 pt
AMD Ryzen 9 7900X
R9 7900X, 4700 MHz
71.4 pt
Intel Core i5-14600K
i5-14600K, 3500 MHz
68.4 pt
AMD Ryzen 7 9700X
Ryzen 7 9700X, 3800 MHz
67.9 pt
Intel Core i9-12900K
i9-12900K, 3200 MHz
67.8 pt
Intel Core Ultra 5 245K
Core Ultra 5 245K, 3600 MHz
67.6 pt
AMD Ryzen 9 5950X
R9 5950X, 3400 MHz
66.7 pt
Intel Core i5-13600K
i5-13600K, 3500 MHz
66.4 pt
AMD Ryzen 5 9600X
Ryzen 5 9600X, 3900 MHz
64.1 pt
AMD Ryzen 7 7800X3D
R7 7800X3D, 4200 MHz
63.7 pt
AMD Ryzen 5 7600X
R5 7600X, 4700 MHz
61.5 pt
Intel Core i5-12600K
i5-12600K, 2800 MHz
59.4 pt
Intel Core i5-13400
i5-13400, 2500 MHz
56.8 pt
Intel Core i5-12400F
i5-12400F, 2500 MHz
52.1 pt
Cinebench R23
Single Core
Intel Core i9-14900K
i9-14900K, 3200 MHz
2351 Points +10%
Intel Core Ultra 9 285K
Core Ultra 9 285K, 3200 MHz
2342 Points +10%
Intel Core i9-13900K
i9-13900K, 3000 MHz
2267 Points +6%
AMD Ryzen 7 9700X
Ryzen 7 9700X, 3800 MHz
2211 Points +4%
AMD Ryzen 9 9950X
Ryzen 9 9950X, 4300 MHz
2202 Points +3%
AMD Ryzen 5 9600X
Ryzen 5 9600X, 3900 MHz
2180 Points +2%
Intel Core Ultra 5 245K
Core Ultra 5 245K, 3600 MHz
2132 Points
Intel Core i5-14600K
i5-14600K, 3500 MHz
2064 Points -3%
AMD Ryzen 9 7950X3D
R9 7950X3D, 4200 MHz
2053 Points -4%
AMD Ryzen 9 7950X
R9 7950X, 4500 MHz
2045 Points -4%
AMD Ryzen 9 7900X
R9 7900X, 4700 MHz
2039 Points -4%
Intel Core i5-13600K
i5-13600K, 3500 MHz
2010 Points -6%
Intel Core i9-12900K
i9-12900K, 3200 MHz
1998 Points -6%
AMD Ryzen 5 7600X
R5 7600X, 4700 MHz
1967 Points -8%
Intel Core i5-12600K
i5-12600K, 2800 MHz
1907 Points -11%
AMD Ryzen 7 7800X3D
R7 7800X3D, 4200 MHz
1820 Points -15%
Intel Core i5-13400
i5-13400, 2500 MHz
1786 Points -16%
Intel Core i5-12400F
i5-12400F, 2500 MHz
1680 Points -21%
AMD Ryzen 9 5950X
R9 5950X, 3400 MHz
1649 Points -23%
Multi Core
Intel Core Ultra 9 285K
Core Ultra 9 285K, 3200 MHz
42522 Points +70%
Intel Core i9-14900K
i9-14900K, 3200 MHz
41193 Points +64%
AMD Ryzen 9 9950X
Ryzen 9 9950X, 4300 MHz
40924 Points +63%
Intel Core i9-13900K
i9-13900K, 3000 MHz
40103 Points +60%
AMD Ryzen 9 7950X
R9 7950X, 4500 MHz
37792 Points +51%
AMD Ryzen 9 7950X3D
R9 7950X3D, 4200 MHz
36291 Points +45%
AMD Ryzen 9 7900X
R9 7900X, 4700 MHz
29480 Points +18%
AMD Ryzen 9 5950X
R9 5950X, 3400 MHz
27062 Points +8%
Intel Core i9-12900K
i9-12900K, 3200 MHz
27005 Points +8%
Intel Core Ultra 5 245K
Core Ultra 5 245K, 3600 MHz
25066 Points
Intel Core i5-14600K
i5-14600K, 3500 MHz
24491 Points -2%
Intel Core i5-13600K
i5-13600K, 3500 MHz
24268 Points -3%
AMD Ryzen 7 9700X
Ryzen 7 9700X, 3800 MHz
20485 Points -18%
AMD Ryzen 7 7800X3D
R7 7800X3D, 4200 MHz
18086 Points -28%
Intel Core i5-12600K
i5-12600K, 2800 MHz
17491 Points -30%
AMD Ryzen 5 9600X
Ryzen 5 9600X, 3900 MHz
17176 Points -31%
Intel Core i5-13400
i5-13400, 2500 MHz
15953 Points -36%
AMD Ryzen 5 7600X
R5 7600X, 4700 MHz
15322 Points -39%
Intel Core i5-12400F
i5-12400F, 2500 MHz
12380 Points -51%
Cinebench R20
CPU (Single Core)
Intel Core i9-14900K
i9-14900K, 3200 MHz
900 Points +10%
Intel Core Ultra 9 285K
Core Ultra 9 285K, 3200 MHz
899 Points +10%
AMD Ryzen 9 9950X
Ryzen 9 9950X, 4300 MHz
871 Points +6%
AMD Ryzen 7 9700X
Ryzen 7 9700X, 3800 MHz
870 Points +6%
AMD Ryzen 5 9600X
Ryzen 5 9600X, 3900 MHz
858 Points +5%
Intel Core i9-13900K
i9-13900K, 3000 MHz
828 Points +1%
Intel Core Ultra 5 245K
Core Ultra 5 245K, 3600 MHz
820 Points
AMD Ryzen 9 7950X
R9 7950X, 4500 MHz
795 Points -3%
AMD Ryzen 9 7950X3D
R9 7950X3D, 4200 MHz
795 Points -3%
Intel Core i5-14600K
i5-14600K, 3500 MHz
790 Points -4%
AMD Ryzen 9 7900X
R9 7900X, 4700 MHz
786 Points -4%
Intel Core i5-13600K
i5-13600K, 3500 MHz
775 Points -5%
Intel Core i9-12900K
i9-12900K, 3200 MHz
766 Points -7%
AMD Ryzen 5 7600X
R5 7600X, 4700 MHz
761 Points -7%
Intel Core i5-12600K
i5-12600K, 2800 MHz
734 Points -10%
AMD Ryzen 7 7800X3D
R7 7800X3D, 4200 MHz
709 Points -14%
Intel Core i5-13400
i5-13400, 2500 MHz
688 Points -16%
Intel Core i5-12400F
i5-12400F, 2500 MHz
653 Points -20%
AMD Ryzen 9 5950X
R9 5950X, 3400 MHz
641 Points -22%
CPU (Multi Core)
Intel Core Ultra 9 285K
Core Ultra 9 285K, 3200 MHz
16623 Points +70%
AMD Ryzen 9 9950X
Ryzen 9 9950X, 4300 MHz
15788 Points +62%
Intel Core i9-14900K
i9-14900K, 3200 MHz
15466 Points +59%
Intel Core i9-13900K
i9-13900K, 3000 MHz
15181 Points +56%
AMD Ryzen 9 7950X
R9 7950X, 4500 MHz
14786 Points +52%
AMD Ryzen 9 7950X3D
R9 7950X3D, 4200 MHz
14188 Points +45%
AMD Ryzen 9 7900X
R9 7900X, 4700 MHz
11563 Points +19%
AMD Ryzen 9 5950X
R9 5950X, 3400 MHz
10482 Points +7%
Intel Core i9-12900K
i9-12900K, 3200 MHz
10240 Points +5%
Intel Core Ultra 5 245K
Core Ultra 5 245K, 3600 MHz
9752 Points
Intel Core i5-14600K
i5-14600K, 3500 MHz
9371 Points -4%
Intel Core i5-13600K
i5-13600K, 3500 MHz
9265 Points -5%
AMD Ryzen 7 9700X
Ryzen 7 9700X, 3800 MHz
7956 Points -18%
AMD Ryzen 7 7800X3D
R7 7800X3D, 4200 MHz
7121 Points -27%
AMD Ryzen 5 9600X
Ryzen 5 9600X, 3900 MHz
6719 Points -31%
Intel Core i5-12600K
i5-12600K, 2800 MHz
6692 Points -31%
Intel Core i5-13400
i5-13400, 2500 MHz
6135 Points -37%
AMD Ryzen 5 7600X
R5 7600X, 4700 MHz
5985 Points -39%
Intel Core i5-12400F
i5-12400F, 2500 MHz
4740 Points -51%
Cinebench R15
CPU Single 64Bit
Intel Core Ultra 9 285K
Core Ultra 9 285K, 3200 MHz
355 Points +10%
AMD Ryzen 7 9700X
Ryzen 7 9700X, 3800 MHz
346 Points +7%
AMD Ryzen 9 9950X
Ryzen 9 9950X, 4300 MHz
344 Points +7%
AMD Ryzen 5 9600X
Ryzen 5 9600X, 3900 MHz
341 Points +6%
Intel Core i9-14900K
i9-14900K, 3200 MHz
332 Points +3%
AMD Ryzen 9 7950X
R9 7950X, 4500 MHz
328 Points +2%
Intel Core i9-13900K
i9-13900K, 3000 MHz
327 Points +2%
AMD Ryzen 9 7950X3D
R9 7950X3D, 4200 MHz
326 Points +1%
AMD Ryzen 9 7900X
R9 7900X, 4700 MHz
324 Points +1%
Intel Core Ultra 5 245K
Core Ultra 5 245K, 3600 MHz
322 Points
AMD Ryzen 5 7600X
R5 7600X, 4700 MHz
315 Points -2%
Intel Core i5-14600K
i5-14600K, 3500 MHz
297 Points -8%
AMD Ryzen 7 7800X3D
R7 7800X3D, 4200 MHz
291 Points -10%
Intel Core i5-13600K
i5-13600K, 3500 MHz
289 Points -10%
Intel Core i9-12900K
i9-12900K, 3200 MHz
286 Points -11%
Intel Core i5-12600K
i5-12600K, 2800 MHz
275 Points -15%
AMD Ryzen 9 5950X
R9 5950X, 3400 MHz
272 Points -16%
Intel Core i5-13400
i5-13400, 2500 MHz
257 Points -20%
Intel Core i5-12400F
i5-12400F, 2500 MHz
244 Points -24%
CPU Multi 64Bit
Intel Core Ultra 9 285K
Core Ultra 9 285K, 3200 MHz
6396 Points +66%
AMD Ryzen 9 9950X
Ryzen 9 9950X, 4300 MHz
6335 (6262.72min - 6335.13max) Points +65%
Intel Core i9-14900K
i9-14900K, 3200 MHz
6282 Points +63%
AMD Ryzen 9 7950X
R9 7950X, 4500 MHz
6209 Points +61%
Intel Core i9-13900K
i9-13900K, 3000 MHz
6191 Points +61%
AMD Ryzen 9 7950X3D
R9 7950X3D, 4200 MHz
5974 Points +55%
AMD Ryzen 9 7900X
R9 7900X, 4700 MHz
4856 Points +26%
AMD Ryzen 9 5950X
R9 5950X, 3400 MHz
4492 Points +17%
Intel Core i9-12900K
i9-12900K, 3200 MHz
4057 Points +5%
Intel Core Ultra 5 245K
Core Ultra 5 245K, 3600 MHz
3850 Points
Intel Core i5-13600K
i5-13600K, 3500 MHz
3643 Points -5%
Intel Core i5-14600K
i5-14600K, 3500 MHz
3640 Points -5%
AMD Ryzen 7 9700X
Ryzen 7 9700X, 3800 MHz
3178 (3067.25min - 3120.37max) Points -17%
AMD Ryzen 7 7800X3D
R7 7800X3D, 4200 MHz
2974 Points -23%
AMD Ryzen 5 9600X
Ryzen 5 9600X, 3900 MHz
2630 Points -32%
Intel Core i5-12600K
i5-12600K, 2800 MHz
2555 Points -34%
AMD Ryzen 5 7600X
R5 7600X, 4700 MHz
2507 Points -35%
Intel Core i5-13400
i5-13400, 2500 MHz
2358 Points -39%
Intel Core i5-12400F
i5-12400F, 2500 MHz
1759 Points -54%
Cinebench R11.5
CPU Single 64Bit
Intel Core Ultra 9 285K
Core Ultra 9 285K, 3200 MHz
4.17 Points +8%
AMD Ryzen 7 9700X
Ryzen 7 9700X, 3800 MHz
4.06 Points +5%
AMD Ryzen 9 9950X
Ryzen 9 9950X, 4300 MHz
4.03 Points +5%
Intel Core i9-14900K
i9-14900K, 3200 MHz
4.02 Points +4%
AMD Ryzen 5 9600X
Ryzen 5 9600X, 3900 MHz
4 Points +4%
Intel Core i9-13900K
i9-13900K, 3000 MHz
3.92 Points +2%
AMD Ryzen 9 7950X
R9 7950X, 4500 MHz
3.86 Points 0%
AMD Ryzen 9 7950X3D
R9 7950X3D, 4200 MHz
3.86 Points 0%
Intel Core Ultra 5 245K
Core Ultra 5 245K, 3600 MHz
3.85 Points
AMD Ryzen 9 7900X
R9 7900X, 4700 MHz
3.83 Points -1%
AMD Ryzen 5 7600X
R5 7600X, 4700 MHz
3.72 Points -3%
Intel Core i5-14600K
i5-14600K, 3500 MHz
3.58 Points -7%
Intel Core i9-12900K
i9-12900K, 3200 MHz
3.49 Points -9%
Intel Core i5-13600K
i5-13600K, 3500 MHz
3.48 Points -10%
AMD Ryzen 7 7800X3D
R7 7800X3D, 4200 MHz
3.43 Points -11%
Intel Core i5-12600K
i5-12600K, 2800 MHz
3.31 Points -14%
AMD Ryzen 9 5950X
R9 5950X, 3400 MHz
3.14 Points -18%
Intel Core i5-13400
i5-13400, 2500 MHz
3.1 Points -19%
Intel Core i5-12400F
i5-12400F, 2500 MHz
2.95 Points -23%
CPU Multi 64Bit
Intel Core Ultra 9 285K
Core Ultra 9 285K, 3200 MHz
77.29 Points +63%
AMD Ryzen 9 9950X
Ryzen 9 9950X, 4300 MHz
72.28 Points +52%
Intel Core i9-14900K
i9-14900K, 3200 MHz
72.24 Points +52%
Intel Core i9-13900K
i9-13900K, 3000 MHz
70.78 Points +49%
AMD Ryzen 9 7950X
R9 7950X, 4500 MHz
68.61 Points +44%
AMD Ryzen 9 7950X3D
R9 7950X3D, 4200 MHz
64.59 Points +36%
AMD Ryzen 9 7900X
R9 7900X, 4700 MHz
54.51 Points +15%
AMD Ryzen 9 5950X
R9 5950X, 3400 MHz
49.6 Points +4%
Intel Core Ultra 5 245K
Core Ultra 5 245K, 3600 MHz
47.55 Points
Intel Core i9-12900K
i9-12900K, 3200 MHz
47.06 Points -1%
Intel Core i5-13600K
i5-13600K, 3500 MHz
42.38 Points -11%
Intel Core i5-14600K
i5-14600K, 3500 MHz
40.96 Points -14%
AMD Ryzen 7 9700X
Ryzen 7 9700X, 3800 MHz
36.24 Points -24%
AMD Ryzen 7 7800X3D
R7 7800X3D, 4200 MHz
33.48 Points -30%
AMD Ryzen 5 9600X
Ryzen 5 9600X, 3900 MHz
30.86 Points -35%
Intel Core i5-12600K
i5-12600K, 2800 MHz
30.01 Points -37%
AMD Ryzen 5 7600X
R5 7600X, 4700 MHz
28.41 Points -40%
Intel Core i5-13400
i5-13400, 2500 MHz
27.36 Points -42%
Intel Core i5-12400F
i5-12400F, 2500 MHz
20.39 Points -57%
Blender - v2.79 BMW27 CPU
Intel Core i5-12400F
i5-12400F, 2500 MHz
269 Seconds * -98%
Intel Core i5-13400
i5-13400, 2500 MHz
206 Seconds * -51%
AMD Ryzen 5 7600X
R5 7600X, 4700 MHz
203 Seconds * -49%
Intel Core i5-12600K
i5-12600K, 2800 MHz
189.5 Seconds * -39%
AMD Ryzen 5 9600X
Ryzen 5 9600X, 3900 MHz
184 Seconds * -35%
AMD Ryzen 7 7800X3D
R7 7800X3D, 4200 MHz
169 Seconds * -24%
AMD Ryzen 7 9700X
Ryzen 7 9700X, 3800 MHz
154 Seconds * -13%
Intel Core Ultra 5 245K
Core Ultra 5 245K, 3600 MHz
136 Seconds *
Intel Core i5-13600K
i5-13600K, 3500 MHz
135 Seconds * +1%
Intel Core i5-14600K
i5-14600K, 3500 MHz
134 Seconds * +1%
Intel Core i9-12900K
i9-12900K, 3200 MHz
121.1 Seconds * +11%
AMD Ryzen 9 5950X
R9 5950X, 3400 MHz
112.8 Seconds * +17%
AMD Ryzen 9 7900X
R9 7900X, 4700 MHz
106 Seconds * +22%
AMD Ryzen 9 7950X3D
R9 7950X3D, 4200 MHz
86 Seconds * +37%
AMD Ryzen 9 7950X
R9 7950X, 4500 MHz
85 Seconds * +37%
Intel Core i9-13900K
i9-13900K, 3000 MHz
80 Seconds * +41%
Intel Core i9-14900K
i9-14900K, 3200 MHz
80 Seconds * +41%
Intel Core Ultra 9 285K
Core Ultra 9 285K, 3200 MHz
79 Seconds * +42%
AMD Ryzen 9 9950X
Ryzen 9 9950X, 4300 MHz
77 Seconds * +43%
wPrime 2.10
32m
Intel Core i9-12900K
i9-12900K, 3200 MHz
4.924 s * -65%
Intel Core i5-12600K
i5-12600K, 2800 MHz
4.725 s * -59%
Intel Core i5-12400F
i5-12400F, 2500 MHz
4.078 s * -37%
Intel Core i5-13400
i5-13400, 2500 MHz
3.474 s * -17%
Intel Core Ultra 5 245K
Core Ultra 5 245K, 3600 MHz
2.976 s *
AMD Ryzen 5 7600X
R5 7600X, 4700 MHz
2.78 s * +7%
AMD Ryzen 5 9600X
Ryzen 5 9600X, 3900 MHz
2.617 s * +12%
AMD Ryzen 9 5950X
R9 5950X, 3400 MHz
2.538 s * +15%
Intel Core i5-13600K
i5-13600K, 3500 MHz
2.527 s * +15%
AMD Ryzen 7 7800X3D
R7 7800X3D, 4200 MHz
2.435 s * +18%
Intel Core i5-14600K
i5-14600K, 3500 MHz
2.39 s * +20%
AMD Ryzen 7 9700X
Ryzen 7 9700X, 3800 MHz
2.36 s * +21%
Intel Core Ultra 9 285K
Core Ultra 9 285K, 3200 MHz
2.197 s * +26%
AMD Ryzen 9 9950X
Ryzen 9 9950X, 4300 MHz
2.077 s * +30%
Intel Core i9-14900K
i9-14900K, 3200 MHz
2.07 s * +30%
AMD Ryzen 9 7950X3D
R9 7950X3D, 4200 MHz
2.007 s * +33%
Intel Core i9-13900K
i9-13900K, 3000 MHz
1.818 s * +39%
AMD Ryzen 9 7900X
R9 7900X, 4700 MHz
1.781 s * +40%
AMD Ryzen 9 7950X
R9 7950X, 4500 MHz
1.669 s * +44%
1024m
Intel Core i5-13400
i5-13400, 2500 MHz
452.309 s * -482%
Intel Core i5-12600K
i5-12600K, 2800 MHz
202.7 s * -161%
Intel Core i9-12900K
i9-12900K, 3200 MHz
190.6 s * -145%
Intel Core i5-13600K
i5-13600K, 3500 MHz
177.592 s * -128%
Intel Core i5-14600K
i5-14600K, 3500 MHz
158.77 s * -104%
Intel Core i5-12400F
i5-12400F, 2500 MHz
112.849 s * -45%
Intel Core i9-13900K
i9-13900K, 3000 MHz
79.738 s * -3%
Intel Core Ultra 5 245K
Core Ultra 5 245K, 3600 MHz
77.721 s *
AMD Ryzen 5 7600X
R5 7600X, 4700 MHz
74.491 s * +4%
Intel Core i9-14900K
i9-14900K, 3200 MHz
74.47 s * +4%
AMD Ryzen 5 9600X
Ryzen 5 9600X, 3900 MHz
72.546 s * +7%
AMD Ryzen 9 5950X
R9 5950X, 3400 MHz
64.9 s * +16%
AMD Ryzen 7 7800X3D
R7 7800X3D, 4200 MHz
62.733 s * +19%
AMD Ryzen 7 9700X
Ryzen 7 9700X, 3800 MHz
59.56 s * +23%
Intel Core Ultra 9 285K
Core Ultra 9 285K, 3200 MHz
48.806 s * +37%
AMD Ryzen 9 7900X
R9 7900X, 4700 MHz
39.954 s * +49%
AMD Ryzen 9 7950X3D
R9 7950X3D, 4200 MHz
33.879 s * +56%
AMD Ryzen 9 7950X
R9 7950X, 4500 MHz
30.811 s * +60%
AMD Ryzen 9 9950X
Ryzen 9 9950X, 4300 MHz
29.318 s * +62%
X264 HD Benchmark 4.0
Pass 1
Intel Core i9-14900K
i9-14900K, 3200 MHz
433.5 (424min - 434max) fps +12%
Intel Core Ultra 9 285K
Core Ultra 9 285K, 3200 MHz
422 (421min - 423max) fps +9%
Intel Core i9-13900K
i9-13900K, 3000 MHz
412 (410min - 417max) fps +6%
Intel Core i5-14600K
i5-14600K, 3500 MHz
411 (410min - 412max) fps +6%
AMD Ryzen 9 7950X3D
R9 7950X3D, 4200 MHz
392.5 (391min - 397max) fps +1%
AMD Ryzen 9 9950X
Ryzen 9 9950X, 4300 MHz
392 (392min - 393max) fps +1%
Intel Core Ultra 5 245K
Core Ultra 5 245K, 3600 MHz
388.5 (387min - 390max) fps
Intel Core i5-13600K
i5-13600K, 3500 MHz
388 (386min - 388max) fps 0%
AMD Ryzen 9 7950X
R9 7950X, 4500 MHz
379.5 (378min - 385max) fps -2%
AMD Ryzen 9 7900X
R9 7900X, 4700 MHz
376 (369min - 378max) fps -3%
AMD Ryzen 7 9700X
Ryzen 7 9700X, 3800 MHz
376 (374min - 376max) fps -3%
Intel Core i9-12900K
i9-12900K, 3200 MHz
368.5 (366min - 369max) fps -5%
AMD Ryzen 5 7600X
R5 7600X, 4700 MHz
367 (363min - 371max) fps -6%
AMD Ryzen 5 9600X
Ryzen 5 9600X, 3900 MHz
364 (361min - 367max) fps -6%
AMD Ryzen 7 7800X3D
R7 7800X3D, 4200 MHz
344 (339min - 346max) fps -11%
AMD Ryzen 9 5950X
R9 5950X, 3400 MHz
338.5 (337min - 340max) fps -13%
Intel Core i5-12600K
i5-12600K, 2800 MHz
333.5 (332min - 336max) fps -14%
Intel Core i5-13400
i5-13400, 2500 MHz
311 (310min - 312max) fps -20%
Intel Core i5-12400F
i5-12400F, 2500 MHz
252.5 (249min - 256max) fps -35%
Pass 2
Intel Core Ultra 9 285K
Core Ultra 9 285K, 3200 MHz
296.5 (296min - 298max) fps +37%
Intel Core i9-14900K
i9-14900K, 3200 MHz
286.5 (285min - 287max) fps +32%
AMD Ryzen 9 9950X
Ryzen 9 9950X, 4300 MHz
271 (271min - 272max) fps +25%
Intel Core i9-13900K
i9-13900K, 3000 MHz
267 (266min - 271max) fps +23%
AMD Ryzen 9 7950X
R9 7950X, 4500 MHz
266.5 (263min - 267max) fps +23%
AMD Ryzen 9 7950X3D
R9 7950X3D, 4200 MHz
265.5 (263min - 266max) fps +23%
AMD Ryzen 9 7900X
R9 7900X, 4700 MHz
241 (240min - 242max) fps +11%
AMD Ryzen 9 5950X
R9 5950X, 3400 MHz
221 (220min - 221max) fps +2%
Intel Core Ultra 5 245K
Core Ultra 5 245K, 3600 MHz
216.5 (215min - 217max) fps
Intel Core i5-14600K
i5-14600K, 3500 MHz
209 (208min - 209max) fps -3%
Intel Core i9-12900K
i9-12900K, 3200 MHz
206 (206min - 206max) fps -5%
Intel Core i5-13600K
i5-13600K, 3500 MHz
199 (198.5min - 199.4max) fps -8%
AMD Ryzen 7 9700X
Ryzen 7 9700X, 3800 MHz
176.05 (175.9min - 176.1max) fps -19%
AMD Ryzen 7 7800X3D
R7 7800X3D, 4200 MHz
169.25 (169.1min - 170max) fps -22%
AMD Ryzen 5 9600X
Ryzen 5 9600X, 3900 MHz
154 (153.4min - 154.3max) fps -29%
Intel Core i5-12600K
i5-12600K, 2800 MHz
148 (147min - 148max) fps -32%
AMD Ryzen 5 7600X
R5 7600X, 4700 MHz
147.8 (147.7min - 147.9max) fps -32%
Intel Core i5-13400
i5-13400, 2500 MHz
135.8 (135.7min - 135.9max) fps -37%
Intel Core i5-12400F
i5-12400F, 2500 MHz
101.35 (101.1min - 101.5max) fps -53%
WinRAR - Result
AMD Ryzen 9 7900X
R9 7900X, 4700 MHz
17225 KB/s +64%
AMD Ryzen 7 7800X3D
R7 7800X3D, 4200 MHz
16585 KB/s +58%
AMD Ryzen 9 7950X
R9 7950X, 4500 MHz
16351 KB/s +55%
AMD Ryzen 5 7600X
R5 7600X, 4700 MHz
16178 KB/s +54%
Intel Core i9-14900K
i9-14900K, 3200 MHz
16108 KB/s +53%
AMD Ryzen 9 7950X3D
R9 7950X3D, 4200 MHz
15779 KB/s +50%
Intel Core i9-13900K
i9-13900K, 3000 MHz
14836 KB/s +41%
AMD Ryzen 5 9600X
Ryzen 5 9600X, 3900 MHz
14819 KB/s +41%
AMD Ryzen 9 9950X
Ryzen 9 9950X, 4300 MHz
13778 KB/s +31%
AMD Ryzen 7 9700X
Ryzen 7 9700X, 3800 MHz
13549 KB/s +29%
Intel Core Ultra 9 285K
Core Ultra 9 285K, 3200 MHz
12599 KB/s +20%
AMD Ryzen 9 5950X
R9 5950X, 3400 MHz
12503 KB/s +19%
Intel Core i5-14600K
i5-14600K, 3500 MHz
11491 KB/s +9%
Intel Core i5-13600K
i5-13600K, 3500 MHz
10937 KB/s +4%
Intel Core i9-12900K
i9-12900K, 3200 MHz
10792 KB/s +3%
Intel Core Ultra 5 245K
Core Ultra 5 245K, 3600 MHz
10521 KB/s
Intel Core i5-13400
i5-13400, 2500 MHz
7979 KB/s -24%
Intel Core i5-12400F
i5-12400F, 2500 MHz
7816 KB/s -26%
Intel Core i5-12600K
i5-12600K, 2800 MHz
6239 KB/s -41%
TrueCrypt
AES Mean 100MB
AMD Ryzen 9 9950X
Ryzen 9 9950X, 4300 MHz
32.4 GB/s +98%
AMD Ryzen 9 7950X
R9 7950X, 4500 MHz
30.7 GB/s +87%
Intel Core i9-13900K
i9-13900K, 3000 MHz
27 GB/s +65%
AMD Ryzen 9 5950X
R9 5950X, 3400 MHz
26.9 GB/s +64%
AMD Ryzen 9 7950X3D
R9 7950X3D, 4200 MHz
26.9 GB/s +64%
Intel Core i9-14900K
i9-14900K, 3200 MHz
26.7 GB/s +63%
Intel Core i5-14600K
i5-14600K, 3500 MHz
19.5 GB/s +19%
Intel Core i5-13600K
i5-13600K, 3500 MHz
18.8 GB/s +15%
Intel Core i9-12900K
i9-12900K, 3200 MHz
18.5 GB/s +13%
Intel Core Ultra 5 245K
Core Ultra 5 245K, 3600 MHz
16.4 GB/s
AMD Ryzen 7 9700X
Ryzen 7 9700X, 3800 MHz
16.1 GB/s -2%
Intel Core Ultra 9 285K
Core Ultra 9 285K, 3200 MHz
16 GB/s -2%
AMD Ryzen 7 7800X3D
R7 7800X3D, 4200 MHz
15.3 GB/s -7%
AMD Ryzen 9 7900X
R9 7900X, 4700 MHz
14.8 GB/s -10%
AMD Ryzen 5 9600X
Ryzen 5 9600X, 3900 MHz
13.4 GB/s -18%
AMD Ryzen 5 7600X
R5 7600X, 4700 MHz
13.2 GB/s -20%
Intel Core i5-12600K
i5-12600K, 2800 MHz
12.8 GB/s -22%
Intel Core i5-13400
i5-13400, 2500 MHz
11.8 GB/s -28%
Intel Core i5-12400F
i5-12400F, 2500 MHz
9.3 GB/s -43%
Twofish Mean 100MB
Intel Core i9-14900K
i9-14900K, 3200 MHz
5.8 GB/s +93%
AMD Ryzen 9 9950X
Ryzen 9 9950X, 4300 MHz
5.6 GB/s +87%
Intel Core i9-13900K
i9-13900K, 3000 MHz
5.4 GB/s +80%
Intel Core Ultra 9 285K
Core Ultra 9 285K, 3200 MHz
4.9 GB/s +63%
AMD Ryzen 9 7950X
R9 7950X, 4500 MHz
4.5 GB/s +50%
AMD Ryzen 9 7950X3D
R9 7950X3D, 4200 MHz
4.2 GB/s +40%
AMD Ryzen 9 5950X
R9 5950X, 3400 MHz
3.7 GB/s +23%
Intel Core i9-12900K
i9-12900K, 3200 MHz
3.7 GB/s +23%
Intel Core i5-14600K
i5-14600K, 3500 MHz
3.4 GB/s +13%
Intel Core i5-13600K
i5-13600K, 3500 MHz
3.1 GB/s +3%
Intel Core Ultra 5 245K
Core Ultra 5 245K, 3600 MHz
3 GB/s
AMD Ryzen 9 7900X
R9 7900X, 4700 MHz
2.8 GB/s -7%
AMD Ryzen 7 9700X
Ryzen 7 9700X, 3800 MHz
2.8 GB/s -7%
Intel Core i5-12600K
i5-12600K, 2800 MHz
2.2 GB/s -27%
AMD Ryzen 5 9600X
Ryzen 5 9600X, 3900 MHz
2.2 GB/s -27%
AMD Ryzen 7 7800X3D
R7 7800X3D, 4200 MHz
2.1 GB/s -30%
Intel Core i5-13400
i5-13400, 2500 MHz
2 GB/s -33%
AMD Ryzen 5 7600X
R5 7600X, 4700 MHz
1.8 GB/s -40%
Intel Core i5-12400F
i5-12400F, 2500 MHz
1.4 GB/s -53%
Serpent Mean 100MB
AMD Ryzen 9 9950X
Ryzen 9 9950X, 4300 MHz
3.4 GB/s +127%
Intel Core i9-13900K
i9-13900K, 3000 MHz
3 GB/s +100%
AMD Ryzen 9 7950X
R9 7950X, 4500 MHz
2.8 GB/s +87%
AMD Ryzen 9 7950X3D
R9 7950X3D, 4200 MHz
2.8 GB/s +87%
Intel Core i9-14900K
i9-14900K, 3200 MHz
2.8 GB/s +87%
AMD Ryzen 9 5950X
R9 5950X, 3400 MHz
2.4 GB/s +60%
Intel Core Ultra 9 285K
Core Ultra 9 285K, 3200 MHz
2.3 GB/s +53%
Intel Core i9-12900K
i9-12900K, 3200 MHz
1.9 GB/s +27%
Intel Core i5-14600K
i5-14600K, 3500 MHz
1.8 GB/s +20%
Intel Core i5-13600K
i5-13600K, 3500 MHz
1.7 GB/s +13%
AMD Ryzen 7 9700X
Ryzen 7 9700X, 3800 MHz
1.7 GB/s +13%
AMD Ryzen 9 7900X
R9 7900X, 4700 MHz
1.5 GB/s 0%
Intel Core Ultra 5 245K
Core Ultra 5 245K, 3600 MHz
1.5 GB/s
AMD Ryzen 5 9600X
Ryzen 5 9600X, 3900 MHz
1.4 GB/s -7%
Intel Core i5-12600K
i5-12600K, 2800 MHz
1.3 GB/s -13%
AMD Ryzen 7 7800X3D
R7 7800X3D, 4200 MHz
1.3 GB/s -13%
Intel Core i5-13400
i5-13400, 2500 MHz
1.2 GB/s -20%
AMD Ryzen 5 7600X
R5 7600X, 4700 MHz
1.1 GB/s -27%
Intel Core i5-12400F
i5-12400F, 2500 MHz
0.884 GB/s -41%
Geekbench 5.5
Multi-Core
Intel Core i9-14900K
i9-14900K, 3200 MHz
25867 Points +46%
Intel Core Ultra 9 285K
Core Ultra 9 285K, 3200 MHz
25740 Points +45%
AMD Ryzen 9 7950X
R9 7950X, 4500 MHz
24625 Points +39%
AMD Ryzen 9 7950X3D
R9 7950X3D, 4200 MHz
24343 Points +37%
Intel Core i9-13900K
i9-13900K, 3000 MHz
24157 Points +36%
AMD Ryzen 9 9950X
Ryzen 9 9950X, 4300 MHz
23982 Points +35%
AMD Ryzen 9 9950X
Ryzen 9 9950X, 4300 MHz
23154 Points +30%
AMD Ryzen 9 7900X
R9 7900X, 4700 MHz
19987 Points +13%
Intel Core i9-12900K
i9-12900K, 3200 MHz
17854 Points +1%
Intel Core Ultra 5 245K
Core Ultra 5 245K, 3600 MHz
17760 Points
Intel Core i5-14600K
i5-14600K, 3500 MHz
17516 Points -1%
AMD Ryzen 9 5950X
R9 5950X, 3400 MHz
16891 Points -5%
Intel Core i5-13600K
i5-13600K, 3500 MHz
16651 Points -6%
AMD Ryzen 7 9700X
Ryzen 7 9700X, 3800 MHz
14613 Points -18%
AMD Ryzen 7 7800X3D
R7 7800X3D, 4200 MHz
14252 Points -20%
Intel Core i5-12600K
i5-12600K, 2800 MHz
12797 Points -28%
AMD Ryzen 5 9600X
Ryzen 5 9600X, 3900 MHz
12751 Points -28%
Intel Core i5-13400
i5-13400, 2500 MHz
12107 Points -32%
AMD Ryzen 5 7600X
R5 7600X, 4700 MHz
11917 Points -33%
Intel Core i5-12400F
i5-12400F, 2500 MHz
9517 Points -46%
Single-Core
AMD Ryzen 9 9950X
Ryzen 9 9950X, 4300 MHz
2559 Points +15%
AMD Ryzen 9 9950X
Ryzen 9 9950X, 4300 MHz
2536 Points +14%
AMD Ryzen 5 9600X
Ryzen 5 9600X, 3900 MHz
2523 Points +13%
AMD Ryzen 7 9700X
Ryzen 7 9700X, 3800 MHz
2507 Points +13%
Intel Core Ultra 9 285K
Core Ultra 9 285K, 3200 MHz
2366 Points +6%
AMD Ryzen 9 7950X
R9 7950X, 4500 MHz
2311 Points +4%
AMD Ryzen 9 7950X3D
R9 7950X3D, 4200 MHz
2311 Points +4%
Intel Core i9-13900K
i9-13900K, 3000 MHz
2290 Points +3%
AMD Ryzen 9 7900X
R9 7900X, 4700 MHz
2274 Points +2%
Intel Core i9-14900K
i9-14900K, 3200 MHz
2243 Points +1%
Intel Core Ultra 5 245K
Core Ultra 5 245K, 3600 MHz
2224 Points
AMD Ryzen 5 7600X
R5 7600X, 4700 MHz
2205 Points -1%
Intel Core i9-12900K
i9-12900K, 3200 MHz
2042 Points -8%
AMD Ryzen 7 7800X3D
R7 7800X3D, 4200 MHz
2027 Points -9%
Intel Core i5-14600K
i5-14600K, 3500 MHz
2017 Points -9%
Intel Core i5-13600K
i5-13600K, 3500 MHz
1967 Points -12%
Intel Core i5-12600K
i5-12600K, 2800 MHz
1904 Points -14%
Intel Core i5-13400
i5-13400, 2500 MHz
1795 Points -19%
Intel Core i5-12400F
i5-12400F, 2500 MHz
1742 Points -22%
AMD Ryzen 9 5950X
R9 5950X, 3400 MHz
1682 Points -24%
Geekbench 5.0
5.0 Multi-Core
Intel Core Ultra 9 285K
Core Ultra 9 285K, 3200 MHz
25793 Points +44%
Intel Core i9-14900K
i9-14900K, 3200 MHz
25459 Points +42%
AMD Ryzen 9 7950X
R9 7950X, 4500 MHz
24479 Points +36%
Intel Core i9-13900K
i9-13900K, 3000 MHz
24021 Points +34%
AMD Ryzen 9 7950X3D
R9 7950X3D, 4200 MHz
23720 Points +32%
AMD Ryzen 9 9950X
Ryzen 9 9950X, 4300 MHz
23387 Points +30%
AMD Ryzen 9 7900X
R9 7900X, 4700 MHz
19975 Points +11%
Intel Core i9-12900K
i9-12900K, 3200 MHz
17959 Points 0%
Intel Core Ultra 5 245K
Core Ultra 5 245K, 3600 MHz
17938 Points
Intel Core i5-14600K
i5-14600K, 3500 MHz
17374 Points -3%
Intel Core i5-13600K
i5-13600K, 3500 MHz
16635 Points -7%
AMD Ryzen 9 5950X
R9 5950X, 3400 MHz
16570 Points -8%
AMD Ryzen 7 9700X
Ryzen 7 9700X, 3800 MHz
14698 Points -18%
AMD Ryzen 7 7800X3D
R7 7800X3D, 4200 MHz
13888 Points -23%
Intel Core i5-12600K
i5-12600K, 2800 MHz
12746 Points -29%
AMD Ryzen 5 9600X
Ryzen 5 9600X, 3900 MHz
12556 Points -30%
AMD Ryzen 5 7600X
R5 7600X, 4700 MHz
11880 Points -34%
Intel Core i5-13400
i5-13400, 2500 MHz
11801 Points -34%
Intel Core i5-12400F
i5-12400F, 2500 MHz
9368 Points -48%
5.0 Single-Core
AMD Ryzen 9 9950X
Ryzen 9 9950X, 4300 MHz
2445 Points +12%
AMD Ryzen 7 9700X
Ryzen 7 9700X, 3800 MHz
2402 Points +10%
AMD Ryzen 5 9600X
Ryzen 5 9600X, 3900 MHz
2397 Points +10%
Intel Core Ultra 9 285K
Core Ultra 9 285K, 3200 MHz
2332 Points +7%
Intel Core i9-14900K
i9-14900K, 3200 MHz
2272 Points +4%
AMD Ryzen 9 7950X
R9 7950X, 4500 MHz
2222 Points +2%
Intel Core i9-13900K
i9-13900K, 3000 MHz
2214 Points +2%
AMD Ryzen 9 7900X
R9 7900X, 4700 MHz
2194 Points +1%
AMD Ryzen 9 7950X3D
R9 7950X3D, 4200 MHz
2183 Points 0%
Intel Core Ultra 5 245K
Core Ultra 5 245K, 3600 MHz
2180 Points
AMD Ryzen 5 7600X
R5 7600X, 4700 MHz
2126 Points -2%
Intel Core i5-14600K
i5-14600K, 3500 MHz
2004 Points -8%
Intel Core i9-12900K
i9-12900K, 3200 MHz
1968 Points -10%
AMD Ryzen 7 7800X3D
R7 7800X3D, 4200 MHz
1938 Points -11%
Intel Core i5-13600K
i5-13600K, 3500 MHz
1931 Points -11%
Intel Core i5-12600K
i5-12600K, 2800 MHz
1821 Points -16%
Intel Core i5-13400
i5-13400, 2500 MHz
1706 Points -22%
AMD Ryzen 9 5950X
R9 5950X, 3400 MHz
1683 Points -23%
Intel Core i5-12400F
i5-12400F, 2500 MHz
1673 Points -23%
Geekbench 4.4
64 Bit Single-Core Score
AMD Ryzen 9 9950X
Ryzen 9 9950X, 4300 MHz
10016 Points +9%
Intel Core i9-14900K
i9-14900K, 3200 MHz
9890 Points +8%
AMD Ryzen 7 9700X
Ryzen 7 9700X, 3800 MHz
9801 Points +7%
Intel Core Ultra 9 285K
Core Ultra 9 285K, 3200 MHz
9791 Points +7%
AMD Ryzen 5 9600X
Ryzen 5 9600X, 3900 MHz
9757 Points +6%
Intel Core i9-13900K
i9-13900K, 3000 MHz
9598 Points +5%
AMD Ryzen 9 7950X
R9 7950X, 4500 MHz
9322 Points +2%
AMD Ryzen 9 7950X3D
R9 7950X3D, 4200 MHz
9240 Points +1%
AMD Ryzen 9 7900X
R9 7900X, 4700 MHz
9193 Points 0%
Intel Core Ultra 5 245K
Core Ultra 5 245K, 3600 MHz
9171 Points
AMD Ryzen 7 7800X3D
R7 7800X3D, 4200 MHz
9097 Points -1%
AMD Ryzen 5 7600X
R5 7600X, 4700 MHz
8926 Points -3%
Intel Core i5-14600K
i5-14600K, 3500 MHz
8904 Points -3%
Intel Core i9-12900K
i9-12900K, 3200 MHz
8665 Points -6%
Intel Core i5-13600K
i5-13600K, 3500 MHz
8618 Points -6%
Intel Core i5-12600K
i5-12600K, 2800 MHz
8223 Points -10%
Intel Core i5-13400
i5-13400, 2500 MHz
7683 Points -16%
Intel Core i5-12400F
i5-12400F, 2500 MHz
7548 Points -18%
AMD Ryzen 9 5950X
R9 5950X, 3400 MHz
7216 Points -21%
64 Bit Multi-Core Score
AMD Ryzen 9 9950X
Ryzen 9 9950X, 4300 MHz
100326 Points +52%
Intel Core Ultra 9 285K
Core Ultra 9 285K, 3200 MHz
92188 Points +40%
AMD Ryzen 9 7950X
R9 7950X, 4500 MHz
89678 Points +36%
Intel Core i9-14900K
i9-14900K, 3200 MHz
89177 Points +35%
AMD Ryzen 9 7950X3D
R9 7950X3D, 4200 MHz
87922 Points +33%
Intel Core i9-13900K
i9-13900K, 3000 MHz
86695 Points +31%
AMD Ryzen 9 7900X
R9 7900X, 4700 MHz
74731 Points +13%
Intel Core Ultra 5 245K
Core Ultra 5 245K, 3600 MHz
65981 Points
Intel Core i5-14600K
i5-14600K, 3500 MHz
64035 Points -3%
Intel Core i9-12900K
i9-12900K, 3200 MHz
63583 Points -4%
AMD Ryzen 9 5950X
R9 5950X, 3400 MHz
63233 Points -4%
Intel Core i5-13600K
i5-13600K, 3500 MHz
60407 Points -8%
AMD Ryzen 7 9700X
Ryzen 7 9700X, 3800 MHz
59594 Points -10%
AMD Ryzen 7 7800X3D
R7 7800X3D, 4200 MHz
54840 Points -17%
AMD Ryzen 5 9600X
Ryzen 5 9600X, 3900 MHz
51644 Points -22%
AMD Ryzen 5 7600X
R5 7600X, 4700 MHz
47407 Points -28%
Intel Core i5-12600K
i5-12600K, 2800 MHz
46557 Points -29%
Intel Core i5-13400
i5-13400, 2500 MHz
42509 Points -36%
Intel Core i5-12400F
i5-12400F, 2500 MHz
35098 Points -47%
3DMark 11 - 1280x720 Performance Physics
AMD Ryzen 9 9950X
Ryzen 9 9950X, 4300 MHz
38269 Points +42%
AMD Ryzen 9 7950X3D
R9 7950X3D, 4200 MHz
36991 Points +37%
AMD Ryzen 7 7800X3D
R7 7800X3D, 4200 MHz
35127 Points +30%
Intel Core i9-13900K
i9-13900K, 3000 MHz
32273 Points +19%
Intel Core i9-14900K
i9-14900K, 3200 MHz
32188 Points +19%
Intel Core i5-14600K
i5-14600K, 3500 MHz
31641 Points +17%
AMD Ryzen 7 9700X
Ryzen 7 9700X, 3800 MHz
30757 Points +14%
Intel Core i5-13600K
i5-13600K, 3500 MHz
30480 Points +13%
Intel Core Ultra 9 285K
Core Ultra 9 285K, 3200 MHz
28636 Points +6%
AMD Ryzen 9 7900X
R9 7900X, 4700 MHz
28618 Points +6%
AMD Ryzen 9 7950X
R9 7950X, 4500 MHz
28618 Points +6%
Intel Core i9-12900K
i9-12900K, 3200 MHz
28211 Points +4%
Intel Core Ultra 5 245K
Core Ultra 5 245K, 3600 MHz
27022 Points
AMD Ryzen 5 9600X
Ryzen 5 9600X, 3900 MHz
25717 Points -5%
AMD Ryzen 5 7600X
R5 7600X, 4700 MHz
25396 Points -6%
AMD Ryzen 9 5950X
R9 5950X, 3400 MHz
25367 Points -6%
Intel Core i5-12600K
i5-12600K, 2800 MHz
25017 Points -7%
Intel Core i5-13400
i5-13400, 2500 MHz
23120 Points -14%
Intel Core i5-12400F
i5-12400F, 2500 MHz
19436 Points -28%
7-Zip 18.03
7z b 4
AMD Ryzen 9 7950X
R9 7950X, 4500 MHz
161724 MIPS +108%
AMD Ryzen 9 9950X
Ryzen 9 9950X, 4300 MHz
160423 MIPS +106%
AMD Ryzen 9 7950X3D
R9 7950X3D, 4200 MHz
159341 MIPS +104%
Intel Core i9-14900K
i9-14900K, 3200 MHz
149570 MIPS +92%
Intel Core i9-13900K
i9-13900K, 3000 MHz
147068 MIPS +89%
Intel Core Ultra 9 285K
Core Ultra 9 285K, 3200 MHz
129542 MIPS +66%
AMD Ryzen 9 5950X
R9 5950X, 3400 MHz
127792 MIPS +64%
AMD Ryzen 9 7900X
R9 7900X, 4700 MHz
124975 MIPS +60%
Intel Core i9-12900K
i9-12900K, 3200 MHz
97671 MIPS +25%
Intel Core i5-14600K
i5-14600K, 3500 MHz
93235 MIPS +20%
Intel Core i5-13600K
i5-13600K, 3500 MHz
89647 MIPS +15%
AMD Ryzen 7 7800X3D
R7 7800X3D, 4200 MHz
85067 MIPS +9%
AMD Ryzen 7 9700X
Ryzen 7 9700X, 3800 MHz
82553 MIPS +6%
Intel Core Ultra 5 245K
Core Ultra 5 245K, 3600 MHz
77921 MIPS
AMD Ryzen 5 7600X
R5 7600X, 4700 MHz
69291 MIPS -11%
AMD Ryzen 5 9600X
Ryzen 5 9600X, 3900 MHz
68220 MIPS -12%
Intel Core i5-12600K
i5-12600K, 2800 MHz
64260 MIPS -18%
Intel Core i5-13400
i5-13400, 2500 MHz
59510 MIPS -24%
Intel Core i5-12400F
i5-12400F, 2500 MHz
45043 MIPS -42%
7z b 4 -mmt1
AMD Ryzen 9 7950X
R9 7950X, 4500 MHz
8365 MIPS +29%
AMD Ryzen 9 7950X3D
R9 7950X3D, 4200 MHz
8321 MIPS +28%
AMD Ryzen 9 7900X
R9 7900X, 4700 MHz
8282 MIPS +28%
AMD Ryzen 7 7800X3D
R7 7800X3D, 4200 MHz
8235 MIPS +27%
AMD Ryzen 5 7600X
R5 7600X, 4700 MHz
8063 MIPS +24%
AMD Ryzen 7 9700X
Ryzen 7 9700X, 3800 MHz
7894 MIPS +22%
AMD Ryzen 9 9950X
Ryzen 9 9950X, 4300 MHz
7852 MIPS +21%
AMD Ryzen 5 9600X
Ryzen 5 9600X, 3900 MHz
7796 MIPS +20%
Intel Core i9-14900K
i9-14900K, 3200 MHz
7772 MIPS +20%
Intel Core Ultra 9 285K
Core Ultra 9 285K, 3200 MHz
7288 MIPS +13%
Intel Core i9-13900K
i9-13900K, 3000 MHz
7272 MIPS +12%
AMD Ryzen 9 5950X
R9 5950X, 3400 MHz
6974 MIPS +8%
Intel Core i5-14600K
i5-14600K, 3500 MHz
6910 MIPS +7%
Intel Core i9-12900K
i9-12900K, 3200 MHz
6571 MIPS +1%
Intel Core i5-13600K
i5-13600K, 3500 MHz
6502 MIPS 0%
Intel Core Ultra 5 245K
Core Ultra 5 245K, 3600 MHz
6477 MIPS
Intel Core i5-12600K
i5-12600K, 2800 MHz
5944 MIPS -8%
Intel Core i5-13400
i5-13400, 2500 MHz
5829 MIPS -10%
Intel Core i5-12400F
i5-12400F, 2500 MHz
5476 MIPS -15%
HWBOT x265 Benchmark v2.2 - 4k Preset
AMD Ryzen 9 9950X
Ryzen 9 9950X, 4300 MHz
45.1 fps +52%
Intel Core Ultra 9 285K
Core Ultra 9 285K, 3200 MHz
45 fps +52%
AMD Ryzen 9 7950X
R9 7950X, 4500 MHz
44.4 fps +50%
Intel Core i9-14900K
i9-14900K, 3200 MHz
42.8 fps +45%
Intel Core i9-13900K
i9-13900K, 3000 MHz
42.6 fps +44%
AMD Ryzen 9 7950X3D
R9 7950X3D, 4200 MHz
42.4 fps +43%
AMD Ryzen 9 7900X
R9 7900X, 4700 MHz
36.2 fps +22%
AMD Ryzen 9 5950X
R9 5950X, 3400 MHz
31.8 fps +7%
Intel Core i5-12600K
i5-12600K, 2800 MHz
30.1 fps +2%
Intel Core i9-12900K
i9-12900K, 3200 MHz
30 fps +1%
Intel Core Ultra 5 245K
Core Ultra 5 245K, 3600 MHz
29.6 fps
Intel Core i5-14600K
i5-14600K, 3500 MHz
28.6 fps -3%
Intel Core i5-13600K
i5-13600K, 3500 MHz
27.6 fps -7%
AMD Ryzen 7 9700X
Ryzen 7 9700X, 3800 MHz
26.4 fps -11%
AMD Ryzen 7 7800X3D
R7 7800X3D, 4200 MHz
24.4 fps -18%
AMD Ryzen 5 9600X
Ryzen 5 9600X, 3900 MHz
23.2 fps -22%
AMD Ryzen 5 7600X
R5 7600X, 4700 MHz
21.1 fps -29%
Intel Core i5-13400
i5-13400, 2500 MHz
19.1 fps -35%
Intel Core i5-12400F
i5-12400F, 2500 MHz
15.2 fps -49%
R Benchmark 2.5 - Overall mean
Intel Core i5-12400F
i5-12400F, 2500 MHz
0.4837 sec * -18%
Intel Core i5-13400
i5-13400, 2500 MHz
0.4654 sec * -14%
AMD Ryzen 9 5950X
R9 5950X, 3400 MHz
0.4556 sec * -12%
Intel Core i5-12600K
i5-12600K, 2800 MHz
0.4456 sec * -9%
Intel Core i9-12900K
i9-12900K, 3200 MHz
0.4216 sec * -3%
AMD Ryzen 7 7800X3D
R7 7800X3D, 4200 MHz
0.4152 sec * -2%
Intel Core Ultra 5 245K
Core Ultra 5 245K, 3600 MHz
0.4086 sec *
Intel Core Ultra 5 245K
Core Ultra 5 245K, 3600 MHz
0.4058 sec * +1%
Intel Core i5-13600K
i5-13600K, 3500 MHz
0.405 sec * +1%
Intel Core i5-14600K
i5-14600K, 3500 MHz
0.3937 sec * +4%
Intel Core Ultra 9 285K
Core Ultra 9 285K, 3200 MHz
0.3833 sec * +6%
AMD Ryzen 5 7600X
R5 7600X, 4700 MHz
0.3749 sec * +8%
AMD Ryzen 9 7900X
R9 7900X, 4700 MHz
0.3736 sec * +9%
AMD Ryzen 9 7950X3D
R9 7950X3D, 4200 MHz
0.372 sec * +9%
AMD Ryzen 9 7950X
R9 7950X, 4500 MHz
0.3682 sec * +10%
Intel Core i9-13900K
i9-13900K, 3000 MHz
0.3539 sec * +13%
Intel Core i9-14900K
i9-14900K, 3200 MHz
0.345 sec * +16%
AMD Ryzen 7 9700X
Ryzen 7 9700X, 3800 MHz
0.3414 sec * +16%
AMD Ryzen 5 9600X
Ryzen 5 9600X, 3900 MHz
0.3389 sec * +17%
AMD Ryzen 9 9950X
Ryzen 9 9950X, 4300 MHz
0.3307 sec * +19%
LibreOffice - 20 Documents To PDF
Intel Core i5-12600K
i5-12600K, 2800 MHz
71.8 s * -67%
Intel Core i5-12400F
i5-12400F, 2500 MHz
46.5 s * -8%
AMD Ryzen 5 9600X
Ryzen 5 9600X, 3900 MHz
46.4 s * -8%
AMD Ryzen 9 5950X
R9 5950X, 3400 MHz
45.97 s * -7%
AMD Ryzen 9 9950X
Ryzen 9 9950X, 4300 MHz
45.1 s * -5%
AMD Ryzen 7 9700X
Ryzen 7 9700X, 3800 MHz
43.8 s * -2%
Intel Core Ultra 5 245K
Core Ultra 5 245K, 3600 MHz
43.1 s *
Intel Core Ultra 5 245K
Core Ultra 5 245K, 3600 MHz
39.3 s * +9%
AMD Ryzen 7 7800X3D
R7 7800X3D, 4200 MHz
40.7 s * +6%
Intel Core i9-12900K
i9-12900K, 3200 MHz
40.6 s * +6%
Intel Core i5-13400
i5-13400, 2500 MHz
38.7 s * +10%
AMD Ryzen 9 7950X3D
R9 7950X3D, 4200 MHz
38.6 s * +10%
AMD Ryzen 5 7600X
R5 7600X, 4700 MHz
36.8 s * +15%
Intel Core i9-13900K
i9-13900K, 3000 MHz
36.6 s * +15%
Intel Core Ultra 9 285K
Core Ultra 9 285K, 3200 MHz
36.2 s * +16%
AMD Ryzen 9 7950X
R9 7950X, 4500 MHz
35.5 s * +18%
Intel Core i5-13600K
i5-13600K, 3500 MHz
35 s * +19%
AMD Ryzen 9 7900X
R9 7900X, 4700 MHz
34.9 s * +19%
Intel Core i9-14900K
i9-14900K, 3200 MHz
32.5 s * +25%
Intel Core i5-14600K
i5-14600K, 3500 MHz
31.9 s * +26%
WebXPRT 3 - Overall
AMD Ryzen 9 9950X
Ryzen 9 9950X, 4300 MHz
409 Points +18%
AMD Ryzen 7 9700X
Ryzen 7 9700X, 3800 MHz
398 Points +15%
AMD Ryzen 9 7950X3D
R9 7950X3D, 4200 MHz
383 Points +11%
Intel Core i9-14900K
i9-14900K, 3200 MHz
382 Points +10%
Intel Core Ultra 9 285K
Core Ultra 9 285K, 3200 MHz
377 Points +9%
AMD Ryzen 9 7900X
R9 7900X, 4700 MHz
371 Points +7%
AMD Ryzen 9 7950X
R9 7950X, 4500 MHz
366 Points +6%
AMD Ryzen 5 9600X
Ryzen 5 9600X, 3900 MHz
364 Points +5%
AMD Ryzen 5 7600X
R5 7600X, 4700 MHz
362 Points +5%
Intel Core i9-13900K
i9-13900K, 3000 MHz
361 Points +4%
Intel Core i5-14600K
i5-14600K, 3500 MHz
354 Points +2%
AMD Ryzen 7 7800X3D
R7 7800X3D, 4200 MHz
353 Points +2%
Intel Core Ultra 5 245K
Core Ultra 5 245K, 3600 MHz
346 Points
Intel Core i5-13600K
i5-13600K, 3500 MHz
333 Points -4%
Intel Core i9-12900K
i9-12900K, 3200 MHz
320 Points -8%
Intel Core i5-13400
i5-13400, 2500 MHz
306 Points -12%
Intel Core i5-12600K
i5-12600K, 2800 MHz
293 Points -15%
AMD Ryzen 9 5950X
R9 5950X, 3400 MHz
291 Points -16%
Intel Core i5-12400F
i5-12400F, 2500 MHz
272 Points -21%
Mozilla Kraken 1.1 - Total
Intel Core i5-12400F
i5-12400F, 2500 MHz
573 ms * -35%
AMD Ryzen 9 5950X
R9 5950X, 3400 MHz
558 ms * -31%
Intel Core i5-13400
i5-13400, 2500 MHz
535 ms * -26%
Intel Core i5-12600K
i5-12600K, 2800 MHz
511 ms * -20%
AMD Ryzen 7 7800X3D
R7 7800X3D, 4200 MHz
487 ms * -15%
Intel Core i9-12900K
i9-12900K, 3200 MHz
481 ms * -13%
Intel Core i5-13600K
i5-13600K, 3500 MHz
469 ms * -10%
Intel Core i5-14600K
i5-14600K, 3500 MHz
450 ms * -6%
AMD Ryzen 5 7600X
R5 7600X, 4700 MHz
441 ms * -4%
AMD Ryzen 9 7950X3D
R9 7950X3D, 4200 MHz
437 ms * -3%
AMD Ryzen 9 7950X
R9 7950X, 4500 MHz
433 ms * -2%
Intel Core i9-13900K
i9-13900K, 3000 MHz
432 ms * -2%
AMD Ryzen 9 7900X
R9 7900X, 4700 MHz
431 ms * -1%
Intel Core Ultra 5 245K
Core Ultra 5 245K, 3600 MHz
425 ms *
Intel Core i9-14900K
i9-14900K, 3200 MHz
418 ms * +2%
Intel Core Ultra 9 285K
Core Ultra 9 285K, 3200 MHz
396 ms * +7%
AMD Ryzen 5 9600X
Ryzen 5 9600X, 3900 MHz
389 ms * +8%
AMD Ryzen 7 9700X
Ryzen 7 9700X, 3800 MHz
383 ms * +10%
AMD Ryzen 9 9950X
Ryzen 9 9950X, 4300 MHz
377 ms * +11%
3DMark
1920x1080 Fire Strike Physics
Intel Core i9-14900K
i9-14900K, 3200 MHz
56087 Points +47%
Intel Core i9-13900K
i9-13900K, 3000 MHz
53853 Points +41%
Intel Core Ultra 9 285K
Core Ultra 9 285K, 3200 MHz
53194 Points +39%
AMD Ryzen 9 9950X
Ryzen 9 9950X, 4300 MHz
49522 Points +30%
AMD Ryzen 9 7950X3D
R9 7950X3D, 4200 MHz
44787 Points +17%
AMD Ryzen 9 7900X
R9 7900X, 4700 MHz
42682 Points +12%
AMD Ryzen 9 7950X
R9 7950X, 4500 MHz
42682 Points +12%
Intel Core i5-14600K
i5-14600K, 3500 MHz
40164 Points +5%
AMD Ryzen 9 5950X
R9 5950X, 3400 MHz
39600 Points +4%
Intel Core i9-12900K
i9-12900K, 3200 MHz
39112 Points +2%
Intel Core Ultra 5 245K
Core Ultra 5 245K, 3600 MHz
38202 Points
AMD Ryzen 7 9700X
Ryzen 7 9700X, 3800 MHz
38088 Points 0%
Intel Core i5-13600K
i5-13600K, 3500 MHz
35386 Points -7%
AMD Ryzen 5 9600X
Ryzen 5 9600X, 3900 MHz
33462 Points -12%
AMD Ryzen 7 7800X3D
R7 7800X3D, 4200 MHz
33345 Points -13%
AMD Ryzen 5 7600X
R5 7600X, 4700 MHz
30691 Points -20%
Intel Core i5-12600K
i5-12600K, 2800 MHz
29671 Points -22%
Intel Core i5-13400
i5-13400, 2500 MHz
27135 Points -29%
Intel Core i5-12400F
i5-12400F, 2500 MHz
24023 Points -37%
2560x1440 Time Spy CPU
Intel Core i9-14900K
i9-14900K, 3200 MHz
23721 Points +58%
Intel Core i9-13900K
i9-13900K, 3000 MHz
19392 Points +29%
Intel Core i5-14600K
i5-14600K, 3500 MHz
18768 Points +25%
Intel Core i9-12900K
i9-12900K, 3200 MHz
18431 Points +23%
Intel Core Ultra 9 285K
Core Ultra 9 285K, 3200 MHz
17911 Points +19%
AMD Ryzen 9 7950X3D
R9 7950X3D, 4200 MHz
17206 Points +15%
Intel Core i5-13600K
i5-13600K, 3500 MHz
17124 Points +14%
AMD Ryzen 9 7900X
R9 7900X, 4700 MHz
16616 Points +11%
AMD Ryzen 9 7950X
R9 7950X, 4500 MHz
16616 Points +11%
AMD Ryzen 9 9950X
Ryzen 9 9950X, 4300 MHz
16112 Points +7%
Intel Core Ultra 5 245K
Core Ultra 5 245K, 3600 MHz
15010 Points
AMD Ryzen 7 9700X
Ryzen 7 9700X, 3800 MHz
14306 Points -5%
AMD Ryzen 7 7800X3D
R7 7800X3D, 4200 MHz
14098 Points -6%
Intel Core i5-12600K
i5-12600K, 2800 MHz
13869 Points -8%
AMD Ryzen 9 5950X
R9 5950X, 3400 MHz
13650 Points -9%
Intel Core i5-13400
i5-13400, 2500 MHz
12948 Points -14%
AMD Ryzen 5 9600X
Ryzen 5 9600X, 3900 MHz
10821 Points -28%
AMD Ryzen 5 7600X
R5 7600X, 4700 MHz
10458 Points -30%
Intel Core i5-12400F
i5-12400F, 2500 MHz
9745 Points -35%
Super Pi mod 1.5 XS 1M - 1M
Intel Core i5-12400F
i5-12400F, 2500 MHz
8.298 s * -14%
Intel Core i5-13400
i5-13400, 2500 MHz
8.033 s * -10%
AMD Ryzen 5 9600X
Ryzen 5 9600X, 3900 MHz
7.614 s * -4%
AMD Ryzen 7 9700X
Ryzen 7 9700X, 3800 MHz
7.54 s * -3%
AMD Ryzen 5 7600X
R5 7600X, 4700 MHz
7.423 s * -2%
Intel Core i5-12600K
i5-12600K, 2800 MHz
7.406 s * -1%
AMD Ryzen 9 9950X
Ryzen 9 9950X, 4300 MHz
7.31 s * -0%
Intel Core Ultra 5 245K
Core Ultra 5 245K, 3600 MHz
7.303 s *
AMD Ryzen 7 7800X3D
R7 7800X3D, 4200 MHz
7.089 s * +3%
AMD Ryzen 9 5950X
R9 5950X, 3400 MHz
7.065 s * +3%
Intel Core i9-12900K
i9-12900K, 3200 MHz
7.063 s * +3%
Intel Core Ultra 9 285K
Core Ultra 9 285K, 3200 MHz
6.713 s * +8%
Intel Core i5-13600K
i5-13600K, 3500 MHz
6.58 s * +10%
Intel Core i5-14600K
i5-14600K, 3500 MHz
6.234 s * +15%
AMD Ryzen 9 7900X
R9 7900X, 4700 MHz
6.141 s * +16%
AMD Ryzen 9 7950X3D
R9 7950X3D, 4200 MHz
6.109 s * +16%
AMD Ryzen 9 7950X
R9 7950X, 4500 MHz
6.088 s * +17%
Intel Core i9-13900K
i9-13900K, 3000 MHz
5.655 s * +23%
Intel Core i9-14900K
i9-14900K, 3200 MHz
5.476 s * +25%
Super Pi mod 1.5 XS 2M - 2M
Intel Core i5-12400F
i5-12400F, 2500 MHz
18.473 s * -15%
Intel Core i5-13400
i5-13400, 2500 MHz
17.963 s * -12%
Intel Core i5-12600K
i5-12600K, 2800 MHz
16.42 s * -2%
AMD Ryzen 5 9600X
Ryzen 5 9600X, 3900 MHz
16.363 s * -2%
AMD Ryzen 7 9700X
Ryzen 7 9700X, 3800 MHz
16.1 s * -0%
Intel Core Ultra 5 245K
Core Ultra 5 245K, 3600 MHz
16.026 s *
AMD Ryzen 5 7600X
R5 7600X, 4700 MHz
15.954 s * -0%
AMD Ryzen 9 9950X
Ryzen 9 9950X, 4300 MHz
15.61 s * +3%
Intel Core i9-12900K
i9-12900K, 3200 MHz
15.59 s * +3%
AMD Ryzen 7 7800X3D
R7 7800X3D, 4200 MHz
15.335 s * +4%
AMD Ryzen 9 5950X
R9 5950X, 3400 MHz
15.28 s * +5%
Intel Core i5-13600K
i5-13600K, 3500 MHz
14.876 s * +7%
Intel Core Ultra 9 285K
Core Ultra 9 285K, 3200 MHz
14.64 s * +9%
Intel Core i5-14600K
i5-14600K, 3500 MHz
13.657 s * +15%
AMD Ryzen 9 7950X
R9 7950X, 4500 MHz
13.291 s * +17%
AMD Ryzen 9 7900X
R9 7900X, 4700 MHz
13.251 s * +17%
Intel Core i9-13900K
i9-13900K, 3000 MHz
13.193 s * +18%
AMD Ryzen 9 7950X3D
R9 7950X3D, 4200 MHz
13.189 s * +18%
Intel Core i9-14900K
i9-14900K, 3200 MHz
11.996 s * +25%

* ... im mniej tym lepiej

Cinebench R15
Cinebench R15
Cinebench R20
Cinebench R20
Cinebench R23
Cinebench R23
Cinebench 2024
Cinebench 2024

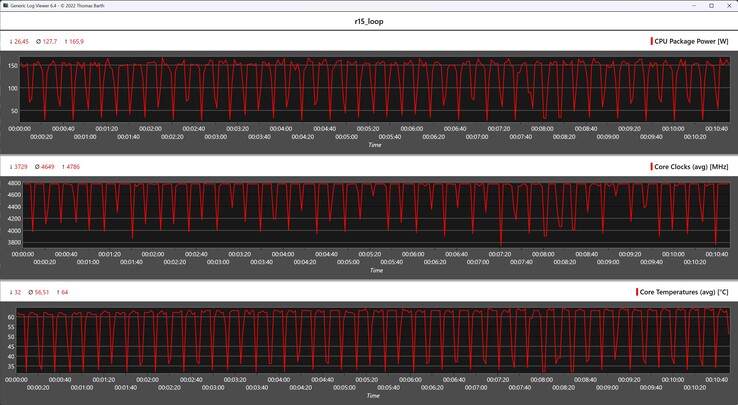
Intel Core Ultra 5 245K w wielopętli Cinebench R15

Intel Core Ultra 5 245K bez ograniczeń radzi sobie z ciągłą pętlą Cinebench R15. Szczytowe obciążenie na poziomie nieco poniżej 166 W występuje tylko przez krótki czas, choć średni pobór mocy procesora kształtuje się na poziomie 128 W w ciągu 50 przebiegów.

Dzięki naszemu wydajnemu układowi chłodzenia, temperatura procesora Intel Core Ultra 5 245K nie przekroczyła 64 °C podczas pracy.

Metryki procesora podczas pętli Cinebench R15
1723.61923.62123.62323.62523.62723.62923.63123.63323.63523.63723.63923.64123.64323.64523.64723.64923.65123.65323.65523.65723.65923.66123.66323.6Tooltip
Intel Core Ultra 5 245K Core Ultra 5 245K: Ø3788 (3746.72-3821.53)
Intel Core i9-13900K i9-13900K: Ø6182 (6045.95-6213.11)
NVIDIA GeForce RTX 3090 Founders Edition R9 7950X: Ø6154 (6136.85-6189.08)
Intel Core i5-13600K i5-13600K: Ø3620 (3607.83-3632.07)
AMD Ryzen 5 7600X R5 7600X: Ø2468 (2440.21-2487.56)
Intel Core i9-12900K i9-12900K: Ø3987 (3920.42-4037.55)
Intel Core i5-12600K i5-12600K: Ø2545 (2497.35-2570.36)
AMD Ryzen 7 7800X3D R7 7800X3D: Ø2967 (2917.15-3006.39)
AMD Ryzen 9 7900X R9 7900X: Ø4785 (4739.9-4829.17)
Intel Core i5-13400 i5-13400: Ø2328 (2286.5-2356.27)
Intel Core i5-12400F i5-12400F: Ø1754 (1723.62-1775.1)
AMD Ryzen 9 5950X R9 5950X: Ø4467 (4442.47-4510.09)
AMD Ryzen 9 7950X3D R9 7950X3D: Ø5942 (5923.29-5966.59)
Palit GeForce RTX 4090 GameRock OC i9-14900K: Ø6068 (5924.17-6110.6)
Intel Core i5-14600K i5-14600K: Ø3640 (3622.86-3654.64)
AMD Ryzen 5 9600X Ryzen 5 9600X: Ø2623 (2586.99-2654.28)
AMD Ryzen 9 9950X Ryzen 9 9950X: Ø6291 (6262.72-6335.13)

Syntetyczne testy porównawcze i wydajność aplikacji

W codziennym użytkowaniu Intel Core Ultra 5 245K radzi sobie równie dobrze jak pozostałe procesory z zestawienia porównawczego. Nie znajdziemy tutaj zauważalnych różnic, aczkolwiek wyniki Core Ultra 5 245K zdradzają jedynie miejsce w połowie stawki.

Wydajność Core i5-14600K nie może się równać, co jest nieco rozczarowujące po dokonaniu oceny.

PCMark 10 - Score
AMD Ryzen 9 9950X
10699 Points +14%
Intel Core i9-14900K
10101 Points +7%
AMD Ryzen 5 9600X
10060 Points +7%
AMD Ryzen 9 7900X
9911 Points +5%
AMD Ryzen 9 7950X
9911 Points +5%
Intel Core i9-13900K
9788 Points +4%
Intel Core i5-14600K
9587 Points +2%
AMD Ryzen 7 7800X3D
9500 Points +1%
AMD Ryzen 5 7600X
9470 Points +1%
Intel Core Ultra 5 245K
9409 Points
Intel Core i5-13600K
9362 Points 0%
AMD Ryzen 9 5950X
8778 Points -7%
Intel Core i5-13400
8614 Points -8%
Intel Core i9-12900K
8604 Points -9%
Intel Core i5-12600K
8259 Points -12%
Intel Core i5-12400F
7756 Points -18%
CrossMark - Overall
Intel Core i9-14900K
2611 Points +16%
Intel Core i9-13900K
2589 Points +15%
AMD Ryzen 9 7950X
2512 Points +12%
AMD Ryzen 9 9950X
2451 Points +9%
AMD Ryzen 9 7900X
2405 Points +7%
Intel Core i5-14600K
2310 Points +3%
Intel Core i5-13600K
2271 Points +1%
Intel Core Ultra 5 245K
2245 Points
AMD Ryzen 5 7600X
2236 Points 0%
AMD Ryzen 7 7800X3D
2216 Points -1%
AMD Ryzen 9 7950X3D
2193 Points -2%
AMD Ryzen 5 9600X
2103 Points -6%
Intel Core i5-13400
1877 Points -16%
Intel Core i5-12400F
1762 Points -22%
AMD Ryzen 9 5950X
1495 Points -33%
Blender
v2.79 BMW27 CPU
Intel Core i5-12400F
269 Seconds * -98%
Intel Core i5-13400
206 Seconds * -51%
AMD Ryzen 5 7600X
203 Seconds * -49%
Intel Core i5-12600K
189.5 Seconds * -39%
AMD Ryzen 5 9600X
184 Seconds * -35%
AMD Ryzen 7 7800X3D
169 Seconds * -24%
Intel Core Ultra 5 245K
136 Seconds *
Intel Core i5-13600K
135 Seconds * +1%
Intel Core i5-14600K
134 Seconds * +1%
Intel Core i9-12900K
121.1 Seconds * +11%
AMD Ryzen 9 5950X
112.8 Seconds * +17%
AMD Ryzen 9 7900X
106 Seconds * +22%
AMD Ryzen 9 7950X3D
86 Seconds * +37%
AMD Ryzen 9 7950X
85 Seconds * +37%
Intel Core i9-13900K
80 Seconds * +41%
Intel Core i9-14900K
80 Seconds * +41%
AMD Ryzen 9 9950X
77 Seconds * +43%
v3.3 Classroom CPU
Intel Core i5-12400F
430 Seconds * -99%
Intel Core i5-13400
336 Seconds * -56%
AMD Ryzen 5 9600X
289 Seconds * -34%
AMD Ryzen 7 7800X3D
266 Seconds * -23%
Intel Core i5-13600K
224 Seconds * -4%
Intel Core i5-14600K
223 Seconds * -3%
Intel Core Ultra 5 245K
216 Seconds *
Intel Core i9-13900K
138 Seconds * +36%
Intel Core i9-14900K
135 Seconds * +37%
AMD Ryzen 9 7950X3D
133 Seconds * +38%
AMD Ryzen 9 9950X
118 Seconds * +45%

* ... im mniej tym lepiej

Performance Rating - Percent
AMD Ryzen 5 9600X
NVIDIA GeForce RTX 4090
97.9 pt
Intel Core i9-14900K
NVIDIA GeForce RTX 4090
97 pt
Intel Core i5-14600K
NVIDIA GeForce RTX 4090
96.2 pt
Intel Core i7-13700K
NVIDIA GeForce RTX 4090
95.6 pt
AMD Ryzen 7 7800X3D
NVIDIA GeForce RTX 4090
95.1 pt
AMD Ryzen 9 7950X3D
NVIDIA GeForce RTX 4090
95.1 pt
AMD Ryzen 9 7950X
NVIDIA GeForce RTX 4090
95.1 pt
Intel Core i7-13700
NVIDIA GeForce RTX 4090
94.7 pt
Intel Core Ultra 9 285K
NVIDIA GeForce RTX 4090
91.1 pt
Intel Core i7-12700
NVIDIA GeForce RTX 4090
91 pt
Intel Core Ultra 5 245K
NVIDIA GeForce RTX 4090
90.8 pt
Intel Core i5-13400
NVIDIA GeForce RTX 4090
88.7 pt
3DMark 11 - 1280x720 Performance GPU
AMD Ryzen 7 7800X3D
NVIDIA GeForce RTX 4090
114641 Points +9%
Intel Core i5-14600K
NVIDIA GeForce RTX 4090
110994 Points +6%
AMD Ryzen 9 7950X
NVIDIA GeForce RTX 4090
107723 Points +3%
Intel Core i7-13700K
NVIDIA GeForce RTX 4090
107060 Points +2%
AMD Ryzen 9 7950X3D
NVIDIA GeForce RTX 4090
105886 Points +1%
Intel Core i7-13700
NVIDIA GeForce RTX 4090
105473 Points +1%
Intel Core i9-14900K
NVIDIA GeForce RTX 4090
104998 Points 0%
Intel Core i7-12700
NVIDIA GeForce RTX 4090
104876 Points 0%
Intel Core Ultra 5 245K
NVIDIA GeForce RTX 4090
104781 Points
Intel Core i5-13400
NVIDIA GeForce RTX 4090
104598 Points 0%
AMD Ryzen 5 9600X
NVIDIA GeForce RTX 4090
104516 Points 0%
Intel Core Ultra 9 285K
NVIDIA GeForce RTX 4090
97005 Points -7%
3DMark
2560x1440 Time Spy Graphics
Intel Core i5-14600K
NVIDIA GeForce RTX 4090
37769 Points +3%
Intel Core i9-14900K
NVIDIA GeForce RTX 4090
37762 Points +3%
AMD Ryzen 7 7800X3D
NVIDIA GeForce RTX 4090
37664 Points +2%
AMD Ryzen 5 9600X
NVIDIA GeForce RTX 4090
37161 Points +1%
Intel Core i7-13700K
NVIDIA GeForce RTX 4090
37109 Points +1%
Intel Core i7-13700
NVIDIA GeForce RTX 4090
37106 Points +1%
AMD Ryzen 9 7950X
NVIDIA GeForce RTX 4090
36836 Points 0%
Intel Core Ultra 5 245K
NVIDIA GeForce RTX 4090
36813 Points
AMD Ryzen 9 7950X3D
NVIDIA GeForce RTX 4090
36665 Points 0%
Intel Core Ultra 9 285K
NVIDIA GeForce RTX 4090
36172 Points -2%
Intel Core i7-12700
NVIDIA GeForce RTX 4090
34580 Points -6%
Intel Core i5-13400
NVIDIA GeForce RTX 4090
33624 Points -9%
1920x1080 Fire Strike Graphics
Intel Core i5-14600K
NVIDIA GeForce RTX 4090
86031 Points +10%
Intel Core i7-12700
NVIDIA GeForce RTX 4090
79398 Points +2%
Intel Core i7-13700K
NVIDIA GeForce RTX 4090
79091 Points +1%
Intel Core i7-13700
NVIDIA GeForce RTX 4090
78878 Points +1%
AMD Ryzen 5 9600X
NVIDIA GeForce RTX 4090
78579 Points +1%
Intel Core Ultra 5 245K
NVIDIA GeForce RTX 4090
78079 Points
Intel Core i5-13400
NVIDIA GeForce RTX 4090
77224 Points -1%
AMD Ryzen 7 7800X3D
NVIDIA GeForce RTX 4090
73447 Points -6%
AMD Ryzen 9 7950X3D
NVIDIA GeForce RTX 4090
72901 Points -7%
AMD Ryzen 9 7950X
NVIDIA GeForce RTX 4090
72678 Points -7%
Intel Core i9-14900K
NVIDIA GeForce RTX 4090
70971 Points -9%
Intel Core Ultra 9 285K
NVIDIA GeForce RTX 4090
55924 Points -28%
3840x2160 Fire Strike Ultra Graphics
AMD Ryzen 7 7800X3D
NVIDIA GeForce RTX 4090
25571 Points +2%
Intel Core i5-14600K
NVIDIA GeForce RTX 4090
25342 Points +1%
Intel Core i7-13700
NVIDIA GeForce RTX 4090
25254 Points +1%
Intel Core i9-14900K
NVIDIA GeForce RTX 4090
25209 Points 0%
Intel Core i7-13700K
NVIDIA GeForce RTX 4090
25187 Points 0%
Intel Core Ultra 5 245K
NVIDIA GeForce RTX 4090
25088 Points
Intel Core i5-13400
NVIDIA GeForce RTX 4090
25052 Points 0%
AMD Ryzen 9 7950X
NVIDIA GeForce RTX 4090
25018 Points 0%
AMD Ryzen 9 7950X3D
NVIDIA GeForce RTX 4090
24969 Points 0%
AMD Ryzen 5 9600X
NVIDIA GeForce RTX 4090
24915 Points -1%
Intel Core i7-12700
NVIDIA GeForce RTX 4090
24669 Points -2%
Intel Core Ultra 9 285K
NVIDIA GeForce RTX 4090
24376 Points -3%
Unigine Superposition
1280x720 720p Low
AMD Ryzen 5 9600X
NVIDIA GeForce RTX 4090
63603 Points +59%
Intel Core i9-14900K
NVIDIA GeForce RTX 4090
57174 Points +43%
AMD Ryzen 7 7800X3D
NVIDIA GeForce RTX 4090
56805 Points +42%
AMD Ryzen 9 7950X
NVIDIA GeForce RTX 4090
51741 Points +29%
Intel Core i7-13700K
NVIDIA GeForce RTX 4090
51443 Points +28%
AMD Ryzen 9 7950X3D
NVIDIA GeForce RTX 4090
50990 Points +27%
Intel Core i7-13700
NVIDIA GeForce RTX 4090
50107 Points +25%
Intel Core i5-14600K
NVIDIA GeForce RTX 4090
49203 Points +23%
Intel Core Ultra 9 285K
NVIDIA GeForce RTX 4090
44723 Points +11%
Intel Core i7-12700
NVIDIA GeForce RTX 4090
40758 Points +2%
Intel Core Ultra 5 245K
NVIDIA GeForce RTX 4090
40122 Points
Intel Core i5-13400
NVIDIA GeForce RTX 4090
35207 Points -12%
1920x1080 1080p High
Intel Core i9-14900K
NVIDIA GeForce RTX 4090
50399 Points +37%
AMD Ryzen 5 9600X
NVIDIA GeForce RTX 4090
50230 Points +37%
AMD Ryzen 7 7800X3D
NVIDIA GeForce RTX 4090
49328 Points +34%
AMD Ryzen 9 7950X
NVIDIA GeForce RTX 4090
46814 Points +27%
Intel Core i7-13700K
NVIDIA GeForce RTX 4090
46385 Points +26%
AMD Ryzen 9 7950X3D
NVIDIA GeForce RTX 4090
46052 Points +25%
Intel Core i7-13700
NVIDIA GeForce RTX 4090
45368 Points +23%
Intel Core i5-14600K
NVIDIA GeForce RTX 4090
45162 Points +23%
Intel Core Ultra 9 285K
NVIDIA GeForce RTX 4090
41496 Points +13%
Intel Core i7-12700
NVIDIA GeForce RTX 4090
37819 Points +3%
Intel Core Ultra 5 245K
NVIDIA GeForce RTX 4090
36786 Points
Intel Core i5-13400
NVIDIA GeForce RTX 4090
32711 Points -11%
1920x1080 1080p Extreme
AMD Ryzen 7 7800X3D
NVIDIA GeForce RTX 4090
22618 Points +4%
Intel Core Ultra 9 285K
NVIDIA GeForce RTX 4090
22319 Points +3%
Intel Core i5-14600K
NVIDIA GeForce RTX 4090
21954 Points +1%
Intel Core i9-14900K
NVIDIA GeForce RTX 4090
21920 Points +1%
AMD Ryzen 9 7950X3D
NVIDIA GeForce RTX 4090
21913 Points +1%
AMD Ryzen 9 7950X
NVIDIA GeForce RTX 4090
21824 Points +1%
Intel Core i7-13700
NVIDIA GeForce RTX 4090
21808 Points 0%
Intel Core i7-13700K
NVIDIA GeForce RTX 4090
21744 Points 0%
Intel Core Ultra 5 245K
NVIDIA GeForce RTX 4090
21706 Points
Intel Core i5-13400
NVIDIA GeForce RTX 4090
21646 Points 0%
Intel Core i7-12700
NVIDIA GeForce RTX 4090
21615 Points 0%
AMD Ryzen 5 9600X
NVIDIA GeForce RTX 4090
21586 Points -1%
3840x2160 4k Optimized
AMD Ryzen 9 7950X
NVIDIA GeForce RTX 4090
33943 Points +6%
Intel Core i9-14900K
NVIDIA GeForce RTX 4090
33885 Points +5%
AMD Ryzen 9 7950X3D
NVIDIA GeForce RTX 4090
33883 Points +5%
Intel Core i7-13700
NVIDIA GeForce RTX 4090
33765 Points +5%
Intel Core i7-13700K
NVIDIA GeForce RTX 4090
33719 Points +5%
Intel Core i5-14600K
NVIDIA GeForce RTX 4090
33700 Points +5%
AMD Ryzen 7 7800X3D
NVIDIA GeForce RTX 4090
33601 Points +4%
AMD Ryzen 5 9600X
NVIDIA GeForce RTX 4090
33095 Points +3%
Intel Core Ultra 9 285K
NVIDIA GeForce RTX 4090
33051 Points +3%
Intel Core i7-12700
NVIDIA GeForce RTX 4090
32608 Points +1%
Intel Core Ultra 5 245K
NVIDIA GeForce RTX 4090
32169 Points
Intel Core i5-13400
NVIDIA GeForce RTX 4090
30877 Points -4%
7680x4320 8k Optimized
AMD Ryzen 9 7950X3D
NVIDIA GeForce RTX 4090
13105 Points +3%
AMD Ryzen 9 7950X
NVIDIA GeForce RTX 4090
13082 Points +3%
Intel Core i7-13700
NVIDIA GeForce RTX 4090
13081 Points +3%
Intel Core i7-13700K
NVIDIA GeForce RTX 4090
13078 Points +3%
Intel Core i7-12700
NVIDIA GeForce RTX 4090
13070 Points +3%
Intel Core i5-13400
NVIDIA GeForce RTX 4090
13011 Points +2%
Intel Core i9-14900K
NVIDIA GeForce RTX 4090
12845 Points +1%
Intel Core i5-14600K
NVIDIA GeForce RTX 4090
12791 Points +1%
AMD Ryzen 7 7800X3D
NVIDIA GeForce RTX 4090
12770 Points 0%
Intel Core Ultra 5 245K
NVIDIA GeForce RTX 4090
12714 Points
Intel Core Ultra 9 285K
NVIDIA GeForce RTX 4090
12705 Points 0%
AMD Ryzen 5 9600X
NVIDIA GeForce RTX 4090
12498 Points -2%
Unigine Valley 1.0
1920x1080 Extreme HD DirectX AA:x8
AMD Ryzen 5 9600X
NVIDIA GeForce RTX 4090
324 fps +31%
Intel Core i9-14900K
NVIDIA GeForce RTX 4090
305.2 fps +24%
Intel Core i5-14600K
NVIDIA GeForce RTX 4090
283.4 fps +15%
AMD Ryzen 9 7950X3D
NVIDIA GeForce RTX 4090
277.2 fps +12%
Intel Core i7-13700K
NVIDIA GeForce RTX 4090
273.9 fps +11%
AMD Ryzen 9 7950X
NVIDIA GeForce RTX 4090
270.7 fps +10%
Intel Core i7-13700
NVIDIA GeForce RTX 4090
266.6 fps +8%
Intel Core Ultra 9 285K
NVIDIA GeForce RTX 4090
264 fps +7%
AMD Ryzen 7 7800X3D
NVIDIA GeForce RTX 4090
246.7 fps 0%
Intel Core Ultra 5 245K
NVIDIA GeForce RTX 4090
246.6 fps
Intel Core i7-12700
NVIDIA GeForce RTX 4090
238.4 fps -3%
Intel Core i5-13400
NVIDIA GeForce RTX 4090
226.2 fps -8%
1920x1080 Extreme HD Preset OpenGL AA:x8
AMD Ryzen 5 9600X
NVIDIA GeForce RTX 4090
331.8 fps +28%
Intel Core i9-14900K
NVIDIA GeForce RTX 4090
322.2 fps +24%
Intel Core i7-13700K
NVIDIA GeForce RTX 4090
305.7 fps +18%
Intel Core i5-14600K
NVIDIA GeForce RTX 4090
303.2 fps +17%
AMD Ryzen 9 7950X3D
NVIDIA GeForce RTX 4090
295.4 fps +14%
Intel Core i7-13700
NVIDIA GeForce RTX 4090
293.1 fps +13%
AMD Ryzen 9 7950X
NVIDIA GeForce RTX 4090
288 fps +11%
Intel Core Ultra 9 285K
NVIDIA GeForce RTX 4090
278.9 fps +7%
AMD Ryzen 7 7800X3D
NVIDIA GeForce RTX 4090
260.9 fps 0%
Intel Core Ultra 5 245K
NVIDIA GeForce RTX 4090
259.8 fps
Intel Core i7-12700
NVIDIA GeForce RTX 4090
258.5 fps -1%
Intel Core i5-13400
NVIDIA GeForce RTX 4090
242.8 fps -7%
Unigine Heaven 4.0
Extreme Preset OpenGL
AMD Ryzen 5 9600X
NVIDIA GeForce RTX 4090
472.4 fps +9%
Intel Core i9-14900K
NVIDIA GeForce RTX 4090
465.1 fps +7%
AMD Ryzen 9 7950X3D
NVIDIA GeForce RTX 4090
458.2 fps +6%
Intel Core i7-13700K
NVIDIA GeForce RTX 4090
456.9 fps +5%
Intel Core i5-14600K
NVIDIA GeForce RTX 4090
456.3 fps +5%
AMD Ryzen 9 7950X
NVIDIA GeForce RTX 4090
450.4 fps +4%
Intel Core i7-13700
NVIDIA GeForce RTX 4090
450.4 fps +4%
Intel Core Ultra 9 285K
NVIDIA GeForce RTX 4090
447.7 fps +3%
AMD Ryzen 7 7800X3D
NVIDIA GeForce RTX 4090
442.4 fps +2%
Intel Core i7-12700
NVIDIA GeForce RTX 4090
433.8 fps 0%
Intel Core Ultra 5 245K
NVIDIA GeForce RTX 4090
433.8 fps
Intel Core i5-13400
NVIDIA GeForce RTX 4090
420 fps -3%
Extreme Preset DX11
AMD Ryzen 9 7950X3D
NVIDIA GeForce RTX 4090
492.5 fps +12%
AMD Ryzen 9 7950X
NVIDIA GeForce RTX 4090
491.5 fps +12%
Intel Core i9-14900K
NVIDIA GeForce RTX 4090
483.7 fps +10%
AMD Ryzen 5 9600X
NVIDIA GeForce RTX 4090
473.9 fps +8%
Intel Core i7-13700K
NVIDIA GeForce RTX 4090
473.8 fps +8%
Intel Core i5-14600K
NVIDIA GeForce RTX 4090
473 fps +7%
AMD Ryzen 7 7800X3D
NVIDIA GeForce RTX 4090
463.8 fps +5%
Intel Core i7-13700
NVIDIA GeForce RTX 4090
462.5 fps +5%
Intel Core Ultra 9 285K
NVIDIA GeForce RTX 4090
462.4 fps +5%
Intel Core Ultra 5 245K
NVIDIA GeForce RTX 4090
440.5 fps
Intel Core i7-12700
NVIDIA GeForce RTX 4090
435.2 fps -1%
Intel Core i5-13400
NVIDIA GeForce RTX 4090
416.6 fps -5%
ComputeMark v2.1
1024x600 Normal, Score
Intel Core i5-14600K
NVIDIA GeForce RTX 4090
92397 Points +2%
AMD Ryzen 5 9600X
NVIDIA GeForce RTX 4090
92222 Points +2%
AMD Ryzen 9 7950X
NVIDIA GeForce RTX 4090
92171 Points +2%
Intel Core i9-14900K
NVIDIA GeForce RTX 4090
92026 Points +2%
Intel Core i7-13700K
NVIDIA GeForce RTX 4090
92009 Points +2%
AMD Ryzen 9 7950X3D
NVIDIA GeForce RTX 4090
91838 Points +1%
Intel Core i7-12700
NVIDIA GeForce RTX 4090
91703 Points +1%
AMD Ryzen 7 7800X3D
NVIDIA GeForce RTX 4090
91665 Points +1%
Intel Core i5-13400
NVIDIA GeForce RTX 4090
91659 Points +1%
Intel Core i7-13700
NVIDIA GeForce RTX 4090
91616 Points +1%
Intel Core Ultra 9 285K
NVIDIA GeForce RTX 4090
90932 Points 0%
Intel Core Ultra 5 245K
NVIDIA GeForce RTX 4090
90595 Points
1024x600 Normal, Fluid 3DTex
AMD Ryzen 7 7800X3D
NVIDIA GeForce RTX 4090
10875 Points +5%
Intel Core i7-13700K
NVIDIA GeForce RTX 4090
10805 Points +4%
Intel Core i5-14600K
NVIDIA GeForce RTX 4090
10797 Points +4%
AMD Ryzen 9 7950X3D
NVIDIA GeForce RTX 4090
10778 Points +4%
Intel Core i7-13700
NVIDIA GeForce RTX 4090
10759 Points +3%
Intel Core i5-13400
NVIDIA GeForce RTX 4090
10756 Points +3%
AMD Ryzen 5 9600X
NVIDIA GeForce RTX 4090
10756 Points +3%
Intel Core i7-12700
NVIDIA GeForce RTX 4090
10749 Points +3%
AMD Ryzen 9 7950X
NVIDIA GeForce RTX 4090
10724 Points +3%
Intel Core i9-14900K
NVIDIA GeForce RTX 4090
10715 Points +3%
Intel Core Ultra 9 285K
NVIDIA GeForce RTX 4090
10584 Points +2%
Intel Core Ultra 5 245K
NVIDIA GeForce RTX 4090
10396 Points
1024x600 Normal, Fluid 2DTexArr
AMD Ryzen 5 9600X
NVIDIA GeForce RTX 4090
6948 Points +1%
Intel Core i9-14900K
NVIDIA GeForce RTX 4090
6940 Points +1%
Intel Core i5-14600K
NVIDIA GeForce RTX 4090
6920 Points 0%
Intel Core i7-13700K
NVIDIA GeForce RTX 4090
6914 Points 0%
Intel Core Ultra 9 285K
NVIDIA GeForce RTX 4090
6895 Points 0%
Intel Core Ultra 5 245K
NVIDIA GeForce RTX 4090
6892 Points
AMD Ryzen 9 7950X
NVIDIA GeForce RTX 4090
6891 Points 0%
Intel Core i7-12700
NVIDIA GeForce RTX 4090
6891 Points 0%
Intel Core i7-13700
NVIDIA GeForce RTX 4090
6891 Points 0%
AMD Ryzen 9 7950X3D
NVIDIA GeForce RTX 4090
6887 Points 0%
AMD Ryzen 7 7800X3D
NVIDIA GeForce RTX 4090
6887 Points 0%
Intel Core i5-13400
NVIDIA GeForce RTX 4090
6879 Points 0%
1024x600 Normal, Mandel Vector
Intel Core i5-14600K
NVIDIA GeForce RTX 4090
17355 Points +2%
AMD Ryzen 9 7950X
NVIDIA GeForce RTX 4090
17336 Points +2%
AMD Ryzen 5 9600X
NVIDIA GeForce RTX 4090
17307 Points +1%
Intel Core i9-14900K
NVIDIA GeForce RTX 4090
17302 Points +1%
AMD Ryzen 9 7950X3D
NVIDIA GeForce RTX 4090
17301 Points +1%
Intel Core i7-13700K
NVIDIA GeForce RTX 4090
17250 Points +1%
Intel Core Ultra 9 285K
NVIDIA GeForce RTX 4090
17212 Points +1%
Intel Core i7-13700
NVIDIA GeForce RTX 4090
17207 Points +1%
Intel Core i7-12700
NVIDIA GeForce RTX 4090
17196 Points +1%
AMD Ryzen 7 7800X3D
NVIDIA GeForce RTX 4090
17156 Points 0%
Intel Core i5-13400
NVIDIA GeForce RTX 4090
17154 Points 0%
Intel Core Ultra 5 245K
NVIDIA GeForce RTX 4090
17075 Points
1024x600 Normal, Mandel Scalar
Intel Core i5-14600K
NVIDIA GeForce RTX 4090
22992 Points +2%
Intel Core i9-14900K
NVIDIA GeForce RTX 4090
22976 Points +2%
AMD Ryzen 7 7800X3D
NVIDIA GeForce RTX 4090
22926 Points +2%
AMD Ryzen 9 7950X
NVIDIA GeForce RTX 4090
22889 Points +2%
Intel Core i7-13700K
NVIDIA GeForce RTX 4090
22862 Points +1%
AMD Ryzen 5 9600X
NVIDIA GeForce RTX 4090
22843 Points +1%
Intel Core i7-12700
NVIDIA GeForce RTX 4090
22834 Points +1%
AMD Ryzen 9 7950X3D
NVIDIA GeForce RTX 4090
22834 Points +1%
Intel Core i7-13700
NVIDIA GeForce RTX 4090
22825 Points +1%
Intel Core i5-13400
NVIDIA GeForce RTX 4090
22813 Points +1%
Intel Core Ultra 5 245K
NVIDIA GeForce RTX 4090
22542 Points
Intel Core Ultra 9 285K
NVIDIA GeForce RTX 4090
22528 Points 0%
1024x600 Normal, QJuliaRayTrace
AMD Ryzen 5 9600X
NVIDIA GeForce RTX 4090
34367 Points +2%
Intel Core i5-14600K
NVIDIA GeForce RTX 4090
34333 Points +2%
AMD Ryzen 9 7950X
NVIDIA GeForce RTX 4090
34332 Points +2%
Intel Core i7-13700K
NVIDIA GeForce RTX 4090
34178 Points +1%
Intel Core i9-14900K
NVIDIA GeForce RTX 4090
34092 Points +1%
Intel Core i5-13400
NVIDIA GeForce RTX 4090
34057 Points +1%
AMD Ryzen 9 7950X3D
NVIDIA GeForce RTX 4090
34038 Points +1%
Intel Core i7-12700
NVIDIA GeForce RTX 4090
34033 Points +1%
Intel Core i7-13700
NVIDIA GeForce RTX 4090
33935 Points +1%
AMD Ryzen 7 7800X3D
NVIDIA GeForce RTX 4090
33822 Points 0%
Intel Core Ultra 5 245K
NVIDIA GeForce RTX 4090
33724 Points
Intel Core Ultra 9 285K
NVIDIA GeForce RTX 4090
33713 Points 0%

Moc NPU

Intel Core Ultra 5 245K jest wyposażony w jednostkę przetwarzania neuronowego (NPU), która może szczególnie wydajnie obliczać aplikacje AI jako oddzielna część procesora.

Rdzeń jest tym samym NPU, który jest już używany w procesorach Meteor Lake w laptopach i mini PC o określonej mocy obliczeniowej 13 TOPS. Niemniej jednak Core Ultra 5 245K może zapewnić większą wydajność niż mobilne odgałęzienia tej samej firmy.

Dopiero okaże się, w jakim stopniu integracja NPU stanie się ważniejsza w przyszłości. Jednak w porównaniu wydajności z nowoczesnymi kartami graficznymi, procesory NPU nie mają szans.

UL Procyon for Windows / Overall Score Integer NPU
Intel Core Ultra 5 245K
Intel Core Ultra 5 245K, NVIDIA GeForce RTX 4090
672 Points
Intel Core Ultra 9 285K
Intel Core Ultra 9 285K, NVIDIA GeForce RTX 4090
672 Points 0%
Asus NUC 14 Pro
Intel Core Ultra 5 125H, Arc 7-Core
508 Points -24%
Khadas Mind 2
Intel Core Ultra 7 155H, Arc 8-Core
504 Points -25%
Minisforum UH125 Pro
Intel Core Ultra 5 125H, Arc 7-Core
501 Points -25%
Acemagic F2A
Intel Core Ultra 7 155H, Arc 8-Core
499 Points -26%

Testy porównawcze gier

Niestety, wzrost wydajności, który zaobserwowaliśmy w testach porównawczych procesora, nie może zostać przełożony na lepszą wydajność w grach. W skrócie: Intel Core Ultra 5 245K jest znacznie wolniejszy niż Intel Core i5-14600K.

Ale po kolei: Kiedyś podzieliliśmy benchmarki gamingowe na dwie sekcje. Użytą kartą graficzną była Palit GeForce RTX 4090 GameRock OC w obu przypadkach.

W pierwszym porównaniu przyjrzymy się wydajności w limicie CPU. Tutaj nasza próbka testowa plasuje się tylko w dolnej trzeciej i pojedynkuje się z Intel Core i7-12700. Core Ultra 5 245K brakuje dokładnie 20 procent w porównaniu do Intel Core i5-14600K. To otrzeźwiający wynik, którego się nie spodziewaliśmy.

Obecny topowy model AMD w sektorze gier zapewnia prawie 50% wyższą wydajność. Ustawienia te nie są jednak reprezentatywne i nie odzwierciedlają codziennego użytkowania.

Po drugie, pozwoliliśmy wszystkim procesorom rywalizować w rozdzielczości 2160p przy maksymalnych detalach. Wszyscy przedstawiciele są bliżej siebie, czego należało się spodziewać, ponieważ karta graficzna jest teraz decydującym czynnikiem, co zbliża nas do limitu GPU.

Niemniej jednak Intel Core Ultra 5 245K udaje się wyprzedzić swojego wewnętrznego przeciwnika, Intel Core i5-14600K. Deficyt wydajności wynosi średnio siedem procent.

Performance comparison in CPU limit

Performance Rating - Percent
AMD Ryzen 7 7800X3D
99 pt
AMD Ryzen 9 7950X3D
91.5 pt
Intel Core i9-14900K
90.7 pt
AMD Ryzen 5 9600X
87.2 pt
AMD Ryzen 9 7950X
85.4 pt
AMD Ryzen 5 7600X
83.9 pt
Intel Core i9-13900K
83.7 pt
Intel Core i5-14600K
79.6 pt
Intel Core i7-13700K
77.5 pt
Intel Core i7-13700
76.8 pt
Intel Core Ultra 9 285K
73.5 pt
Intel Core Ultra 5 245K
66.5 pt
Intel Core i7-12700
65.9 pt
Intel Core i5-13400
57.7 pt
Intel Core i5-12400F
56.5 pt
F1 22 - 1920x1080 Low Preset AA:T AF:16x
AMD Ryzen 7 7800X3D
533 (380min, 288P1 - 637max) fps +71%
AMD Ryzen 9 7950X3D
475 (338min, 264P1 - 542max) fps +53%
Intel Core i9-14900K
462 (309min, 256P1 - 558max) fps +49%
AMD Ryzen 9 7950X
443 (278min, 245P1 - 521max) fps +42%
AMD Ryzen 5 9600X
439 (256min, 238P1 - 510max) fps +41%
AMD Ryzen 5 7600X
417 (281min, 236P1 - 488max) fps +34%
Intel Core i9-13900K
401 (265min, 222P1 - 463max) fps +29%
Intel Core i7-13700K
380 (280min, 217P1 - 437max) fps +22%
Intel Core i5-14600K
379 (280min, 225P1 - 455max) fps +22%
Intel Core i7-13700
378 (244min, 212P1 - 430max) fps +22%
Intel Core Ultra 9 285K
354 (237min, 199P1 - 414max) fps +14%
Intel Core i7-12700
313 (235min, 185P1 - 364max) fps +1%
Intel Core Ultra 5 245K
311 (242min, 180P1 - 346max) fps
Intel Core i5-12400F
271 (200min, 165P1 - 305max) fps -13%
Intel Core i5-13400
249 (197min, 152P1 - 284max) fps -20%
Far Cry 5 - 1280x720 Low Preset AA:T
AMD Ryzen 7 7800X3D
344 (220min - 464max) fps +69%
AMD Ryzen 9 7950X3D
299 (201min - 390max) fps +47%
Intel Core i9-14900K
280 (214min - 355max) fps +37%
Intel Core i9-13900K
270 (203min - 349max) fps +32%
AMD Ryzen 5 9600X
263 (201min - 342max) fps +29%
Intel Core i5-14600K
255 (199min - 343max) fps +25%
Intel Core i7-13700K
242 (183min - 317max) fps +19%
AMD Ryzen 5 7600X
241 (180min - 334max) fps +18%
AMD Ryzen 9 7950X
238 (182min - 313max) fps +17%
Intel Core i7-13700
232 (161min - 306max) fps +14%
Intel Core Ultra 9 285K
213 (169min - 274max) fps +4%
Intel Core i7-12700
204 (156min - 270max) fps 0%
Intel Core Ultra 5 245K
204 (149min - 271max) fps
Intel Core i5-13400
185 (144min - 241max) fps -9%
Intel Core i5-12400F
173 (124min - 232max) fps -15%
X-Plane 11.11 - 1280x720 low (fps_test=1)
Intel Core i9-13900K
245 fps +90%
AMD Ryzen 5 9600X
245 fps +90%
Intel Core i9-14900K
244 fps +89%
Intel Core i5-14600K
228 fps +77%
AMD Ryzen 9 7950X3D
225 fps +74%
Intel Core i7-13700K
224 fps +74%
AMD Ryzen 9 7950X
223 fps +73%
AMD Ryzen 7 7800X3D
219 fps +70%
Intel Core i7-13700
218 fps +69%
AMD Ryzen 5 7600X
217 fps +68%
Intel Core i7-12700
181.4 fps +41%
Intel Core i5-13400
155.7 fps +21%
Intel Core Ultra 9 285K
143.4 fps +11%
Intel Core Ultra 5 245K
129.1 fps
Intel Core i5-12400F
113 fps -12%
Final Fantasy XV Benchmark - 1280x720 Lite Quality
AMD Ryzen 5 9600X
237 fps +1%
Intel Core i9-13900K
236 fps 0%
AMD Ryzen 9 7950X
236 fps 0%
AMD Ryzen 5 7600X
236 fps 0%
Intel Core i7-13700
236 fps 0%
Intel Core i7-13700K
236 fps 0%
AMD Ryzen 7 7800X3D
236 fps 0%
Intel Core i5-14600K
236 fps 0%
Intel Core Ultra 9 285K
236 fps 0%
Intel Core i9-14900K
235 fps 0%
Intel Core Ultra 5 245K
235 fps
AMD Ryzen 9 7950X3D
234 fps 0%
Intel Core i7-12700
232 fps -1%
Intel Core i5-12400F
217 fps -8%
Intel Core i5-13400
217 fps -8%
Dota 2 Reborn - 1280x720 min (0/3) fastest
AMD Ryzen 7 7800X3D
322.9 (268min) fps +51%
AMD Ryzen 9 7950X3D
314.1 (261.7min) fps +47%
AMD Ryzen 9 7950X
310.6 (261.3min) fps +45%
Intel Core i9-14900K
299.9 (248.4min) fps +40%
Intel Core i9-13900K
294 (254.9min) fps +38%
AMD Ryzen 5 9600X
291 (244.2min) fps +36%
AMD Ryzen 5 7600X
278.1 (211.4min) fps +30%
Intel Core i5-14600K
261.5 (226.3min) fps +22%
Intel Core Ultra 9 285K
252.4 (219.5min) fps +18%
Intel Core i7-13700K
251.2 (215.9min) fps +18%
Intel Core i7-13700
245 (213.8min) fps +15%
Intel Core Ultra 5 245K
213.7 (189.8min) fps
Intel Core i7-12700
202.4 (178min) fps -5%
Intel Core i5-12400F
182.1 (159.5min) fps -15%
Intel Core i5-13400
182.1 (160.5min) fps -15%
The Witcher 3 - 1024x768 Low Graphics & Postprocessing
AMD Ryzen 9 7950X3D
864.7 fps +61%
AMD Ryzen 7 7800X3D
858.4 fps +60%
Intel Core i9-14900K
829 (31.9min, 380P0.1, 595P1 - 1296max) fps +55%
AMD Ryzen 9 7950X
826 (23.6min, 360P0.1, 574P1 - 1357max) fps +54%
Intel Core i9-13900K
794 (25.1min, 361P0.1, 581P1 - 1267max) fps +48%
AMD Ryzen 5 9600X
762 (66min, 266P0.1, 520P1 - 1355max) fps +42%
AMD Ryzen 5 7600X
738 fps +38%
Intel Core i7-13700K
687.5 fps +28%
Intel Core i7-13700
670.4 fps +25%
Intel Core Ultra 9 285K
663 (87.9min, 319P0.1, 454P1 - 1115max) fps +24%
Intel Core i5-14600K
632 (29.4min, 209P0.1, 471P1 - 1028max) fps +18%
Intel Core Ultra 5 245K
536 (23.7min, 212P0.1, 371P1 - 944max) fps
Intel Core i7-12700
522 fps -3%
Intel Core i5-13400
451.7 fps -16%
Intel Core i5-12400F
414 fps -23%
GTA V - 1024x768 Lowest Settings possible
AMD Ryzen 7 7800X3D
188.5 fps 0%
AMD Ryzen 9 7950X
188.2 (5.44min, 200P1 - 724max) fps 0%
AMD Ryzen 5 9600X
188.1 (3min, 200P1 - 713max) fps 0%
AMD Ryzen 9 7950X3D
188 (3.25min, 200P1 - 705max) fps 0%
AMD Ryzen 5 7600X
187.9 (7.22min, 200P1 - 815max) fps 0%
Intel Core i9-14900K
187.9 (3.8min, 200P1 - 705max) fps 0%
Intel Core i9-13900K
187.8 (2.26min, 200P1 - 688max) fps 0%
Intel Core i7-13700
187.7 (5.01min, 200P1 - 613max) fps 0%
Intel Core i5-14600K
187.7 (4.67min, 200P1 - 640max) fps 0%
Intel Core Ultra 5 245K
187.7 (4.11min, 200P1 - 547max) fps
Intel Core Ultra 9 285K
187.7 (4.29min, 200P1 - 567max) fps 0%
Intel Core i7-13700K
187.6 (3.74min, 200P1 - 607max) fps 0%
Intel Core i7-12700
187.1 (2.4min, 200P1 - 499max) fps 0%
Intel Core i5-13400
186.8 (1.87min, 166.7P1 - 445max) fps 0%
Intel Core i5-12400F
186.4 (2.09min, 166.7P1 - 413max) fps -1%
Borderlands 3 - 1280x720 Very Low Overall Quality (DX11)
AMD Ryzen 7 7800X3D
310 fps +80%
AMD Ryzen 9 7950X3D
308 fps +79%
Intel Core i9-14900K
263 fps +53%
Intel Core i9-13900K
243 fps +41%
AMD Ryzen 9 7950X
242 fps +41%
Intel Core i5-14600K
237 fps +38%
AMD Ryzen 5 7600X
228 fps +32%
AMD Ryzen 5 9600X
228 fps +32%
Intel Core i7-13700
222 fps +29%
Intel Core i7-13700K
222 fps +29%
Intel Core Ultra 9 285K
196.6 fps +14%
Intel Core i7-12700
185.6 fps +8%
Intel Core Ultra 5 245K
172.1 fps
Intel Core i5-13400
169 fps -2%
Intel Core i5-12400F
155 fps -10%
Far Cry New Dawn - 1280x720 Low Preset
AMD Ryzen 7 7800X3D
291 (218min - 442max) fps +79%
AMD Ryzen 9 7950X3D
255 (145min - 381max) fps +56%
Intel Core i9-14900K
235 (156min - 353max) fps +44%
AMD Ryzen 5 9600X
226 (163min - 362max) fps +39%
Intel Core i9-13900K
222 (150min - 335max) fps +36%
Intel Core i5-14600K
216 (168min - 312max) fps +33%
Intel Core i7-13700
203 (144min - 297max) fps +25%
Intel Core i7-13700K
203 (157min - 304max) fps +25%
AMD Ryzen 9 7950X
200 (140min - 302max) fps +23%
AMD Ryzen 5 7600X
199 (140min - 316max) fps +22%
Intel Core Ultra 9 285K
184 (140min - 275max) fps +13%
Intel Core i7-12700
174 (103min - 253max) fps +7%
Intel Core Ultra 5 245K
163 (122min - 246max) fps
Intel Core i5-13400
159 (110min - 233max) fps -2%
Intel Core i5-12400F
147 (102min - 216max) fps -10%
Shadow of the Tomb Raider - 1280x720 Lowest Preset
AMD Ryzen 7 7800X3D
407 fps +65%
AMD Ryzen 9 7950X3D
383 fps +56%
AMD Ryzen 9 7950X
332 fps +35%
Intel Core i9-14900K
332 fps +35%
AMD Ryzen 5 7600X
321 fps +30%
Intel Core i9-13900K
320 fps +30%
AMD Ryzen 5 9600X
319 fps +30%
Intel Core i5-14600K
281 fps +14%
Intel Core i7-13700
272 fps +11%
Intel Core i7-13700K
272 fps +11%
Intel Core Ultra 9 285K
263 fps +7%
Intel Core Ultra 5 245K
246 fps
Intel Core i7-12700
231 fps -6%
Intel Core i5-13400
204 fps -17%
Intel Core i5-12400F
196.4 fps -20%
Tiny Tina's Wonderlands - 1920x1080 Low Preset (DX12)
AMD Ryzen 7 7800X3D
506 fps +39%
Intel Core i9-14900K
502 fps +38%
AMD Ryzen 9 7950X3D
477 fps +31%
Intel Core i5-14600K
429 fps +18%
AMD Ryzen 9 7950X
428 fps +18%
AMD Ryzen 5 7600X
415 fps +14%
AMD Ryzen 5 9600X
411 fps +13%
Intel Core Ultra 9 285K
403 fps +11%
Intel Core i9-13900K
398 fps +10%
Intel Core i7-13700
378 fps +4%
Intel Core i7-13700K
371 fps +2%
Intel Core Ultra 5 245K
363 fps
Intel Core i7-12700
303 fps -17%
Intel Core i5-13400
275 fps -24%
Intel Core i5-12400F
258 fps -29%
Strange Brigade - 1280x720 lowest AF:1
AMD Ryzen 5 7600X
780 (275min, 597P1 - 1128max) fps +18%
Intel Core i9-14900K
762 (261min, 605P1 - 1027max) fps +15%
AMD Ryzen 7 7800X3D
760 (257min, 602P1 - 1084max) fps +15%
AMD Ryzen 5 9600X
735 (154.9min, 595P1 - 998max) fps +11%
Intel Core i5-14600K
717 (186min, 554P1 - 1036max) fps +8%
AMD Ryzen 9 7950X
698 (182.7min, 569P1 - 937max) fps +6%
Intel Core i9-13900K
691 (60.2min, 543P1 - 929max) fps +5%
Intel Core Ultra 9 285K
681 (43.7min, 531P1 - 898max) fps +3%
AMD Ryzen 9 7950X3D
672 (259min, 529P1 - 894max) fps +2%
Intel Core Ultra 5 245K
661 (248min, 487P1 - 949max) fps
Intel Core i7-13700K
646 (277min, 510P1 - 858max) fps -2%
Intel Core i7-13700
626 (284min, 497P1 - 830max) fps -5%
Intel Core i7-12700
523 (243min, 410P1 - 698max) fps -21%
Intel Core i5-12400F
444 (33.1min, 345P1 - 648max) fps -33%
Intel Core i5-13400
408 (153.5min, 319P1 - 565max) fps -38%
Metro Exodus - 1280x720 Low Quality AF:4x
AMD Ryzen 7 7800X3D
374 (214.41min - 571.76max) fps +46%
AMD Ryzen 5 9600X
349 (182.25min - 551.57max) fps +36%
Intel Core i9-14900K
319 (166.53min - 527.7max) fps +25%
AMD Ryzen 5 7600X
309 (157.23min - 500.25max) fps +21%
AMD Ryzen 9 7950X
300 (162.95min - 476.42max) fps +17%
Intel Core i5-14600K
296 (170.68min - 455.17max) fps +16%
AMD Ryzen 9 7950X3D
293 (157.18min - 462.11max) fps +14%
Intel Core Ultra 9 285K
276 (133.01min - 479.85max) fps +8%
Intel Core i7-13700
268 (127.73min - 445.04max) fps +5%
Intel Core i9-13900K
261 (116.81min - 454.13max) fps +2%
Intel Core i7-13700K
261 (117.16min - 442.09max) fps +2%
Intel Core Ultra 5 245K
256 (135.37min - 427.35max) fps
Intel Core i7-12700
233 (124.52min - 364.56max) fps -9%
Intel Core i5-12400F
203 (112.65min - 299.76max) fps -21%
Intel Core i5-13400
196.9 (110.05min - 286.04max) fps -23%
F1 2020 - 1280x720 Ultra Low Preset
AMD Ryzen 7 7800X3D
681 (531min - 769max) fps +77%
AMD Ryzen 5 9600X
630 (468min - 710max) fps +64%
Intel Core i9-14900K
598 (473min - 679max) fps +56%
AMD Ryzen 9 7950X3D
594 (461min - 653max) fps +55%
AMD Ryzen 9 7950X
563 (437min - 628max) fps +47%
AMD Ryzen 5 7600X
559 (420min - 634max) fps +46%
Intel Core i9-13900K
526 (418min - 596max) fps +37%
Intel Core i7-13700K
465 (325min - 539max) fps +21%
Intel Core i7-13700
461 (323min - 528max) fps +20%
Intel Core Ultra 9 285K
454 (355min - 499max) fps +18%
Intel Core i5-14600K
403 (333min - 436max) fps +5%
Intel Core i7-12700
388 (314min - 434max) fps +1%
Intel Core Ultra 5 245K
384 (313min - 422max) fps
Intel Core i5-12400F
322 (266min - 345max) fps -16%
Intel Core i5-13400
292 (253min - 317max) fps -24%
F1 2021 - 1280x720 Ultra Low Preset
AMD Ryzen 7 7800X3D
830 (632min, 515P1 - 919max) fps +115%
Intel Core i9-14900K
733 (560min, 450P1 - 806max) fps +90%
AMD Ryzen 5 7600X
690 (453min, 397P1 - 783max) fps +79%
AMD Ryzen 9 7950X3D
682 (522min, 418P1 - 767max) fps +77%
AMD Ryzen 9 7950X
677 (504min, 418P1 - 754max) fps +75%
AMD Ryzen 5 9600X
669 (451min, 412P1 - 741max) fps +73%
Intel Core i9-13900K
599 (469min, 379P1 - 653max) fps +55%
Intel Core i7-13700K
588 (466min, 371P1 - 639max) fps +52%
Intel Core i7-13700
572 (447min, 359P1 - 620max) fps +48%
Intel Core i5-14600K
562 (468min, 364P1 - 618max) fps +46%
Intel Core Ultra 9 285K
527 (401min, 329P1 - 583max) fps +37%
Intel Core i7-12700
448 (363min, 297P1 - 477max) fps +16%
Intel Core i5-12400F
393 (309min, 274P1 - 416max) fps +2%
Intel Core Ultra 5 245K
386 (318min, 250P1 - 422max) fps
Intel Core i5-13400
337 (277min, 237P1 - 358max) fps -13%

Performance comparison in GPU limit

Performance Rating - Percent
AMD Ryzen 7 7800X3D
98.7 pt
AMD Ryzen 9 7950X3D
97 pt
Intel Core i9-14900K
96.6 pt
Intel Core i5-14600K
94.6 pt
AMD Ryzen 9 7950X
94 pt
AMD Ryzen 5 9600X
93.8 pt
AMD Ryzen 5 7600X
93.6 pt
Intel Core i9-13900K
93.4 pt
Intel Core i7-13700K
92.6 pt
Intel Core i7-13700
91.9 pt
Intel Core Ultra 9 285K
90.5 pt
Intel Core Ultra 5 245K
88 pt
Intel Core i7-12700
87.6 pt
Intel Core i5-13400
83.3 pt
Intel Core i5-12400F
80.7 pt
F1 22 - 3840x2160 Ultra High Preset AA:T AF:16x
Intel Core Ultra 9 285K
86.2 (74min, 70P1 - 101max) fps +1%
Intel Core Ultra 5 245K
85.5 (74min, 69P1 - 98max) fps
AMD Ryzen 5 9600X
85 (73min, 72P1 - 99max) fps -1%
AMD Ryzen 7 7800X3D
84.5 (72min, 71P1 - 97max) fps -1%
Intel Core i5-14600K
83.5 (72min, 71P1 - 96max) fps -2%
Intel Core i9-14900K
83.4 (72min, 71P1 - 96max) fps -2%
AMD Ryzen 5 7600X
83 (72min, 71P1 - 95max) fps -3%
AMD Ryzen 9 7950X
82.5 (72min, 71P1 - 96max) fps -4%
Intel Core i7-13700K
82.4 (72min, 71P1 - 95max) fps -4%
AMD Ryzen 9 7950X3D
82.3 (71min, 70P1 - 94max) fps -4%
Intel Core i5-12400F
81.7 (71min, 70P1 - 95max) fps -4%
Intel Core i7-13700
81.6 (71min, 70P1 - 93max) fps -5%
Intel Core i7-12700
81.3 (71min, 68P1 - 93max) fps -5%
Intel Core i5-13400
81.2 (72min, 67P1 - 93max) fps -5%
Intel Core i9-13900K
81.1 (71min, 70P1 - 93max) fps -5%
Far Cry 5 - 3840x2160 Ultra Preset AA:T
AMD Ryzen 7 7800X3D
187 (166min - 215max) fps +22%
Intel Core i9-14900K
187 (168min - 216max) fps +22%
Intel Core i9-13900K
182 (148min - 212max) fps +19%
AMD Ryzen 9 7950X3D
182 (157min - 212max) fps +19%
Intel Core i5-14600K
181 (151min - 215max) fps +18%
AMD Ryzen 9 7950X
175 (140min - 212max) fps +14%
AMD Ryzen 5 7600X
173 (142min - 209max) fps +13%
Intel Core i7-13700K
172 (137min - 206max) fps +12%
Intel Core i7-13700
171 (140min - 207max) fps +12%
AMD Ryzen 5 9600X
170 (136min - 198max) fps +11%
Intel Core Ultra 9 285K
158 (125min - 209max) fps +3%
Intel Core i7-12700
153 (117min - 203max) fps 0%
Intel Core Ultra 5 245K
153 (117min - 210max) fps
Intel Core i5-13400
142 (108min - 190max) fps -7%
Intel Core i5-12400F
131 (97min - 177max) fps -14%
X-Plane 11.11 - 3840x2160 high (fps_test=3)
AMD Ryzen 7 7800X3D
160.5 fps +72%
AMD Ryzen 9 7950X3D
158.4 fps +70%
AMD Ryzen 5 9600X
136.6 fps +46%
Intel Core i9-14900K
136.3 fps +46%
Intel Core i9-13900K
132.3 fps +42%
AMD Ryzen 5 7600X
125.8 fps +35%
Intel Core i5-14600K
124.6 fps +33%
AMD Ryzen 9 7950X
124.5 fps +33%
Intel Core i7-13700K
121.8 fps +30%
Intel Core i7-13700
119.3 fps +28%
Intel Core Ultra 9 285K
105.8 fps +13%
Intel Core i7-12700
105.4 fps +13%
Intel Core i5-13400
95 fps +2%
Intel Core Ultra 5 245K
93.4 fps
Intel Core i5-12400F
77 fps -18%
Final Fantasy XV Benchmark - 3840x2160 High Quality
Intel Core Ultra 5 245K
162.3 fps
Intel Core i9-14900K
161.9 fps 0%
Intel Core Ultra 9 285K
161.7 fps 0%
Intel Core i5-14600K
161.5 fps 0%
Intel Core i9-13900K
161.3 fps -1%
AMD Ryzen 9 7950X
161.1 fps -1%
AMD Ryzen 5 7600X
159.2 fps -2%
AMD Ryzen 7 7800X3D
158.2 fps -3%
Intel Core i7-13700
157.9 fps -3%
AMD Ryzen 9 7950X3D
157.6 fps -3%
Intel Core i7-13700K
155.9 fps -4%
Intel Core i7-12700
153.4 fps -5%
Intel Core i5-12400F
151.9 fps -6%
AMD Ryzen 5 9600X
150.9 fps -7%
Intel Core i5-13400
149.8 fps -8%
Dota 2 Reborn - 3840x2160 ultra (3/3) best looking
AMD Ryzen 7 7800X3D
258.2 (201.3min) fps +54%
AMD Ryzen 9 7950X3D
245.4 (195.9min) fps +46%
AMD Ryzen 9 7950X
234.4 (192.2min) fps +40%
Intel Core i9-13900K
230 (185.3min) fps +37%
Intel Core i9-14900K
227.8 (188.3min) fps +36%
AMD Ryzen 5 9600X
225 (189.1min) fps +34%
AMD Ryzen 5 7600X
223.4 (185.4min) fps +33%
Intel Core i5-14600K
211.5 (179.5min) fps +26%
Intel Core i7-13700K
200.2 (165.5min) fps +19%
Intel Core i7-13700
196.8 (166.7min) fps +17%
Intel Core Ultra 9 285K
193.6 (162.4min) fps +15%
Intel Core Ultra 5 245K
168 (143.3min) fps
Intel Core i7-12700
163.7 (141.2min) fps -3%
Intel Core i5-12400F
150.3 (129.4min) fps -11%
Intel Core i5-13400
149.8 (129.3min) fps -11%
The Witcher 3 - 3840x2160 High Graphics & Postprocessing (Nvidia HairWorks Off)
AMD Ryzen 5 7600X
294 fps +4%
Intel Core i9-14900K
293 (121.6min, 193.2P0.1, 243P1 - 865max) fps +3%
Intel Core i5-14600K
288 (85.6min, 166.1P0.1, 233P1 - 721max) fps +1%
Intel Core Ultra 9 285K
286 (152.2min, 226P0.1, 257P1 - 596max) fps +1%
AMD Ryzen 9 7950X
284 (88.3min, 166.6P0.1, 240P1 - 831max) fps 0%
Intel Core Ultra 5 245K
284 (132.6min, 215P0.1, 256P1 - 516max) fps
Intel Core i5-13400
282.2 fps -1%
Intel Core i7-13700
282.1 fps -1%
Intel Core i7-12700
282 fps -1%
AMD Ryzen 7 7800X3D
281 fps -1%
Intel Core i7-13700K
278.9 fps -2%
AMD Ryzen 5 9600X
277 (20.2min, 154.7P0.1, 219P1 - 925max) fps -2%
AMD Ryzen 9 7950X3D
275.2 fps -3%
Intel Core i5-12400F
254 fps -11%
Intel Core i9-13900K
239 (103.3min, 154P0.1, 203P1 - 639max) fps -16%
GTA V - 3840x2160 High/On (Advanced Graphics Off) AA:FX AF:8x
AMD Ryzen 7 7800X3D
188 (2.69min, 200P1 - 698max) fps +2%
AMD Ryzen 5 9600X
187.7 (4.85min, 200P1 - 597max) fps +2%
Intel Core i9-14900K
187.6 (4.19min, 200P1 - 613max) fps +2%
Intel Core i9-13900K
187.5 (3.71min, 200P1 - 553max) fps +2%
AMD Ryzen 9 7950X
187.5 (2.97min, 200P1 - 593max) fps +2%
Intel Core i7-13700K
187.5 (6.22min, 200P1 - 502max) fps +2%
Intel Core i5-14600K
187.4 (5.2min, 200P1 - 502max) fps +2%
Intel Core i7-13700
187.2 (1.451min, 200P1 - 464max) fps +2%
AMD Ryzen 5 7600X
186.5 (2.19min, 166.7P1 - 524max) fps +2%
AMD Ryzen 9 7950X3D
186.5 (2.67min, 166.7P1 - 575max) fps +2%
Intel Core Ultra 9 285K
186 (2.01min, 166.7P1 - 464max) fps +1%
Intel Core Ultra 5 245K
183.7 (2.01min, 125P1 - 443max) fps
Intel Core i7-12700
182 (2.29min, 142.9P1 - 460max) fps -1%
Intel Core i5-13400
178.2 (2.26min, 125P1 - 359max) fps -3%
Intel Core i5-12400F
175.6 (3.48min, 125P1 - 323max) fps -4%
Borderlands 3 - 3840x2160 Badass Overall Quality (DX11)
Intel Core i7-13700K
143.4 fps +16%
Intel Core i9-14900K
137.9 fps +11%
AMD Ryzen 7 7800X3D
137.4 fps +11%
AMD Ryzen 9 7950X3D
136.4 fps +10%
Intel Core i5-14600K
136.1 fps +10%
Intel Core i9-13900K
135.5 fps +9%
AMD Ryzen 9 7950X
135 fps +9%
AMD Ryzen 5 7600X
133.4 fps +8%
Intel Core i7-13700
132.4 fps +7%
AMD Ryzen 5 9600X
131.8 fps +6%
Intel Core Ultra 9 285K
128.6 fps +4%
Intel Core i7-12700
125.5 fps +1%
Intel Core Ultra 5 245K
124 fps
Intel Core i5-13400
120.5 fps -3%
Intel Core i5-12400F
114.4 fps -8%
Far Cry New Dawn - 3840x2160 Ultra Preset
AMD Ryzen 7 7800X3D
180 (147min - 219max) fps +50%
AMD Ryzen 9 7950X3D
171 (130min - 219max) fps +43%
Intel Core i9-14900K
161 (122min - 221max) fps +34%
Intel Core i9-13900K
154 (113min - 219max) fps +28%
Intel Core i5-14600K
153 (115min - 219max) fps +28%
AMD Ryzen 5 9600X
148 (110min - 200max) fps +23%
AMD Ryzen 9 7950X
145 (104min - 215max) fps +21%
Intel Core i7-13700
145 (106min - 212max) fps +21%
Intel Core i7-13700K
145 (109min - 213max) fps +21%
AMD Ryzen 5 7600X
142 (99min - 212max) fps +18%
Intel Core Ultra 9 285K
130 (90min - 200max) fps +8%
Intel Core i7-12700
127 (92min - 198max) fps +6%
Intel Core Ultra 5 245K
120 (85min - 198max) fps
Intel Core i5-13400
119 (88min - 182max) fps -1%
Intel Core i5-12400F
110 (79min - 170max) fps -8%
Tiny Tina's Wonderlands - 3840x2160 Badass Preset (DX12)
Intel Core Ultra 5 245K
132.6 fps
Intel Core Ultra 9 285K
132.6 fps 0%
Intel Core i9-14900K
131.7 fps -1%
AMD Ryzen 9 7950X3D
131.3 fps -1%
AMD Ryzen 5 7600X
130.6 fps -2%
Intel Core i5-14600K
130.4 fps -2%
AMD Ryzen 9 7950X
130.3 fps -2%
Intel Core i7-13700
130.2 fps -2%
AMD Ryzen 5 9600X
130 fps -2%
Intel Core i9-13900K
129.8 fps -2%
AMD Ryzen 7 7800X3D
129.8 fps -2%
Intel Core i7-12700
129.7 fps -2%
Intel Core i5-13400
129.7 fps -2%
Intel Core i7-13700K
129.6 fps -2%
Intel Core i5-12400F
114.2 fps -14%
Strange Brigade - 3840x2160 ultra AA:ultra AF:16
Intel Core i9-14900K
291 (120min, 249P1 - 467max) fps +2%
AMD Ryzen 7 7800X3D
289 (119.3min, 246P1 - 463max) fps +1%
Intel Core i5-14600K
289 (243min, 249P1 - 426max) fps +1%
Intel Core Ultra 9 285K
288 (214min, 245P1 - 410max) fps +1%
AMD Ryzen 5 9600X
286 (37.1min, 244P1 - 520max) fps 0%
Intel Core i7-13700K
285 (59.9min, 241P1 - 552max) fps 0%
AMD Ryzen 9 7950X3D
285 (53.2min, 243P1 - 469max) fps 0%
Intel Core Ultra 5 245K
285 (195.3min, 242P1 - 410max) fps
Intel Core i7-12700
284 (44.1min, 236P1 - 407max) fps 0%
AMD Ryzen 5 7600X
283 (39.7min, 242P1 - 668max) fps -1%
Intel Core i7-13700
282 (28.1min, 238P1 - 533max) fps -1%
AMD Ryzen 9 7950X
281 (31.7min, 239P1 - 482max) fps -1%
Intel Core i5-12400F
281 (59.7min, 240P1 - 421max) fps -1%
Intel Core i9-13900K
279 (59.9min, 239P1 - 532max) fps -2%
Intel Core i5-13400
278 (59.8min, 227P1 - 408max) fps -2%
Metro Exodus - 3840x2160 Ultra Quality AF:16x
Intel Core i9-14900K
143.4 (84.04min - 227.17max) fps +6%
Intel Core i5-14600K
142.1 (81.45min - 230.73max) fps +5%
AMD Ryzen 7 7800X3D
141.6 (85.41min - 213.31max) fps +5%
AMD Ryzen 9 7950X
139.7 (76.95min - 229.15max) fps +4%
AMD Ryzen 9 7950X3D
139.4 (76.47min - 227.32max) fps +3%
Intel Core i9-13900K
138.6 (76.78min - 237.3max) fps +3%
AMD Ryzen 5 9600X
138 (71.03min - 235.4max) fps +2%
AMD Ryzen 5 7600X
137 (71.99min - 228.62max) fps +2%
Intel Core i7-13700
136.9 (71.43min - 234.36max) fps +2%
Intel Core i7-13700K
136.9 (72.87min - 233.59max) fps +2%
Intel Core Ultra 5 245K
134.7 (69.85min - 225.07max) fps
Intel Core Ultra 9 285K
134 (68.14min - 237.76max) fps -1%
Intel Core i7-12700
132.4 (68.05min - 211.86max) fps -2%
Intel Core i5-13400
126.7 (68.66min - 196.97max) fps -6%
Intel Core i5-12400F
124.1 (74min - 188.01max) fps -8%
F1 2020 - 3840x2160 Ultra High Preset AA:T AF:16x
Intel Core i9-14900K
289 (237min - 340max) fps +7%
AMD Ryzen 9 7950X3D
288 (242min - 339max) fps +7%
AMD Ryzen 7 7800X3D
288 (242min - 333max) fps +7%
Intel Core i5-14600K
288 (242min - 338max) fps +7%
AMD Ryzen 5 9600X
287 (243min - 337max) fps +6%
AMD Ryzen 9 7950X
286 (245min - 335max) fps +6%
Intel Core i9-13900K
285 (240min - 333max) fps +6%
AMD Ryzen 5 7600X
285 (241min - 333max) fps +6%
Intel Core i7-13700K
284 (242min - 329max) fps +5%
Intel Core i7-13700
283 (240min - 332max) fps +5%
Intel Core i7-12700
275 (197min - 319max) fps +2%
Intel Core Ultra 9 285K
273 (236min - 319max) fps +1%
Intel Core Ultra 5 245K
270 (233min - 318max) fps
Intel Core i5-12400F
247 (202min - 285max) fps -9%
Intel Core i5-13400
229 (184min - 265max) fps -15%
F1 2021 - 3840x2160 Ultra High Preset + Raytracing AA:T AF:16x
AMD Ryzen 7 7800X3D
207 (179min, 176P1 - 230max) fps +5%
AMD Ryzen 5 9600X
205 (176min, 168P1 - 232max) fps +4%
AMD Ryzen 5 7600X
203 (173min, 170P1 - 228max) fps +3%
AMD Ryzen 9 7950X3D
203 (169min, 169P1 - 225max) fps +3%
Intel Core i9-14900K
203 (173min, 165P1 - 226max) fps +3%
Intel Core i5-14600K
201 (173min, 153P1 - 227max) fps +2%
Intel Core Ultra 9 285K
200 (168min, 137P1 - 218max) fps +2%
AMD Ryzen 9 7950X
199.1 (168min, 166P1 - 223max) fps +1%
Intel Core i7-13700K
197.5 (169min, 158P1 - 222max) fps 0%
Intel Core Ultra 5 245K
196.9 (171min, 139P1 - 211max) fps
Intel Core i7-13700
196.8 (166min, 156P1 - 217max) fps 0%
Intel Core i9-13900K
196.5 (166min, 152P1 - 220max) fps 0%
Intel Core i7-12700
193.1 (162min, 137P1 - 211max) fps -2%
Intel Core i5-12400F
185 (153min, 132P1 - 197max) fps -6%
Intel Core i5-13400
176.2 (144min, 127P1 - 189max) fps -11%

Intel Core Ultra 5 245K with Nvidia GeForce RTX 4090

lowmed.highultraQHD4K
GTA V (2015) 187.7 187.4 186 149.8 151.7 183.7
The Witcher 3 (2015) 536 485 461 308 273 284
Dota 2 Reborn (2015) 213.7 192.2 185.3 172.9 168
Final Fantasy XV Benchmark (2018) 235 235 219 214 162.3
X-Plane 11.11 (2018) 129.1 114.5 98.2 93.4
Far Cry 5 (2018) 204 177 169 156 155 153
Strange Brigade (2018) 661 503 498 491 479 285
Shadow of the Tomb Raider (2018) 246 235 232 233 229 186.6
Far Cry New Dawn (2019) 163 141 136 123 122 120
Metro Exodus (2019) 256 233 203 175.4 169 134.7
Total War: Three Kingdoms (2019) 471.8 317.1 263.6 232.3 199 104.7
Borderlands 3 (2019) 172.1 157.5 146.1 138.8 140.9 124
F1 2020 (2020) 384 333 333 314 311 270
F1 2021 (2021) 386 362 316 203 201 196.9
Far Cry 6 (2021) 181.7 156.3 139.9 143.5 137.3 126.5
God of War (2022) 227 227 223 206 181.6 127.2
Tiny Tina's Wonderlands (2022) 363 308 273 260 226 132.6
F1 22 (2022) 311 302 282 161 152.1 85.5
The Witcher 3 v4.00 (2023) 273 233 219 204 205 171.9
Dead Space Remake (2023) 215 213 207 203 176.4 97.2
Returnal (2023) 202 202 192 187 173 114
F1 23 (2023) 288 290 276 160.7 148 80
Baldur's Gate 3 (2023) 254 238 218 223 206 135.3
Cyberpunk 2077 2.1 Phantom Liberty (2023) 190.4 190.9 175.6 164.1 151 74.7
Assassin's Creed Mirage (2023) 267 259 253 183 179 128
Total War Pharaoh (2023) 399.7 235.8 197.1 159.4 157.2 147.4
Avatar Frontiers of Pandora (2023) 238 225 201 166 121 69
F1 24 (2024) 302 321 301 173.4 144.2 79.1

Zapotrzebowanie na energię

Intel zrobił duży krok naprzód pod względem zużycia energii. Intel Core Ultra 5 245K był w stanie zaimponować w średnim zakresie dzięki lepszej wydajności procesora, a do tego widzimy, że potrzeba znacznie mniej energii.

AMD pokazuje jednak, że stać go na jeszcze więcej. W Core Ultra 5 245K nie widzimy nadmiernego zużycia energii poprzednich generacji procesorów. Limit mocy wynosi 159 W i jest ustawiony jako PL1 i PL2, co oznacza, że procesor może wywołać maksymalną wydajność nawet przy stałym obciążeniu.

Limit jest sporadycznie przekraczany, co widać na wykresie. W teście zaobserwowaliśmy sporadyczne skoki do 173 W. Umiarkowany pobór mocy pod pełnym obciążeniem oznacza, że Core Ultra 5 245K może być dobrze chłodzony i nie wymaga ekstremalnych rozwiązań chłodzących. Chłodnica o specyfikacji TDP 200 W powinna być wystarczająca w większości przypadków, aby utrzymać Intel Core Ultra 5 245K w ryzach.

Temperatury zawsze mieszczą się w zielonym zakresie. Jeśli wszystkie limity zostaną wyłączone w BIOS-ie, pobór mocy procesora nie wzrośnie zauważalnie.

Temperatury są również na podobnym poziomie do aktywowanych domyślnych ustawień Intela, które służą jako podstawa naszych testów wydajności. Ze względu na znacznie niższy pobór mocy, Intel Core Ultra 5 245K może osiągnąć dużą przewagę nad Intel Core i5-14600K w porównaniu wydajności.

System testowania zużycia energii: Bieg jałowy
System testowania zużycia energii: Cinebench-R15-nT
System testowania zużycia energii: Cinebench-R23-nT
System testowania zużycia energii: Cinebench-R23-1T
System testowania zużycia energii: Odtwarzanie The Witcher 3, Ultra-Preset
System testowania zużycia energii: Test obciążeniowy Prime95
Test warunków skrajnych: Prime95
 

Efficiency

Power Consumption / Cinebench R23 Single Power Efficiency - external Monitor
Core Ultra 9 285K
19.5 Points per Watt +5%
Core Ultra 5 245K
18.6 Points per Watt
Ryzen 5 9600X
15.2 Points per Watt -18%
i5-14600K
13.8 Points per Watt -26%
R7 7800X3D
9.54 Points per Watt -49%
Power Consumption / Cinebench R23 Multi Power Efficiency - external Monitor
Core Ultra 9 285K
119.8 Points per Watt +9%
Core Ultra 5 245K
109.9 Points per Watt
R7 7800X3D
89.1 Points per Watt -19%
Ryzen 5 9600X
82.2 Points per Watt -25%
i5-14600K
73.8 Points per Watt -33%
Power Consumption / Cinebench R15 Multi Efficiency (external Monitor)
Core Ultra 9 285K
17.1 Points per Watt +8%
Core Ultra 5 245K
15.8 Points per Watt
R7 7800X3D
14.4 Points per Watt -9%
Ryzen 5 9600X
12.5 Points per Watt -21%
R5 7600X
11.7 Points per Watt -26%
i5-14600K
11.1 Points per Watt -30%
Performance Rating - Percent
AMD Ryzen 5 9600X
61 pt
AMD Ryzen 7 7800X3D
60.8 pt
Intel Core i5-13400
60.7 pt
Intel Core i5-12400F
60 pt
AMD Ryzen 5 7600X
59.2 pt
Intel Core Ultra 5 245K
53.2 pt
AMD Ryzen 9 7950X3D
49.4 pt
Intel Core i7-12700
43.6 pt
Intel Core i5-14600K
35.5 pt
Intel Core i7-13700K
34.2 pt
Intel Core i7-13700
30.8 pt
Intel Core Ultra 9 285K
30.4 pt
Intel Core i9-14900K
0 pt
Power Consumption
Cinebench R15 Multi (external Monitor)
Intel Core i9-14900K
548 (545min, 545P1 - 551max) Watt * -125%
Intel Core Ultra 9 285K
373 (360min, 360P1 - 402max) Watt * -53%
Intel Core i7-13700
365 (363min, 363P1 - 367max) Watt * -50%
Intel Core i7-13700K
357 (356min, 356P1 - 362max) Watt * -46%
Intel Core i5-14600K
329 (323min, 324P1 - 331max) Watt * -35%
Intel Core i7-12700
284 (282min, 282P1 - 287max) Watt * -16%
AMD Ryzen 9 7950X3D
273 (264min, 264P1 - 304max) Watt * -12%
Intel Core Ultra 5 245K
244 (242min, 242P1 - 246max) Watt *
AMD Ryzen 5 7600X
215 (134.8min, 135.6P1 - 259max) Watt * +12%
AMD Ryzen 5 9600X
210 (209min, 209P1 - 210max) Watt * +14%
AMD Ryzen 7 7800X3D
207 (203min, 203P1 - 216max) Watt * +15%
Intel Core i5-13400
196.6 (194.6min, 194.6P1 - 207max) Watt * +19%
Intel Core i5-12400F
194.4 (192.3min, 192.3P1 - 200max) Watt * +20%
Prime95 V2810 Stress (external Monitor)
Intel Core i9-14900K
537 (508min, 510P1 - 606max) Watt * -104%
Intel Core i7-13700
386 (363min, 364P1 - 487max) Watt * -47%
Intel Core Ultra 9 285K
382 (374min, 376P1 - 392max) Watt * -45%
Intel Core i5-14600K
370 (349min, 349P1 - 422max) Watt * -41%
Intel Core i7-13700K
357 (341min, 342P1 - 458max) Watt * -36%
Intel Core i7-12700
327 (304min, 305P1 - 394max) Watt * -24%
AMD Ryzen 9 7950X3D
276 (267min, 267P1 - 329max) Watt * -5%
Intel Core Ultra 5 245K
263 (256min, 256P1 - 271max) Watt *
Intel Core i5-12400F
239 (225min, 226P1 - 252max) Watt * +9%
Intel Core i5-13400
229 (224min, 224P1 - 247max) Watt * +13%
AMD Ryzen 5 7600X
227 (218min, 219P1 - 245max) Watt * +14%
AMD Ryzen 7 7800X3D
218 (214min, 215P1 - 223max) Watt * +17%
AMD Ryzen 5 9600X
213 (207min, 208P1 - 220max) Watt * +19%

* ... im mniej tym lepiej

Power consumption with an external monitor

0306090120150180210240270300330360390420450480510540570Tooltip
Intel Core Ultra 5 245K Core Ultra 5 245K, NVIDIA GeForce RTX 4090; Prime95 V2810 Stress (external Monitor): Ø263 (256-271)
Intel Core Ultra 9 285K Core Ultra 9 285K, NVIDIA GeForce RTX 4090; Prime95 V2810 Stress (external Monitor): Ø382 (374-392)
Intel Core Ultra 5 245K Core Ultra 5 245K, NVIDIA GeForce RTX 4090; Cinebench R15 Multi (external Monitor): Ø244 (242-246)
Intel Core Ultra 9 285K Core Ultra 9 285K, NVIDIA GeForce RTX 4090; Cinebench R15 Multi (external Monitor): Ø373 (360-402)
Intel Core Ultra 5 245K Core Ultra 5 245K, NVIDIA GeForce RTX 4090; Cinebench R23 Single (external Monitor): Ø114.4 (109.6-170.5)
Intel Core Ultra 9 285K Core Ultra 9 285K, NVIDIA GeForce RTX 4090; Cinebench R23 Single (external Monitor): Ø120 (114.3-180.3)
Intel Core Ultra 5 245K Core Ultra 5 245K, NVIDIA GeForce RTX 4090; Cinebench R23 Multi (external Monitor): Ø228 (225-232)
Intel Core Ultra 9 285K Core Ultra 9 285K, NVIDIA GeForce RTX 4090; Cinebench R23 Multi (external Monitor): Ø355 (352-359)
Intel Core Ultra 5 245K Core Ultra 5 245K, NVIDIA GeForce RTX 4090; 1280x720 FurMark 1.19 GPU Stress Test (external Monitor): Ø552 (534-578)
Intel Core Ultra 9 285K Core Ultra 9 285K, NVIDIA GeForce RTX 4090; 1280x720 FurMark 1.19 GPU Stress Test (external Monitor): Ø557 (538-585)

Power consumption with the external monitor

0306090120150180210240270300330360390420450480510Tooltip
Intel Core Ultra 5 245K Core Ultra 5 245K, NVIDIA GeForce RTX 4090; Idle 1min (external Monitor): Ø93.8 (91.9-96.8)
Intel Core Ultra 9 285K Core Ultra 9 285K, NVIDIA GeForce RTX 4090; Idle 1min (external Monitor): Ø95.7 (91.8-102.2)
Intel Core Ultra 5 245K Core Ultra 5 245K, NVIDIA GeForce RTX 4090; Cyberpunk 2077 FHD ultra no FSR (external Monitor): Ø425 (411-433)
Intel Core Ultra 9 285K Core Ultra 9 285K, NVIDIA GeForce RTX 4090; Cyberpunk 2077 FHD ultra no FSR (external Monitor): Ø439 (432-447)
Intel Core Ultra 5 245K Core Ultra 5 245K, NVIDIA GeForce RTX 4090; 1920x1080 The Witcher 3 ultra (external Monitor): Ø492 (455-506)
Intel Core Ultra 9 285K Core Ultra 9 285K, NVIDIA GeForce RTX 4090; 1920x1080 The Witcher 3 ultra (external Monitor): Ø515 (499-537)

Ogólne wrażenie Notebookcheck na temat Core Ultra 5 245K

Intel Core Ultra 5 245K oferuje doskonałą równowagę między wydajnością i efektywnością, co czyni go idealnym do gier i wielozadaniowości. Nowoczesna architektura sprawia, że jest to wszechstronny i wszechstronny komputer.

Transparency

The selection of devices to be reviewed is made by our editorial team. The test sample was provided to the author as a loan by the manufacturer or retailer for the purpose of this review. The lender had no influence on this review, nor did the manufacturer receive a copy of this review before publication. There was no obligation to publish this review. We never accept compensation or payment in return for our reviews. As an independent media company, Notebookcheck is not subjected to the authority of manufacturers, retailers or publishers.

This is how Notebookcheck is testing

Every year, Notebookcheck independently reviews hundreds of laptops and smartphones using standardized procedures to ensure that all results are comparable. We have continuously developed our test methods for around 20 years and set industry standards in the process. In our test labs, high-quality measuring equipment is utilized by experienced technicians and editors. These tests involve a multi-stage validation process. Our complex rating system is based on hundreds of well-founded measurements and benchmarks, which maintains objectivity. Further information on our test methods can be found here.

Please share our article, every link counts!
Mail Logo
> laptopy testy i recenzje notebooki > Laptopy > Recenzja Intel Core Ultra 5 245K: Idealna równowaga między mocą i wydajnością?
Sebastian Bade, 2024-10-25 (Update: 2024-10-25)