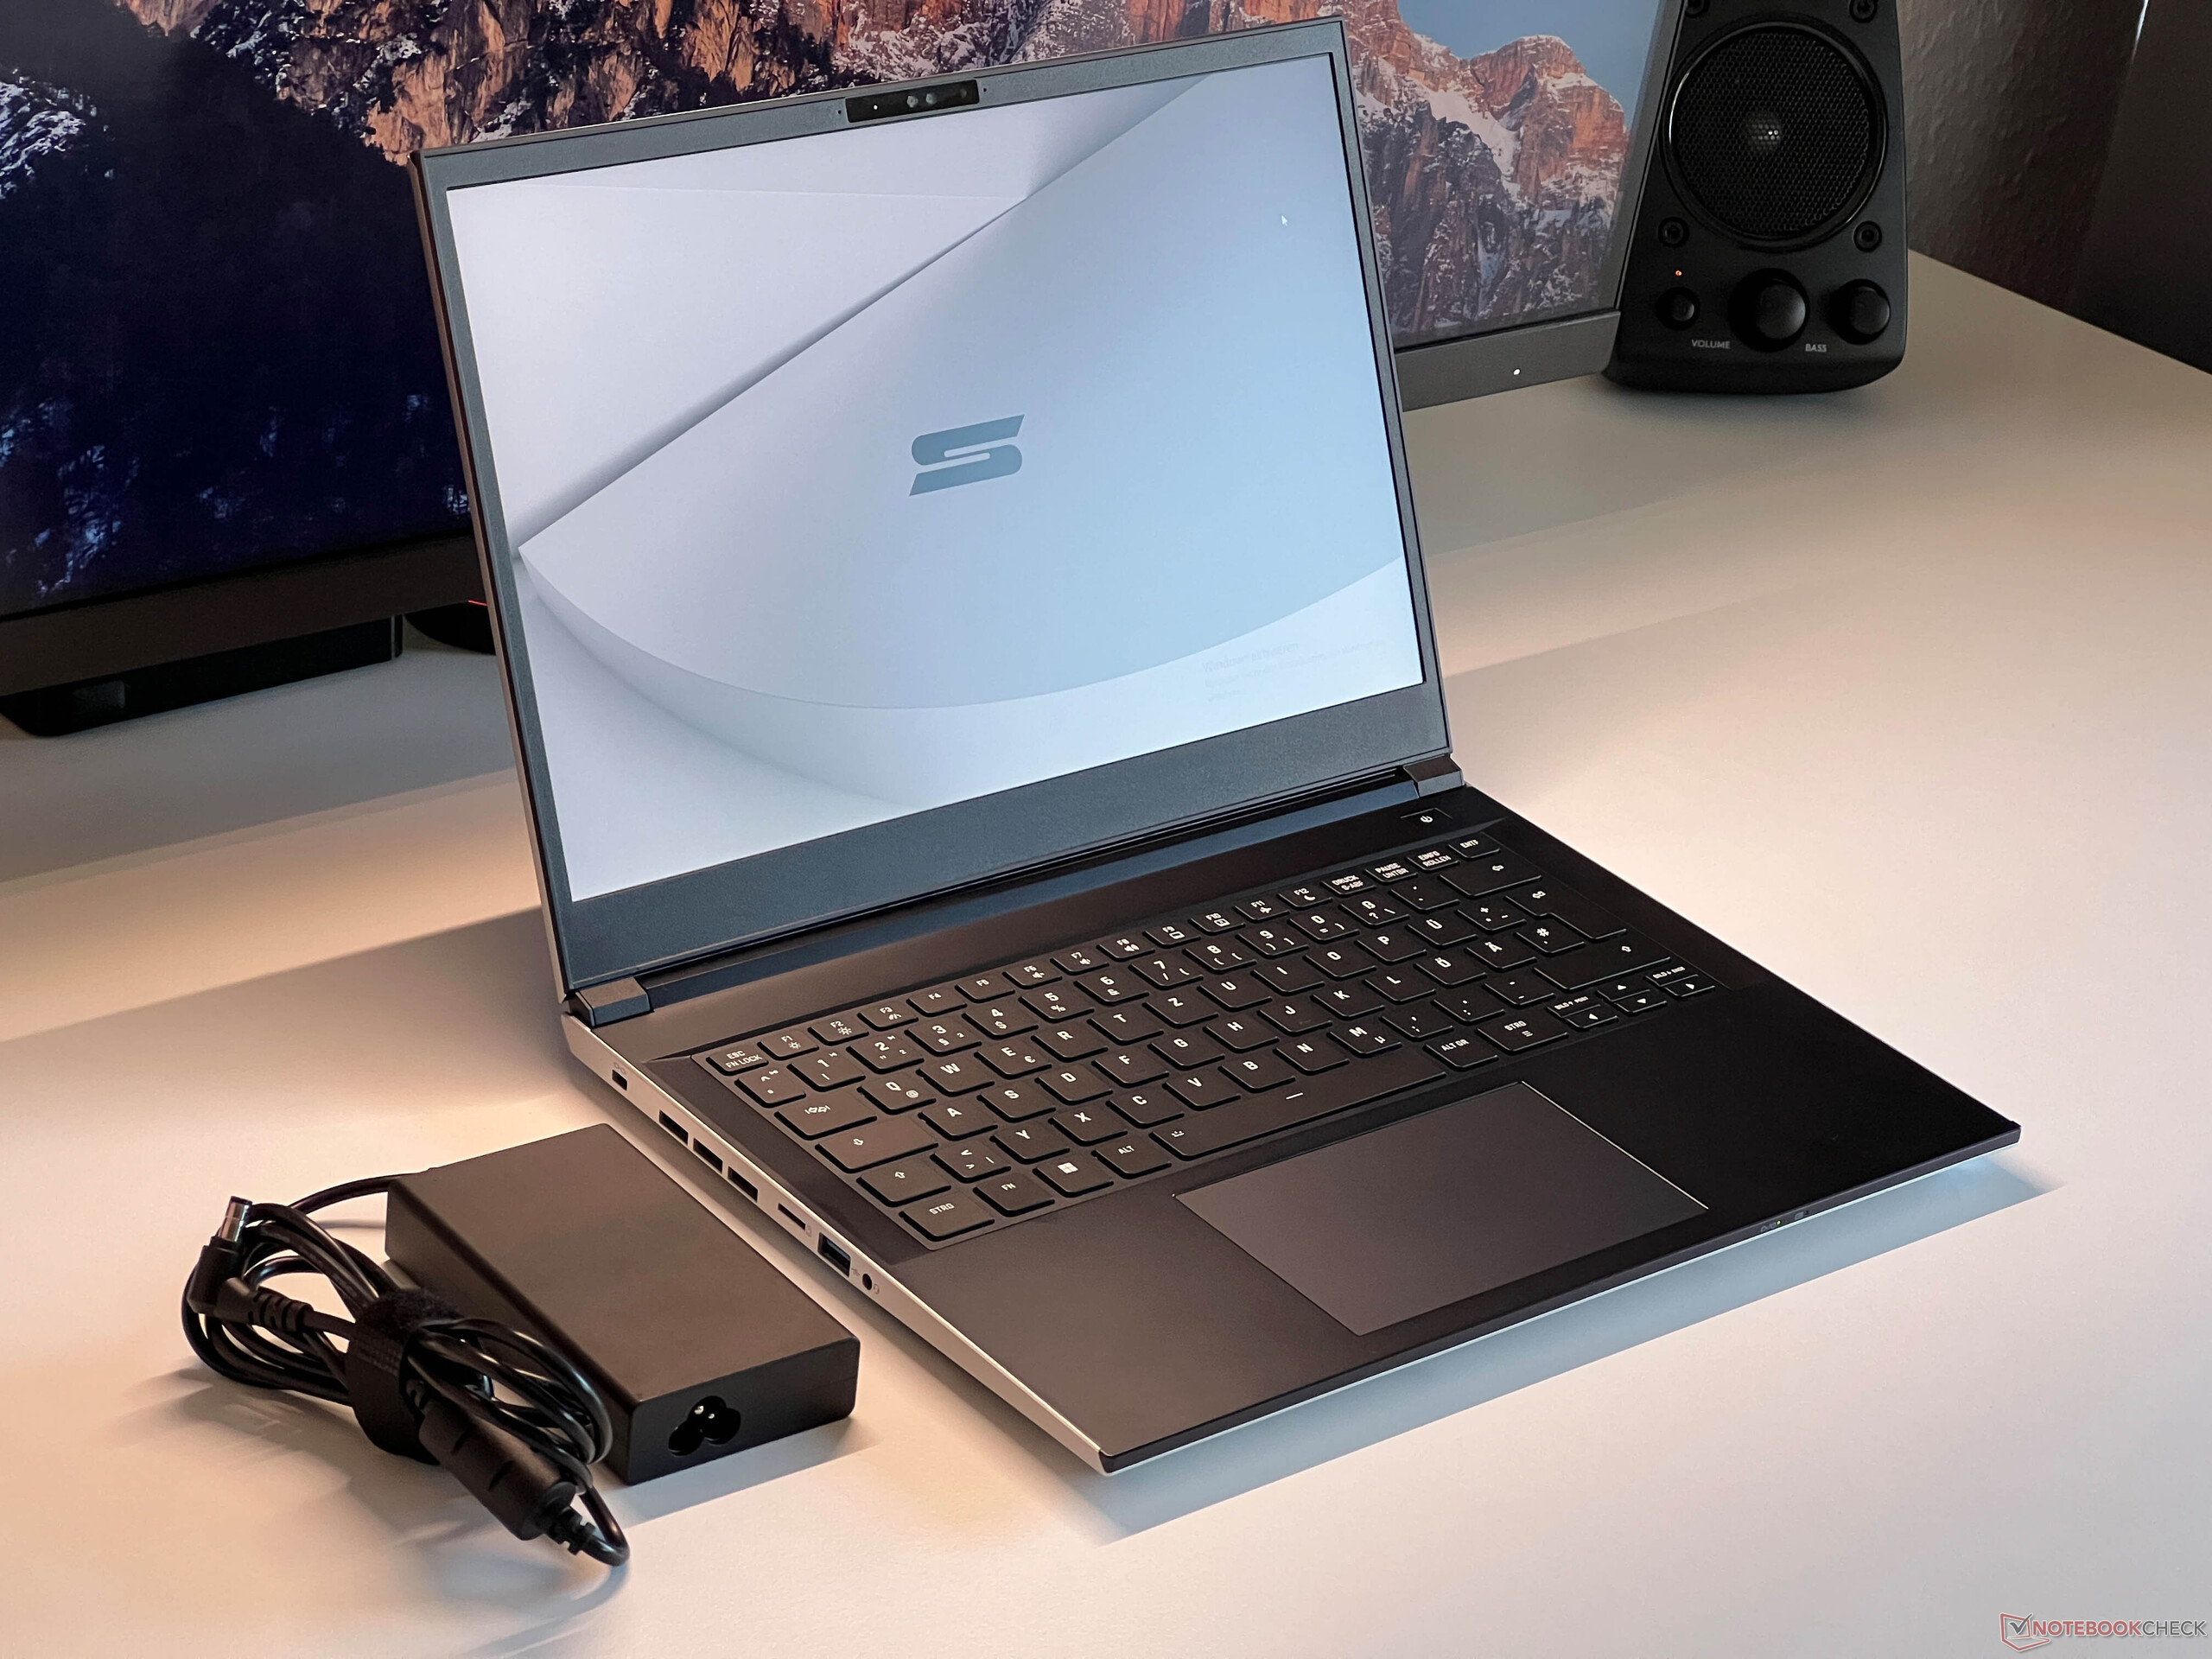
Recenzja Schenker Key 14 - 100 W RTX 4060 w kompaktowym laptopie multimedialnym
Mały, ale potężny.
Dzięki Key 14 Schenker ma w swojej ofercie kompaktowy 14-calowy notebook z fabrycznie skalibrowanym wyświetlaczem 120 Hz i wyborem szybkich dedykowanych kart graficznych Nvidii. Przetestowaliśmy jednostkę SKU zbudowaną wokół laptopa GeForce RTX 4060 z TGP wynoszącym 100 watów.Andreas Osthoff, 👁 Andreas Osthoff (tłumaczenie DeepL / Ninh Duy) Opublikowany 🇺🇸 🇩🇪 ...
Werdykt - Key 14 oferuje dobrą wydajność i opcje konserwacji, ale są też słabe punkty
Schenker Key 14 to szybki 14-calowy laptop multimedialny dostępny ze 100-watowymi wariantami kart graficznych GeForce RTX 4060 lub alternatywnie RTX 4070. Pamięć RAM można tutaj rozbudować, obsługując maksymalnie 96 GB. Ogólna wydajność jest dobra i pozostaje stabilna nawet przy ciągłym obciążeniu, chociaż dwa wentylatory mogą stać się dość głośne podczas intensywnego użytkowania. Jeśli chodzi o łączność, obsługiwane są wszystkie niezbędne standardy, w tym Thunderbolt 4, port Gigabit Ethernet i opcjonalny moduł Wi-Fi 7.
W wielu innych aspektach Key jest jednak dość przeciętny. Chociaż jego obudowa jest solidna i dobrze wykonana, szorstka plastikowa ramka wokół wyświetlacza wydaje się nieco nie na miejscu. Klawiatura jest wygodna, ale mogłaby korzystać z nieco większego skoku klawiszy, a żywotność baterii nie ustanawia nowych rekordów w najbliższym czasie. Matowy wyświetlacz IPS 120 Hz bez migotania oferuje dobrą ogólną jakość obrazu, ale jego jasność jest niższa niż w przypadku konkurencji, osiągając nieco ponad 300 nitów.
W Niemczech, Key 14 zaczyna się od €1,699 (~$1,780) z RTX 4060, a w ofercie znajduje się wiele jednostek SKU, a także wiele opcji aktualizacji, co jest wyraźnym plusem. Jeśli chodzi o inne opcje, za 1799 euro można kupić Asusa Zephyrus G14 z RTX 4060, który oferuje lepszy ogólny pakiet, ale jest ograniczony do 16 GB przylutowanej pamięci RAM. Dell XPS 14 pozostaje w tyle z wolniejszym RTX 4050 i ograniczonymi opcjami łączności. Asus TUF Gaming 14 wyróżnia się szybszym procesorem AMD, ale nie jest też całkowicie wolny od problemów. Obejmują one przylutowaną pamięć i wysoką emisję.
Za
Przeciw
Cena i dostępność
W Niemczech Key 14 (M24) można skonfigurować i zamówić w Bestware już od 1699 euro.
Porównanie możliwych alternatyw
Obraz | Model / recenzja | Cena | Waga | Wysokość | Ekran |
|---|---|---|---|---|---|
| SCHENKER Key 14 (M24) Intel Core Ultra 7 155H ⎘ NVIDIA GeForce RTX 4060 Laptop GPU ⎘ 32 GB Pamięć, 1024 GB SSD | Amazon: 1. $68.99 PowerHOOD 20V AC/DC Adapter ... Cena katalogowa: 1890€ | 1.7 kg | 19.9 mm | 14.00" 2880x1800 243 PPI IPS | |
| Asus TUF Gaming A14 FA401WV-WB94 AMD Ryzen AI 9 HX 370 ⎘ NVIDIA GeForce RTX 4060 Laptop GPU ⎘ 16 GB Pamięć, 1024 GB SSD | Amazon: Cena katalogowa: 1500 USD | 1.5 kg | 19.9 mm | 14.00" 2560x1600 216 PPI IPS | |
| Dell XPS 14 2024 OLED Intel Core Ultra 7 155H ⎘ NVIDIA GeForce RTX 4050 Laptop GPU ⎘ 32 GB Pamięć, 1024 GB SSD | Amazon: $1,175.00 Cena katalogowa: 2949€ | 1.8 kg | 19 mm | 14.50" 3200x2000 260 PPI OLED | |
| Asus ROG Zephyrus G14 2024 GA403U AMD Ryzen 9 8945HS ⎘ NVIDIA GeForce RTX 4070 Laptop GPU ⎘ 32 GB Pamięć, 1024 GB SSD | Amazon: 1. $72.99 180W 20V 9A Charger ADP-180T... 2. $72.99 180W Rectangle Conn Charger ... 3. $89.99 Slim 200W 180W Charger for A... Cena katalogowa: 2499€ | 1.5 kg | 16.3 mm | 14.00" 2880x1800 243 PPI OLED | |
| Acer Nitro 14 AN14-41-R3MX AMD Ryzen 5 8645HS ⎘ NVIDIA GeForce RTX 4060 Laptop GPU ⎘ 16 GB Pamięć, 512 GB SSD | Amazon: $1,249.99 Cena katalogowa: 1450 Euro | 2 kg | 22.84 mm | 14.50" 2560x1600 208 PPI IPS |
Spis treści
- Werdykt - Key 14 oferuje dobrą wydajność i opcje konserwacji, ale są też słabe punkty
- Specyfikacje
- Obudowa i łączność
- Urządzenia wejściowe - Wygodna klawiatura
- Wyświetlacz - IPS z odświeżaniem 120 Hz i kalibracją
- Wydajność - Core Ultra w połączeniu z maksymalnie 96 GB pamięci RAM
- Emisje. Moc
- Ocena Notebookcheck
Key 14 od Schenker to potężny laptop multimedialny wyposażony w procesor Intel Meteor Lake w połączeniu z dedykowaną kartą graficzną GeForce RTX 4060 Laptop lub nawet RTX 4070 Laptop. Podstawowy model z RTX 4060 zaczyna się od 1699 euro i zawiera wyświetlacz IPS o wysokiej rozdzielczości 120 Hz. Nasza konfiguracja testowa, wyposażona w 32 GB pamięci RAM, dysk SSD o pojemności 1 TB, opcjonalny moduł Wi-Fi 7 i trzyletnią gwarancję, została wyceniona na około 1900 euro. Dodatkowo otrzymaliśmy wariant z kartą RTX 4070, aby przeprowadzić testy porównawcze i gamingowe.
Specyfikacje
Obudowa i łączność
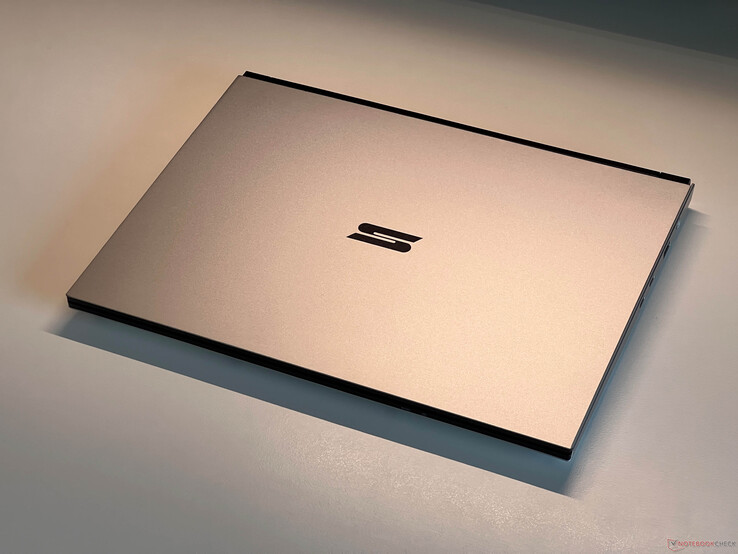
Dzięki czarno-srebrnemu wzornictwu Key 14 może pochwalić się subtelnym i profesjonalnym wyglądem, który bez wysiłku wtapia się w środowisko pracy. Pokrywa i podstawa (obie wykonane z aluminium) nie są magnesami na odciski palców, ale ciemna plastikowa podpórka pod nadgarstki, która jest nieco gumowa, wymaga regularnego czyszczenia. Ramka ekranu jest wykonana z bardziej szorstkiego plastiku, co nadaje jej nieco tani wygląd. Ponadto ramki wyświetlacza są stosunkowo szerokie jak na nowoczesne urządzenie (szczególnie na górze i na dole). Zarówno jakość wykonania, jak i stabilność są dobre, z minimalnym uginaniem się górnej części jednostki bazowej i brakiem skrzypienia przy próbie jej przekręcenia. Część ekranowa laptopa jest nieco bardziej elastyczna, choć nie udało nam się wywołać żadnych zniekształceń obrazu. Zawiasy są dobrze zestrojone, oferując wystarczający opór (lepszy niż w Vision 14), ale maksymalny kąt otwarcia jest ograniczony do zaledwie 130 stopni.
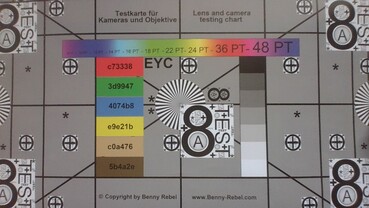
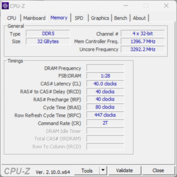
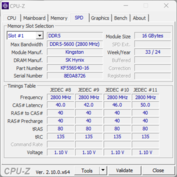
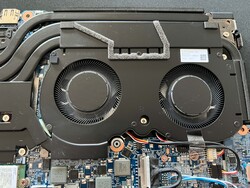
Dolną pokrywę można zdjąć, uzyskując w ten sposób dostęp do wentylatorów, baterii, dysku SSD M.2 2280, wlutowanego modułu WLAN i dwóch gniazd pamięci RAM. Jest to wyraźna przewaga Schenkera nad wieloma konkurentami, ponieważ pozwala na bezproblemową rozbudowę pamięci RAM do 96 GB. Nasz SKU jest wyposażony w opcjonalny moduł Intel Wi-Fi 7, który zapewnia znacznie wyższe prędkości transferu niż alternatywne rozwiązania Wi-Fi 6 po sparowaniu z kompatybilnym routerem. Odnotowaliśmy prędkości w zakresie od 2,6 do 4,1 Gbit/s, co stanowi znaczną poprawę w stosunku do ~1,7 Gbit/s osiąganych przez Wi-Fi 6. Kamera internetowa Full HD spełnia swoje zadanie, a także obsługuje rozpoznawanie twarzy za pomocą funkcji Windows Hello.
Key 14 wyróżnia się pod względem łączności, oferując wszystkie niezbędne standardy, w tym Thunderbolt 4, HDMI 2.1, a nawet port Gigabit Ethernet - co jest coraz rzadszą cechą w tej klasie wielkości. Rozmieszczenie portów jest dobrze przemyślane, a Key obsługuje również ładowanie przez USB-C z mocą do 100 watów.
Ważąc 1,75 kg (3,85 funta) i mierząc nieco poniżej 2 cm wysokości, Key 14 plasuje się pośrodku swojej grupy porównawczej. Dołączony do zestawu 180-watowy zasilacz waży 430 gramów.
| SD Card Reader | |
| average JPG Copy Test (av. of 3 runs) | |
| Asus ROG Zephyrus G14 2024 GA403U (Angelbird AV Pro V60) | |
| Dell XPS 14 2024 OLED (Angelbird AV Pro V60) | |
| Średnia w klasie Multimedia (18.4 - 201, n=56, ostatnie 2 lata) | |
| SCHENKER Key 14 (M24) (Angelbird AV Pro V60) | |
| Asus TUF Gaming A14 FA401WV-WB94 (Angelbird AV Pro V60) | |
| Acer Nitro 14 AN14-41-R3MX (AV PRO microSD 128 GB V60) | |
| maximum AS SSD Seq Read Test (1GB) | |
| Asus TUF Gaming A14 FA401WV-WB94 (Angelbird AV Pro V60) | |
| Dell XPS 14 2024 OLED (Angelbird AV Pro V60) | |
| Asus ROG Zephyrus G14 2024 GA403U (Angelbird AV Pro V60) | |
| Średnia w klasie Multimedia (25.8 - 266, n=56, ostatnie 2 lata) | |
| SCHENKER Key 14 (M24) (Angelbird AV Pro V60) | |
| Acer Nitro 14 AN14-41-R3MX (AV PRO microSD 128 GB V60) | |
| Networking | |
| SCHENKER Key 14 (M24) | |
| iperf3 transmit AXE11000 | |
| iperf3 receive AXE11000 | |
| iperf3 transmit GT-BE19000 WiFi7 | |
| iperf3 receive GT-BE19000 WiFi7 | |
| Asus TUF Gaming A14 FA401WV-WB94 | |
| iperf3 transmit AXE11000 | |
| iperf3 receive AXE11000 | |
| iperf3 transmit AXE11000 6GHz | |
| iperf3 receive AXE11000 6GHz | |
| Dell XPS 14 2024 OLED | |
| iperf3 transmit AXE11000 | |
| iperf3 receive AXE11000 | |
| Asus ROG Zephyrus G14 2024 GA403U | |
| iperf3 transmit AXE11000 | |
| iperf3 receive AXE11000 | |
| Acer Nitro 14 AN14-41-R3MX | |
| iperf3 transmit AXE11000 | |
| iperf3 receive AXE11000 | |
| iperf3 transmit AXE11000 6GHz | |
| iperf3 receive AXE11000 6GHz | |

Zrównoważony rozwój
Schenker Technologies nie dostarcza informacji o śladzie CO² dla Key 14. Opakowanie składa się głównie z materiałów nadających się do recyklingu, co jest plusem.
Urządzenia wejściowe - Wygodna klawiatura
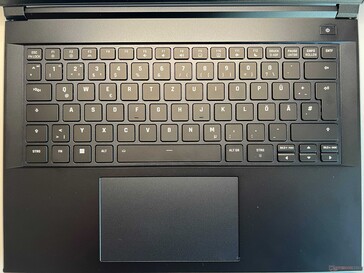
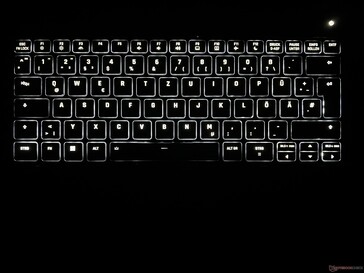
Klawiatura w czarnym kolorze posiada białe podświetlenie i stosunkowo małe klawisze o wymiarach 15 x 15 mm z dużymi odstępami między nimi. Chociaż skok klawiszy jest dość ograniczony, klawiatura jest ogólnie wygodna w użyciu dzięki precyzyjnemu i stosunkowo cichemu naciśnięciu klawiszy. Małe klawisze strzałek mogą wymagać przyzwyczajenia. Dedykowane klawisze Page Up i Page Down są pomocnym dodatkiem.
Klawiatura laptopa jest wystarczająco duża i ma wymiary 12,1 x 7,3 cm i jest zgodna ze standardem Microsoft Precision. Oferuje dobre właściwości ślizgowe i działa dobrze w codziennym użytkowaniu. Dolny obszar podkładki można kliknąć mechanicznie, co powoduje dość głośny hałas.
Wyświetlacz - IPS z odświeżaniem 120 Hz i kalibracją
Matowy, 14-calowy wyświetlacz IPS zapewnia ostry obraz dzięki wysokiej rozdzielczości 2880 x 1800 pikseli (proporcje 16:10). Odwzorowanie kolorów jest całkowicie akceptowalne, pomimo braku blasku, jaki mają panele OLED. Nie występuje tu również migotanie PWM.
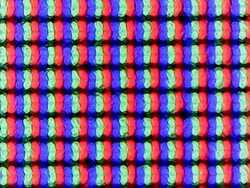
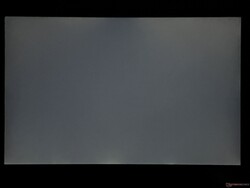
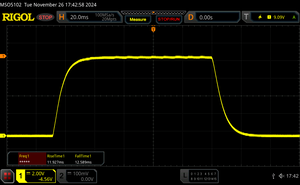
Jasne obszary wydają się nieco ziarniste po bliższym przyjrzeniu się, co nie jest tak naprawdę zauważalne w codziennym użytkowaniu. Częstotliwość odświeżania 120 Hz umożliwia płynny ruch, a czasy reakcji są również dobre. Niewielkie aureole mogą być widoczne na krawędziach, gdy ekran wyświetla ciemny obraz. Nie ma problemów ze stabilnością kątów widzenia.
Producent podaje jasność na poziomie 300 cd/m², którą panel naszego urządzenia testowego faktycznie przekracza, uzyskując średnio 317 cd/m². Poziom czerni jest bardzo niski, co przekłada się na wysoki maksymalny współczynnik kontrastu. W pomieszczeniach przyzwoita jasność w połączeniu z matową powierzchnią pozwala na bezproblemową interakcję z wyświetlaczem; jednak konkurencja oferuje wyższe poziomy jasności. Key byłby o wiele bardziej odpowiedni do użytku na zewnątrz, gdyby miał jaśniejszy ekran.
| |||||||||||||||||||||||||
rozświetlenie: 94 %
na akumulatorze: 325 cd/m²
kontrast: 2708:1 (czerń: 0.12 cd/m²)
ΔE Color 1.8 | 0.5-29.43 Ø4.87, calibrated: 1.4
ΔE Greyscale 2.5 | 0.5-98 Ø5.1
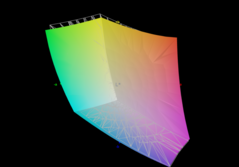
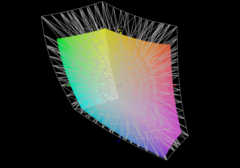
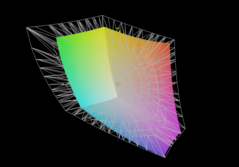
72.4% AdobeRGB 1998 (Argyll 2.2.0 3D)
97.4% sRGB (Argyll 2.2.0 3D)
70.3% Display P3 (Argyll 2.2.0 3D)
Gamma: 2.15
| SCHENKER Key 14 (M24) TL140ADXP24-0, IPS, 2880x1800, 14", 120 Hz | Asus TUF Gaming A14 FA401WV-WB94 BOE NE140QDM-NX7, IPS, 2560x1600, 14", 165 Hz | Dell XPS 14 2024 OLED SDC41A2, OLED, 3200x2000, 14.5", 120 Hz | Asus ROG Zephyrus G14 2024 GA403U ATNA40CU05-0, OLED, 2880x1800, 14", 120 Hz | Acer Nitro 14 AN14-41-R3MX AU Optronics B145QAN01.J, IPS, 2560x1600, 14.5", 120 Hz | |
|---|---|---|---|---|---|
| Display | -6% | 21% | 23% | 2% | |
| Display P3 Coverage | 70.3 | 65.1 -7% | 98.5 40% | 99.6 42% | 72.7 3% |
| sRGB Coverage | 97.4 | 94 -3% | 100 3% | 100 3% | 97.6 0% |
| AdobeRGB 1998 Coverage | 72.4 | 65.6 -9% | 87.2 20% | 89.9 24% | 74.7 3% |
| Response Times | 72% | 98% | 98% | 41% | |
| Response Time Grey 50% / Grey 80% * | 38.5 ? | 10.7 ? 72% | 0.7 ? 98% | 0.62 ? 98% | 22.3 ? 42% |
| Response Time Black / White * | 24.6 ? | 7.1 ? 71% | 0.77 ? 97% | 0.68 ? 97% | 14.8 ? 40% |
| PWM Frequency | 480 | 960 ? | |||
| Screen | -53% | 12% | 225% | -86% | |
| Brightness middle | 325 | 455.8 40% | 351 8% | 423 30% | 415 28% |
| Brightness | 317 | 436 38% | 353 11% | 424 34% | 395 25% |
| Brightness Distribution | 94 | 93 -1% | 97 3% | 98 4% | 89 -5% |
| Black Level * | 0.12 | 0.38 -217% | 0.01 92% | 0.34 -183% | |
| Contrast | 2708 | 1199 -56% | 42300 1462% | 1221 -55% | |
| Colorchecker dE 2000 * | 1.8 | 3.39 -88% | 1.7 6% | 0.7 61% | 4.5 -150% |
| Colorchecker dE 2000 max. * | 3.4 | 7.3 -115% | 2.2 35% | 1.8 47% | 10.7 -215% |
| Colorchecker dE 2000 calibrated * | 1.4 | 1.67 -19% | 0.8 43% | 1.8 -29% | |
| Greyscale dE 2000 * | 2.5 | 3.9 -56% | 3.1 -24% | 0.8 68% | 7.2 -188% |
| Gamma | 2.15 102% | 2.17 101% | 2.12 104% | 2.18 101% | 2.15 102% |
| CCT | 7017 93% | 7340 89% | 6616 98% | 6505 100% | 6541 99% |
| Całkowita średnia (program / ustawienia) | 4% /
-25% | 44% /
28% | 115% /
159% | -14% /
-49% |
* ... im mniej tym lepiej
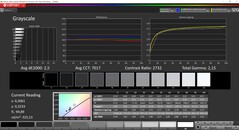
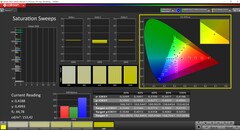
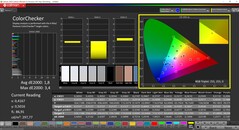
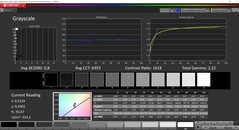
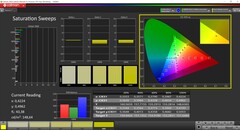
Parametry panelu zmierzyliśmy za pomocą profesjonalnego oprogramowania CalMAN, korzystając z profilu Default. Test skali szarości ujawnił lekki niebieski odcień i nieco zbyt niską temperaturę barwową. W przypadku kolorów odchylenia od kolorów referencyjnych sRGB są jednak poniżej progu 3, co oznacza, że są one wyświetlane w wystarczająco naturalny sposób.
Po zastosowaniu naszego profilu kalibracyjnego (plik jest dostępny do bezpłatnego pobrania powyżej), widoczna jest niewielka poprawa skali szarości i kolorów. Tak czy inaczej, panel pokrywa całe spektrum sRGB, co oznacza, że edycja obrazu nie stanowi problemu z Schenkerem.
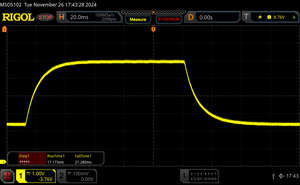
Wyświetl czasy reakcji
| ↔ Czas reakcji od czerni do bieli | ||
|---|---|---|
| 24.6 ms ... wzrost ↗ i spadek ↘ łącznie | ↗ 11.9 ms wzrost | |
| ↘ 12.6 ms upadek | ||
| W naszych testach ekran wykazuje dobry współczynnik reakcji, ale może być zbyt wolny dla graczy rywalizujących ze sobą. Dla porównania, wszystkie testowane urządzenia wahają się od 0.1 (minimum) do 240 (maksimum) ms. » 55 % wszystkich urządzeń jest lepszych. Oznacza to, że zmierzony czas reakcji jest gorszy od średniej wszystkich testowanych urządzeń (20.8 ms). | ||
| ↔ Czas reakcji 50% szarości do 80% szarości | ||
| 38.5 ms ... wzrost ↗ i spadek ↘ łącznie | ↗ 17.2 ms wzrost | |
| ↘ 21.3 ms upadek | ||
| W naszych testach ekran wykazuje powolne tempo reakcji, co będzie niezadowalające dla graczy. Dla porównania, wszystkie testowane urządzenia wahają się od 0.165 (minimum) do 636 (maksimum) ms. » 55 % wszystkich urządzeń jest lepszych. Oznacza to, że zmierzony czas reakcji jest gorszy od średniej wszystkich testowanych urządzeń (32.5 ms). | ||
Migotanie ekranu / PWM (modulacja szerokości impulsu)
| Migotanie ekranu/nie wykryto PWM | |||
Dla porównania: 53 % wszystkich testowanych urządzeń nie używa PWM do przyciemniania wyświetlacza. Jeśli wykryto PWM, zmierzono średnio 8516 (minimum: 5 - maksimum: 343500) Hz. | |||
Wydajność - Core Ultra w połączeniu z maksymalnie 96 GB pamięci RAM
Warunki testowania
Key 14 jest wyposażony w najnowsze Command Center 3.0, oferujące szereg ustawień i trzy profile energetyczne: Cichy, Rozrywka i Wydajność. Każdy profil ma kilka podprofili, a ponadto istnieje możliwość ręcznego dostosowania krzywych wentylatorów. Aby osiągnąć maksymalny docelowy pobór mocy GPU na poziomie 100 W, należy użyć profilu Wydajność z podprofilem Turbo, który aktywowaliśmy na potrzeby poniższych testów wydajności.
Procesor
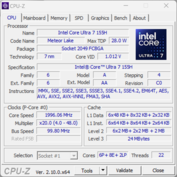
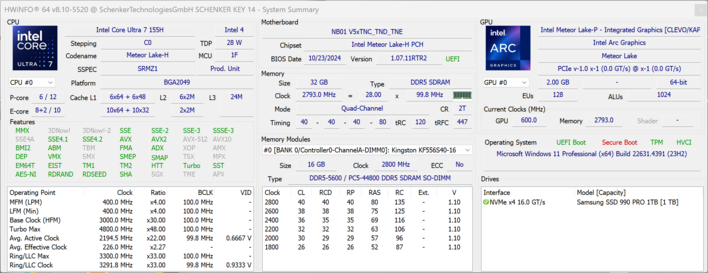
Zastosowany procesor to Core Ultra 7 155H z generacji Meteor Lake. Schenker pozwala mu zużywać nawet 65 watów; liczba ta ostatecznie ustabilizowała się na poziomie 54 watów. W rezultacie wydajność procesora jest tutaj stosunkowo stała, nawet przy długotrwałym obciążeniu.
To powiedziawszy, konkurencja zbudowana wokół procesorów AMD Ryzen zapewnia wyższą wydajność wielordzeniową, przy czym Ryzen AI 9 HX 370 jest znacznie szybszy niż Core Ultra 7.
Na baterii procesor zużywa maksymalnie 45 watów, by chwilę później ustabilizować się na poziomie 40 watów. Skutkuje to spadkiem wydajności o około 14% w testach wielordzeniowych w porównaniu do pracy na zasilaniu sieciowym. Dodatkowe testy porównawcze procesora są dostępne w naszej sekcji technicznej.
Cinebench R15 Multi loop
Cinebench R23: Multi Core | Single Core
Cinebench R20: CPU (Multi Core) | CPU (Single Core)
Cinebench R15: CPU Multi 64Bit | CPU Single 64Bit
Blender: v2.79 BMW27 CPU
7-Zip 18.03: 7z b 4 | 7z b 4 -mmt1
Geekbench 6.4: Multi-Core | Single-Core
Geekbench 5.5: Multi-Core | Single-Core
HWBOT x265 Benchmark v2.2: 4k Preset
LibreOffice : 20 Documents To PDF
R Benchmark 2.5: Overall mean
| CPU Performance Rating | |
| Asus TUF Gaming A14 FA401WV-WB94 | |
| Asus ROG Zephyrus G14 2024 GA403U | |
| Średnia w klasie Multimedia | |
| SCHENKER Key 14 (M24) | |
| Dell XPS 14 2024 OLED | |
| Acer Nitro 14 AN14-41-R3MX | |
| Przeciętny Intel Core Ultra 7 155H | |
| Cinebench R23 / Multi Core | |
| Asus TUF Gaming A14 FA401WV-WB94 | |
| Asus ROG Zephyrus G14 2024 GA403U | |
| Średnia w klasie Multimedia (4861 - 30789, n=96, ostatnie 2 lata) | |
| SCHENKER Key 14 (M24) | |
| Przeciętny Intel Core Ultra 7 155H (9769 - 19007, n=52) | |
| Dell XPS 14 2024 OLED | |
| Acer Nitro 14 AN14-41-R3MX | |
| Cinebench R23 / Single Core | |
| Asus TUF Gaming A14 FA401WV-WB94 | |
| Średnia w klasie Multimedia (878 - 2290, n=87, ostatnie 2 lata) | |
| Asus ROG Zephyrus G14 2024 GA403U | |
| Dell XPS 14 2024 OLED | |
| Przeciętny Intel Core Ultra 7 155H (1496 - 1815, n=52) | |
| Acer Nitro 14 AN14-41-R3MX | |
| SCHENKER Key 14 (M24) | |
| Cinebench R20 / CPU (Multi Core) | |
| Asus TUF Gaming A14 FA401WV-WB94 | |
| Asus ROG Zephyrus G14 2024 GA403U | |
| Dell XPS 14 2024 OLED | |
| SCHENKER Key 14 (M24) | |
| Średnia w klasie Multimedia (1887 - 11924, n=80, ostatnie 2 lata) | |
| Przeciętny Intel Core Ultra 7 155H (3798 - 7409, n=50) | |
| Acer Nitro 14 AN14-41-R3MX | |
| Cinebench R20 / CPU (Single Core) | |
| Asus TUF Gaming A14 FA401WV-WB94 | |
| Asus ROG Zephyrus G14 2024 GA403U | |
| Średnia w klasie Multimedia (341 - 853, n=80, ostatnie 2 lata) | |
| Dell XPS 14 2024 OLED | |
| Acer Nitro 14 AN14-41-R3MX | |
| Przeciętny Intel Core Ultra 7 155H (601 - 696, n=50) | |
| SCHENKER Key 14 (M24) | |
| Cinebench R15 / CPU Multi 64Bit | |
| Asus TUF Gaming A14 FA401WV-WB94 | |
| Asus ROG Zephyrus G14 2024 GA403U | |
| Dell XPS 14 2024 OLED | |
| Średnia w klasie Multimedia (856 - 5224, n=87, ostatnie 2 lata) | |
| SCHENKER Key 14 (M24) | |
| Przeciętny Intel Core Ultra 7 155H (1932 - 2880, n=56) | |
| Acer Nitro 14 AN14-41-R3MX | |
| Cinebench R15 / CPU Single 64Bit | |
| Asus TUF Gaming A14 FA401WV-WB94 | |
| Asus ROG Zephyrus G14 2024 GA403U | |
| Acer Nitro 14 AN14-41-R3MX | |
| Średnia w klasie Multimedia (99.6 - 323, n=82, ostatnie 2 lata) | |
| Dell XPS 14 2024 OLED | |
| Przeciętny Intel Core Ultra 7 155H (99.6 - 268, n=52) | |
| SCHENKER Key 14 (M24) | |
| Blender / v2.79 BMW27 CPU | |
| Dell XPS 14 2024 OLED | |
| Średnia w klasie Multimedia (100 - 557, n=80, ostatnie 2 lata) | |
| Acer Nitro 14 AN14-41-R3MX | |
| Przeciętny Intel Core Ultra 7 155H (175 - 381, n=47) | |
| SCHENKER Key 14 (M24) | |
| Asus ROG Zephyrus G14 2024 GA403U | |
| Asus TUF Gaming A14 FA401WV-WB94 | |
| 7-Zip 18.03 / 7z b 4 | |
| Asus TUF Gaming A14 FA401WV-WB94 | |
| Asus ROG Zephyrus G14 2024 GA403U | |
| SCHENKER Key 14 (M24) | |
| Średnia w klasie Multimedia (29095 - 130368, n=75, ostatnie 2 lata) | |
| Przeciętny Intel Core Ultra 7 155H (41739 - 70254, n=50) | |
| Acer Nitro 14 AN14-41-R3MX | |
| Dell XPS 14 2024 OLED | |
| 7-Zip 18.03 / 7z b 4 -mmt1 | |
| Acer Nitro 14 AN14-41-R3MX | |
| Asus TUF Gaming A14 FA401WV-WB94 | |
| Asus ROG Zephyrus G14 2024 GA403U | |
| Średnia w klasie Multimedia (3398 - 7545, n=75, ostatnie 2 lata) | |
| SCHENKER Key 14 (M24) | |
| Dell XPS 14 2024 OLED | |
| Przeciętny Intel Core Ultra 7 155H (4594 - 5621, n=50) | |
| Geekbench 6.4 / Multi-Core | |
| Asus TUF Gaming A14 FA401WV-WB94 | |
| Średnia w klasie Multimedia (4983 - 25760, n=77, ostatnie 2 lata) | |
| Dell XPS 14 2024 OLED | |
| Asus ROG Zephyrus G14 2024 GA403U | |
| SCHENKER Key 14 (M24) | |
| Przeciętny Intel Core Ultra 7 155H (7732 - 13656, n=55) | |
| Acer Nitro 14 AN14-41-R3MX | |
| Geekbench 6.4 / Single-Core | |
| Asus TUF Gaming A14 FA401WV-WB94 | |
| Średnia w klasie Multimedia (1534 - 3927, n=73, ostatnie 2 lata) | |
| Asus ROG Zephyrus G14 2024 GA403U | |
| Acer Nitro 14 AN14-41-R3MX | |
| Dell XPS 14 2024 OLED | |
| Przeciętny Intel Core Ultra 7 155H (1901 - 2473, n=52) | |
| SCHENKER Key 14 (M24) | |
| Geekbench 5.5 / Multi-Core | |
| Asus TUF Gaming A14 FA401WV-WB94 | |
| Dell XPS 14 2024 OLED | |
| SCHENKER Key 14 (M24) | |
| Średnia w klasie Multimedia (4652 - 23059, n=79, ostatnie 2 lata) | |
| Przeciętny Intel Core Ultra 7 155H (10017 - 13556, n=52) | |
| Asus ROG Zephyrus G14 2024 GA403U | |
| Acer Nitro 14 AN14-41-R3MX | |
| Geekbench 5.5 / Single-Core | |
| Asus TUF Gaming A14 FA401WV-WB94 | |
| Acer Nitro 14 AN14-41-R3MX | |
| Średnia w klasie Multimedia (891 - 2555, n=79, ostatnie 2 lata) | |
| Asus ROG Zephyrus G14 2024 GA403U | |
| Dell XPS 14 2024 OLED | |
| Przeciętny Intel Core Ultra 7 155H (1462 - 1824, n=52) | |
| SCHENKER Key 14 (M24) | |
| HWBOT x265 Benchmark v2.2 / 4k Preset | |
| Asus TUF Gaming A14 FA401WV-WB94 | |
| Asus ROG Zephyrus G14 2024 GA403U | |
| Acer Nitro 14 AN14-41-R3MX | |
| Średnia w klasie Multimedia (5.26 - 34.3, n=74, ostatnie 2 lata) | |
| Przeciętny Intel Core Ultra 7 155H (9.93 - 21.2, n=50) | |
| Dell XPS 14 2024 OLED | |
| SCHENKER Key 14 (M24) | |
| LibreOffice / 20 Documents To PDF | |
| Asus ROG Zephyrus G14 2024 GA403U | |
| Asus TUF Gaming A14 FA401WV-WB94 | |
| Średnia w klasie Multimedia (23.9 - 146.7, n=76, ostatnie 2 lata) | |
| Dell XPS 14 2024 OLED | |
| Przeciętny Intel Core Ultra 7 155H (37.5 - 79.2, n=49) | |
| Acer Nitro 14 AN14-41-R3MX | |
| SCHENKER Key 14 (M24) | |
| R Benchmark 2.5 / Overall mean | |
| SCHENKER Key 14 (M24) | |
| Przeciętny Intel Core Ultra 7 155H (0.4457 - 0.53, n=49) | |
| Średnia w klasie Multimedia (0.3604 - 0.947, n=74, ostatnie 2 lata) | |
| Dell XPS 14 2024 OLED | |
| Acer Nitro 14 AN14-41-R3MX | |
| Asus ROG Zephyrus G14 2024 GA403U | |
| Asus TUF Gaming A14 FA401WV-WB94 | |
* ... im mniej tym lepiej
AIDA64: FP32 Ray-Trace | FPU Julia | CPU SHA3 | CPU Queen | FPU SinJulia | FPU Mandel | CPU AES | CPU ZLib | FP64 Ray-Trace | CPU PhotoWorxx
| Performance Rating | |
| Asus TUF Gaming A14 FA401WV-WB94 | |
| Asus ROG Zephyrus G14 2024 GA403U | |
| Acer Nitro 14 AN14-41-R3MX | |
| Średnia w klasie Multimedia | |
| SCHENKER Key 14 (M24) | |
| Przeciętny Intel Core Ultra 7 155H | |
| Dell XPS 14 2024 OLED | |
| AIDA64 / FP32 Ray-Trace | |
| Asus TUF Gaming A14 FA401WV-WB94 | |
| Asus ROG Zephyrus G14 2024 GA403U | |
| Acer Nitro 14 AN14-41-R3MX | |
| Średnia w klasie Multimedia (5121 - 50388, n=73, ostatnie 2 lata) | |
| SCHENKER Key 14 (M24) | |
| Przeciętny Intel Core Ultra 7 155H (6670 - 18470, n=50) | |
| Dell XPS 14 2024 OLED | |
| AIDA64 / FPU Julia | |
| Asus TUF Gaming A14 FA401WV-WB94 | |
| Asus ROG Zephyrus G14 2024 GA403U | |
| Acer Nitro 14 AN14-41-R3MX | |
| Średnia w klasie Multimedia (14528 - 201874, n=74, ostatnie 2 lata) | |
| SCHENKER Key 14 (M24) | |
| Przeciętny Intel Core Ultra 7 155H (40905 - 93181, n=50) | |
| Dell XPS 14 2024 OLED | |
| AIDA64 / CPU SHA3 | |
| Asus TUF Gaming A14 FA401WV-WB94 | |
| Asus ROG Zephyrus G14 2024 GA403U | |
| Acer Nitro 14 AN14-41-R3MX | |
| Średnia w klasie Multimedia (1188 - 8623, n=74, ostatnie 2 lata) | |
| SCHENKER Key 14 (M24) | |
| Przeciętny Intel Core Ultra 7 155H (1940 - 4436, n=50) | |
| Dell XPS 14 2024 OLED | |
| AIDA64 / CPU Queen | |
| Asus ROG Zephyrus G14 2024 GA403U | |
| Acer Nitro 14 AN14-41-R3MX | |
| Asus TUF Gaming A14 FA401WV-WB94 | |
| Średnia w klasie Multimedia (21547 - 181505, n=74, ostatnie 2 lata) | |
| SCHENKER Key 14 (M24) | |
| Dell XPS 14 2024 OLED | |
| Przeciętny Intel Core Ultra 7 155H (64698 - 94181, n=50) | |
| AIDA64 / FPU SinJulia | |
| Asus TUF Gaming A14 FA401WV-WB94 | |
| Asus ROG Zephyrus G14 2024 GA403U | |
| Acer Nitro 14 AN14-41-R3MX | |
| Średnia w klasie Multimedia (1240 - 28794, n=74, ostatnie 2 lata) | |
| SCHENKER Key 14 (M24) | |
| Przeciętny Intel Core Ultra 7 155H (5639 - 10647, n=50) | |
| Dell XPS 14 2024 OLED | |
| AIDA64 / FPU Mandel | |
| Asus TUF Gaming A14 FA401WV-WB94 | |
| Asus ROG Zephyrus G14 2024 GA403U | |
| Acer Nitro 14 AN14-41-R3MX | |
| Średnia w klasie Multimedia (9903 - 105740, n=73, ostatnie 2 lata) | |
| SCHENKER Key 14 (M24) | |
| Przeciętny Intel Core Ultra 7 155H (18236 - 47685, n=50) | |
| Dell XPS 14 2024 OLED | |
| AIDA64 / CPU AES | |
| Asus ROG Zephyrus G14 2024 GA403U | |
| Asus TUF Gaming A14 FA401WV-WB94 | |
| Przeciętny Intel Core Ultra 7 155H (45713 - 152179, n=50) | |
| Średnia w klasie Multimedia (26066 - 169946, n=74, ostatnie 2 lata) | |
| SCHENKER Key 14 (M24) | |
| Dell XPS 14 2024 OLED | |
| Acer Nitro 14 AN14-41-R3MX | |
| AIDA64 / CPU ZLib | |
| Asus TUF Gaming A14 FA401WV-WB94 | |
| Asus ROG Zephyrus G14 2024 GA403U | |
| SCHENKER Key 14 (M24) | |
| Średnia w klasie Multimedia (440 - 2022, n=74, ostatnie 2 lata) | |
| Przeciętny Intel Core Ultra 7 155H (557 - 1250, n=50) | |
| Dell XPS 14 2024 OLED | |
| Acer Nitro 14 AN14-41-R3MX | |
| AIDA64 / FP64 Ray-Trace | |
| Asus TUF Gaming A14 FA401WV-WB94 | |
| Asus ROG Zephyrus G14 2024 GA403U | |
| Acer Nitro 14 AN14-41-R3MX | |
| Średnia w klasie Multimedia (2759 - 26875, n=74, ostatnie 2 lata) | |
| SCHENKER Key 14 (M24) | |
| Przeciętny Intel Core Ultra 7 155H (3569 - 9802, n=50) | |
| Dell XPS 14 2024 OLED | |
| AIDA64 / CPU PhotoWorxx | |
| Dell XPS 14 2024 OLED | |
| SCHENKER Key 14 (M24) | |
| Przeciętny Intel Core Ultra 7 155H (32719 - 54223, n=50) | |
| Średnia w klasie Multimedia (12860 - 58844, n=74, ostatnie 2 lata) | |
| Asus ROG Zephyrus G14 2024 GA403U | |
| Asus TUF Gaming A14 FA401WV-WB94 | |
| Acer Nitro 14 AN14-41-R3MX | |
Wydajność systemu
Key 14 jest dość responsywny w codziennym użytkowaniu, a syntetyczne testy porównawcze mniej więcej potwierdzają nasze subiektywne wrażenie. Nie doświadczyliśmy również żadnych problemów podczas korzystania z egzemplarza próbnego.
CrossMark: Overall | Productivity | Creativity | Responsiveness
WebXPRT 3: Overall
WebXPRT 4: Overall
Mozilla Kraken 1.1: Total
| PCMark 10 / Score | |
| Asus TUF Gaming A14 FA401WV-WB94 | |
| Acer Nitro 14 AN14-41-R3MX | |
| Asus ROG Zephyrus G14 2024 GA403U | |
| Przeciętny Intel Core Ultra 7 155H, NVIDIA GeForce RTX 4060 Laptop GPU (6751 - 7370, n=5) | |
| Średnia w klasie Multimedia (4325 - 8670, n=70, ostatnie 2 lata) | |
| SCHENKER Key 14 (M24) | |
| Dell XPS 14 2024 OLED | |
| PCMark 10 / Essentials | |
| Średnia w klasie Multimedia (8025 - 12420, n=70, ostatnie 2 lata) | |
| Asus TUF Gaming A14 FA401WV-WB94 | |
| SCHENKER Key 14 (M24) | |
| Dell XPS 14 2024 OLED | |
| Przeciętny Intel Core Ultra 7 155H, NVIDIA GeForce RTX 4060 Laptop GPU (9476 - 10446, n=5) | |
| Asus ROG Zephyrus G14 2024 GA403U | |
| Acer Nitro 14 AN14-41-R3MX | |
| PCMark 10 / Productivity | |
| Acer Nitro 14 AN14-41-R3MX | |
| Asus TUF Gaming A14 FA401WV-WB94 | |
| Asus ROG Zephyrus G14 2024 GA403U | |
| Średnia w klasie Multimedia (6089 - 10615, n=70, ostatnie 2 lata) | |
| Dell XPS 14 2024 OLED | |
| Przeciętny Intel Core Ultra 7 155H, NVIDIA GeForce RTX 4060 Laptop GPU (8079 - 9477, n=5) | |
| SCHENKER Key 14 (M24) | |
| PCMark 10 / Digital Content Creation | |
| Asus TUF Gaming A14 FA401WV-WB94 | |
| Asus ROG Zephyrus G14 2024 GA403U | |
| Acer Nitro 14 AN14-41-R3MX | |
| Przeciętny Intel Core Ultra 7 155H, NVIDIA GeForce RTX 4060 Laptop GPU (9811 - 11620, n=5) | |
| SCHENKER Key 14 (M24) | |
| Średnia w klasie Multimedia (3651 - 13548, n=70, ostatnie 2 lata) | |
| Dell XPS 14 2024 OLED | |
| CrossMark / Overall | |
| Asus ROG Zephyrus G14 2024 GA403U | |
| Acer Nitro 14 AN14-41-R3MX | |
| SCHENKER Key 14 (M24) | |
| Średnia w klasie Multimedia (866 - 2255, n=81, ostatnie 2 lata) | |
| Asus TUF Gaming A14 FA401WV-WB94 | |
| Dell XPS 14 2024 OLED | |
| Przeciętny Intel Core Ultra 7 155H, NVIDIA GeForce RTX 4060 Laptop GPU (1540 - 1746, n=5) | |
| CrossMark / Productivity | |
| Acer Nitro 14 AN14-41-R3MX | |
| Asus ROG Zephyrus G14 2024 GA403U | |
| SCHENKER Key 14 (M24) | |
| Średnia w klasie Multimedia (913 - 2050, n=81, ostatnie 2 lata) | |
| Przeciętny Intel Core Ultra 7 155H, NVIDIA GeForce RTX 4060 Laptop GPU (1436 - 1684, n=5) | |
| Dell XPS 14 2024 OLED | |
| Asus TUF Gaming A14 FA401WV-WB94 | |
| CrossMark / Creativity | |
| Asus TUF Gaming A14 FA401WV-WB94 | |
| Asus ROG Zephyrus G14 2024 GA403U | |
| Średnia w klasie Multimedia (907 - 2795, n=81, ostatnie 2 lata) | |
| Dell XPS 14 2024 OLED | |
| Przeciętny Intel Core Ultra 7 155H, NVIDIA GeForce RTX 4060 Laptop GPU (1811 - 1929, n=5) | |
| SCHENKER Key 14 (M24) | |
| Acer Nitro 14 AN14-41-R3MX | |
| CrossMark / Responsiveness | |
| Acer Nitro 14 AN14-41-R3MX | |
| SCHENKER Key 14 (M24) | |
| Asus ROG Zephyrus G14 2024 GA403U | |
| Średnia w klasie Multimedia (605 - 2094, n=81, ostatnie 2 lata) | |
| Przeciętny Intel Core Ultra 7 155H, NVIDIA GeForce RTX 4060 Laptop GPU (1165 - 1631, n=5) | |
| Dell XPS 14 2024 OLED | |
| Asus TUF Gaming A14 FA401WV-WB94 | |
| WebXPRT 3 / Overall | |
| Średnia w klasie Multimedia (136.4 - 545, n=81, ostatnie 2 lata) | |
| Asus ROG Zephyrus G14 2024 GA403U | |
| Acer Nitro 14 AN14-41-R3MX | |
| Asus TUF Gaming A14 FA401WV-WB94 | |
| Przeciętny Intel Core Ultra 7 155H, NVIDIA GeForce RTX 4060 Laptop GPU (274 - 290, n=5) | |
| Dell XPS 14 2024 OLED | |
| SCHENKER Key 14 (M24) | |
| WebXPRT 4 / Overall | |
| Średnia w klasie Multimedia (133.2 - 353, n=75, ostatnie 2 lata) | |
| Dell XPS 14 2024 OLED | |
| Asus TUF Gaming A14 FA401WV-WB94 | |
| Przeciętny Intel Core Ultra 7 155H, NVIDIA GeForce RTX 4060 Laptop GPU (236 - 262, n=5) | |
| Asus ROG Zephyrus G14 2024 GA403U | |
| Acer Nitro 14 AN14-41-R3MX | |
| SCHENKER Key 14 (M24) | |
| Mozilla Kraken 1.1 / Total | |
| SCHENKER Key 14 (M24) | |
| Przeciętny Intel Core Ultra 7 155H, NVIDIA GeForce RTX 4060 Laptop GPU (519 - 585, n=5) | |
| Acer Nitro 14 AN14-41-R3MX | |
| Dell XPS 14 2024 OLED | |
| Asus ROG Zephyrus G14 2024 GA403U | |
| Średnia w klasie Multimedia (254 - 1016, n=86, ostatnie 2 lata) | |
| Asus TUF Gaming A14 FA401WV-WB94 | |
* ... im mniej tym lepiej
| PCMark 10 Score | 6751 pkt. | |
Pomoc | ||
| AIDA64 / Memory Copy | |
| Dell XPS 14 2024 OLED | |
| Asus TUF Gaming A14 FA401WV-WB94 | |
| Przeciętny Intel Core Ultra 7 155H (62397 - 96791, n=50) | |
| SCHENKER Key 14 (M24) | |
| Średnia w klasie Multimedia (21158 - 104459, n=74, ostatnie 2 lata) | |
| Acer Nitro 14 AN14-41-R3MX | |
| Asus ROG Zephyrus G14 2024 GA403U | |
| AIDA64 / Memory Read | |
| Asus TUF Gaming A14 FA401WV-WB94 | |
| Dell XPS 14 2024 OLED | |
| SCHENKER Key 14 (M24) | |
| Przeciętny Intel Core Ultra 7 155H (60544 - 90647, n=50) | |
| Średnia w klasie Multimedia (24312 - 125604, n=74, ostatnie 2 lata) | |
| Acer Nitro 14 AN14-41-R3MX | |
| Asus ROG Zephyrus G14 2024 GA403U | |
| AIDA64 / Memory Write | |
| Asus TUF Gaming A14 FA401WV-WB94 | |
| Asus ROG Zephyrus G14 2024 GA403U | |
| Acer Nitro 14 AN14-41-R3MX | |
| SCHENKER Key 14 (M24) | |
| Dell XPS 14 2024 OLED | |
| Przeciętny Intel Core Ultra 7 155H (58692 - 93451, n=50) | |
| Średnia w klasie Multimedia (23679 - 117933, n=74, ostatnie 2 lata) | |
| AIDA64 / Memory Latency | |
| Przeciętny Intel Core Ultra 7 155H (116.2 - 233, n=50) | |
| Dell XPS 14 2024 OLED | |
| Asus TUF Gaming A14 FA401WV-WB94 | |
| SCHENKER Key 14 (M24) | |
| Asus ROG Zephyrus G14 2024 GA403U | |
| Średnia w klasie Multimedia (7 - 346, n=74, ostatnie 2 lata) | |
| Acer Nitro 14 AN14-41-R3MX | |
* ... im mniej tym lepiej
Opóźnienia DPC
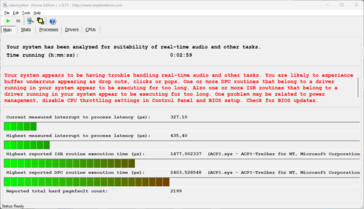
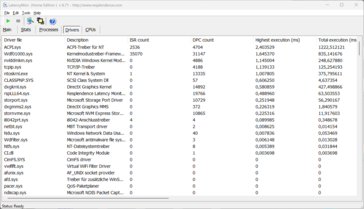
W naszym standardowym teście opóźnień (przeglądanie Internetu, odtwarzanie YouTube 4K, obciążenie procesora za pomocą Prime95), jeden ze sterowników sprawiał trochę problemów, ale ważna wartość "interrupt-to-process latency" wciąż pozostawała na bardzo niskim poziomie. Dlatego też nie powinno być żadnych problemów podczas pracy z dźwiękiem lub wideo w czasie rzeczywistym.
| DPC Latencies / LatencyMon - interrupt to process latency (max), Web, Youtube, Prime95 | |
| Dell XPS 14 2024 OLED | |
| Acer Nitro 14 AN14-41-R3MX | |
| Asus ROG Zephyrus G14 2024 GA403U | |
| SCHENKER Key 14 (M24) | |
* ... im mniej tym lepiej
Urządzenia pamięci masowej
Key 14 może być wyposażony w różne dyski SSD PCIe 4 M.2 2280. Urządzenie testowe jest wyposażone w 1 TB Samsung SSD 990 Pro, który jest o 64 euro droższy w porównaniu do podstawowej opcji 500 GB Samsung 980.
Dysk SSD zapewnia doskonałe prędkości transferu bez spadków wydajności nawet przy długotrwałym obciążeniu. Po wstępnej konfiguracji dostępnych jest około 890 GB. Więcej SSD można znaleźć tutaj.
* ... im mniej tym lepiej
Disk throttling: DiskSpd Read Loop, Queue Depth 8
Wydajność GPU
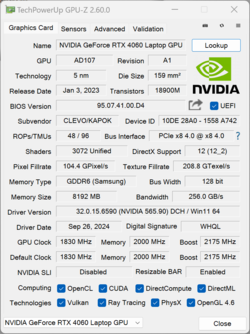
Key 14 jest dostępny z procesorami graficznymi GeForce RTX 4060 lub GeForce RTX 4070. Ta druga opcja sprawia, że cały pakiet jest droższy o 295 euro. W obu przypadkach maksymalna docelowa moc TGP jest ustawiona na 100 watów (75 W TGP + 25 W Dynamic Boost) i jest 8 GB pamięci VRAM. GeForce Na pokładzie znajduje się również certyfikat RTX Studio. Przełącznik MUX jest obecny.
Mieliśmy okazję przeprowadzić syntetyczne i gamingowe testy porównawcze na obu wariantach. Laptop RTX 4070 jest o około 16% szybszy w syntetycznych testach porównawczych, ale tylko o 7% szybszy w testowanych grach. Wydajność RTX 4060 Laptop jest wystarczająca do płynnego uruchomienia wszystkich 2024 gier w rozdzielczości Full HD na maksymalnych ustawieniach i pozostaje stabilna nawet przy dłuższym obciążeniu.
Na baterii GPU jest ograniczone do maksymalnie 40 watów, co skutkuje spadkiem wydajności o około 30%. Więcej testów porównawczych GPU można znaleźć dostępne są tutaj.
| 3DMark Performance Rating - Percent | |
| SCHENKER Key 14 (M24) | |
| Acer Nitro 14 AN14-41-R3MX | |
| Asus ROG Zephyrus G14 2024 GA403U | |
| Asus TUF Gaming A14 FA401WV-WB94 | |
| SCHENKER Key 14 (M24) | |
| Przeciętny NVIDIA GeForce RTX 4060 Laptop GPU | |
| Średnia w klasie Multimedia | |
| Dell XPS 14 2024 OLED | |
| 3DMark 11 Performance | 28106 pkt. | |
| 3DMark Fire Strike Score | 18863 pkt. | |
| 3DMark Time Spy Score | 10037 pkt. | |
| 3DMark Steel Nomad Score | 2236 pkt. | |
| 3DMark Steel Nomad Light Score | 9967 pkt. | |
Pomoc | ||
| Blender / v3.3 Classroom OPTIX/RTX | |
| Średnia w klasie Multimedia (19 - 105, n=39, ostatnie 2 lata) | |
| Dell XPS 14 2024 OLED | |
| Asus ROG Zephyrus G14 2024 GA403U | |
| Przeciętny NVIDIA GeForce RTX 4060 Laptop GPU (19 - 28, n=53) | |
| Asus TUF Gaming A14 FA401WV-WB94 | |
| Acer Nitro 14 AN14-41-R3MX | |
| SCHENKER Key 14 (M24) | |
| SCHENKER Key 14 (M24) | |
| Blender / v3.3 Classroom CUDA | |
| Dell XPS 14 2024 OLED | |
| Średnia w klasie Multimedia (32 - 164, n=39, ostatnie 2 lata) | |
| Przeciętny NVIDIA GeForce RTX 4060 Laptop GPU (39 - 53, n=53) | |
| SCHENKER Key 14 (M24) | |
| Asus TUF Gaming A14 FA401WV-WB94 | |
| Acer Nitro 14 AN14-41-R3MX | |
| Asus ROG Zephyrus G14 2024 GA403U | |
| SCHENKER Key 14 (M24) | |
| Blender / v3.3 Classroom CPU | |
| Dell XPS 14 2024 OLED | |
| Średnia w klasie Multimedia (160 - 1042, n=80, ostatnie 2 lata) | |
| Acer Nitro 14 AN14-41-R3MX | |
| SCHENKER Key 14 (M24) | |
| SCHENKER Key 14 (M24) | |
| Asus ROG Zephyrus G14 2024 GA403U | |
| Przeciętny NVIDIA GeForce RTX 4060 Laptop GPU (189 - 452, n=53) | |
| Asus TUF Gaming A14 FA401WV-WB94 | |
* ... im mniej tym lepiej
| Performance Rating - Percent | |
| Acer Nitro 14 AN14-41-R3MX | |
| Asus TUF Gaming A14 FA401WV-WB94 | |
| Asus ROG Zephyrus G14 2024 GA403U -1! | |
| SCHENKER Key 14 (M24) | |
| SCHENKER Key 14 (M24) | |
| Dell XPS 14 2024 OLED | |
| Średnia w klasie Multimedia | |
| Cyberpunk 2077 2.2 Phantom Liberty - 1920x1080 Ultra Preset (FSR off) | |
| Acer Nitro 14 AN14-41-R3MX | |
| Asus ROG Zephyrus G14 2024 GA403U | |
| Asus TUF Gaming A14 FA401WV-WB94 | |
| SCHENKER Key 14 (M24) | |
| SCHENKER Key 14 (M24) | |
| Dell XPS 14 2024 OLED | |
| Średnia w klasie Multimedia (8.26 - 86, n=63, ostatnie 2 lata) | |
| Baldur's Gate 3 - 1920x1080 Ultra Preset | |
| Acer Nitro 14 AN14-41-R3MX | |
| Asus TUF Gaming A14 FA401WV-WB94 | |
| SCHENKER Key 14 (M24) | |
| SCHENKER Key 14 (M24) | |
| Dell XPS 14 2024 OLED | |
| Średnia w klasie Multimedia (9.1 - 117.7, n=51, ostatnie 2 lata) | |
| GTA V - 1920x1080 Highest Settings possible AA:4xMSAA + FX AF:16x | |
| Asus TUF Gaming A14 FA401WV-WB94 | |
| Acer Nitro 14 AN14-41-R3MX | |
| Asus ROG Zephyrus G14 2024 GA403U | |
| SCHENKER Key 14 (M24) | |
| SCHENKER Key 14 (M24) | |
| Dell XPS 14 2024 OLED | |
| Średnia w klasie Multimedia (9.38 - 141.6, n=77, ostatnie 2 lata) | |
| Final Fantasy XV Benchmark - 1920x1080 High Quality | |
| Acer Nitro 14 AN14-41-R3MX | |
| SCHENKER Key 14 (M24) | |
| Asus ROG Zephyrus G14 2024 GA403U | |
| Asus TUF Gaming A14 FA401WV-WB94 | |
| SCHENKER Key 14 (M24) | |
| Dell XPS 14 2024 OLED | |
| Średnia w klasie Multimedia (7.61 - 141.8, n=78, ostatnie 2 lata) | |
| Strange Brigade - 1920x1080 ultra AA:ultra AF:16 | |
| SCHENKER Key 14 (M24) | |
| Asus TUF Gaming A14 FA401WV-WB94 | |
| Acer Nitro 14 AN14-41-R3MX | |
| Asus ROG Zephyrus G14 2024 GA403U | |
| SCHENKER Key 14 (M24) | |
| Dell XPS 14 2024 OLED | |
| Średnia w klasie Multimedia (13.3 - 233, n=78, ostatnie 2 lata) | |
| Dota 2 Reborn - 1920x1080 ultra (3/3) best looking | |
| Asus TUF Gaming A14 FA401WV-WB94 | |
| SCHENKER Key 14 (M24) | |
| SCHENKER Key 14 (M24) | |
| Asus ROG Zephyrus G14 2024 GA403U | |
| Acer Nitro 14 AN14-41-R3MX | |
| Dell XPS 14 2024 OLED | |
| Średnia w klasie Multimedia (29 - 179.9, n=79, ostatnie 2 lata) | |
| X-Plane 11.11 - 1920x1080 high (fps_test=3) | |
| SCHENKER Key 14 (M24) | |
| SCHENKER Key 14 (M24) | |
| Asus ROG Zephyrus G14 2024 GA403U | |
| Dell XPS 14 2024 OLED | |
| Acer Nitro 14 AN14-41-R3MX | |
| Asus TUF Gaming A14 FA401WV-WB94 | |
| Średnia w klasie Multimedia (16.9 - 141.1, n=76, ostatnie 2 lata) | |
Cyberpunk 2077 Ultra fps chart
| low | med. | high | ultra | QHD | |
|---|---|---|---|---|---|
| GTA V (2015) | 167 | 158.8 | 141.1 | 79.7 | 72.3 |
| Dota 2 Reborn (2015) | 167.5 | 141.1 | 136.5 | 122.6 | |
| Final Fantasy XV Benchmark (2018) | 156.8 | 121.1 | 94 | 72.4 | |
| X-Plane 11.11 (2018) | 123.1 | 103.2 | 84.6 | ||
| Far Cry 5 (2018) | 130 | 116 | 112 | 106 | |
| Strange Brigade (2018) | 341 | 255 | 214 | 186 | 125 |
| Baldur's Gate 3 (2023) | 124.5 | 104.2 | 77.6 | 66.9 | 50.8 |
| Cyberpunk 2077 2.2 Phantom Liberty (2023) | 109.6 | 79.3 | 70.5 | 56.4 | 41.5 |
| F1 24 (2024) | 182.8 | 182.9 | 162.8 | 52.3 | 24.3 |
Emisje. Moc
Emisja hałasu
Key wykorzystuje dwa wentylatory do odprowadzania niepożądanego ciepła. Wytwarzany hałas różni się znacznie w zależności od profilu mocy. W trybach Rozrywka i Wydajność wentylatory aktywują się szybko nawet podczas prozaicznych zadań, co może być nieco irytujące. Pod obciążeniem system jest dość głośny, osiągając 57,8 dB(A) w trybie Performance (Turbo) podczas gier i testów obciążeniowych. Jest to 55,9 dB(A) w trybie Wydajność (Automatyczny) i 51,6 dB(A) w trybie Rozrywka, co nadal jest głośniejsze. W związku z tym zalecane jest korzystanie ze słuchawek. Aktywacja trybu cichego sprawia, że chłodzenie działa znacznie ciszej na poziomie 30,3 dB(A), nawet podczas testów obciążeniowych.
Nie słyszeliśmy żadnych innych dźwięków, takich jak wycie cewek.
Hałas
| luz |
| 25.5 / 26.5 / 30.3 dB |
| obciążenie |
| 49.3 / 57.8 dB |
 | ||
30 dB cichy 40 dB(A) słyszalny 50 dB(A) irytujący |
||
min: | ||
| SCHENKER Key 14 (M24) NVIDIA GeForce RTX 4060 Laptop GPU, Ultra 7 155H, Samsung 990 Pro 1 TB | Asus TUF Gaming A14 FA401WV-WB94 NVIDIA GeForce RTX 4060 Laptop GPU, Ryzen AI 9 HX 370, WD PC SN560 SDDPNQE-1T00 | Dell XPS 14 2024 OLED NVIDIA GeForce RTX 4050 Laptop GPU, Ultra 7 155H, Samsung PM9A1 MZVL21T0HCLR | Asus ROG Zephyrus G14 2024 GA403U NVIDIA GeForce RTX 4070 Laptop GPU, R9 8945HS, WD PC SN560 SDDPNQE-1T00 | Acer Nitro 14 AN14-41-R3MX NVIDIA GeForce RTX 4060 Laptop GPU, R5 8645HS, Micron 3500 MTFDKBA512TGD | |
|---|---|---|---|---|---|
| Noise | 9% | 11% | 12% | 10% | |
| wyłączone / środowisko * | 25.5 | 22.9 10% | 24.3 5% | 23.9 6% | 24.3 5% |
| Idle Minimum * | 25.5 | 22.9 10% | 24.3 5% | 23.9 6% | 24.3 5% |
| Idle Average * | 26.5 | 28.3 -7% | 26.5 -0% | 23.9 10% | 24.3 8% |
| Idle Maximum * | 30.3 | 28.8 5% | 28.5 6% | 23.9 21% | 24.3 20% |
| Load Average * | 49.3 | 37.3 24% | 37 25% | 46.2 6% | 33.1 33% |
| Cyberpunk 2077 ultra * | 57.8 | 50.6 12% | 57.1 1% | ||
| Load Maximum * | 57.8 | 50.6 12% | 43.3 25% | 46.2 20% | 57 1% |
| Witcher 3 ultra * | 39.1 | 46.2 |
* ... im mniej tym lepiej
Temperatura
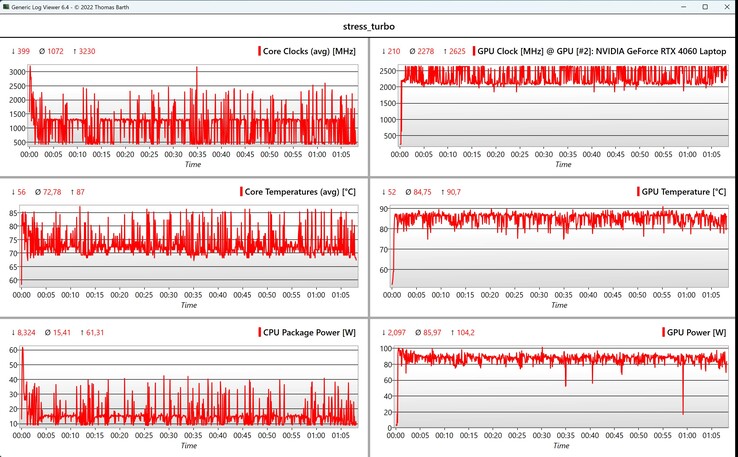
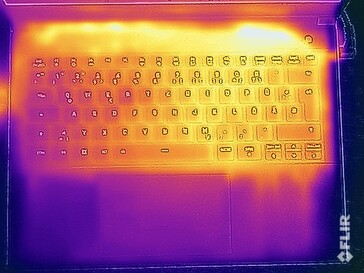
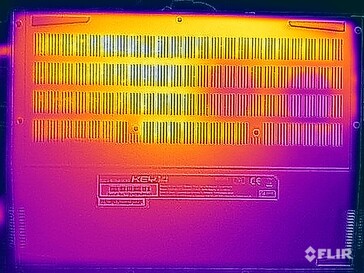
Temperatury nie stanowią problemu podczas wykonywania prostych zadań, ale pod obciążeniem tylna część spodu staje się bardzo ciepła (ponad 50°C) i nie jest to jedyny sektor, który się nagrzewa. Najlepiej nie kłaść systemu na udach. Podczas naszych testów obciążeniowych (Prime95 + FurMark), prędkości taktowania procesora i karty graficznej oraz wartości poboru mocy nieznacznie się wahają, przy czym GPU otrzymuje znacznie większą część ogólnego budżetu mocy. Średnie zużycie energii przez procesor wynosi około 15 watów, podczas gdy dGPU zużywa aż 85 watów.
(±) Maksymalna temperatura w górnej części wynosi 43.1 °C / 110 F, w porównaniu do średniej 36.9 °C / 98 F , począwszy od 21.1 do 71 °C dla klasy Multimedia.
(-) Dno nagrzewa się maksymalnie do 51.3 °C / 124 F, w porównaniu do średniej 39.2 °C / 103 F
(+) W stanie bezczynności średnia temperatura górnej części wynosi 30.4 °C / 87 F, w porównaniu ze średnią temperaturą urządzenia wynoszącą 31.3 °C / ### class_avg_f### F.
(±) 3: The average temperature for the upper side is 37.3 °C / 99 F, compared to the average of 31.3 °C / 88 F for the class Multimedia.
(+) Podpórki pod nadgarstki i touchpad są chłodniejsze niż temperatura skóry i maksymalnie 31 °C / 87.8 F i dlatego są chłodne w dotyku.
(-) Średnia temperatura obszaru podparcia dłoni w podobnych urządzeniach wynosiła 28.8 °C / 83.8 F (-2.2 °C / -4 F).
| SCHENKER Key 14 (M24) Intel Core Ultra 7 155H, NVIDIA GeForce RTX 4060 Laptop GPU | Asus TUF Gaming A14 FA401WV-WB94 AMD Ryzen AI 9 HX 370, NVIDIA GeForce RTX 4060 Laptop GPU | Dell XPS 14 2024 OLED Intel Core Ultra 7 155H, NVIDIA GeForce RTX 4050 Laptop GPU | Asus ROG Zephyrus G14 2024 GA403U AMD Ryzen 9 8945HS, NVIDIA GeForce RTX 4070 Laptop GPU | Acer Nitro 14 AN14-41-R3MX AMD Ryzen 5 8645HS, NVIDIA GeForce RTX 4060 Laptop GPU | |
|---|---|---|---|---|---|
| Heat | 6% | 17% | 12% | 9% | |
| Maximum Upper Side * | 43.1 | 49.8 -16% | 40.5 6% | 46.6 -8% | 43.5 -1% |
| Maximum Bottom * | 51.3 | 46 10% | 42.6 17% | 47.8 7% | 46.3 10% |
| Idle Upper Side * | 33.2 | 30.2 9% | 26.9 19% | 26.7 20% | 30.4 8% |
| Idle Bottom * | 38.3 | 29.8 22% | 27.8 27% | 27.8 27% | 31.3 18% |
* ... im mniej tym lepiej
Głośniki
Głośniki stereo brzmią nieco blado i nie są szczególnie imponujące. Podczas gdy odtwarzanie mowy korzysta z wyraźnych wysokich tonów, zewnętrzne głośniki lub słuchawki są zalecane do odtwarzania muzyki lub treści wideo.
SCHENKER Key 14 (M24) analiza dźwięku
(±) | głośność głośnika jest średnia, ale dobra (81.5 dB)
Bas 100 - 315 Hz
(-) | prawie brak basu - średnio 29.9% niższa od mediany
(±) | liniowość basu jest średnia (7.9% delta do poprzedniej częstotliwości)
Średnie 400 - 2000 Hz
(±) | wyższe średnie - średnio 5.3% wyższe niż mediana
(+) | średnie są liniowe (5.9% delta do poprzedniej częstotliwości)
Wysokie 2–16 kHz
(+) | zrównoważone maksima - tylko 2.1% od mediany
(+) | wzloty są liniowe (2.8% delta do poprzedniej częstotliwości)
Ogólnie 100 - 16.000 Hz
(±) | liniowość ogólnego dźwięku jest średnia (20.9% różnicy w stosunku do mediany)
W porównaniu do tej samej klasy
» 70% wszystkich testowanych urządzeń w tej klasie było lepszych, 8% podobnych, 22% gorszych
» Najlepszy miał deltę 5%, średnia wynosiła ###średnia###%, najgorsza wynosiła 45%
W porównaniu do wszystkich testowanych urządzeń
» 54% wszystkich testowanych urządzeń było lepszych, 8% podobnych, 38% gorszych
» Najlepszy miał deltę 4%, średnia wynosiła ###średnia###%, najgorsza wynosiła 134%
Asus TUF Gaming A14 FA401WV-WB94 analiza dźwięku
(±) | głośność głośnika jest średnia, ale dobra (75.2 dB)
Bas 100 - 315 Hz
(±) | zredukowany bas - średnio 8.4% niższy od mediany
(±) | liniowość basu jest średnia (9.7% delta do poprzedniej częstotliwości)
Średnie 400 - 2000 Hz
(±) | wyższe średnie - średnio 10% wyższe niż mediana
(+) | średnie są liniowe (4.2% delta do poprzedniej częstotliwości)
Wysokie 2–16 kHz
(+) | zrównoważone maksima - tylko 3.8% od mediany
(+) | wzloty są liniowe (6.7% delta do poprzedniej częstotliwości)
Ogólnie 100 - 16.000 Hz
(±) | liniowość ogólnego dźwięku jest średnia (19.2% różnicy w stosunku do mediany)
W porównaniu do tej samej klasy
» 63% wszystkich testowanych urządzeń w tej klasie było lepszych, 7% podobnych, 30% gorszych
» Najlepszy miał deltę 6%, średnia wynosiła ###średnia###%, najgorsza wynosiła 132%
W porównaniu do wszystkich testowanych urządzeń
» 43% wszystkich testowanych urządzeń było lepszych, 7% podobnych, 49% gorszych
» Najlepszy miał deltę 4%, średnia wynosiła ###średnia###%, najgorsza wynosiła 134%
Dell XPS 14 2024 OLED analiza dźwięku
(+) | głośniki mogą odtwarzać stosunkowo głośno (82.8 dB)
Bas 100 - 315 Hz
(±) | zredukowany bas - średnio 9.9% niższy od mediany
(±) | liniowość basu jest średnia (10.1% delta do poprzedniej częstotliwości)
Średnie 400 - 2000 Hz
(+) | zbalansowane środki średnie - tylko 4.4% od mediany
(+) | średnie są liniowe (3.8% delta do poprzedniej częstotliwości)
Wysokie 2–16 kHz
(+) | zrównoważone maksima - tylko 2.3% od mediany
(±) | liniowość wysokich wartości jest średnia (7% delta do poprzedniej częstotliwości)
Ogólnie 100 - 16.000 Hz
(+) | ogólny dźwięk jest liniowy (11% różnicy w stosunku do mediany)
W porównaniu do tej samej klasy
» 12% wszystkich testowanych urządzeń w tej klasie było lepszych, 3% podobnych, 85% gorszych
» Najlepszy miał deltę 5%, średnia wynosiła ###średnia###%, najgorsza wynosiła 45%
W porównaniu do wszystkich testowanych urządzeń
» 5% wszystkich testowanych urządzeń było lepszych, 2% podobnych, 93% gorszych
» Najlepszy miał deltę 4%, średnia wynosiła ###średnia###%, najgorsza wynosiła 134%
Asus ROG Zephyrus G14 2024 GA403U analiza dźwięku
(+) | głośniki mogą odtwarzać stosunkowo głośno (84.7 dB)
Bas 100 - 315 Hz
(+) | dobry bas - tylko 3.5% od mediany
(±) | liniowość basu jest średnia (7.3% delta do poprzedniej częstotliwości)
Średnie 400 - 2000 Hz
(+) | zbalansowane środki średnie - tylko 3.8% od mediany
(+) | średnie są liniowe (3.6% delta do poprzedniej częstotliwości)
Wysokie 2–16 kHz
(+) | zrównoważone maksima - tylko 1.4% od mediany
(+) | wzloty są liniowe (3.5% delta do poprzedniej częstotliwości)
Ogólnie 100 - 16.000 Hz
(+) | ogólny dźwięk jest liniowy (5.8% różnicy w stosunku do mediany)
W porównaniu do tej samej klasy
» 0% wszystkich testowanych urządzeń w tej klasie było lepszych, 0% podobnych, 100% gorszych
» Najlepszy miał deltę 6%, średnia wynosiła ###średnia###%, najgorsza wynosiła 132%
W porównaniu do wszystkich testowanych urządzeń
» 0% wszystkich testowanych urządzeń było lepszych, 0% podobnych, 100% gorszych
» Najlepszy miał deltę 4%, średnia wynosiła ###średnia###%, najgorsza wynosiła 134%
Acer Nitro 14 AN14-41-R3MX analiza dźwięku
(±) | głośność głośnika jest średnia, ale dobra (79.6 dB)
Bas 100 - 315 Hz
(-) | prawie brak basu - średnio 23.5% niższa od mediany
(±) | liniowość basu jest średnia (10.2% delta do poprzedniej częstotliwości)
Średnie 400 - 2000 Hz
(+) | zbalansowane środki średnie - tylko 2.7% od mediany
(±) | liniowość środka jest średnia (7.9% delta do poprzedniej częstotliwości)
Wysokie 2–16 kHz
(±) | wyższe maksima - średnio 5.3% wyższe od mediany
(±) | liniowość wysokich wartości jest średnia (9.4% delta do poprzedniej częstotliwości)
Ogólnie 100 - 16.000 Hz
(±) | liniowość ogólnego dźwięku jest średnia (20% różnicy w stosunku do mediany)
W porównaniu do tej samej klasy
» 68% wszystkich testowanych urządzeń w tej klasie było lepszych, 7% podobnych, 25% gorszych
» Najlepszy miał deltę 6%, średnia wynosiła ###średnia###%, najgorsza wynosiła 132%
W porównaniu do wszystkich testowanych urządzeń
» 48% wszystkich testowanych urządzeń było lepszych, 8% podobnych, 43% gorszych
» Najlepszy miał deltę 4%, średnia wynosiła ###średnia###%, najgorsza wynosiła 134%
Zużycie energii
Maksymalny pobór mocy w trybie bezczynności wynosi około 11 watów, podczas gdy pobór mocy w grach waha się od 160 do 180 watów. W teście obciążeniowym początkowo zmierzyliśmy maksymalnie 183 waty, ale wartość ta szybko spadła i ustabilizowała się na poziomie około 125-140 watów. Dołączony 180-watowy zasilacz jest zatem odpowiednio dobrany.
| wyłączony / stan wstrzymania | |
| luz | |
| obciążenie |
|
Legenda:
min: | |
Power consumption in Cyberpunk 2077 (gaming stress test)
Power consumption with ext. monitor connected
Żywotność baterii
Akumulator o pojemności 80 Wh zapewnia tylko przeciętny czas pracy na baterii. W naszym teście surfowania po Internecie przez Wi-Fi z jasnością 150 cd/m² (odpowiada ustawieniu 70%), Schenker wytrzymał około 7,5 godziny.
Ocena Notebookcheck
SCHENKER Key 14 (M24)
- 15/12/2024 v8
Andreas Osthoff
Przezroczystość
Wyboru urządzeń do recenzji dokonuje nasza redakcja. Próbka testowa została udostępniona autorowi jako pożyczka od producenta lub sprzedawcy detalicznego na potrzeby tej recenzji. Pożyczkodawca nie miał wpływu na tę recenzję, producent nie otrzymał też kopii tej recenzji przed publikacją. Nie było obowiązku publikowania tej recenzji. Nigdy nie przyjmujemy rekompensaty ani płatności w zamian za nasze recenzje. Jako niezależna firma medialna, Notebookcheck nie podlega władzy producentów, sprzedawców detalicznych ani wydawców.
Tak testuje Notebookcheck
Każdego roku Notebookcheck niezależnie sprawdza setki laptopów i smartfonów, stosując standardowe procedury, aby zapewnić porównywalność wszystkich wyników. Od około 20 lat stale rozwijamy nasze metody badawcze, ustanawiając przy tym standardy branżowe. W naszych laboratoriach testowych doświadczeni technicy i redaktorzy korzystają z wysokiej jakości sprzętu pomiarowego. Testy te obejmują wieloetapowy proces walidacji. Nasz kompleksowy system ocen opiera się na setkach uzasadnionych pomiarów i benchmarków, co pozwala zachować obiektywizm.











 Total Sustainability Score:


