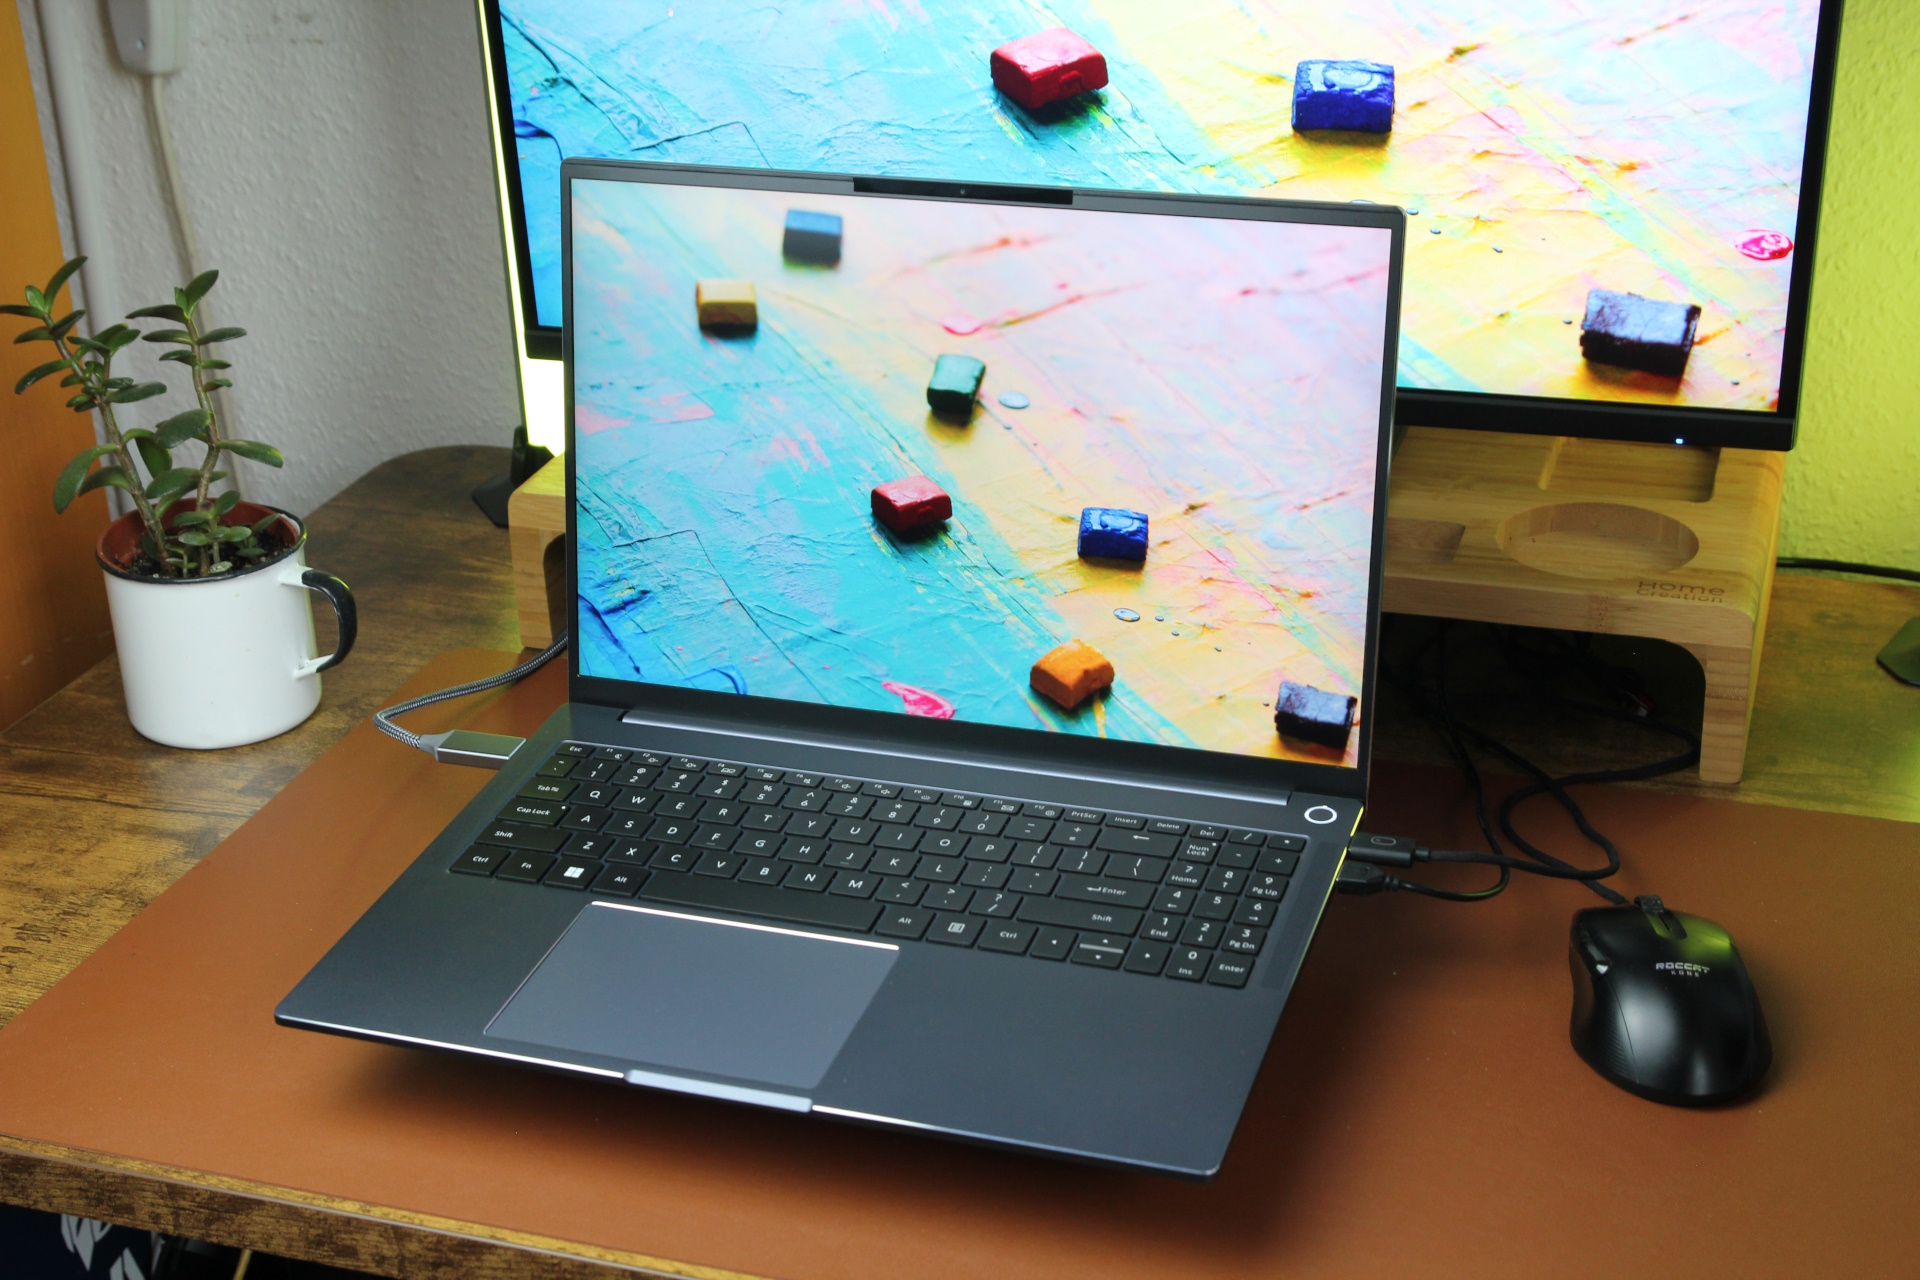
Recenzja laptopa Ninkear A16 Pro: Niedrogi, wydajny i cichy podczas użytkowania
Jeszcze lepiej z AMD.
Ninkear A16 Pro to zaskakująco dobry laptop z Chin wyposażony w procesor AMD Ryzen 7 8845HS, 32 GB pamięci RAM i dysk SSD o pojemności 1 TB za około 840 USD. Dzięki dobrym funkcjom przewyższa on swój siostrzany model, N16 Pro, a nawet zbliża się do Xiaomi RedmiBook Pro 16. Podczas naszych testów przekonaliśmy się, jak blisko.Christian Hintze, 👁 Christian Hintze (tłumaczenie DeepL / Ninh Duy) Opublikowany 🇺🇸 🇩🇪 ...
Werdykt - Dużo dobrego, prawie nic złego
Wraz z premierą A16 Pro, Ninkear po raz kolejny udowodnił, że może zaoferować przystępną cenowo i wysokiej jakości alternatywę dla modeli uznanych marek. Chociaż nie możemy nic powiedzieć o jego długoterminowej funkcjonalności, A16 Pro zaimponował nam podczas naszego testu metalową obudową, ładnym wyświetlaczem, dobrą i przede wszystkim stałą wydajnością (nawet podczas pracy na zasilaniu bateryjnym) oraz cichą pracą za stosunkowo niewielkie pieniądze. Zdecydowanie wyprzedza swój siostrzany model - N16 Pro - pod względem wydajności.
Punkty są odejmowane za słabą kamerę internetową 720p, a bardzo głośny i nieco tandetnie wyglądający panel dotykowy umniejsza poza tym dobre wrażenia użytkownika. Są to jednak słabości, które można wybaczyć. Pomimo dużej baterii, byliśmy zaskoczeni słabą żywotnością baterii laptopa - chociaż producent deklaruje czas pracy wynoszący co najmniej 10 godzin. Ponadto z pewnością jest jeszcze miejsce na poprawę w zakresie optymalizacji oprogramowania. Jego porty USB również mogłyby być nieco bardziej nowoczesne.
Za
Przeciw
Cena i dostępność
W chwili pisania tego tekstu Ninkear A16 nie jest dostępny do kupienia w Stanach Zjednoczonych, ale jeśli są Państwo w Europie, można go kupić od naszego pożyczkodawcy Geekmaxi. Obecnie kosztuje on 779 € (około 842 USD).
Porównanie możliwych alternatyw
Obraz | Model / recenzja | Geizhals | Waga | Wysokość | Ekran |
|---|---|---|---|---|---|
| Ninkear A16 Pro AMD Ryzen 7 8845HS ⎘ AMD Radeon 780M ⎘ 32 GB Pamięć, 1000 GB SSD | Listenpreis 799 Euro Geizhals Suche | 1.8 kg | 24 mm | 16.00" 2560x1600 189 PPI IPS | |
| Ninkear N16-Pro-32+1TB Intel Core i7-13620H ⎘ Intel UHD Graphics 64EUs (Alder Lake 12th Gen) ⎘ 32 GB Pamięć, 1024 GB SSD | Listenpreis 800 Euro Geizhals Suche | 1.8 kg | 22 mm | 16.00" 2560x1600 189 PPI IPS | |
| Xiaomi RedmiBook Pro 16 2024 Intel Core Ultra 7 155H ⎘ Intel Arc 8-Core iGPU ⎘ 32 GB Pamięć, 1024 GB SSD | Listenpreis 957€ | 1.9 kg | 15.9 mm | 16.00" 3072x1920 226 PPI IPS | |
| Acer Aspire 16 A16-51GM-77G2 Intel Core 7 150U ⎘ NVIDIA GeForce RTX 2050 Mobile ⎘ 16 GB Pamięć, 1024 GB SSD | 1.9 kg | 21 mm | 16.00" 1920x1200 142 PPI IPS | ||
| Lenovo IdeaPad Slim 5 16IRU9 Intel Core 7 150U ⎘ Intel Iris Xe Graphics G7 96EUs ⎘ 16 GB Pamięć | Listenpreis 800 USD Geizhals Suche | 1.8 kg | 16.9 mm | 16.00" 1920x1200 142 PPI IPS | |
| Medion S10 OLED Intel Core Ultra 7 155H ⎘ Intel Arc 8-Core iGPU ⎘ 16 GB Pamięć, 1024 GB SSD | 1.6 kg | 17.8 mm | 16.00" 3840x2400 283 PPI OLED |
Spis treści
- Werdykt - Dużo dobrego, prawie nic złego
- Specyfikacje
- Obudowa i łączność - wiele niewiadomych w A16 Pro
- Urządzenia wejściowe - Dobra klawiatura, głośne klawisze touchpada
- Wyświetlacz - Ninkear o rozdzielczości 1600p, 400 nitów i 120 Hz
- Wydajność - A16 Pro z AMD Hawk Point
- Emisje i moc - cichy i chłodny Ninkear
- Łączna ocena Notebookcheck
W ostatnim czasie laptopy Ninkear nas zaskoczyły. The A15 Plus i N16 Pro z Dalekiego Wschodu wypadły całkiem dobrze w naszych testach, więc teraz nadszedł czas na przetestowanie A16 Pro. Wyróżnia się on metalową obudową, a przede wszystkim 16-calowym ekranem o rozdzielczości 2560 x 1600 pikseli. W przeciwieństwie do N16 Pro z procesorem Intela, ten model jest zasilany przez procesor AMD Hawk Point i zintegrowany układ graficzny Radeon. Kosztuje on nieco ponad 800 dolarów. Przyjrzeliśmy się, jak dobry jest jego wyświetlacz multimedialny i jak wszechstronny jest jego pakiet biurowy.
Specyfikacje
Obudowa i łączność - wiele niewiadomych w A16 Pro
Pomimo pewnych podobieństw, nasz A16 Pro wygląda również zupełnie inaczej niż N16 Pro na zewnątrz. Ninkear zdecydował się na jeszcze więcej metalu i mniej plastiku w A16 Pro. Ponieważ wszystko jest metalicznie niebieskie, A16 Pro wygląda tak, jakby został odlany z jednej formy. Niestety, pokrywa wyświetlacza trzeszczy i znacznie pęka przy skręcaniu. Z drugiej strony, podstawa jest bardzo stabilna.
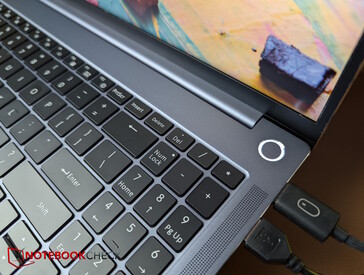
Ogólnie rzecz biorąc, jego konstrukcja wygląda świetnie, z czarnym napisem "Ninkear" w jednym z górnych rogów pokrywy. Poza tym laptop lśni niebieską elegancją i prostotą. Wyświetlacz można otworzyć o 180 stopni, ale zawias niestety nie trzyma wystarczająco mocno. Wyloty powietrza są ukryte za długim zawiasem, a czujnik linii papilarnych jest zintegrowany z przyciskiem zasilania.
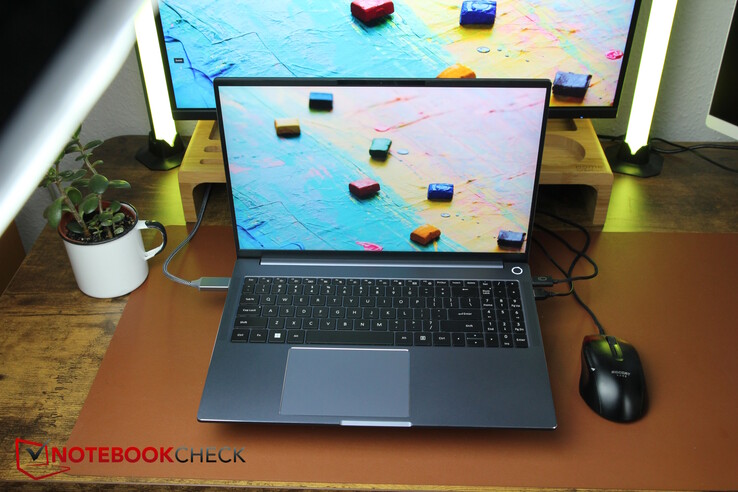
Na pochwałę zasługują akcesoria: Oprócz naklejek na klawiaturę w różnych układach językowych, użytkownicy otrzymują również mysz USB i podkładkę pod mysz.
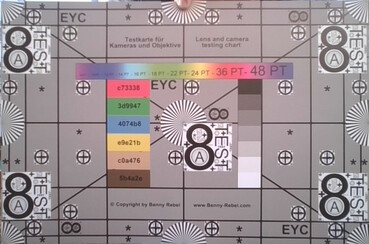
Niestety, jego kamera internetowa ma tylko rozdzielczość 720p i cierpi na duże odchylenia kolorów i niską ostrość. Obsługuje tylko Wi-Fi 6 bez przyrostka E, więc brakuje szybkiej sieci 6 GHz, a jego szybkość transferu w sieci 5 GHz jest raczej przeciętna.
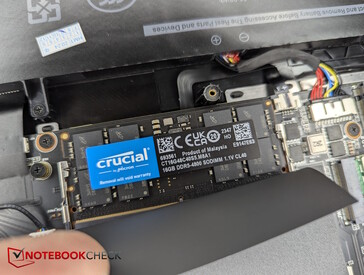
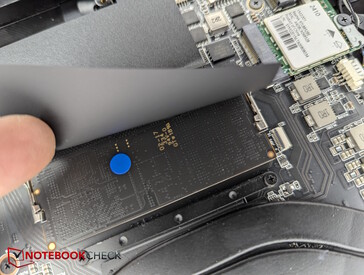
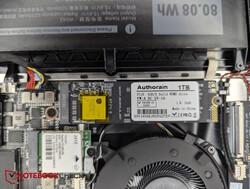
Aby otworzyć urządzenie, wystarczy odkręcić 13 śrub krzyżakowych. Wygląda na to, że na płycie bazowej nie ma prawie żadnych zacisków, więc odpada ona natychmiast. Wewnątrz można uzyskać dostęp do wszystkich ważnych komponentów, takich jak dysk SSD, pamięć RAM, bateria, moduł Wi-Fi i układ chłodzenia. Jest też drugie gniazdo M.2 na dyski SSD.
Łączność
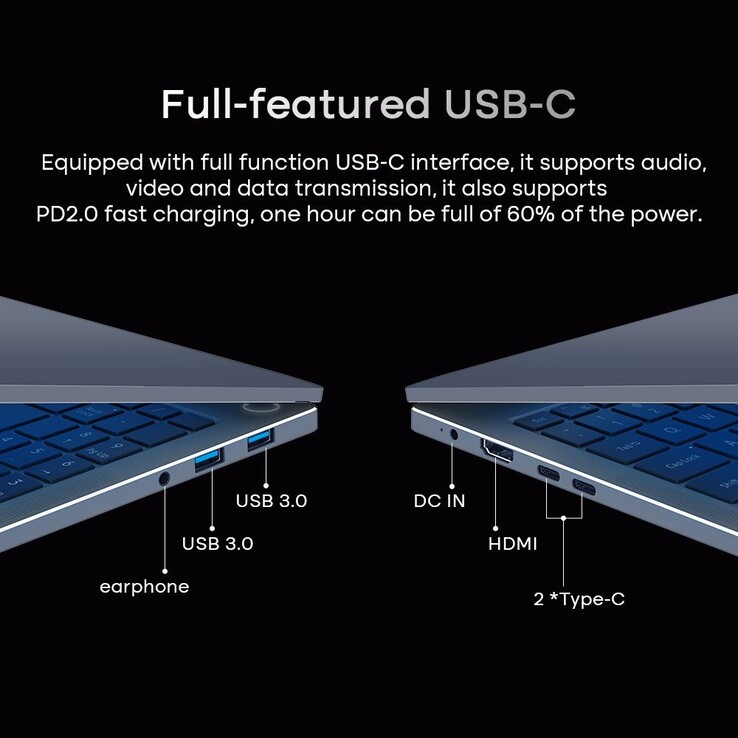
Niestety, laptop nie obsługuje Thunderbolt, a producent nie wydaje się chcieć podać więcej szczegółów na temat dwóch portów USB-C - lub co dokładnie oznacza w pełni funkcjonalne USB-C?
| Networking | |
| iperf3 transmit AXE11000 | |
| Ninkear N16-Pro-32+1TB | |
| Medion S10 OLED | |
| Średnia w klasie Office (47.8 - 1793, n=87, ostatnie 2 lata) | |
| Acer Aspire 16 A16-51GM-77G2 | |
| Lenovo IdeaPad Slim 5 16IRU9 | |
| Ninkear A16 Pro | |
| Przeciętny Realtek RTL8852BE (536 - 926, n=52) | |
| Xiaomi RedmiBook Pro 16 2024 | |
| iperf3 receive AXE11000 | |
| Ninkear N16-Pro-32+1TB | |
| Medion S10 OLED | |
| Średnia w klasie Office (104.2 - 1775, n=87, ostatnie 2 lata) | |
| Xiaomi RedmiBook Pro 16 2024 | |
| Ninkear A16 Pro | |
| Acer Aspire 16 A16-51GM-77G2 | |
| Przeciętny Realtek RTL8852BE (455 - 985, n=53) | |
| Lenovo IdeaPad Slim 5 16IRU9 | |
| iperf3 transmit AXE11000 6GHz | |
| Acer Aspire 16 A16-51GM-77G2 | |
| Średnia w klasie Office (385 - 1961, n=51, ostatnie 2 lata) | |
| iperf3 receive AXE11000 6GHz | |
| Średnia w klasie Office (1065 - 1790, n=51, ostatnie 2 lata) | |
| Acer Aspire 16 A16-51GM-77G2 | |
Zrównoważony rozwój
Laptop dostarczany jest w dwóch kartonowych pudełkach - jedno w drugim. Wewnątrz jednak opakowanie i materiały ochronne składają się z dużej ilości plastiku. Producent nie podał żadnych informacji na temat emisjiCO2 podczas produkcji.
Urządzenia wejściowe - Dobra klawiatura, głośne klawisze touchpada
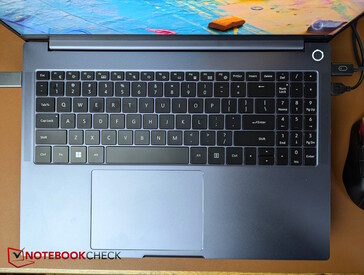
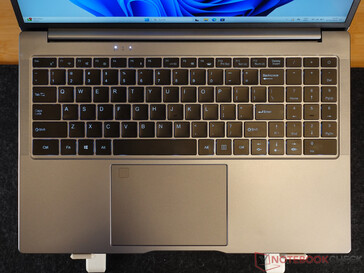
Układ klawiatury jest bardzo schludny i różni się od tego z N16 Pro. Po prawej stronie klawiatura numeryczna z małymi klawiszami jest wciśnięta obok innych, dość dużych klawiszy. Niestety, pionowe klawisze strzałek są o połowę niższe. Laptop standardowo wyposażony jest w amerykański układ klawiatury, jednak osoby posługujące się innymi językami nie muszą się martwić, gdyż producent dołącza naklejki z oznaczeniami dla różnych innych języków.
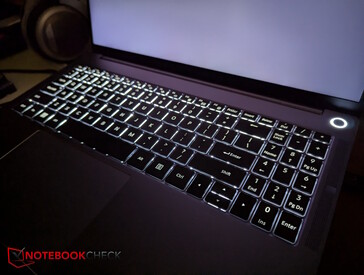
Pisanie na klawiaturze jest zaskakująco przyjemne - chociaż jej skok jest niski, sprzężenie zwrotne, które zapewnia, jest zauważalne, a odgłosy klikania są raczej ciche, a jedynie spacja jest zauważalnie głośniejsza. Dwupoziomowe białe podświetlenie zapewnia wsparcie w ciemności.
Bardzo duży touchpad (ok. 12,8 x 9 cm) jest łatwy do przesuwania palcem i wykonywania gestów. Jedynie zintegrowane przyciski myszy wydają się nieco tanie z ich głośnymi kliknięciami i dlatego są mniej przyjemne w użyciu, chociaż sprzężenie zwrotne jest w porządku i niezawodnie wyzwalane.
Wyświetlacz - Ninkear o rozdzielczości 1600p, 400 nitów i 120 Hz
Jeśli chodzi o zainstalowany matowy wyświetlacz IPS, nawet Hwinfo musi przejść ("nieznany") - wyszukiwanie za pomocą identyfikatora sprzętu (CSO1623) wskazuje, że jest to panel Lenovo, ale to również nie przyniosło żadnych ostatecznych wyników. Ma rozdzielczość 2560 x 1600 pikseli i powinien w pełni pokrywać sRGB, mieć wysoki kontrast i działać z częstotliwością 120 Hz.
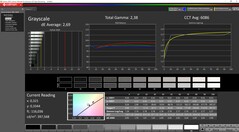
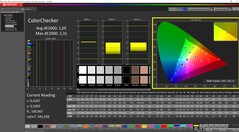
Zmierzyliśmy średnią jasność nieco poniżej 400 nitów, a jego podświetlenie wynosi dobre 91%. W ustawieniach fabrycznych poziom czerni jest zbyt wysoki, przez co cierpi kontrast. Po kalibracji poziom czerni ekranu spada, a kontrast wzrasta do ponad 1200:1.
| |||||||||||||||||||||||||
rozświetlenie: 91 %
na akumulatorze: 393.5 cd/m²
kontrast: 895:1 (czerń: 0.44 cd/m²)
ΔE Color 2.32 | 0.5-29.43 Ø4.87, calibrated: 1.05
ΔE Greyscale 2.69 | 0.5-98 Ø5.1
71.1% AdobeRGB 1998 (Argyll 2.2.0 3D)
97.6% sRGB (Argyll 2.2.0 3D)
68.7% Display P3 (Argyll 2.2.0 3D)
Gamma: 2.38
| Ninkear A16 Pro cso1623, IPS, 2560x1600, 16", 120 Hz | Ninkear N16-Pro-32+1TB BOE0A40 (NE160QDM-NY1), IPS, 2560x1600, 16", 165 Hz | Xiaomi RedmiBook Pro 16 2024 TL160MDMP03_0, IPS, 3072x1920, 16", 165 Hz | Acer Aspire 16 A16-51GM-77G2 N160JCA-EEK (Chi Mei CMN163D), IPS, 1920x1200, 16", 60 Hz | Lenovo IdeaPad Slim 5 16IRU9 LEN160WUXGA, IPS, 1920x1200, 16", 60 Hz | Medion S10 OLED Samsung SDC4174, OLED, 3840x2400, 16", 60 Hz | |
|---|---|---|---|---|---|---|
| Display | 2% | 24% | -37% | -39% | 29% | |
| Display P3 Coverage | 68.7 | 70.2 2% | 98.8 44% | 42.3 -38% | 41.5 -40% | 99.9 45% |
| sRGB Coverage | 97.6 | 99.5 2% | 100 2% | 63.6 -35% | 61.2 -37% | 100 2% |
| AdobeRGB 1998 Coverage | 71.1 | 72.5 2% | 89.9 26% | 43.7 -39% | 42.9 -40% | 98.6 39% |
| Response Times | 18% | -85% | -94% | -31% | 89% | |
| Response Time Grey 50% / Grey 80% * | 16.4 ? | 14 ? 15% | 39.2 ? -139% | 31.4 ? -91% | 20.7 ? -26% | 1.7 ? 90% |
| Response Time Black / White * | 11.2 ? | 9 ? 20% | 14.6 ? -30% | 22 ? -96% | 15.1 ? -35% | 1.4 ? 87% |
| PWM Frequency | 60 ? | |||||
| Screen | 23% | -1% | -67% | -114% | 371% | |
| Brightness middle | 393.6 | 397 1% | 520 32% | 352 -11% | 313.3 -20% | 307 -22% |
| Brightness | 398 | 396 -1% | 510 28% | 324 -19% | 308 -23% | 307 -23% |
| Brightness Distribution | 91 | 89 -2% | 93 2% | 86 -5% | 91 0% | 96 5% |
| Black Level * | 0.44 | 0.35 20% | 0.35 20% | 0.27 39% | 0.37 16% | 0.01 98% |
| Contrast | 895 | 1134 27% | 1486 66% | 1304 46% | 847 -5% | 30700 3330% |
| Colorchecker dE 2000 * | 2.32 | 1.15 50% | 2.9 -25% | 4.41 -90% | 8.42 -263% | 2.1 9% |
| Colorchecker dE 2000 max. * | 3.72 | 2.08 44% | 6.2 -67% | 15.04 -304% | 19.09 -413% | 4.87 -31% |
| Colorchecker dE 2000 calibrated * | 1.05 | 0.81 23% | 1.1 -5% | 3.52 -235% | 2.16 -106% | 2.08 -98% |
| Greyscale dE 2000 * | 2.69 | 1.4 48% | 4.3 -60% | 3.32 -23% | 8.3 -209% | 0.9 67% |
| Gamma | 2.38 92% | 2.142 103% | 2.19 100% | 2.44 90% | 2.83 78% | 2.197 100% |
| CCT | 6086 107% | 7422 88% | 7122 91% | 6296 103% | 6513 100% | |
| Całkowita średnia (program / ustawienia) | 14% /
18% | -21% /
-8% | -66% /
-64% | -61% /
-86% | 163% /
257% |
* ... im mniej tym lepiej
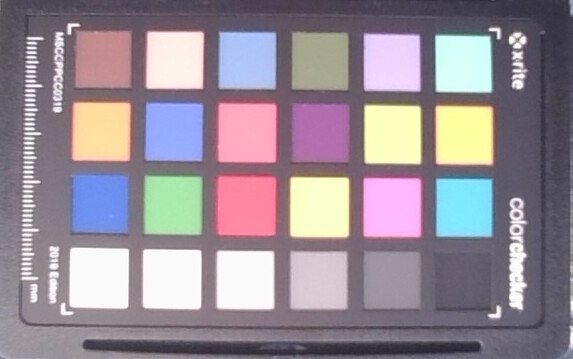
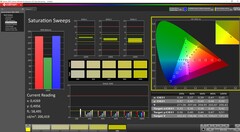
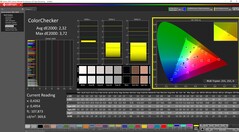
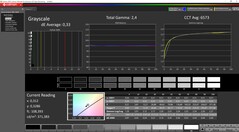
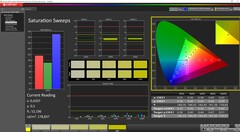
Zaraz po wyjęciu z pudełka, odchylenia kolorów panelu, a przede wszystkim jego poziom czerni, są zbyt wysokie. Ręczna kalibracja przy użyciu naszego kolorymetru Xrite i oprogramowania Calman to świetny sposób na zmniejszenie wartości DeltaE, a poziom czerni również spada. Nasz profil icc można pobrać za darmo powyżej. Niestety, więcej niż przyzwoity panel obejmuje tylko sRGB.
Wyświetl czasy reakcji
| ↔ Czas reakcji od czerni do bieli | ||
|---|---|---|
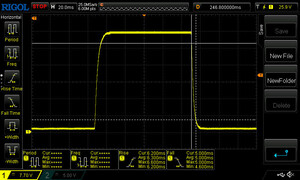
| 11.2 ms ... wzrost ↗ i spadek ↘ łącznie | ↗ 6.2 ms wzrost | |
| ↘ 5 ms upadek | ||
| W naszych testach ekran wykazuje dobry współczynnik reakcji, ale może być zbyt wolny dla graczy rywalizujących ze sobą. Dla porównania, wszystkie testowane urządzenia wahają się od 0.1 (minimum) do 240 (maksimum) ms. » 27 % wszystkich urządzeń jest lepszych. Oznacza to, że zmierzony czas reakcji jest lepszy od średniej wszystkich testowanych urządzeń (20.8 ms). | ||
| ↔ Czas reakcji 50% szarości do 80% szarości | ||
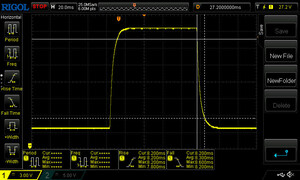
| 16.4 ms ... wzrost ↗ i spadek ↘ łącznie | ↗ 8.2 ms wzrost | |
| ↘ 8.2 ms upadek | ||
| W naszych testach ekran wykazuje dobry współczynnik reakcji, ale może być zbyt wolny dla graczy rywalizujących ze sobą. Dla porównania, wszystkie testowane urządzenia wahają się od 0.165 (minimum) do 636 (maksimum) ms. » 28 % wszystkich urządzeń jest lepszych. Oznacza to, że zmierzony czas reakcji jest lepszy od średniej wszystkich testowanych urządzeń (32.5 ms). | ||
Migotanie ekranu / PWM (modulacja szerokości impulsu)
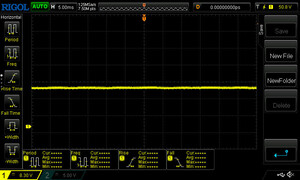
| Migotanie ekranu/nie wykryto PWM | |||
Dla porównania: 53 % wszystkich testowanych urządzeń nie używa PWM do przyciemniania wyświetlacza. Jeśli wykryto PWM, zmierzono średnio 8516 (minimum: 5 - maksimum: 343500) Hz. | |||
Wydajność - A16 Pro z AMD Hawk Point
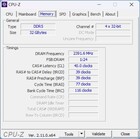
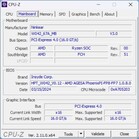
Ninkear A16 Pro jest dostępny tylko w jednej konfiguracji, a mianowicie z procesorem AMD Ryzen 7 8845HS w tym zintegrowaną kartą graficzną Radeon 780M, 32 GB pamięci RAM i dyskiem SSD o pojemności 1 TB. Sprawia to, że 16-calowy laptop jest szczególnie odpowiedni do użytku biurowego i niektórych zadań multimedialnych. Dzięki zintegrowanej jednostce NPU poradzi sobie również z aplikacjami AI, choć najnowsze modele są pod tym względem jeszcze wydajniejsze.
Warunki testowania
A16 Pro nie ma własnych wstępnie ustawionych profili wydajności ani aplikacji Centrum sterowania. Dlatego też ustawiliśmy profile energetyczne systemu Windows na "wydajność" dla naszych testów wydajności i na "oszczędzanie energii" podczas testów baterii.
Procesor
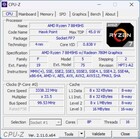
AMD Ryzen 7 8845HS AMD Ryzen 7 8845HS z serii Hawk Point jest klasyfikowany jako jeden z bardziej high-endowych procesorów do laptopów, ma 8 rdzeni i może przetwarzać 16 wątków jednocześnie, a jego taktowanie wynosi od 3,8 do 5,1 GHz. Zintegrowana jednostka NPU dla lokalnych aplikacji AI osiąga do 16 TOPS, a cały procesor zarządza do 38 TOPS.
Nasz test wytrzymałości Cinebench R15 potwierdził, że procesor działa bardzo konsekwentnie bez żadnego spadku wydajności. Ryzen działał dokładnie na poziomie Intel Ultra 7 155H w Medion S10 - ten sam procesor w Xiaomi RedmiBook Pro 16 był tylko nieznacznie szybszy na początku, ale zostało to wyrównane, gdy przyszło do ciągłej wydajności.
We wszystkich testach CPU, Ryzen 7 wypadł nieco poniżej naszych oczekiwań, ale nadal zajął drugie miejsce w naszym porównaniu za RedmiBookiem, a nawet wyprzedził Mediona i wszystkich innych konkurentów.
Ku naszej uciesze, A16 Pro nie stracił nic ze swojej wydajności w trybie bateryjnym, co pokazał kolejny test Cinebench R15.
Cinebench R15 Multi continuous test
Cinebench R23: Multi Core | Single Core
Cinebench R20: CPU (Multi Core) | CPU (Single Core)
Cinebench R15: CPU Multi 64Bit | CPU Single 64Bit
Blender: v2.79 BMW27 CPU
7-Zip 18.03: 7z b 4 | 7z b 4 -mmt1
Geekbench 6.4: Multi-Core | Single-Core
Geekbench 5.5: Multi-Core | Single-Core
HWBOT x265 Benchmark v2.2: 4k Preset
LibreOffice : 20 Documents To PDF
R Benchmark 2.5: Overall mean
| CPU Performance Rating | |
| Xiaomi RedmiBook Pro 16 2024 | |
| Przeciętny AMD Ryzen 7 8845HS | |
| Ninkear A16 Pro | |
| Medion S10 OLED | |
| Ninkear N16-Pro-32+1TB | |
| Acer Aspire 16 A16-51GM-77G2 | |
| Lenovo IdeaPad Slim 5 16IRU9 | |
| Średnia w klasie Office | |
| Cinebench R23 / Multi Core | |
| Xiaomi RedmiBook Pro 16 2024 | |
| Przeciętny AMD Ryzen 7 8845HS (14895 - 18037, n=12) | |
| Medion S10 OLED | |
| Ninkear A16 Pro | |
| Ninkear N16-Pro-32+1TB | |
| Średnia w klasie Office (1577 - 20399, n=90, ostatnie 2 lata) | |
| Lenovo IdeaPad Slim 5 16IRU9 | |
| Acer Aspire 16 A16-51GM-77G2 | |
| Cinebench R23 / Single Core | |
| Acer Aspire 16 A16-51GM-77G2 | |
| Lenovo IdeaPad Slim 5 16IRU9 | |
| Ninkear N16-Pro-32+1TB | |
| Medion S10 OLED | |
| Xiaomi RedmiBook Pro 16 2024 | |
| Przeciętny AMD Ryzen 7 8845HS (1623 - 1783, n=12) | |
| Ninkear A16 Pro | |
| Średnia w klasie Office (618 - 1995, n=90, ostatnie 2 lata) | |
| Cinebench R20 / CPU (Multi Core) | |
| Xiaomi RedmiBook Pro 16 2024 | |
| Przeciętny AMD Ryzen 7 8845HS (5808 - 7026, n=12) | |
| Medion S10 OLED | |
| Ninkear A16 Pro | |
| Ninkear N16-Pro-32+1TB | |
| Średnia w klasie Office (590 - 8086, n=88, ostatnie 2 lata) | |
| Lenovo IdeaPad Slim 5 16IRU9 | |
| Acer Aspire 16 A16-51GM-77G2 | |
| Cinebench R20 / CPU (Single Core) | |
| Acer Aspire 16 A16-51GM-77G2 | |
| Ninkear N16-Pro-32+1TB | |
| Lenovo IdeaPad Slim 5 16IRU9 | |
| Medion S10 OLED | |
| Przeciętny AMD Ryzen 7 8845HS (673 - 698, n=12) | |
| Ninkear A16 Pro | |
| Xiaomi RedmiBook Pro 16 2024 | |
| Średnia w klasie Office (229 - 766, n=88, ostatnie 2 lata) | |
| Cinebench R15 / CPU Multi 64Bit | |
| Xiaomi RedmiBook Pro 16 2024 | |
| Przeciętny AMD Ryzen 7 8845HS (2342 - 2908, n=12) | |
| Medion S10 OLED | |
| Ninkear A16 Pro | |
| Ninkear N16-Pro-32+1TB | |
| Średnia w klasie Office (246 - 3132, n=92, ostatnie 2 lata) | |
| Acer Aspire 16 A16-51GM-77G2 | |
| Lenovo IdeaPad Slim 5 16IRU9 | |
| Cinebench R15 / CPU Single 64Bit | |
| Acer Aspire 16 A16-51GM-77G2 | |
| Przeciętny AMD Ryzen 7 8845HS (269 - 283, n=12) | |
| Ninkear A16 Pro | |
| Ninkear N16-Pro-32+1TB | |
| Medion S10 OLED | |
| Xiaomi RedmiBook Pro 16 2024 | |
| Lenovo IdeaPad Slim 5 16IRU9 | |
| Średnia w klasie Office (98 - 294, n=90, ostatnie 2 lata) | |
| Blender / v2.79 BMW27 CPU | |
| Średnia w klasie Office (163 - 1956, n=91, ostatnie 2 lata) | |
| Lenovo IdeaPad Slim 5 16IRU9 | |
| Acer Aspire 16 A16-51GM-77G2 | |
| Ninkear N16-Pro-32+1TB | |
| Ninkear A16 Pro | |
| Medion S10 OLED | |
| Przeciętny AMD Ryzen 7 8845HS (179 - 216, n=12) | |
| Xiaomi RedmiBook Pro 16 2024 | |
| 7-Zip 18.03 / 7z b 4 | |
| Xiaomi RedmiBook Pro 16 2024 | |
| Przeciętny AMD Ryzen 7 8845HS (62669 - 74664, n=12) | |
| Ninkear A16 Pro | |
| Medion S10 OLED | |
| Ninkear N16-Pro-32+1TB | |
| Średnia w klasie Office (7532 - 76886, n=92, ostatnie 2 lata) | |
| Lenovo IdeaPad Slim 5 16IRU9 | |
| Acer Aspire 16 A16-51GM-77G2 | |
| 7-Zip 18.03 / 7z b 4 -mmt1 | |
| Ninkear N16-Pro-32+1TB | |
| Przeciętny AMD Ryzen 7 8845HS (5197 - 6714, n=12) | |
| Acer Aspire 16 A16-51GM-77G2 | |
| Lenovo IdeaPad Slim 5 16IRU9 | |
| Ninkear A16 Pro | |
| Medion S10 OLED | |
| Xiaomi RedmiBook Pro 16 2024 | |
| Średnia w klasie Office (2972 - 6687, n=91, ostatnie 2 lata) | |
| Geekbench 6.4 / Multi-Core | |
| Xiaomi RedmiBook Pro 16 2024 | |
| Ninkear A16 Pro | |
| Przeciętny AMD Ryzen 7 8845HS (11073 - 14014, n=16) | |
| Medion S10 OLED | |
| Acer Aspire 16 A16-51GM-77G2 | |
| Lenovo IdeaPad Slim 5 16IRU9 | |
| Ninkear N16-Pro-32+1TB | |
| Średnia w klasie Office (662 - 14767, n=85, ostatnie 2 lata) | |
| Geekbench 6.4 / Single-Core | |
| Acer Aspire 16 A16-51GM-77G2 | |
| Lenovo IdeaPad Slim 5 16IRU9 | |
| Przeciętny AMD Ryzen 7 8845HS (2510 - 2698, n=14) | |
| Ninkear A16 Pro | |
| Ninkear N16-Pro-32+1TB | |
| Medion S10 OLED | |
| Xiaomi RedmiBook Pro 16 2024 | |
| Średnia w klasie Office (457 - 2871, n=84, ostatnie 2 lata) | |
| Geekbench 5.5 / Multi-Core | |
| Xiaomi RedmiBook Pro 16 2024 | |
| Przeciętny AMD Ryzen 7 8845HS (11256 - 12726, n=13) | |
| Ninkear A16 Pro | |
| Medion S10 OLED | |
| Ninkear N16-Pro-32+1TB | |
| Acer Aspire 16 A16-51GM-77G2 | |
| Lenovo IdeaPad Slim 5 16IRU9 | |
| Średnia w klasie Office (1018 - 14192, n=91, ostatnie 2 lata) | |
| Geekbench 5.5 / Single-Core | |
| Acer Aspire 16 A16-51GM-77G2 | |
| Przeciętny AMD Ryzen 7 8845HS (1765 - 2004, n=13) | |
| Lenovo IdeaPad Slim 5 16IRU9 | |
| Ninkear N16-Pro-32+1TB | |
| Ninkear A16 Pro | |
| Xiaomi RedmiBook Pro 16 2024 | |
| Medion S10 OLED | |
| Średnia w klasie Office (510 - 2096, n=92, ostatnie 2 lata) | |
| HWBOT x265 Benchmark v2.2 / 4k Preset | |
| Przeciętny AMD Ryzen 7 8845HS (18.6 - 22.7, n=12) | |
| Xiaomi RedmiBook Pro 16 2024 | |
| Ninkear A16 Pro | |
| Medion S10 OLED | |
| Ninkear N16-Pro-32+1TB | |
| Średnia w klasie Office (1.72 - 22.4, n=89, ostatnie 2 lata) | |
| Lenovo IdeaPad Slim 5 16IRU9 | |
| Acer Aspire 16 A16-51GM-77G2 | |
| LibreOffice / 20 Documents To PDF | |
| Średnia w klasie Office (31.3 - 129.6, n=89, ostatnie 2 lata) | |
| Ninkear A16 Pro | |
| Przeciętny AMD Ryzen 7 8845HS (44.4 - 77, n=12) | |
| Medion S10 OLED | |
| Xiaomi RedmiBook Pro 16 2024 | |
| Ninkear N16-Pro-32+1TB | |
| Lenovo IdeaPad Slim 5 16IRU9 | |
| Acer Aspire 16 A16-51GM-77G2 | |
| R Benchmark 2.5 / Overall mean | |
| Średnia w klasie Office (0.4098 - 1.135, n=88, ostatnie 2 lata) | |
| Ninkear A16 Pro | |
| Xiaomi RedmiBook Pro 16 2024 | |
| Medion S10 OLED | |
| Przeciętny AMD Ryzen 7 8845HS (0.4304 - 0.4935, n=12) | |
| Ninkear N16-Pro-32+1TB | |
| Lenovo IdeaPad Slim 5 16IRU9 | |
| Acer Aspire 16 A16-51GM-77G2 | |
* ... im mniej tym lepiej
AIDA64: FP32 Ray-Trace | FPU Julia | CPU SHA3 | CPU Queen | FPU SinJulia | FPU Mandel | CPU AES | CPU ZLib | FP64 Ray-Trace | CPU PhotoWorxx
| Performance Rating | |
| Przeciętny AMD Ryzen 7 8845HS | |
| Ninkear A16 Pro | |
| Xiaomi RedmiBook Pro 16 2024 | |
| Medion S10 OLED | |
| Ninkear N16-Pro-32+1TB | |
| Średnia w klasie Office | |
| Lenovo IdeaPad Slim 5 16IRU9 | |
| Acer Aspire 16 A16-51GM-77G2 | |
| AIDA64 / FP32 Ray-Trace | |
| Przeciętny AMD Ryzen 7 8845HS (23708 - 29544, n=12) | |
| Ninkear A16 Pro | |
| Medion S10 OLED | |
| Xiaomi RedmiBook Pro 16 2024 | |
| Ninkear N16-Pro-32+1TB | |
| Średnia w klasie Office (763 - 31245, n=90, ostatnie 2 lata) | |
| Lenovo IdeaPad Slim 5 16IRU9 | |
| Acer Aspire 16 A16-51GM-77G2 | |
| AIDA64 / FPU Julia | |
| Przeciętny AMD Ryzen 7 8845HS (99659 - 125873, n=12) | |
| Ninkear A16 Pro | |
| Xiaomi RedmiBook Pro 16 2024 | |
| Medion S10 OLED | |
| Ninkear N16-Pro-32+1TB | |
| Średnia w klasie Office (4113 - 125394, n=90, ostatnie 2 lata) | |
| Lenovo IdeaPad Slim 5 16IRU9 | |
| Acer Aspire 16 A16-51GM-77G2 | |
| AIDA64 / CPU SHA3 | |
| Przeciętny AMD Ryzen 7 8845HS (4332 - 5180, n=12) | |
| Ninkear A16 Pro | |
| Xiaomi RedmiBook Pro 16 2024 | |
| Medion S10 OLED | |
| Średnia w klasie Office (287 - 5398, n=90, ostatnie 2 lata) | |
| Ninkear N16-Pro-32+1TB | |
| Lenovo IdeaPad Slim 5 16IRU9 | |
| Acer Aspire 16 A16-51GM-77G2 | |
| AIDA64 / CPU Queen | |
| Przeciętny AMD Ryzen 7 8845HS (109458 - 124695, n=12) | |
| Ninkear A16 Pro | |
| Xiaomi RedmiBook Pro 16 2024 | |
| Medion S10 OLED | |
| Średnia w klasie Office (8185 - 115197, n=90, ostatnie 2 lata) | |
| Acer Aspire 16 A16-51GM-77G2 | |
| Lenovo IdeaPad Slim 5 16IRU9 | |
| Ninkear N16-Pro-32+1TB | |
| AIDA64 / FPU SinJulia | |
| Przeciętny AMD Ryzen 7 8845HS (14062 - 15519, n=12) | |
| Ninkear A16 Pro | |
| Xiaomi RedmiBook Pro 16 2024 | |
| Medion S10 OLED | |
| Średnia w klasie Office (404 - 18321, n=90, ostatnie 2 lata) | |
| Ninkear N16-Pro-32+1TB | |
| Acer Aspire 16 A16-51GM-77G2 | |
| Lenovo IdeaPad Slim 5 16IRU9 | |
| AIDA64 / FPU Mandel | |
| Przeciętny AMD Ryzen 7 8845HS (53436 - 67367, n=12) | |
| Ninkear A16 Pro | |
| Medion S10 OLED | |
| Xiaomi RedmiBook Pro 16 2024 | |
| Średnia w klasie Office (2075 - 66922, n=90, ostatnie 2 lata) | |
| Ninkear N16-Pro-32+1TB | |
| Lenovo IdeaPad Slim 5 16IRU9 | |
| Acer Aspire 16 A16-51GM-77G2 | |
| AIDA64 / CPU AES | |
| Ninkear A16 Pro | |
| Przeciętny AMD Ryzen 7 8845HS (64515 - 172642, n=12) | |
| Ninkear N16-Pro-32+1TB | |
| Xiaomi RedmiBook Pro 16 2024 | |
| Medion S10 OLED | |
| Średnia w klasie Office (7254 - 155900, n=90, ostatnie 2 lata) | |
| Lenovo IdeaPad Slim 5 16IRU9 | |
| Acer Aspire 16 A16-51GM-77G2 | |
| AIDA64 / CPU ZLib | |
| Xiaomi RedmiBook Pro 16 2024 | |
| Medion S10 OLED | |
| Przeciętny AMD Ryzen 7 8845HS (627 - 1080, n=12) | |
| Ninkear A16 Pro | |
| Ninkear N16-Pro-32+1TB | |
| Średnia w klasie Office (78 - 1366, n=90, ostatnie 2 lata) | |
| Lenovo IdeaPad Slim 5 16IRU9 | |
| Acer Aspire 16 A16-51GM-77G2 | |
| AIDA64 / FP64 Ray-Trace | |
| Przeciętny AMD Ryzen 7 8845HS (12361 - 15911, n=12) | |
| Ninkear A16 Pro | |
| Medion S10 OLED | |
| Xiaomi RedmiBook Pro 16 2024 | |
| Ninkear N16-Pro-32+1TB | |
| Średnia w klasie Office (432 - 17834, n=90, ostatnie 2 lata) | |
| Acer Aspire 16 A16-51GM-77G2 | |
| Lenovo IdeaPad Slim 5 16IRU9 | |
| AIDA64 / CPU PhotoWorxx | |
| Xiaomi RedmiBook Pro 16 2024 | |
| Przeciętny AMD Ryzen 7 8845HS (33192 - 41668, n=12) | |
| Medion S10 OLED | |
| Lenovo IdeaPad Slim 5 16IRU9 | |
| Ninkear A16 Pro | |
| Acer Aspire 16 A16-51GM-77G2 | |
| Średnia w klasie Office (4814 - 54971, n=90, ostatnie 2 lata) | |
| Ninkear N16-Pro-32+1TB | |
Wydajność systemu
CrossMark: Overall | Productivity | Creativity | Responsiveness
WebXPRT 3: Overall
WebXPRT 4: Overall
Mozilla Kraken 1.1: Total
| PCMark 10 / Score | |
| Ninkear A16 Pro | |
| Przeciętny AMD Ryzen 7 8845HS, AMD Radeon 780M (7120 - 7641, n=7) | |
| Xiaomi RedmiBook Pro 16 2024 | |
| Acer Aspire 16 A16-51GM-77G2 | |
| Medion S10 OLED | |
| Lenovo IdeaPad Slim 5 16IRU9 | |
| Średnia w klasie Office (2463 - 7578, n=82, ostatnie 2 lata) | |
| Ninkear N16-Pro-32+1TB | |
| PCMark 10 / Essentials | |
| Lenovo IdeaPad Slim 5 16IRU9 | |
| Acer Aspire 16 A16-51GM-77G2 | |
| Ninkear A16 Pro | |
| Przeciętny AMD Ryzen 7 8845HS, AMD Radeon 780M (10685 - 11570, n=7) | |
| Xiaomi RedmiBook Pro 16 2024 | |
| Średnia w klasie Office (5575 - 20841, n=82, ostatnie 2 lata) | |
| Ninkear N16-Pro-32+1TB | |
| Medion S10 OLED | |
| PCMark 10 / Productivity | |
| Ninkear A16 Pro | |
| Przeciętny AMD Ryzen 7 8845HS, AMD Radeon 780M (9787 - 10482, n=7) | |
| Acer Aspire 16 A16-51GM-77G2 | |
| Xiaomi RedmiBook Pro 16 2024 | |
| Lenovo IdeaPad Slim 5 16IRU9 | |
| Medion S10 OLED | |
| Średnia w klasie Office (3041 - 10415, n=82, ostatnie 2 lata) | |
| Ninkear N16-Pro-32+1TB | |
| PCMark 10 / Digital Content Creation | |
| Xiaomi RedmiBook Pro 16 2024 | |
| Przeciętny AMD Ryzen 7 8845HS, AMD Radeon 780M (9009 - 10009, n=7) | |
| Ninkear A16 Pro | |
| Medion S10 OLED | |
| Acer Aspire 16 A16-51GM-77G2 | |
| Średnia w klasie Office (2049 - 11108, n=82, ostatnie 2 lata) | |
| Lenovo IdeaPad Slim 5 16IRU9 | |
| Ninkear N16-Pro-32+1TB | |
| CrossMark / Overall | |
| Acer Aspire 16 A16-51GM-77G2 | |
| Przeciętny AMD Ryzen 7 8845HS, AMD Radeon 780M (1633 - 1939, n=7) | |
| Xiaomi RedmiBook Pro 16 2024 | |
| Medion S10 OLED | |
| Lenovo IdeaPad Slim 5 16IRU9 | |
| Ninkear A16 Pro | |
| Ninkear N16-Pro-32+1TB | |
| Średnia w klasie Office (348 - 1891, n=84, ostatnie 2 lata) | |
| CrossMark / Productivity | |
| Acer Aspire 16 A16-51GM-77G2 | |
| Przeciętny AMD Ryzen 7 8845HS, AMD Radeon 780M (1562 - 1872, n=7) | |
| Xiaomi RedmiBook Pro 16 2024 | |
| Medion S10 OLED | |
| Lenovo IdeaPad Slim 5 16IRU9 | |
| Ninkear A16 Pro | |
| Ninkear N16-Pro-32+1TB | |
| Średnia w klasie Office (393 - 1870, n=84, ostatnie 2 lata) | |
| CrossMark / Creativity | |
| Xiaomi RedmiBook Pro 16 2024 | |
| Przeciętny AMD Ryzen 7 8845HS, AMD Radeon 780M (1734 - 2040, n=7) | |
| Ninkear A16 Pro | |
| Acer Aspire 16 A16-51GM-77G2 | |
| Medion S10 OLED | |
| Lenovo IdeaPad Slim 5 16IRU9 | |
| Ninkear N16-Pro-32+1TB | |
| Średnia w klasie Office (340 - 2155, n=84, ostatnie 2 lata) | |
| CrossMark / Responsiveness | |
| Acer Aspire 16 A16-51GM-77G2 | |
| Przeciętny AMD Ryzen 7 8845HS, AMD Radeon 780M (1437 - 1849, n=7) | |
| Xiaomi RedmiBook Pro 16 2024 | |
| Medion S10 OLED | |
| Lenovo IdeaPad Slim 5 16IRU9 | |
| Ninkear A16 Pro | |
| Ninkear N16-Pro-32+1TB | |
| Średnia w klasie Office (258 - 2017, n=84, ostatnie 2 lata) | |
| WebXPRT 3 / Overall | |
| Lenovo IdeaPad Slim 5 16IRU9 | |
| Przeciętny AMD Ryzen 7 8845HS, AMD Radeon 780M (295 - 334, n=7) | |
| Acer Aspire 16 A16-51GM-77G2 | |
| Ninkear A16 Pro | |
| Xiaomi RedmiBook Pro 16 2024 | |
| Ninkear N16-Pro-32+1TB | |
| Średnia w klasie Office (121 - 455, n=84, ostatnie 2 lata) | |
| Medion S10 OLED | |
| WebXPRT 4 / Overall | |
| Acer Aspire 16 A16-51GM-77G2 | |
| Lenovo IdeaPad Slim 5 16IRU9 | |
| Przeciętny AMD Ryzen 7 8845HS, AMD Radeon 780M (245 - 314, n=7) | |
| Ninkear A16 Pro | |
| Xiaomi RedmiBook Pro 16 2024 | |
| Medion S10 OLED | |
| Średnia w klasie Office (80 - 328, n=84, ostatnie 2 lata) | |
| Mozilla Kraken 1.1 / Total | |
| Średnia w klasie Office (399 - 1966, n=92, ostatnie 2 lata) | |
| Medion S10 OLED | |
| Medion S10 OLED | |
| Przeciętny AMD Ryzen 7 8845HS, AMD Radeon 780M (501 - 664, n=7) | |
| Ninkear N16-Pro-32+1TB | |
| Ninkear A16 Pro | |
| Xiaomi RedmiBook Pro 16 2024 | |
| Lenovo IdeaPad Slim 5 16IRU9 | |
| Acer Aspire 16 A16-51GM-77G2 | |
* ... im mniej tym lepiej
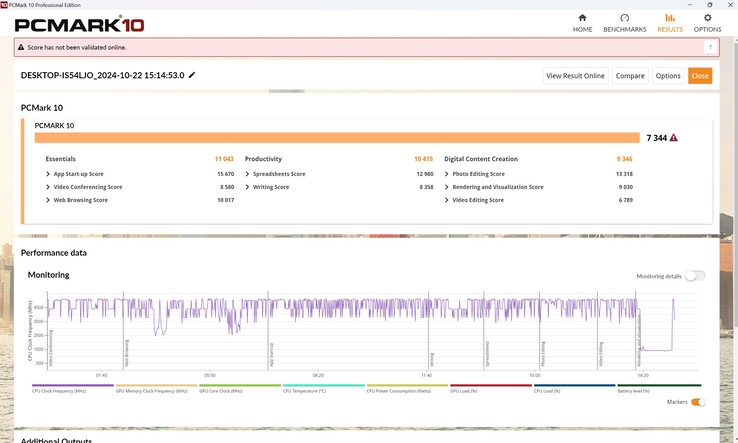
| PCMark 10 Score | 7344 pkt. | |
Pomoc | ||
| AIDA64 / Memory Copy | |
| Xiaomi RedmiBook Pro 16 2024 | |
| Przeciętny AMD Ryzen 7 8845HS (61459 - 71873, n=12) | |
| Medion S10 OLED | |
| Ninkear A16 Pro | |
| Lenovo IdeaPad Slim 5 16IRU9 | |
| Acer Aspire 16 A16-51GM-77G2 | |
| Średnia w klasie Office (7158 - 108783, n=91, ostatnie 2 lata) | |
| Ninkear N16-Pro-32+1TB | |
| AIDA64 / Memory Read | |
| Xiaomi RedmiBook Pro 16 2024 | |
| Medion S10 OLED | |
| Ninkear A16 Pro | |
| Acer Aspire 16 A16-51GM-77G2 | |
| Przeciętny AMD Ryzen 7 8845HS (49866 - 61976, n=12) | |
| Średnia w klasie Office (7325 - 127282, n=91, ostatnie 2 lata) | |
| Lenovo IdeaPad Slim 5 16IRU9 | |
| Ninkear N16-Pro-32+1TB | |
| AIDA64 / Memory Write | |
| Przeciętny AMD Ryzen 7 8845HS (68425 - 93239, n=12) | |
| Lenovo IdeaPad Slim 5 16IRU9 | |
| Xiaomi RedmiBook Pro 16 2024 | |
| Ninkear A16 Pro | |
| Medion S10 OLED | |
| Acer Aspire 16 A16-51GM-77G2 | |
| Średnia w klasie Office (7579 - 117935, n=91, ostatnie 2 lata) | |
| Ninkear N16-Pro-32+1TB | |
| AIDA64 / Memory Latency | |
| Medion S10 OLED | |
| Xiaomi RedmiBook Pro 16 2024 | |
| Ninkear A16 Pro | |
| Lenovo IdeaPad Slim 5 16IRU9 | |
| Przeciętny AMD Ryzen 7 8845HS (82.5 - 117, n=12) | |
| Średnia w klasie Office (7.6 - 185.2, n=89, ostatnie 2 lata) | |
| Acer Aspire 16 A16-51GM-77G2 | |
| Ninkear N16-Pro-32+1TB | |
* ... im mniej tym lepiej
Opóźnienie DPC
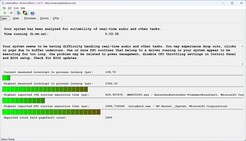
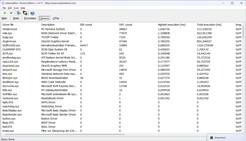
Niewielkie problemy pojawiały się, gdy tylko poruszyliśmy wskaźnikiem myszy po uruchomieniu LatencyMon. Wzrosły one minimalnie po otwarciu przeglądarki; otwarcie kilku kart nie miało już żadnego wpływu na wartość. Odtwarzanie naszego wideo 4K/60 fps z YouTube przebiegło bez żadnych spadków klatek, nawet jeśli wartość opóźnienia ponownie nieznacznie wzrosła w 10-sekundowym teście Prime95. Ogólnie jednak wartość opóźnienia nie była zbyt wysoka i była nawet drugą najniższą w porównaniu.
| DPC Latencies / LatencyMon - interrupt to process latency (max), Web, Youtube, Prime95 | |
| Medion S10 OLED | |
| Acer Aspire 16 A16-51GM-77G2 | |
| Lenovo IdeaPad Slim 5 16IRU9 | |
| Ninkear N16-Pro-32+1TB | |
| Ninkear A16 Pro | |
| Xiaomi RedmiBook Pro 16 2024 | |
* ... im mniej tym lepiej
Urządzenie pamięci masowej
HWinfo dopasowało również dysk SSD - nasze spojrzenie do wnętrza laptopa ujawniło markę "Authorain" o pojemności 1 TB. Wyszukiwarka Google również nie znalazła niczego na ten temat, ale jak wiemy, nie jest to już to, co kiedyś. Tabliczka znamionowa mówi coś o 6 GB/s, ale zmierzyliśmy około 2 GB/s. Konkurencyjne modele były szybsze, ale w praktyce nie zauważą Państwo tego zbytnio.
Utrzymywał swoją wydajność przez długi czas w ciągłym stresie, ale potem zmagał się z niewielkimi spadkami w ostatniej jednej trzeciej testu.
| Drive Performance Rating - Percent | |
| Acer Aspire 16 A16-51GM-77G2 | |
| Medion S10 OLED | |
| Średnia w klasie Office | |
| Xiaomi RedmiBook Pro 16 2024 | |
| Lenovo IdeaPad Slim 5 16IRU9 | |
| Ninkear N16-Pro-32+1TB | |
| Ninkear A16 Pro | |
| Przeciętny Authorain NV900-1T | |
* ... im mniej tym lepiej
Reading continuous performance: DiskSpd Read Loop, Queue Depth 8
Karta graficzna
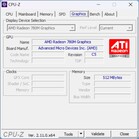
Zintegrowany z procesorem układ graficzny Radeon 780M może być wykorzystywany w aplikacjach 3D. Nie pogramy na niej w żadne wymagające gry, ale powinna wystarczyć do zastosowań multimedialnych i przynajmniej lekkich gier.
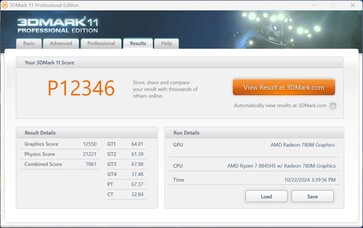
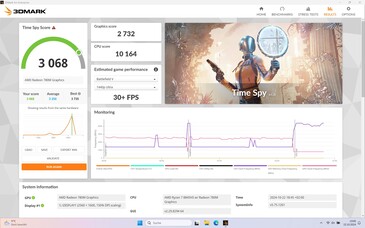
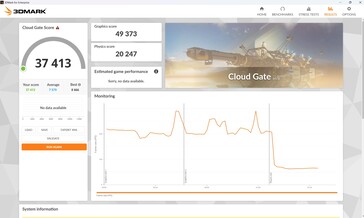
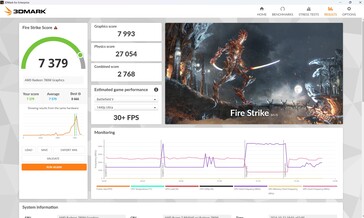
W teście 3DMark osiągnął on docelowy poziom i przewyższył starą kartę Intel UHD Graphics wewnątrz Ninkear N16 Pro. W porównaniu do Arc 8 Graphics w Core Ultra 7 155H, nasz A16 Pro uplasował się pośrodku między bardzo szybkim RedmiBookiem a raczej powolnym Medionem S10 - oba z tym samym iGPU Intela.
Nawet w teście 3D za pośrednictwem Fire Strike, wydajność nie spadła z dala od gniazdka elektrycznego.
W grach poradził sobie nawet nieco lepiej niż RedmiBook z grafiką Intela, co pokazuje, że Intel wciąż marnuje duży potencjał swoich sterowników. W stare i mniej wymagające gry, takie jak GTA V, można również grać w rozdzielczości Full HD z wysokimi detalami, podczas gdy aktualne tytuły, takie jak Cyberpunk, działają płynnie w rozdzielczości Full HD w najlepszym przypadku ze średnimi detalami - ale bardziej prawdopodobne jest, że będziesz musiał wybrać minimalne szczegóły. Wydajność podczas testu wytrzymałości Cyberpunk 2077 była przyjemna i spójna.
| 3DMark Performance Rating - Percent | |
| Acer Aspire 16 A16-51GM-77G2 | |
| Xiaomi RedmiBook Pro 16 2024 -1! | |
| Ninkear A16 Pro | |
| Przeciętny AMD Radeon 780M | |
| Medion S10 OLED -1! | |
| Średnia w klasie Office | |
| Lenovo IdeaPad Slim 5 16IRU9 | |
| Ninkear N16-Pro-32+1TB | |
| 3DMark 11 - 1280x720 Performance GPU | |
| Acer Aspire 16 A16-51GM-77G2 | |
| Xiaomi RedmiBook Pro 16 2024 | |
| Ninkear A16 Pro | |
| Przeciętny AMD Radeon 780M (7868 - 14274, n=63) | |
| Medion S10 OLED | |
| Średnia w klasie Office (1468 - 16418, n=87, ostatnie 2 lata) | |
| Lenovo IdeaPad Slim 5 16IRU9 | |
| Ninkear N16-Pro-32+1TB | |
| 3DMark | |
| 1280x720 Cloud Gate Standard Graphics | |
| Acer Aspire 16 A16-51GM-77G2 | |
| Ninkear A16 Pro | |
| Przeciętny AMD Radeon 780M (27771 - 53972, n=34) | |
| Lenovo IdeaPad Slim 5 16IRU9 | |
| Średnia w klasie Office (7982 - 58068, n=55, ostatnie 2 lata) | |
| Ninkear N16-Pro-32+1TB | |
| 1920x1080 Fire Strike Graphics | |
| Acer Aspire 16 A16-51GM-77G2 | |
| Xiaomi RedmiBook Pro 16 2024 | |
| Ninkear A16 Pro | |
| Przeciętny AMD Radeon 780M (4550 - 8904, n=65) | |
| Medion S10 OLED | |
| Średnia w klasie Office (736 - 10476, n=89, ostatnie 2 lata) | |
| Lenovo IdeaPad Slim 5 16IRU9 | |
| Ninkear N16-Pro-32+1TB | |
| 2560x1440 Time Spy Graphics | |
| Xiaomi RedmiBook Pro 16 2024 | |
| Acer Aspire 16 A16-51GM-77G2 | |
| Ninkear A16 Pro | |
| Przeciętny AMD Radeon 780M (1496 - 3196, n=65) | |
| Medion S10 OLED | |
| Średnia w klasie Office (313 - 4415, n=86, ostatnie 2 lata) | |
| Lenovo IdeaPad Slim 5 16IRU9 | |
| Ninkear N16-Pro-32+1TB | |
| 3DMark 11 Performance | 12346 pkt. | |
| 3DMark Cloud Gate Standard Score | 37413 pkt. | |
| 3DMark Fire Strike Score | 7279 pkt. | |
| 3DMark Time Spy Score | 3068 pkt. | |
| 3DMark Steel Nomad Light Score | 2714 pkt. | |
Pomoc | ||
| Blender - v3.3 Classroom CPU | |
| Średnia w klasie Office (245 - 3964, n=87, ostatnie 2 lata) | |
| Lenovo IdeaPad Slim 5 16IRU9 | |
| Acer Aspire 16 A16-51GM-77G2 | |
| Ninkear N16-Pro-32+1TB | |
| Przeciętny AMD Radeon 780M (300 - 664, n=61) | |
| Ninkear A16 Pro | |
| Medion S10 OLED | |
| Xiaomi RedmiBook Pro 16 2024 | |
* ... im mniej tym lepiej
| Performance Rating - Percent | |
| Acer Aspire 16 A16-51GM-77G2 | |
| Ninkear A16 Pro | |
| Xiaomi RedmiBook Pro 16 2024 -1! | |
| Medion S10 OLED | |
| Średnia w klasie Office | |
| Lenovo IdeaPad Slim 5 16IRU9 | |
| Ninkear N16-Pro-32+1TB -3! | |
| Baldur's Gate 3 - 1920x1080 Ultra Preset | |
| Acer Aspire 16 A16-51GM-77G2 | |
| Ninkear A16 Pro | |
| Średnia w klasie Office (7.96 - 30, n=32, ostatnie 2 lata) | |
| Medion S10 OLED | |
| Lenovo IdeaPad Slim 5 16IRU9 | |
| GTA V - 1920x1080 Highest Settings possible AA:4xMSAA + FX AF:16x | |
| Acer Aspire 16 A16-51GM-77G2 | |
| Ninkear A16 Pro | |
| Xiaomi RedmiBook Pro 16 2024 | |
| Średnia w klasie Office (3.98 - 47.8, n=78, ostatnie 2 lata) | |
| Medion S10 OLED | |
| Lenovo IdeaPad Slim 5 16IRU9 | |
| Ninkear N16-Pro-32+1TB | |
| Final Fantasy XV Benchmark - 1920x1080 High Quality | |
| Acer Aspire 16 A16-51GM-77G2 | |
| Xiaomi RedmiBook Pro 16 2024 | |
| Ninkear A16 Pro | |
| Medion S10 OLED | |
| Średnia w klasie Office (4.18 - 36.4, n=86, ostatnie 2 lata) | |
| Lenovo IdeaPad Slim 5 16IRU9 | |
| Ninkear N16-Pro-32+1TB | |
| Strange Brigade - 1920x1080 ultra AA:ultra AF:16 | |
| Acer Aspire 16 A16-51GM-77G2 | |
| Xiaomi RedmiBook Pro 16 2024 | |
| Ninkear A16 Pro | |
| Medion S10 OLED | |
| Średnia w klasie Office (12.8 - 61.7, n=69, ostatnie 2 lata) | |
| Lenovo IdeaPad Slim 5 16IRU9 | |
| Dota 2 Reborn - 1920x1080 ultra (3/3) best looking | |
| Acer Aspire 16 A16-51GM-77G2 | |
| Xiaomi RedmiBook Pro 16 2024 | |
| Ninkear A16 Pro | |
| Medion S10 OLED | |
| Lenovo IdeaPad Slim 5 16IRU9 | |
| Średnia w klasie Office (13.4 - 121.2, n=92, ostatnie 2 lata) | |
| Ninkear N16-Pro-32+1TB | |
| X-Plane 11.11 - 1920x1080 high (fps_test=3) | |
| Acer Aspire 16 A16-51GM-77G2 | |
| Ninkear A16 Pro | |
| Lenovo IdeaPad Slim 5 16IRU9 | |
| Xiaomi RedmiBook Pro 16 2024 | |
| Średnia w klasie Office (8.88 - 92.6, n=84, ostatnie 2 lata) | |
| Medion S10 OLED | |
Cyberpunk 2077 ultra FPS diagram
| low | med. | high | ultra | QHD | |
|---|---|---|---|---|---|
| GTA V (2015) | 162.2 | 149.8 | 62.2 | 25.1 | 17.4 |
| Dota 2 Reborn (2015) | 148.4 | 117.9 | 76.4 | 70.6 | |
| Final Fantasy XV Benchmark (2018) | 74.3 | 37.2 | 27 | 19.3 | |
| X-Plane 11.11 (2018) | 64.9 | 47.8 | 40.1 | ||
| Strange Brigade (2018) | 149.3 | 62.6 | 53 | 45.6 | |
| Baldur's Gate 3 (2023) | 42 | 33.3 | 27.5 | 27 | |
| Cyberpunk 2077 2.2 Phantom Liberty (2023) | 39.2 | 31 | 24.9 | 21.8 |
Emisje i moc - cichy i chłodny Ninkear
Emisja hałasu
Wentylatory są w większości wyłączone w trybie bezczynności. Nie jest też szczególnie głośny pod obciążeniem; nasz A16 Pro pozostał najcichszy w porównaniu.
Podczas testu 3DMark 06 - naszego scenariusza średniego obciążenia - wentylatory obracały się na poziomie cichego RedmiBooka, a dopiero pod sam koniec jeszcze bardziej się rozkręciły.
Hałas
| luz |
| 23 / 23 / 23 dB |
| obciążenie |
| 37.68 / 37.41 dB |
 | ||
30 dB cichy 40 dB(A) słyszalny 50 dB(A) irytujący |
||
min: | ||
| Ninkear A16 Pro Radeon 780M, R7 8845HS, Authorain NV900-1T | Ninkear N16-Pro-32+1TB UHD Graphics 64EUs, i7-13620H, Derlar FP3 NVMe M.2 SSD PCIe Gen 3.0X4 1 TB | Xiaomi RedmiBook Pro 16 2024 Arc 8-Core, Ultra 7 155H, YMTC PC300-1TB | Acer Aspire 16 A16-51GM-77G2 GeForce RTX 2050 Mobile, Core 7 150U, WD PC SN740 SDDQNQD-1T00-1014 | Lenovo IdeaPad Slim 5 16IRU9 Iris Xe G7 96EUs, Core 7 150U | Medion S10 OLED Arc 8-Core, Ultra 7 155H, Phison PS5019-E19 SSO1TBITC4-E19-V7 | |
|---|---|---|---|---|---|---|
| Noise | -8% | -3% | -18% | -5% | -16% | |
| wyłączone / środowisko * | 23 | 25 -9% | 24.4 -6% | 23 -0% | 23 -0% | 25 -9% |
| Idle Minimum * | 23 | 25 -9% | 24.4 -6% | 23 -0% | 23 -0% | 26 -13% |
| Idle Average * | 23 | 25 -9% | 24.4 -6% | 23 -0% | 23 -0% | 27 -17% |
| Idle Maximum * | 23 | 25 -9% | 24.4 -6% | 31 -35% | 23 -0% | 28 -22% |
| Load Average * | 37.68 | 35.4 6% | 32 15% | 46.57 -24% | 43.3 -15% | 43 -14% |
| Cyberpunk 2077 ultra * | 37.68 | 43.5 -15% | 50 -33% | 40.8 -8% | 42 -11% | |
| Load Maximum * | 37.41 | 42.2 -13% | 39.7 -6% | 50 -34% | 40.9 -9% | 48 -28% |
| Witcher 3 ultra * | 30.6 |
* ... im mniej tym lepiej
Temperatura
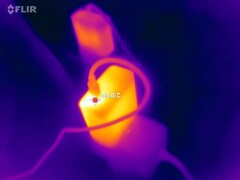
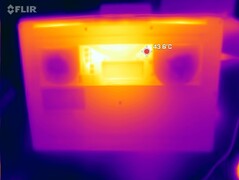
Naprawdę gorąco robi się tylko na spodzie laptopa, pośrodku wyświetlacza. To właśnie tam zlokalizowaliśmy gorący punkt o temperaturze około 50 °C. Wszędzie indziej rozwój temperatury pozostawał umiarkowany i wynosił maksymalnie 43 °C, a podpórki pod nadgarstki pozostawały znacznie chłodniejsze. Jednak mały zasilacz USB-C rozgrzał się do 56 °C.
(±) Maksymalna temperatura w górnej części wynosi 43 °C / 109 F, w porównaniu do średniej 34.3 °C / 94 F , począwszy od 21.2 do 62.5 °C dla klasy Office.
(-) Dno nagrzewa się maksymalnie do 50 °C / 122 F, w porównaniu do średniej 36.8 °C / 98 F
(±) 3: The average temperature for the upper side is 35.7 °C / 96 F, compared to the average of 29.5 °C / 85 F for the class Office.
(+) Podpórki pod nadgarstki i touchpad są chłodniejsze niż temperatura skóry i maksymalnie 31 °C / 87.8 F i dlatego są chłodne w dotyku.
(-) Średnia temperatura obszaru podparcia dłoni w podobnych urządzeniach wynosiła 27.6 °C / 81.7 F (-3.4 °C / -6.1 F).
| Ninkear A16 Pro AMD Ryzen 7 8845HS, AMD Radeon 780M | Ninkear N16-Pro-32+1TB Intel Core i7-13620H, Intel UHD Graphics 64EUs (Alder Lake 12th Gen) | Xiaomi RedmiBook Pro 16 2024 Intel Core Ultra 7 155H, Intel Arc 8-Core iGPU | Acer Aspire 16 A16-51GM-77G2 Intel Core 7 150U, NVIDIA GeForce RTX 2050 Mobile | Lenovo IdeaPad Slim 5 16IRU9 Intel Core 7 150U, Intel Iris Xe Graphics G7 96EUs | Medion S10 OLED Intel Core Ultra 7 155H, Intel Arc 8-Core iGPU | |
|---|---|---|---|---|---|---|
| Heat | 8% | 7% | -5% | 26% | -19% | |
| Maximum Upper Side * | 43 | 35.1 18% | 40.3 6% | 47 -9% | 35.4 18% | 55 -28% |
| Maximum Bottom * | 50 | 51 -2% | 45.9 8% | 50 -0% | 33 34% | 55 -10% |
| Idle Upper Side * | 27.1 | 26.3 | 31 | 30.2 | 32 | |
| Idle Bottom * | 33.8 | 27.9 | 32 | 30.2 | 33 |
* ... im mniej tym lepiej
Głośniki
Głośniki są w najlepszym razie przeciętne, prawie nie odtwarzają basów i grają tylko z rozczarowującą głośnością. Analogowe urządzenia audio można podłączyć za pomocą wyjścia jack.
Ninkear A16 Pro analiza dźwięku
(±) | głośność głośnika jest średnia, ale dobra (75.63 dB)
Bas 100 - 315 Hz
(-) | prawie brak basu - średnio 21.5% niższa od mediany
(±) | liniowość basu jest średnia (7.7% delta do poprzedniej częstotliwości)
Średnie 400 - 2000 Hz
(±) | wyższe średnie - średnio 7.6% wyższe niż mediana
(±) | liniowość środka jest średnia (7% delta do poprzedniej częstotliwości)
Wysokie 2–16 kHz
(±) | wyższe maksima - średnio 5.8% wyższe od mediany
(+) | wzloty są liniowe (6.7% delta do poprzedniej częstotliwości)
Ogólnie 100 - 16.000 Hz
(±) | liniowość ogólnego dźwięku jest średnia (26.2% różnicy w stosunku do mediany)
W porównaniu do tej samej klasy
» 79% wszystkich testowanych urządzeń w tej klasie było lepszych, 7% podobnych, 14% gorszych
» Najlepszy miał deltę 7%, średnia wynosiła ###średnia###%, najgorsza wynosiła 53%
W porównaniu do wszystkich testowanych urządzeń
» 79% wszystkich testowanych urządzeń było lepszych, 4% podobnych, 17% gorszych
» Najlepszy miał deltę 4%, średnia wynosiła ###średnia###%, najgorsza wynosiła 134%
Apple MacBook Pro 16 2021 M1 Pro analiza dźwięku
(+) | głośniki mogą odtwarzać stosunkowo głośno (84.7 dB)
Bas 100 - 315 Hz
(+) | dobry bas - tylko 3.8% od mediany
(+) | bas jest liniowy (5.2% delta do poprzedniej częstotliwości)
Średnie 400 - 2000 Hz
(+) | zbalansowane środki średnie - tylko 1.3% od mediany
(+) | średnie są liniowe (2.1% delta do poprzedniej częstotliwości)
Wysokie 2–16 kHz
(+) | zrównoważone maksima - tylko 1.9% od mediany
(+) | wzloty są liniowe (2.7% delta do poprzedniej częstotliwości)
Ogólnie 100 - 16.000 Hz
(+) | ogólny dźwięk jest liniowy (4.6% różnicy w stosunku do mediany)
W porównaniu do tej samej klasy
» 0% wszystkich testowanych urządzeń w tej klasie było lepszych, 0% podobnych, 100% gorszych
» Najlepszy miał deltę 5%, średnia wynosiła ###średnia###%, najgorsza wynosiła 45%
W porównaniu do wszystkich testowanych urządzeń
» 0% wszystkich testowanych urządzeń było lepszych, 0% podobnych, 100% gorszych
» Najlepszy miał deltę 4%, średnia wynosiła ###średnia###%, najgorsza wynosiła 134%
Zużycie energii
Zużycie energii jest dość niskie, zwłaszcza w stanie spoczynku. Jego zużycie wzrasta nieznacznie pod obciążeniem, ale nadal jest odpowiednie w porównaniu do jego wydajności. Niestety brakuje nam tutaj wartości porównawczych z RedmiBooka, podczas gdy inni, mniej wydajni konkurenci zużywają mniej pod obciążeniem. Jasność wyświetlacza nie była bez znaczenia podczas pomiaru zużycia w trybie bezczynności, przy około 4 do 5 watów między niską a pełną jasnością.
| wyłączony / stan wstrzymania | |
| luz | |
| obciążenie |
|
Legenda:
min: | |
Power consumption Cyberpunk / stress test
Power consumption with external monitor
Czas trwania
Ninkear zainstalował dużą baterię o pojemności 80 Wh, czyli więcej niż konkurencja (z wyjątkiem RedmiBooka). Jednak laptop nie działał dłużej niż jego rywale, przynajmniej w naszych testach. 7.5 godzin w teście WLAN było ogólnie w porządku, ale niektórzy konkurenci wydawali się działać dłużej przy mniejszej pojemności.
| Ninkear A16 Pro R7 8845HS, Radeon 780M, 80 Wh | Ninkear N16-Pro-32+1TB i7-13620H, UHD Graphics 64EUs, 57.75 Wh | Xiaomi RedmiBook Pro 16 2024 Ultra 7 155H, Arc 8-Core, 99 Wh | Acer Aspire 16 A16-51GM-77G2 Core 7 150U, GeForce RTX 2050 Mobile, 48.5 Wh | Lenovo IdeaPad Slim 5 16IRU9 Core 7 150U, Iris Xe G7 96EUs, 57 Wh | Medion S10 OLED Ultra 7 155H, Arc 8-Core, 70 Wh | Średnia w klasie Office | |
|---|---|---|---|---|---|---|---|
| Czasy pracy | -28% | 79% | 41% | 38% | -3% | 36% | |
| WiFi v1.3 | 450 | 322 -28% | 983 118% | 607 35% | 761 69% | 436 -3% | 638 ? 42% |
| Load | 89 | 124 39% | 130 46% | 94 6% | 114.9 ? 29% | ||
| H.264 | 1308 | 498 | 750 ? | ||||
| Reader / Idle | 1568 | 1300 ? |
Łączna ocena Notebookcheck
Ninkear A16 Pro zaimponował nam pod wieloma względami, a dzięki połączeniu dobrych i niedrogich komponentów daje poczucie, że jest nawet lepszy w ważnych obszarach niż niektórzy drożsi konkurenci.
Ninkear A16 Pro
- 24/10/2024 v8
Christian Hintze
Przezroczystość
Wyboru urządzeń do recenzji dokonuje nasza redakcja. Próbka testowa została udostępniona autorowi jako pożyczka od producenta lub sprzedawcy detalicznego na potrzeby tej recenzji. Pożyczkodawca nie miał wpływu na tę recenzję, producent nie otrzymał też kopii tej recenzji przed publikacją. Nie było obowiązku publikowania tej recenzji. Nigdy nie przyjmujemy rekompensaty ani płatności w zamian za nasze recenzje. Jako niezależna firma medialna, Notebookcheck nie podlega władzy producentów, sprzedawców detalicznych ani wydawców.
Tak testuje Notebookcheck
Każdego roku Notebookcheck niezależnie sprawdza setki laptopów i smartfonów, stosując standardowe procedury, aby zapewnić porównywalność wszystkich wyników. Od około 20 lat stale rozwijamy nasze metody badawcze, ustanawiając przy tym standardy branżowe. W naszych laboratoriach testowych doświadczeni technicy i redaktorzy korzystają z wysokiej jakości sprzętu pomiarowego. Testy te obejmują wieloetapowy proces walidacji. Nasz kompleksowy system ocen opiera się na setkach uzasadnionych pomiarów i benchmarków, co pozwala zachować obiektywizm.














 Total Sustainability Score:


