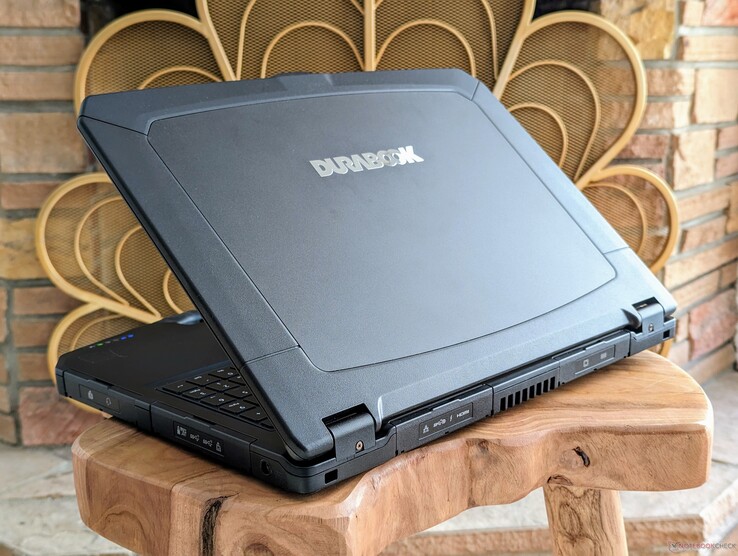
Recenzja wytrzymałego laptopa Durabook S15: Zaskakująco cienki i lekki jak na tę kategorię
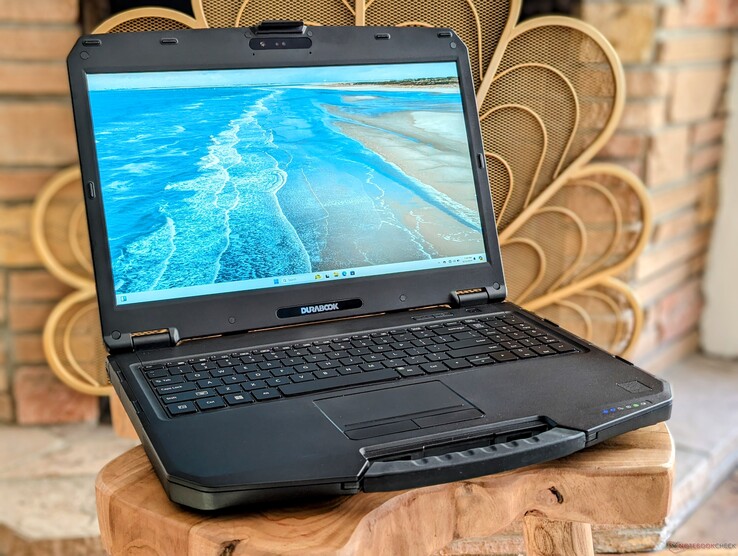
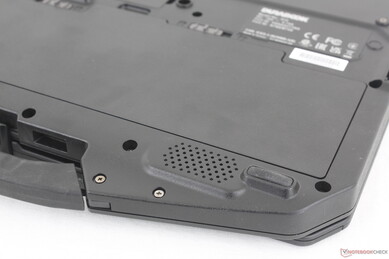
2024 S15 to najnowszy 15,6-calowy wytrzymały laptop firmy Durabook, który zastąpił starszy model 2020 S15. Wiąże się to z kilkoma zmianami zewnętrznymi, a także nowszymi procesorami Alder Lake z obsługą vPro, które zastąpiły starsze opcje Whiskey Lake-U z 2020 roku.
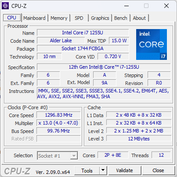
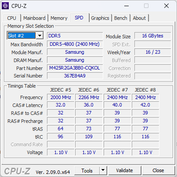
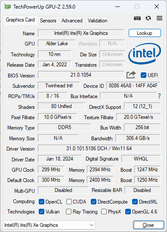
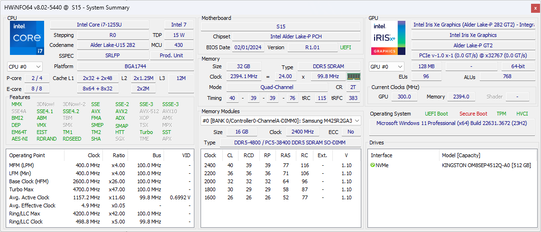
Nasz recenzowany egzemplarz wyposażony jest w procesor Core i7-1255U 12. generacji, zintegrowaną grafikę Iris Xe i wyświetlacz IPS 1080p o jasności 1000 nitów, podczas gdy inne jednostki SKU mogą oferować wolniejszy procesor Core i5-1235U, szybszą dyskretną grafikę Quadro T1000 lub ciemniejszy wyświetlacz. Pełną specyfikację można znaleźć na stronie tutaj.
Więcej recenzji Durabook:
Potencjalni konkurenci w porównaniu
Ocena | Data | Model | Waga | Wysokość | Rozmiar | Rezolucja | Cena |
|---|---|---|---|---|---|---|---|
| 80.5 % | 06/2024 | Durabook S15 i7-1255U, Iris Xe G7 96EUs | 2.7 kg | 29.5 mm | 15.60" | 1920x1080 | |
| 78.3 % v7 (old) | Durabook S15ABG2 i5-8265U, UHD Graphics 620 | 2.6 kg | 30 mm | 15.60" | 1920x1080 | ||
v (old) | 10/2024 | Panasonic Toughbook 40 i7-1185G7, Iris Xe G7 96EUs | 3.9 kg | 53.4 mm | 14.00" | 1920x1080 | |
| 82.9 % v7 (old) | 06/2024 | Getac S410 G5 i5-1350P, Iris Xe G7 80EUs | 2.9 kg | 34.9 mm | 14.00" | 1920x1080 | |
| 89.2 % v6 (old) | Dell Latitude 5420 Rugged-P85G i7-8650U, Radeon RX 540 | 2.8 kg | 32.9 mm | 14.00" | 1920x1080 | ||
| 82.4 % v7 (old) | Acer Enduro Urban N3 EUN314 i7-1165G7, Iris Xe G7 96EUs | 1.8 kg | 21.95 mm | 14.00" | 1920x1080 |
Obudowa - certyfikat MIL-STD-810H
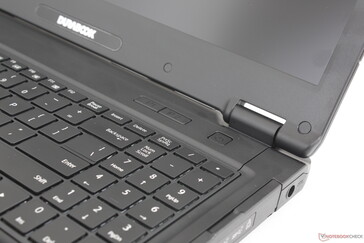
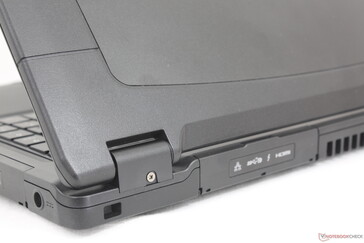
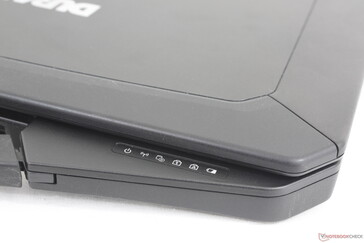
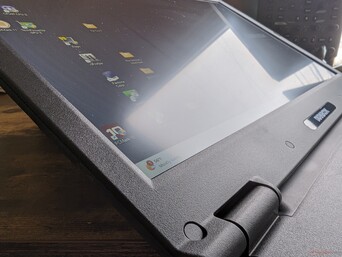
Z wizualnego punktu widzenia, w obudowie wprowadzono pewne poprawki, w tym nowy jednolity czarny kolor, większą klawiaturę z numpadem, płynniejsze przejście między klawiaturą a uchwytem do przenoszenia oraz poprawione rozmieszczenie portów ze względu na wszystkie wewnętrzne zmiany na płycie głównej. Jakość obudowy pozostaje doskonała, tak jak poprzednio, z wyjątkiem części klawiatury z numpadem, gdzie powierzchnia ma tendencję do wypaczania się znacznie łatwiej podczas wywierania nacisku. Uważamy, że grubszy Getac S410 jest bardziej wytrzymały, zwłaszcza na rogach, ponieważ Durabook nie jest gumowany dla lepszej ochrony przed upadkiem.
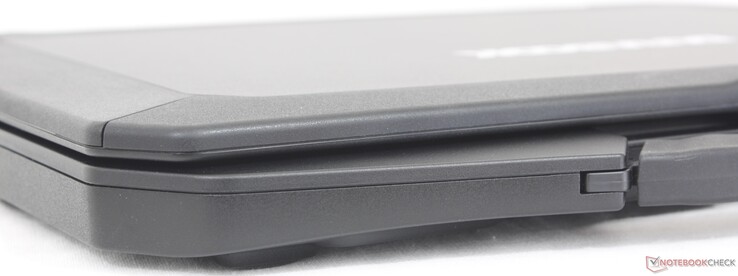
Waga i wymiary są zasadniczo identyczne z konstrukcją z 2020 roku, aby zachować kompatybilność z jak największą liczbą akcesoriów. Starsza konstrukcja była już bardzo przenośna dla tej kategorii i nadal pozostaje to prawdą w przypadku 2024 S15, gdzie producent chwali się tytułem "najcieńszego i najlżejszego". 14-calowy Getac S410 G5na przykład, jest zarówno cięższy, jak i grubszy niż S15, mimo że Durabook oferuje większy 15,6-calowy ekran.
Łączność - teraz z większą liczbą portów USB-C
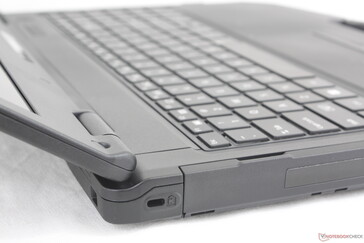
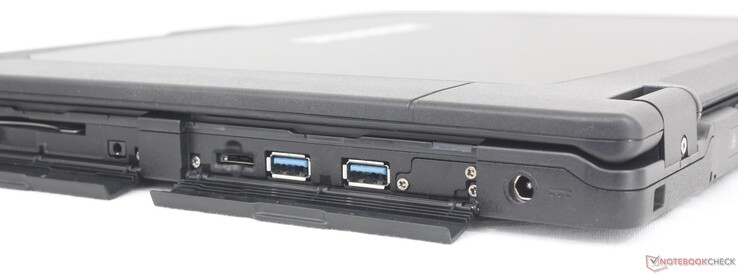
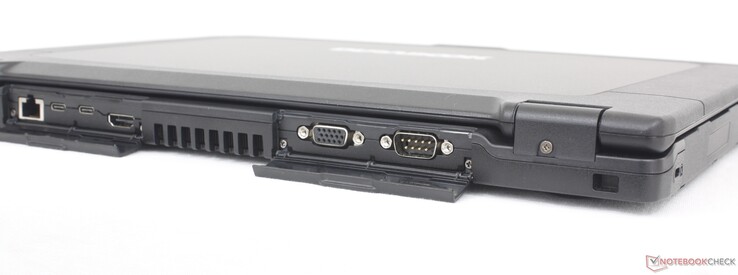
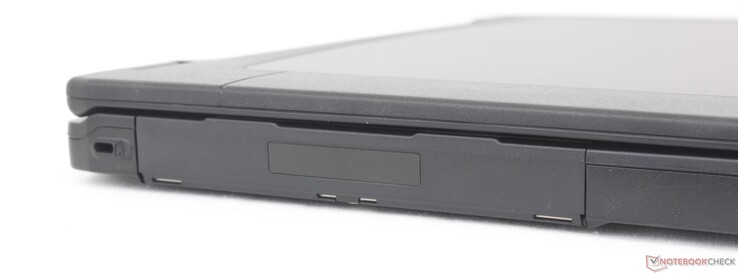
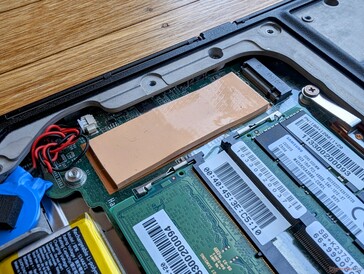
Różnorodność portów jest doskonała, a wszystkie te same opcje powracają z grubszego S15AB. Najbardziej godne uwagi jest dodanie drugiego portu USB-C do obsługi Thunderbolt oraz poręcznego gniazda ODD do wymiany podczas pracy dodatkowej pamięci masowej lub specjalistycznych akcesoriów. Proszę zauważyć, że chociaż oba porty USB-C obsługują DisplayPort, to tylko port kompatybilny z Thunderbolt obsługuje Power Delivery do ładowania urządzenia.
Klapki ochronne zakrywające porty są znacznie łatwiejsze do otwierania i zamykania niż klapki w Getac S410. To mały szczegół, który sprawia, że Durabook jest nieco bardziej przyjazny w użyciu w terenie.
Czytnik kart SD
Szybkość transferu kart SD nie uległa poprawie. Zalecamy sprawdzenie Dell Latitude Seria Rugged które mają tendencję do integrowania znacznie szybszych czytników kart SD, jeśli szybkość transferu jest priorytetem.
| SD Card Reader | |
| average JPG Copy Test (av. of 3 runs) | |
| Dell Latitude 5420 Rugged-P85G (Toshiba Exceria Pro SDXC 64 GB UHS-II) | |
| Getac S410 G5 (AV Pro V60) | |
| Panasonic Toughbook 40 (AV Pro V60) | |
| Durabook S15ABG2 (Toshiba Exceria Pro SDXC 64 GB UHS-II) | |
| Durabook S15 (AV Pro V60) | |
| Acer Enduro Urban N3 EUN314 (AV Pro V60) | |
| maximum AS SSD Seq Read Test (1GB) | |
| Dell Latitude 5420 Rugged-P85G (Toshiba Exceria Pro SDXC 64 GB UHS-II) | |
| Getac S410 G5 (AV Pro V60) | |
| Durabook S15 (AV Pro V60) | |
| Durabook S15ABG2 (Toshiba Exceria Pro SDXC 64 GB UHS-II) | |
| Panasonic Toughbook 40 (AV Pro V60) | |
| Acer Enduro Urban N3 EUN314 (AV Pro V60) | |
Komunikacja
| Networking | |
| iperf3 transmit AX12 | |
| Acer Enduro Urban N3 EUN314 | |
| Durabook S15ABG2 | |
| Dell Latitude 5420 Rugged-P85G | |
| iperf3 receive AX12 | |
| Acer Enduro Urban N3 EUN314 | |
| Durabook S15ABG2 | |
| Dell Latitude 5420 Rugged-P85G | |
| iperf3 transmit AXE11000 | |
| Durabook S15 | |
| Panasonic Toughbook 40 | |
| Getac S410 G5 | |
| iperf3 receive AXE11000 | |
| Panasonic Toughbook 40 | |
| Durabook S15 | |
| Getac S410 G5 | |
| iperf3 transmit AXE11000 6GHz | |
| Durabook S15 | |
| Getac S410 G5 | |
| iperf3 receive AXE11000 6GHz | |
| Durabook S15 | |
| Getac S410 G5 | |
Kamera internetowa
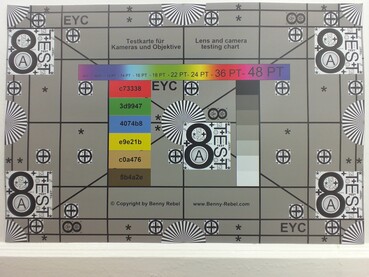
Kamera internetowa może być skonfigurowana na 2 MP, 5 MP lub wcale, w zależności od aplikacji użytkownika. Nasz egzemplarz zawiera czujnik 5 MP z wbudowaną podczerwienią do obsługi Hello. Fizyczna przesuwana migawka jest standardem w przypadku obaw o prywatność.
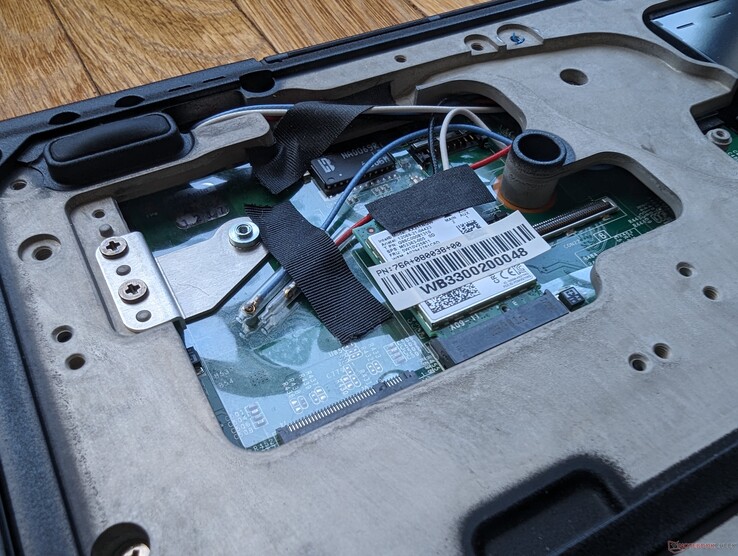
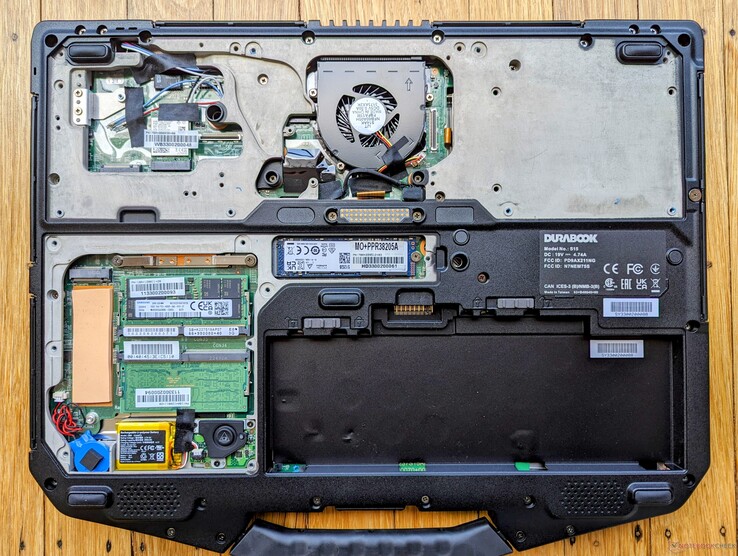
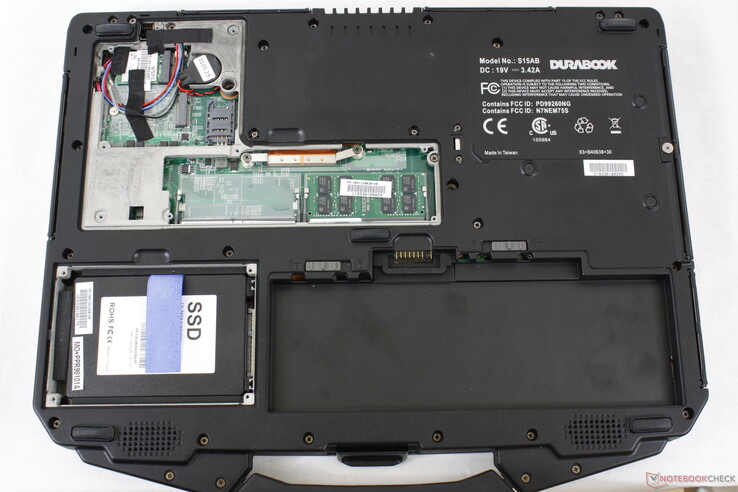
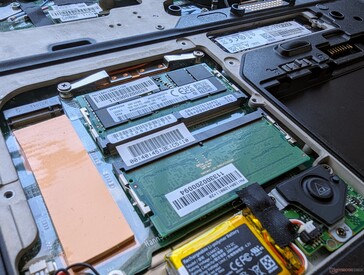
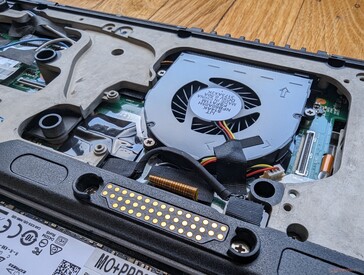
Konserwacja
Akcesoria i gwarancja
Durabook oferuje kilka opcjonalnych akcesoriów, w tym wnęki na nośniki rozszerzeń, zasilacze samochodowe, stacje dokujące i zapasowe baterie. Proszę zauważyć, że nie ma pióra ani rysika, ponieważ ekran dotykowy nie jest opcją.
W standardzie otrzymają Państwo trzyletnią ograniczoną gwarancję producenta.
Urządzenia wejściowe - słaba klawiatura w połączeniu z doskonałym touchpadem
Klawiatura
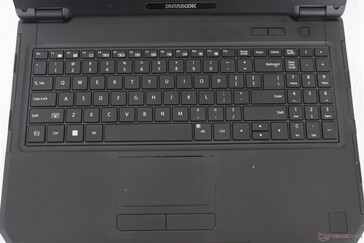
Klawiatura jest niestety mieszana. Choć przestronna ze zintegrowanym numpadem, sprzężenie zwrotne klawiszy jest słabe, a skok jest zbyt płytki, nawet w porównaniu do cieńszych laptopów konsumenckich, takich jak HP Pavilion lub Lenovo IdeaPad. W szczególności klawisz spacji wydaje się gąbczasty po naciśnięciu, gdy jest tradycyjnie mocniejszy i bardziej klikalny niż główne klawisze QWERTY. Wspomniane wcześniej wypaczenie podczas naciskania klawiatury numerycznej również nie pomaga w sprzężeniu zwrotnym klawiszy. Dlatego też pisanie na klawiaturze S15 może wydawać się niesatysfakcjonujące.
Panel dotykowy
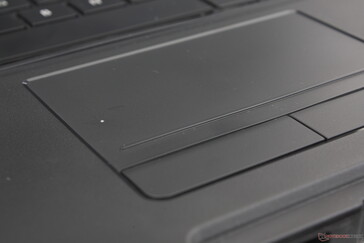
Powierzchnia użytkowa touchpada jest identyczna jak w modelu 2020 S15AB i wynosi 10 x 5 cm. Musimy powiedzieć "użytkowy", ponieważ rzeczywista powierzchnia gładzika wydaje się nieco większa, ale wąska sekcja między podniesionym paskiem a dedykowanymi przyciskami myszy to tylko martwa przestrzeń. Powierzchnia jest lekko teksturowana z doskonałą responsywnością, podczas gdy gładziki w innych wytrzymałych laptopach, takich jak Getac S410 lub Panasonic Toughbook 40 mogą często pomijać lub błędnie rejestrować dane wejściowe. Jest to jeden z lepszych trackpadów, jakie widzieliśmy w tej kategorii.
Tymczasem dedykowane przyciski myszy są mocne i głośne po naciśnięciu, co zapewnia satysfakcjonujące odczucia. Podróż mogłaby być jednak nieco głębsza.
Wyświetlacz - jasna matryca IPS o jasności 1000 nitów
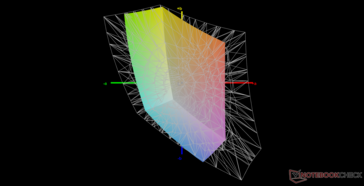
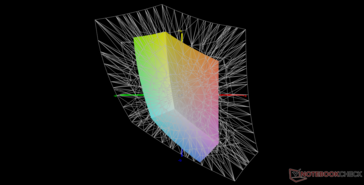
S15 to pierwszy model w naszej bazie danych wyposażony w panel IPS HKC MB156CS01'2. Jest to znacząca poprawa w stosunku do panelu Chi Mei TN w starszym modelu S15ABG2 pod względem kątów widzenia, kontrastu i jasności, podczas gdy inne aspekty, takie jak czas reakcji i kolory, są w dużej mierze takie same. Inne wytrzymałe modele, takie jak Dell Latitude 5420 Rugged lub Acer Enduro Urban oferują panele o większym pokryciu palety sRGB, co przekłada się na żywsze kolory.
| |||||||||||||||||||||||||
rozświetlenie: 84 %
na akumulatorze: 1087.3 cd/m²
kontrast: 1066:1 (czerń: 1.02 cd/m²)
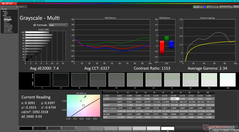
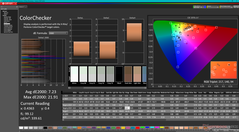
ΔE ColorChecker Calman: 7.23 | ∀{0.5-29.43 Ø4.78}
calibrated: 4.14
ΔE Greyscale Calman: 7.4 | ∀{0.09-98 Ø5}
41.2% AdobeRGB 1998 (Argyll 3D)
59% sRGB (Argyll 3D)
39.9% Display P3 (Argyll 3D)
Gamma: 2.34
CCT: 6327 K
| Durabook S15 HKC MY MB156CS01'2, IPS, 1920x1080, 15.6" | Durabook S15ABG2 Chi Mei N156HGE-EA2, TN LED, 1920x1080, 15.6" | Panasonic Toughbook 40 InfoVision M140NWF5 R3, IPS, 1920x1080, 14" | Getac S410 G5 CSOT T9 SNE001BS1-1, IPS, 1920x1080, 14" | Dell Latitude 5420 Rugged-P85G AU Optronics AUO523D, IPS, 1920x1080, 14" | Acer Enduro Urban N3 EUN314 XR140EA6T, IPS, 1920x1080, 14" | |
|---|---|---|---|---|---|---|
| Display | 29% | -10% | -3% | 57% | 58% | |
| Display P3 Coverage (%) | 39.9 | 51.4 29% | 35.8 -10% | 38.5 -4% | 62.5 57% | 63.5 59% |
| sRGB Coverage (%) | 59 | 77.1 31% | 53.8 -9% | 57.9 -2% | 92.4 57% | 91.9 56% |
| AdobeRGB 1998 Coverage (%) | 41.2 | 52.9 28% | 37 -10% | 39.8 -3% | 64.2 56% | 65.5 59% |
| Response Times | -22% | -108% | -29% | -168% | -147% | |
| Response Time Grey 50% / Grey 80% * (ms) | 22.4 ? | 24.4 ? -9% | 50.4 ? -125% | 29 ? -29% | 68 ? -204% | 56 ? -150% |
| Response Time Black / White * (ms) | 14.5 ? | 19.6 ? -35% | 27.6 ? -90% | 18.6 ? -28% | 33.6 ? -132% | 35.2 ? -143% |
| PWM Frequency (Hz) | 300 ? | 301.2 ? | 694.4 ? | 876 ? | 735 ? | 1000 ? |
| Screen | -31% | 28% | 16% | 24% | 6% | |
| Brightness middle (cd/m²) | 1087.3 | 284.8 -74% | 1284.3 18% | 958.4 -12% | 1111.7 2% | 487.8 -55% |
| Brightness (cd/m²) | 997 | 267 -73% | 1289 29% | 978 -2% | 1026 3% | 464 -53% |
| Brightness Distribution (%) | 84 | 86 2% | 82 -2% | 86 2% | 80 -5% | 89 6% |
| Black Level * (cd/m²) | 1.02 | 0.7 31% | 0.89 13% | 0.96 6% | 0.81 21% | 0.48 53% |
| Contrast (:1) | 1066 | 407 -62% | 1443 35% | 998 -6% | 1372 29% | 1016 -5% |
| Colorchecker dE 2000 * | 7.23 | 11.48 -59% | 4.67 35% | 4.95 32% | 3.83 47% | 6.51 10% |
| Colorchecker dE 2000 max. * | 21.91 | 19.71 10% | 19.85 9% | 16.88 23% | 7.85 64% | 11.36 48% |
| Colorchecker dE 2000 calibrated * | 4.14 | 3.06 26% | 2.21 47% | 1.96 53% | 2.98 28% | 1.77 57% |
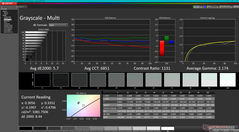
| Greyscale dE 2000 * | 7.4 | 13.2 -78% | 2.7 64% | 3.9 47% | 5.6 24% | 7.8 -5% |
| Gamma | 2.34 94% | 2.09 105% | 1.97 112% | 2.14 103% | 2.306 95% | 2.28 96% |
| CCT | 6327 103% | 14566 45% | 6222 104% | 7174 91% | 7676 85% | 8102 80% |
| Color Space (Percent of AdobeRGB 1998) (%) | 48.8 | 59 | ||||
| Color Space (Percent of sRGB) (%) | 76.8 | 93 | ||||
| Całkowita średnia (program / ustawienia) | -8% /
-17% | -30% /
0% | -5% /
6% | -29% /
3% | -28% /
-5% |
* ... im mniej tym lepiej
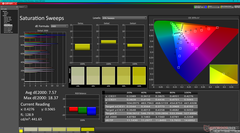
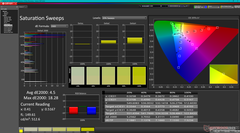
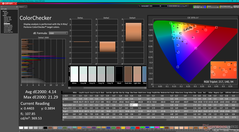
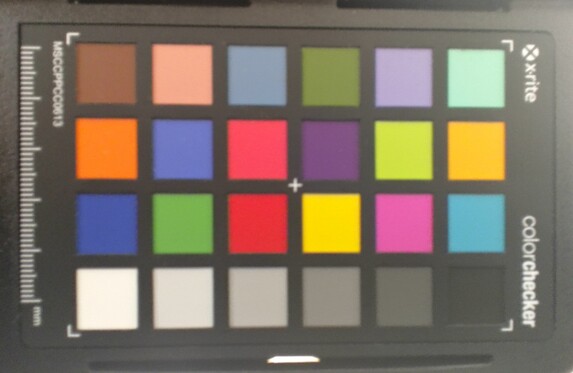
Wyświetlacz jest słabo skalibrowany po wyjęciu z pudełka ze stosunkowo wysokimi średnimi wartościami deltaE skali szarości i kolorów wynoszącymi odpowiednio 7,4 i 7,23. Samodzielna kalibracja wyświetlacza poprawiłaby nieco sytuację, ale kolory nadal stają się coraz bardziej niedokładne, im wyższy poziom nasycenia ze względu na wspomniane wcześniej ograniczone pokrycie sRGB. Dokładne kolory nie są jednak priorytetem w tego typu laptopach.
Wyświetl czasy reakcji
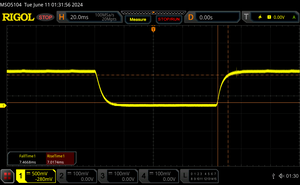
| ↔ Czas reakcji od czerni do bieli | ||
|---|---|---|
| 14.5 ms ... wzrost ↗ i spadek ↘ łącznie | ↗ 7 ms wzrost | |
| ↘ 7.5 ms upadek | ||
| W naszych testach ekran wykazuje dobry współczynnik reakcji, ale może być zbyt wolny dla graczy rywalizujących ze sobą. Dla porównania, wszystkie testowane urządzenia wahają się od 0.1 (minimum) do 240 (maksimum) ms. » 34 % wszystkich urządzeń jest lepszych. Oznacza to, że zmierzony czas reakcji jest lepszy od średniej wszystkich testowanych urządzeń (20.2 ms). | ||
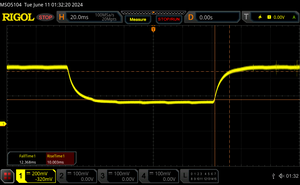
| ↔ Czas reakcji 50% szarości do 80% szarości | ||
| 22.4 ms ... wzrost ↗ i spadek ↘ łącznie | ↗ 10 ms wzrost | |
| ↘ 12.4 ms upadek | ||
| W naszych testach ekran wykazuje dobry współczynnik reakcji, ale może być zbyt wolny dla graczy rywalizujących ze sobą. Dla porównania, wszystkie testowane urządzenia wahają się od 0.165 (minimum) do 636 (maksimum) ms. » 33 % wszystkich urządzeń jest lepszych. Oznacza to, że zmierzony czas reakcji jest lepszy od średniej wszystkich testowanych urządzeń (31.6 ms). | ||
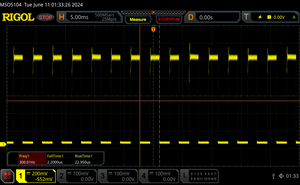
Migotanie ekranu / PWM (modulacja szerokości impulsu)
| Wykryto migotanie ekranu/wykryto PWM | 300 Hz | ≤ 99 % ustawienia jasności | |
Podświetlenie wyświetlacza miga z częstotliwością 300 Hz (najgorszy przypadek, np. przy użyciu PWM) Wykryto migotanie przy ustawieniu jasności 99 % i poniżej. Powyżej tego ustawienia jasności nie powinno być żadnego migotania ani PWM. Częstotliwość 300 Hz jest stosunkowo wysoka, więc większość użytkowników wrażliwych na PWM nie powinna zauważyć żadnego migotania. Istnieją jednak doniesienia, że niektórzy użytkownicy są nadal wrażliwi na PWM przy częstotliwości 500 Hz i wyższej, więc należy zachować ostrożność. Dla porównania: 53 % wszystkich testowanych urządzeń nie używa PWM do przyciemniania wyświetlacza. Jeśli wykryto PWM, zmierzono średnio 8111 (minimum: 5 - maksimum: 343500) Hz. | |||
Modulacja szerokości impulsu jest obecna na wszystkich poziomach jasności z wyjątkiem maksymalnego. Jej częstotliwość jest stała i wynosi 300 Hz od 0 do 99 procent jasności, co oznacza, że użytkownicy wrażliwi na migotanie ekranu mogą unikać korzystania z Durabooka przez dłuższy czas.
Widoczność na zewnątrz jest doskonała w cieniu i użyteczna w świetle słonecznym lub przy dużym zachmurzeniu. Będą występować pewne odblaski, ale podświetlenie o jasności 1000 nitów pomaga złagodzić jasne oświetlenie otoczenia, aby teksty były łatwiejsze do odczytania.
Wydajność - Intel 12. generacji z vPro
Warunki testowania
Przed uruchomieniem poniższych testów porównawczych ustawiliśmy system Windows w tryb wydajności.
Procesor
Wydajność procesora znacznie przewyższa Core i5-8265U w starszym modelu S15ABG2, jak można się było spodziewać, a także nieco szybciej niż procesory Core i7 Tiger Lake, które można znaleźć w Panasonic Toughbook FZ lub Acer Enduro Urban. Z drugiej jednak strony, jest on również zauważalnie wolniejszy niż przeciętny laptop w naszej bazie danych wyposażony w ten sam procesor Core i7-1255U CPU o około 20 do 25 procent. Sugeruje to, że S15 pracuje z procesorem konserwatywnie, aby poprawić spójność wydajności i niezawodność.
Aby uzyskać bardziej znaczący wzrost wydajności, zalecamy przyjrzenie się laptopowi Getac S410 G5 który jest wyposażony w opcje procesora Raptor Lake-P 13. generacji, zapewniające nawet o 60 do 70 procent wyższą wydajność wielowątkową niż nasz Core i7-1255U.
Cinebench R15 Multi Loop
Cinebench R23: Multi Core | Single Core
Cinebench R20: CPU (Multi Core) | CPU (Single Core)
Cinebench R15: CPU Multi 64Bit | CPU Single 64Bit
Blender: v2.79 BMW27 CPU
7-Zip 18.03: 7z b 4 | 7z b 4 -mmt1
Geekbench 6.5: Multi-Core | Single-Core
Geekbench 5.5: Multi-Core | Single-Core
HWBOT x265 Benchmark v2.2: 4k Preset
LibreOffice : 20 Documents To PDF
R Benchmark 2.5: Overall mean
| CPU Performance rating | |
| Getac S410 G5 | |
| Przeciętny Intel Core i7-1255U | |
| Durabook S15 | |
| Dell Latitude 7330 Rugged Extreme -2! | |
| Acer Enduro Urban N3 EUN314 -2! | |
| Panasonic Toughbook FZ-55 MK2 -4! | |
| Getac S410 Gen 4 -2! | |
| Panasonic Toughbook 40 -2! | |
| Durabook S14I -2! | |
| Getac B360 -3! | |
| Getac S410 -14! | |
| Dell Latitude 5420 Rugged-P85G -14! | |
| Durabook S15ABG2 -4! | |
| Cinebench R23 / Multi Core | |
| Getac S410 G5 | |
| Przeciętny Intel Core i7-1255U (5269 - 9628, n=11) | |
| Durabook S15 | |
| Dell Latitude 7330 Rugged Extreme | |
| Panasonic Toughbook FZ-55 MK2 | |
| Acer Enduro Urban N3 EUN314 | |
| Getac S410 Gen 4 | |
| Panasonic Toughbook 40 | |
| Getac B360 | |
| Durabook S14I | |
| Cinebench R23 / Single Core | |
| Getac S410 G5 | |
| Przeciętny Intel Core i7-1255U (1408 - 1775, n=11) | |
| Dell Latitude 7330 Rugged Extreme | |
| Panasonic Toughbook FZ-55 MK2 | |
| Acer Enduro Urban N3 EUN314 | |
| Getac S410 Gen 4 | |
| Durabook S15 | |
| Panasonic Toughbook 40 | |
| Durabook S14I | |
| Getac B360 | |
| Cinebench R20 / CPU (Multi Core) | |
| Getac S410 G5 | |
| Przeciętny Intel Core i7-1255U (2095 - 3702, n=11) | |
| Durabook S15 | |
| Dell Latitude 7330 Rugged Extreme | |
| Panasonic Toughbook FZ-55 MK2 | |
| Acer Enduro Urban N3 EUN314 | |
| Getac S410 Gen 4 | |
| Panasonic Toughbook 40 | |
| Getac B360 | |
| Durabook S14I | |
| Durabook S15ABG2 | |
| Cinebench R20 / CPU (Single Core) | |
| Getac S410 G5 | |
| Przeciętny Intel Core i7-1255U (550 - 682, n=11) | |
| Durabook S15 | |
| Dell Latitude 7330 Rugged Extreme | |
| Acer Enduro Urban N3 EUN314 | |
| Panasonic Toughbook FZ-55 MK2 | |
| Getac S410 Gen 4 | |
| Durabook S14I | |
| Panasonic Toughbook 40 | |
| Getac B360 | |
| Durabook S15ABG2 | |
| Cinebench R15 / CPU Multi 64Bit | |
| Getac S410 G5 | |
| Przeciętny Intel Core i7-1255U (919 - 1577, n=11) | |
| Durabook S15 | |
| Acer Enduro Urban N3 EUN314 | |
| Dell Latitude 7330 Rugged Extreme | |
| Panasonic Toughbook FZ-55 MK2 | |
| Getac S410 Gen 4 | |
| Panasonic Toughbook 40 | |
| Getac B360 | |
| Durabook S14I | |
| Getac S410 | |
| Durabook S15ABG2 | |
| Dell Latitude 5420 Rugged-P85G | |
| Cinebench R15 / CPU Single 64Bit | |
| Getac S410 G5 | |
| Przeciętny Intel Core i7-1255U (161 - 251, n=12) | |
| Durabook S15 | |
| Dell Latitude 7330 Rugged Extreme | |
| Panasonic Toughbook FZ-55 MK2 | |
| Acer Enduro Urban N3 EUN314 | |
| Getac S410 Gen 4 | |
| Durabook S14I | |
| Panasonic Toughbook 40 | |
| Getac B360 | |
| Getac S410 | |
| Durabook S15ABG2 | |
| Dell Latitude 5420 Rugged-P85G | |
| Blender / v2.79 BMW27 CPU | |
| Durabook S15ABG2 | |
| Durabook S14I | |
| Getac B360 | |
| Panasonic Toughbook 40 | |
| Getac S410 Gen 4 | |
| Panasonic Toughbook FZ-55 MK2 | |
| Acer Enduro Urban N3 EUN314 | |
| Dell Latitude 7330 Rugged Extreme | |
| Durabook S15 | |
| Przeciętny Intel Core i7-1255U (372 - 601, n=11) | |
| Getac S410 G5 | |
| 7-Zip 18.03 / 7z b 4 | |
| Getac S410 G5 | |
| Przeciętny Intel Core i7-1255U (24126 - 37365, n=11) | |
| Durabook S15 | |
| Acer Enduro Urban N3 EUN314 | |
| Dell Latitude 7330 Rugged Extreme | |
| Panasonic Toughbook FZ-55 MK2 | |
| Getac S410 Gen 4 | |
| Getac B360 | |
| Panasonic Toughbook 40 | |
| Durabook S14I | |
| Durabook S15ABG2 | |
| 7-Zip 18.03 / 7z b 4 -mmt1 | |
| Dell Latitude 7330 Rugged Extreme | |
| Acer Enduro Urban N3 EUN314 | |
| Przeciętny Intel Core i7-1255U (5059 - 5529, n=11) | |
| Panasonic Toughbook FZ-55 MK2 | |
| Durabook S14I | |
| Getac S410 G5 | |
| Durabook S15 | |
| Panasonic Toughbook 40 | |
| Getac S410 Gen 4 | |
| Getac B360 | |
| Durabook S15ABG2 | |
| Geekbench 6.5 / Multi-Core | |
| Getac S410 G5 | |
| Przeciętny Intel Core i7-1255U (7914 - 8632, n=2) | |
| Durabook S15 | |
| Geekbench 6.5 / Single-Core | |
| Getac S410 G5 | |
| Przeciętny Intel Core i7-1255U (2313 - 2325, n=2) | |
| Durabook S15 | |
| Geekbench 5.5 / Multi-Core | |
| Getac S410 G5 | |
| Przeciętny Intel Core i7-1255U (4463 - 8821, n=12) | |
| Durabook S15 | |
| Dell Latitude 7330 Rugged Extreme | |
| Acer Enduro Urban N3 EUN314 | |
| Getac S410 Gen 4 | |
| Panasonic Toughbook 40 | |
| Getac B360 | |
| Durabook S14I | |
| Durabook S15ABG2 | |
| Geekbench 5.5 / Single-Core | |
| Getac S410 G5 | |
| Durabook S15 | |
| Przeciętny Intel Core i7-1255U (1560 - 1712, n=12) | |
| Dell Latitude 7330 Rugged Extreme | |
| Acer Enduro Urban N3 EUN314 | |
| Durabook S14I | |
| Getac S410 Gen 4 | |
| Panasonic Toughbook 40 | |
| Getac B360 | |
| Durabook S15ABG2 | |
| HWBOT x265 Benchmark v2.2 / 4k Preset | |
| Getac S410 G5 | |
| Przeciętny Intel Core i7-1255U (6.31 - 10.1, n=11) | |
| Dell Latitude 7330 Rugged Extreme | |
| Durabook S15 | |
| Panasonic Toughbook FZ-55 MK2 | |
| Acer Enduro Urban N3 EUN314 | |
| Getac S410 Gen 4 | |
| Panasonic Toughbook 40 | |
| Getac B360 | |
| Durabook S14I | |
| Durabook S15ABG2 | |
| LibreOffice / 20 Documents To PDF | |
| Durabook S15ABG2 | |
| Acer Enduro Urban N3 EUN314 | |
| Panasonic Toughbook 40 | |
| Durabook S15 | |
| Getac S410 Gen 4 | |
| Dell Latitude 7330 Rugged Extreme | |
| Panasonic Toughbook FZ-55 MK2 | |
| Przeciętny Intel Core i7-1255U (35.6 - 52.5, n=11) | |
| Durabook S14I | |
| Getac S410 G5 | |
| R Benchmark 2.5 / Overall mean | |
| Durabook S15ABG2 | |
| Getac B360 | |
| Panasonic Toughbook 40 | |
| Getac S410 Gen 4 | |
| Durabook S14I | |
| Acer Enduro Urban N3 EUN314 | |
| Panasonic Toughbook FZ-55 MK2 | |
| Dell Latitude 7330 Rugged Extreme | |
| Przeciętny Intel Core i7-1255U (0.4688 - 0.558, n=11) | |
| Getac S410 G5 | |
| Durabook S15 | |
Cinebench R23: Multi Core | Single Core
Cinebench R20: CPU (Multi Core) | CPU (Single Core)
Cinebench R15: CPU Multi 64Bit | CPU Single 64Bit
Blender: v2.79 BMW27 CPU
7-Zip 18.03: 7z b 4 | 7z b 4 -mmt1
Geekbench 6.5: Multi-Core | Single-Core
Geekbench 5.5: Multi-Core | Single-Core
HWBOT x265 Benchmark v2.2: 4k Preset
LibreOffice : 20 Documents To PDF
R Benchmark 2.5: Overall mean
* ... im mniej tym lepiej
AIDA64: FP32 Ray-Trace | FPU Julia | CPU SHA3 | CPU Queen | FPU SinJulia | FPU Mandel | CPU AES | CPU ZLib | FP64 Ray-Trace | CPU PhotoWorxx
| Performance rating | |
| Getac S410 G5 | |
| Przeciętny Intel Core i7-1255U | |
| Acer Enduro Urban N3 EUN314 | |
| Durabook S15 | |
| Panasonic Toughbook 40 | |
| Durabook S15ABG2 | |
| AIDA64 / FP32 Ray-Trace | |
| Getac S410 G5 | |
| Acer Enduro Urban N3 EUN314 | |
| Przeciętny Intel Core i7-1255U (4313 - 8127, n=11) | |
| Panasonic Toughbook 40 | |
| Durabook S15 | |
| Durabook S15ABG2 | |
| AIDA64 / FPU Julia | |
| Getac S410 G5 | |
| Przeciętny Intel Core i7-1255U (19813 - 41353, n=11) | |
| Acer Enduro Urban N3 EUN314 | |
| Durabook S15 | |
| Panasonic Toughbook 40 | |
| Durabook S15ABG2 | |
| AIDA64 / CPU SHA3 | |
| Getac S410 G5 | |
| Acer Enduro Urban N3 EUN314 | |
| Przeciętny Intel Core i7-1255U (1325 - 2135, n=11) | |
| Panasonic Toughbook 40 | |
| Durabook S15 | |
| Durabook S15ABG2 | |
| AIDA64 / CPU Queen | |
| Getac S410 G5 | |
| Przeciętny Intel Core i7-1255U (61375 - 65892, n=11) | |
| Durabook S15 | |
| Acer Enduro Urban N3 EUN314 | |
| Panasonic Toughbook 40 | |
| Durabook S15ABG2 | |
| AIDA64 / FPU SinJulia | |
| Getac S410 G5 | |
| Acer Enduro Urban N3 EUN314 | |
| Przeciętny Intel Core i7-1255U (3577 - 5095, n=11) | |
| Panasonic Toughbook 40 | |
| Durabook S15ABG2 | |
| Durabook S15 | |
| AIDA64 / FPU Mandel | |
| Getac S410 G5 | |
| Acer Enduro Urban N3 EUN314 | |
| Przeciętny Intel Core i7-1255U (11759 - 20187, n=11) | |
| Panasonic Toughbook 40 | |
| Durabook S15 | |
| Durabook S15ABG2 | |
| AIDA64 / CPU AES | |
| Acer Enduro Urban N3 EUN314 | |
| Getac S410 G5 | |
| Przeciętny Intel Core i7-1255U (27900 - 67458, n=11) | |
| Panasonic Toughbook 40 | |
| Durabook S15 | |
| Durabook S15ABG2 | |
| AIDA64 / CPU ZLib | |
| Getac S410 G5 | |
| Przeciętny Intel Core i7-1255U (393 - 640, n=11) | |
| Durabook S15 | |
| Acer Enduro Urban N3 EUN314 | |
| Panasonic Toughbook 40 | |
| Durabook S15ABG2 | |
| AIDA64 / FP64 Ray-Trace | |
| Getac S410 G5 | |
| Acer Enduro Urban N3 EUN314 | |
| Przeciętny Intel Core i7-1255U (2474 - 4400, n=11) | |
| Panasonic Toughbook 40 | |
| Durabook S15 | |
| Durabook S15ABG2 | |
| AIDA64 / CPU PhotoWorxx | |
| Getac S410 G5 | |
| Durabook S15 | |
| Przeciętny Intel Core i7-1255U (13899 - 44054, n=11) | |
| Acer Enduro Urban N3 EUN314 | |
| Panasonic Toughbook 40 | |
| Durabook S15ABG2 | |
Test warunków skrajnych
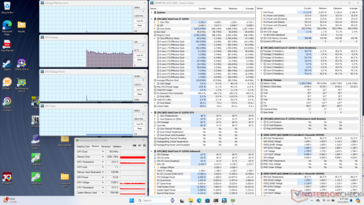
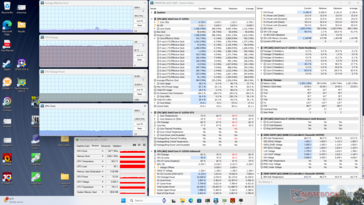
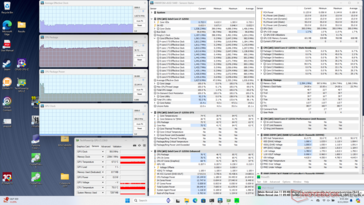
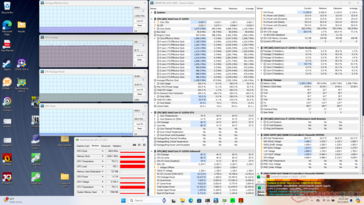
Procesor zwiększyłby częstotliwość taktowania do 2,4 GHz i 34 W podczas inicjowania stresu Prime95. Jednak po osiągnięciu temperatury rdzenia 85 C kilka sekund później, procesor spadłby do 1,3 GHz i 15 W, aby utrzymać nieco niższą temperaturę 80 C. Ten zakres temperatur jest podobny do tego, który odnotowaliśmy na 2020 S15ABG2.
| Średnie taktowanie CPU (GHz) | Taktowanie GPU (MHz) | Średnia temperatura CPU (°C) | |
| System bezczynności | -- | -- | 60 |
| Prime95Stress | 1.6 | -- | 76 |
| Prime95+ FurMark Stress | 1.1 | 499 | 80 |
| Witcher 3 Obciążenie | 0.5 | 948 | 80 |
Wydajność systemu
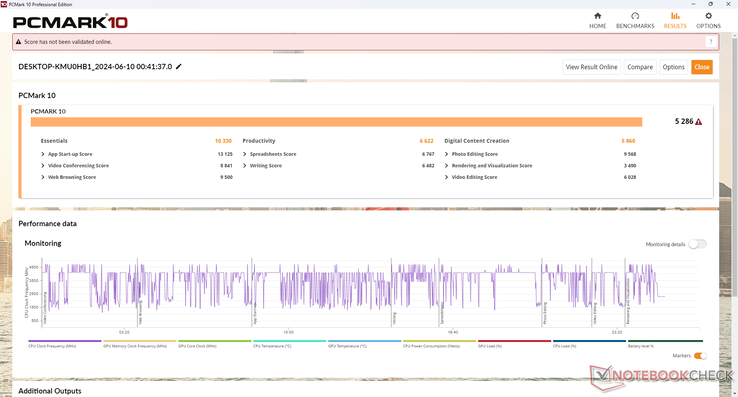
Wyniki PCMark wyprzedzają większość innych wytrzymałych laptopów działających na starszych platformach Intel 11. lub 10. generacji. Być może najbardziej znaczące jest to, że znacznie wyprzedza starszy model 2020 S15ABG2 w podteście Digital Content Creation, gdzie wydajność GPU ma największe znaczenie.
CrossMark: Overall | Productivity | Creativity | Responsiveness
WebXPRT 3: Overall
WebXPRT 4: Overall
Mozilla Kraken 1.1: Total
| PCMark 10 / Score | |
| Getac S410 G5 | |
| Przeciętny Intel Core i7-1255U, Intel Iris Xe Graphics G7 96EUs (4676 - 5523, n=9) | |
| Durabook S15 | |
| Panasonic Toughbook 40 | |
| Durabook S14I | |
| Acer Enduro Urban N3 EUN314 | |
| Dell Latitude 5420 Rugged-P85G | |
| Durabook S15ABG2 | |
| PCMark 10 / Essentials | |
| Przeciętny Intel Core i7-1255U, Intel Iris Xe Graphics G7 96EUs (9381 - 11654, n=9) | |
| Durabook S15 | |
| Durabook S14I | |
| Getac S410 G5 | |
| Panasonic Toughbook 40 | |
| Acer Enduro Urban N3 EUN314 | |
| Dell Latitude 5420 Rugged-P85G | |
| Durabook S15ABG2 | |
| PCMark 10 / Productivity | |
| Dell Latitude 5420 Rugged-P85G | |
| Getac S410 G5 | |
| Durabook S14I | |
| Przeciętny Intel Core i7-1255U, Intel Iris Xe Graphics G7 96EUs (6530 - 7418, n=9) | |
| Durabook S15 | |
| Panasonic Toughbook 40 | |
| Durabook S15ABG2 | |
| Acer Enduro Urban N3 EUN314 | |
| PCMark 10 / Digital Content Creation | |
| Getac S410 G5 | |
| Durabook S15 | |
| Przeciętny Intel Core i7-1255U, Intel Iris Xe Graphics G7 96EUs (4498 - 6203, n=9) | |
| Panasonic Toughbook 40 | |
| Acer Enduro Urban N3 EUN314 | |
| Durabook S14I | |
| Dell Latitude 5420 Rugged-P85G | |
| Durabook S15ABG2 | |
| CrossMark / Overall | |
| Przeciętny Intel Core i7-1255U, Intel Iris Xe Graphics G7 96EUs (1329 - 1573, n=9) | |
| Getac S410 G5 | |
| Durabook S15 | |
| Panasonic Toughbook 40 | |
| CrossMark / Productivity | |
| Przeciętny Intel Core i7-1255U, Intel Iris Xe Graphics G7 96EUs (1364 - 1554, n=9) | |
| Getac S410 G5 | |
| Durabook S15 | |
| Panasonic Toughbook 40 | |
| CrossMark / Creativity | |
| Getac S410 G5 | |
| Przeciętny Intel Core i7-1255U, Intel Iris Xe Graphics G7 96EUs (1372 - 1660, n=9) | |
| Durabook S15 | |
| Panasonic Toughbook 40 | |
| CrossMark / Responsiveness | |
| Durabook S15 | |
| Przeciętny Intel Core i7-1255U, Intel Iris Xe Graphics G7 96EUs (1117 - 1434, n=9) | |
| Getac S410 G5 | |
| Panasonic Toughbook 40 | |
| WebXPRT 3 / Overall | |
| Przeciętny Intel Core i7-1255U, Intel Iris Xe Graphics G7 96EUs (200 - 366, n=9) | |
| Getac S410 G5 | |
| Durabook S14I | |
| Panasonic Toughbook 40 | |
| Acer Enduro Urban N3 EUN314 | |
| Durabook S15ABG2 | |
| WebXPRT 4 / Overall | |
| Getac S410 G5 | |
| Durabook S15 | |
| Przeciętny Intel Core i7-1255U, Intel Iris Xe Graphics G7 96EUs (183.4 - 249, n=9) | |
| Mozilla Kraken 1.1 / Total | |
| Dell Latitude 5420 Rugged-P85G | |
| Durabook S15ABG2 | |
| Acer Enduro Urban N3 EUN314 | |
| Panasonic Toughbook 40 | |
| Durabook S14I | |
| Przeciętny Intel Core i7-1255U, Intel Iris Xe Graphics G7 96EUs (476 - 727, n=10) | |
| Durabook S15 | |
| Getac S410 G5 | |
* ... im mniej tym lepiej
| PCMark 10 Score | 5286 pkt. | |
Pomoc | ||
| AIDA64 / Memory Copy | |
| Durabook S15 | |
| Getac S410 G5 | |
| Przeciętny Intel Core i7-1255U (22846 - 67017, n=11) | |
| Acer Enduro Urban N3 EUN314 | |
| Panasonic Toughbook 40 | |
| Durabook S15ABG2 | |
| AIDA64 / Memory Read | |
| Durabook S15 | |
| Getac S410 G5 | |
| Przeciętny Intel Core i7-1255U (22877 - 67398, n=11) | |
| Acer Enduro Urban N3 EUN314 | |
| Panasonic Toughbook 40 | |
| Durabook S15ABG2 | |
| AIDA64 / Memory Write | |
| Durabook S15 | |
| Getac S410 G5 | |
| Przeciętny Intel Core i7-1255U (22883 - 65839, n=11) | |
| Acer Enduro Urban N3 EUN314 | |
| Panasonic Toughbook 40 | |
| Durabook S15ABG2 | |
| AIDA64 / Memory Latency | |
| Getac S410 G5 | |
| Panasonic Toughbook 40 | |
| Durabook S15 | |
| Przeciętny Intel Core i7-1255U (76 - 163.2, n=11) | |
| Acer Enduro Urban N3 EUN314 | |
| Durabook S15ABG2 | |
* ... im mniej tym lepiej
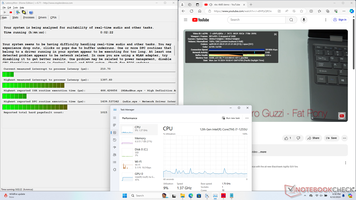
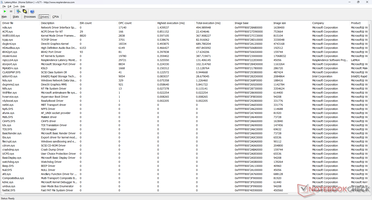
Opóźnienie DPC
| DPC Latencies / LatencyMon - interrupt to process latency (max), Web, Youtube, Prime95 | |
| Acer Enduro Urban N3 EUN314 | |
| Getac S410 G5 | |
| Durabook S15 | |
| Panasonic Toughbook 40 | |
| Durabook S15ABG2 | |
* ... im mniej tym lepiej
Urządzenia pamięci masowej
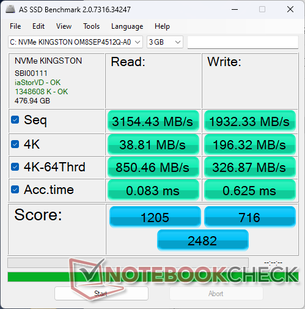
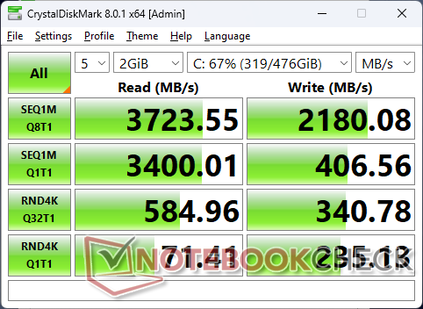
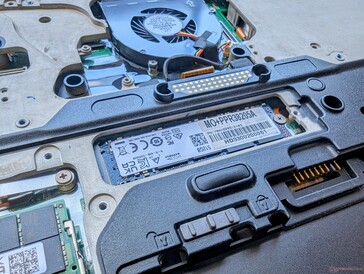
Nasze urządzenie jest dostarczane z Kingston OM8SEP4512Q-AA PCIe4 NVMe SSD do sekwencyjnego odczytu i zapisu z prędkościami odpowiednio około 3300 MB/s i 2200 MB/s. Dysk nie wykazuje żadnych problemów z utrzymaniem tych maksymalnych prędkości pod obciążeniem.
| Drive Performance rating - Percent | |
| Acer Enduro Urban N3 EUN314 | |
| Getac S410 G5 | |
| Panasonic Toughbook 40 | |
| Durabook S15 | |
| Dell Latitude 5420 Rugged-P85G -8! | |
| Durabook S15ABG2 | |
| DiskSpd | |
| seq read | |
| Durabook S15 | |
| Getac S410 G5 | |
| Panasonic Toughbook 40 | |
| Acer Enduro Urban N3 EUN314 | |
| Durabook S15ABG2 | |
| seq write | |
| Panasonic Toughbook 40 | |
| Acer Enduro Urban N3 EUN314 | |
| Getac S410 G5 | |
| Durabook S15 | |
| Durabook S15ABG2 | |
| seq q8 t1 read | |
| Getac S410 G5 | |
| Durabook S15 | |
| Panasonic Toughbook 40 | |
| Acer Enduro Urban N3 EUN314 | |
| Durabook S15ABG2 | |
| seq q8 t1 write | |
| Durabook S15 | |
| Getac S410 G5 | |
| Panasonic Toughbook 40 | |
| Acer Enduro Urban N3 EUN314 | |
| Durabook S15ABG2 | |
| 4k q1 t1 read | |
| Panasonic Toughbook 40 | |
| Acer Enduro Urban N3 EUN314 | |
| Getac S410 G5 | |
| Durabook S15 | |
| Durabook S15ABG2 | |
| 4k q1 t1 write | |
| Durabook S15 | |
| Acer Enduro Urban N3 EUN314 | |
| Getac S410 G5 | |
| Panasonic Toughbook 40 | |
| Durabook S15ABG2 | |
| 4k q32 t16 read | |
| Acer Enduro Urban N3 EUN314 | |
| Durabook S15 | |
| Panasonic Toughbook 40 | |
| Getac S410 G5 | |
| Durabook S15ABG2 | |
| 4k q32 t16 write | |
| Acer Enduro Urban N3 EUN314 | |
| Durabook S15 | |
| Getac S410 G5 | |
| Panasonic Toughbook 40 | |
| Durabook S15ABG2 | |
| AS SSD | |
| Score Total | |
| Acer Enduro Urban N3 EUN314 | |
| Getac S410 G5 | |
| Panasonic Toughbook 40 | |
| Durabook S15 | |
| Dell Latitude 5420 Rugged-P85G | |
| Durabook S15ABG2 | |
| Score Read | |
| Acer Enduro Urban N3 EUN314 | |
| Durabook S15 | |
| Getac S410 G5 | |
| Panasonic Toughbook 40 | |
| Dell Latitude 5420 Rugged-P85G | |
| Durabook S15ABG2 | |
| Score Write | |
| Getac S410 G5 | |
| Acer Enduro Urban N3 EUN314 | |
| Panasonic Toughbook 40 | |
| Dell Latitude 5420 Rugged-P85G | |
| Durabook S15 | |
| Durabook S15ABG2 | |
| Seq Read | |
| Durabook S15 | |
| Getac S410 G5 | |
| Panasonic Toughbook 40 | |
| Acer Enduro Urban N3 EUN314 | |
| Dell Latitude 5420 Rugged-P85G | |
| Durabook S15ABG2 | |
| Seq Write | |
| Durabook S15 | |
| Getac S410 G5 | |
| Acer Enduro Urban N3 EUN314 | |
| Panasonic Toughbook 40 | |
| Dell Latitude 5420 Rugged-P85G | |
| Durabook S15ABG2 | |
| 4K Read | |
| Panasonic Toughbook 40 | |
| Getac S410 G5 | |
| Acer Enduro Urban N3 EUN314 | |
| Dell Latitude 5420 Rugged-P85G | |
| Durabook S15 | |
| Durabook S15ABG2 | |
| 4K Write | |
| Durabook S15 | |
| Acer Enduro Urban N3 EUN314 | |
| Panasonic Toughbook 40 | |
| Getac S410 G5 | |
| Dell Latitude 5420 Rugged-P85G | |
| Durabook S15ABG2 | |
| 4K-64 Read | |
| Acer Enduro Urban N3 EUN314 | |
| Durabook S15 | |
| Panasonic Toughbook 40 | |
| Getac S410 G5 | |
| Dell Latitude 5420 Rugged-P85G | |
| Durabook S15ABG2 | |
| 4K-64 Write | |
| Getac S410 G5 | |
| Dell Latitude 5420 Rugged-P85G | |
| Panasonic Toughbook 40 | |
| Acer Enduro Urban N3 EUN314 | |
| Durabook S15 | |
| Durabook S15ABG2 | |
| Access Time Read | |
| Durabook S15ABG2 | |
| Durabook S15 | |
| Acer Enduro Urban N3 EUN314 | |
| Panasonic Toughbook 40 | |
| Getac S410 G5 | |
| Dell Latitude 5420 Rugged-P85G | |
| Access Time Write | |
| Durabook S15 | |
| Getac S410 G5 | |
| Durabook S15ABG2 | |
| Panasonic Toughbook 40 | |
| Acer Enduro Urban N3 EUN314 | |
| Dell Latitude 5420 Rugged-P85G | |
* ... im mniej tym lepiej
Disk Throttling: DiskSpd Read Loop, Queue Depth 8
Wydajność GPU - Iris Xe zaczyna pokazywać swój wiek
Model ten wykorzystuje ten sam zintegrowany Iris Xe GPU jak w starszym S14I, co tylko nieznacznie zwiększa ogólną wydajność graficzną. Większość wytrzymałych laptopów musi jeszcze przejść na Meteor Lake, aby uzyskać znacznie ulepszoną zintegrowaną serię Arc, ale 2024 S15 mimo to znacznie wyprzedza starożytne już UHD Graphics 620 o 2x do 4x.
Karta graficzna Nvidia Quadro T1000 jest opcjonalna dla tych, którzy wymagają oddzielnej grafiki.
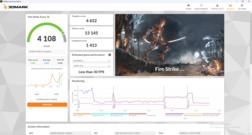
| Profil zasilania | Wynik grafiki | Wynik fizyki | Wynik łączny |
| Tryb wydajności | 4652 | 13145 | 1413 |
| Tryb zrównoważony | 4119 (-15%) | 11865 (-10%) | 1312 (-7%) |
| Zasilanie bateryjne | 3958 (-15%) | 12722 (-3%) | 1314 (-7%) |
Praca w trybie zrównoważonym lub na zasilaniu bateryjnym może wpłynąć na wydajność nawet o 10 do 15 procent, jak pokazuje nasza tabela wyników Fire Strike powyżej.
| 3DMark Performance rating - Percent | |
| Lenovo ThinkPad P1 2019-20QT000RGE | |
| Dell Latitude 7330 Rugged Extreme | |
| Getac S410 G5 | |
| Acer Enduro Urban N3 EUN314 | |
| Przeciętny Intel Iris Xe Graphics G7 96EUs | |
| Panasonic Toughbook FZ-55 MK2 | |
| Getac S410 Gen 4 | |
| Panasonic Toughbook 40 | |
| Durabook S15 | |
| Durabook S14I | |
| Dell Latitude 5420 Rugged-P85G | |
| Getac B360 | |
| Getac S410 -4! | |
| Durabook S15ABG2 | |
| 3DMark 11 - 1280x720 Performance GPU | |
| Lenovo ThinkPad P1 2019-20QT000RGE | |
| Acer Enduro Urban N3 EUN314 | |
| Dell Latitude 7330 Rugged Extreme | |
| Panasonic Toughbook FZ-55 MK2 | |
| Getac S410 Gen 4 | |
| Getac S410 G5 | |
| Panasonic Toughbook 40 | |
| Przeciętny Intel Iris Xe Graphics G7 96EUs (2867 - 7676, n=209) | |
| Durabook S15 | |
| Durabook S14I | |
| Dell Latitude 5420 Rugged-P85G | |
| Getac B360 | |
| Getac S410 | |
| Durabook S15ABG2 | |
| 3DMark | |
| 1280x720 Cloud Gate Standard Graphics | |
| Lenovo ThinkPad P1 2019-20QT000RGE | |
| Getac S410 G5 | |
| Dell Latitude 7330 Rugged Extreme | |
| Panasonic Toughbook FZ-55 MK2 | |
| Przeciętny Intel Iris Xe Graphics G7 96EUs (13162 - 39880, n=187) | |
| Acer Enduro Urban N3 EUN314 | |
| Getac S410 Gen 4 | |
| Panasonic Toughbook 40 | |
| Dell Latitude 5420 Rugged-P85G | |
| Durabook S15 | |
| Durabook S14I | |
| Getac B360 | |
| Durabook S15ABG2 | |
| 1920x1080 Fire Strike Graphics | |
| Lenovo ThinkPad P1 2019-20QT000RGE | |
| Dell Latitude 7330 Rugged Extreme | |
| Getac S410 G5 | |
| Przeciętny Intel Iris Xe Graphics G7 96EUs (2286 - 6624, n=222) | |
| Acer Enduro Urban N3 EUN314 | |
| Getac S410 Gen 4 | |
| Panasonic Toughbook FZ-55 MK2 | |
| Durabook S15 | |
| Panasonic Toughbook 40 | |
| Dell Latitude 5420 Rugged-P85G | |
| Durabook S14I | |
| Getac B360 | |
| Durabook S15ABG2 | |
| 2560x1440 Time Spy Graphics | |
| Lenovo ThinkPad P1 2019-20QT000RGE | |
| Dell Latitude 7330 Rugged Extreme | |
| Acer Enduro Urban N3 EUN314 | |
| Przeciętny Intel Iris Xe Graphics G7 96EUs (707 - 1890, n=218) | |
| Panasonic Toughbook 40 | |
| Getac S410 Gen 4 | |
| Getac S410 G5 | |
| Panasonic Toughbook FZ-55 MK2 | |
| Durabook S15 | |
| Durabook S14I | |
| Dell Latitude 5420 Rugged-P85G | |
| Getac B360 | |
| Durabook S15ABG2 | |
| 2560x1440 Time Spy Score | |
| Lenovo ThinkPad P1 2019-20QT000RGE | |
| Dell Latitude 7330 Rugged Extreme | |
| Acer Enduro Urban N3 EUN314 | |
| Przeciętny Intel Iris Xe Graphics G7 96EUs (789 - 2159, n=215) | |
| Getac S410 G5 | |
| Panasonic Toughbook 40 | |
| Getac S410 Gen 4 | |
| Panasonic Toughbook FZ-55 MK2 | |
| Durabook S15 | |
| Durabook S14I | |
| Dell Latitude 5420 Rugged-P85G | |
| Getac B360 | |
| Durabook S15ABG2 | |
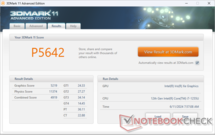
| 3DMark 11 Performance | 5642 pkt. | |
| 3DMark Cloud Gate Standard Score | 14383 pkt. | |
| 3DMark Fire Strike Score | 4108 pkt. | |
| 3DMark Time Spy Score | 1275 pkt. | |
Pomoc | ||
| Blender - v3.3 Classroom CPU | |
| Durabook S15 | |
| Przeciętny Intel Iris Xe Graphics G7 96EUs (336 - 1259, n=109) | |
| Getac S410 G5 | |
* ... im mniej tym lepiej
| Performance rating - Percent | |
| Getac S410 G5 | |
| Acer Enduro Urban N3 EUN314 | |
| Panasonic Toughbook 40 -2! | |
| Durabook S15 -1! | |
| Durabook S15ABG2 -4! | |
| Dell Latitude 5420 Rugged-P85G -4! | |
| The Witcher 3 - 1920x1080 Ultra Graphics & Postprocessing (HBAO+) | |
| Getac S410 G5 | |
| Panasonic Toughbook 40 | |
| Acer Enduro Urban N3 EUN314 | |
| Durabook S15 | |
| Dell Latitude 5420 Rugged-P85G | |
| GTA V - 1920x1080 Highest AA:4xMSAA + FX AF:16x | |
| Getac S410 G5 | |
| Acer Enduro Urban N3 EUN314 | |
| Final Fantasy XV Benchmark - 1920x1080 High Quality | |
| Acer Enduro Urban N3 EUN314 | |
| Getac S410 G5 | |
| Panasonic Toughbook 40 | |
| Durabook S15 | |
| Dell Latitude 5420 Rugged-P85G | |
| Strange Brigade - 1920x1080 ultra AA:ultra AF:16 | |
| Getac S410 G5 | |
| Acer Enduro Urban N3 EUN314 | |
| Durabook S15 | |
| Dota 2 Reborn - 1920x1080 ultra (3/3) best looking | |
| Panasonic Toughbook 40 | |
| Getac S410 G5 | |
| Durabook S15 | |
| Acer Enduro Urban N3 EUN314 | |
| Durabook S15ABG2 | |
| X-Plane 11.11 - 1920x1080 high (fps_test=3) | |
| Acer Enduro Urban N3 EUN314 | |
| Getac S410 G5 | |
| Durabook S15 | |
| Panasonic Toughbook 40 | |
| Durabook S15ABG2 | |
| Far Cry 5 | |
| 1280x720 Low Preset AA:T | |
| Acer Enduro Urban N3 EUN314 | |
| Przeciętny Intel Iris Xe Graphics G7 96EUs (23 - 75, n=93) | |
| Dell Latitude 5420 Rugged-P85G | |
| Durabook S15 | |
| 1920x1080 Medium Preset AA:T | |
| Przeciętny Intel Iris Xe Graphics G7 96EUs (14 - 39, n=91) | |
| Dell Latitude 5420 Rugged-P85G | |
| Acer Enduro Urban N3 EUN314 | |
| Durabook S15 | |
| 1920x1080 High Preset AA:T | |
| Przeciętny Intel Iris Xe Graphics G7 96EUs (10 - 35, n=89) | |
| Dell Latitude 5420 Rugged-P85G | |
| Acer Enduro Urban N3 EUN314 | |
| Durabook S15 | |
| 1920x1080 Ultra Preset AA:T | |
| Przeciętny Intel Iris Xe Graphics G7 96EUs (11 - 33, n=75) | |
| Acer Enduro Urban N3 EUN314 | |
| Durabook S15 | |
| Dell Latitude 5420 Rugged-P85G | |
| The Witcher 3 | |
| 1024x768 Low Graphics & Postprocessing | |
| Dell Latitude 7330 Rugged Extreme | |
| Panasonic Toughbook FZ-55 MK2 | |
| Acer Enduro Urban N3 EUN314 | |
| Panasonic Toughbook 40 | |
| Przeciętny Intel Iris Xe Graphics G7 96EUs (28.9 - 117.2, n=188) | |
| Getac S410 G5 | |
| Getac S410 Gen 4 | |
| Durabook S15 | |
| Dell Latitude 5420 Rugged-P85G | |
| Getac B360 | |
| 1366x768 Medium Graphics & Postprocessing | |
| Dell Latitude 7330 Rugged Extreme | |
| Acer Enduro Urban N3 EUN314 | |
| Panasonic Toughbook FZ-55 MK2 | |
| Getac S410 G5 | |
| Panasonic Toughbook 40 | |
| Przeciętny Intel Iris Xe Graphics G7 96EUs (21.4 - 77.8, n=185) | |
| Getac S410 Gen 4 | |
| Durabook S15 | |
| Dell Latitude 5420 Rugged-P85G | |
| Getac B360 | |
| 1920x1080 High Graphics & Postprocessing (Nvidia HairWorks Off) | |
| Dell Latitude 7330 Rugged Extreme | |
| Getac S410 G5 | |
| Panasonic Toughbook FZ-55 MK2 | |
| Panasonic Toughbook 40 | |
| Acer Enduro Urban N3 EUN314 | |
| Przeciętny Intel Iris Xe Graphics G7 96EUs (10.6 - 45.9, n=191) | |
| Getac S410 Gen 4 | |
| Durabook S15 | |
| Getac B360 | |
| Dell Latitude 5420 Rugged-P85G | |
| 1920x1080 Ultra Graphics & Postprocessing (HBAO+) | |
| Getac S410 G5 | |
| Dell Latitude 7330 Rugged Extreme | |
| Panasonic Toughbook FZ-55 MK2 | |
| Panasonic Toughbook 40 | |
| Przeciętny Intel Iris Xe Graphics G7 96EUs (8.79 - 20.1, n=181) | |
| Acer Enduro Urban N3 EUN314 | |
| Getac S410 Gen 4 | |
| Durabook S15 | |
| Dell Latitude 5420 Rugged-P85G | |
| Getac B360 | |
| Final Fantasy XV Benchmark | |
| 1280x720 Lite Quality | |
| Dell Latitude 7330 Rugged Extreme | |
| Panasonic Toughbook FZ-55 MK2 | |
| Getac S410 G5 | |
| Panasonic Toughbook 40 | |
| Acer Enduro Urban N3 EUN314 | |
| Przeciętny Intel Iris Xe Graphics G7 96EUs (14.9 - 56.5, n=189) | |
| Getac S410 Gen 4 | |
| Durabook S15 | |
| Durabook S14I | |
| Getac B360 | |
| Dell Latitude 5420 Rugged-P85G | |
| 1920x1080 Standard Quality | |
| Dell Latitude 7330 Rugged Extreme | |
| Acer Enduro Urban N3 EUN314 | |
| Panasonic Toughbook FZ-55 MK2 | |
| Getac S410 G5 | |
| Przeciętny Intel Iris Xe Graphics G7 96EUs (10.5 - 31.2, n=185) | |
| Panasonic Toughbook 40 | |
| Getac S410 Gen 4 | |
| Durabook S15 | |
| Durabook S14I | |
| Getac B360 | |
| Dell Latitude 5420 Rugged-P85G | |
| 1920x1080 High Quality | |
| Dell Latitude 7330 Rugged Extreme | |
| Przeciętny Intel Iris Xe Graphics G7 96EUs (8.15 - 27.8, n=178) | |
| Acer Enduro Urban N3 EUN314 | |
| Getac S410 G5 | |
| Panasonic Toughbook FZ-55 MK2 | |
| Panasonic Toughbook 40 | |
| Getac S410 Gen 4 | |
| Durabook S15 | |
| Durabook S14I | |
| Getac B360 | |
| Dell Latitude 5420 Rugged-P85G | |
| Dota 2 Reborn | |
| 1280x720 min (0/3) fastest | |
| Dell Latitude 7330 Rugged Extreme | |
| Panasonic Toughbook 40 | |
| Przeciętny Intel Iris Xe Graphics G7 96EUs (36 - 148, n=221) | |
| Getac S410 G5 | |
| Durabook S15 | |
| Getac B360 | |
| Panasonic Toughbook FZ-55 MK2 | |
| Getac S410 Gen 4 | |
| Acer Enduro Urban N3 EUN314 | |
| Durabook S14I | |
| Durabook S15ABG2 | |
| 1366x768 med (1/3) | |
| Dell Latitude 7330 Rugged Extreme | |
| Panasonic Toughbook 40 | |
| Panasonic Toughbook FZ-55 MK2 | |
| Acer Enduro Urban N3 EUN314 | |
| Przeciętny Intel Iris Xe Graphics G7 96EUs (31.6 - 108.5, n=221) | |
| Getac S410 G5 | |
| Getac S410 Gen 4 | |
| Durabook S15 | |
| Durabook S14I | |
| Getac B360 | |
| Durabook S15ABG2 | |
| 1920x1080 high (2/3) | |
| Dell Latitude 7330 Rugged Extreme | |
| Panasonic Toughbook 40 | |
| Getac S410 G5 | |
| Przeciętny Intel Iris Xe Graphics G7 96EUs (23.2 - 88.1, n=221) | |
| Panasonic Toughbook FZ-55 MK2 | |
| Durabook S15 | |
| Acer Enduro Urban N3 EUN314 | |
| Getac S410 Gen 4 | |
| Durabook S14I | |
| Getac B360 | |
| Durabook S15ABG2 | |
| 1920x1080 ultra (3/3) best looking | |
| Dell Latitude 7330 Rugged Extreme | |
| Panasonic Toughbook 40 | |
| Przeciętny Intel Iris Xe Graphics G7 96EUs (20.6 - 78.5, n=221) | |
| Getac S410 G5 | |
| Panasonic Toughbook FZ-55 MK2 | |
| Durabook S15 | |
| Getac S410 Gen 4 | |
| Acer Enduro Urban N3 EUN314 | |
| Durabook S14I | |
| Getac B360 | |
| Durabook S15ABG2 | |
| X-Plane 11.11 | |
| 1280x720 low (fps_test=1) | |
| Getac S410 G5 | |
| Durabook S15 | |
| Getac S410 Gen 4 | |
| Przeciętny Intel Iris Xe Graphics G7 96EUs (13.4 - 88.4, n=213) | |
| Durabook S14I | |
| Dell Latitude 7330 Rugged Extreme | |
| Panasonic Toughbook FZ-55 MK2 | |
| Panasonic Toughbook 40 | |
| Acer Enduro Urban N3 EUN314 | |
| Durabook S15ABG2 | |
| Getac B360 | |
| 1920x1080 med (fps_test=2) | |
| Acer Enduro Urban N3 EUN314 | |
| Getac S410 G5 | |
| Przeciętny Intel Iris Xe Graphics G7 96EUs (11.6 - 69.5, n=214) | |
| Getac S410 Gen 4 | |
| Durabook S15 | |
| Durabook S14I | |
| Dell Latitude 7330 Rugged Extreme | |
| Panasonic Toughbook FZ-55 MK2 | |
| Panasonic Toughbook 40 | |
| Durabook S15ABG2 | |
| Getac B360 | |
| 1920x1080 high (fps_test=3) | |
| Acer Enduro Urban N3 EUN314 | |
| Getac S410 G5 | |
| Przeciętny Intel Iris Xe Graphics G7 96EUs (11.1 - 59.8, n=213) | |
| Getac S410 Gen 4 | |
| Durabook S15 | |
| Durabook S14I | |
| Panasonic Toughbook 40 | |
| Panasonic Toughbook FZ-55 MK2 | |
| Dell Latitude 7330 Rugged Extreme | |
| Durabook S15ABG2 | |
| Getac B360 | |
| Strange Brigade | |
| 1280x720 lowest AF:1 | |
| Getac S410 G5 | |
| Przeciętny Intel Iris Xe Graphics G7 96EUs (48.5 - 115.1, n=172) | |
| Acer Enduro Urban N3 EUN314 | |
| Getac S410 Gen 4 | |
| Durabook S15 | |
| 1920x1080 medium AA:medium AF:4 | |
| Getac S410 G5 | |
| Przeciętny Intel Iris Xe Graphics G7 96EUs (18.2 - 51.4, n=170) | |
| Acer Enduro Urban N3 EUN314 | |
| Durabook S15 | |
| Getac S410 Gen 4 | |
| 1920x1080 high AA:high AF:8 | |
| Getac S410 G5 | |
| Przeciętny Intel Iris Xe Graphics G7 96EUs (15.4 - 39.8, n=169) | |
| Acer Enduro Urban N3 EUN314 | |
| Getac S410 Gen 4 | |
| Durabook S15 | |
| 1920x1080 ultra AA:ultra AF:16 | |
| Getac S410 G5 | |
| Przeciętny Intel Iris Xe Graphics G7 96EUs (13.2 - 31.7, n=167) | |
| Acer Enduro Urban N3 EUN314 | |
| Getac S410 Gen 4 | |
| Durabook S15 | |
| Tiny Tina's Wonderlands | |
| 1280x720 Lowest Preset (DX12) | |
| Przeciętny Intel Iris Xe Graphics G7 96EUs (25.9 - 67.3, n=32) | |
| Durabook S15 | |
| 1920x1080 Low Preset (DX12) | |
| Przeciętny Intel Iris Xe Graphics G7 96EUs (22.3 - 53, n=32) | |
| Durabook S15 | |
| F1 22 | |
| 1280x720 Ultra Low Preset AA:T AF:16x | |
| Przeciętny Intel Iris Xe Graphics G7 96EUs (57.4 - 94.9, n=53) | |
| Durabook S15 | |
| 1920x1080 Low Preset AA:T AF:16x | |
| Przeciętny Intel Iris Xe Graphics G7 96EUs (33.3 - 57.2, n=58) | |
| Durabook S15 | |
| 1920x1080 Medium Preset AA:T AF:16x | |
| Przeciętny Intel Iris Xe Graphics G7 96EUs (28 - 52.3, n=58) | |
| Durabook S15 | |
| Baldur's Gate 3 | |
| 1280x720 Low Preset AA:SM | |
| Przeciętny Intel Iris Xe Graphics G7 96EUs (14.5 - 66.1, n=13) | |
| Durabook S15 | |
| 1920x1080 Low Preset AA:SM | |
| Przeciętny Intel Iris Xe Graphics G7 96EUs (9.4 - 29.3, n=13) | |
| Durabook S15 | |
| Cyberpunk 2077 | |
| 1280x720 Low Preset (FSR off) | |
| Przeciętny Intel Iris Xe Graphics G7 96EUs (21.4 - 37.3, n=17) | |
| Durabook S15 | |
| 1920x1080 Low Preset (FSR off) | |
| Przeciętny Intel Iris Xe Graphics G7 96EUs (13.1 - 22.5, n=17) | |
| Durabook S15 | |
Witcher 3 FPS Chart
| low | med. | high | ultra | |
|---|---|---|---|---|
| The Witcher 3 (2015) | 60.2 | 46 | 24.9 | 12.5 |
| Dota 2 Reborn (2015) | 93.7 | 65.7 | 51.8 | 46.8 |
| Final Fantasy XV Benchmark (2018) | 35.2 | 20.1 | 14.7 | |
| X-Plane 11.11 (2018) | 44.8 | 33.3 | 30.2 | |
| Far Cry 5 (2018) | 23 | 22 | 19 | 19 |
| Strange Brigade (2018) | 73 | 32.4 | 26.7 | 21.9 |
| Tiny Tina's Wonderlands (2022) | 23.4 | |||
| F1 22 (2022) | 34.7 | 29.1 | 22.1 | |
| Baldur's Gate 3 (2023) | 9.4 | |||
| Cyberpunk 2077 (2023) | 14.4 |
Emisje
Hałas systemowy
Szum wentylatora jest jednym z najcichszych wśród laptopów z kategorii rugged. Podczas uruchamiania bardzo wymagających obciążeń, takich jak gry lub Prime95, hałas wentylatora może osiągnąć maksymalnie 37 dB(A), po czym szybko spada do prawie cichego zakresu 28 dB(A). To bardzo konserwatywne podejście uzupełnia wspomnianą powyżej wydajność procesora poniżej średniej. Biorąc pod uwagę odbiorców aplikacji rządowych lub naukowych, cichszy hałas wentylatora jest prawdopodobnie preferowany, nawet jeśli oznacza to obniżoną wydajność.
Hałas
| luz |
| 26.3 / 26.3 / 26.8 dB |
| obciążenie |
| 27.7 / 37.4 dB |
 | ||
30 dB cichy 40 dB(A) słyszalny 50 dB(A) irytujący |
||
min: | ||
| Durabook S15 Iris Xe G7 96EUs, i7-1255U, Kingston OM8SEP4512Q-AA | Durabook S15ABG2 UHD Graphics 620, i5-8265U, UDinfo HF3-25UB HF325UB256GBA2P | Panasonic Toughbook 40 Iris Xe G7 96EUs, i7-1185G7, Samsung PM991 MZVLQ1T0HALB | Getac S410 G5 Iris Xe G7 80EUs, i5-1350P, SSSTC CL4-8D512 | Dell Latitude 5420 Rugged-P85G Radeon RX 540, i7-8650U, SK hynix PC401 NVMe 500 GB | Acer Enduro Urban N3 EUN314 Iris Xe G7 96EUs, i7-1165G7, Samsung PM991 MZVLQ1T0HALB | |
|---|---|---|---|---|---|---|
| Noise | -13% | -10% | -12% | -8% | -1% | |
| wyłączone / środowisko * (dB) | 24.6 | 29.3 -19% | 22.8 7% | 23.4 5% | 28.3 -15% | 23.8 3% |
| Idle Minimum * (dB) | 26.3 | 29.3 -11% | 26 1% | 23.4 11% | 28.3 -8% | 24.1 8% |
| Idle Average * (dB) | 26.3 | 29.3 -11% | 26 1% | 25.9 2% | 28.3 -8% | 24.1 8% |
| Idle Maximum * (dB) | 26.8 | 29.3 -9% | 26 3% | 26 3% | 28.3 -6% | 24.1 10% |
| Load Average * (dB) | 27.7 | 35.5 -28% | 37.6 -36% | 38.7 -40% | 29.9 -8% | 27.9 -1% |
| Witcher 3 ultra * (dB) | 27.4 | 37.8 -38% | 42.1 -54% | 35.7 -30% | ||
| Load Maximum * (dB) | 37.4 | 38 -2% | 40.3 -8% | 42.1 -13% | 38 -2% | 38.6 -3% |
* ... im mniej tym lepiej
Temperatura
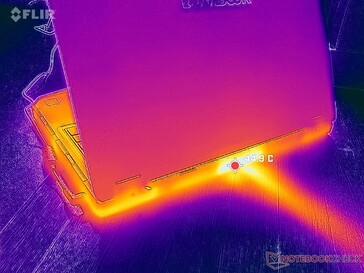
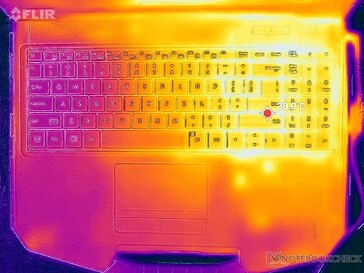
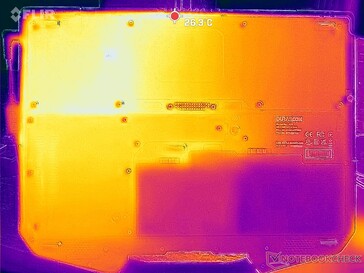
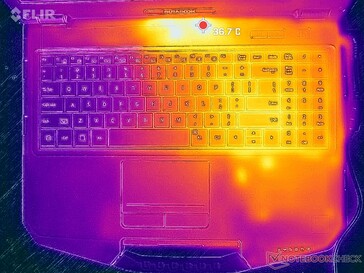
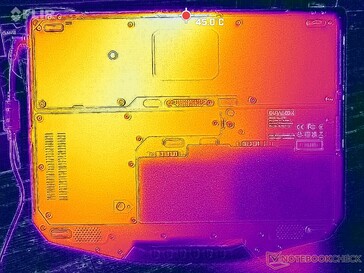
Prawa połowa systemu zawsze będzie cieplejsza niż lewa ze względu na umiejscowienie baterii i rozwiązania chłodzącego. Gorące punkty na spodzie mogą osiągnąć nieco ponad 40 C, podobnie jak w przypadku grubszego i cięższego Panasonic Toughbook 40 lub starszego Durabooka S15ABG2.
(+) Maksymalna temperatura w górnej części wynosi 38.6 °C / 101 F, w porównaniu do średniej 34.3 °C / 94 F , począwszy od 21.2 do 62.5 °C dla klasy Office.
(±) Dno nagrzewa się maksymalnie do 41 °C / 106 F, w porównaniu do średniej 36.8 °C / 98 F
(+) W stanie bezczynności średnia temperatura górnej części wynosi 26.6 °C / 80 F, w porównaniu ze średnią temperaturą urządzenia wynoszącą 29.5 °C / ### class_avg_f### F.
(+) Podparcia dłoni i touchpad osiągają maksymalną temperaturę skóry (32.6 °C / 90.7 F) i dlatego nie są gorące.
(-) Średnia temperatura obszaru podparcia dłoni w podobnych urządzeniach wynosiła 27.6 °C / 81.7 F (-5 °C / -9 F).
| Durabook S15 Intel Core i7-1255U, Intel Iris Xe Graphics G7 96EUs | Durabook S15ABG2 Intel Core i5-8265U, Intel UHD Graphics 620 | Panasonic Toughbook 40 Intel Core i7-1185G7, Intel Iris Xe Graphics G7 96EUs | Getac S410 G5 Intel Core i5-1350P, Intel Iris Xe Graphics G7 80EUs | Dell Latitude 5420 Rugged-P85G Intel Core i7-8650U, AMD Radeon RX 540 | Acer Enduro Urban N3 EUN314 Intel Core i7-1165G7, Intel Iris Xe Graphics G7 96EUs | |
|---|---|---|---|---|---|---|
| Heat | -3% | 4% | -1% | -6% | 1% | |
| Maximum Upper Side * (°C) | 38.6 | 44 -14% | 35.6 8% | 37 4% | 42.2 -9% | 37.8 2% |
| Maximum Bottom * (°C) | 41 | 42 -2% | 40 2% | 42.2 -3% | 42 -2% | 45.8 -12% |
| Idle Upper Side * (°C) | 28.8 | 28 3% | 28.6 1% | 28.8 -0% | 31.6 -10% | 26.4 8% |
| Idle Bottom * (°C) | 31.4 | 30.6 3% | 29.4 6% | 33 -5% | 31.8 -1% | 30.2 4% |
* ... im mniej tym lepiej
Głośniki
Durabook S15 analiza dźwięku
(+) | głośniki mogą odtwarzać stosunkowo głośno (86.7 dB)
Bas 100 - 315 Hz
(-) | prawie brak basu - średnio 41.6% niższa od mediany
(+) | bas jest liniowy (6.3% delta do poprzedniej częstotliwości)
Średnie 400 - 2000 Hz
(±) | zmniejszone średnie - średnio 6.7% niższe niż mediana
(±) | liniowość środka jest średnia (8.8% delta do poprzedniej częstotliwości)
Wysokie 2–16 kHz
(+) | zrównoważone maksima - tylko 4.4% od mediany
(+) | wzloty są liniowe (5.7% delta do poprzedniej częstotliwości)
Ogólnie 100 - 16.000 Hz
(±) | liniowość ogólnego dźwięku jest średnia (25.8% różnicy w stosunku do mediany)
W porównaniu do tej samej klasy
» 78% wszystkich testowanych urządzeń w tej klasie było lepszych, 7% podobnych, 15% gorszych
» Najlepszy miał deltę 7%, średnia wynosiła ###średnia###%, najgorsza wynosiła 53%
W porównaniu do wszystkich testowanych urządzeń
» 79% wszystkich testowanych urządzeń było lepszych, 4% podobnych, 17% gorszych
» Najlepszy miał deltę 4%, średnia wynosiła ###średnia###%, najgorsza wynosiła 134%
Apple MacBook Pro 16 2021 M1 Pro analiza dźwięku
(+) | głośniki mogą odtwarzać stosunkowo głośno (84.7 dB)
Bas 100 - 315 Hz
(+) | dobry bas - tylko 3.8% od mediany
(+) | bas jest liniowy (5.2% delta do poprzedniej częstotliwości)
Średnie 400 - 2000 Hz
(+) | zbalansowane środki średnie - tylko 1.3% od mediany
(+) | średnie są liniowe (2.1% delta do poprzedniej częstotliwości)
Wysokie 2–16 kHz
(+) | zrównoważone maksima - tylko 1.9% od mediany
(+) | wzloty są liniowe (2.7% delta do poprzedniej częstotliwości)
Ogólnie 100 - 16.000 Hz
(+) | ogólny dźwięk jest liniowy (4.6% różnicy w stosunku do mediany)
W porównaniu do tej samej klasy
» 0% wszystkich testowanych urządzeń w tej klasie było lepszych, 0% podobnych, 100% gorszych
» Najlepszy miał deltę 5%, średnia wynosiła ###średnia###%, najgorsza wynosiła 45%
W porównaniu do wszystkich testowanych urządzeń
» 0% wszystkich testowanych urządzeń było lepszych, 0% podobnych, 100% gorszych
» Najlepszy miał deltę 4%, średnia wynosiła ###średnia###%, najgorsza wynosiła 134%
Zarządzanie energią
Zużycie energii
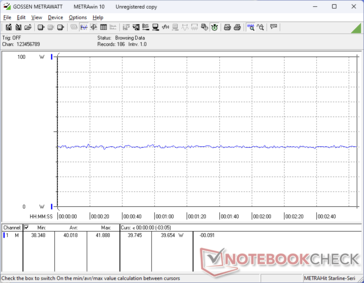
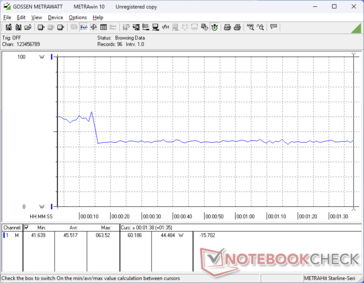
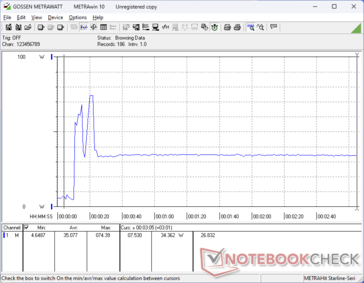
Praca na biegu jałowym na komputerze stacjonarnym wymaga od 4 W do 16 W, co jest zauważalnie wyższe niż w przypadku 2020 S15ABG2. Zwiększone zużycie energii można jednak przypisać znacznie jaśniejszemu wyświetlaczowi naszego S15, gdzie różnica między jasnością minimalną a maksymalną wynosi około 10 W.
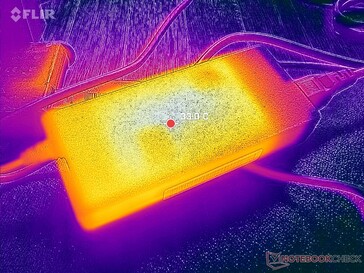
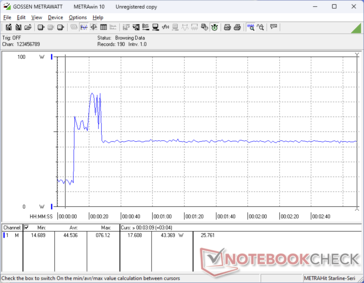
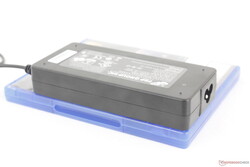
Ogólne zużycie energii przy wyższych obciążeniach jest nieco niższe niż w przypadku Getac S410 G5 który posiada szybszy procesor z serii Core-P. Maksymalny pobór może tymczasowo wynosić do 77 W, gdy procesor jest obciążony, zanim zaczną obowiązywać ograniczenia termiczne, jak pokazano na poniższych wykresach. System jest kompatybilny z większością ogólnych zasilaczy sieciowych USB-C, więc dostarczany w pudełku zasilacz sieciowy o mocy 90 W (~15 x 6,4 x 2,6 cm) nie jest absolutnie konieczny.
| wyłączony / stan wstrzymania | |
| luz | |
| obciążenie |
|
Legenda:
min: | |
| Durabook S15 i7-1255U, Iris Xe G7 96EUs, Kingston OM8SEP4512Q-AA, IPS, 1920x1080, 15.6" | Durabook S15ABG2 i5-8265U, UHD Graphics 620, UDinfo HF3-25UB HF325UB256GBA2P, TN LED, 1920x1080, 15.6" | Panasonic Toughbook 40 i7-1185G7, Iris Xe G7 96EUs, Samsung PM991 MZVLQ1T0HALB, IPS, 1920x1080, 14" | Getac S410 G5 i5-1350P, Iris Xe G7 80EUs, SSSTC CL4-8D512, IPS, 1920x1080, 14" | Dell Latitude 5420 Rugged-P85G i7-8650U, Radeon RX 540, SK hynix PC401 NVMe 500 GB, IPS, 1920x1080, 14" | Acer Enduro Urban N3 EUN314 i7-1165G7, Iris Xe G7 96EUs, Samsung PM991 MZVLQ1T0HALB, IPS, 1920x1080, 14" | |
|---|---|---|---|---|---|---|
| Power Consumption | 29% | -5% | -29% | -22% | 30% | |
| Idle Minimum * (Watt) | 4.4 | 3.5 20% | 4.9 -11% | 7.9 -80% | 4.8 -9% | 3.8 14% |
| Idle Average * (Watt) | 14.9 | 7.9 47% | 12.3 17% | 14.4 3% | 13.6 9% | 8 46% |
| Idle Maximum * (Watt) | 15.6 | 9 42% | 14 10% | 15.2 3% | 13.8 12% | 8.7 44% |
| Load Average * (Watt) | 45.5 | 39.8 13% | 54 -19% | 58.4 -28% | 67.8 -49% | 34.6 24% |
| Witcher 3 ultra * (Watt) | 40 | 46.3 -16% | 53.7 -34% | 69.1 -73% | 35.4 11% | |
| Load Maximum * (Watt) | 76.2 | 59.8 22% | 83.6 -10% | 106.5 -40% | 93.5 -23% | 45.4 40% |
* ... im mniej tym lepiej
Power Consumption Witcher 3 / Stresstest
Power Consumption external Monitor
Żywotność baterii
Wewnętrzna bateria jest stosunkowo niewielka i ma pojemność 54 Wh, co zapewnia rzeczywisty czas pracy w sieci WLAN wynoszący około 8 godzin, podobnie jak w starszym modelu 2020, gdy oba są ustawione na jasność 150 nitów. Aby wydłużyć czas pracy na baterii, dostępne są dodatkowe opcje baterii.
Ładowanie od pustej do pełnej pojemności jest stosunkowo powolne i trwa nieco ponad 2 godziny w porównaniu do 1,5 godziny w przypadku większości laptopów konsumenckich.
| Durabook S15 i7-1255U, Iris Xe G7 96EUs, 56 Wh | Durabook S15ABG2 i5-8265U, UHD Graphics 620, 56 Wh | Panasonic Toughbook 40 i7-1185G7, Iris Xe G7 96EUs, 136 Wh | Getac S410 G5 i5-1350P, Iris Xe G7 80EUs, 150 Wh | Dell Latitude 5420 Rugged-P85G i7-8650U, Radeon RX 540, 102 Wh | Acer Enduro Urban N3 EUN314 i7-1165G7, Iris Xe G7 96EUs, 50.3 Wh | |
|---|---|---|---|---|---|---|
| Czasy pracy | -14% | 138% | 119% | 93% | -20% | |
| Reader / Idle (h) | 17.2 | 31.4 83% | ||||
| WiFi v1.3 (h) | 8 | 6.9 -14% | 19 138% | 17.5 119% | 16.2 103% | 6.4 -20% |
| Load (h) | 3.2 |
Za
Przeciw
Werdykt - Zaktualizowane elementy wewnętrzne robią różnicę
Durabook S15 2024 bazuje na konstrukcji, którą recenzowaliśmy w 2020 roku, aby przyspieszyć serię, zachowując jednocześnie wszystkie podstawowe cechy oryginału. Znajome funkcje zewnętrzne są solidne, ale z nowymi specyfikacjami sprzętowymi, takimi jak Wi-Fi 6E, opcje wyświetlania 1000 nitów, większa klawiatura, Thunderbolt 4 i oczywiście szybsza wydajność procesora. Niektórzy użytkownicy mogą być jednak niezadowoleni z rezygnacji z 2,5-calowego gniazda SATA III i braku ekranu dotykowego. Kilka konkurencyjnych modeli, takich jak Getac S410 Gen 5 ma ekran dotykowy, rysik i szybsze opcje Core-P w porównaniu.
Durabook S15 2024 może wyglądać tak samo z zewnątrz, ale wnętrze zostało prawie całkowicie zmienione, aby wprowadzić nowoczesne funkcje i opcje, zachowując jednocześnie wsteczną kompatybilność z większością akcesoriów.
Obecność PWM do kontroli jasności i nierównomierne sprzężenie zwrotne klawiszy między lewą i prawą stroną klawiatury powinny zostać poprawione w przyszłych wersjach. Głośniki mogłyby być głośniejsze, a boczna zatoka dokująca nadal wymaga śrubokręta, co może być niewygodne w terenie. Zdecydowana większość najnowszych laptopów przeszła również na ekrany 16:10 lub 16-calowe, podczas gdy S15 zaczyna wydawać się przestarzały ze swoim 15,6-calowym współczynnikiem 16:9. Pomimo tych wad, imponujące jest to, że model ten pozostaje jednym z najbardziej przenośnych w tej kategorii nawet po tylu latach.
Cena i dostępność
Wyceny są dostępne w przypadku konfiguracji i zakupu bezpośrednio od producenta.
Durabook S15
- 17/06/2024 v8
Allen Ngo
Przezroczystość
Wyboru urządzeń do recenzji dokonuje nasza redakcja. Próbka testowa została udostępniona autorowi jako pożyczka od producenta lub sprzedawcy detalicznego na potrzeby tej recenzji. Pożyczkodawca nie miał wpływu na tę recenzję, producent nie otrzymał też kopii tej recenzji przed publikacją. Nie było obowiązku publikowania tej recenzji. Jako niezależna firma medialna, Notebookcheck nie podlega władzy producentów, sprzedawców detalicznych ani wydawców.
Tak testuje Notebookcheck
Każdego roku Notebookcheck niezależnie sprawdza setki laptopów i smartfonów, stosując standardowe procedury, aby zapewnić porównywalność wszystkich wyników. Od około 20 lat stale rozwijamy nasze metody badawcze, ustanawiając przy tym standardy branżowe. W naszych laboratoriach testowych doświadczeni technicy i redaktorzy korzystają z wysokiej jakości sprzętu pomiarowego. Testy te obejmują wieloetapowy proces walidacji. Nasz kompleksowy system ocen opiera się na setkach uzasadnionych pomiarów i benchmarków, co pozwala zachować obiektywizm.


