

Recenzja AMD Ryzen 9 9950X3D: Wydajność w grach i energooszczędność na poziomie Ryzen 7 9800X3D za 50 dolarów w porównaniu do Ryzen 9 9950X
Pamięć podręczna warta swojej ceny?
AMD Ryzen 9 9950X3D oferuje dokładnie taką samą wydajność jak jego konwencjonalny odpowiednik, jednocześnie czerpiąc korzyści z dodatkowej pamięci podręcznej w grach z ograniczonym procesorem. Podczas gdy wydajność w grach jest teraz na poziomie Ryzen 7 9800X3D, dodatkowa marża w wysokości 50 USD w porównaniu do Ryzen 9 9950X za niezbyt namacalne korzyści może uzasadniać bliższe przyjrzenie się.Vaidyanathan Subramaniam, 👁 Vaidyanathan Subramaniam (tłumaczenie DeepL / Ninh Duy) Opublikowany 🇺🇸 🇫🇷 ...
Werdykt: Doskonały wzrost wydajności i wydajności w grach z wątpliwą propozycją wartości
Dzisiejsza premiera procesora AMD Ryzen 9 9950X3D jeszcze bardziej potwierdza fakt, że zwykłe dodanie dodatkowej pamięci podręcznej zapewnia bardziej namacalne korzyści w zakresie wydajności niż jakakolwiek radykalna zmiana architektury.
Platforma AM5 znacznie dojrzała od czasu jej pojawienia się trzy lata temu, w połączeniu z przystępnymi cenowo zestawami DDR5. W rzeczywistości, można używać AMD Ryzen 9 9950X3D z niemal każdą płytą główną AM5 i czerpać mniej więcej takie same korzyści z wydajności.
Ostatnie aktualizacje AGESA wprowadziły funkcję przywracania kontekstu pamięci, która znacznie poprawia trening pamięci i czasy uruchamiania, które były bolączką platformy AM5.
Podczas gdy przyszłość nowego gniazda LGA 1851 Intela jest wciąż niepewna, AMD obiecało wsparcie AM5 do 2027 roku. Jeśli długowieczność AM4 jest cokolwiek warta, można oczekiwać, że AM5 po raz kolejny przeżyje swoje przeznaczenie.

Ryzen 9 9950X3D jest na równi z Intel Core Ultra 9 285K, Core i9-14900K, a nawet Ryzen 9 9950X w skumulowanych testach porównawczych procesorów, oferując jednocześnie dobry wzrost wydajności energetycznej. Obciążenia związane z wydajnością sprawiają, że Ryzen 9 9950X3D plasuje się na szczycie list przebojów, oferując wymierne korzyści w porównaniu z ofertą Intela.
Jeśli chodzi o gry, szczególnie przy ustawieniach intensywnie wykorzystujących procesor, dodatkowe 64 MB pamięci V-cache w Ryzen 9 9950X3D okazuje się korzystne, zwiększając jego wydajność o 18% w porównaniu do odpowiednika bez X3D i przewyższając Core i9-14900K o 10% w zagregowanych testach gier.
Pomimo tego, Ryzen 9 9950X3D może jedynie grać drugie skrzypce z Ryzenem 7 9800X3D w grach, choć różnica między nimi jest praktycznie znikoma. Nawet Ryzen 7 7800X3D jest nadal cenioną opcją w 2025 roku, jeśli zależy Państwu przede wszystkim na procesorze do gier.
Podczas gdy Core Ultra 9 285K przynosi ze sobą dobrą poprawę wydajności, jego obecna cena sprzedaży wynosząca 620 USD sprawia, że jest to mniej atrakcyjna rekomendacja.
Potrzebują Państwo procesora, który sprawdzi się zarówno w grach, jak i przy tworzeniu treści? Ryzen 9 9950X3D za 699 USD i Core i9-14900K za 500 USD to dobre opcje.
Chcą Państwo najlepszy procesor do gier? Ryzen 7 7800X3D za 449 USD lub Ryzen 7 9800X3D za 479 USD to właśnie to, co zalecił lekarz.
Za
Przeciw
Cena i dostępność
AMD Ryzen 9 9950X3D będzie dostępny w sklepach detalicznych na całym świecie od jutra w cenie 699 USD SEP.
Spis treści
- Werdykt: Doskonały wzrost wydajności i wydajności w grach z wątpliwą propozycją wartości
- Stanowisko testowe: Ryzen 9 9950X3D i GeForce RTX 4090 tworzą zgraną parę
- Wydajność procesora: W tym samym przedziale co Ryzen 9 9950X i Core Ultra 9 285K
- Wydajność systemu: Wymierne korzyści w porównaniu do Ryzen 9 7950X3D
- wydajność 3D i w grach: Gnaws right at the Ryzen 7 9800X3D's heels
- Pobór mocy: Przewyższa Core Ultra 9 285K pod względem wydajności wielordzeniowej
- Wrażenia Notebookcheck dotyczące AMD Ryzen 9 9950X3D
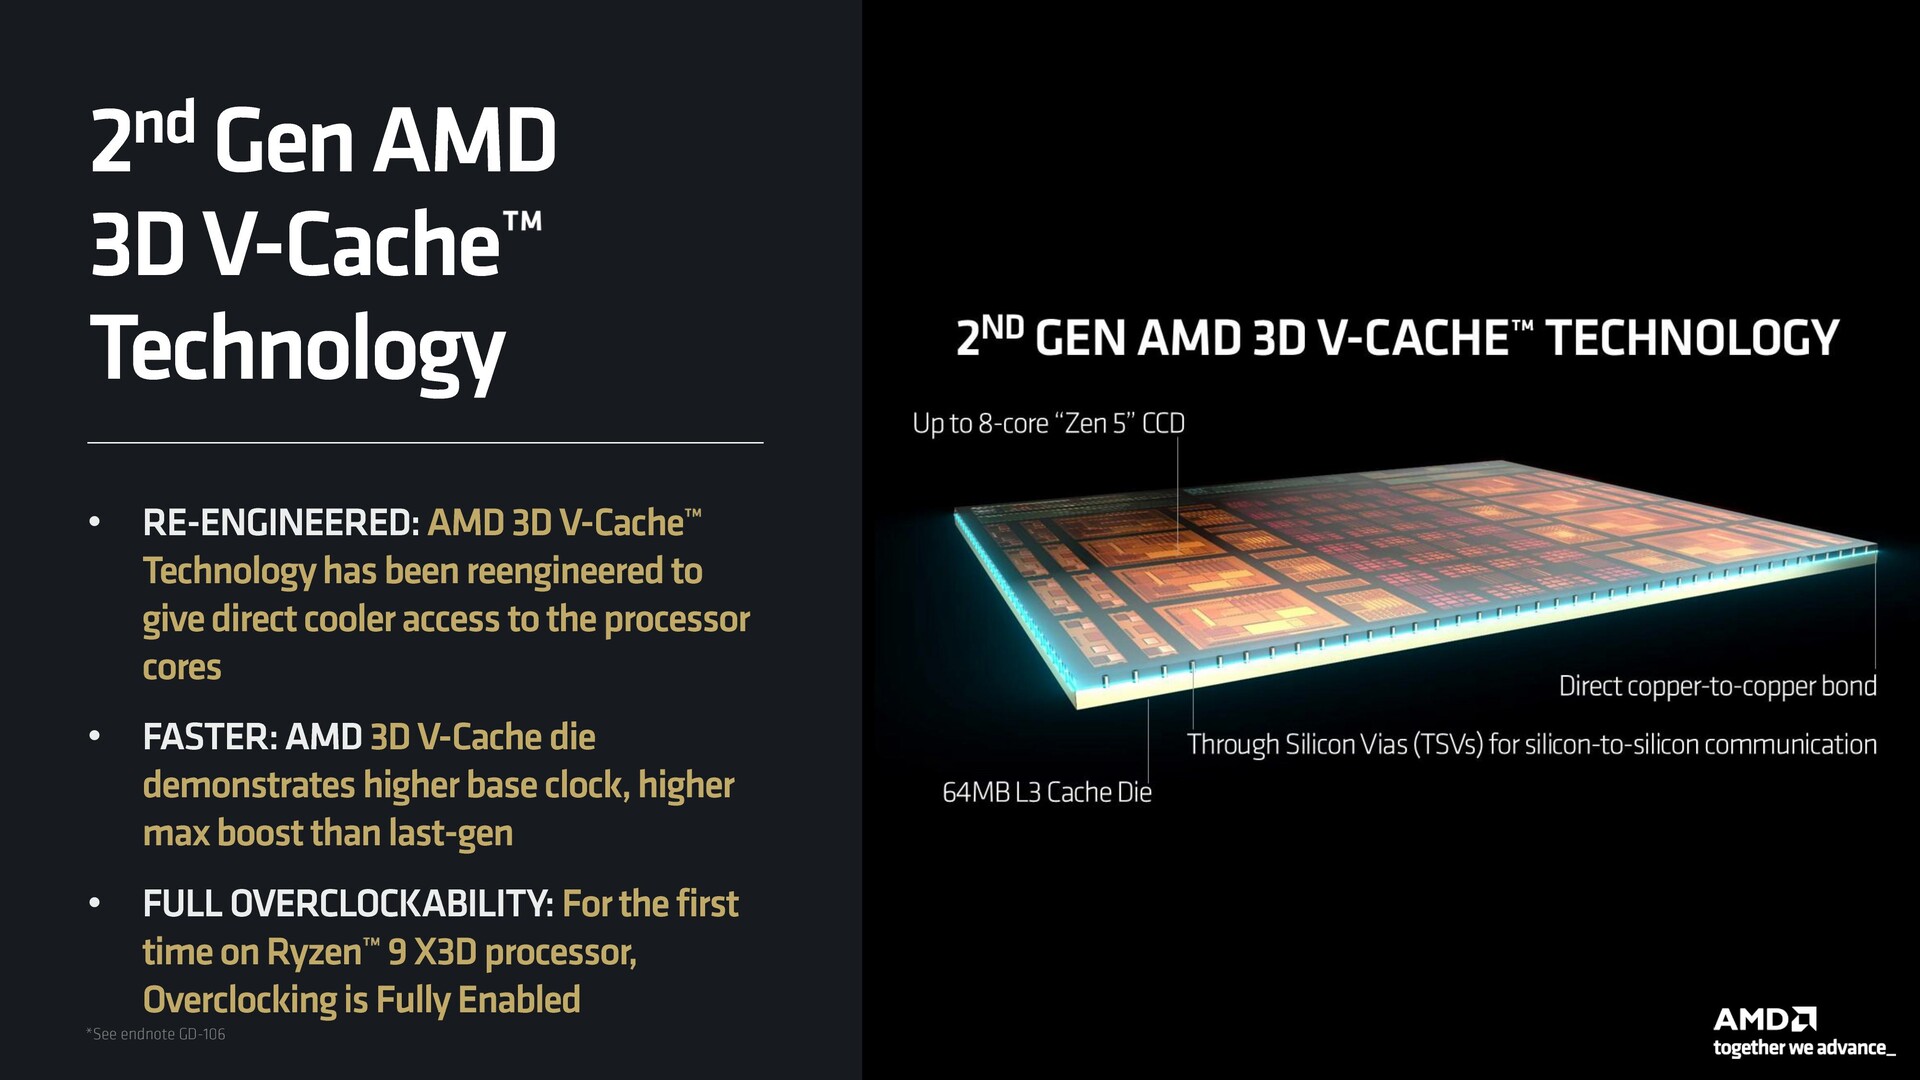
AMD zaczęło zastanawiać się nad wprowadzeniem technologii pamięci podręcznej technologii 3D V-cache - po raz pierwszy zastosowanej w Ryzen 7 5800X3D - do flagowych procesorów Ryzen, począwszy od serii Ryzen 7000.
Procesor Ryzen 7 9800X3D był hitem generacji Zen 5, a teraz przyszła kolej na 16-rdzeniowego behemota z najwyższej półki, który zasmakował dobroci 3D V-cache.
W dniu dzisiejszym AMD udostępniło procesory Ryzen 9 9900X3D i Ryzen 9 9950X3D, a embargo na ich sprzedaż zostanie zniesione jutro.
Mamy z nami Ryzen 9 9950X3D do recenzji. AMD nie udostępniło jeszcze procesora Ryzen 9 9900X prasie w Indiach, ale mamy nadzieję, że wkrótce trafi on do naszych laboratoriów.
Przegląd procesorów AMD Zen 5 "Granite Ridge" Ryzen 9000 do komputerów stacjonarnych
| SKU | Rdzenie / wątki | Taktowanie bazowe | Taktowanie Turbo | Pamięć podręczna L2 | Pamięć podręczna L3 | TDP | Domyślna moc gniazda (PPT) | Cena premierowa (SEP) |
|---|---|---|---|---|---|---|---|---|
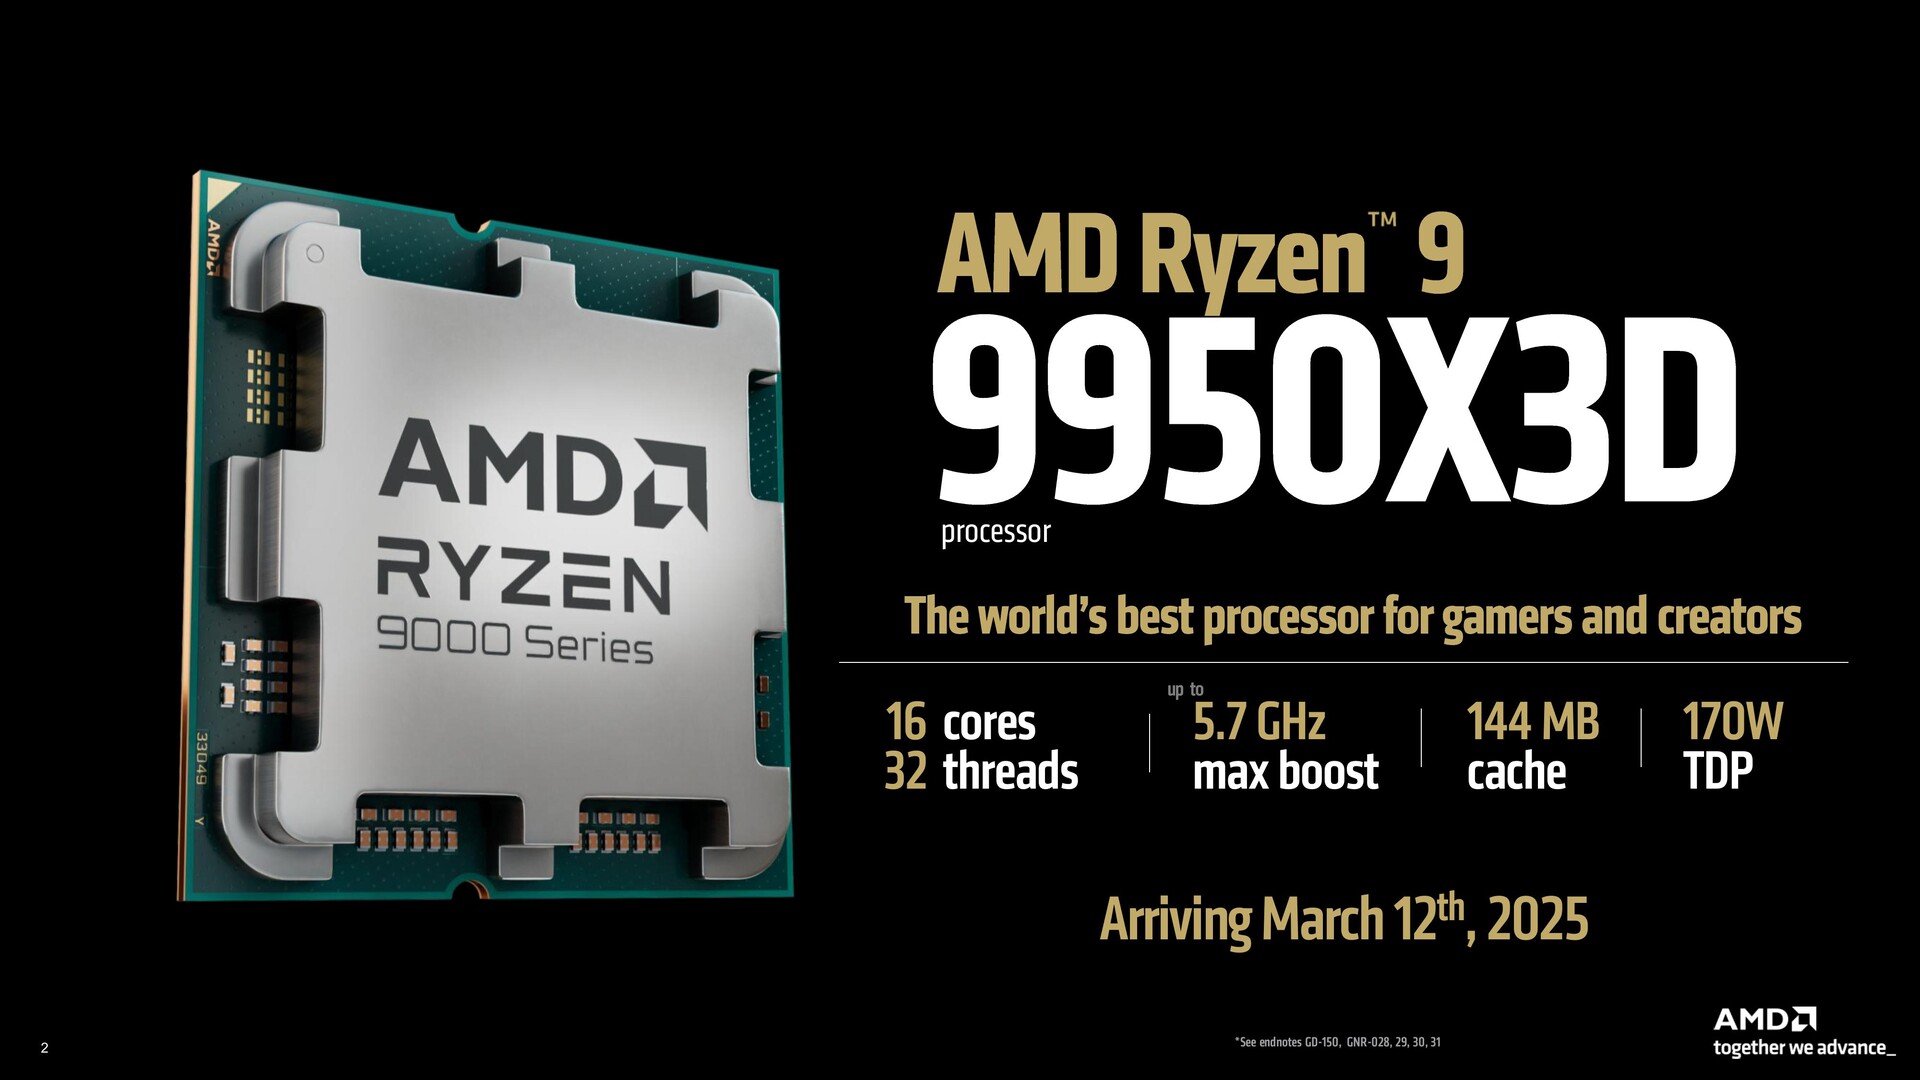
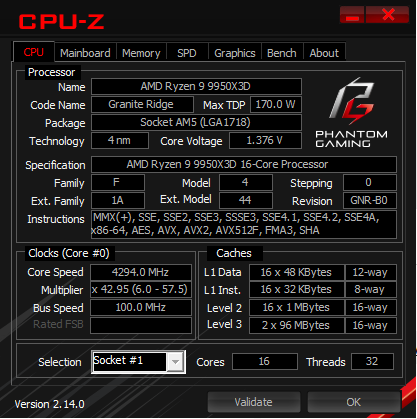
| Ryzen 9 9950X3D | 16 / 32 | 4,3 GHz | 5,7 GHz | 16x 1 MB | 128 MB | 170 W | 200 W | 699 USD |
| Ryzen 9 9950X | 16 / 32 | 4,3 GHz | 5,7 GHz | 16x 1 MB | 64 MB | 170 W | 200 W | 649 USD |
| Ryzen 9 9900X3D | 12 / 24 | 4,4GHz | 5,5 GHz | 12x 1MB | 128 MB | 120 W | 162 W | 599 USD |
| Ryzen 9 9900X | 12 / 24 | 4,4 GHz | 5,6 GHz | 12x 1 MB | 64 MB | 120 W | 162 W | 499 USD |
| Ryzen 7 9800X3D | 8 / 16 | 4,7 GHz | 5,2 GHz | 8x 1 MB | 96 MB | 120 W | 162 W | US$479 |
| Ryzen 7 9700X | 8 / 16 | 3,8 GHz | 5,5 GHz | 8x 1 MB | 32 MB | 65 W | 88 W | 359 USD |
| Ryzen 5 9600X | 6 / 12 | 3,9 GHz | 5,4 GHz | 6x 1 MB | 32 MB | 65 W | 88 W | 279 USD |
W przeciwieństwie do implementacji pojedynczego CCD, takiej jak Ryzen 7 9800X3D, wprowadzenie wariantu X3D 16-rdzeniowego, 32-wątkowego układu z dwoma CCD jest znacznie bardziej złożone.
Procesor (i system operacyjny) powinny być w stanie efektywnie parkować i wykorzystywać rdzenie - wysyłać obciążenia związane z grami do X3D CCD, jednocześnie wykorzystując wyższe zegary na CCD bez X3D do zadań związanych z produktywnością.
Łatwiej to powiedzieć niż zrobić, więc AMD wdraża kilka własnych technologii (lub obejść?), aby zapewnić płynne wrażenia użytkownika.
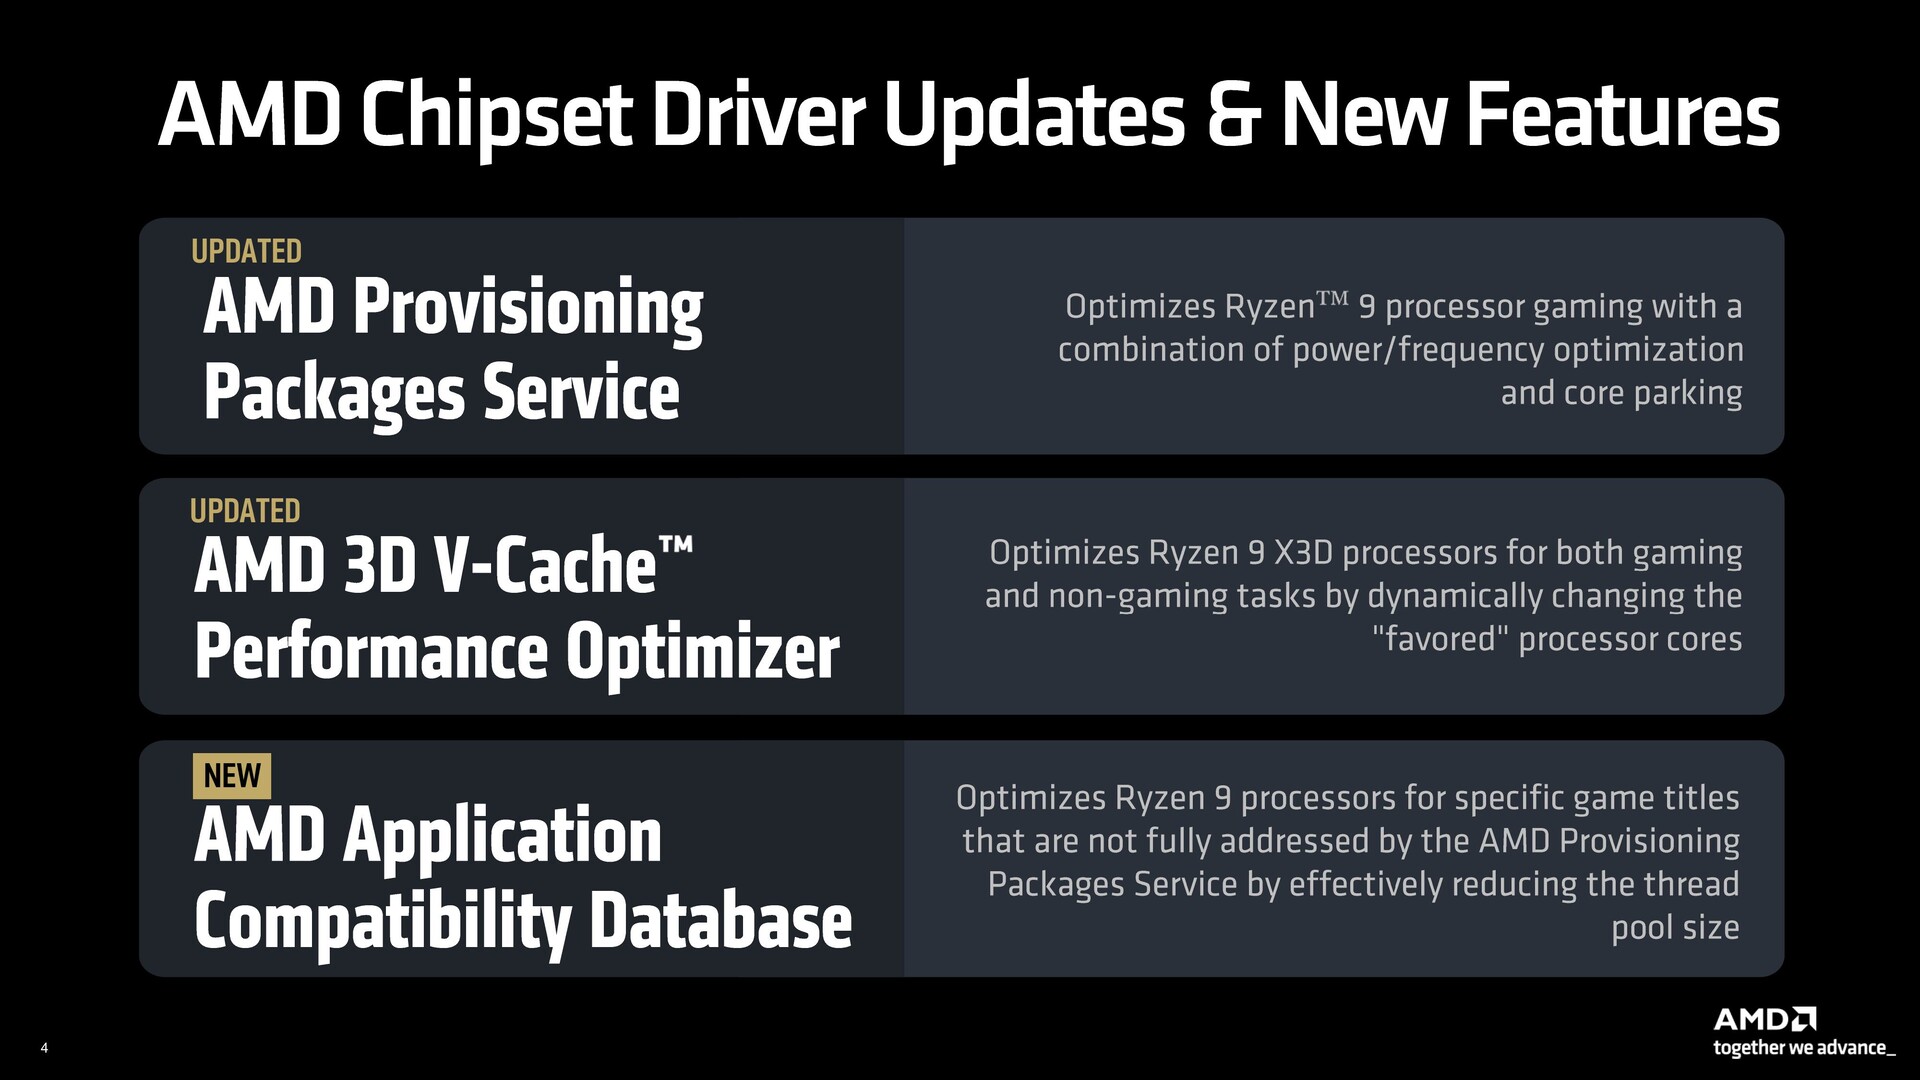
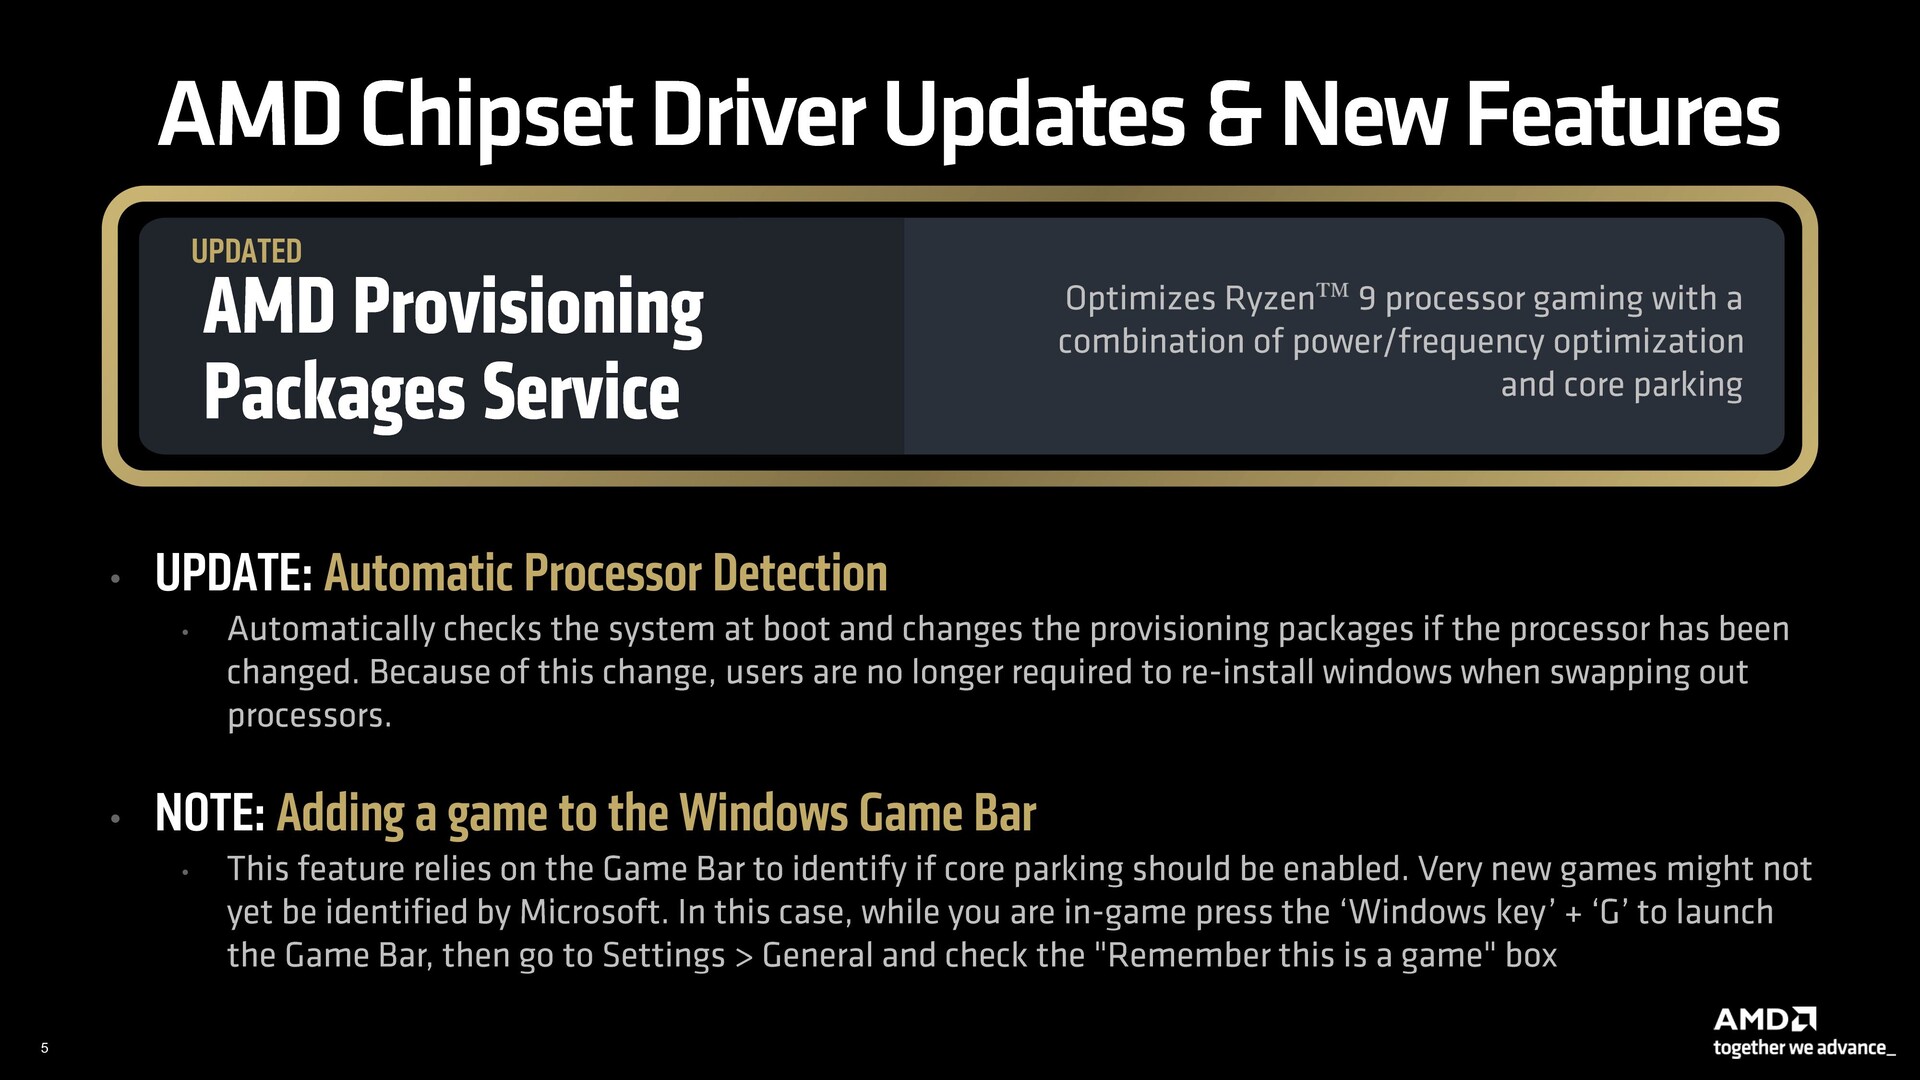
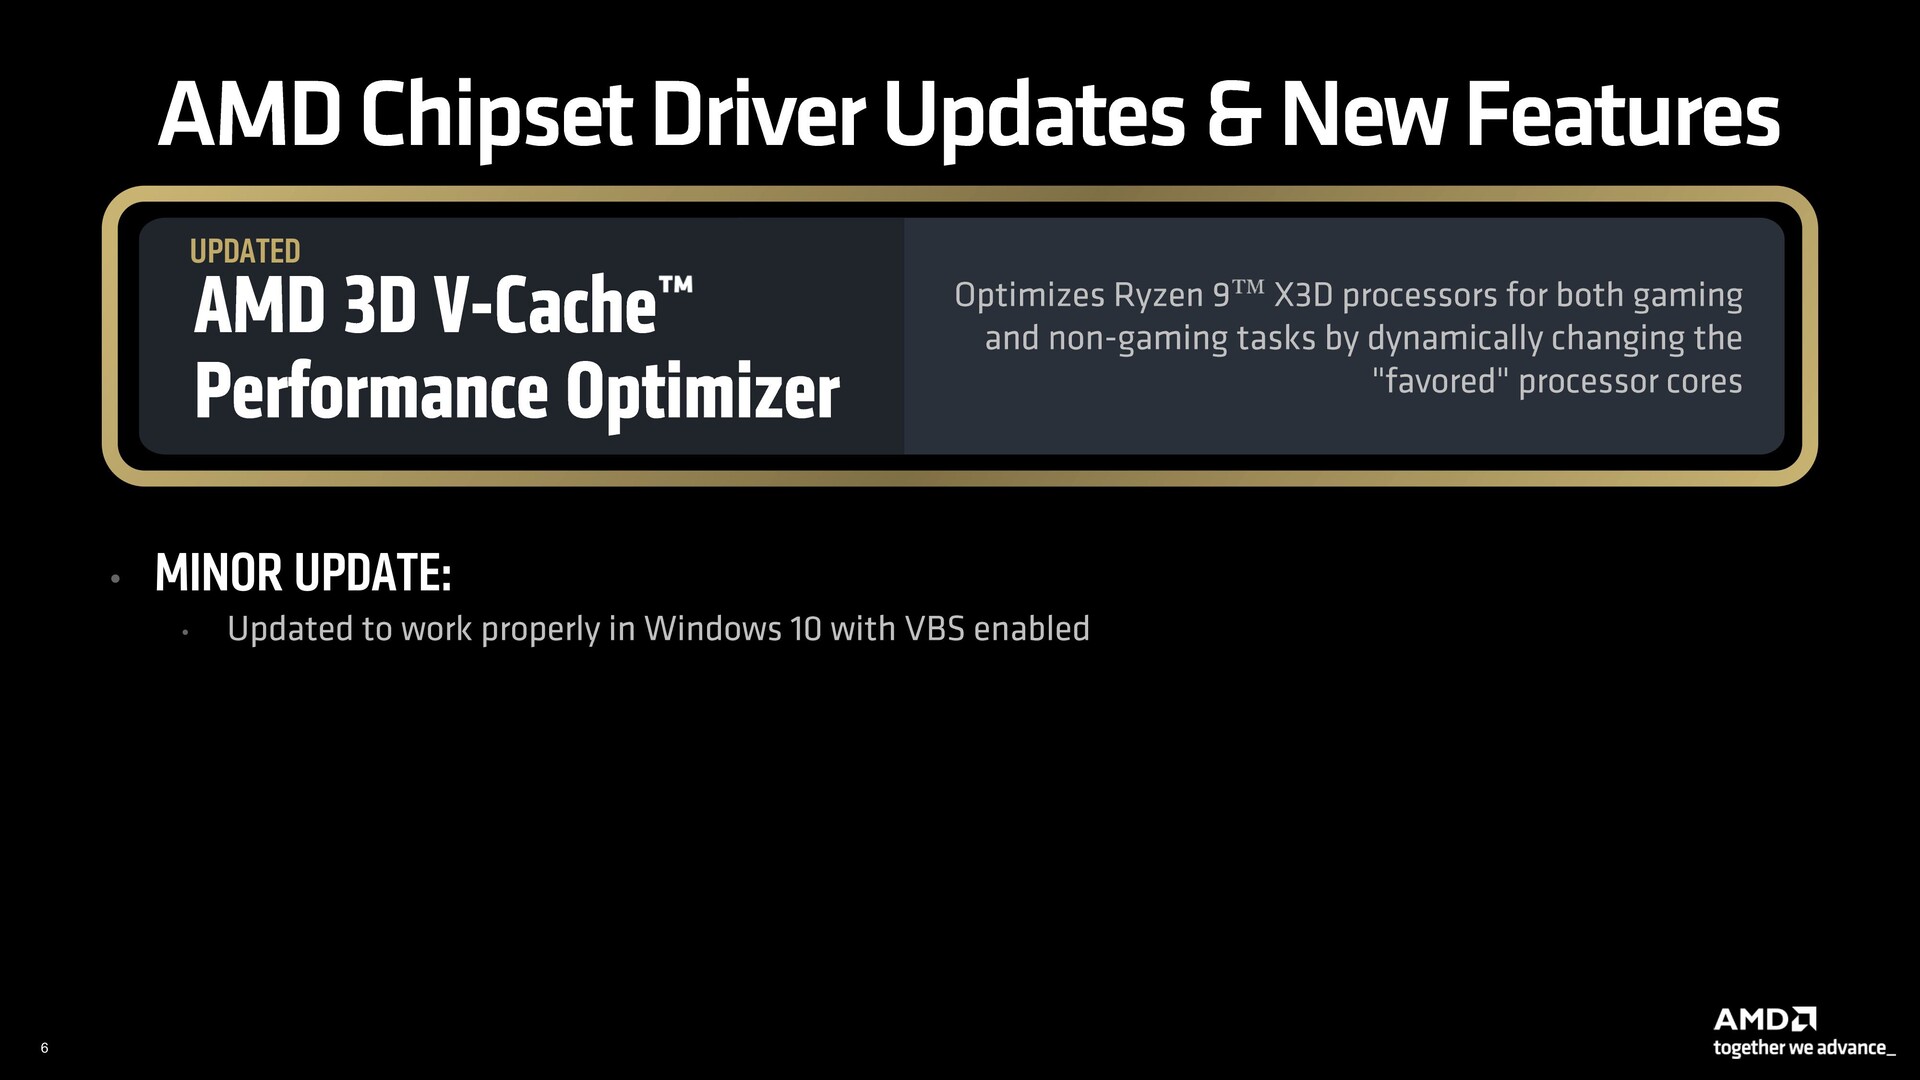
Instalując najnowszy sterownik chipsetu AMD, otrzymują Państwo najnowsze wersje pakietów udostępniania i optymalizatora wydajności 3D V-cache dostępnego wyłącznie w serii Ryzen 9 w celu efektywnego parkowania rdzeni i planowania procesora.
Najnowsze pakiety provisioningu eliminują konieczność ponownej instalacji systemu Windows, jeśli zechcą Państwo zmienić procesor na inny niż X3D lub Ryzen 7 X3D.
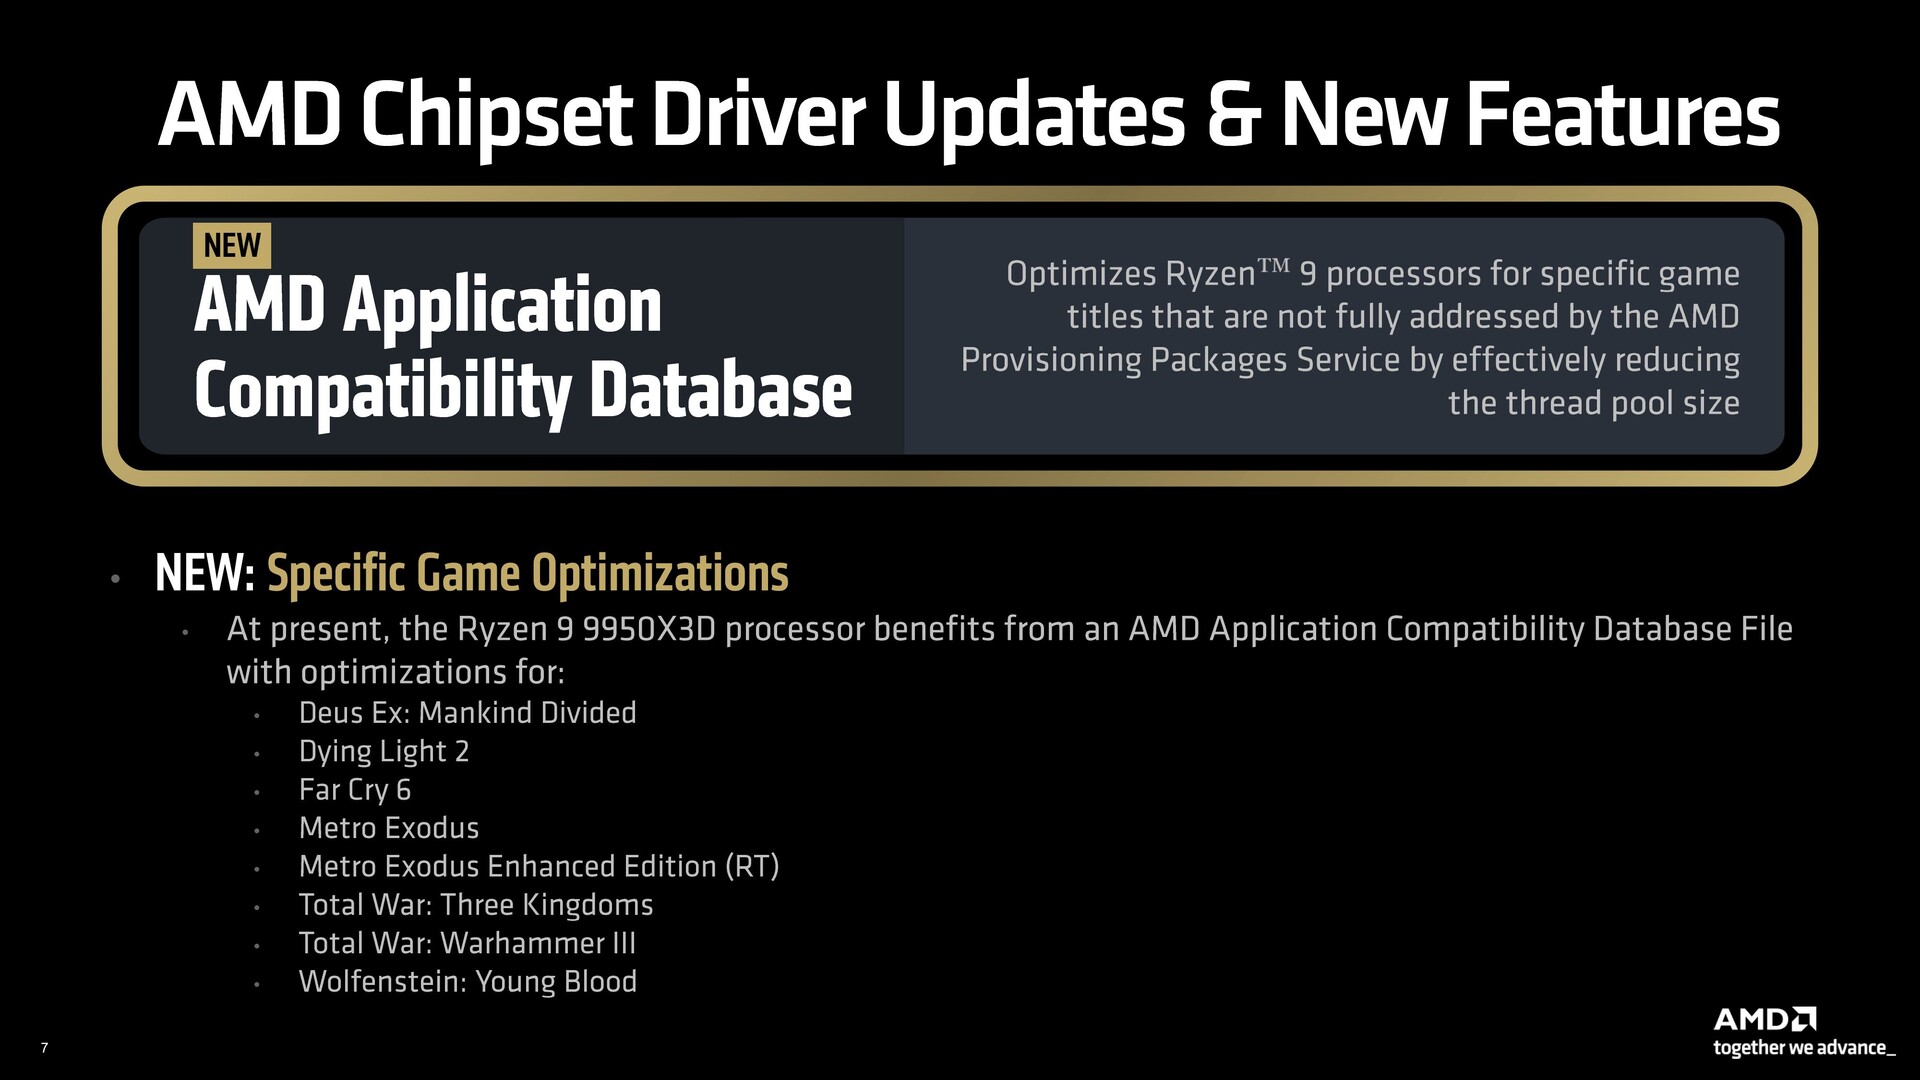
Nowością w tej generacji jest baza danych kompatybilności aplikacji AMD, która optymalizuje wydajność procesora Ryzen 9 X3D w wybranych tytułach, które nie są jeszcze w stanie wykorzystać zaktualizowanych pakietów aprowizacyjnych.
Biorąc to wszystko pod uwagę, procesorowi brakuje bezpośredniej metody identyfikacji, czy program powinien zostać sklasyfikowany jako gra, a tym samym przypisany do X3D CCD.
Zamiast tego sterowniki AMD opierają się na logice Microsoftu, oferując funkcję Game Bar po wykryciu gry, wykorzystując tę wskazówkę do odpowiedniego zaparkowania rdzeni.
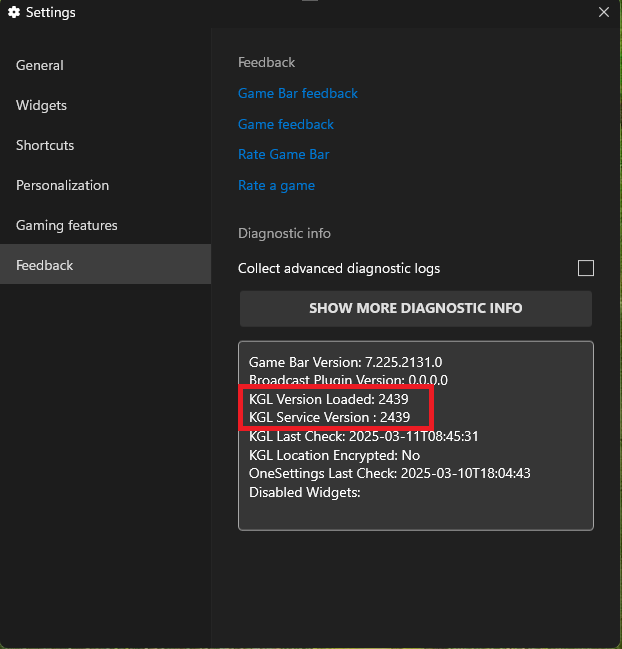
Dlatego też, aby uzyskać optymalną funkcjonalność X3D, konieczne jest posiadanie najnowszej wersji Game Bar wraz z KGL w wersji 2400 lub nowszej.
Stanowisko testowe: Ryzen 9 9950X3D i GeForce RTX 4090 tworzą zgraną parę
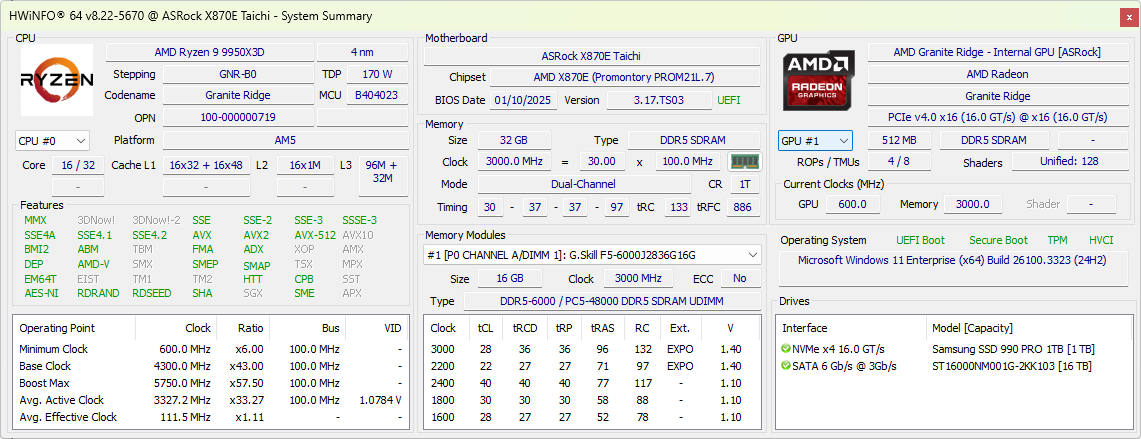
Nasz zestaw testowy AMD Ryzen 9 9950X3D składa się z następujących komponentów:
- Cooler Master MasterFrame 700 open test bench
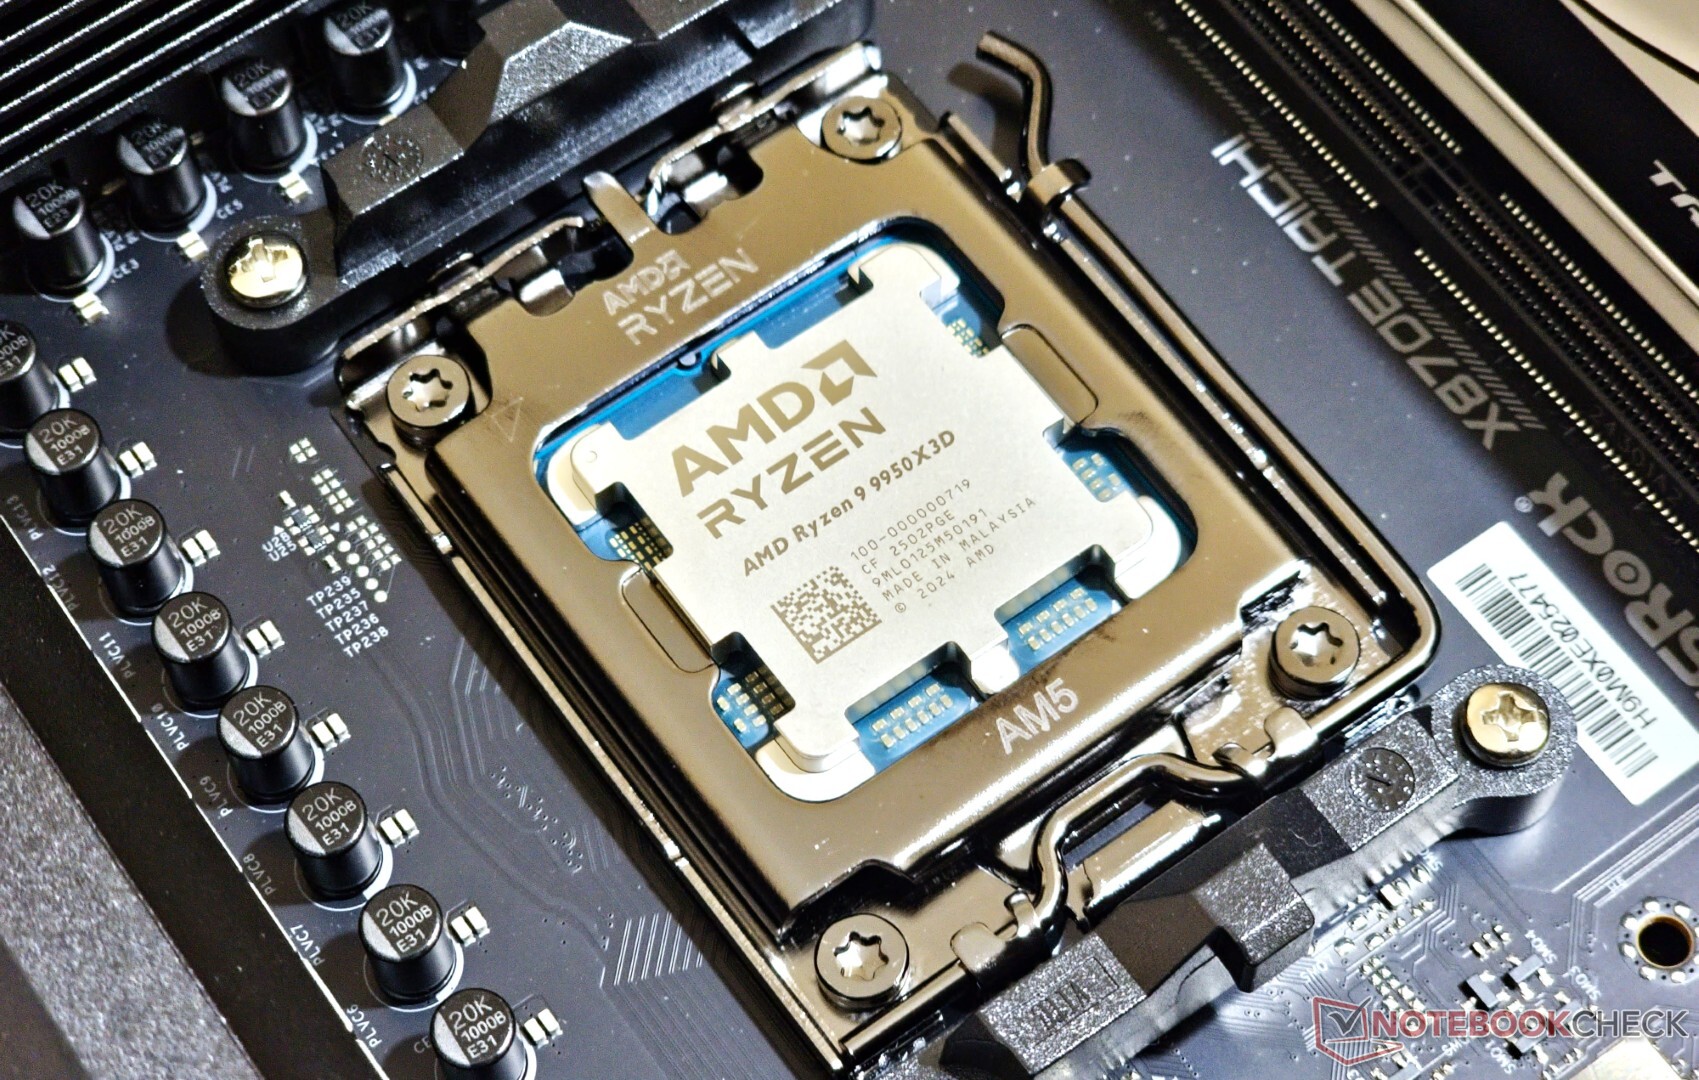
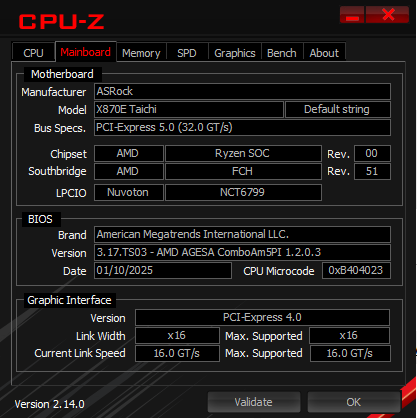
- Płyta główna ASRock X870E Taichi z BIOS-em 3.17.TS03 (AGESA ComboAM5PI 1.2.0.3) udostępnionym prasie
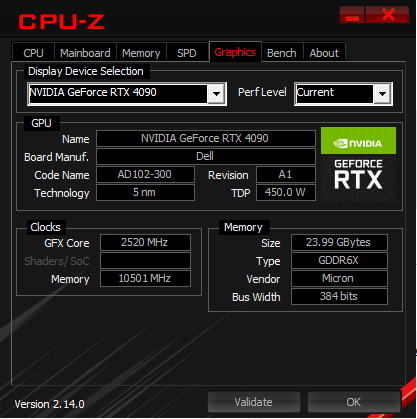
- Nvidia GeForce RTX 4090 Founders Edition GPU
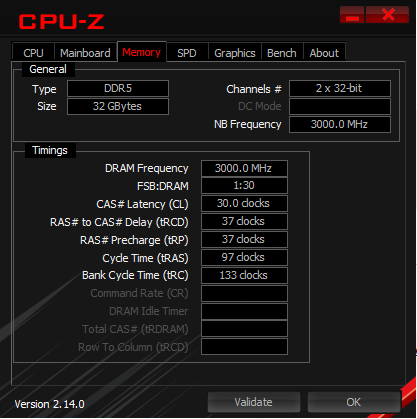
- 2x 16 GB pamięci RAM G.Skill Trident Z5 Neo RGB DDR5-6000 działającej w profilu EXPO-6000 z timingami 30-37-37-97 przy 1,40 V
- Samsung 990 Pro 1 TB PCIe Gen 4 NVMe SSD dla systemu operacyjnego, testów porównawczych i gier
- Monitor Alienware AW3225QF 4K 240 Hz QD-OLED
- Thermaltake TH420 V2 Ultra EX ARGB Chłodnica AiO
- W pełni modularny zasilacz Cooler Master MVE Gold V2 1250 ATX 3.0
Chcielibyśmy podziękować firmie AMD za dostarczenie próbki testowej Ryzen 9 9950X3D, płyty głównej, dysku SSD i pamięci DDR5, firmie Nvidia za kartę graficzną RTX 4090 Founders Edition, firmie Dell za monitor AW3225QF, firmie Thermaltake za model TH420 V2 Ultra EX AIO oraz firmie Cooler Master za stanowisko testowe i zasilacz.
Wszystkie testy zostały przeprowadzone na świeżo zainstalowanym systemie Windows 11 24H2 (kompilacja 26100.3323) wraz ze sterownikami chipsetu AMD 7.01.07.634 udostępnionymi prasie oraz sterownikiem Nvidia Game Ready Driver 572.70.
Biorąc pod uwagę możliwość nieprawidłowego parkowania rdzenia z 3D V-cache na układzie z dwoma procesorami CCD, zastosowaliśmy się do zaleceń AMD dotyczących korzystania ze zrównoważonego profilu zasilania w systemie Windows. VBS został włączony, a wersja KGL została potwierdzona jako 2439 na pasku gier.
Wydajność procesora: W tym samym przedziale co Ryzen 9 9950X i Core Ultra 9 285K
Dodatkowa pamięć podręczna 3D V-cache nie daje AMD Ryzen 9 9950X3D żadnej zauważalnej przewagi nad Ryzenem 9 9950X czy nawet Core Ultra 9 285K w skumulowanych testach porównawczych CPU.
Ryzen 9 9950X3D i Core Ultra 9 285K idą łeb w łeb w jedno- i wielordzeniowych testach Cinebench. Podobny wzorzec widać również w wynikach Geekbench.
Wzrost wydajności pochodzący z Core i9-14900K lub Ryzen 9 7950X3D również nie przekracza 5%. Niemniej jednak, poszczególne wyniki Cinebench pokazują, że Ryzen 9 9950X3D prowadzi Ryzen 9 7950X3D o 10% i 16% odpowiednio w jedno- i wielordzeniowych testach porównawczych Cinebench R23.

| CPU Performance Rating - Percent | |
| AMD Ryzen 9 9950X3D | |
| AMD Ryzen 9 9950X | |
| Intel Core Ultra 9 285K | |
| AMD Ryzen 9 7950X -4! | |
| Intel Core i9-13900K -2! | |
| AMD Ryzen 9 7950X3D -2! | |
| Intel Core i9-14900K -1! | |
| AMD Ryzen 9 9900X -1! | |
| AMD Ryzen 9 7900X -4! | |
| Intel Core i7-14700K | |
| AMD Ryzen 7 9800X3D | |
| AMD Ryzen 7 9700X | |
| Intel Core Ultra 5 245K | |
| Intel Core i9-12900K -3! | |
| Intel Core i5-14600K | |
| AMD Ryzen 7 7800X3D -5! | |
| Intel Core i5-13600K -4! | |
| AMD Ryzen 5 9600X -2! | |
| Intel Core i5-12600K -5! | |
* ... im mniej tym lepiej
Cinebench R15 Multi Loop
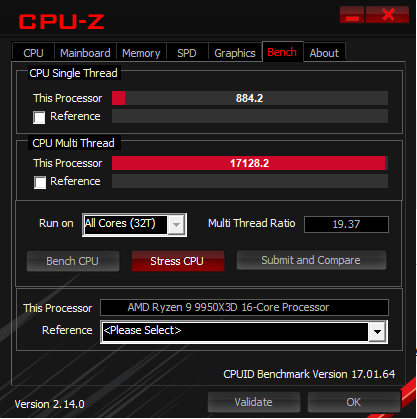
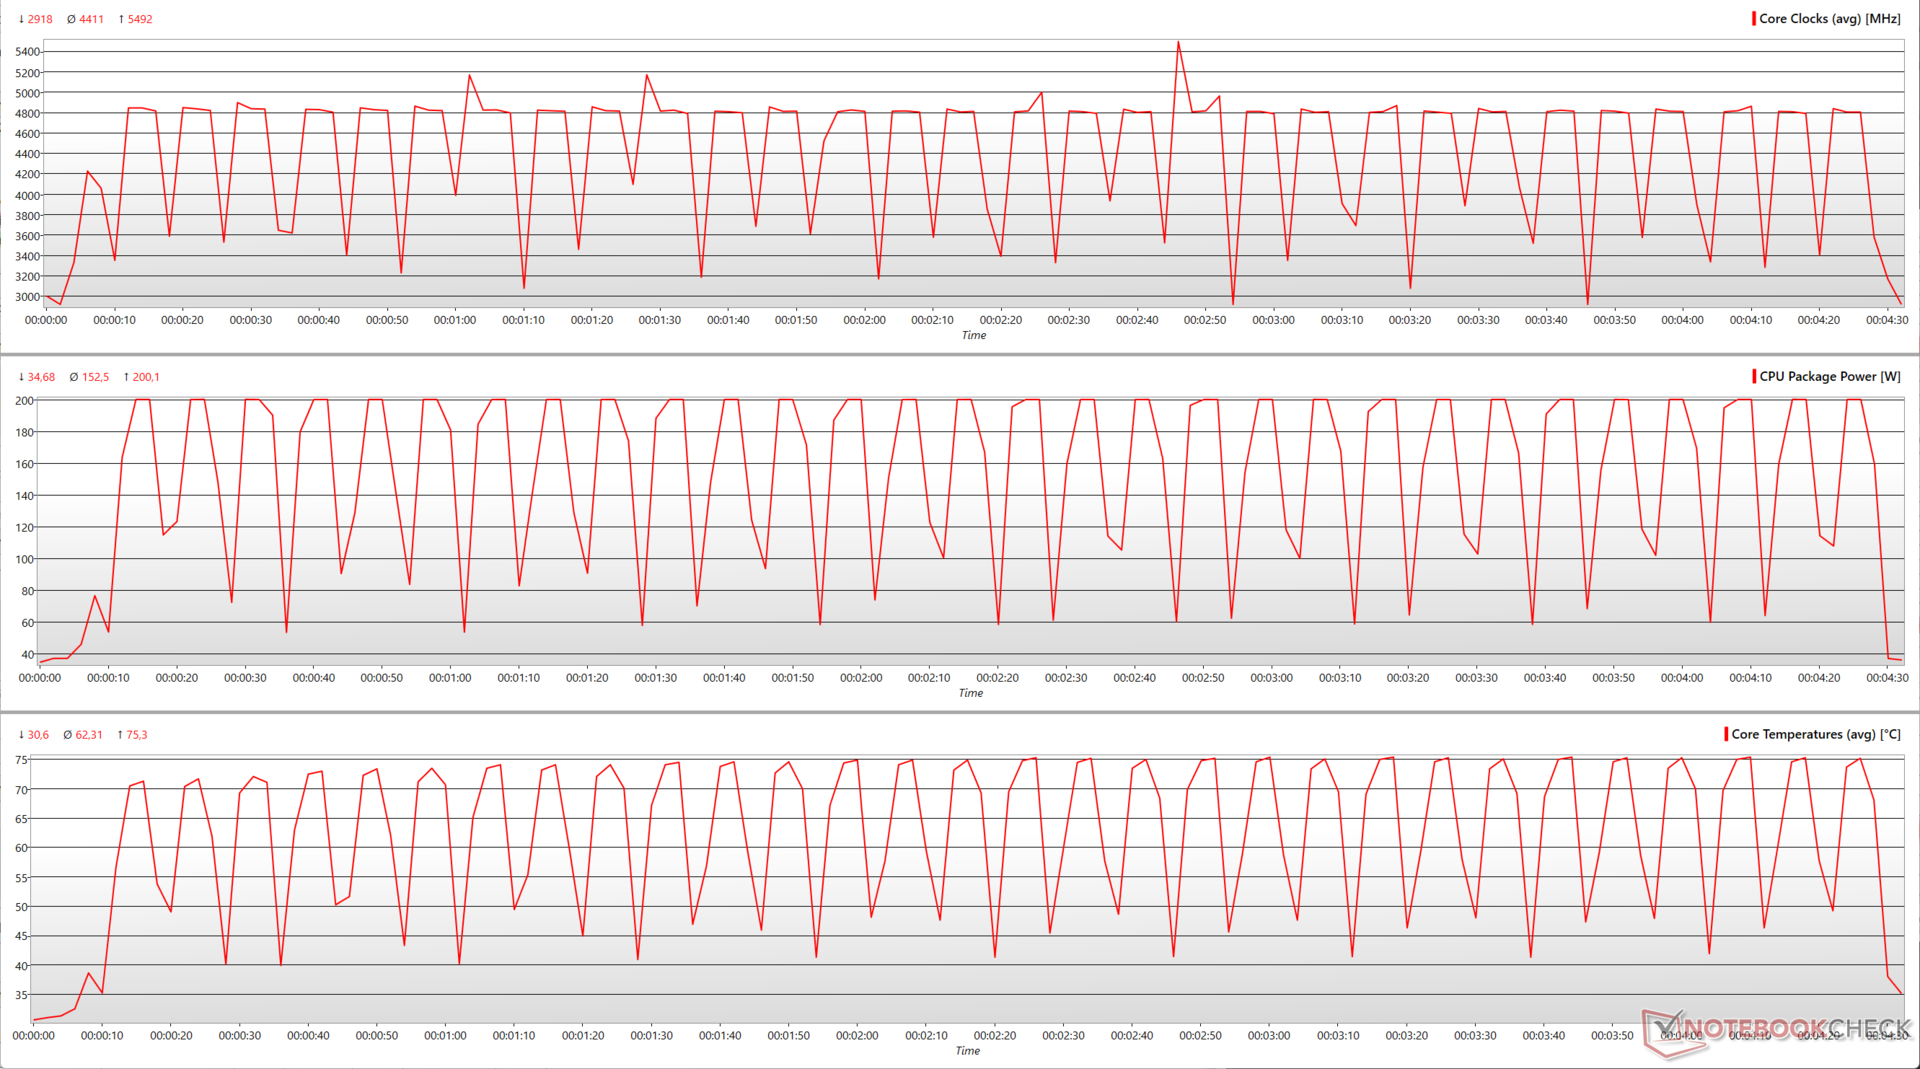
Ryzen 9 9950X3D nie jest dostarczany z coolerem w pudełku. Niemniej jednak, nasz cooler Thermaltake TH420 V2 Ultra EX AiO zarządza wydajnym odprowadzaniem ciepła z procesora, zapewniając dobrą, stałą wydajność bez dławienia, jak widać na poniższym wykresie wielordzeniowej pętli Cinebench R15.
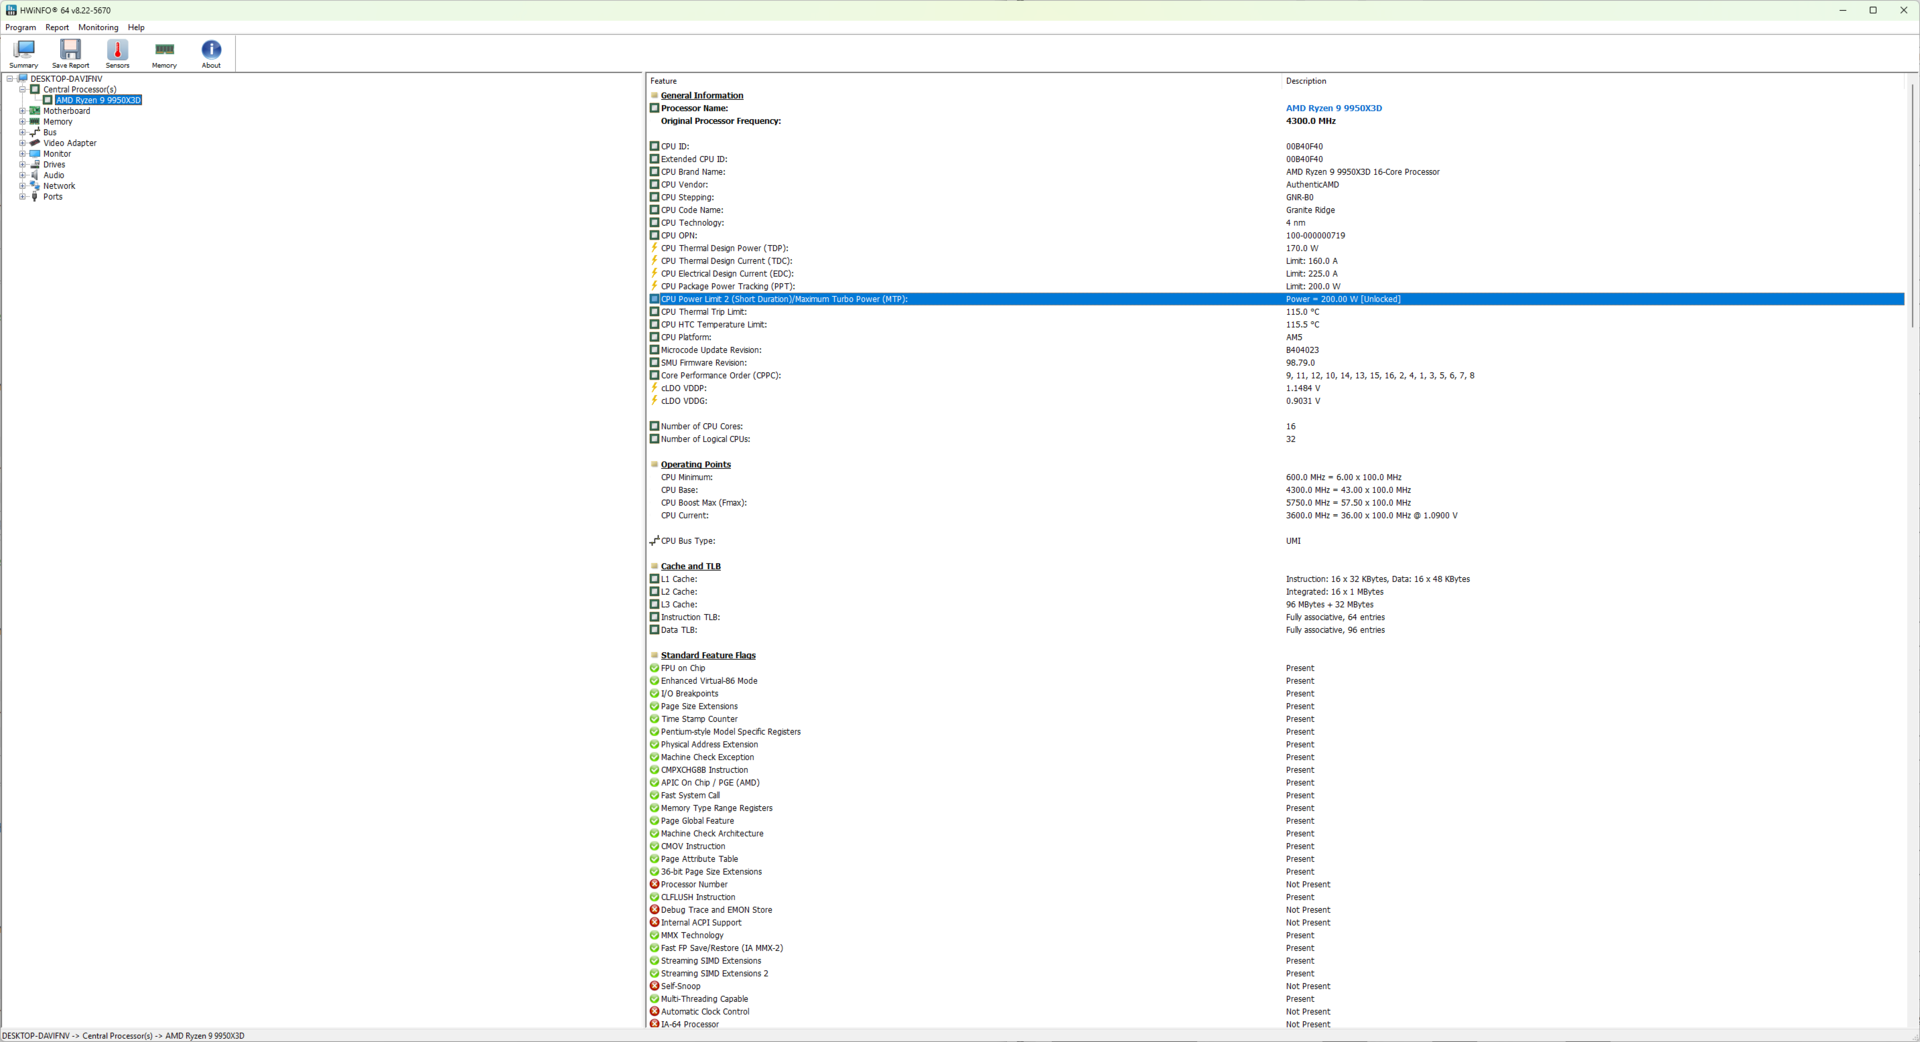
Podczas 30-pętlowego testu wielordzeniowego Cinebench R15 zaobserwowaliśmy, że Ryzen 9 9950X3D może zwiększyć częstotliwość taktowania do 5,5 GHz, co zostało osiągnięte przy szczytowym poborze mocy pakietu wynoszącym 200 W i maksymalnej temperaturze rdzenia 75,3 °C.
Chociaż cTDP wynosi 170 W, Ryzen 9 9950X3D może zużywać do 200 W PPT z gniazda, co jest wartością znacznie wyższą w porównaniu do limitu 162 W dla Ryzena 9 7950X3D.
Wydajność systemu: Wymierne korzyści w porównaniu do Ryzen 9 7950X3D
Procesor Ryzen 9 9950X3D nie poci się podczas obsługi większości zadań związanych z produktywnością. Łącznie widzimy 13% wzrost wydajności Ryzena 9 7950X3D, podczas gdy różnica w stosunku do Core Ultra 9 285K wynosi zaledwie 6%.
Układy Intela mają przewagę w testach CrossMark, gdzie Ryzen 9 9950X3D ustępuje Core i9-14900K o 9%. Wręcz przeciwnie, procesory AMD wygrywają w większości testów CPU AIDA64, z wyjątkiem benchmarku CPU PhotoWorxx.
3DMark 11: 1280x720 Performance Physics
3DMark: 1920x1080 Fire Strike Physics | 2560x1440 Time Spy CPU
CrossMark: Overall | Responsiveness | Creativity | Productivity
PCMark 10: Score | Essentials | Productivity | Digital Content Creation
AIDA64: FP32 Ray-Trace | FPU Julia | CPU SHA3 | CPU Queen | FPU SinJulia | FPU Mandel | CPU AES | CPU ZLib | FP64 Ray-Trace | CPU PhotoWorxx
| System Performance Rating | |
| AMD Ryzen 9 9950X3D | |
| AMD Ryzen 9 9950X | |
| Intel Core i9-14900K | |
| Intel Core Ultra 9 285K | |
| AMD Ryzen 9 7950X | |
| AMD Ryzen 9 9900X | |
| Intel Core i9-13900K | |
| AMD Ryzen 9 7950X3D -2! | |
| Intel Core i7-14700K | |
| AMD Ryzen 9 7900X | |
| AMD Ryzen 7 9800X3D | |
| AMD Ryzen 7 9700X | |
| Intel Core i5-14600K | |
| AMD Ryzen 7 7800X3D | |
| Intel Core i5-13600K | |
| AMD Ryzen 5 9600X | |
| Intel Core Ultra 5 245K | |
| Intel Core i9-12900K -4! | |
| Intel Core i5-12600K -4! | |
3DMark 11: 1280x720 Performance Physics
3DMark: 1920x1080 Fire Strike Physics | 2560x1440 Time Spy CPU
CrossMark: Overall | Responsiveness | Creativity | Productivity
PCMark 10: Score | Essentials | Productivity | Digital Content Creation
AIDA64: FP32 Ray-Trace | FPU Julia | CPU SHA3 | CPU Queen | FPU SinJulia | FPU Mandel | CPU AES | CPU ZLib | FP64 Ray-Trace | CPU PhotoWorxx
| PCMark 10 Score | 10843 pkt. | |
Pomoc | ||
Wykorzystaliśmy stronę MicroBenchX do oceny opóźnień międzyrdzeniowych w Ryzen 9 9950X3D z wyłączonym SMT. Zmierzyliśmy średnie opóźnienie wynoszące 54,6 ns dla obu CCD.
Jednak transmisja danych pomiędzy CCD0 i CCD1 może trwać dość długo, do 87,5 ns. Z kolei opóźnienia wewnątrzrdzeniowe w ramach tego samego CCD były minimalne, a najkrótszy czas wynosił 16,5 ns między rdzeniem 11 a rdzeniem 9 w CCD1.
| Core 0 | Core 1 | Core 2 | Core 3 | Core 4 | Core 5 | Core 6 | Core 7 | Core 8 | Core 9 | Core 10 | Core 11 | Core 12 | Core 13 | Core 14 | Core 15 | |
|---|---|---|---|---|---|---|---|---|---|---|---|---|---|---|---|---|
| Core 0 | 24 | 22.3 | 22.8 | 21.3 | 19.8 | 21.3 | 22 | 85.3 | 84.8 | 87.5 | 86.3 | 85.5 | 82.8 | 83 | 83.5 | |
| Core 1 | 24 | 22.5 | 20.3 | 21.3 | 21.3 | 20.5 | 21.5 | 83.3 | 84 | 86 | 85.8 | 82.5 | 84.3 | 84 | 85.8 | |
| Core 2 | 22.3 | 22.5 | 21.3 | 20.8 | 21.3 | 21.3 | 22 | 85.8 | 83.5 | 84.3 | 84 | 83.8 | 84.8 | 84 | 83 | |
| Core 3 | 22.8 | 20.3 | 21.3 | 21.3 | 22.5 | 23 | 20.8 | 83.3 | 82.5 | 84.5 | 85.8 | 84 | 83 | 85 | 83.8 | |
| Core 4 | 21.3 | 21.3 | 20.8 | 21.3 | 22.5 | 21 | 19.5 | 83 | 86.8 | 85 | 85.3 | 84.5 | 84 | 84 | 83 | |
| Core 5 | 19.8 | 21.3 | 21.3 | 22.5 | 22.5 | 22.5 | 21 | 84.3 | 80.5 | 84.5 | 81.5 | 85.8 | 84.3 | 85 | 84 | |
| Core 6 | 21.3 | 20.5 | 21.3 | 23 | 21 | 22.5 | 22.5 | 85.8 | 84.5 | 86 | 83.5 | 84.8 | 85 | 84.5 | 84 | |
| Core 7 | 22 | 21.5 | 22 | 20.8 | 19.5 | 21 | 22.5 | 83 | 82.3 | 83.8 | 84.8 | 85.5 | 85.8 | 84.3 | 85 | |
| Core 8 | 85.3 | 83.3 | 85.8 | 83.3 | 83 | 84.3 | 85.8 | 83 | 19.8 | 20.5 | 19.3 | 21 | 20 | 20.5 | 19 | |
| Core 9 | 84.8 | 84 | 83.5 | 82.5 | 86.8 | 80.5 | 84.5 | 82.3 | 19.8 | 19.5 | 16.5 | 18.3 | 19.8 | 19.3 | 19.8 | |
| Core 10 | 87.5 | 86 | 84.3 | 84.5 | 85 | 84.5 | 86 | 83.8 | 20.5 | 19.5 | 17.8 | 20.8 | 21.3 | 22 | 20.3 | |
| Core 11 | 86.3 | 85.8 | 84 | 85.8 | 85.3 | 81.5 | 83.5 | 84.8 | 19.3 | 16.5 | 17.8 | 21.5 | 19.3 | 19 | 19.5 | |
| Core 12 | 85.5 | 82.5 | 83.8 | 84 | 84.5 | 85.8 | 84.8 | 85.5 | 21 | 18.3 | 20.8 | 21.5 | 19.3 | 19 | 23 | |
| Core 13 | 82.8 | 84.3 | 84.8 | 83 | 84 | 84.3 | 85 | 85.8 | 20 | 19.8 | 21.3 | 19.3 | 19.3 | 21.8 | 16.8 | |
| Core 14 | 83 | 84 | 84 | 85 | 84 | 85 | 84.5 | 84.3 | 20.5 | 19.3 | 22 | 19 | 19 | 21.8 | 20 | |
| Core 15 | 83.5 | 85.8 | 83 | 83.8 | 83 | 84 | 84 | 85 | 19 | 19.8 | 20.3 | 19.5 | 23 | 16.8 | 20 |
| AIDA64 Memory Performance Rating - Percent | |
| Intel Core i9-12900K -1! | |
| Intel Core i9-14900K | |
| Intel Core i7-14700K | |
| Intel Core i5-12600K -1! | |
| Intel Core i5-14600K | |
| Intel Core Ultra 9 285K | |
| AMD Ryzen 9 7950X3D | |
| AMD Ryzen 9 7950X | |
| AMD Ryzen 9 9950X | |
| Intel Core i9-13900K | |
| AMD Ryzen 9 9900X | |
| AMD Ryzen 9 7900X | |
| AMD Ryzen 9 9950X3D | |
| AMD Ryzen 7 7800X3D | |
| Intel Core i5-13600K | |
| AMD Ryzen 7 9700X | |
| AMD Ryzen 5 9600X | |
| AMD Ryzen 7 9800X3D | |
| Intel Core Ultra 5 245K | |
* ... im mniej tym lepiej
wydajność 3D i w grach: Gnaws right at the Ryzen 7 9800X3D's heels
Z jakiegoś powodu Ryzen 9 9950X3D wypada raczej słabo w testach graficznych 3DMark. Widzieliśmy to już wcześniej w przypadku Ryzena 9 7950X3D i Core Ultra 9 285K, ale najnowszy procesor AMD Zen 5 wypada jeszcze gorzej.
| 3DMark 11 Performance | 68617 pkt. | |
| 3DMark Fire Strike Score | 59444 pkt. | |
| 3DMark Time Spy Score | 28882 pkt. | |
Pomoc | ||
granie w rozdzielczości 720p może być już passé, ale nadal ma sens testowanie w tej rozdzielczości, aby sprawdzić, czy procesor stanowi wąskie gardło w grach.
W wysoce ograniczonych przez procesor rozdzielczościach, Ryzen 9 9950X3D jest bardzo blisko panującego mistrza gier, Ryzena 7 9800X3D, w skumulowanych testach gier w 720p Low, 1080p Low i 1080p Ultra.
Ryzen 9 9950X3D jest ogólnie o 10% szybszy niż Core i9-14900K, a dobre wyniki można zaobserwować w takich tytułach jak Borderlands 3, Shadow of the Tomb Raider, Far Cry 5i Metro Exodus (wersja bez ulepszeń).
| CPU Limit Gaming Performance Rating - Percent | |
| AMD Ryzen 7 9800X3D | |
| AMD Ryzen 9 9950X3D | |
| AMD Ryzen 7 7800X3D | |
| AMD Ryzen 9 7950X3D | |
| Intel Core i9-14900K | |
| AMD Ryzen 7 9700X | |
| AMD Ryzen 9 9900X | |
| AMD Ryzen 5 9600X | |
| AMD Ryzen 9 9950X -2! | |
| Intel Core i5-14600K | |
| Intel Core Ultra 9 285K | |
| Intel Core i7-14700K | |
| Intel Core Ultra 5 245K | |
W wyższych rozdzielczościach Ryzen 7 7800X3D zyskuje niewielką przewagę nad Ryzenem 9 9950X3D. Ryzen 9 9950X3D i Core i9-14900K generują w dużej mierze podobne średnie liczby klatek na sekundę w skumulowanych grach QHD i 4K.
Obecność pamięci podręcznej 3D V pomaga jednak w lepszych spadkach o 1% i 0,1%, co powinno zapewnić znacznie płynniejszą rozgrywkę przy tych ustawieniach.
| QHD and 4K Gaming Performance Rating - Percent | |
| AMD Ryzen 7 9800X3D | |
| AMD Ryzen 7 7800X3D | |
| AMD Ryzen 9 9950X3D | |
| AMD Ryzen 9 7950X3D | |
| Intel Core i9-14900K | |
| Intel Core i5-14600K | |
| AMD Ryzen 9 9900X | |
| AMD Ryzen 7 9700X | |
| AMD Ryzen 5 9600X | |
| AMD Ryzen 9 9950X -2! | |
| Intel Core i7-14700K | |
| Intel Core Ultra 9 285K | |
| Intel Core Ultra 5 245K | |
| low | med. | high | ultra | QHD DLSS | QHD | 4K DLSS | 4K | |
|---|---|---|---|---|---|---|---|---|
| The Witcher 3 (2015) | 839 | 790 | 638 | 290 | 247 | 274 | ||
| Dota 2 Reborn (2015) | 370.5 | 329.9 | 322.9 | 280.5 | 275.6 | |||
| Final Fantasy XV Benchmark (2018) | 236 | 237 | 234 | 222 | 160.1 | |||
| X-Plane 11.11 (2018) | 233 | 220 | 189.3 | 153.9 | ||||
| Far Cry 5 (2018) | 348 | 310 | 302 | 287 | 274 | 179 | ||
| Strange Brigade (2018) | 680 | 575 | 565 | 552 | 499 | 276 | ||
| Shadow of the Tomb Raider (2018) | 407 | 386 | 381 | 365 | 312 | 180 | ||
| Metro Exodus (2019) | 458 | 337 | 281 | 226 | 194.1 | 132.7 | ||
| Borderlands 3 (2019) | 330 | 294 | 270 | 248 | 223 | 131.2 | ||
| F1 22 (2022) | 498 | 541 | 458 | 219 | 158.5 | 83.3 | ||
| Baldur's Gate 3 (2023) | 453 | 365 | 317 | 316 | 237 | 207 | 137.6 | |
| Cyberpunk 2077 2.2 Phantom Liberty (2023) | 261 | 262 | 238 | 212 | 165 | 148.7 | 130 | 73.4 |
| Assassin's Creed Mirage (2023) | 298 | 272 | 264 | 214 | 181 | 158 | 126 | |
| F1 24 (2024) | 501 | 547 | 519 | 239 | 169.4 | 146.7 | 90.5 | |
| Black Myth: Wukong (2024) | 212 | 163 | 130 | 84 | 92 | 68 | 70 | 42 |
Pobór mocy: Przewyższa Core Ultra 9 285K pod względem wydajności wielordzeniowej
Pomimo dodanej pamięci podręcznej 3D V-cache, Ryzen 9 9950X3D i Ryzen 9 9950X wykazują mniej więcej podobny pobór mocy w jedno- i wielordzeniowych testach Cinebench.
Niemniej jednak, Ryzen 9 9950X3D nadal jest mistrzem wydajności z aż o 44% niższym zużyciem energii niż Core i9-14900K w Cinebench R15 multi.
Power Consumption: External monitor
| Power Consumption / Cinebench R15 Multi (external Monitor) | |
| Intel Core i9-14900K, NVIDIA GeForce RTX 4090 | |
| Intel Core i7-14700K, NVIDIA GeForce RTX 4090 | |
| Intel Core Ultra 9 285K, NVIDIA GeForce RTX 4090 (Idle: 76.2 W) | |
| Intel Core i5-14600K, NVIDIA GeForce RTX 4090 | |
| AMD Ryzen 9 9950X, NVIDIA GeForce RTX 4090 (Idle: 100 W) | |
| AMD Ryzen 9 9950X3D, NVIDIA GeForce RTX 4090 | |
| AMD Ryzen 9 9900X, NVIDIA GeForce RTX 4090 (Idle: 85.1 W) | |
| AMD Ryzen 9 7950X3D, NVIDIA GeForce RTX 4090 | |
| Intel Core Ultra 5 245K, NVIDIA GeForce RTX 4090 | |
| AMD Ryzen 7 9800X3D, NVIDIA GeForce RTX 4090 | |
| AMD Ryzen 5 9600X, NVIDIA GeForce RTX 4090 | |
| AMD Ryzen 7 7800X3D, NVIDIA GeForce RTX 4090 | |
| AMD Ryzen 7 9700X, NVIDIA GeForce RTX 4090 (Idle: 83 W) | |
* ... im mniej tym lepiej
Intel poczynił pewne znaczące postępy w zakresie wydajności dzięki Arrow Lake-S, ale Ryzen 9 9950X3D i inne procesory Zen 5 nadal mają przewagę w zakresie wielordzeniowej efektywności energetycznej.
W testach wielordzeniowych Cinebench Ryzen 9 9950X3D osiąga nawet o 5% wyższą wydajność energetyczną w porównaniu do Ryzena 9 9950X.
Oba procesory są remisowe, jeśli chodzi o gry w The Witcher 3 w rozdzielczości 1080p Ultra, ale Core Ultra 9 285K jest pod tym względem o 10% wydajniejszy.
Wrażenia Notebookcheck dotyczące AMD Ryzen 9 9950X3D
AMD Ryzen 9 9950X3D wprowadza pamięć podręczną 3D V-cache do flagowej 16-rdzeniowej, 32-wątkowej części. Podczas gdy dodanie pamięci podręcznej 3D V-cache pomaga Ryzenowi 9 9950X3D dorównać czcigodnemu Ryzenowi 7 9800X3D w tytułach z ograniczonym procesorem, korzyści w wyższych rozdzielczościach nie stają się od razu widoczne.
Niezależnie od faktu, że będą Państwo musieli wyłożyć dodatkowe 50 USD ponad SEP Ryzena 9 9950X za niewielki lub żaden wzrost wydajności lub efektywności.
Przezroczystość
Wyboru urządzeń do recenzji dokonuje nasza redakcja. Próbka testowa została udostępniona autorowi jako pożyczka od producenta lub sprzedawcy detalicznego na potrzeby tej recenzji. Pożyczkodawca nie miał wpływu na tę recenzję, producent nie otrzymał też kopii tej recenzji przed publikacją. Nie było obowiązku publikowania tej recenzji. Nigdy nie przyjmujemy rekompensaty ani płatności w zamian za nasze recenzje. Jako niezależna firma medialna, Notebookcheck nie podlega władzy producentów, sprzedawców detalicznych ani wydawców.
Tak testuje Notebookcheck
Każdego roku Notebookcheck niezależnie sprawdza setki laptopów i smartfonów, stosując standardowe procedury, aby zapewnić porównywalność wszystkich wyników. Od około 20 lat stale rozwijamy nasze metody badawcze, ustanawiając przy tym standardy branżowe. W naszych laboratoriach testowych doświadczeni technicy i redaktorzy korzystają z wysokiej jakości sprzętu pomiarowego. Testy te obejmują wieloetapowy proces walidacji. Nasz kompleksowy system ocen opiera się na setkach uzasadnionych pomiarów i benchmarków, co pozwala zachować obiektywizm.
