


Recenzja Dell Pro 13 Premium: Prawie idealny laptop biznesowy
Laptop "Promium".
Korzystamy z okazji, aby zrecenzować 13-calowy laptop biznesowy z linii produktów Dell. Skierowany do wymagających użytkowników biznesowych i zaprojektowany z myślą o przedsiębiorcach z nowoczesnymi portami, Dell Pro 13 Premium ma solidną, ale lekką magnezową obudowę, AI, a także cieszy się bardzo długimi czasami pracy na baterii.Christian Hintze, 👁 Christian Hintze (tłumaczenie DeepL / Ninh Duy) Opublikowany 🇺🇸 🇩🇪 ...
Werdykt - Prawie kompletny laptop biznesowy
Dell Pro 13 Premium to świetny laptop biznesowy, który nie ma praktycznie żadnych słabych stron, ale za to mnóstwo pozytywnych cech, dzięki którym ten mobilny laptop otrzymał nasze wyróżnienie. Pracownicy korporacyjni i inni potencjalni nabywcy otrzymują kompaktowy, mały, lekki, ekonomiczny, wyjątkowo długo działający (24 godziny!) i wydajny laptop z wysokiej jakości magnezową obudową, kamerą internetową o wysokiej rozdzielczości 8 MP i nowoczesnymi interfejsami, takimi jak podwójny Thunderbolt 4 i Wi-Fi 7. Co więcej, laptop pozostaje niezmiennie chłodny w praktycznie każdej sytuacji.
Wiąże się to jednak z kosztami - cena laptopa wynosi od 1900 do 2500 dolarów! Mając to na uwadze, kiepski dysk SSD M.2 2230 jest prawie skandaliczny, ale w codziennych sytuacjach prawie nie zauważysz różnicy. Jedynymi obszarami, w których wymagane są ulepszenia, są nazwa i możliwość aktualizacji.
Za
Przeciw
Cena i dostępność
Recenzowany przez nas model wyposażony jest w wyświetlacz FHD+ i kosztuje około 2100 USD w sklepie internetowym Dell.
- $29.99Smatree Hard EVA Protective Sleeve Compatible for 13.3 inch Dell Pro 13 Premium (PA13250), for 13 inch DELL Latitude 7350/7320 Detachable, for 12 inch DELL Latitude 7230 Rugged Extreme Tablet (X8016)
- $49.99Smatree 13 inch Laptop Sleeve for DELL Pro 13 Premium PA13250, Protective Laptop Case with Accessory Pocket, YKK Zipper, Patented Shockproof Design (E431)
Porównanie możliwych alternatyw
Obraz | Model / recenzja | Cena | Waga | Wysokość | Ekran |
|---|---|---|---|---|---|
1. 89.9%  | Dell Pro 13 Premium PA13250 Intel Core Ultra 7 268V ⎘ Intel Arc Graphics 140V ⎘ 32 GB Pamięć, 1024 GB SSD | Amazon: 1. $39.99 Smatree Hard Shell Laptop Ca... 2. $29.99 Smatree Hard EVA Protective ... 3. $49.99 Smatree 13 inch Laptop Sleev... Cena katalogowa: 2700 Euro | 1.1 kg | 17.2 mm | 13.30" 1920x1200 170 PPI IPS |
2. 85%  | MSI Prestige 13 AI Plus Evo A2VMG Intel Core Ultra 7 258V ⎘ Intel Arc Graphics 140V ⎘ 32 GB Pamięć | Amazon: $1,349.99 Cena katalogowa: 1400 USD | 970 g | 16.9 mm | 13.30" 2880x1800 255 PPI OLED |
3. 85.1%  | Lenovo ThinkPad X13 2-in-1 Gen 5 Intel Core Ultra 7 165U ⎘ Intel Graphics 4-Core iGPU (Arc) ⎘ 32 GB Pamięć, 1000 GB SSD | Amazon: $1,601.95 Cena katalogowa: 2107.23 Euro | 1.3 kg | 16.4 mm | 13.30" 1920x1200 170 PPI IPS |
4. 84%  | Framework Laptop 13.5 Core Ultra 7 155H Intel Core Ultra 7 155H ⎘ Intel Arc 8-Core iGPU ⎘ 32 GB Pamięć | Cena katalogowa: 1500 USD | 1.4 kg | 15.85 mm | 13.50" 2880x1920 256 PPI IPS |
5. 85.3%  | Dell XPS 13 9350 Intel Core Ultra 7 256V ⎘ Intel Arc Graphics 140V ⎘ 16 GB Pamięć, 512 GB SSD | Amazon: 1. $1,499.99 2025 Latest Dell XPS 13 9350... 2. $1,699.00 NewDell XPS 13 9350 Powerful... 3. $1,599.99 Dell XPS 13 9340 Business La... Cena katalogowa: 1400 USD | 1.2 kg | 15.3 mm | 13.40" 1920x1200 169 PPI IPS |
6. 80.7%  | Microsoft Surface Pro Copilot+ Qualcomm Snapdragon X Plus X1P-64-100 ⎘ Qualcomm SD X Adreno X1-85 3.8 TFLOPS ⎘ 16 GB Pamięć, 256 GB SSD | Amazon: $1,079.99 Cena katalogowa: 1199€ | 872 g | 9.3 mm | 13.00" 2880x1920 266 PPI IPS |
Spis treści
- Werdykt - Prawie kompletny laptop biznesowy
- Specyfikacje
- Obudowa i funkcje - ten Dell jest wyposażony w kamerę internetową 8 MP
- Urządzenia wejściowe - 13 Premium ma touchpad do połączeń konferencyjnych
- Wyświetlacz - panel biurowy o wysokim kontraście z dodatkowymi opcjami
- Wydajność - mocny łuk 140 V
- Emisje i energia - Dell Pro jest ekonomiczny
- Ogólna ocena Notebookcheck
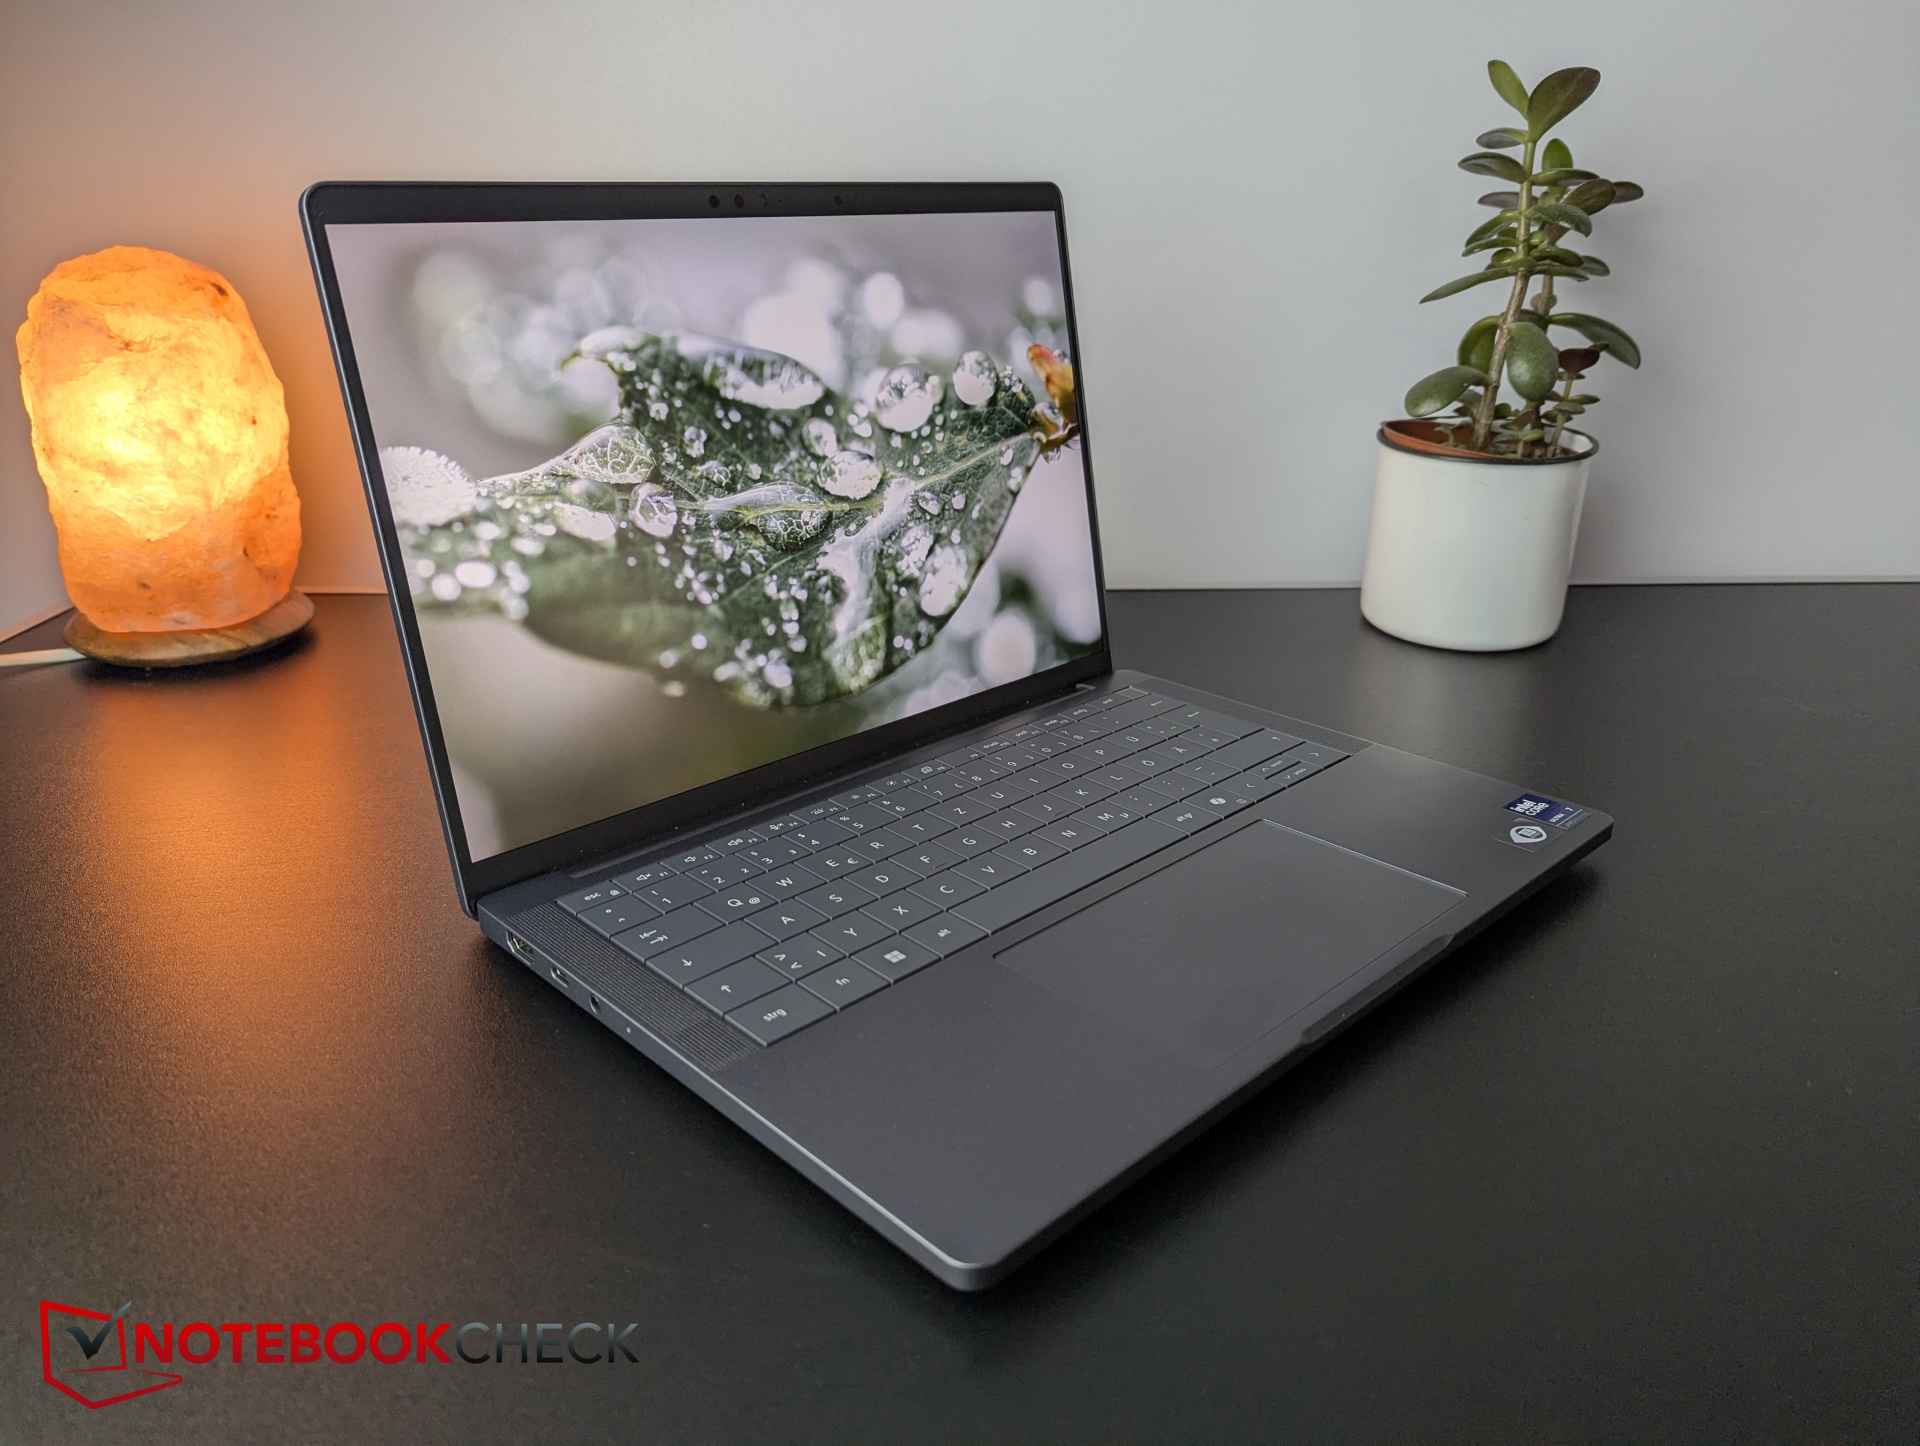
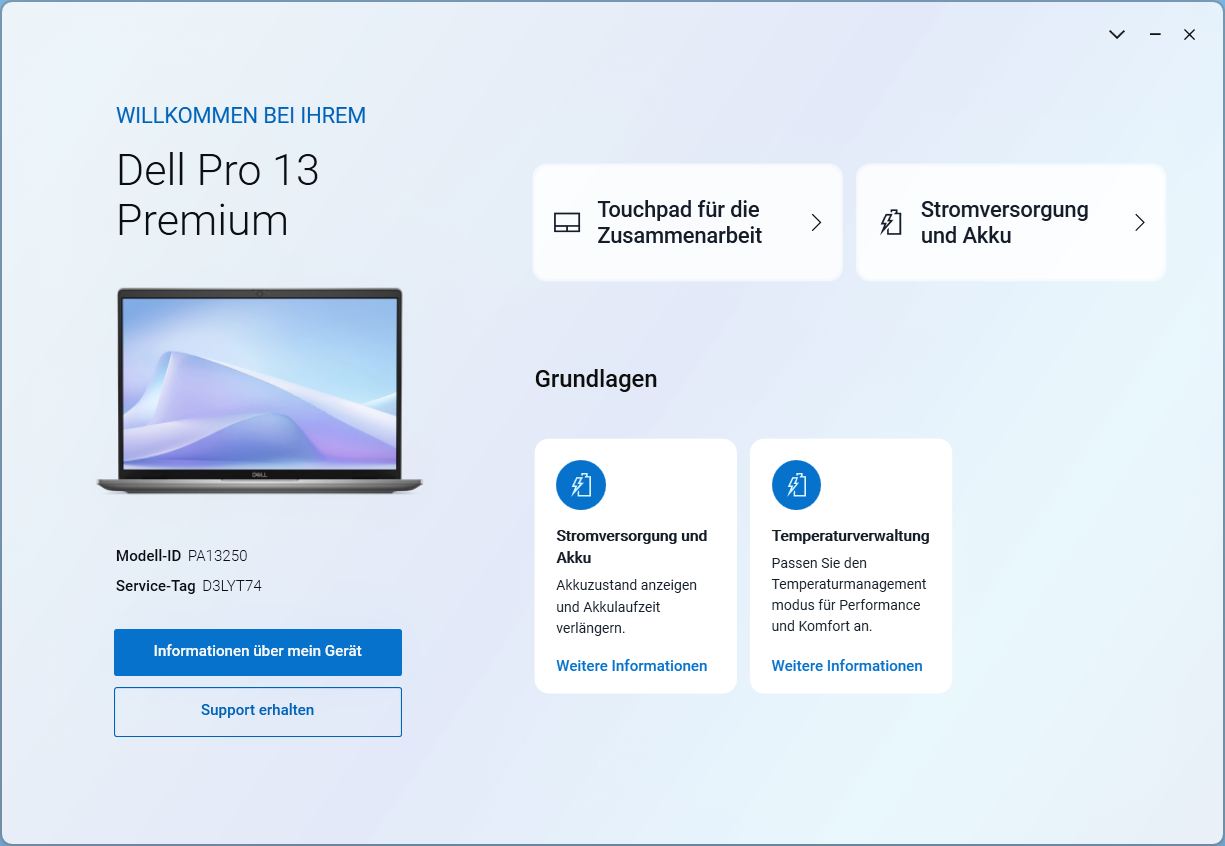
Firma Dell niedawno zmieniła swój schemat nazewnictwa. Wraz z serią Pro, Dell celuje w typowego użytkownika biznesowego, zasadniczo zastępując poprzednią serię Latitude. Premium oznacza najlepsze materiały i funkcje, a nasz obecny 13-calowy model jest wyposażony w nowoczesne porty, rozbudowane zabezpieczenia, mnóstwo sztucznej inteligencji, solidną magnezową obudowę, a mimo to waży nieco ponad 1 kg. Czy jest to więc laptop klasy premium dla użytkowników biznesowych?
Specyfikacje
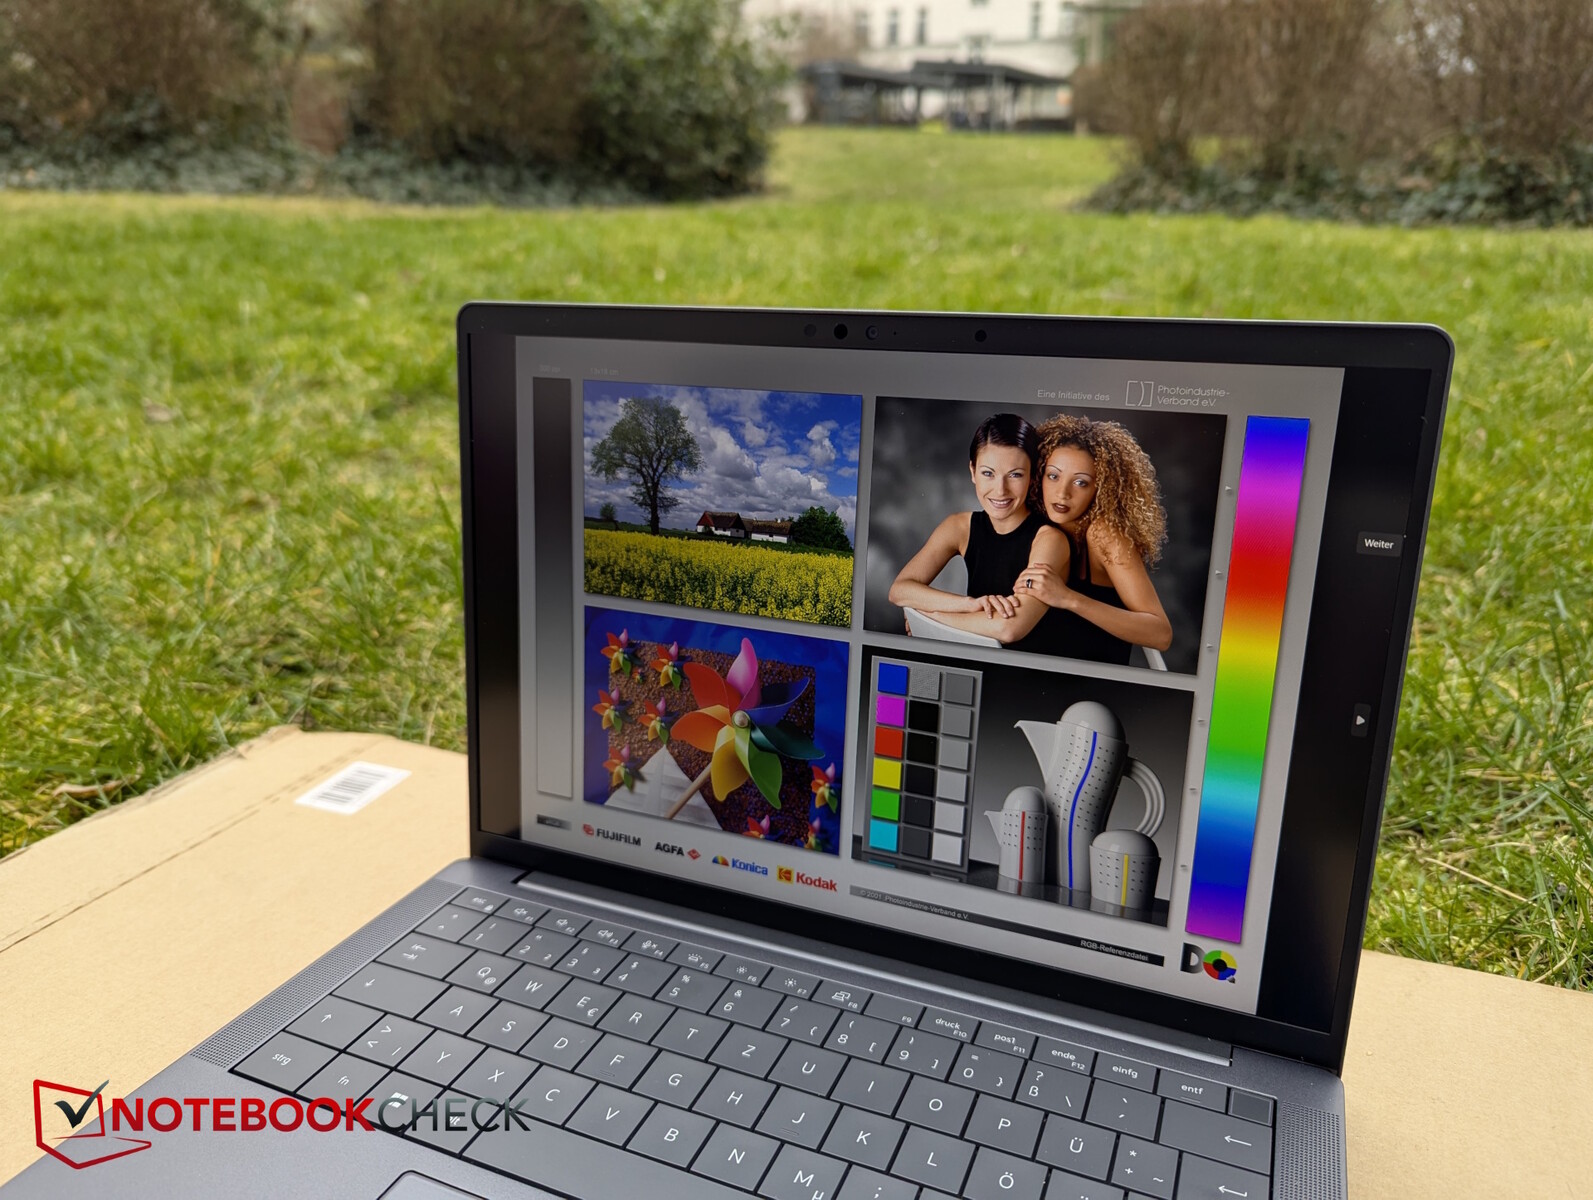
Obudowa i funkcje - ten Dell jest wyposażony w kamerę internetową 8 MP
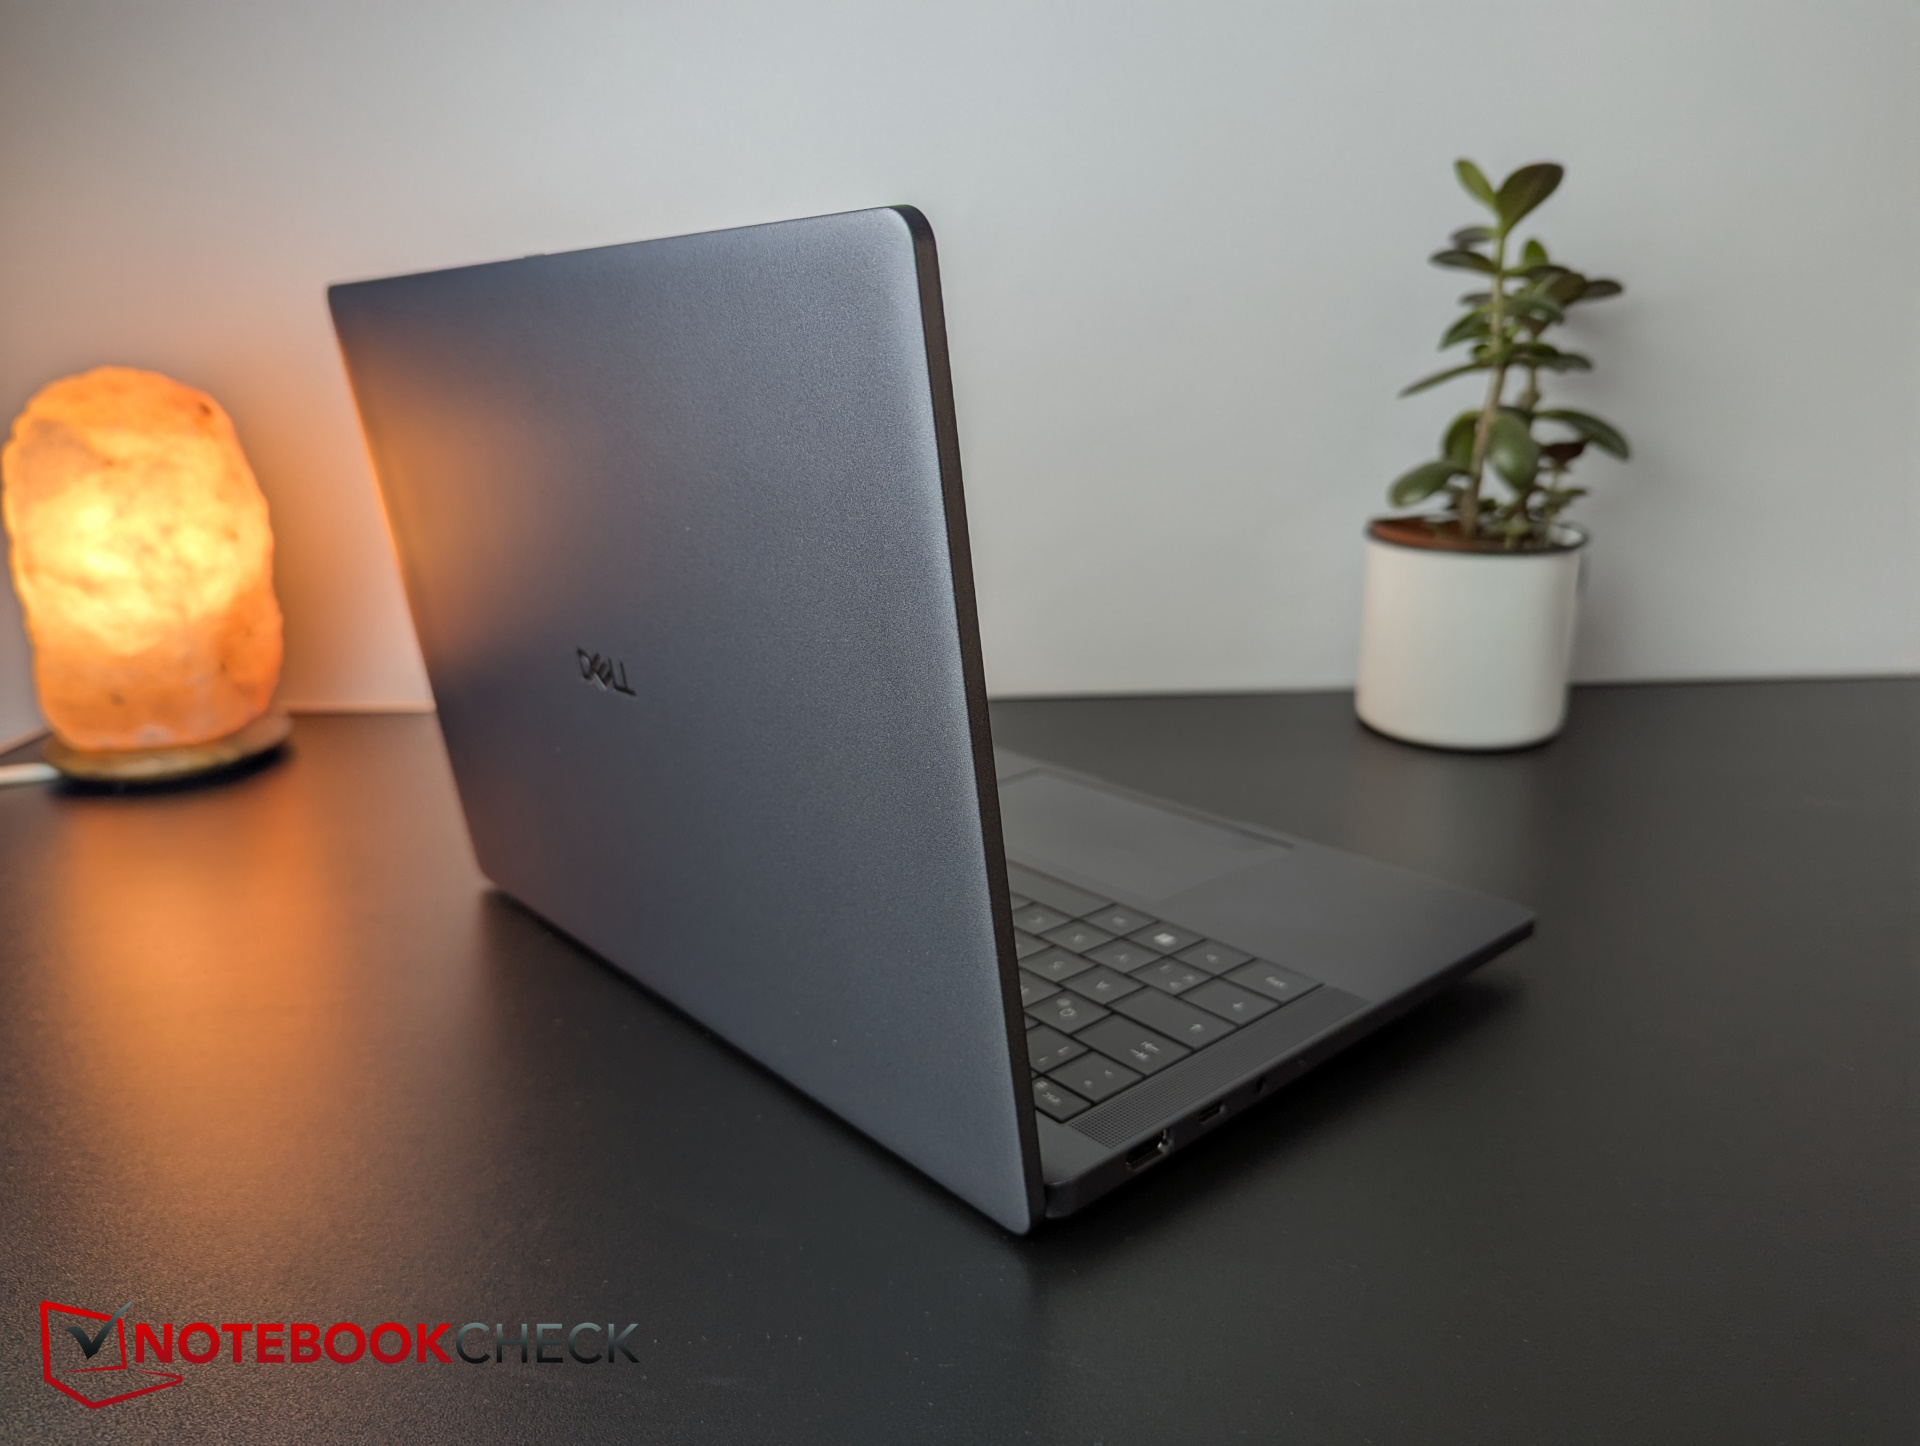
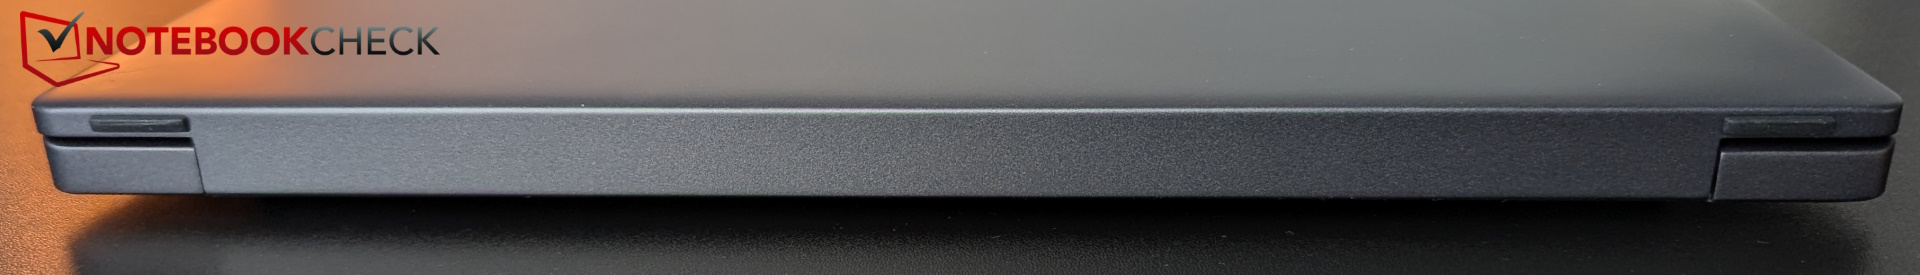
Ciemnoszara obudowa wykonana jest w 90% z magnezu pochodzącego z recyklingu. Dzięki temu jednostka bazowa i pokrywa 180 stopni są bardzo stabilne i nie wykryliśmy żadnych skrzypiących dźwięków podczas obracania urządzenia. Konstrukcja wydaje się niezwykle kompaktowa i prosta, a jednocześnie elegancka.
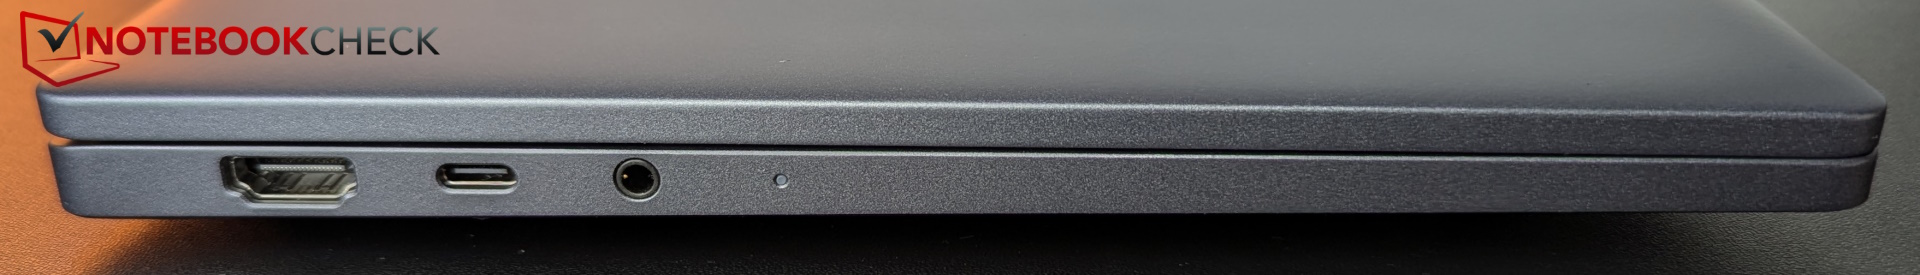
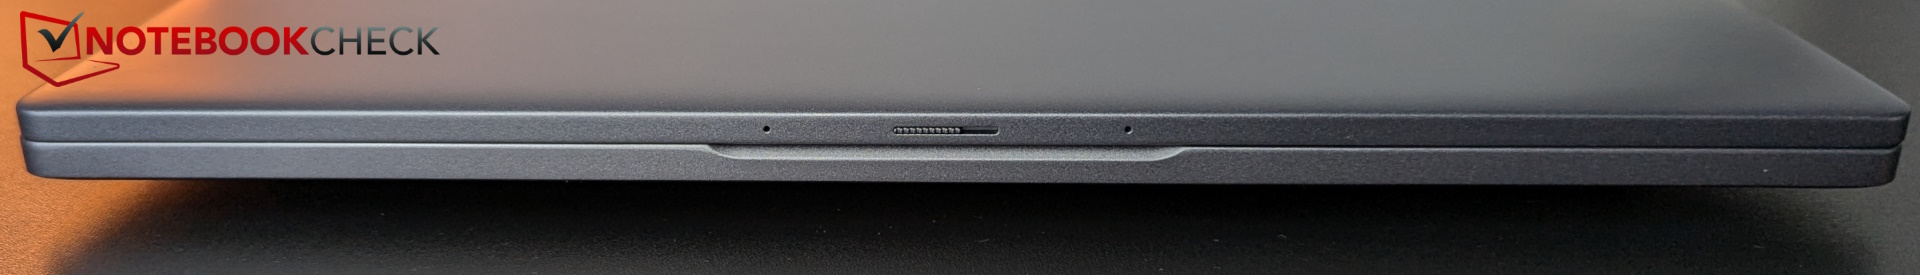
Pro 13 Premium posiada dwa porty Thunderbolt 4, po jednym z każdej strony, oraz pełnowymiarowy port HDMI. Czujnik linii papilarnych jest zintegrowany z przyciskiem zasilania. Nie ma czytnika kart ani dedykowanego portu LAN. Dell oferuje jednak Wi-Fi 7. Gniazdo karty SIM jest opcjonalne.
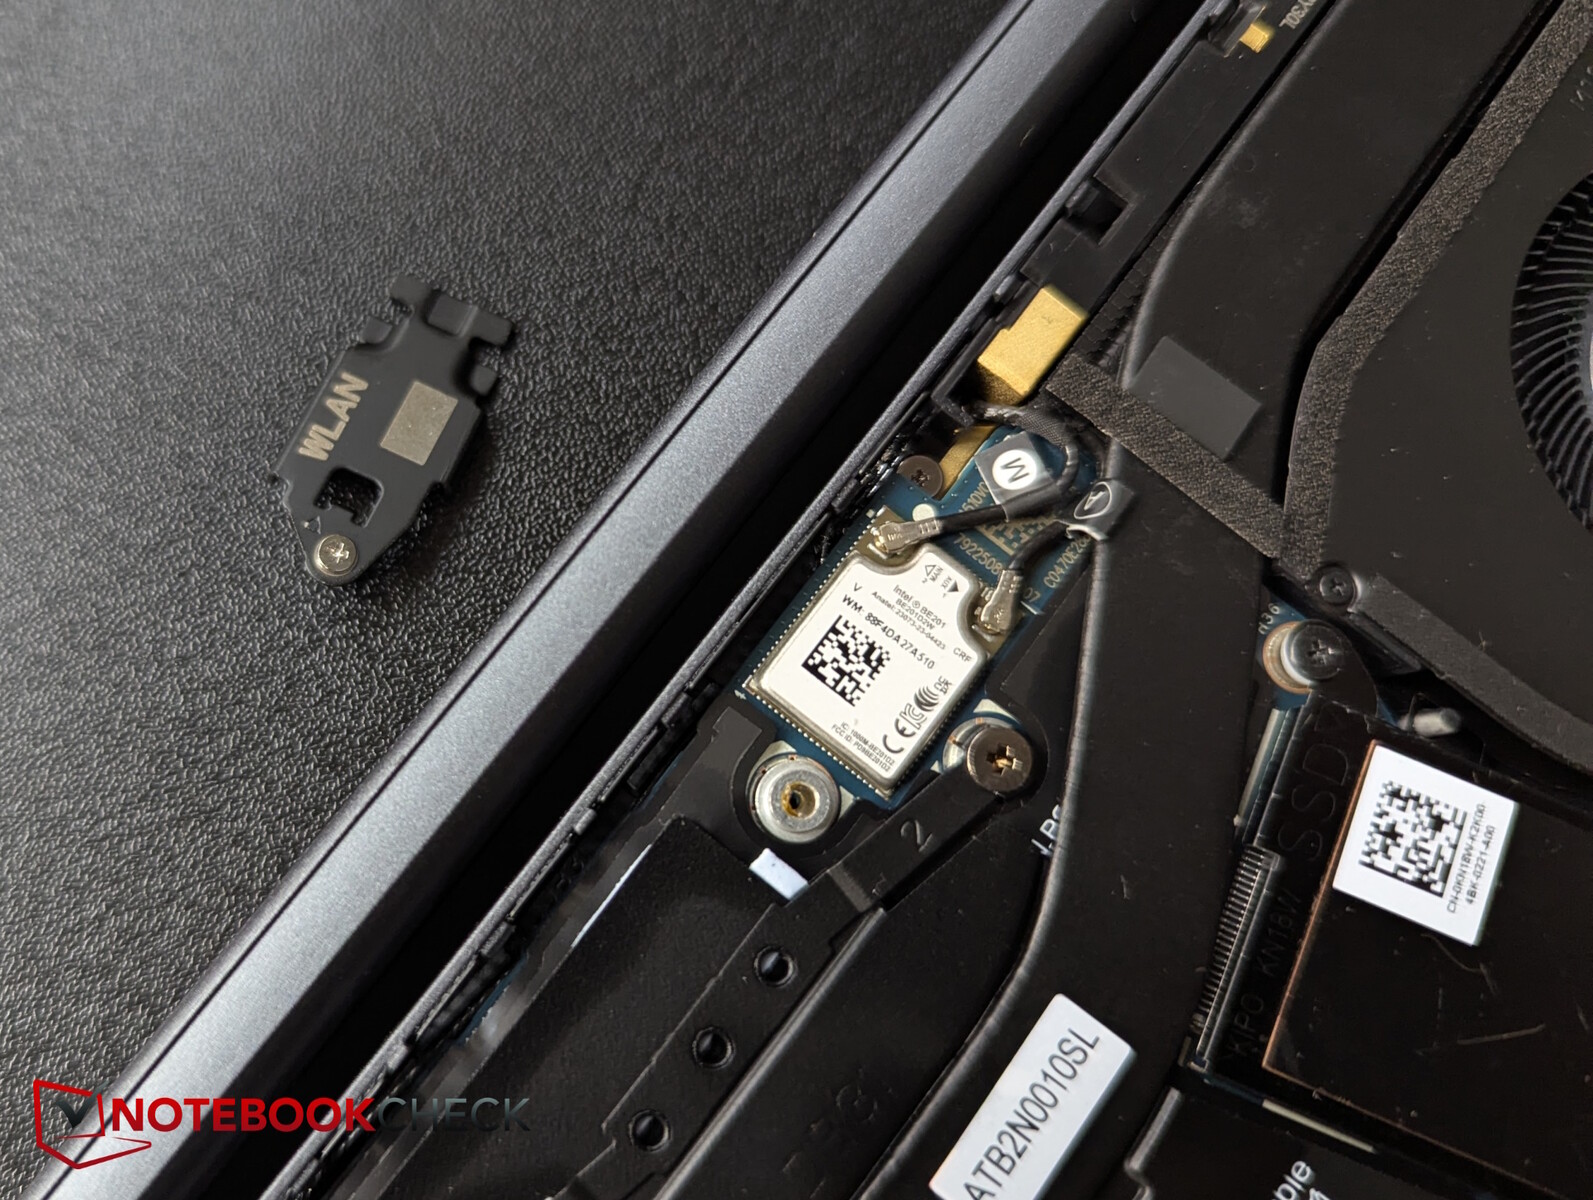
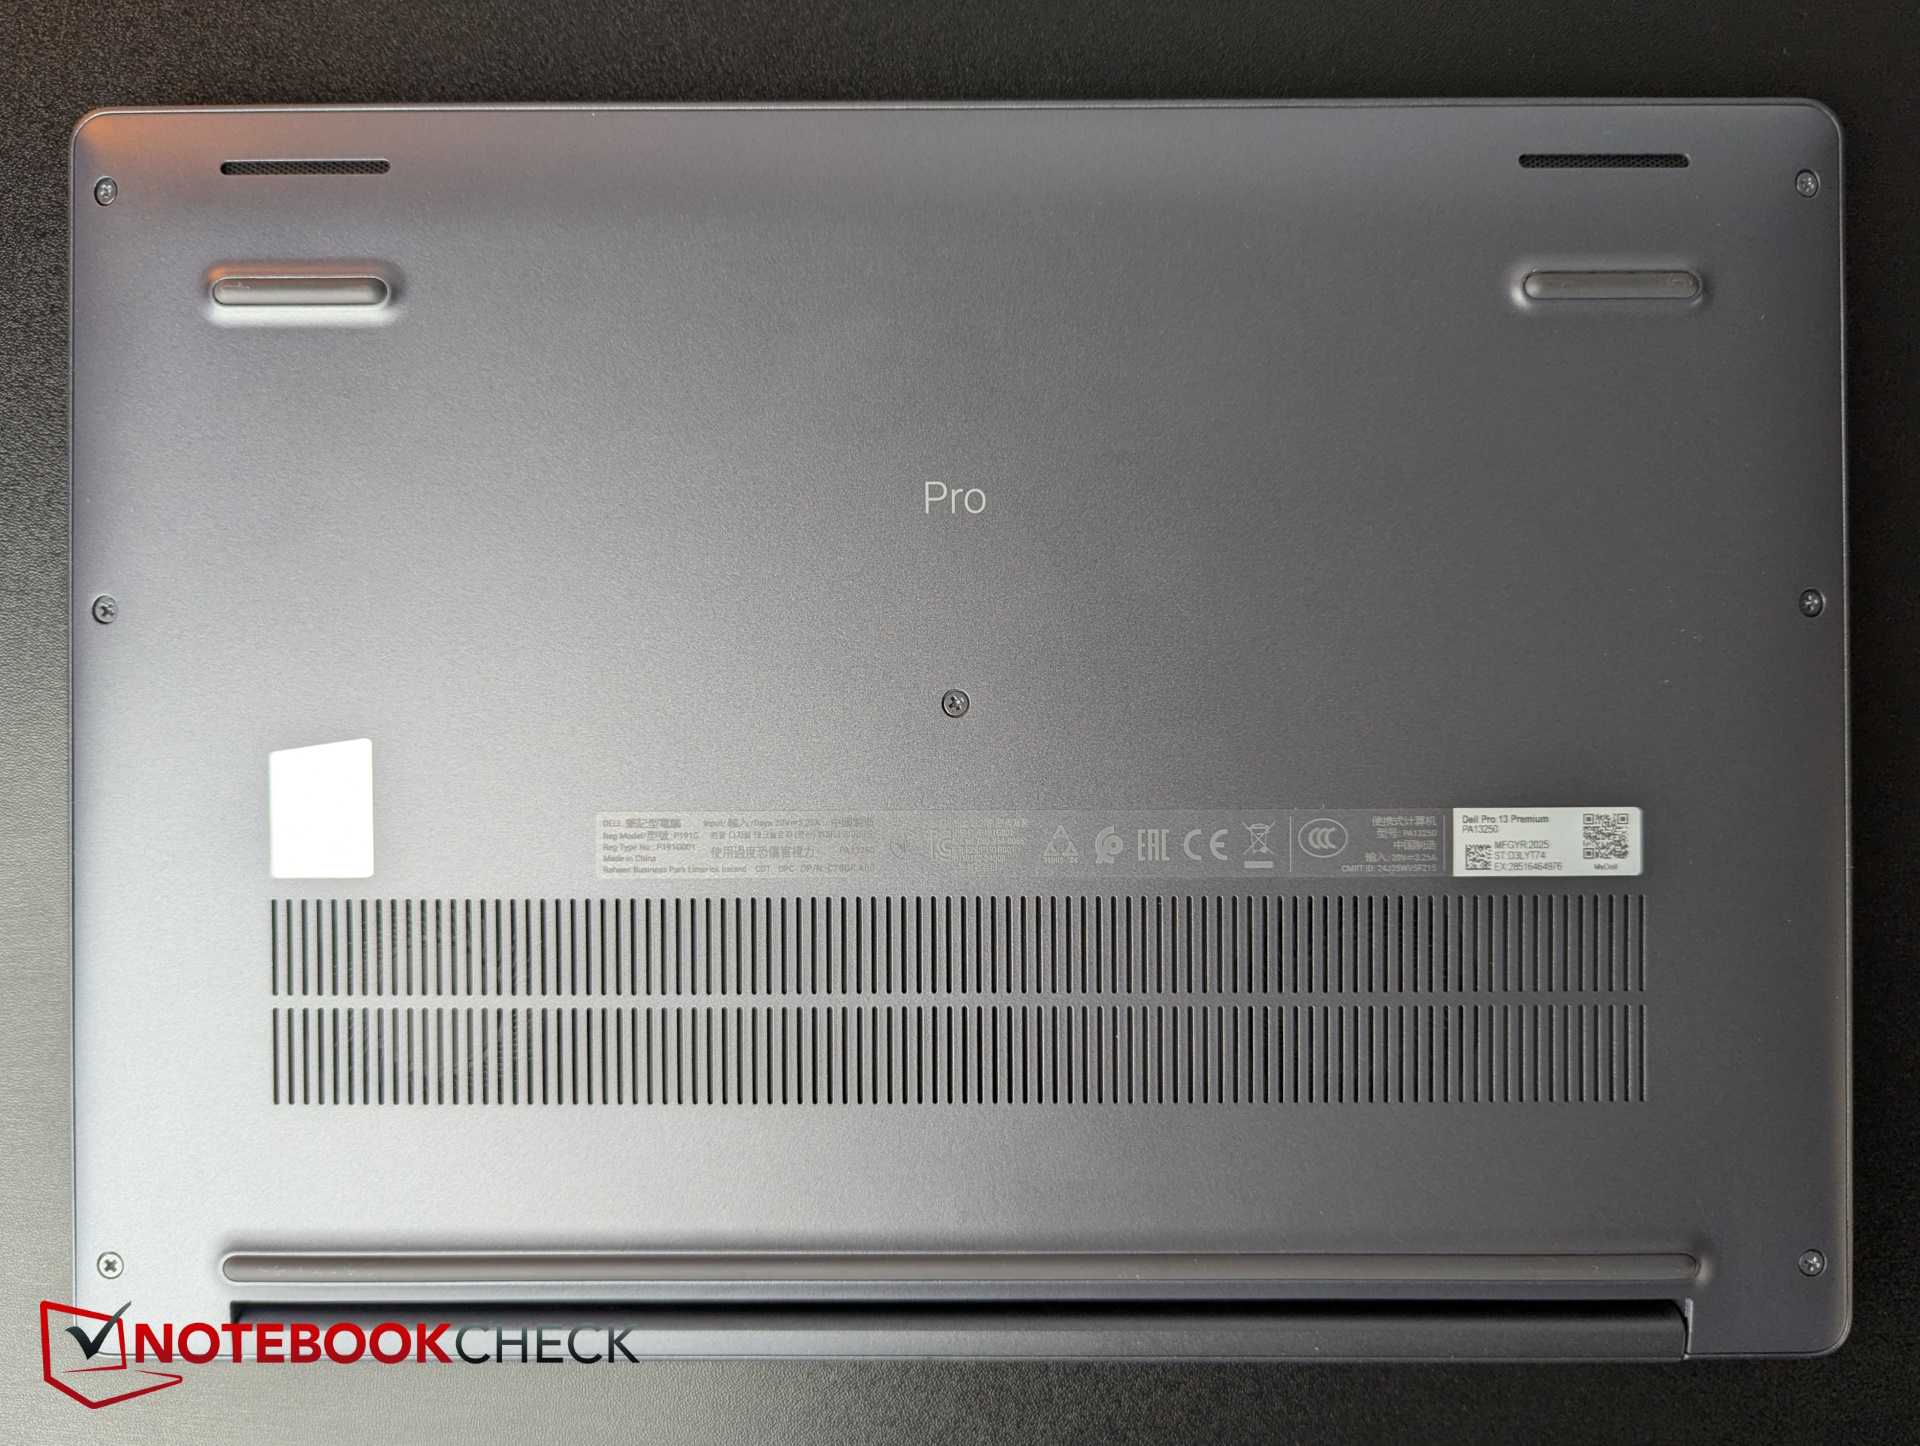
Laptop biznesowy jest stosunkowo łatwy do otwarcia dzięki śrubom krzyżakowym pozostałym w płycie bazowej. Pamięć RAM i moduł Wi-Fi są jednak zainstalowane na stałe w środku, a dysk SSD ma tylko mały format M.2 2230 i brakuje mu drugiego gniazda.
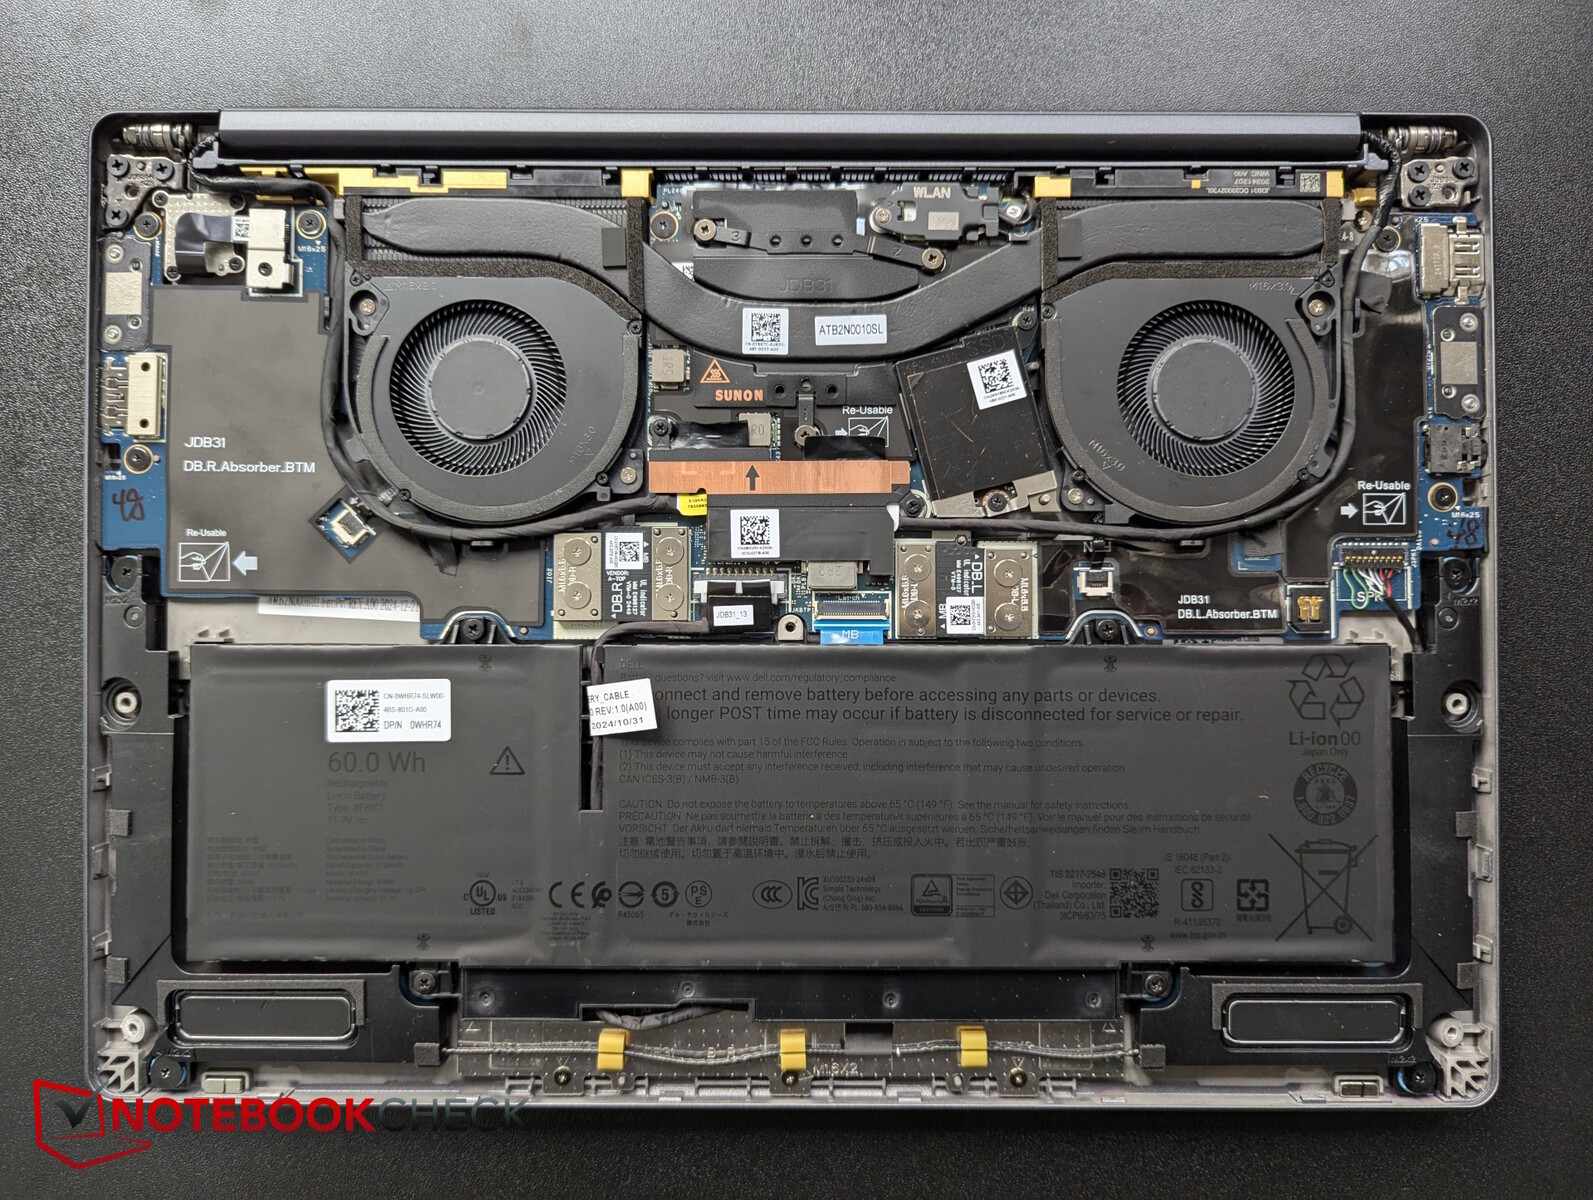

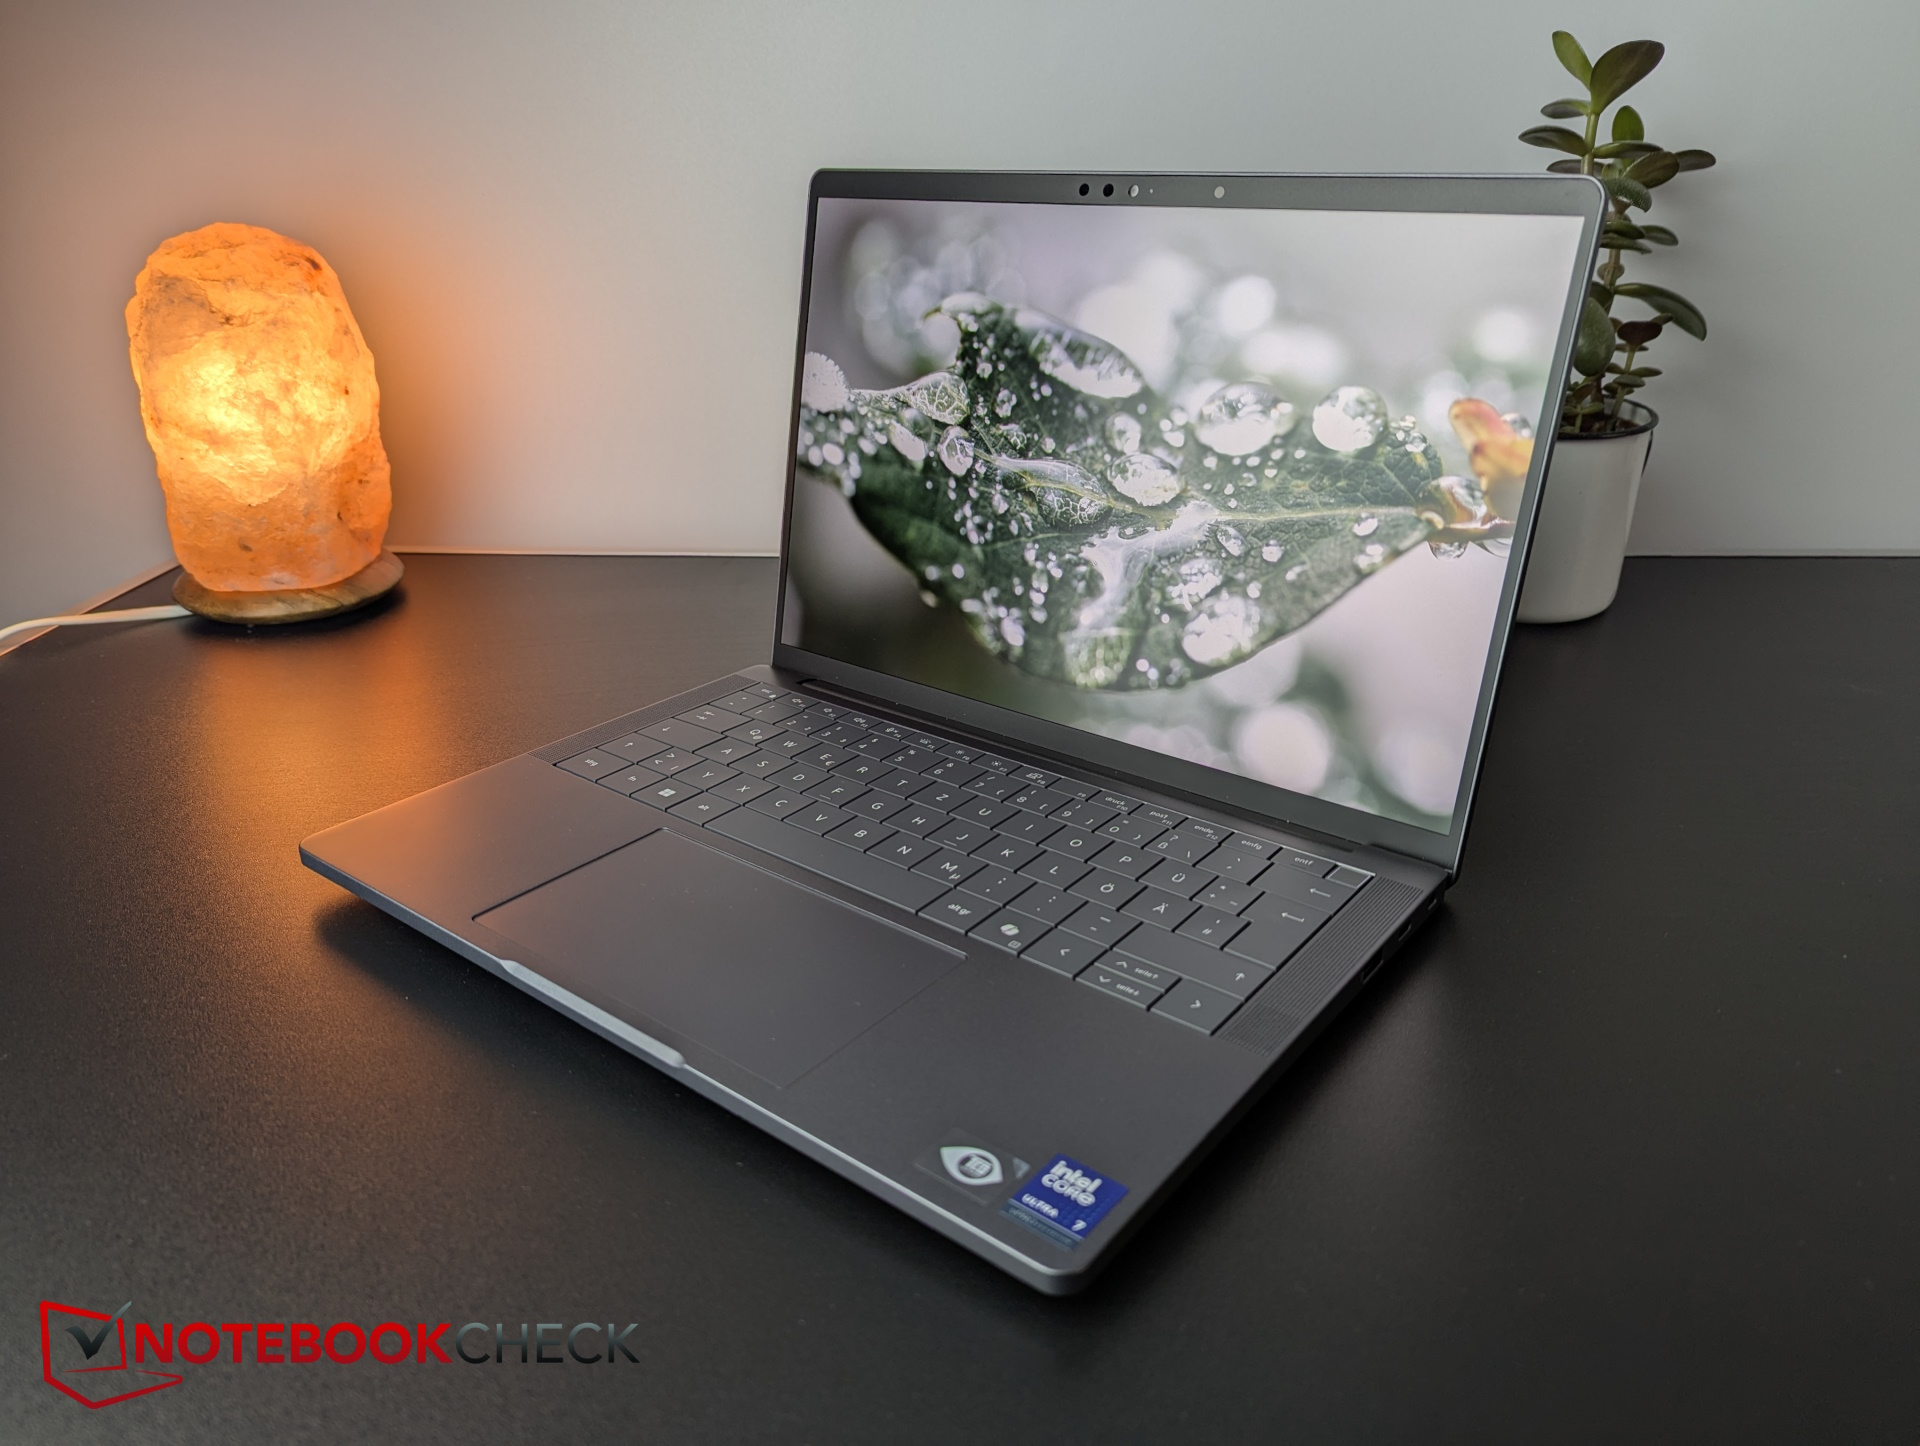
Kamera internetowa IR o rozdzielczości 8 MP ma niezwykle wysoką rozdzielczość. Nadaje to obrazom testowym dobrą ostrość, ale odchylenia kolorów są średnie do wysokich, szczególnie w zakresie zieleni. Moduł WiFi 7 zapewnia niezmiennie wysokie prędkości transferu.


Zrównoważony rozwój
Według Asusa, Pro 13 Premium posiada certyfikat ENERGY STAR, EPEAT Gold i Climate+. Spełnia również najnowszy certyfikat TCO Generation 9 w zakresie zużycia energii i możliwości naprawy.
Zastosowane materiały obejmują plastik PCR, magnez z recyklingu, plastik na bazie biologicznej i kobalt z recyklingu, a opakowanie jest wykonane w 100% z materiałów pochodzących z recyklingu lub odnawialnych, które są głównie kartonowe.
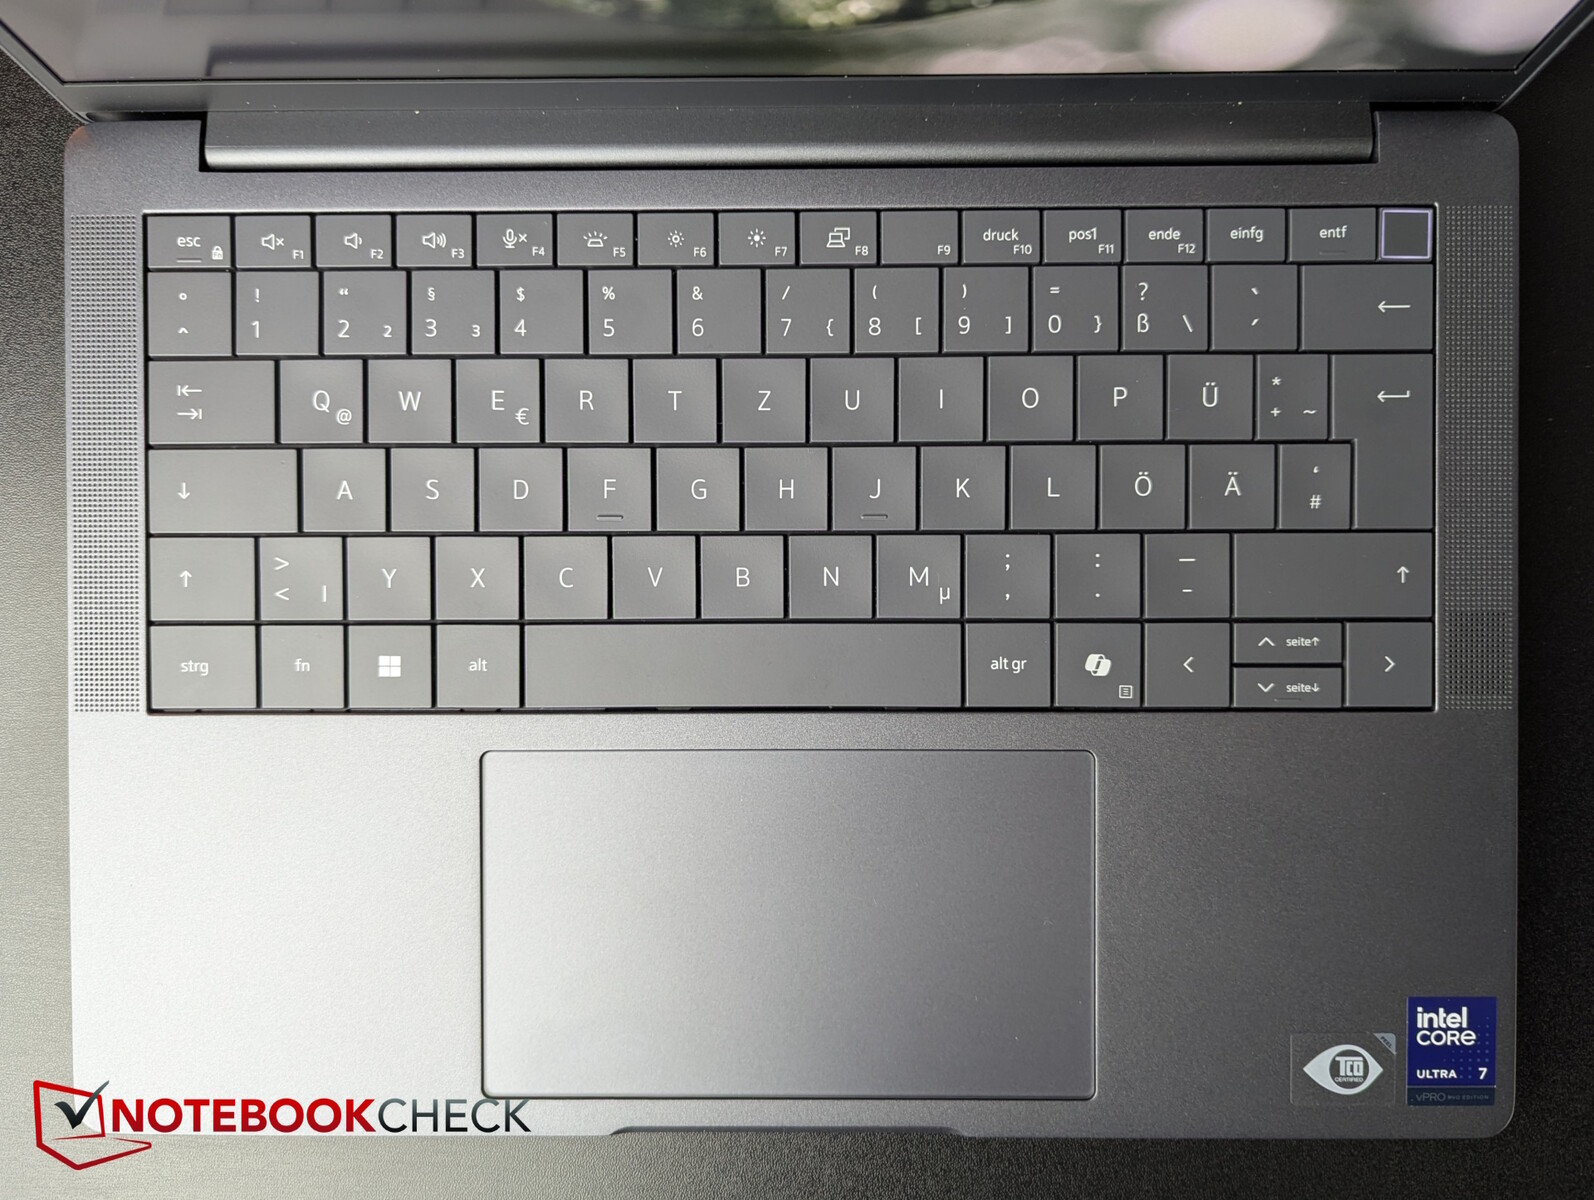
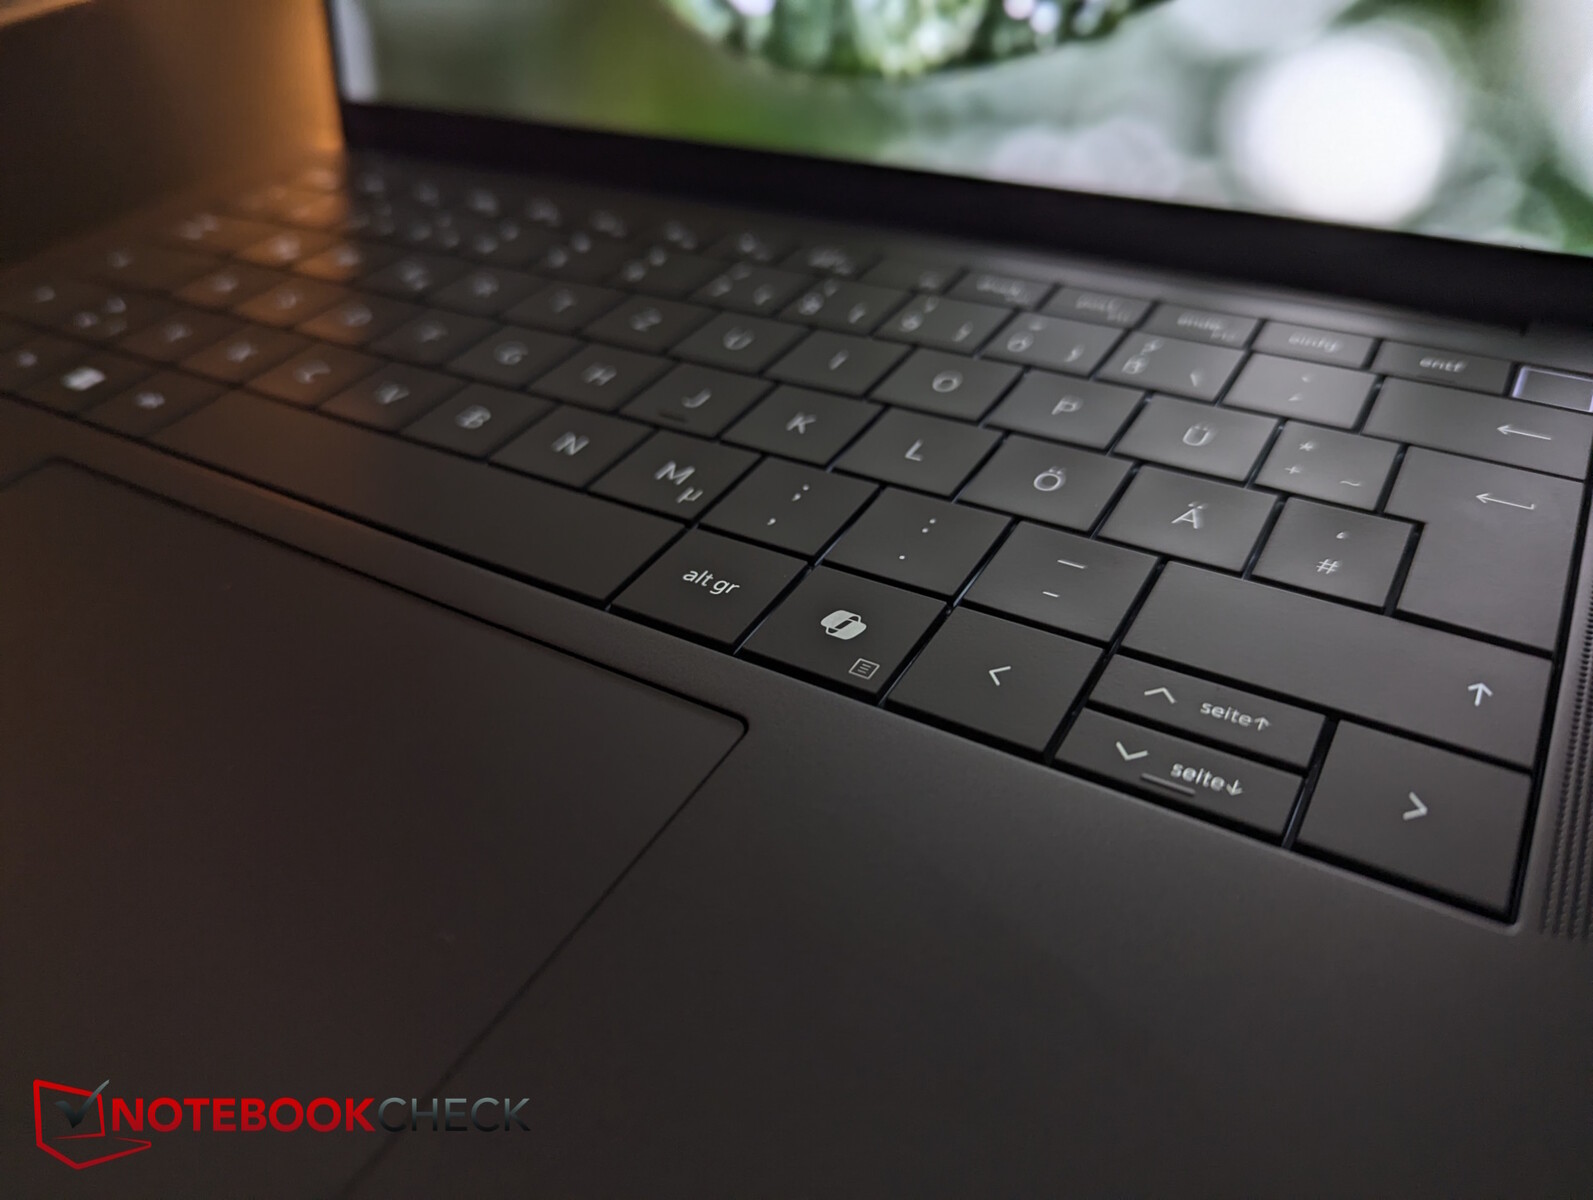
Urządzenia wejściowe - 13 Premium ma touchpad do połączeń konferencyjnych
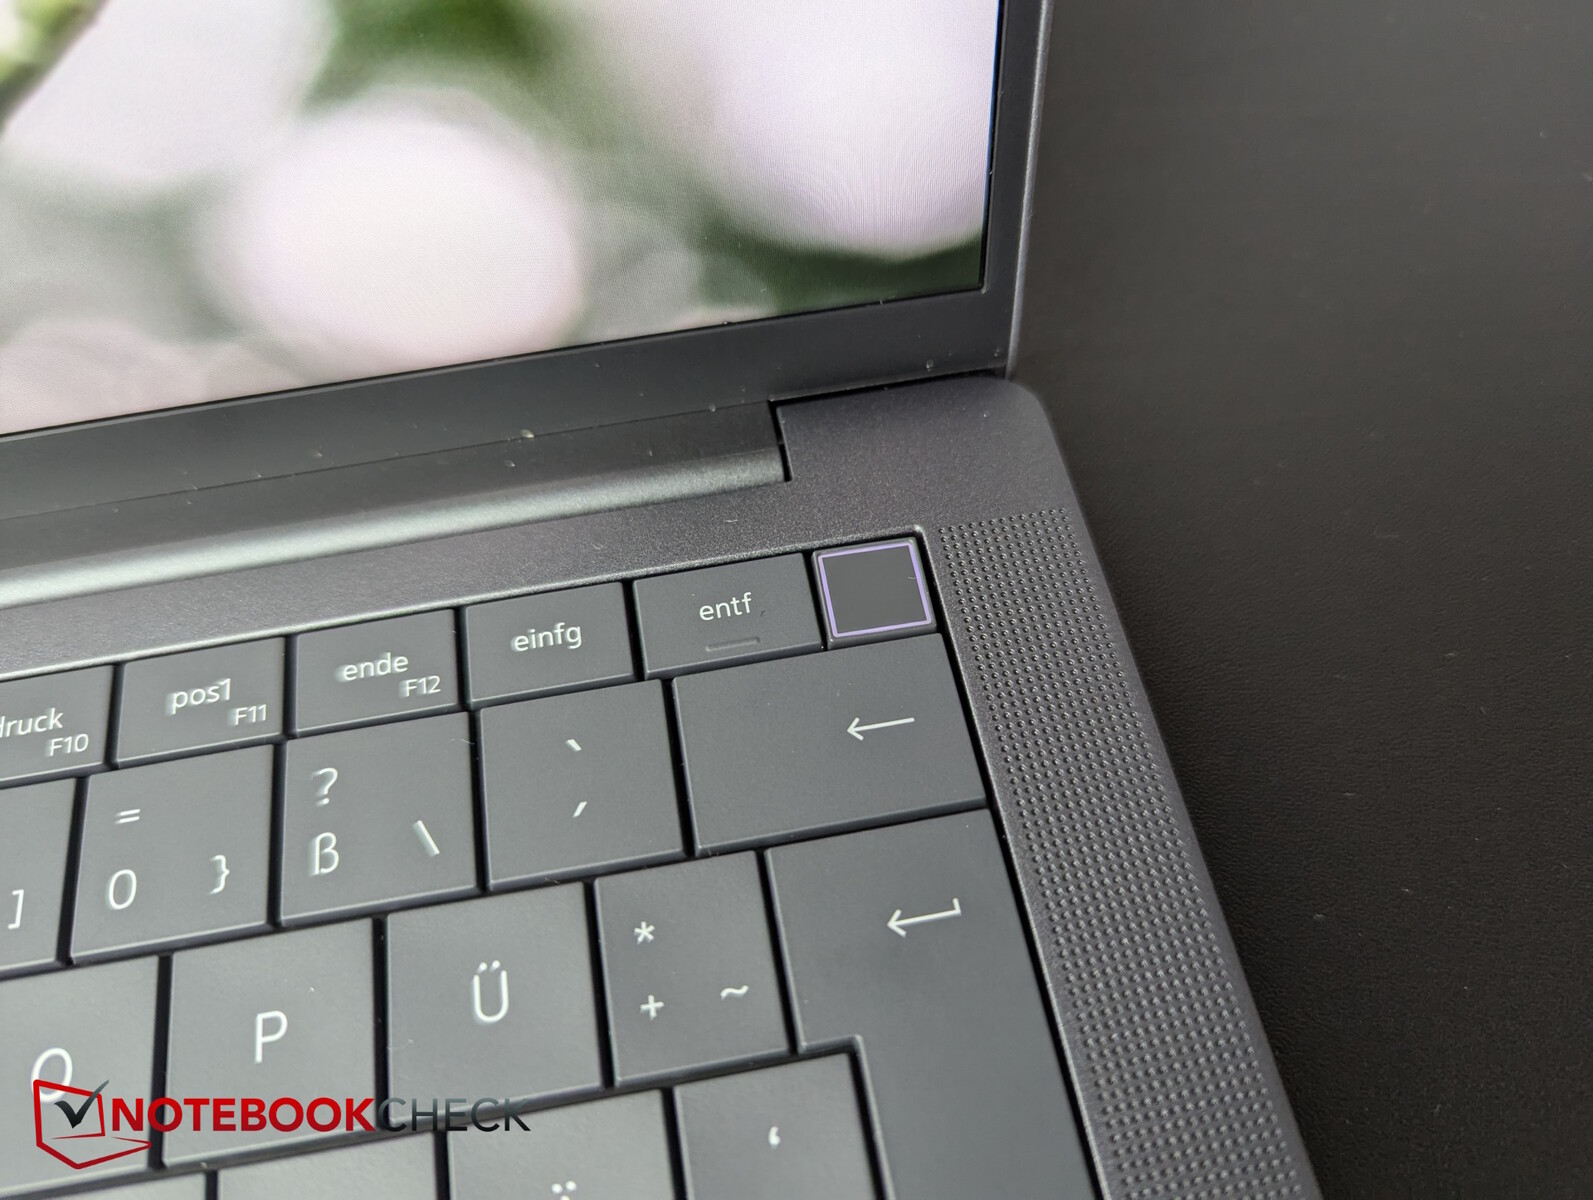
Dell oferuje bardzo uporządkowany i kompaktowy układ z dużymi klawiszami (ok. 1,7 cm), bez przerw między nimi, a pionowe klawisze strzałek są o połowę niższe. Przycisk zasilania zintegrowany z klawiaturą w prawym górnym rogu zawiera również czujnik odcisków palców.
Klawisze mają płytki lub średni skok, ale namacalne sprzężenie zwrotne. Pozwala to użytkownikowi na szybkie pisanie, a odgłos naciskania klawiszy jest więcej niż umiarkowany. Zużycie energii przez dwustopniowe podświetlenie zostało zmniejszone nawet o 75% dzięki zastosowaniu miniaturowych diod LED.
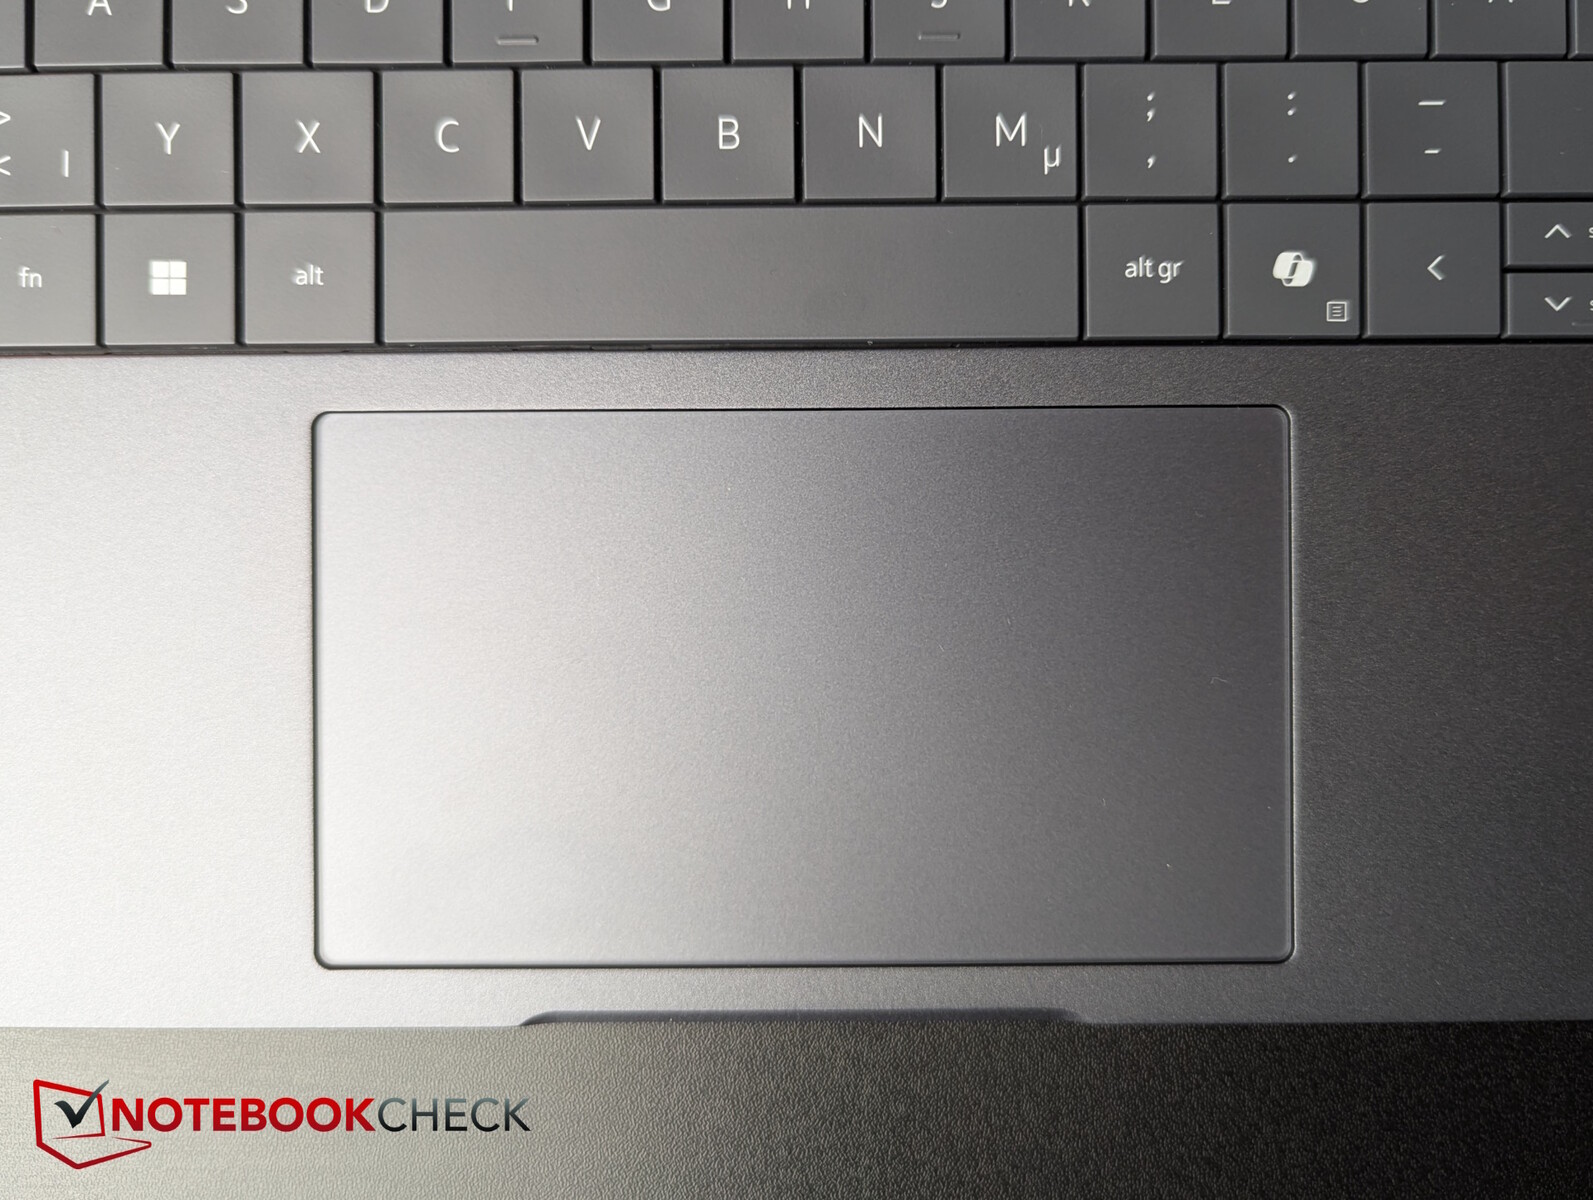
Touchpad ma wymiary około 12,5 x 7,1 cm, a jego wyróżniającą cechą jest umieszczenie w górnym rzędzie specjalnych klawiszy do wideorozmów (włączanie/wyłączanie kamery, udostępnianie ekranu, czat, włączanie/wyłączanie mikrofonu). Symbole dotykowe są widoczne tylko podczas połączeń Zoom lub Microsoft Teams. Powierzchnia jest bardzo gładka, ale jeśli właśnie umyłeś ręce lub masz lekko wilgotne palce z innego powodu, będzie się znacznie zacinać. Ciche kliknięcia zintegrowanych przycisków myszy zapewniają przyjemne sprzężenie zwrotne i są uruchamiane niezawodnie.
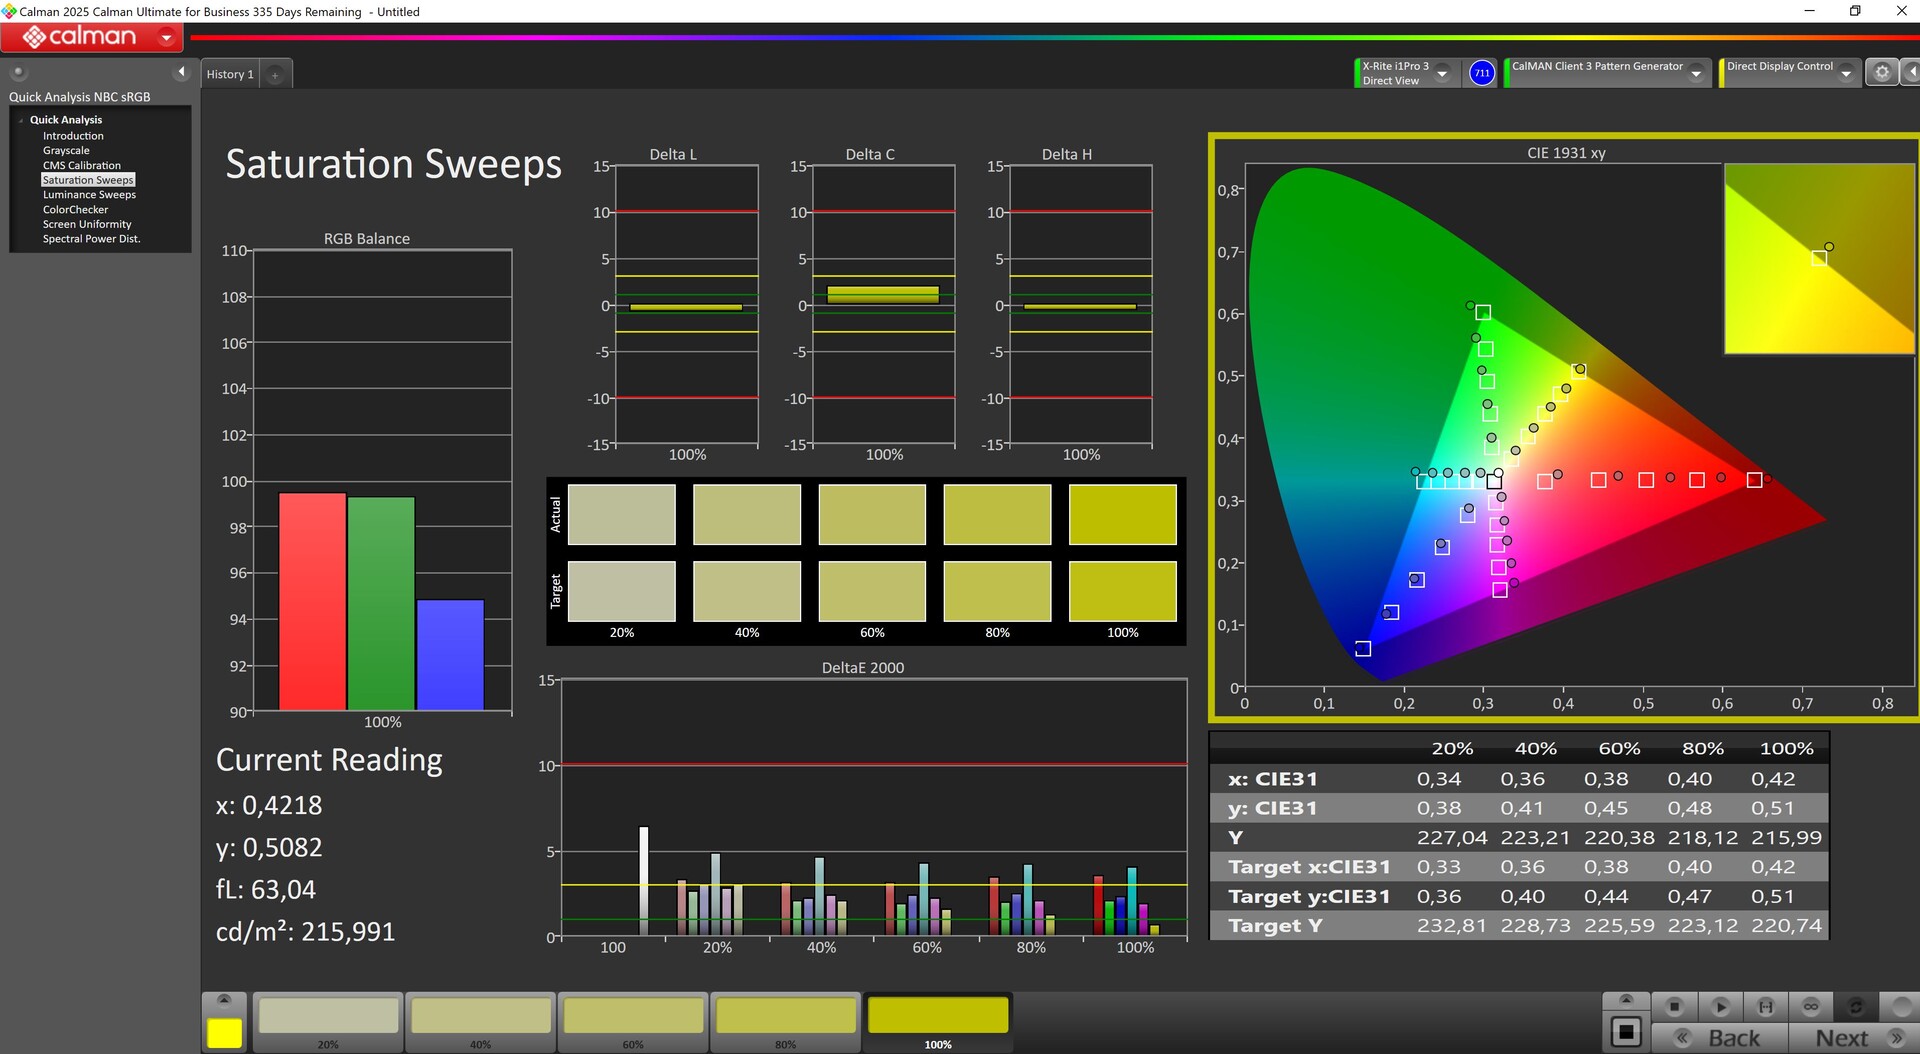
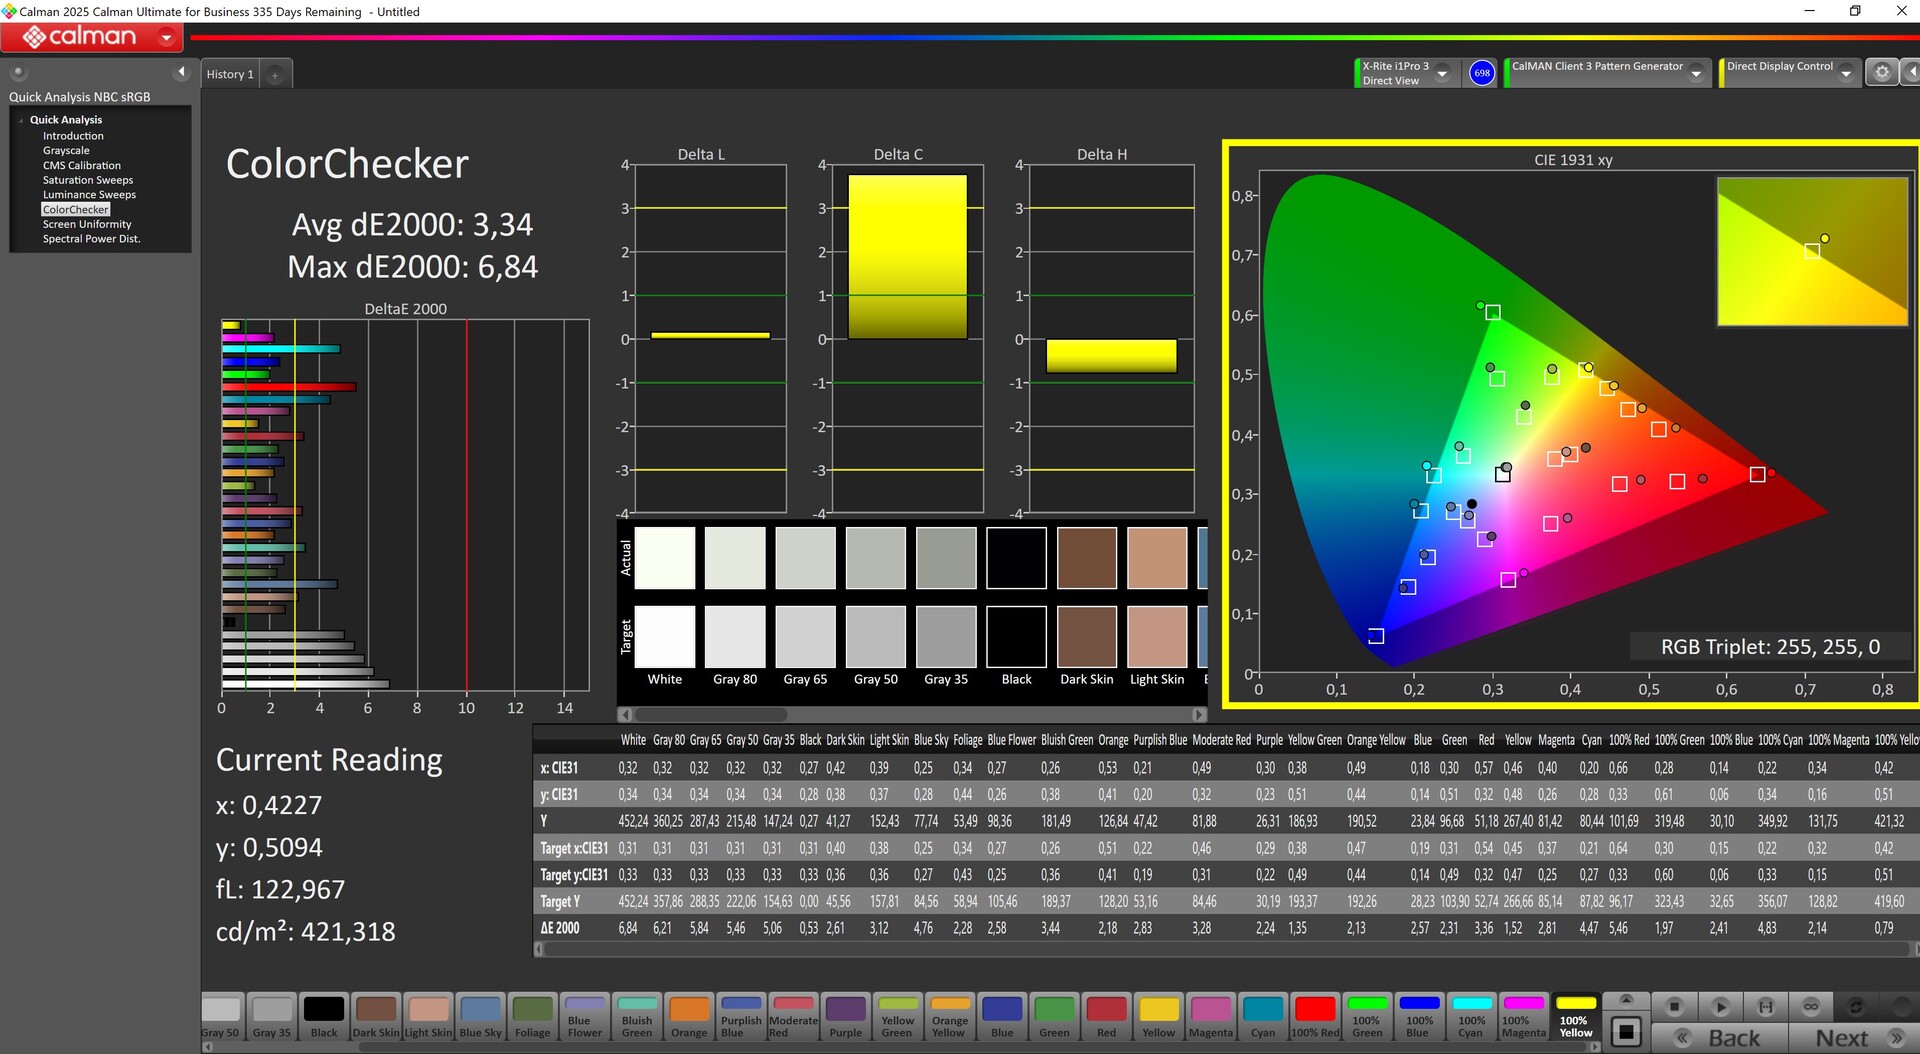
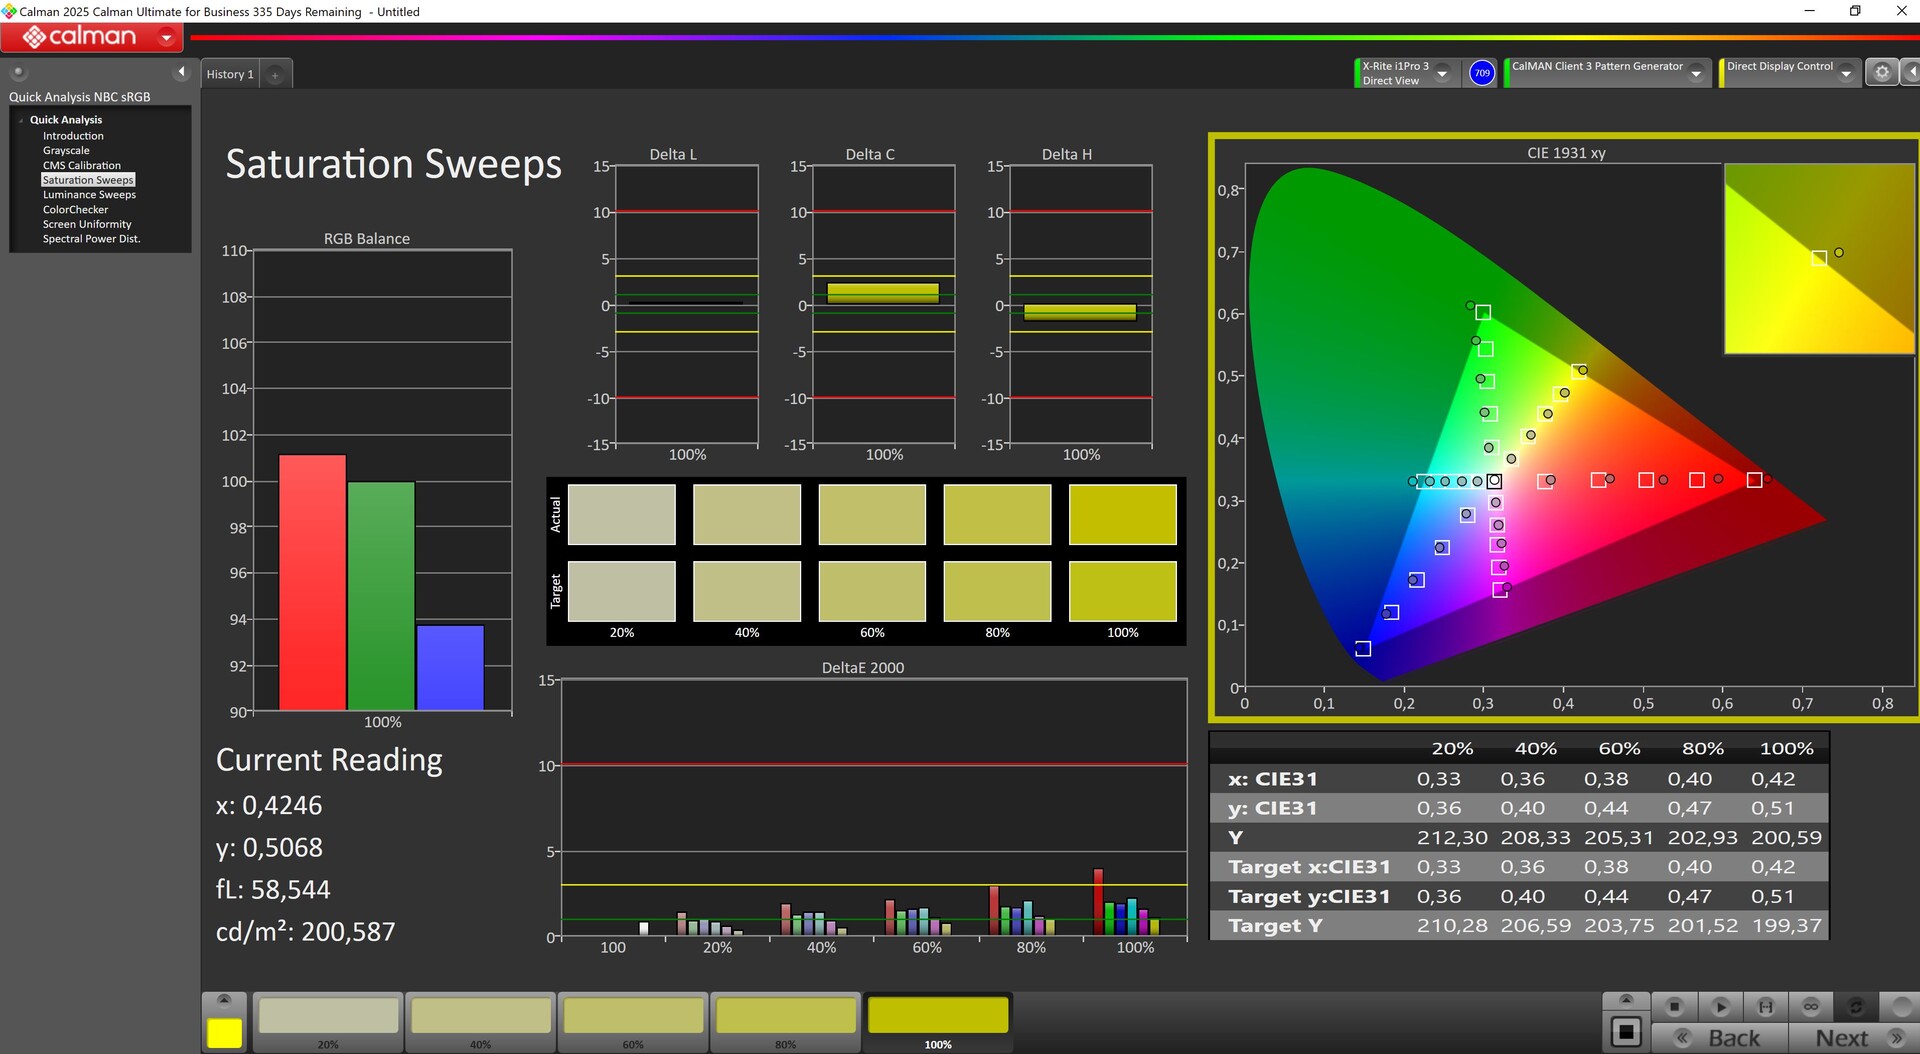
Wyświetlacz - panel biurowy o wysokim kontraście z dodatkowymi opcjami
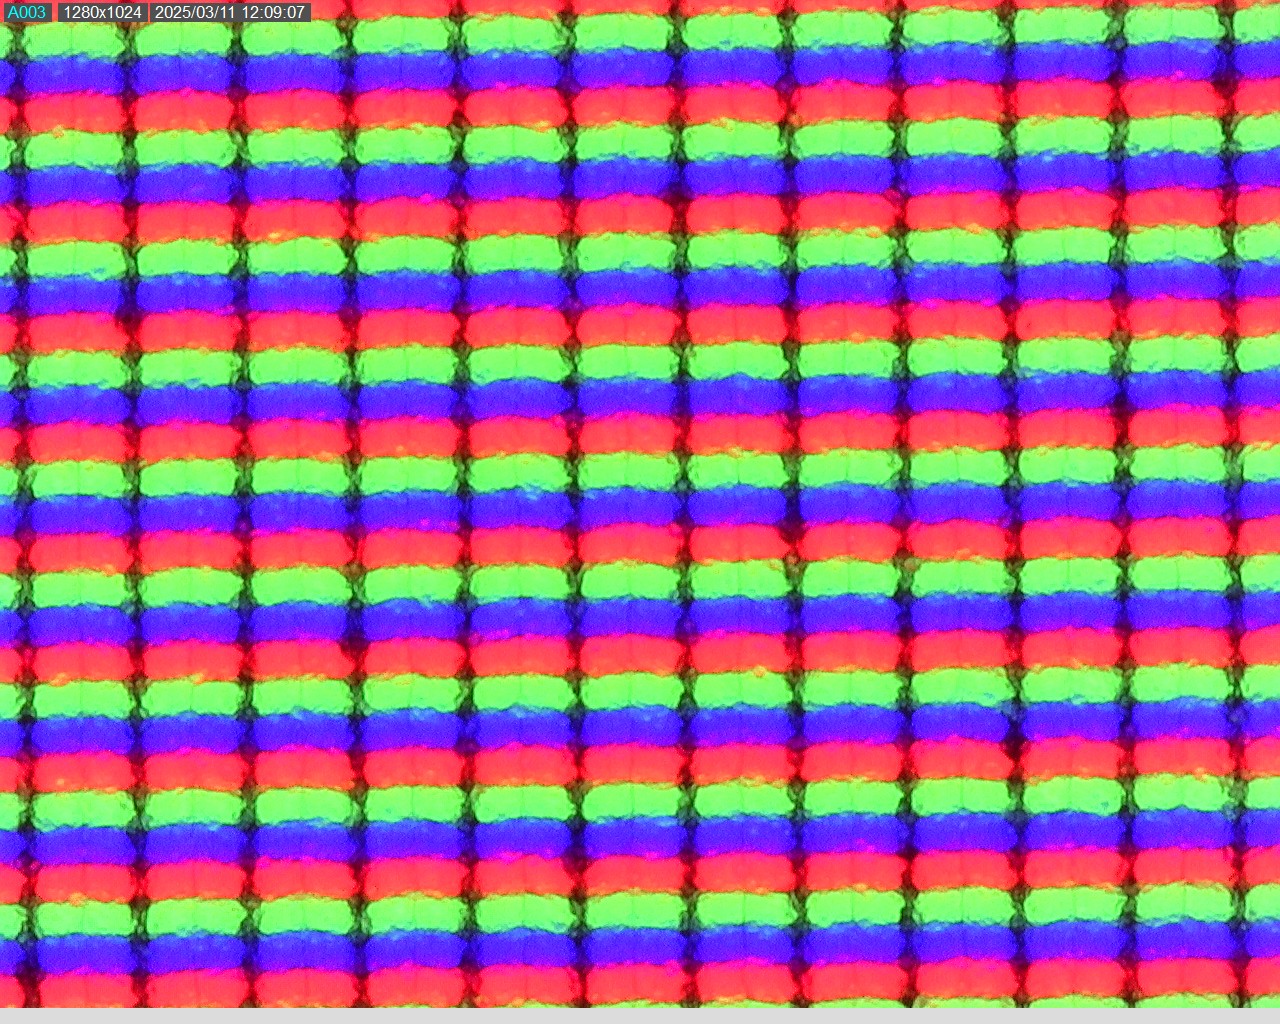
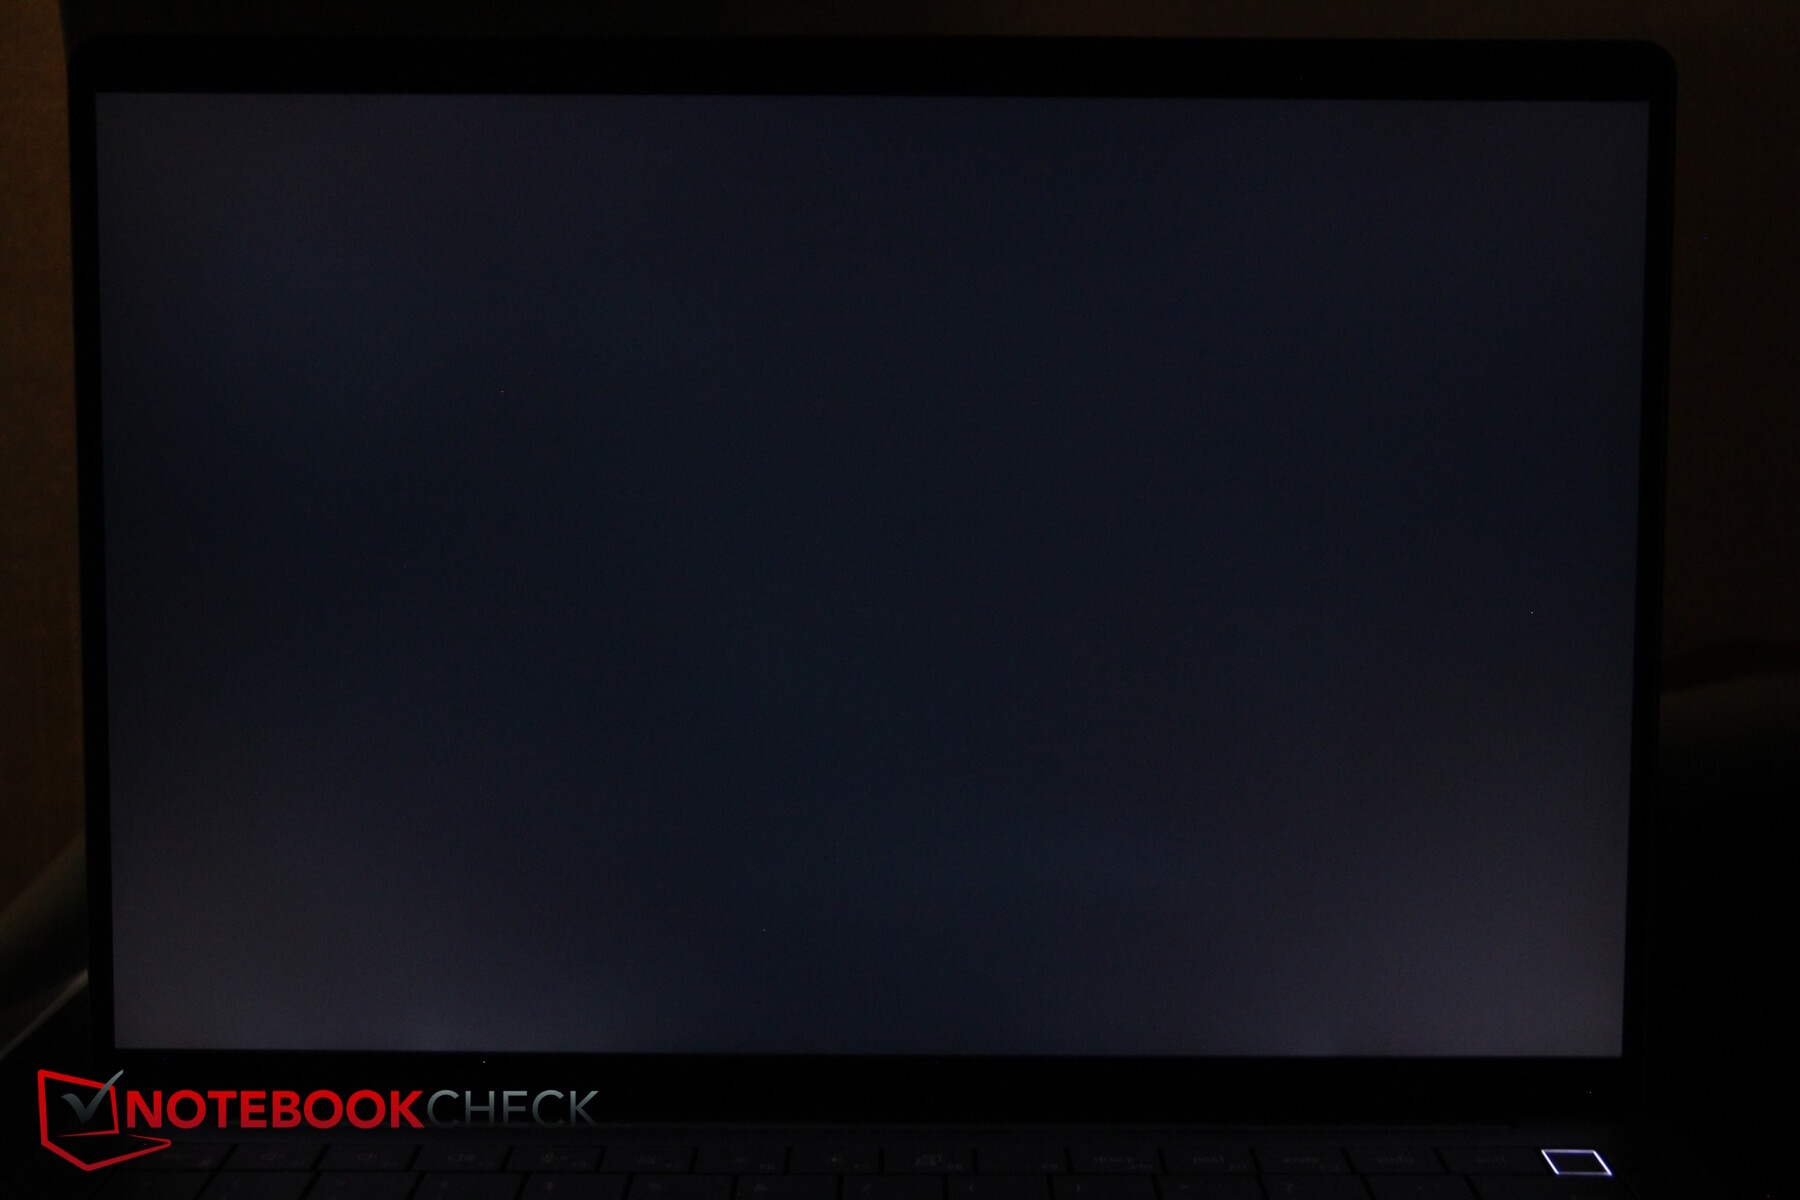
Istnieje kilka opcji wyświetlania, ale to, na co patrzymy tutaj, to matowy wyświetlacz o proporcjach 16:10, 1,920 x 1,200 z oficjalną jasnością 400 nitów i bez wejścia dotykowego. Dostępna jest również wersja 300 nitów, a także najwyższa opcja, która ma rozdzielczość 2560 x 1600 pikseli, 500 nitów i funkcję dotykową. Dell podkreśla, że wszystkie jego wyświetlacze są szczególnie energooszczędne.
Zmierzyliśmy dobrze podświetloną średnią jasność 460 nitów. Kontrast jest również więcej niż przyzwoity, dzięki stosunkowo niskiemu poziomowi czerni. AdobeRGB i Display P3 są pokryte w około 75 procentach, a sRGB prawie całkowicie.
Czasy reakcji są jednak dość powolne, a panel obsługuje tylko 60 Hz.
| |||||||||||||||||||||||||
rozświetlenie: 89 %
na akumulatorze: 456 cd/m²
kontrast: 1983:1 (czerń: 0.23 cd/m²)
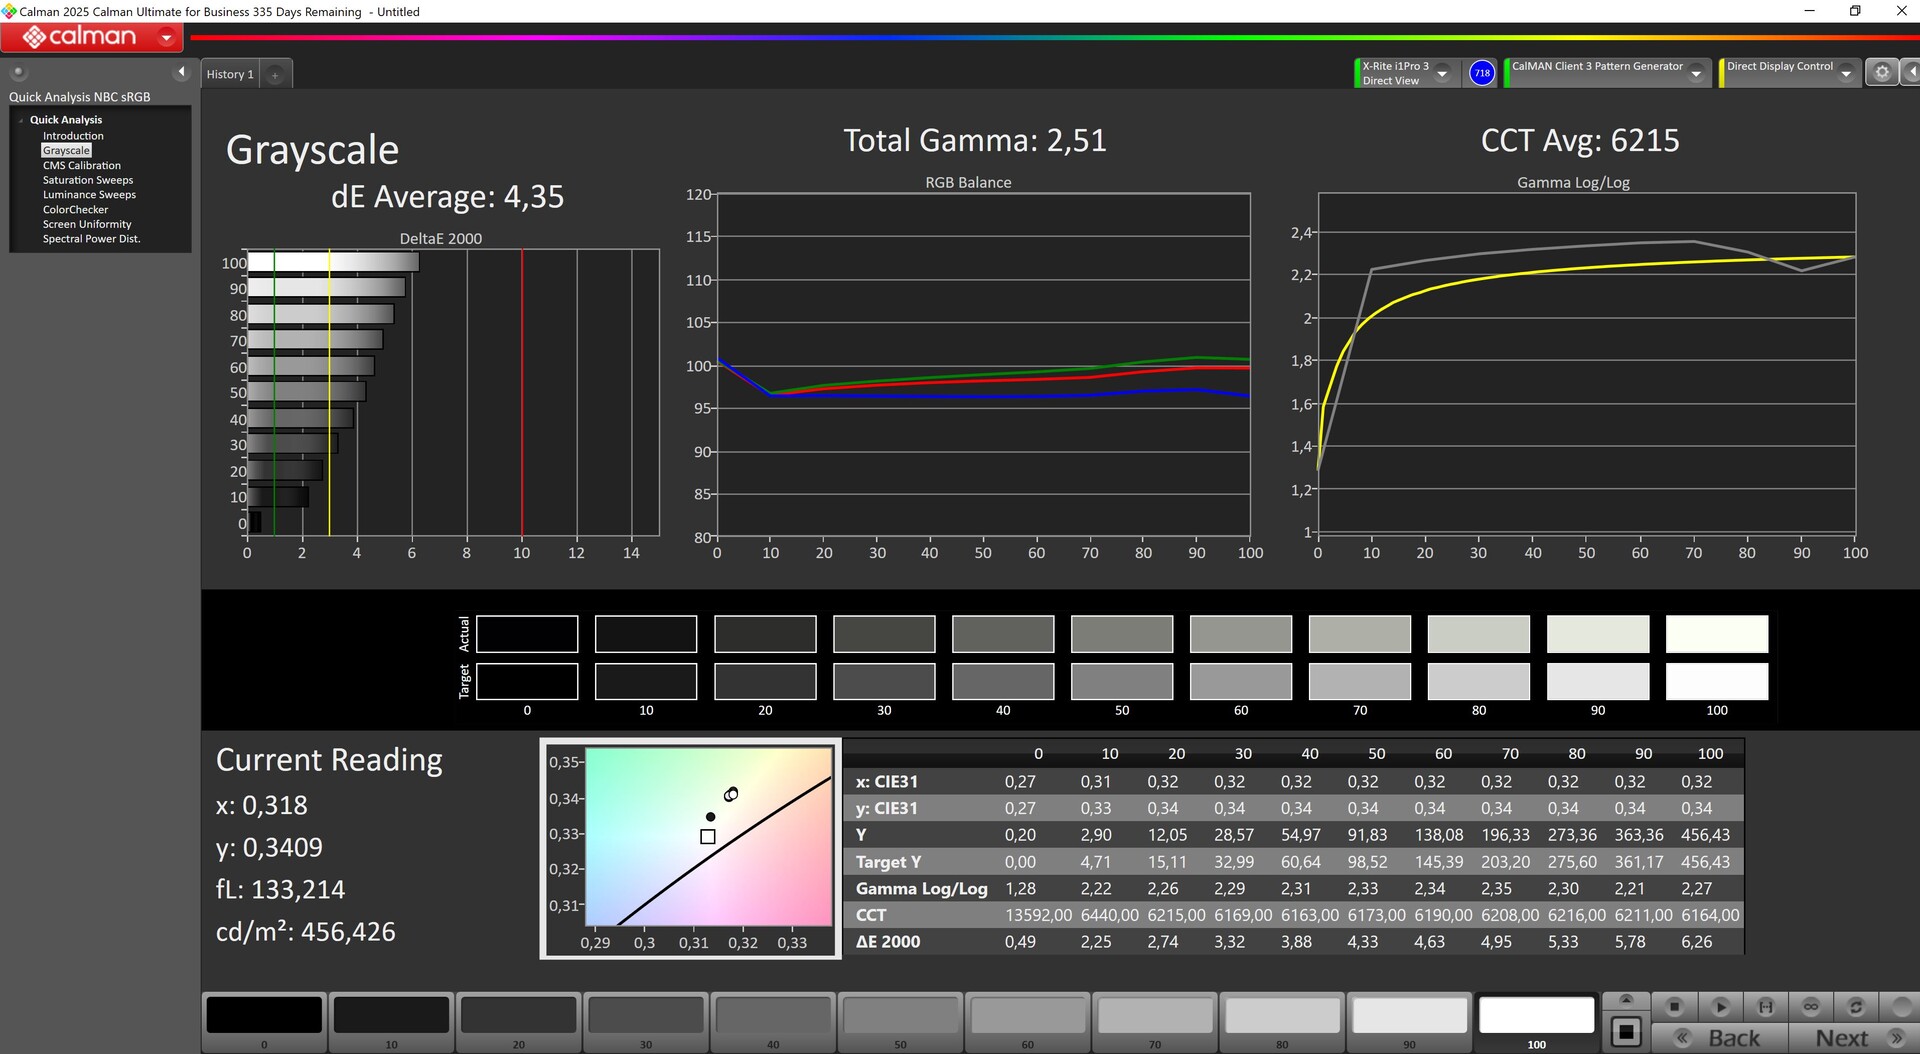
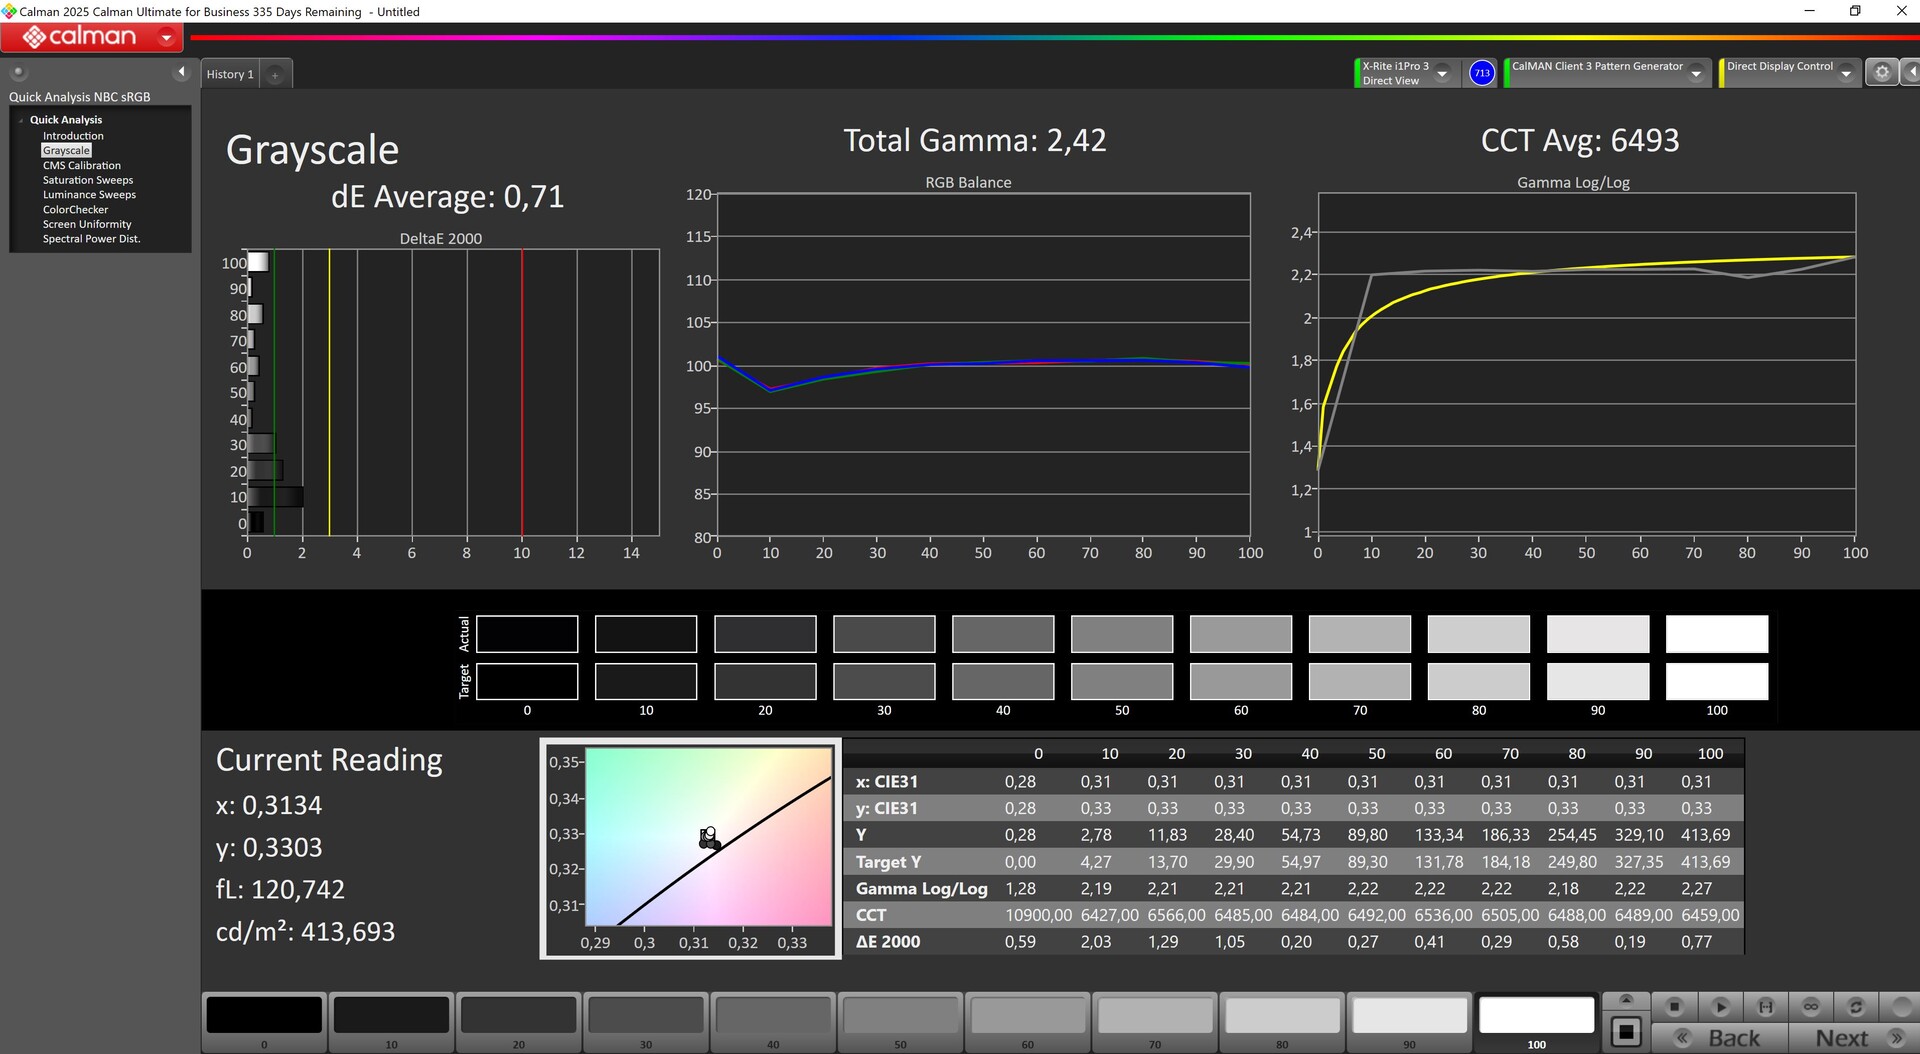
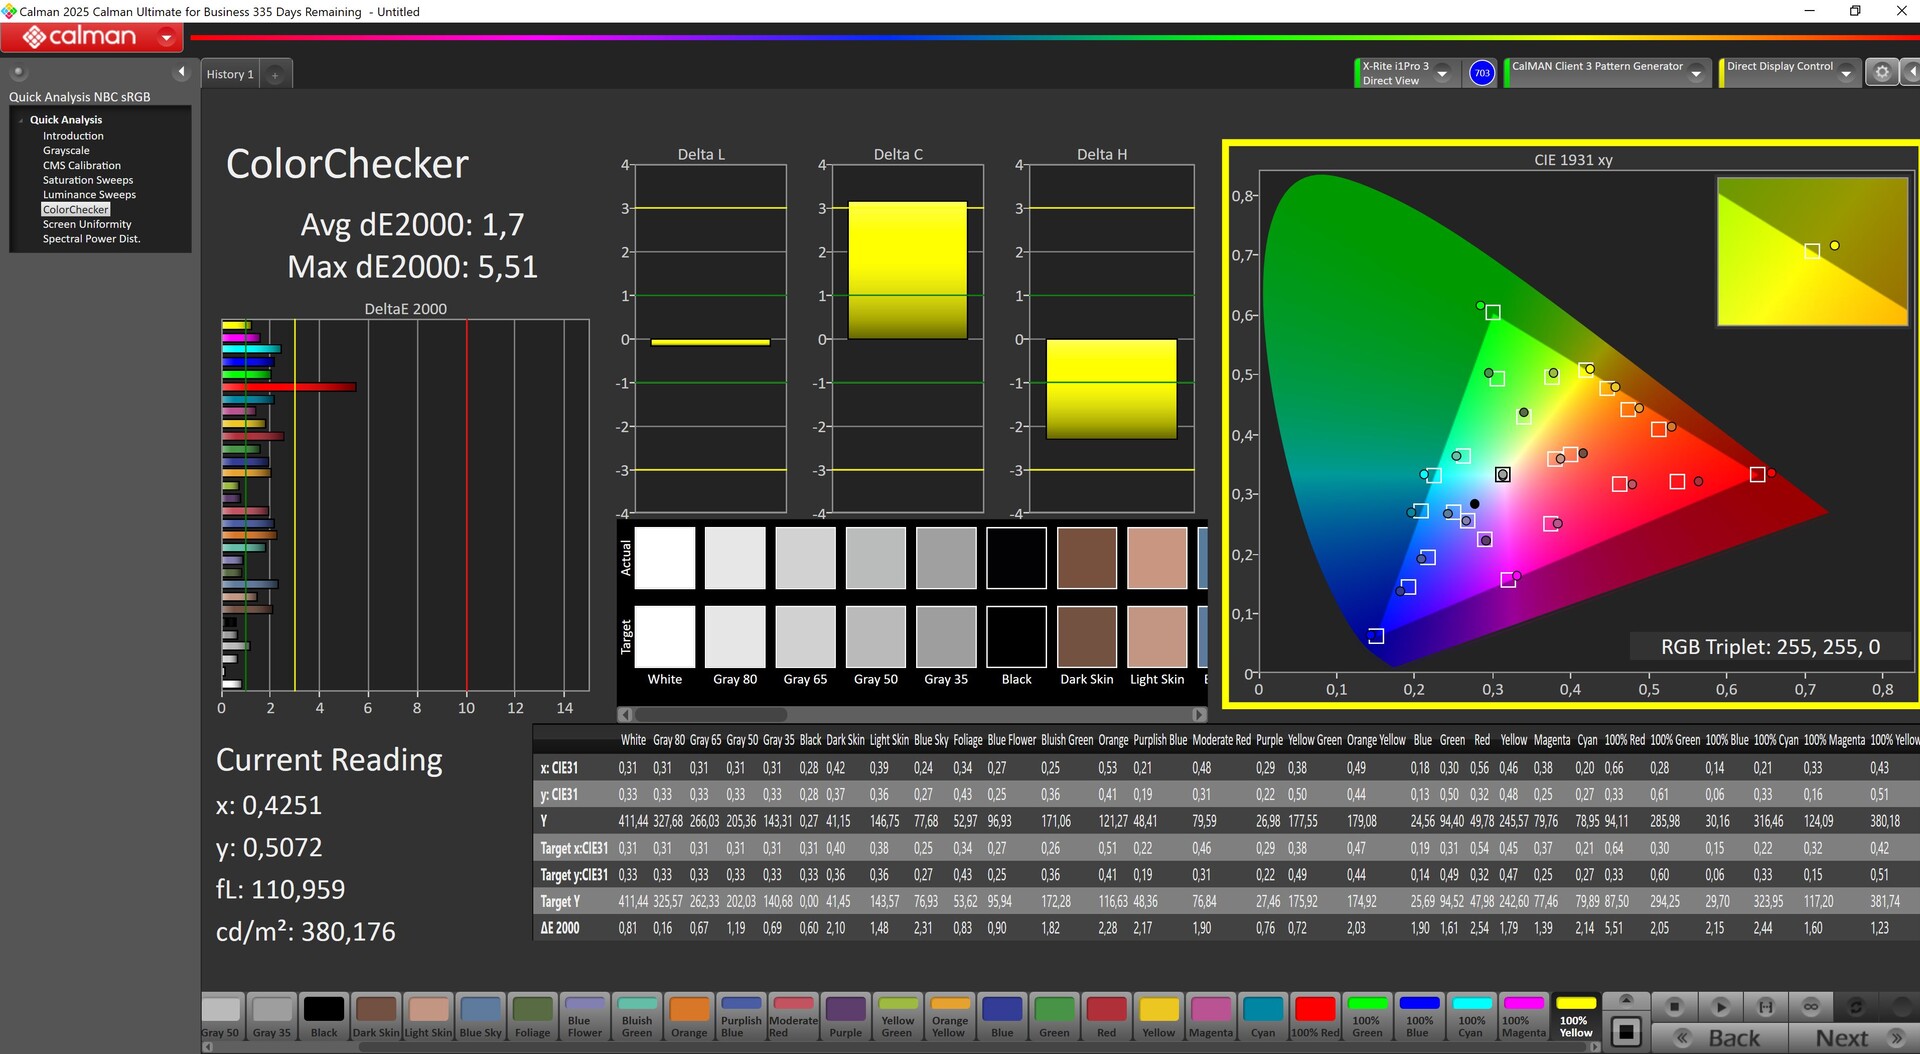
ΔE Color 3.3 | 0.5-29.43 Ø4.87, calibrated: 1.7
ΔE Greyscale 4.35 | 0.5-98 Ø5.1
75.9% AdobeRGB 1998 (Argyll 2.2.0 3D)
99.1% sRGB (Argyll 2.2.0 3D)
74.3% Display P3 (Argyll 2.2.0 3D)
Gamma: 2.51
| Dell Pro 13 Premium PA13250 B133UAN (AUOBEB0), IPS, 1920x1200, 13.3", 60 Hz | MSI Prestige 13 AI Plus Evo A2VMG ATNA33AA07-0, OLED, 2880x1800, 13.3", 60 Hz | Lenovo ThinkPad X13 2-in-1 Gen 5 Lenovo B133UAN01.2, IPS, 1920x1200, 13.3", 60 Hz | Framework Laptop 13.5 Core Ultra 7 155H BOE NE135A1M-NY1, IPS, 2880x1920, 13.5", 120 Hz | Dell XPS 13 9350 LG Philips 134WU2, IPS, 1920x1200, 13.4", 120 Hz | Microsoft Surface Pro Copilot+ LP129WT342166, IPS, 2880x1920, 13", 120 Hz | |
|---|---|---|---|---|---|---|
| Display | 20% | -4% | -2% | -6% | 6% | |
| Display P3 Coverage | 74.3 | 99.9 34% | 71.1 -4% | 72.8 -2% | 67.3 -9% | 83.4 12% |
| sRGB Coverage | 99.1 | 100 1% | 97.1 -2% | 98.6 -1% | 99 0% | 99.7 1% |
| AdobeRGB 1998 Coverage | 75.9 | 95.8 26% | 71.7 -6% | 72.9 -4% | 68.6 -10% | 79.4 5% |
| Response Times | 94% | -9% | 16% | 16% | 29% | |
| Response Time Grey 50% / Grey 80% * | 52.8 ? | 1.94 ? 96% | 50.2 ? 5% | 41.9 ? 21% | 37.3 ? 29% | 39.6 ? 25% |
| Response Time Black / White * | 26.4 ? | 2.02 ? 92% | 32.6 ? -23% | 23.7 ? 10% | 25.9 ? 2% | 18 ? 32% |
| PWM Frequency | 60 ? | |||||
| Screen | 17% | -9% | -11% | 31% | 4% | |
| Brightness middle | 456 | 382.4 -16% | 334 -27% | 498.5 9% | 462.8 1% | 585 28% |
| Brightness | 460 | 383 -17% | 308 -33% | 464 1% | 435 -5% | 574 25% |
| Brightness Distribution | 89 | 99 11% | 86 -3% | 86 -3% | 87 -2% | 89 0% |
| Black Level * | 0.23 | 0.37 -61% | 0.36 -57% | 0.19 17% | 0.56 -143% | |
| Contrast | 1983 | 903 -54% | 1385 -30% | 2436 23% | 1045 -47% | |
| Colorchecker dE 2000 * | 3.3 | 3.84 -16% | 2.36 28% | 4.27 -29% | 1.92 42% | 1.3 61% |
| Colorchecker dE 2000 max. * | 6.47 | 6.66 -3% | 4.93 24% | 7.08 -9% | 3.45 47% | 3 54% |
| Colorchecker dE 2000 calibrated * | 1.7 | 0.41 76% | 1.25 26% | 1.26 26% | 0.48 72% | |
| Greyscale dE 2000 * | 4.35 | 0.7 84% | 3.38 22% | 4.7 -8% | 0.6 86% | 2 54% |
| Gamma | 2.51 88% | 2.23 99% | 2.38 92% | 2.09 105% | 2.19 100% | 2.18 101% |
| CCT | 6215 105% | 6475 100% | 6352 102% | 7417 88% | 6539 99% | 6914 94% |
| Całkowita średnia (program / ustawienia) | 44% /
31% | -7% /
-8% | 1% /
-5% | 14% /
21% | 13% /
8% |
* ... im mniej tym lepiej
Po wyjęciu z pudełka panel nie jest szczególnie dobrze skalibrowany i chociaż nasza ręczna kalibracja zdołała poprawić wartości DeltaE zarówno w odniesieniu do skali szarości, jak i ColorChecker, nadal występował punkt odstający w czerwonym obszarze.
Wyświetl czasy reakcji
| ↔ Czas reakcji od czerni do bieli | ||
|---|---|---|
| 26.4 ms ... wzrost ↗ i spadek ↘ łącznie | ↗ 12.2 ms wzrost | 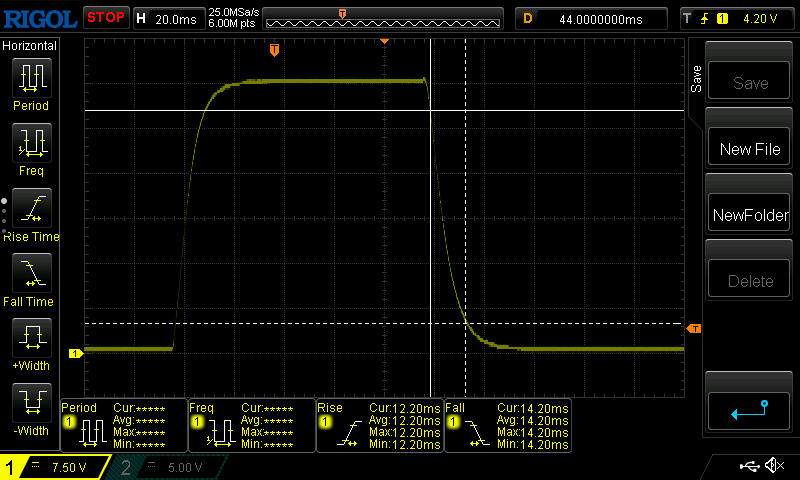 |
| ↘ 14.2 ms upadek | ||
| W naszych testach ekran wykazuje stosunkowo powolne tempo reakcji i może być zbyt wolny dla graczy. Dla porównania, wszystkie testowane urządzenia wahają się od 0.1 (minimum) do 240 (maksimum) ms. » 63 % wszystkich urządzeń jest lepszych. Oznacza to, że zmierzony czas reakcji jest gorszy od średniej wszystkich testowanych urządzeń (20.8 ms). | ||
| ↔ Czas reakcji 50% szarości do 80% szarości | ||
| 52.8 ms ... wzrost ↗ i spadek ↘ łącznie | ↗ 23.4 ms wzrost | 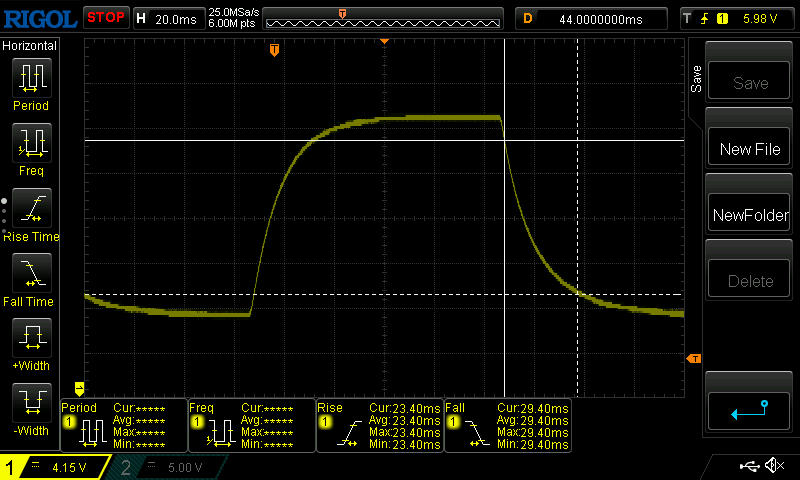 |
| ↘ 29.4 ms upadek | ||
| W naszych testach ekran wykazuje powolne tempo reakcji, co będzie niezadowalające dla graczy. Dla porównania, wszystkie testowane urządzenia wahają się od 0.165 (minimum) do 636 (maksimum) ms. » 89 % wszystkich urządzeń jest lepszych. Oznacza to, że zmierzony czas reakcji jest gorszy od średniej wszystkich testowanych urządzeń (32.5 ms). | ||
Migotanie ekranu / PWM (modulacja szerokości impulsu)
| Migotanie ekranu/nie wykryto PWM | 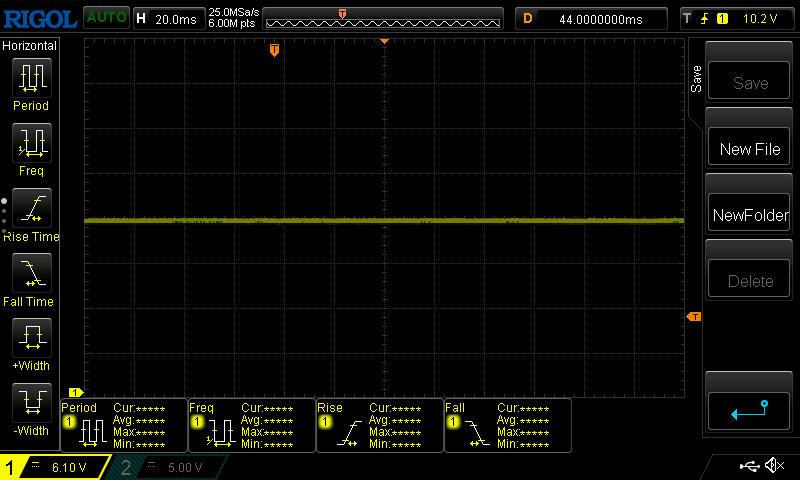 | ||
Dla porównania: 53 % wszystkich testowanych urządzeń nie używa PWM do przyciemniania wyświetlacza. Jeśli wykryto PWM, zmierzono średnio 8516 (minimum: 5 - maksimum: 343500) Hz. | |||

Na zewnątrz dobra jasność i kontrast, matowa powierzchnia, a także dobra stabilność kąta widzenia pomagają zapewnić w dużej mierze bezproblemową pracę.


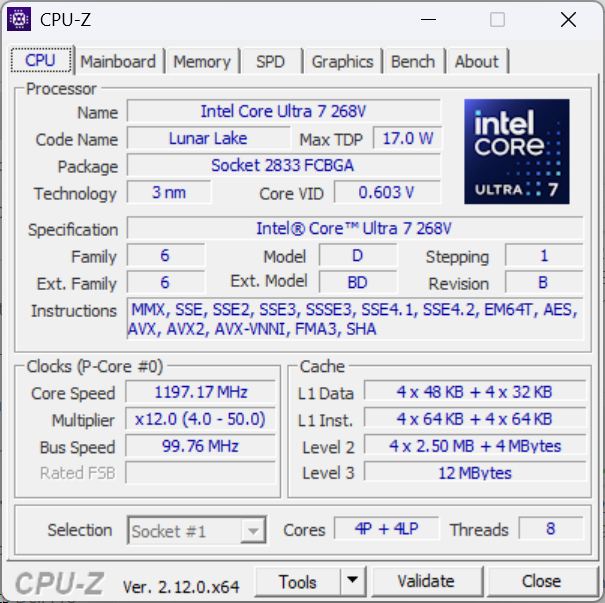
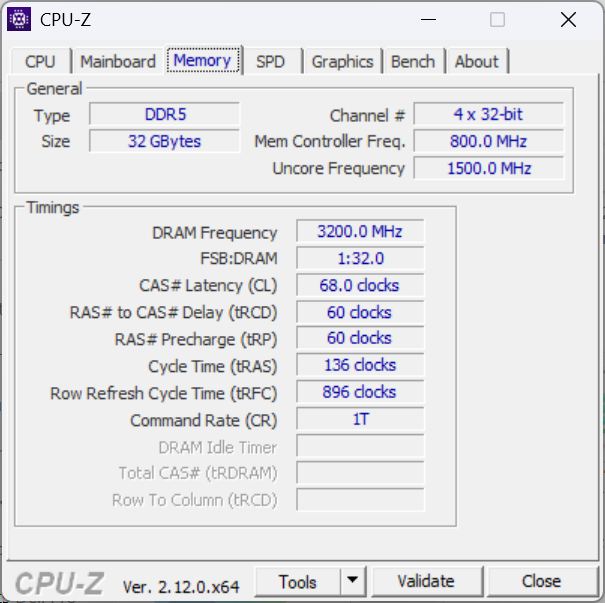
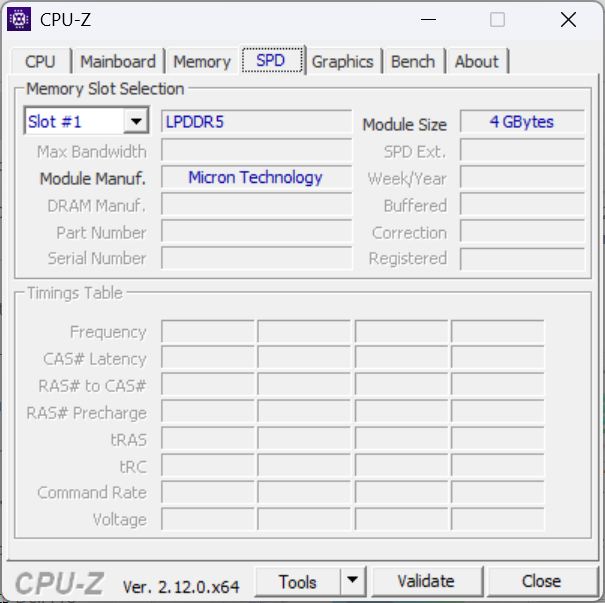
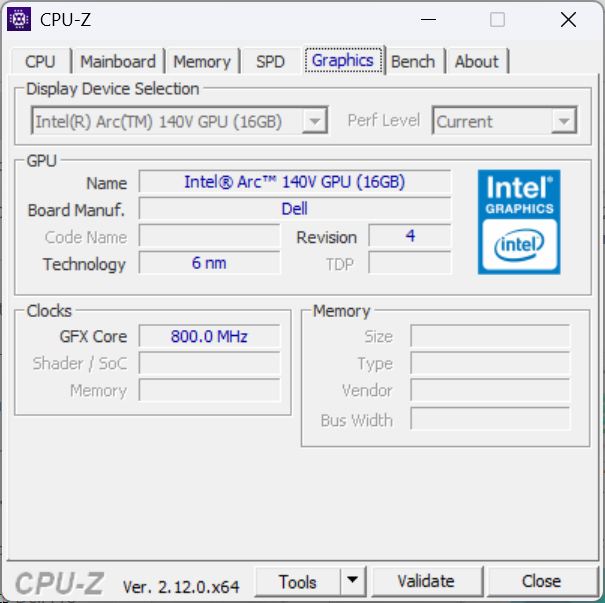
Wydajność - mocny łuk 140 V
Bijącym sercem jest nowy Intel Core Ultra 7 268V który jest również wyposażony w 32 GB wbudowanej pamięci RAM. Alternatywą jest wersja ze słabszym procesorem Core Ultra 5 236V i 16 GB pamięci RAM. Pamięć masowa jest również dostępna w różnych konfiguracjach (256 GB, 512 GB, 1 TB). Dell Pro 13 Premium jest wyraźnie skierowany do mobilnych użytkowników biznesowych.

Warunki testu
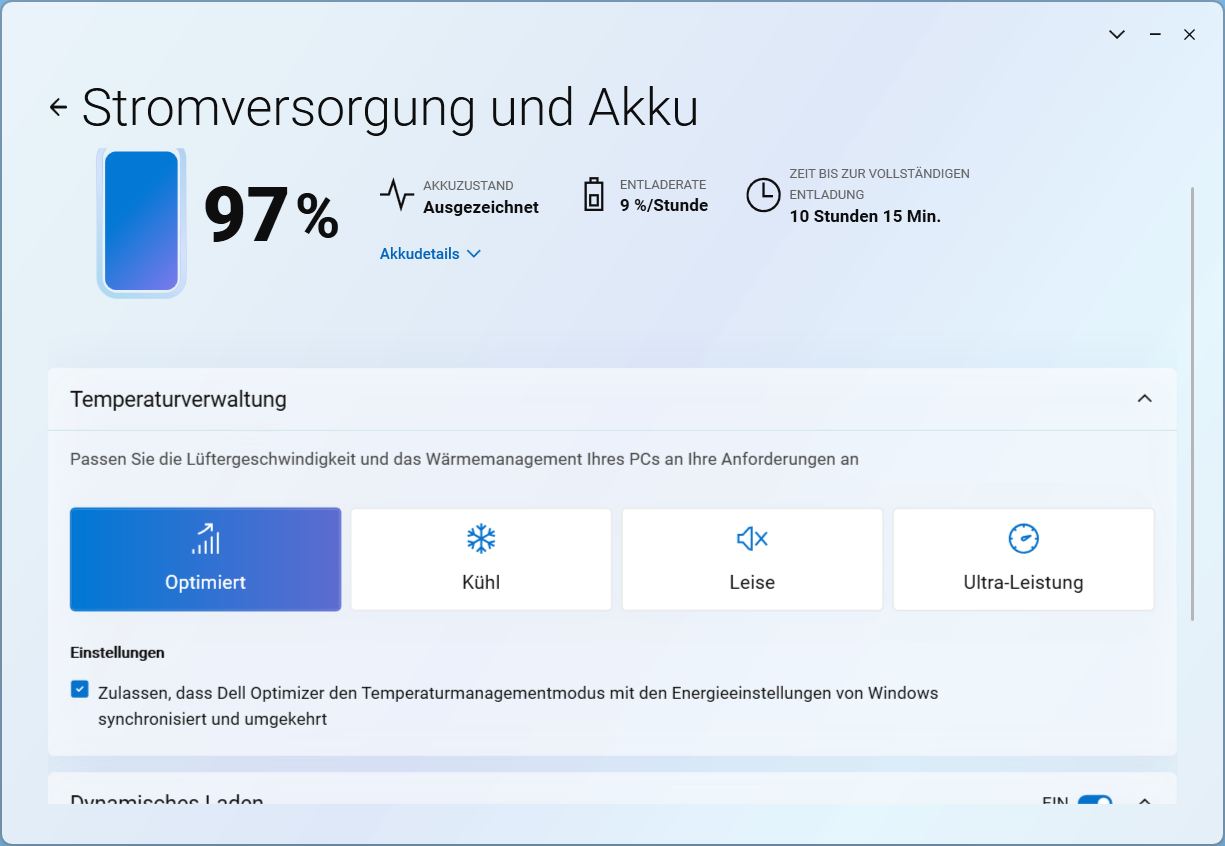
Dell Optimizer służy jako centrum sterowania, oferując ustawienia wentylatorów, które wpływają na wydajność i kilka innych opcji. W naszych testach porównawczych pozostawiliśmy go z wstępnie wybranym trybem "Zoptymalizowany".

Procesor
Procesor Intel Core Ultra 7 268V to jeden z wyższej klasy modeli z energooszczędnej rodziny Lunar Lake. Jego cztery rdzenie E i cztery rdzenie P taktowane są zegarem od 2,2 GHz do 5,0 GHz, a także posiadają 48 TOPS NPU.
Jego wydajność jednordzeniowa była szczególnie imponująca w każdym przeprowadzonym przez nas teście. W wielordzeniowych testach porównawczych procesor w Dell Pro 13 jest nieco rozczarowujący, często pozostając nieco w tyle za konkurencją, niektóre z nominalnie słabszymi procesorami. W trybie bateryjnym tracimy około 16 procent wydajności.
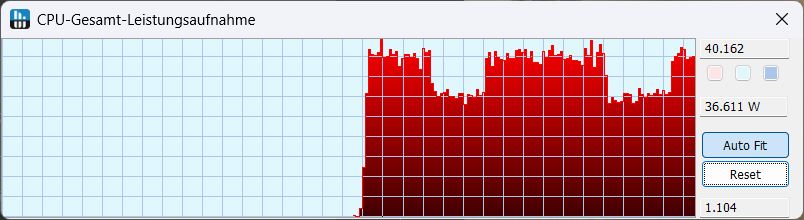
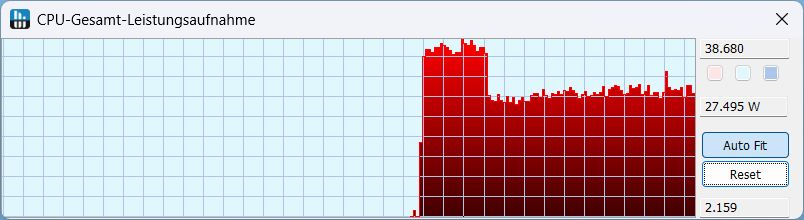
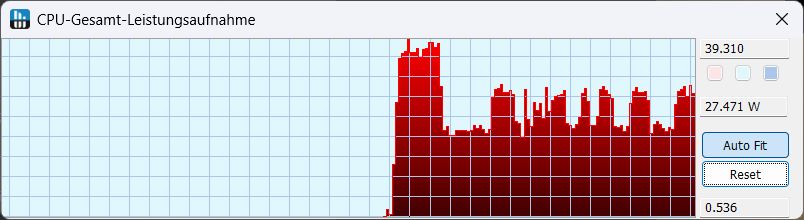
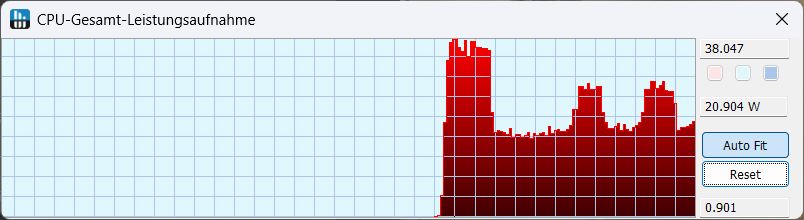
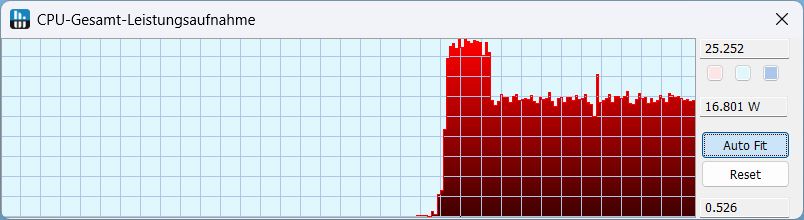
W pętli Cinebench R15 wydajność spadła o około 28 procent (!) w ciągu pierwszych trzech przebiegów, a następnie utrzymywała się na stałym poziomie. W standardowym trybie zoptymalizowanym pobór mocy początkowo wynosił około 38 W, a następnie spadł do 27 W. Obrazy po prawej stronie pokazują zachowanie poboru mocy w Cinebench R23, w zależności od trybu wentylatora.
Cinebench R15 Multi Continuous Test
Cinebench R23: Multi Core | Single Core
Cinebench R20: CPU (Multi Core) | CPU (Single Core)
Cinebench R15: CPU Multi 64Bit | CPU Single 64Bit
Blender: v2.79 BMW27 CPU
7-Zip 18.03: 7z b 4 | 7z b 4 -mmt1
Geekbench 6.4: Multi-Core | Single-Core
Geekbench 5.5: Multi-Core | Single-Core
HWBOT x265 Benchmark v2.2: 4k Preset
LibreOffice : 20 Documents To PDF
R Benchmark 2.5: Overall mean
| CPU Performance Rating | |
| Framework Laptop 13.5 Core Ultra 7 155H | |
| MSI Prestige 13 AI Plus Evo A2VMG | |
| Dell XPS 13 9350 | |
| Przeciętny Intel Core Ultra 7 268V | |
| Średnia w klasie Subnotebook | |
| Dell Pro 13 Premium PA13250 | |
| Lenovo ThinkPad X13 2-in-1 Gen 5 | |
| Microsoft Surface Pro Copilot+ -2! | |
| Cinebench R23 / Multi Core | |
| Framework Laptop 13.5 Core Ultra 7 155H | |
| Średnia w klasie Subnotebook (1555 - 21812, n=76, ostatnie 2 lata) | |
| MSI Prestige 13 AI Plus Evo A2VMG | |
| Dell XPS 13 9350 | |
| Przeciętny Intel Core Ultra 7 268V (9835 - 10535, n=2) | |
| Dell Pro 13 Premium PA13250 | |
| Microsoft Surface Pro Copilot+ | |
| Lenovo ThinkPad X13 2-in-1 Gen 5 | |
| Cinebench R23 / Single Core | |
| Dell Pro 13 Premium PA13250 | |
| Przeciętny Intel Core Ultra 7 268V (1910 - 1985, n=2) | |
| Dell XPS 13 9350 | |
| MSI Prestige 13 AI Plus Evo A2VMG | |
| Framework Laptop 13.5 Core Ultra 7 155H | |
| Średnia w klasie Subnotebook (358 - 2165, n=76, ostatnie 2 lata) | |
| Lenovo ThinkPad X13 2-in-1 Gen 5 | |
| Microsoft Surface Pro Copilot+ | |
| Cinebench R20 / CPU (Multi Core) | |
| Framework Laptop 13.5 Core Ultra 7 155H | |
| Średnia w klasie Subnotebook (579 - 8541, n=71, ostatnie 2 lata) | |
| MSI Prestige 13 AI Plus Evo A2VMG | |
| Dell XPS 13 9350 | |
| Przeciętny Intel Core Ultra 7 268V (3811 - 4129, n=2) | |
| Dell Pro 13 Premium PA13250 | |
| Lenovo ThinkPad X13 2-in-1 Gen 5 | |
| Microsoft Surface Pro Copilot+ | |
| Cinebench R20 / CPU (Single Core) | |
| Dell Pro 13 Premium PA13250 | |
| Przeciętny Intel Core Ultra 7 268V (736 - 764, n=2) | |
| Dell XPS 13 9350 | |
| MSI Prestige 13 AI Plus Evo A2VMG | |
| Framework Laptop 13.5 Core Ultra 7 155H | |
| Średnia w klasie Subnotebook (128 - 826, n=71, ostatnie 2 lata) | |
| Lenovo ThinkPad X13 2-in-1 Gen 5 | |
| Microsoft Surface Pro Copilot+ | |
| Cinebench R15 / CPU Multi 64Bit | |
| Framework Laptop 13.5 Core Ultra 7 155H | |
| Microsoft Surface Pro Copilot+ | |
| Średnia w klasie Subnotebook (327 - 3345, n=77, ostatnie 2 lata) | |
| MSI Prestige 13 AI Plus Evo A2VMG | |
| Przeciętny Intel Core Ultra 7 268V (1601 - 1616, n=2) | |
| Dell Pro 13 Premium PA13250 | |
| Dell XPS 13 9350 | |
| Lenovo ThinkPad X13 2-in-1 Gen 5 | |
| Cinebench R15 / CPU Single 64Bit | |
| Dell Pro 13 Premium PA13250 | |
| Przeciętny Intel Core Ultra 7 268V (287 - 302, n=2) | |
| Dell XPS 13 9350 | |
| MSI Prestige 13 AI Plus Evo A2VMG | |
| Framework Laptop 13.5 Core Ultra 7 155H | |
| Średnia w klasie Subnotebook (72.4 - 322, n=72, ostatnie 2 lata) | |
| Lenovo ThinkPad X13 2-in-1 Gen 5 | |
| Microsoft Surface Pro Copilot+ | |
| Blender / v2.79 BMW27 CPU | |
| Dell Pro 13 Premium PA13250 | |
| Microsoft Surface Pro Copilot+ | |
| Lenovo ThinkPad X13 2-in-1 Gen 5 | |
| Średnia w klasie Subnotebook (159 - 2271, n=75, ostatnie 2 lata) | |
| Przeciętny Intel Core Ultra 7 268V (337 - 410, n=2) | |
| Dell XPS 13 9350 | |
| MSI Prestige 13 AI Plus Evo A2VMG | |
| Framework Laptop 13.5 Core Ultra 7 155H | |
| 7-Zip 18.03 / 7z b 4 | |
| Framework Laptop 13.5 Core Ultra 7 155H | |
| Średnia w klasie Subnotebook (11668 - 77867, n=67, ostatnie 2 lata) | |
| Microsoft Surface Pro Copilot+ | |
| Dell XPS 13 9350 | |
| MSI Prestige 13 AI Plus Evo A2VMG | |
| Przeciętny Intel Core Ultra 7 268V (32797 - 35687, n=2) | |
| Dell Pro 13 Premium PA13250 | |
| Lenovo ThinkPad X13 2-in-1 Gen 5 | |
| 7-Zip 18.03 / 7z b 4 -mmt1 | |
| Przeciętny Intel Core Ultra 7 268V (5884 - 6021, n=2) | |
| Dell Pro 13 Premium PA13250 | |
| Dell XPS 13 9350 | |
| MSI Prestige 13 AI Plus Evo A2VMG | |
| Średnia w klasie Subnotebook (2643 - 6442, n=69, ostatnie 2 lata) | |
| Framework Laptop 13.5 Core Ultra 7 155H | |
| Microsoft Surface Pro Copilot+ | |
| Lenovo ThinkPad X13 2-in-1 Gen 5 | |
| Geekbench 6.4 / Multi-Core | |
| Microsoft Surface Pro Copilot+ | |
| Framework Laptop 13.5 Core Ultra 7 155H | |
| Średnia w klasie Subnotebook (2244 - 17489, n=72, ostatnie 2 lata) | |
| MSI Prestige 13 AI Plus Evo A2VMG | |
| Dell XPS 13 9350 | |
| Przeciętny Intel Core Ultra 7 268V (10589 - 11279, n=3) | |
| Dell Pro 13 Premium PA13250 | |
| Lenovo ThinkPad X13 2-in-1 Gen 5 | |
| Geekbench 6.4 / Single-Core | |
| Dell Pro 13 Premium PA13250 | |
| Dell XPS 13 9350 | |
| Przeciętny Intel Core Ultra 7 268V (2583 - 2871, n=3) | |
| MSI Prestige 13 AI Plus Evo A2VMG | |
| Średnia w klasie Subnotebook (960 - 3655, n=67, ostatnie 2 lata) | |
| Microsoft Surface Pro Copilot+ | |
| Framework Laptop 13.5 Core Ultra 7 155H | |
| Lenovo ThinkPad X13 2-in-1 Gen 5 | |
| Lenovo ThinkPad X13 2-in-1 Gen 5 | |
| Geekbench 5.5 / Multi-Core | |
| Framework Laptop 13.5 Core Ultra 7 155H | |
| Średnia w klasie Subnotebook (2557 - 17218, n=68, ostatnie 2 lata) | |
| Przeciętny Intel Core Ultra 7 268V (9491 - 9801, n=3) | |
| MSI Prestige 13 AI Plus Evo A2VMG | |
| Dell Pro 13 Premium PA13250 | |
| Dell XPS 13 9350 | |
| Lenovo ThinkPad X13 2-in-1 Gen 5 | |
| Geekbench 5.5 / Single-Core | |
| Przeciętny Intel Core Ultra 7 268V (2008 - 2091, n=3) | |
| Dell XPS 13 9350 | |
| Dell Pro 13 Premium PA13250 | |
| MSI Prestige 13 AI Plus Evo A2VMG | |
| Średnia w klasie Subnotebook (726 - 2350, n=68, ostatnie 2 lata) | |
| Framework Laptop 13.5 Core Ultra 7 155H | |
| Lenovo ThinkPad X13 2-in-1 Gen 5 | |
| HWBOT x265 Benchmark v2.2 / 4k Preset | |
| MSI Prestige 13 AI Plus Evo A2VMG | |
| Framework Laptop 13.5 Core Ultra 7 155H | |
| Dell XPS 13 9350 | |
| Średnia w klasie Subnotebook (0.97 - 25.1, n=70, ostatnie 2 lata) | |
| Przeciętny Intel Core Ultra 7 268V (10.4 - 12.9, n=2) | |
| Dell Pro 13 Premium PA13250 | |
| Lenovo ThinkPad X13 2-in-1 Gen 5 | |
| Microsoft Surface Pro Copilot+ | |
| LibreOffice / 20 Documents To PDF | |
| Dell Pro 13 Premium PA13250 | |
| Microsoft Surface Pro Copilot+ | |
| Lenovo ThinkPad X13 2-in-1 Gen 5 | |
| Średnia w klasie Subnotebook (38.5 - 220, n=68, ostatnie 2 lata) | |
| Przeciętny Intel Core Ultra 7 268V (48 - 60.8, n=2) | |
| Dell XPS 13 9350 | |
| MSI Prestige 13 AI Plus Evo A2VMG | |
| Framework Laptop 13.5 Core Ultra 7 155H | |
| R Benchmark 2.5 / Overall mean | |
| Microsoft Surface Pro Copilot+ | |
| Lenovo ThinkPad X13 2-in-1 Gen 5 | |
| Średnia w klasie Subnotebook (0.403 - 1.456, n=70, ostatnie 2 lata) | |
| Framework Laptop 13.5 Core Ultra 7 155H | |
| MSI Prestige 13 AI Plus Evo A2VMG | |
| Dell XPS 13 9350 | |
| Przeciętny Intel Core Ultra 7 268V (0.4344 - 0.4565, n=2) | |
| Dell Pro 13 Premium PA13250 | |
* ... im mniej tym lepiej
AIDA64: FP32 Ray-Trace | FPU Julia | CPU SHA3 | CPU Queen | FPU SinJulia | FPU Mandel | CPU AES | CPU ZLib | FP64 Ray-Trace | CPU PhotoWorxx
| Performance Rating | |
| Framework Laptop 13.5 Core Ultra 7 155H | |
| Średnia w klasie Subnotebook | |
| MSI Prestige 13 AI Plus Evo A2VMG | |
| Dell XPS 13 9350 | |
| Przeciętny Intel Core Ultra 7 268V | |
| Dell Pro 13 Premium PA13250 | |
| Lenovo ThinkPad X13 2-in-1 Gen 5 | |
| Microsoft Surface Pro Copilot+ | |
| AIDA64 / FP32 Ray-Trace | |
| Średnia w klasie Subnotebook (1135 - 32888, n=70, ostatnie 2 lata) | |
| MSI Prestige 13 AI Plus Evo A2VMG | |
| Dell XPS 13 9350 | |
| Framework Laptop 13.5 Core Ultra 7 155H | |
| Przeciętny Intel Core Ultra 7 268V (10556 - 11547, n=2) | |
| Dell Pro 13 Premium PA13250 | |
| Microsoft Surface Pro Copilot+ | |
| Lenovo ThinkPad X13 2-in-1 Gen 5 | |
| AIDA64 / FPU Julia | |
| MSI Prestige 13 AI Plus Evo A2VMG | |
| Dell XPS 13 9350 | |
| Framework Laptop 13.5 Core Ultra 7 155H | |
| Średnia w klasie Subnotebook (5218 - 123315, n=70, ostatnie 2 lata) | |
| Przeciętny Intel Core Ultra 7 268V (47659 - 56299, n=2) | |
| Dell Pro 13 Premium PA13250 | |
| Lenovo ThinkPad X13 2-in-1 Gen 5 | |
| Microsoft Surface Pro Copilot+ | |
| AIDA64 / CPU SHA3 | |
| Średnia w klasie Subnotebook (444 - 5287, n=70, ostatnie 2 lata) | |
| MSI Prestige 13 AI Plus Evo A2VMG | |
| Framework Laptop 13.5 Core Ultra 7 155H | |
| Dell XPS 13 9350 | |
| Przeciętny Intel Core Ultra 7 268V (2117 - 2538, n=2) | |
| Dell Pro 13 Premium PA13250 | |
| Lenovo ThinkPad X13 2-in-1 Gen 5 | |
| Microsoft Surface Pro Copilot+ | |
| AIDA64 / CPU Queen | |
| Framework Laptop 13.5 Core Ultra 7 155H | |
| Średnia w klasie Subnotebook (10579 - 115682, n=70, ostatnie 2 lata) | |
| Microsoft Surface Pro Copilot+ | |
| MSI Prestige 13 AI Plus Evo A2VMG | |
| Dell Pro 13 Premium PA13250 | |
| Przeciętny Intel Core Ultra 7 268V (49645 - 49759, n=2) | |
| Dell XPS 13 9350 | |
| Lenovo ThinkPad X13 2-in-1 Gen 5 | |
| AIDA64 / FPU SinJulia | |
| Framework Laptop 13.5 Core Ultra 7 155H | |
| Średnia w klasie Subnotebook (744 - 18418, n=70, ostatnie 2 lata) | |
| Lenovo ThinkPad X13 2-in-1 Gen 5 | |
| Dell XPS 13 9350 | |
| MSI Prestige 13 AI Plus Evo A2VMG | |
| Przeciętny Intel Core Ultra 7 268V (4353 - 4426, n=2) | |
| Dell Pro 13 Premium PA13250 | |
| Microsoft Surface Pro Copilot+ | |
| AIDA64 / FPU Mandel | |
| MSI Prestige 13 AI Plus Evo A2VMG | |
| Dell XPS 13 9350 | |
| Średnia w klasie Subnotebook (3341 - 65433, n=70, ostatnie 2 lata) | |
| Framework Laptop 13.5 Core Ultra 7 155H | |
| Przeciętny Intel Core Ultra 7 268V (25929 - 29637, n=2) | |
| Dell Pro 13 Premium PA13250 | |
| Lenovo ThinkPad X13 2-in-1 Gen 5 | |
| Microsoft Surface Pro Copilot+ | |
| AIDA64 / CPU AES | |
| Framework Laptop 13.5 Core Ultra 7 155H | |
| Microsoft Surface Pro Copilot+ | |
| Średnia w klasie Subnotebook (638 - 161430, n=70, ostatnie 2 lata) | |
| Dell XPS 13 9350 | |
| MSI Prestige 13 AI Plus Evo A2VMG | |
| Lenovo ThinkPad X13 2-in-1 Gen 5 | |
| Przeciętny Intel Core Ultra 7 268V (33196 - 38706, n=2) | |
| Dell Pro 13 Premium PA13250 | |
| AIDA64 / CPU ZLib | |
| Framework Laptop 13.5 Core Ultra 7 155H | |
| Średnia w klasie Subnotebook (164.9 - 1379, n=70, ostatnie 2 lata) | |
| Microsoft Surface Pro Copilot+ | |
| MSI Prestige 13 AI Plus Evo A2VMG | |
| Dell XPS 13 9350 | |
| Lenovo ThinkPad X13 2-in-1 Gen 5 | |
| Przeciętny Intel Core Ultra 7 268V (441 - 583, n=2) | |
| Dell Pro 13 Premium PA13250 | |
| AIDA64 / FP64 Ray-Trace | |
| MSI Prestige 13 AI Plus Evo A2VMG | |
| Średnia w klasie Subnotebook (610 - 17495, n=70, ostatnie 2 lata) | |
| Dell XPS 13 9350 | |
| Przeciętny Intel Core Ultra 7 268V (5938 - 6214, n=2) | |
| Framework Laptop 13.5 Core Ultra 7 155H | |
| Dell Pro 13 Premium PA13250 | |
| Lenovo ThinkPad X13 2-in-1 Gen 5 | |
| Microsoft Surface Pro Copilot+ | |
| AIDA64 / CPU PhotoWorxx | |
| MSI Prestige 13 AI Plus Evo A2VMG | |
| Dell XPS 13 9350 | |
| Przeciętny Intel Core Ultra 7 268V (46733 - 53540, n=2) | |
| Dell Pro 13 Premium PA13250 | |
| Framework Laptop 13.5 Core Ultra 7 155H | |
| Średnia w klasie Subnotebook (6569 - 64588, n=70, ostatnie 2 lata) | |
| Lenovo ThinkPad X13 2-in-1 Gen 5 | |
| Microsoft Surface Pro Copilot+ | |
Wydajność systemu
W PCMark 10 i CrossMark porównywane urządzenia są blisko siebie, ale zarówno w tym obszarze, jak i w testach internetowych, nasz Dell Pro plasuje się bardziej pośrodku niż walczy o pierwsze miejsce.

CrossMark: Overall | Productivity | Creativity | Responsiveness
WebXPRT 3: Overall
WebXPRT 4: Overall
Mozilla Kraken 1.1: Total
| PCMark 10 / Score | |
| Przeciętny Intel Core Ultra 7 268V, Intel Arc Graphics 140V (6729 - 7236, n=2) | |
| Dell XPS 13 9350 | |
| Framework Laptop 13.5 Core Ultra 7 155H | |
| MSI Prestige 13 AI Plus Evo A2VMG | |
| Dell Pro 13 Premium PA13250 | |
| Średnia w klasie Subnotebook (4993 - 7788, n=59, ostatnie 2 lata) | |
| Lenovo ThinkPad X13 2-in-1 Gen 5 | |
| PCMark 10 / Essentials | |
| Lenovo ThinkPad X13 2-in-1 Gen 5 | |
| Framework Laptop 13.5 Core Ultra 7 155H | |
| Średnia w klasie Subnotebook (9363 - 11331, n=59, ostatnie 2 lata) | |
| Przeciętny Intel Core Ultra 7 268V, Intel Arc Graphics 140V (10007 - 10701, n=2) | |
| MSI Prestige 13 AI Plus Evo A2VMG | |
| Dell Pro 13 Premium PA13250 | |
| Dell XPS 13 9350 | |
| PCMark 10 / Productivity | |
| Dell XPS 13 9350 | |
| Przeciętny Intel Core Ultra 7 268V, Intel Arc Graphics 140V (8766 - 9217, n=2) | |
| Dell Pro 13 Premium PA13250 | |
| Framework Laptop 13.5 Core Ultra 7 155H | |
| Średnia w klasie Subnotebook (5435 - 10623, n=59, ostatnie 2 lata) | |
| MSI Prestige 13 AI Plus Evo A2VMG | |
| Lenovo ThinkPad X13 2-in-1 Gen 5 | |
| PCMark 10 / Digital Content Creation | |
| MSI Prestige 13 AI Plus Evo A2VMG | |
| Przeciętny Intel Core Ultra 7 268V, Intel Arc Graphics 140V (9425 - 10427, n=2) | |
| Dell XPS 13 9350 | |
| Framework Laptop 13.5 Core Ultra 7 155H | |
| Dell Pro 13 Premium PA13250 | |
| Średnia w klasie Subnotebook (5305 - 12442, n=59, ostatnie 2 lata) | |
| Lenovo ThinkPad X13 2-in-1 Gen 5 | |
| CrossMark / Overall | |
| Dell XPS 13 9350 | |
| MSI Prestige 13 AI Plus Evo A2VMG | |
| Przeciętny Intel Core Ultra 7 268V, Intel Arc Graphics 140V (1643 - 1738, n=2) | |
| Framework Laptop 13.5 Core Ultra 7 155H | |
| Dell Pro 13 Premium PA13250 | |
| Średnia w klasie Subnotebook (365 - 2018, n=68, ostatnie 2 lata) | |
| Lenovo ThinkPad X13 2-in-1 Gen 5 | |
| Microsoft Surface Pro Copilot+ | |
| CrossMark / Productivity | |
| Dell XPS 13 9350 | |
| MSI Prestige 13 AI Plus Evo A2VMG | |
| Przeciętny Intel Core Ultra 7 268V, Intel Arc Graphics 140V (1577 - 1680, n=2) | |
| Framework Laptop 13.5 Core Ultra 7 155H | |
| Dell Pro 13 Premium PA13250 | |
| Lenovo ThinkPad X13 2-in-1 Gen 5 | |
| Średnia w klasie Subnotebook (364 - 1875, n=68, ostatnie 2 lata) | |
| Microsoft Surface Pro Copilot+ | |
| CrossMark / Creativity | |
| MSI Prestige 13 AI Plus Evo A2VMG | |
| Dell XPS 13 9350 | |
| Przeciętny Intel Core Ultra 7 268V, Intel Arc Graphics 140V (1866 - 1976, n=2) | |
| Framework Laptop 13.5 Core Ultra 7 155H | |
| Dell Pro 13 Premium PA13250 | |
| Średnia w klasie Subnotebook (372 - 2396, n=68, ostatnie 2 lata) | |
| Lenovo ThinkPad X13 2-in-1 Gen 5 | |
| Microsoft Surface Pro Copilot+ | |
| CrossMark / Responsiveness | |
| Lenovo ThinkPad X13 2-in-1 Gen 5 | |
| Framework Laptop 13.5 Core Ultra 7 155H | |
| Dell XPS 13 9350 | |
| Średnia w klasie Subnotebook (312 - 1899, n=68, ostatnie 2 lata) | |
| MSI Prestige 13 AI Plus Evo A2VMG | |
| Przeciętny Intel Core Ultra 7 268V, Intel Arc Graphics 140V (1267 - 1311, n=2) | |
| Dell Pro 13 Premium PA13250 | |
| Microsoft Surface Pro Copilot+ | |
| WebXPRT 3 / Overall | |
| Microsoft Surface Pro Copilot+ | |
| Średnia w klasie Subnotebook (156 - 479, n=67, ostatnie 2 lata) | |
| Dell XPS 13 9350 | |
| MSI Prestige 13 AI Plus Evo A2VMG | |
| Framework Laptop 13.5 Core Ultra 7 155H | |
| Przeciętny Intel Core Ultra 7 268V, Intel Arc Graphics 140V (266 - 310, n=2) | |
| Dell Pro 13 Premium PA13250 | |
| Lenovo ThinkPad X13 2-in-1 Gen 5 | |
| WebXPRT 4 / Overall | |
| MSI Prestige 13 AI Plus Evo A2VMG | |
| Dell XPS 13 9350 | |
| Przeciętny Intel Core Ultra 7 268V, Intel Arc Graphics 140V (245 - 287, n=2) | |
| Średnia w klasie Subnotebook (132 - 348, n=68, ostatnie 2 lata) | |
| Microsoft Surface Pro Copilot+ | |
| Framework Laptop 13.5 Core Ultra 7 155H | |
| Dell Pro 13 Premium PA13250 | |
| Lenovo ThinkPad X13 2-in-1 Gen 5 | |
| Mozilla Kraken 1.1 / Total | |
| Lenovo ThinkPad X13 2-in-1 Gen 5 | |
| Framework Laptop 13.5 Core Ultra 7 155H | |
| Średnia w klasie Subnotebook (278 - 1104, n=76, ostatnie 2 lata) | |
| Dell Pro 13 Premium PA13250 | |
| Przeciętny Intel Core Ultra 7 268V, Intel Arc Graphics 140V (475 - 476, n=2) | |
| MSI Prestige 13 AI Plus Evo A2VMG | |
| Dell XPS 13 9350 | |
| Microsoft Surface Pro Copilot+ | |
* ... im mniej tym lepiej
| PCMark 10 Score | 6729 pkt. | |
Pomoc | ||
| AIDA64 / Memory Copy | |
| MSI Prestige 13 AI Plus Evo A2VMG | |
| Przeciętny Intel Core Ultra 7 268V (100445 - 107108, n=2) | |
| Dell XPS 13 9350 | |
| Dell Pro 13 Premium PA13250 | |
| Średnia w klasie Subnotebook (14554 - 109035, n=70, ostatnie 2 lata) | |
| Framework Laptop 13.5 Core Ultra 7 155H | |
| Lenovo ThinkPad X13 2-in-1 Gen 5 | |
| Microsoft Surface Pro Copilot+ | |
| AIDA64 / Memory Read | |
| Microsoft Surface Pro Copilot+ | |
| Dell XPS 13 9350 | |
| MSI Prestige 13 AI Plus Evo A2VMG | |
| Przeciętny Intel Core Ultra 7 268V (82511 - 88341, n=2) | |
| Dell Pro 13 Premium PA13250 | |
| Framework Laptop 13.5 Core Ultra 7 155H | |
| Średnia w klasie Subnotebook (15948 - 122210, n=70, ostatnie 2 lata) | |
| Lenovo ThinkPad X13 2-in-1 Gen 5 | |
| AIDA64 / Memory Write | |
| MSI Prestige 13 AI Plus Evo A2VMG | |
| Przeciętny Intel Core Ultra 7 268V (115959 - 117888, n=2) | |
| Dell Pro 13 Premium PA13250 | |
| Dell XPS 13 9350 | |
| Średnia w klasie Subnotebook (15709 - 117898, n=70, ostatnie 2 lata) | |
| Framework Laptop 13.5 Core Ultra 7 155H | |
| Lenovo ThinkPad X13 2-in-1 Gen 5 | |
| Microsoft Surface Pro Copilot+ | |
| AIDA64 / Memory Latency | |
| Lenovo ThinkPad X13 2-in-1 Gen 5 | |
| Framework Laptop 13.5 Core Ultra 7 155H | |
| Średnia w klasie Subnotebook (7.2 - 187.8, n=69, ostatnie 2 lata) | |
| Dell Pro 13 Premium PA13250 | |
| MSI Prestige 13 AI Plus Evo A2VMG | |
| Dell XPS 13 9350 | |
| Przeciętny Intel Core Ultra 7 268V (97.4 - 101.2, n=2) | |
| Microsoft Surface Pro Copilot+ | |
* ... im mniej tym lepiej
Opóźnienia DPC
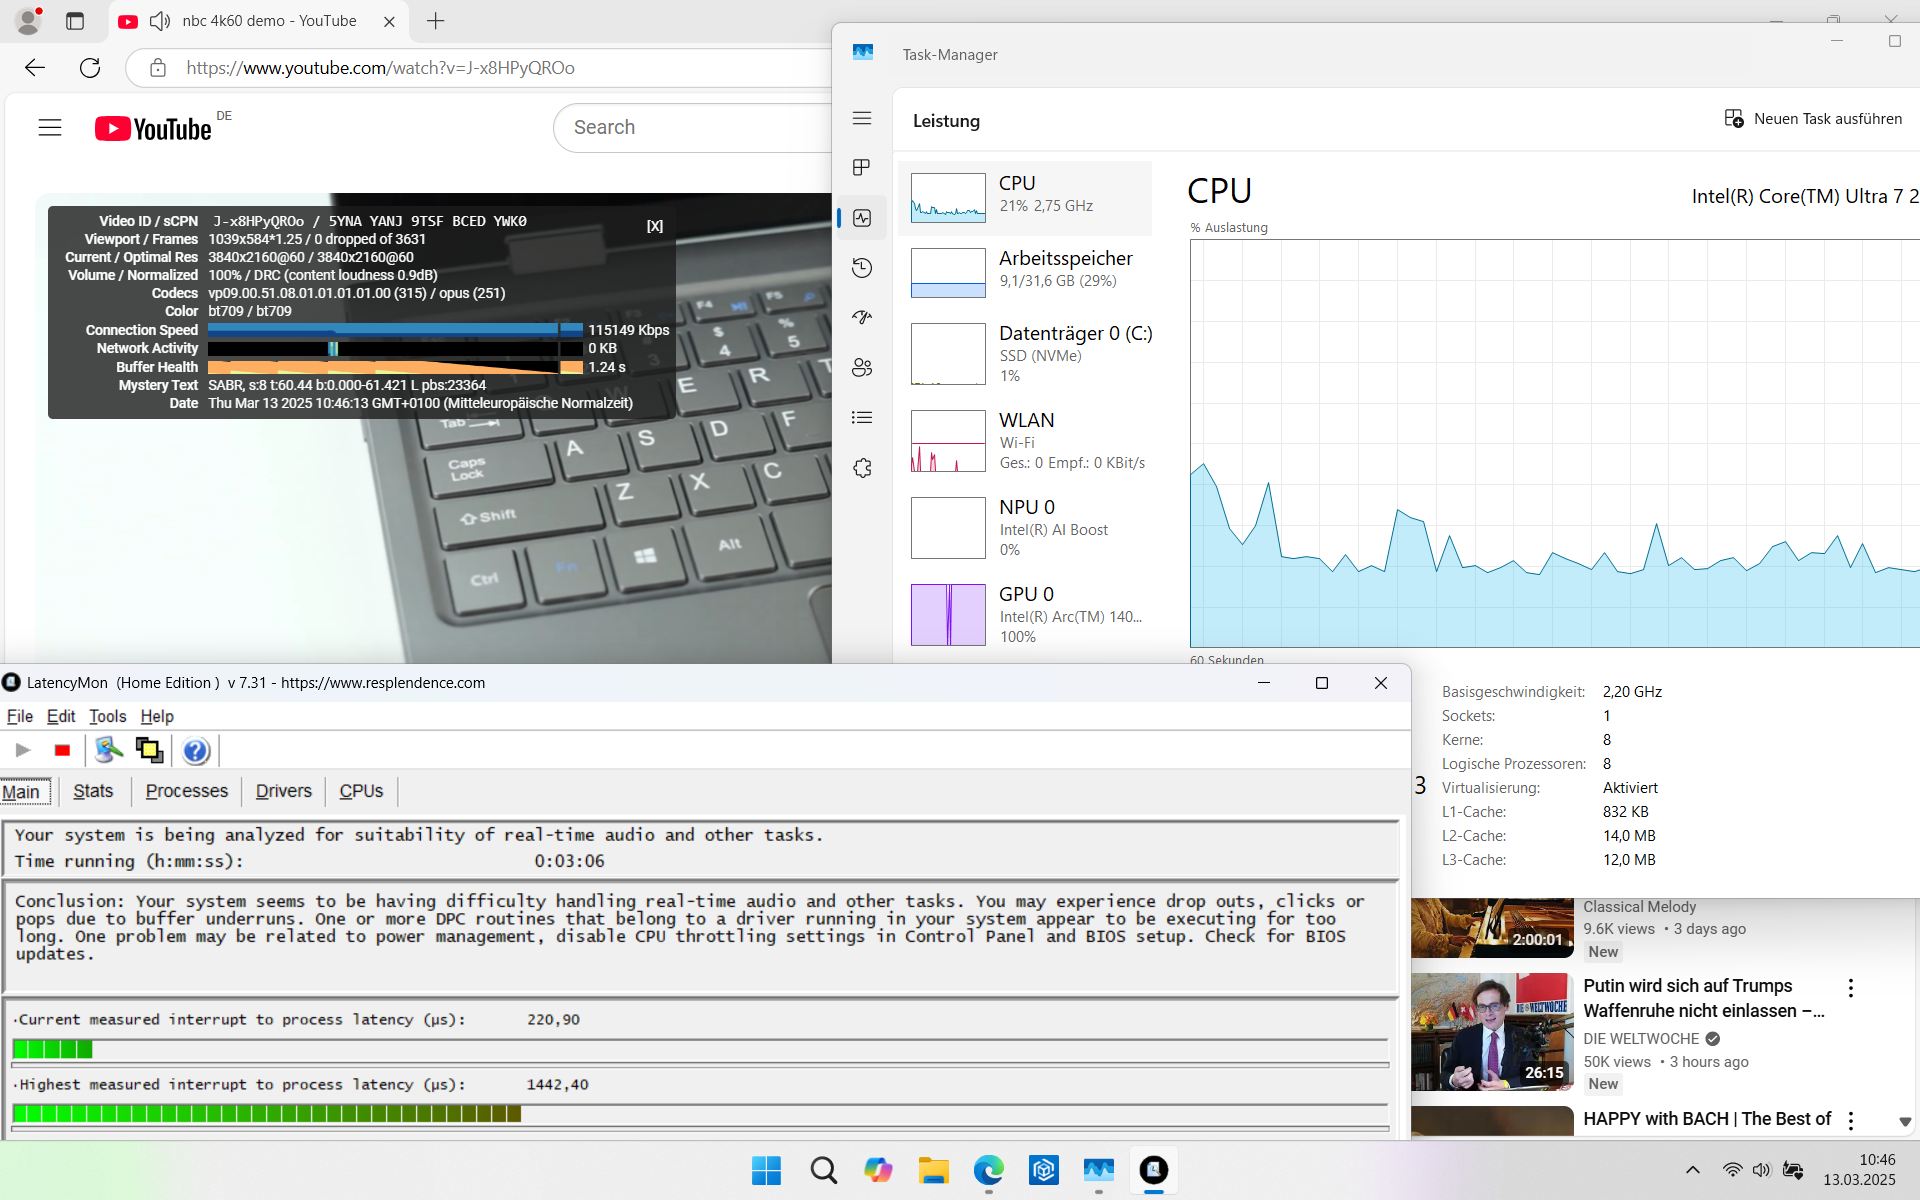
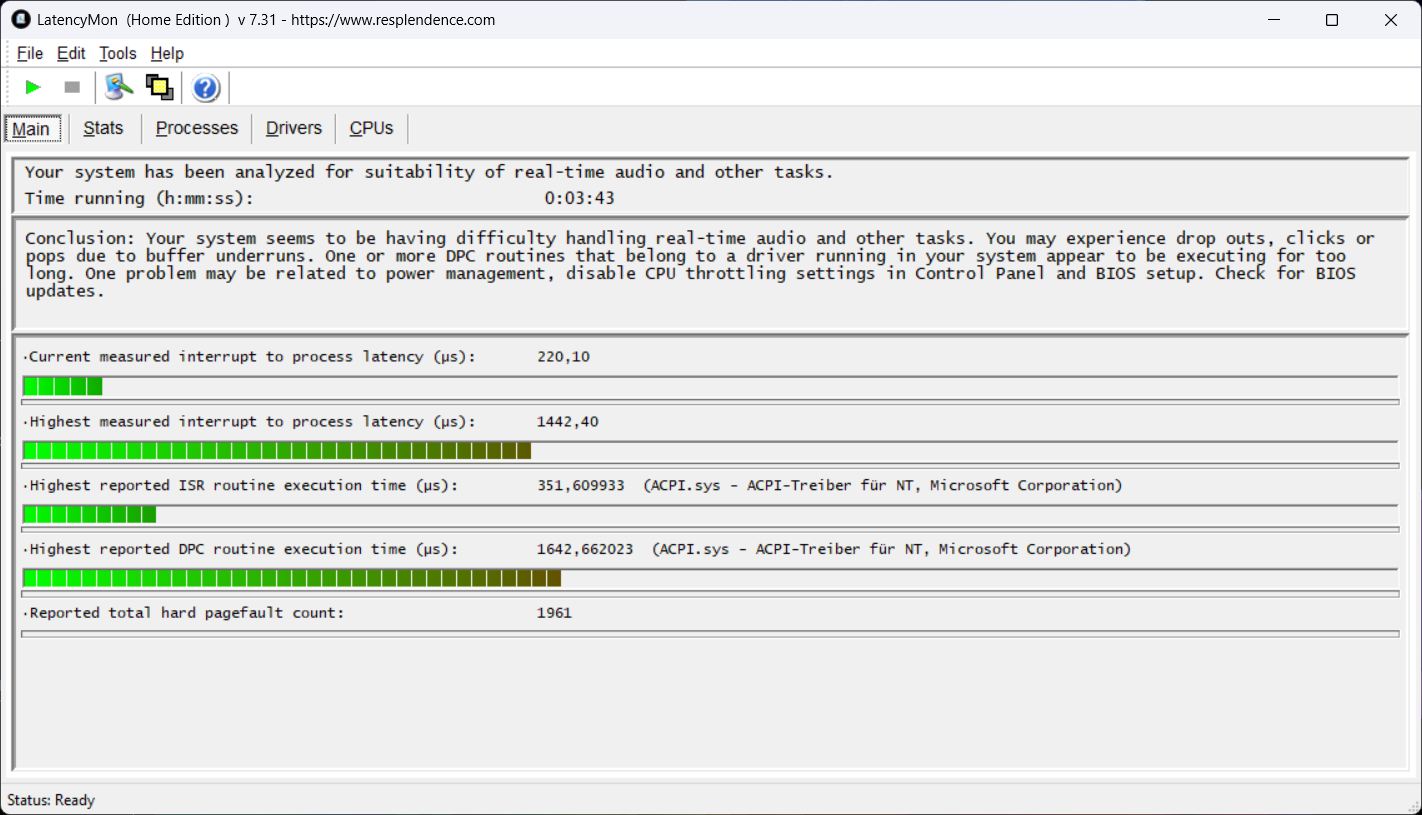
Pierwsze poważne problemy z opóźnieniami pojawiły się podczas otwierania wielu kart przeglądarki. Opóźnienie wzrosło podczas odtwarzania naszego filmu 4K/60fps na YouTube, który na szczęście nadal działał bez utraty klatek. Ostateczna wartość jest dla nas nieco zbyt wysoka.
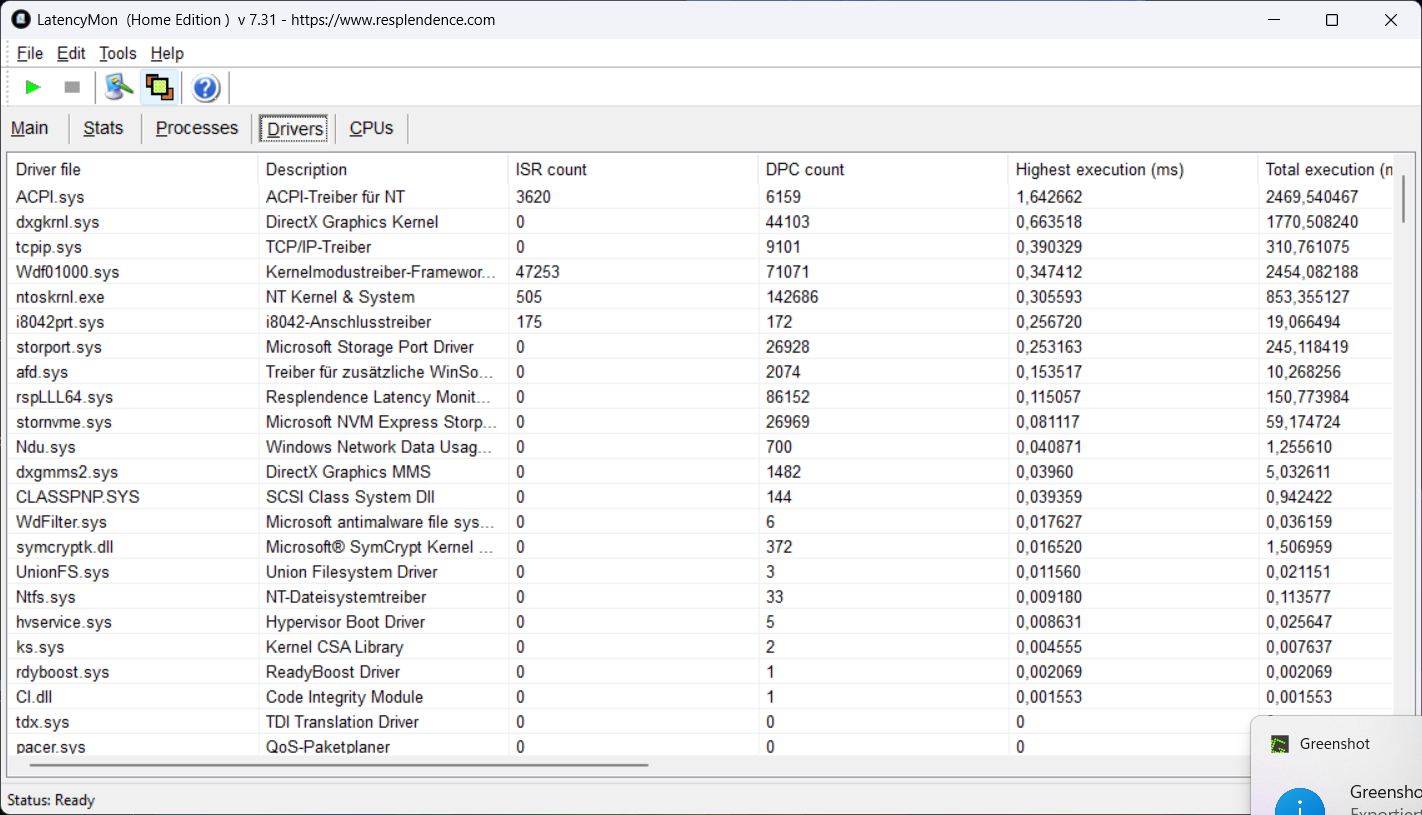
| DPC Latencies / LatencyMon - interrupt to process latency (max), Web, Youtube, Prime95 | |
| Dell Pro 13 Premium PA13250 | |
| Lenovo ThinkPad X13 2-in-1 Gen 5 | |
| MSI Prestige 13 AI Plus Evo A2VMG | |
| Framework Laptop 13.5 Core Ultra 7 155H | |
* ... im mniej tym lepiej
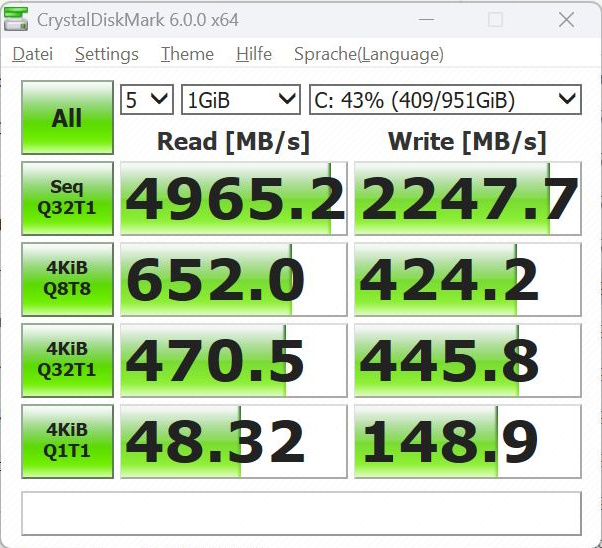
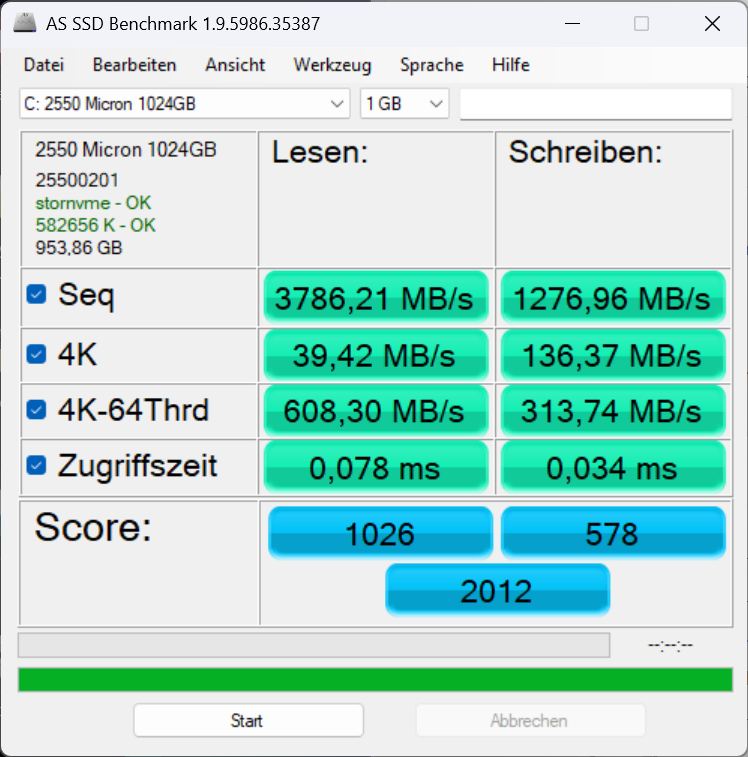
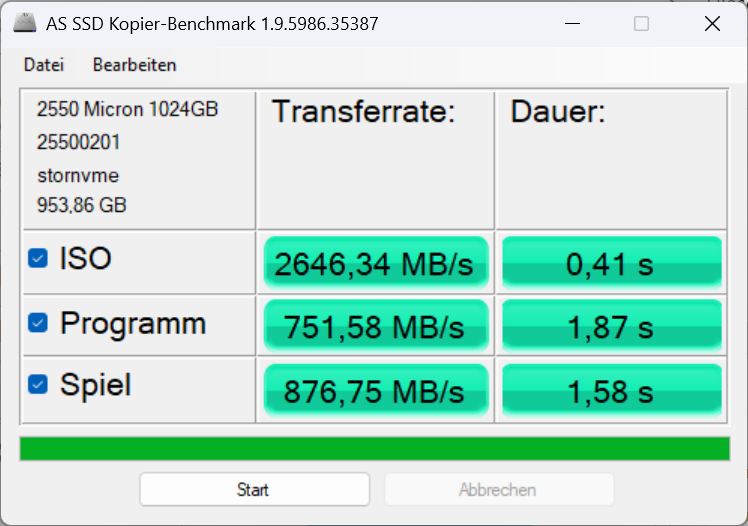
Pamięć masowa
Pamięć masowa ma postać 1 TB Micron 2550, choć w zależności od konfiguracji dostępne są również modele 512 GB. Ogólnie rzecz biorąc, dysk jest rozczarowujący pod względem szybkości, ale wydajność pozostaje dość spójna w czasie.

* ... im mniej tym lepiej
Continuous Performance Read: DiskSpd Read Loop, Queue Depth 8
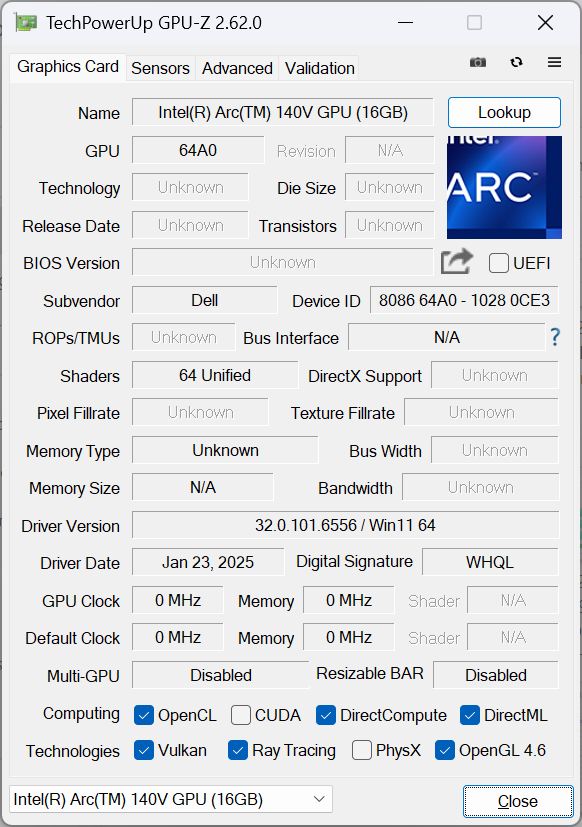
Karta graficzna
Karta graficzna Intel Arc Graphics 140V iGPU To stosunkowo szybka zintegrowana karta graficzna. W syntetycznych benchmarkach 3DMark wypadła na poziomie lub nieco powyżej naszych oczekiwań. Nie zauważyliśmy żadnego spadku wydajności w zapętlonym Fire Strike działającym na zasilaniu bateryjnym.
Imponująco wypadła również w grach, gdzie niemal każda gra działała w rozdzielczości Full HD i średnich detalach powyżej 30 klatek na sekundę, a w niektórych przypadkach wystarczały nawet wysokie detale. 30-minutowa liczba klatek na sekundę w Cyberpunk 2077 wyglądała bardzo spójnie.
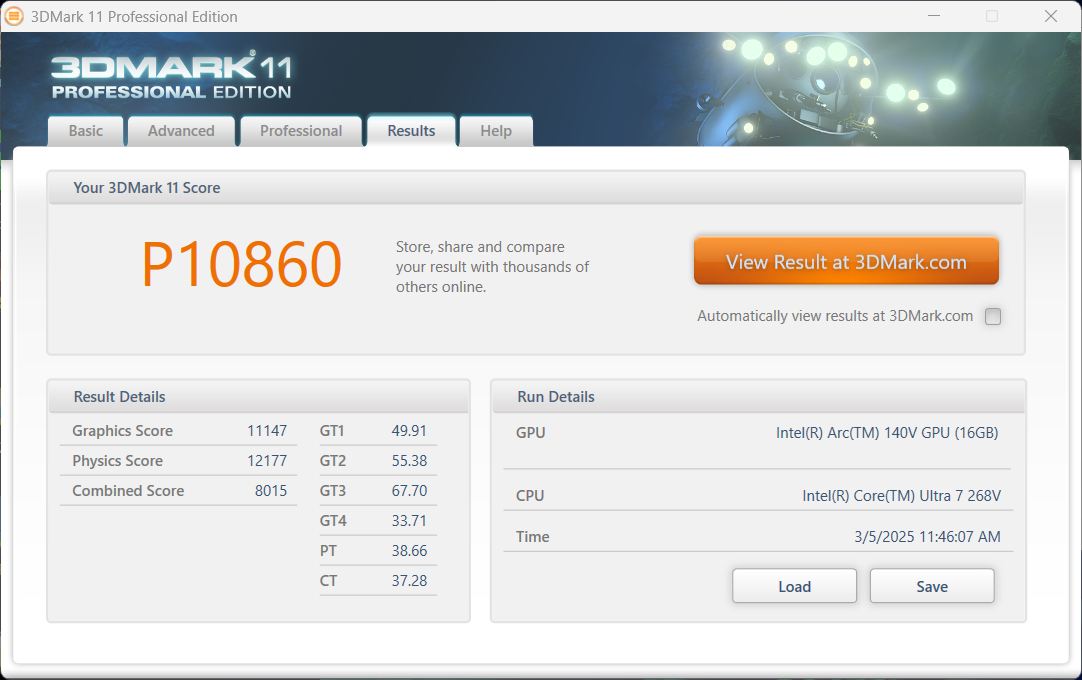
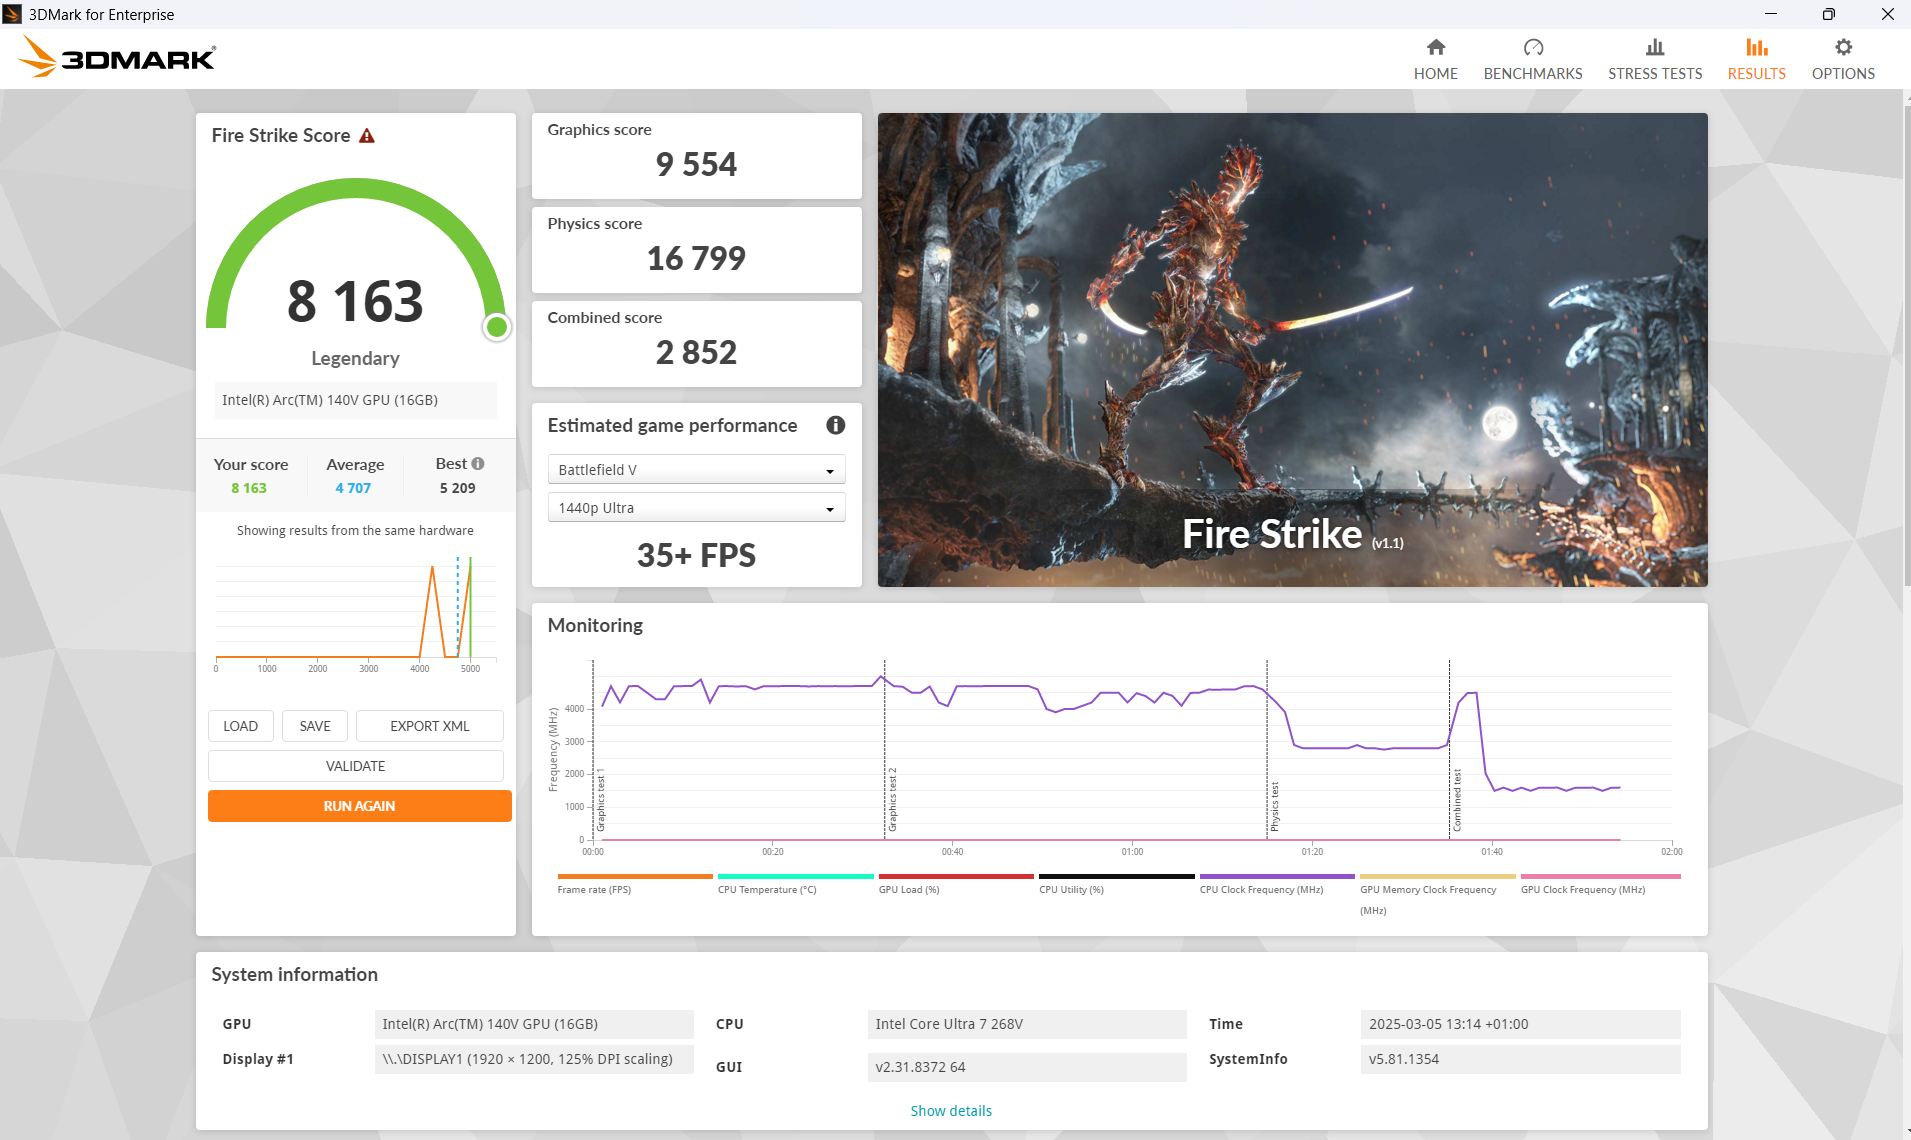
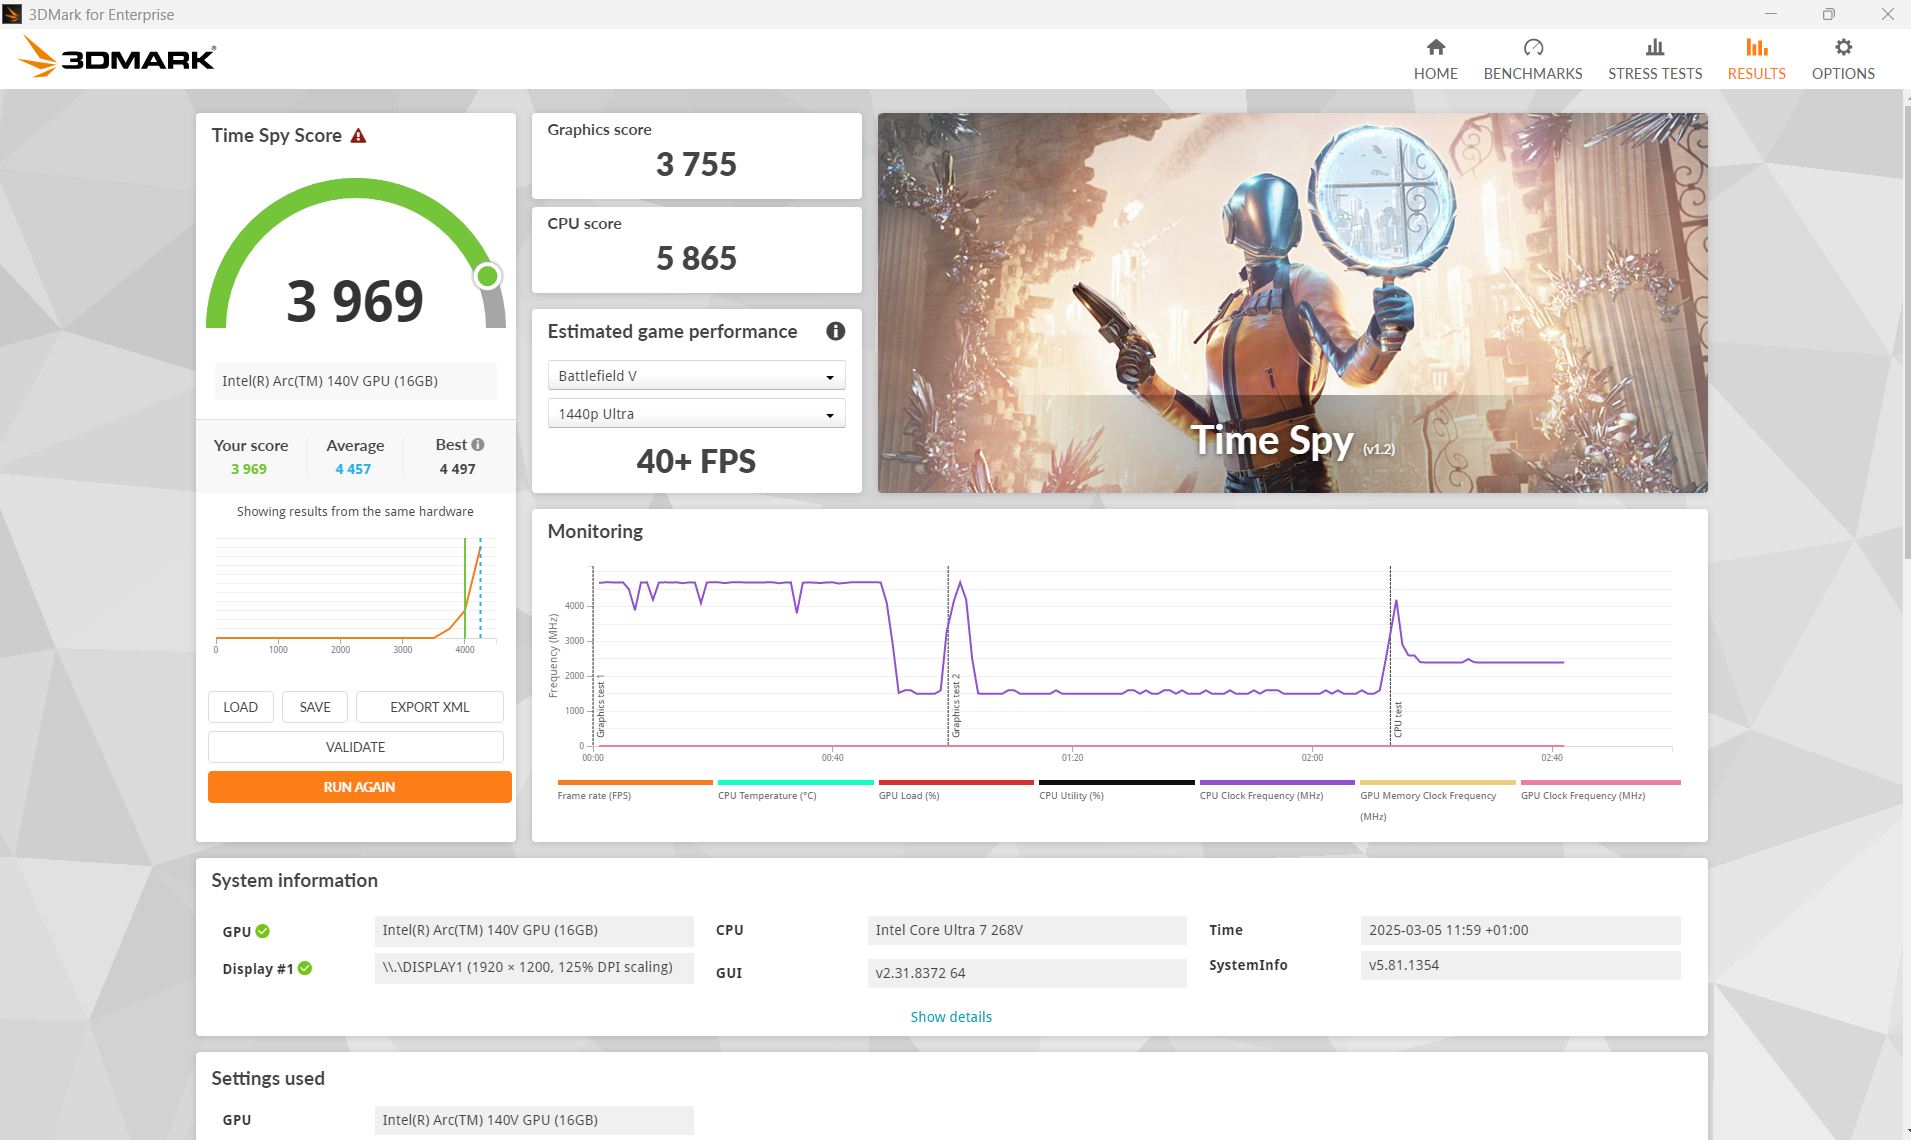
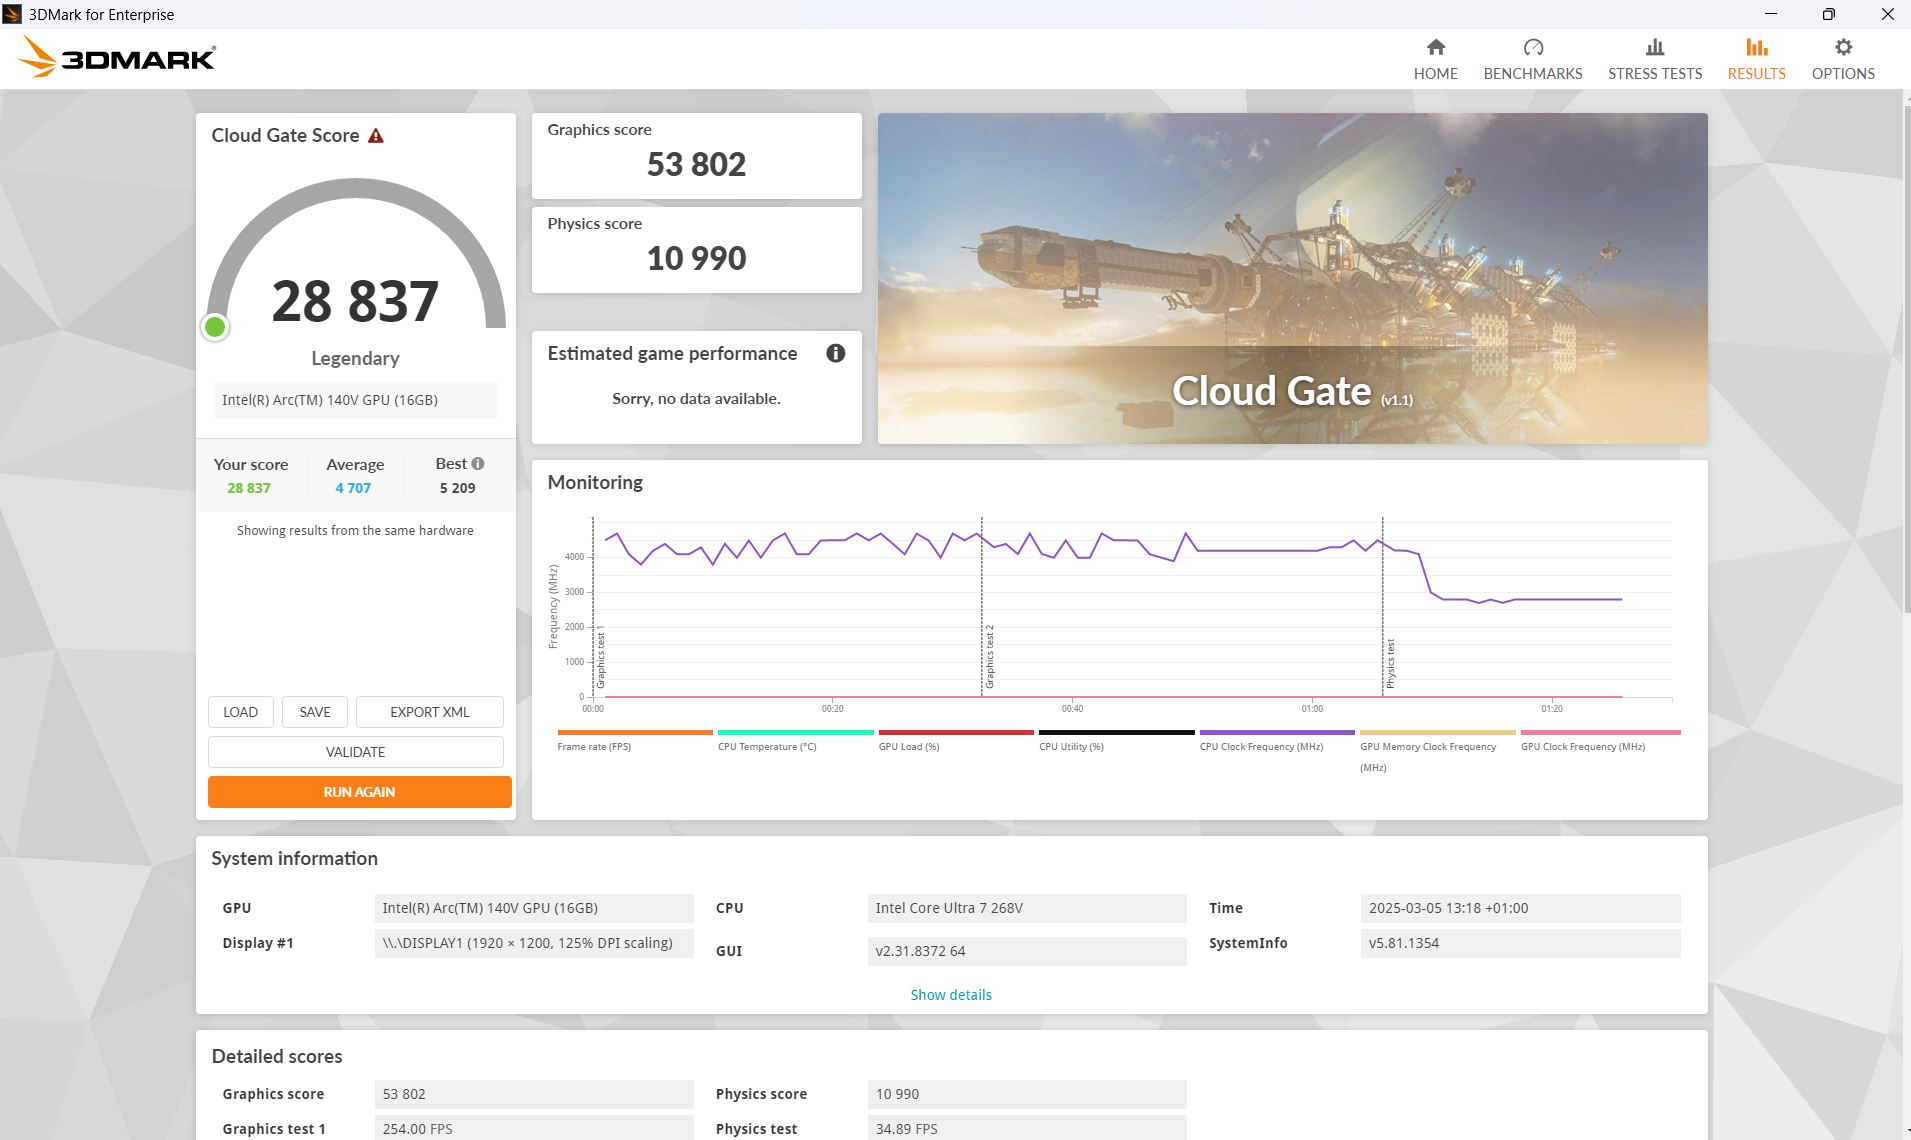
| 3DMark 11 Performance | 10860 pkt. | |
| 3DMark Cloud Gate Standard Score | 28837 pkt. | |
| 3DMark Fire Strike Score | 8163 pkt. | |
| 3DMark Time Spy Score | 3969 pkt. | |
Pomoc | ||
* ... im mniej tym lepiej
| Cyberpunk 2077 2.2 Phantom Liberty - 1920x1080 Ultra Preset (FSR off) | |
| MSI Prestige 13 AI Plus Evo A2VMG | |
| Dell Pro 13 Premium PA13250 | |
| Framework Laptop 13.5 Core Ultra 7 155H | |
| Średnia w klasie Subnotebook (8.48 - 31.4, n=47, ostatnie 2 lata) | |
| Dell XPS 13 9350 | |
| Microsoft Surface Pro Copilot+ | |
| Lenovo ThinkPad X13 2-in-1 Gen 5 | |
| GTA V - 1920x1080 Highest Settings possible AA:4xMSAA + FX AF:16x | |
| MSI Prestige 13 AI Plus Evo A2VMG | |
| Dell Pro 13 Premium PA13250 | |
| Dell XPS 13 9350 | |
| Microsoft Surface Pro Copilot+ | |
| Średnia w klasie Subnotebook (7.81 - 53, n=67, ostatnie 2 lata) | |
| Framework Laptop 13.5 Core Ultra 7 155H | |
| Lenovo ThinkPad X13 2-in-1 Gen 5 | |
Cyberpunk 2077 ultra FPS diagram
| low | med. | high | ultra | |
|---|---|---|---|---|
| GTA V (2015) | 153.4 | 140 | 26.3 | |
| Dota 2 Reborn (2015) | 107.5 | 101.7 | 87.8 | 71.2 |
| Final Fantasy XV Benchmark (2018) | 74.9 | 42.3 | 29.1 | |
| X-Plane 11.11 (2018) | 48.1 | 36.7 | 32.7 | |
| Strange Brigade (2018) | 223 | 83.3 | 69.5 | 57.8 |
| Baldur's Gate 3 (2023) | 45.5 | 35.7 | 31.3 | 30.8 |
| Cyberpunk 2077 2.2 Phantom Liberty (2023) | 43.5 | 35.4 | 28.6 | 28.1 |
Emisje i energia - Dell Pro jest ekonomiczny
Emisja hałasu
Wentylatory są zazwyczaj ciche podczas bezczynności. Podczas grania pod maksymalnym obciążeniem zmierzyliśmy maksymalnie 42 dB, ale w rzeczywistości był on niższy (nawet w testach obciążeniowych) i często osiągał tylko 36 lub 37 dB.
Hałas
| luz |
| 23 / 23 / 23 dB |
| obciążenie |
| 37 / 42.74 dB |
 | ||
30 dB cichy 40 dB(A) słyszalny 50 dB(A) irytujący |
||
min: | ||
| Dell Pro 13 Premium PA13250 Arc 140V, Core Ultra 7 268V, Micron 2550 1TB | MSI Prestige 13 AI Plus Evo A2VMG Arc 140V, Core Ultra 7 258V | Lenovo ThinkPad X13 2-in-1 Gen 5 Graphics 4-Core, Ultra 7 165U, Lenovo UMIS RPETJ1T24MHP2QDQ | Framework Laptop 13.5 Core Ultra 7 155H Arc 8-Core, Ultra 7 155H | Dell XPS 13 9350 Arc 140V, Core Ultra 7 256V, Micron 2550 512GB | Microsoft Surface Pro Copilot+ Adreno X1-85 3.8 TFLOPS, SD X Plus X1P-64-100, Samsung PM9B1 256GB MZ9L4256HCJQ | |
|---|---|---|---|---|---|---|
| Noise | -8% | 4% | -7% | 3% | 2% | |
| wyłączone / środowisko * | 23 | 24.1 -5% | 23 -0% | 24 -4% | 24.1 -5% | 23.8 -3% |
| Idle Minimum * | 23 | 24.8 -8% | 23 -0% | 24.1 -5% | 24.4 -6% | 23.8 -3% |
| Idle Average * | 23 | 24.8 -8% | 23 -0% | 25.1 -9% | 24.4 -6% | 23.8 -3% |
| Idle Maximum * | 23 | 26.7 -16% | 23 -0% | 27 -17% | 24.4 -6% | 23.8 -3% |
| Load Average * | 37 | 36.8 1% | 34.44 7% | 38.4 -4% | 26.2 29% | 23.8 36% |
| Cyberpunk 2077 ultra * | 42.74 | 44.5 -4% | 38.28 10% | 43.7 -2% | 34.2 20% | 44.7 -5% |
| Load Maximum * | 42.74 | 50.8 -19% | 39.04 9% | 45.8 -7% | 45.2 -6% | 44.7 -5% |
* ... im mniej tym lepiej
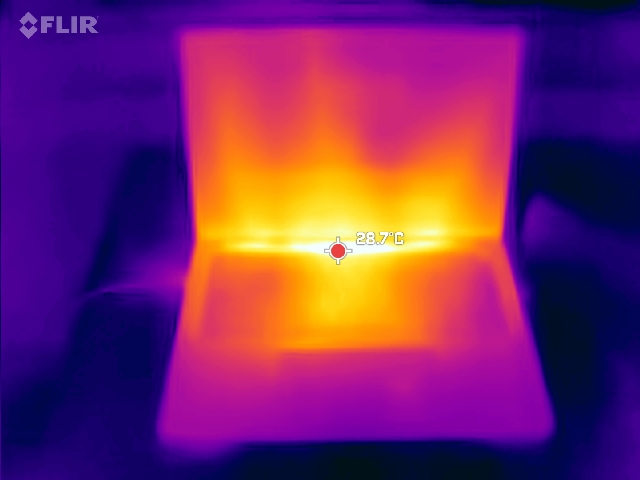
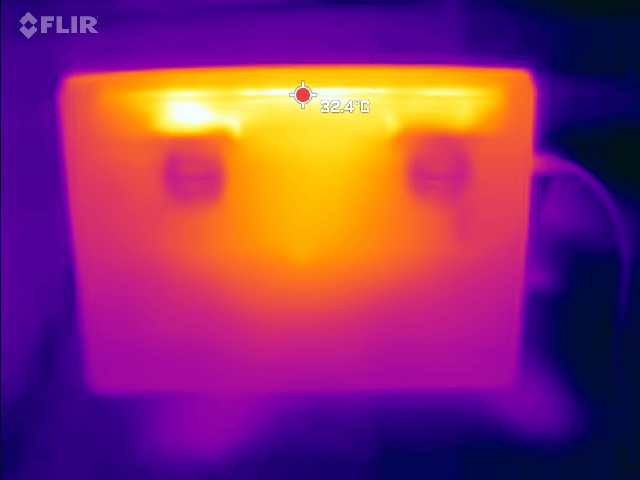
Temperatura
W przeciwieństwie do wielu biurowych i biznesowych konkurentów tej wielkości, Dell Pro 13 Premium wykorzystuje dwa wentylatory zamiast tylko jednego, co ma pozytywny wpływ na temperatury powierzchni. W grach jest cieplej niż w naszym teście warunków skrajnych, ale nawet tutaj zmierzyliśmy gorące punkty o temperaturze zaledwie 37°C. Obie strony laptopa są chłodzone równomiernie, a nie tylko jedna strona, jak w przypadku niektórych konkurentów.
(+) Maksymalna temperatura w górnej części wynosi 31 °C / 88 F, w porównaniu do średniej 35.9 °C / 97 F , począwszy od 21.4 do 59 °C dla klasy Subnotebook.
(+) Dno nagrzewa się maksymalnie do 31 °C / 88 F, w porównaniu do średniej 39.3 °C / 103 F
(+) W stanie bezczynności średnia temperatura górnej części wynosi 22.3 °C / 72 F, w porównaniu ze średnią temperaturą urządzenia wynoszącą 30.8 °C / ### class_avg_f### F.
(+) 3: The average temperature for the upper side is 28.8 °C / 84 F, compared to the average of 30.8 °C / 87 F for the class Subnotebook.
(+) Podpórki pod nadgarstki i touchpad są chłodniejsze niż temperatura skóry i maksymalnie 26 °C / 78.8 F i dlatego są chłodne w dotyku.
(+) Średnia temperatura obszaru podparcia dłoni w podobnych urządzeniach wynosiła 28.2 °C / 82.8 F (+2.2 °C / 4 F).
| Dell Pro 13 Premium PA13250 Intel Core Ultra 7 268V, Intel Arc Graphics 140V | MSI Prestige 13 AI Plus Evo A2VMG Intel Core Ultra 7 258V, Intel Arc Graphics 140V | Lenovo ThinkPad X13 2-in-1 Gen 5 Intel Core Ultra 7 165U, Intel Graphics 4-Core iGPU (Arc) | Framework Laptop 13.5 Core Ultra 7 155H Intel Core Ultra 7 155H, Intel Arc 8-Core iGPU | Dell XPS 13 9350 Intel Core Ultra 7 256V, Intel Arc Graphics 140V | Microsoft Surface Pro Copilot+ Qualcomm Snapdragon X Plus X1P-64-100, Qualcomm SD X Adreno X1-85 3.8 TFLOPS | |
|---|---|---|---|---|---|---|
| Heat | -23% | -52% | -29% | -12% | -25% | |
| Maximum Upper Side * | 31 | 43.4 -40% | 60 -94% | 42.8 -38% | 34.8 -12% | 43.9 -42% |
| Maximum Bottom * | 31 | 42.4 -37% | 57 -84% | 45.2 -46% | 37.4 -21% | 44.9 -45% |
| Idle Upper Side * | 24 | 25.4 -6% | 27 -13% | 27.2 -13% | 25.4 -6% | 26.2 -9% |
| Idle Bottom * | 24 | 25.6 -7% | 28 -17% | 28.6 -19% | 26.2 -9% | 24.6 -3% |
* ... im mniej tym lepiej
Głośniki
Jak na tak mały laptop, głośniki są nawet w stanie przewyższyć niektóre znacznie większe modele. Średnie tony są zbalansowane, ale wciąż brakuje im basów. Wejście audio jack jest dostępne do podłączenia urządzeń zewnętrznych.
Dell Pro 13 Premium PA13250 analiza dźwięku
(+) | głośniki mogą odtwarzać stosunkowo głośno (87.49 dB)
Bas 100 - 315 Hz
(-) | prawie brak basu - średnio 15.9% niższa od mediany
(±) | liniowość basu jest średnia (8.3% delta do poprzedniej częstotliwości)
Średnie 400 - 2000 Hz
(+) | zbalansowane środki średnie - tylko 2.9% od mediany
(+) | średnie są liniowe (4.7% delta do poprzedniej częstotliwości)
Wysokie 2–16 kHz
(±) | obniżone maksima - średnio 5.2% niższe od mediany
(±) | liniowość wysokich wartości jest średnia (7.1% delta do poprzedniej częstotliwości)
Ogólnie 100 - 16.000 Hz
(+) | ogólny dźwięk jest liniowy (12.2% różnicy w stosunku do mediany)
W porównaniu do tej samej klasy
» 14% wszystkich testowanych urządzeń w tej klasie było lepszych, 4% podobnych, 82% gorszych
» Najlepszy miał deltę 5%, średnia wynosiła ###średnia###%, najgorsza wynosiła 53%
W porównaniu do wszystkich testowanych urządzeń
» 8% wszystkich testowanych urządzeń było lepszych, 2% podobnych, 89% gorszych
» Najlepszy miał deltę 4%, średnia wynosiła ###średnia###%, najgorsza wynosiła 134%
MSI Prestige 13 AI Plus Evo A2VMG analiza dźwięku
(+) | głośniki mogą odtwarzać stosunkowo głośno (84.5 dB)
Bas 100 - 315 Hz
(-) | prawie brak basu - średnio 19.4% niższa od mediany
(±) | liniowość basu jest średnia (9.6% delta do poprzedniej częstotliwości)
Średnie 400 - 2000 Hz
(±) | wyższe średnie - średnio 6.4% wyższe niż mediana
(+) | średnie są liniowe (5.1% delta do poprzedniej częstotliwości)
Wysokie 2–16 kHz
(±) | wyższe maksima - średnio 6.1% wyższe od mediany
(+) | wzloty są liniowe (4.6% delta do poprzedniej częstotliwości)
Ogólnie 100 - 16.000 Hz
(±) | liniowość ogólnego dźwięku jest średnia (18.2% różnicy w stosunku do mediany)
W porównaniu do tej samej klasy
» 50% wszystkich testowanych urządzeń w tej klasie było lepszych, 7% podobnych, 43% gorszych
» Najlepszy miał deltę 5%, średnia wynosiła ###średnia###%, najgorsza wynosiła 53%
W porównaniu do wszystkich testowanych urządzeń
» 36% wszystkich testowanych urządzeń było lepszych, 8% podobnych, 56% gorszych
» Najlepszy miał deltę 4%, średnia wynosiła ###średnia###%, najgorsza wynosiła 134%
Zużycie energii
Dzięki SoC Lunar Lake, Dell Pro 13 jest bardzo oszczędny. Zużywa tylko od 2 do 4,75 W na biegu jałowym, a podczas uruchamiania Cyberpunk 2077 zmierzyliśmy zaledwie 38 W. Tylko Dell XPS 13 9350z nieco słabszym procesorem Lunar Lake, jest bardziej ekonomiczny, a każdy inny konkurent zużywa więcej energii
| wyłączony / stan wstrzymania | |
| luz | |
| obciążenie |
|
Legenda:
min: | |
| Dell Pro 13 Premium PA13250 Core Ultra 7 268V, Arc 140V | MSI Prestige 13 AI Plus Evo A2VMG Core Ultra 7 258V, Arc 140V | Lenovo ThinkPad X13 2-in-1 Gen 5 Ultra 7 165U, Graphics 4-Core | Framework Laptop 13.5 Core Ultra 7 155H Ultra 7 155H, Arc 8-Core | Dell XPS 13 9350 Core Ultra 7 256V, Arc 140V | Microsoft Surface Pro Copilot+ SD X Plus X1P-64-100, Adreno X1-85 3.8 TFLOPS | Średnia w klasie Subnotebook | |
|---|---|---|---|---|---|---|---|
| Power Consumption | -39% | -19% | -26% | 7% | -23% | -62% | |
| Idle Minimum * | 2 | 3.5 -75% | 3.2 -60% | 2.5 -25% | 1.3 35% | 1.9 5% | 4.3 ? -115% |
| Idle Average * | 4.3 | 5.9 -37% | 6.1 -42% | 5.2 -21% | 2.5 42% | 9.2 -114% | 7.33 ? -70% |
| Idle Maximum * | 4.75 | 10 -111% | 6.7 -41% | 5.8 -22% | 4.1 14% | 9.5 -100% | 9.07 ? -91% |
| Load Average * | 40 | 38.7 3% | 44.2 -11% | 47.5 -19% | 40.1 -0% | 29.6 26% | 45.2 ? -13% |
| Cyberpunk 2077 ultra * | 36.4 | 46.3 -27% | 25.2 31% | 54.5 -50% | 46.1 -27% | 39.5 -9% | |
| Cyberpunk 2077 ultra external monitor * | 38 | 45.6 -20% | 38.5 -1% | 52.4 -38% | 43.1 -13% | 37.4 2% | |
| Load Maximum * | 57 | 61.5 -8% | 62.5 -10% | 61.5 -8% | 57.3 -1% | 40.7 29% | 69 ? -21% |
* ... im mniej tym lepiej
Power consumption Cyberpunk / stress test
Power consumption with an external monitor
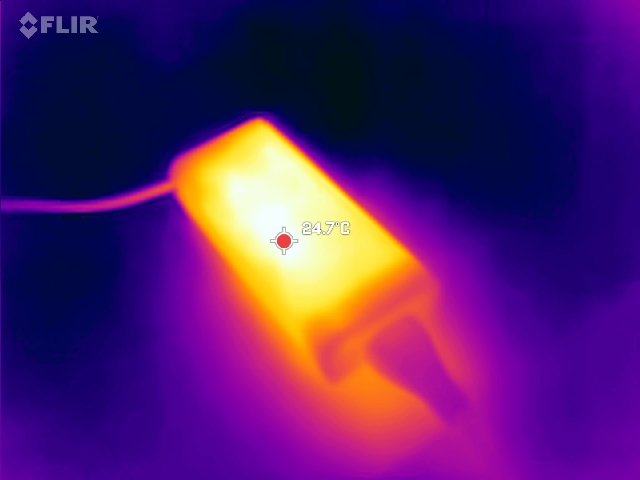
Żywotność baterii
Dzięki niskiemu zużyciu energii czas pracy na baterii jest doskonały. W testach Wi-Fi i wideo zarejestrowaliśmy prawie 24 godziny, co jest fantastycznym wynikiem! Bateria o mocy 60 W jest raczej średniej klasy pod względem pojemności. The XPS 13 przegrywa tylko nieznacznie ze względu na nieco mniejszą baterię (55 Wh).
| Dell Pro 13 Premium PA13250 Core Ultra 7 268V, Arc 140V, 60 Wh | MSI Prestige 13 AI Plus Evo A2VMG Core Ultra 7 258V, Arc 140V, 75 Wh | Lenovo ThinkPad X13 2-in-1 Gen 5 Ultra 7 165U, Graphics 4-Core, 54.7 Wh | Framework Laptop 13.5 Core Ultra 7 155H Ultra 7 155H, Arc 8-Core, 61 Wh | Dell XPS 13 9350 Core Ultra 7 256V, Arc 140V, 55 Wh | Microsoft Surface Pro Copilot+ SD X Plus X1P-64-100, Adreno X1-85 3.8 TFLOPS, 47 Wh | Średnia w klasie Subnotebook | |
|---|---|---|---|---|---|---|---|
| Czasy pracy | -44% | -50% | -52% | -15% | -48% | -36% | |
| H.264 | 1425 | 731 -49% | 841 -41% | 961 ? -33% | |||
| WiFi v1.3 | 1440 | 804 -44% | 739 -49% | 630 -56% | 1236 -14% | 662 -54% | 757 ? -47% |
| Load | 170 | 84 -51% | 90 -47% | 142 -16% | 89 -48% | 121.3 ? -29% | |
| Reader / Idle | 2296 | 3407 | 1882 ? |
Ogólna ocena Notebookcheck
Dell Pro 13 Premium to niemal wszystko, czego można oczekiwać od mobilnego laptopa biznesowego: Jest dość mały, lekki, ekonomiczny, ma świetny czas pracy na baterii i nadal zapewnia wydajność na wysokim poziomie. Poza wysoką ceną, nie można mieć do niego praktycznie żadnych zastrzeżeń.
Dell Pro 13 Premium PA13250
- 14/03/2025 v8
Christian Hintze
 Total Sustainability Score:
 Przezroczystość
Wyboru urządzeń do recenzji dokonuje nasza redakcja. Próbka testowa została udostępniona autorowi jako pożyczka od producenta lub sprzedawcy detalicznego na potrzeby tej recenzji. Pożyczkodawca nie miał wpływu na tę recenzję, producent nie otrzymał też kopii tej recenzji przed publikacją. Nie było obowiązku publikowania tej recenzji. Nigdy nie przyjmujemy rekompensaty ani płatności w zamian za nasze recenzje. Jako niezależna firma medialna, Notebookcheck nie podlega władzy producentów, sprzedawców detalicznych ani wydawców.
Tak testuje Notebookcheck
Każdego roku Notebookcheck niezależnie sprawdza setki laptopów i smartfonów, stosując standardowe procedury, aby zapewnić porównywalność wszystkich wyników. Od około 20 lat stale rozwijamy nasze metody badawcze, ustanawiając przy tym standardy branżowe. W naszych laboratoriach testowych doświadczeni technicy i redaktorzy korzystają z wysokiej jakości sprzętu pomiarowego. Testy te obejmują wieloetapowy proces walidacji. Nasz kompleksowy system ocen opiera się na setkach uzasadnionych pomiarów i benchmarków, co pozwala zachować obiektywizm.
