Notebookcheck Logo

Recenzja Lenovo Legion 9 16IRX9 (Legion 9i): Jak wysokiej klasy jest RTX 4090 dla graczy?
Średnia maszyna.

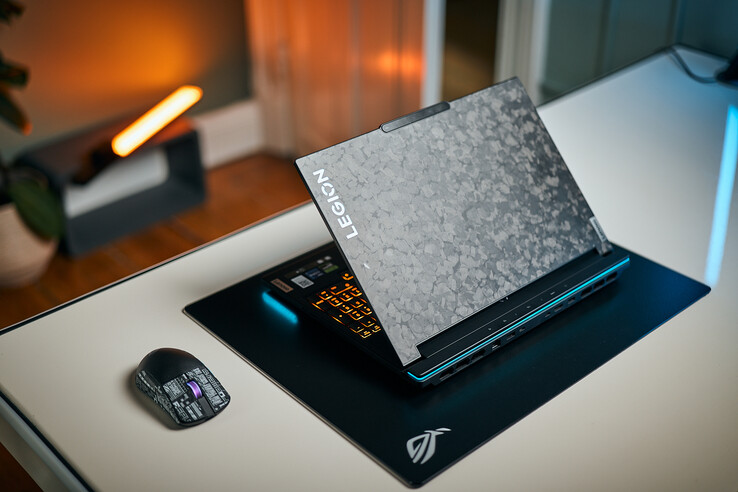
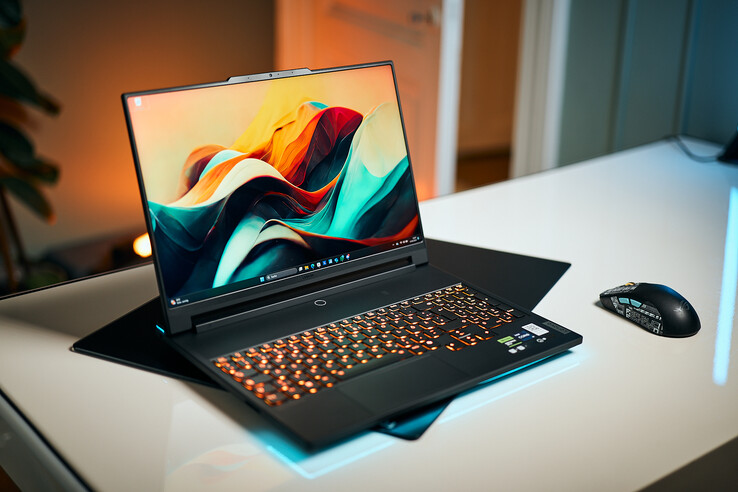
"Kuty węgiel", "wzmocniony w 90% magnezem z recyklingu", a także aktualizacja procesorów Intel Gen14, w tym funkcje sztucznej inteligencji. To wszystko, wraz z RTX 4090, składa się na luksusowego gracza za 3800 dolarów. Nasz test pokaże, czy nowy procesor naprawdę sprawia, że Legion 9 jest lepszy, czy też można trochę zaoszczędzić, kupując zeszłoroczny model.
AI Gaming Geforce Intel Laptop / Notebook Nvidia Raptor Lake Windows

W zeszłym roku nazwaliśmy Legion 9i "najbardziej ambitnym laptopem gamingowym Lenovo do tej pory". Następna generacja może być nie mniej ambitna, jednak zmiany faktycznie wprowadzone w high-endowym graczu są mocno ograniczone. Jedynie jego procesor został wymieniony na najnowszą, 14. generację Intela, co również sprawia, że laptop jest bardziej kompatybilny ze sztuczną inteligencją.

Ponieważ 16-calowe laptopy nie są często wyposażone w RTX 4090porównamy go z jego poprzednikiem, razer Blade 16 (2024) Razer Blade 16 (2024) a także 18-calowymi graczami, takimi jak Alienware m18 R2 i Asus ROG Strix Scar 18 (2024)oraz 17-calowy Medion Erazer Beast X40 (2024).

Aktualizacja: Ze względu na problemy wspomniane w tym teście (spadki liczby klatek na sekundę, niski wynik pojedynczego rdzenia), skontaktowaliśmy się z producentem (za pośrednictwem jego agencji). Potencjalne urządzenie zastępcze wykazało taki sam wynik pojedynczego rdzenia (zmierzony przez agencję), więc przynajmniej to zostało potwierdzone. Nadal jesteśmy w kontakcie w sprawie liczby klatek na sekundę i opublikujemy odpowiedź tak szybko, jak to możliwe.

Legion 9 16IRX9 (Legion 9 16 Rodzina)
Procesor
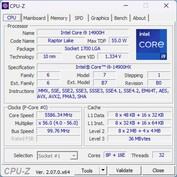
Intel Core i9-14900HX 24 x 1.6 - 5.8 GHz, Raptor Lake-HX Refresh
Karta grafiki
NVIDIA GeForce RTX 4090 Laptop GPU - 16 GB VRAM, 175 W TDP ( including 25 W Dynamic Boost), Geforce 552.22, Optimus
Pamięć
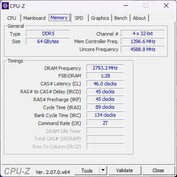
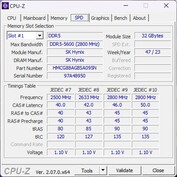
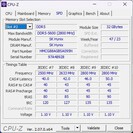
64 GB 
, 2x 32 GB DDR5-5600
Matryca
16.00 cali 16:10, 3200 x 2000 pikseli 236 PPI, CSOT T3 MNG007ZA2-2, MiniLED, refleksująca: nie, HDR, 165 Hz, Adaptive Sync
Chipset
Intel HM770 (Raptor Lake-S PCH)
Dysk twardy
Micron 3400 2TB MTFDKBA2T0TFH, 2048 GB 
, 1700 GB wolne miejsce
Złącza
3 USB 3.0, 2 USB 4.0 40 Gbps, 2 Thunderbolt, USB-C Power Delivery (PD), 1 HDMI, 2 DisplayPort, gniazda audio: 3.5 mm headset, czytnik kart: Full SD card reader
Łączność
Killer E3000 2.5 Gigabit Ethernet Controller (10/100/1000/2500MBit/s), Killer Wi-Fi 6E AX1675i 160MHz Wireless Network Adapter (a/b/g/n = Wi-Fi 4/ac = Wi-Fi 5/ax = Wi-Fi 6/), Bluetooth Bluetooth 5
Gabaryty
wysokość x szerokość x głębokość (mm): 22.7 x 357.7 x 277.7
Akumulator
99.99 Wh, Super Rapid Charge
Charging
fast charging / Quickcharge
System operacyjny
Microsoft Windows 11 Pro
Camera
kamerka: FHD webcam (1,080p)
Primary Camera: 2 MPix
Inne
głośniki: 2x 2 W, klawiatura: Chiclet, podświetlanie klawiatury: tak, 36 miesiące(y) gwarancji, 3 years PremiumCare
Waga
2.541 kg, zasilacz: 1.037 kg
Cena
4899 Euro
Amazon
Note: The manufacturer may use components from different suppliers including display panels, drives or memory sticks with similar specifications.


Potencjalni konkurenci w porównaniu

Rating
Version
Date
Model
Weight
Height
Size
Resolution
Price
83.9 %v8
06/2024
Lenovo Legion 9 16IRX9, RTX 4090
i9-14900HX, NVIDIA GeForce RTX 4090 Laptop GPU
2.5 kg22.7 mm16.00"3200x2000
90.2 %
v7 (old)
v7 (old)
10/2023
Lenovo Legion 9 16IRX8
i9-13980HX, NVIDIA GeForce RTX 4090 Laptop GPU
2.6 kg22.7 mm16.00"3200x2000
91.1 %
v7 (old)
v7 (old)
02/2024
Razer Blade 16 2024, RTX 4090
i9-14900HX, NVIDIA GeForce RTX 4090 Laptop GPU
2.5 kg22 mm16.00"2560x1600
89.5 %
v7 (old)
v7 (old)
03/2024
Alienware m18 R2
i9-14900HX, NVIDIA GeForce RTX 4090 Laptop GPU
4 kg26.7 mm18.00"2560x1600
88.3 %
v7 (old)
v7 (old)
02/2024
Asus ROG Strix Scar 18 G834JYR (2024)
i9-14900HX, NVIDIA GeForce RTX 4090 Laptop GPU
3.1 kg30.8 mm18.00"2560x1600
89.2 %
v7 (old)
v7 (old)
02/2024
Medion Erazer Beast X40 2024
i9-14900HX, NVIDIA GeForce RTX 4090 Laptop GPU
2.9 kg36 mm17.00"2560x1600

Uwaga: Niedawno zaktualizowaliśmy nasz system oceny i wyniki wersji 8 nie są porównywalne z wynikami wersji 7. Więcej informacji znajdą Państwo tutaj .

Obudowa i łącznik - kuty węgiel

Ponieważ przynajmniej wizualnie wszystko pozostało niezmienione w nowym modelu, zalecamy zapoznanie się z naszą recenzją Lenovo Legion 9i Gen8 w celu uzyskania informacji na temat obudowy kutej z włókna węglowego, opcji konserwacji i urządzeń wejściowych.

Porównanie rozmiarów

383 mm 272 mm 36 mm 2.9 kg357.7 mm 277.7 mm 22.7 mm 2.5 kg357.7 mm 277.7 mm 22.7 mm 2.6 kg355 mm 244 mm 22 mm 2.5 kg297 mm 210 mm 1 mm 5.7 g
Po lewej: zestaw słuchawkowy 3,5 mm, czytnik kart SD
Po prawej: migawka kamery internetowej, USB-C (5 Gb/s), USB-A (5 Gb/s)
Tył: zasilanie, USB-A (5 Gb/s, Always-On), 2x Thunderbolt 4 (DP 1.4 i PD 3.0 140 W), HDMI 2.1, LAN
Przód: brak połączeń

Czytnik kart SD

Jak na laptop z wyższej półki, prędkości transferu czytnika kart SD są rozczarowujące. Są one nieco gorsze niż w zeszłym roku i daleko im do szybkości transferu Razer Blade 16 lub Alienware m18 R2.

SD Card Reader
average JPG Copy Test (av. of 3 runs)
Alienware m18 R2
Intel Core i9-14900HX (Toshiba Exceria Pro SDXC 64 GB UHS-II)
190.3 MB/s +161%
Razer Blade 16 2024, RTX 4090
Intel Core i9-14900HX
171 (169.48min - 194.55max) MB/s +134%
Average of class Gaming
  (19 - 202, n=87, last 2 years)
95.9 MB/s +31%
Lenovo Legion 9 16IRX8
Intel Core i9-13980HX (Toshiba Exceria Pro SDXC 64 GB UHS-II)
84.8 MB/s +16%
Medion Erazer Beast X40 2024
Intel Core i9-14900HX (AV PRO microSD 128 GB V60)
77 MB/s +5%
Lenovo Legion 9 16IRX9, RTX 4090
Intel Core i9-14900HX
73 (51.3min - 77.05max) MB/s
maximum AS SSD Seq Read Test (1GB)
Alienware m18 R2
Intel Core i9-14900HX (Toshiba Exceria Pro SDXC 64 GB UHS-II)
219.7 MB/s +149%
Razer Blade 16 2024, RTX 4090
Intel Core i9-14900HX
181.81 MB/s +106%
Average of class Gaming
  (25.8 - 269, n=88, last 2 years)
120 MB/s +36%
Medion Erazer Beast X40 2024
Intel Core i9-14900HX (AV PRO microSD 128 GB V60)
90 MB/s +2%
Lenovo Legion 9 16IRX9, RTX 4090
Intel Core i9-14900HX
88.2 MB/s
Lenovo Legion 9 16IRX8
Intel Core i9-13980HX (Toshiba Exceria Pro SDXC 64 GB UHS-II)
87.9 MB/s 0%
Networking
iperf3 transmit AXE11000
Razer Blade 16 2024, RTX 4090
Intel Killer Wi-Fi 7 BE1750W 320 MHz (BE200NGW)
1577 (796min - 1617max) MBit/s +14%
Lenovo Legion 9 16IRX9, RTX 4090
Killer Wi-Fi 6E AX1675i 160MHz Wireless Network Adapter
1378 (539min - 1507max) MBit/s
Average Killer Wi-Fi 6E AX1675i 160MHz Wireless Network Adapter
  (942 - 1622, n=26)
1358 MBit/s -1%
Lenovo Legion 9 16IRX8
Killer Wi-Fi 6E AX1675i 160MHz Wireless Network Adapter
1308 (606min - 1544max) MBit/s -5%
Average of class Gaming
  (469 - 1843, n=148, last 2 years)
1230 MBit/s -11%
Asus ROG Strix Scar 18 G834JYR (2024)
Intel Wi-Fi 6E AX211
968 (656min - 1200max) MBit/s -30%
Alienware m18 R2
Intel Killer Wi-Fi 7 BE1750x BE200NGW
791 (736min - 894max) MBit/s -43%
Medion Erazer Beast X40 2024
Intel Wi-Fi 6E AX211
636 (501min - 571max) MBit/s -54%
iperf3 receive AXE11000
Asus ROG Strix Scar 18 G834JYR (2024)
Intel Wi-Fi 6E AX211
1681 (1662min - 1704max) MBit/s +8%
Medion Erazer Beast X40 2024
Intel Wi-Fi 6E AX211
1650 (1031min - 1711max) MBit/s +6%
Razer Blade 16 2024, RTX 4090
Intel Killer Wi-Fi 7 BE1750W 320 MHz (BE200NGW)
1604 (1554min - 1623max) MBit/s +3%
Lenovo Legion 9 16IRX9, RTX 4090
Killer Wi-Fi 6E AX1675i 160MHz Wireless Network Adapter
1562 (657min - 1677max) MBit/s
Average Killer Wi-Fi 6E AX1675i 160MHz Wireless Network Adapter
  (872 - 1714, n=28)
1473 MBit/s -6%
Average of class Gaming
  (680 - 1890, n=148, last 2 years)
1392 MBit/s -11%
Alienware m18 R2
Intel Killer Wi-Fi 7 BE1750x BE200NGW
1381 (1277min - 1427max) MBit/s -12%
Lenovo Legion 9 16IRX8
Killer Wi-Fi 6E AX1675i 160MHz Wireless Network Adapter
1178 (483min - 1393max) MBit/s -25%
iperf3 transmit AXE11000 6GHz
Lenovo Legion 9 16IRX9, RTX 4090
Killer Wi-Fi 6E AX1675i 160MHz Wireless Network Adapter
1569 (771min - 1600max) MBit/s
Razer Blade 16 2024, RTX 4090
Intel Killer Wi-Fi 7 BE1750W 320 MHz (BE200NGW)
1538 (784min - 1597max) MBit/s -2%
Average Killer Wi-Fi 6E AX1675i 160MHz Wireless Network Adapter
  (1229 - 1693, n=19)
1519 MBit/s -3%
Lenovo Legion 9 16IRX8
Killer Wi-Fi 6E AX1675i 160MHz Wireless Network Adapter
1472 (1007min - 1545max) MBit/s -6%
Average of class Gaming
  (648 - 1878, n=68, last 2 years)
1429 MBit/s -9%
Alienware m18 R2
Intel Killer Wi-Fi 7 BE1750x BE200NGW
648 (595min - 759max) MBit/s -59%
iperf3 receive AXE11000 6GHz
Lenovo Legion 9 16IRX9, RTX 4090
Killer Wi-Fi 6E AX1675i 160MHz Wireless Network Adapter
1660 (1606min - 1685max) MBit/s
Average Killer Wi-Fi 6E AX1675i 160MHz Wireless Network Adapter
  (1327 - 1788, n=20)
1553 MBit/s -6%
Razer Blade 16 2024, RTX 4090
Intel Killer Wi-Fi 7 BE1750W 320 MHz (BE200NGW)
1518 (762min - 1536max) MBit/s -9%
Lenovo Legion 9 16IRX8
Killer Wi-Fi 6E AX1675i 160MHz Wireless Network Adapter
1498 (754min - 1540max) MBit/s -10%
Average of class Gaming
  (853 - 1788, n=68, last 2 years)
1488 MBit/s -10%
Alienware m18 R2
Intel Killer Wi-Fi 7 BE1750x BE200NGW
1292 (1215min - 1327max) MBit/s -22%
05010015020025030035040045050055060065070075080085090095010001050110011501200125013001350140014501500155016001650Tooltip
Lenovo Legion 9 16IRX9, RTX 4090 Killer Wi-Fi 6E AX1675i 160MHz Wireless Network Adapter; iperf3 transmit AXE11000 6GHz; iperf 3.1.3: Ø1543 (771-1600)
Lenovo Legion 9 16IRX8 Killer Wi-Fi 6E AX1675i 160MHz Wireless Network Adapter; iperf3 transmit AXE11000 6GHz; iperf 3.1.3: Ø1472 (1007-1545)
Razer Blade 16 2024, RTX 4090 Intel Killer Wi-Fi 7 BE1750W 320 MHz (BE200NGW); iperf3 transmit AXE11000 6GHz; iperf 3.1.3: Ø1512 (784-1597)
Lenovo Legion 9 16IRX9, RTX 4090 Killer Wi-Fi 6E AX1675i 160MHz Wireless Network Adapter; iperf3 receive AXE11000 6GHz; iperf 3.1.3: Ø1659 (1606-1685)
Lenovo Legion 9 16IRX8 Killer Wi-Fi 6E AX1675i 160MHz Wireless Network Adapter; iperf3 receive AXE11000 6GHz; iperf 3.1.3: Ø1472 (754-1540)
Razer Blade 16 2024, RTX 4090 Intel Killer Wi-Fi 7 BE1750W 320 MHz (BE200NGW); iperf3 receive AXE11000 6GHz; iperf 3.1.3: Ø1492 (762-1536)

Kamera internetowa

Kamera internetowa Full HD 1,080p ma średnie lub wysokie odchylenia kolorów, a ostrość obrazu jest w porządku.
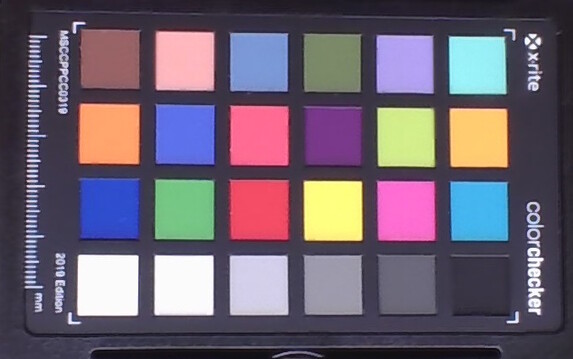
ColorChecker
13.6 ∆E
16.7 ∆E
11.7 ∆E
12.5 ∆E
13.8 ∆E
16.3 ∆E
12.9 ∆E
12.3 ∆E
14.9 ∆E
7.7 ∆E
12.9 ∆E
10.7 ∆E
8.5 ∆E
15.3 ∆E
17.9 ∆E
14.5 ∆E
15.3 ∆E
18.2 ∆E
1.8 ∆E
11.3 ∆E
17.3 ∆E
15.6 ∆E
12.6 ∆E
9.9 ∆E
ColorChecker Lenovo Legion 9 16IRX9, RTX 4090: 13.09 ∆E min: 1.76 - max: 18.23 ∆E
No screenshots found ()

Urządzenia wejściowe - teraz z Co-Pilotem

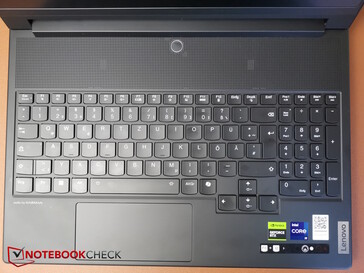
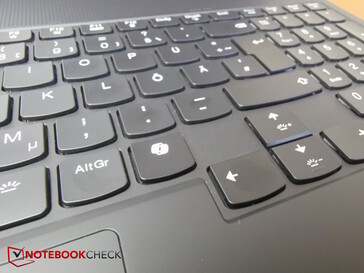
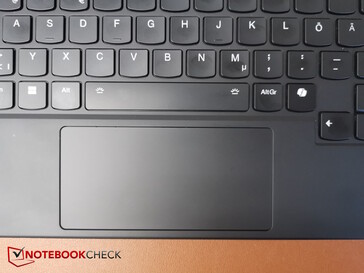
Wygodna klawiatura membranowa i touchpad pozostały w dużej mierze niezmienione. Ten ostatni jest nadal bardzo wąski i ma zaledwie 5,9 cm. Klawisz Co-Pilot został dodany do klawiatury. Prawy klawisz Ctrl musiał ustąpić miejsca temu klawiszowi.
Klawiatura
Klawiatura
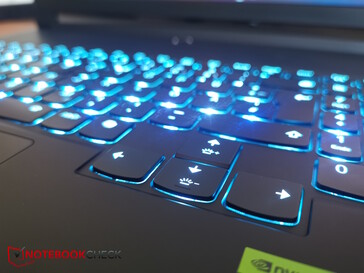
Podświetlenie
Podświetlenie
Teraz z kluczem drugiego pilota
Wąski panel dotykowy

Wyświetlacz - 1,200 nitów MiniLED

Matowe subpiksele
Matowe subpiksele
Brak krwawienia podświetlenia

16-calowy wyświetlacz mini LED 3,2K (3200 x 2000) z Dolby Vision i G-Sync jest nadal jedną z głównych atrakcji wewnątrz Legion 9. Mówi się, że ma jasność do 1200 nitów, a zatem spełnia standard HDR 1000. W rzeczywistości zmierzyliśmy ponad 1000 nitów w trybie HDR.

W trybie SD z lepszą dokładnością kolorów, wyświetlacz nadal świeci średnio 664 nitami! Przy 43 procentach jasności ekranu, jego wartość jasności wynosi około 150 nitów, co jest wartością, której używamy do niektórych naszych testów baterii. Poziom czerni jest doskonały dzięki mini diodom LED, które można wyłączyć w wielu strefach, co prowadzi do bardzo wysokich kontrastów.

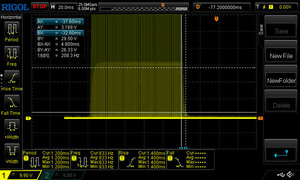
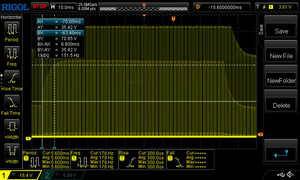
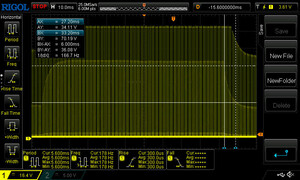
W ogóle nie występuje krwawienie podświetlenia, a czasy reakcji są również wystarczająco szybkie, choć oczywiście nie do końca na poziomie OLED. Mogliśmy zmierzyć PWM, choć przy dość wysokiej częstotliwości od 5 kHz do 40 kHz, co nie powinno stanowić problemu nawet dla wrażliwych osób.

663
cd/m²
691
cd/m²
670
cd/m²
662
cd/m²
631
cd/m²
670
cd/m²
684
cd/m²
633
cd/m²
669
cd/m²
podświetlenie ekranu
CSOT T3 MNG007ZA2-2 tested with X-Rite i1Pro 3
maksimum: 691 cd/m² (Nits) średnia: 663.7 cd/m² Minimum: 23.4 cd/m²
rozświetlenie: 91 %
na akumulatorze: 630 cd/m²
kontrast: 21033:1 (czerń: 0.03 cd/m²)
ΔE Color 2.68 | 0.5-29.43 Ø4.91, calibrated: 2.68
ΔE Greyscale 2.71 | 0.5-98 Ø5.2
86.6% AdobeRGB 1998 (Argyll 2.2.0 3D)
99.9% sRGB (Argyll 2.2.0 3D)
95.3% Display P3 (Argyll 2.2.0 3D)
Gamma: 2.27
Lenovo Legion 9 16IRX9, RTX 4090
CSOT T3 MNG007ZA2-2, MiniLED, 3200x2000, 16"
Lenovo Legion 9 16IRX8
CSOT T3 MNG007ZA2-2, Mini-LED, 3200x2000, 16"
Razer Blade 16 2024, RTX 4090
Samsung SDC41AB (ATNA60DL03-0), OLED, 2560x1600, 16"
Alienware m18 R2
BOE NE18NZ1, IPS, 2560x1600, 18"
Asus ROG Strix Scar 18 G834JYR (2024)
BOE NE180QDM-NM1, Mini LED, 2560x1600, 18"
Medion Erazer Beast X40 2024
BOE NE170QDM-NZ1, IPS, 2560x1600, 17"
Display
1%
5%
2%
3%
-16%
Display P3 Coverage
95.3
97.2
2%
99.1
4%
97.8
3%
99.9
5%
68.1
-29%
sRGB Coverage
99.9
99.9
0%
99.9
0%
99.5
0%
100
0%
99.5
0%
AdobeRGB 1998 Coverage
86.6
87
0%
95.6
10%
88.9
3%
90
4%
69
-20%
Response Times
-12%
37%
27%
1%
19%
Response Time Grey 50% / Grey 80% *
12.6 ?(6.6, 6)
13.3 ?(5.7, 7.6)
-6%
0.24 ?(0.15, 0.09)
98%
5.3 ?(2.2, 3.1)
58%
12 ?(8, 4)
5%
11.7 ?(5.7, 6)
7%
Response Time Black / White *
10 ?(5.2, 4.8)
11.6 ?(5.1, 6.5)
-16%
0.4 ?(0.2, 0.2)
96%
10.4 ?(4.8, 5.6)
-4%
10.7 ?(7.6, 3.1)
-7%
6.9 ?(2.8, 4.1)
31%
PWM Frequency
5430
4742
-13%
960
-82%
5733 ?(94)
6%
Screen
-0%
21%
-107%
14%
-136%
Brightness middle
631
674.9
7%
418
-34%
271.8
-57%
937
48%
422
-33%
Brightness
664
682
3%
420
-37%
275
-59%
934
41%
388
-42%
Brightness Distribution
91
96
5%
98
8%
78
-14%
89
-2%
87
-4%
Black Level *
0.03
0.04
-33%
0.02
33%
0.27
-800%
0.066
-120%
0.42
-1300%
Contrast
21033
16873
-20%
20900
-1%
1007
-95%
14197
-33%
1005
-95%
Colorchecker dE 2000 *
2.68
2.56
4%
1.07
60%
2.48
7%
1.52
43%
1.42
47%
Colorchecker dE 2000 max. *
6.41
4.16
35%
4.04
37%
5.59
13%
2.82
56%
1.97
69%
Colorchecker dE 2000 calibrated *
2.68
2.47
8%
1.07
60%
0.56
79%
1.21
55%
0.7
74%
Greyscale dE 2000 *
2.71
3
-11%
1.12
59%
3.7
-37%
1.7
37%
1.2
56%
Gamma
2.27 97%
2.38 92%
2.29 96%
2.2 100%
2.042 108%
2.078 106%
CCT
6135 106%
6799 96%
6417 101%
6355 102%
6578 99%
6581 99%
Total Average (Program / Settings)
-4% / -2%
21% / 21%
-26% / -65%
6% / 9%
-44% / -89%

* ... im mniej tym lepiej

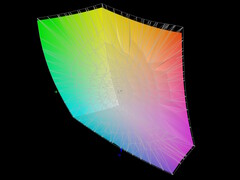
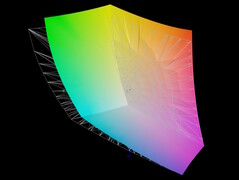
DisplayP3 pokrywa około 95%, sRGB całkowicie, a AdobeRGB od 86 do 87%.

sRGB
sRGB
Wyświetlacz P3
Wyświetlacz P3
AdobeRGB
AdobeRGB

Ex działa, wyświetlacz jest prawidłowo skalibrowany względem standardu P3. Nasza ponowna kalibracja poprawiła wartości DeltaE w skali szarości, ale pogorszyła wartości DeltaE w ClocChecker, dlatego nie jest warta wysiłku. Jednak jego odchylenia kolorów nie są idealne, ze średnią 2,68 i wartościami odstającymi do 6,41.

Skala szarości
Skala szarości
Nasycenie
Nasycenie
ColorChecker
ColorChecker
Skala szarości po kalibracji
Nasycenie po kalibracji
ColorChecker po kalibracji

Display Response Times

Display response times show how fast the screen is able to change from one color to the next. Slow response times can lead to afterimages and can cause moving objects to appear blurry (ghosting). Gamers of fast-paced 3D titles should pay special attention to fast response times.
       Response Time Black to White
10 ms ... rise ↗ and fall ↘ combined↗ 5.2 ms rise
↘ 4.8 ms fall
The screen shows good response rates in our tests, but may be too slow for competitive gamers.
In comparison, all tested devices range from 0.1 (minimum) to 240 (maximum) ms. » 23 % of all devices are better.
This means that the measured response time is better than the average of all tested devices (20.9 ms).
       Response Time 50% Grey to 80% Grey
12.6 ms ... rise ↗ and fall ↘ combined↗ 6.6 ms rise
↘ 6 ms fall
The screen shows good response rates in our tests, but may be too slow for competitive gamers.
In comparison, all tested devices range from 0.165 (minimum) to 636 (maximum) ms. » 23 % of all devices are better.
This means that the measured response time is better than the average of all tested devices (32.8 ms).

Screen Flickering / PWM (Pulse-Width Modulation)

To dim the screen, some notebooks will simply cycle the backlight on and off in rapid succession - a method called Pulse Width Modulation (PWM) . This cycling frequency should ideally be undetectable to the human eye. If said frequency is too low, users with sensitive eyes may experience strain or headaches or even notice the flickering altogether.
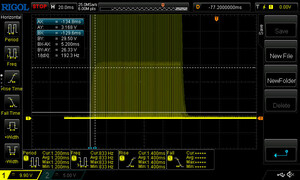
Screen flickering / PWM detected 5430 Hz
Amplitude: 8 %

The display backlight flickers at 5430 Hz (worst case, e.g., utilizing PWM) .

The frequency of 5430 Hz is quite high, so most users sensitive to PWM should not notice any flickering.

In comparison: 53 % of all tested devices do not use PWM to dim the display. If PWM was detected, an average of 8715 (minimum: 5 - maximum: 343500) Hz was measured.

0 procent jasności
0 procent jasności
25 procent jasności
25 procent jasności
50 procent jasności
50 procent jasności
75 procent jasności
75 procent jasności
100 procent jasności

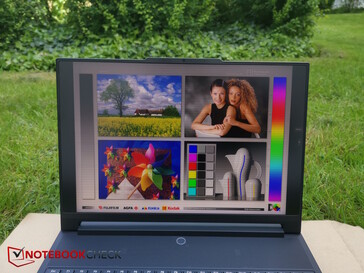
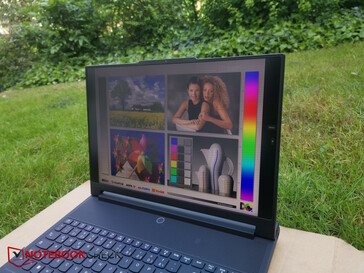
Na zewnątrz widoczność jest całkiem dobra dzięki wysokiej jasności ekranu i matowej powierzchni. Mimo to należy unikać bezpośredniego światła słonecznego.

Na zewnątrz w cieniu
Zewnętrzny, ukośny kąt widzenia
Bardzo dobra stabilność kąta widzenia

Wydajność - wysoka, ale nie bezproblemowa

Nowy i9-14900HX w połączeniu z potężnym RTX 4090 i 64 GB pamięci RAM wyraźnie sprawiają, że Legion 9i jest wysokiej klasy urządzeniem dla graczy. Sugeruje to również jego wystająca konstrukcja z tyłu, dlatego twórcy mogą szukać bardziej subtelnych alternatyw, pomimo potencjalnie wysokiej wydajności urządzenia.

Warunki testowania

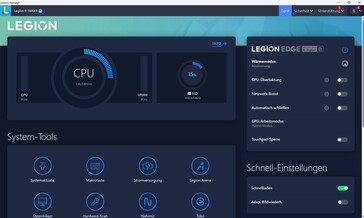
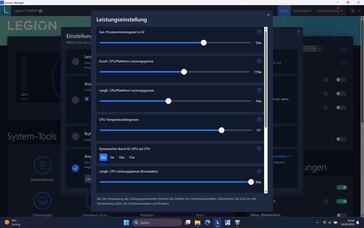
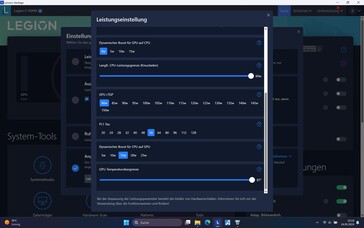
Lenovo Vantage to nazwa centrum sterowania Legion 9, które obejmuje profile wydajności Wydajność, Zrównoważony (tutaj można również wybrać AI do optymalizacji) i Cichy. Istnieje również tryb niestandardowy, który pozwala ręcznie ustawić różne parametry.

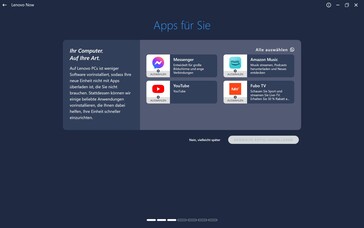
Niestety, Vantage czasami irytował nas reklamami, na przykład dla Amazon Music, aplikacji YouTube itp. Dzieje się tak, ponieważ komunikaty marketingowe są domyślnie aktywne w Vantage i najpierw trzeba je wyłączyć, aby przestały przeszkadzać.

Wybraliśmy tryb Wydajność dla naszych testów porównawczych, ale pozostawiliśmy przełącznik podkręcania GPU nieaktywny.

Ekran główny Lenovo Vantage
Tryby wydajności
Tryby wydajności
Wartości charakterystyczne trybu niestandardowego
Wartości charakterystyczne trybu niestandardowego strona 2
Reklama Amazon Music
Podczas wstępnej konfiguracji sugerowane są dodatkowe aplikacje

Procesor

Tryb wydajności
Tryb wydajności
Tryb zrównoważony ze sztuczną inteligencją
Tryb zrównoważony bez AI
Tryb cichy
Tryb cichy
Tryb baterii
Tryb baterii
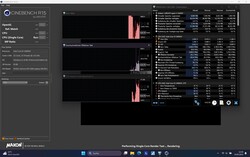
CB15 pojedynczy rdzeń: taktowanie spadło na krótko po 50 sekundach

The i9-14900HX to high-endowy procesor z najnowszej serii Raptor Lake Refresh od Intela. Jego 8 rdzeni P taktuje z częstotliwością do 5,8 GHz, a bazowa częstotliwość taktowania 16 rdzeni E wynosi 1,6 GHz. Razem mogą one przetwarzać łącznie 32 wątki.

Podczas pętli Cinebench R15 nasz Legion 9i miał najwyższą wydajność początkową, jednak w przeciwieństwie do konkurencji z tym samym procesorem, jego wydajność konsekwentnie spadała w czasie - o około 7,5 procent po pół godzinie. Następnie jego wydajność była tylko nieznacznie wyższa od poprzednika z procesorem i9-13980HX. Mimo to, procesor wewnątrz Legion 9 jest nadal jednym z najszybszych w porównywanym obszarze, choć jego wzrost wydajności w stosunku do poprzednika jest raczej niewielki.

Podczas gdy wydajność wielowątkowa nie budzi żadnych wątpliwości,

Legion 9i wyraźnie osłabł, jeśli chodzi o wydajność jednordzeniową we wszystkich benchmarkach CPU. Było to powtarzalne - najwyraźniej rezerwy wydajności jednordzeniowej nie zostały wyczerpane w trybie wydajności, dla którego trzeba ręcznie zwiększyć kluczowe wartości w trybie niestandardowym.

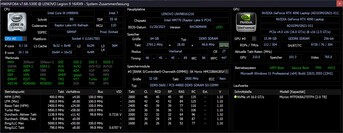
Przyjrzeliśmy się zatem kluczowym liczbom: W Cinebench R15 Single Core, rdzeń początkowo taktowany był zegarem 4,6 GHz. Po około 50 sekundach taktowanie rdzenia na krótko spadło do zaledwie 1,2 GHz, a następnie ustabilizowało się między 3 a 3,5 GHz. TDP wynosiło około 30 watów. W innym teście spadek był znacznie mniej wyraźny.

Po wyciągnięciu wtyczki zasilania wydajność wielowątkowa w Cinebench R15 spadła o około 48,5 procent, czyli prawie o połowę w porównaniu do korzystania z laptopa podłączonego do sieci!

Profil wydajności/wartość pomiaru Cinebench-15-Score 1st run Pobór mocy procesora w watach
Wydajność bez podkręcania procesora 4,879 140 - 180
Zrównoważony z AI 4,115 120 - 130
Zrównoważony bez AI 4,091 115 - 127
Cichy 2,938 65 - 70
Bateria 2,516 40 - 58

Cinebench R15 Multi continuous test

0245490735980122514701715196022052450269529403185343036753920416544104655Tooltip
Lenovo Legion 9 16IRX9, RTX 4090 Intel Core i9-14900HX: Ø4648 (4505.52-4878.64)
Lenovo Legion 9 16IRX8 Intel Core i9-13980HX: Ø4416 (4337.45-4565.69)
Razer Blade 16 2024, RTX 4090 Intel Core i9-14900HX: Ø4396 (4349.72-4455.83)
Alienware m18 R2 Intel Core i9-14900HX: Ø4743 (4458.81-4807.11)
Asus ROG Strix Scar 18 G834JYR (2024) Intel Core i9-14900HX: Ø4024 (3961.18-4098.11)
Medion Erazer Beast X40 2024 Intel Core i9-14900HX: Ø3224 (3189.54-3263.11)
CPU Performance Rating: Percent
Cinebench R23: Multi Core | Single Core
Cinebench R20: CPU (Multi Core) | CPU (Single Core)
Cinebench R15: CPU Multi 64Bit | CPU Single 64Bit
Blender: v2.79 BMW27 CPU
7-Zip 18.03: 7z b 4 | 7z b 4 -mmt1
Geekbench 6.3: Multi-Core | Single-Core
Geekbench 5.5: Multi-Core | Single-Core
HWBOT x265 Benchmark v2.2: 4k Preset
LibreOffice : 20 Documents To PDF
R Benchmark 2.5: Overall mean
CPU Performance Rating
Alienware m18 R2
Intel Core i9-14900HX
85.4 pt
Lenovo Legion 9 16IRX8
Intel Core i9-13980HX
82.7 pt
Razer Blade 16 2024, RTX 4090
Intel Core i9-14900HX
80.5 pt
Asus ROG Strix Scar 18 G834JYR (2024)
Intel Core i9-14900HX
80.3 pt
Average Intel Core i9-14900HX
 
79.6 pt
Lenovo Legion 9 16IRX9, RTX 4090
Intel Core i9-14900HX
74.5 pt
Medion Erazer Beast X40 2024
Intel Core i9-14900HX
73.6 pt
Average of class Gaming
 
64.6 pt
Cinebench R23 / Multi Core
Lenovo Legion 9 16IRX9, RTX 4090
Intel Core i9-14900HX
31889 Points
Alienware m18 R2
Intel Core i9-14900HX
31391 (28656min - 31390.7max) Points -2%
Lenovo Legion 9 16IRX8
Intel Core i9-13980HX
29892 (28505.8min - 29891.7max) Points -6%
Razer Blade 16 2024, RTX 4090
Intel Core i9-14900HX
28867 Points -9%
Average Intel Core i9-14900HX
  (17078 - 36249, n=38)
28781 Points -10%
Asus ROG Strix Scar 18 G834JYR (2024)
Intel Core i9-14900HX
28516 Points -11%
Medion Erazer Beast X40 2024
Intel Core i9-14900HX
22238 Points -30%
Average of class Gaming
  (5668 - 36249, n=190, last 2 years)
21953 Points -31%
Cinebench R23 / Single Core
Alienware m18 R2
Intel Core i9-14900HX
2235 Points +30%
Medion Erazer Beast X40 2024
Intel Core i9-14900HX
2227 Points +29%
Asus ROG Strix Scar 18 G834JYR (2024)
Intel Core i9-14900HX
2177 Points +27%
Average Intel Core i9-14900HX
  (1720 - 2245, n=39)
2146 Points +25%
Lenovo Legion 9 16IRX8
Intel Core i9-13980HX
2129 Points +24%
Razer Blade 16 2024, RTX 4090
Intel Core i9-14900HX
2117 Points +23%
Average of class Gaming
  (1136 - 2235, n=189, last 2 years)
1893 Points +10%
Lenovo Legion 9 16IRX9, RTX 4090
Intel Core i9-14900HX
1720 Points
Cinebench R20 / CPU (Multi Core)
Lenovo Legion 9 16IRX9, RTX 4090
Intel Core i9-14900HX
11960 Points
Alienware m18 R2
Intel Core i9-14900HX
11816 Points -1%
Lenovo Legion 9 16IRX8
Intel Core i9-13980HX
11155 Points -7%
Razer Blade 16 2024, RTX 4090
Intel Core i9-14900HX
10968 Points -8%
Average Intel Core i9-14900HX
  (6579 - 13832, n=37)
10930 Points -9%
Asus ROG Strix Scar 18 G834JYR (2024)
Intel Core i9-14900HX
10787 Points -10%
Medion Erazer Beast X40 2024
Intel Core i9-14900HX
8495 Points -29%
Average of class Gaming
  (2179 - 13832, n=187, last 2 years)
8336 Points -30%
Cinebench R20 / CPU (Single Core)
Medion Erazer Beast X40 2024
Intel Core i9-14900HX
855 Points +30%
Alienware m18 R2
Intel Core i9-14900HX
853 Points +30%
Asus ROG Strix Scar 18 G834JYR (2024)
Intel Core i9-14900HX
833 Points +27%
Average Intel Core i9-14900HX
  (657 - 859, n=37)
824 Points +25%
Razer Blade 16 2024, RTX 4090
Intel Core i9-14900HX
810 Points +23%
Average of class Gaming
  (439 - 856, n=187, last 2 years)
727 Points +11%
Lenovo Legion 9 16IRX8
Intel Core i9-13980HX
723 Points +10%
Lenovo Legion 9 16IRX9, RTX 4090
Intel Core i9-14900HX
657 Points
Cinebench R15 / CPU Multi 64Bit
Lenovo Legion 9 16IRX9, RTX 4090
Intel Core i9-14900HX
4879 (4505.52min - 4878.64max) Points
Alienware m18 R2
Intel Core i9-14900HX
4807 (4458.81min - 4807.11max) Points -1%
Lenovo Legion 9 16IRX8
Intel Core i9-13980HX
4566 (4337.45min - 4565.69max) Points -6%
Razer Blade 16 2024, RTX 4090
Intel Core i9-14900HX
4456 (4349.72min - 4455.83max) Points -9%
Average Intel Core i9-14900HX
  (3263 - 5589, n=38)
4424 Points -9%
Asus ROG Strix Scar 18 G834JYR (2024)
Intel Core i9-14900HX
4098 Points -16%
Average of class Gaming
  (905 - 5663, n=194, last 2 years)
3433 Points -30%
Medion Erazer Beast X40 2024
Intel Core i9-14900HX
3263 Points -33%
Cinebench R15 / CPU Single 64Bit
Alienware m18 R2
Intel Core i9-14900HX
318 Points +29%
Medion Erazer Beast X40 2024
Intel Core i9-14900HX
314 Points +27%
Razer Blade 16 2024, RTX 4090
Intel Core i9-14900HX
311 Points +26%
Average Intel Core i9-14900HX
  (247 - 323, n=37)
305 Points +23%
Lenovo Legion 9 16IRX8
Intel Core i9-13980HX
303 Points +23%
Asus ROG Strix Scar 18 G834JYR (2024)
Intel Core i9-14900HX
302 Points +22%
Average of class Gaming
  (191.9 - 318, n=191, last 2 years)
278 Points +13%
Lenovo Legion 9 16IRX9, RTX 4090
Intel Core i9-14900HX
247 Points
Blender / v2.79 BMW27 CPU
Average of class Gaming
  (87 - 555, n=182, last 2 years)
169.7 Seconds * -60%
Medion Erazer Beast X40 2024
Intel Core i9-14900HX
143 Seconds * -35%
Average Intel Core i9-14900HX
  (91 - 206, n=37)
121.2 Seconds * -14%
Asus ROG Strix Scar 18 G834JYR (2024)
Intel Core i9-14900HX
118 Seconds * -11%
Razer Blade 16 2024, RTX 4090
Intel Core i9-14900HX
113 Seconds * -7%
Lenovo Legion 9 16IRX9, RTX 4090
Intel Core i9-14900HX
106 Seconds *
Lenovo Legion 9 16IRX8
Intel Core i9-13980HX
103 Seconds * +3%
Alienware m18 R2
Intel Core i9-14900HX
102 Seconds * +4%
7-Zip 18.03 / 7z b 4
Lenovo Legion 9 16IRX9, RTX 4090
Intel Core i9-14900HX
125676 MIPS
Alienware m18 R2
Intel Core i9-14900HX
122772 MIPS -2%
Lenovo Legion 9 16IRX8
Intel Core i9-13980HX
117479 MIPS -7%
Razer Blade 16 2024, RTX 4090
Intel Core i9-14900HX
115695 MIPS -8%
Asus ROG Strix Scar 18 G834JYR (2024)
Intel Core i9-14900HX
114546 MIPS -9%
Average Intel Core i9-14900HX
  (66769 - 136645, n=37)
111239 MIPS -11%
Medion Erazer Beast X40 2024
Intel Core i9-14900HX
92386 MIPS -26%
Average of class Gaming
  (23795 - 140932, n=186, last 2 years)
85566 MIPS -32%
7-Zip 18.03 / 7z b 4 -mmt1
Medion Erazer Beast X40 2024
Intel Core i9-14900HX
7340 MIPS +35%
Asus ROG Strix Scar 18 G834JYR (2024)
Intel Core i9-14900HX
7172 MIPS +32%
Alienware m18 R2
Intel Core i9-14900HX
7103 MIPS +30%
Average Intel Core i9-14900HX
  (5452 - 7545, n=37)
7021 MIPS +29%
Razer Blade 16 2024, RTX 4090
Intel Core i9-14900HX
7018 MIPS +29%
Lenovo Legion 9 16IRX8
Intel Core i9-13980HX
6965 MIPS +28%
Average of class Gaming
  (4199 - 7581, n=186, last 2 years)
6318 MIPS +16%
Lenovo Legion 9 16IRX9, RTX 4090
Intel Core i9-14900HX
5452 MIPS
Geekbench 6.3 / Multi-Core
Alienware m18 R2
Intel Core i9-14900HX
18233 Points +4%
Asus ROG Strix Scar 18 G834JYR (2024)
Intel Core i9-14900HX
17695 Points +1%
Razer Blade 16 2024, RTX 4090
Intel Core i9-14900HX
17559 Points 0%
Lenovo Legion 9 16IRX9, RTX 4090
Intel Core i9-14900HX
17499 Points
Lenovo Legion 9 16IRX8
Intel Core i9-13980HX
17472 Points 0%
Average Intel Core i9-14900HX
  (13158 - 19665, n=37)
17321 Points -1%
Medion Erazer Beast X40 2024
Intel Core i9-14900HX
15849 Points -9%
Average of class Gaming
  (5340 - 19665, n=112, last 2 years)
14207 Points -19%
Geekbench 6.3 / Single-Core
Medion Erazer Beast X40 2024
Intel Core i9-14900HX
3077 Points +27%
Alienware m18 R2
Intel Core i9-14900HX
3057 Points +26%
Asus ROG Strix Scar 18 G834JYR (2024)
Intel Core i9-14900HX
2999 Points +24%
Average Intel Core i9-14900HX
  (2419 - 3129, n=37)
2967 Points +23%
Razer Blade 16 2024, RTX 4090
Intel Core i9-14900HX
2964 Points +23%
Lenovo Legion 9 16IRX8
Intel Core i9-13980HX
2961 Points +22%
Average of class Gaming
  (1490 - 3129, n=112, last 2 years)
2651 Points +10%
Lenovo Legion 9 16IRX9, RTX 4090
Intel Core i9-14900HX
2419 Points
Geekbench 5.5 / Multi-Core
Lenovo Legion 9 16IRX9, RTX 4090
Intel Core i9-14900HX
21642 Points
Alienware m18 R2
Intel Core i9-14900HX
21284 Points -2%
Lenovo Legion 9 16IRX8
Intel Core i9-13980HX
20639 Points -5%
Asus ROG Strix Scar 18 G834JYR (2024)
Intel Core i9-14900HX
19975 Points -8%
Average Intel Core i9-14900HX
  (8618 - 23194, n=37)
19449 Points -10%
Razer Blade 16 2024, RTX 4090
Intel Core i9-14900HX
19372 Points -10%
Medion Erazer Beast X40 2024
Intel Core i9-14900HX
17082 Points -21%
Average of class Gaming
  (4557 - 23194, n=187, last 2 years)
15073 Points -30%
Geekbench 5.5 / Single-Core
Alienware m18 R2
Intel Core i9-14900HX
2193 Points +27%
Medion Erazer Beast X40 2024
Intel Core i9-14900HX
2168 Points +25%
Lenovo Legion 9 16IRX8
Intel Core i9-13980HX
2135 Points +23%
Razer Blade 16 2024, RTX 4090
Intel Core i9-14900HX
2131 Points +23%
Asus ROG Strix Scar 18 G834JYR (2024)
Intel Core i9-14900HX
2118 Points +22%
Average Intel Core i9-14900HX
  (1669 - 2210, n=37)
2092 Points +21%
Average of class Gaming
  (986 - 2210, n=187, last 2 years)
1897 Points +10%
Lenovo Legion 9 16IRX9, RTX 4090
Intel Core i9-14900HX
1729 Points
HWBOT x265 Benchmark v2.2 / 4k Preset
Alienware m18 R2
Intel Core i9-14900HX
32.1 fps +5%
Lenovo Legion 9 16IRX8
Intel Core i9-13980HX
31.7 fps +3%
Lenovo Legion 9 16IRX9, RTX 4090
Intel Core i9-14900HX
30.7 fps
Razer Blade 16 2024, RTX 4090
Intel Core i9-14900HX
30.1 fps -2%
Average Intel Core i9-14900HX
  (16.8 - 38.9, n=37)
29.3 fps -5%
Asus ROG Strix Scar 18 G834JYR (2024)
Intel Core i9-14900HX
29.2 fps -5%
Medion Erazer Beast X40 2024
Intel Core i9-14900HX
23.7 fps -23%
Average of class Gaming
  (6.72 - 38.9, n=186, last 2 years)
23.6 fps -23%
LibreOffice / 20 Documents To PDF
Lenovo Legion 9 16IRX9, RTX 4090
Intel Core i9-14900HX
53.6 s *
Average of class Gaming
  (31.4 - 199, n=183, last 2 years)
48.1 s * +10%
Razer Blade 16 2024, RTX 4090
Intel Core i9-14900HX
47.5 s * +11%
Average Intel Core i9-14900HX
  (31.4 - 199, n=37)
47.5 s * +11%
Alienware m18 R2
Intel Core i9-14900HX
44.8 s * +16%
Asus ROG Strix Scar 18 G834JYR (2024)
Intel Core i9-14900HX
43.8 s * +18%
Medion Erazer Beast X40 2024
Intel Core i9-14900HX
42.8 s * +20%
Lenovo Legion 9 16IRX8
Intel Core i9-13980HX
35 s * +35%
R Benchmark 2.5 / Overall mean
Lenovo Legion 9 16IRX9, RTX 4090
Intel Core i9-14900HX
0.4859 sec *
Average of class Gaming
  (0.3609 - 0.759, n=187, last 2 years)
0.4368 sec * +10%
Asus ROG Strix Scar 18 G834JYR (2024)
Intel Core i9-14900HX
0.3944 sec * +19%
Average Intel Core i9-14900HX
  (0.3604 - 0.4859, n=37)
0.385 sec * +21%
Lenovo Legion 9 16IRX8
Intel Core i9-13980HX
0.3797 sec * +22%
Razer Blade 16 2024, RTX 4090
Intel Core i9-14900HX
0.3789 sec * +22%
Alienware m18 R2
Intel Core i9-14900HX
0.3767 sec * +22%
Medion Erazer Beast X40 2024
Intel Core i9-14900HX
0.3717 sec * +24%

* ... im mniej tym lepiej

Cinebench R15 CPU Multi 64Bit
4879 Points
Cinebench R15 OpenGL 64Bit
241 fps
Cinebench R15 Ref. Match 64Bit
99.6 %
Cinebench R15 CPU Single 64Bit
247 Points
Cinebench R20 CPU (Multi Core)
11960 Points
Cinebench R20 CPU (Single Core)
657 Points
Cinebench R23 Single Core
1720 Points
Cinebench R23 Multi Core
31889 Points
Pomoc
Performance Rating
Alienware m18 R2
Intel Core i9-14900HX, NVIDIA GeForce RTX 4090 Laptop GPU
98.6 pt
Lenovo Legion 9 16IRX9, RTX 4090
Intel Core i9-14900HX, NVIDIA GeForce RTX 4090 Laptop GPU
96.2 pt
Lenovo Legion 9 16IRX8
Intel Core i9-13980HX, NVIDIA GeForce RTX 4090 Laptop GPU
93.5 pt
Razer Blade 16 2024, RTX 4090
Intel Core i9-14900HX, NVIDIA GeForce RTX 4090 Laptop GPU
90.5 pt
Asus ROG Strix Scar 18 G834JYR (2024)
Intel Core i9-14900HX, NVIDIA GeForce RTX 4090 Laptop GPU
90.2 pt
Average Intel Core i9-14900HX
 
88.9 pt
Medion Erazer Beast X40 2024
Intel Core i9-14900HX, NVIDIA GeForce RTX 4090 Laptop GPU
75.6 pt
Average of class Gaming
 
74.9 pt
AIDA64 / FP32 Ray-Trace
Alienware m18 R2
Intel Core i9-14900HX, NVIDIA GeForce RTX 4090 Laptop GPU
29280 KRay/s +6%
Lenovo Legion 9 16IRX9, RTX 4090
Intel Core i9-14900HX, NVIDIA GeForce RTX 4090 Laptop GPU
27535 KRay/s
Lenovo Legion 9 16IRX8
Intel Core i9-13980HX, NVIDIA GeForce RTX 4090 Laptop GPU
27175 KRay/s -1%
Razer Blade 16 2024, RTX 4090
Intel Core i9-14900HX, NVIDIA GeForce RTX 4090 Laptop GPU
25682 KRay/s -7%
Asus ROG Strix Scar 18 G834JYR (2024)
Intel Core i9-14900HX, NVIDIA GeForce RTX 4090 Laptop GPU
25444 KRay/s -8%
Average Intel Core i9-14900HX
  (13098 - 33474, n=36)
24763 KRay/s -10%
Average of class Gaming
  (4986 - 60169, n=183, last 2 years)
21914 KRay/s -20%
Medion Erazer Beast X40 2024
Intel Core i9-14900HX, NVIDIA GeForce RTX 4090 Laptop GPU
20114 KRay/s -27%
AIDA64 / FPU Julia
Alienware m18 R2
Intel Core i9-14900HX, NVIDIA GeForce RTX 4090 Laptop GPU
142791 Points +5%
Lenovo Legion 9 16IRX9, RTX 4090
Intel Core i9-14900HX, NVIDIA GeForce RTX 4090 Laptop GPU
136486 Points
Lenovo Legion 9 16IRX8
Intel Core i9-13980HX, NVIDIA GeForce RTX 4090 Laptop GPU
133962 Points -2%
Asus ROG Strix Scar 18 G834JYR (2024)
Intel Core i9-14900HX, NVIDIA GeForce RTX 4090 Laptop GPU
128826 Points -6%
Razer Blade 16 2024, RTX 4090
Intel Core i9-14900HX, NVIDIA GeForce RTX 4090 Laptop GPU
127908 Points -6%
Average Intel Core i9-14900HX
  (67573 - 166040, n=36)
124114 Points -9%
Average of class Gaming
  (25360 - 252486, n=183, last 2 years)
106726 Points -22%
Medion Erazer Beast X40 2024
Intel Core i9-14900HX, NVIDIA GeForce RTX 4090 Laptop GPU
103901 Points -24%
AIDA64 / CPU SHA3
Alienware m18 R2
Intel Core i9-14900HX, NVIDIA GeForce RTX 4090 Laptop GPU
7095 MB/s +1%
Lenovo Legion 9 16IRX9, RTX 4090
Intel Core i9-14900HX, NVIDIA GeForce RTX 4090 Laptop GPU
7000 MB/s
Lenovo Legion 9 16IRX8
Intel Core i9-13980HX, NVIDIA GeForce RTX 4090 Laptop GPU
6692 MB/s -4%
Asus ROG Strix Scar 18 G834JYR (2024)
Intel Core i9-14900HX, NVIDIA GeForce RTX 4090 Laptop GPU
6204 MB/s -11%
Razer Blade 16 2024, RTX 4090
Intel Core i9-14900HX, NVIDIA GeForce RTX 4090 Laptop GPU
6188 MB/s -12%
Average Intel Core i9-14900HX
  (3589 - 7979, n=36)
6130 MB/s -12%
Average of class Gaming
  (1339 - 10389, n=183, last 2 years)
4910 MB/s -30%
Medion Erazer Beast X40 2024
Intel Core i9-14900HX, NVIDIA GeForce RTX 4090 Laptop GPU
4905 MB/s -30%
AIDA64 / CPU Queen
Asus ROG Strix Scar 18 G834JYR (2024)
Intel Core i9-14900HX, NVIDIA GeForce RTX 4090 Laptop GPU
141681 Points +8%
Alienware m18 R2
Intel Core i9-14900HX, NVIDIA GeForce RTX 4090 Laptop GPU
139323 Points +7%
Razer Blade 16 2024, RTX 4090
Intel Core i9-14900HX, NVIDIA GeForce RTX 4090 Laptop GPU
138473 Points +6%
Average Intel Core i9-14900HX
  (118405 - 148966, n=36)
138261 Points +6%
Lenovo Legion 9 16IRX8
Intel Core i9-13980HX, NVIDIA GeForce RTX 4090 Laptop GPU
134299 Points +3%
Medion Erazer Beast X40 2024
Intel Core i9-14900HX, NVIDIA GeForce RTX 4090 Laptop GPU
132613 Points +1%
Lenovo Legion 9 16IRX9, RTX 4090
Intel Core i9-14900HX, NVIDIA GeForce RTX 4090 Laptop GPU
130803 Points
Average of class Gaming
  (50699 - 200651, n=183, last 2 years)
117145 Points -10%
AIDA64 / FPU SinJulia
Alienware m18 R2
Intel Core i9-14900HX, NVIDIA GeForce RTX 4090 Laptop GPU
16279 Points 0%
Lenovo Legion 9 16IRX9, RTX 4090
Intel Core i9-14900HX, NVIDIA GeForce RTX 4090 Laptop GPU
16268 Points
Asus ROG Strix Scar 18 G834JYR (2024)
Intel Core i9-14900HX, NVIDIA GeForce RTX 4090 Laptop GPU
16121 Points -1%
Razer Blade 16 2024, RTX 4090
Intel Core i9-14900HX, NVIDIA GeForce RTX 4090 Laptop GPU
15857 Points -3%
Lenovo Legion 9 16IRX8
Intel Core i9-13980HX, NVIDIA GeForce RTX 4090 Laptop GPU
15467 Points -5%
Average Intel Core i9-14900HX
  (10475 - 18517, n=36)
15241 Points -6%
Medion Erazer Beast X40 2024
Intel Core i9-14900HX, NVIDIA GeForce RTX 4090 Laptop GPU
13541 Points -17%
Average of class Gaming
  (4800 - 32988, n=183, last 2 years)
13258 Points -19%
AIDA64 / FPU Mandel
Alienware m18 R2
Intel Core i9-14900HX, NVIDIA GeForce RTX 4090 Laptop GPU
72594 Points +6%
Lenovo Legion 9 16IRX9, RTX 4090
Intel Core i9-14900HX, NVIDIA GeForce RTX 4090 Laptop GPU
68467 Points
Lenovo Legion 9 16IRX8
Intel Core i9-13980HX, NVIDIA GeForce RTX 4090 Laptop GPU
68019 Points -1%
Razer Blade 16 2024, RTX 4090
Intel Core i9-14900HX, NVIDIA GeForce RTX 4090 Laptop GPU
64134 Points -6%
Asus ROG Strix Scar 18 G834JYR (2024)
Intel Core i9-14900HX, NVIDIA GeForce RTX 4090 Laptop GPU
63748 Points -7%
Average Intel Core i9-14900HX
  (32543 - 83662, n=36)
61081 Points -11%
Average of class Gaming
  (12321 - 134044, n=183, last 2 years)
53700 Points -22%
Medion Erazer Beast X40 2024
Intel Core i9-14900HX, NVIDIA GeForce RTX 4090 Laptop GPU
50393 Points -26%
AIDA64 / CPU AES
Average Intel Core i9-14900HX
  (86964 - 241777, n=36)
139038 MB/s +4%
Alienware m18 R2
Intel Core i9-14900HX, NVIDIA GeForce RTX 4090 Laptop GPU
134675 MB/s +1%
Lenovo Legion 9 16IRX9, RTX 4090
Intel Core i9-14900HX, NVIDIA GeForce RTX 4090 Laptop GPU
133395 MB/s
Lenovo Legion 9 16IRX8
Intel Core i9-13980HX, NVIDIA GeForce RTX 4090 Laptop GPU
127602 MB/s -4%
Razer Blade 16 2024, RTX 4090
Intel Core i9-14900HX, NVIDIA GeForce RTX 4090 Laptop GPU
122937 MB/s -8%
Asus ROG Strix Scar 18 G834JYR (2024)
Intel Core i9-14900HX, NVIDIA GeForce RTX 4090 Laptop GPU
122250 MB/s -8%
Average of class Gaming
  (19065 - 328679, n=183, last 2 years)
109216 MB/s -18%
Medion Erazer Beast X40 2024
Intel Core i9-14900HX, NVIDIA GeForce RTX 4090 Laptop GPU
99333 MB/s -26%
AIDA64 / CPU ZLib
Alienware m18 R2
Intel Core i9-14900HX, NVIDIA GeForce RTX 4090 Laptop GPU
2053 MB/s 0%
Lenovo Legion 9 16IRX9, RTX 4090
Intel Core i9-14900HX, NVIDIA GeForce RTX 4090 Laptop GPU
2043 MB/s
Lenovo Legion 9 16IRX8
Intel Core i9-13980HX, NVIDIA GeForce RTX 4090 Laptop GPU
1929 MB/s -6%
Razer Blade 16 2024, RTX 4090
Intel Core i9-14900HX, NVIDIA GeForce RTX 4090 Laptop GPU
1863 MB/s -9%
Average Intel Core i9-14900HX
  (1054 - 2292, n=36)
1791 MB/s -12%
Asus ROG Strix Scar 18 G834JYR (2024)
Intel Core i9-14900HX, NVIDIA GeForce RTX 4090 Laptop GPU
1789 MB/s -12%
Medion Erazer Beast X40 2024
Intel Core i9-14900HX, NVIDIA GeForce RTX 4090 Laptop GPU
1443 MB/s -29%
Average of class Gaming
  (373 - 2409, n=183, last 2 years)
1367 MB/s -33%
AIDA64 / FP64 Ray-Trace
Alienware m18 R2
Intel Core i9-14900HX, NVIDIA GeForce RTX 4090 Laptop GPU
16128 KRay/s +9%
Lenovo Legion 9 16IRX8
Intel Core i9-13980HX, NVIDIA GeForce RTX 4090 Laptop GPU
14940 KRay/s +1%
Lenovo Legion 9 16IRX9, RTX 4090
Intel Core i9-14900HX, NVIDIA GeForce RTX 4090 Laptop GPU
14791 KRay/s
Razer Blade 16 2024, RTX 4090
Intel Core i9-14900HX, NVIDIA GeForce RTX 4090 Laptop GPU
13993 KRay/s -5%
Asus ROG Strix Scar 18 G834JYR (2024)
Intel Core i9-14900HX, NVIDIA GeForce RTX 4090 Laptop GPU
13608 KRay/s -8%
Average Intel Core i9-14900HX
  (6809 - 18349, n=36)
13332 KRay/s -10%
Average of class Gaming
  (2540 - 31796, n=183, last 2 years)
11803 KRay/s -20%
Medion Erazer Beast X40 2024
Intel Core i9-14900HX, NVIDIA GeForce RTX 4090 Laptop GPU
10990 KRay/s -26%
AIDA64 / CPU PhotoWorxx
Lenovo Legion 9 16IRX9, RTX 4090
Intel Core i9-14900HX, NVIDIA GeForce RTX 4090 Laptop GPU
54702 MPixel/s
Lenovo Legion 9 16IRX8
Intel Core i9-13980HX, NVIDIA GeForce RTX 4090 Laptop GPU
50656 MPixel/s -7%
Alienware m18 R2
Intel Core i9-14900HX, NVIDIA GeForce RTX 4090 Laptop GPU
49716 MPixel/s -9%
Asus ROG Strix Scar 18 G834JYR (2024)
Intel Core i9-14900HX, NVIDIA GeForce RTX 4090 Laptop GPU
49710 MPixel/s -9%
Razer Blade 16 2024, RTX 4090
Intel Core i9-14900HX, NVIDIA GeForce RTX 4090 Laptop GPU
49616 MPixel/s -9%
Medion Erazer Beast X40 2024
Intel Core i9-14900HX, NVIDIA GeForce RTX 4090 Laptop GPU
49089 MPixel/s -10%
Average Intel Core i9-14900HX
  (23903 - 54702, n=36)
46878 MPixel/s -14%
Average of class Gaming
  (10805 - 60161, n=184, last 2 years)
40243 MPixel/s -26%

Wydajność systemu

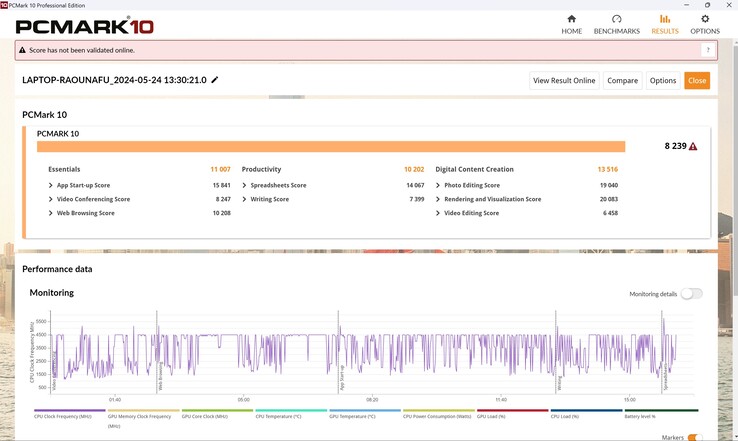
Jego wydajność w PCMark 10 była o około 5 procent niższa od przeciętnego laptopa z tą samą kombinacją CPU/GPU. Aida pokazała również, że chociaż jej pamięć RAM oferuje dobre szybkości odczytu i zapisu, jej opóźnienie pamięci jest niezwykle wysokie, co prowadzi do gorszych niż oczekiwano wyników w niektórych testach porównawczych, takich jak tutaj.

Subiektywnie zauważyliśmy, że chociaż laptop działa płynnie przez większość czasu, to czasami "zawiesza się" podczas uruchamiania gier. Zostało to również potwierdzone na wykresie liczby klatek na sekundę dla Far Cry 5, gdzie liczba klatek na sekundę wydaje się na krótko spadać, co wydaje się występować częściej. Jego opóźnienia DPC są również dość wysokie, patrz następna sekcja. Jego wyniki w aplikacjach internetowych również były wielokrotnie słabe.

PCMark 10
PCMark 10
PCMark 10 / Score
Alienware m18 R2
NVIDIA GeForce RTX 4090 Laptop GPU, i9-14900HX, SK Hynix PC811 HFS002TEM9X152N
9234 Points +12%
Lenovo Legion 9 16IRX8
NVIDIA GeForce RTX 4090 Laptop GPU, i9-13980HX, 2x SK Hynix HFS001TEJ9X115N (RAID 0)
9068 Points +10%
Medion Erazer Beast X40 2024
NVIDIA GeForce RTX 4090 Laptop GPU, i9-14900HX, Phison E18-1TB-PHISON-SSD-BICS5
8963 Points +9%
Asus ROG Strix Scar 18 G834JYR (2024)
NVIDIA GeForce RTX 4090 Laptop GPU, i9-14900HX, Samsung PM9A1a MZVL22T0HDLB
8801 Points +7%
Average Intel Core i9-14900HX, NVIDIA GeForce RTX 4090 Laptop GPU
  (8230 - 9234, n=13)
8674 Points +5%
Razer Blade 16 2024, RTX 4090
NVIDIA GeForce RTX 4090 Laptop GPU, i9-14900HX, Samsung PM9A1 MZVL22T0HBLB
8401 Points +2%
Lenovo Legion 9 16IRX9, RTX 4090
NVIDIA GeForce RTX 4090 Laptop GPU, i9-14900HX, Micron 3400 2TB MTFDKBA2T0TFH
8239 Points
Average of class Gaming
  (5776 - 9852, n=164, last 2 years)
7803 Points -5%
PCMark 10 / Essentials
Lenovo Legion 9 16IRX8
NVIDIA GeForce RTX 4090 Laptop GPU, i9-13980HX, 2x SK Hynix HFS001TEJ9X115N (RAID 0)
11644 Points +6%
Alienware m18 R2
NVIDIA GeForce RTX 4090 Laptop GPU, i9-14900HX, SK Hynix PC811 HFS002TEM9X152N
11415 Points +4%
Asus ROG Strix Scar 18 G834JYR (2024)
NVIDIA GeForce RTX 4090 Laptop GPU, i9-14900HX, Samsung PM9A1a MZVL22T0HDLB
11394 Points +4%
Average Intel Core i9-14900HX, NVIDIA GeForce RTX 4090 Laptop GPU
  (10778 - 11628, n=13)
11125 Points +1%
Lenovo Legion 9 16IRX9, RTX 4090
NVIDIA GeForce RTX 4090 Laptop GPU, i9-14900HX, Micron 3400 2TB MTFDKBA2T0TFH
11007 Points
Razer Blade 16 2024, RTX 4090
NVIDIA GeForce RTX 4090 Laptop GPU, i9-14900HX, Samsung PM9A1 MZVL22T0HBLB
10915 Points -1%
Medion Erazer Beast X40 2024
NVIDIA GeForce RTX 4090 Laptop GPU, i9-14900HX, Phison E18-1TB-PHISON-SSD-BICS5
10871 Points -1%
Average of class Gaming
  (9057 - 12334, n=163, last 2 years)
10833 Points -2%
PCMark 10 / Productivity
Medion Erazer Beast X40 2024
NVIDIA GeForce RTX 4090 Laptop GPU, i9-14900HX, Phison E18-1TB-PHISON-SSD-BICS5
11759 Points +15%
Alienware m18 R2
NVIDIA GeForce RTX 4090 Laptop GPU, i9-14900HX, SK Hynix PC811 HFS002TEM9X152N
11415 Points +12%
Razer Blade 16 2024, RTX 4090
NVIDIA GeForce RTX 4090 Laptop GPU, i9-14900HX, Samsung PM9A1 MZVL22T0HBLB
11150 Points +9%
Lenovo Legion 9 16IRX8
NVIDIA GeForce RTX 4090 Laptop GPU, i9-13980HX, 2x SK Hynix HFS001TEJ9X115N (RAID 0)
11067 Points +8%
Average Intel Core i9-14900HX, NVIDIA GeForce RTX 4090 Laptop GPU
  (9458 - 11759, n=13)
10610 Points +4%
Asus ROG Strix Scar 18 G834JYR (2024)
NVIDIA GeForce RTX 4090 Laptop GPU, i9-14900HX, Samsung PM9A1a MZVL22T0HDLB
10528 Points +3%
Lenovo Legion 9 16IRX9, RTX 4090
NVIDIA GeForce RTX 4090 Laptop GPU, i9-14900HX, Micron 3400 2TB MTFDKBA2T0TFH
10202 Points
Average of class Gaming
  (6662 - 14612, n=163, last 2 years)
9904 Points -3%
PCMark 10 / Digital Content Creation
Alienware m18 R2
NVIDIA GeForce RTX 4090 Laptop GPU, i9-14900HX, SK Hynix PC811 HFS002TEM9X152N
16398 Points +21%
Lenovo Legion 9 16IRX8
NVIDIA GeForce RTX 4090 Laptop GPU, i9-13980HX, 2x SK Hynix HFS001TEJ9X115N (RAID 0)
15702 Points +16%
Asus ROG Strix Scar 18 G834JYR (2024)
NVIDIA GeForce RTX 4090 Laptop GPU, i9-14900HX, Samsung PM9A1a MZVL22T0HDLB
15421 Points +14%
Medion Erazer Beast X40 2024
NVIDIA GeForce RTX 4090 Laptop GPU, i9-14900HX, Phison E18-1TB-PHISON-SSD-BICS5
15287 Points +13%
Average Intel Core i9-14900HX, NVIDIA GeForce RTX 4090 Laptop GPU
  (13219 - 16462, n=13)
15042 Points +11%
Lenovo Legion 9 16IRX9, RTX 4090
NVIDIA GeForce RTX 4090 Laptop GPU, i9-14900HX, Micron 3400 2TB MTFDKBA2T0TFH
13516 Points
Razer Blade 16 2024, RTX 4090
NVIDIA GeForce RTX 4090 Laptop GPU, i9-14900HX, Samsung PM9A1 MZVL22T0HBLB
13219 Points -2%
Average of class Gaming
  (6703 - 18475, n=163, last 2 years)
12134 Points -10%
CrossMark / Overall
Asus ROG Strix Scar 18 G834JYR (2024)
NVIDIA GeForce RTX 4090 Laptop GPU, i9-14900HX, Samsung PM9A1a MZVL22T0HDLB
2208 Points +14%
Razer Blade 16 2024, RTX 4090
NVIDIA GeForce RTX 4090 Laptop GPU, i9-14900HX, Samsung PM9A1 MZVL22T0HBLB
2149 Points +11%
Medion Erazer Beast X40 2024
NVIDIA GeForce RTX 4090 Laptop GPU, i9-14900HX, Phison E18-1TB-PHISON-SSD-BICS5
2144 Points +11%
Average Intel Core i9-14900HX, NVIDIA GeForce RTX 4090 Laptop GPU
  (1877 - 2344, n=10)
2119 Points +9%
Alienware m18 R2
NVIDIA GeForce RTX 4090 Laptop GPU, i9-14900HX, SK Hynix PC811 HFS002TEM9X152N
2073 Points +7%
Lenovo Legion 9 16IRX9, RTX 4090
NVIDIA GeForce RTX 4090 Laptop GPU, i9-14900HX, Micron 3400 2TB MTFDKBA2T0TFH
1939 Points
Lenovo Legion 9 16IRX8
NVIDIA GeForce RTX 4090 Laptop GPU, i9-13980HX, 2x SK Hynix HFS001TEJ9X115N (RAID 0)
1935 Points 0%
Average of class Gaming
  (1247 - 2344, n=145, last 2 years)
1910 Points -1%
CrossMark / Productivity
Medion Erazer Beast X40 2024
NVIDIA GeForce RTX 4090 Laptop GPU, i9-14900HX, Phison E18-1TB-PHISON-SSD-BICS5
2070 Points +18%
Asus ROG Strix Scar 18 G834JYR (2024)
NVIDIA GeForce RTX 4090 Laptop GPU, i9-14900HX, Samsung PM9A1a MZVL22T0HDLB
2055 Points +17%
Razer Blade 16 2024, RTX 4090
NVIDIA GeForce RTX 4090 Laptop GPU, i9-14900HX, Samsung PM9A1 MZVL22T0HBLB
2007 Points +14%
Average Intel Core i9-14900HX, NVIDIA GeForce RTX 4090 Laptop GPU
  (1738 - 2162, n=10)
1968 Points +12%
Alienware m18 R2
NVIDIA GeForce RTX 4090 Laptop GPU, i9-14900HX, SK Hynix PC811 HFS002TEM9X152N
1881 Points +7%
Average of class Gaming
  (1299 - 2204, n=145, last 2 years)
1809 Points +3%
Lenovo Legion 9 16IRX8
NVIDIA GeForce RTX 4090 Laptop GPU, i9-13980HX, 2x SK Hynix HFS001TEJ9X115N (RAID 0)
1764 Points +1%
Lenovo Legion 9 16IRX9, RTX 4090
NVIDIA GeForce RTX 4090 Laptop GPU, i9-14900HX, Micron 3400 2TB MTFDKBA2T0TFH
1755 Points
CrossMark / Creativity
Asus ROG Strix Scar 18 G834JYR (2024)
NVIDIA GeForce RTX 4090 Laptop GPU, i9-14900HX, Samsung PM9A1a MZVL22T0HDLB
2478 Points +12%
Razer Blade 16 2024, RTX 4090
NVIDIA GeForce RTX 4090 Laptop GPU, i9-14900HX, Samsung PM9A1 MZVL22T0HBLB
2418 Points +10%
Alienware m18 R2
NVIDIA GeForce RTX 4090 Laptop GPU, i9-14900HX, SK Hynix PC811 HFS002TEM9X152N
2393 Points +8%
Average Intel Core i9-14900HX, NVIDIA GeForce RTX 4090 Laptop GPU
  (2195 - 2660, n=10)
2387 Points +8%
Medion Erazer Beast X40 2024
NVIDIA GeForce RTX 4090 Laptop GPU, i9-14900HX, Phison E18-1TB-PHISON-SSD-BICS5
2323 Points +5%
Lenovo Legion 9 16IRX8
NVIDIA GeForce RTX 4090 Laptop GPU, i9-13980HX, 2x SK Hynix HFS001TEJ9X115N (RAID 0)
2267 Points +3%
Lenovo Legion 9 16IRX9, RTX 4090
NVIDIA GeForce RTX 4090 Laptop GPU, i9-14900HX, Micron 3400 2TB MTFDKBA2T0TFH
2207 Points
Average of class Gaming
  (1275 - 2660, n=145, last 2 years)
2097 Points -5%
CrossMark / Responsiveness
Asus ROG Strix Scar 18 G834JYR (2024)
NVIDIA GeForce RTX 4090 Laptop GPU, i9-14900HX, Samsung PM9A1a MZVL22T0HDLB
1944 Points +10%
Medion Erazer Beast X40 2024
NVIDIA GeForce RTX 4090 Laptop GPU, i9-14900HX, Phison E18-1TB-PHISON-SSD-BICS5
1874 Points +6%
Average Intel Core i9-14900HX, NVIDIA GeForce RTX 4090 Laptop GPU
  (1478 - 2327, n=10)
1862 Points +5%
Razer Blade 16 2024, RTX 4090
NVIDIA GeForce RTX 4090 Laptop GPU, i9-14900HX, Samsung PM9A1 MZVL22T0HBLB
1851 Points +5%
Alienware m18 R2
NVIDIA GeForce RTX 4090 Laptop GPU, i9-14900HX, SK Hynix PC811 HFS002TEM9X152N
1806 Points +2%
Lenovo Legion 9 16IRX9, RTX 4090
NVIDIA GeForce RTX 4090 Laptop GPU, i9-14900HX, Micron 3400 2TB MTFDKBA2T0TFH
1769 Points
Average of class Gaming
  (1030 - 2330, n=145, last 2 years)
1709 Points -3%
Lenovo Legion 9 16IRX8
NVIDIA GeForce RTX 4090 Laptop GPU, i9-13980HX, 2x SK Hynix HFS001TEJ9X115N (RAID 0)
1586 Points -10%
WebXPRT 3 / Overall
Lenovo Legion 9 16IRX8
NVIDIA GeForce RTX 4090 Laptop GPU, i9-13980HX, 2x SK Hynix HFS001TEJ9X115N (RAID 0)
349 Points +25%
Razer Blade 16 2024, RTX 4090
NVIDIA GeForce RTX 4090 Laptop GPU, i9-14900HX, Samsung PM9A1 MZVL22T0HBLB
330 Points +18%
Medion Erazer Beast X40 2024
NVIDIA GeForce RTX 4090 Laptop GPU, i9-14900HX, Phison E18-1TB-PHISON-SSD-BICS5
326 Points +17%
Alienware m18 R2
NVIDIA GeForce RTX 4090 Laptop GPU, i9-14900HX, SK Hynix PC811 HFS002TEM9X152N
326 Points +17%
Average Intel Core i9-14900HX, NVIDIA GeForce RTX 4090 Laptop GPU
  (279 - 339, n=10)
323 Points +16%
Asus ROG Strix Scar 18 G834JYR (2024)
NVIDIA GeForce RTX 4090 Laptop GPU, i9-14900HX, Samsung PM9A1a MZVL22T0HDLB
322 Points +15%
Average of class Gaming
  (215 - 480, n=161, last 2 years)
304 Points +9%
Lenovo Legion 9 16IRX9, RTX 4090
NVIDIA GeForce RTX 4090 Laptop GPU, i9-14900HX, Micron 3400 2TB MTFDKBA2T0TFH
279 Points
WebXPRT 4 / Overall
Alienware m18 R2
NVIDIA GeForce RTX 4090 Laptop GPU, i9-14900HX, SK Hynix PC811 HFS002TEM9X152N
309 Points +26%
Lenovo Legion 9 16IRX8
NVIDIA GeForce RTX 4090 Laptop GPU, i9-13980HX, 2x SK Hynix HFS001TEJ9X115N (RAID 0)
306 Points +24%
Asus ROG Strix Scar 18 G834JYR (2024)
NVIDIA GeForce RTX 4090 Laptop GPU, i9-14900HX, Samsung PM9A1a MZVL22T0HDLB
304 Points +24%
Medion Erazer Beast X40 2024
NVIDIA GeForce RTX 4090 Laptop GPU, i9-14900HX, Phison E18-1TB-PHISON-SSD-BICS5
295 Points +20%
Average Intel Core i9-14900HX, NVIDIA GeForce RTX 4090 Laptop GPU
  (246 - 309, n=8)
291 Points +18%
Average of class Gaming
  (176.4 - 328, n=150, last 2 years)
267 Points +9%
Lenovo Legion 9 16IRX9, RTX 4090
NVIDIA GeForce RTX 4090 Laptop GPU, i9-14900HX, Micron 3400 2TB MTFDKBA2T0TFH
246 Points
Mozilla Kraken 1.1 / Total
Lenovo Legion 9 16IRX9, RTX 4090
NVIDIA GeForce RTX 4090 Laptop GPU, i9-14900HX, Micron 3400 2TB MTFDKBA2T0TFH
535 ms *
Average of class Gaming
  (421 - 674, n=176, last 2 years)
502 ms * +6%
Average Intel Core i9-14900HX, NVIDIA GeForce RTX 4090 Laptop GPU
  (428 - 535, n=11)
456 ms * +15%
Razer Blade 16 2024, RTX 4090
NVIDIA GeForce RTX 4090 Laptop GPU, i9-14900HX, Samsung PM9A1 MZVL22T0HBLB
450 ms * +16%
Asus ROG Strix Scar 18 G834JYR (2024)
NVIDIA GeForce RTX 4090 Laptop GPU, i9-14900HX, Samsung PM9A1a MZVL22T0HDLB
449 ms * +16%
Lenovo Legion 9 16IRX8
NVIDIA GeForce RTX 4090 Laptop GPU, i9-13980HX, 2x SK Hynix HFS001TEJ9X115N (RAID 0)
447 ms * +16%
Medion Erazer Beast X40 2024
NVIDIA GeForce RTX 4090 Laptop GPU, i9-14900HX, Phison E18-1TB-PHISON-SSD-BICS5
437 ms * +18%
Alienware m18 R2
NVIDIA GeForce RTX 4090 Laptop GPU, i9-14900HX, SK Hynix PC811 HFS002TEM9X152N
430 ms * +20%

* ... im mniej tym lepiej

PCMark 10 Score
8239 pkt.
Pomoc
AIDA64 / Memory Copy
Asus ROG Strix Scar 18 G834JYR (2024)
Intel Core i9-14900HX, NVIDIA GeForce RTX 4090 Laptop GPU
83392 MB/s +2%
Lenovo Legion 9 16IRX9, RTX 4090
Intel Core i9-14900HX, NVIDIA GeForce RTX 4090 Laptop GPU
81940 MB/s
Alienware m18 R2
Intel Core i9-14900HX, NVIDIA GeForce RTX 4090 Laptop GPU
79243 MB/s -3%
Razer Blade 16 2024, RTX 4090
Intel Core i9-14900HX, NVIDIA GeForce RTX 4090 Laptop GPU
78799 MB/s -4%
Lenovo Legion 9 16IRX8
Intel Core i9-13980HX, NVIDIA GeForce RTX 4090 Laptop GPU
78266 MB/s -4%
Medion Erazer Beast X40 2024
Intel Core i9-14900HX, NVIDIA GeForce RTX 4090 Laptop GPU
77961 MB/s -5%
Average Intel Core i9-14900HX
  (38028 - 83392, n=36)
75105 MB/s -8%
Average of class Gaming
  (21842 - 94222, n=183, last 2 years)
65434 MB/s -20%
AIDA64 / Memory Read
Asus ROG Strix Scar 18 G834JYR (2024)
Intel Core i9-14900HX, NVIDIA GeForce RTX 4090 Laptop GPU
86788 MB/s +3%
Razer Blade 16 2024, RTX 4090
Intel Core i9-14900HX, NVIDIA GeForce RTX 4090 Laptop GPU
86387 MB/s +3%
Alienware m18 R2
Intel Core i9-14900HX, NVIDIA GeForce RTX 4090 Laptop GPU
85791 MB/s +2%
Lenovo Legion 9 16IRX8
Intel Core i9-13980HX, NVIDIA GeForce RTX 4090 Laptop GPU
85683 MB/s +2%
Medion Erazer Beast X40 2024
Intel Core i9-14900HX, NVIDIA GeForce RTX 4090 Laptop GPU
85340 MB/s +1%
Lenovo Legion 9 16IRX9, RTX 4090
Intel Core i9-14900HX, NVIDIA GeForce RTX 4090 Laptop GPU
84192 MB/s
Average Intel Core i9-14900HX
  (43306 - 87568, n=36)
81377 MB/s -3%
Average of class Gaming
  (23681 - 99713, n=183, last 2 years)
69366 MB/s -18%
AIDA64 / Memory Write
Lenovo Legion 9 16IRX9, RTX 4090
Intel Core i9-14900HX, NVIDIA GeForce RTX 4090 Laptop GPU
80589 MB/s
Asus ROG Strix Scar 18 G834JYR (2024)
Intel Core i9-14900HX, NVIDIA GeForce RTX 4090 Laptop GPU
77534 MB/s -4%
Medion Erazer Beast X40 2024
Intel Core i9-14900HX, NVIDIA GeForce RTX 4090 Laptop GPU
77302 MB/s -4%
Alienware m18 R2
Intel Core i9-14900HX, NVIDIA GeForce RTX 4090 Laptop GPU
77089 MB/s -4%
Lenovo Legion 9 16IRX8
Intel Core i9-13980HX, NVIDIA GeForce RTX 4090 Laptop GPU
76314 MB/s -5%
Razer Blade 16 2024, RTX 4090
Intel Core i9-14900HX, NVIDIA GeForce RTX 4090 Laptop GPU
75421 MB/s -6%
Average Intel Core i9-14900HX
  (37146 - 80589, n=36)
72406 MB/s -10%
Average of class Gaming
  (22986 - 108954, n=183, last 2 years)
67198 MB/s -17%
AIDA64 / Memory Latency
Lenovo Legion 9 16IRX9, RTX 4090
Intel Core i9-14900HX, NVIDIA GeForce RTX 4090 Laptop GPU
96.2 ns *
Average of class Gaming
  (59.5 - 259, n=183, last 2 years)
93.7 ns * +3%
Alienware m18 R2
Intel Core i9-14900HX, NVIDIA GeForce RTX 4090 Laptop GPU
86.4 ns * +10%
Average Intel Core i9-14900HX
  (76.1 - 105, n=36)
84.7 ns * +12%
Lenovo Legion 9 16IRX8
Intel Core i9-13980HX, NVIDIA GeForce RTX 4090 Laptop GPU
84 ns * +13%
Razer Blade 16 2024, RTX 4090
Intel Core i9-14900HX, NVIDIA GeForce RTX 4090 Laptop GPU
83.4 ns * +13%
Asus ROG Strix Scar 18 G834JYR (2024)
Intel Core i9-14900HX, NVIDIA GeForce RTX 4090 Laptop GPU
82.8 ns * +14%
Medion Erazer Beast X40 2024
Intel Core i9-14900HX, NVIDIA GeForce RTX 4090 Laptop GPU
80.9 ns * +16%

* ... im mniej tym lepiej

Opóźnienia DPC

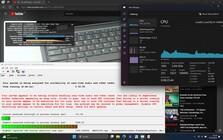
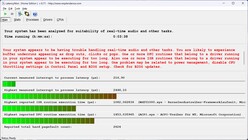
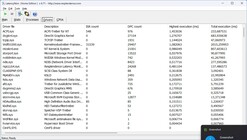
Pierwsze opóźnienia wystąpiły zaraz po otwarciu przeglądarki. Wartość minimalnie wzrosła po otwarciu kilku kart na naszej stronie internetowej. Jednak to przede wszystkim odtwarzanie naszego wideo 4K/60 fps na YouTube spowodowało gwałtowny wzrost wartości opóźnienia.

Ponadto, wewnętrzne obciążenie GPU - które było aktywne w tym przypadku - stale utrzymywało się na niezwykle wysokim poziomie 79%; wartości około 20% byłyby normalne! Niemniej jednak nie było żadnych spadków klatek, na które można by narzekać.

YouTube: Wysokie obciążenie GPU
LatencyMon main
LatencyMon main
Sterowniki LatencyMon
DPC Latencies / LatencyMon - interrupt to process latency (max), Web, Youtube, Prime95
Alienware m18 R2
NVIDIA GeForce RTX 4090 Laptop GPU, i9-14900HX, SK Hynix PC811 HFS002TEM9X152N
2815.1 μs * -15%
Lenovo Legion 9 16IRX9, RTX 4090
NVIDIA GeForce RTX 4090 Laptop GPU, i9-14900HX, Micron 3400 2TB MTFDKBA2T0TFH
2448.1 μs *
Lenovo Legion 9 16IRX8
NVIDIA GeForce RTX 4090 Laptop GPU, i9-13980HX, 2x SK Hynix HFS001TEJ9X115N (RAID 0)
2026.5 μs * +17%
Razer Blade 16 2024, RTX 4090
NVIDIA GeForce RTX 4090 Laptop GPU, i9-14900HX, Samsung PM9A1 MZVL22T0HBLB
1389.7 μs * +43%
Medion Erazer Beast X40 2024
NVIDIA GeForce RTX 4090 Laptop GPU, i9-14900HX, Phison E18-1TB-PHISON-SSD-BICS5
1305.5 μs * +47%
Asus ROG Strix Scar 18 G834JYR (2024)
NVIDIA GeForce RTX 4090 Laptop GPU, i9-14900HX, Samsung PM9A1a MZVL22T0HDLB
1117.4 μs * +54%

* ... im mniej tym lepiej

Urządzenie pamięci masowej

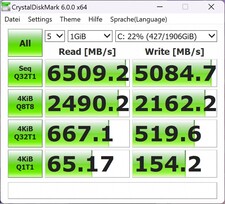
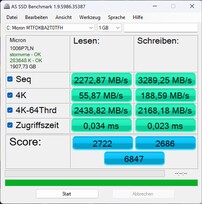
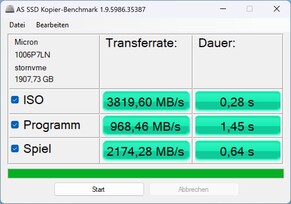
Lenovo zainstalowało w naszym modelu testowym dysk Micron 3400 z 2 TB pamięci masowej. Zajmuje on 121 miejsce na naszej liście Liście najlepszych dysków SSDco oznacza, że jest to dysk co najwyżej średniej klasy. Według Microna powinien on osiągać sekwencyjne prędkości odczytu do 6600 MB/s i sekwencyjne prędkości zapisu na poziomie 5000 MB/s, ale nasz model był tak samo daleki od tego wyniku, jak przeciętny laptop z tym samym dyskiem SSD w naszej bazie danych. Tylko Crystaldiskmark mógł potwierdzić wysokie wartości, podczas gdy DiskSpd i AS SSD zmierzyły znacznie niższe szybkości transmisji danych.

Zachowanie laptopa podczas ciągłego obciążenia jest niezwykłe: podczas gdy inne modele czasami nagrzewały się po pewnym czasie, a następnie były dławione, urządzenie pamięci masowej wewnątrz Legion 9 zachowywało się dokładnie odwrotnie. Na początku testu jego wydajność znacznie się wahała i wielokrotnie spadała. Jednak dysk SSD działał nieprzerwanie z maksymalną prędkością przez ostatnie dwie trzecie testu. Może to oznaczać, że system chłodzenia Legion 9i włącza się nieco za późno lub że osiąga optymalną wydajność chłodzenia zbyt późno.

Crystaldiskmark 6
Crystaldiskmark 6
AS SSD
AS SSD
Kopia AS SSD
Kopia AS SSD
Micron 3400 2TB MTFDKBA2T0TFH
CDM 5/6 Read Seq Q32T1: 6509 MB/s
CDM 5/6 Write Seq Q32T1: 5085 MB/s
CDM 5/6 Read 4K Q32T1: 667 MB/s
CDM 5/6 Write 4K Q32T1: 520 MB/s
CDM 5/6 Read 4K: 65.2 MB/s
CDM 5/6 Write 4K: 154.2 MB/s
CDM 6 Write 4K Q8T8: 2162 MB/s
CDM 6 Read 4K Q8T8: 2490 MB/s
Drive Performance Rating - Percent
Alienware m18 R2
SK Hynix PC811 HFS002TEM9X152N
84.7 pt
Medion Erazer Beast X40 2024
Phison E18-1TB-PHISON-SSD-BICS5
71.3 pt
Asus ROG Strix Scar 18 G834JYR (2024)
Samsung PM9A1a MZVL22T0HDLB
71.1 pt
Razer Blade 16 2024, RTX 4090
Samsung PM9A1 MZVL22T0HBLB
64.6 pt
Average Micron 3400 2TB MTFDKBA2T0TFH
 
61.1 pt
Lenovo Legion 9 16IRX8
2x SK Hynix HFS001TEJ9X115N (RAID 0)
60.1 pt
Lenovo Legion 9 16IRX9, RTX 4090
Micron 3400 2TB MTFDKBA2T0TFH
60 pt
Average of class Gaming
 
58.4 pt
DiskSpd
seq read
Alienware m18 R2
SK Hynix PC811 HFS002TEM9X152N
5588 (5540.05min - 5587.65max) MB/s +67%
Asus ROG Strix Scar 18 G834JYR (2024)
Samsung PM9A1a MZVL22T0HDLB
3908 (3887.48min - 3908.2max) MB/s +17%
Razer Blade 16 2024, RTX 4090
Samsung PM9A1 MZVL22T0HBLB
3795 (3693.04min - 3794.8max) MB/s +13%
Average of class Gaming
  (1319 - 7045, n=165, last 2 years)
3475 MB/s +4%
Average Micron 3400 2TB MTFDKBA2T0TFH
  (3347 - 3531, n=4)
3421 MB/s +2%
Lenovo Legion 9 16IRX9, RTX 4090
Micron 3400 2TB MTFDKBA2T0TFH
3347 (3203.49min - 3347.47max) MB/s
Medion Erazer Beast X40 2024
Phison E18-1TB-PHISON-SSD-BICS5
3238 (3056.39min - 3237.58max) MB/s -3%
Lenovo Legion 9 16IRX8
2x SK Hynix HFS001TEJ9X115N (RAID 0)
3087 (3070.23min - 3086.59max) MB/s -8%
seq write
Lenovo Legion 9 16IRX8
2x SK Hynix HFS001TEJ9X115N (RAID 0)
8109 (7978.61min - 8108.5max) MB/s +116%
Alienware m18 R2
SK Hynix PC811 HFS002TEM9X152N
5153 (5139.7min - 5152.91max) MB/s +37%
Asus ROG Strix Scar 18 G834JYR (2024)
Samsung PM9A1a MZVL22T0HDLB
4335 (4306.29min - 4335.44max) MB/s +16%
Average Micron 3400 2TB MTFDKBA2T0TFH
  (3655 - 4880, n=4)
4193 MB/s +12%
Medion Erazer Beast X40 2024
Phison E18-1TB-PHISON-SSD-BICS5
3940 (3577.56min - 3940.13max) MB/s +5%
Average of class Gaming
  (535 - 9307, n=165, last 2 years)
3812 MB/s +2%
Razer Blade 16 2024, RTX 4090
Samsung PM9A1 MZVL22T0HBLB
3794 (3745.51min - 3793.5max) MB/s +1%
Lenovo Legion 9 16IRX9, RTX 4090
Micron 3400 2TB MTFDKBA2T0TFH
3750 (3377.21min - 3749.92max) MB/s
seq q8 t1 read
Lenovo Legion 9 16IRX8
2x SK Hynix HFS001TEJ9X115N (RAID 0)
7439 (6642.31min - 7439.43max) MB/s +14%
Alienware m18 R2
SK Hynix PC811 HFS002TEM9X152N
7110 (6256.85min - 7110.18max) MB/s +9%
Asus ROG Strix Scar 18 G834JYR (2024)
Samsung PM9A1a MZVL22T0HDLB
7084 (6413.06min - 7083.97max) MB/s +9%
Medion Erazer Beast X40 2024
Phison E18-1TB-PHISON-SSD-BICS5
6929 (6183.66min - 6928.97max) MB/s +6%
Razer Blade 16 2024, RTX 4090
Samsung PM9A1 MZVL22T0HBLB
6673 (5801.28min - 6672.72max) MB/s +2%
Lenovo Legion 9 16IRX9, RTX 4090
Micron 3400 2TB MTFDKBA2T0TFH
6523 (5649.96min - 6522.56max) MB/s
Average Micron 3400 2TB MTFDKBA2T0TFH
  (6449 - 6523, n=4)
6474 MB/s -1%
Average of class Gaming
  (2594 - 16089, n=165, last 2 years)
6323 MB/s -3%
seq q8 t1 write
Lenovo Legion 9 16IRX8
2x SK Hynix HFS001TEJ9X115N (RAID 0)
11187 (11074.2min - 11187.3max) MB/s +120%
Alienware m18 R2
SK Hynix PC811 HFS002TEM9X152N
6779 (6710.47min - 6778.83max) MB/s +33%
Medion Erazer Beast X40 2024
Phison E18-1TB-PHISON-SSD-BICS5
5740 (5704.67min - 5740.32max) MB/s +13%
Asus ROG Strix Scar 18 G834JYR (2024)
Samsung PM9A1a MZVL22T0HDLB
5255 (5183.65min - 5254.62max) MB/s +3%
Lenovo Legion 9 16IRX9, RTX 4090
Micron 3400 2TB MTFDKBA2T0TFH
5092 (4641.78min - 5091.77max) MB/s
Average Micron 3400 2TB MTFDKBA2T0TFH
  (4803 - 5101, n=4)
5015 MB/s -2%
Razer Blade 16 2024, RTX 4090
Samsung PM9A1 MZVL22T0HBLB
4936 (4909.47min - 4936.28max) MB/s -3%
Average of class Gaming
  (539 - 14571, n=165, last 2 years)
4851 MB/s -5%
4k q1 t1 read
Asus ROG Strix Scar 18 G834JYR (2024)
Samsung PM9A1a MZVL22T0HDLB
80.7 (80.11min - 80.66max) MB/s +37%
Alienware m18 R2
SK Hynix PC811 HFS002TEM9X152N
75.4 (73.49min - 75.43max) MB/s +28%
Razer Blade 16 2024, RTX 4090
Samsung PM9A1 MZVL22T0HBLB
71.4 (66.19min - 71.35max) MB/s +21%
Lenovo Legion 9 16IRX8
2x SK Hynix HFS001TEJ9X115N (RAID 0)
68.8 (67.29min - 68.75max) MB/s +16%
Average Micron 3400 2TB MTFDKBA2T0TFH
  (59.1 - 69.5, n=4)
66 MB/s +12%
Average of class Gaming
  (30.6 - 95.9, n=165, last 2 years)
66 MB/s +12%
Lenovo Legion 9 16IRX9, RTX 4090
Micron 3400 2TB MTFDKBA2T0TFH
59.1 (58.3min - 59.06max) MB/s
Medion Erazer Beast X40 2024
Phison E18-1TB-PHISON-SSD-BICS5
54.5 (53.38min - 54.47max) MB/s -8%
4k q1 t1 write
Medion Erazer Beast X40 2024
Phison E18-1TB-PHISON-SSD-BICS5
324 (322.91min - 324.37max) MB/s +55%
Alienware m18 R2
SK Hynix PC811 HFS002TEM9X152N
300 (297.27min - 299.6max) MB/s +44%
Asus ROG Strix Scar 18 G834JYR (2024)
Samsung PM9A1a MZVL22T0HDLB
230 (219.52min - 229.87max) MB/s +10%
Average of class Gaming
  (78 - 397, n=165, last 2 years)
224 MB/s +7%
Average Micron 3400 2TB MTFDKBA2T0TFH
  (147.3 - 253, n=4)
215 MB/s +3%
Lenovo Legion 9 16IRX9, RTX 4090
Micron 3400 2TB MTFDKBA2T0TFH
209 (203.44min - 208.84max) MB/s
Razer Blade 16 2024, RTX 4090
Samsung PM9A1 MZVL22T0HBLB
205 (202.97min - 204.75max) MB/s -2%
Lenovo Legion 9 16IRX8
2x SK Hynix HFS001TEJ9X115N (RAID 0)
178.4 (174.74min - 178.37max) MB/s -15%
4k q32 t16 read
Alienware m18 R2
SK Hynix PC811 HFS002TEM9X152N
6067 (5596.15min - 6066.73max) MB/s +102%
Asus ROG Strix Scar 18 G834JYR (2024)
Samsung PM9A1a MZVL22T0HDLB
3732 (3273.44min - 3732.1max) MB/s +25%
Razer Blade 16 2024, RTX 4090
Samsung PM9A1 MZVL22T0HBLB
3726 (3704.12min - 3725.6max) MB/s +24%
Medion Erazer Beast X40 2024
Phison E18-1TB-PHISON-SSD-BICS5
3653 (3636.8min - 3652.63max) MB/s +22%
Lenovo Legion 9 16IRX9, RTX 4090
Micron 3400 2TB MTFDKBA2T0TFH
2997 (2834.64min - 2996.72max) MB/s
Average of class Gaming
  (417 - 6172, n=165, last 2 years)
2571 MB/s -14%
Average Micron 3400 2TB MTFDKBA2T0TFH
  (729 - 3013, n=4)
2434 MB/s -19%
Lenovo Legion 9 16IRX8
2x SK Hynix HFS001TEJ9X115N (RAID 0)
1666 (1310.98min - 1665.65max) MB/s -44%
4k q32 t16 write
Alienware m18 R2
SK Hynix PC811 HFS002TEM9X152N
4176 (3805.57min - 4175.9max) MB/s +56%
Razer Blade 16 2024, RTX 4090
Samsung PM9A1 MZVL22T0HBLB
3548 (3533.85min - 3548.33max) MB/s +33%
Medion Erazer Beast X40 2024
Phison E18-1TB-PHISON-SSD-BICS5
3447 (3336.65min - 3446.75max) MB/s +29%
Asus ROG Strix Scar 18 G834JYR (2024)
Samsung PM9A1a MZVL22T0HDLB
2900 MB/s +8%
Lenovo Legion 9 16IRX9, RTX 4090
Micron 3400 2TB MTFDKBA2T0TFH
2673 (2401.6min - 2673.33max) MB/s
Average Micron 3400 2TB MTFDKBA2T0TFH
  (542 - 2736, n=4)
2167 MB/s -19%
Average of class Gaming
  (162.3 - 4869, n=165, last 2 years)
2137 MB/s -20%
Lenovo Legion 9 16IRX8
2x SK Hynix HFS001TEJ9X115N (RAID 0)
1433 (1370.49min - 1433.18max) MB/s -46%
AS SSD
Score Total
Alienware m18 R2
SK Hynix PC811 HFS002TEM9X152N
10655 Points +56%
Medion Erazer Beast X40 2024
Phison E18-1TB-PHISON-SSD-BICS5
8462 Points +24%
Asus ROG Strix Scar 18 G834JYR (2024)
Samsung PM9A1a MZVL22T0HDLB
8367 Points +22%
Razer Blade 16 2024, RTX 4090
Samsung PM9A1 MZVL22T0HBLB
7040 Points +3%
Lenovo Legion 9 16IRX9, RTX 4090
Micron 3400 2TB MTFDKBA2T0TFH
6847 Points
Average of class Gaming
  (2271 - 13854, n=156, last 2 years)
6746 Points -1%
Average Micron 3400 2TB MTFDKBA2T0TFH
  (5068 - 7774, n=3)
6563 Points -4%
Lenovo Legion 9 16IRX8
2x SK Hynix HFS001TEJ9X115N (RAID 0)
4895 Points -29%
Score Read
Alienware m18 R2
SK Hynix PC811 HFS002TEM9X152N
3753 Points +38%
Asus ROG Strix Scar 18 G834JYR (2024)
Samsung PM9A1a MZVL22T0HDLB
3272 Points +20%
Medion Erazer Beast X40 2024
Phison E18-1TB-PHISON-SSD-BICS5
3033 Points +11%
Razer Blade 16 2024, RTX 4090
Samsung PM9A1 MZVL22T0HBLB
2848 Points +5%
Lenovo Legion 9 16IRX9, RTX 4090
Micron 3400 2TB MTFDKBA2T0TFH
2722 Points
Average of class Gaming
  (776 - 4721, n=156, last 2 years)
2446 Points -10%
Average Micron 3400 2TB MTFDKBA2T0TFH
  (1517 - 2959, n=3)
2399 Points -12%
Lenovo Legion 9 16IRX8
2x SK Hynix HFS001TEJ9X115N (RAID 0)
2002 Points -26%
Score Write
Alienware m18 R2
SK Hynix PC811 HFS002TEM9X152N
4993 Points +86%
Medion Erazer Beast X40 2024
Phison E18-1TB-PHISON-SSD-BICS5
3948 Points +47%
Asus ROG Strix Scar 18 G834JYR (2024)
Samsung PM9A1a MZVL22T0HDLB
3490 Points +30%
Average of class Gaming
  (515 - 7208, n=156, last 2 years)
3112 Points +16%
Average Micron 3400 2TB MTFDKBA2T0TFH
  (2686 - 3331, n=3)
2999 Points +12%
Razer Blade 16 2024, RTX 4090
Samsung PM9A1 MZVL22T0HBLB
2766 Points +3%
Lenovo Legion 9 16IRX9, RTX 4090
Micron 3400 2TB MTFDKBA2T0TFH
2686 Points
Lenovo Legion 9 16IRX8
2x SK Hynix HFS001TEJ9X115N (RAID 0)
1903 Points -29%
Seq Read
Lenovo Legion 9 16IRX8
2x SK Hynix HFS001TEJ9X115N (RAID 0)
8168.77 MB/s +260%
Alienware m18 R2
SK Hynix PC811 HFS002TEM9X152N
5916.27 MB/s +160%
Asus ROG Strix Scar 18 G834JYR (2024)
Samsung PM9A1a MZVL22T0HDLB
5636.54 MB/s +148%
Medion Erazer Beast X40 2024
Phison E18-1TB-PHISON-SSD-BICS5
5459.84 MB/s +140%
Average of class Gaming
  (2260 - 12763, n=156, last 2 years)
4945 MB/s +118%
Razer Blade 16 2024, RTX 4090
Samsung PM9A1 MZVL22T0HBLB
4371 MB/s +92%
Average Micron 3400 2TB MTFDKBA2T0TFH
  (2272 - 5126, n=3)
4078 MB/s +79%
Lenovo Legion 9 16IRX9, RTX 4090
Micron 3400 2TB MTFDKBA2T0TFH
2272 MB/s
Seq Write
Lenovo Legion 9 16IRX8
2x SK Hynix HFS001TEJ9X115N (RAID 0)
7332.87 MB/s +123%
Alienware m18 R2
SK Hynix PC811 HFS002TEM9X152N
5929.42 MB/s +80%
Asus ROG Strix Scar 18 G834JYR (2024)
Samsung PM9A1a MZVL22T0HDLB
4294.95 MB/s +31%
Medion Erazer Beast X40 2024
Phison E18-1TB-PHISON-SSD-BICS5
3914.76 MB/s +19%
Razer Blade 16 2024, RTX 4090
Samsung PM9A1 MZVL22T0HBLB
3791 MB/s +15%
Average of class Gaming
  (495 - 11316, n=156, last 2 years)
3760 MB/s +14%
Lenovo Legion 9 16IRX9, RTX 4090
Micron 3400 2TB MTFDKBA2T0TFH
3289 MB/s
Average Micron 3400 2TB MTFDKBA2T0TFH
  (462 - 4546, n=3)
2766 MB/s -16%
4K Read
Medion Erazer Beast X40 2024
Phison E18-1TB-PHISON-SSD-BICS5
82.84 MB/s +48%
Asus ROG Strix Scar 18 G834JYR (2024)
Samsung PM9A1a MZVL22T0HDLB
75.56 MB/s +35%
Average of class Gaming
  (27.8 - 112.1, n=156, last 2 years)
65.2 MB/s +17%
Alienware m18 R2
SK Hynix PC811 HFS002TEM9X152N
64.97 MB/s +16%
Lenovo Legion 9 16IRX8
2x SK Hynix HFS001TEJ9X115N (RAID 0)
62.87 MB/s +12%
Average Micron 3400 2TB MTFDKBA2T0TFH
  (55.9 - 67.7, n=3)
62.5 MB/s +12%
Razer Blade 16 2024, RTX 4090
Samsung PM9A1 MZVL22T0HBLB
61.1 MB/s +9%
Lenovo Legion 9 16IRX9, RTX 4090
Micron 3400 2TB MTFDKBA2T0TFH
55.9 MB/s
4K Write
Alienware m18 R2
SK Hynix PC811 HFS002TEM9X152N
238.28 MB/s +26%
Medion Erazer Beast X40 2024
Phison E18-1TB-PHISON-SSD-BICS5
237.11 MB/s +26%
Average of class Gaming
  (108.8 - 512, n=156, last 2 years)
213 MB/s +13%
Asus ROG Strix Scar 18 G834JYR (2024)
Samsung PM9A1a MZVL22T0HDLB
207.25 MB/s +10%
Average Micron 3400 2TB MTFDKBA2T0TFH
  (188.6 - 207, n=3)
197.7 MB/s +5%
Lenovo Legion 9 16IRX9, RTX 4090
Micron 3400 2TB MTFDKBA2T0TFH
188.6 MB/s
Lenovo Legion 9 16IRX8
2x SK Hynix HFS001TEJ9X115N (RAID 0)
162.28 MB/s -14%
Razer Blade 16 2024, RTX 4090
Samsung PM9A1 MZVL22T0HBLB
160.6 MB/s -15%
4K-64 Read
Alienware m18 R2
SK Hynix PC811 HFS002TEM9X152N
3096 MB/s +27%
Asus ROG Strix Scar 18 G834JYR (2024)
Samsung PM9A1a MZVL22T0HDLB
2636.61 MB/s +8%
Lenovo Legion 9 16IRX9, RTX 4090
Micron 3400 2TB MTFDKBA2T0TFH
2439 MB/s
Medion Erazer Beast X40 2024
Phison E18-1TB-PHISON-SSD-BICS5
2404.46 MB/s -1%
Razer Blade 16 2024, RTX 4090
Samsung PM9A1 MZVL22T0HBLB
2350 MB/s -4%
Average Micron 3400 2TB MTFDKBA2T0TFH
  (969 - 2439, n=3)
1929 MB/s -21%
Average of class Gaming
  (451 - 3475, n=156, last 2 years)
1881 MB/s -23%
Lenovo Legion 9 16IRX8
2x SK Hynix HFS001TEJ9X115N (RAID 0)
1122.07 MB/s -54%
4K-64 Write
Alienware m18 R2
SK Hynix PC811 HFS002TEM9X152N
4161.9 MB/s +92%
Medion Erazer Beast X40 2024
Phison E18-1TB-PHISON-SSD-BICS5
3319.37 MB/s +53%
Asus ROG Strix Scar 18 G834JYR (2024)
Samsung PM9A1a MZVL22T0HDLB
2866.57 MB/s +32%
Average of class Gaming
  (277 - 5909, n=156, last 2 years)
2527 MB/s +17%
Average Micron 3400 2TB MTFDKBA2T0TFH
  (2168 - 2736, n=3)
2524 MB/s +16%
Razer Blade 16 2024, RTX 4090
Samsung PM9A1 MZVL22T0HBLB
2226 MB/s +3%
Lenovo Legion 9 16IRX9, RTX 4090
Micron 3400 2TB MTFDKBA2T0TFH
2168 MB/s
Lenovo Legion 9 16IRX8
2x SK Hynix HFS001TEJ9X115N (RAID 0)
1007.57 MB/s -54%
Access Time Read
Medion Erazer Beast X40 2024
Phison E18-1TB-PHISON-SSD-BICS5
0.057 ms * -68%
Average of class Gaming
  (0.016 - 0.379, n=155, last 2 years)
0.05576 ms * -64%
Asus ROG Strix Scar 18 G834JYR (2024)
Samsung PM9A1a MZVL22T0HDLB
0.046 ms * -35%
Lenovo Legion 9 16IRX9, RTX 4090
Micron 3400 2TB MTFDKBA2T0TFH
0.034 ms *
Lenovo Legion 9 16IRX8
2x SK Hynix HFS001TEJ9X115N (RAID 0)
0.033 ms * +3%
Razer Blade 16 2024, RTX 4090
Samsung PM9A1 MZVL22T0HBLB
0.033 ms * +3%
Alienware m18 R2
SK Hynix PC811 HFS002TEM9X152N
0.029 ms * +15%
Average Micron 3400 2TB MTFDKBA2T0TFH
  (0.022 - 0.034, n=3)
0.02767 ms * +19%
Access Time Write
Lenovo Legion 9 16IRX8
2x SK Hynix HFS001TEJ9X115N (RAID 0)
0.071 ms * -209%
Alienware m18 R2
SK Hynix PC811 HFS002TEM9X152N
0.055 ms * -139%
Average of class Gaming
  (0.011 - 1.028, n=156, last 2 years)
0.04728 ms * -106%
Razer Blade 16 2024, RTX 4090
Samsung PM9A1 MZVL22T0HBLB
0.025 ms * -9%
Lenovo Legion 9 16IRX9, RTX 4090
Micron 3400 2TB MTFDKBA2T0TFH
0.023 ms *
Asus ROG Strix Scar 18 G834JYR (2024)
Samsung PM9A1a MZVL22T0HDLB
0.022 ms * +4%
Average Micron 3400 2TB MTFDKBA2T0TFH
  (0.02 - 0.023, n=3)
0.021 ms * +9%
Medion Erazer Beast X40 2024
Phison E18-1TB-PHISON-SSD-BICS5
0.016 ms * +30%

* ... im mniej tym lepiej

Reading continuous performance: DiskSpd Read Loop, Queue Depth 8

037575011251500187522502625300033753750412545004875525056256000637567507125Tooltip
Lenovo Legion 9 16IRX9, RTX 4090 Micron 3400 2TB MTFDKBA2T0TFH; diskspd 2.0.17 f: Ø5061 (3927.87-5317.18)
Lenovo Legion 9 16IRX8 2x SK Hynix HFS001TEJ9X115N (RAID 0): Ø6539 (4611.21-7454.56)
Razer Blade 16 2024, RTX 4090 Samsung PM9A1 MZVL22T0HBLB; diskspd 2.0.17 f: Ø5414 (3853.78-6701.45)
Alienware m18 R2 SK Hynix PC811 HFS002TEM9X152N; diskspd 2.0.17 f: Ø7089 (6353.66-7123.8)

Karta graficzna

Karta graficzna Nvidia Geforce RTX 4090 wewnątrz Legion 9i jest obecnie liderem wśród kart graficznych do laptopów. W związku z tym powinna być w stanie uruchomić wszystkie obecne gry w wysokiej rozdzielczości i maksymalnych detalach.

W syntetycznych testach 3DMark jego wydajność była mniej więcej na oczekiwanym poziomie, ale ponownie była nieco niższa, a bezpośrednia konkurencja była często o kilka punktów procentowych szybsza - tak się składa, że również znacznie mniejszy i smuklejszy Blade 16.

Po odłączeniu laptopa od zasilania, jego wynik Fire Strike spada o około 40 procent, jeśli chodzi o wydajność 3D.

W grach jego wydajność jest mniej więcej porównywalna z Razer Blade 16. Jego wyniki byłyby prawdopodobnie wyższe, gdyby nie wspomniane wcześniej krótkie spadki liczby klatek na sekundę. Problem ten widać dość wyraźnie w wartościach liczby klatek na sekundę w naszym 1-godzinnym teście Witcher 3. Spadki liczby klatek na sekundę występowały głównie na wczesnych etapach, po czym system działał stabilnie, a jego wydajność była na równi z konkurencją.

Tylko podczas uruchamiania bardzo aktualnych i wymagających gier, takich jak Skull & Bones, liczba klatek na sekundę w rozdzielczości 4K czasami spada poniżej 60 fps, w przeciwnym razie wszystkie gry działają płynnie przy ponad 60 fps, nawet w 4K.

Profil wydajności/wartość pomiaru Witcher 3 fps start Witcher 3 fps po 10 min Pobór mocy w watach Pobór mocy GPU w watach Średnie taktowanie GPU w MHz Emisja hałasu w dB
Wydajność 203 192 246 162 2,120 55.32
Wydajność z GPU boost 201 193 254 160.5 2,180 55.32
Zrównoważony z AI 197 182 254 159 2,080 54.81
Zrównoważony bez AI 161 145 184 103 1,530 47.98
Cichy 108 60 101 43 pierwsze 1,000, po 2 minutach 800 32.19
3DMark Performance Rating - Percent
Alienware m18 R2 -1!
NVIDIA GeForce RTX 4090 Laptop GPU, Intel Core i9-14900HX
98.5 pt
Razer Blade 16 2024, RTX 4090
NVIDIA GeForce RTX 4090 Laptop GPU, Intel Core i9-14900HX
96.1 pt
Lenovo Legion 9 16IRX8 -1!
NVIDIA GeForce RTX 4090 Laptop GPU, Intel Core i9-13980HX
96 pt
Average NVIDIA GeForce RTX 4090 Laptop GPU
 
95.2 pt
Medion Erazer Beast X40 2024 -1!
NVIDIA GeForce RTX 4090 Laptop GPU, Intel Core i9-14900HX
94 pt
Lenovo Legion 9 16IRX9, RTX 4090
NVIDIA GeForce RTX 4090 Laptop GPU, Intel Core i9-14900HX
93.9 pt
Asus ROG Strix Scar 18 G834JYR (2024)
NVIDIA GeForce RTX 4090 Laptop GPU, Intel Core i9-14900HX
91.4 pt
Average of class Gaming
 
71 pt
3DMark 11 - 1280x720 Performance GPU
Alienware m18 R2
NVIDIA GeForce RTX 4090 Laptop GPU, Intel Core i9-14900HX
69254 Points +8%
Razer Blade 16 2024, RTX 4090
NVIDIA GeForce RTX 4090 Laptop GPU, Intel Core i9-14900HX
65956 Points +3%
Average NVIDIA GeForce RTX 4090 Laptop GPU
  (54073 - 73027, n=42)
65041 Points +1%
Medion Erazer Beast X40 2024
NVIDIA GeForce RTX 4090 Laptop GPU, Intel Core i9-14900HX
64540 Points 0%
Lenovo Legion 9 16IRX9, RTX 4090
NVIDIA GeForce RTX 4090 Laptop GPU, Intel Core i9-14900HX
64341 Points
Lenovo Legion 9 16IRX8
NVIDIA GeForce RTX 4090 Laptop GPU, Intel Core i9-13980HX
63925 Points -1%
Asus ROG Strix Scar 18 G834JYR (2024)
NVIDIA GeForce RTX 4090 Laptop GPU, Intel Core i9-14900HX
61833 Points -4%
Average of class Gaming
  (1029 - 72178, n=183, last 2 years)
43810 Points -32%
3DMark
1280x720 Cloud Gate Standard Graphics
Razer Blade 16 2024, RTX 4090
NVIDIA GeForce RTX 4090 Laptop GPU, Intel Core i9-14900HX
152306 Points +3%
Lenovo Legion 9 16IRX9, RTX 4090
NVIDIA GeForce RTX 4090 Laptop GPU, Intel Core i9-14900HX
148437 Points
Average of class Gaming
  (15902 - 193851, n=101, last 2 years)
143583 Points -3%
Average NVIDIA GeForce RTX 4090 Laptop GPU
  (95671 - 164399, n=14)
142227 Points -4%
Asus ROG Strix Scar 18 G834JYR (2024)
NVIDIA GeForce RTX 4090 Laptop GPU, Intel Core i9-14900HX
141676 Points -5%
1920x1080 Fire Strike Graphics
Razer Blade 16 2024, RTX 4090
NVIDIA GeForce RTX 4090 Laptop GPU, Intel Core i9-14900HX
46527 Points +7%
Lenovo Legion 9 16IRX8
NVIDIA GeForce RTX 4090 Laptop GPU, Intel Core i9-13980HX
46386 Points +7%
Average NVIDIA GeForce RTX 4090 Laptop GPU
  (40259 - 53059, n=41)
46365 Points +7%
Alienware m18 R2
NVIDIA GeForce RTX 4090 Laptop GPU, Intel Core i9-14900HX
44492 Points +2%
Medion Erazer Beast X40 2024
NVIDIA GeForce RTX 4090 Laptop GPU, Intel Core i9-14900HX
44366 Points +2%
Lenovo Legion 9 16IRX9, RTX 4090
NVIDIA GeForce RTX 4090 Laptop GPU, Intel Core i9-14900HX
43518 Points
Asus ROG Strix Scar 18 G834JYR (2024)
NVIDIA GeForce RTX 4090 Laptop GPU, Intel Core i9-14900HX
43477 Points 0%
Average of class Gaming
  (781 - 53059, n=194, last 2 years)
31415 Points -28%
2560x1440 Time Spy Graphics
Alienware m18 R2
NVIDIA GeForce RTX 4090 Laptop GPU, Intel Core i9-14900HX
22290 Points +9%
Lenovo Legion 9 16IRX8
NVIDIA GeForce RTX 4090 Laptop GPU, Intel Core i9-13980HX
21391 Points +5%
Average NVIDIA GeForce RTX 4090 Laptop GPU
  (16950 - 23292, n=43)
20950 Points +3%
Medion Erazer Beast X40 2024
NVIDIA GeForce RTX 4090 Laptop GPU, Intel Core i9-14900HX
20806 Points +2%
Lenovo Legion 9 16IRX9, RTX 4090
NVIDIA GeForce RTX 4090 Laptop GPU, Intel Core i9-14900HX
20416 Points
Asus ROG Strix Scar 18 G834JYR (2024)
NVIDIA GeForce RTX 4090 Laptop GPU, Intel Core i9-14900HX
20070 Points -2%
Razer Blade 16 2024, RTX 4090
NVIDIA GeForce RTX 4090 Laptop GPU, Intel Core i9-14900HX
19878 Points -3%
Average of class Gaming
  (224 - 22717, n=189, last 2 years)
13118 Points -36%
3DMark 11 Performance
46826 pkt.
3DMark Cloud Gate Standard Score
67697 pkt.
3DMark Fire Strike Score
34686 pkt.
3DMark Time Spy Score
20099 pkt.
Pomoc
Blender
v3.3 Classroom OPTIX/RTX
Average of class Gaming
  (9 - 95, n=179, last 2 years)
20.9 Seconds * -61%
Lenovo Legion 9 16IRX9, RTX 4090
NVIDIA GeForce RTX 4090 Laptop GPU, Intel Core i9-14900HX
13 Seconds *
Average NVIDIA GeForce RTX 4090 Laptop GPU
  (9 - 19, n=39)
12.1 Seconds * +7%
Asus ROG Strix Scar 18 G834JYR (2024)
NVIDIA GeForce RTX 4090 Laptop GPU, Intel Core i9-14900HX
12 Seconds * +8%
Razer Blade 16 2024, RTX 4090
NVIDIA GeForce RTX 4090 Laptop GPU, Intel Core i9-14900HX
12 Seconds * +8%
Alienware m18 R2
NVIDIA GeForce RTX 4090 Laptop GPU, Intel Core i9-14900HX
12 Seconds * +8%
Medion Erazer Beast X40 2024
NVIDIA GeForce RTX 4090 Laptop GPU, Intel Core i9-14900HX
11 Seconds * +15%
Lenovo Legion 9 16IRX8
NVIDIA GeForce RTX 4090 Laptop GPU, Intel Core i9-13980HX
10 Seconds * +23%
v3.3 Classroom CUDA
Average of class Gaming
  (16 - 175, n=185, last 2 years)
36.9 Seconds * -105%
Average NVIDIA GeForce RTX 4090 Laptop GPU
  (16 - 24, n=39)
18.3 Seconds * -2%
Razer Blade 16 2024, RTX 4090
NVIDIA GeForce RTX 4090 Laptop GPU, Intel Core i9-14900HX
18 Seconds * -0%
Alienware m18 R2
NVIDIA GeForce RTX 4090 Laptop GPU, Intel Core i9-14900HX
18 Seconds * -0%
Lenovo Legion 9 16IRX9, RTX 4090
NVIDIA GeForce RTX 4090 Laptop GPU, Intel Core i9-14900HX
18 Seconds *
Asus ROG Strix Scar 18 G834JYR (2024)
NVIDIA GeForce RTX 4090 Laptop GPU, Intel Core i9-14900HX
17 Seconds * +6%
Medion Erazer Beast X40 2024
NVIDIA GeForce RTX 4090 Laptop GPU, Intel Core i9-14900HX
17 Seconds * +6%
Lenovo Legion 9 16IRX8
NVIDIA GeForce RTX 4090 Laptop GPU, Intel Core i9-13980HX
16 Seconds * +11%
v3.3 Classroom CPU
Average of class Gaming
  (138 - 962, n=188, last 2 years)
294 Seconds * -52%
Medion Erazer Beast X40 2024
NVIDIA GeForce RTX 4090 Laptop GPU, Intel Core i9-14900HX
253 Seconds * -31%
Asus ROG Strix Scar 18 G834JYR (2024)
NVIDIA GeForce RTX 4090 Laptop GPU, Intel Core i9-14900HX
209 Seconds * -8%
Razer Blade 16 2024, RTX 4090
NVIDIA GeForce RTX 4090 Laptop GPU, Intel Core i9-14900HX
202 Seconds * -5%
Average NVIDIA GeForce RTX 4090 Laptop GPU
  (144 - 305, n=39)
199.1 Seconds * -3%
Lenovo Legion 9 16IRX8
NVIDIA GeForce RTX 4090 Laptop GPU, Intel Core i9-13980HX
194 Seconds * -1%
Lenovo Legion 9 16IRX9, RTX 4090
NVIDIA GeForce RTX 4090 Laptop GPU, Intel Core i9-14900HX
193 Seconds *
Alienware m18 R2
NVIDIA GeForce RTX 4090 Laptop GPU, Intel Core i9-14900HX
180 Seconds * +7%

* ... im mniej tym lepiej

Performance Rating - Percent
Lenovo Legion 9 16IRX8
Intel Core i9-13980HX, NVIDIA GeForce RTX 4090 Laptop GPU
98.3 pt
Medion Erazer Beast X40 2024
Intel Core i9-14900HX, NVIDIA GeForce RTX 4090 Laptop GPU
96.3 pt
Alienware m18 R2
Intel Core i9-14900HX, NVIDIA GeForce RTX 4090 Laptop GPU
95 pt
Razer Blade 16 2024, RTX 4090
Intel Core i9-14900HX, NVIDIA GeForce RTX 4090 Laptop GPU
91.5 pt
Lenovo Legion 9 16IRX9, RTX 4090
Intel Core i9-14900HX, NVIDIA GeForce RTX 4090 Laptop GPU
90 pt
Asus ROG Strix Scar 18 G834JYR (2024)
Intel Core i9-14900HX, NVIDIA GeForce RTX 4090 Laptop GPU
88.3 pt
Average of class Gaming
 
68.4 pt
The Witcher 3 - 1920x1080 Ultra Graphics & Postprocessing (HBAO+)
Lenovo Legion 9 16IRX8
Intel Core i9-13980HX, NVIDIA GeForce RTX 4090 Laptop GPU
208.7 (191min) fps +3%
Alienware m18 R2
Intel Core i9-14900HX, NVIDIA GeForce RTX 4090 Laptop GPU
205.7 (193min) fps +1%
Medion Erazer Beast X40 2024
Intel Core i9-14900HX, NVIDIA GeForce RTX 4090 Laptop GPU
204 fps 0%
Lenovo Legion 9 16IRX9, RTX 4090
Intel Core i9-14900HX, NVIDIA GeForce RTX 4090 Laptop GPU
203.4 fps
Razer Blade 16 2024, RTX 4090
Intel Core i9-14900HX, NVIDIA GeForce RTX 4090 Laptop GPU
200 fps -2%
Asus ROG Strix Scar 18 G834JYR (2024)
Intel Core i9-14900HX, NVIDIA GeForce RTX 4090 Laptop GPU
189.4 (165min) fps -7%
Average of class Gaming
  (18.4 - 216, n=163, last 2 years)
128.3 fps -37%
GTA V - 1920x1080 Highest Settings possible AA:4xMSAA + FX AF:16x
Lenovo Legion 9 16IRX8
Intel Core i9-13980HX, NVIDIA GeForce RTX 4090 Laptop GPU
150.7 (3min, 111.1P1) fps +11%
Medion Erazer Beast X40 2024
Intel Core i9-14900HX, NVIDIA GeForce RTX 4090 Laptop GPU
141.5 (3.53min, 100P1) fps +4%
Razer Blade 16 2024, RTX 4090
Intel Core i9-14900HX, NVIDIA GeForce RTX 4090 Laptop GPU
138.1 (4.19min, 83.3P1) fps +1%
Alienware m18 R2
Intel Core i9-14900HX, NVIDIA GeForce RTX 4090 Laptop GPU
137 (7.81min, 83.3P1) fps +1%
Lenovo Legion 9 16IRX9, RTX 4090
Intel Core i9-14900HX, NVIDIA GeForce RTX 4090 Laptop GPU
136.2 (0.938min, 111.1P1) fps
Asus ROG Strix Scar 18 G834JYR (2024)
Intel Core i9-14900HX, NVIDIA GeForce RTX 4090 Laptop GPU
136 (8.67min, 100P1) fps 0%
Average of class Gaming
  (12.1 - 167.7, n=170, last 2 years)
113.7 fps -17%
Final Fantasy XV Benchmark - 1920x1080 High Quality
Alienware m18 R2
Intel Core i9-14900HX, NVIDIA GeForce RTX 4090 Laptop GPU
193.2 fps +17%
Lenovo Legion 9 16IRX8
Intel Core i9-13980HX, NVIDIA GeForce RTX 4090 Laptop GPU
181.3 fps +10%
Medion Erazer Beast X40 2024
Intel Core i9-14900HX, NVIDIA GeForce RTX 4090 Laptop GPU
181.1 fps +10%
Asus ROG Strix Scar 18 G834JYR (2024)
Intel Core i9-14900HX, NVIDIA GeForce RTX 4090 Laptop GPU
166.1 fps +1%
Lenovo Legion 9 16IRX9, RTX 4090
Intel Core i9-14900HX, NVIDIA GeForce RTX 4090 Laptop GPU
165.1 fps
Razer Blade 16 2024, RTX 4090
Intel Core i9-14900HX, NVIDIA GeForce RTX 4090 Laptop GPU
137.5 fps -17%
Average of class Gaming
  (19.2 - 201, n=182, last 2 years)
119.9 fps -27%
Strange Brigade - 1920x1080 ultra AA:ultra AF:16
Lenovo Legion 9 16IRX8
Intel Core i9-13980HX, NVIDIA GeForce RTX 4090 Laptop GPU
387 (23.7min, 277P1) fps +5%
Medion Erazer Beast X40 2024
Intel Core i9-14900HX, NVIDIA GeForce RTX 4090 Laptop GPU
371 (5min, 273P1) fps +1%
Alienware m18 R2
Intel Core i9-14900HX, NVIDIA GeForce RTX 4090 Laptop GPU
369 (31.4min, 266P1) fps 0%
Lenovo Legion 9 16IRX9, RTX 4090
Intel Core i9-14900HX, NVIDIA GeForce RTX 4090 Laptop GPU
369 (5min, 269P1) fps
Razer Blade 16 2024, RTX 4090
Intel Core i9-14900HX, NVIDIA GeForce RTX 4090 Laptop GPU
359.8 (30.2min, 253P1) fps -2%
Asus ROG Strix Scar 18 G834JYR (2024)
Intel Core i9-14900HX, NVIDIA GeForce RTX 4090 Laptop GPU
331 (34.1min, 238P1) fps -10%
Average of class Gaming
  (38.9 - 421, n=179, last 2 years)
229 fps -38%
Dota 2 Reborn - 1920x1080 ultra (3/3) best looking
Lenovo Legion 9 16IRX8
Intel Core i9-13980HX, NVIDIA GeForce RTX 4090 Laptop GPU
193.1 (162.4min) fps +17%
Medion Erazer Beast X40 2024
Intel Core i9-14900HX, NVIDIA GeForce RTX 4090 Laptop GPU
189.9 (162.8min) fps +15%
Razer Blade 16 2024, RTX 4090
Intel Core i9-14900HX, NVIDIA GeForce RTX 4090 Laptop GPU
188.1 (155.2min) fps +14%
Alienware m18 R2
Intel Core i9-14900HX, NVIDIA GeForce RTX 4090 Laptop GPU
171.8 (143.6min) fps +4%
Lenovo Legion 9 16IRX9, RTX 4090
Intel Core i9-14900HX, NVIDIA GeForce RTX 4090 Laptop GPU
164.5 (136min) fps
Asus ROG Strix Scar 18 G834JYR (2024)
Intel Core i9-14900HX, NVIDIA GeForce RTX 4090 Laptop GPU
161.3 (135.6min) fps -2%
Average of class Gaming
  (65.1 - 220, n=187, last 2 years)
151.2 fps -8%
X-Plane 11.11 - 1920x1080 high (fps_test=3)
Razer Blade 16 2024, RTX 4090
Intel Core i9-14900HX, NVIDIA GeForce RTX 4090 Laptop GPU
146.2 fps +16%
Medion Erazer Beast X40 2024
Intel Core i9-14900HX, NVIDIA GeForce RTX 4090 Laptop GPU
143.9 fps +15%
Alienware m18 R2
Intel Core i9-14900HX, NVIDIA GeForce RTX 4090 Laptop GPU
140.6 fps +12%
Lenovo Legion 9 16IRX8
Intel Core i9-13980HX, NVIDIA GeForce RTX 4090 Laptop GPU
140.1 fps +12%
Asus ROG Strix Scar 18 G834JYR (2024)
Intel Core i9-14900HX, NVIDIA GeForce RTX 4090 Laptop GPU
136.8 fps +9%
Lenovo Legion 9 16IRX9, RTX 4090
Intel Core i9-14900HX, NVIDIA GeForce RTX 4090 Laptop GPU
125.6 fps
Average of class Gaming
  (32.8 - 166.2, n=194, last 2 years)
108.4 fps -14%
Far Cry 5
1920x1080 Ultra Preset AA:T
Alienware m18 R2
Intel Core i9-14900HX, NVIDIA GeForce RTX 4090 Laptop GPU
160 (124min) fps +3%
Lenovo Legion 9 16IRX8
Intel Core i9-13980HX, NVIDIA GeForce RTX 4090 Laptop GPU
158 (102min) fps +2%
Lenovo Legion 9 16IRX9, RTX 4090
Intel Core i9-14900HX, NVIDIA GeForce RTX 4090 Laptop GPU
155 fps
Average NVIDIA GeForce RTX 4090 Laptop GPU
  (117 - 218, n=21)
153.5 fps -1%
Asus ROG Strix Scar 18 G834JYR (2024)
Intel Core i9-14900HX, NVIDIA GeForce RTX 4090 Laptop GPU
145 (103min) fps -6%
Average of class Gaming
  (34 - 218, n=101, last 2 years)
131 fps -15%
Razer Blade 16 2024, RTX 4090
Intel Core i9-14900HX, NVIDIA GeForce RTX 4090 Laptop GPU
127 fps -18%
2560x1440 Ultra Preset AA:T
Lenovo Legion 9 16IRX8
Intel Core i9-13980HX, NVIDIA GeForce RTX 4090 Laptop GPU
157 (111min) fps +8%
Alienware m18 R2
Intel Core i9-14900HX, NVIDIA GeForce RTX 4090 Laptop GPU
154 (113min) fps +5%
Average NVIDIA GeForce RTX 4090 Laptop GPU
  (115 - 194, n=23)
148.8 fps +2%
Lenovo Legion 9 16IRX9, RTX 4090
Intel Core i9-14900HX, NVIDIA GeForce RTX 4090 Laptop GPU
146 fps
Asus ROG Strix Scar 18 G834JYR (2024)
Intel Core i9-14900HX, NVIDIA GeForce RTX 4090 Laptop GPU
145 (108min) fps -1%
Razer Blade 16 2024, RTX 4090
Intel Core i9-14900HX, NVIDIA GeForce RTX 4090 Laptop GPU
125 fps -14%
Average of class Gaming
  (71 - 194, n=80, last 2 years)
119.6 fps -18%
3840x2160 Ultra Preset AA:T
Alienware m18 R2
Intel Core i9-14900HX, NVIDIA GeForce RTX 4090 Laptop GPU
112 (100min) fps +8%
Lenovo Legion 9 16IRX9, RTX 4090
Intel Core i9-14900HX, NVIDIA GeForce RTX 4090 Laptop GPU
104 fps
Razer Blade 16 2024, RTX 4090
Intel Core i9-14900HX, NVIDIA GeForce RTX 4090 Laptop GPU
103 fps -1%
Average NVIDIA GeForce RTX 4090 Laptop GPU
  (75 - 113, n=13)
102.7 fps -1%
Average of class Gaming
  (39 - 113, n=28, last 2 years)
85.1 fps -18%

Witcher 3 FPS diagram

0153045607590105120135150165180195210Tooltip
Lenovo Legion 9 16IRX9, RTX 4090 i9-14900HX, NVIDIA GeForce RTX 4090 Laptop GPU: Ø195.6 (67-209)
Lenovo Legion 9 16IRX8 i9-13980HX, NVIDIA GeForce RTX 4090 Laptop GPU: Ø198.7 (181-213)
Razer Blade 16 2024, RTX 4090 i9-14900HX, NVIDIA GeForce RTX 4090 Laptop GPU: Ø192.6 (177-211)
Alienware m18 R2 i9-14900HX, NVIDIA GeForce RTX 4090 Laptop GPU: Ø196.9 (185-209)
lowmed.highultraQHD4K DLSS4K FSR4K
GTA V (2015) 186.9 185.2 183.3 136.2 138.9 95
The Witcher 3 (2015) 540 494 370 203.4 165 104.5
Dota 2 Reborn (2015) 201 181.8 174.4 164.5 160.8
Final Fantasy XV Benchmark (2018) 228 194.9 165.1 142
X-Plane 11.11 (2018) 193.5 166.3 125.6 109.6
Far Cry 5 (2018) 201 173 166 155 146 104
Strange Brigade (2018) 499 403 387 369 290
F1 23 (2023) 151.5 149.2 144.6
Cyberpunk 2077 2.1 Phantom Liberty (2023) 127 86
Skull & Bones (2024) 164 140 149 118 98 90 81 61
F1 24 (2024) 339 304 113.6 72.1

Emisje i moc - Głośno i ciepło

Emisja hałasu

Podczas bezczynności na komputerze stacjonarnym wentylatory laptopa są przeważnie ciche. Od czasu do czasu mogą na chwilę przyspieszyć, ale potem znów się uspokajają. Jednak gdy tylko umieścimy urządzenie nawet pod codziennym obciążeniem, takim jak surfowanie po Internecie, wentylatory szybko zaczynają działać, nawet w trybie cichym.

Podczas 3DMark06 wentylatory najpierw nieustannie przyspieszały do nieco ponad 40 dB, a następnie uspokoiły się ponownie do 35 dB, po czym ustabilizowały się na poziomie około 39 dB w ostatniej jednej trzeciej. Może to również oznaczać, że system zbyt późno dostosowuje swoje chłodzenie i wydajność do warunków termicznych i dopiero po pewnym czasie osiąga optymalne wartości.

Podczas grania i w trybie wydajności wentylatory pracują z maksymalną głośnością około 55 dB, co jest dość głośne w porównaniu; na przykład Blade 16 pozostaje cichszy. W trybie zrównoważonym (bez AI) emisja hałasu laptopa spada do bardziej umiarkowanych 47 dB, ale jego wydajność w grach spada zauważalnie, a mianowicie o 20 do 25 procent.

Hałas

luz
23 / 23 / 23 dB
obciążenie
39 / 55.56 dB
  red to green bar
 
 
30 dB
cichy
40 dB(A)
słyszalny
50 dB(A)
irytujący
 
min: dark, med: mid, max: light   Earthworks M23R, Arta (odległość 15 cm)   environment noise: 23 dB(A)
dB(A) 0102030405060708090Deep BassMiddle BassHigh BassLower RangeMidsHigher MidsLower HighsMid HighsUpper HighsSuper Highs2029.224.829.22526.223.426.23129.228.229.24026.216.526.25027.122.127.16327.923.827.9802612.32610026.819.726.812525.814.925.816027.11127.120027.516.527.525031.814.731.831534.812.434.840037.110.937.150038.79.238.7630397.83980038.28.738.2100040.38.640.3125042942160044.79.844.7200045.510.145.5250046.91146.9315046.711.246.7400045.511.745.5500043.411.843.4630041.31241.3800037.712.137.71000035.512.135.51250033.312.533.31600030.911.130.9SPL55.62355.6N9.80.49.8median 38.2median 11.2median 38.2Delta6.11.96.1hearing rangehide median Fan NoiseLenovo Legion 9 16IRX9, RTX 4090
Lenovo Legion 9 16IRX9, RTX 4090
NVIDIA GeForce RTX 4090 Laptop GPU, i9-14900HX, Micron 3400 2TB MTFDKBA2T0TFH
Lenovo Legion 9 16IRX8
NVIDIA GeForce RTX 4090 Laptop GPU, i9-13980HX, 2x SK Hynix HFS001TEJ9X115N (RAID 0)
Razer Blade 16 2024, RTX 4090
NVIDIA GeForce RTX 4090 Laptop GPU, i9-14900HX, Samsung PM9A1 MZVL22T0HBLB
Alienware m18 R2
NVIDIA GeForce RTX 4090 Laptop GPU, i9-14900HX, SK Hynix PC811 HFS002TEM9X152N
Asus ROG Strix Scar 18 G834JYR (2024)
NVIDIA GeForce RTX 4090 Laptop GPU, i9-14900HX, Samsung PM9A1a MZVL22T0HDLB
Medion Erazer Beast X40 2024
NVIDIA GeForce RTX 4090 Laptop GPU, i9-14900HX, Phison E18-1TB-PHISON-SSD-BICS5
Noise
-2%
-1%
-5%
-13%
-15%
off / environment *
23
23.7
-3%
23
-0%
23.6
-3%
24
-4%
25
-9%
Idle Minimum *
23
24
-4%
23
-0%
23.8
-3%
27
-17%
28
-22%
Idle Average *
23
24
-4%
23
-0%
26.1
-13%
28
-22%
29
-26%
Idle Maximum *
23
30.4
-32%
27.66
-20%
31.5
-37%
32
-39%
32
-39%
Load Average *
39
30.4
22%
43.76
-12%
31.5
19%
50
-28%
48
-23%
Witcher 3 ultra *
55.32
52.2
6%
46.81
15%
52.1
6%
50
10%
50
10%
Load Maximum *
55.56
54.9
1%
50.37
9%
56.6
-2%
52
6%
52
6%

* ... im mniej tym lepiej

Temperatura

Pomimo dość głośnego systemu chłodzenia, temperatury laptopa są dość wysokie w porównaniu. Gorące punkty podczas grania i przy innych dużych obciążeniach znajdują się na środku i w kierunku ekranu. Może również zrobić się dość ciepło wokół klawiszy WASD - zmierzyliśmy 46 °C. Przynajmniej podpórki pod nadgarstki są w porządku. Nawet jego poprzednik nie był idealny w tym aspekcie, ale Lenovo najwyraźniej nie wprowadziło żadnych ulepszeń.

 56 °C56 °C48 °C 
 46 °C50 °C44 °C 
 36 °C36 °C34 °C 
maks. w ogóle: 56 °C
średnia: 45.1 °C
50 °C53 °C51 °C
50 °C53 °C48 °C
35 °C40 °C39 °C
maks. w ogóle: 53 °C
średnia: 46.6 °C
zasilacz  50 °C | temperatura otoczenia 22 °C | Fluke t3000FC (calibrated), Fluke 62 Mini
(-) The average temperature for the upper side under maximal load is 45.1 °C / 113 F, compared to the average of 33.9 °C / 93 F for the devices in the class Gaming.
(-) The maximum temperature on the upper side is 56 °C / 133 F, compared to the average of 40.5 °C / 105 F, ranging from 21.2 to 68.8 °C for the class Gaming.
(-) The bottom heats up to a maximum of 53 °C / 127 F, compared to the average of 43.2 °C / 110 F
(±) In idle usage, the average temperature for the upper side is 33.6 °C / 92 F, compared to the device average of 33.9 °C / 93 F.
(-) Playing The Witcher 3, the average temperature for the upper side is 42.3 °C / 108 F, compared to the device average of 33.9 °C / 93 F.
(±) The palmrests and touchpad can get very hot to the touch with a maximum of 36 °C / 96.8 F.
(-) The average temperature of the palmrest area of similar devices was 28.9 °C / 84 F (-7.1 °C / -12.8 F).
Witcher 3 top
Witcher 3 top
Witcher 3 zasilanie
Witcher 3 zasilanie
Witcher 3 dno
Witcher 3 dno
Top stresu
Top stresu
Zasilanie naprężeniowe
Dno stresu
Dno stresu
Lenovo Legion 9 16IRX9, RTX 4090
Intel Core i9-14900HX, NVIDIA GeForce RTX 4090 Laptop GPU
Lenovo Legion 9 16IRX8
Intel Core i9-13980HX, NVIDIA GeForce RTX 4090 Laptop GPU
Razer Blade 16 2024, RTX 4090
Intel Core i9-14900HX, NVIDIA GeForce RTX 4090 Laptop GPU
Alienware m18 R2
Intel Core i9-14900HX, NVIDIA GeForce RTX 4090 Laptop GPU
Asus ROG Strix Scar 18 G834JYR (2024)
Intel Core i9-14900HX, NVIDIA GeForce RTX 4090 Laptop GPU
Medion Erazer Beast X40 2024
Intel Core i9-14900HX, NVIDIA GeForce RTX 4090 Laptop GPU
Heat
11%
21%
9%
17%
13%
Maximum Upper Side *
56
49.6
11%
45
20%
41.2
26%
49
12%
47
16%
Maximum Bottom *
53
48.6
8%
45
15%
34.6
35%
47
11%
54
-2%
Idle Upper Side *
38
33.2
13%
29
24%
42.8
-13%
29
24%
30
21%
Idle Bottom *
39
34.2
12%
30
23%
43.6
-12%
31
21%
32
18%

* ... im mniej tym lepiej

Głośniki

Zakres słyszalny jest bardzo liniowy, wysokie i średnie tony są dobrze zbalansowane. Bas jest jednak naturalnie zredukowany, ale nadal wyczuwalny. Głośniki mogłyby być również nieco mocniejsze, tj. głośniejsze.

dB(A) 0102030405060708090Deep BassMiddle BassHigh BassLower RangeMidsHigher MidsLower HighsMid HighsUpper HighsSuper Highs2032.124.832.12528.423.428.43129.728.229.74025.716.525.75029.222.129.26332.123.832.18035.412.335.410041.319.741.312544.314.944.316050.61150.620054.616.554.625055.414.755.43156412.46440066.110.966.150065.89.265.8630667.86680070.78.770.7100068.88.668.8125067.8967.8160067.59.867.5200071.210.171.2250066.31166.3315066.811.266.8400061.111.761.1500061.511.861.5630063.21263.2800064.212.164.21000064.812.164.81250064.812.564.81600065.711.165.7SPL792379N45.80.445.8median 64.8median 11.2median 64.8Delta4.81.94.83032.83030.931.430.935.742.935.723.728.123.726.219.726.231.216.431.245.113.845.145.919.845.951.414.551.45913.95964.117.864.168.614.368.667.19.667.167.68.567.672.97.572.977.47.477.4717.77164.88.164.865.88.265.867.58.867.568.89.868.868.710.568.77010.67066.410.966.467.311.267.36411.56464.711.664.767126763.211.863.25510.75581.222.581.254.70.454.7median 67median 10.7median 673.62.53.6hearing rangehide median Pink NoiseLenovo Legion 9 16IRX9, RTX 4090Razer Blade 16 2024, RTX 4090
Frequency diagram (checkboxes can be checked and unchecked to compare devices)
Lenovo Legion 9 16IRX9, RTX 4090 audio analysis

(±) | speaker loudness is average but good (78.96 dB)
Bass 100 - 315 Hz
(±) | reduced bass - on average 13.2% lower than median
(±) | linearity of bass is average (8.9% delta to prev. frequency)
Mids 400 - 2000 Hz
(+) | balanced mids - only 3.2% away from median
(+) | mids are linear (3.4% delta to prev. frequency)
Highs 2 - 16 kHz
(+) | balanced highs - only 1.8% away from median
(+) | highs are linear (4% delta to prev. frequency)
Overall 100 - 16.000 Hz
(+) | overall sound is linear (11.3% difference to median)
Compared to same class
» 8% of all tested devices in this class were better, 3% similar, 89% worse
» The best had a delta of 6%, average was 18%, worst was 132%
Compared to all devices tested
» 6% of all tested devices were better, 2% similar, 92% worse
» The best had a delta of 4%, average was 25%, worst was 134%

Razer Blade 16 2024, RTX 4090 audio analysis

(±) | speaker loudness is average but good (81.16 dB)
Bass 100 - 315 Hz
(±) | reduced bass - on average 8.2% lower than median
(±) | linearity of bass is average (7.4% delta to prev. frequency)
Mids 400 - 2000 Hz
(+) | balanced mids - only 3.3% away from median
(+) | mids are linear (5.9% delta to prev. frequency)
Highs 2 - 16 kHz
(+) | balanced highs - only 1.6% away from median
(+) | highs are linear (3.1% delta to prev. frequency)
Overall 100 - 16.000 Hz
(+) | overall sound is linear (9.2% difference to median)
Compared to same class
» 3% of all tested devices in this class were better, 1% similar, 96% worse
» The best had a delta of 6%, average was 18%, worst was 132%
Compared to all devices tested
» 3% of all tested devices were better, 1% similar, 97% worse
» The best had a delta of 4%, average was 25%, worst was 134%

Zużycie energii

Jego zużycie paliwa może być nieco lepsze w porównaniu do poprzedniego modelu, zarówno na biegu jałowym, jak i poza nim. Jednak niewiele - nawet 18-calowa konkurencja jest często bardziej oszczędna, przynajmniej na biegu jałowym.

Domniemany problem nowego Legion 9 można ponownie zaobserwować na wykresach zużycia energii, ponieważ jego zużycie (a zatem także wydajność) spadało bardzo krótko od czasu do czasu w różnych testach. To, co było normalne w Cinebench 23, nie było już takie w testach Cinebench 23 i Furmark Witcher 3 czy Furmark.

Zmierzyliśmy krótkoterminowe maksymalne zużycie energii na poziomie 323 watów przy użyciu płaskiego i stosunkowo małego zasilacza. Jednostka ta została zaprojektowana na 330 watów, więc nie powinna mieć problemów z zasilaniem laptopa w każdej sytuacji.

Unikalna cecha: Legion 9 jest również wyposażony w drugi zasilacz, znacznie mniejszy 140-watowy zasilacz USB-C. Jeśli nie grają Państwo w gry, mniejszy zasilacz oczywiście jeszcze lepiej nadaje się do użytku w podróży.

330-watowy zasilacz
330-watowy zasilacz
Mniejszy, 140-watowy zasilacz USB-C
Pobór mocy
wyłączony / stan wstrzymaniadarklight 0.21 / 0.23 W
luzdarkmidlight 20.5 / 27.7 / 32.1 W
obciążenie midlight 105 / 323 W
 color bar
Legenda: min: dark, med: mid, max: light        Metrahit Energy
Lenovo Legion 9 16IRX9, RTX 4090
i9-14900HX, NVIDIA GeForce RTX 4090 Laptop GPU, Micron 3400 2TB MTFDKBA2T0TFH, MiniLED, 3200x2000, 16"
Lenovo Legion 9 16IRX8
i9-13980HX, NVIDIA GeForce RTX 4090 Laptop GPU, 2x SK Hynix HFS001TEJ9X115N (RAID 0), Mini-LED, 3200x2000, 16"
Razer Blade 16 2024, RTX 4090
i9-14900HX, NVIDIA GeForce RTX 4090 Laptop GPU, Samsung PM9A1 MZVL22T0HBLB, OLED, 2560x1600, 16"
Asus ROG Strix Scar 18 G834JYR (2024)
i9-14900HX, NVIDIA GeForce RTX 4090 Laptop GPU, Samsung PM9A1a MZVL22T0HDLB, Mini LED, 2560x1600, 18"
Medion Erazer Beast X40 2024
i9-14900HX, NVIDIA GeForce RTX 4090 Laptop GPU, Phison E18-1TB-PHISON-SSD-BICS5, IPS, 2560x1600, 17"
Average NVIDIA GeForce RTX 4090 Laptop GPU
 
Average of class Gaming
 
Power Consumption
-34%
12%
11%
13%
1%
21%
Idle Minimum *
20.5
32.3
-58%
16.9
18%
14
32%
7
66%
16.2 ?(6 - 32.3, n=29)
21%
Idle Average *
27.7
42.6
-54%
17.8
36%
17
39%
15
46%
Idle Maximum *
32.1
57.9
-80%
19.6
39%
24
25%
33
-3%
Load Average *
105
121
-15%
128
-22%
143
-36%
134
-28%
130.5 ?(79 - 201, n=29)
-24%
Witcher 3 ultra *
246
254
-3%
243
1%
251
-2%
280
-14%
Load Maximum *
323
297.7
8%
328
-2%
302
7%
294
9%

* ... im mniej tym lepiej

Power consumption Witcher 3 / stress test

020406080100120140160180200220240260280300320Tooltip
Lenovo Legion 9 16IRX9, RTX 4090; Witcher 3 ultra: Ø246 (96.7-323.15)
Lenovo Legion 9 16IRX9, RTX 4090; 1280x720 Prime95 28.10 and Furmark 1.25: Ø233 (140.46-311.94)
Lenovo Legion 9 16IRX9, RTX 4090; Idle 150cd/m2: Ø25.2 (19.368-36.719)

Power consumption with external monitor

0153045607590105120135150165180195210225240Tooltip
Lenovo Legion 9 16IRX9, RTX 4090; Prime95 V2810 Stress (external Monitor): Ø219 (192.21-241.01)
Lenovo Legion 9 16IRX9, RTX 4090; Cinebench R15 Multi (external Monitor): Ø238 (236.92-239.74)
Lenovo Legion 9 16IRX9, RTX 4090; Cinebench R23 Multi (external Monitor): Ø214 (74.98-247.35)
Lenovo Legion 9 16IRX9, RTX 4090; 1280x720 FurMark 1.19 GPU Stress Test (external Monitor): Ø222 (86.99-228.52)
Lenovo Legion 9 16IRX9, RTX 4090; 1920x1080 The Witcher 3 ultra (external Monitor): Ø231 (88.59-243.99)
Lenovo Legion 9 16IRX9, RTX 4090; Idle 1min (external Monitor): Ø29.4 (21.519-38.919)

Czas trwania

Wbudowana bateria ma pojemność około 100 Wh, co jest wartością zbliżoną do konkurencji. Niemniej jednak, jego czasy pracy są często krótsze - problem, z którym boryka się już jego poprzednik i inne laptopy z ekranami MiniLED. Choć jego czas pracy został poprawiony, urządzenia porównawcze (poza laptopem Alienware) uzyskują dłuższe czasy pracy ze swoich baterii. To samo dotyczy na przykład Asusa ROG Scar Strix, który również ma wyświetlacz MiniLED.

Mimo to wystarcza on na niecałe 5 godzin oglądania filmów lub surfowania po sieci z jasnością zredukowaną do 150 nitów. Urządzenie Asusa wytrzymuje tutaj ponad 6 godzin.

Laptop Lenovo obsługuje funkcję szybkiego ładowania, którą należy najpierw aktywować w oprogramowaniu Vantage. Następnie pełne ładowanie zajmuje tylko około godziny.

Wydajność akumulatora
WiFi Websurfing
4h 50min
WiFi Websurfing max. Brightness
3h 17min
Big Buck Bunny H.264 1080p
4h 54min
obciążenie
2h 9min
Lenovo Legion 9 16IRX9, RTX 4090
i9-14900HX, NVIDIA GeForce RTX 4090 Laptop GPU, 99.99 Wh
Lenovo Legion 9 16IRX8
i9-13980HX, NVIDIA GeForce RTX 4090 Laptop GPU, 99.9 Wh
Razer Blade 16 2024, RTX 4090
i9-14900HX, NVIDIA GeForce RTX 4090 Laptop GPU, 95.2 Wh
Alienware m18 R2
i9-14900HX, NVIDIA GeForce RTX 4090 Laptop GPU, 97 Wh
Asus ROG Strix Scar 18 G834JYR (2024)
i9-14900HX, NVIDIA GeForce RTX 4090 Laptop GPU, 90 Wh
Medion Erazer Beast X40 2024
i9-14900HX, NVIDIA GeForce RTX 4090 Laptop GPU, 99.8 Wh
Average of class Gaming
 
Czasy pracy
-50%
10%
0%
24%
29%
11%
H.264
294
456
55%
447
52%
WiFi v1.3
290
159
-45%
329
13%
290
0%
461
59%
374
29%
Load
129
58
-55%
79
-39%
77
-40%
Reader / Idle
404
612

Za

+ fajny design, świetne materiały
+ wygodne klawisze z wymiennymi nasadkami
+ potężna kombinacja sprzętowa
+ 2x Thunderbolt 4
+ Wyświetlacz MiniLED z HDR1000, G-Sync
+ płaski 330-watowy zasilacz + 140-watowy zasilacz USB-C

Przeciw

- Trudny dostęp do pamięci RAM
- mały touchpad
- problemy z opóźnieniami i krótkie spadki wydajności
- Dławienie dysku SSD
- nieoptymalny system chłodzenia, głośny i ciepły
- zbyt wysokie zużycie energii w trybie bezczynności
- słaba żywotność baterii

Werdykt - Więcej problemów niż oczekiwano

Recenzja Lenovo Legion 9i. Urządzenie testowe dostarczone przez Lenovo

Jeśli chodzi o cenę, Lenovo Legion 9i to high-endowy gracz o atrakcyjnym wyglądzie, dobrych materiałach, dobrej jakości wykonania i jasnym wyświetlaczu Mini LED z HDR1000. Płaski zasilacz, którego nie można znaleźć u konkurencji, a także dodatkowy 140-watowy zasilacz USB-C można zaliczyć do kolejnych plusów.

Jednak podczas gdy mniejsze modele Legion imponują dobrą optymalizacją systemu, topowy model cierpi na znacznie więcej słabości i problemów niż oczekiwano. Przede wszystkim są to problemy z opóźnieniami, które stały się widoczne nie tylko podczas testu LatencyMon - zauważyliśmy je również podczas testowania opóźnień pamięci RAM, a nawet podczas grania w gry można zobaczyć kilka widocznych spadków klatek. Do tego dochodzi niezwykle słaba wydajność pojedynczego rdzenia. Kolejnym większym problemem jest nieoptymalny system chłodzenia. Wydaje się, że chłodzi on zbyt późno, a czasami zbyt słabo, co skutkuje na przykład dławieniem dysku SSD. Co więcej, staje się on bardzo głośny pod obciążeniem, a jednocześnie nie zapobiega wysokim temperaturom powierzchni tak dobrze, jak robią to jego konkurenci. Chociaż czas pracy na baterii został poprawiony, nie jest tak dobry jak u konkurencji. Ogólnie rzecz biorąc, jest wiele miejsca na poprawę.

Legion 9i to stylowy high-endowy gracz, ale w przeciwieństwie do mniejszych modeli Legion, drogi model high-endowy cierpi z powodu irytujących problemów, takich jak nieoptymalny system chłodzenia i duże problemy z opóźnieniami.

Alternatywą może być na przykład Razer Blade 16, który zapewnia porównywalną wydajność w mniejszej obudowie i nie ma tylu problemów co Legion 9i. Poza tym, jego poprzednik faktycznie sprawiał wrażenie bardziej dojrzałego systemu, a nawet może pochwalić się wyższą wydajnością w wyniku wielu problemów następcy. W rezultacie, nowy Legion 9i nie jest obecnie wart zakupu.

Aktualizacja z września 2024 r.: Pojawiła się aktualizacja BIOS-u, która naprawia problemy z liczbą klatek na sekundę.

Cena i dostępność

Naszą konfigurację Lenovo Legion 9 16IRX9 lub Lenovo Legion 9i można nabyć bezpośrednio od Lenovo w cenie 3 804,66 USD.

Uwaga: Niedawno zaktualizowaliśmy nasz system oceny i wyniki wersji 8 nie są porównywalne z wynikami wersji 7. Więcej informacji znajdą Państwo tutaj .

Lenovo Legion 9 16IRX9, RTX 4090 - 27/09/2024 v8
Christian Hintze

Wykonanie
86 / 98 → 88%
Klawiatura
87%
Myszka
73%
Komunikacja
71 / 80 → 89%
Waga
60 / 10-68 → 85%
Akumulator
60 / 95 → 63%
Wyświetlacz
92%
Wydajność w grach
91%
Wydajność w programach użytkowych
87%
AI Performance
97%
Temperatura
73 / 95 → 77%
Hałas
73 / 90 → 81%
Głośniki
80%
Kamerka
38 / 75 → 51%
Impression
-2%
Średnio
60%
84%
Gaming - Ważona średnia
CO2 Emissions
No Data
Materials
25%
Packaging
55%
Power Use
60.6%
Repairability
55%
Software Updates
22.3%
Recycle Logo Total Sustainability Score: 36.3%

Transparency

The selection of devices to be reviewed is made by our editorial team. The test sample was provided to the author as a loan by the manufacturer or retailer for the purpose of this review. The lender had no influence on this review, nor did the manufacturer receive a copy of this review before publication. There was no obligation to publish this review. We never accept compensation or payment in return for our reviews. As an independent media company, Notebookcheck is not subjected to the authority of manufacturers, retailers or publishers.

This is how Notebookcheck is testing

Every year, Notebookcheck independently reviews hundreds of laptops and smartphones using standardized procedures to ensure that all results are comparable. We have continuously developed our test methods for around 20 years and set industry standards in the process. In our test labs, high-quality measuring equipment is utilized by experienced technicians and editors. These tests involve a multi-stage validation process. Our complex rating system is based on hundreds of well-founded measurements and benchmarks, which maintains objectivity. Further information on our test methods can be found here.

Price comparison

Please share our article, every link counts!
Mail Logo
> laptopy testy i recenzje notebooki > Laptopy > Recenzja Lenovo Legion 9 16IRX9 (Legion 9i): Jak wysokiej klasy jest RTX 4090 dla graczy?
Christian Hintze, 2024-06-27 (Update: 2024-09-27)