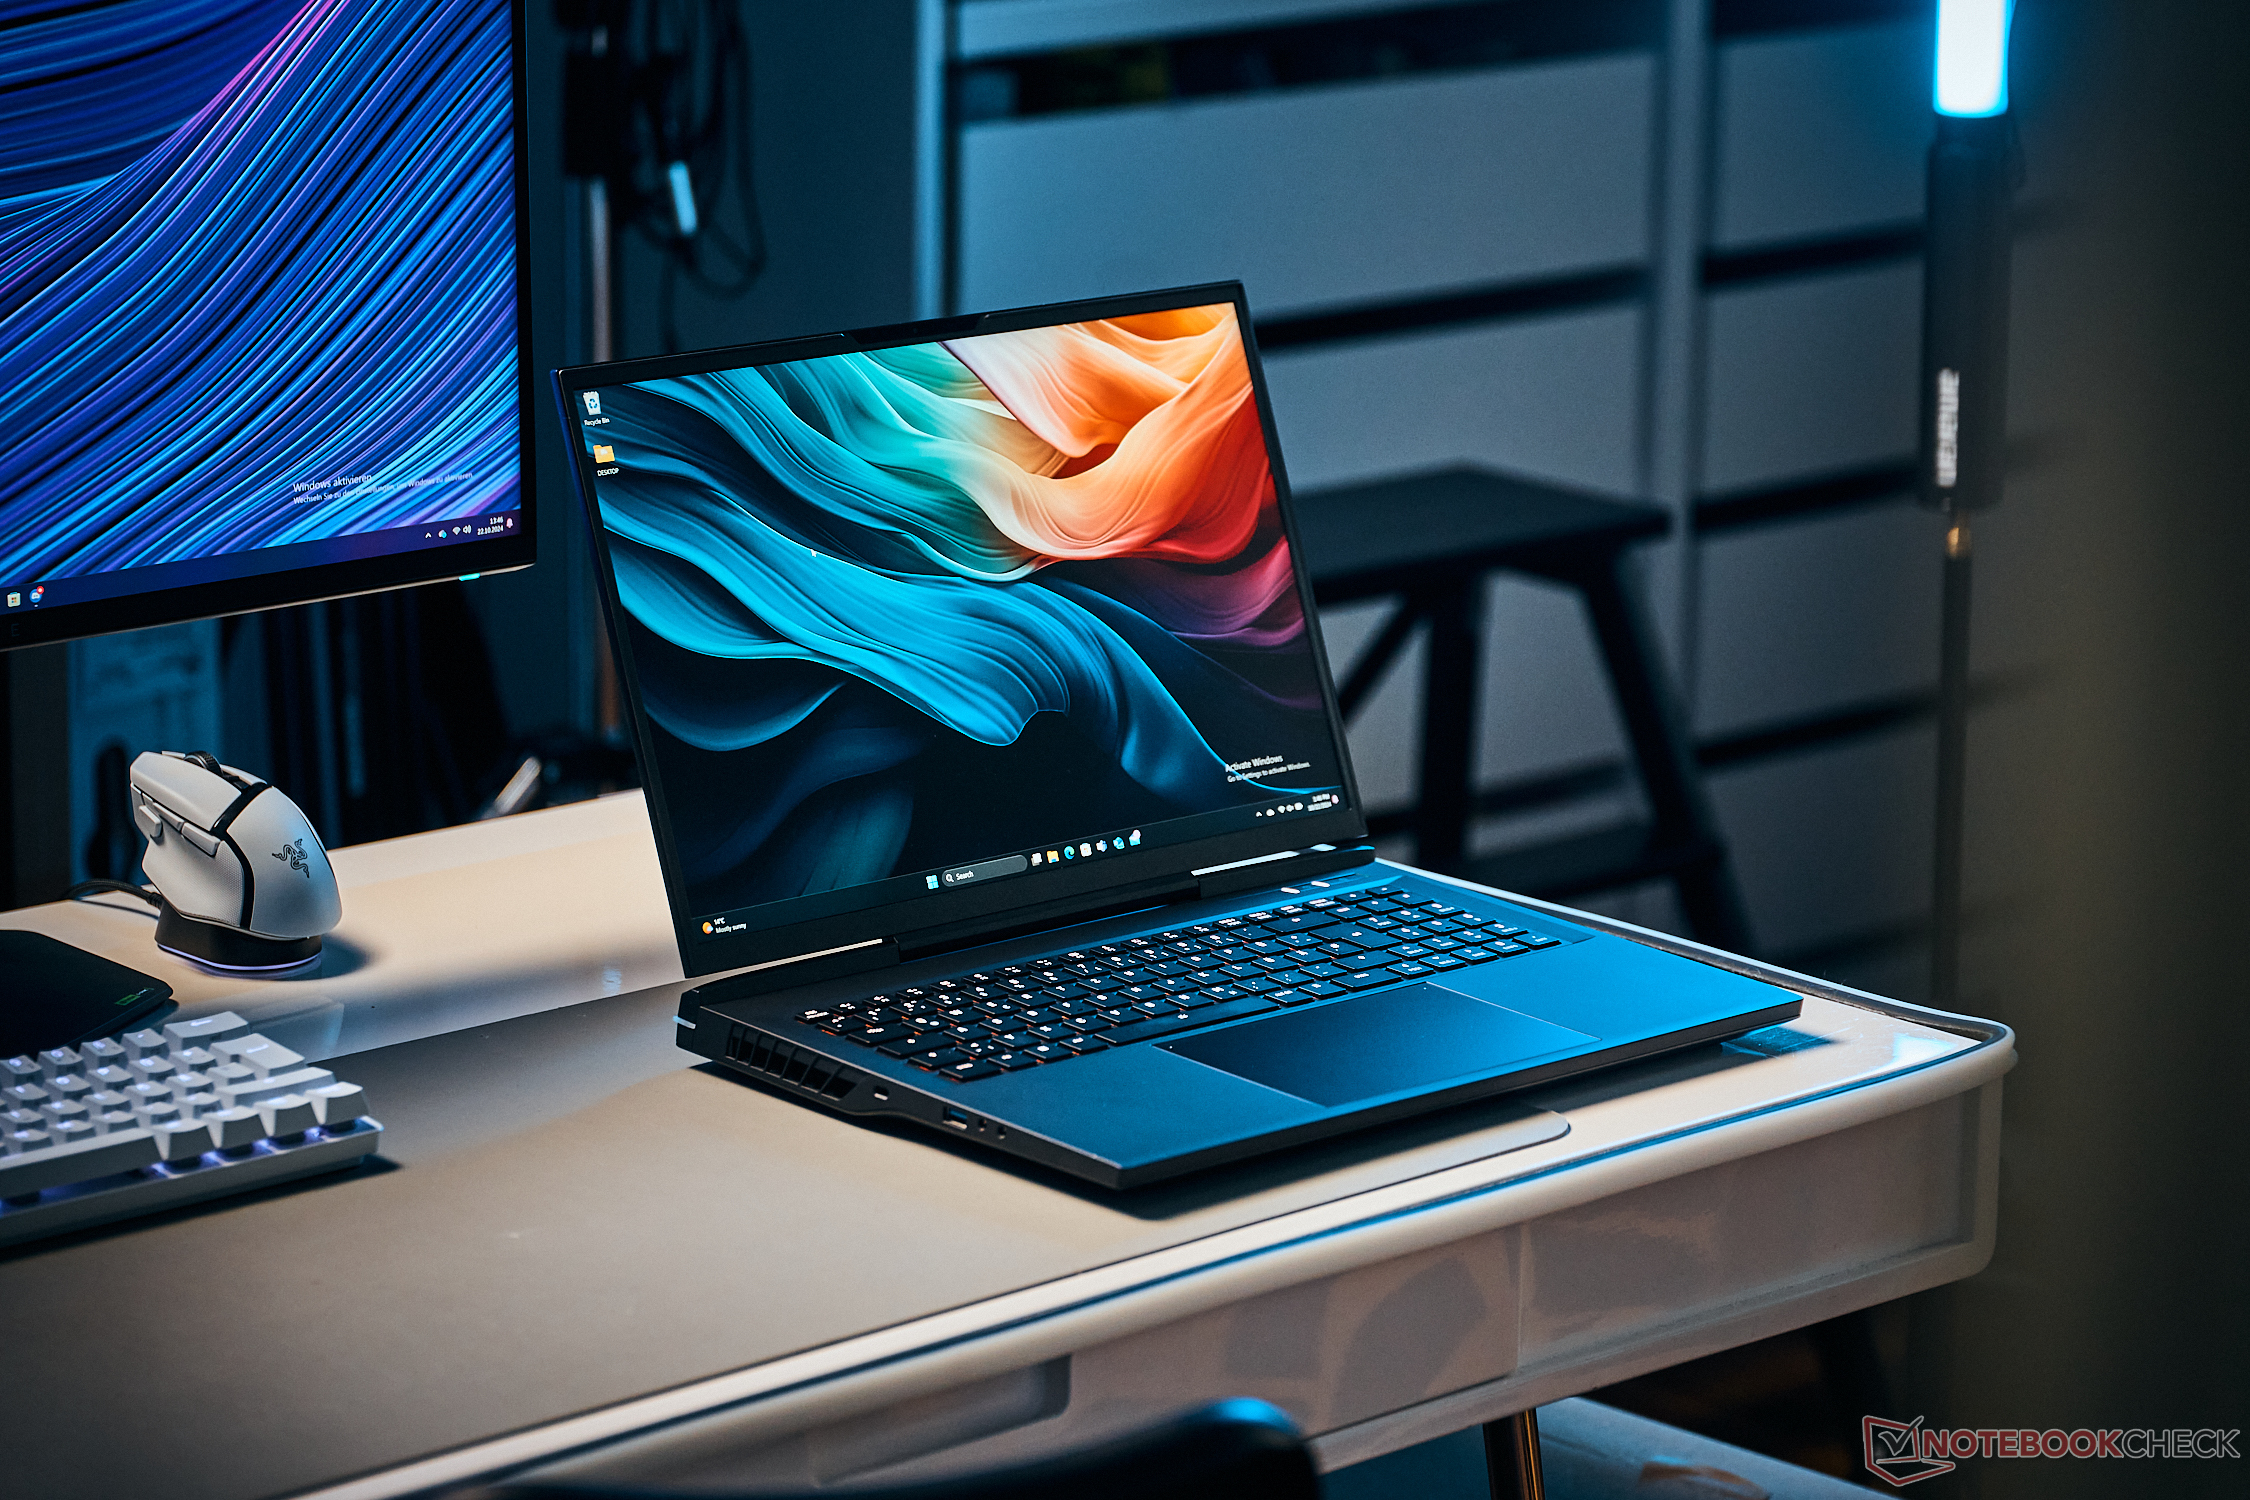
Recenzja XMG Neo 17 E24 - Szybki laptop do gier z opcjonalnym chłodzeniem wodnym
Laptop RTX 4080 i klawiatura mechaniczna.
Dzięki XMG Neo 17 otrzymują Państwo rasowego gracza, który może być wyposażony w najszybsze komponenty na rynku. Mechaniczna klawiatura Cherry i zewnętrzny system chłodzenia wodą są również dostępne jako opcje, które nie tylko obniżają temperatury, ale także hałas w tle.Andreas Osthoff, 👁 Andreas Osthoff (tłumaczenie DeepL / Ninh Duy) Opublikowany 🇺🇸 🇩🇪 ...
Werdykt - XMG Neo 17 koncentruje się na wydajności w grach
XMG Neo 17 prezentuje się w teście jako potężny laptop do gier z oczywistym naciskiem na maksymalną wydajność komponentów. Procesor Intel Core i9-14900HX jest używany jako procesor we wszystkich konfiguracjach, podczas gdy dedykowane układy GPU Nvidii można podkręcać. W rezultacie otrzymujemy jeden z najszybszych laptopów z RTX 4080, jakie do tej pory testowaliśmy. Zapewnia to wystarczającą wydajność dla szybkiego panelu QHD 240 Hz, który jest również bardzo odpowiedni do gier. Obwód opcjonalnego zewnętrznego chłodzenia wodnego Oasis został ulepszony i teraz obejmuje również procesor. Rezultatem są znacznie niższe temperatury, a tym samym niższy poziom hałasu podczas grania.
Gracz ma również dobrą sylwetkę w innych obszarach: dostępna jest wystarczająca liczba portów, obudowa jest dobrej jakości, a opcjonalna klawiatura mechaniczna Cherry jest bardzo dobra, ale także bardzo głośna. Pojemność pamięci RAM/SSD można również skonfigurować, a późniejsza aktualizacja nie stanowi problemu. 17-calowy notebook jest stosunkowo duży i nie jest lekki - waży niecałe 3 kg. Układ chłodzenia wykonuje dobrą robotę nawet bez chłodzenia wodnego Oasis, ale wentylatory stają się bardzo głośne podczas grania i należy używać słuchawek.
Pod względem ceny, ponad 3000 euro nie jest oczywiście okazją, ale wynika to głównie z GPU GeForce. Jeśli szukają Państwo rasowego gracza i chcą skorzystać z chłodzenia wodnego, XMG Neo 17 jest zdecydowanie dobrym wyborem.
Za
Przeciw
Cena i dostępność
Schenker Neo 17 E24 można skonfigurować i zamówić bezpośrednio w Bestware. Cena początkowa wynosi 1 949 euro za konfigurację z laptopem RTX 4060 i 2 924 euro za laptopa RTX 4080.
Porównanie możliwych alternatyw
Obraz | Model / recenzja | Geizhals | Waga | Wysokość | Ekran |
|---|---|---|---|---|---|
| Schenker XMG Neo 17 E24 Intel Core i9-14900HX ⎘ NVIDIA GeForce RTX 4080 Laptop GPU ⎘ 32 GB Pamięć, 1024 GB SSD | Listenpreis 3189€ | 2.9 kg | 27 mm | 17.00" 2560x1600 178 PPI IPS | |
| Medion Erazer Beast X40 2024 Intel Core i9-14900HX ⎘ NVIDIA GeForce RTX 4090 Laptop GPU ⎘ 32 GB Pamięć, 1024 GB SSD | Listenpreis 4000 Euro | 2.9 kg | 36 mm | 17.00" 2560x1600 178 PPI IPS | |
| HP Omen 17-db0079ng AMD Ryzen 7 8845HS ⎘ NVIDIA GeForce RTX 4070 Laptop GPU ⎘ 32 GB Pamięć, 1024 GB SSD | Listenpreis 1900€ | 2.8 kg | 30.1 mm | 17.30" 2560x1440 170 PPI IPS | |
| Eurocom Raptor X17 Core i9-14900HX Intel Core i9-14900HX ⎘ NVIDIA GeForce RTX 4090 Laptop GPU ⎘ 32 GB Pamięć, 2048 GB SSD | Listenpreis 4500 USD | 3.4 kg | 24.9 mm | 17.30" 3840x2160 255 PPI IPS | |
| MSI GE78HX 13VH-070US Intel Core i9-13950HX ⎘ NVIDIA GeForce RTX 4080 Laptop GPU ⎘ 32 GB Pamięć, 2048 GB SSD | Listenpreis 3600 USD | 3 kg | 23 mm | 17.00" 2560x1600 178 PPI IPS |
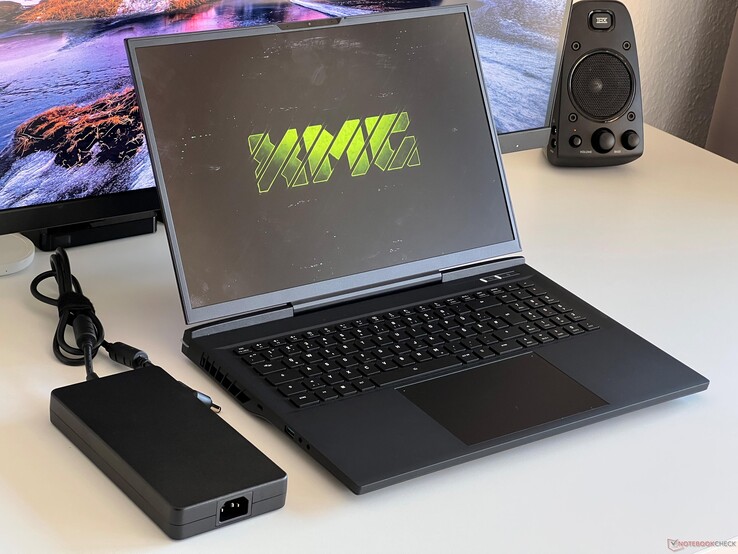
Dzięki XMG Neo 17 E24 Schenker oferuje potężny 17-calowy notebook do gier z panelem QHD 240 Hz (G-Sync). Procesor to zawsze Intel Core i9-14900HX, a jeśli chodzi o kartę graficzną, mają Państwo wybór między Nvidia GeForce RTX 4060 Laptop i wszystkimi innymi modelami aż do GeForce RTX 4090. Pamięć RAM/SSD można konfigurować w szerokim zakresie, a oprócz klawiatury mechanicznej opcjonalnie dostępny jest również zewnętrzny system chłodzenia wodnego Oasis, który może znacznie zwiększyć wydajność chłodzenia laptopa.
Nasze urządzenie testowe zostało wyposażone w dedykowany GeForce RTX 4080 GPU, 32 GB pamięci RAM i 1 TB dysk SSD od Samsunga, co zwiększa cenę wraz z mechaniczną klawiaturą Cherry do 3 182 euro (cena bazowa 1 948 euro). Przyjrzymy się również niektórym testom porównawczym Neo 17 z laptopem RTX 4090 w połączeniu z systemem chłodzenia wodnego Oasis (199 euro).
Specyfikacje
Walizka i wyposażenie
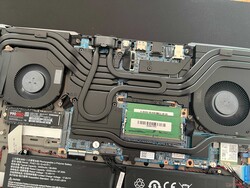
Znamy już czarną metalową obudowę i gumowaną jednostkę bazową od Medion Erazer Beastktóry bazuje na tym samym barebone. Z tyłu znajduje się pasek LED i logo XMG na pokrywie, ale poza tym nie ma irytujących naklejek producenta. Ogólna stabilność jest bardzo dobra, ale przy wadze nieco poniżej 2,9 kg i wysokości 2,7 cm, Neo 17 również nie jest lekki. Dolną pokrywę obudowy można stosunkowo łatwo zdjąć (należy również poluzować dwie śruby na złączu chłodzenia wodnego) i uzyskać dostęp do wszystkich ważnych komponentów, w tym pamięci RAM, 2x M.2-2280 SSD lub modułu WLAN.
Zakres połączeń jest bardzo szeroki, gdyż oprócz wystarczającej liczby portów USB, dostępne są również Thunderbolt 4 i HDMI. Czytnik kart osiąga średnie prędkości transferu w połączeniu z naszą kartą referencyjną (Angelbird AV Pro V60), a kamera internetowa 1080p robi wystarczająco ostre zdjęcia. Moduł Wi-Fi 6E od Intela (AX211) osiąga bardzo dobre prędkości transferu w połączeniu z naszym routerem referencyjnym, ale najnowszy standard Wi-Fi 7 nie jest jeszcze obsługiwany.
| SD Card Reader | |
| average JPG Copy Test (av. of 3 runs) | |
| Średnia w klasie Gaming (20 - 210, n=66, ostatnie 2 lata) | |
| Schenker XMG Neo 17 E24 (Angelbird AV Pro V60) | |
| Medion Erazer Beast X40 2024 (AV PRO microSD 128 GB V60) | |
| MSI GE78HX 13VH-070US (Angelibird AV Pro V60) | |
| maximum AS SSD Seq Read Test (1GB) | |
| Średnia w klasie Gaming (25.8 - 261, n=63, ostatnie 2 lata) | |
| Medion Erazer Beast X40 2024 (AV PRO microSD 128 GB V60) | |
| MSI GE78HX 13VH-070US (Angelibird AV Pro V60) | |
| Schenker XMG Neo 17 E24 (Angelbird AV Pro V60) | |
| Networking | |
| Schenker XMG Neo 17 E24 | |
| iperf3 transmit AXE11000 | |
| iperf3 receive AXE11000 | |
| Medion Erazer Beast X40 2024 | |
| iperf3 transmit AXE11000 | |
| iperf3 receive AXE11000 | |
| HP Omen 17-db0079ng | |
| iperf3 transmit AXE11000 | |
| iperf3 receive AXE11000 | |
| Eurocom Raptor X17 Core i9-14900HX | |
| iperf3 transmit AXE11000 | |
| iperf3 receive AXE11000 | |
| iperf3 transmit AXE11000 6GHz | |
| iperf3 receive AXE11000 6GHz | |
| MSI GE78HX 13VH-070US | |
| iperf3 transmit AXE11000 | |
| iperf3 receive AXE11000 | |
| iperf3 transmit AXE11000 6GHz | |
| iperf3 receive AXE11000 6GHz | |

Urządzenia wejściowe - Mechaniczna klawiatura Cherry
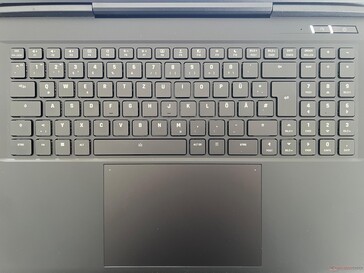
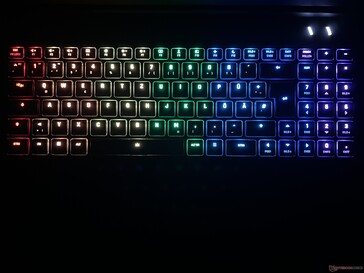
Neo 17 jest dostępny z konwencjonalną klawiaturą membranową z 4 strefami podświetlenia lub klawiaturą mechaniczną z indywidualnym podświetleniem klawiszy (dopłata 95 euro). Jest to również zainstalowane w naszym urządzeniu testowym, z dotykowymi przełącznikami Cherry (MX ULP). Są one zgodne ze swoją nazwą i oferują bardzo wyczuwalne i precyzyjne pisanie, ale przyciski są również bardzo głośne. Zdecydowanie należy wziąć to pod uwagę przy dokonywaniu wyboru. Duża szklana podkładka ClickPad (15 x 9,5 cm) działa bez żadnych problemów.
Wyświetlacz - QHD z 240 Hz
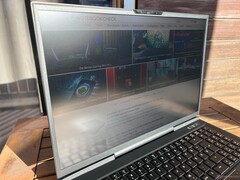
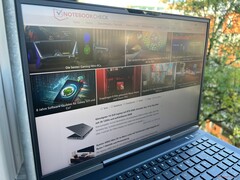
17-calowy wyświetlacz IPS z matową powierzchnią oferuje rozdzielczość 2560 x 1600 pikseli (16:10) i doskonale nadaje się do gier dzięki krótkim czasom reakcji i częstotliwości 240 Hz. Subiektywna jakość obrazu jest również bardzo dobra. PWM nie jest używany i nie ma większych problemów z aureolą.
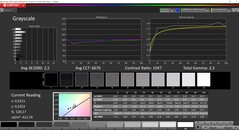
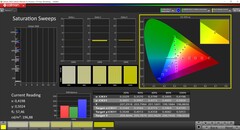
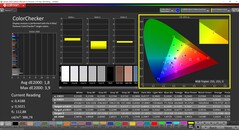
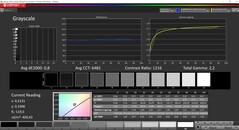
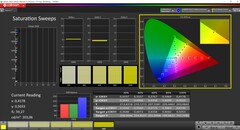
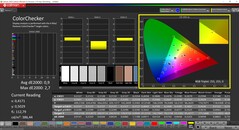
Średnia jasność wynosi około 400 cd/m², choć poziom czerni jest nieco wyższy i wynosi 0,39. Skutkuje to maksymalnym współczynnikiem kontrastu wynoszącym nieco ponad 1000:1, co jest w porządku. Panel powinien być jeszcze jaśniejszy na zewnątrz. Fabryczna kalibracja jest już bardzo dobra, ale możemy jeszcze bardziej zoptymalizować wyświetlacz za pomocą naszej kalibracji. Odpowiedni profil jest dostępny do bezpłatnego pobrania w ramce po prawej stronie. Wraz z pełnym pokryciem palety sRGB, panel nadaje się również do edycji zdjęć/filmów.
| |||||||||||||||||||||||||
rozświetlenie: 88 %
na akumulatorze: 412 cd/m²
kontrast: 1056:1 (czerń: 0.39 cd/m²)
ΔE ColorChecker Calman: 1.8 | ∀{0.5-29.43 Ø4.78}
calibrated: 0.9
ΔE Greyscale Calman: 2.5 | ∀{0.09-98 Ø5}
69.6% AdobeRGB 1998 (Argyll 3D)
98.4% sRGB (Argyll 3D)
69% Display P3 (Argyll 3D)
Gamma: 2.3
CCT: 6676 K
| Schenker XMG Neo 17 E24 NE170QDM-NZ1, IPS, 2560x1600, 17", 240 Hz | Medion Erazer Beast X40 2024 BOE NE170QDM-NZ1, IPS, 2560x1600, 17", 240 Hz | HP Omen 17-db0079ng BOE0B67, IPS, 2560x1440, 17.3", 240 Hz | Eurocom Raptor X17 Core i9-14900HX BOE CQ NE173QUM-NY1, IPS, 3840x2160, 17.3", 144 Hz | MSI GE78HX 13VH-070US AU Optronics B170QAN01.2, IPS, 2560x1600, 17", 240 Hz | |
|---|---|---|---|---|---|
| Display | -0% | -3% | 20% | 22% | |
| Display P3 Coverage (%) | 69 | 68.1 -1% | 66.2 -4% | 95.9 39% | 97.6 41% |
| sRGB Coverage (%) | 98.4 | 99.5 1% | 95.5 -3% | 99.8 1% | 99.9 2% |
| AdobeRGB 1998 Coverage (%) | 69.6 | 69 -1% | 68.1 -2% | 84.2 21% | 86.5 24% |
| Response Times | 4% | -17% | -40% | 38% | |
| Response Time Grey 50% / Grey 80% * (ms) | 12.1 ? | 11.7 ? 3% | 14.4 ? -19% | 14.8 ? -22% | 4.2 ? 65% |
| Response Time Black / White * (ms) | 7.2 ? | 6.9 ? 4% | 8.3 ? -15% | 11.4 ? -58% | 6.4 ? 11% |
| PWM Frequency (Hz) | |||||
| Screen | 14% | -9% | -25% | -51% | |
| Brightness middle (cd/m²) | 412 | 422 2% | 363 -12% | 544.6 32% | 398.6 -3% |
| Brightness (cd/m²) | 401 | 388 -3% | 341 -15% | 507 26% | 384 -4% |
| Brightness Distribution (%) | 88 | 87 -1% | 84 -5% | 77 -12% | 89 1% |
| Black Level * (cd/m²) | 0.39 | 0.42 -8% | 0.38 3% | 0.48 -23% | 0.46 -18% |
| Contrast (:1) | 1056 | 1005 -5% | 955 -10% | 1135 7% | 867 -18% |
| Colorchecker dE 2000 * | 1.8 | 1.42 21% | 1.74 3% | 3.38 -88% | 4.05 -125% |
| Colorchecker dE 2000 max. * | 3.9 | 1.97 49% | 5.39 -38% | 7.13 -83% | 8.68 -123% |
| Colorchecker dE 2000 calibrated * | 0.9 | 0.7 22% | 1.43 -59% | 1.03 -14% | 1.02 -13% |
| Greyscale dE 2000 * | 2.5 | 1.2 52% | 1.3 48% | 4.3 -72% | 6.5 -160% |
| Gamma | 2.3 96% | 2.078 106% | 2.235 98% | 2.42 91% | 2.11 104% |
| CCT | 6676 97% | 6581 99% | 6346 102% | 7356 88% | 7518 86% |
| Całkowita średnia (program / ustawienia) | 6% /
10% | -10% /
-9% | -15% /
-18% | 3% /
-23% |
* ... im mniej tym lepiej
Wyświetl czasy reakcji
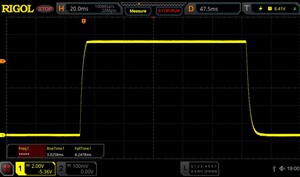
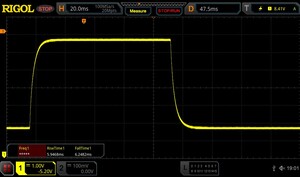
| ↔ Czas reakcji od czerni do bieli | ||
|---|---|---|
| 7.2 ms ... wzrost ↗ i spadek ↘ łącznie | ↗ 3 ms wzrost | |
| ↘ 4.2 ms upadek | ||
| W naszych testach ekran wykazuje bardzo szybką reakcję i powinien bardzo dobrze nadawać się do szybkich gier. Dla porównania, wszystkie testowane urządzenia wahają się od 0.1 (minimum) do 240 (maksimum) ms. » 20 % wszystkich urządzeń jest lepszych. Oznacza to, że zmierzony czas reakcji jest lepszy od średniej wszystkich testowanych urządzeń (20.2 ms). | ||
| ↔ Czas reakcji 50% szarości do 80% szarości | ||
| 12.1 ms ... wzrost ↗ i spadek ↘ łącznie | ↗ 5.9 ms wzrost | |
| ↘ 6.2 ms upadek | ||
| W naszych testach ekran wykazuje dobry współczynnik reakcji, ale może być zbyt wolny dla graczy rywalizujących ze sobą. Dla porównania, wszystkie testowane urządzenia wahają się od 0.165 (minimum) do 636 (maksimum) ms. » 25 % wszystkich urządzeń jest lepszych. Oznacza to, że zmierzony czas reakcji jest lepszy od średniej wszystkich testowanych urządzeń (31.6 ms). | ||
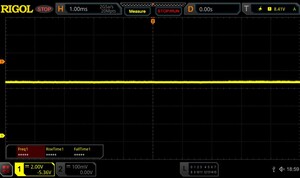
Migotanie ekranu / PWM (modulacja szerokości impulsu)
| Migotanie ekranu/nie wykryto PWM | |||
Dla porównania: 53 % wszystkich testowanych urządzeń nie używa PWM do przyciemniania wyświetlacza. Jeśli wykryto PWM, zmierzono średnio 8108 (minimum: 5 - maksimum: 343500) Hz. | |||
Wydajność - Raptor Lake-HX
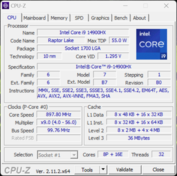
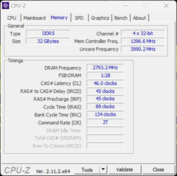
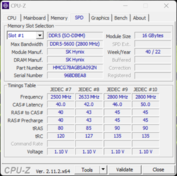
Neo 17 jest wyposażony wyłącznie w Intel Core i9-14900HX. standardowo zainstalowane jest 16 GB pamięci RAM, ale możliwe jest do 96 GB dzięki dwóm gniazdom SO-DIMM (dopłata 260 euro).
Warunki testu
XMG Neo 17 oferuje różne profile energetyczne, które podsumowaliśmy w poniższej tabeli. W naszych testach porównawczych i pomiarach wykorzystaliśmy tryb Overboost, ponieważ różnica w hałasie w porównaniu do trybu Enthusiast jest niewielka. Producent udostępnia również stronę Deep Dive gdzie znajdą Państwo więcej informacji technicznych na temat Neo 17 i profili energetycznych.
| Profil energetyczny | TDP CPU | CB R23 Multi | TDP GPU | Time Spy Grafika | CP 2077 Ultra QHD | Maks. głośność wentylatora |
|---|---|---|---|---|---|---|
| Zrównoważony | 45 W | 14,899 punktów | 130 W | 10,778 punktów | 73.9 FPS | 43.1 dB(A) |
| Enthusiast | 75 W | 22 027 punktów | 150 W | 18 021 punktów | 78,6 FPS | 49,9 dB(A) |
| Overboost | 160/140 W | 31 740 punktów | 175 W | 19 155 punktów | 80,7 FPS | 51,9 dB(A) |
Procesor - Core i9-14900HX
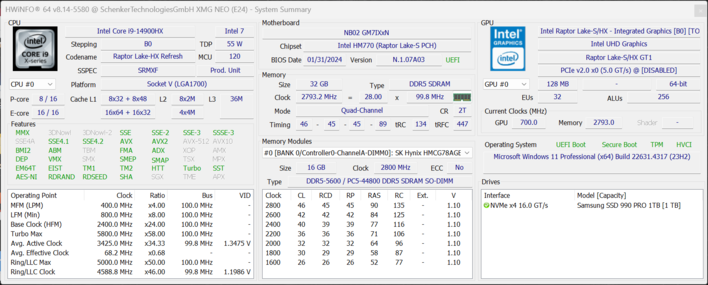
Intel Core i9-14900HX jest nadal jednym z najszybszych procesorów mobilnych i jest mało prawdopodobne, aby zmieniło się to wraz z nadchodzącymi układami Arrow Lake. Dostarczanie energii przez procesor jest doskonałe, ponieważ może on zużywać 160 watów przez krótki czas i 140 watów w sposób ciągły. Dla użytkownika oznacza to bardzo wysoką i stałą wydajność. Należy jednak liczyć się ze znacznymi stratami w trybie bateryjnym, ponieważ procesor może zużywać maksymalnie 35 watów, co odpowiada 65% spadkowi wydajności w testach wielordzeniowych. Dalsze testy porównawcze procesora są dostępne w naszej sekcji technologicznej.
Cinebench R15 Multi loop
Cinebench R23: Multi Core | Single Core
Cinebench R20: CPU (Multi Core) | CPU (Single Core)
Cinebench R15: CPU Multi 64Bit | CPU Single 64Bit
Blender: v2.79 BMW27 CPU
7-Zip 18.03: 7z b 4 | 7z b 4 -mmt1
Geekbench 6.5: Multi-Core | Single-Core
Geekbench 5.5: Multi-Core | Single-Core
HWBOT x265 Benchmark v2.2: 4k Preset
LibreOffice : 20 Documents To PDF
R Benchmark 2.5: Overall mean
| CPU Performance rating | |
| Schenker XMG Neo 17 E24 | |
| MSI GE78HX 13VH-070US -2! | |
| Przeciętny Intel Core i9-14900HX | |
| Eurocom Raptor X17 Core i9-14900HX | |
| Medion Erazer Beast X40 2024 | |
| Średnia w klasie Gaming | |
| HP Omen 17-db0079ng | |
| Cinebench R23 / Multi Core | |
| MSI GE78HX 13VH-070US | |
| Schenker XMG Neo 17 E24 | |
| Eurocom Raptor X17 Core i9-14900HX | |
| Przeciętny Intel Core i9-14900HX (17078 - 36249, n=37) | |
| Średnia w klasie Gaming (5668 - 40970, n=145, ostatnie 2 lata) | |
| Medion Erazer Beast X40 2024 | |
| HP Omen 17-db0079ng | |
| Cinebench R23 / Single Core | |
| Schenker XMG Neo 17 E24 | |
| Medion Erazer Beast X40 2024 | |
| Przeciętny Intel Core i9-14900HX (1720 - 2245, n=37) | |
| MSI GE78HX 13VH-070US | |
| Eurocom Raptor X17 Core i9-14900HX | |
| Średnia w klasie Gaming (1136 - 2267, n=145, ostatnie 2 lata) | |
| HP Omen 17-db0079ng | |
| Cinebench R20 / CPU (Multi Core) | |
| MSI GE78HX 13VH-070US | |
| Schenker XMG Neo 17 E24 | |
| Eurocom Raptor X17 Core i9-14900HX | |
| Przeciętny Intel Core i9-14900HX (6579 - 13832, n=37) | |
| Średnia w klasie Gaming (2179 - 16108, n=144, ostatnie 2 lata) | |
| Medion Erazer Beast X40 2024 | |
| HP Omen 17-db0079ng | |
| Cinebench R20 / CPU (Single Core) | |
| Schenker XMG Neo 17 E24 | |
| Medion Erazer Beast X40 2024 | |
| Przeciętny Intel Core i9-14900HX (657 - 859, n=37) | |
| Eurocom Raptor X17 Core i9-14900HX | |
| MSI GE78HX 13VH-070US | |
| Średnia w klasie Gaming (439 - 870, n=144, ostatnie 2 lata) | |
| HP Omen 17-db0079ng | |
| Cinebench R15 / CPU Multi 64Bit | |
| MSI GE78HX 13VH-070US | |
| Schenker XMG Neo 17 E24 | |
| Eurocom Raptor X17 Core i9-14900HX | |
| Przeciętny Intel Core i9-14900HX (3263 - 5589, n=38) | |
| Średnia w klasie Gaming (1537 - 6271, n=144, ostatnie 2 lata) | |
| Medion Erazer Beast X40 2024 | |
| HP Omen 17-db0079ng | |
| Cinebench R15 / CPU Single 64Bit | |
| Schenker XMG Neo 17 E24 | |
| Medion Erazer Beast X40 2024 | |
| Przeciętny Intel Core i9-14900HX (247 - 323, n=37) | |
| MSI GE78HX 13VH-070US | |
| Eurocom Raptor X17 Core i9-14900HX | |
| Średnia w klasie Gaming (188.8 - 343, n=143, ostatnie 2 lata) | |
| HP Omen 17-db0079ng | |
| Blender / v2.79 BMW27 CPU | |
| HP Omen 17-db0079ng | |
| Średnia w klasie Gaming (80 - 517, n=140, ostatnie 2 lata) | |
| Medion Erazer Beast X40 2024 | |
| Przeciętny Intel Core i9-14900HX (91 - 206, n=37) | |
| Eurocom Raptor X17 Core i9-14900HX | |
| Schenker XMG Neo 17 E24 | |
| MSI GE78HX 13VH-070US | |
| 7-Zip 18.03 / 7z b 4 | |
| MSI GE78HX 13VH-070US | |
| Schenker XMG Neo 17 E24 | |
| Eurocom Raptor X17 Core i9-14900HX | |
| Przeciętny Intel Core i9-14900HX (66769 - 136645, n=37) | |
| Medion Erazer Beast X40 2024 | |
| Średnia w klasie Gaming (23795 - 148086, n=142, ostatnie 2 lata) | |
| HP Omen 17-db0079ng | |
| 7-Zip 18.03 / 7z b 4 -mmt1 | |
| Medion Erazer Beast X40 2024 | |
| Schenker XMG Neo 17 E24 | |
| MSI GE78HX 13VH-070US | |
| Przeciętny Intel Core i9-14900HX (5452 - 7545, n=37) | |
| Eurocom Raptor X17 Core i9-14900HX | |
| Średnia w klasie Gaming (4199 - 7508, n=142, ostatnie 2 lata) | |
| HP Omen 17-db0079ng | |
| Geekbench 6.5 / Multi-Core | |
| Schenker XMG Neo 17 E24 | |
| Eurocom Raptor X17 Core i9-14900HX | |
| Przeciętny Intel Core i9-14900HX (13158 - 19665, n=37) | |
| Medion Erazer Beast X40 2024 | |
| Średnia w klasie Gaming (5340 - 22104, n=142, ostatnie 2 lata) | |
| HP Omen 17-db0079ng | |
| Geekbench 6.5 / Single-Core | |
| Medion Erazer Beast X40 2024 | |
| Schenker XMG Neo 17 E24 | |
| Przeciętny Intel Core i9-14900HX (2419 - 3129, n=37) | |
| Eurocom Raptor X17 Core i9-14900HX | |
| Średnia w klasie Gaming (1490 - 3253, n=142, ostatnie 2 lata) | |
| HP Omen 17-db0079ng | |
| Geekbench 5.5 / Multi-Core | |
| MSI GE78HX 13VH-070US | |
| Schenker XMG Neo 17 E24 | |
| Przeciętny Intel Core i9-14900HX (8618 - 23194, n=37) | |
| Medion Erazer Beast X40 2024 | |
| Średnia w klasie Gaming (4557 - 27010, n=141, ostatnie 2 lata) | |
| HP Omen 17-db0079ng | |
| Eurocom Raptor X17 Core i9-14900HX | |
| Geekbench 5.5 / Single-Core | |
| Medion Erazer Beast X40 2024 | |
| Schenker XMG Neo 17 E24 | |
| MSI GE78HX 13VH-070US | |
| Przeciętny Intel Core i9-14900HX (1669 - 2210, n=37) | |
| Średnia w klasie Gaming (986 - 2423, n=141, ostatnie 2 lata) | |
| HP Omen 17-db0079ng | |
| Eurocom Raptor X17 Core i9-14900HX | |
| HWBOT x265 Benchmark v2.2 / 4k Preset | |
| MSI GE78HX 13VH-070US | |
| Eurocom Raptor X17 Core i9-14900HX | |
| Schenker XMG Neo 17 E24 | |
| Przeciętny Intel Core i9-14900HX (16.8 - 38.9, n=37) | |
| Średnia w klasie Gaming (7.7 - 44.3, n=142, ostatnie 2 lata) | |
| Medion Erazer Beast X40 2024 | |
| HP Omen 17-db0079ng | |
| LibreOffice / 20 Documents To PDF | |
| HP Omen 17-db0079ng | |
| Średnia w klasie Gaming (19 - 88.8, n=141, ostatnie 2 lata) | |
| MSI GE78HX 13VH-070US | |
| Medion Erazer Beast X40 2024 | |
| Przeciętny Intel Core i9-14900HX (19 - 85.1, n=37) | |
| Schenker XMG Neo 17 E24 | |
| Eurocom Raptor X17 Core i9-14900HX | |
| R Benchmark 2.5 / Overall mean | |
| HP Omen 17-db0079ng | |
| Średnia w klasie Gaming (0.3551 - 0.759, n=143, ostatnie 2 lata) | |
| Przeciętny Intel Core i9-14900HX (0.3604 - 0.4859, n=37) | |
| Eurocom Raptor X17 Core i9-14900HX | |
| MSI GE78HX 13VH-070US | |
| Schenker XMG Neo 17 E24 | |
| Medion Erazer Beast X40 2024 | |
* ... im mniej tym lepiej
AIDA64: FP32 Ray-Trace | FPU Julia | CPU SHA3 | CPU Queen | FPU SinJulia | FPU Mandel | CPU AES | CPU ZLib | FP64 Ray-Trace | CPU PhotoWorxx
| Performance rating | |
| Eurocom Raptor X17 Core i9-14900HX | |
| Schenker XMG Neo 17 E24 | |
| MSI GE78HX 13VH-070US | |
| Przeciętny Intel Core i9-14900HX | |
| Średnia w klasie Gaming | |
| HP Omen 17-db0079ng | |
| Medion Erazer Beast X40 2024 | |
| AIDA64 / FP32 Ray-Trace | |
| Schenker XMG Neo 17 E24 | |
| Średnia w klasie Gaming (7192 - 85542, n=141, ostatnie 2 lata) | |
| MSI GE78HX 13VH-070US | |
| Eurocom Raptor X17 Core i9-14900HX | |
| HP Omen 17-db0079ng | |
| Przeciętny Intel Core i9-14900HX (13098 - 33474, n=36) | |
| Medion Erazer Beast X40 2024 | |
| AIDA64 / FPU Julia | |
| Schenker XMG Neo 17 E24 | |
| MSI GE78HX 13VH-070US | |
| Eurocom Raptor X17 Core i9-14900HX | |
| Średnia w klasie Gaming (35040 - 238426, n=141, ostatnie 2 lata) | |
| Przeciętny Intel Core i9-14900HX (67573 - 166040, n=36) | |
| HP Omen 17-db0079ng | |
| Medion Erazer Beast X40 2024 | |
| AIDA64 / CPU SHA3 | |
| Eurocom Raptor X17 Core i9-14900HX | |
| Schenker XMG Neo 17 E24 | |
| MSI GE78HX 13VH-070US | |
| Przeciętny Intel Core i9-14900HX (3589 - 7979, n=36) | |
| Średnia w klasie Gaming (1728 - 9817, n=141, ostatnie 2 lata) | |
| Medion Erazer Beast X40 2024 | |
| HP Omen 17-db0079ng | |
| AIDA64 / CPU Queen | |
| Eurocom Raptor X17 Core i9-14900HX | |
| Schenker XMG Neo 17 E24 | |
| MSI GE78HX 13VH-070US | |
| Przeciętny Intel Core i9-14900HX (118405 - 148966, n=36) | |
| Medion Erazer Beast X40 2024 | |
| Średnia w klasie Gaming (50699 - 173351, n=141, ostatnie 2 lata) | |
| HP Omen 17-db0079ng | |
| AIDA64 / FPU SinJulia | |
| MSI GE78HX 13VH-070US | |
| Schenker XMG Neo 17 E24 | |
| Eurocom Raptor X17 Core i9-14900HX | |
| Przeciętny Intel Core i9-14900HX (10475 - 18517, n=36) | |
| HP Omen 17-db0079ng | |
| Średnia w klasie Gaming (5020 - 33636, n=141, ostatnie 2 lata) | |
| Medion Erazer Beast X40 2024 | |
| AIDA64 / FPU Mandel | |
| Schenker XMG Neo 17 E24 | |
| MSI GE78HX 13VH-070US | |
| Eurocom Raptor X17 Core i9-14900HX | |
| Średnia w klasie Gaming (17585 - 128721, n=141, ostatnie 2 lata) | |
| Przeciętny Intel Core i9-14900HX (32543 - 83662, n=36) | |
| HP Omen 17-db0079ng | |
| Medion Erazer Beast X40 2024 | |
| AIDA64 / CPU AES | |
| Eurocom Raptor X17 Core i9-14900HX | |
| Przeciętny Intel Core i9-14900HX (86964 - 241777, n=36) | |
| Schenker XMG Neo 17 E24 | |
| MSI GE78HX 13VH-070US | |
| Średnia w klasie Gaming (19065 - 247074, n=141, ostatnie 2 lata) | |
| Medion Erazer Beast X40 2024 | |
| HP Omen 17-db0079ng | |
| AIDA64 / CPU ZLib | |
| MSI GE78HX 13VH-070US | |
| Eurocom Raptor X17 Core i9-14900HX | |
| Schenker XMG Neo 17 E24 | |
| Przeciętny Intel Core i9-14900HX (1054 - 2292, n=36) | |
| Średnia w klasie Gaming (373 - 2531, n=141, ostatnie 2 lata) | |
| Medion Erazer Beast X40 2024 | |
| HP Omen 17-db0079ng | |
| AIDA64 / FP64 Ray-Trace | |
| MSI GE78HX 13VH-070US | |
| Schenker XMG Neo 17 E24 | |
| Średnia w klasie Gaming (3856 - 45446, n=141, ostatnie 2 lata) | |
| Eurocom Raptor X17 Core i9-14900HX | |
| HP Omen 17-db0079ng | |
| Przeciętny Intel Core i9-14900HX (6809 - 18349, n=36) | |
| Medion Erazer Beast X40 2024 | |
| AIDA64 / CPU PhotoWorxx | |
| Eurocom Raptor X17 Core i9-14900HX | |
| MSI GE78HX 13VH-070US | |
| Schenker XMG Neo 17 E24 | |
| Medion Erazer Beast X40 2024 | |
| Przeciętny Intel Core i9-14900HX (23903 - 54702, n=36) | |
| Średnia w klasie Gaming (10805 - 62916, n=141, ostatnie 2 lata) | |
| HP Omen 17-db0079ng | |
Wydajność systemu
Neo 17 imponuje również w syntetycznych testach porównawczych systemu, choć konkurencja jest tu generalnie bardzo blisko. W codziennym użytkowaniu oznacza to niezwykle responsywny system, chociaż podczas przełączania karty graficznej występuje krótkie zawieszenie. Jest to jednak całkowicie normalne i można tego uniknąć, całkowicie dezaktywując iGPU.
CrossMark: Overall | Productivity | Creativity | Responsiveness
WebXPRT 3: Overall
WebXPRT 4: Overall
Mozilla Kraken 1.1: Total
| PCMark 10 / Score | |
| Medion Erazer Beast X40 2024 | |
| MSI GE78HX 13VH-070US | |
| Przeciętny Intel Core i9-14900HX, NVIDIA GeForce RTX 4080 Laptop GPU (7703 - 9223, n=7) | |
| Schenker XMG Neo 17 E24 | |
| Średnia w klasie Gaming (5776 - 9647, n=120, ostatnie 2 lata) | |
| HP Omen 17-db0079ng | |
| PCMark 10 / Essentials | |
| Przeciętny Intel Core i9-14900HX, NVIDIA GeForce RTX 4080 Laptop GPU (11255 - 12600, n=7) | |
| MSI GE78HX 13VH-070US | |
| Schenker XMG Neo 17 E24 | |
| Medion Erazer Beast X40 2024 | |
| Średnia w klasie Gaming (8840 - 12600, n=124, ostatnie 2 lata) | |
| HP Omen 17-db0079ng | |
| PCMark 10 / Productivity | |
| Medion Erazer Beast X40 2024 | |
| Schenker XMG Neo 17 E24 | |
| MSI GE78HX 13VH-070US | |
| Przeciętny Intel Core i9-14900HX, NVIDIA GeForce RTX 4080 Laptop GPU (6662 - 11410, n=7) | |
| HP Omen 17-db0079ng | |
| Średnia w klasie Gaming (6662 - 14612, n=120, ostatnie 2 lata) | |
| PCMark 10 / Digital Content Creation | |
| Medion Erazer Beast X40 2024 | |
| MSI GE78HX 13VH-070US | |
| Przeciętny Intel Core i9-14900HX, NVIDIA GeForce RTX 4080 Laptop GPU (14211 - 16246, n=7) | |
| Schenker XMG Neo 17 E24 | |
| Średnia w klasie Gaming (7440 - 19351, n=120, ostatnie 2 lata) | |
| HP Omen 17-db0079ng | |
| CrossMark / Overall | |
| Eurocom Raptor X17 Core i9-14900HX | |
| Przeciętny Intel Core i9-14900HX, NVIDIA GeForce RTX 4080 Laptop GPU (1992 - 2334, n=7) | |
| Medion Erazer Beast X40 2024 | |
| Schenker XMG Neo 17 E24 | |
| Średnia w klasie Gaming (1247 - 2344, n=115, ostatnie 2 lata) | |
| MSI GE78HX 13VH-070US | |
| HP Omen 17-db0079ng | |
| CrossMark / Productivity | |
| Eurocom Raptor X17 Core i9-14900HX | |
| Medion Erazer Beast X40 2024 | |
| Przeciętny Intel Core i9-14900HX, NVIDIA GeForce RTX 4080 Laptop GPU (1812 - 2204, n=7) | |
| Średnia w klasie Gaming (1299 - 2211, n=115, ostatnie 2 lata) | |
| MSI GE78HX 13VH-070US | |
| Schenker XMG Neo 17 E24 | |
| HP Omen 17-db0079ng | |
| CrossMark / Creativity | |
| Przeciętny Intel Core i9-14900HX, NVIDIA GeForce RTX 4080 Laptop GPU (2327 - 2500, n=7) | |
| Schenker XMG Neo 17 E24 | |
| Eurocom Raptor X17 Core i9-14900HX | |
| Medion Erazer Beast X40 2024 | |
| Średnia w klasie Gaming (1275 - 2729, n=115, ostatnie 2 lata) | |
| MSI GE78HX 13VH-070US | |
| HP Omen 17-db0079ng | |
| CrossMark / Responsiveness | |
| Eurocom Raptor X17 Core i9-14900HX | |
| Przeciętny Intel Core i9-14900HX, NVIDIA GeForce RTX 4080 Laptop GPU (1520 - 2254, n=7) | |
| Medion Erazer Beast X40 2024 | |
| Średnia w klasie Gaming (1030 - 2330, n=115, ostatnie 2 lata) | |
| MSI GE78HX 13VH-070US | |
| Schenker XMG Neo 17 E24 | |
| HP Omen 17-db0079ng | |
| WebXPRT 3 / Overall | |
| Eurocom Raptor X17 Core i9-14900HX | |
| Schenker XMG Neo 17 E24 | |
| Przeciętny Intel Core i9-14900HX, NVIDIA GeForce RTX 4080 Laptop GPU (310 - 345, n=7) | |
| Medion Erazer Beast X40 2024 | |
| MSI GE78HX 13VH-070US | |
| Średnia w klasie Gaming (237 - 532, n=120, ostatnie 2 lata) | |
| HP Omen 17-db0079ng | |
| WebXPRT 4 / Overall | |
| Schenker XMG Neo 17 E24 | |
| Przeciętny Intel Core i9-14900HX, NVIDIA GeForce RTX 4080 Laptop GPU (300 - 321, n=7) | |
| Eurocom Raptor X17 Core i9-14900HX | |
| Medion Erazer Beast X40 2024 | |
| MSI GE78HX 13VH-070US | |
| Średnia w klasie Gaming (176.4 - 345, n=115, ostatnie 2 lata) | |
| Mozilla Kraken 1.1 / Total | |
| HP Omen 17-db0079ng | |
| MSI GE78HX 13VH-070US | |
| Średnia w klasie Gaming (397 - 674, n=129, ostatnie 2 lata) | |
| Eurocom Raptor X17 Core i9-14900HX | |
| Przeciętny Intel Core i9-14900HX, NVIDIA GeForce RTX 4080 Laptop GPU (437 - 446, n=7) | |
| Schenker XMG Neo 17 E24 | |
| Medion Erazer Beast X40 2024 | |
* ... im mniej tym lepiej
| PCMark 10 Score | 8694 pkt. | |
Pomoc | ||
| AIDA64 / Memory Copy | |
| Medion Erazer Beast X40 2024 | |
| Schenker XMG Neo 17 E24 | |
| MSI GE78HX 13VH-070US | |
| Eurocom Raptor X17 Core i9-14900HX | |
| Przeciętny Intel Core i9-14900HX (38028 - 83392, n=36) | |
| Średnia w klasie Gaming (21750 - 104987, n=141, ostatnie 2 lata) | |
| HP Omen 17-db0079ng | |
| AIDA64 / Memory Read | |
| Schenker XMG Neo 17 E24 | |
| MSI GE78HX 13VH-070US | |
| Medion Erazer Beast X40 2024 | |
| Przeciętny Intel Core i9-14900HX (43306 - 87568, n=36) | |
| Eurocom Raptor X17 Core i9-14900HX | |
| Średnia w klasie Gaming (22956 - 104349, n=141, ostatnie 2 lata) | |
| HP Omen 17-db0079ng | |
| AIDA64 / Memory Write | |
| HP Omen 17-db0079ng | |
| Medion Erazer Beast X40 2024 | |
| Schenker XMG Neo 17 E24 | |
| MSI GE78HX 13VH-070US | |
| Eurocom Raptor X17 Core i9-14900HX | |
| Średnia w klasie Gaming (22297 - 133486, n=141, ostatnie 2 lata) | |
| Przeciętny Intel Core i9-14900HX (37146 - 80589, n=36) | |
| AIDA64 / Memory Latency | |
| Średnia w klasie Gaming (59.5 - 259, n=141, ostatnie 2 lata) | |
| HP Omen 17-db0079ng | |
| Eurocom Raptor X17 Core i9-14900HX | |
| Przeciętny Intel Core i9-14900HX (76.1 - 105, n=36) | |
| MSI GE78HX 13VH-070US | |
| Schenker XMG Neo 17 E24 | |
| Medion Erazer Beast X40 2024 | |
* ... im mniej tym lepiej
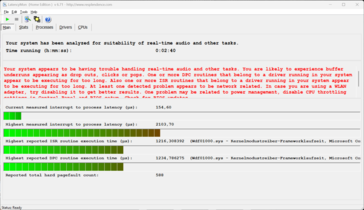
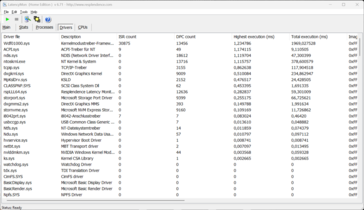
Opóźnienia DPC
| DPC Latencies / LatencyMon - interrupt to process latency (max), Web, Youtube, Prime95 | |
| MSI GE78HX 13VH-070US | |
| Schenker XMG Neo 17 E24 | |
| HP Omen 17-db0079ng | |
| Medion Erazer Beast X40 2024 | |
| Eurocom Raptor X17 Core i9-14900HX | |
* ... im mniej tym lepiej
Pamięć masowa
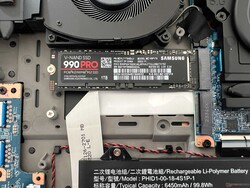
Neo 17 oferuje dwa szybkie gniazda M.2-2280, które są połączone przez PCIe 4.0 x4. W testowanym urządzeniu zainstalowano wersję Samsung 990 Pro o pojemności 1 TB, która osiąga szybkie prędkości transferu i jest jednym z najszybszych dysków SSD na rynku. Ponadto wydajność pozostaje całkowicie stabilna nawet przy stałym obciążeniu. Po pierwszym uruchomieniu użytkownik ma do dyspozycji 864 GB. Więcej testów porównawczych dysków SSD można znaleźć tutaj.
* ... im mniej tym lepiej
Continuous read: DiskSpd Read Loop, Queue Depth 8
Karta graficzna
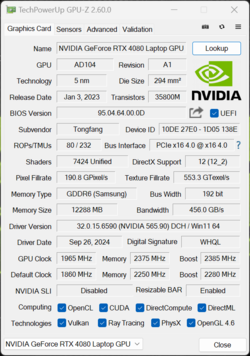
W naszym urządzeniu testowym, dedykowany Laptop Nvidia GeForce RTX 4080 z 12 GB pamięci VRAM. Karta graficzna może zużywać maksymalnie 175 watów (150 watów TGP + 25 watów Dynamic Boost), więc Neo 17 może w pełni wykorzystać GPU. Dzięki przełączaniu grafiki Advanced Optimus, wydajność w grach jest wyjątkowa, a laptop RTX 4080 jest całkowicie wystarczający dla natywnej rozdzielczości QHD. Co więcej, wydajność pozostaje całkowicie stabilna nawet przy stałym obciążeniu.
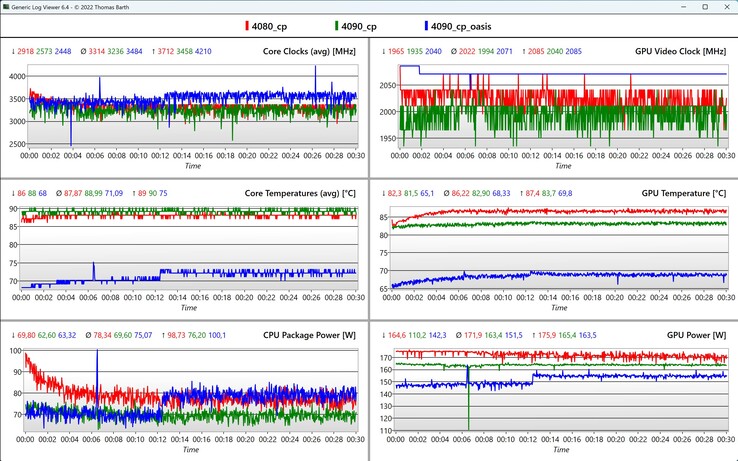
Porównując dane CPU/GPU w naszej pętli Cyberpunk 2077, przewaga zewnętrznego chłodzenia wodnego staje się bardzo wyraźna, ponieważ temperatury CPU/GPU są o około 20 °C niższe, dlatego też wentylatory również muszą pracować mniej.
W trybie bateryjnym zużycie energii przez GPU jest ograniczone do 52 W, dlatego też wydajność GPU jest o około 53% niższa. Dalsze testy porównawcze GPU są dostępne tutaj.
| 3DMark Performance rating - Percent | |
| Eurocom Raptor X17 Core i9-14900HX | |
| Schenker Neo 17 2024 Engineering Sample -1! | |
| Medion Erazer Beast X40 2024 | |
| Schenker XMG Neo 17 E24 | |
| MSI GE78HX 13VH-070US | |
| Przeciętny NVIDIA GeForce RTX 4080 Laptop GPU | |
| Średnia w klasie Gaming | |
| HP Omen 17-db0079ng | |
| 3DMark 11 - 1280x720 Performance GPU | |
| Schenker Neo 17 2024 Engineering Sample | |
| Medion Erazer Beast X40 2024 | |
| Eurocom Raptor X17 Core i9-14900HX | |
| Schenker XMG Neo 17 E24 | |
| MSI GE78HX 13VH-070US | |
| Przeciętny NVIDIA GeForce RTX 4080 Laptop GPU (45199 - 63128, n=24) | |
| Średnia w klasie Gaming (13523 - 80022, n=136, ostatnie 2 lata) | |
| HP Omen 17-db0079ng | |
| 3DMark 11 Performance | 45722 pkt. | |
| 3DMark Fire Strike Score | 34851 pkt. | |
| 3DMark Time Spy Score | 18980 pkt. | |
Pomoc | ||
| Blender / v3.3 Classroom OPTIX/RTX | |
| HP Omen 17-db0079ng | |
| Średnia w klasie Gaming (9 - 95, n=138, ostatnie 2 lata) | |
| Przeciętny NVIDIA GeForce RTX 4080 Laptop GPU (13 - 20, n=22) | |
| MSI GE78HX 13VH-070US | |
| Schenker XMG Neo 17 E24 | |
| Eurocom Raptor X17 Core i9-14900HX | |
| Medion Erazer Beast X40 2024 | |
| Blender / v3.3 Classroom CUDA | |
| Średnia w klasie Gaming (15 - 228, n=142, ostatnie 2 lata) | |
| HP Omen 17-db0079ng | |
| Przeciętny NVIDIA GeForce RTX 4080 Laptop GPU (21 - 28, n=23) | |
| MSI GE78HX 13VH-070US | |
| Schenker XMG Neo 17 E24 | |
| Eurocom Raptor X17 Core i9-14900HX | |
| Medion Erazer Beast X40 2024 | |
| Blender / v3.3 Classroom CPU | |
| HP Omen 17-db0079ng | |
| Średnia w klasie Gaming (122 - 962, n=139, ostatnie 2 lata) | |
| Medion Erazer Beast X40 2024 | |
| Przeciętny NVIDIA GeForce RTX 4080 Laptop GPU (177 - 337, n=23) | |
| Eurocom Raptor X17 Core i9-14900HX | |
| Schenker XMG Neo 17 E24 | |
| MSI GE78HX 13VH-070US | |
* ... im mniej tym lepiej
| Performance rating - Percent | |
| Eurocom Raptor X17 Core i9-14900HX -1! | |
| Schenker Neo 17 2024 Engineering Sample -2! | |
| Medion Erazer Beast X40 2024 -1! | |
| Schenker XMG Neo 17 E24 | |
| MSI GE78HX 13VH-070US -2! | |
| Średnia w klasie Gaming | |
| HP Omen 17-db0079ng -1! | |
| Cyberpunk 2077 - 1920x1080 Ultra Preset (FSR off) | |
| Eurocom Raptor X17 Core i9-14900HX | |
| Schenker XMG Neo 17 E24 | |
| Medion Erazer Beast X40 2024 | |
| Średnia w klasie Gaming (17.7 - 169.9, n=144, ostatnie 2 lata) | |
| HP Omen 17-db0079ng | |
| Baldur's Gate 3 - 1920x1080 Ultra Preset AA:T | |
| Eurocom Raptor X17 Core i9-14900HX | |
| Średnia w klasie Gaming (37.2 - 246, n=111, ostatnie 2 lata) | |
| Schenker XMG Neo 17 E24 | |
| GTA V - 1920x1080 Highest AA:4xMSAA + FX AF:16x | |
| Eurocom Raptor X17 Core i9-14900HX | |
| Schenker XMG Neo 17 E24 | |
| Schenker Neo 17 2024 Engineering Sample | |
| Medion Erazer Beast X40 2024 | |
| Średnia w klasie Gaming (12.1 - 186.9, n=128, ostatnie 2 lata) | |
| HP Omen 17-db0079ng | |
| MSI GE78HX 13VH-070US | |
| Final Fantasy XV Benchmark - 1920x1080 High Quality | |
| Schenker Neo 17 2024 Engineering Sample | |
| Medion Erazer Beast X40 2024 | |
| Schenker XMG Neo 17 E24 | |
| MSI GE78HX 13VH-070US | |
| Średnia w klasie Gaming (19.2 - 215, n=140, ostatnie 2 lata) | |
| HP Omen 17-db0079ng | |
| Strange Brigade - 1920x1080 ultra AA:ultra AF:16 | |
| Eurocom Raptor X17 Core i9-14900HX | |
| Schenker Neo 17 2024 Engineering Sample | |
| Medion Erazer Beast X40 2024 | |
| Schenker XMG Neo 17 E24 | |
| Średnia w klasie Gaming (38.9 - 456, n=128, ostatnie 2 lata) | |
| MSI GE78HX 13VH-070US | |
| HP Omen 17-db0079ng | |
| Dota 2 Reborn - 1920x1080 ultra (3/3) best looking | |
| Eurocom Raptor X17 Core i9-14900HX | |
| Medion Erazer Beast X40 2024 | |
| Schenker Neo 17 2024 Engineering Sample | |
| Schenker XMG Neo 17 E24 | |
| Średnia w klasie Gaming (65.1 - 248, n=143, ostatnie 2 lata) | |
| MSI GE78HX 13VH-070US | |
| HP Omen 17-db0079ng | |
| X-Plane 11.11 - 1920x1080 high (fps_test=3) | |
| Eurocom Raptor X17 Core i9-14900HX | |
| Medion Erazer Beast X40 2024 | |
| Schenker XMG Neo 17 E24 | |
| MSI GE78HX 13VH-070US | |
| Schenker Neo 17 2024 Engineering Sample | |
| Średnia w klasie Gaming (33.4 - 150.2, n=146, ostatnie 2 lata) | |
| HP Omen 17-db0079ng | |
Cyberpunk 2077 Ultra FPS chart
| low | med. | high | ultra | QHD DLSS | QHD | 4K | |
|---|---|---|---|---|---|---|---|
| GTA V (2015) | 181.7 | 143.4 | 135.1 | 163.7 | |||
| Dota 2 Reborn (2015) | 220 | 197.1 | 194 | 179.7 | |||
| Final Fantasy XV Benchmark (2018) | 226 | 215 | 173.9 | 134.4 | |||
| X-Plane 11.11 (2018) | 202 | 176.8 | 138.9 | ||||
| Far Cry 5 (2018) | 179 | 162 | 157 | ||||
| Strange Brigade (2018) | 381 | 347 | 239 | 122 | |||
| Shadow of the Tomb Raider (2018) | 212 | 176 | |||||
| Far Cry 6 (2021) | 156 | 141 | |||||
| F1 23 (2023) | 321 | 111.6 | 70.7 | 35.5 | |||
| Baldur's Gate 3 (2023) | 231 | 143 | 122.2 | 111.8 | 88.3 | ||
| Cyberpunk 2077 (2023) | 101.1 | 146.9 | 133.8 | 121.3 | 110.1 | 80.7 | |
| Assassin's Creed Mirage (2023) | 197 | 153 | 129 | ||||
| Call of Duty Modern Warfare 3 2023 (2023) | 180 | 171 | 123 | ||||
| Avatar Frontiers of Pandora (2023) | 125 | 97 | 66 | ||||
| F1 24 (2024) | 304 | 323 | 289 | 112.2 | 71.2 |
Emisje i energia
Emisja hałasu
Chłodzenie z dwoma wentylatorami jest w zasadzie takie samo jak w zeszłorocznym modelu, ale konfiguracje Neo 17 z laptopem RTX 4080/4090 oferują zmodyfikowany kanał do chłodzenia wodnego, który teraz biegnie również bezpośrednio nad procesorem. Wentylatory zawsze działają, ale podczas bardzo prostych zadań (surfowanie po Internecie, e-maile, filmy) słychać tylko bardzo niski poziom hałasu. Jednak podczas grania robi się znacznie głośniej, osiągając 52 dB(A). Chociaż istnieją głośniejsi konkurenci, nadal należy używać słuchawek podczas grania. Podczas testów porównawczych / gier słychać było również lekki szum cewki.
Hałas
| luz |
| 28.1 / 28.1 / 28.1 dB |
| HDD |
| 0 dB |
| obciążenie |
| 43.1 / 51.9 dB |
 | ||
30 dB cichy 40 dB(A) słyszalny 50 dB(A) irytujący |
||
min: | ||
| Schenker XMG Neo 17 E24 GeForce RTX 4080 Laptop GPU, i9-14900HX, Samsung 990 Pro 1 TB | Medion Erazer Beast X40 2024 GeForce RTX 4090 Laptop GPU, i9-14900HX, Phison E18-1TB-PHISON-SSD-BICS5 | HP Omen 17-db0079ng GeForce RTX 4070 Laptop GPU, R7 8845HS, WD PC SN560 SDDPNQE-1T00 | Eurocom Raptor X17 Core i9-14900HX GeForce RTX 4090 Laptop GPU, i9-14900HX, Corsair MP700 Pro 2TB | MSI GE78HX 13VH-070US GeForce RTX 4080 Laptop GPU, i9-13950HX, Samsung PM9A1 MZVL22T0HBLB | |
|---|---|---|---|---|---|
| Noise | -6% | -2% | -7% | -0% | |
| wyłączone / środowisko * (dB) | 23.3 | 25 -7% | 25 -7% | 23.7 -2% | 23.4 -0% |
| Idle Minimum * (dB) | 28.1 | 28 -0% | 25 11% | 31.7 -13% | 24.2 14% |
| Idle Average * (dB) | 28.1 | 29 -3% | 29 -3% | 31.7 -13% | 25.6 9% |
| Idle Maximum * (dB) | 28.1 | 32 -14% | 33 -17% | 32.9 -17% | 31 -10% |
| Load Average * (dB) | 43.1 | 48 -11% | 45 -4% | 34 21% | 43.3 -0% |
| Cyberpunk 2077 ultra * (dB) | 51.9 | 48 8% | |||
| Load Maximum * (dB) | 51.9 | 52 -0% | 52 -0% | 61.6 -19% | 59.1 -14% |
| Witcher 3 ultra * (dB) | 50 | 61.6 | 56.3 |
* ... im mniej tym lepiej
Temperatura
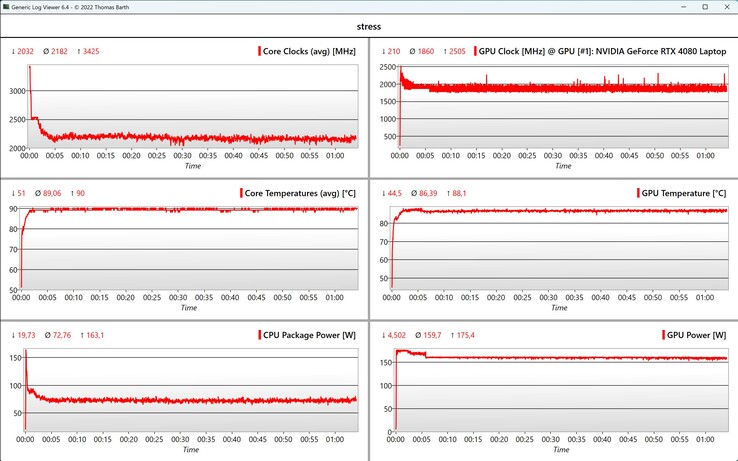
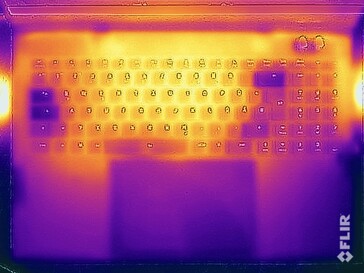
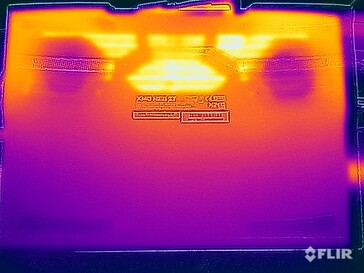
Schenker wykorzystuje interfejs termiczny z ciekłego metalu zarówno dla CPU, jak i GPU w konfiguracjach od laptopa RTX 4080 w górę. Temperatury obudowy pozostają chłodne podczas prostych zadań, ale zmierzyliśmy ponad 50 °C na spodzie w niektórych punktach pod obciążeniem. Jednak ze względu na swój rozmiar, Neo 17 nie będzie umieszczony na Państwa udach, więc te wartości nie są problematyczne. Obszar klawiatury również nagrzewa się zauważalnie, ale nie ma tutaj żadnych ograniczeń. W teście obciążeniowym karta graficzna ustabilizowała się na poziomie 160 W, a procesor na około 70 W.
(-) Maksymalna temperatura w górnej części wynosi 46.2 °C / 115 F, w porównaniu do średniej 40.4 °C / 105 F , począwszy od 21.2 do 68.8 °C dla klasy Gaming.
(-) Dno nagrzewa się maksymalnie do 56.7 °C / 134 F, w porównaniu do średniej 43.3 °C / 110 F
(+) W stanie bezczynności średnia temperatura górnej części wynosi 28.2 °C / 83 F, w porównaniu ze średnią temperaturą urządzenia wynoszącą 33.9 °C / ### class_avg_f### F.
(-) 3: The average temperature for the upper side is 39.8 °C / 104 F, compared to the average of 33.9 °C / 93 F for the class Gaming.
(+) Podparcia dłoni i touchpad osiągają maksymalną temperaturę skóry (33.5 °C / 92.3 F) i dlatego nie są gorące.
(-) Średnia temperatura obszaru podparcia dłoni w podobnych urządzeniach wynosiła 28.9 °C / 84 F (-4.6 °C / -8.3 F).
| Schenker XMG Neo 17 E24 Intel Core i9-14900HX, NVIDIA GeForce RTX 4080 Laptop GPU | Medion Erazer Beast X40 2024 Intel Core i9-14900HX, NVIDIA GeForce RTX 4090 Laptop GPU | HP Omen 17-db0079ng AMD Ryzen 7 8845HS, NVIDIA GeForce RTX 4070 Laptop GPU | Eurocom Raptor X17 Core i9-14900HX Intel Core i9-14900HX, NVIDIA GeForce RTX 4090 Laptop GPU | MSI GE78HX 13VH-070US Intel Core i9-13950HX, NVIDIA GeForce RTX 4080 Laptop GPU | |
|---|---|---|---|---|---|
| Heat | 1% | 14% | 1% | 10% | |
| Maximum Upper Side * (°C) | 46.2 | 47 -2% | 44 5% | 52.2 -13% | 37.4 19% |
| Maximum Bottom * (°C) | 56.7 | 54 5% | 45 21% | 53.2 6% | 45 21% |
| Idle Upper Side * (°C) | 29.8 | 30 -1% | 26 13% | 28.6 4% | 29.8 -0% |
| Idle Bottom * (°C) | 32 | 32 -0% | 27 16% | 29.8 7% | 32.4 -1% |
* ... im mniej tym lepiej
Głośnik
Głośniki stereo nie są szczególnie dobre, ale wystarczają do okazjonalnego oglądania filmów na YouTube. Jednak głośniki i tak nie są przydatne w grach ze względu na głośne wentylatory.
Schenker XMG Neo 17 E24 analiza dźwięku
(+) | głośniki mogą odtwarzać stosunkowo głośno (83.7 dB)
Bas 100 - 315 Hz
(-) | prawie brak basu - średnio 19% niższa od mediany
(+) | bas jest liniowy (6% delta do poprzedniej częstotliwości)
Średnie 400 - 2000 Hz
(±) | wyższe średnie - średnio 6.6% wyższe niż mediana
(±) | liniowość środka jest średnia (9.4% delta do poprzedniej częstotliwości)
Wysokie 2–16 kHz
(+) | zrównoważone maksima - tylko 3.6% od mediany
(±) | liniowość wysokich wartości jest średnia (7.1% delta do poprzedniej częstotliwości)
Ogólnie 100 - 16.000 Hz
(±) | liniowość ogólnego dźwięku jest średnia (18.3% różnicy w stosunku do mediany)
W porównaniu do tej samej klasy
» 58% wszystkich testowanych urządzeń w tej klasie było lepszych, 8% podobnych, 34% gorszych
» Najlepszy miał deltę 6%, średnia wynosiła ###średnia###%, najgorsza wynosiła 132%
W porównaniu do wszystkich testowanych urządzeń
» 39% wszystkich testowanych urządzeń było lepszych, 8% podobnych, 53% gorszych
» Najlepszy miał deltę 4%, średnia wynosiła ###średnia###%, najgorsza wynosiła 134%
Medion Erazer Beast X40 2024 analiza dźwięku
(+) | głośniki mogą odtwarzać stosunkowo głośno (88 dB)
Bas 100 - 315 Hz
(±) | zredukowany bas - średnio 14.7% niższy od mediany
(±) | liniowość basu jest średnia (7.2% delta do poprzedniej częstotliwości)
Średnie 400 - 2000 Hz
(+) | zbalansowane środki średnie - tylko 3.7% od mediany
(+) | średnie są liniowe (5.8% delta do poprzedniej częstotliwości)
Wysokie 2–16 kHz
(+) | zrównoważone maksima - tylko 2.8% od mediany
(+) | wzloty są liniowe (6.4% delta do poprzedniej częstotliwości)
Ogólnie 100 - 16.000 Hz
(+) | ogólny dźwięk jest liniowy (12.1% różnicy w stosunku do mediany)
W porównaniu do tej samej klasy
» 12% wszystkich testowanych urządzeń w tej klasie było lepszych, 4% podobnych, 84% gorszych
» Najlepszy miał deltę 6%, średnia wynosiła ###średnia###%, najgorsza wynosiła 132%
W porównaniu do wszystkich testowanych urządzeń
» 9% wszystkich testowanych urządzeń było lepszych, 2% podobnych, 89% gorszych
» Najlepszy miał deltę 4%, średnia wynosiła ###średnia###%, najgorsza wynosiła 134%
HP Omen 17-db0079ng analiza dźwięku
(±) | głośność głośnika jest średnia, ale dobra (80 dB)
Bas 100 - 315 Hz
(-) | prawie brak basu - średnio 19.1% niższa od mediany
(±) | liniowość basu jest średnia (10.3% delta do poprzedniej częstotliwości)
Średnie 400 - 2000 Hz
(+) | zbalansowane środki średnie - tylko 1.9% od mediany
(+) | średnie są liniowe (4.4% delta do poprzedniej częstotliwości)
Wysokie 2–16 kHz
(+) | zrównoważone maksima - tylko 3.8% od mediany
(±) | liniowość wysokich wartości jest średnia (7.8% delta do poprzedniej częstotliwości)
Ogólnie 100 - 16.000 Hz
(+) | ogólny dźwięk jest liniowy (14.3% różnicy w stosunku do mediany)
W porównaniu do tej samej klasy
» 26% wszystkich testowanych urządzeń w tej klasie było lepszych, 7% podobnych, 67% gorszych
» Najlepszy miał deltę 6%, średnia wynosiła ###średnia###%, najgorsza wynosiła 132%
W porównaniu do wszystkich testowanych urządzeń
» 17% wszystkich testowanych urządzeń było lepszych, 4% podobnych, 79% gorszych
» Najlepszy miał deltę 4%, średnia wynosiła ###średnia###%, najgorsza wynosiła 134%
Eurocom Raptor X17 Core i9-14900HX analiza dźwięku
(±) | głośność głośnika jest średnia, ale dobra (74.2 dB)
Bas 100 - 315 Hz
(±) | zredukowany bas - średnio 13.4% niższy od mediany
(±) | liniowość basu jest średnia (10.1% delta do poprzedniej częstotliwości)
Średnie 400 - 2000 Hz
(±) | wyższe średnie - średnio 6.6% wyższe niż mediana
(±) | liniowość środka jest średnia (8.6% delta do poprzedniej częstotliwości)
Wysokie 2–16 kHz
(+) | zrównoważone maksima - tylko 2% od mediany
(±) | liniowość wysokich wartości jest średnia (8.5% delta do poprzedniej częstotliwości)
Ogólnie 100 - 16.000 Hz
(±) | liniowość ogólnego dźwięku jest średnia (24% różnicy w stosunku do mediany)
W porównaniu do tej samej klasy
» 86% wszystkich testowanych urządzeń w tej klasie było lepszych, 4% podobnych, 10% gorszych
» Najlepszy miał deltę 6%, średnia wynosiła ###średnia###%, najgorsza wynosiła 132%
W porównaniu do wszystkich testowanych urządzeń
» 71% wszystkich testowanych urządzeń było lepszych, 6% podobnych, 22% gorszych
» Najlepszy miał deltę 4%, średnia wynosiła ###średnia###%, najgorsza wynosiła 134%
MSI GE78HX 13VH-070US analiza dźwięku
(+) | głośniki mogą odtwarzać stosunkowo głośno (84.4 dB)
Bas 100 - 315 Hz
(±) | zredukowany bas - średnio 8.3% niższy od mediany
(±) | liniowość basu jest średnia (9.3% delta do poprzedniej częstotliwości)
Średnie 400 - 2000 Hz
(±) | wyższe średnie - średnio 6.8% wyższe niż mediana
(+) | średnie są liniowe (3.4% delta do poprzedniej częstotliwości)
Wysokie 2–16 kHz
(+) | zrównoważone maksima - tylko 2% od mediany
(+) | wzloty są liniowe (2.6% delta do poprzedniej częstotliwości)
Ogólnie 100 - 16.000 Hz
(+) | ogólny dźwięk jest liniowy (12% różnicy w stosunku do mediany)
W porównaniu do tej samej klasy
» 12% wszystkich testowanych urządzeń w tej klasie było lepszych, 4% podobnych, 84% gorszych
» Najlepszy miał deltę 6%, średnia wynosiła ###średnia###%, najgorsza wynosiła 132%
W porównaniu do wszystkich testowanych urządzeń
» 9% wszystkich testowanych urządzeń było lepszych, 2% podobnych, 89% gorszych
» Najlepszy miał deltę 4%, średnia wynosiła ###średnia###%, najgorsza wynosiła 134%
Zużycie energii
Maksymalny pobór mocy w trybie bezczynności wynoszący 13 W jest bardzo niski jak na duży 17-calowy notebook. Podczas grania wynosi on jednak około 300 watów, co nie jest zaskakujące, biorąc pod uwagę wysokie wartości TDP/TGP. Dostarczony 330-watowy zasilacz jest odpowiednio zwymiarowany. Zużycie energii w trybie czuwania na poziomie 2,1 W jest jednak zbyt wysokie.
| wyłączony / stan wstrzymania | |
| luz | |
| obciążenie |
|
Legenda:
min: | |
Power consumption Cyberpunk / Stresstest
Power consumption with external monitor
Żywotność baterii
Neo 17 jest wyposażony w baterię o pojemności 99 Wh, która osiąga przyzwoity czas pracy wynoszący około 6 godzin w trybie WLAN przy 150 cd/m² (58% maksymalnej jasności testowanego urządzenia). Stawia to dużego gracza w połowie stawki w porównaniu do konkurencji. Pełne ładowanie przy włączonym urządzeniu trwa 107 minut, przy czym 80% baterii jest ponownie dostępne po około 45 minutach.
Ogólna ocena Notebookcheck
XMG Neo 17 wyraźnie koncentruje się na wydajności w grach, a wydajność jest bardzo dobra. Dzięki opcjonalnemu chłodzeniu wodnemu, temperatury, a tym samym hałas wentylatora, można ponownie znacznie zmniejszyć. Matowy panel QHD z 240 Hz i krótkim czasem reakcji jest również bardzo odpowiedni do gier.
Schenker XMG Neo 17 E24
- 27/11/2024 v8
Andreas Osthoff
Przezroczystość
Wyboru urządzeń do recenzji dokonuje nasza redakcja. Próbka testowa została udostępniona autorowi jako pożyczka od producenta lub sprzedawcy detalicznego na potrzeby tej recenzji. Pożyczkodawca nie miał wpływu na tę recenzję, producent nie otrzymał też kopii tej recenzji przed publikacją. Nie było obowiązku publikowania tej recenzji. Jako niezależna firma medialna, Notebookcheck nie podlega władzy producentów, sprzedawców detalicznych ani wydawców.
Tak testuje Notebookcheck
Każdego roku Notebookcheck niezależnie sprawdza setki laptopów i smartfonów, stosując standardowe procedury, aby zapewnić porównywalność wszystkich wyników. Od około 20 lat stale rozwijamy nasze metody badawcze, ustanawiając przy tym standardy branżowe. W naszych laboratoriach testowych doświadczeni technicy i redaktorzy korzystają z wysokiej jakości sprzętu pomiarowego. Testy te obejmują wieloetapowy proces walidacji. Nasz kompleksowy system ocen opiera się na setkach uzasadnionych pomiarów i benchmarków, co pozwala zachować obiektywizm.
















 Total Sustainability Score: