Notebookcheck Logo
Teaser

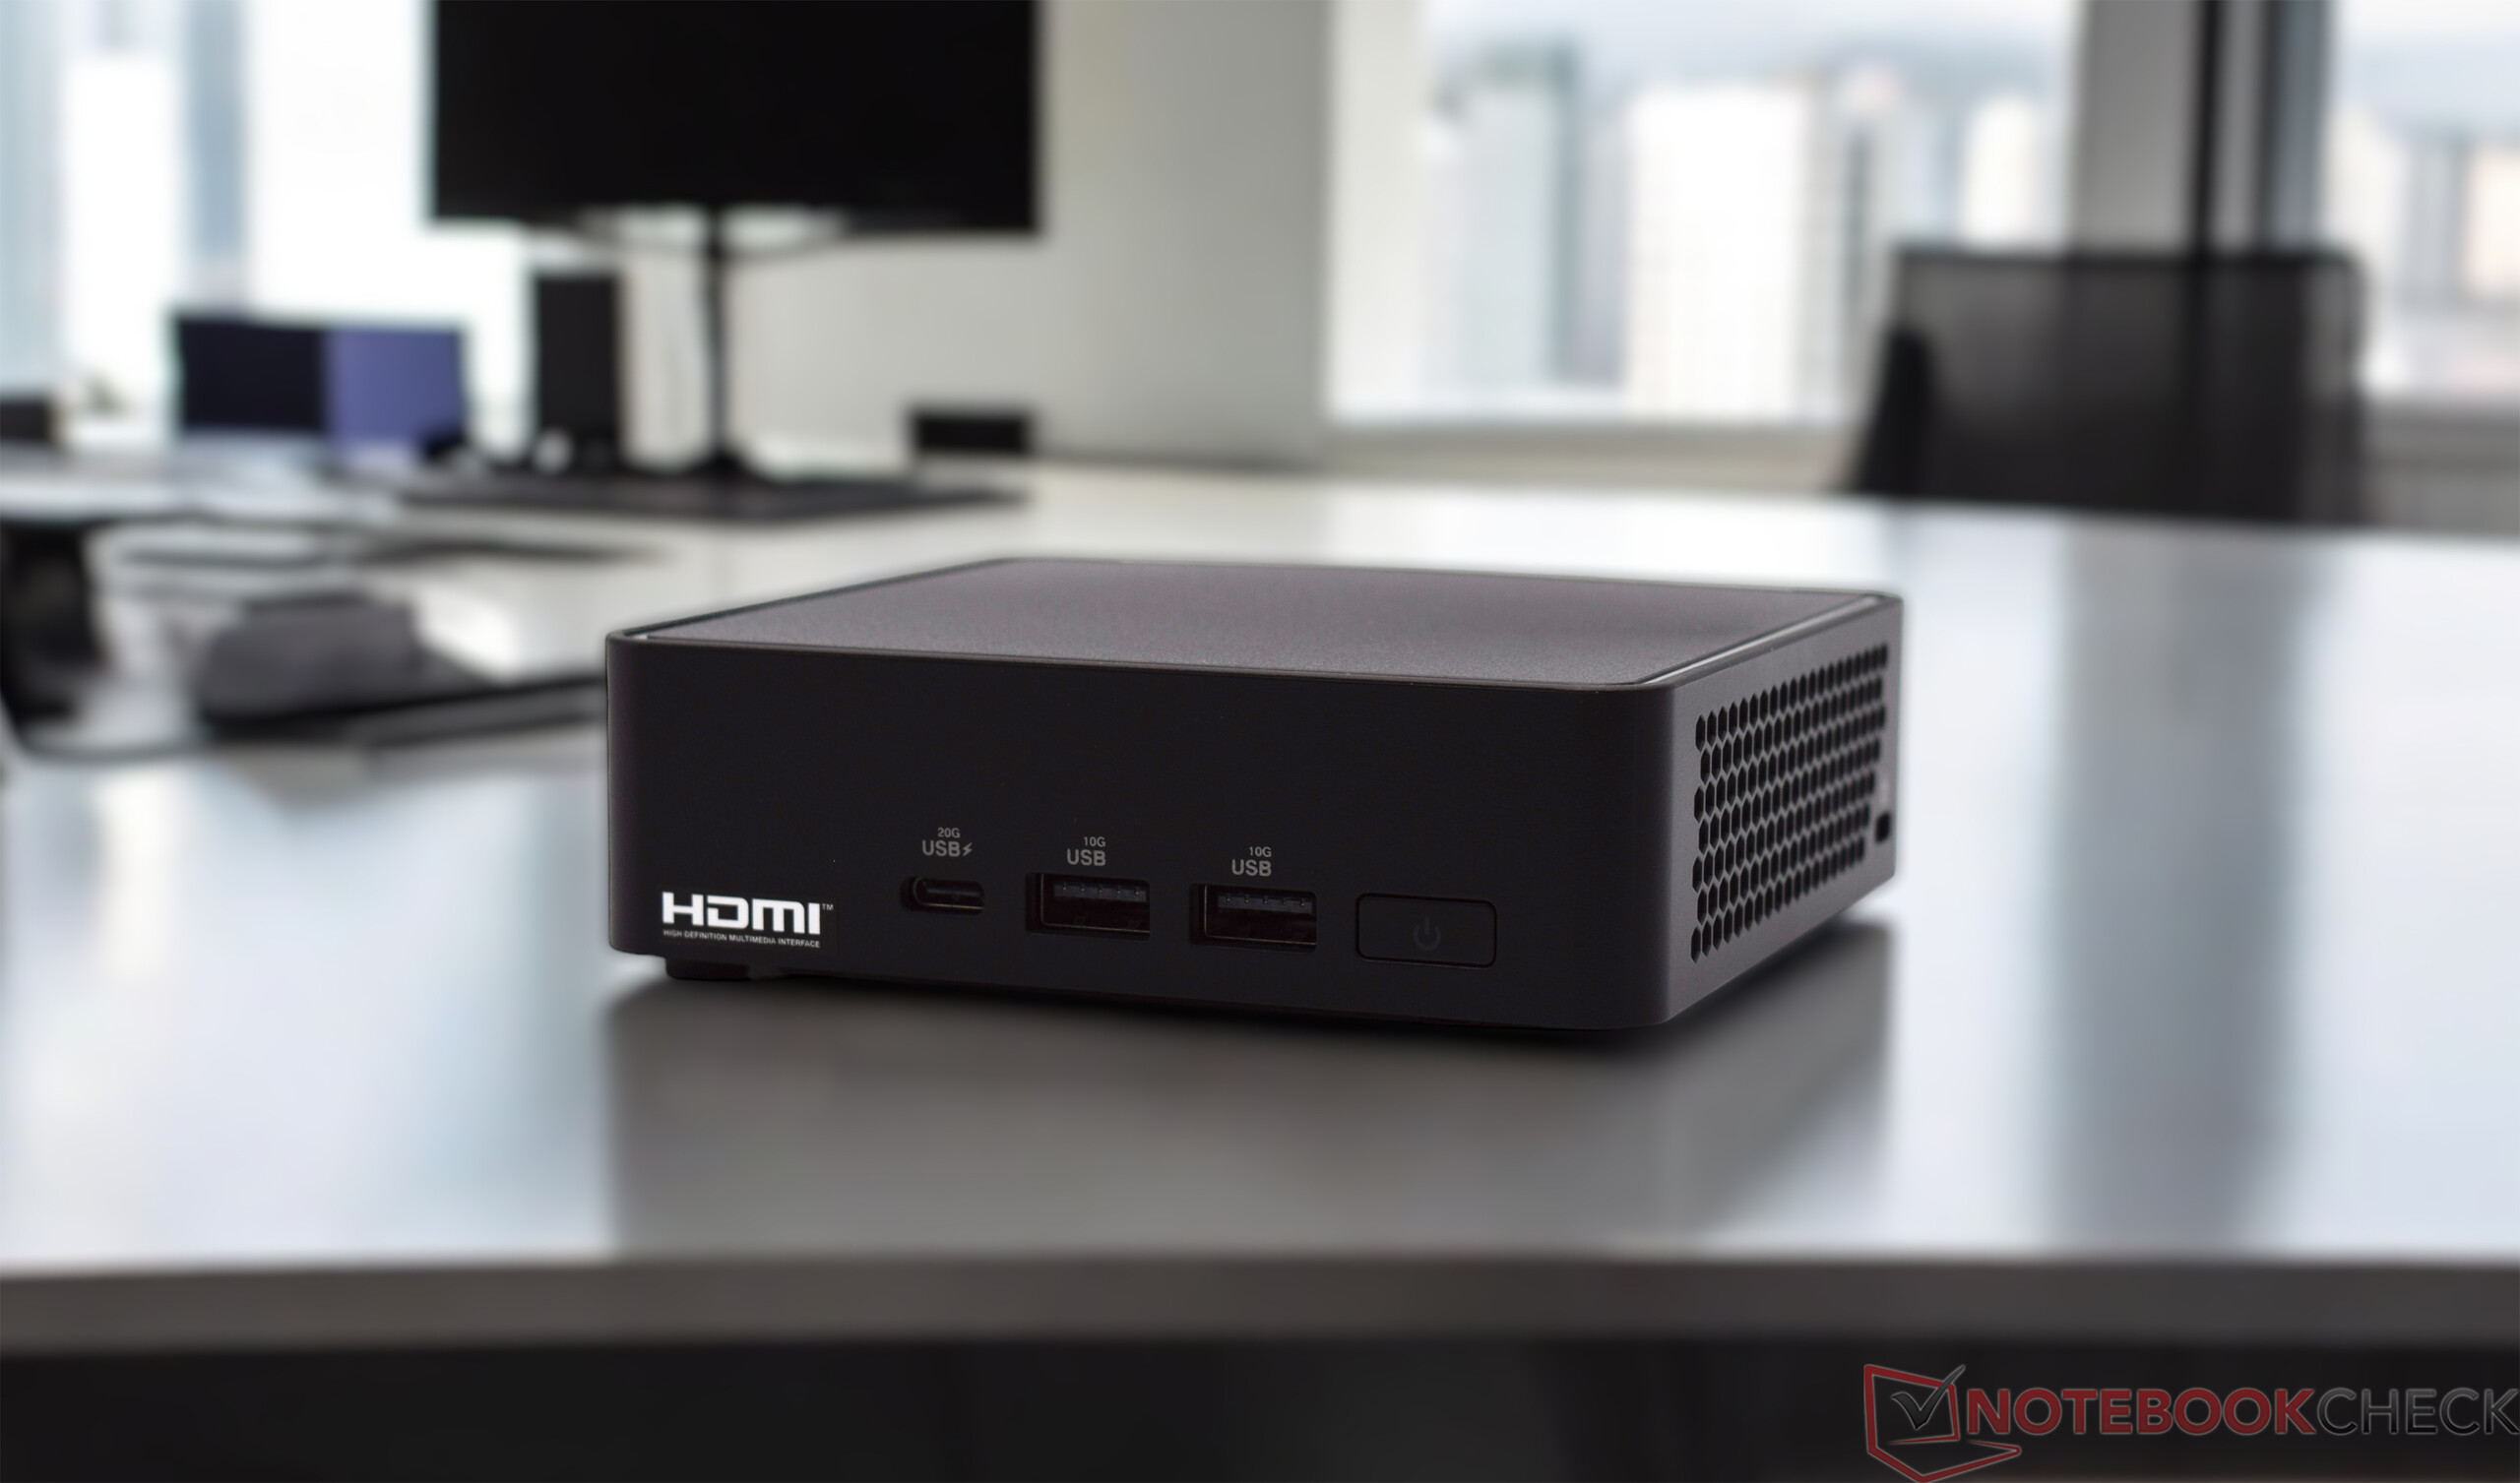
Recenzja Asus NUC 14 Pro: NUC mini PC z procesorem Intel Core Ultra 5 125H, szybką kartą graficzną Intel Arc iGPU i 2x Thunderbolt 4

Nie jest to wizualna atrakcja!

Asus przejął dział NUC Intela i oferuje teraz popularne mini PC z procesorami Intel Meteor Lake. Zapewnia to nie tylko większą moc obliczeniową małych komputerów stacjonarnych, ale może również znacznie zwiększyć wydajność 3D dzięki ulepszonemu iGPU. Szczegółowo przetestowaliśmy Asus NUC 14 Pro z procesorem Intel Core Ultra 5 125H i oceniliśmy jego wydajność na podstawie licznych pomiarów i testów porównawczych.
Sebastian Bade, 👁 Sebastian Bade (tłumaczenie DeepL / Ninh Duy) Published 🇺🇸 🇩🇪 ...
Mini PC Desktop Intel 3D Printing Meteor Lake Thunderbolt

Seria NUC (Next Unit of Computing), zapoczątkowana niegdyś przez Intela, została przejęta przez Asusa. Asus oferuje teraz znane modele w tym samym stylu, chociaż wprowadzane są również nowsze urządzenia. Oparte na platformie Intel Meteor Lake, kompaktowe komputery otrzymują więcej mocy, a przede wszystkim korzystają z ulepszonego iGPU z architekturą Arc. Asus NUC 14 Pro jest dostępny z różnymi procesorami i jak zwykle w płaskiej i nieco grubszej wersji, która oferuje dodatkowe miejsce na 2,5-calowy dysk. Przetestowaliśmy Asus NUC 14 Pro w wersji slim z procesorem Intel Core Ultra 5 125H. Urządzenie dotarło do nas jako barebone, co oznaczało, że przed testami musieliśmy zainstalować pamięć RAM i dysk SSD. System operacyjny również nie wchodzi w zakres dostawy. Za naszą próbkę testową trzeba wyłożyć nieco ponad 500 euro. W porównaniu do konkurentów jest to dużo, jeśli weźmiemy pod uwagę dodatkowe koszty związane z opcją barebone. W porównaniu do innych marek, Asus jest bardziej znany i oferuje lepsze wsparcie.

Konkurenci, z którymi zestawiliśmy Asus NUC 14 Pro, są wymienieni w poniższej tabeli.

Asus NUC 14 Pro
Procesor
Intel Core Ultra 5 125H 14 x 3.6 - 4.5 GHz, 64 W PL2 / Short Burst, 64 W PL1 / Sustained, Meteor Lake-H
Karta grafiki
Intel Arc 7-Core iGPU, rdzeń: 2200 MHz, 32.0.101.5762 DCH
Chipset
Intel Meteor Lake-U/P/H PCH
Dysk twardy
Kingston KC3000 2048G SKC3000D2048G, 2048 GB 
, 1750 GB wolne miejsce
Karta dźwiękowa
Intel Meteor Lake-U/P/H PCH - cAVS (Audio, Voice, Speech)
Złącza
1 USB 2.0, 3 USB 3.0, 1 USB 3.2 Gen 2x2 20Gbps, 2 USB 4.0 40 Gbps, 2 Thunderbolt, USB-C Power Delivery (PD), 2 HDMI, 2 DisplayPort, 1 blokada Kensingtona
Łączność
Intel Ethernet Controller I226-V (10/2500MBit/s), Intel Wi-Fi 6E AX211 (a/b/g/h/n = Wi-Fi 4/ac = Wi-Fi 5/ax = Wi-Fi 6/ Wi-Fi 6E 6 GHz), Bluetooth 5.3
Gabaryty
wysokość x szerokość x głębokość (mm): 37 x 117 x 112
Inne
120W power adapter, VESA-Mount, 36 miesiące(y) gwarancji
Waga
525 g, zasilacz: 238 g
Cena
500 EUR
Note: The manufacturer may use components from different suppliers including display panels, drives or memory sticks with similar specifications.


Potencjalni konkurenci w porównaniu

Rating
Version
Date
Model
Weight
Height
Price
74.7 %v8
08/2024
Asus NUC 14 Pro
Ultra 5 125H, Arc 7-Core
525 g37 mm
78 %v8
07/2024
Geekom AE7
R9 7940HS, Radeon 780M
578 g49.2 mm
74.5 %v8
07/2024
Minisforum UH125 Pro
Ultra 5 125H, Arc 7-Core
797 g49 mm
73.7 %v8
Aoostar GEM10
R7 6800H, Radeon 680M
525 g60 mm
83.4 %
v7 (old)
v7 (old)
04/2024
Acemagic F2A
Ultra 7 155H, Arc 8-Core
768 g57 mm
81.2 %
v7 (old)
v7 (old)
10/2023
Geekom A5
R7 5800H, Vega 8
555 g49.2 mm

Uwaga: Zaktualizowaliśmy nasz system oceniania i wyniki wersji 8 nie są porównywalne z wynikami wersji 7 dostępnej tutaj.

Asus NUC 14 Pro
Asus NUC 14 Pro
Asus NUC 14 Pro
Asus NUC 14 Pro
Asus NUC 14 Pro
Asus NUC 14 Pro
Asus NUC 14 Pro
Asus NUC 14 Pro
Asus NUC 14 Pro
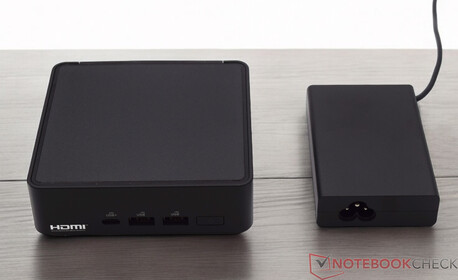
Asus NUC 14 Pro z zasilaczem (19 V; 6,32 A)
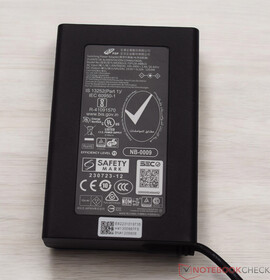
Zasilacz (19 V; 6,32 A)

Obudowa - czarna plastikowa obudowa zakrywająca metalową klatkę

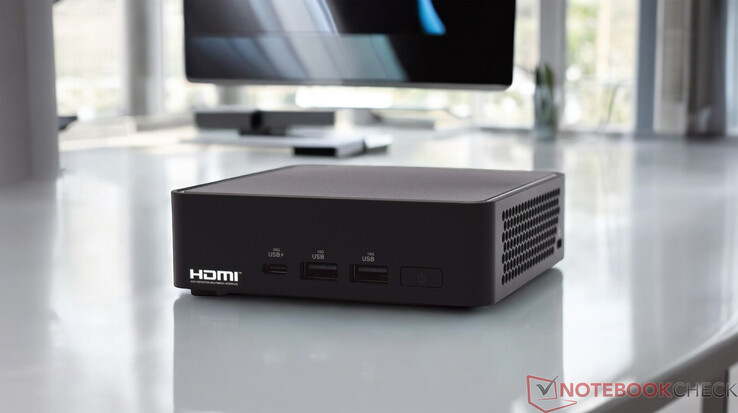
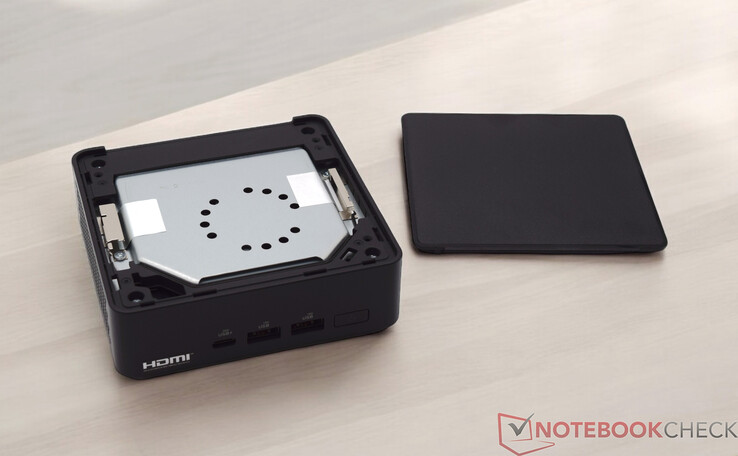
Wizualnie, Asus NUC 14 Pro przypomina zestaw Zestaw Intel NUC 12 Pro chociaż konstrukcja została nieco zmieniona. Wybór materiałów jest jednak taki sam. Podstawowa koncepcja również pozostała niezmieniona, ponieważ czarny plastik skrywa solidną metalową ramę. Pod względem dotykowym Asus NUC 14 Pro jest gorszy od Mini PC, które opierają się na aluminiowej obudowie. Jako wizualny element przyciągający wzrok, urządzenie Asusa również nie jest przekonujące, jeśli jest to dla Państwa ważne. Wykonanie nie daje jednak powodów do krytyki. Z drugiej strony spód został przeprojektowany i zawiera mechaniczną blokadę do otwierania urządzenia bez użycia narzędzi. Smukła wersja, którą tutaj testowaliśmy, ma bardzo płaską konstrukcję o wysokości 37 milimetrów. Dzięki niemal kwadratowej powierzchni 11,7 x 11,2 centymetra, urządzenie zajmuje niewiele miejsca na biurku. Dostarczony uchwyt VESA umożliwia również montaż na monitorze.

Porównanie rozmiarów

146 mm 146 mm 57 mm 768 g145 mm 145 mm 49 mm 797 g107 mm 107 mm 60 mm 525 g117 mm 112 mm 49.2 mm 578 g117 mm 112 mm 49.2 mm 555 g117 mm 112 mm 37 mm 525 g210 mm 148 mm 1 mm 2.9 g

Sprzęt

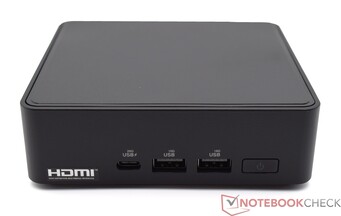
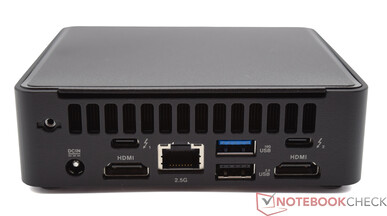
Asus NUC 14 Pro Mini PC oferuje wiele interfejsów pomimo swojej kompaktowej konstrukcji. Do dyspozycji użytkownika oddano łącznie sześć portów USB, z czego cztery to powszechnie używane gniazda typu A, a dwa pozostałe to gniazda typu C. Te ostatnie oferują również pełną obsługę Thunderbolt. To odróżnia Asus NUC 14 Pro od innych mini PC, które często oferują tylko proste porty USB 4 lub konwencjonalne porty Type-C. Dostępne są również dwa porty HDMI i połączenie sieciowe 2,5G.

Przód: 1x USB 3.2 Gen2x2 Type-C, 2 x USB 3.2 Gen2 Type-A
Panel tylny: Złącze zasilania, 2x Thunderbold (typ C), 1x USB 3.2, 1x USB 2.0, LAN 2.5G, 2x HDMI 2.1

Komunikacja

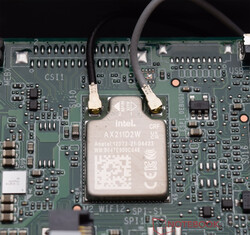
Moduł WLAN
Moduł WLAN

Asus wyposaża NUC 14 Pro w moduł Intel Wi-Fi 6E AX211, który zapewnia doskonałe wyniki w teście. W połączeniu z routerem ASUS ROG Rapture GT-AXE11000 udokumentowaliśmy konsekwentnie lepsze wyniki niż w przypadku urządzeń porównawczych.

Networking
iperf3 receive AXE11000 6GHz
Acemagic F2A
Intel Wi-Fi 7 BE200 320MHz
1770 (1584min - 1790max) MBit/s +2%
Minisforum UH125 Pro
Intel Wi-Fi 6E AX210
1755 (1737min - 1766max) MBit/s +2%
Asus NUC 14 Pro
Intel Wi-Fi 6E AX211
1729 (1594min - 1755max) MBit/s
Geekom AE7
MediaTek Wi-Fi 6E MT7922 160MHz Wireless LAN Card
1528 (1495min - 1552max) MBit/s -12%
Average Intel Wi-Fi 6E AX211
  (700 - 1857, n=216)
1494 MBit/s -14%
Average of class Mini PC
  (684 - 1771, n=57, last 2 years)
1390 MBit/s -20%
iperf3 transmit AXE11000 6GHz
Geekom AE7
MediaTek Wi-Fi 6E MT7922 160MHz Wireless LAN Card
1699 (1590min - 1792max) MBit/s +23%
Acemagic F2A
Intel Wi-Fi 7 BE200 320MHz
1615 (767min - 1670max) MBit/s +17%
Minisforum UH125 Pro
Intel Wi-Fi 6E AX210
1605 (1238min - 1652max) MBit/s +16%
Asus NUC 14 Pro
Intel Wi-Fi 6E AX211
1379 (1299min - 1425max) MBit/s
Average Intel Wi-Fi 6E AX211
  (385 - 1851, n=216)
1368 MBit/s -1%
Average of class Mini PC
  (394 - 1800, n=57, last 2 years)
1334 MBit/s -3%
iperf3 receive AXE11000
Average Intel Wi-Fi 6E AX211
  (582 - 1890, n=246)
1383 MBit/s 0%
Asus NUC 14 Pro
Intel Wi-Fi 6E AX211
1379 (1016min - 1613max) MBit/s
Average of class Mini PC
  (349 - 1796, n=111, last 2 years)
953 MBit/s -31%
Geekom A5
Realtek RTL8852BE
946 (856min - 970max) MBit/s -31%
Minisforum UH125 Pro
Intel Wi-Fi 6E AX210
936 (907min - 946max) MBit/s -32%
Acemagic F2A
Intel Wi-Fi 7 BE200 320MHz
838 (728min - 926max) MBit/s -39%
Geekom AE7
MediaTek Wi-Fi 6E MT7922 160MHz Wireless LAN Card
707 (631min - 811max) MBit/s -49%
Aoostar GEM10
Intel Wi-Fi 6 AX200
451 (228min - 466max) MBit/s -67%
iperf3 transmit AXE11000
Asus NUC 14 Pro
Intel Wi-Fi 6E AX211
1331 (1187min - 1442max) MBit/s
Average Intel Wi-Fi 6E AX211
  (64 - 1921, n=246)
1228 MBit/s -8%
Average of class Mini PC
  (269 - 1776, n=111, last 2 years)
883 MBit/s -34%
Geekom A5
Realtek RTL8852BE
834 (730min - 861max) MBit/s -37%
Minisforum UH125 Pro
Intel Wi-Fi 6E AX210
758 (727min - 793max) MBit/s -43%
Acemagic F2A
Intel Wi-Fi 7 BE200 320MHz
709 (369min - 977max) MBit/s -47%
Geekom AE7
MediaTek Wi-Fi 6E MT7922 160MHz Wireless LAN Card
573 (145min - 972max) MBit/s -57%
Aoostar GEM10
Intel Wi-Fi 6 AX200
429 (325min - 510max) MBit/s -68%
0501001502002503003504004505005506006507007508008509009501000105011001150120012501300135014001450150015501600165017001750Tooltip
Asus NUC 14 Pro Intel Wi-Fi 6E AX211; iperf3 transmit AXE11000 6GHz; iperf 3.1.3: Ø1379 (1299-1425)
Geekom AE7 MediaTek Wi-Fi 6E MT7922 160MHz Wireless LAN Card; iperf3 transmit AXE11000 6GHz; iperf 3.1.3: Ø1700 (1590-1792)
Minisforum UH125 Pro Intel Wi-Fi 6E AX210; iperf3 transmit AXE11000 6GHz; iperf 3.1.3: Ø1605 (1238-1652)
Acemagic F2A Intel Wi-Fi 7 BE200 320MHz; iperf3 transmit AXE11000 6GHz; iperf 3.1.3: Ø1590 (767-1670)
Asus NUC 14 Pro Intel Wi-Fi 6E AX211; iperf3 receive AXE11000 6GHz; iperf 3.1.3: Ø1728 (1594-1755)
Geekom AE7 MediaTek Wi-Fi 6E MT7922 160MHz Wireless LAN Card; iperf3 receive AXE11000 6GHz; iperf 3.1.3: Ø1527 (1495-1552)
Minisforum UH125 Pro Intel Wi-Fi 6E AX210; iperf3 receive AXE11000 6GHz; iperf 3.1.3: Ø1755 (1737-1766)
Acemagic F2A Intel Wi-Fi 7 BE200 320MHz; iperf3 receive AXE11000 6GHz; iperf 3.1.3: Ø1769 (1584-1790)
Asus NUC 14 Pro Intel Wi-Fi 6E AX211; iperf3 receive AXE11000; iperf 3.1.3: Ø1379 (1016-1613)
Geekom AE7 MediaTek Wi-Fi 6E MT7922 160MHz Wireless LAN Card; iperf3 receive AXE11000; iperf 3.1.3: Ø707 (631-811)
Minisforum UH125 Pro Intel Wi-Fi 6E AX210; iperf3 receive AXE11000; iperf 3.1.3: Ø935 (907-946)
Acemagic F2A Intel Wi-Fi 7 BE200 320MHz; iperf3 receive AXE11000; iperf 3.1.3: Ø838 (728-926)
Asus NUC 14 Pro Intel Wi-Fi 6E AX211; iperf3 transmit AXE11000; iperf 3.1.3: Ø1331 (1187-1442)
Geekom AE7 MediaTek Wi-Fi 6E MT7922 160MHz Wireless LAN Card; iperf3 transmit AXE11000; iperf 3.1.3: Ø558 (145-972)
Minisforum UH125 Pro Intel Wi-Fi 6E AX210; iperf3 transmit AXE11000; iperf 3.1.3: Ø758 (727-793)
Acemagic F2A Intel Wi-Fi 7 BE200 320MHz; iperf3 transmit AXE11000; iperf 3.1.3: Ø695 (369-977)

Akcesoria

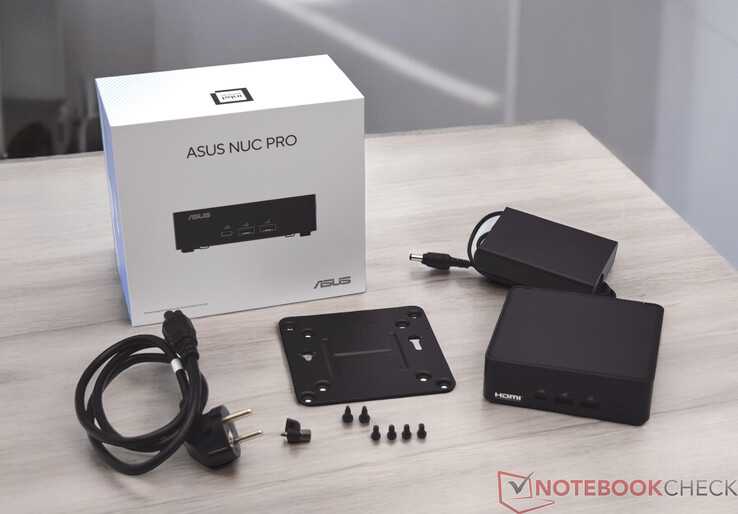
Asus NUC 14 Pro posiada w zestawie 120-watowy zasilacz oraz uchwyt VESA z materiałem montażowym. Producent nie dołącza żadnych innych akcesoriów, takich jak klawiatura czy mysz.

Zakres dostawy Asus NUC 14 Pro

Konserwacja

Asus NUC 14 Pro otrzymaliśmy w wersji barebone, co oznacza, że pamięć RAM, dysk SSD i system operacyjny nie wchodzą w zakres dostawy. W rezultacie ważne jest, aby użytkownik mógł łatwo otworzyć urządzenie, aby samodzielnie zainstalować brakujące komponenty. W przypadku Asus NUC 14 Pro płytę bazową można zdjąć łatwo i bez użycia narzędzi. Producent zintegrował niewielki mechaniczny zatrzask, który to umożliwia: Pamięć RAM i dysk SSD można szybko zainstalować, a następnie mini PC jest gotowy do pierwszego uruchomienia. W urządzeniu można zainstalować dwa dyski SSD, a dla pamięci RAM przewidziano dwa gniazda SO-DIMM. Aby zapewnić optymalne działanie, oba gniazda SO-DIMM powinny być zajęte.

Asus NUC 14 Pro bez pokrywy obudowy
Asus NUC 14 Pro z otwartym spodem
Płytka drukowana z jednostką chłodzącą
Asus NUC 14 Pro rozłożony na części
Asus NUC 14 Pro bez plastikowej obudowy
Pusta plastikowa osłona

Zrównoważony rozwój

Asus NUC 14 Pro to bardzo kompaktowy mini PC, który ma znaczące zalety pod względem zużycia energii w porównaniu do konwencjonalnego komputera stacjonarnego. Urządzenie dostarczane jest w niewielkim pudełku, które nie jest przesadnie duże. Sam mini PC wykonany jest głównie z metalu i plastiku. Nie wiemy, czy w procesie produkcji wykorzystano specjalnie przetworzone materiały. Asus zbiera pochwały za trzyletni okres gwarancyjny.

Wydajność

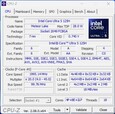
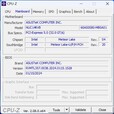
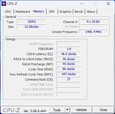
Procesor Intel Core Ultra 5 125H to solidny, ale wydajny SoC średniej klasy z serii Meteor Lake firmy Intel. Duża liczba fizycznych rdzeni obliczeniowych, które SoC ze sobą niesie, ostatecznie zapewnia dobrą wydajność wielowątkową. SoC z serii Meteor Lake wyposażono również w zmodyfikowany układ iGPU, który oferuje zauważalnie wyższą wydajność niż przestarzałe układy iGPU Intel Iris Xe z poprzedniej serii opartej na architekturze Arc. Asus NUC 14 Pro dostępny jest również z nieco słabszym procesorem Intel Core 3 100U, a także nieco mocniejszym wariantem z układem Intel Core Ultra 7 SoC.

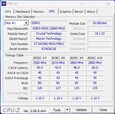
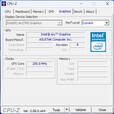
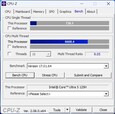
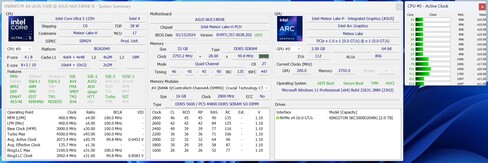
CPU-Z
CPU-Z
CPU-Z
CPU-Z
CPU-Z
CPU-Z
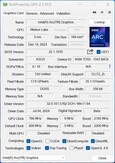
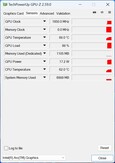
GPU-Z
GPU-Z
HWiNFO

Warunki testu

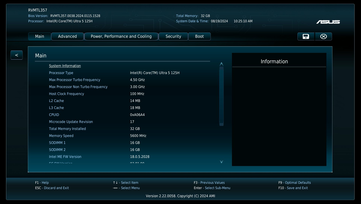
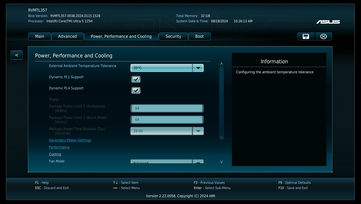
Wszystkie testy wydajności przeprowadziliśmy przy użyciu profilu energetycznego Balanced. Nie zmienialiśmy wydajności SoC i pozostawiliśmy go w domyślnym stanie zgodnie z ustawieniami BIOS-u (Balanced). Ustawienia BIOS-u są bardzo rozbudowane. W porównaniu do Mini-PC z Geekom, Minisforum, czy Acemagic, Asus jest tutaj wyraźnie z przodu. Oprócz zużycia energii przez procesor, można nawet wyłączyć poszczególne porty USB.

Procesor

W naszym przypadku Asus NUC 14 Pro jest zasilany przez procesor Intel Core Ultra 5 125H. 14 rdzeni z łącznie 18 wątkami zapewnia wysoką prędkość pracy, co stawia naszą próbkę testową na dobrym trzecim miejscu. Limit mocy procesora wynosi 64 waty i jest wielokrotnie osiągany przez krótkie okresy. W scenariuszach dłuższego obciążenia SoC dławi się tylko z powodu nadmiernych temperatur. Te przekraczają 100 °C pod obciążeniem i nie są rzadkością. Asus nie wydaje się dalej spowalniać SoC Intela, ponieważ zgodnie ze specyfikacją maksymalna temperatura pracy SoC wynosi 110 °C. Bezpośrednie porównanie z Minisforum UH125 Pro wygrywa nasza próbka testowa od Asusa. W poszczególnych testach Asus NUC 14 Pro ma niewielką przewagę dzięki konsekwentnie lepszej wydajności jednordzeniowej.

W celu uzyskania dalszych porównań i testów porównawczych, proszę odnieść się do naszej Tabela porównawcza procesorów.

Cinebench R15
Cinebench R15
Cinebench R20
Cinebench R20
Cinebench R23
Cinebench R23
Cinebench 2024
Cinebench 2024
Performance Rating - Percent
Geekom AE7
AMD Ryzen 9 7940HS
57 pt
Acemagic F2A
Intel Core Ultra 7 155H
55.3 pt
Asus NUC 14 Pro
Intel Core Ultra 5 125H
50.9 pt
Aoostar GEM10
AMD Ryzen 7 6800H
50.3 pt
Minisforum UH125 Pro
Intel Core Ultra 5 125H
50.1 pt
Geekom A5
AMD Ryzen 7 5800H
48.5 pt
Cinebench 2024
CPU Multi Core
Acemagic F2A
Intel Core Ultra 7 155H
1022 Points +25%
Geekom AE7
AMD Ryzen 9 7940HS
946 Points +16%
Asus NUC 14 Pro
Intel Core Ultra 5 125H
815 Points
Minisforum UH125 Pro
Intel Core Ultra 5 125H
814 Points 0%
Aoostar GEM10
AMD Ryzen 7 6800H
709 Points -13%
Geekom A5
AMD Ryzen 7 5800H
618 Points -24%
CPU Single Core
Geekom AE7
AMD Ryzen 9 7940HS
108 Points +6%
Acemagic F2A
Intel Core Ultra 7 155H
106 Points +4%
Asus NUC 14 Pro
Intel Core Ultra 5 125H
102 Points
Minisforum UH125 Pro
Intel Core Ultra 5 125H
97 Points -5%
Aoostar GEM10
AMD Ryzen 7 6800H
88 Points -14%
Geekom A5
AMD Ryzen 7 5800H
86 Points -16%
Cinebench R23
Multi Core
Acemagic F2A
Intel Core Ultra 7 155H
18497 Points +27%
Geekom AE7
AMD Ryzen 9 7940HS
16099 Points +11%
Minisforum UH125 Pro
Intel Core Ultra 5 125H
14564 Points 0%
Asus NUC 14 Pro
Intel Core Ultra 5 125H
14516 Points
Aoostar GEM10
AMD Ryzen 7 6800H
13117 Points -10%
Geekom A5
AMD Ryzen 7 5800H
10819 Points -25%
Single Core
Geekom AE7
AMD Ryzen 9 7940HS
1788 Points +4%
Acemagic F2A
Intel Core Ultra 7 155H
1771 Points +3%
Asus NUC 14 Pro
Intel Core Ultra 5 125H
1721 Points
Minisforum UH125 Pro
Intel Core Ultra 5 125H
1640 Points -5%
Aoostar GEM10
AMD Ryzen 7 6800H
1542 Points -10%
Geekom A5
AMD Ryzen 7 5800H
1405 Points -18%
Cinebench R20
CPU (Single Core)
Geekom AE7
AMD Ryzen 9 7940HS
700 Points +13%
Acemagic F2A
Intel Core Ultra 7 155H
679 Points +9%
Minisforum UH125 Pro
Intel Core Ultra 5 125H
629 Points +1%
Asus NUC 14 Pro
Intel Core Ultra 5 125H
622 Points
Aoostar GEM10
AMD Ryzen 7 6800H
598 Points -4%
Geekom A5
AMD Ryzen 7 5800H
551 Points -11%
CPU (Multi Core)
Acemagic F2A
Intel Core Ultra 7 155H
7188 Points +28%
Geekom AE7
AMD Ryzen 9 7940HS
6321 Points +13%
Minisforum UH125 Pro
Intel Core Ultra 5 125H
5618 Points 0%
Asus NUC 14 Pro
Intel Core Ultra 5 125H
5617 Points
Aoostar GEM10
AMD Ryzen 7 6800H
5216 Points -7%
Geekom A5
AMD Ryzen 7 5800H
4229 Points -25%
Cinebench R15
CPU Single 64Bit
Geekom AE7
AMD Ryzen 9 7940HS
281 Points +13%
Acemagic F2A
Intel Core Ultra 7 155H
258 Points +4%
Asus NUC 14 Pro
Intel Core Ultra 5 125H
248 Points
Aoostar GEM10
AMD Ryzen 7 6800H
240 Points -3%
Minisforum UH125 Pro
Intel Core Ultra 5 125H
235 Points -5%
Geekom A5
AMD Ryzen 7 5800H
227 Points -8%
CPU Multi 64Bit
Acemagic F2A
Intel Core Ultra 7 155H
2738 Points +28%
Geekom AE7
AMD Ryzen 9 7940HS
2544 Points +19%
Minisforum UH125 Pro
Intel Core Ultra 5 125H
2245 Points +5%
Asus NUC 14 Pro
Intel Core Ultra 5 125H
2141 Points
Aoostar GEM10
AMD Ryzen 7 6800H
2117 Points -1%
Geekom A5
AMD Ryzen 7 5800H
1773 Points -17%
Cinebench R11.5
CPU Single 64Bit
Geekom AE7
AMD Ryzen 9 7940HS
3.38 Points +12%
Acemagic F2A
Intel Core Ultra 7 155H
3.13 Points +3%
Asus NUC 14 Pro
Intel Core Ultra 5 125H
3.03 Points
Aoostar GEM10
AMD Ryzen 7 6800H
2.86 Points -6%
Minisforum UH125 Pro
Intel Core Ultra 5 125H
2.86 Points -6%
Geekom A5
AMD Ryzen 7 5800H
2.69 Points -11%
CPU Multi 64Bit
Acemagic F2A
Intel Core Ultra 7 155H
33.49 Points +24%
Geekom AE7
AMD Ryzen 9 7940HS
30.49 Points +13%
Minisforum UH125 Pro
Intel Core Ultra 5 125H
27.02 Points 0%
Asus NUC 14 Pro
Intel Core Ultra 5 125H
26.92 Points
Aoostar GEM10
AMD Ryzen 7 6800H
24.57 Points -9%
Geekom A5
AMD Ryzen 7 5800H
21.25 Points -21%
Cinebench R10
Rendering Single CPUs 64Bit
Geekom AE7
AMD Ryzen 9 7940HS
14232 Points +7%
Acemagic F2A
Intel Core Ultra 7 155H
13938 Points +5%
Asus NUC 14 Pro
Intel Core Ultra 5 125H
13281 Points
Minisforum UH125 Pro
Intel Core Ultra 5 125H
12858 Points -3%
Aoostar GEM10
AMD Ryzen 7 6800H
12142 Points -9%
Geekom A5
AMD Ryzen 7 5800H
11378 Points -14%
Rendering Multiple CPUs 64Bit
Acemagic F2A
Intel Core Ultra 7 155H
95005 Points +21%
Geekom AE7
AMD Ryzen 9 7940HS
87296 Points +11%
Minisforum UH125 Pro
Intel Core Ultra 5 125H
78817 Points 0%
Asus NUC 14 Pro
Intel Core Ultra 5 125H
78788 Points
Aoostar GEM10
AMD Ryzen 7 6800H
70792 Points -10%
Geekom A5
AMD Ryzen 7 5800H
62312 Points -21%
Blender - v2.79 BMW27 CPU
Geekom A5
AMD Ryzen 7 5800H
293 Seconds * -29%
Aoostar GEM10
AMD Ryzen 7 6800H
259 Seconds * -14%
Minisforum UH125 Pro
Intel Core Ultra 5 125H
230 Seconds * -1%
Asus NUC 14 Pro
Intel Core Ultra 5 125H
228 Seconds *
Geekom AE7
AMD Ryzen 9 7940HS
197 Seconds * +14%
Acemagic F2A
Intel Core Ultra 7 155H
178 Seconds * +22%
wPrime 2.10
32m
Minisforum UH125 Pro
Intel Core Ultra 5 125H
4.48 s * -9%
Asus NUC 14 Pro
Intel Core Ultra 5 125H
4.107 s *
Geekom A5
AMD Ryzen 7 5800H
3.93 s * +4%
Aoostar GEM10
AMD Ryzen 7 6800H
3.55 s * +14%
Acemagic F2A
Intel Core Ultra 7 155H
3.523 s * +14%
Geekom AE7
AMD Ryzen 9 7940HS
2.699 s * +34%
1024m
Minisforum UH125 Pro
Intel Core Ultra 5 125H
246.982 s * -66%
Asus NUC 14 Pro
Intel Core Ultra 5 125H
148.994 s *
Acemagic F2A
Intel Core Ultra 7 155H
139.617 s * +6%
Geekom A5
AMD Ryzen 7 5800H
111.714 s * +25%
Aoostar GEM10
AMD Ryzen 7 6800H
97.298 s * +35%
Geekom AE7
AMD Ryzen 9 7940HS
96.95 s * +35%
X264 HD Benchmark 4.0
Pass 1
Acemagic F2A
Intel Core Ultra 7 155H
325 (323min - 328max) fps +5%
Asus NUC 14 Pro
Intel Core Ultra 5 125H
308.5 (306min - 311max) fps
Minisforum UH125 Pro
Intel Core Ultra 5 125H
304.5 (304min - 306max) fps -1%
Geekom AE7
AMD Ryzen 9 7940HS
288 (287min - 289max) fps -7%
Aoostar GEM10
AMD Ryzen 7 6800H
251.5 (250min - 256max) fps -18%
Geekom A5
AMD Ryzen 7 5800H
244 (242min - 246max) fps -21%
Pass 2
Acemagic F2A
Intel Core Ultra 7 155H
154.15 (153.8min - 154.3max) fps +17%
Geekom AE7
AMD Ryzen 9 7940HS
144.15 (143.5min - 146.6max) fps +9%
Minisforum UH125 Pro
Intel Core Ultra 5 125H
134 (133.7min - 134.5max) fps +1%
Asus NUC 14 Pro
Intel Core Ultra 5 125H
132.3 (129.2min - 135max) fps
Aoostar GEM10
AMD Ryzen 7 6800H
122.2 (120.3min - 126.1max) fps -8%
Geekom A5
AMD Ryzen 7 5800H
104.65 (104.1min - 106.9max) fps -21%
WinRAR - Result
Acemagic F2A
Intel Core Ultra 7 155H
7723 KB/s +22%
Geekom AE7
AMD Ryzen 9 7940HS
7580 KB/s +20%
Geekom A5
AMD Ryzen 7 5800H
7042 KB/s +12%
Asus NUC 14 Pro
Intel Core Ultra 5 125H
6315 KB/s
Aoostar GEM10
AMD Ryzen 7 6800H
5890 KB/s -7%
Minisforum UH125 Pro
Intel Core Ultra 5 125H
5594 KB/s -11%
TrueCrypt
AES Mean 100MB
Geekom AE7
AMD Ryzen 9 7940HS
15.2 GB/s +73%
Aoostar GEM10
AMD Ryzen 7 6800H
13.5 GB/s +53%
Geekom A5
AMD Ryzen 7 5800H
11.5 GB/s +31%
Acemagic F2A
Intel Core Ultra 7 155H
10.6 GB/s +20%
Minisforum UH125 Pro
Intel Core Ultra 5 125H
9 GB/s +2%
Asus NUC 14 Pro
Intel Core Ultra 5 125H
8.8 GB/s
Twofish Mean 100MB
Geekom AE7
AMD Ryzen 9 7940HS
2.1 GB/s +50%
Aoostar GEM10
AMD Ryzen 7 6800H
1.8 GB/s +29%
Acemagic F2A
Intel Core Ultra 7 155H
1.7 GB/s +21%
Geekom A5
AMD Ryzen 7 5800H
1.6 GB/s +14%
Minisforum UH125 Pro
Intel Core Ultra 5 125H
1.4 GB/s 0%
Asus NUC 14 Pro
Intel Core Ultra 5 125H
1.4 GB/s
Serpent Mean 100MB
Geekom AE7
AMD Ryzen 9 7940HS
1.4 GB/s +61%
Aoostar GEM10
AMD Ryzen 7 6800H
1.2 GB/s +38%
Geekom A5
AMD Ryzen 7 5800H
1 GB/s +15%
Acemagic F2A
Intel Core Ultra 7 155H
1 GB/s +15%
Asus NUC 14 Pro
Intel Core Ultra 5 125H
0.869 GB/s
Minisforum UH125 Pro
Intel Core Ultra 5 125H
0.854 GB/s -2%
Geekbench 5.5
Multi-Core
Acemagic F2A
Intel Core Ultra 7 155H
12662 Points +17%
Geekom AE7
AMD Ryzen 9 7940HS
12228 Points +13%
Asus NUC 14 Pro
Intel Core Ultra 5 125H
10856 Points
Minisforum UH125 Pro
Intel Core Ultra 5 125H
10788 Points -1%
Aoostar GEM10
AMD Ryzen 7 6800H
8898 Points -18%
Geekom A5
AMD Ryzen 7 5800H
8823 Points -19%
Single-Core
Geekom AE7
AMD Ryzen 9 7940HS
1986 Points +18%
Acemagic F2A
Intel Core Ultra 7 155H
1746 Points +4%
Asus NUC 14 Pro
Intel Core Ultra 5 125H
1685 Points
Minisforum UH125 Pro
Intel Core Ultra 5 125H
1593 Points -5%
Aoostar GEM10
AMD Ryzen 7 6800H
1552 Points -8%
Geekom A5
AMD Ryzen 7 5800H
1494 Points -11%
Geekbench 5.0
5.0 Multi-Core
Acemagic F2A
Intel Core Ultra 7 155H
12438 Points +16%
Geekom AE7
AMD Ryzen 9 7940HS
12141 Points +13%
Asus NUC 14 Pro
Intel Core Ultra 5 125H
10747 Points
Minisforum UH125 Pro
Intel Core Ultra 5 125H
10676 Points -1%
Aoostar GEM10
AMD Ryzen 7 6800H
8868 Points -17%
Geekom A5
AMD Ryzen 7 5800H
8568 Points -20%
5.0 Single-Core
Geekom AE7
AMD Ryzen 9 7940HS
1905 Points +15%
Acemagic F2A
Intel Core Ultra 7 155H
1708 Points +3%
Asus NUC 14 Pro
Intel Core Ultra 5 125H
1659 Points
Minisforum UH125 Pro
Intel Core Ultra 5 125H
1596 Points -4%
Aoostar GEM10
AMD Ryzen 7 6800H
1509 Points -9%
Geekom A5
AMD Ryzen 7 5800H
1421 Points -14%
Geekbench 4.4
64 Bit Single-Core Score
Geekom AE7
AMD Ryzen 9 7940HS
8125 Points +17%
Asus NUC 14 Pro
Intel Core Ultra 5 125H
6964 Points
Acemagic F2A
Intel Core Ultra 7 155H
6927 Points -1%
Minisforum UH125 Pro
Intel Core Ultra 5 125H
6734 Points -3%
Aoostar GEM10
AMD Ryzen 7 6800H
6341 Points -9%
Geekom A5
AMD Ryzen 7 5800H
6295 Points -10%
64 Bit Multi-Core Score
Geekom AE7
AMD Ryzen 9 7940HS
49341 Points +27%
Acemagic F2A
Intel Core Ultra 7 155H
45250 Points +17%
Asus NUC 14 Pro
Intel Core Ultra 5 125H
38793 Points
Minisforum UH125 Pro
Intel Core Ultra 5 125H
38648 Points 0%
Aoostar GEM10
AMD Ryzen 7 6800H
35898 Points -7%
Geekom A5
AMD Ryzen 7 5800H
34200 Points -12%
3DMark 11 - 1280x720 Performance Physics
Geekom AE7
AMD Ryzen 9 7940HS
22237 Points +26%
Acemagic F2A
Intel Core Ultra 7 155H
20846 Points +18%
Asus NUC 14 Pro
Intel Core Ultra 5 125H
17624 Points
Minisforum UH125 Pro
Intel Core Ultra 5 125H
17138 Points -3%
Geekom A5
AMD Ryzen 7 5800H
16933 Points -4%
Aoostar GEM10
AMD Ryzen 7 6800H
16034 Points -9%
7-Zip 18.03
7z b 4
Geekom AE7
AMD Ryzen 9 7940HS
71631 MIPS
Acemagic F2A
Intel Core Ultra 7 155H
66438 MIPS
Aoostar GEM10
AMD Ryzen 7 6800H
55067 MIPS
Geekom A5
AMD Ryzen 7 5800H
53954 MIPS
Minisforum UH125 Pro
Intel Core Ultra 5 125H
0 MIPS
Asus NUC 14 Pro
Intel Core Ultra 5 125H
0 MIPS
7z b 4 -mmt1
Geekom AE7
AMD Ryzen 9 7940HS
6661 MIPS +30%
Aoostar GEM10
AMD Ryzen 7 6800H
5521 MIPS +7%
Geekom A5
AMD Ryzen 7 5800H
5486 MIPS +7%
Acemagic F2A
Intel Core Ultra 7 155H
5485 MIPS +7%
Asus NUC 14 Pro
Intel Core Ultra 5 125H
5136 MIPS
Minisforum UH125 Pro
Intel Core Ultra 5 125H
4699 MIPS -9%
HWBOT x265 Benchmark v2.2 - 4k Preset
Geekom AE7
AMD Ryzen 9 7940HS
20.9 fps +33%
Acemagic F2A
Intel Core Ultra 7 155H
19.6 fps +25%
Minisforum UH125 Pro
Intel Core Ultra 5 125H
16.7 fps +6%
Asus NUC 14 Pro
Intel Core Ultra 5 125H
15.7 fps
Aoostar GEM10
AMD Ryzen 7 6800H
14.9 fps -5%
Geekom A5
AMD Ryzen 7 5800H
13.3 fps -15%
R Benchmark 2.5 - Overall mean
Geekom A5
AMD Ryzen 7 5800H
0.523 sec * -5%
Aoostar GEM10
AMD Ryzen 7 6800H
0.515 sec * -3%
Minisforum UH125 Pro
Intel Core Ultra 5 125H
0.513 sec * -3%
Asus NUC 14 Pro
Intel Core Ultra 5 125H
0.4982 sec *
Acemagic F2A
Intel Core Ultra 7 155H
0.4652 sec * +7%
Geekom AE7
AMD Ryzen 9 7940HS
0.4346 sec * +13%
LibreOffice - 20 Documents To PDF
Minisforum UH125 Pro
Intel Core Ultra 5 125H
70.9 s * -27%
Asus NUC 14 Pro
Intel Core Ultra 5 125H
55.7 s *
Geekom A5
AMD Ryzen 7 5800H
54.3 s * +3%
Geekom AE7
AMD Ryzen 9 7940HS
53.7 s * +4%
Aoostar GEM10
AMD Ryzen 7 6800H
51.2 s * +8%
Acemagic F2A
Intel Core Ultra 7 155H
44.5 s * +20%
WebXPRT 3 - Overall
Geekom AE7
AMD Ryzen 9 7940HS
323 Points +27%
Acemagic F2A
Intel Core Ultra 7 155H
276 Points +9%
Aoostar GEM10
AMD Ryzen 7 6800H
275 Points +8%
Geekom A5
AMD Ryzen 7 5800H
269 Points +6%
Minisforum UH125 Pro
Intel Core Ultra 5 125H
254 Points 0%
Asus NUC 14 Pro
Intel Core Ultra 5 125H
254 Points
Mozilla Kraken 1.1 - Total
Geekom A5
AMD Ryzen 7 5800H
653 ms * -15%
Minisforum UH125 Pro
Intel Core Ultra 5 125H
595 ms * -5%
Aoostar GEM10
AMD Ryzen 7 6800H
591 ms * -4%
Asus NUC 14 Pro
Intel Core Ultra 5 125H
567 ms *
Acemagic F2A
Intel Core Ultra 7 155H
535 ms * +6%
Geekom AE7
AMD Ryzen 9 7940HS
510 ms * +10%
3DMark
1920x1080 Fire Strike Physics
Geekom AE7
AMD Ryzen 9 7940HS
26617 Points +16%
Acemagic F2A
Intel Core Ultra 7 155H
25043 Points +10%
Aoostar GEM10
AMD Ryzen 7 6800H
23807 Points +4%
Asus NUC 14 Pro
Intel Core Ultra 5 125H
22863 Points
Geekom A5
AMD Ryzen 7 5800H
22433 Points -2%
Minisforum UH125 Pro
Intel Core Ultra 5 125H
21391 Points -6%
2560x1440 Time Spy CPU
Geekom AE7
AMD Ryzen 9 7940HS
11049 Points +27%
Acemagic F2A
Intel Core Ultra 7 155H
10014 Points +15%
Minisforum UH125 Pro
Intel Core Ultra 5 125H
9182 Points +5%
Asus NUC 14 Pro
Intel Core Ultra 5 125H
8719 Points
Geekom A5
AMD Ryzen 7 5800H
8481 Points -3%
Aoostar GEM10
AMD Ryzen 7 6800H
8128 Points -7%
Super Pi mod 1.5 XS 1M - 1M
Geekom A5
AMD Ryzen 7 5800H
9.415 s * -26%
Aoostar GEM10
AMD Ryzen 7 6800H
7.839 s * -5%
Minisforum UH125 Pro
Intel Core Ultra 5 125H
7.744 s * -4%
Asus NUC 14 Pro
Intel Core Ultra 5 125H
7.444 s *
Acemagic F2A
Intel Core Ultra 7 155H
7.168 s * +4%
Geekom AE7
AMD Ryzen 9 7940HS
7.158 s * +4%
Super Pi mod 1.5 XS 2M - 2M
Geekom A5
AMD Ryzen 7 5800H
20.257 s * -23%
Aoostar GEM10
AMD Ryzen 7 6800H
19.101 s * -16%
Geekom AE7
AMD Ryzen 9 7940HS
17.904 s * -9%
Minisforum UH125 Pro
Intel Core Ultra 5 125H
16.967 s * -3%
Asus NUC 14 Pro
Intel Core Ultra 5 125H
16.446 s *
Acemagic F2A
Intel Core Ultra 7 155H
16.125 s * +2%
Super Pi Mod 1.5 XS 32M - 32M
Aoostar GEM10
AMD Ryzen 7 6800H
694.152 s * -76%
Geekom AE7
AMD Ryzen 9 7940HS
653.976 s * -66%
Geekom A5
AMD Ryzen 7 5800H
472.992 s * -20%
Minisforum UH125 Pro
Intel Core Ultra 5 125H
423.565 s * -7%
Acemagic F2A
Intel Core Ultra 7 155H
394.754 s * -0%
Asus NUC 14 Pro
Intel Core Ultra 5 125H
394.697 s *
Affinity Photo 2 - Combined (Multi CPU)
Acemagic F2A
Intel Core Ultra 7 155H
770 Points +30%
Geekom AE7
AMD Ryzen 9 7940HS
623 Points +5%
Minisforum UH125 Pro
Intel Core Ultra 5 125H
615 Points +4%
Asus NUC 14 Pro
Intel Core Ultra 5 125H
594 Points
Aoostar GEM10
AMD Ryzen 7 6800H
513 Points -14%
Geekom A5
AMD Ryzen 7 5800H
439 Points -26%

* ... im mniej tym lepiej

Cinebench R10 Rendering Single 32Bit
9561
Cinebench R10 Shading 64Bit
16957 Points
Cinebench R10 Rendering Multiple CPUs 64Bit
78788 Points
Cinebench R10 Rendering Single CPUs 64Bit
13281 Points
Cinebench R10 Shading 32Bit
16752
Cinebench R10 Rendering Multiple CPUs 32Bit
53390
Cinebench R11.5 CPU Single 32Bit
2.66 Points
Cinebench R11.5 CPU Multi 32Bit
24.31 Points
Cinebench R11.5 OpenGL 32Bit
101.29 fps
Cinebench R11.5 CPU Single 64Bit
3.03 Points
Cinebench R11.5 CPU Multi 64Bit
26.92 Points
Cinebench R11.5 OpenGL 64Bit
97.61 fps
Cinebench R15 CPU Single 64Bit
248 Points
Cinebench R15 CPU Multi 64Bit
2141 Points
Cinebench R15 Ref. Match 64Bit
97.8 %
Cinebench R15 OpenGL 64Bit
145.06 fps
Cinebench R20 CPU (Single Core)
622 Points
Cinebench R20 CPU (Multi Core)
5617 Points
Cinebench R23 Multi Core
14516 Points
Cinebench R23 Single Core
1721 Points
Cinebench 2024 CPU Single Core
102 Points
Cinebench 2024 CPU Multi Core
815 Points
Pomoc
Performance Rating
Geekom AE7
AMD Ryzen 9 7940HS, Radeon 780M
97.2 pt
Acemagic F2A
Intel Core Ultra 7 155H, Arc 8-Core
77.3 pt
Aoostar GEM10
AMD Ryzen 7 6800H, Radeon 680M
67.4 pt
Minisforum UH125 Pro
Intel Core Ultra 5 125H, Arc 7-Core
63.1 pt
Asus NUC 14 Pro
Intel Core Ultra 5 125H, Arc 7-Core
62.4 pt
Geekom A5
AMD Ryzen 7 5800H, Vega 8
61.4 pt
Average of class Mini PC
 
57 pt
AIDA64 / FP32 Ray-Trace
Geekom AE7
AMD Ryzen 9 7940HS, Radeon 780M
26514 KRay/s +99%
Acemagic F2A
Intel Core Ultra 7 155H, Arc 8-Core
17544 KRay/s +31%
Aoostar GEM10
AMD Ryzen 7 6800H, Radeon 680M
13726 KRay/s +3%
Minisforum UH125 Pro
Intel Core Ultra 5 125H, Arc 7-Core
13639 KRay/s +2%
Asus NUC 14 Pro
Intel Core Ultra 5 125H, Arc 7-Core
13347 KRay/s
Average of class Mini PC
  (646 - 51004, n=118, last 2 years)
12899 KRay/s -3%
Geekom A5
AMD Ryzen 7 5800H, Vega 8
12468 KRay/s -7%
AIDA64 / FPU Julia
Geekom AE7
AMD Ryzen 9 7940HS, Radeon 780M
112419 Points +64%
Acemagic F2A
Intel Core Ultra 7 155H, Arc 8-Core
88829 Points +30%
Aoostar GEM10
AMD Ryzen 7 6800H, Radeon 680M
86223 Points +26%
Geekom A5
AMD Ryzen 7 5800H, Vega 8
77847 Points +14%
Minisforum UH125 Pro
Intel Core Ultra 5 125H, Arc 7-Core
70880 Points +3%
Asus NUC 14 Pro
Intel Core Ultra 5 125H, Arc 7-Core
68551 Points
Average of class Mini PC
  (3857 - 214250, n=118, last 2 years)
64853 Points -5%
AIDA64 / CPU SHA3
Geekom AE7
AMD Ryzen 9 7940HS, Radeon 780M
4898 MB/s +47%
Acemagic F2A
Intel Core Ultra 7 155H, Arc 8-Core
4246 MB/s +28%
Minisforum UH125 Pro
Intel Core Ultra 5 125H, Arc 7-Core
3404 MB/s +2%
Asus NUC 14 Pro
Intel Core Ultra 5 125H, Arc 7-Core
3323 MB/s
Aoostar GEM10
AMD Ryzen 7 6800H, Radeon 680M
2953 MB/s -11%
Average of class Mini PC
  (260 - 9399, n=118, last 2 years)
2863 MB/s -14%
Geekom A5
AMD Ryzen 7 5800H, Vega 8
2707 MB/s -19%
AIDA64 / CPU Queen
Geekom AE7
AMD Ryzen 9 7940HS, Radeon 780M
119250 Points +49%
Aoostar GEM10
AMD Ryzen 7 6800H, Radeon 680M
98582 Points +23%
Geekom A5
AMD Ryzen 7 5800H, Vega 8
91846 Points +15%
Acemagic F2A
Intel Core Ultra 7 155H, Arc 8-Core
89748 Points +12%
Average of class Mini PC
  (8172 - 184747, n=118, last 2 years)
80064 Points 0%
Asus NUC 14 Pro
Intel Core Ultra 5 125H, Arc 7-Core
79866 Points
Minisforum UH125 Pro
Intel Core Ultra 5 125H, Arc 7-Core
78098 Points -2%
AIDA64 / FPU SinJulia
Geekom AE7
AMD Ryzen 9 7940HS, Radeon 780M
14976 Points +91%
Aoostar GEM10
AMD Ryzen 7 6800H, Radeon 680M
12159 Points +55%
Geekom A5
AMD Ryzen 7 5800H, Vega 8
10972 Points +40%
Acemagic F2A
Intel Core Ultra 7 155H, Arc 8-Core
10247 Points +31%
Average of class Mini PC
  (408 - 29064, n=118, last 2 years)
8760 Points +12%
Asus NUC 14 Pro
Intel Core Ultra 5 125H, Arc 7-Core
7851 Points
Minisforum UH125 Pro
Intel Core Ultra 5 125H, Arc 7-Core
7842 Points 0%
AIDA64 / FPU Mandel
Geekom AE7
AMD Ryzen 9 7940HS, Radeon 780M
60098 Points +76%
Aoostar GEM10
AMD Ryzen 7 6800H, Radeon 680M
47463 Points +39%
Acemagic F2A
Intel Core Ultra 7 155H, Arc 8-Core
45718 Points +34%
Geekom A5
AMD Ryzen 7 5800H, Vega 8
42543 Points +24%
Minisforum UH125 Pro
Intel Core Ultra 5 125H, Arc 7-Core
35321 Points +3%
Asus NUC 14 Pro
Intel Core Ultra 5 125H, Arc 7-Core
34225 Points
Average of class Mini PC
  (1987 - 113499, n=118, last 2 years)
33799 Points -1%
AIDA64 / CPU AES
Geekom AE7
AMD Ryzen 9 7940HS, Radeon 780M
167583 MB/s +161%
Acemagic F2A
Intel Core Ultra 7 155H, Arc 8-Core
144741 MB/s +126%
Aoostar GEM10
AMD Ryzen 7 6800H, Radeon 680M
119681 MB/s +87%
Geekom A5
AMD Ryzen 7 5800H, Vega 8
108262 MB/s +69%
Average of class Mini PC
  (3691 - 325960, n=118, last 2 years)
88023 MB/s +37%
Minisforum UH125 Pro
Intel Core Ultra 5 125H, Arc 7-Core
65304 MB/s +2%
Asus NUC 14 Pro
Intel Core Ultra 5 125H, Arc 7-Core
64107 MB/s
AIDA64 / CPU ZLib
Acemagic F2A
Intel Core Ultra 7 155H, Arc 8-Core
1183 MB/s +22%
Geekom AE7
AMD Ryzen 9 7940HS, Radeon 780M
1015 MB/s +5%
Minisforum UH125 Pro
Intel Core Ultra 5 125H, Arc 7-Core
994 MB/s +3%
Asus NUC 14 Pro
Intel Core Ultra 5 125H, Arc 7-Core
969 MB/s
Aoostar GEM10
AMD Ryzen 7 6800H, Radeon 680M
757 MB/s -22%
Average of class Mini PC
  (74.9 - 2039, n=118, last 2 years)
741 MB/s -24%
Geekom A5
AMD Ryzen 7 5800H, Vega 8
700 MB/s -28%
AIDA64 / FP64 Ray-Trace
Geekom AE7
AMD Ryzen 9 7940HS, Radeon 780M
14162 KRay/s +109%
Acemagic F2A
Intel Core Ultra 7 155H, Arc 8-Core
9284 KRay/s +37%
Aoostar GEM10
AMD Ryzen 7 6800H, Radeon 680M
7279 KRay/s +7%
Minisforum UH125 Pro
Intel Core Ultra 5 125H, Arc 7-Core
7221 KRay/s +6%
Average of class Mini PC
  (350 - 26952, n=118, last 2 years)
6891 KRay/s +2%
Asus NUC 14 Pro
Intel Core Ultra 5 125H, Arc 7-Core
6786 KRay/s
Geekom A5
AMD Ryzen 7 5800H, Vega 8
6380 KRay/s -6%
AIDA64 / CPU PhotoWorxx
Asus NUC 14 Pro
Intel Core Ultra 5 125H, Arc 7-Core
47377 MPixel/s
Minisforum UH125 Pro
Intel Core Ultra 5 125H, Arc 7-Core
45789 MPixel/s -3%
Geekom AE7
AMD Ryzen 9 7940HS, Radeon 780M
40690 MPixel/s -14%
Acemagic F2A
Intel Core Ultra 7 155H, Arc 8-Core
33092 MPixel/s -30%
Average of class Mini PC
  (4408 - 50500, n=118, last 2 years)
28353 MPixel/s -40%
Aoostar GEM10
AMD Ryzen 7 6800H, Radeon 680M
26496 MPixel/s -44%
Geekom A5
AMD Ryzen 7 5800H, Vega 8
25113 MPixel/s -47%

Cinebench R15 Multi loop

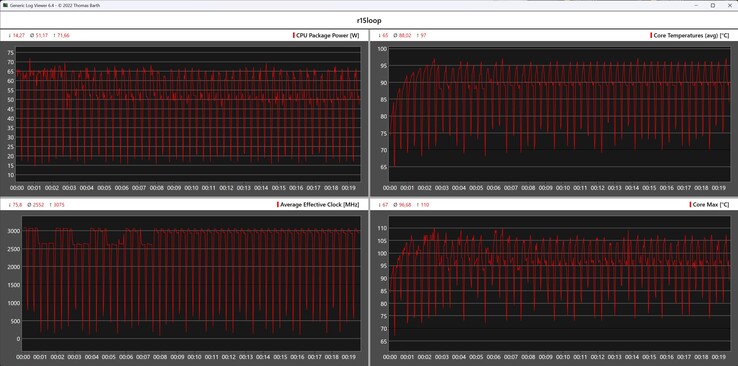
Niestety, Asus NUC 14 Pro nie jest w stanie utrzymać nieco lepszej wydajności procesora w ciągłej pętli Cinebench R15 w porównaniu do Minisforum UH125 Pro. Podwyższone temperatury procesora wielokrotnie powodują krótkotrwałe spadki wydajności, dlatego też wyniki nie są zbyt spójne. Ze średnią wynoszącą 2 021 punktów, Asus NUC 14 Pro nie może pokonać Minisforum UH125 Pro.

Metryki procesora podczas pętli Cinebench R15
01452904355807258701015116013051450159517401885203021752320246526102755Tooltip
Asus NUC 14 Pro Intel Core Ultra 5 125H, Intel Core Ultra 5 125H: Ø2021 (1900.15-2203.13)
Geekom AE7 AMD Ryzen 9 7940HS, AMD Ryzen 9 7940HS: Ø2563 (2486.79-2630.54)
Minisforum UH125 Pro Intel Core Ultra 5 125H, Intel Core Ultra 5 125H: Ø2186 (2040.4-2248.33)
Aoostar GEM10 AMD Ryzen 7 6800H, AMD Ryzen 7 6800H: Ø1983 (1919.75-2106.82)
Acemagic F2A Intel Core Ultra 7 155H, Intel Core Ultra 7 155H: Ø2759 (2690.7-2800.92)
Geekom A5 AMD Ryzen 7 5800H, AMD Ryzen 7 5800H: Ø1715 (1692.05-1838.74)

Wydajność systemu

Wydajność systemu dokładnie odzwierciedla to, co jest możliwe dzięki Intel Core Ultra 5 125H. Oparty na tym samym SoC, Minisforum UH125 Pro jest głównym konkurentem i zapewnia podobną wydajność do Asus NUC 14 Pro. Subiektywnie, Asus NUC 14 Pro zapewnia doskonałą wydajność na co dzień, a nasza próbka testowa może zapewnić drugie miejsce w testach pamięci RAM.

PCMark 10 / Score
Geekom AE7, AMD Ryzen 9 7940HS
AMD Radeon 780M, Wodposit NVMe SSD 1024 GB
7520 Points +20%
Acemagic F2A, Intel Core Ultra 7 155H
Intel Arc 8-Core iGPU, Kingston OM8SEP1024Q-A0
7120 Points +13%
Aoostar GEM10, AMD Ryzen 7 6800H
AMD Radeon 680M, BIWIN CE980Y28900-1TB
6749 Points +7%
Asus NUC 14 Pro, Intel Core Ultra 5 125H
Intel Arc 7-Core iGPU, Kingston KC3000 2048G SKC3000D2048G
6282 Points
Minisforum UH125 Pro, Intel Core Ultra 5 125H
Intel Arc 7-Core iGPU, Kingston OM8PGP41024Q-A0
6194 Points -1%
Geekom A5, AMD Ryzen 7 5800H
AMD Radeon RX Vega 8 (Ryzen 4000/5000), Lexar NM620 512GB
6149 Points -2%
PCMark 10 / Essentials
Acemagic F2A, Intel Core Ultra 7 155H
Intel Arc 8-Core iGPU, Kingston OM8SEP1024Q-A0
11125 Points +11%
Geekom AE7, AMD Ryzen 9 7940HS
AMD Radeon 780M, Wodposit NVMe SSD 1024 GB
11058 Points +10%
Aoostar GEM10, AMD Ryzen 7 6800H
AMD Radeon 680M, BIWIN CE980Y28900-1TB
10522 Points +5%
Geekom A5, AMD Ryzen 7 5800H
AMD Radeon RX Vega 8 (Ryzen 4000/5000), Lexar NM620 512GB
10356 Points +3%
Asus NUC 14 Pro, Intel Core Ultra 5 125H
Intel Arc 7-Core iGPU, Kingston KC3000 2048G SKC3000D2048G
10050 Points
Minisforum UH125 Pro, Intel Core Ultra 5 125H
Intel Arc 7-Core iGPU, Kingston OM8PGP41024Q-A0
9427 Points -6%
PCMark 10 / Productivity
Geekom AE7, AMD Ryzen 9 7940HS
AMD Radeon 780M, Wodposit NVMe SSD 1024 GB
10717 Points +52%
Aoostar GEM10, AMD Ryzen 7 6800H
AMD Radeon 680M, BIWIN CE980Y28900-1TB
9367 Points +33%
Geekom A5, AMD Ryzen 7 5800H
AMD Radeon RX Vega 8 (Ryzen 4000/5000), Lexar NM620 512GB
9311 Points +32%
Acemagic F2A, Intel Core Ultra 7 155H
Intel Arc 8-Core iGPU, Kingston OM8SEP1024Q-A0
8901 Points +26%
Minisforum UH125 Pro, Intel Core Ultra 5 125H
Intel Arc 7-Core iGPU, Kingston OM8PGP41024Q-A0
7715 Points +10%
Asus NUC 14 Pro, Intel Core Ultra 5 125H
Intel Arc 7-Core iGPU, Kingston KC3000 2048G SKC3000D2048G
7042 Points
CrossMark / Overall
Geekom AE7, AMD Ryzen 9 7940HS
AMD Radeon 780M, Wodposit NVMe SSD 1024 GB
1813 Points +19%
Acemagic F2A, Intel Core Ultra 7 155H
Intel Arc 8-Core iGPU, Kingston OM8SEP1024Q-A0
1802 Points +18%
Aoostar GEM10, AMD Ryzen 7 6800H
AMD Radeon 680M, BIWIN CE980Y28900-1TB
1648 Points +8%
Minisforum UH125 Pro, Intel Core Ultra 5 125H
Intel Arc 7-Core iGPU, Kingston OM8PGP41024Q-A0
1533 Points +1%
Asus NUC 14 Pro, Intel Core Ultra 5 125H
Intel Arc 7-Core iGPU, Kingston KC3000 2048G SKC3000D2048G
1522 Points
Geekom A5, AMD Ryzen 7 5800H
AMD Radeon RX Vega 8 (Ryzen 4000/5000), Lexar NM620 512GB
1429 Points -6%
CrossMark / Responsiveness
Acemagic F2A, Intel Core Ultra 7 155H
Intel Arc 8-Core iGPU, Kingston OM8SEP1024Q-A0
1700 Points +45%
Aoostar GEM10, AMD Ryzen 7 6800H
AMD Radeon 680M, BIWIN CE980Y28900-1TB
1566 Points +34%
Geekom AE7, AMD Ryzen 9 7940HS
AMD Radeon 780M, Wodposit NVMe SSD 1024 GB
1527 Points +30%
Minisforum UH125 Pro, Intel Core Ultra 5 125H
Intel Arc 7-Core iGPU, Kingston OM8PGP41024Q-A0
1332 Points +14%
Geekom A5, AMD Ryzen 7 5800H
AMD Radeon RX Vega 8 (Ryzen 4000/5000), Lexar NM620 512GB
1233 Points +5%
Asus NUC 14 Pro, Intel Core Ultra 5 125H
Intel Arc 7-Core iGPU, Kingston KC3000 2048G SKC3000D2048G
1171 Points
CrossMark / Creativity
Geekom AE7, AMD Ryzen 9 7940HS
AMD Radeon 780M, Wodposit NVMe SSD 1024 GB
2011 Points +14%
Acemagic F2A, Intel Core Ultra 7 155H
Intel Arc 8-Core iGPU, Kingston OM8SEP1024Q-A0
1929 Points +9%
Asus NUC 14 Pro, Intel Core Ultra 5 125H
Intel Arc 7-Core iGPU, Kingston KC3000 2048G SKC3000D2048G
1765 Points
Aoostar GEM10, AMD Ryzen 7 6800H
AMD Radeon 680M, BIWIN CE980Y28900-1TB
1696 Points -4%
Minisforum UH125 Pro, Intel Core Ultra 5 125H
Intel Arc 7-Core iGPU, Kingston OM8PGP41024Q-A0
1683 Points -5%
Geekom A5, AMD Ryzen 7 5800H
AMD Radeon RX Vega 8 (Ryzen 4000/5000), Lexar NM620 512GB
1523 Points -14%
CrossMark / Productivity
Geekom AE7, AMD Ryzen 9 7940HS
AMD Radeon 780M, Wodposit NVMe SSD 1024 GB
1731 Points +21%
Acemagic F2A, Intel Core Ultra 7 155H
Intel Arc 8-Core iGPU, Kingston OM8SEP1024Q-A0
1717 Points +20%
Aoostar GEM10, AMD Ryzen 7 6800H
AMD Radeon 680M, BIWIN CE980Y28900-1TB
1629 Points +14%
Minisforum UH125 Pro, Intel Core Ultra 5 125H
Intel Arc 7-Core iGPU, Kingston OM8PGP41024Q-A0
1463 Points +2%
Asus NUC 14 Pro, Intel Core Ultra 5 125H
Intel Arc 7-Core iGPU, Kingston KC3000 2048G SKC3000D2048G
1432 Points
Geekom A5, AMD Ryzen 7 5800H
AMD Radeon RX Vega 8 (Ryzen 4000/5000), Lexar NM620 512GB
1408 Points -2%
AIDA64 / Memory Copy
Minisforum UH125 Pro
Intel Core Ultra 5 125H, Arc 7-Core
69592 MB/s 0%
Asus NUC 14 Pro
Intel Core Ultra 5 125H, Arc 7-Core
69264 MB/s
Geekom AE7
AMD Ryzen 9 7940HS, Radeon 780M
68449 MB/s -1%
Acemagic F2A
Intel Core Ultra 7 155H, Arc 8-Core
62397 MB/s -10%
Aoostar GEM10
AMD Ryzen 7 6800H, Radeon 680M
50829 MB/s -27%
Average of class Mini PC
  (6481 - 89287, n=118, last 2 years)
48312 MB/s -30%
Geekom A5
AMD Ryzen 7 5800H, Vega 8
43870 MB/s -37%
AIDA64 / Memory Read
Asus NUC 14 Pro
Intel Core Ultra 5 125H, Arc 7-Core
74415 MB/s
Minisforum UH125 Pro
Intel Core Ultra 5 125H, Arc 7-Core
72711 MB/s -2%
Acemagic F2A
Intel Core Ultra 7 155H, Arc 8-Core
64323 MB/s -14%
Geekom AE7
AMD Ryzen 9 7940HS, Radeon 780M
61836 MB/s -17%
Average of class Mini PC
  (6914 - 99171, n=118, last 2 years)
49202 MB/s -34%
Geekom A5
AMD Ryzen 7 5800H, Vega 8
46241 MB/s -38%
Aoostar GEM10
AMD Ryzen 7 6800H, Radeon 680M
43828 MB/s -41%
AIDA64 / Memory Write
Geekom AE7
AMD Ryzen 9 7940HS, Radeon 780M
87118 MB/s +20%
Asus NUC 14 Pro
Intel Core Ultra 5 125H, Arc 7-Core
72443 MB/s
Minisforum UH125 Pro
Intel Core Ultra 5 125H, Arc 7-Core
71514 MB/s -1%
Acemagic F2A
Intel Core Ultra 7 155H, Arc 8-Core
65057 MB/s -10%
Average of class Mini PC
  (6862 - 98583, n=118, last 2 years)
52727 MB/s -27%
Aoostar GEM10
AMD Ryzen 7 6800H, Radeon 680M
51116 MB/s -29%
Geekom A5
AMD Ryzen 7 5800H, Vega 8
46407 MB/s -36%
AIDA64 / Memory Latency
Minisforum UH125 Pro
Intel Core Ultra 5 125H, Arc 7-Core
184.8 ns * -45%
Acemagic F2A
Intel Core Ultra 7 155H, Arc 8-Core
149 ns * -17%
Asus NUC 14 Pro
Intel Core Ultra 5 125H, Arc 7-Core
127.3 ns *
Aoostar GEM10
AMD Ryzen 7 6800H, Radeon 680M
104.1 ns * +18%
Average of class Mini PC
  (44.9 - 184.8, n=118, last 2 years)
91.6 ns * +28%
Geekom AE7
AMD Ryzen 9 7940HS, Radeon 780M
90 ns * +29%
Geekom A5
AMD Ryzen 7 5800H, Vega 8
81.4 ns * +36%

* ... im mniej tym lepiej

UL Procyon for Windows
Overall Score Integer NPU
Asus NUC 14 Pro
Intel Core Ultra 5 125H, Arc 7-Core
508 Points
Minisforum UH125 Pro
Intel Core Ultra 5 125H, Arc 7-Core
501 Points -1%
Acemagic F2A
Intel Core Ultra 7 155H, Arc 8-Core
499 Points -2%
Overall Score Integer GPU
Asus NUC 14 Pro
Intel Core Ultra 5 125H, Arc 7-Core
741 Points
Acemagic F2A
Intel Core Ultra 7 155H, Arc 8-Core
684 Points -8%
Minisforum UH125 Pro
Intel Core Ultra 5 125H, Arc 7-Core
547 Points -26%

Opóźnienia DPC

Opóźnienia DPC Asusa NUC 14 Pro nie są przekonujące. Nawet podczas zwykłego surfowania po Internecie widzimy wysokie wartości, które pogarszają się jeszcze bardziej podczas odtwarzania testowego wideo 4K. Przyszłe aktualizacje BIOS-u lub sterowników mogą zapewnić poprawę w tym zakresie w przyszłości.

Maksymalne opóźnienie podczas otwierania wielu kart przeglądarki
Maksymalne opóźnienie podczas odtwarzania materiałów wideo 4K
Maksymalne opóźnienie po dziesięciu sekundach Prime95
Sterowniki uszeregowane według najdłuższego czasu wykonania
DPC Latencies / LatencyMon - interrupt to process latency (max), Web, Youtube, Prime95
Asus NUC 14 Pro
Arc 7-Core, Ultra 5 125H, Kingston KC3000 2048G SKC3000D2048G
2776 μs *
Acemagic F2A
Arc 8-Core, Ultra 7 155H, Kingston OM8SEP1024Q-A0
2724 μs * +2%
Geekom AE7
Radeon 780M, R9 7940HS, Wodposit NVMe SSD 1024 GB
2198.8 μs * +21%
Minisforum UH125 Pro
Arc 7-Core, Ultra 5 125H, Kingston OM8PGP41024Q-A0
1438 μs * +48%
Geekom A5
Vega 8, R7 5800H, Lexar NM620 512GB
1310.5 μs * +53%
Aoostar GEM10
Radeon 680M, R7 6800H, BIWIN CE980Y28900-1TB
962.8 μs * +65%

* ... im mniej tym lepiej

Pamięć masowa

Testowy dysk SSD firmy Kingston

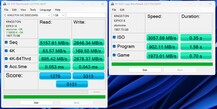
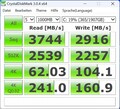
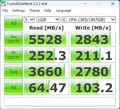
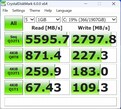
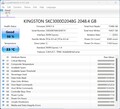
Urządzenie testowe wyposażyliśmy w dysk SSD Kingston KC3000. Teoretyczna wydajność dysku SSD nie może zostać osiągnięta w praktyce. Niemniej jednak odnotowaliśmy stosunkowo dobre wyniki, co oznaczało dobre trzecie miejsce w ogólnym rozrachunku. Niewielkie problemy można zauważyć w teście obciążeniowym: W połączeniu z zastosowanym dyskiem Kingston SC3000, wydajność odczytu nie może być stale utrzymywana na tym samym poziomie.

Aby uzyskać więcej porównań i benchmarków, proszę spojrzeć na naszą tabelę porównawczą Laptop SSD & HDD Benchmarks .

AS SSD
AS SSD
CDM 3
CDM 3
CDM 5
CDM 5
CDM 6
CDM 6
CDI
CDI
Kingston KC3000 2048G SKC3000D2048G
Sequential Read: 3744 MB/s
Sequential Write: 2916 MB/s
512K Read: 2539 MB/s
512K Write: 2257 MB/s
4K Read: 62.03 MB/s
4K Write: 104.1 MB/s
4K QD32 Read: 241 MB/s
4K QD32 Write: 160.9 MB/s
Drive Performance Rating - Percent
Aoostar GEM10
BIWIN CE980Y28900-1TB
86.8 pt
Geekom AE7
Wodposit NVMe SSD 1024 GB
76.3 pt
Asus NUC 14 Pro
Kingston KC3000 2048G SKC3000D2048G
70.6 pt
Average of class Mini PC
 
60.2 pt
Minisforum UH125 Pro
Kingston OM8PGP41024Q-A0
59.7 pt
Acemagic F2A
Kingston OM8SEP1024Q-A0
59.2 pt
Geekom A5
Lexar NM620 512GB
59 pt
DiskSpd
seq read
Aoostar GEM10
BIWIN CE980Y28900-1TB
4000 (3961.36min - 3999.66max) MB/s +8%
Asus NUC 14 Pro
Kingston KC3000 2048G SKC3000D2048G
3706 (3594.04min - 3706.37max) MB/s
Geekom AE7
Wodposit NVMe SSD 1024 GB
2411 (2346.63min - 2410.89max) MB/s -35%
Geekom A5
Lexar NM620 512GB
2371 (2315.68min - 2370.91max) MB/s -36%
Minisforum UH125 Pro
Kingston OM8PGP41024Q-A0
2351 (2320.68min - 2350.61max) MB/s -37%
Average of class Mini PC
  (277 - 4357, n=118, last 2 years)
2326 MB/s -37%
Acemagic F2A
Kingston OM8SEP1024Q-A0
1674 (1242.56min - 1673.54max) MB/s -55%
seq write
Aoostar GEM10
BIWIN CE980Y28900-1TB
4553 (4417.86min - 4552.92max) MB/s +55%
Geekom AE7
Wodposit NVMe SSD 1024 GB
3650 (3239.07min - 3649.71max) MB/s +25%
Minisforum UH125 Pro
Kingston OM8PGP41024Q-A0
3331 (3244.92min - 3330.75max) MB/s +14%
Asus NUC 14 Pro
Kingston KC3000 2048G SKC3000D2048G
2928 (1958.53min - 2927.62max) MB/s
Geekom A5
Lexar NM620 512GB
2668 (292.6min - 2668max) MB/s -9%
Average of class Mini PC
  (229 - 5595, n=118, last 2 years)
2507 MB/s -14%
Acemagic F2A
Kingston OM8SEP1024Q-A0
1348 (1117.85min - 1347.87max) MB/s -54%
seq q8 t1 read
Asus NUC 14 Pro
Kingston KC3000 2048G SKC3000D2048G
7110 (6058.21min - 7110.02max) MB/s
Geekom AE7
Wodposit NVMe SSD 1024 GB
4939 (4360.49min - 4938.56max) MB/s -31%
Aoostar GEM10
BIWIN CE980Y28900-1TB
4878 (4476.29min - 4877.98max) MB/s -31%
Minisforum UH125 Pro
Kingston OM8PGP41024Q-A0
4802 (4169.19min - 4801.68max) MB/s -32%
Average of class Mini PC
  (236 - 8430, n=118, last 2 years)
3797 MB/s -47%
Geekom A5
Lexar NM620 512GB
3444 (2979.63min - 3443.98max) MB/s -52%
Acemagic F2A
Kingston OM8SEP1024Q-A0
3194 (2810.81min - 3194.17max) MB/s -55%
seq q8 t1 write
Asus NUC 14 Pro
Kingston KC3000 2048G SKC3000D2048G
4712 (3064.99min - 4711.88max) MB/s
Aoostar GEM10
BIWIN CE980Y28900-1TB
4505 (4403.81min - 4505.09max) MB/s -4%
Geekom AE7
Wodposit NVMe SSD 1024 GB
4273 (4238.26min - 4272.58max) MB/s -9%
Minisforum UH125 Pro
Kingston OM8PGP41024Q-A0
3902 (3839.68min - 3901.75max) MB/s -17%
Geekom A5
Lexar NM620 512GB
3117 (3075.4min - 3117.21max) MB/s -34%
Average of class Mini PC
  (239 - 6669, n=118, last 2 years)
2813 MB/s -40%
Acemagic F2A
Kingston OM8SEP1024Q-A0
2212 (1222.43min - 2212.27max) MB/s -53%
4k q1 t1 read
Aoostar GEM10
BIWIN CE980Y28900-1TB
61.7 (61.26min - 61.71max) MB/s +16%
Minisforum UH125 Pro
Kingston OM8PGP41024Q-A0
60 (58.44min - 60.02max) MB/s +12%
Average of class Mini PC
  (6.85 - 86.6, n=118, last 2 years)
55.3 MB/s +4%
Geekom A5
Lexar NM620 512GB
54.5 (37.15min - 54.54max) MB/s +2%
Asus NUC 14 Pro
Kingston KC3000 2048G SKC3000D2048G
53.4 (49.89min - 53.35max) MB/s
Geekom AE7
Wodposit NVMe SSD 1024 GB
48.1 (43.1min - 48.11max) MB/s -10%
Acemagic F2A
Kingston OM8SEP1024Q-A0
47.3 (47.07min - 47.31max) MB/s -11%
4k q1 t1 write
Aoostar GEM10
BIWIN CE980Y28900-1TB
235 (230.8min - 235.02max) MB/s +183%
Average of class Mini PC
  (30.4 - 435, n=118, last 2 years)
196.1 MB/s +136%
Acemagic F2A
Kingston OM8SEP1024Q-A0
187.2 (181.54min - 187.2max) MB/s +125%
Geekom AE7
Wodposit NVMe SSD 1024 GB
184.8 (177.47min - 184.84max) MB/s +122%
Geekom A5
Lexar NM620 512GB
148.4 (147.43min - 148.38max) MB/s +79%
Minisforum UH125 Pro
Kingston OM8PGP41024Q-A0
136.8 (131.56min - 136.81max) MB/s +65%
Asus NUC 14 Pro
Kingston KC3000 2048G SKC3000D2048G
83.1 (75.3min - 83.11max) MB/s
4k q32 t16 read
Aoostar GEM10
BIWIN CE980Y28900-1TB
2004 (2002.37min - 2004.23max) MB/s +174%
Geekom A5
Lexar NM620 512GB
1960 MB/s +168%
Acemagic F2A
Kingston OM8SEP1024Q-A0
1824 (1239.47min - 1824.09max) MB/s +150%
Geekom AE7
Wodposit NVMe SSD 1024 GB
1580 (1549.8min - 1579.65max) MB/s +116%
Average of class Mini PC
  (26.1 - 4158, n=118, last 2 years)
1407 MB/s +92%
Asus NUC 14 Pro
Kingston KC3000 2048G SKC3000D2048G
731 (660.89min - 731.29max) MB/s
Minisforum UH125 Pro
Kingston OM8PGP41024Q-A0
698 (691.89min - 697.84max) MB/s -5%
4k q32 t16 write
Aoostar GEM10
BIWIN CE980Y28900-1TB
2681 (2560.18min - 2680.76max) MB/s +1336%
Acemagic F2A
Kingston OM8SEP1024Q-A0
1434 (1410.26min - 1433.71max) MB/s +668%
Geekom A5
Lexar NM620 512GB
1370 (84.65min - 1370.23max) MB/s +634%
Average of class Mini PC
  (32.6 - 4288, n=118, last 2 years)
1325 MB/s +610%
Geekom AE7
Wodposit NVMe SSD 1024 GB
627 (618.33min - 627.08max) MB/s +236%
Minisforum UH125 Pro
Kingston OM8PGP41024Q-A0
311 (252.72min - 310.91max) MB/s +67%
Asus NUC 14 Pro
Kingston KC3000 2048G SKC3000D2048G
186.7 (155.05min - 186.74max) MB/s
AS SSD
Score Total
Geekom AE7
Wodposit NVMe SSD 1024 GB
6354 Points +24%
Aoostar GEM10
BIWIN CE980Y28900-1TB
6147 Points +20%
Asus NUC 14 Pro
Kingston KC3000 2048G SKC3000D2048G
5131 Points
Acemagic F2A
Kingston OM8SEP1024Q-A0
4412 Points -14%
Average of class Mini PC
  (211 - 10021, n=116, last 2 years)
4241 Points -17%
Geekom A5
Lexar NM620 512GB
4006 Points -22%
Minisforum UH125 Pro
Kingston OM8PGP41024Q-A0
3878 Points -24%
Score Read
Aoostar GEM10
BIWIN CE980Y28900-1TB
2109 Points +65%
Geekom AE7
Wodposit NVMe SSD 1024 GB
1757 Points +38%
Average of class Mini PC
  (76 - 3741, n=116, last 2 years)
1575 Points +24%
Acemagic F2A
Kingston OM8SEP1024Q-A0
1561 Points +22%
Geekom A5
Lexar NM620 512GB
1502 Points +18%
Asus NUC 14 Pro
Kingston KC3000 2048G SKC3000D2048G
1275 Points
Minisforum UH125 Pro
Kingston OM8PGP41024Q-A0
1096 Points -14%
Score Write
Geekom AE7
Wodposit NVMe SSD 1024 GB
3759 Points +13%
Asus NUC 14 Pro
Kingston KC3000 2048G SKC3000D2048G
3313 Points
Aoostar GEM10
BIWIN CE980Y28900-1TB
2964 Points -11%
Minisforum UH125 Pro
Kingston OM8PGP41024Q-A0
2306 Points -30%
Acemagic F2A
Kingston OM8SEP1024Q-A0
2082 Points -37%
Average of class Mini PC
  (88 - 4371, n=116, last 2 years)
1904 Points -43%
Geekom A5
Lexar NM620 512GB
1739 Points -48%
Seq Read
Asus NUC 14 Pro
Kingston KC3000 2048G SKC3000D2048G
5158 MB/s
Aoostar GEM10
BIWIN CE980Y28900-1TB
4264 MB/s -17%
Geekom AE7
Wodposit NVMe SSD 1024 GB
3891 MB/s -25%
Minisforum UH125 Pro
Kingston OM8PGP41024Q-A0
3808 MB/s -26%
Average of class Mini PC
  (291 - 6620, n=116, last 2 years)
3235 MB/s -37%
Geekom A5
Lexar NM620 512GB
3020 MB/s -41%
Acemagic F2A
Kingston OM8SEP1024Q-A0
3010 MB/s -42%
Seq Write
Aoostar GEM10
BIWIN CE980Y28900-1TB
3970 MB/s +50%
Geekom A5
Lexar NM620 512GB
2714 MB/s +3%
Asus NUC 14 Pro
Kingston KC3000 2048G SKC3000D2048G
2646 MB/s
Geekom AE7
Wodposit NVMe SSD 1024 GB
2526 MB/s -5%
Acemagic F2A
Kingston OM8SEP1024Q-A0
2369 MB/s -10%
Average of class Mini PC
  (242 - 5783, n=116, last 2 years)
2290 MB/s -13%
Minisforum UH125 Pro
Kingston OM8PGP41024Q-A0
1787 MB/s -32%
4K Read
Aoostar GEM10
BIWIN CE980Y28900-1TB
68.4 MB/s +8%
Asus NUC 14 Pro
Kingston KC3000 2048G SKC3000D2048G
63.6 MB/s
Average of class Mini PC
  (18.2 - 104.3, n=116, last 2 years)
59.7 MB/s -6%
Geekom A5
Lexar NM620 512GB
57.7 MB/s -9%
Minisforum UH125 Pro
Kingston OM8PGP41024Q-A0
57.3 MB/s -10%
Geekom AE7
Wodposit NVMe SSD 1024 GB
55.2 MB/s -13%
Acemagic F2A
Kingston OM8SEP1024Q-A0
41.8 MB/s -34%
4K Write
Acemagic F2A
Kingston OM8SEP1024Q-A0
196.9 MB/s +16%
Aoostar GEM10
BIWIN CE980Y28900-1TB
196.5 MB/s +16%
Geekom AE7
Wodposit NVMe SSD 1024 GB
195.5 MB/s +15%
Minisforum UH125 Pro
Kingston OM8PGP41024Q-A0
182.1 MB/s +7%
Average of class Mini PC
  (30.9 - 366, n=116, last 2 years)
177.3 MB/s +5%
Asus NUC 14 Pro
Kingston KC3000 2048G SKC3000D2048G
169.5 MB/s
Geekom A5
Lexar NM620 512GB
125.5 MB/s -26%
4K-64 Read
Aoostar GEM10
BIWIN CE980Y28900-1TB
1614 MB/s +132%
Geekom AE7
Wodposit NVMe SSD 1024 GB
1313 MB/s +89%
Acemagic F2A
Kingston OM8SEP1024Q-A0
1218 MB/s +75%
Average of class Mini PC
  (23.4 - 3220, n=116, last 2 years)
1192 MB/s +72%
Geekom A5
Lexar NM620 512GB
1143 MB/s +64%
Asus NUC 14 Pro
Kingston KC3000 2048G SKC3000D2048G
695 MB/s
Minisforum UH125 Pro
Kingston OM8PGP41024Q-A0
658 MB/s -5%
4K-64 Write
Geekom AE7
Wodposit NVMe SSD 1024 GB
3311 MB/s +15%
Asus NUC 14 Pro
Kingston KC3000 2048G SKC3000D2048G
2878 MB/s
Aoostar GEM10
BIWIN CE980Y28900-1TB
2370 MB/s -18%
Minisforum UH125 Pro
Kingston OM8PGP41024Q-A0
1945 MB/s -32%
Acemagic F2A
Kingston OM8SEP1024Q-A0
1649 MB/s -43%
Average of class Mini PC
  (32.8 - 3731, n=116, last 2 years)
1497 MB/s -48%
Geekom A5
Lexar NM620 512GB
1342 MB/s -53%
Access Time Read
Minisforum UH125 Pro
Kingston OM8PGP41024Q-A0
0.101 ms * -91%
Aoostar GEM10
BIWIN CE980Y28900-1TB
0.098 ms * -85%
Average of class Mini PC
  (0.022 - 0.489, n=116, last 2 years)
0.09784 ms * -85%
Geekom A5
Lexar NM620 512GB
0.08 ms * -51%
Geekom AE7
Wodposit NVMe SSD 1024 GB
0.077 ms * -45%
Asus NUC 14 Pro
Kingston KC3000 2048G SKC3000D2048G
0.053 ms *
Acemagic F2A
Kingston OM8SEP1024Q-A0
0.046 ms * +13%
Access Time Write
Geekom A5
Lexar NM620 512GB
0.13 ms * -202%
Acemagic F2A
Kingston OM8SEP1024Q-A0
0.126 ms * -193%
Average of class Mini PC
  (0.014 - 0.765, n=116, last 2 years)
0.1128 ms * -162%
Aoostar GEM10
BIWIN CE980Y28900-1TB
0.061 ms * -42%
Asus NUC 14 Pro
Kingston KC3000 2048G SKC3000D2048G
0.043 ms *
Minisforum UH125 Pro
Kingston OM8PGP41024Q-A0
0.024 ms * +44%
Geekom AE7
Wodposit NVMe SSD 1024 GB
0.023 ms * +47%

* ... im mniej tym lepiej

Continuous read: DiskSpd Read Loop, Queue Depth 8

036072010801440180021602520288032403600396043204680504054005760612064806840Tooltip
Asus NUC 14 Pro Kingston KC3000 2048G SKC3000D2048G; diskspd 2.0.17 f: Ø6306 (1073.74-7111.48)
Geekom AE7 Wodposit NVMe SSD 1024 GB; diskspd 2.0.17 f: Ø4932 (4634.29-4944.25)
Minisforum UH125 Pro Kingston OM8PGP41024Q-A0; diskspd 2.0.17 f: Ø4790 (4223.81-4803.95)
Aoostar GEM10 BIWIN CE980Y28900-1TB; diskspd 2.0.17 f: Ø4833 (4418.07-4847.99)
Acemagic F2A Kingston OM8SEP1024Q-A0; diskspd 2.0.17 f: Ø1320 (771.89-3141.95)
Geekom A5 Lexar NM620 512GB: Ø3437 (3126.47-3454.22)

Karta graficzna

Wydajność 3D Asusa NUC 14 Pro jest zauważalnie lepsza niż starszego Intel Iris Xe G7 z 96 EU dzięki poprawionej architekturze Intel Arc. Jednakże Intel Arc 7-rdzeniowy iGPU nie nadąża za AMD Radeon 780M. Niemniej jednak, Asus NUC 14 Pro zapewnia wyjątkową wydajność, ponieważ nasza próbka testowa wygrywa porównanie z Acemagic F2A w kilku testach.

Dalsze porównania i testy porównawcze można znaleźć w naszej tabeli porównawczej GPU Mobile Graphics Cards - Benchmark List .

3DMark Performance Rating - Percent
Geekom AE7
AMD Radeon 780M, AMD Ryzen 9 7940HS
97.6 pt
Asus NUC 14 Pro
Intel Arc 7-Core iGPU, Intel Core Ultra 5 125H
93 pt
Acemagic F2A
Intel Arc 8-Core iGPU, Intel Core Ultra 7 155H
92.9 pt
Aoostar GEM10
AMD Radeon 680M, AMD Ryzen 7 6800H
84.6 pt
Minisforum UH125 Pro
Intel Arc 7-Core iGPU, Intel Core Ultra 5 125H
81.8 pt
Geekom A5
AMD Radeon RX Vega 8 (Ryzen 4000/5000), AMD Ryzen 7 5800H
49.9 pt
3DMark 11 - 1280x720 Performance GPU
Geekom AE7
AMD Radeon 780M, AMD Ryzen 9 7940HS
13824 Points +17%
Acemagic F2A
Intel Arc 8-Core iGPU, Intel Core Ultra 7 155H
12085 Points +3%
Asus NUC 14 Pro
Intel Arc 7-Core iGPU, Intel Core Ultra 5 125H
11785 Points
Aoostar GEM10
AMD Radeon 680M, AMD Ryzen 7 6800H
11668 Points -1%
Minisforum UH125 Pro
Intel Arc 7-Core iGPU, Intel Core Ultra 5 125H
10303 Points -13%
Geekom A5
AMD Radeon RX Vega 8 (Ryzen 4000/5000), AMD Ryzen 7 5800H
7101 Points -40%
3DMark
2560x1440 Time Spy Graphics
Acemagic F2A
Intel Arc 8-Core iGPU, Intel Core Ultra 7 155H
3205 Points 0%
Asus NUC 14 Pro
Intel Arc 7-Core iGPU, Intel Core Ultra 5 125H
3205 Points
Geekom AE7
AMD Radeon 780M, AMD Ryzen 9 7940HS
2970 Points -7%
Minisforum UH125 Pro
Intel Arc 7-Core iGPU, Intel Core Ultra 5 125H
2796 Points -13%
Aoostar GEM10
AMD Radeon 680M, AMD Ryzen 7 6800H
2518 Points -21%
Geekom A5
AMD Radeon RX Vega 8 (Ryzen 4000/5000), AMD Ryzen 7 5800H
1418 Points -56%
1920x1080 Fire Strike Graphics
Geekom AE7
AMD Radeon 780M, AMD Ryzen 9 7940HS
8437 Points +7%
Asus NUC 14 Pro
Intel Arc 7-Core iGPU, Intel Core Ultra 5 125H
7900 Points
Acemagic F2A
Intel Arc 8-Core iGPU, Intel Core Ultra 7 155H
7710 Points -2%
Aoostar GEM10
AMD Radeon 680M, AMD Ryzen 7 6800H
7653 Points -3%
Minisforum UH125 Pro
Intel Arc 7-Core iGPU, Intel Core Ultra 5 125H
7047 Points -11%
Geekom A5
AMD Radeon RX Vega 8 (Ryzen 4000/5000), AMD Ryzen 7 5800H
4567 Points -42%
Unigine Heaven 4.0
Extreme Preset OpenGL
Aoostar GEM10
AMD Radeon 680M, AMD Ryzen 7 6800H
37 fps +11%
Asus NUC 14 Pro
Intel Arc 7-Core iGPU, Intel Core Ultra 5 125H
33.3 fps
Geekom AE7
AMD Radeon 780M, AMD Ryzen 9 7940HS
33.2 fps 0%
Acemagic F2A
Intel Arc 8-Core iGPU, Intel Core Ultra 7 155H
31.6 fps -5%
Minisforum UH125 Pro
Intel Arc 7-Core iGPU, Intel Core Ultra 5 125H
29.6 fps -11%
Geekom A5
AMD Radeon RX Vega 8 (Ryzen 4000/5000), AMD Ryzen 7 5800H
22.8 fps -32%
Extreme Preset DX11
Geekom AE7
AMD Radeon 780M, AMD Ryzen 9 7940HS
36.1 fps +5%
Aoostar GEM10
AMD Radeon 680M, AMD Ryzen 7 6800H
34.7 fps +1%
Asus NUC 14 Pro
Intel Arc 7-Core iGPU, Intel Core Ultra 5 125H
34.5 fps
Acemagic F2A
Intel Arc 8-Core iGPU, Intel Core Ultra 7 155H
32.7 fps -5%
Minisforum UH125 Pro
Intel Arc 7-Core iGPU, Intel Core Ultra 5 125H
31.5 fps -9%
Geekom A5
AMD Radeon RX Vega 8 (Ryzen 4000/5000), AMD Ryzen 7 5800H
22 fps -36%
Unigine Valley 1.0
1920x1080 Extreme HD DirectX AA:x8
Geekom AE7
AMD Radeon 780M, AMD Ryzen 9 7940HS
24.5 fps +30%
Aoostar GEM10
AMD Radeon 680M, AMD Ryzen 7 6800H
23.7 fps +26%
Asus NUC 14 Pro
Intel Arc 7-Core iGPU, Intel Core Ultra 5 125H
18.8 fps
Acemagic F2A
Intel Arc 8-Core iGPU, Intel Core Ultra 7 155H
17.1 fps -9%
Minisforum UH125 Pro
Intel Arc 7-Core iGPU, Intel Core Ultra 5 125H
16.9 fps -10%
Geekom A5
AMD Radeon RX Vega 8 (Ryzen 4000/5000), AMD Ryzen 7 5800H
14.2 fps -24%
1920x1080 Extreme HD Preset OpenGL AA:x8
Aoostar GEM10
AMD Radeon 680M, AMD Ryzen 7 6800H
25.5 fps +26%
Asus NUC 14 Pro
Intel Arc 7-Core iGPU, Intel Core Ultra 5 125H
20.2 fps
Geekom AE7
AMD Radeon 780M, AMD Ryzen 9 7940HS
19.2 fps -5%
Acemagic F2A
Intel Arc 8-Core iGPU, Intel Core Ultra 7 155H
18.3 fps -9%
Minisforum UH125 Pro
Intel Arc 7-Core iGPU, Intel Core Ultra 5 125H
18.3 fps -9%
Geekom A5
AMD Radeon RX Vega 8 (Ryzen 4000/5000), AMD Ryzen 7 5800H
14.7 fps -27%
Unigine Superposition
1280x720 720p Low
Geekom AE7
AMD Radeon 780M, AMD Ryzen 9 7940HS
12146 Points +12%
Aoostar GEM10
AMD Radeon 680M, AMD Ryzen 7 6800H
11940 Points +10%
Asus NUC 14 Pro
Intel Arc 7-Core iGPU, Intel Core Ultra 5 125H
10872 Points
Acemagic F2A
Intel Arc 8-Core iGPU, Intel Core Ultra 7 155H
10491 Points -4%
Minisforum UH125 Pro
Intel Arc 7-Core iGPU, Intel Core Ultra 5 125H
10026 Points -8%
Geekom A5
AMD Radeon RX Vega 8 (Ryzen 4000/5000), AMD Ryzen 7 5800H
7952 Points -27%
1920x1080 1080p High
Geekom AE7
AMD Radeon 780M, AMD Ryzen 9 7940HS
3698 Points +2%
Asus NUC 14 Pro
Intel Arc 7-Core iGPU, Intel Core Ultra 5 125H
3609 Points
Acemagic F2A
Intel Arc 8-Core iGPU, Intel Core Ultra 7 155H
3391 Points -6%
Aoostar GEM10
AMD Radeon 680M, AMD Ryzen 7 6800H
3380 Points -6%
Minisforum UH125 Pro
Intel Arc 7-Core iGPU, Intel Core Ultra 5 125H
3066 Points -15%
Geekom A5
AMD Radeon RX Vega 8 (Ryzen 4000/5000), AMD Ryzen 7 5800H
1949 Points -46%
1920x1080 1080p Extreme
Asus NUC 14 Pro
Intel Arc 7-Core iGPU, Intel Core Ultra 5 125H
1981 Points
Acemagic F2A
Intel Arc 8-Core iGPU, Intel Core Ultra 7 155H
1920 Points -3%
Geekom AE7
AMD Radeon 780M, AMD Ryzen 9 7940HS
1803 Points -9%
Minisforum UH125 Pro
Intel Arc 7-Core iGPU, Intel Core Ultra 5 125H
1686 Points -15%
Aoostar GEM10
AMD Radeon 680M, AMD Ryzen 7 6800H
1424 Points -28%
Geekom A5
AMD Radeon RX Vega 8 (Ryzen 4000/5000), AMD Ryzen 7 5800H
914 Points -54%
ComputeMark v2.1
1024x600 Normal, Score
Geekom AE7
AMD Radeon 780M, AMD Ryzen 9 7940HS
9806 Points +46%
Acemagic F2A
Intel Arc 8-Core iGPU, Intel Core Ultra 7 155H
7480 Points +12%
Aoostar GEM10
AMD Radeon 680M, AMD Ryzen 7 6800H
6763 Points +1%
Asus NUC 14 Pro
Intel Arc 7-Core iGPU, Intel Core Ultra 5 125H
6698 Points
Minisforum UH125 Pro
Intel Arc 7-Core iGPU, Intel Core Ultra 5 125H
5613 Points -16%
Geekom A5
AMD Radeon RX Vega 8 (Ryzen 4000/5000), AMD Ryzen 7 5800H
4020 Points -40%
1024x600 Normal, Fluid 3DTex
Asus NUC 14 Pro
Intel Arc 7-Core iGPU, Intel Core Ultra 5 125H
490 Points
Geekom AE7
AMD Radeon 780M, AMD Ryzen 9 7940HS
481 Points -2%
Minisforum UH125 Pro
Intel Arc 7-Core iGPU, Intel Core Ultra 5 125H
471 Points -4%
Acemagic F2A
Intel Arc 8-Core iGPU, Intel Core Ultra 7 155H
427 Points -13%
Aoostar GEM10
AMD Radeon 680M, AMD Ryzen 7 6800H
427 Points -13%
Geekom A5
AMD Radeon RX Vega 8 (Ryzen 4000/5000), AMD Ryzen 7 5800H
296 Points -40%
1024x600 Normal, Fluid 2DTexArr
Geekom AE7
AMD Radeon 780M, AMD Ryzen 9 7940HS
486 Points +3%
Asus NUC 14 Pro
Intel Arc 7-Core iGPU, Intel Core Ultra 5 125H
472 Points
Aoostar GEM10
AMD Radeon 680M, AMD Ryzen 7 6800H
468 Points -1%
Minisforum UH125 Pro
Intel Arc 7-Core iGPU, Intel Core Ultra 5 125H
439 Points -7%
Acemagic F2A
Intel Arc 8-Core iGPU, Intel Core Ultra 7 155H
422 Points -11%
Geekom A5
AMD Radeon RX Vega 8 (Ryzen 4000/5000), AMD Ryzen 7 5800H
280 Points -41%
1024x600 Normal, Mandel Vector
Geekom AE7
AMD Radeon 780M, AMD Ryzen 9 7940HS
2560 Points +49%
Acemagic F2A
Intel Arc 8-Core iGPU, Intel Core Ultra 7 155H
1961 Points +14%
Aoostar GEM10
AMD Radeon 680M, AMD Ryzen 7 6800H
1900 Points +11%
Asus NUC 14 Pro
Intel Arc 7-Core iGPU, Intel Core Ultra 5 125H
1715 Points
Minisforum UH125 Pro
Intel Arc 7-Core iGPU, Intel Core Ultra 5 125H
1447 Points -16%
Geekom A5
AMD Radeon RX Vega 8 (Ryzen 4000/5000), AMD Ryzen 7 5800H
1236 Points -28%
1024x600 Normal, Mandel Scalar
Geekom AE7
AMD Radeon 780M, AMD Ryzen 9 7940HS
2614 Points +92%
Aoostar GEM10
AMD Radeon 680M, AMD Ryzen 7 6800H
1812 Points +33%
Acemagic F2A
Intel Arc 8-Core iGPU, Intel Core Ultra 7 155H
1594 Points +17%
Asus NUC 14 Pro
Intel Arc 7-Core iGPU, Intel Core Ultra 5 125H
1360 Points
Minisforum UH125 Pro
Intel Arc 7-Core iGPU, Intel Core Ultra 5 125H
1112 Points -18%
Geekom A5
AMD Radeon RX Vega 8 (Ryzen 4000/5000), AMD Ryzen 7 5800H
1062 Points -22%
1024x600 Normal, QJuliaRayTrace
Geekom AE7
AMD Radeon 780M, AMD Ryzen 9 7940HS
3665 Points +38%
Acemagic F2A
Intel Arc 8-Core iGPU, Intel Core Ultra 7 155H
3076 Points +16%
Asus NUC 14 Pro
Intel Arc 7-Core iGPU, Intel Core Ultra 5 125H
2662 Points
Aoostar GEM10
AMD Radeon 680M, AMD Ryzen 7 6800H
2157 Points -19%
Minisforum UH125 Pro
Intel Arc 7-Core iGPU, Intel Core Ultra 5 125H
2143 Points -19%
Geekom A5
AMD Radeon RX Vega 8 (Ryzen 4000/5000), AMD Ryzen 7 5800H
1145 Points -57%
LuxMark v2.0 64Bit
Room GPUs-only
Geekom AE7
AMD Radeon 780M, AMD Ryzen 9 7940HS
1025 Samples/s +28%
Asus NUC 14 Pro
Intel Arc 7-Core iGPU, Intel Core Ultra 5 125H
801 Samples/s
Minisforum UH125 Pro
Intel Arc 7-Core iGPU, Intel Core Ultra 5 125H
710 Samples/s -11%
Aoostar GEM10
AMD Radeon 680M, AMD Ryzen 7 6800H
567 Samples/s -29%
Acemagic F2A
Intel Arc 8-Core iGPU, Intel Core Ultra 7 155H
549 Samples/s -31%
Sala GPUs-only
Asus NUC 14 Pro
Intel Arc 7-Core iGPU, Intel Core Ultra 5 125H
2807 Samples/s
Minisforum UH125 Pro
Intel Arc 7-Core iGPU, Intel Core Ultra 5 125H
2517 Samples/s -10%
Acemagic F2A
Intel Arc 8-Core iGPU, Intel Core Ultra 7 155H
2319 Samples/s -17%
Geekom AE7
AMD Radeon 780M, AMD Ryzen 9 7940HS
2312 Samples/s -18%
Aoostar GEM10
AMD Radeon 680M, AMD Ryzen 7 6800H
1288 Samples/s -54%
Affinity Photo 2 - Combined (Single / Multi GPU)
Minisforum UH125 Pro
Intel Arc 7-Core iGPU, Intel Core Ultra 5 125H
5244 Points +3%
Asus NUC 14 Pro
Intel Arc 7-Core iGPU, Intel Core Ultra 5 125H
5105 Points
Acemagic F2A
Intel Arc 8-Core iGPU, Intel Core Ultra 7 155H
4928 Points -3%
Aoostar GEM10
AMD Radeon 680M, AMD Ryzen 7 6800H
2339 Points -54%
Geekom AE7
AMD Radeon 780M, AMD Ryzen 9 7940HS
1889 Points -63%
Geekom A5
AMD Radeon RX Vega 8 (Ryzen 4000/5000), AMD Ryzen 7 5800H
1683 Points -67%
Asus NUC 14 Pro, Intel Arc 7-Core iGPU
Ultra 5 125H
Geekom AE7, AMD Radeon 780M
R9 7940HS
Minisforum UH125 Pro, Intel Arc 7-Core iGPU
Ultra 5 125H
Aoostar GEM10, AMD Radeon 680M
R7 6800H
Acemagic F2A, Intel Arc 8-Core iGPU
Ultra 7 155H
Geekom A5, AMD Radeon RX Vega 8 (Ryzen 4000/5000)
R7 5800H
Average of class Mini PC
 
SPECviewperf 2020
236%
-8%
217%
1%
83%
154%
3840x2160 Medical (medical-03)
5.87
12.7
116%
4.8
-18%
10.7
82%
5.05
-14%
4.82
-18%
3840x2160 Energy (energy-03)
3.81
14.4
278%
3.38
-11%
10.6
178%
4.61
21%
5.33
40%
3840x2160 Creo (creo-03)
15.3
30.2
97%
15.4
1%
32
109%
17.9
17%
19.1
25%
3840x2160 CATIA (catia-06)
10.4
23.7
128%
9.7
-7%
22.8
119%
10
-4%
13.1
26%
3840x2160 3ds Max (3dsmax-07)
14.5
20.7
43%
13.2
-9%
18.9
30%
12.9
-11%
11.3
-22%
3840x2160 Siemens NX (snx-04)
5.82
61.3
953%
5.54
-5%
61.4
955%
5.7
-2%
38
553%
3840x2160 Maya (maya-06)
34.7
47.4
37%
32.8
-5%
49.7
43%
35.4
2%
25.8
-26%
3DMark 05 Standard
48550 pkt.
3DMark 06 Standard Score
40475 pkt.
3DMark Vantage P Result
39395 pkt.
3DMark 11 Performance
11870 pkt.
3DMark Ice Storm Standard Score
126152 pkt.
3DMark Cloud Gate Standard Score
29960 pkt.
3DMark Fire Strike Score
7302 pkt.
3DMark Fire Strike Extreme Score
3819 pkt.
3DMark Time Spy Score
3540 pkt.
3DMark Steel Nomad Score
699 pkt.
3DMark Steel Nomad Light Score
2798 pkt.
Pomoc

Wydajność w grach

Asus NUC 14 Pro nadaje się do nowoczesnych gier tylko w ograniczonym zakresie. W porównaniu do starszego Intel Iris Xe G7 z 96 EU, wydajność w grach może jednak ulec zauważalnej poprawie. Intel przegrywa pojedynek z iGPU AMD wyraźniej niż w testach syntetycznych pod względem wydajności 3D. Aby lepiej sklasyfikować wydajność iGPU, odsyłamy do naszej Listy gier GPU.

GTA V
1024x768 Lowest Settings possible
Geekom AE7
Radeon 780M, R9 7940HS, Wodposit NVMe SSD 1024 GB
168 (6.33min, 125P1) fps +7%
Acemagic F2A
Arc 8-Core, Ultra 7 155H, Kingston OM8SEP1024Q-A0
161 (4.76min, 100P1) fps +3%
Asus NUC 14 Pro
Arc 7-Core, Ultra 5 125H, Kingston KC3000 2048G SKC3000D2048G
156.3 (4.92min, 90.9P1) fps
Aoostar GEM10
Radeon 680M, R7 6800H, BIWIN CE980Y28900-1TB
145.3 (5.31min, 100P1) fps -7%
Geekom A5
Vega 8, R7 5800H, Lexar NM620 512GB
140.1 (17.4min, 90.9P1) fps -10%
Minisforum UH125 Pro
Arc 7-Core, Ultra 5 125H, Kingston OM8PGP41024Q-A0
132.4 (4.93min, 90.9P1) fps -15%
1920x1080 High/On (Advanced Graphics Off) AA:2xMSAA + FX AF:8x
Geekom AE7
Radeon 780M, R9 7940HS, Wodposit NVMe SSD 1024 GB
65.1 (2.93min, 29.4P1) fps +63%
Aoostar GEM10
Radeon 680M, R7 6800H, BIWIN CE980Y28900-1TB
53.9 (3.82min, 38.5P1) fps +35%
Asus NUC 14 Pro
Arc 7-Core, Ultra 5 125H, Kingston KC3000 2048G SKC3000D2048G
39.9 (3.1min, 29.4P1) fps
Minisforum UH125 Pro
Arc 7-Core, Ultra 5 125H, Kingston OM8PGP41024Q-A0
38.9 (3.15min, 28.6P1) fps -3%
Geekom A5
Vega 8, R7 5800H, Lexar NM620 512GB
35.1 (10.8min, 25.6P1) fps -12%
Acemagic F2A
Arc 8-Core, Ultra 7 155H, Kingston OM8SEP1024Q-A0
31.3 (2.94min, 22.7P1) fps -22%
Dota 2 Reborn
1280x720 min (0/3) fastest
Geekom AE7
Radeon 780M, R9 7940HS, Wodposit NVMe SSD 1024 GB
163 (143.1min) fps +68%
Geekom A5
Vega 8, R7 5800H, Lexar NM620 512GB
129.5 (112.6min) fps +33%
Aoostar GEM10
Radeon 680M, R7 6800H, BIWIN CE980Y28900-1TB
124 (8.9min) fps +28%
Acemagic F2A
Arc 8-Core, Ultra 7 155H, Kingston OM8SEP1024Q-A0
103.2 (59.8min) fps +6%
Asus NUC 14 Pro
Arc 7-Core, Ultra 5 125H, Kingston KC3000 2048G SKC3000D2048G
97.1 (61.8min) fps
Minisforum UH125 Pro
Arc 7-Core, Ultra 5 125H, Kingston OM8PGP41024Q-A0
95.5 (63.7min) fps -2%
1920x1080 high (2/3)
Geekom AE7
Radeon 780M, R9 7940HS, Wodposit NVMe SSD 1024 GB
89.8 (75.7min) fps +18%
Aoostar GEM10
Radeon 680M, R7 6800H, BIWIN CE980Y28900-1TB
81.6 (72.3min) fps +8%
Acemagic F2A
Arc 8-Core, Ultra 7 155H, Kingston OM8SEP1024Q-A0
77.3 (52.5min) fps +2%
Asus NUC 14 Pro
Arc 7-Core, Ultra 5 125H, Kingston KC3000 2048G SKC3000D2048G
75.9 (45.7min) fps
Minisforum UH125 Pro
Arc 7-Core, Ultra 5 125H, Kingston OM8PGP41024Q-A0
73.6 (47.5min) fps -3%
Geekom A5
Vega 8, R7 5800H, Lexar NM620 512GB
67.7 (59.9min) fps -11%
Cyberpunk 2077 2.1 Phantom Liberty
1920x1080 Low Preset (FSR off)
Geekom AE7
Radeon 780M, R9 7940HS, Wodposit NVMe SSD 1024 GB
45 (38min) fps +50%
Aoostar GEM10
Radeon 680M, R7 6800H, BIWIN CE980Y28900-1TB
34.8 (29.9min) fps +16%
Asus NUC 14 Pro
Arc 7-Core, Ultra 5 125H, Kingston KC3000 2048G SKC3000D2048G
30.1 (25.8min) fps
Acemagic F2A
Arc 8-Core, Ultra 7 155H, Kingston OM8SEP1024Q-A0
29.5 (24.1min) fps -2%
Minisforum UH125 Pro
Arc 7-Core, Ultra 5 125H, Kingston OM8PGP41024Q-A0
29.5 (25.4min) fps -2%
1920x1080 High Preset (FSR off)
Geekom AE7
Radeon 780M, R9 7940HS, Wodposit NVMe SSD 1024 GB
27.4 (23.1min) fps +26%
Asus NUC 14 Pro
Arc 7-Core, Ultra 5 125H, Kingston KC3000 2048G SKC3000D2048G
21.7 (18.8min) fps
Aoostar GEM10
Radeon 680M, R7 6800H, BIWIN CE980Y28900-1TB
21.3 (18.4min) fps -2%
Minisforum UH125 Pro
Arc 7-Core, Ultra 5 125H, Kingston OM8PGP41024Q-A0
20.6 (17.9min) fps -5%
Acemagic F2A
Arc 8-Core, Ultra 7 155H, Kingston OM8SEP1024Q-A0
20.4 (13.8min) fps -6%
Baldur's Gate 3
1280x720 Low Preset
Geekom AE7
Radeon 780M, R9 7940HS, Wodposit NVMe SSD 1024 GB
67.4 (22.7min, 28.3P0.1, 43.6P1) fps +34%
Asus NUC 14 Pro
Arc 7-Core, Ultra 5 125H, Kingston KC3000 2048G SKC3000D2048G
50.2 (27.7min, 29.7P0.1, 32.6P1) fps
Aoostar GEM10
Radeon 680M, R7 6800H, BIWIN CE980Y28900-1TB
48.9 (16.6min, 29.1P0.1, 36.8P1) fps -3%
Minisforum UH125 Pro
Arc 7-Core, Ultra 5 125H, Kingston OM8PGP41024Q-A0
45 (14.9min, 19.4P0.1, 29P1) fps -10%
1920x1080 High Preset
Geekom AE7
Radeon 780M, R9 7940HS, Wodposit NVMe SSD 1024 GB
25.7 (11min, 11.5P0.1, 14.5P1) fps +15%
Aoostar GEM10
Radeon 680M, R7 6800H, BIWIN CE980Y28900-1TB
23.3 (16.6min, 16.7P0.1, 18.3P1) fps +4%
Asus NUC 14 Pro
Arc 7-Core, Ultra 5 125H, Kingston KC3000 2048G SKC3000D2048G
22.4 (14min, 14.2P0.1, 15.3P1) fps
Minisforum UH125 Pro
Arc 7-Core, Ultra 5 125H, Kingston OM8PGP41024Q-A0
19.5 (9.2min, 10.4P0.1, 12.7P1) fps -13%
F1 24
1920x1080 Low Preset AA:T AF:16x
Geekom AE7
Radeon 780M, R9 7940HS, Wodposit NVMe SSD 1024 GB
94.8 (81min, 64P1) fps +43%
Asus NUC 14 Pro
Arc 7-Core, Ultra 5 125H, Kingston KC3000 2048G SKC3000D2048G
66.2 (56min, 54P1) fps
Minisforum UH125 Pro
Arc 7-Core, Ultra 5 125H, Kingston OM8PGP41024Q-A0
64.3 (55min, 53P1) fps -3%
1920x1080 High Preset AA:T AF:16x
Geekom AE7
Radeon 780M, R9 7940HS, Wodposit NVMe SSD 1024 GB
59.5 (50min, 41P1) fps +37%
Asus NUC 14 Pro
Arc 7-Core, Ultra 5 125H, Kingston KC3000 2048G SKC3000D2048G
43.4 (34min, 35P1) fps
Minisforum UH125 Pro
Arc 7-Core, Ultra 5 125H, Kingston OM8PGP41024Q-A0
41.7 (34min, 34P1) fps -4%

FPS chart

05101520Tooltip
Asus NUC 14 Pro Ultra 5 125H, Arc 7-Core: Ø18.5 (12.6-20.7)
lowmed.highultra
GTA V (2015) 156.3 148.8 39.9 16.6
Dota 2 Reborn (2015) 97.1 79.2 75.9 72.9
Final Fantasy XV Benchmark (2018) 60.6 35.4 25.3
X-Plane 11.11 (2018) 47.5 38.5 32.9
Baldur's Gate 3 (2023) 33.5 25.9 22.4 21.5
Cyberpunk 2077 2.1 Phantom Liberty (2023) 30.1 25.2 21.7 19.6
F1 24 (2024) 66.2 57.6 43.4

Test wydajności Asus NUC 14 Pro z kartą graficzną Nvidia GeForce RTX 3060 Ti

Wydajność 3D może zostać zauważalnie poprawiona dzięki zewnętrznej karcie graficznej. Zewnętrzne akceleratory 3D można jednak podłączyć tylko przez USB-C. Bez wpływu na ogólną ocenę, przeprowadziliśmy kilka testów w połączeniu z Razer Core X i kartą graficzną Nvidia GeForce RTX 3060 Ti. Konsekwentnie widzimy poprawę wydajności 3D, a nawet w nowoczesne gry można teraz grać bez żadnych problemów. W porównaniu z Minisforum UH125 Proasus NUC 14 Pro zapewnia identyczną wydajność.

Performance Rating - Percent
Geekom XT13 Pro (Nvidia GeForce RTX 3060 Ti FE)
Intel Core i9-13900H
99.2 pt
Geekom AX8 Pro (Nvidia GeForce RTX 3060 Ti FE)
AMD Ryzen 9 8945HS
98.6 pt
Asus NUC 14 Pro (Nvidia GeForce RTX 3060 Ti FE)
Intel Core Ultra 5 125H
97.4 pt
Minisforum UH125 Pro (Nvidia GeForce RTX 3060 Ti FE)
Intel Core Ultra 5 125H
96.8 pt
3DMark 11 - 1280x720 Performance GPU
Geekom AX8 Pro (Nvidia GeForce RTX 3060 Ti FE)
AMD Ryzen 9 8945HS
34907 Points +196%
Geekom XT13 Pro (Nvidia GeForce RTX 3060 Ti FE)
Intel Core i9-13900H
33454 Points +184%
Minisforum UH125 Pro (Nvidia GeForce RTX 3060 Ti FE)
Intel Core Ultra 5 125H
32085 Points +172%
Asus NUC 14 Pro (Nvidia GeForce RTX 3060 Ti FE)
Intel Core Ultra 5 125H
31917 Points +171%

11785 Points
3DMark
2560x1440 Time Spy Graphics
Geekom AX8 Pro (Nvidia GeForce RTX 3060 Ti FE)
AMD Ryzen 9 8945HS
11180 Points +249%
Geekom XT13 Pro (Nvidia GeForce RTX 3060 Ti FE)
Intel Core i9-13900H
11118 Points +247%
Minisforum UH125 Pro (Nvidia GeForce RTX 3060 Ti FE)
Intel Core Ultra 5 125H
10935 Points +241%
Asus NUC 14 Pro (Nvidia GeForce RTX 3060 Ti FE)
Intel Core Ultra 5 125H
10932 Points +241%

3205 Points
1920x1080 Fire Strike Graphics
Geekom AX8 Pro (Nvidia GeForce RTX 3060 Ti FE)
AMD Ryzen 9 8945HS
25665 Points +225%
Geekom XT13 Pro (Nvidia GeForce RTX 3060 Ti FE)
Intel Core i9-13900H
25415 Points +222%
Minisforum UH125 Pro (Nvidia GeForce RTX 3060 Ti FE)
Intel Core Ultra 5 125H
24809 Points +214%
Asus NUC 14 Pro (Nvidia GeForce RTX 3060 Ti FE)
Intel Core Ultra 5 125H
24767 Points +214%

7900 Points
3840x2160 Fire Strike Ultra Graphics
Geekom AX8 Pro (Nvidia GeForce RTX 3060 Ti FE)
AMD Ryzen 9 8945HS
7103 Points +274%
Geekom XT13 Pro (Nvidia GeForce RTX 3060 Ti FE)
Intel Core i9-13900H
7046 Points +271%
Asus NUC 14 Pro (Nvidia GeForce RTX 3060 Ti FE)
Intel Core Ultra 5 125H
7024 Points +270%
Minisforum UH125 Pro (Nvidia GeForce RTX 3060 Ti FE)
Intel Core Ultra 5 125H
6997 Points +268%

1899 Points
Unigine Superposition
1280x720 720p Low
Geekom AX8 Pro (Nvidia GeForce RTX 3060 Ti FE)
AMD Ryzen 9 8945HS
33452 Points +208%
Geekom XT13 Pro (Nvidia GeForce RTX 3060 Ti FE)
Intel Core i9-13900H
31986 Points +194%
Asus NUC 14 Pro (Nvidia GeForce RTX 3060 Ti FE)
Intel Core Ultra 5 125H
27554 Points +153%
Minisforum UH125 Pro (Nvidia GeForce RTX 3060 Ti FE)
Intel Core Ultra 5 125H
25121 Points +131%

10872 Points
1920x1080 1080p High
Geekom AX8 Pro (Nvidia GeForce RTX 3060 Ti FE)
AMD Ryzen 9 8945HS
15070 Points +318%
Geekom XT13 Pro (Nvidia GeForce RTX 3060 Ti FE)
Intel Core i9-13900H
14959 Points +314%
Asus NUC 14 Pro (Nvidia GeForce RTX 3060 Ti FE)
Intel Core Ultra 5 125H
14910 Points +313%
Minisforum UH125 Pro (Nvidia GeForce RTX 3060 Ti FE)
Intel Core Ultra 5 125H
14859 Points +312%

3609 Points
1920x1080 1080p Extreme
Geekom AX8 Pro (Nvidia GeForce RTX 3060 Ti FE)
AMD Ryzen 9 8945HS
7117 Points +259%
Asus NUC 14 Pro (Nvidia GeForce RTX 3060 Ti FE)
Intel Core Ultra 5 125H
7111 Points +259%
Geekom XT13 Pro (Nvidia GeForce RTX 3060 Ti FE)
Intel Core i9-13900H
7098 Points +258%
Minisforum UH125 Pro (Nvidia GeForce RTX 3060 Ti FE)
Intel Core Ultra 5 125H
7064 Points +257%

1981 Points
3840x2160 4k Optimized
Geekom XT13 Pro (Nvidia GeForce RTX 3060 Ti FE)
Intel Core i9-13900H
9315 Points
Asus NUC 14 Pro (Nvidia GeForce RTX 3060 Ti FE)
Intel Core Ultra 5 125H
9243 Points
Geekom AX8 Pro (Nvidia GeForce RTX 3060 Ti FE)
AMD Ryzen 9 8945HS
9206 Points
Minisforum UH125 Pro (Nvidia GeForce RTX 3060 Ti FE)
Intel Core Ultra 5 125H
9188 Points
7680x4320 8k Optimized
Geekom XT13 Pro (Nvidia GeForce RTX 3060 Ti FE)
Intel Core i9-13900H
4061 Points
Geekom AX8 Pro (Nvidia GeForce RTX 3060 Ti FE)
AMD Ryzen 9 8945HS
4047 Points
Minisforum UH125 Pro (Nvidia GeForce RTX 3060 Ti FE)
Intel Core Ultra 5 125H
4016 Points
Asus NUC 14 Pro (Nvidia GeForce RTX 3060 Ti FE)
Intel Core Ultra 5 125H
4013 Points
Unigine Valley 1.0
1920x1080 Extreme HD DirectX AA:x8
Geekom XT13 Pro (Nvidia GeForce RTX 3060 Ti FE)
Intel Core i9-13900H
142.2 fps +656%
Geekom AX8 Pro (Nvidia GeForce RTX 3060 Ti FE)
AMD Ryzen 9 8945HS
141.7 fps +654%
Asus NUC 14 Pro (Nvidia GeForce RTX 3060 Ti FE)
Intel Core Ultra 5 125H
137.3 fps +630%
Minisforum UH125 Pro (Nvidia GeForce RTX 3060 Ti FE)
Intel Core Ultra 5 125H
135.9 fps +623%

18.8 fps
1920x1080 Extreme HD Preset OpenGL AA:x8
Geekom XT13 Pro (Nvidia GeForce RTX 3060 Ti FE)
Intel Core i9-13900H
137.6 fps +581%
Geekom AX8 Pro (Nvidia GeForce RTX 3060 Ti FE)
AMD Ryzen 9 8945HS
137.6 fps +581%
Asus NUC 14 Pro (Nvidia GeForce RTX 3060 Ti FE)
Intel Core Ultra 5 125H
133.8 fps +562%
Minisforum UH125 Pro (Nvidia GeForce RTX 3060 Ti FE)
Intel Core Ultra 5 125H
133.5 fps +561%

20.2 fps
Unigine Heaven 4.0
Extreme Preset OpenGL
Geekom AX8 Pro (Nvidia GeForce RTX 3060 Ti FE)
AMD Ryzen 9 8945HS
174.9 fps +425%
Geekom XT13 Pro (Nvidia GeForce RTX 3060 Ti FE)
Intel Core i9-13900H
173.5 fps +421%
Asus NUC 14 Pro (Nvidia GeForce RTX 3060 Ti FE)
Intel Core Ultra 5 125H
172.4 fps +418%
Minisforum UH125 Pro (Nvidia GeForce RTX 3060 Ti FE)
Intel Core Ultra 5 125H
172.3 fps +417%

33.3 fps
Extreme Preset DX11
Geekom XT13 Pro (Nvidia GeForce RTX 3060 Ti FE)
Intel Core i9-13900H
164.2 fps +376%
Geekom AX8 Pro (Nvidia GeForce RTX 3060 Ti FE)
AMD Ryzen 9 8945HS
163.2 fps +373%
Minisforum UH125 Pro (Nvidia GeForce RTX 3060 Ti FE)
Intel Core Ultra 5 125H
158.8 fps +360%
Asus NUC 14 Pro (Nvidia GeForce RTX 3060 Ti FE)
Intel Core Ultra 5 125H
158.7 fps +360%

34.5 fps
ComputeMark v2.1
1024x600 Normal, Score
Geekom XT13 Pro (Nvidia GeForce RTX 3060 Ti FE)
Intel Core i9-13900H
27843 Points +316%
Asus NUC 14 Pro (Nvidia GeForce RTX 3060 Ti FE)
Intel Core Ultra 5 125H
27843 Points +316%
Minisforum UH125 Pro (Nvidia GeForce RTX 3060 Ti FE)
Intel Core Ultra 5 125H
27669 Points +313%
Geekom AX8 Pro (Nvidia GeForce RTX 3060 Ti FE)
AMD Ryzen 9 8945HS
26591 Points +297%

6698 Points
1024x600 Normal, Fluid 3DTex
Minisforum UH125 Pro (Nvidia GeForce RTX 3060 Ti FE)
Intel Core Ultra 5 125H
2708 Points +453%
Geekom AX8 Pro (Nvidia GeForce RTX 3060 Ti FE)
AMD Ryzen 9 8945HS
2683 Points +448%
Geekom XT13 Pro (Nvidia GeForce RTX 3060 Ti FE)
Intel Core i9-13900H
2681 Points +447%
Asus NUC 14 Pro (Nvidia GeForce RTX 3060 Ti FE)
Intel Core Ultra 5 125H
2681 Points +447%

490 Points
1024x600 Normal, Fluid 2DTexArr
Minisforum UH125 Pro (Nvidia GeForce RTX 3060 Ti FE)
Intel Core Ultra 5 125H
2641 Points +460%
Geekom AX8 Pro (Nvidia GeForce RTX 3060 Ti FE)
AMD Ryzen 9 8945HS
2618 Points +455%
Geekom XT13 Pro (Nvidia GeForce RTX 3060 Ti FE)
Intel Core i9-13900H
2614 Points +454%
Asus NUC 14 Pro (Nvidia GeForce RTX 3060 Ti FE)
Intel Core Ultra 5 125H
2614 Points +454%

472 Points
1024x600 Normal, Mandel Vector
Geekom XT13 Pro (Nvidia GeForce RTX 3060 Ti FE)
Intel Core i9-13900H
5726 Points +234%
Asus NUC 14 Pro (Nvidia GeForce RTX 3060 Ti FE)
Intel Core Ultra 5 125H
5726 Points +234%
Minisforum UH125 Pro (Nvidia GeForce RTX 3060 Ti FE)
Intel Core Ultra 5 125H
5652 Points +230%
Geekom AX8 Pro (Nvidia GeForce RTX 3060 Ti FE)
AMD Ryzen 9 8945HS
5358 Points +212%

1715 Points
1024x600 Normal, Mandel Scalar
Geekom XT13 Pro (Nvidia GeForce RTX 3060 Ti FE)
Intel Core i9-13900H
6275 Points +361%
Asus NUC 14 Pro (Nvidia GeForce RTX 3060 Ti FE)
Intel Core Ultra 5 125H
6275 Points +361%
Minisforum UH125 Pro (Nvidia GeForce RTX 3060 Ti FE)
Intel Core Ultra 5 125H
6223 Points +358%
Geekom AX8 Pro (Nvidia GeForce RTX 3060 Ti FE)
AMD Ryzen 9 8945HS
5949 Points +337%

1360 Points
1024x600 Normal, QJuliaRayTrace
Geekom XT13 Pro (Nvidia GeForce RTX 3060 Ti FE)
Intel Core i9-13900H
10548 Points +296%
Asus NUC 14 Pro (Nvidia GeForce RTX 3060 Ti FE)
Intel Core Ultra 5 125H
10548 Points +296%
Minisforum UH125 Pro (Nvidia GeForce RTX 3060 Ti FE)
Intel Core Ultra 5 125H
10445 Points +292%
Geekom AX8 Pro (Nvidia GeForce RTX 3060 Ti FE)
AMD Ryzen 9 8945HS
9982 Points +275%

2662 Points
Performance Rating - Percent
Geekom AX8 Pro (Nvidia GeForce RTX 3060 Ti FE)
AMD Ryzen 9 8945HS
99.5 pt
Geekom XT13 Pro (Nvidia GeForce RTX 3060 Ti FE)
Intel Core i9-13900H
94.6 pt
Minisforum UH125 Pro (Nvidia GeForce RTX 3060 Ti FE)
Intel Core Ultra 5 125H
88.3 pt
Asus NUC 14 Pro (Nvidia GeForce RTX 3060 Ti FE)
Intel Core Ultra 5 125H
88 pt
Cyberpunk 2077 2.1 Phantom Liberty
1280x720 Low Preset (FSR off)
Geekom AX8 Pro (Nvidia GeForce RTX 3060 Ti FE)
AMD Ryzen 9 8945HS
103.1 (80.9min - 132.1max) fps +123%
Geekom XT13 Pro (Nvidia GeForce RTX 3060 Ti FE)
Intel Core i9-13900H
88.7 (68min - 118.2max) fps +92%
Asus NUC 14 Pro (Nvidia GeForce RTX 3060 Ti FE)
Intel Core Ultra 5 125H
72.4 (53.9min - 101max) fps +56%
Minisforum UH125 Pro (Nvidia GeForce RTX 3060 Ti FE)
Intel Core Ultra 5 125H
70.2 (53.5min - 91.7max) fps +52%

46.3 (39.2min - 54.8max) fps
1920x1080 Medium Preset (FSR off)
Geekom AX8 Pro (Nvidia GeForce RTX 3060 Ti FE)
AMD Ryzen 9 8945HS
81.5 (65.7min - 103.4max) fps +223%
Geekom XT13 Pro (Nvidia GeForce RTX 3060 Ti FE)
Intel Core i9-13900H
81.4 (65.1min - 102max) fps +223%
Minisforum UH125 Pro (Nvidia GeForce RTX 3060 Ti FE)
Intel Core Ultra 5 125H
72.2 (55.8min - 97.4max) fps +187%
Asus NUC 14 Pro (Nvidia GeForce RTX 3060 Ti FE)
Intel Core Ultra 5 125H
69.8 (50min - 99.9max) fps +177%

25.2 (22.3min - 29max) fps
1920x1080 Ultra Preset (FSR off)
Geekom XT13 Pro (Nvidia GeForce RTX 3060 Ti FE)
Intel Core i9-13900H
64.4 (49.9min - 85.5max) fps +229%
Geekom AX8 Pro (Nvidia GeForce RTX 3060 Ti FE)
AMD Ryzen 9 8945HS
64.3 (50.9min - 85.8max) fps +228%
Minisforum UH125 Pro (Nvidia GeForce RTX 3060 Ti FE)
Intel Core Ultra 5 125H
60.8 (43.6min - 87max) fps +210%
Asus NUC 14 Pro (Nvidia GeForce RTX 3060 Ti FE)
Intel Core Ultra 5 125H
58.3 (36.6min - 87.8max) fps +197%

19.6 (16.7min - 23.6max) fps
Baldur's Gate 3
1920x1080 Low Preset
Geekom XT13 Pro (Nvidia GeForce RTX 3060 Ti FE)
Intel Core i9-13900H
113 (47.4min, 65.4P0.1, 77.5P1 - 215max) fps +237%
Asus NUC 14 Pro (Nvidia GeForce RTX 3060 Ti FE)
Intel Core Ultra 5 125H
111.6 (57.7min, 64.3P0.1, 75.6P1 - 248max) fps +233%
Geekom AX8 Pro (Nvidia GeForce RTX 3060 Ti FE)
AMD Ryzen 9 8945HS
110.9 (57.4min, 66.9P0.1, 76.7P1 - 233max) fps +231%
Minisforum UH125 Pro (Nvidia GeForce RTX 3060 Ti FE)
Intel Core Ultra 5 125H
109.5 (51.8min, 62.3P0.1, 74.4P1 - 198.7max) fps +227%

33.5 (20.9min, 21P0.1, 23.4P1 - 64.9max) fps
1920x1080 Medium Preset
Geekom XT13 Pro (Nvidia GeForce RTX 3060 Ti FE)
Intel Core i9-13900H
91.3 (51.4min, 53.4P0.1, 61.1P1 - 196.3max) fps +253%
Geekom AX8 Pro (Nvidia GeForce RTX 3060 Ti FE)
AMD Ryzen 9 8945HS
89.4 (43.6min, 53.5P0.1, 60P1 - 201max) fps +245%
Minisforum UH125 Pro (Nvidia GeForce RTX 3060 Ti FE)
Intel Core Ultra 5 125H
87.3 (36.9min, 43.6P0.1, 57.2P1 - 191.9max) fps +237%
Asus NUC 14 Pro (Nvidia GeForce RTX 3060 Ti FE)
Intel Core Ultra 5 125H
86 (30.5min, 43.2P0.1, 55.8P1 - 194.6max) fps +232%

25.9 (5.81min, 8.8P0.1, 15.9P1 - 97.2max) fps
1920x1080 Ultra Preset
Geekom XT13 Pro (Nvidia GeForce RTX 3060 Ti FE)
Intel Core i9-13900H
78.5 (46.2min, 47P0.1, 53.1P1 - 179.1max) fps +265%
Geekom AX8 Pro (Nvidia GeForce RTX 3060 Ti FE)
AMD Ryzen 9 8945HS
78.2 (23.4min, 47.3P0.1, 51.1P1 - 216max) fps +264%
Minisforum UH125 Pro (Nvidia GeForce RTX 3060 Ti FE)
Intel Core Ultra 5 125H
76.3 (41.3min, 43.7P0.1, 50P1 - 176.1max) fps +255%
Asus NUC 14 Pro (Nvidia GeForce RTX 3060 Ti FE)
Intel Core Ultra 5 125H
72.1 (20.2min, 24.7P0.1, 31.8P1 - 189.9max) fps +235%

21.5 (13.6min, 13.7P0.1, 14.1P1 - 66max) fps
F1 24
1920x1080 Low Preset AA:T AF:16x
Geekom AX8 Pro (Nvidia GeForce RTX 3060 Ti FE)
AMD Ryzen 9 8945HS
86.5 (48min, 51P1 - 108max) fps +31%
Geekom XT13 Pro (Nvidia GeForce RTX 3060 Ti FE)
Intel Core i9-13900H
76.9 (42min, 44P1 - 96max) fps +16%
Asus NUC 14 Pro (Nvidia GeForce RTX 3060 Ti FE)
Intel Core Ultra 5 125H
75.3 (42min, 44P1 - 92max) fps +14%
Minisforum UH125 Pro (Nvidia GeForce RTX 3060 Ti FE)
Intel Core Ultra 5 125H
72.6 (41min, 43P1 - 87max) fps +10%

66.2 (56min, 54P1 - 77max) fps
1920x1080 Medium Preset AA:T AF:16x
Geekom AX8 Pro (Nvidia GeForce RTX 3060 Ti FE)
AMD Ryzen 9 8945HS
82.3 (47min, 49P1 - 97max) fps +43%
Geekom XT13 Pro (Nvidia GeForce RTX 3060 Ti FE)
Intel Core i9-13900H
73.1 (42min, 43P1 - 86max) fps +27%
Asus NUC 14 Pro (Nvidia GeForce RTX 3060 Ti FE)
Intel Core Ultra 5 125H
71.7 (41min, 43P1 - 84max) fps +24%
Minisforum UH125 Pro (Nvidia GeForce RTX 3060 Ti FE)
Intel Core Ultra 5 125H
70 (41min, 42P1 - 81max) fps +22%

57.6 (47min, 46P1 - 68max) fps
1920x1080 High Preset AA:T AF:16x
Geekom AX8 Pro (Nvidia GeForce RTX 3060 Ti FE)
AMD Ryzen 9 8945HS
68.7 (40min, 40P1 - 82max) fps +58%
Geekom XT13 Pro (Nvidia GeForce RTX 3060 Ti FE)
Intel Core i9-13900H
60.5 (35min, 37P1 - 74max) fps +39%
Asus NUC 14 Pro (Nvidia GeForce RTX 3060 Ti FE)
Intel Core Ultra 5 125H
59.5 (35min, 35P1 - 72max) fps +37%
Minisforum UH125 Pro (Nvidia GeForce RTX 3060 Ti FE)
Intel Core Ultra 5 125H
58.2 (34min, 36P1 - 71max) fps +34%

43.4 (34min, 35P1 - 51max) fps
Asus NUC 14 Pro (Nvidia GeForce RTX 3060 Ti FE),
Ultra 5 125H
Minisforum UH125 Pro (Nvidia GeForce RTX 3060 Ti FE),
Ultra 5 125H
Geekom AX8 Pro (Nvidia GeForce RTX 3060 Ti FE),
R9 8945HS
Geekom XT13 Pro (Nvidia GeForce RTX 3060 Ti FE),
i9-13900H
Average of class Mini PC
 
SPECviewperf 2020
290%
126%
304%
300%
154%
3840x2160 Medical (medical-03)
13
121%
10.9
86%
13
121%
13
121%
3840x2160 Energy (energy-03)
20.9
449%
17.8
367%
21
451%
20.9
449%
3840x2160 Creo (creo-03)
68.3
346%
26.6
74%
77.2
405%
74.2
385%
3840x2160 CATIA (catia-06)
37.3
259%
23.6
127%
39.2
277%
39.4
279%
3840x2160 3ds Max (3dsmax-07)
46.5
221%
28.7
98%
46.1
218%
47.2
226%
3840x2160 Siemens NX (snx-04)
16.2
178%
11.4
96%
16.7
187%
16.5
184%
3840x2160 Maya (maya-06)
193
456%
47.5
37%
198
471%
194
459%
lowmed.highultraQHD4K
GTA V (2015) 178.7 174 162.9 100.6 90 102.6
Dota 2 Reborn (2015) 159 138.8 131 122.6 104.3
Final Fantasy XV Benchmark (2018) 163.8 141 97.3 75.6 47.4
X-Plane 11.11 (2018) 119.6 107.5 83.7 71.7
Baldur's Gate 3 (2023) 111.6 86 72.8 72.1 57.5 36.4
Cyberpunk 2077 2.1 Phantom Liberty (2023) 72.4 69.8 63.7 58.3 43.5 22.2
F1 24 (2024) 75.3 71.7 59.5 41.1 35.7 16.9

Emisje

Emisja hałasu

Asus NUC 14 Pro jest bardzo cichy przez większość czasu. Wentylator pracuje jednak także w trybie bezczynności, więc jego praca nie jest bezgłośna. Przy średnim obciążeniu odnotowaliśmy poziom ciśnienia akustycznego w wysokości 42,4 dB(A). W Minisforum UH125 Pro i Aoostar GEM10 są mniej więcej na tym samym poziomie. Przy maksymalnym obciążeniu nasza próbka testowa osiąga 47,8 dB(A). Oznacza to, że Asus NUC 14 Pro jest wyraźnie słyszalny, choć subiektywne odczucie poziomu hałasu jest nieco niższe.

Hałas

luz
26 / 26.2 / 26.2 dB
obciążenie
42.4 / 47.8 dB
  red to green bar
 
 
30 dB
cichy
40 dB(A)
słyszalny
50 dB(A)
irytujący
 
min: dark, med: mid, max: light   Earthworks M23R (odległość 15 cm)   environment noise: 24 dB(A)
dB(A) 0102030405060708090Deep BassMiddle BassHigh BassLower RangeMidsHigher MidsLower HighsMid HighsUpper HighsSuper Highs2035.53536.236.836.335.435.52533.235.836.532.935.733.733.23133.435.235.835.937.534.333.44029.224.131.53126.726.629.25032.727.625.426.326.327.732.76330.524.124.125.924.327.730.58023.518.318.920.415.120.523.510020.820.717.91817.822.520.812522.319.218.514.813.816.822.316021.219.611.610.911.315.321.220023.921.111.812.211.912.723.925027.322.512.31211.210.927.331526.223.816.916.517.39.326.240027.523.813.313.312.69.327.55002925.313.713.213.38.72963031.227.71312.512.38.931.280034.130.315.215.615.39.334.1100037.432.81514.914.79.837.412503632.312.812.812.410.936160038.734.411.912.3121138.7200040.733.812.312.512.511.740.7250039.233.113.213.613.112.439.2315035.528.913.413.513.313.235.5400033.826.214.214.114.113.833.8500030.524.314.314.314.41430.5630029.223.11514.814.814.929.2800022.117.515.114.91514.922.11000019.417.815.315.215.214.919.4125002424.217.617.717.716.2241600014.915.114.214.214.314.314.9SPL47.842.426.226.22624.947.8N5.43.60.70.70.70.65.4median 29median 24.2median 14.2median 14.1median 13.8median 12.7median 29Delta6.75.31.21.21.42.26.7hearing rangehide median Fan NoiseAsus NUC 14 Pro
Asus NUC 14 Pro
Ultra 5 125H, Arc 7-Core
Geekom AE7
R9 7940HS, Radeon 780M
Minisforum UH125 Pro
Ultra 5 125H, Arc 7-Core
Aoostar GEM10
R7 6800H, Radeon 680M
Acemagic F2A
Ultra 7 155H, Arc 8-Core
Geekom A5
R7 5800H, Vega 8
Noise
-4%
-12%
-13%
-2%
-7%
off / environment *
24
24.4
-2%
24.8
-3%
24.3
-1%
24.9
-4%
25
-4%
Idle Minimum *
26
24.9
4%
35
-35%
36.5
-40%
25.4
2%
28.2
-8%
Idle Average *
26.2
25
5%
35
-34%
36.6
-40%
25.7
2%
28.2
-8%
Idle Maximum *
26.2
25
5%
35
-34%
36.6
-40%
25.7
2%
28.2
-8%
Load Average *
42.4
52
-23%
42.2
-0%
41.7
2%
47.8
-13%
47.8
-13%
Cyberpunk 2077 ultra *
47.7
52
-9%
40.8
14%
40.3
16%
Load Maximum *
47.8
51.4
-8%
43.9
8%
40.8
15%
49
-3%
47.4
1%
Witcher 3 ultra *
40.18
45.23

* ... im mniej tym lepiej

Temperatura

Obudowa Asusa NUC 14 Pro znacznie nagrzewa się w miejscach pod obciążeniem. Na wierzchu odnotowaliśmy maksymalnie 55,1 °C. W trybie bezczynności nie występują żadne zauważalne nieprawidłowości. W teście obciążeniowym z łatwością osiągnęliśmy wartości powyżej 100 °C dla SoC. Według Intela, Intel Core Ultra 5 125H został zaprojektowany do pracy w temperaturze do 110 °C. Osiągnęliśmy to w teście obciążeniowym, chociaż w rezultacie pobór mocy został zmniejszony do około 50 watów. System chłodzenia nie jest w stanie trwale rozproszyć 64 watów zdefiniowanych jako PL1 i PL2.

Test warunków skrajnych Prime95, solo
Test obciążeniowy FurMark, solo
Prime95 i test warunków skrajnych FurMark
Asus NUC 14 Pro podczas testu obciążeniowego (górna strona)
Test obciążeniowy Asus NUC 14 Pro (spód)
Asus NUC 14 Pro podczas testu obciążeniowego (otwarta dolna strona)
Test obciążeniowy Asus NUC 14 Pro (tył)
w stresie
 38.3 °C50.5 °C55.1 °C 
 34.9 °C39.3 °C32.9 °C 
 35.1 °C35.9 °C30.5 °C 
maks. w ogóle: 55.1 °C
średnia: 39.2 °C
36.6 °C38.2 °C39.3 °C
33.6 °C36.1 °C37.7 °C
31.1 °C32.7 °C36.6 °C
maks. w ogóle: 39.3 °C
średnia: 35.8 °C
zasilacz  45.4 °C | temperatura otoczenia 21.4 °C | Fluke t3000FC (calibrated)
(-) The average temperature for the upper side under maximal load is 39.2 °C / 103 F, compared to the average of 32.3 °C / 90 F for the devices in the class Mini PC.
(-) The maximum temperature on the upper side is 55.1 °C / 131 F, compared to the average of 35.8 °C / 96 F, ranging from 24 to 69.5 °C for the class Mini PC.
(+) The bottom heats up to a maximum of 39.3 °C / 103 F, compared to the average of 36.1 °C / 97 F
(+) In idle usage, the average temperature for the upper side is 30.8 °C / 87 F, compared to the device average of 32.3 °C / 90 F.

Zużycie energii

Asus stosunkowo dobrze kontroluje zużycie energii przez NUC 14 Pro. Pod średnim obciążeniem nasza próbka testowa wymaga tylko 55,5 wata, czyli nieco więcej niż Miniforum UH125 Pro. Powodem tego jest nieco wyższy limit mocy, który Asus nakłada na SoC. Krótko zarejestrowaliśmy 103,3 wata, z czym 120-watowy zasilacz z łatwością sobie radzi.

Asus NUC 14 Pro z zasilaczem (19 V; 6,32 A)
Zasilacz (19 V; 6,32 A)
Pobór mocy
wyłączony / stan wstrzymaniadarklight 0.48 / 1 W
luzdarkmidlight 5.1 / 6.4 / 14.7 W
obciążenie midlight 55.5 / 103.3 W
 color bar
Legenda: min: dark, med: mid, max: light        Metrahit Energy
Asus NUC 14 Pro
Ultra 5 125H, Arc 7-Core
Geekom AE7
R9 7940HS, Radeon 780M
Minisforum UH125 Pro
Ultra 5 125H, Arc 7-Core
Aoostar GEM10
R7 6800H, Radeon 680M
Acemagic F2A
Ultra 7 155H, Arc 8-Core
Geekom A5
R7 5800H, Vega 8
Average Intel Arc 7-Core iGPU
 
Average of class Mini PC
 
Power Consumption
3%
-38%
-11%
-29%
-3%
-6%
-35%
Idle Minimum *
5.1
4.5
12%
11.9
-133%
7.3
-43%
9.1
-78%
6.9
-35%
6.88 ?(3 - 11.9, n=6)
-35%
Idle Average *
6.4
4.7
27%
14.6
-128%
8.7
-36%
10.3
-61%
7.9
-23%
9.02 ?(6.3 - 14.6, n=6)
-41%
Idle Maximum *
14.7
8.1
45%
15.4
-5%
10.4
29%
14.4
2%
8.9
39%
12.2 ?(6.5 - 16, n=6)
17%
Load Average *
55.5
81.8
-47%
48.3
13%
67.2
-21%
54.9
1%
60.8
-10%
Cyberpunk 2077 ultra external monitor *
59.1
71.2
-20%
52.7
11%
58.8
1%
Load Maximum *
103.3
100.3
3%
89.8
13%
101.6
2%
110.4
-7%
89.7
13%

* ... im mniej tym lepiej

Efficiency

Performance Rating - Percent
Geekom AE7
AMD Ryzen 9 7940HS, Radeon 780M
96.2 pt
Minisforum UH125 Pro
Intel Core Ultra 5 125H, Arc 7-Core
80.9 pt
Asus NUC 14 Pro
Intel Core Ultra 5 125H, Arc 7-Core
80.4 pt
Acemagic F2A
Intel Core Ultra 7 155H, Arc 8-Core
78.5 pt
Power Consumption
Cinebench R23 Multi Power Efficiency - external Monitor
Geekom AE7
AMD Ryzen 9 7940HS, Radeon 780M
238 Points per Watt +45%
Acemagic F2A
Intel Core Ultra 7 155H, Arc 8-Core
183.7 Points per Watt +12%
Minisforum UH125 Pro
Intel Core Ultra 5 125H, Arc 7-Core
181.1 Points per Watt +11%
Asus NUC 14 Pro
Intel Core Ultra 5 125H, Arc 7-Core
163.7 Points per Watt
Cinebench R23 Single Power Efficiency - external Monitor
Asus NUC 14 Pro
Intel Core Ultra 5 125H, Arc 7-Core
69.4 Points per Watt
Geekom AE7
AMD Ryzen 9 7940HS, Radeon 780M
61.4 Points per Watt -12%
Minisforum UH125 Pro
Intel Core Ultra 5 125H, Arc 7-Core
57.1 Points per Watt -18%
Acemagic F2A
Intel Core Ultra 7 155H, Arc 8-Core
54.2 Points per Watt -22%
Cinebench R15 Multi Efficiency (external Monitor)
Geekom AE7
AMD Ryzen 9 7940HS, Radeon 780M
33.2 Points per Watt +38%
Minisforum UH125 Pro
Intel Core Ultra 5 125H, Arc 7-Core
28 Points per Watt +17%
Acemagic F2A
Intel Core Ultra 7 155H, Arc 8-Core
26.6 Points per Watt +11%
Asus NUC 14 Pro
Intel Core Ultra 5 125H, Arc 7-Core
24 Points per Watt

Power consumtion with the external monitor

0102030405060708090100Tooltip
Asus NUC 14 Pro Ultra 5 125H, Arc 7-Core; Idle 1min (external Monitor): Ø6.48 (4.52-12)
Minisforum UH125 Pro Ultra 5 125H, Arc 7-Core; Idle 1min (external Monitor): Ø14.4 (13.7-16.8)
Aoostar GEM10 R7 6800H, Radeon 680M; Idle 1min (external Monitor): Ø9.01 (8.45-10.4)
Aoostar GEM10 R7 6800H, Radeon 680M; 1920x1080 The Witcher 3 ultra (external Monitor): Ø63.2 (61.3-86)
Asus NUC 14 Pro Ultra 5 125H, Arc 7-Core; 1280x720 Prime95 28.10 and Furmark 1.25: Ø90.8 (85.1-98.5)
Minisforum UH125 Pro Ultra 5 125H, Arc 7-Core; 1280x720 Prime95 28.10 and Furmark 1.25: Ø82.9 (81.3-87.6)
Aoostar GEM10 R7 6800H, Radeon 680M; 1280x720 Prime95 28.10 and Furmark 1.25: Ø87.3 (85-101.6)
Asus NUC 14 Pro Ultra 5 125H, Arc 7-Core; Cyberpunk 2077 FHD ultra no FSR (external Monitor): Ø59.1 (55.8-67.9)
Minisforum UH125 Pro Ultra 5 125H, Arc 7-Core; Cyberpunk 2077 FHD ultra no FSR (external Monitor): Ø52.7 (51.9-55.2)
Aoostar GEM10 R7 6800H, Radeon 680M; Cyberpunk 2077 FHD ultra no FSR (external Monitor): Ø58.8 (56.1-62.3)
Asus NUC 14 Pro Ultra 5 125H, Arc 7-Core; 3DMark06 Return To Proxycon: Ø55.5 (51.2-61.4)
Minisforum UH125 Pro Ultra 5 125H, Arc 7-Core; 3DMark06 Return To Proxycon: Ø48.4 (45.1-51.5)
Aoostar GEM10 R7 6800H, Radeon 680M; 3DMark06 Return To Proxycon: Ø67.2 (55.9-76)

Power consumtion with the external monitor

0102030405060708090100Tooltip
Asus NUC 14 Pro Ultra 5 125H, Arc 7-Core; Prime95 V2810 Stress (external Monitor): Ø90.6 (79.2-103.3)
Minisforum UH125 Pro Ultra 5 125H, Arc 7-Core; Prime95 V2810 Stress (external Monitor): Ø83 (67.7-89.8)
Aoostar GEM10 R7 6800H, Radeon 680M; Prime95 V2810 Stress (external Monitor): Ø76.4 (71.4-100.8)
Asus NUC 14 Pro Ultra 5 125H, Arc 7-Core; Cinebench R15 Multi (external Monitor): Ø89.2 (88-90.9)
Minisforum UH125 Pro Ultra 5 125H, Arc 7-Core; Cinebench R15 Multi (external Monitor): Ø80.3 (80-81.4)
Aoostar GEM10 R7 6800H, Radeon 680M; Cinebench R15 Multi (external Monitor): Ø87.9 (81.6-97.1)
Asus NUC 14 Pro Ultra 5 125H, Arc 7-Core; Cinebench R23 Single (external Monitor): Ø24.8 (20.8-58)
Minisforum UH125 Pro Ultra 5 125H, Arc 7-Core; Cinebench R23 Single (external Monitor): Ø28.7 (27-62.8)
Aoostar GEM10 R7 6800H, Radeon 680M; Cinebench R23 Single (external Monitor): Ø30.1 (28.4-45.5)
Asus NUC 14 Pro Ultra 5 125H, Arc 7-Core; Cinebench R23 Multi (external Monitor): Ø88.7 (86.9-91.6)
Minisforum UH125 Pro Ultra 5 125H, Arc 7-Core; Cinebench R23 Multi (external Monitor): Ø80.4 (79.8-81.1)
Aoostar GEM10 R7 6800H, Radeon 680M; Cinebench R23 Multi (external Monitor): Ø78.2 (71.1-95.8)
Asus NUC 14 Pro Ultra 5 125H, Arc 7-Core; 1280x720 FurMark 1.19 GPU Stress Test (external Monitor): Ø56.9 (53.6-63.3)
Minisforum UH125 Pro Ultra 5 125H, Arc 7-Core; 1280x720 FurMark 1.19 GPU Stress Test (external Monitor): Ø48 (46.2-53.5)
Aoostar GEM10 R7 6800H, Radeon 680M; 1280x720 FurMark 1.19 GPU Stress Test (external Monitor): Ø76.4 (69.1-84.4)

Za

+ solidna, kompaktowa obudowa
+ nowoczesny SoC z rdzeniami P i E
+ dobra wydajność systemu
+ łatwe otwieranie (bez użycia narzędzi)
+ 2x Thunderbolt
+ szybka sieć WLAN
+ wiele ustawień BIOS
+ 36 miesięcy gwarancji

Przeciw

- słyszalne pod obciążeniem
- wysokie opóźnienia DPC
- Jednostka chłodząca szybko osiąga swój limit

Werdykt - Biznesowy mini PC z rozbudowanymi opcjami BIOS-u

Recenzja Asus NUC 14 Pro: dostarczona przez Asus Niemcy

Dobrze znane mini PC NUC, które kiedyś były sprzedawane bezpośrednio przez Intela, są teraz kontynuowane przez Asusa w ten sam sposób. Oparte na procesorach Meteor Lake, kompaktowe komputery uzyskują zauważalny wzrost wydajności pod względem wydajności 3D.

Niewiele zmieniło się pod względem wzornictwa w porównaniu do znanych mini PC NUC. Pożądana byłaby całkowicie metalowa obudowa, ponieważ Asus NUC 14 Pro ustępuje pod tym względem niektórym konkurentom. Pod względem wymiarów mini PC jest mniejszy niż wiele innych urządzeń. Niestety, taka konstrukcja prowadzi do kompromisu, na który muszą pójść wszyscy producenci. Wydajność SoC musi być niezawodnie rozpraszana. Asus NUC 14 Pro radzi sobie z tym całkiem dobrze, jeśli nie ma ciągłych obciążeń. Asus przesuwa limit temperatury Intel Core Ultra 5 125H co z pewnością sprawi, że niektórzy użytkownicy zaczną się pocić. Zasadniczo procesory są zaprojektowane dla tych zakresów temperatur. Tymczasem BIOS oferuje wiele opcji, które również wpływają na limit temperatury procesora. Limit można tutaj ustawić ręcznie. Należy się jednak wtedy liczyć z nieco niższą wydajnością. Pozytywnie należy podkreślić doskonałą łączność: na pokładzie znajduje się wiele portów USB i dwa porty Thunderbolt 4. Nie zabrakło też szybkiego Wi-Fi i sieci LAN 2,5G.

Asus NUC 14 Pro to potężny mini PC NUC. Łączność jest lepsza niż u większości konkurentów, a rozbudowane opcje BIOS-u są również prawdziwym punktem sprzedaży.

Cena Asus NUC 14 Pro nie jest całkowicie niezwykła. Przy cenie 510 euro urządzenie typu barebone z pewnością nie jest okazją. Jednak jego konkurenci mogą z łatwością kosztować ponad 700 euro, w tym dysk SSD, pamięć RAM i system operacyjny. Jako wskazówka dotycząca ceny i wydajności Aoostar GEM10 jest już dostępny za 459 dolarów amerykańskich.

Uwaga: Niedawno zaktualizowaliśmy nasz system oceny i wyniki wersji 8 nie są porównywalne z wynikami wersji 7. Więcej informacji można znaleźć tutaj.

Cena i dostępność

Asus NUC 14 Pro jest dostępny w różnych konfiguracjach. Mini PC z procesorem Intel Core Ultra 5 125H jest obecnie dostępny w cenie 500 euro. Nasze urządzenie testowe znajduje się na liście Alternate i Notebooksbilliger. Opcja Tall z tym samym SoC oferuje dodatkowe miejsce na 2,5-calowy nośnik danych i również można ją zamówić w Alternate lub Notebooksbilliger. Cena wynosi tutaj około 520 euro.

Asus NUC 14 Pro - 26/08/2024 v8
Sebastian Bade

Wykonanie
81 / 98 → 83%
Komunikacja
58 / 81 → 71%
Waga
83%
Wydajność w grach
47 / 80 → 59%
Wydajność w programach użytkowych
80 / 92 → 87%
Workstation
28%
AI Performance
77%
Temperatura
87%
Hałas
80%
Średnio
54%
75%
Mini PC - Ważona średnia
CO2 Emissions
No Data
Materials
25%
Packaging
25%
Power Use
77.5%
Repairability
30%
Software Updates
50%
Recycle Logo Total Sustainability Score: 34.6%

Transparency

The selection of devices to be reviewed is made by our editorial team. The test sample was provided to the author as a loan by the manufacturer or retailer for the purpose of this review. The lender had no influence on this review, nor did the manufacturer receive a copy of this review before publication. There was no obligation to publish this review. We never accept compensation or payment in return for our reviews. As an independent media company, Notebookcheck is not subjected to the authority of manufacturers, retailers or publishers.

This is how Notebookcheck is testing

Every year, Notebookcheck independently reviews hundreds of laptops and smartphones using standardized procedures to ensure that all results are comparable. We have continuously developed our test methods for around 20 years and set industry standards in the process. In our test labs, high-quality measuring equipment is utilized by experienced technicians and editors. These tests involve a multi-stage validation process. Our complex rating system is based on hundreds of well-founded measurements and benchmarks, which maintains objectivity. Further information on our test methods can be found here.

Price comparison

Please share our article, every link counts!
Mail Logo
> laptopy testy i recenzje notebooki > Laptopy > Recenzja Asus NUC 14 Pro: NUC mini PC z procesorem Intel Core Ultra 5 125H, szybką kartą graficzną Intel Arc iGPU i 2x Thunderbolt 4
Sebastian Bade, 2024-08-30 (Update: 2024-08-30)