Notebookcheck Logo
Konserwacja modelu: XMG Pro 16 Studio (Mid 24)

Recenzja XMG Pro 16 Studio (Mid 24): Core i9 i RTX 4070 dla graczy i twórców

Rozkosz twórcy?

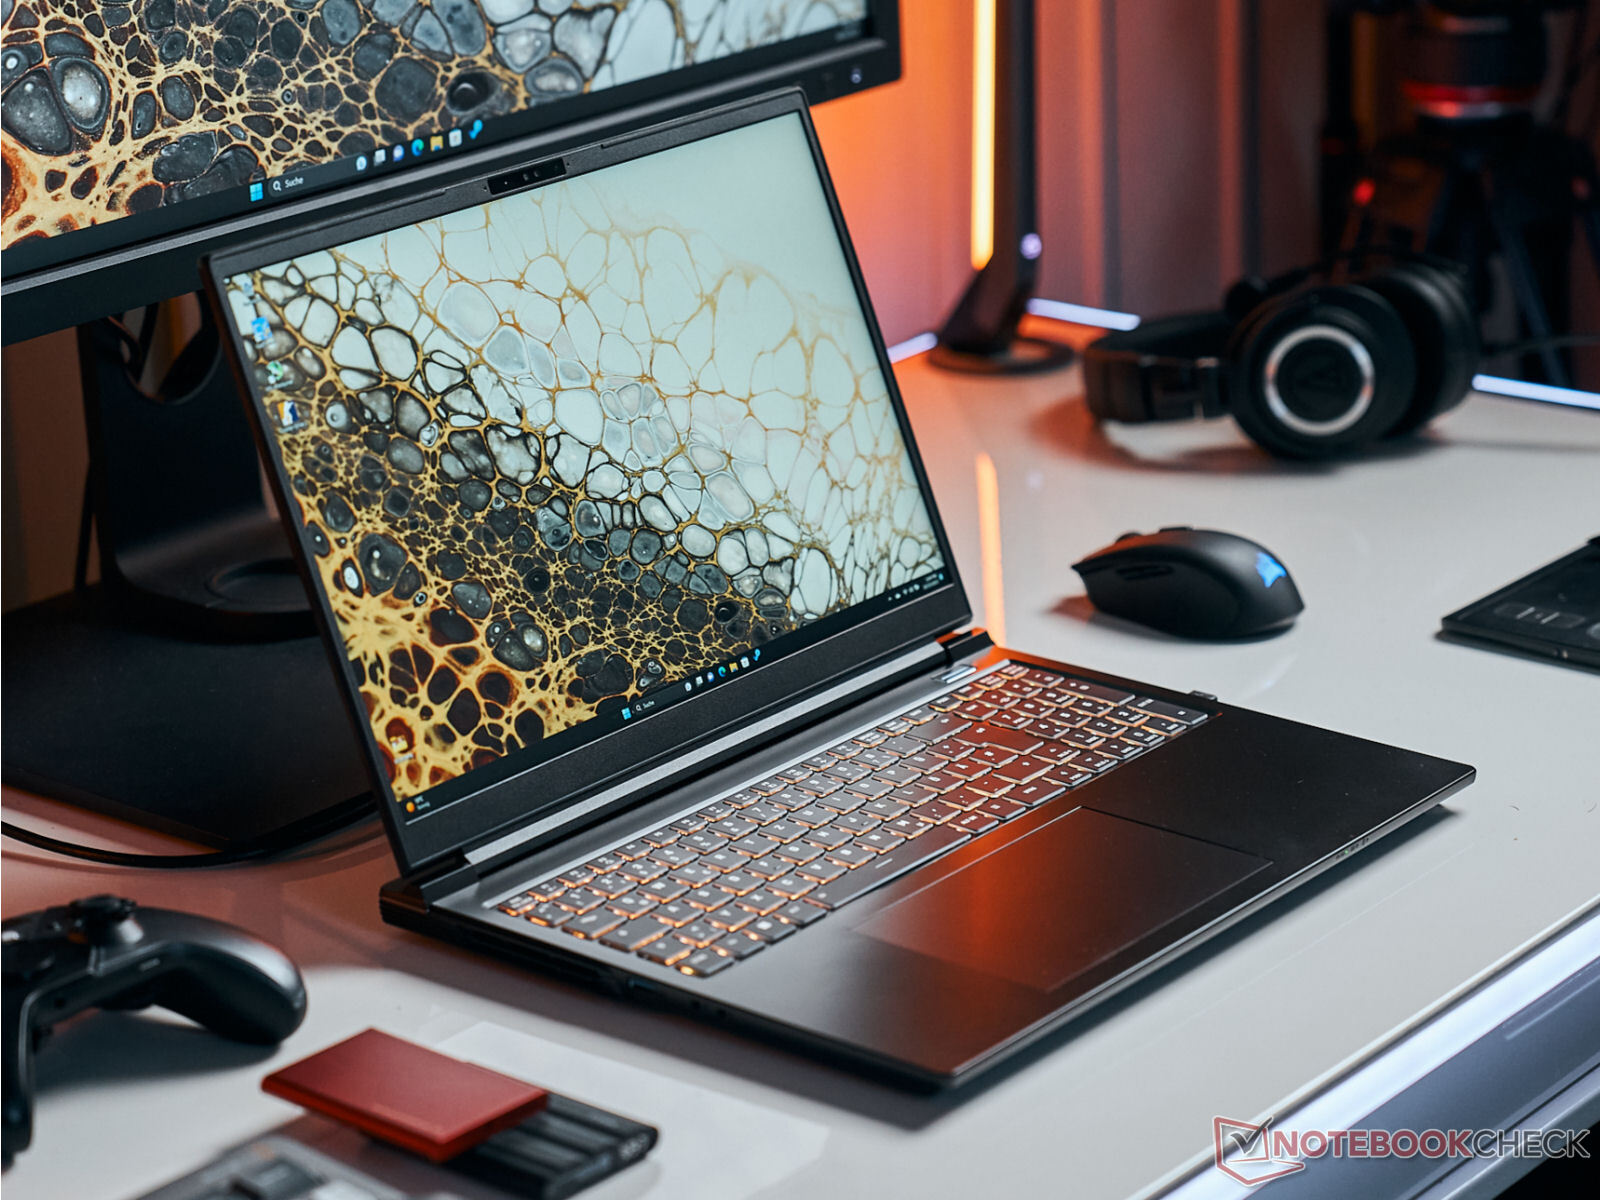
Twórcy treści i gracze stanowią rynek docelowy XMG Pro 16 Studio: Schenker przygotował ofertę składającą się z procesora Core i9, RTX 4070, portu Thunderbolt 4 i wyświetlacza 16:10 (QHD+, 240 Hz, sRGB). Dobre chłodzenie ma być zapewnione dzięki zastosowaniu komory Vapor Chamber.
Sascha Mölck, 👁 Florian Glaser (tłumaczenie DeepL / Ninh Duy) Published 🇺🇸 🇩🇪 ...
Gaming Geforce Intel Laptop / Notebook Nvidia Raptor Lake Thunderbolt Windows

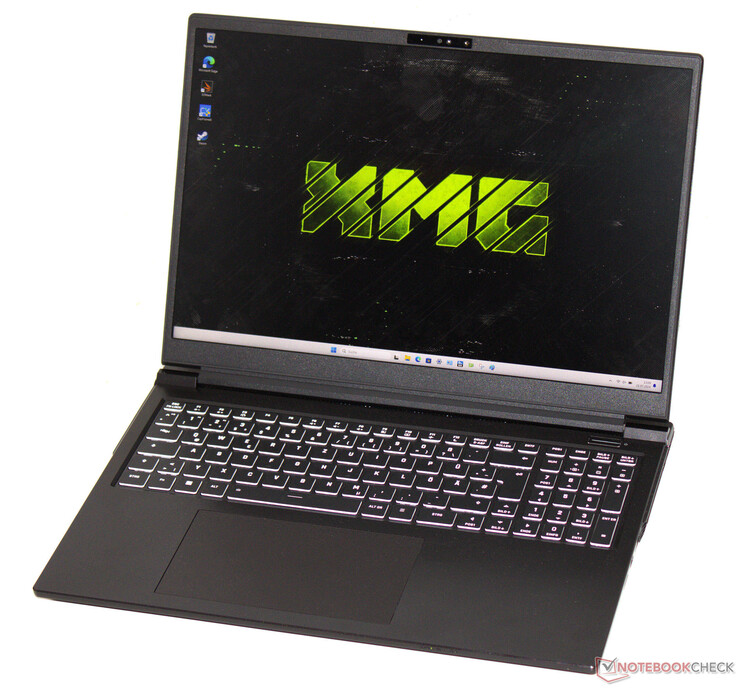
XMG Pro 16 Studio (Mid 24) jest przeznaczony dla graczy i twórców. Na pokładzie znajduje się odpowiedni sprzęt: Core i9-14900HX, GeForce RTX 4070, a także skalibrowany (X-Rite) 16-calowy wyświetlacz o proporcjach 16:10. Za podstawę służy tutaj barebone (PE60SNE-S) od producenta Clevo. Jest to następca XMG Pro 16 (Mid 23) który wizualnie wygląda tak samo. Konkurenci obejmują Lenovo Legion Pro 5 16IRX9, Acer Predator Helios Neo 16 (2024), Lenovo Legion 7 16 G9 i Aorus 16X (2024).

SCHENKER XMG Pro 16 Studio (Mid 24)
Procesor
Intel Core i9-14900HX 24 x 1.6 - 5.8 GHz, 150 W PL2 / Short Burst, 135 W PL1 / Sustained, Raptor Lake-HX Refresh
Karta grafiki
NVIDIA GeForce RTX 4070 Laptop GPU - 8 GB VRAM, rdzeń: 2055 MHz, pamięć: 2000 MHz, 140 W TDP ( including 25 W Dynamic Boost), GDDR6, 32.0.15.5599, Optimus + MUX-Switch
Pamięć
32 GB 
, DDR5-5600, Dual-Channel-Mode, two memory slots (both in use)
Matryca
16.00 cali 16:10, 2560 x 1600 pikseli 189 PPI, BOE CQ NE160QDM-NZ1, IPS, refleksująca: nie, 240 Hz
Chipset
Intel HM770 (Raptor Lake-S PCH)
Dysk twardy
Samsung 990 Pro 1 TB, 1024 GB 
, PCIe 4, M.2-2280, 864 GB wolne miejsce
Karta dźwiękowa
Realtek ALC1220
Złącza
2 USB 3.0, 1 USB 3.1 Gen2, 1 USB 4.0 40 Gbps, 1 Thunderbolt, USB-C Power Delivery (PD), 1 HDMI, 2 DisplayPort, 1 blokada Kensingtona, gniazda audio: Headset combined port, Mic-in, czytnik kart: MicroSD, TPM 2.0
Łączność
Realtek RTL8125 2.5GBe Family Ethernet Controller (10/100/1000/2500MBit/s), Intel Wi-Fi 6E AX211 (a/b/g/h/n = Wi-Fi 4/ac = Wi-Fi 5/ax = Wi-Fi 6/ Wi-Fi 6E 6 GHz), Bluetooth 5.3
Gabaryty
wysokość x szerokość x głębokość (mm): 19.9 x 359.5 x 273
Akumulator
73 Wh, 4600 mAh litowo-polimerowy
System operacyjny
Microsoft Windows 11 Pro
Camera
kamerka: FHD
Primary Camera: 2.1 MPix
Inne
głośniki: Stereo, klawiatura: Chiclet, podświetlanie klawiatury: tak, Driver-DVDs, screws, cloth, 24 miesiące(y) gwarancji
Waga
2.282 kg, zasilacz: 666 g
Cena
2300 Euro
Note: The manufacturer may use components from different suppliers including display panels, drives or memory sticks with similar specifications.


Potencjalni konkurenci w porównaniu

Rating
Version
Date
Model
Weight
Height
Size
Resolution
Price
81.2 %v8
07/2024
SCHENKER XMG Pro 16 Studio (Mid 24)
i9-14900HX, NVIDIA GeForce RTX 4070 Laptop GPU
2.3 kg19.9 mm16.00"2560x1600
86.8 %
v7 (old)
v7 (old)
05/2024
Acer Predator Helios Neo 16 (2024)
i7-14700HX, NVIDIA GeForce RTX 4070 Laptop GPU
2.6 kg25.95 mm16.00"2560x1600
89.3 %
v7 (old)
v7 (old)
04/2024
Lenovo Legion Pro 5 16IRX9
i9-14900HX, NVIDIA GeForce RTX 4070 Laptop GPU
2.5 kg26.95 mm16.00"2560x1600
87.4 %
v7 (old)
v7 (old)
04/2024
Aorus 16X 2024
i9-14900HX, NVIDIA GeForce RTX 4070 Laptop GPU
2.3 kg20 mm16.00"2560x1600
90.8 %
v7 (old)
v7 (old)
04/2024
Lenovo Legion 7 16 IRX G9
i9-14900HX, NVIDIA GeForce RTX 4070 Laptop GPU
2.3 kg19.8 mm16.00"3200x2000

Prosimy pamiętać: Niedawno zaktualizowaliśmy nasz system oceny i wyniki wersji 8 nie są porównywalne z wynikami wersji 7. Więcej informacji znajdą Państwo tutaj.

Obudowa i łączność - Schenker używa barebone od Clevo

Z zewnątrz nic się nie zmieniło: najnowszy Pro 16 wykorzystuje tę samą matową czarną aluminiową obudowę, co zeszłoroczny model-jeśli chodzi o obudowę zewnętrzną. Podstawa i pokrywa mogą być lekko skręcone, ale ich jakość wykonania jest dobra. Na próżno szukać pasków LED na tak poważnie wyglądającej obudowie. Maksymalny kąt otwarcia pokrywy wynosi 130 stopni.

Dwa porty USB-A (USB 3.2 Gen 1), dwa porty USB-C (1x USB 3.2 Gen 2, 1x TB 4/USB 4), a także trzy wyjścia wideo powinny być wystarczające dla większości użytkowników - w najgorszym przypadku być może trzeba będzie sięgnąć po stację dokującą. Power Delivery jest obsługiwane dzięki portowi TB4. Port Gigabit Ethernet umożliwia przesyłanie danych z prędkością do 2,5 Gbit/s.

W optymalnych warunkach (brak urządzeń WiFi w bliskim sąsiedztwie, niewielka odległość między laptopem a serwerem PC), układ Intel WiFi-6E (AX211) zapewnia dobre lub bardzo dobre prędkości transmisji danych. Kamera internetowa FHD (2,1 MP, bez osłony) nie robi zaskakujących zdjęć. Czytnik kart microSD (karta referencyjna: AV PRO microSD 128 GB V60) jest przeciętnie szybki.

XMG Pro 16 Studio
XMG Pro 16 Studio
XMG Pro 16 Studio
XMG Pro 16 Studio
XMG Pro 16 Studio
XMG Pro 16 Studio
XMG Pro 16 Studio
XMG Pro 16 Studio
XMG Pro 16 Studio
XMG Pro 16 Studio
XMG Pro 16 Studio
XMG Pro 16 Studio
Sprzęt XMG Pro 16 Studio (M24)

Porównanie rozmiarów

363.4 mm 261.75 mm 26.95 mm 2.5 kg357.78 mm 278.63 mm 25.95 mm 2.6 kg359.5 mm 273 mm 19.9 mm 2.3 kg358 mm 262.5 mm 19.8 mm 2.3 kg356 mm 254 mm 20 mm 2.3 kg297 mm 210 mm 1 mm 5.7 g
Lewa strona: USB 3.2 Gen 1 (USB-A), wejście mikrofonowe, combo audio
Prawa strona: czytnik kart microSD, Thunderbolt 4/USB 4 (USB-C; Power Delivery, DisplayPort), USB 3.2 Gen 1 (USB-A), gniazdo na blokadę kabla
Tył: złącze zasilania, USB 3.2 Gen 2 (USB-C), HDMI 2.1, Mini DisplayPort 1.4a, Gigabit Ethernet (2,5 GBit/s)
SD Card Reader
average JPG Copy Test (av. of 3 runs)
Aorus 16X 2024
Intel Core i9-14900HX (AV PRO microSD 128 GB V60)
186 MB/s +116%
Average of class Gaming
  (19 - 202, n=89, last 2 years)
95.5 MB/s +11%
SCHENKER XMG Pro 16 Studio (Mid 23)
Intel Core i9-13900H (AV PRO microSD 128 GB V60)
86 MB/s 0%
SCHENKER XMG Pro 16 Studio (Mid 24)
Intel Core i9-14900HX (AV PRO microSD 128 GB V60)
86 MB/s
Lenovo Legion 7 16 IRX G9
Intel Core i9-14900HX (Angelbird AV Pro V60)
76.7 MB/s -11%
Acer Predator Helios Neo 16 (2024)
Intel Core i7-14700HX (AV PRO microSD 128 GB V60)
20 MB/s -77%
maximum AS SSD Seq Read Test (1GB)
Aorus 16X 2024
Intel Core i9-14900HX (AV PRO microSD 128 GB V60)
188 MB/s +111%
Average of class Gaming
  (25.8 - 269, n=90, last 2 years)
119.3 MB/s +34%
SCHENKER XMG Pro 16 Studio (Mid 23)
Intel Core i9-13900H (AV PRO microSD 128 GB V60)
90 MB/s +1%
Lenovo Legion 7 16 IRX G9
Intel Core i9-14900HX (Angelbird AV Pro V60)
89.2 MB/s 0%
SCHENKER XMG Pro 16 Studio (Mid 24)
Intel Core i9-14900HX (AV PRO microSD 128 GB V60)
89 MB/s
Acer Predator Helios Neo 16 (2024)
Intel Core i7-14700HX (AV PRO microSD 128 GB V60)
25.8 MB/s -71%
Networking
iperf3 transmit AXE11000
Lenovo Legion 7 16 IRX G9
RealTek Semiconductor RTL8852CE WiFi 6E PCI-E NIC
1793 (1696min, 1700.64P1 - 1886max) MBit/s +57%
SCHENKER XMG Pro 16 Studio (Mid 23)
Intel Wi-Fi 6E AX211
1386 (708min - 1471max) MBit/s +21%
Average Intel Wi-Fi 6E AX211
  (464 - 1921, n=237)
1235 MBit/s +8%
Average of class Gaming
  (469 - 1843, n=151, last 2 years)
1235 MBit/s +8%
SCHENKER XMG Pro 16 Studio (Mid 24)
Intel Wi-Fi 6E AX211
1143 (930min - 1352max) MBit/s
Acer Predator Helios Neo 16 (2024)
Killer Wi-Fi 6E AX1675i 160MHz Wireless Network Adapter
980 (886min - 1077max) MBit/s -14%
Lenovo Legion Pro 5 16IRX9
Intel Wi-Fi 6E AX211
636 (485min - 769max) MBit/s -44%
Aorus 16X 2024
Intel Wi-Fi 7 BE200 320MHz
469 (304min - 548max) MBit/s -59%
iperf3 receive AXE11000
SCHENKER XMG Pro 16 Studio (Mid 23)
Intel Wi-Fi 6E AX211
1714 (1696min - 1727max) MBit/s +3%
Lenovo Legion 7 16 IRX G9
RealTek Semiconductor RTL8852CE WiFi 6E PCI-E NIC
1685 (1647min, 1651.64P1 - 1715max) MBit/s +1%
SCHENKER XMG Pro 16 Studio (Mid 24)
Intel Wi-Fi 6E AX211
1672 (1316min - 1721max) MBit/s
Aorus 16X 2024
Intel Wi-Fi 7 BE200 320MHz
1577 (1237min - 1665max) MBit/s -6%
Average of class Gaming
  (680 - 1890, n=151, last 2 years)
1383 MBit/s -17%
Average Intel Wi-Fi 6E AX211
  (582 - 1890, n=237)
1377 MBit/s -18%
Lenovo Legion Pro 5 16IRX9
Intel Wi-Fi 6E AX211
1040 (739min - 1218max) MBit/s -38%
Acer Predator Helios Neo 16 (2024)
Killer Wi-Fi 6E AX1675i 160MHz Wireless Network Adapter
957 (475min - 998max) MBit/s -43%
050100150200250300350400450500550600650700750800850900950100010501100115012001250130013501400145015001550160016501700175018001850Tooltip
SCHENKER XMG Pro 16 Studio (Mid 24) Intel Wi-Fi 6E AX211; iperf3 transmit AXE11000; iperf 3.1.3: Ø1143 (930-1352)
Acer Predator Helios Neo 16 (2024) Killer Wi-Fi 6E AX1675i 160MHz Wireless Network Adapter; iperf3 transmit AXE11000; iperf 3.1.3: Ø980 (886-1077)
Lenovo Legion Pro 5 16IRX9 Intel Wi-Fi 6E AX211; iperf3 transmit AXE11000; iperf 3.1.3: Ø636 (485-769)
Aorus 16X 2024 Intel Wi-Fi 7 BE200 320MHz; iperf3 transmit AXE11000; iperf 3.1.3: Ø469 (304-548)
SCHENKER XMG Pro 16 Studio (Mid 23) Intel Wi-Fi 6E AX211; iperf3 transmit AXE11000; iperf 3.1.3: Ø1362 (708-1471)
Lenovo Legion 7 16 IRX G9 RealTek Semiconductor RTL8852CE WiFi 6E PCI-E NIC; iperf3 transmit AXE11000: Ø1793 (1696-1886)
SCHENKER XMG Pro 16 Studio (Mid 24) Intel Wi-Fi 6E AX211; iperf3 receive AXE11000; iperf 3.1.3: Ø1671 (1316-1721)
Acer Predator Helios Neo 16 (2024) Killer Wi-Fi 6E AX1675i 160MHz Wireless Network Adapter; iperf3 receive AXE11000; iperf 3.1.3: Ø941 (475-998)
Lenovo Legion Pro 5 16IRX9 Intel Wi-Fi 6E AX211; iperf3 receive AXE11000; iperf 3.1.3: Ø1039 (739-1218)
Aorus 16X 2024 Intel Wi-Fi 7 BE200 320MHz; iperf3 receive AXE11000; iperf 3.1.3: Ø1576 (1237-1665)
SCHENKER XMG Pro 16 Studio (Mid 23) Intel Wi-Fi 6E AX211; iperf3 receive AXE11000; iperf 3.1.3: Ø1714 (1696-1727)
Lenovo Legion 7 16 IRX G9 RealTek Semiconductor RTL8852CE WiFi 6E PCI-E NIC; iperf3 receive AXE11000: Ø1685 (1647-1715)
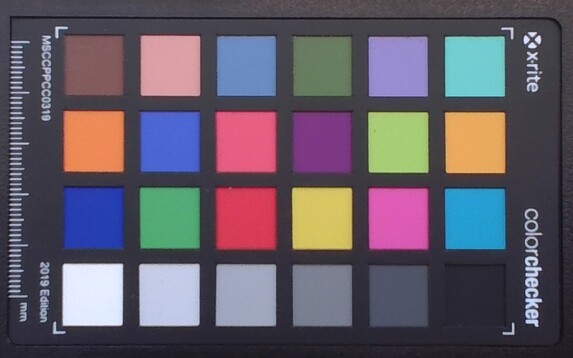
ColorChecker
9.3 ∆E
12.9 ∆E
7.5 ∆E
7.9 ∆E
6.5 ∆E
9.9 ∆E
9.1 ∆E
7.7 ∆E
10.1 ∆E
8.2 ∆E
7.3 ∆E
6.8 ∆E
4.3 ∆E
9.9 ∆E
11.1 ∆E
7.4 ∆E
7.8 ∆E
11.6 ∆E
8.3 ∆E
11.6 ∆E
10.5 ∆E
9.7 ∆E
9.9 ∆E
9.1 ∆E
ColorChecker SCHENKER XMG Pro 16 Studio (Mid 24): 8.95 ∆E min: 4.27 - max: 12.93 ∆E

Zrównoważony rozwój

Laptop i akcesoria są chronione przez różnego rodzaju plastikowe osłony (piankowy nośnik, folia, torba). Nazwy użytych tworzyw sztucznych są na nich nadrukowane. Wyjątek: Przezroczysta foliowa osłona na pokrywie nie posiada odpowiedniej informacji. Dostęp do osprzętu urządzenia jest możliwy po zdjęciu płyty bazowej - dzięki temu można przeprowadzić prace konserwacyjne i naprawcze. Aktualizacje oprogramowania powinny być zapewnione przez kilka następnych lat.

Urządzenia wejściowe - Laptop XMG z wymienną klawiaturą

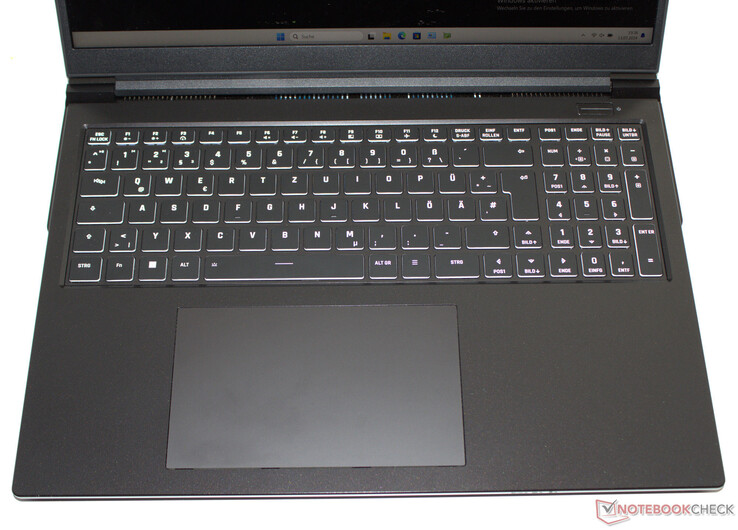
Często jest to regułą w przypadku Schenkera, a wyjątkiem w przypadku innych producentów: Podświetlana (RGB, czteropoziomowa) klawiatura typu chiclet może być łatwo wymieniona, ponieważ jest utrzymywana na miejscu tylko przez dwie śruby (i kilka klipsów). Jej płaskie, gładkie klawisze mają średni skok i wyraźny punkt nacisku. Ich opór mógłby być wyraźniejszy - ale to kwestia gustu. Lekkie uginanie się klawiatury nie powinno przeszkadzać podczas codziennego użytkowania. Pozytywne: Cztery klawisze strzałek są pełnowymiarowe. Do sterowania wskaźnikiem myszy służy sporych rozmiarów wielodotykowy clickpad (15,1 x 9,1 cm).

Klawiatura XMG Pro 16 Studio (Mid 24)

Wyświetlacz - 16:10, IPS, sRGB

16-calowy wyświetlacz (2560 x 1600 pikseli) o proporcjach 16:10 jest znajomy: Laptop korzysta z tego samego panelu IPS firmy BOE, który był już używany w pro 16 w wersji z 2023 roku. Korzysta jednak z nieco wyższej maksymalnej jasności. Podsumowując, zmierzone przez nas wartości ekranu są wystarczające do użytku w pomieszczeniach. Czytanie na zewnątrz powinno być możliwe, o ile słońce nie jest zbyt jasne. Pozytywne: Czuły panel 240 Hz nie wykazuje migotania PWM. Alternatywne opcje wyświetlania nie są dostępne.

Tablica pikseli
Tablica pikseli
Widoczne jest krwawienie podświetlenia.
Na zewnątrz
Na zewnątrz
378
cd/m²
390
cd/m²
390
cd/m²
368
cd/m²
416
cd/m²
396
cd/m²
371
cd/m²
427
cd/m²
390
cd/m²
podświetlenie ekranu
BOE CQ NE160QDM-NZ1 tested with X-Rite i1Pro 2
maksimum: 427 cd/m² (Nits) średnia: 391.8 cd/m² Minimum: 41 cd/m²
rozświetlenie: 86 %
na akumulatorze: 416 cd/m²
kontrast: 1095:1 (czerń: 0.38 cd/m²)
ΔE Color 2.33 | 0.5-29.43 Ø4.92, calibrated: 1.02
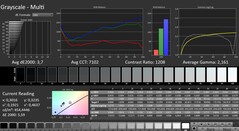
ΔE Greyscale 3.7 | 0.5-98 Ø5.2
70.8% AdobeRGB 1998 (Argyll 2.2.0 3D)
99.5% sRGB (Argyll 2.2.0 3D)
68.8% Display P3 (Argyll 2.2.0 3D)
Gamma: 2.161
SCHENKER XMG Pro 16 Studio (Mid 24)
BOE CQ NE160QDM-NZ1, IPS, 2560x1600, 16"
Acer Predator Helios Neo 16 (2024)
Chi Mei N160GME-GTB, LED, 2560x1600, 16"
Lenovo Legion Pro 5 16IRX9
BOE NE160QDM-NYC, IPS, 2560x1600, 16"
Aorus 16X 2024
BOE CQ NE160QDM-NY1, IPS, 2560x1600, 16"
SCHENKER XMG Pro 16 Studio (Mid 23)
BOE CQ NE160QDM-NZ1, IPS, 2560x1600, 16"
Lenovo Legion 7 16 IRX G9
MNG007ZA1-2, IPS, 3200x2000, 16"
Display
20%
0%
-2%
-0%
21%
Display P3 Coverage
68.8
95.9
39%
69.3
1%
67.2
-2%
69.4
1%
95
38%
sRGB Coverage
99.5
99.8
0%
99.4
0%
96.7
-3%
98.2
-1%
100
1%
AdobeRGB 1998 Coverage
70.8
86.4
22%
70.1
-1%
69.3
-2%
70.1
-1%
87.2
23%
Response Times
11%
-18%
28%
-9%
-14%
Response Time Grey 50% / Grey 80% *
12.7 ?(6, 6.7)
5 ?(2.5, 2.5)
61%
11.9 ?(5.5, 6.4)
6%
7.5 ?(3.3, 4.2)
41%
12.2 ?(5.9, 6.3)
4%
14.4 ?(6.9, 7.5)
-13%
Response Time Black / White *
6.3 ?(2.5, 3.8)
8.8 ?(4.7, 4.1)
-40%
8.9 ?(4.8, 4.1)
-41%
5.4 ?(1.5, 3.9)
14%
7.7 ?(4, 3.7)
-22%
7.2 ?(2.9, 4.3)
-14%
PWM Frequency
Screen
19%
20%
4%
-5%
23%
Brightness middle
416
521
25%
384
-8%
542
30%
349
-16%
412
-1%
Brightness
392
506
29%
366
-7%
504
29%
348
-11%
396
1%
Brightness Distribution
86
85
-1%
91
6%
86
0%
93
8%
89
3%
Black Level *
0.38
0.44
-16%
0.35
8%
0.45
-18%
0.32
16%
0.43
-13%
Contrast
1095
1184
8%
1097
0%
1204
10%
1091
0%
958
-13%
Colorchecker dE 2000 *
2.33
1.74
25%
0.97
58%
2.73
-17%
1.98
15%
0.9
61%
Colorchecker dE 2000 max. *
6.07
3.88
36%
3.57
41%
5.29
13%
7.56
-25%
2
67%
Colorchecker dE 2000 calibrated *
1.02
0.52
49%
0.77
25%
1.32
-29%
1.45
-42%
0.6
41%
Greyscale dE 2000 *
3.7
3
19%
1.5
59%
2.9
22%
3.3
11%
1.4
62%
Gamma
2.161 102%
2.164 102%
2.24 98%
2.192 100%
2.137 103%
2.23 99%
CCT
7102 92%
6816 95%
6709 97%
6173 105%
6672 97%
6731 97%
Total Average (Program / Settings)
17% / 18%
1% / 11%
10% / 6%
-5% / -5%
10% / 17%

* ... im mniej tym lepiej

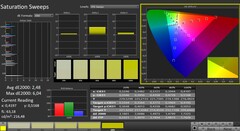
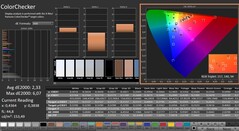
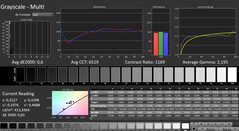
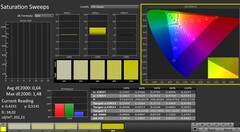
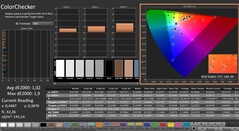
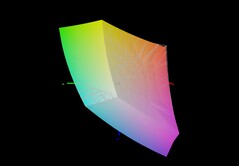
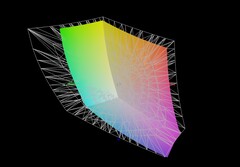
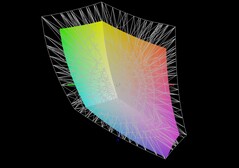
Pokrycie przestrzeni barw zainstalowanego panelu jest rozczarowujące. Odwzorowywana jest tylko przestrzeń sRGB, a nie AdobeRGB i DCI-P3. Nie różni się to jednak od wyświetlaczy większości konkurentów. Niemniej jednak ekran laptopa, który jest sprzedawany jako "profesjonalna stacja robocza do tworzenia treści", powinien naprawdę oferować pełny zakres. Jego odwzorowanie kolorów wygląda lepiej: Niewielkie odchylenie 2,26 (cel: DeltaE < 3) można zmniejszyć do 1,03, wykonując kalibrację.

CalMAN: skala szarości
CalMAN: nasycenie kolorów
CalMAN: ColorChecker
CalMAN: skala szarości (skalibrowana)
CalMAN: nasycenie kolorów (skalibrowane)
CalMAN: ColorChecker (skalibrowany)
XMG Pro 16 Studio M24 vs sRGB
XMG Pro 16 Studio M24 vs AdobeRGB
XMG Pro 16 Studio M24 vs DCI-P3

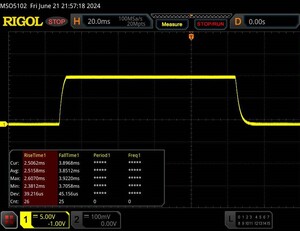
Display Response Times

Display response times show how fast the screen is able to change from one color to the next. Slow response times can lead to afterimages and can cause moving objects to appear blurry (ghosting). Gamers of fast-paced 3D titles should pay special attention to fast response times.
       Response Time Black to White
6.3 ms ... rise ↗ and fall ↘ combined↗ 2.5 ms rise
↘ 3.8 ms fall
The screen shows very fast response rates in our tests and should be very well suited for fast-paced gaming.
In comparison, all tested devices range from 0.1 (minimum) to 240 (maximum) ms. » 16 % of all devices are better.
This means that the measured response time is better than the average of all tested devices (21 ms).
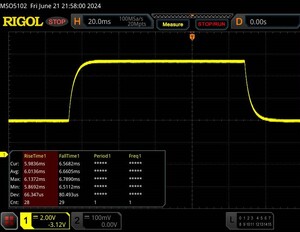
       Response Time 50% Grey to 80% Grey
12.7 ms ... rise ↗ and fall ↘ combined↗ 6 ms rise
↘ 6.7 ms fall
The screen shows good response rates in our tests, but may be too slow for competitive gamers.
In comparison, all tested devices range from 0.165 (minimum) to 636 (maximum) ms. » 23 % of all devices are better.
This means that the measured response time is better than the average of all tested devices (32.9 ms).

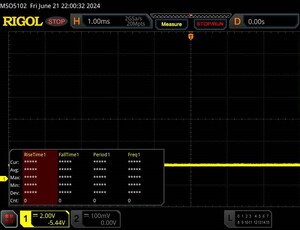
Screen Flickering / PWM (Pulse-Width Modulation)

To dim the screen, some notebooks will simply cycle the backlight on and off in rapid succession - a method called Pulse Width Modulation (PWM) . This cycling frequency should ideally be undetectable to the human eye. If said frequency is too low, users with sensitive eyes may experience strain or headaches or even notice the flickering altogether.
Screen flickering / PWM not detected

In comparison: 53 % of all tested devices do not use PWM to dim the display. If PWM was detected, an average of 8746 (minimum: 5 - maximum: 343500) Hz was measured.

100 % jasności
100 % jasności
75 % jasności
75 % jasności
50 % jasności
50 % jasności
25 % jasności
25 % jasności
0 % jasności
0 % jasności

Wydajność - Raptor Lake Refresh zastępuje Raptor Lake

XMG Pro 16 Studio (Mid 24), opisywany przez firmę Schenker jako "laptop do tworzenia treści", skierowany jest do graczy i twórców. Wszystkie modele wyposażone są w procesor Core i9-14900HX, a dostępny wybór GPU obejmuje RTX 4060 i RTX 4070 - nasze urządzenie testowe jest wyposażone w RTX 4070. Ten wariant jest dostępny za około 2500 USD. Ceny zaczynają się od około 1800 USD.

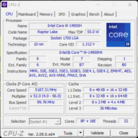
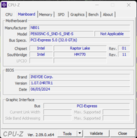
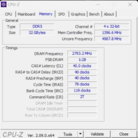
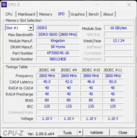
CPU-Z
CPU-Z
CPU-Z
CPU-Z
Informacje o systemie Nvidia
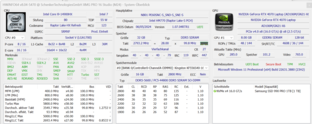
GPU-Z
GPU-Z
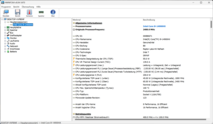
HWInfo
HWInfo
 

Warunki testowania

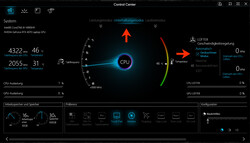
Do wyboru są trzy tryby wydajności specyficzne dla producenta (patrz tabela), między którymi można przełączać się za pomocą oprogramowania Control Center (centrum sterowania laptopa). My korzystaliśmy z trybów wydajność (benchmarki) i cichy (testy baterii). Optimus był aktywny.

Tryb wydajności Tryb rozrywki Tryb cichy (dGPU wyłączone)
Limit mocy 1 (HWInfo) 135 watów 55 watów 25 watów
Limit mocy 2 (HWInfo) 150 watów 135 watów 35 watów
Hałas (CP 2077 Phantom) 53 dB (A) 49 dB (A) -
Wydajność (CP 2077 Phantom) 78 fps 73 fps -
Centrum Kontroli
Centrum Kontroli
Centrum Kontroli
Centrum Kontroli
Centrum Kontroli
Centrum Kontroli
Centrum Kontroli
Centrum Kontroli
Centrum Kontroli
Centrum Kontroli

Problemy z trybem rozrywki

Profil "rozrywkowy" powodował znaczne wahania wydajności podczas naszych testów. W rezultacie powstrzymaliśmy się od korzystania z niego. W trakcie testu Schenker był w stanie znaleźć sposób na obejście problemu: aktywowanie opcji wentylatora "tryb cichy" w Centrum sterowania. Miejmy nadzieję, że przyszła aktualizacja BIOS-u naprawi ten błąd.

Procesor

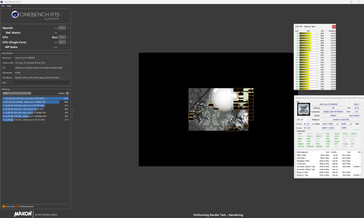
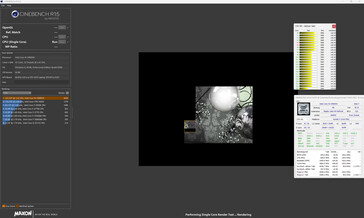
Procesor Core i9-14900HX (Raptor Lake) jest wykorzystywany we wszystkich wariantach konfiguracji Pro 16. Jego 24 rdzenie (8P + 16E) mogą przetwarzać łącznie 32 wątki. Niespodzianka: Nawet gdy tryb wydajności jest aktywny, procesor nie może pracować z pełną mocą przez cały czas. Ciągłe obciążenie wielowątkowe (pętla CB15) spowodowało znaczny spadek taktowania procesora od pierwszego do piątego uruchomienia. Następnie krzywa spłaszczyła się. Wyniki benchmarków są poniżej poprzedniej średniej CPU.

Wielowątkowy (podłączony do sieci)
Jednowątkowy (podłączony do sieci)

Cinebench R15 Multi continuous test

0235470705940117514101645188021152350258528203055329035253760399542304465Tooltip
SCHENKER XMG Pro 16 Studio (Mid 24) Intel Core i9-14900HX: Ø3394 (3129.4-4350.66)
Acer Predator Helios Neo 16 (2024) Intel Core i7-14700HX: Ø3274 (3212.59-3455.14)
Lenovo Legion Pro 5 16IRX9 Intel Core i9-14900HX: Ø4230 (4151.1-4590.84)
Aorus 16X 2024 Intel Core i9-14900HX: Ø3877 (3701.99-4280.82)
SCHENKER XMG Pro 16 Studio (Mid 23) Intel Core i9-13900H: Ø2574 (2525.07-2739.09)
SCHENKER XMG Pro 16 Studio (Mid 24) Intel Core i9-14900HX; Unterhaltungsmodus + Geräuschlose Modus: Ø2674 (2445.88-3927.73)
Lenovo Legion 7 16 IRX G9 Intel Core i9-14900HX: Ø4024 (3900.54-4690.98)
Pętla CB15 (tryb wydajności)
Pętla CB15 (tryb rozrywkowy)
Pętla CB15 (tryb cichy)
CPU Performance Rating - Percent
Lenovo Legion 7 16 IRX G9
Intel Core i9-14900HX
83.1 pt
Lenovo Legion Pro 5 16IRX9
Intel Core i9-14900HX
82.7 pt
Aorus 16X 2024
Intel Core i9-14900HX
81.6 pt
Average Intel Core i9-14900HX
 
81.6 pt
SCHENKER XMG Pro 16 Studio (Mid 24)
Intel Core i9-14900HX
76.4 pt
Acer Predator Helios Neo 16 (2024)
Intel Core i7-14700HX
74.1 pt
Average of class Gaming
 
64.7 pt
SCHENKER XMG Pro 16 Studio (Mid 23)
Intel Core i9-13900H
60.3 pt
Cinebench R23
Multi Core
Lenovo Legion 7 16 IRX G9
Intel Core i9-14900HX
31127 Points +11%
Lenovo Legion Pro 5 16IRX9
Intel Core i9-14900HX
29686 (26317.7min - 29686max) Points +6%
Average Intel Core i9-14900HX
  (17078 - 36249, n=34)
29130 Points +4%
SCHENKER XMG Pro 16 Studio (Mid 24)
Intel Core i9-14900HX
28075 Points
Aorus 16X 2024
Intel Core i9-14900HX
27818 Points -1%
Acer Predator Helios Neo 16 (2024)
Intel Core i7-14700HX
23207 Points -17%
Average of class Gaming
  (5668 - 36249, n=193, last 2 years)
21651 Points -23%
SCHENKER XMG Pro 16 Studio (Mid 23)
Intel Core i9-13900H
17706 Points -37%
Single Core
Lenovo Legion 7 16 IRX G9
Intel Core i9-14900HX
2195 Points +7%
Aorus 16X 2024
Intel Core i9-14900HX
2188 Points +7%
Average Intel Core i9-14900HX
  (1720 - 2245, n=34)
2157 Points +5%
Lenovo Legion Pro 5 16IRX9
Intel Core i9-14900HX
2122 Points +4%
Acer Predator Helios Neo 16 (2024)
Intel Core i7-14700HX
2103 Points +3%
SCHENKER XMG Pro 16 Studio (Mid 24)
Intel Core i9-14900HX
2049 Points
SCHENKER XMG Pro 16 Studio (Mid 23)
Intel Core i9-13900H
1927 Points -6%
Average of class Gaming
  (1088 - 2235, n=191, last 2 years)
1877 Points -8%
Cinebench R20
CPU (Multi Core)
Lenovo Legion 7 16 IRX G9
Intel Core i9-14900HX
11898 Points +14%
Lenovo Legion Pro 5 16IRX9
Intel Core i9-14900HX
11319 Points +8%
Average Intel Core i9-14900HX
  (6579 - 13832, n=34)
11084 Points +6%
Aorus 16X 2024
Intel Core i9-14900HX
10655 Points +2%
SCHENKER XMG Pro 16 Studio (Mid 24)
Intel Core i9-14900HX
10474 Points
Acer Predator Helios Neo 16 (2024)
Intel Core i7-14700HX
8361 Points -20%
Average of class Gaming
  (2179 - 13832, n=191, last 2 years)
8240 Points -21%
SCHENKER XMG Pro 16 Studio (Mid 23)
Intel Core i9-13900H
6773 Points -35%
CPU (Single Core)
Lenovo Legion 7 16 IRX G9
Intel Core i9-14900HX
845 Points +7%
Aorus 16X 2024
Intel Core i9-14900HX
841 Points +7%
Average Intel Core i9-14900HX
  (657 - 859, n=34)
826 Points +5%
Lenovo Legion Pro 5 16IRX9
Intel Core i9-14900HX
812 Points +3%
Acer Predator Helios Neo 16 (2024)
Intel Core i7-14700HX
803 Points +2%
SCHENKER XMG Pro 16 Studio (Mid 24)
Intel Core i9-14900HX
789 Points
SCHENKER XMG Pro 16 Studio (Mid 23)
Intel Core i9-13900H
735 Points -7%
Average of class Gaming
  (427 - 856, n=191, last 2 years)
722 Points -8%
Cinebench R15
CPU Multi 64Bit
Lenovo Legion 7 16 IRX G9
Intel Core i9-14900HX
4691 (3900.54min - 4690.98max) Points +8%
Lenovo Legion Pro 5 16IRX9
Intel Core i9-14900HX
4591 (4151.1min - 4590.84max) Points +6%
Average Intel Core i9-14900HX
  (3263 - 5589, n=35)
4462 Points +3%
SCHENKER XMG Pro 16 Studio (Mid 24)
Intel Core i9-14900HX
4350 Points
Aorus 16X 2024
Intel Core i9-14900HX
4280 Points -2%
Acer Predator Helios Neo 16 (2024)
Intel Core i7-14700HX
3455 Points -21%
Average of class Gaming
  (905 - 5663, n=198, last 2 years)
3394 Points -22%
SCHENKER XMG Pro 16 Studio (Mid 23)
Intel Core i9-13900H
2739 Points -37%
CPU Single 64Bit
Aorus 16X 2024
Intel Core i9-14900HX
312 Points +11%
Lenovo Legion 7 16 IRX G9
Intel Core i9-14900HX
309 Points +10%
Average Intel Core i9-14900HX
  (247 - 323, n=34)
306 Points +9%
Lenovo Legion Pro 5 16IRX9
Intel Core i9-14900HX
299 Points +6%
Acer Predator Helios Neo 16 (2024)
Intel Core i7-14700HX
294 Points +5%
SCHENKER XMG Pro 16 Studio (Mid 24)
Intel Core i9-14900HX
281 Points
SCHENKER XMG Pro 16 Studio (Mid 23)
Intel Core i9-13900H
278 Points -1%
Average of class Gaming
  (176.6 - 318, n=195, last 2 years)
276 Points -2%
Blender - v2.79 BMW27 CPU
SCHENKER XMG Pro 16 Studio (Mid 23)
Intel Core i9-13900H
186 Seconds * -43%
Average of class Gaming
  (87 - 555, n=186, last 2 years)
172.1 Seconds * -32%
Acer Predator Helios Neo 16 (2024)
Intel Core i7-14700HX
140 Seconds * -8%
SCHENKER XMG Pro 16 Studio (Mid 24)
Intel Core i9-14900HX
130 Seconds *
Aorus 16X 2024
Intel Core i9-14900HX
126 Seconds * +3%
Lenovo Legion 7 16 IRX G9
Intel Core i9-14900HX
123 Seconds * +5%
Average Intel Core i9-14900HX
  (91 - 206, n=34)
119.5 Seconds * +8%
Lenovo Legion Pro 5 16IRX9
Intel Core i9-14900HX
113 Seconds * +13%
7-Zip 18.03
7z b 4
Lenovo Legion Pro 5 16IRX9
Intel Core i9-14900HX
115585 MIPS +11%
Average Intel Core i9-14900HX
  (66769 - 136645, n=34)
112494 MIPS +8%
Lenovo Legion 7 16 IRX G9
Intel Core i9-14900HX
109964 MIPS +6%
Aorus 16X 2024
Intel Core i9-14900HX
106866 MIPS +3%
SCHENKER XMG Pro 16 Studio (Mid 24)
Intel Core i9-14900HX
104193 MIPS
Acer Predator Helios Neo 16 (2024)
Intel Core i7-14700HX
93134 MIPS -11%
Average of class Gaming
  (23795 - 140932, n=190, last 2 years)
84653 MIPS -19%
SCHENKER XMG Pro 16 Studio (Mid 23)
Intel Core i9-13900H
68491 MIPS -34%
7z b 4 -mmt1
Aorus 16X 2024
Intel Core i9-14900HX
7297 MIPS +6%
Lenovo Legion 7 16 IRX G9
Intel Core i9-14900HX
7204 MIPS +4%
Average Intel Core i9-14900HX
  (5452 - 7545, n=34)
7017 MIPS +1%
SCHENKER XMG Pro 16 Studio (Mid 24)
Intel Core i9-14900HX
6914 MIPS
Acer Predator Helios Neo 16 (2024)
Intel Core i7-14700HX
6890 MIPS 0%
Lenovo Legion Pro 5 16IRX9
Intel Core i9-14900HX
6776 MIPS -2%
SCHENKER XMG Pro 16 Studio (Mid 23)
Intel Core i9-13900H
6458 MIPS -7%
Average of class Gaming
  (4168 - 7581, n=190, last 2 years)
6281 MIPS -9%
Geekbench 6.3
Multi-Core
Lenovo Legion Pro 5 16IRX9
Intel Core i9-14900HX
18126 Points +6%
Lenovo Legion 7 16 IRX G9
Intel Core i9-14900HX
18079 Points +6%
Aorus 16X 2024
Intel Core i9-14900HX
17408 Points +2%
Average Intel Core i9-14900HX
  (13158 - 19665, n=34)
17369 Points +2%
Acer Predator Helios Neo 16 (2024)
Intel Core i7-14700HX
17292 Points +1%
SCHENKER XMG Pro 16 Studio (Mid 24)
Intel Core i9-14900HX
17086 Points
Average of class Gaming
  (5340 - 19665, n=110, last 2 years)
14171 Points -17%
SCHENKER XMG Pro 16 Studio (Mid 23)
Intel Core i9-13900H
14090 Points -18%
Single-Core
Aorus 16X 2024
Intel Core i9-14900HX
3054 Points +10%
Lenovo Legion 7 16 IRX G9
Intel Core i9-14900HX
2980 Points +8%
Acer Predator Helios Neo 16 (2024)
Intel Core i7-14700HX
2975 Points +8%
Average Intel Core i9-14900HX
  (2419 - 3129, n=34)
2973 Points +8%
Lenovo Legion Pro 5 16IRX9
Intel Core i9-14900HX
2889 Points +5%
SCHENKER XMG Pro 16 Studio (Mid 24)
Intel Core i9-14900HX
2764 Points
SCHENKER XMG Pro 16 Studio (Mid 23)
Intel Core i9-13900H
2645 Points -4%
Average of class Gaming
  (1490 - 3129, n=110, last 2 years)
2641 Points -4%
Geekbench 5.5
Multi-Core
Lenovo Legion Pro 5 16IRX9
Intel Core i9-14900HX
21299 Points +14%
Lenovo Legion 7 16 IRX G9
Intel Core i9-14900HX
20533 Points +10%
Aorus 16X 2024
Intel Core i9-14900HX
19607 Points +5%
Average Intel Core i9-14900HX
  (8618 - 23194, n=34)
19540 Points +4%
SCHENKER XMG Pro 16 Studio (Mid 24)
Intel Core i9-14900HX
18749 Points
Acer Predator Helios Neo 16 (2024)
Intel Core i7-14700HX
18225 Points -3%
Average of class Gaming
  (4557 - 23194, n=191, last 2 years)
14891 Points -21%
SCHENKER XMG Pro 16 Studio (Mid 23)
Intel Core i9-13900H
13072 Points -30%
Single-Core
Aorus 16X 2024
Intel Core i9-14900HX
2183 Points +12%
Acer Predator Helios Neo 16 (2024)
Intel Core i7-14700HX
2131 Points +10%
Lenovo Legion 7 16 IRX G9
Intel Core i9-14900HX
2101 Points +8%
Average Intel Core i9-14900HX
  (1669 - 2210, n=34)
2092 Points +8%
Lenovo Legion Pro 5 16IRX9
Intel Core i9-14900HX
2046 Points +5%
SCHENKER XMG Pro 16 Studio (Mid 24)
Intel Core i9-14900HX
1941 Points
Average of class Gaming
  (986 - 2210, n=191, last 2 years)
1882 Points -3%
SCHENKER XMG Pro 16 Studio (Mid 23)
Intel Core i9-13900H
1861 Points -4%
HWBOT x265 Benchmark v2.2 - 4k Preset
Lenovo Legion Pro 5 16IRX9
Intel Core i9-14900HX
30.1 fps +14%
Average Intel Core i9-14900HX
  (16.8 - 38.9, n=34)
29.7 fps +12%
Lenovo Legion 7 16 IRX G9
Intel Core i9-14900HX
28.8 fps +9%
Aorus 16X 2024
Intel Core i9-14900HX
27 fps +2%
SCHENKER XMG Pro 16 Studio (Mid 24)
Intel Core i9-14900HX
26.5 fps
Acer Predator Helios Neo 16 (2024)
Intel Core i7-14700HX
24.6 fps -7%
Average of class Gaming
  (6.72 - 38.9, n=190, last 2 years)
23.3 fps -12%
SCHENKER XMG Pro 16 Studio (Mid 23)
Intel Core i9-13900H
18.9 fps -29%
LibreOffice - 20 Documents To PDF
Average of class Gaming
  (31.4 - 96.6, n=187, last 2 years)
47.6 s * -3%
SCHENKER XMG Pro 16 Studio (Mid 24)
Intel Core i9-14900HX
46.4 s *
Lenovo Legion 7 16 IRX G9
Intel Core i9-14900HX
44.6 s * +4%
SCHENKER XMG Pro 16 Studio (Mid 23)
Intel Core i9-13900H
44.2 s * +5%
Average Intel Core i9-14900HX
  (31.4 - 85.1, n=34)
43.4 s * +6%
Acer Predator Helios Neo 16 (2024)
Intel Core i7-14700HX
42.5 s * +8%
Lenovo Legion Pro 5 16IRX9
Intel Core i9-14900HX
40.7 s * +12%
Aorus 16X 2024
Intel Core i9-14900HX
38.5 s * +17%
R Benchmark 2.5 - Overall mean
SCHENKER XMG Pro 16 Studio (Mid 23)
Intel Core i9-13900H
0.4412 sec * -8%
Average of class Gaming
  (0.3609 - 0.759, n=191, last 2 years)
0.4402 sec * -8%
SCHENKER XMG Pro 16 Studio (Mid 24)
Intel Core i9-14900HX
0.409 sec *
Lenovo Legion 7 16 IRX G9
Intel Core i9-14900HX
0.393 sec * +4%
Lenovo Legion Pro 5 16IRX9
Intel Core i9-14900HX
0.3917 sec * +4%
Average Intel Core i9-14900HX
  (0.3604 - 0.4859, n=34)
0.3845 sec * +6%
Acer Predator Helios Neo 16 (2024)
Intel Core i7-14700HX
0.3821 sec * +7%
Aorus 16X 2024
Intel Core i9-14900HX
0.3782 sec * +8%

* ... im mniej tym lepiej

Cinebench R15 CPU Multi 64Bit
4350 Points
Cinebench R15 OpenGL 64Bit
257 fps
Cinebench R15 Ref. Match 64Bit
99.6 %
Cinebench R15 CPU Single 64Bit
281 Points
Cinebench R20 CPU (Single Core)
789 Points
Cinebench R20 CPU (Multi Core)
10474 Points
Cinebench R23 Multi Core
28075 Points
Cinebench R23 Single Core
2049 Points
Cinebench 2024 CPU Multi Core
1393 Points
Cinebench 2024 CPU Single Core
118.8 Points
Pomoc
Performance Rating
Lenovo Legion Pro 5 16IRX9
Intel Core i9-14900HX, NVIDIA GeForce RTX 4070 Laptop GPU
97.8 pt
Average Intel Core i9-14900HX
 
97.2 pt
Aorus 16X 2024
Intel Core i9-14900HX, NVIDIA GeForce RTX 4070 Laptop GPU
91.1 pt
Lenovo Legion 7 16 IRX G9
Intel Core i9-14900HX, NVIDIA GeForce RTX 4070 Laptop GPU
89.5 pt
SCHENKER XMG Pro 16 Studio (Mid 24)
Intel Core i9-14900HX, NVIDIA GeForce RTX 4070 Laptop GPU
86.9 pt
Acer Predator Helios Neo 16 (2024)
Intel Core i7-14700HX, NVIDIA GeForce RTX 4070 Laptop GPU
85 pt
Average of class Gaming
 
80.7 pt
SCHENKER XMG Pro 16 Studio (Mid 23)
Intel Core i9-13900H, NVIDIA GeForce RTX 4070 Laptop GPU
71.1 pt
AIDA64 / FP32 Ray-Trace
Lenovo Legion 7 16 IRX G9
Intel Core i9-14900HX, NVIDIA GeForce RTX 4070 Laptop GPU
25381 KRay/s +19%
Average Intel Core i9-14900HX
  (13098 - 33474, n=33)
25096 KRay/s +17%
Lenovo Legion Pro 5 16IRX9
Intel Core i9-14900HX, NVIDIA GeForce RTX 4070 Laptop GPU
25072 KRay/s +17%
Aorus 16X 2024
Intel Core i9-14900HX, NVIDIA GeForce RTX 4070 Laptop GPU
23082 KRay/s +8%
Average of class Gaming
  (4986 - 60169, n=187, last 2 years)
21640 KRay/s +1%
Acer Predator Helios Neo 16 (2024)
Intel Core i7-14700HX, NVIDIA GeForce RTX 4070 Laptop GPU
21558 KRay/s +1%
SCHENKER XMG Pro 16 Studio (Mid 24)
Intel Core i9-14900HX, NVIDIA GeForce RTX 4070 Laptop GPU
21393 KRay/s
SCHENKER XMG Pro 16 Studio (Mid 23)
Intel Core i9-13900H, NVIDIA GeForce RTX 4070 Laptop GPU
16419 KRay/s -23%
AIDA64 / FPU Julia
Lenovo Legion Pro 5 16IRX9
Intel Core i9-14900HX, NVIDIA GeForce RTX 4070 Laptop GPU
129169 Points +17%
Average Intel Core i9-14900HX
  (67573 - 166040, n=33)
125765 Points +14%
Lenovo Legion 7 16 IRX G9
Intel Core i9-14900HX, NVIDIA GeForce RTX 4070 Laptop GPU
117057 Points +6%
Aorus 16X 2024
Intel Core i9-14900HX, NVIDIA GeForce RTX 4070 Laptop GPU
116836 Points +6%
SCHENKER XMG Pro 16 Studio (Mid 24)
Intel Core i9-14900HX, NVIDIA GeForce RTX 4070 Laptop GPU
110279 Points
Acer Predator Helios Neo 16 (2024)
Intel Core i7-14700HX, NVIDIA GeForce RTX 4070 Laptop GPU
107531 Points -2%
Average of class Gaming
  (25360 - 252486, n=187, last 2 years)
106090 Points -4%
SCHENKER XMG Pro 16 Studio (Mid 23)
Intel Core i9-13900H, NVIDIA GeForce RTX 4070 Laptop GPU
83334 Points -24%
AIDA64 / CPU SHA3
Lenovo Legion Pro 5 16IRX9
Intel Core i9-14900HX, NVIDIA GeForce RTX 4070 Laptop GPU
6285 MB/s +12%
Average Intel Core i9-14900HX
  (3589 - 7979, n=33)
6212 MB/s +11%
Aorus 16X 2024
Intel Core i9-14900HX, NVIDIA GeForce RTX 4070 Laptop GPU
5723 MB/s +2%
Lenovo Legion 7 16 IRX G9
Intel Core i9-14900HX, NVIDIA GeForce RTX 4070 Laptop GPU
5658 MB/s +1%
SCHENKER XMG Pro 16 Studio (Mid 24)
Intel Core i9-14900HX, NVIDIA GeForce RTX 4070 Laptop GPU
5615 MB/s
Acer Predator Helios Neo 16 (2024)
Intel Core i7-14700HX, NVIDIA GeForce RTX 4070 Laptop GPU
5056 MB/s -10%
Average of class Gaming
  (1339 - 10389, n=187, last 2 years)
4852 MB/s -14%
SCHENKER XMG Pro 16 Studio (Mid 23)
Intel Core i9-13900H, NVIDIA GeForce RTX 4070 Laptop GPU
3809 MB/s -32%
AIDA64 / CPU Queen
Acer Predator Helios Neo 16 (2024)
Intel Core i7-14700HX, NVIDIA GeForce RTX 4070 Laptop GPU
150835 Points +11%
Lenovo Legion Pro 5 16IRX9
Intel Core i9-14900HX, NVIDIA GeForce RTX 4070 Laptop GPU
142503 Points +4%
Lenovo Legion 7 16 IRX G9
Intel Core i9-14900HX, NVIDIA GeForce RTX 4070 Laptop GPU
141814 Points +4%
Aorus 16X 2024
Intel Core i9-14900HX, NVIDIA GeForce RTX 4070 Laptop GPU
139355 Points +2%
Average Intel Core i9-14900HX
  (118405 - 148966, n=33)
138709 Points +2%
SCHENKER XMG Pro 16 Studio (Mid 24)
Intel Core i9-14900HX, NVIDIA GeForce RTX 4070 Laptop GPU
136489 Points
Average of class Gaming
  (50699 - 200651, n=187, last 2 years)
116237 Points -15%
SCHENKER XMG Pro 16 Studio (Mid 23)
Intel Core i9-13900H, NVIDIA GeForce RTX 4070 Laptop GPU
104502 Points -23%
AIDA64 / FPU SinJulia
Lenovo Legion Pro 5 16IRX9
Intel Core i9-14900HX, NVIDIA GeForce RTX 4070 Laptop GPU
15401 Points +11%
Average Intel Core i9-14900HX
  (10475 - 18517, n=33)
15369 Points +11%
Aorus 16X 2024
Intel Core i9-14900HX, NVIDIA GeForce RTX 4070 Laptop GPU
14830 Points +7%
Lenovo Legion 7 16 IRX G9
Intel Core i9-14900HX, NVIDIA GeForce RTX 4070 Laptop GPU
13926 Points +1%
SCHENKER XMG Pro 16 Studio (Mid 24)
Intel Core i9-14900HX, NVIDIA GeForce RTX 4070 Laptop GPU
13846 Points
Acer Predator Helios Neo 16 (2024)
Intel Core i7-14700HX, NVIDIA GeForce RTX 4070 Laptop GPU
13605 Points -2%
Average of class Gaming
  (4800 - 32988, n=187, last 2 years)
13175 Points -5%
SCHENKER XMG Pro 16 Studio (Mid 23)
Intel Core i9-13900H, NVIDIA GeForce RTX 4070 Laptop GPU
10361 Points -25%
AIDA64 / FPU Mandel
Lenovo Legion Pro 5 16IRX9
Intel Core i9-14900HX, NVIDIA GeForce RTX 4070 Laptop GPU
62567 Points +19%
Average Intel Core i9-14900HX
  (32543 - 83662, n=33)
61872 Points +18%
Aorus 16X 2024
Intel Core i9-14900HX, NVIDIA GeForce RTX 4070 Laptop GPU
57633 Points +10%
Acer Predator Helios Neo 16 (2024)
Intel Core i7-14700HX, NVIDIA GeForce RTX 4070 Laptop GPU
54174 Points +3%
Average of class Gaming
  (12321 - 134044, n=187, last 2 years)
53471 Points +2%
SCHENKER XMG Pro 16 Studio (Mid 24)
Intel Core i9-14900HX, NVIDIA GeForce RTX 4070 Laptop GPU
52621 Points
Lenovo Legion 7 16 IRX G9
Intel Core i9-14900HX, NVIDIA GeForce RTX 4070 Laptop GPU
47375 Points -10%
SCHENKER XMG Pro 16 Studio (Mid 23)
Intel Core i9-13900H, NVIDIA GeForce RTX 4070 Laptop GPU
40932 Points -22%
AIDA64 / CPU AES
SCHENKER XMG Pro 16 Studio (Mid 23)
Intel Core i9-13900H, NVIDIA GeForce RTX 4070 Laptop GPU
141059 MB/s +32%
Average Intel Core i9-14900HX
  (86964 - 241777, n=33)
137399 MB/s +28%
Lenovo Legion Pro 5 16IRX9
Intel Core i9-14900HX, NVIDIA GeForce RTX 4070 Laptop GPU
120213 MB/s +12%
Aorus 16X 2024
Intel Core i9-14900HX, NVIDIA GeForce RTX 4070 Laptop GPU
112833 MB/s +5%
Lenovo Legion 7 16 IRX G9
Intel Core i9-14900HX, NVIDIA GeForce RTX 4070 Laptop GPU
111489 MB/s +4%
Average of class Gaming
  (19065 - 328679, n=187, last 2 years)
109176 MB/s +2%
SCHENKER XMG Pro 16 Studio (Mid 24)
Intel Core i9-14900HX, NVIDIA GeForce RTX 4070 Laptop GPU
107172 MB/s
Acer Predator Helios Neo 16 (2024)
Intel Core i7-14700HX, NVIDIA GeForce RTX 4070 Laptop GPU
98391 MB/s -8%
AIDA64 / CPU ZLib
Lenovo Legion Pro 5 16IRX9
Intel Core i9-14900HX, NVIDIA GeForce RTX 4070 Laptop GPU
1866 MB/s +14%
Average Intel Core i9-14900HX
  (1054 - 2292, n=33)
1815 MB/s +10%
Aorus 16X 2024
Intel Core i9-14900HX, NVIDIA GeForce RTX 4070 Laptop GPU
1662 MB/s +1%
SCHENKER XMG Pro 16 Studio (Mid 24)
Intel Core i9-14900HX, NVIDIA GeForce RTX 4070 Laptop GPU
1643 MB/s
Lenovo Legion 7 16 IRX G9
Intel Core i9-14900HX, NVIDIA GeForce RTX 4070 Laptop GPU
1639 MB/s 0%
Acer Predator Helios Neo 16 (2024)
Intel Core i7-14700HX, NVIDIA GeForce RTX 4070 Laptop GPU
1494 MB/s -9%
Average of class Gaming
  (373 - 2409, n=187, last 2 years)
1349 MB/s -18%
SCHENKER XMG Pro 16 Studio (Mid 23)
Intel Core i9-13900H, NVIDIA GeForce RTX 4070 Laptop GPU
1088 MB/s -34%
AIDA64 / FP64 Ray-Trace
Lenovo Legion Pro 5 16IRX9
Intel Core i9-14900HX, NVIDIA GeForce RTX 4070 Laptop GPU
13776 KRay/s +20%
Average Intel Core i9-14900HX
  (6809 - 18349, n=33)
13525 KRay/s +18%
Lenovo Legion 7 16 IRX G9
Intel Core i9-14900HX, NVIDIA GeForce RTX 4070 Laptop GPU
12370 KRay/s +8%
Aorus 16X 2024
Intel Core i9-14900HX, NVIDIA GeForce RTX 4070 Laptop GPU
12355 KRay/s +8%
Average of class Gaming
  (2540 - 31796, n=187, last 2 years)
11654 KRay/s +2%
SCHENKER XMG Pro 16 Studio (Mid 24)
Intel Core i9-14900HX, NVIDIA GeForce RTX 4070 Laptop GPU
11481 KRay/s
Acer Predator Helios Neo 16 (2024)
Intel Core i7-14700HX, NVIDIA GeForce RTX 4070 Laptop GPU
11438 KRay/s 0%
SCHENKER XMG Pro 16 Studio (Mid 23)
Intel Core i9-13900H, NVIDIA GeForce RTX 4070 Laptop GPU
8955 KRay/s -22%
AIDA64 / CPU PhotoWorxx
Lenovo Legion Pro 5 16IRX9
Intel Core i9-14900HX, NVIDIA GeForce RTX 4070 Laptop GPU
49676 MPixel/s +2%
Aorus 16X 2024
Intel Core i9-14900HX, NVIDIA GeForce RTX 4070 Laptop GPU
49217 MPixel/s +1%
SCHENKER XMG Pro 16 Studio (Mid 24)
Intel Core i9-14900HX, NVIDIA GeForce RTX 4070 Laptop GPU
48831 MPixel/s
Lenovo Legion 7 16 IRX G9
Intel Core i9-14900HX, NVIDIA GeForce RTX 4070 Laptop GPU
48577 MPixel/s -1%
SCHENKER XMG Pro 16 Studio (Mid 23)
Intel Core i9-13900H, NVIDIA GeForce RTX 4070 Laptop GPU
47412 MPixel/s -3%
Average Intel Core i9-14900HX
  (23903 - 54702, n=33)
46637 MPixel/s -4%
Acer Predator Helios Neo 16 (2024)
Intel Core i7-14700HX, NVIDIA GeForce RTX 4070 Laptop GPU
46636 MPixel/s -4%
Average of class Gaming
  (10805 - 60161, n=188, last 2 years)
39919 MPixel/s -18%

Wydajność systemu

Płynnie działający system zapewnia wystarczającą wydajność do gier, renderowania i strumieniowania, ale zainstalowany sprzęt nie jest w stanie ustanowić żadnych nowych rekordów. Prędkości transferu pamięci RAM są na normalnym poziomie dla pamięci DDR5-5600 RAM.

Pamięć RAM działa w trybie dwukanałowym.
PCMark 10 / Score
Lenovo Legion Pro 5 16IRX9
NVIDIA GeForce RTX 4070 Laptop GPU, i9-14900HX, Samsung PM9A1 MZVL21T0HCLR
8550 Points +5%
Aorus 16X 2024
NVIDIA GeForce RTX 4070 Laptop GPU, i9-14900HX, Gigabyte AG450E1024-SI
8389 Points +3%
Acer Predator Helios Neo 16 (2024)
NVIDIA GeForce RTX 4070 Laptop GPU, i7-14700HX, Samsung PM9A1a MZVL21T0HDLU
8302 Points +2%
Average Intel Core i9-14900HX, NVIDIA GeForce RTX 4070 Laptop GPU
  (7866 - 8550, n=6)
8253 Points +1%
SCHENKER XMG Pro 16 Studio (Mid 24)
NVIDIA GeForce RTX 4070 Laptop GPU, i9-14900HX, Samsung 990 Pro 1 TB
8166 Points
Lenovo Legion 7 16 IRX G9
NVIDIA GeForce RTX 4070 Laptop GPU, i9-14900HX, SK Hynix HFS001TEJ9X115N
8023 Points -2%
SCHENKER XMG Pro 16 Studio (Mid 23)
NVIDIA GeForce RTX 4070 Laptop GPU, i9-13900H, Samsung 990 Pro 1 TB
8010 Points -2%
Average of class Gaming
  (5776 - 9852, n=168, last 2 years)
7774 Points -5%
PCMark 10 / Essentials
SCHENKER XMG Pro 16 Studio (Mid 23)
NVIDIA GeForce RTX 4070 Laptop GPU, i9-13900H, Samsung 990 Pro 1 TB
11940 Points +11%
Acer Predator Helios Neo 16 (2024)
NVIDIA GeForce RTX 4070 Laptop GPU, i7-14700HX, Samsung PM9A1a MZVL21T0HDLU
11708 Points +9%
Lenovo Legion Pro 5 16IRX9
NVIDIA GeForce RTX 4070 Laptop GPU, i9-14900HX, Samsung PM9A1 MZVL21T0HCLR
11286 Points +5%
Average Intel Core i9-14900HX, NVIDIA GeForce RTX 4070 Laptop GPU
  (10621 - 11815, n=6)
11079 Points +3%
Aorus 16X 2024
NVIDIA GeForce RTX 4070 Laptop GPU, i9-14900HX, Gigabyte AG450E1024-SI
11071 Points +3%
Lenovo Legion 7 16 IRX G9
NVIDIA GeForce RTX 4070 Laptop GPU, i9-14900HX, SK Hynix HFS001TEJ9X115N
10958 Points +2%
Average of class Gaming
  (9057 - 12334, n=167, last 2 years)
10836 Points +1%
SCHENKER XMG Pro 16 Studio (Mid 24)
NVIDIA GeForce RTX 4070 Laptop GPU, i9-14900HX, Samsung 990 Pro 1 TB
10725 Points
PCMark 10 / Productivity
Aorus 16X 2024
NVIDIA GeForce RTX 4070 Laptop GPU, i9-14900HX, Gigabyte AG450E1024-SI
11103 Points +1%
SCHENKER XMG Pro 16 Studio (Mid 24)
NVIDIA GeForce RTX 4070 Laptop GPU, i9-14900HX, Samsung 990 Pro 1 TB
11014 Points
Average Intel Core i9-14900HX, NVIDIA GeForce RTX 4070 Laptop GPU
  (9701 - 11103, n=6)
10493 Points -5%
SCHENKER XMG Pro 16 Studio (Mid 23)
NVIDIA GeForce RTX 4070 Laptop GPU, i9-13900H, Samsung 990 Pro 1 TB
10425 Points -5%
Acer Predator Helios Neo 16 (2024)
NVIDIA GeForce RTX 4070 Laptop GPU, i7-14700HX, Samsung PM9A1a MZVL21T0HDLU
10273 Points -7%
Lenovo Legion Pro 5 16IRX9
NVIDIA GeForce RTX 4070 Laptop GPU, i9-14900HX, Samsung PM9A1 MZVL21T0HCLR
10139 Points -8%
Average of class Gaming
  (6662 - 14612, n=167, last 2 years)
9878 Points -10%
Lenovo Legion 7 16 IRX G9
NVIDIA GeForce RTX 4070 Laptop GPU, i9-14900HX, SK Hynix HFS001TEJ9X115N
9701 Points -12%
PCMark 10 / Digital Content Creation
Lenovo Legion Pro 5 16IRX9
NVIDIA GeForce RTX 4070 Laptop GPU, i9-14900HX, Samsung PM9A1 MZVL21T0HCLR
14827 Points +19%
Lenovo Legion 7 16 IRX G9
NVIDIA GeForce RTX 4070 Laptop GPU, i9-14900HX, SK Hynix HFS001TEJ9X115N
13185 Points +5%
Average Intel Core i9-14900HX, NVIDIA GeForce RTX 4070 Laptop GPU
  (12114 - 14827, n=6)
13153 Points +5%
Aorus 16X 2024
NVIDIA GeForce RTX 4070 Laptop GPU, i9-14900HX, Gigabyte AG450E1024-SI
13036 Points +4%
Acer Predator Helios Neo 16 (2024)
NVIDIA GeForce RTX 4070 Laptop GPU, i7-14700HX, Samsung PM9A1a MZVL21T0HDLU
12909 Points +3%
SCHENKER XMG Pro 16 Studio (Mid 24)
NVIDIA GeForce RTX 4070 Laptop GPU, i9-14900HX, Samsung 990 Pro 1 TB
12511 Points
Average of class Gaming
  (6703 - 18475, n=167, last 2 years)
12030 Points -4%
SCHENKER XMG Pro 16 Studio (Mid 23)
NVIDIA GeForce RTX 4070 Laptop GPU, i9-13900H, Samsung 990 Pro 1 TB
11204 Points -10%
CrossMark / Overall
Aorus 16X 2024
NVIDIA GeForce RTX 4070 Laptop GPU, i9-14900HX, Gigabyte AG450E1024-SI
2312 Points +12%
Lenovo Legion 7 16 IRX G9
NVIDIA GeForce RTX 4070 Laptop GPU, i9-14900HX, SK Hynix HFS001TEJ9X115N
2311 Points +12%
Acer Predator Helios Neo 16 (2024)
NVIDIA GeForce RTX 4070 Laptop GPU, i7-14700HX, Samsung PM9A1a MZVL21T0HDLU
2235 Points +8%
Average Intel Core i9-14900HX, NVIDIA GeForce RTX 4070 Laptop GPU
  (2002 - 2312, n=5)
2179 Points +5%
SCHENKER XMG Pro 16 Studio (Mid 24)
NVIDIA GeForce RTX 4070 Laptop GPU, i9-14900HX, Samsung 990 Pro 1 TB
2067 Points
Lenovo Legion Pro 5 16IRX9
NVIDIA GeForce RTX 4070 Laptop GPU, i9-14900HX, Samsung PM9A1 MZVL21T0HCLR
2002 Points -3%
SCHENKER XMG Pro 16 Studio (Mid 23)
NVIDIA GeForce RTX 4070 Laptop GPU, i9-13900H, Samsung 990 Pro 1 TB
1955 Points -5%
Average of class Gaming
  (1247 - 2344, n=151, last 2 years)
1899 Points -8%
CrossMark / Productivity
Aorus 16X 2024
NVIDIA GeForce RTX 4070 Laptop GPU, i9-14900HX, Gigabyte AG450E1024-SI
2191 Points +15%
Lenovo Legion 7 16 IRX G9
NVIDIA GeForce RTX 4070 Laptop GPU, i9-14900HX, SK Hynix HFS001TEJ9X115N
2172 Points +14%
Acer Predator Helios Neo 16 (2024)
NVIDIA GeForce RTX 4070 Laptop GPU, i7-14700HX, Samsung PM9A1a MZVL21T0HDLU
2093 Points +10%
Average Intel Core i9-14900HX, NVIDIA GeForce RTX 4070 Laptop GPU
  (1827 - 2191, n=5)
2042 Points +7%
SCHENKER XMG Pro 16 Studio (Mid 24)
NVIDIA GeForce RTX 4070 Laptop GPU, i9-14900HX, Samsung 990 Pro 1 TB
1911 Points
SCHENKER XMG Pro 16 Studio (Mid 23)
NVIDIA GeForce RTX 4070 Laptop GPU, i9-13900H, Samsung 990 Pro 1 TB
1884 Points -1%
Lenovo Legion Pro 5 16IRX9
NVIDIA GeForce RTX 4070 Laptop GPU, i9-14900HX, Samsung PM9A1 MZVL21T0HCLR
1827 Points -4%
Average of class Gaming
  (1299 - 2204, n=151, last 2 years)
1801 Points -6%
CrossMark / Creativity
Aorus 16X 2024
NVIDIA GeForce RTX 4070 Laptop GPU, i9-14900HX, Gigabyte AG450E1024-SI
2458 Points +4%
Acer Predator Helios Neo 16 (2024)
NVIDIA GeForce RTX 4070 Laptop GPU, i7-14700HX, Samsung PM9A1a MZVL21T0HDLU
2455 Points +4%
Lenovo Legion 7 16 IRX G9
NVIDIA GeForce RTX 4070 Laptop GPU, i9-14900HX, SK Hynix HFS001TEJ9X115N
2452 Points +3%
Average Intel Core i9-14900HX, NVIDIA GeForce RTX 4070 Laptop GPU
  (2287 - 2458, n=5)
2385 Points +1%
SCHENKER XMG Pro 16 Studio (Mid 24)
NVIDIA GeForce RTX 4070 Laptop GPU, i9-14900HX, Samsung 990 Pro 1 TB
2371 Points
Lenovo Legion Pro 5 16IRX9
NVIDIA GeForce RTX 4070 Laptop GPU, i9-14900HX, Samsung PM9A1 MZVL21T0HCLR
2287 Points -4%
Average of class Gaming
  (1275 - 2660, n=151, last 2 years)
2083 Points -12%
SCHENKER XMG Pro 16 Studio (Mid 23)
NVIDIA GeForce RTX 4070 Laptop GPU, i9-13900H, Samsung 990 Pro 1 TB
2028 Points -14%
CrossMark / Responsiveness
Lenovo Legion 7 16 IRX G9
NVIDIA GeForce RTX 4070 Laptop GPU, i9-14900HX, SK Hynix HFS001TEJ9X115N
2330 Points +34%
Aorus 16X 2024
NVIDIA GeForce RTX 4070 Laptop GPU, i9-14900HX, Gigabyte AG450E1024-SI
2259 Points +30%
Acer Predator Helios Neo 16 (2024)
NVIDIA GeForce RTX 4070 Laptop GPU, i7-14700HX, Samsung PM9A1a MZVL21T0HDLU
2053 Points +18%
Average Intel Core i9-14900HX, NVIDIA GeForce RTX 4070 Laptop GPU
  (1734 - 2330, n=5)
2028 Points +17%
SCHENKER XMG Pro 16 Studio (Mid 23)
NVIDIA GeForce RTX 4070 Laptop GPU, i9-13900H, Samsung 990 Pro 1 TB
1952 Points +13%
Lenovo Legion Pro 5 16IRX9
NVIDIA GeForce RTX 4070 Laptop GPU, i9-14900HX, Samsung PM9A1 MZVL21T0HCLR
1769 Points +2%
SCHENKER XMG Pro 16 Studio (Mid 24)
NVIDIA GeForce RTX 4070 Laptop GPU, i9-14900HX, Samsung 990 Pro 1 TB
1734 Points
Average of class Gaming
  (1030 - 2330, n=151, last 2 years)
1699 Points -2%
WebXPRT 3 / Overall
Lenovo Legion 7 16 IRX G9
NVIDIA GeForce RTX 4070 Laptop GPU, i9-14900HX, SK Hynix HFS001TEJ9X115N
342 Points +7%
Average Intel Core i9-14900HX, NVIDIA GeForce RTX 4070 Laptop GPU
  (319 - 342, n=6)
333 Points +4%
Aorus 16X 2024
NVIDIA GeForce RTX 4070 Laptop GPU, i9-14900HX, Gigabyte AG450E1024-SI
330 Points +3%
Acer Predator Helios Neo 16 (2024)
NVIDIA GeForce RTX 4070 Laptop GPU, i7-14700HX, Samsung PM9A1a MZVL21T0HDLU
323 Points +1%
Lenovo Legion Pro 5 16IRX9
NVIDIA GeForce RTX 4070 Laptop GPU, i9-14900HX, Samsung PM9A1 MZVL21T0HCLR
322 Points +1%
SCHENKER XMG Pro 16 Studio (Mid 23)
NVIDIA GeForce RTX 4070 Laptop GPU, i9-13900H, Samsung 990 Pro 1 TB
320 Points 0%
SCHENKER XMG Pro 16 Studio (Mid 24)
NVIDIA GeForce RTX 4070 Laptop GPU, i9-14900HX, Samsung 990 Pro 1 TB
319 Points
Average of class Gaming
  (215 - 480, n=165, last 2 years)
303 Points -5%
WebXPRT 4 / Overall
Acer Predator Helios Neo 16 (2024)
NVIDIA GeForce RTX 4070 Laptop GPU, i7-14700HX, Samsung PM9A1a MZVL21T0HDLU
307 Points +2%
SCHENKER XMG Pro 16 Studio (Mid 24)
NVIDIA GeForce RTX 4070 Laptop GPU, i9-14900HX, Samsung 990 Pro 1 TB
301 Points
Average Intel Core i9-14900HX, NVIDIA GeForce RTX 4070 Laptop GPU
  (291 - 301, n=4)
298 Points -1%
Lenovo Legion 7 16 IRX G9
NVIDIA GeForce RTX 4070 Laptop GPU, i9-14900HX, SK Hynix HFS001TEJ9X115N
297.6 Points -1%
Lenovo Legion Pro 5 16IRX9
NVIDIA GeForce RTX 4070 Laptop GPU, i9-14900HX, Samsung PM9A1 MZVL21T0HCLR
291 Points -3%
Average of class Gaming
  (157.9 - 328, n=153, last 2 years)
266 Points -12%
Mozilla Kraken 1.1 / Total
Average of class Gaming
  (421 - 779, n=179, last 2 years)
506 ms * -10%
SCHENKER XMG Pro 16 Studio (Mid 23)
NVIDIA GeForce RTX 4070 Laptop GPU, i9-13900H, Samsung 990 Pro 1 TB
505 ms * -10%
SCHENKER XMG Pro 16 Studio (Mid 24)
NVIDIA GeForce RTX 4070 Laptop GPU, i9-14900HX, Samsung 990 Pro 1 TB
461 ms *
Lenovo Legion Pro 5 16IRX9
NVIDIA GeForce RTX 4070 Laptop GPU, i9-14900HX, Samsung PM9A1 MZVL21T0HCLR
449 ms * +3%
Acer Predator Helios Neo 16 (2024)
NVIDIA GeForce RTX 4070 Laptop GPU, i7-14700HX, Samsung PM9A1a MZVL21T0HDLU
447 ms * +3%
Lenovo Legion 7 16 IRX G9
NVIDIA GeForce RTX 4070 Laptop GPU, i9-14900HX, SK Hynix HFS001TEJ9X115N
443 ms * +4%
Average Intel Core i9-14900HX, NVIDIA GeForce RTX 4070 Laptop GPU
  (431 - 461, n=6)
443 ms * +4%
Aorus 16X 2024
NVIDIA GeForce RTX 4070 Laptop GPU, i9-14900HX, Gigabyte AG450E1024-SI
436 ms * +5%

* ... im mniej tym lepiej

PCMark 10 Score
8166 pkt.
Pomoc
AIDA64 / Memory Copy
Lenovo Legion Pro 5 16IRX9
Intel Core i9-14900HX, NVIDIA GeForce RTX 4070 Laptop GPU
78979 MB/s 0%
Lenovo Legion 7 16 IRX G9
Intel Core i9-14900HX, NVIDIA GeForce RTX 4070 Laptop GPU
78859 MB/s 0%
Aorus 16X 2024
Intel Core i9-14900HX, NVIDIA GeForce RTX 4070 Laptop GPU
78854 MB/s 0%
SCHENKER XMG Pro 16 Studio (Mid 24)
Intel Core i9-14900HX, NVIDIA GeForce RTX 4070 Laptop GPU
78788 MB/s
Acer Predator Helios Neo 16 (2024)
Intel Core i7-14700HX, NVIDIA GeForce RTX 4070 Laptop GPU
75827 MB/s -4%
Average Intel Core i9-14900HX
  (38028 - 83392, n=33)
74739 MB/s -5%
SCHENKER XMG Pro 16 Studio (Mid 23)
Intel Core i9-13900H, NVIDIA GeForce RTX 4070 Laptop GPU
70102 MB/s -11%
Average of class Gaming
  (21842 - 94222, n=187, last 2 years)
64907 MB/s -18%
AIDA64 / Memory Read
Aorus 16X 2024
Intel Core i9-14900HX, NVIDIA GeForce RTX 4070 Laptop GPU
86538 MB/s +1%
Lenovo Legion Pro 5 16IRX9
Intel Core i9-14900HX, NVIDIA GeForce RTX 4070 Laptop GPU
86376 MB/s +1%
Lenovo Legion 7 16 IRX G9
Intel Core i9-14900HX, NVIDIA GeForce RTX 4070 Laptop GPU
85746 MB/s 0%
SCHENKER XMG Pro 16 Studio (Mid 24)
Intel Core i9-14900HX, NVIDIA GeForce RTX 4070 Laptop GPU
85460 MB/s
Acer Predator Helios Neo 16 (2024)
Intel Core i7-14700HX, NVIDIA GeForce RTX 4070 Laptop GPU
83034 MB/s -3%
Average Intel Core i9-14900HX
  (43306 - 87568, n=33)
80919 MB/s -5%
SCHENKER XMG Pro 16 Studio (Mid 23)
Intel Core i9-13900H, NVIDIA GeForce RTX 4070 Laptop GPU
75433 MB/s -12%
Average of class Gaming
  (23681 - 99713, n=187, last 2 years)
68658 MB/s -20%
AIDA64 / Memory Write
Aorus 16X 2024
Intel Core i9-14900HX, NVIDIA GeForce RTX 4070 Laptop GPU
77406 MB/s +6%
Lenovo Legion Pro 5 16IRX9
Intel Core i9-14900HX, NVIDIA GeForce RTX 4070 Laptop GPU
77346 MB/s +6%
Lenovo Legion 7 16 IRX G9
Intel Core i9-14900HX, NVIDIA GeForce RTX 4070 Laptop GPU
74500 MB/s +2%
SCHENKER XMG Pro 16 Studio (Mid 24)
Intel Core i9-14900HX, NVIDIA GeForce RTX 4070 Laptop GPU
73167 MB/s
SCHENKER XMG Pro 16 Studio (Mid 23)
Intel Core i9-13900H, NVIDIA GeForce RTX 4070 Laptop GPU
72225 MB/s -1%
Average Intel Core i9-14900HX
  (37146 - 80589, n=33)
71949 MB/s -2%
Acer Predator Helios Neo 16 (2024)
Intel Core i7-14700HX, NVIDIA GeForce RTX 4070 Laptop GPU
70034 MB/s -4%
Average of class Gaming
  (22986 - 108954, n=187, last 2 years)
66727 MB/s -9%
AIDA64 / Memory Latency
Average of class Gaming
  (59.5 - 259, n=187, last 2 years)
94.1 ns * -12%
Acer Predator Helios Neo 16 (2024)
Intel Core i7-14700HX, NVIDIA GeForce RTX 4070 Laptop GPU
91.1 ns * -8%
SCHENKER XMG Pro 16 Studio (Mid 23)
Intel Core i9-13900H, NVIDIA GeForce RTX 4070 Laptop GPU
87.1 ns * -4%
Average Intel Core i9-14900HX
  (76.1 - 105, n=33)
84.8 ns * -1%
SCHENKER XMG Pro 16 Studio (Mid 24)
Intel Core i9-14900HX, NVIDIA GeForce RTX 4070 Laptop GPU
84 ns *
Lenovo Legion 7 16 IRX G9
Intel Core i9-14900HX, NVIDIA GeForce RTX 4070 Laptop GPU
83.5 ns * +1%
Lenovo Legion Pro 5 16IRX9
Intel Core i9-14900HX, NVIDIA GeForce RTX 4070 Laptop GPU
83.4 ns * +1%
Aorus 16X 2024
Intel Core i9-14900HX, NVIDIA GeForce RTX 4070 Laptop GPU
82.5 ns * +2%

* ... im mniej tym lepiej

Opóźnienia DPC

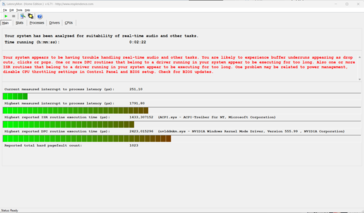
Ze względu na stosunkowo wysokie opóźnienia laptopa, edycja wideo i audio w czasie rzeczywistym nie jest przewidziana. Przyszłe aktualizacje oprogramowania mogą jednak doprowadzić do zmian w tym zakresie.

Monitor opóźnienia
Monitor opóźnienia
Monitor opóźnienia
Monitor opóźnienia
DPC Latencies / LatencyMon - interrupt to process latency (max), Web, Youtube, Prime95
SCHENKER XMG Pro 16 Studio (Mid 23)
NVIDIA GeForce RTX 4070 Laptop GPU, i9-13900H, Samsung 990 Pro 1 TB
1857.6 μs * -4%
SCHENKER XMG Pro 16 Studio (Mid 24)
NVIDIA GeForce RTX 4070 Laptop GPU, i9-14900HX, Samsung 990 Pro 1 TB
1791.8 μs *
Lenovo Legion 7 16 IRX G9
NVIDIA GeForce RTX 4070 Laptop GPU, i9-14900HX, SK Hynix HFS001TEJ9X115N
1559.5 μs * +13%
Acer Predator Helios Neo 16 (2024)
NVIDIA GeForce RTX 4070 Laptop GPU, i7-14700HX, Samsung PM9A1a MZVL21T0HDLU
1451.9 μs * +19%
Aorus 16X 2024
NVIDIA GeForce RTX 4070 Laptop GPU, i9-14900HX, Gigabyte AG450E1024-SI
1162.9 μs * +35%
Lenovo Legion Pro 5 16IRX9
NVIDIA GeForce RTX 4070 Laptop GPU, i9-14900HX, Samsung PM9A1 MZVL21T0HCLR
989.1 μs * +45%

* ... im mniej tym lepiej

Urządzenia pamięci masowej

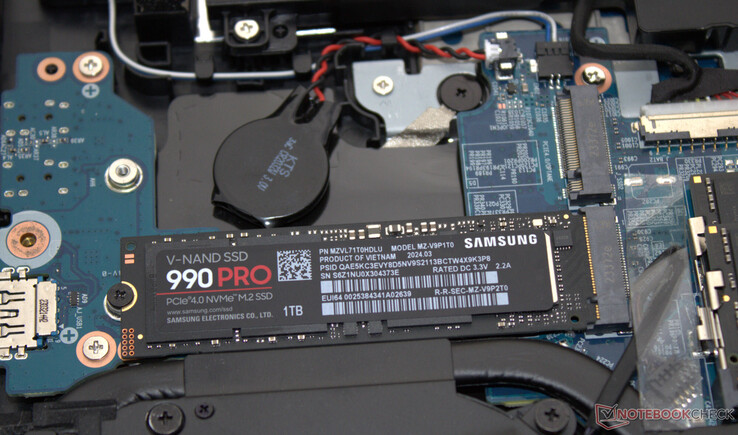
Sklep internetowy Schenker oferuje szeroki wybór dysków SSD - w naszym urządzeniu testowym znalazł się błyskawiczny model (1 TB, PCIe 4, M.2-2280) firmy Samsung. Pozytywne: Nie wystąpił throttling indukowany termicznie. Laptop może pomieścić do dwóch dysków SSD PCIe 4 (M.2-2280). Obsługiwany jest RAID-0/1.

Pro 16 oferuje miejsce na dwa dyski SSD PCIe-4.
Samsung 990 Pro 1 TB
CDM 5/6 Read Seq Q32T1: 7089 MB/s
CDM 5/6 Write Seq Q32T1: 6849 MB/s
CDM 5/6 Read 4K Q32T1: 681.3 MB/s
CDM 5/6 Write 4K Q32T1: 462.3 MB/s
CDM 5 Read Seq: 3840 MB/s
CDM 5 Write Seq: 4952 MB/s
CDM 5/6 Read 4K: 84.39 MB/s
CDM 5/6 Write 4K: 266.6 MB/s
Drive Performance Rating - Percent
Lenovo Legion 7 16 IRX G9
SK Hynix HFS001TEJ9X115N
93.9 pt
SCHENKER XMG Pro 16 Studio (Mid 23)
Samsung 990 Pro 1 TB
86.8 pt
Acer Predator Helios Neo 16 (2024)
Samsung PM9A1a MZVL21T0HDLU
82.4 pt
SCHENKER XMG Pro 16 Studio (Mid 24)
Samsung 990 Pro 1 TB
82.2 pt
Average Samsung 990 Pro 1 TB
 
76.9 pt
Lenovo Legion Pro 5 16IRX9
Samsung PM9A1 MZVL21T0HCLR
74.3 pt
Aorus 16X 2024
Gigabyte AG450E1024-SI
71.7 pt
Average of class Gaming
 
62.6 pt
DiskSpd
seq read
Lenovo Legion 7 16 IRX G9
SK Hynix HFS001TEJ9X115N
4175 (4140.41min - 4174.97max) MB/s +63%
Acer Predator Helios Neo 16 (2024)
Samsung PM9A1a MZVL21T0HDLU
4104 (4091.75min - 4103.68max) MB/s +61%
Lenovo Legion Pro 5 16IRX9
Samsung PM9A1 MZVL21T0HCLR
4037 (3964.04min - 4036.7max) MB/s +58%
Average of class Gaming
  (1319 - 7045, n=168, last 2 years)
3487 MB/s +36%
Average Samsung 990 Pro 1 TB
  (2556 - 4234, n=18)
3249 MB/s +27%
SCHENKER XMG Pro 16 Studio (Mid 23)
Samsung 990 Pro 1 TB
3157 (2968.73min - 3157.45max) MB/s +24%
Aorus 16X 2024
Gigabyte AG450E1024-SI
2620 (2556.56min - 2619.76max) MB/s +3%
SCHENKER XMG Pro 16 Studio (Mid 24)
Samsung 990 Pro 1 TB
2556 (2209.35min - 2555.51max) MB/s
seq write
Lenovo Legion 7 16 IRX G9
SK Hynix HFS001TEJ9X115N
5091 (5032.33min - 5091.26max) MB/s +5%
SCHENKER XMG Pro 16 Studio (Mid 24)
Samsung 990 Pro 1 TB
4834 (4439.32min - 4834.12max) MB/s
Average Samsung 990 Pro 1 TB
  (3598 - 5842, n=18)
4777 MB/s -1%
Aorus 16X 2024
Gigabyte AG450E1024-SI
4757 (4720.06min - 4757.31max) MB/s -2%
SCHENKER XMG Pro 16 Studio (Mid 23)
Samsung 990 Pro 1 TB
4698 (3640.45min - 4697.66max) MB/s -3%
Acer Predator Helios Neo 16 (2024)
Samsung PM9A1a MZVL21T0HDLU
4533 (4522.27min - 4532.95max) MB/s -6%
Lenovo Legion Pro 5 16IRX9
Samsung PM9A1 MZVL21T0HCLR
4093 (4016.82min - 4092.8max) MB/s -15%
Average of class Gaming
  (535 - 9307, n=168, last 2 years)
3797 MB/s -21%
seq q8 t1 read
Average Samsung 990 Pro 1 TB
  (7011 - 7148, n=18)
7091 MB/s +1%
SCHENKER XMG Pro 16 Studio (Mid 23)
Samsung 990 Pro 1 TB
7090 (6633.87min - 7089.84max) MB/s +1%
Acer Predator Helios Neo 16 (2024)
Samsung PM9A1a MZVL21T0HDLU
7058 (6624.24min - 7058.17max) MB/s 0%
SCHENKER XMG Pro 16 Studio (Mid 24)
Samsung 990 Pro 1 TB
7049 (5964.33min - 7049.37max) MB/s
Lenovo Legion 7 16 IRX G9
SK Hynix HFS001TEJ9X115N
7019 (6133.64min - 7018.76max) MB/s 0%
Lenovo Legion Pro 5 16IRX9
Samsung PM9A1 MZVL21T0HCLR
6636 (6205.02min - 6635.75max) MB/s -6%
Average of class Gaming
  (2594 - 16089, n=168, last 2 years)
6328 MB/s -10%
Aorus 16X 2024
Gigabyte AG450E1024-SI
5181 (4323.23min - 5181.35max) MB/s -27%
seq q8 t1 write
SCHENKER XMG Pro 16 Studio (Mid 24)
Samsung 990 Pro 1 TB
6896 (6883.77min - 6896.11max) MB/s
Average Samsung 990 Pro 1 TB
  (6531 - 6898, n=18)
6802 MB/s -1%
SCHENKER XMG Pro 16 Studio (Mid 23)
Samsung 990 Pro 1 TB
6770 (6323.06min - 6770.24max) MB/s -2%
Lenovo Legion 7 16 IRX G9
SK Hynix HFS001TEJ9X115N
6500 (6455.66min - 6499.7max) MB/s -6%
Acer Predator Helios Neo 16 (2024)
Samsung PM9A1a MZVL21T0HDLU
5265 (5223.42min - 5264.69max) MB/s -24%
Lenovo Legion Pro 5 16IRX9
Samsung PM9A1 MZVL21T0HCLR
4949 (4932.28min - 4948.61max) MB/s -28%
Average of class Gaming
  (539 - 14571, n=168, last 2 years)
4823 MB/s -30%
Aorus 16X 2024
Gigabyte AG450E1024-SI
4821 (4606.6min - 4820.72max) MB/s -30%
4k q1 t1 read
Acer Predator Helios Neo 16 (2024)
Samsung PM9A1a MZVL21T0HDLU
95.2 (94.25min - 95.19max) MB/s +13%
Lenovo Legion Pro 5 16IRX9
Samsung PM9A1 MZVL21T0HCLR
92.7 (91.49min - 92.68max) MB/s +10%
Lenovo Legion 7 16 IRX G9
SK Hynix HFS001TEJ9X115N
84.6 (83.7min - 84.58max) MB/s 0%
SCHENKER XMG Pro 16 Studio (Mid 24)
Samsung 990 Pro 1 TB
84.4 (72.17min - 84.41max) MB/s
Average Samsung 990 Pro 1 TB
  (55.3 - 99, n=18)
76.4 MB/s -9%
Average of class Gaming
  (30.6 - 95.9, n=168, last 2 years)
65.8 MB/s -22%
SCHENKER XMG Pro 16 Studio (Mid 23)
Samsung 990 Pro 1 TB
55.3 (53.37min - 55.32max) MB/s -34%
Aorus 16X 2024
Gigabyte AG450E1024-SI
47.2 (45.9min - 47.16max) MB/s -44%
4k q1 t1 write
SCHENKER XMG Pro 16 Studio (Mid 23)
Samsung 990 Pro 1 TB
343 (338.95min - 343.03max) MB/s +23%
Aorus 16X 2024
Gigabyte AG450E1024-SI
340 (329.38min - 339.78max) MB/s +21%
Lenovo Legion 7 16 IRX G9
SK Hynix HFS001TEJ9X115N
334 (316.9min - 334.07max) MB/s +19%
SCHENKER XMG Pro 16 Studio (Mid 24)
Samsung 990 Pro 1 TB
280 (277.46min - 279.66max) MB/s
Acer Predator Helios Neo 16 (2024)
Samsung PM9A1a MZVL21T0HDLU
270 (268.96min - 269.65max) MB/s -4%
Lenovo Legion Pro 5 16IRX9
Samsung PM9A1 MZVL21T0HCLR
251 (249.74min - 251.16max) MB/s -10%
Average Samsung 990 Pro 1 TB
  (133.9 - 343, n=18)
235 MB/s -16%
Average of class Gaming
  (66.6 - 397, n=168, last 2 years)
222 MB/s -21%
4k q32 t16 read
Lenovo Legion 7 16 IRX G9
SK Hynix HFS001TEJ9X115N
5847 (5827.75min - 5846.56max) MB/s +19%
SCHENKER XMG Pro 16 Studio (Mid 23)
Samsung 990 Pro 1 TB
4923 (4891.68min - 4922.98max) MB/s 0%
SCHENKER XMG Pro 16 Studio (Mid 24)
Samsung 990 Pro 1 TB
4915 (4891.5min - 4914.51max) MB/s
Lenovo Legion Pro 5 16IRX9
Samsung PM9A1 MZVL21T0HCLR
4055 (4044.11min - 4055.48max) MB/s -17%
Acer Predator Helios Neo 16 (2024)
Samsung PM9A1a MZVL21T0HDLU
3764 (3700.88min - 3763.72max) MB/s -23%
Average Samsung 990 Pro 1 TB
  (818 - 4926, n=18)
3327 MB/s -32%
Aorus 16X 2024
Gigabyte AG450E1024-SI
3302 (3194.22min - 3302.44max) MB/s -33%
Average of class Gaming
  (417 - 6172, n=168, last 2 years)
2555 MB/s -48%
4k q32 t16 write
SCHENKER XMG Pro 16 Studio (Mid 23)
Samsung 990 Pro 1 TB
4394 (3486.17min - 4394.19max) MB/s +25%
Lenovo Legion 7 16 IRX G9
SK Hynix HFS001TEJ9X115N
3792 (3142.55min - 3791.52max) MB/s +8%
Acer Predator Helios Neo 16 (2024)
Samsung PM9A1a MZVL21T0HDLU
3717 (3584.28min - 3717.4max) MB/s +6%
Lenovo Legion Pro 5 16IRX9
Samsung PM9A1 MZVL21T0HCLR
3542 (3491.17min - 3541.69max) MB/s +1%
SCHENKER XMG Pro 16 Studio (Mid 24)
Samsung 990 Pro 1 TB
3522 (3439.08min - 3521.99max) MB/s
Aorus 16X 2024
Gigabyte AG450E1024-SI
3443 (3007.99min - 3443.05max) MB/s -2%
Average Samsung 990 Pro 1 TB
  (413 - 4683, n=18)
2563 MB/s -27%
Average of class Gaming
  (162.3 - 4869, n=168, last 2 years)
2101 MB/s -40%
AS SSD
Score Total
Lenovo Legion 7 16 IRX G9
SK Hynix HFS001TEJ9X115N
10769 Points +18%
SCHENKER XMG Pro 16 Studio (Mid 23)
Samsung 990 Pro 1 TB
10265 Points +13%
SCHENKER XMG Pro 16 Studio (Mid 24)
Samsung 990 Pro 1 TB
9122 Points
Acer Predator Helios Neo 16 (2024)
Samsung PM9A1a MZVL21T0HDLU
9056 Points -1%
Aorus 16X 2024
Gigabyte AG450E1024-SI
8778 Points -4%
Lenovo Legion Pro 5 16IRX9
Samsung PM9A1 MZVL21T0HCLR
8364 Points -8%
Average Samsung 990 Pro 1 TB
  (5405 - 10591, n=18)
8308 Points -9%
Average of class Gaming
  (2271 - 13854, n=159, last 2 years)
6737 Points -26%
Score Read
SCHENKER XMG Pro 16 Studio (Mid 23)
Samsung 990 Pro 1 TB
4721 Points +32%
Lenovo Legion 7 16 IRX G9
SK Hynix HFS001TEJ9X115N
3747 Points +4%
SCHENKER XMG Pro 16 Studio (Mid 24)
Samsung 990 Pro 1 TB
3590 Points
Acer Predator Helios Neo 16 (2024)
Samsung PM9A1a MZVL21T0HDLU
3368 Points -6%
Lenovo Legion Pro 5 16IRX9
Samsung PM9A1 MZVL21T0HCLR
3233 Points -10%
Aorus 16X 2024
Gigabyte AG450E1024-SI
3152 Points -12%
Average Samsung 990 Pro 1 TB
  (1349 - 4721, n=18)
2891 Points -19%
Average of class Gaming
  (776 - 4721, n=159, last 2 years)
2441 Points -32%
Score Write
Lenovo Legion 7 16 IRX G9
SK Hynix HFS001TEJ9X115N
5126 Points +38%
SCHENKER XMG Pro 16 Studio (Mid 23)
Samsung 990 Pro 1 TB
4652 Points +26%
Average Samsung 990 Pro 1 TB
  (2308 - 4852, n=18)
4043 Points +9%
Acer Predator Helios Neo 16 (2024)
Samsung PM9A1a MZVL21T0HDLU
4018 Points +9%
Aorus 16X 2024
Gigabyte AG450E1024-SI
4006 Points +8%
SCHENKER XMG Pro 16 Studio (Mid 24)
Samsung 990 Pro 1 TB
3703 Points
Lenovo Legion Pro 5 16IRX9
Samsung PM9A1 MZVL21T0HCLR
3543 Points -4%
Average of class Gaming
  (515 - 7208, n=159, last 2 years)
3113 Points -16%
Seq Read
Lenovo Legion 7 16 IRX G9
SK Hynix HFS001TEJ9X115N
5849 MB/s +12%
Acer Predator Helios Neo 16 (2024)
Samsung PM9A1a MZVL21T0HDLU
5622.8 MB/s +8%
Lenovo Legion Pro 5 16IRX9
Samsung PM9A1 MZVL21T0HCLR
5355.36 MB/s +3%
SCHENKER XMG Pro 16 Studio (Mid 24)
Samsung 990 Pro 1 TB
5214.03 MB/s
Average Samsung 990 Pro 1 TB
  (4362 - 5760, n=18)
5211 MB/s 0%
Average of class Gaming
  (2260 - 12763, n=159, last 2 years)
4944 MB/s -5%
SCHENKER XMG Pro 16 Studio (Mid 23)
Samsung 990 Pro 1 TB
4797.97 MB/s -8%
Aorus 16X 2024
Gigabyte AG450E1024-SI
4161.31 MB/s -20%
Seq Write
Lenovo Legion 7 16 IRX G9
SK Hynix HFS001TEJ9X115N
5482 MB/s +7%
SCHENKER XMG Pro 16 Studio (Mid 24)
Samsung 990 Pro 1 TB
5143.63 MB/s
Average Samsung 990 Pro 1 TB
  (3376 - 5651, n=18)
4712 MB/s -8%
SCHENKER XMG Pro 16 Studio (Mid 23)
Samsung 990 Pro 1 TB
4668.7 MB/s -9%
Acer Predator Helios Neo 16 (2024)
Samsung PM9A1a MZVL21T0HDLU
4482.43 MB/s -13%
Aorus 16X 2024
Gigabyte AG450E1024-SI
4431.76 MB/s -14%
Lenovo Legion Pro 5 16IRX9
Samsung PM9A1 MZVL21T0HCLR
3950.35 MB/s -23%
Average of class Gaming
  (495 - 11316, n=159, last 2 years)
3720 MB/s -28%
4K Read
Acer Predator Helios Neo 16 (2024)
Samsung PM9A1a MZVL21T0HDLU
84.56 MB/s +10%
Lenovo Legion Pro 5 16IRX9
Samsung PM9A1 MZVL21T0HCLR
82.62 MB/s +8%
Lenovo Legion 7 16 IRX G9
SK Hynix HFS001TEJ9X115N
80.9 MB/s +6%
SCHENKER XMG Pro 16 Studio (Mid 23)
Samsung 990 Pro 1 TB
76.81 MB/s 0%
SCHENKER XMG Pro 16 Studio (Mid 24)
Samsung 990 Pro 1 TB
76.57 MB/s
Average Samsung 990 Pro 1 TB
  (52.7 - 90.9, n=18)
71.6 MB/s -6%
Average of class Gaming
  (27.8 - 112.1, n=159, last 2 years)
65.1 MB/s -15%
Aorus 16X 2024
Gigabyte AG450E1024-SI
61.86 MB/s -19%
4K Write
SCHENKER XMG Pro 16 Studio (Mid 23)
Samsung 990 Pro 1 TB
306.26 MB/s +47%
Aorus 16X 2024
Gigabyte AG450E1024-SI
283.44 MB/s +36%
Lenovo Legion 7 16 IRX G9
SK Hynix HFS001TEJ9X115N
283 MB/s +36%
Acer Predator Helios Neo 16 (2024)
Samsung PM9A1a MZVL21T0HDLU
231.38 MB/s +11%
Average Samsung 990 Pro 1 TB
  (172.3 - 306, n=18)
223 MB/s +7%
Lenovo Legion Pro 5 16IRX9
Samsung PM9A1 MZVL21T0HCLR
213.76 MB/s +3%
Average of class Gaming
  (108.8 - 512, n=159, last 2 years)
211 MB/s +1%
SCHENKER XMG Pro 16 Studio (Mid 24)
Samsung 990 Pro 1 TB
208.4 MB/s
4K-64 Read
SCHENKER XMG Pro 16 Studio (Mid 23)
Samsung 990 Pro 1 TB
3164.36 MB/s +6%
Lenovo Legion 7 16 IRX G9
SK Hynix HFS001TEJ9X115N
3081 MB/s +3%
SCHENKER XMG Pro 16 Studio (Mid 24)
Samsung 990 Pro 1 TB
2991.57 MB/s
Acer Predator Helios Neo 16 (2024)
Samsung PM9A1a MZVL21T0HDLU
2721.41 MB/s -9%
Aorus 16X 2024
Gigabyte AG450E1024-SI
2673.76 MB/s -11%
Lenovo Legion Pro 5 16IRX9
Samsung PM9A1 MZVL21T0HCLR
2615.17 MB/s -13%
Average Samsung 990 Pro 1 TB
  (787 - 3182, n=18)
2252 MB/s -25%
Average of class Gaming
  (451 - 3475, n=159, last 2 years)
1876 MB/s -37%
4K-64 Write
Lenovo Legion 7 16 IRX G9
SK Hynix HFS001TEJ9X115N
4295 MB/s +44%
SCHENKER XMG Pro 16 Studio (Mid 23)
Samsung 990 Pro 1 TB
3878.76 MB/s +30%
Average Samsung 990 Pro 1 TB
  (1592 - 4090, n=18)
3356 MB/s +13%
Acer Predator Helios Neo 16 (2024)
Samsung PM9A1a MZVL21T0HDLU
3338.79 MB/s +12%
Aorus 16X 2024
Gigabyte AG450E1024-SI
3279.44 MB/s +10%
SCHENKER XMG Pro 16 Studio (Mid 24)
Samsung 990 Pro 1 TB
2980.22 MB/s
Lenovo Legion Pro 5 16IRX9
Samsung PM9A1 MZVL21T0HCLR
2933.74 MB/s -2%
Average of class Gaming
  (277 - 5909, n=159, last 2 years)
2533 MB/s -15%
Access Time Read
Aorus 16X 2024
Gigabyte AG450E1024-SI
0.088 ms * -175%
SCHENKER XMG Pro 16 Studio (Mid 23)
Samsung 990 Pro 1 TB
0.064 ms * -100%
Average of class Gaming
  (0.016 - 0.379, n=158, last 2 years)
0.05509 ms * -72%
Lenovo Legion Pro 5 16IRX9
Samsung PM9A1 MZVL21T0HCLR
0.042 ms * -31%
Acer Predator Helios Neo 16 (2024)
Samsung PM9A1a MZVL21T0HDLU
0.038 ms * -19%
Average Samsung 990 Pro 1 TB
  (0.018 - 0.074, n=18)
0.0345 ms * -8%
SCHENKER XMG Pro 16 Studio (Mid 24)
Samsung 990 Pro 1 TB
0.032 ms *
Lenovo Legion 7 16 IRX G9
SK Hynix HFS001TEJ9X115N
0.016 ms * +50%
Access Time Write
Lenovo Legion Pro 5 16IRX9
Samsung PM9A1 MZVL21T0HCLR
0.059 ms * -228%
Average of class Gaming
  (0.011 - 1.028, n=159, last 2 years)
0.04843 ms * -169%
Average Samsung 990 Pro 1 TB
  (0.012 - 0.053, n=18)
0.01978 ms * -10%
Acer Predator Helios Neo 16 (2024)
Samsung PM9A1a MZVL21T0HDLU
0.019 ms * -6%
SCHENKER XMG Pro 16 Studio (Mid 24)
Samsung 990 Pro 1 TB
0.018 ms *
Lenovo Legion 7 16 IRX G9
SK Hynix HFS001TEJ9X115N
0.017 ms * +6%
Aorus 16X 2024
Gigabyte AG450E1024-SI
0.015 ms * +17%
SCHENKER XMG Pro 16 Studio (Mid 23)
Samsung 990 Pro 1 TB
0.012 ms * +33%

* ... im mniej tym lepiej

Reading continuous performance: DiskSpd Read Loop, Queue Depth 8

036072010801440180021602520288032403600396043204680504054005760612064806840Tooltip
SCHENKER XMG Pro 16 Studio (Mid 24) Samsung 990 Pro 1 TB; diskspd 2.0.17 f: Ø6971 (4271.48-7056.44)
Acer Predator Helios Neo 16 (2024) Samsung PM9A1a MZVL21T0HDLU; diskspd 2.0.17 f: Ø7013 (6198.53-7048.48)
Lenovo Legion Pro 5 16IRX9 Samsung PM9A1 MZVL21T0HCLR; diskspd 2.0.17 f: Ø5723 (3286.38-6614.84)
Aorus 16X 2024 Gigabyte AG450E1024-SI; diskspd 2.0.17 f: Ø5164 (4823.45-5192.86)
SCHENKER XMG Pro 16 Studio (Mid 23) Samsung 990 Pro 1 TB: Ø7081 (6350.81-7114.2)
Lenovo Legion 7 16 IRX G9 SK Hynix HFS001TEJ9X115N; diskspd 2.0.17 f: Ø5669 (3420.66-6904)

Karta graficzna

Rozgrywka w rozdzielczości QHD przy wysokich i maksymalnych ustawieniach nie stanowi problemu dla zainstalowanej karty GeForce RTX 4070 (TGP: 140 W): Zapewnia on liczbę klatek na sekundę (i wyniki benchmarków) nieco powyżej średniej GPU. Trochę ciasno jak na dzisiejsze wymagania: GPU ma do dyspozycji tylko 8 GB pamięci VRAM (GDDR6). Przełączanie między dGPU a Optimusem wymaga restartu.

Time Spy (podłączony do sieci, tryb wydajności)
Time Spy (tryb baterii, tryb wydajności)
Time Spy (podłączony do sieci, tryb rozrywki + tryb cichy)
3DMark Performance Rating - Percent
Lenovo Legion Pro 5 16IRX9
NVIDIA GeForce RTX 4070 Laptop GPU, Intel Core i9-14900HX
99.2 pt
Acer Predator Helios Neo 16 (2024)
NVIDIA GeForce RTX 4070 Laptop GPU, Intel Core i7-14700HX
98.7 pt
Average of class Gaming
 
98.5 pt
SCHENKER XMG Pro 16 Studio (Mid 24)
NVIDIA GeForce RTX 4070 Laptop GPU, Intel Core i9-14900HX
94.6 pt
SCHENKER XMG Pro 16 Studio (Mid 23)
NVIDIA GeForce RTX 4070 Laptop GPU, Intel Core i9-13900H
92.8 pt
Aorus 16X 2024
NVIDIA GeForce RTX 4070 Laptop GPU, Intel Core i9-14900HX
92.2 pt
Lenovo Legion 7 16 IRX G9
NVIDIA GeForce RTX 4070 Laptop GPU, Intel Core i9-14900HX
90.8 pt
Average NVIDIA GeForce RTX 4070 Laptop GPU
 
90.2 pt
3DMark 11 - 1280x720 Performance GPU
Acer Predator Helios Neo 16 (2024)
NVIDIA GeForce RTX 4070 Laptop GPU, Intel Core i7-14700HX
44538 Points +4%
Lenovo Legion Pro 5 16IRX9
NVIDIA GeForce RTX 4070 Laptop GPU, Intel Core i9-14900HX
43689 Points +2%
Average of class Gaming
  (1029 - 72178, n=186, last 2 years)
43521 Points +2%
SCHENKER XMG Pro 16 Studio (Mid 24)
NVIDIA GeForce RTX 4070 Laptop GPU, Intel Core i9-14900HX
42753 Points
Aorus 16X 2024
NVIDIA GeForce RTX 4070 Laptop GPU, Intel Core i9-14900HX
41457 Points -3%
SCHENKER XMG Pro 16 Studio (Mid 23)
NVIDIA GeForce RTX 4070 Laptop GPU, Intel Core i9-13900H
41432 Points -3%
Average NVIDIA GeForce RTX 4070 Laptop GPU
  (24229 - 46434, n=59)
40410 Points -5%
Lenovo Legion 7 16 IRX G9
NVIDIA GeForce RTX 4070 Laptop GPU, Intel Core i9-14900HX
40259 Points -6%
3DMark
1920x1080 Fire Strike Graphics
Average of class Gaming
  (781 - 53059, n=196, last 2 years)
31245 Points +2%
Lenovo Legion Pro 5 16IRX9
NVIDIA GeForce RTX 4070 Laptop GPU, Intel Core i9-14900HX
31105 Points +1%
Acer Predator Helios Neo 16 (2024)
NVIDIA GeForce RTX 4070 Laptop GPU, Intel Core i7-14700HX
31091 Points +1%
SCHENKER XMG Pro 16 Studio (Mid 24)
NVIDIA GeForce RTX 4070 Laptop GPU, Intel Core i9-14900HX
30687 Points
SCHENKER XMG Pro 16 Studio (Mid 23)
NVIDIA GeForce RTX 4070 Laptop GPU, Intel Core i9-13900H
29892 Points -3%
Aorus 16X 2024
NVIDIA GeForce RTX 4070 Laptop GPU, Intel Core i9-14900HX
29156 Points -5%
Average NVIDIA GeForce RTX 4070 Laptop GPU
  (12242 - 33451, n=62)
29041 Points -5%
Lenovo Legion 7 16 IRX G9
NVIDIA GeForce RTX 4070 Laptop GPU, Intel Core i9-14900HX
28319 Points -8%
2560x1440 Time Spy Graphics
Lenovo Legion Pro 5 16IRX9
NVIDIA GeForce RTX 4070 Laptop GPU, Intel Core i9-14900HX
13336 Points +12%
Average of class Gaming
  (224 - 22717, n=191, last 2 years)
13034 Points +9%
Acer Predator Helios Neo 16 (2024)
NVIDIA GeForce RTX 4070 Laptop GPU, Intel Core i7-14700HX
12900 Points +8%
Lenovo Legion 7 16 IRX G9
NVIDIA GeForce RTX 4070 Laptop GPU, Intel Core i9-14900HX
12174 Points +2%
Aorus 16X 2024
NVIDIA GeForce RTX 4070 Laptop GPU, Intel Core i9-14900HX
12048 Points +1%
SCHENKER XMG Pro 16 Studio (Mid 23)
NVIDIA GeForce RTX 4070 Laptop GPU, Intel Core i9-13900H
11972 Points 0%
SCHENKER XMG Pro 16 Studio (Mid 24)
NVIDIA GeForce RTX 4070 Laptop GPU, Intel Core i9-14900HX
11959 Points
Average NVIDIA GeForce RTX 4070 Laptop GPU
  (5012 - 13391, n=60)
11603 Points -3%
3DMark 11 Performance
34173 pkt.
3DMark Fire Strike Score
23584 pkt.
3DMark Time Spy Score
12286 pkt.
3DMark Steel Nomad Score
2598 pkt.
Pomoc
Blender
v3.3 Classroom OPTIX/RTX
SCHENKER XMG Pro 16 Studio (Mid 24)
NVIDIA GeForce RTX 4070 Laptop GPU, Intel Core i9-14900HX
23 Seconds *
Average NVIDIA GeForce RTX 4070 Laptop GPU
  (18 - 30, n=60)
21.5 Seconds * +7%
SCHENKER XMG Pro 16 Studio (Mid 23)
NVIDIA GeForce RTX 4070 Laptop GPU, Intel Core i9-13900H
21 Seconds * +9%
Average of class Gaming
  (9 - 95, n=177, last 2 years)
21 Seconds * +9%
Aorus 16X 2024
NVIDIA GeForce RTX 4070 Laptop GPU, Intel Core i9-14900HX
20 Seconds * +13%
Lenovo Legion 7 16 IRX G9
NVIDIA GeForce RTX 4070 Laptop GPU, Intel Core i9-14900HX
20 Seconds * +13%
Lenovo Legion Pro 5 16IRX9
NVIDIA GeForce RTX 4070 Laptop GPU, Intel Core i9-14900HX
19 Seconds * +17%
Acer Predator Helios Neo 16 (2024)
NVIDIA GeForce RTX 4070 Laptop GPU, Intel Core i7-14700HX
19 Seconds * +17%
v3.3 Classroom CUDA
Average NVIDIA GeForce RTX 4070 Laptop GPU
  (32 - 181, n=63)
40.6 Seconds * -19%
Average of class Gaming
  (16 - 175, n=183, last 2 years)
36.7 Seconds * -8%
SCHENKER XMG Pro 16 Studio (Mid 23)
NVIDIA GeForce RTX 4070 Laptop GPU, Intel Core i9-13900H
34 Seconds * -0%
SCHENKER XMG Pro 16 Studio (Mid 24)
NVIDIA GeForce RTX 4070 Laptop GPU, Intel Core i9-14900HX
34 Seconds *
Acer Predator Helios Neo 16 (2024)
NVIDIA GeForce RTX 4070 Laptop GPU, Intel Core i7-14700HX
33 Seconds * +3%
Lenovo Legion Pro 5 16IRX9
NVIDIA GeForce RTX 4070 Laptop GPU, Intel Core i9-14900HX
32 Seconds * +6%
Aorus 16X 2024
NVIDIA GeForce RTX 4070 Laptop GPU, Intel Core i9-14900HX
32 Seconds * +6%
Lenovo Legion 7 16 IRX G9
NVIDIA GeForce RTX 4070 Laptop GPU, Intel Core i9-14900HX
32 Seconds * +6%
v3.3 Classroom CPU
SCHENKER XMG Pro 16 Studio (Mid 23)
NVIDIA GeForce RTX 4070 Laptop GPU, Intel Core i9-13900H
326 Seconds * -40%
Average of class Gaming
  (138 - 962, n=191, last 2 years)
297 Seconds * -27%
Average NVIDIA GeForce RTX 4070 Laptop GPU
  (158 - 440, n=59)
290 Seconds * -24%
Acer Predator Helios Neo 16 (2024)
NVIDIA GeForce RTX 4070 Laptop GPU, Intel Core i7-14700HX
245 Seconds * -5%
SCHENKER XMG Pro 16 Studio (Mid 24)
NVIDIA GeForce RTX 4070 Laptop GPU, Intel Core i9-14900HX
233 Seconds *
Aorus 16X 2024
NVIDIA GeForce RTX 4070 Laptop GPU, Intel Core i9-14900HX
227 Seconds * +3%
Lenovo Legion 7 16 IRX G9
NVIDIA GeForce RTX 4070 Laptop GPU, Intel Core i9-14900HX
220 Seconds * +6%
Lenovo Legion Pro 5 16IRX9
NVIDIA GeForce RTX 4070 Laptop GPU, Intel Core i9-14900HX
205 Seconds * +12%
Geekbench 5.5
OpenCL Score
SCHENKER XMG Pro 16 Studio (Mid 24)
NVIDIA GeForce RTX 4070 Laptop GPU, Intel Core i9-14900HX
127544 Points
Aorus 16X 2024
NVIDIA GeForce RTX 4070 Laptop GPU, Intel Core i9-14900HX
126537 Points -1%
Average of class Gaming
  (5039 - 237138, n=193, last 2 years)
125975 Points -1%
SCHENKER XMG Pro 16 Studio (Mid 23)
NVIDIA GeForce RTX 4070 Laptop GPU, Intel Core i9-13900H
120585 Points -5%
Lenovo Legion 7 16 IRX G9
NVIDIA GeForce RTX 4070 Laptop GPU, Intel Core i9-14900HX
118860 Points -7%
Acer Predator Helios Neo 16 (2024)
NVIDIA GeForce RTX 4070 Laptop GPU, Intel Core i7-14700HX
113950 Points -11%
Average NVIDIA GeForce RTX 4070 Laptop GPU
  (17391 - 129366, n=61)
113893 Points -11%
Lenovo Legion Pro 5 16IRX9
NVIDIA GeForce RTX 4070 Laptop GPU, Intel Core i9-14900HX
112841 Points -12%
Vulkan Score 5.5
SCHENKER XMG Pro 16 Studio (Mid 23)
NVIDIA GeForce RTX 4070 Laptop GPU, Intel Core i9-13900H
88210 Points +13%
SCHENKER XMG Pro 16 Studio (Mid 24)
NVIDIA GeForce RTX 4070 Laptop GPU, Intel Core i9-14900HX
78091 Points
Aorus 16X 2024
NVIDIA GeForce RTX 4070 Laptop GPU, Intel Core i9-14900HX
75575 Points -3%
Average of class Gaming
  (7995 - 163089, n=123, last 2 years)
71890 Points -8%
Average NVIDIA GeForce RTX 4070 Laptop GPU
  (42883 - 102618, n=32)
70985 Points -9%
Acer Predator Helios Neo 16 (2024)
NVIDIA GeForce RTX 4070 Laptop GPU, Intel Core i7-14700HX
65791 Points -16%
Lenovo Legion Pro 5 16IRX9
NVIDIA GeForce RTX 4070 Laptop GPU, Intel Core i9-14900HX
58476 Points -25%
Geekbench 6.3
GPU OpenCL
SCHENKER XMG Pro 16 Studio (Mid 23)
NVIDIA GeForce RTX 4070 Laptop GPU, Intel Core i9-13900H
120852 Points +3%
Aorus 16X 2024
NVIDIA GeForce RTX 4070 Laptop GPU, Intel Core i9-14900HX
120176 Points +3%
Acer Predator Helios Neo 16 (2024)
NVIDIA GeForce RTX 4070 Laptop GPU, Intel Core i7-14700HX
119119 Points +2%
SCHENKER XMG Pro 16 Studio (Mid 24)
NVIDIA GeForce RTX 4070 Laptop GPU, Intel Core i9-14900HX
117097 Points
Lenovo Legion Pro 5 16IRX9
NVIDIA GeForce RTX 4070 Laptop GPU, Intel Core i9-14900HX
115718 Points -1%
Average of class Gaming
  (4321 - 207373, n=109, last 2 years)
115663 Points -1%
Average NVIDIA GeForce RTX 4070 Laptop GPU
  (85488 - 129836, n=37)
113812 Points -3%
Lenovo Legion 7 16 IRX G9
NVIDIA GeForce RTX 4070 Laptop GPU, Intel Core i9-14900HX
101474 Points -13%
GPU Vulkan
SCHENKER XMG Pro 16 Studio (Mid 23)
NVIDIA GeForce RTX 4070 Laptop GPU, Intel Core i9-13900H
109205 Points +8%
Lenovo Legion Pro 5 16IRX9
NVIDIA GeForce RTX 4070 Laptop GPU, Intel Core i9-14900HX
105334 Points +4%
SCHENKER XMG Pro 16 Studio (Mid 24)
NVIDIA GeForce RTX 4070 Laptop GPU, Intel Core i9-14900HX
101006 Points
Aorus 16X 2024
NVIDIA GeForce RTX 4070 Laptop GPU, Intel Core i9-14900HX
90584 Points -10%
Acer Predator Helios Neo 16 (2024)
NVIDIA GeForce RTX 4070 Laptop GPU, Intel Core i7-14700HX
89638 Points -11%
Average of class Gaming
  (4286 - 196201, n=106, last 2 years)
82317 Points -19%
Average NVIDIA GeForce RTX 4070 Laptop GPU
  (18099 - 120033, n=34)
71564 Points -29%
V-Ray 5 Benchmark
GPU RTX
Average of class Gaming
  (171 - 3824, n=114, last 2 years)
2181 mpaths +29%
Lenovo Legion Pro 5 16IRX9
NVIDIA GeForce RTX 4070 Laptop GPU, Intel Core i9-14900HX
1868 mpaths +11%
Acer Predator Helios Neo 16 (2024)
NVIDIA GeForce RTX 4070 Laptop GPU, Intel Core i7-14700HX
1805 mpaths +7%
Aorus 16X 2024
NVIDIA GeForce RTX 4070 Laptop GPU, Intel Core i9-14900HX
1737 mpaths +3%
SCHENKER XMG Pro 16 Studio (Mid 24)
NVIDIA GeForce RTX 4070 Laptop GPU, Intel Core i9-14900HX
1690 mpaths
Average NVIDIA GeForce RTX 4070 Laptop GPU
  (171 - 1872, n=36)
1648 mpaths -2%
SCHENKER XMG Pro 16 Studio (Mid 23)
NVIDIA GeForce RTX 4070 Laptop GPU, Intel Core i9-13900H
1643 mpaths -3%
GPU CUDA
Average of class Gaming
  (120 - 2797, n=116, last 2 years)
1568 mpaths +26%
Lenovo Legion Pro 5 16IRX9
NVIDIA GeForce RTX 4070 Laptop GPU, Intel Core i9-14900HX
1333 mpaths +7%
Acer Predator Helios Neo 16 (2024)
NVIDIA GeForce RTX 4070 Laptop GPU, Intel Core i7-14700HX
1289 mpaths +4%
Aorus 16X 2024
NVIDIA GeForce RTX 4070 Laptop GPU, Intel Core i9-14900HX
1256 mpaths +1%
SCHENKER XMG Pro 16 Studio (Mid 24)
NVIDIA GeForce RTX 4070 Laptop GPU, Intel Core i9-14900HX
1244 mpaths
Average NVIDIA GeForce RTX 4070 Laptop GPU
  (120 - 1356, n=36)
1192 mpaths -4%
SCHENKER XMG Pro 16 Studio (Mid 23)
NVIDIA GeForce RTX 4070 Laptop GPU, Intel Core i9-13900H
1180 mpaths -5%
CPU
Lenovo Legion Pro 5 16IRX9
NVIDIA GeForce RTX 4070 Laptop GPU, Intel Core i9-14900HX
19077 mpaths +14%
Aorus 16X 2024
NVIDIA GeForce RTX 4070 Laptop GPU, Intel Core i9-14900HX
17465 mpaths +4%
SCHENKER XMG Pro 16 Studio (Mid 24)
NVIDIA GeForce RTX 4070 Laptop GPU, Intel Core i9-14900HX
16766 mpaths
Acer Predator Helios Neo 16 (2024)
NVIDIA GeForce RTX 4070 Laptop GPU, Intel Core i7-14700HX
16168 mpaths -4%
Average of class Gaming
  (3562 - 26944, n=119, last 2 years)
15070 mpaths -10%
Average NVIDIA GeForce RTX 4070 Laptop GPU
  (9339 - 20388, n=35)
14381 mpaths -14%
SCHENKER XMG Pro 16 Studio (Mid 23)
NVIDIA GeForce RTX 4070 Laptop GPU, Intel Core i9-13900H
11943 mpaths -29%
V-Ray Benchmark Next 4.10
GPU
Average of class Gaming
  (54 - 1334, n=152, last 2 years)
701 mpaths +17%
Lenovo Legion 7 16 IRX G9
NVIDIA GeForce RTX 4070 Laptop GPU, Intel Core i9-14900HX
686 mpaths +15%
Lenovo Legion Pro 5 16IRX9
NVIDIA GeForce RTX 4070 Laptop GPU, Intel Core i9-14900HX
675 mpaths +13%
Acer Predator Helios Neo 16 (2024)
NVIDIA GeForce RTX 4070 Laptop GPU, Intel Core i7-14700HX
649 mpaths +8%
Average NVIDIA GeForce RTX 4070 Laptop GPU
  (434 - 686, n=46)
606 mpaths +1%
SCHENKER XMG Pro 16 Studio (Mid 24)
NVIDIA GeForce RTX 4070 Laptop GPU, Intel Core i9-14900HX
599 mpaths
Aorus 16X 2024
NVIDIA GeForce RTX 4070 Laptop GPU, Intel Core i9-14900HX
587 mpaths -2%
SCHENKER XMG Pro 16 Studio (Mid 23)
NVIDIA GeForce RTX 4070 Laptop GPU, Intel Core i9-13900H
579 mpaths -3%
CPU
Lenovo Legion Pro 5 16IRX9
NVIDIA GeForce RTX 4070 Laptop GPU, Intel Core i9-14900HX
28791 ksamples +10%
Lenovo Legion 7 16 IRX G9
NVIDIA GeForce RTX 4070 Laptop GPU, Intel Core i9-14900HX
27701 ksamples +6%
Aorus 16X 2024
NVIDIA GeForce RTX 4070 Laptop GPU, Intel Core i9-14900HX
26677 ksamples +2%
SCHENKER XMG Pro 16 Studio (Mid 24)
NVIDIA GeForce RTX 4070 Laptop GPU, Intel Core i9-14900HX
26235 ksamples
Acer Predator Helios Neo 16 (2024)
NVIDIA GeForce RTX 4070 Laptop GPU, Intel Core i7-14700HX
24305 ksamples -7%
Average of class Gaming
  (5413 - 37629, n=152, last 2 years)
21367 ksamples -19%
Average NVIDIA GeForce RTX 4070 Laptop GPU
  (12638 - 35173, n=46)
20879 ksamples -20%
SCHENKER XMG Pro 16 Studio (Mid 23)
NVIDIA GeForce RTX 4070 Laptop GPU, Intel Core i9-13900H
18346 ksamples -30%

* ... im mniej tym lepiej

Performance Rating - Percent
Lenovo Legion Pro 5 16IRX9
Intel Core i9-14900HX, NVIDIA GeForce RTX 4070 Laptop GPU
99.7 pt
Lenovo Legion 7 16 IRX G9
Intel Core i9-14900HX, NVIDIA GeForce RTX 4070 Laptop GPU
96.1 pt
Acer Predator Helios Neo 16 (2024)
Intel Core i7-14700HX, NVIDIA GeForce RTX 4070 Laptop GPU
94.7 pt
SCHENKER XMG Pro 16 Studio (Mid 23)
Intel Core i9-13900H, NVIDIA GeForce RTX 4070 Laptop GPU
91.2 pt
SCHENKER XMG Pro 16 Studio (Mid 24)
Intel Core i9-14900HX, NVIDIA GeForce RTX 4070 Laptop GPU
90.9 pt
Average of class Gaming
 
88.7 pt
Aorus 16X 2024
Intel Core i9-14900HX, NVIDIA GeForce RTX 4070 Laptop GPU
88.6 pt
Average NVIDIA GeForce RTX 4070 Laptop GPU
 
83.5 pt
Cyberpunk 2077 2.1 Phantom Liberty - 1920x1080 Ultra Preset (FSR off)
SCHENKER XMG Pro 16 Studio (Mid 23)
Intel Core i9-13900H, NVIDIA GeForce RTX 4070 Laptop GPU
87.9 (48.6min) fps +7%
Lenovo Legion Pro 5 16IRX9
Intel Core i9-14900HX, NVIDIA GeForce RTX 4070 Laptop GPU
87.1 (52.5min) fps +6%
Average of class Gaming
  (6.76 - 144.7, n=79, last 2 years)
85.9 fps +4%
Lenovo Legion 7 16 IRX G9
Intel Core i9-14900HX, NVIDIA GeForce RTX 4070 Laptop GPU
85.2 (70min) fps +3%
Acer Predator Helios Neo 16 (2024)
Intel Core i7-14700HX, NVIDIA GeForce RTX 4070 Laptop GPU
83.3 (37.9min) fps +1%
SCHENKER XMG Pro 16 Studio (Mid 24)
Intel Core i9-14900HX, NVIDIA GeForce RTX 4070 Laptop GPU
82.5 (68.4min) fps
Average NVIDIA GeForce RTX 4070 Laptop GPU
  (30.7 - 90.7, n=29)
79.6 fps -4%
Aorus 16X 2024
Intel Core i9-14900HX, NVIDIA GeForce RTX 4070 Laptop GPU
75.8 (32.9min) fps -8%
GTA V - 1920x1080 Highest Settings possible AA:4xMSAA + FX AF:16x
Acer Predator Helios Neo 16 (2024)
Intel Core i7-14700HX, NVIDIA GeForce RTX 4070 Laptop GPU
127.8 (8.14min, 90.9P1) fps +1%
Lenovo Legion Pro 5 16IRX9
Intel Core i9-14900HX, NVIDIA GeForce RTX 4070 Laptop GPU
127.2 (5.17min, 83.3P1) fps +1%
SCHENKER XMG Pro 16 Studio (Mid 24)
Intel Core i9-14900HX, NVIDIA GeForce RTX 4070 Laptop GPU
126 (8.93min, 83.3P1) fps
SCHENKER XMG Pro 16 Studio (Mid 23)
Intel Core i9-13900H, NVIDIA GeForce RTX 4070 Laptop GPU
125.4 (4.46min, 83.3P1) fps 0%
Lenovo Legion 7 16 IRX G9
Intel Core i9-14900HX, NVIDIA GeForce RTX 4070 Laptop GPU
124.1 (4.37min, 76.9P1) fps -2%
Average of class Gaming
  (12.1 - 167.7, n=171, last 2 years)
113 fps -10%
Average NVIDIA GeForce RTX 4070 Laptop GPU
  (48.3 - 140.5, n=55)
110.9 fps -12%
Aorus 16X 2024
Intel Core i9-14900HX, NVIDIA GeForce RTX 4070 Laptop GPU
107.2 (4.31min, 71.4P1) fps -15%
Final Fantasy XV Benchmark - 1920x1080 High Quality
Lenovo Legion Pro 5 16IRX9
Intel Core i9-14900HX, NVIDIA GeForce RTX 4070 Laptop GPU
131 fps +9%
Acer Predator Helios Neo 16 (2024)
Intel Core i7-14700HX, NVIDIA GeForce RTX 4070 Laptop GPU
122.1 fps +2%
Lenovo Legion 7 16 IRX G9
Intel Core i9-14900HX, NVIDIA GeForce RTX 4070 Laptop GPU
119.8 fps 0%
SCHENKER XMG Pro 16 Studio (Mid 24)
Intel Core i9-14900HX, NVIDIA GeForce RTX 4070 Laptop GPU
119.7 fps
Average of class Gaming
  (19.2 - 201, n=184, last 2 years)
119 fps -1%
SCHENKER XMG Pro 16 Studio (Mid 23)
Intel Core i9-13900H, NVIDIA GeForce RTX 4070 Laptop GPU
115.5 fps -4%
Aorus 16X 2024
Intel Core i9-14900HX, NVIDIA GeForce RTX 4070 Laptop GPU
111.5 fps -7%
Average NVIDIA GeForce RTX 4070 Laptop GPU
  (41 - 131.9, n=57)
111 fps -7%
Strange Brigade - 1920x1080 ultra AA:ultra AF:16
Lenovo Legion Pro 5 16IRX9
Intel Core i9-14900HX, NVIDIA GeForce RTX 4070 Laptop GPU
234 (27.8min, 175.8P1) fps +14%
Average of class Gaming
  (38.9 - 421, n=182, last 2 years)
227 fps +10%
Lenovo Legion 7 16 IRX G9
Intel Core i9-14900HX, NVIDIA GeForce RTX 4070 Laptop GPU
220 fps +7%
Acer Predator Helios Neo 16 (2024)
Intel Core i7-14700HX, NVIDIA GeForce RTX 4070 Laptop GPU
213 (26.4min, 161.7P1) fps +3%
SCHENKER XMG Pro 16 Studio (Mid 24)
Intel Core i9-14900HX, NVIDIA GeForce RTX 4070 Laptop GPU
206 (37.8min, 155P1) fps
Aorus 16X 2024
Intel Core i9-14900HX, NVIDIA GeForce RTX 4070 Laptop GPU
204 (69.2min, 153P1) fps -1%
SCHENKER XMG Pro 16 Studio (Mid 23)
Intel Core i9-13900H, NVIDIA GeForce RTX 4070 Laptop GPU
202 (47.3min, 151P1) fps -2%
Average NVIDIA GeForce RTX 4070 Laptop GPU
  (76.3 - 234, n=58)
196.1 fps -5%
Dota 2 Reborn - 1920x1080 ultra (3/3) best looking
Lenovo Legion Pro 5 16IRX9
Intel Core i9-14900HX, NVIDIA GeForce RTX 4070 Laptop GPU
185.3 (161min) fps +15%
Acer Predator Helios Neo 16 (2024)
Intel Core i7-14700HX, NVIDIA GeForce RTX 4070 Laptop GPU
181.7 (153.5min) fps +13%
Aorus 16X 2024
Intel Core i9-14900HX, NVIDIA GeForce RTX 4070 Laptop GPU
180.9 (156.5min) fps +13%
Lenovo Legion 7 16 IRX G9
Intel Core i9-14900HX, NVIDIA GeForce RTX 4070 Laptop GPU
179.5 (154.3min) fps +12%
SCHENKER XMG Pro 16 Studio (Mid 23)
Intel Core i9-13900H, NVIDIA GeForce RTX 4070 Laptop GPU
162.8 (140.6min) fps +1%
SCHENKER XMG Pro 16 Studio (Mid 24)
Intel Core i9-14900HX, NVIDIA GeForce RTX 4070 Laptop GPU
160.8 (136.5min) fps
Average of class Gaming
  (30.8 - 220, n=190, last 2 years)
149.3 fps -7%
Average NVIDIA GeForce RTX 4070 Laptop GPU
  (89.7 - 187.5, n=59)
147.6 fps -8%
X-Plane 11.11 - 1920x1080 high (fps_test=3)
Lenovo Legion 7 16 IRX G9
Intel Core i9-14900HX, NVIDIA GeForce RTX 4070 Laptop GPU
138.2 fps +16%
Lenovo Legion Pro 5 16IRX9
Intel Core i9-14900HX, NVIDIA GeForce RTX 4070 Laptop GPU
137.6 fps +15%
Aorus 16X 2024
Intel Core i9-14900HX, NVIDIA GeForce RTX 4070 Laptop GPU
126.4 fps +6%
Acer Predator Helios Neo 16 (2024)
Intel Core i7-14700HX, NVIDIA GeForce RTX 4070 Laptop GPU
126.3 fps +6%
SCHENKER XMG Pro 16 Studio (Mid 23)
Intel Core i9-13900H, NVIDIA GeForce RTX 4070 Laptop GPU
119.5 fps 0%
SCHENKER XMG Pro 16 Studio (Mid 24)
Intel Core i9-14900HX, NVIDIA GeForce RTX 4070 Laptop GPU
119.5 fps
Average of class Gaming
  (31.5 - 166.2, n=196, last 2 years)
107.2 fps -10%
Average NVIDIA GeForce RTX 4070 Laptop GPU
  (58.9 - 144.4, n=61)
104.6 fps -12%
Baldur's Gate 3
1920x1080 Ultra Preset
Lenovo Legion Pro 5 16IRX9
Intel Core i9-14900HX, NVIDIA GeForce RTX 4070 Laptop GPU
125.6 fps +12%
Acer Predator Helios Neo 16 (2024)
Intel Core i7-14700HX, NVIDIA GeForce RTX 4070 Laptop GPU
117 (72.8min, 80.4P0.1, 90.5P1) fps +5%
Lenovo Legion 7 16 IRX G9
Intel Core i9-14900HX, NVIDIA GeForce RTX 4070 Laptop GPU
115 fps +3%
SCHENKER XMG Pro 16 Studio (Mid 24)
Intel Core i9-14900HX, NVIDIA GeForce RTX 4070 Laptop GPU
111.8 (87.2min, 87.8P0.1, 95.1P1) fps
Average NVIDIA GeForce RTX 4070 Laptop GPU
  (66.7 - 128.5, n=20)
103 fps -8%
Average of class Gaming
  (21.2 - 208, n=44, last 2 years)
102.1 fps -9%
2560x1440 Ultra Preset
Lenovo Legion Pro 5 16IRX9
Intel Core i9-14900HX, NVIDIA GeForce RTX 4070 Laptop GPU
89.6 fps +16%
Acer Predator Helios Neo 16 (2024)
Intel Core i7-14700HX, NVIDIA GeForce RTX 4070 Laptop GPU
82.8 (61.9min, 63.9P0.1, 68.7P1) fps +7%
Average of class Gaming
  (44 - 155.2, n=34, last 2 years)
82.2 fps +6%
SCHENKER XMG Pro 16 Studio (Mid 24)
Intel Core i9-14900HX, NVIDIA GeForce RTX 4070 Laptop GPU
77.2 (60.8min, 61.7P0.1, 66.4P1) fps
Average NVIDIA GeForce RTX 4070 Laptop GPU
  (54.4 - 89.6, n=18)
73.9 fps -4%
Lenovo Legion 7 16 IRX G9
Intel Core i9-14900HX, NVIDIA GeForce RTX 4070 Laptop GPU
71.9 fps -7%
Dragon's Dogma 2
1920x1080 High Preset
SCHENKER XMG Pro 16 Studio (Mid 24)
Intel Core i9-14900HX, NVIDIA GeForce RTX 4070 Laptop GPU
70.4 (29.5min, 31P0.1, 35.9P1) fps
Average NVIDIA GeForce RTX 4070 Laptop GPU
  (61.3 - 80, n=5)
67.8 fps -4%
Average of class Gaming
  (49.5 - 80, n=8, last 2 years)
64.5 fps -8%
2560x1440 High Preset
SCHENKER XMG Pro 16 Studio (Mid 24)
Intel Core i9-14900HX, NVIDIA GeForce RTX 4070 Laptop GPU
58.5 (31.3min, 34.1P0.1, 45.9P1) fps
Average NVIDIA GeForce RTX 4070 Laptop GPU
  (47.7 - 61.3, n=5)
55.3 fps -5%
Average of class Gaming
  (34.6 - 61.3, n=5, last 2 years)
51.8 fps -11%
Senua's Saga Hellblade 2
1920x1080 High Preset
Average of class Gaming
  (38.4 - 78.8, n=4, last 2 years)
52 fps +2%
SCHENKER XMG Pro 16 Studio (Mid 24)
Intel Core i9-14900HX, NVIDIA GeForce RTX 4070 Laptop GPU
51.2 (33.8min, 36.4P0.1, 43P1) fps
Average NVIDIA GeForce RTX 4070 Laptop GPU
  (46.2 - 51.2, n=2)
48.7 fps -5%
2560x1440 High Preset
Average of class Gaming
  (33.3 - 57.3, n=2, last 2 years)
45.3 fps +36%
SCHENKER XMG Pro 16 Studio (Mid 24)
Intel Core i9-14900HX, NVIDIA GeForce RTX 4070 Laptop GPU
33.3 (25.5min, 26.8P0.1, 29.7P1) fps
Average NVIDIA GeForce RTX 4070 Laptop GPU
  (32 - 33.3, n=2)
32.7 fps -2%
2560x1440 High Preset + Quality DLSS
Average of class Gaming
  (47.8 - 83.1, n=2, last 2 years)
65.5 fps +37%
SCHENKER XMG Pro 16 Studio (Mid 24)
Intel Core i9-14900HX, NVIDIA GeForce RTX 4070 Laptop GPU
47.8 (30.3min, 33.1P0.1, 40.9P1) fps
Average NVIDIA GeForce RTX 4070 Laptop GPU
  ()
47.8 fps 0%
Ghost of Tsushima
1920x1080 Very High Preset AA:T
SCHENKER XMG Pro 16 Studio (Mid 24)
Intel Core i9-14900HX, NVIDIA GeForce RTX 4070 Laptop GPU
73.7 (30min, 46.2P0.1, 55.4P1) fps
Average NVIDIA GeForce RTX 4070 Laptop GPU
  (68.1 - 73.7, n=3)
70.2 fps -5%
Average of class Gaming
  (28.5 - 73.7, n=7, last 2 years)
59 fps -20%
2560x1440 Very High Preset AA:T
SCHENKER XMG Pro 16 Studio (Mid 24)
Intel Core i9-14900HX, NVIDIA GeForce RTX 4070 Laptop GPU
56.1 (32min, 37.7P0.1, 43.8P1) fps
Average NVIDIA GeForce RTX 4070 Laptop GPU
  (50.5 - 56.1, n=3)
53.1 fps -5%
Average of class Gaming
  (22.7 - 56.1, n=5, last 2 years)
44.1 fps -21%
2560x1440 Very High Preset + Quality DLSS
SCHENKER XMG Pro 16 Studio (Mid 24)
Intel Core i9-14900HX, NVIDIA GeForce RTX 4070 Laptop GPU
74.2 (40.6min, 44.9P0.1, 57.2P1) fps
Average NVIDIA GeForce RTX 4070 Laptop GPU
  (69.6 - 74.2, n=2)
71.9 fps -3%
Average of class Gaming
  (63.6 - 74.2, n=3, last 2 years)
69.1 fps -7%
The First Descendant
1920x1080 Ultra Preset
SCHENKER XMG Pro 16 Studio (Mid 24)
Intel Core i9-14900HX, NVIDIA GeForce RTX 4070 Laptop GPU
80 (53.7min, 54.9P0.1, 62.7P1) fps
Average NVIDIA GeForce RTX 4070 Laptop GPU
  (73.7 - 80, n=4)
78 fps -2%
Average of class Gaming
  (15.4 - 80, n=5, last 2 years)
62.2 fps -22%
2560x1440 Ultra Preset
SCHENKER XMG Pro 16 Studio (Mid 24)
Intel Core i9-14900HX, NVIDIA GeForce RTX 4070 Laptop GPU
51.2 (34min, 38.1P0.1, 43.3P1) fps
Average NVIDIA GeForce RTX 4070 Laptop GPU
  (48.2 - 51.2, n=4)
50 fps -2%
Average of class Gaming
  (43.7 - 51.2, n=3, last 2 years)
48.3 fps -6%
2560x1440 Ultra Preset + Ultra Ray Tracing + DLSS Quality
SCHENKER XMG Pro 16 Studio (Mid 24)
Intel Core i9-14900HX, NVIDIA GeForce RTX 4070 Laptop GPU
51.8 (23.7min, 31.9P0.1, 40.2P1) fps
Average NVIDIA GeForce RTX 4070 Laptop GPU
  (48.6 - 51.8, n=2)
50.2 fps -3%
Average of class Gaming
  (43.3 - 51.8, n=2, last 2 years)
47.6 fps -8%
F1 24
1920x1080 Ultra High Preset AA:T AF:16x
Average of class Gaming
  (54.1 - 127, n=14, last 2 years)
78.2 fps +11%
SCHENKER XMG Pro 16 Studio (Mid 24)
Intel Core i9-14900HX, NVIDIA GeForce RTX 4070 Laptop GPU
70.4 (57min, 56P1) fps
Average NVIDIA GeForce RTX 4070 Laptop GPU
  (64.7 - 74.1, n=6)
69.9 fps -1%
2560x1440 Ultra High Preset AA:T AF:16x
Average of class Gaming
  (36.7 - 84.7, n=11, last 2 years)
54.6 fps +21%
Average NVIDIA GeForce RTX 4070 Laptop GPU
  (41.1 - 48.4, n=6)
45.2 fps 0%
SCHENKER XMG Pro 16 Studio (Mid 24)
Intel Core i9-14900HX, NVIDIA GeForce RTX 4070 Laptop GPU
45.1 (36min, 36P1) fps
2560x1440 Ultra High Preset + Quality DLSS AF:16x
Average of class Gaming
  (59.2 - 129.5, n=9, last 2 years)
78.4 fps +9%
SCHENKER XMG Pro 16 Studio (Mid 24)
Intel Core i9-14900HX, NVIDIA GeForce RTX 4070 Laptop GPU
71.8 (58min, 58P1) fps
Average NVIDIA GeForce RTX 4070 Laptop GPU
  (65.2 - 73.9, n=5)
70 fps -3%

Cyberpunk 2077 ultra FPS diagram

051015202530354045505560657075Tooltip
SCHENKER XMG Pro 16 Studio (Mid 24) i9-14900HX, NVIDIA GeForce RTX 4070 Laptop GPU: Ø77.5 (72.5-79.1)
SCHENKER XMG Pro 16 Studio (Mid 24) i9-14900HX, NVIDIA GeForce RTX 4070 Laptop GPU; Unterhaltungsmodus + Geräuschloser Modus: Ø72.3 (68.6-73.6)
Cyberpunk 2077 Phantom (tryb wydajności)
lowmed.highultraQHD
GTA V (2015) 186.7 184.9 180.9 126 95.9
Dota 2 Reborn (2015) 231 196.2 181.6 160.8
Final Fantasy XV Benchmark (2018) 214 163.6 119.7 86.8
X-Plane 11.11 (2018) 178 147.3 119.5
Strange Brigade (2018) 457 297 236 206 135.9
Baldur's Gate 3 (2023) 171.8 132 115.3 111.8 77.2
Cyberpunk 2077 2.1 Phantom Liberty (2023) 126.3 112.1 95.5 82.5 48.6
Dragon's Dogma 2 (2024) 81 70.4 58.5
Ghost of Tsushima (2024) 114.9 102.8 93 73.7 56.1
Senua's Saga Hellblade 2 (2024) 78.3 64.9 51.2 33.3
F1 24 (2024) 239 238 203 70.4 45.1
The First Descendant (2024) 171 110.9 91.3 80 51.2

Emisje i moc - XMG Pro o wysokim zużyciu energii

Emisja hałasu

Cyberpunk 2077 zwiększa emisję hałasu laptopa do 53 dB(A)( trybwydajnościowy ), podczas gdy profil rozrywkowy generuje nieco bardziej umiarkowane wartości. Tryb cichy nie nadaje się do gier, ponieważ dGPU jest wyłączone. Poziom hałasu urządzenia jest niższy na biegu jałowym i podczas codziennego użytkowania (biuro, internet): Wentylatory nie rozkręcają się nadmiernie, a od czasu do czasu stoją w miejscu. Czasami z wnętrza laptopa słychać elektroniczny trzask.

Hałas

luz
28 / 31 / 35 dB
obciążenie
52 / 52 dB
  red to green bar
 
 
30 dB
cichy
40 dB(A)
słyszalny
50 dB(A)
irytujący
 
min: dark, med: mid, max: light   Earthworks M23R, Arta (odległość 15 cm)   environment noise: 25 dB(A)
dB(A) 0102030405060708090Deep BassMiddle BassHigh BassLower RangeMidsHigher MidsLower HighsMid HighsUpper HighsSuper Highs2026.232.137.631.434.235.72524.828.228.425.531.129.23133.937.243.238.544.541.74025.723.127.92728.629.25020.821.822.421.924.324.7632319.825.221.319.523.38023.620.920.319.418.136.810023.718.118.41814.925.21252824.125.825.722.42816030.63130.730.82730.420032.22826.527.421.63325031.523.324.122.718.632.731532.422.224.422.71735.440035.521.724.721.116.136.250038.921.726.420.614.338.963038.423.52521.612.84080040.622.125.618.912.741.3100041.120.425.517.414.940.2125041.719.625.616.611.940.7160042.31826.115.211.541.6200040.417.223.51512.140.3250039.815.422.613.71341315038.414.22113.112.840.440003913.72013.213.138.750004113.51813.41340.2630038.713.417.813.613.436.380003213.615.713.713.633.61000029.113.717.313.713.329.81250026.71315.412.912.825.31600024.512.514.112.412.120.7SPL51.730.635.329.125.851.6N81.42.31.20.88.1median 38.4median 18.1median 24.1median 16.6median 13.3median 36.3Delta5.44.83.84.52.25.2hearing rangehide median Fan NoiseSCHENKER XMG Pro 16 Studio (Mid 24)
SCHENKER XMG Pro 16 Studio (Mid 24)
NVIDIA GeForce RTX 4070 Laptop GPU, i9-14900HX, Samsung 990 Pro 1 TB
Acer Predator Helios Neo 16 (2024)
NVIDIA GeForce RTX 4070 Laptop GPU, i7-14700HX, Samsung PM9A1a MZVL21T0HDLU
Lenovo Legion Pro 5 16IRX9
NVIDIA GeForce RTX 4070 Laptop GPU, i9-14900HX, Samsung PM9A1 MZVL21T0HCLR
Aorus 16X 2024
NVIDIA GeForce RTX 4070 Laptop GPU, i9-14900HX, Gigabyte AG450E1024-SI
SCHENKER XMG Pro 16 Studio (Mid 23)
NVIDIA GeForce RTX 4070 Laptop GPU, i9-13900H, Samsung 990 Pro 1 TB
Lenovo Legion 7 16 IRX G9
NVIDIA GeForce RTX 4070 Laptop GPU, i9-14900HX, SK Hynix HFS001TEJ9X115N
Noise
3%
10%
-3%
7%
16%
off / environment *
25
25.2
-1%
23.9
4%
26
-4%
25
-0%
24.5
2%
Idle Minimum *
28
27.8
1%
24.3
13%
26
7%
26
7%
24.5
12%
Idle Average *
31
32
-3%
24.3
22%
32
-3%
29
6%
24.5
21%
Idle Maximum *
35
29.6
15%
28.9
17%
38
-9%
34
3%
24.5
30%
Load Average *
52
45.2
13%
45.8
12%
54
-4%
43
17%
34.8
33%
Cyberpunk 2077 ultra *
53
Load Maximum *
52
55.8
-7%
56.6
-9%
55
-6%
48
8%
54.1
-4%
Witcher 3 ultra *
51
50
48
54.1

* ... im mniej tym lepiej

Temperatura

Laptop wyraźnie się nagrzewa: Cyberpunk i testy obciążeniowe skutkowały temperaturami powyżej 60 stopni Celsjusza w niektórych momentach. Wartości powyżej średniej można również osiągnąć podczas codziennego użytkowania (biuro, internet). Temperatury podpórki pod nadgarstki nie są tak złe.

Ekstremalny scenariusz testu obciążeniowego (Prime95 i Furmark w trybie ciągłym) sprawdza stabilność systemu pod pełnym obciążeniem. Priorytety urządzenia są wyraźnie rozłożone: Podczas gdy GPU pracowało z pełną mocą, taktowanie CPU (od 400 MHz do 2 GHz) spadało poniżej zegara bazowego.

 50 °C48 °C51 °C 
 44 °C49 °C48 °C 
 29 °C31 °C31 °C 
maks. w ogóle: 51 °C
średnia: 42.3 °C
66 °C65 °C58 °C
55 °C58 °C47 °C
34 °C34 °C32 °C
maks. w ogóle: 66 °C
średnia: 49.9 °C
zasilacz  50 °C | temperatura otoczenia 22 °C | Fluke t3000FC (calibrated), Voltcraft IR-900
(-) The average temperature for the upper side under maximal load is 42.3 °C / 108 F, compared to the average of 33.9 °C / 93 F for the devices in the class Gaming.
(-) The maximum temperature on the upper side is 51 °C / 124 F, compared to the average of 40.5 °C / 105 F, ranging from 21.2 to 68.8 °C for the class Gaming.
(-) The bottom heats up to a maximum of 66 °C / 151 F, compared to the average of 43.2 °C / 110 F
(±) In idle usage, the average temperature for the upper side is 32.3 °C / 90 F, compared to the device average of 33.9 °C / 93 F.
(-) 3: The average temperature for the upper side is 42.2 °C / 108 F, compared to the average of 33.9 °C / 93 F for the class Gaming.
(+) The palmrests and touchpad are cooler than skin temperature with a maximum of 31 °C / 87.8 F and are therefore cool to the touch.
(-) The average temperature of the palmrest area of similar devices was 28.9 °C / 84 F (-2.1 °C / -3.8 F).
Tryb wydajności Cyberpunk 2077
Tryb wydajności Furmark i Prime95
SCHENKER XMG Pro 16 Studio (Mid 24)
Intel Core i9-14900HX, NVIDIA GeForce RTX 4070 Laptop GPU
Acer Predator Helios Neo 16 (2024)
Intel Core i7-14700HX, NVIDIA GeForce RTX 4070 Laptop GPU
Lenovo Legion Pro 5 16IRX9
Intel Core i9-14900HX, NVIDIA GeForce RTX 4070 Laptop GPU
Aorus 16X 2024
Intel Core i9-14900HX, NVIDIA GeForce RTX 4070 Laptop GPU
SCHENKER XMG Pro 16 Studio (Mid 23)
Intel Core i9-13900H, NVIDIA GeForce RTX 4070 Laptop GPU
Lenovo Legion 7 16 IRX G9
Intel Core i9-14900HX, NVIDIA GeForce RTX 4070 Laptop GPU
Heat
9%
11%
14%
2%
22%
Maximum Upper Side *
51
58
-14%
43.8
14%
41
20%
55
-8%
43.7
14%
Maximum Bottom *
66
45.2
32%
55.4
16%
41
38%
66
-0%
42.9
35%
Idle Upper Side *
35
31.1
11%
32.8
6%
37
-6%
33
6%
29.1
17%
Idle Bottom *
39
37.2
5%
36
8%
38
3%
35
10%
30.6
22%

* ... im mniej tym lepiej

Głośniki

Wyraźnie brakuje basów. Poza tym głośniki stereo generują akceptowalny dźwięk. Ich maksymalny poziom mógłby być nieco wyższy.

dB(A) 0102030405060708090Deep BassMiddle BassHigh BassLower RangeMidsHigher MidsLower HighsMid HighsUpper HighsSuper Highs2034.234.92531.128.43144.540.14028.628.65024.329.66319.525.98018.124.410014.924.312522.437.61602747.120021.655.325018.663.33151765.140016.166.950014.368.763012.870.280012.768.9100014.970.8125011.968160011.565.4200012.169.525001368.5315012.863.3400013.161.250001360.6630013.459.7800013.657.21000013.352.41250012.853.21600012.151.2SPL25.878.6N0.843.7median 13.3median 63.3Delta2.2830.533.830.523.627.923.621.426.421.421.525.321.522.322.822.325.927.825.926.624.726.627.221.127.235.11735.145.814.745.850.115.150.154.915.654.957.816.657.861.215.661.263.412.863.469.911.669.972.51172.567.810.167.869.91069.968.810.368.869.811.969.869.211.369.267.111.867.164.111.864.167136771.412.571.469.313.169.364.212.664.259.713.459.752.913.552.980.724.380.750.40.650.4median 64.2median 12.8median 64.28.21.78.2hearing rangehide median Pink NoiseSCHENKER XMG Pro 16 Studio (Mid 24)Lenovo Legion Pro 5 16IRX9
Frequency diagram (checkboxes can be checked and unchecked to compare devices)
SCHENKER XMG Pro 16 Studio (Mid 24) audio analysis

(±) | speaker loudness is average but good (79 dB)
Bass 100 - 315 Hz
(-) | nearly no bass - on average 15.1% lower than median
(±) | linearity of bass is average (13.6% delta to prev. frequency)
Mids 400 - 2000 Hz
(±) | higher mids - on average 5.3% higher than median
(+) | mids are linear (4.4% delta to prev. frequency)
Highs 2 - 16 kHz
(+) | balanced highs - only 4.4% away from median
(+) | highs are linear (4.9% delta to prev. frequency)
Overall 100 - 16.000 Hz
(±) | linearity of overall sound is average (17.7% difference to median)
Compared to same class
» 50% of all tested devices in this class were better, 10% similar, 40% worse
» The best had a delta of 6%, average was 18%, worst was 132%
Compared to all devices tested
» 32% of all tested devices were better, 8% similar, 60% worse
» The best had a delta of 4%, average was 25%, worst was 134%

Lenovo Legion Pro 5 16IRX9 audio analysis

(±) | speaker loudness is average but good (80.7 dB)
Bass 100 - 315 Hz
(-) | nearly no bass - on average 19% lower than median
(±) | linearity of bass is average (10.1% delta to prev. frequency)
Mids 400 - 2000 Hz
(+) | balanced mids - only 4.7% away from median
(+) | mids are linear (5.7% delta to prev. frequency)
Highs 2 - 16 kHz
(+) | balanced highs - only 3.3% away from median
(+) | highs are linear (5.6% delta to prev. frequency)
Overall 100 - 16.000 Hz
(±) | linearity of overall sound is average (17.2% difference to median)
Compared to same class
» 45% of all tested devices in this class were better, 11% similar, 44% worse
» The best had a delta of 6%, average was 18%, worst was 132%
Compared to all devices tested
» 28% of all tested devices were better, 8% similar, 64% worse
» The best had a delta of 4%, average was 25%, worst was 134%

Zużycie energii

W trybie bezczynności pobór mocy laptopa jest zdecydowanie zbyt wysoki - znacznie wyższy niż w przypadku podobnie wyposażonego poprzednika. Cyberpunk i testy obciążeniowe zostały przeprowadzone przy nieznacznie malejącym, stale wahającym się poborze mocy. Zasilacz o mocy 230 W jest wciąż wystarczającej wielkości. Krótkotrwałe skoki obciążenia, takie jak na początku testu obciążeniowego, nie stanowią dla niego problemu.

Pobór mocy
wyłączony / stan wstrzymaniadarklight 0.1 /  W
luzdarkmidlight 31 / 33 / 41 W
obciążenie midlight 114 / 250 W
 color bar
Legenda: min: dark, med: mid, max: light        Metrahit Energy
SCHENKER XMG Pro 16 Studio (Mid 24)
NVIDIA GeForce RTX 4070 Laptop GPU, i9-14900HX, Samsung 990 Pro 1 TB
Acer Predator Helios Neo 16 (2024)
NVIDIA GeForce RTX 4070 Laptop GPU, i7-14700HX, Samsung PM9A1a MZVL21T0HDLU
Lenovo Legion Pro 5 16IRX9
NVIDIA GeForce RTX 4070 Laptop GPU, i9-14900HX, Samsung PM9A1 MZVL21T0HCLR
Aorus 16X 2024
NVIDIA GeForce RTX 4070 Laptop GPU, i9-14900HX, Gigabyte AG450E1024-SI
SCHENKER XMG Pro 16 Studio (Mid 23)
NVIDIA GeForce RTX 4070 Laptop GPU, i9-13900H, Samsung 990 Pro 1 TB
Power Consumption
11%
23%
22%
43%
Idle Minimum *
31
26.7
14%
12.5
60%
13
58%
8
74%
Idle Average *
33
24.4
26%
24.6
25%
18
45%
12
64%
Idle Maximum *
41
32.7
20%
24.8
40%
35
15%
23
44%
Load Average *
114
122.1
-7%
109.6
4%
138
-21%
94
18%
Cyberpunk 2077 ultra *
218
Cyberpunk 2077 ultra external monitor *
196.8
Load Maximum *
250
241
4%
284.9
-14%
222
11%
215
14%
Witcher 3 ultra *
190.6
218
172.6
181.5

* ... im mniej tym lepiej

Power consumption Cyberpunk / stress test

0153045607590105120135150165180195210225240Tooltip
SCHENKER XMG Pro 16 Studio (Mid 24); 1280x720 Prime95 28.10 and Furmark 1.25: Ø152.8 (135.5-250)
SCHENKER XMG Pro 16 Studio (Mid 24); Idle 150cd/m2: Ø33.1 (31.4-41.5)
SCHENKER XMG Pro 16 Studio (Mid 24); Cyberpunk 2077 FHD ultra no FSR 150cd: Ø218 (198.6-231)

Power consumption with external monitor

0153045607590105120135150165180195210Tooltip
SCHENKER XMG Pro 16 Studio (Mid 24); Prime95 V2810 Stress (external Monitor): Ø102.9 (90.4-157.6)
SCHENKER XMG Pro 16 Studio (Mid 24); Cinebench R23 Multi (external Monitor): Ø154 (147.4-167.4)
SCHENKER XMG Pro 16 Studio (Mid 24); 1280x720 FurMark 1.19 GPU Stress Test (external Monitor): Ø187 (176.6-193.3)
SCHENKER XMG Pro 16 Studio (Mid 24); Idle 1min (external Monitor): Ø28.5 (27.6-33.1)
SCHENKER XMG Pro 16 Studio (Mid 24); Cyberpunk 2077 FHD ultra no FSR - external Monitor: Ø196.8 (187.7-222)

Czas trwania

Pro 16 wymaga również więcej energii niż jego poprzednik przy niskim obciążeniu w trybie baterii. W rezultacie osiągnął czas pracy 5:37 godzin podczas testu WiFi (mapowanie obciążenia podczas uzyskiwania dostępu do stron internetowych za pomocą skryptu). To pozostawia go dobrą godzinę za jego poprzednika-który miał taką samą pojemność baterii 73 Wh.

Wydajność akumulatora
WiFi Websurfing (Edge 126)
5h 37min
Battery Runtime - WiFi Websurfing
Aorus 16X 2024
i9-14900HX, NVIDIA GeForce RTX 4070 Laptop GPU, 99 Wh
481 min +43%
Lenovo Legion 7 16 IRX G9
i9-14900HX, NVIDIA GeForce RTX 4070 Laptop GPU, 99.9 Wh
433 min +28%
SCHENKER XMG Pro 16 Studio (Mid 23)
i9-13900H, NVIDIA GeForce RTX 4070 Laptop GPU, 73 Wh
405 min +20%
Average of class Gaming
  (85 - 889, n=157, last 2 years)
376 min +12%
SCHENKER XMG Pro 16 Studio (Mid 24)
i9-14900HX, NVIDIA GeForce RTX 4070 Laptop GPU, 73 Wh
337 min
Lenovo Legion Pro 5 16IRX9
i9-14900HX, NVIDIA GeForce RTX 4070 Laptop GPU, 80 Wh
290 min -14%
Acer Predator Helios Neo 16 (2024)
i7-14700HX, NVIDIA GeForce RTX 4070 Laptop GPU, 90.61 Wh
227 min -33%

Za

+ wyświetlacz 16:10 (WQXGA, 240 Hz)
+ Pamięć RAM może być wymieniana/rozbudowywana
+ dwa gniazda na dyski SSD (PCIe 4)
+ Podświetlenie klawiatury RGB
+ Thunderbolt 4
+ Power Delivery

Przeciw

- 8 GB VRAM nie jest przyszłościowe
- części obudowy bardzo się nagrzewają
- wysoki pobór mocy w trybie bezczynności
- brak DCI-P3

Werdykt - Potęga z problemami

XMG Pro 16 Studio (Mid 24), próbka testowa dostarczona przez firmę Schenker.

Pro 16 koncentruje się na stale wysokiej mocy GPU z wartościami wydajności nieco powyżej średniej GPU. Procesor już po krótkim czasie musi się uspokoić - ujawniła to pętla CB15.

XMG Pro 16 Studio (Mid 24) można przypisać do działu utrzymania modeli. Poza przejściem z Raptor Lake na Raptor Lake Refresh, laptop nie może pochwalić się żadnymi istotnymi nowościami.

Hałas i wydzielanie ciepła przez urządzenie, a także zużycie energii w trybie bezczynności są (zbyt) wysokie. Jeśli chodzi o to, jak energochłonny jest laptop, nie możemy wykluczyć, że nasza próbka testowa ma wadę. Czasy pracy są przyzwoite.

Zainstalowany panel 16:10 (16 cali, 2560 x 1600 pikseli, sRGB, IPS, 240 Hz) jest w porządku, ale brakuje mu przestrzeni kolorów DCI-P3, która jest warunkiem wstępnym dla laptopa dla twórców. Urządzenie nadal może pomieścić dwa dyski SSD PCIe 4 i obsługuje RAID 0/1. Port TB-4 zapewnia opcje rozszerzeń (zewnętrzne GPU, dokowanie) i obsługuje Power Delivery.

Alternatywą może być Aorus 16X (2024). Jest on w stanie uzyskać nieco więcej mocy obliczeniowej z tego samego procesora, posiada znacznie jaśniejszy ekran (w tym Dolby Vision) - dodatkowo może pochwalić się lepszymi czasami pracy.

Cena i dostępność

Nowy XMG Pro 16 Studio (Mid 24) można skonfigurować i zamówić za pośrednictwem strony bestware.comprzy czym obecne urządzenie testowe kosztuje około 2500 USD.

Prosimy pamiętać: Niedawno zaktualizowaliśmy nasz system oceny i wyniki wersji 8 nie są porównywalne z wynikami wersji 7. Więcej informacji znajdą Państwo tutaj.

SCHENKER XMG Pro 16 Studio (Mid 24) - 23/07/2024 v8
Sascha Mölck

Wykonanie
77 / 98 → 79%
Klawiatura
78%
Myszka
83%
Komunikacja
72 / 80 → 90%
Waga
61 / 10-68 → 88%
Akumulator
67 / 95 → 70%
Wyświetlacz
82%
Wydajność w grach
87%
Wydajność w programach użytkowych
86%
AI Performance
96%
Temperatura
74 / 95 → 78%
Hałas
60 / 90 → 67%
Głośniki
72%
Kamerka
40 / 75 → 53%
Średnio
60%
81%
Gaming - Ważona średnia
CO2 Emissions
No Data
Materials
0%
Packaging
25%
Power Use
75.7%
Repairability
70%
Software Updates
22.3%
Recycle Logo Total Sustainability Score: 32.2%

Transparency

The selection of devices to be reviewed is made by our editorial team. The test sample was provided to the author as a loan by the manufacturer or retailer for the purpose of this review. The lender had no influence on this review, nor did the manufacturer receive a copy of this review before publication. There was no obligation to publish this review. We never accept compensation or payment in return for our reviews. As an independent media company, Notebookcheck is not subjected to the authority of manufacturers, retailers or publishers.

This is how Notebookcheck is testing

Every year, Notebookcheck independently reviews hundreds of laptops and smartphones using standardized procedures to ensure that all results are comparable. We have continuously developed our test methods for around 20 years and set industry standards in the process. In our test labs, high-quality measuring equipment is utilized by experienced technicians and editors. These tests involve a multi-stage validation process. Our complex rating system is based on hundreds of well-founded measurements and benchmarks, which maintains objectivity. Further information on our test methods can be found here.

Price comparison

Please share our article, every link counts!
> laptopy testy i recenzje notebooki > Laptopy > Recenzja XMG Pro 16 Studio (Mid 24): Core i9 i RTX 4070 dla graczy i twórców
Sascha Mölck, 2024-07-26 (Update: 2024-07-26)