Notebookcheck Logo

Recenzja Acer Predator Helios Neo 16 (2024): Laptop do gier z RTX 4070 i panelem DCI-P3

Głód mocy.

Helio Neo 16 oferuje jasny i wiernie odwzorowujący kolory 16-calowy wyświetlacz (2560x1600 pikseli, 240 Hz, DCI-P3) w formacie 16:10, 32 GB pamięci RAM oraz dwa porty Thunderbolt 4 (Power Delivery). Ten potężny laptop jest napędzany przez procesor Core i7-14700HX wraz z kartą graficzną GeForce RTX 4070.
Gaming Geforce Intel Laptop / Notebook Nvidia Raptor Lake Thunderbolt Windows

Wraz z Predator Helios Neo 16, Acer dodaje kolejny model do segmentu laptopów gamingowych średniej klasy. Sprzęt odpowiada docelowym scenariuszom użytkowania gier, renderowania i przesyłania strumieniowego: procesor Core i7-14700HX, a GeForce RTX 4070, 32 GB pamięci RAM i jasny wyświetlacz IPS z dokładnymi kolorami (DCI-P3) w formacie 16:10.

Chociaż Helios przypomina swojego poprzednika, nie mają dokładnie tej samej konstrukcji. Wśród konkurentów znajdują się inne laptopy, takie jak Aorus 16X 2024, Alienware m16 R2, HP Omen Transcend 16, Asus TUF Gaming A17 FA707XIoraz Lenovo Legion Pro 5 16IRX9.

Acer Predator Helios Neo 16 (2024) (Predator Helios Neo 16 Rodzina)
Procesor
Intel Core i7-14700HX 20 x 3.9 - 5.5 GHz, 157 W PL2 / Short Burst, 95 W PL1 / Sustained, Raptor Lake-HX Refresh
Karta grafiki
NVIDIA GeForce RTX 4070 Laptop GPU - 8 GB VRAM, rdzeń: 1980 MHz, pamięć: 2000 MHz, 140 W TDP ( w tym 25 W Dynamic Boost), GDDR6, 31.0.15.5212, Advanced Optimus
Pamięć
32 GB 
, DDR5-5600, dual-channel mode, two memory slots (both in use)
Matryca
16.00 cali 16:10, 2560 x 1600 pikseli 189 PPI, Chi Mei N160GME-GTB, LED, G-Sync, refleksująca: nie, 240 Hz, Adaptive Sync
Chipset
Intel HM770 (Raptor Lake-S PCH)
Dysk twardy
Samsung PM9A1a MZVL21T0HDLU, 1024 GB 
, PCIe 4, M.2-2280, 882 GB wolne miejsce
Złącza
1 USB 3.0, 4 USB 3.1 Gen2, 2 USB 4.0 40 Gbps, USB-C Power Delivery (PD), 1 HDMI, 2 DisplayPort, 1 blokada Kensingtona, gniazda audio: combined headset port, czytnik kart: microSD, TPM 2.0
Łączność
Killer E3100G 2.5 Gigabit Ethernet Controller (10/100/1000/2500MBit/s), Killer Wi-Fi 6E AX1675i 160MHz Wireless Network Adapter (a/b/g/n = Wi-Fi 4/ac = Wi-Fi 5/ax = Wi-Fi 6/), Bluetooth 5.3
Gabaryty
wysokość x szerokość x głębokość (mm): 25.95 x 357.78 x 278.63
Akumulator
90.61 Wh, 5884 mAh litowo-jonowy, 4-cell
System operacyjny
Microsoft Windows 11 Home
Kamera
kamerka: FHD
Główny aparat: 2.1 MPix
Inne
głośniki: stereo, klawiatura: chiclet, podświetlanie klawiatury: tak, McAfee LiveSafe (trial), ExpressVPN (trial), Microsoft 365 (trial), Microsoft OneNote (trial), 24 miesiące(y) gwarancji
Waga
2.624 kg, zasilacz: 1.228 kg
Cena
1999 Euro
Uwaga: Producent może używać komponentów pochodzących od różnych dostawców, w tym paneli wyświetlaczy, napędów lub kart pamięci o podobnych specyfikacjach.


Potencjalni konkurenci w porównaniu

Ocena
Data
Model
Waga
Wysokość
Rozmiar
Rezolucja
Cena
86.8 %
v7 (old)
05/2024
Acer Predator Helios Neo 16 (2024)
i7-14700HX, NVIDIA GeForce RTX 4070 Laptop GPU
2.6 kg25.95 mm16.00"2560x1600
87.4 %
v7 (old)
04/2024
Aorus 16X 2024
i9-14900HX, NVIDIA GeForce RTX 4070 Laptop GPU
2.3 kg20 mm16.00"2560x1600
90.2 %
v7 (old)
03/2024
Alienware m16 R2
Ultra 7 155H, NVIDIA GeForce RTX 4070 Laptop GPU
2.5 kg23.5 mm16.00"2560x1600
88.4 %
v7 (old)
02/2024
HP Omen Transcend 16-u1095ng
i9-14900HX, NVIDIA GeForce RTX 4070 Laptop GPU
2.3 kg20 mm16.00"2560x1600
85.6 %
v7 (old)
01/2024
Asus TUF Gaming A17 FA707XI-NS94
R9 7940HS, NVIDIA GeForce RTX 4070 Laptop GPU
2.5 kg25.4 mm17.30"1920x1080
89.3 %
v7 (old)
04/2024
Lenovo Legion Pro 5 16IRX9
i9-14900HX, NVIDIA GeForce RTX 4070 Laptop GPU
2.5 kg26.95 mm16.00"2560x1600

Obudowa - Acer wykorzystuje plastik i aluminium

Obudowa wykazuje dobrą jakość wykonania. Pomimo tego, że plastikowa podstawa i aluminiowa pokrywa mogą się lekko odkształcać, pozostaje to w granicach rozsądku. Nacisk na tylną część pokrywy wyświetlacza nie powoduje żadnych artefaktów obrazu. Zawiasy mocno trzymają pokrywę w miejscu, a maksymalny kąt otwarcia wynosi około 150 stopni. Pokrywę można otworzyć jedną ręką.

Jeśli chodzi o kolorystykę obudowy, to dominuje czerń i jedynie osłony wentylatorów z tyłu mają jaśniejszy odcień szarości. Kolorytu dodaje podświetlenie klawiatury oraz podświetlane logo Predator z tyłu pokrywy.

Acer Predator Helios 16 (2024)

Predator jest najcięższym i największym spośród 16-calowych laptopów w naszym polu porównawczym.

Porównanie rozmiarów

395 mm 264 mm 25.4 mm 2.5 kg363.4 mm 261.75 mm 26.95 mm 2.5 kg363.9 mm 249.4 mm 23.5 mm 2.5 kg357.78 mm 278.63 mm 25.95 mm 2.6 kg356 mm 254 mm 20 mm 2.3 kg356 mm 269 mm 20 mm 2.3 kg297 mm 210 mm 1 mm 5.7 g

Wyposażenie - Predator jest wyposażony w Thunderbolt 4

Bogate wyposażenie w złącza obejmuje trzy porty USB-A (1x USB 3.2 Gen 1, 2x USB 3.2 Gen 2), dwa porty USB-C (Thunderbolt 4; Power Delivery, DisplayPort) oraz trzy porty wideo (HDMI 2.1, 2x DP). Dostępne złącza uzupełnia port audio oraz port Gigabit Ethernet (2,5 Gbit/s).

Porty wideo i zasilania zostały umieszczone z tyłu laptopa, dzięki czemu odpowiednie kable biegną z tyłu i nie przeszkadzają. Acer umieścił resztę portów na środku prawej i lewej strony, a obszary obok podpórek pod nadgarstki pozostają w większości wolne od jakichkolwiek kabli.

Lewa strona: Gigabit Ethernet (2,5 Gbit/s), USB 3.2 Gen 1 (USB-A), czytnik kart pamięci microSD, port audio combo
Prawa strona: 2x USB 3.2 Gen 2 (USB-A), gniazdo na blokadę Kensington
Tył: port zasilania, HDMI 2.1, 2x Thunderbolt 4 (USB-C; Power Delivery, DisplayPort)

Czytnik kart SD

Czytnik kart pamięci microSD (karta referencyjna: AV PRO microSD 128 GB V60) działa w spokojnym tempie, z maksymalnymi transferami na poziomie 20 MB/s (przesyłanie 250 plików jpg po 5 MB każdy) i 25,8 MB/s (kopiowanie dużych bloków danych), co nie przystaje już do obecnych standardów. Konkurenci radzą sobie tutaj znacznie lepiej.

SD Card Reader
average JPG Copy Test (av. of 3 runs)
Aorus 16X 2024
Intel Core i9-14900HX (AV PRO microSD 128 GB V60)
186 MB/s +830%
Średnia w klasie Gaming
  (19 - 197.3, n=78, ostatnie 2 lata)
91 MB/s +355%
Alienware m16 R2
Intel Core Ultra 7 155H (AV PRO microSD 128 GB V60)
75.3 MB/s +277%
Acer Predator Helios Neo 16 (2024)
Intel Core i7-14700HX (AV PRO microSD 128 GB V60)
20 MB/s
maximum AS SSD Seq Read Test (1GB)
Alienware m16 R2
Intel Core Ultra 7 155H (AV PRO microSD 128 GB V60)
205.32 MB/s +696%
Aorus 16X 2024
Intel Core i9-14900HX (AV PRO microSD 128 GB V60)
188 MB/s +629%
Średnia w klasie Gaming
  (25.8 - 269, n=78, ostatnie 2 lata)
114.9 MB/s +345%
Acer Predator Helios Neo 16 (2024)
Intel Core i7-14700HX (AV PRO microSD 128 GB V60)
25.8 MB/s

Komunikacja

W optymalnych warunkach (brak urządzeń WLAN w pobliżu i niewielka odległość między laptopem a serwerem PC) laptop Acer osiąga bardzo dobre prędkości transmisji danych WiFi. Zarówno układ WiFi 6E (AX1675i vel Intel AX211), jak i kontroler Gigabit Ethernet (E3100G; 2,5 Gbit/s) pochodzą od Killera.

Networking
iperf3 transmit AXE11000
HP Omen Transcend 16-u1095ng
Intel Wi-Fi 6E AX211
1411 (1327min - 1472max) MBit/s +44%
Przeciętny Killer Wi-Fi 6E AX1675i 160MHz Wireless Network Adapter
  (942 - 1622, n=26)
1358 MBit/s +39%
Średnia w klasie Gaming
  (469 - 1843, n=137, ostatnie 2 lata)
1217 MBit/s +24%
Alienware m16 R2
Intel Wi-Fi 7 BE202
1205 (875min - 1438max) MBit/s +23%
Acer Predator Helios Neo 16 (2024)
Killer Wi-Fi 6E AX1675i 160MHz Wireless Network Adapter
980 (886min - 1077max) MBit/s
Asus TUF Gaming A17 FA707XI-NS94
Realtek RTL8852BE
875 (812min - 916max) MBit/s -11%
Lenovo Legion Pro 5 16IRX9
Intel Wi-Fi 6E AX211
636 (485min - 769max) MBit/s -35%
Aorus 16X 2024
Intel Wi-Fi 7 BE200 320MHz
469 (304min - 548max) MBit/s -52%
iperf3 receive AXE11000
HP Omen Transcend 16-u1095ng
Intel Wi-Fi 6E AX211
1697 (849min - 1712max) MBit/s +77%
Aorus 16X 2024
Intel Wi-Fi 7 BE200 320MHz
1577 (1237min - 1665max) MBit/s +65%
Przeciętny Killer Wi-Fi 6E AX1675i 160MHz Wireless Network Adapter
  (872 - 1714, n=28)
1473 MBit/s +54%
Średnia w klasie Gaming
  (680 - 1744, n=137, ostatnie 2 lata)
1388 MBit/s +45%
Alienware m16 R2
Intel Wi-Fi 7 BE202
1227 (1074min - 1317max) MBit/s +28%
Lenovo Legion Pro 5 16IRX9
Intel Wi-Fi 6E AX211
1040 (739min - 1218max) MBit/s +9%
Acer Predator Helios Neo 16 (2024)
Killer Wi-Fi 6E AX1675i 160MHz Wireless Network Adapter
957 (475min - 998max) MBit/s
Asus TUF Gaming A17 FA707XI-NS94
Realtek RTL8852BE
843 (621min - 906max) MBit/s -12%
iperf3 transmit AXE11000 6GHz
Acer Predator Helios Neo 16 (2024)
Killer Wi-Fi 6E AX1675i 160MHz Wireless Network Adapter
1693 (818min - 1767max) MBit/s
Przeciętny Killer Wi-Fi 6E AX1675i 160MHz Wireless Network Adapter
  (1229 - 1693, n=19)
1519 MBit/s -10%
Średnia w klasie Gaming
  (648 - 2355, n=64, ostatnie 2 lata)
1435 MBit/s -15%
Alienware m16 R2
Intel Wi-Fi 7 BE202
1405 (735min - 1499max) MBit/s -17%
Lenovo Legion Pro 5 16IRX9
Intel Wi-Fi 6E AX211
820 (711min - 921max) MBit/s -52%
iperf3 receive AXE11000 6GHz
Acer Predator Helios Neo 16 (2024)
Killer Wi-Fi 6E AX1675i 160MHz Wireless Network Adapter
1788 (925min - 1879max) MBit/s
Przeciętny Killer Wi-Fi 6E AX1675i 160MHz Wireless Network Adapter
  (1327 - 1788, n=20)
1553 MBit/s -13%
Średnia w klasie Gaming
  (853 - 1788, n=64, ostatnie 2 lata)
1478 MBit/s -17%
Alienware m16 R2
Intel Wi-Fi 7 BE202
1410 (1307min - 1476max) MBit/s -21%
Lenovo Legion Pro 5 16IRX9
Intel Wi-Fi 6E AX211
1205 (1100min - 1317max) MBit/s -33%
050100150200250300350400450500550600650700750800850900950100010501100115012001250130013501400145015001550160016501700Tooltip
Acer Predator Helios Neo 16 (2024) Killer Wi-Fi 6E AX1675i 160MHz Wireless Network Adapter; iperf3 transmit AXE11000; iperf 3.1.3: Ø980 (886-1077)
Aorus 16X 2024 Intel Wi-Fi 7 BE200 320MHz; iperf3 transmit AXE11000; iperf 3.1.3: Ø469 (304-548)
Alienware m16 R2 Intel Wi-Fi 7 BE202; iperf3 transmit AXE11000; iperf 3.1.3: Ø1205 (875-1438)
HP Omen Transcend 16-u1095ng Intel Wi-Fi 6E AX211; iperf3 transmit AXE11000; iperf 3.1.3: Ø1411 (1327-1472)
Asus TUF Gaming A17 FA707XI-NS94 Realtek RTL8852BE; iperf3 transmit AXE11000; iperf 3.1.3: Ø875 (812-916)
Lenovo Legion Pro 5 16IRX9 Intel Wi-Fi 6E AX211; iperf3 transmit AXE11000; iperf 3.1.3: Ø636 (485-769)
Acer Predator Helios Neo 16 (2024) Killer Wi-Fi 6E AX1675i 160MHz Wireless Network Adapter; iperf3 receive AXE11000; iperf 3.1.3: Ø941 (475-998)
Aorus 16X 2024 Intel Wi-Fi 7 BE200 320MHz; iperf3 receive AXE11000; iperf 3.1.3: Ø1576 (1237-1665)
Alienware m16 R2 Intel Wi-Fi 7 BE202; iperf3 receive AXE11000; iperf 3.1.3: Ø1227 (1074-1317)
HP Omen Transcend 16-u1095ng Intel Wi-Fi 6E AX211; iperf3 receive AXE11000; iperf 3.1.3: Ø1668 (849-1712)
Asus TUF Gaming A17 FA707XI-NS94 Realtek RTL8852BE; iperf3 receive AXE11000; iperf 3.1.3: Ø843 (621-906)
Lenovo Legion Pro 5 16IRX9 Intel Wi-Fi 6E AX211; iperf3 receive AXE11000; iperf 3.1.3: Ø1039 (739-1218)

Kamera internetowa

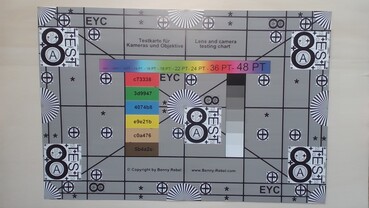
Kamera internetowa o rozdzielczości 2,1 MP zapewnia przeciętne wyniki, ale przynajmniej jest w stanie uzyskać przyzwoitą dokładność kolorów. Nie ma mechanicznej osłony obiektywu.

ColorChecker
6.9 ∆E
6.7 ∆E
10.1 ∆E
8 ∆E
9.7 ∆E
6.8 ∆E
4.4 ∆E
12.5 ∆E
5.9 ∆E
6.6 ∆E
3.8 ∆E
3.5 ∆E
9.9 ∆E
7.3 ∆E
7.6 ∆E
2.2 ∆E
6.9 ∆E
11.2 ∆E
1.8 ∆E
5.1 ∆E
6.7 ∆E
6.3 ∆E
5.2 ∆E
3.8 ∆E
ColorChecker Acer Predator Helios Neo 16 (2024): 6.61 ∆E min: 1.76 - max: 12.48 ∆E

Akcesoria

Laptop nie zawiera żadnych dodatkowych akcesoriów poza zwykłymi dokumentami (skrócona instrukcja obsługi i informacje o gwarancji).

Konserwacja

Zdjęcie dolnej płyty daje dostęp do dysku SSD (PCIe 4, M.2-2280) i drugiego slotu SSD (PCIe 4, M.2-2280), modułu WLAN, wentylatorów i akumulatora. Pamięć operacyjna wraz z gniazdami (oba zajęte) ukryta jest pod dodatkową przykręcaną pokrywą.

Sprzęt Acer Predator Helios Neo 16

Gwarancja

Acer oferuje dwuletnią gwarancję (wysyłając go do naprawy) na 16-calowy laptop. Mogą Państwo rozszerzyć gwarancję do trzech lat za dodatkowe ~100 euro (~108 dolarów).

Urządzenia wejściowe - klawiatura oferuje podświetlenie RGB

Klawiatura

Acer zastosował ogólnie przeciętną klawiaturę typu chicklet (z podświetleniem RGB), która nadaje się do codziennych zadań i nie wyróżnia się ani pozytywnie, ani negatywnie. Gładkie klawisze oferują krótki skok, wyraźny punkt nacisku i przyzwoity opór. Klawiatura minimalnie ugina się podczas pisania, co jednak nie okazało się żadną przeszkodą. Fakt, że cztery klawisze strzałek mają regularny rozmiar jest plusem.

Panel dotykowy

Wielodotykowy ClickPad (~12,6 x 8,3 cm, ~5 x 3,3 cala) również nie wyróżnia się niczym szczególnym. Oferuje krótki skok i wyraźny punkt nacisku, pozwalając palcom łatwo przesuwać się po gładkiej powierzchni.

Klawiatura Acer Predator Helios Neo 16 - Acer był w stanie dostarczyć nam tylko model z angielskim układem klawiatury.

Wyświetlacz - jasny panel WQXGA z pokryciem DCI-P3

16-calowy wyświetlacz IPS (2560x1600 pikseli) w przyjaznym dla użytkownika formacie 16:10 wyróżnia się stabilnymi kątami widzenia, brakiem migotania PWM, krótkim czasem reakcji, matową powierzchnią i wysoką jasnością (>500 cd/m²). Ta ostatnia umożliwia odczytywanie zawartości wyświetlacza na zewnątrz, o ile światło słoneczne nie jest zbyt jasne.

Acer wykorzystuje panel o częstotliwości odświeżania 240 Hz wraz z obsługą G-Sync. Dzięki temu częstotliwość odświeżania wyświetlacza i procesora graficznego jest dynamicznie dostosowywana, aby umożliwić wyświetlanie ruchomych obrazów, które są tak płynne, jak to tylko możliwe, szczególnie podczas grania.

Proszę zauważyć, że najwyraźniej overdrive LCD nie może być dezaktywowany. Czasy reakcji pozostają na tym samym poziomie, niezależnie od położenia przełącznika on/off w oprogramowaniu PredatorSense (centrum sterowania laptopa).

Siatka pikseli
Siatka pikseli
Zauważalne są pewne dyskretne aureole
Kąty widzenia
Kąty widzenia
Zastosowanie na zewnątrz
526
cd/m²
532
cd/m²
542
cd/m²
492
cd/m²
521
cd/m²
514
cd/m²
460
cd/m²
470
cd/m²
496
cd/m²
podświetlenie ekranu
Chi Mei N160GME-GTB testowany z X-Rite i1Pro 2
maksimum: 542 cd/m² (Nits) średnia: 505.9 cd/m² Minimum: 20.9 cd/m²
rozświetlenie: 85 %
na akumulatorze: 521 cd/m²
kontrast: 1184:1 (czerń: 0.44 cd/m²)
ΔE Color 1.74 | 0.5-29.43 Ø4.89, calibrated: 0.52
ΔE Greyscale 3 | 0.5-98 Ø5.1
86.4% AdobeRGB 1998 (Argyll 2.2.0 3D)
99.8% sRGB (Argyll 2.2.0 3D)
95.9% Display P3 (Argyll 2.2.0 3D)
Gamma: 2.164
Acer Predator Helios Neo 16 (2024)
Chi Mei N160GME-GTB, LED, 2560x1600, 16"
Aorus 16X 2024
BOE CQ NE160QDM-NY1, IPS, 2560x1600, 16"
Alienware m16 R2
BOE NE16NYH, IPS, 2560x1600, 16"
HP Omen Transcend 16-u1095ng
ATNA60DL02-0 (SDC41A4), OLED, 2560x1600, 16"
Asus TUF Gaming A17 FA707XI-NS94
AU Optronics B173HAN04.9, IPS, 1920x1080, 17.3"
Lenovo Legion Pro 5 16IRX9
BOE NE160QDM-NYC, IPS, 2560x1600, 16"
Display
-18%
-14%
5%
-51%
-16%
Display P3 Coverage
95.9
67.2
-30%
71
-26%
99.8
4%
39.7
-59%
69.3
-28%
sRGB Coverage
99.8
96.7
-3%
100
0%
100
0%
59.1
-41%
99.4
0%
AdobeRGB 1998 Coverage
86.4
69.3
-20%
71.4
-17%
97
12%
41
-53%
70.1
-19%
Response Times
-6%
-7%
97%
-443%
-70%
Response Time Grey 50% / Grey 80% *
5 ?(2.5, 2.5)
7.5 ?(3.3, 4.2)
-50%
5.7 ?(2.6, 3.1)
-14%
0.2 ?(0.1, 0.1)
96%
39 ?(18, 21)
-680%
11.9 ?(5.5, 6.4)
-138%
Response Time Black / White *
8.8 ?(4.7, 4.1)
5.4 ?(1.5, 3.9)
39%
8.7 ?(4.6, 4.1)
1%
0.2 ?(0.1, 0.1)
98%
26.9 ?(13.8, 13.1)
-206%
8.9 ?(4.8, 4.1)
-1%
PWM Frequency
120 ?(100)
Screen
-27%
-3%
103%
-99%
2%
Brightness middle
521
542
4%
345.8
-34%
390
-25%
255.9
-51%
384
-26%
Brightness
506
504
0%
337
-33%
392
-23%
248
-51%
366
-28%
Brightness Distribution
85
86
1%
87
2%
98
15%
91
7%
91
7%
Black Level *
0.44
0.45
-2%
0.3
32%
0.02
95%
0.21
52%
0.35
20%
Contrast
1184
1204
2%
1153
-3%
19500
1547%
1219
3%
1097
-7%
Colorchecker dE 2000 *
1.74
2.73
-57%
1.99
-14%
1.94
-11%
4.51
-159%
0.97
44%
Colorchecker dE 2000 max. *
3.88
5.29
-36%
3.52
9%
4.26
-10%
20.77
-435%
3.57
8%
Colorchecker dE 2000 calibrated *
0.52
1.32
-154%
0.62
-19%
4.21
-710%
1.82
-250%
0.77
-48%
Greyscale dE 2000 *
3
2.9
3%
2.1
30%
1.5
50%
3.2
-7%
1.5
50%
Gamma
2.164 102%
2.192 100%
2.32 95%
2.221 99%
2.08 106%
2.24 98%
CCT
6816 95%
6173 105%
6369 102%
6395 102%
6054 107%
6709 97%
Całkowita średnia (program / ustawienia)
-17% / -22%
-8% / -6%
68% / 81%
-198% / -138%
-28% / -12%

* ... im mniej tym lepiej

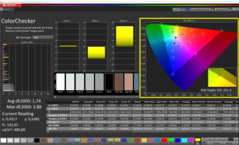
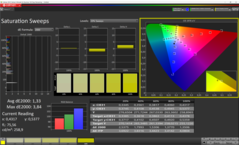
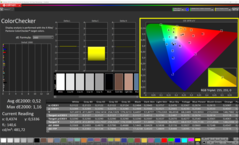
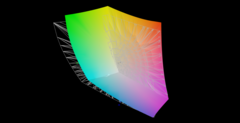
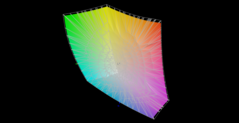
Panel jest w stanie całkowicie lub prawie całkowicie pokryć przestrzenie barw sRGB i DCI-P3, ale to samo nie dotyczy przestrzeni barw AdobeRGB. Dzięki temu wyświetlacz Predator oferuje lepsze pokrycie przestrzeni barw niż panele większości konkurentów. Ogólnie rzecz biorąc, wyświetlacz już w stanie dostawy osiąga dobre odwzorowanie kolorów, z odchyleniem 1,7 (cel: DeltaE < 3). Dodatkowa kalibracja obniża tę wartość jeszcze bardziej, do 0,52, co jest bardzo dobrym wynikiem.

Mogą Państwo pobrać i używać naszego profilu kolorów za darmo. Link znajdą Państwo w polu informacyjnym wyświetlacza.

CalMAN - ColorChecker
CalMAN - Skala szarości
CalMAN - Nasycenie
CalMAN - Nasycenie
CalMAN - ColorChecker (skalibrowany)
CalMAN - Skala szarości (skalibrowana)
CalMAN - Nasycenie (skalibrowane)
Predator vs. sRGB
Predator vs. sRGB
Predator vs. Adobe RGB
Predator vs. DCI-P3
Predator vs. DCI-P3

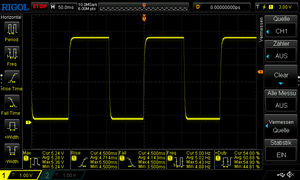
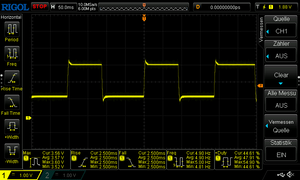
Wyświetl czasy reakcji

Czasy reakcji wyświetlacza pokazują, jak szybko ekran może zmieniać kolor z jednego koloru na drugi. Długi czas reakcji może powodować powstawanie powidoków i sprawiać, że poruszające się obiekty będą niewyraźne (duchy). Gracze szybkich tytułów 3D powinni zwrócić szczególną uwagę na szybki czas reakcji.
       Czas reakcji od czerni do bieli
8.8 ms ... wzrost ↗ i spadek ↘ łącznie↗ 4.7 ms wzrost
↘ 4.1 ms upadek
W naszych testach ekran wykazuje szybki czas reakcji i powinien nadawać się do gier.
Dla porównania, wszystkie testowane urządzenia wahają się od 0.1 (minimum) do 240 (maksimum) ms. » 21 % wszystkich urządzeń jest lepszych.
Oznacza to, że zmierzony czas reakcji jest lepszy od średniej wszystkich testowanych urządzeń (20.9 ms).
       Czas reakcji 50% szarości do 80% szarości
5 ms ... wzrost ↗ i spadek ↘ łącznie↗ 2.5 ms wzrost
↘ 2.5 ms upadek
W naszych testach ekran wykazuje bardzo szybką reakcję i powinien bardzo dobrze nadawać się do szybkich gier.
Dla porównania, wszystkie testowane urządzenia wahają się od 0.165 (minimum) do 636 (maksimum) ms. » 14 % wszystkich urządzeń jest lepszych.
Oznacza to, że zmierzony czas reakcji jest lepszy od średniej wszystkich testowanych urządzeń (32.7 ms).

Migotanie ekranu / PWM (modulacja szerokości impulsu)

Aby przyciemnić ekran, niektóre notebooki po prostu w krótkich odstępach czasu włączają i wyłączają podświetlenie — jest to metoda zwana modulacją szerokości impulsu (PWM). W idealnym przypadku ta częstotliwość cykli powinna być niewykrywalna dla ludzkiego oka. Jeśli wspomniana częstotliwość jest zbyt niska, użytkownicy o wrażliwych oczach mogą odczuwać zmęczenie lub bóle głowy, a nawet całkowicie zauważyć migotanie.
Migotanie ekranu/nie wykryto PWM

Dla porównania: 53 % wszystkich testowanych urządzeń nie używa PWM do przyciemniania wyświetlacza. Jeśli wykryto PWM, zmierzono średnio 8615 (minimum: 5 - maksimum: 343500) Hz.

Wydajność - duża moc dzięki Raptor Lake i Adzie Lovelace

Docelową grupą użytkowników 16-calowego laptopa Acer są gracze i twórcy. Laptop jest napędzany przez Raptor Lake i Adę Lovelace. W momencie przeprowadzania tego testu, model naszej jednostki testowej nie jest jeszcze dostępny (w Niemczech), ale mogą Państwo nabyć bratni model z 16 zamiast 32 GB pamięci RAM za prawie 1900 euro (~ 2 044 USD). Najbardziej przystępny cenowo model z tej serii kosztuje około 1 500 euro (~ 1 614 USD).

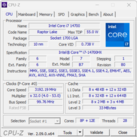
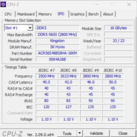
CPU-Z
CPU-Z
CPU-Z
CPU-Z
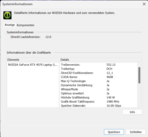
Nvidia Sysinfo
GPU-Z
GPU-Z
HWInfo
HWInfo
 

Warunki testu

Producent oferuje sześć różnych trybów pracy systemu - cztery przy zasilaniu sieciowym i dwa przy zasilaniu bateryjnym (patrz tabela). W naszych testach porównawczych korzystaliśmy z trybu "Performance", a w testach bateryjnych z trybu "Eco". Aby korzystać z trybu "Turbo" lub "Wydajność", poziom naładowania baterii musi wynosić co najmniej 40%. Między trybami można przełączać się za pomocą naciśnięcia klawisza (nad klawiaturą) lub oprogramowania PredatorSense (centrum sterowania laptopa), z diodą LED wskazującą aktualnie aktywny tryb.

Turbo Performance Balanced Silent Balanced (bateria) Eco (bateria)
Limit mocy 1 (HWInfo) 115 Watt 95 Watt 85 Watt 55 Watt 85 Watt 85 Watt
Limit mocy 2 (HWInfo) 157 Watt 157 Watt 157 Watt 157 Watt 157 Watt 157 Watt
Maks. Hałas 55,8 dB(A) 49,5 dB(A) 45 dB(A) - - -
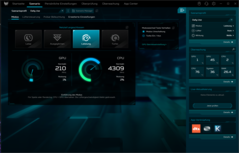
PredatorSense
PredatorSense
PredatorSense
PredatorSense
PredatorSense
PredatorSense
PredatorSense
PredatorSense
PredatorSense

Procesor

20 rdzeni CPU (8P + 12E = 28 wątków) procesora Core i7-14700HX (Raptor Lake) osiąga maksymalne taktowania wynoszące odpowiednio 5,5 GHz (P) i 3,9 GHz (E). Stałe obciążenie wielowątkowe (CB15 Loop) jest obsługiwane ze stałą prędkością zegara, niezależnie od wybranego profilu zasilania. Różnice okazują się jednak raczej niewielkie, a jedynie profil "Silent" znacząco obniża wydajność.

Wyniki benchmarków są nieco rozczarowujące: Pomimo czterech dodatkowych rdzeni CPU i wyższego taktowania, wydajność wielowątkowa jest na tym samym poziomie co w przypadku Core i7-14650HX. Jedynie w wydajności jednowątkowej 14700HX jest w stanie wykorzystać swoją nominalnie dodatkową moc.

Wielowątkowość (praca sieciowa)
Jednowątkowy (zasilanie sieciowe)

Cinebench R15 Multi Constant Load Test

0230460690920115013801610184020702300253027602990322034503680391041404370Tooltip
Acer Predator Helios Neo 16 (2024) Intel Core i7-14700HX: Ø3274 (3212.59-3455.14)
Aorus 16X 2024 Intel Core i9-14900HX: Ø3877 (3701.99-4280.82)
Alienware m16 R2 Intel Core Ultra 7 155H: Ø2777 (2743.86-2839.9)
HP Omen Transcend 16-u1095ng Intel Core i9-14900HX: Ø2840 (2582.31-3904.72)
Asus TUF Gaming A17 FA707XI-NS94 AMD Ryzen 9 7940HS: Ø2784 (2741.98-2817.3)
Lenovo Legion Pro 5 16IRX9 Intel Core i9-14900HX: Ø4230 (4151.1-4590.84)
Lenovo Legion 5 16IRX G9 Intel Core i7-14650HX: Ø3471 (3409.19-3799.39)
Acer Predator Helios Neo 16 (2024) Intel Core i7-14700HX; Turbo: Ø3444 (3384.38-3854.9)
Pętla CB15 (wydajność)
CB15 Loop (Turbo)
CB15 Loop (Turbo)
Pętla CB15 (zbalansowana)
Pętla CB15 (cicha)
Pętla CB15 (cicha)
CPU Performance Rating - Percent
Lenovo Legion Pro 5 16IRX9
Intel Core i9-14900HX
84.5 pt
Aorus 16X 2024
Intel Core i9-14900HX
83.3 pt
Acer Predator Helios Neo 16 (2024)
Intel Core i7-14700HX
76.6 pt
Acer Predator Helios Neo 16 (2024)
Intel Core i7-14700HX
75.7 pt
Lenovo Legion 5 16IRX G9
Intel Core i7-14650HX
73.6 pt
Przeciętny Intel Core i7-14700HX
 
73.4 pt
HP Omen Transcend 16-u1095ng
Intel Core i9-14900HX
72.5 pt
Średnia w klasie Gaming
 
66.8 pt
Asus TUF Gaming A17 FA707XI-NS94
AMD Ryzen 9 7940HS
62 pt
Alienware m16 R2 -1!
Intel Core Ultra 7 155H
61.2 pt
Cinebench R23
Multi Core
Lenovo Legion Pro 5 16IRX9
Intel Core i9-14900HX
29686 (26317.7min - 29686max) Points +28%
Aorus 16X 2024
Intel Core i9-14900HX
27818 Points +20%
Acer Predator Helios Neo 16 (2024)
Intel Core i7-14700HX (Turbo)
25330 Points +9%
Przeciętny Intel Core i7-14700HX
  (22313 - 28122, n=7)
24631 Points +6%
Lenovo Legion 5 16IRX G9
Intel Core i7-14650HX
24455 Points +5%
Acer Predator Helios Neo 16 (2024)
Intel Core i7-14700HX
23207 Points
Średnia w klasie Gaming
  (5668 - 36249, n=168, ostatnie 2 lata)
21665 Points -7%
HP Omen Transcend 16-u1095ng
Intel Core i9-14900HX
20702 Points -11%
Alienware m16 R2
Intel Core Ultra 7 155H
18419 (18019.3min - 18419.5max) Points -21%
Asus TUF Gaming A17 FA707XI-NS94
AMD Ryzen 9 7940HS
17623 (17398.8min - 17622.8max) Points -24%
Single Core
Aorus 16X 2024
Intel Core i9-14900HX
2188 Points +4%
HP Omen Transcend 16-u1095ng
Intel Core i9-14900HX
2182 Points +4%
Acer Predator Helios Neo 16 (2024)
Intel Core i7-14700HX (Turbo)
2144 Points +2%
Lenovo Legion Pro 5 16IRX9
Intel Core i9-14900HX
2122 Points +1%
Acer Predator Helios Neo 16 (2024)
Intel Core i7-14700HX
2103 Points
Przeciętny Intel Core i7-14700HX
  (1702 - 2144, n=7)
2000 Points -5%
Lenovo Legion 5 16IRX G9
Intel Core i7-14650HX
1963 Points -7%
Średnia w klasie Gaming
  (1136 - 2235, n=168, ostatnie 2 lata)
1886 Points -10%
Asus TUF Gaming A17 FA707XI-NS94
AMD Ryzen 9 7940HS
1832 Points -13%
Alienware m16 R2
Intel Core Ultra 7 155H
1749 Points -17%
Cinebench R20
CPU (Multi Core)
Lenovo Legion Pro 5 16IRX9
Intel Core i9-14900HX
11319 Points +35%
Aorus 16X 2024
Intel Core i9-14900HX
10655 Points +27%
Acer Predator Helios Neo 16 (2024)
Intel Core i7-14700HX (Turbo)
9661 Points +16%
Lenovo Legion 5 16IRX G9
Intel Core i7-14650HX
9349 Points +12%
Przeciętny Intel Core i7-14700HX
  (8361 - 10498, n=7)
9231 Points +10%
HP Omen Transcend 16-u1095ng
Intel Core i9-14900HX
8427 Points +1%
Acer Predator Helios Neo 16 (2024)
Intel Core i7-14700HX
8361 Points
Średnia w klasie Gaming
  (2179 - 13832, n=168, ostatnie 2 lata)
8280 Points -1%
Alienware m16 R2
Intel Core Ultra 7 155H
7050 Points -16%
Asus TUF Gaming A17 FA707XI-NS94
AMD Ryzen 9 7940HS
6894 Points -18%
CPU (Single Core)
Aorus 16X 2024
Intel Core i9-14900HX
841 Points +5%
HP Omen Transcend 16-u1095ng
Intel Core i9-14900HX
836 Points +4%
Acer Predator Helios Neo 16 (2024)
Intel Core i7-14700HX (Turbo)
821 Points +2%
Lenovo Legion Pro 5 16IRX9
Intel Core i9-14900HX
812 Points +1%
Acer Predator Helios Neo 16 (2024)
Intel Core i7-14700HX
803 Points
Przeciętny Intel Core i7-14700HX
  (651 - 821, n=7)
765 Points -5%
Lenovo Legion 5 16IRX G9
Intel Core i7-14650HX
754 Points -6%
Średnia w klasie Gaming
  (439 - 856, n=168, ostatnie 2 lata)
725 Points -10%
Asus TUF Gaming A17 FA707XI-NS94
AMD Ryzen 9 7940HS
714 Points -11%
Alienware m16 R2
Intel Core Ultra 7 155H
674 Points -16%
Cinebench R15
CPU Multi 64Bit
Lenovo Legion Pro 5 16IRX9
Intel Core i9-14900HX
4591 (4151.1min - 4590.84max) Points +33%
Aorus 16X 2024
Intel Core i9-14900HX
4280 Points +24%
HP Omen Transcend 16-u1095ng
Intel Core i9-14900HX
3905 (2582.31min - 3904.72max) Points +13%
Acer Predator Helios Neo 16 (2024)
Intel Core i7-14700HX (Turbo)
3855 Points +12%
Lenovo Legion 5 16IRX G9
Intel Core i7-14650HX
3799 (3409.19min - 3799.39max) Points +10%
Przeciętny Intel Core i7-14700HX
  (3328 - 4137, n=7)
3752 Points +9%
Acer Predator Helios Neo 16 (2024)
Intel Core i7-14700HX
3455 Points
Średnia w klasie Gaming
  (905 - 5663, n=174, ostatnie 2 lata)
3386 Points -2%
Alienware m16 R2
Intel Core Ultra 7 155H
2840 (2743.86min - 2839.9max) Points -18%
Asus TUF Gaming A17 FA707XI-NS94
AMD Ryzen 9 7940HS
2817 (2741.98min - 2817.3max) Points -18%
CPU Single 64Bit
Aorus 16X 2024
Intel Core i9-14900HX
312 Points +6%
Acer Predator Helios Neo 16 (2024)
Intel Core i7-14700HX (Turbo)
304 Points +3%
Lenovo Legion Pro 5 16IRX9
Intel Core i9-14900HX
299 Points +2%
HP Omen Transcend 16-u1095ng
Intel Core i9-14900HX
298 Points +1%
Acer Predator Helios Neo 16 (2024)
Intel Core i7-14700HX
294 Points
Asus TUF Gaming A17 FA707XI-NS94
AMD Ryzen 9 7940HS
287 Points -2%
Lenovo Legion 5 16IRX G9
Intel Core i7-14650HX
287 Points -2%
Przeciętny Intel Core i7-14700HX
  (238 - 304, n=7)
281 Points -4%
Średnia w klasie Gaming
  (191.9 - 318, n=171, ostatnie 2 lata)
278 Points -5%
Alienware m16 R2
Intel Core Ultra 7 155H
256 Points -13%
Blender - v2.79 BMW27 CPU
Acer Predator Helios Neo 16 (2024)
Intel Core i7-14700HX (Turbo)
184 Seconds * -31%
Asus TUF Gaming A17 FA707XI-NS94
AMD Ryzen 9 7940HS
183 Seconds * -31%
Średnia w klasie Gaming
  (87 - 555, n=163, ostatnie 2 lata)
171.6 Seconds * -23%
HP Omen Transcend 16-u1095ng
Intel Core i9-14900HX
164 Seconds * -17%
Przeciętny Intel Core i7-14700HX
  (126 - 184, n=7)
148.7 Seconds * -6%
Lenovo Legion 5 16IRX G9
Intel Core i7-14650HX
141 Seconds * -1%
Acer Predator Helios Neo 16 (2024)
Intel Core i7-14700HX
140 Seconds *
Aorus 16X 2024
Intel Core i9-14900HX
126 Seconds * +10%
Lenovo Legion Pro 5 16IRX9
Intel Core i9-14900HX
113 Seconds * +19%
7-Zip 18.03
7z b 4
Lenovo Legion Pro 5 16IRX9
Intel Core i9-14900HX
115585 MIPS +24%
Aorus 16X 2024
Intel Core i9-14900HX
106866 MIPS +15%
Acer Predator Helios Neo 16 (2024)
Intel Core i7-14700HX (Turbo)
100368 MIPS +8%
Przeciętny Intel Core i7-14700HX
  (84799 - 104730, n=7)
95840 MIPS +3%
Lenovo Legion 5 16IRX G9
Intel Core i7-14650HX
93686 MIPS +1%
Acer Predator Helios Neo 16 (2024)
Intel Core i7-14700HX
93134 MIPS
HP Omen Transcend 16-u1095ng
Intel Core i9-14900HX
88012 MIPS -5%
Średnia w klasie Gaming
  (23795 - 140932, n=167, ostatnie 2 lata)
84572 MIPS -9%
Asus TUF Gaming A17 FA707XI-NS94
AMD Ryzen 9 7940HS
72749 MIPS -22%
Alienware m16 R2
Intel Core Ultra 7 155H
67581 MIPS -27%
7z b 4 -mmt1
Aorus 16X 2024
Intel Core i9-14900HX
7297 MIPS +6%
HP Omen Transcend 16-u1095ng
Intel Core i9-14900HX
7142 MIPS +4%
Acer Predator Helios Neo 16 (2024)
Intel Core i7-14700HX (Turbo)
7041 MIPS +2%
Acer Predator Helios Neo 16 (2024)
Intel Core i7-14700HX
6890 MIPS
Lenovo Legion Pro 5 16IRX9
Intel Core i9-14900HX
6776 MIPS -2%
Lenovo Legion 5 16IRX G9
Intel Core i7-14650HX
6695 MIPS -3%
Asus TUF Gaming A17 FA707XI-NS94
AMD Ryzen 9 7940HS
6642 MIPS -4%
Przeciętny Intel Core i7-14700HX
  (5641 - 7041, n=7)
6595 MIPS -4%
Średnia w klasie Gaming
  (4199 - 7581, n=167, ostatnie 2 lata)
6307 MIPS -8%
Alienware m16 R2
Intel Core Ultra 7 155H
5037 MIPS -27%
Geekbench 6.3
Multi-Core
Lenovo Legion Pro 5 16IRX9
Intel Core i9-14900HX (6.2.1)
18126 Points +5%
Acer Predator Helios Neo 16 (2024)
Intel Core i7-14700HX (6.2.1, Turbo)
17442 Points +1%
Aorus 16X 2024
Intel Core i9-14900HX (6.2.1)
17408 Points +1%
Acer Predator Helios Neo 16 (2024)
Intel Core i7-14700HX (6.2.1)
17292 Points
Przeciętny Intel Core i7-14700HX
  (14807 - 17562, n=7)
16228 Points -6%
HP Omen Transcend 16-u1095ng
Intel Core i9-14900HX (6.2.1)
16011 Points -7%
Lenovo Legion 5 16IRX G9
Intel Core i7-14650HX (6.2.1)
16010 Points -7%
Średnia w klasie Gaming
  (5340 - 19665, n=116, ostatnie 2 lata)
14190 Points -18%
Alienware m16 R2
Intel Core Ultra 7 155H (6.2.1)
12670 Points -27%
Asus TUF Gaming A17 FA707XI-NS94
AMD Ryzen 9 7940HS (6.2.1)
12447 Points -28%
Single-Core
Aorus 16X 2024
Intel Core i9-14900HX (6.2.1)
3054 Points +3%
Acer Predator Helios Neo 16 (2024)
Intel Core i7-14700HX (6.2.1)
2975 Points
Acer Predator Helios Neo 16 (2024)
Intel Core i7-14700HX (6.2.1, Turbo)
2936 Points -1%
Lenovo Legion Pro 5 16IRX9
Intel Core i9-14900HX (6.2.1)
2889 Points -3%
HP Omen Transcend 16-u1095ng
Intel Core i9-14900HX (6.2.1)
2800 Points -6%
Przeciętny Intel Core i7-14700HX
  (2378 - 2975, n=7)
2764 Points -7%
Lenovo Legion 5 16IRX G9
Intel Core i7-14650HX (6.2.1)
2761 Points -7%
Asus TUF Gaming A17 FA707XI-NS94
AMD Ryzen 9 7940HS (6.2.1)
2730 Points -8%
Średnia w klasie Gaming
  (1490 - 3129, n=116, ostatnie 2 lata)
2652 Points -11%
Alienware m16 R2
Intel Core Ultra 7 155H (6.2.1)
2383 Points -20%
Geekbench 5.5
Multi-Core
Lenovo Legion Pro 5 16IRX9
Intel Core i9-14900HX
21299 Points +17%
Aorus 16X 2024
Intel Core i9-14900HX
19607 Points +8%
Acer Predator Helios Neo 16 (2024)
Intel Core i7-14700HX (Turbo)
18645 Points +2%
Acer Predator Helios Neo 16 (2024)
Intel Core i7-14700HX
18225 Points
Przeciętny Intel Core i7-14700HX
  (15705 - 19597, n=7)
17679 Points -3%
HP Omen Transcend 16-u1095ng
Intel Core i9-14900HX
17612 Points -3%
Lenovo Legion 5 16IRX G9
Intel Core i7-14650HX
16810 Points -8%
Średnia w klasie Gaming
  (4557 - 23194, n=167, ostatnie 2 lata)
14919 Points -18%
Alienware m16 R2
Intel Core Ultra 7 155H
12328 Points -32%
Asus TUF Gaming A17 FA707XI-NS94
AMD Ryzen 9 7940HS
11399 Points -37%
Single-Core
Aorus 16X 2024
Intel Core i9-14900HX
2183 Points +2%
Acer Predator Helios Neo 16 (2024)
Intel Core i7-14700HX
2131 Points
Acer Predator Helios Neo 16 (2024)
Intel Core i7-14700HX (Turbo)
2080 Points -2%
HP Omen Transcend 16-u1095ng
Intel Core i9-14900HX
2053 Points -4%
Lenovo Legion Pro 5 16IRX9
Intel Core i9-14900HX
2046 Points -4%
Asus TUF Gaming A17 FA707XI-NS94
AMD Ryzen 9 7940HS
2014 Points -5%
Przeciętny Intel Core i7-14700HX
  (1700 - 2133, n=7)
1982 Points -7%
Lenovo Legion 5 16IRX G9
Intel Core i7-14650HX
1933 Points -9%
Średnia w klasie Gaming
  (986 - 2210, n=167, ostatnie 2 lata)
1899 Points -11%
Alienware m16 R2
Intel Core Ultra 7 155H
1741 Points -18%
HWBOT x265 Benchmark v2.2 - 4k Preset
Lenovo Legion Pro 5 16IRX9
Intel Core i9-14900HX
30.1 fps +22%
Aorus 16X 2024
Intel Core i9-14900HX
27 fps +10%
Lenovo Legion 5 16IRX G9
Intel Core i7-14650HX
25.6 fps +4%
Acer Predator Helios Neo 16 (2024)
Intel Core i7-14700HX (Turbo)
25.5 fps +4%
Przeciętny Intel Core i7-14700HX
  (22 - 27.4, n=7)
25.1 fps +2%
Acer Predator Helios Neo 16 (2024)
Intel Core i7-14700HX
24.6 fps
Średnia w klasie Gaming
  (6.72 - 38.9, n=167, ostatnie 2 lata)
23.4 fps -5%
HP Omen Transcend 16-u1095ng
Intel Core i9-14900HX
22.7 fps -8%
Asus TUF Gaming A17 FA707XI-NS94
AMD Ryzen 9 7940HS
21.8 fps -11%
Alienware m16 R2
Intel Core Ultra 7 155H
21.2 fps -14%
LibreOffice - 20 Documents To PDF
HP Omen Transcend 16-u1095ng
Intel Core i9-14900HX (6.3.4.2)
53.1 s * -25%
Alienware m16 R2
Intel Core Ultra 7 155H (6.3.4.2)
49.8 s * -17%
Asus TUF Gaming A17 FA707XI-NS94
AMD Ryzen 9 7940HS (6.3.4.2)
49.4 s * -16%
Średnia w klasie Gaming
  (19 - 96.6, n=164, ostatnie 2 lata)
47.3 s * -11%
Przeciętny Intel Core i7-14700HX
  (41.9 - 55.3, n=7)
46.5 s * -9%
Acer Predator Helios Neo 16 (2024)
Intel Core i7-14700HX (6.3.4.2, Turbo)
44.3 s * -4%
Lenovo Legion 5 16IRX G9
Intel Core i7-14650HX (6.3.4.2)
43.8 s * -3%
Acer Predator Helios Neo 16 (2024)
Intel Core i7-14700HX (6.3.4.2)
42.5 s *
Lenovo Legion Pro 5 16IRX9
Intel Core i9-14900HX (6.3.4.2)
40.7 s * +4%
Aorus 16X 2024
Intel Core i9-14900HX (6.3.4.2)
38.5 s * +9%
R Benchmark 2.5 - Overall mean
Alienware m16 R2
Intel Core Ultra 7 155H
0.487 sec * -27%
Średnia w klasie Gaming
  (0.3609 - 0.759, n=168, ostatnie 2 lata)
0.4377 sec * -15%
Asus TUF Gaming A17 FA707XI-NS94
AMD Ryzen 9 7940HS
0.4278 sec * -12%
Lenovo Legion 5 16IRX G9
Intel Core i7-14650HX
0.4195 sec * -10%
Przeciętny Intel Core i7-14700HX
  (0.3821 - 0.4896, n=7)
0.4182 sec * -9%
Acer Predator Helios Neo 16 (2024)
Intel Core i7-14700HX (Turbo)
0.3973 sec * -4%
HP Omen Transcend 16-u1095ng
Intel Core i9-14900HX
0.3955 sec * -4%
Lenovo Legion Pro 5 16IRX9
Intel Core i9-14900HX
0.3917 sec * -3%
Acer Predator Helios Neo 16 (2024)
Intel Core i7-14700HX
0.3821 sec *
Aorus 16X 2024
Intel Core i9-14900HX
0.3782 sec * +1%

* ... im mniej tym lepiej

Cinebench R10 Shading 32Bit
24016
Cinebench R10 Rendering Multiple CPUs 32Bit
68172
Cinebench R10 Rendering Single 32Bit
11767
Cinebench R11.5 CPU Single 64Bit
3.63 Points
Cinebench R11.5 CPU Multi 64Bit
10.44 Points
Cinebench R11.5 OpenGL 64Bit
191.9 fps
Cinebench R15 CPU Multi 64Bit
3455 Points
Cinebench R15 CPU Single 64Bit
294 Points
Cinebench R15 Ref. Match 64Bit
99.6 %
Cinebench R15 OpenGL 64Bit
257 fps
Cinebench R20 CPU (Single Core)
803 Points
Cinebench R20 CPU (Multi Core)
8361 Points
Cinebench R23 Multi Core
23207 Points
Cinebench R23 Single Core
2103 Points
Cinebench 2024 CPU Single Core
125.5 Points
Cinebench 2024 CPU Multi Core
1358 Points
Pomoc
Performance Rating
Lenovo Legion Pro 5 16IRX9
Intel Core i9-14900HX, NVIDIA GeForce RTX 4070 Laptop GPU
96.3 pt
Aorus 16X 2024
Intel Core i9-14900HX, NVIDIA GeForce RTX 4070 Laptop GPU
89.7 pt
Acer Predator Helios Neo 16 (2024)
Intel Core i7-14700HX, NVIDIA GeForce RTX 4070 Laptop GPU
88.3 pt
Asus TUF Gaming A17 FA707XI-NS94
AMD Ryzen 9 7940HS, NVIDIA GeForce RTX 4070 Laptop GPU
86.2 pt
Acer Predator Helios Neo 16 (2024)
Intel Core i7-14700HX, NVIDIA GeForce RTX 4070 Laptop GPU
83.7 pt
Przeciętny Intel Core i7-14700HX
 
82.1 pt
Średnia w klasie Gaming
 
80.2 pt
HP Omen Transcend 16-u1095ng
Intel Core i9-14900HX, NVIDIA GeForce RTX 4070 Laptop GPU
71.7 pt
Alienware m16 R2
Intel Core Ultra 7 155H, NVIDIA GeForce RTX 4070 Laptop GPU
67.6 pt
AIDA64 / FP32 Ray-Trace
Asus TUF Gaming A17 FA707XI-NS94
AMD Ryzen 9 7940HS, NVIDIA GeForce RTX 4070 Laptop GPU (v6.92.6600)
28889 KRay/s +34%
Lenovo Legion Pro 5 16IRX9
Intel Core i9-14900HX, NVIDIA GeForce RTX 4070 Laptop GPU (v6.92.6600)
25072 KRay/s +16%
Acer Predator Helios Neo 16 (2024)
Intel Core i7-14700HX, NVIDIA GeForce RTX 4070 Laptop GPU (v6.92.6600, Turbo)
23179 KRay/s +8%
Aorus 16X 2024
Intel Core i9-14900HX, NVIDIA GeForce RTX 4070 Laptop GPU (v6.92.6600)
23082 KRay/s +7%
Średnia w klasie Gaming
  (4986 - 60169, n=164, ostatnie 2 lata)
22202 KRay/s +3%
Acer Predator Helios Neo 16 (2024)
Intel Core i7-14700HX, NVIDIA GeForce RTX 4070 Laptop GPU (v6.92.6600)
21558 KRay/s
Przeciętny Intel Core i7-14700HX
  (16932 - 23676, n=7)
21253 KRay/s -1%
Alienware m16 R2
Intel Core Ultra 7 155H, NVIDIA GeForce RTX 4070 Laptop GPU (v6.92.6600)
18470 KRay/s -14%
HP Omen Transcend 16-u1095ng
Intel Core i9-14900HX, NVIDIA GeForce RTX 4070 Laptop GPU (v6.92.6600)
17244 KRay/s -20%
AIDA64 / FPU Julia
Lenovo Legion Pro 5 16IRX9
Intel Core i9-14900HX, NVIDIA GeForce RTX 4070 Laptop GPU (v6.92.6600)
129169 Points +20%
Asus TUF Gaming A17 FA707XI-NS94
AMD Ryzen 9 7940HS, NVIDIA GeForce RTX 4070 Laptop GPU (v6.92.6600)
123214 Points +15%
Aorus 16X 2024
Intel Core i9-14900HX, NVIDIA GeForce RTX 4070 Laptop GPU (v6.92.6600)
116836 Points +9%
Acer Predator Helios Neo 16 (2024)
Intel Core i7-14700HX, NVIDIA GeForce RTX 4070 Laptop GPU (v6.92.6600, Turbo)
114710 Points +7%
Przeciętny Intel Core i7-14700HX
  (86338 - 116556, n=7)
107655 Points 0%
Acer Predator Helios Neo 16 (2024)
Intel Core i7-14700HX, NVIDIA GeForce RTX 4070 Laptop GPU (v6.92.6600)
107531 Points
Średnia w klasie Gaming
  (25360 - 252486, n=164, ostatnie 2 lata)
107331 Points 0%
Alienware m16 R2
Intel Core Ultra 7 155H, NVIDIA GeForce RTX 4070 Laptop GPU (v6.92.6600)
92996 Points -14%
HP Omen Transcend 16-u1095ng
Intel Core i9-14900HX, NVIDIA GeForce RTX 4070 Laptop GPU (v6.92.6600)
88537 Points -18%
AIDA64 / CPU SHA3
Lenovo Legion Pro 5 16IRX9
Intel Core i9-14900HX, NVIDIA GeForce RTX 4070 Laptop GPU (v6.92.6600)
6285 MB/s +24%
Aorus 16X 2024
Intel Core i9-14900HX, NVIDIA GeForce RTX 4070 Laptop GPU (v6.92.6600)
5723 MB/s +13%
Acer Predator Helios Neo 16 (2024)
Intel Core i7-14700HX, NVIDIA GeForce RTX 4070 Laptop GPU (v6.92.6600, Turbo)
5411 MB/s +7%
Asus TUF Gaming A17 FA707XI-NS94
AMD Ryzen 9 7940HS, NVIDIA GeForce RTX 4070 Laptop GPU (v6.92.6600)
5119 MB/s +1%
Przeciętny Intel Core i7-14700HX
  (4008 - 5567, n=7)
5065 MB/s 0%
Acer Predator Helios Neo 16 (2024)
Intel Core i7-14700HX, NVIDIA GeForce RTX 4070 Laptop GPU (v6.92.6600)
5056 MB/s
Średnia w klasie Gaming
  (1339 - 10389, n=164, ostatnie 2 lata)
4898 MB/s -3%
HP Omen Transcend 16-u1095ng
Intel Core i9-14900HX, NVIDIA GeForce RTX 4070 Laptop GPU (v6.92.6600)
4267 MB/s -16%
Alienware m16 R2
Intel Core Ultra 7 155H, NVIDIA GeForce RTX 4070 Laptop GPU (v6.92.6600)
4242 MB/s -16%
AIDA64 / CPU Queen
Acer Predator Helios Neo 16 (2024)
Intel Core i7-14700HX, NVIDIA GeForce RTX 4070 Laptop GPU (v6.92.6600)
150835 Points
Acer Predator Helios Neo 16 (2024)
Intel Core i7-14700HX, NVIDIA GeForce RTX 4070 Laptop GPU (v6.92.6600, Turbo)
150500 Points 0%
Lenovo Legion Pro 5 16IRX9
Intel Core i9-14900HX, NVIDIA GeForce RTX 4070 Laptop GPU (v6.92.6600)
142503 Points -6%
Przeciętny Intel Core i7-14700HX
  (129836 - 152200, n=7)
141316 Points -6%
Aorus 16X 2024
Intel Core i9-14900HX, NVIDIA GeForce RTX 4070 Laptop GPU (v6.92.6600)
139355 Points -8%
Asus TUF Gaming A17 FA707XI-NS94
AMD Ryzen 9 7940HS, NVIDIA GeForce RTX 4070 Laptop GPU (v6.92.6600)
121191 Points -20%
HP Omen Transcend 16-u1095ng
Intel Core i9-14900HX, NVIDIA GeForce RTX 4070 Laptop GPU (v6.92.6600)
118405 Points -22%
Średnia w klasie Gaming
  (50699 - 200651, n=164, ostatnie 2 lata)
116667 Points -23%
Alienware m16 R2
Intel Core Ultra 7 155H, NVIDIA GeForce RTX 4070 Laptop GPU (v6.92.6600)
84180 Points -44%
AIDA64 / FPU SinJulia
Asus TUF Gaming A17 FA707XI-NS94
AMD Ryzen 9 7940HS, NVIDIA GeForce RTX 4070 Laptop GPU (v6.92.6600)
15511 Points +14%
Lenovo Legion Pro 5 16IRX9
Intel Core i9-14900HX, NVIDIA GeForce RTX 4070 Laptop GPU (v6.92.6600)
15401 Points +13%
Aorus 16X 2024
Intel Core i9-14900HX, NVIDIA GeForce RTX 4070 Laptop GPU (v6.92.6600)
14830 Points +9%
Acer Predator Helios Neo 16 (2024)
Intel Core i7-14700HX, NVIDIA GeForce RTX 4070 Laptop GPU (v6.92.6600, Turbo)
13868 Points +2%
Acer Predator Helios Neo 16 (2024)
Intel Core i7-14700HX, NVIDIA GeForce RTX 4070 Laptop GPU (v6.92.6600)
13605 Points
Średnia w klasie Gaming
  (4800 - 32988, n=164, ostatnie 2 lata)
13355 Points -2%
Przeciętny Intel Core i7-14700HX
  (11704 - 14434, n=7)
13322 Points -2%
HP Omen Transcend 16-u1095ng
Intel Core i9-14900HX, NVIDIA GeForce RTX 4070 Laptop GPU (v6.92.6600)
12217 Points -10%
Alienware m16 R2
Intel Core Ultra 7 155H, NVIDIA GeForce RTX 4070 Laptop GPU (v6.92.6600)
10617 Points -22%
AIDA64 / FPU Mandel
Asus TUF Gaming A17 FA707XI-NS94
AMD Ryzen 9 7940HS, NVIDIA GeForce RTX 4070 Laptop GPU (v6.92.6600)
66238 Points +22%
Lenovo Legion Pro 5 16IRX9
Intel Core i9-14900HX, NVIDIA GeForce RTX 4070 Laptop GPU (v6.92.6600)
62567 Points +15%
Acer Predator Helios Neo 16 (2024)
Intel Core i7-14700HX, NVIDIA GeForce RTX 4070 Laptop GPU (v6.92.6600, Turbo)
57996 Points +7%
Aorus 16X 2024
Intel Core i9-14900HX, NVIDIA GeForce RTX 4070 Laptop GPU (v6.92.6600)
57633 Points +6%
Acer Predator Helios Neo 16 (2024)
Intel Core i7-14700HX, NVIDIA GeForce RTX 4070 Laptop GPU (v6.92.6600)
54174 Points
Średnia w klasie Gaming
  (12321 - 134044, n=164, ostatnie 2 lata)
54142 Points 0%
Przeciętny Intel Core i7-14700HX
  (42125 - 58380, n=7)
52861 Points -2%
Alienware m16 R2
Intel Core Ultra 7 155H, NVIDIA GeForce RTX 4070 Laptop GPU (v6.92.6600)
47685 Points -12%
HP Omen Transcend 16-u1095ng
Intel Core i9-14900HX, NVIDIA GeForce RTX 4070 Laptop GPU (v6.92.6600)
43302 Points -20%
AIDA64 / CPU AES
Lenovo Legion Pro 5 16IRX9
Intel Core i9-14900HX, NVIDIA GeForce RTX 4070 Laptop GPU (v6.92.6600)
120213 MB/s +22%
Aorus 16X 2024
Intel Core i9-14900HX, NVIDIA GeForce RTX 4070 Laptop GPU (v6.92.6600)
112833 MB/s +15%
Acer Predator Helios Neo 16 (2024)
Intel Core i7-14700HX, NVIDIA GeForce RTX 4070 Laptop GPU (v6.92.6600, Turbo)
108043 MB/s +10%
Średnia w klasie Gaming
  (19065 - 328679, n=164, ostatnie 2 lata)
107856 MB/s +10%
Przeciętny Intel Core i7-14700HX
  (82161 - 113157, n=7)
101130 MB/s +3%
Acer Predator Helios Neo 16 (2024)
Intel Core i7-14700HX, NVIDIA GeForce RTX 4070 Laptop GPU (v6.92.6600)
98391 MB/s
Asus TUF Gaming A17 FA707XI-NS94
AMD Ryzen 9 7940HS, NVIDIA GeForce RTX 4070 Laptop GPU (v6.92.6600)
91719 MB/s -7%
HP Omen Transcend 16-u1095ng
Intel Core i9-14900HX, NVIDIA GeForce RTX 4070 Laptop GPU (v6.92.6600)
86964 MB/s -12%
Alienware m16 R2
Intel Core Ultra 7 155H, NVIDIA GeForce RTX 4070 Laptop GPU (v6.92.6600)
82757 MB/s -16%
AIDA64 / CPU ZLib
Lenovo Legion Pro 5 16IRX9
Intel Core i9-14900HX, NVIDIA GeForce RTX 4070 Laptop GPU (v6.92.6600)
1866 MB/s +25%
Aorus 16X 2024
Intel Core i9-14900HX, NVIDIA GeForce RTX 4070 Laptop GPU (v6.92.6600)
1662 MB/s +11%
Acer Predator Helios Neo 16 (2024)
Intel Core i7-14700HX, NVIDIA GeForce RTX 4070 Laptop GPU (v6.92.6600, Turbo)
1568 MB/s +5%
Przeciętny Intel Core i7-14700HX
  (1177 - 1682, n=7)
1502 MB/s +1%
Acer Predator Helios Neo 16 (2024)
Intel Core i7-14700HX, NVIDIA GeForce RTX 4070 Laptop GPU (v6.92.6600)
1494 MB/s
Średnia w klasie Gaming
  (373 - 2409, n=164, ostatnie 2 lata)
1354 MB/s -9%
HP Omen Transcend 16-u1095ng
Intel Core i9-14900HX, NVIDIA GeForce RTX 4070 Laptop GPU (v6.92.6600)
1265 MB/s -15%
Alienware m16 R2
Intel Core Ultra 7 155H, NVIDIA GeForce RTX 4070 Laptop GPU (v6.92.6600)
1219 MB/s -18%
Asus TUF Gaming A17 FA707XI-NS94
AMD Ryzen 9 7940HS, NVIDIA GeForce RTX 4070 Laptop GPU (v6.92.6600)
1152 MB/s -23%
AIDA64 / FP64 Ray-Trace
Asus TUF Gaming A17 FA707XI-NS94
AMD Ryzen 9 7940HS, NVIDIA GeForce RTX 4070 Laptop GPU (v6.92.6600)
15675 KRay/s +37%
Lenovo Legion Pro 5 16IRX9
Intel Core i9-14900HX, NVIDIA GeForce RTX 4070 Laptop GPU (v6.92.6600)
13776 KRay/s +20%
Acer Predator Helios Neo 16 (2024)
Intel Core i7-14700HX, NVIDIA GeForce RTX 4070 Laptop GPU (v6.92.6600, Turbo)
12676 KRay/s +11%
Aorus 16X 2024
Intel Core i9-14900HX, NVIDIA GeForce RTX 4070 Laptop GPU (v6.92.6600)
12355 KRay/s +8%
Średnia w klasie Gaming
  (2540 - 31796, n=164, ostatnie 2 lata)
11948 KRay/s +4%
Acer Predator Helios Neo 16 (2024)
Intel Core i7-14700HX, NVIDIA GeForce RTX 4070 Laptop GPU (v6.92.6600)
11438 KRay/s
Przeciętny Intel Core i7-14700HX
  (9029 - 12928, n=7)
11393 KRay/s 0%
Alienware m16 R2
Intel Core Ultra 7 155H, NVIDIA GeForce RTX 4070 Laptop GPU (v6.92.6600)
9802 KRay/s -14%
HP Omen Transcend 16-u1095ng
Intel Core i9-14900HX, NVIDIA GeForce RTX 4070 Laptop GPU (v6.92.6600)
9170 KRay/s -20%
AIDA64 / CPU PhotoWorxx
Lenovo Legion Pro 5 16IRX9
Intel Core i9-14900HX, NVIDIA GeForce RTX 4070 Laptop GPU (v6.92.6600)
49676 MPixel/s +7%
HP Omen Transcend 16-u1095ng
Intel Core i9-14900HX, NVIDIA GeForce RTX 4070 Laptop GPU (v6.92.6600)
49507 MPixel/s +6%
Aorus 16X 2024
Intel Core i9-14900HX, NVIDIA GeForce RTX 4070 Laptop GPU (v6.92.6600)
49217 MPixel/s +6%
Acer Predator Helios Neo 16 (2024)
Intel Core i7-14700HX, NVIDIA GeForce RTX 4070 Laptop GPU (v6.92.6600, Turbo)
47993 MPixel/s +3%
Acer Predator Helios Neo 16 (2024)
Intel Core i7-14700HX, NVIDIA GeForce RTX 4070 Laptop GPU (v6.92.6600)
46636 MPixel/s
Przeciętny Intel Core i7-14700HX
  (39151 - 49671, n=7)
43200 MPixel/s -7%
Średnia w klasie Gaming
  (10805 - 60161, n=164, ostatnie 2 lata)
40174 MPixel/s -14%
Alienware m16 R2
Intel Core Ultra 7 155H, NVIDIA GeForce RTX 4070 Laptop GPU (v6.92.6600)
39532 MPixel/s -15%
Asus TUF Gaming A17 FA707XI-NS94
AMD Ryzen 9 7940HS, NVIDIA GeForce RTX 4070 Laptop GPU (v6.92.6600)
33407 MPixel/s -28%

Wydajność systemu

System, który został zaprojektowany z myślą o energochłonnych obszarach zastosowań, takich jak renderowanie, strumieniowanie i gry, działa szybko i płynnie. Pamięć robocza zapewnia szybkość transferu na normalnym poziomie dla pamięci RAM DDR5-5600.

Pamięć robocza działa w trybie dwukanałowym.
PCMark 10 / Score
Lenovo Legion Pro 5 16IRX9
NVIDIA GeForce RTX 4070 Laptop GPU, i9-14900HX, Samsung PM9A1 MZVL21T0HCLR
8550 Points +3%
Przeciętny Intel Core i7-14700HX, NVIDIA GeForce RTX 4070 Laptop GPU
  (8302 - 8512, n=2)
8407 Points +1%
Aorus 16X 2024
NVIDIA GeForce RTX 4070 Laptop GPU, i9-14900HX, Gigabyte AG450E1024-SI
8389 Points +1%
Acer Predator Helios Neo 16 (2024)
NVIDIA GeForce RTX 4070 Laptop GPU, i7-14700HX, Samsung PM9A1a MZVL21T0HDLU
8302 Points
Asus TUF Gaming A17 FA707XI-NS94
NVIDIA GeForce RTX 4070 Laptop GPU, R9 7940HS, WD PC SN560 SDDPNQE-1T00
8092 Points -3%
HP Omen Transcend 16-u1095ng
NVIDIA GeForce RTX 4070 Laptop GPU, i9-14900HX, Kioxia XG8 KXG80ZNV1T02
7866 Points -5%
Średnia w klasie Gaming
  (5776 - 9852, n=151, ostatnie 2 lata)
7828 Points -6%
Alienware m16 R2
NVIDIA GeForce RTX 4070 Laptop GPU, Ultra 7 155H, Samsung PM9A1 MZVL21T0HCLR
7761 Points -7%
PCMark 10 / Essentials
Acer Predator Helios Neo 16 (2024)
NVIDIA GeForce RTX 4070 Laptop GPU, i7-14700HX, Samsung PM9A1a MZVL21T0HDLU
11708 Points
Przeciętny Intel Core i7-14700HX, NVIDIA GeForce RTX 4070 Laptop GPU
  (10939 - 11708, n=2)
11324 Points -3%
Lenovo Legion Pro 5 16IRX9
NVIDIA GeForce RTX 4070 Laptop GPU, i9-14900HX, Samsung PM9A1 MZVL21T0HCLR
11286 Points -4%
Aorus 16X 2024
NVIDIA GeForce RTX 4070 Laptop GPU, i9-14900HX, Gigabyte AG450E1024-SI
11071 Points -5%
Asus TUF Gaming A17 FA707XI-NS94
NVIDIA GeForce RTX 4070 Laptop GPU, R9 7940HS, WD PC SN560 SDDPNQE-1T00
10896 Points -7%
Średnia w klasie Gaming
  (9057 - 12600, n=151, ostatnie 2 lata)
10807 Points -8%
HP Omen Transcend 16-u1095ng
NVIDIA GeForce RTX 4070 Laptop GPU, i9-14900HX, Kioxia XG8 KXG80ZNV1T02
10621 Points -9%
Alienware m16 R2
NVIDIA GeForce RTX 4070 Laptop GPU, Ultra 7 155H, Samsung PM9A1 MZVL21T0HCLR
10330 Points -12%
PCMark 10 / Productivity
Aorus 16X 2024
NVIDIA GeForce RTX 4070 Laptop GPU, i9-14900HX, Gigabyte AG450E1024-SI
11103 Points +8%
Przeciętny Intel Core i7-14700HX, NVIDIA GeForce RTX 4070 Laptop GPU
  (10273 - 10925, n=2)
10599 Points +3%
Acer Predator Helios Neo 16 (2024)
NVIDIA GeForce RTX 4070 Laptop GPU, i7-14700HX, Samsung PM9A1a MZVL21T0HDLU
10273 Points
HP Omen Transcend 16-u1095ng
NVIDIA GeForce RTX 4070 Laptop GPU, i9-14900HX, Kioxia XG8 KXG80ZNV1T02
10268 Points 0%
Lenovo Legion Pro 5 16IRX9
NVIDIA GeForce RTX 4070 Laptop GPU, i9-14900HX, Samsung PM9A1 MZVL21T0HCLR
10139 Points -1%
Średnia w klasie Gaming
  (6662 - 14612, n=151, ostatnie 2 lata)
9942 Points -3%
Asus TUF Gaming A17 FA707XI-NS94
NVIDIA GeForce RTX 4070 Laptop GPU, R9 7940HS, WD PC SN560 SDDPNQE-1T00
9693 Points -6%
Alienware m16 R2
NVIDIA GeForce RTX 4070 Laptop GPU, Ultra 7 155H, Samsung PM9A1 MZVL21T0HCLR
9422 Points -8%
PCMark 10 / Digital Content Creation
Lenovo Legion Pro 5 16IRX9
NVIDIA GeForce RTX 4070 Laptop GPU, i9-14900HX, Samsung PM9A1 MZVL21T0HCLR
14827 Points +15%
Asus TUF Gaming A17 FA707XI-NS94
NVIDIA GeForce RTX 4070 Laptop GPU, R9 7940HS, WD PC SN560 SDDPNQE-1T00
13618 Points +5%
Przeciętny Intel Core i7-14700HX, NVIDIA GeForce RTX 4070 Laptop GPU
  (12909 - 14003, n=2)
13456 Points +4%
Aorus 16X 2024
NVIDIA GeForce RTX 4070 Laptop GPU, i9-14900HX, Gigabyte AG450E1024-SI
13036 Points +1%
Alienware m16 R2
NVIDIA GeForce RTX 4070 Laptop GPU, Ultra 7 155H, Samsung PM9A1 MZVL21T0HCLR
13035 Points +1%
Acer Predator Helios Neo 16 (2024)
NVIDIA GeForce RTX 4070 Laptop GPU, i7-14700HX, Samsung PM9A1a MZVL21T0HDLU
12909 Points
Średnia w klasie Gaming
  (6807 - 18475, n=151, ostatnie 2 lata)
12251 Points -5%
HP Omen Transcend 16-u1095ng
NVIDIA GeForce RTX 4070 Laptop GPU, i9-14900HX, Kioxia XG8 KXG80ZNV1T02
12114 Points -6%
CrossMark / Overall
Aorus 16X 2024
NVIDIA GeForce RTX 4070 Laptop GPU, i9-14900HX, Gigabyte AG450E1024-SI
2312 Points +3%
Acer Predator Helios Neo 16 (2024)
NVIDIA GeForce RTX 4070 Laptop GPU, i7-14700HX, Samsung PM9A1a MZVL21T0HDLU
2235 Points
Przeciętny Intel Core i7-14700HX, NVIDIA GeForce RTX 4070 Laptop GPU
  (2138 - 2235, n=2)
2187 Points -2%
Lenovo Legion Pro 5 16IRX9
NVIDIA GeForce RTX 4070 Laptop GPU, i9-14900HX, Samsung PM9A1 MZVL21T0HCLR
2002 Points -10%
Średnia w klasie Gaming
  (1247 - 2344, n=131, ostatnie 2 lata)
1911 Points -14%
Asus TUF Gaming A17 FA707XI-NS94
NVIDIA GeForce RTX 4070 Laptop GPU, R9 7940HS, WD PC SN560 SDDPNQE-1T00
1797 Points -20%
Alienware m16 R2
NVIDIA GeForce RTX 4070 Laptop GPU, Ultra 7 155H, Samsung PM9A1 MZVL21T0HCLR
1762 Points -21%
CrossMark / Productivity
Aorus 16X 2024
NVIDIA GeForce RTX 4070 Laptop GPU, i9-14900HX, Gigabyte AG450E1024-SI
2191 Points +5%
Acer Predator Helios Neo 16 (2024)
NVIDIA GeForce RTX 4070 Laptop GPU, i7-14700HX, Samsung PM9A1a MZVL21T0HDLU
2093 Points
Przeciętny Intel Core i7-14700HX, NVIDIA GeForce RTX 4070 Laptop GPU
  (2035 - 2093, n=2)
2064 Points -1%
Lenovo Legion Pro 5 16IRX9
NVIDIA GeForce RTX 4070 Laptop GPU, i9-14900HX, Samsung PM9A1 MZVL21T0HCLR
1827 Points -13%
Średnia w klasie Gaming
  (1299 - 2204, n=131, ostatnie 2 lata)
1811 Points -13%
Asus TUF Gaming A17 FA707XI-NS94
NVIDIA GeForce RTX 4070 Laptop GPU, R9 7940HS, WD PC SN560 SDDPNQE-1T00
1740 Points -17%
Alienware m16 R2
NVIDIA GeForce RTX 4070 Laptop GPU, Ultra 7 155H, Samsung PM9A1 MZVL21T0HCLR
1684 Points -20%
CrossMark / Creativity
Aorus 16X 2024
NVIDIA GeForce RTX 4070 Laptop GPU, i9-14900HX, Gigabyte AG450E1024-SI
2458 Points 0%
Acer Predator Helios Neo 16 (2024)
NVIDIA GeForce RTX 4070 Laptop GPU, i7-14700HX, Samsung PM9A1a MZVL21T0HDLU
2455 Points
Przeciętny Intel Core i7-14700HX, NVIDIA GeForce RTX 4070 Laptop GPU
  (2311 - 2455, n=2)
2383 Points -3%
Lenovo Legion Pro 5 16IRX9
NVIDIA GeForce RTX 4070 Laptop GPU, i9-14900HX, Samsung PM9A1 MZVL21T0HCLR
2287 Points -7%
Średnia w klasie Gaming
  (1275 - 2660, n=131, ostatnie 2 lata)
2098 Points -15%
Asus TUF Gaming A17 FA707XI-NS94
NVIDIA GeForce RTX 4070 Laptop GPU, R9 7940HS, WD PC SN560 SDDPNQE-1T00
1979 Points -19%
Alienware m16 R2
NVIDIA GeForce RTX 4070 Laptop GPU, Ultra 7 155H, Samsung PM9A1 MZVL21T0HCLR
1913 Points -22%
CrossMark / Responsiveness
Aorus 16X 2024
NVIDIA GeForce RTX 4070 Laptop GPU, i9-14900HX, Gigabyte AG450E1024-SI
2259 Points +10%
Acer Predator Helios Neo 16 (2024)
NVIDIA GeForce RTX 4070 Laptop GPU, i7-14700HX, Samsung PM9A1a MZVL21T0HDLU
2053 Points
Przeciętny Intel Core i7-14700HX, NVIDIA GeForce RTX 4070 Laptop GPU
  (1960 - 2053, n=2)
2007 Points -2%
Lenovo Legion Pro 5 16IRX9
NVIDIA GeForce RTX 4070 Laptop GPU, i9-14900HX, Samsung PM9A1 MZVL21T0HCLR
1769 Points -14%
Średnia w klasie Gaming
  (1030 - 2330, n=131, ostatnie 2 lata)
1708 Points -17%
Alienware m16 R2
NVIDIA GeForce RTX 4070 Laptop GPU, Ultra 7 155H, Samsung PM9A1 MZVL21T0HCLR
1576 Points -23%
Asus TUF Gaming A17 FA707XI-NS94
NVIDIA GeForce RTX 4070 Laptop GPU, R9 7940HS, WD PC SN560 SDDPNQE-1T00
1478 Points -28%
WebXPRT 3 / Overall
HP Omen Transcend 16-u1095ng
NVIDIA GeForce RTX 4070 Laptop GPU, i9-14900HX, Kioxia XG8 KXG80ZNV1T02
342 Points +6%
Aorus 16X 2024
NVIDIA GeForce RTX 4070 Laptop GPU, i9-14900HX, Gigabyte AG450E1024-SI
330 Points +2%
Acer Predator Helios Neo 16 (2024)
NVIDIA GeForce RTX 4070 Laptop GPU, i7-14700HX, Samsung PM9A1a MZVL21T0HDLU
323 Points
Lenovo Legion Pro 5 16IRX9
NVIDIA GeForce RTX 4070 Laptop GPU, i9-14900HX, Samsung PM9A1 MZVL21T0HCLR
322 Points 0%
Asus TUF Gaming A17 FA707XI-NS94
NVIDIA GeForce RTX 4070 Laptop GPU, R9 7940HS, WD PC SN560 SDDPNQE-1T00
319 Points -1%
Przeciętny Intel Core i7-14700HX, NVIDIA GeForce RTX 4070 Laptop GPU
  (302 - 323, n=2)
313 Points -3%
Średnia w klasie Gaming
  (215 - 480, n=142, ostatnie 2 lata)
303 Points -6%
Alienware m16 R2
NVIDIA GeForce RTX 4070 Laptop GPU, Ultra 7 155H, Samsung PM9A1 MZVL21T0HCLR
294 Points -9%
WebXPRT 4 / Overall
Acer Predator Helios Neo 16 (2024)
NVIDIA GeForce RTX 4070 Laptop GPU, i7-14700HX, Samsung PM9A1a MZVL21T0HDLU
307 Points
Lenovo Legion Pro 5 16IRX9
NVIDIA GeForce RTX 4070 Laptop GPU, i9-14900HX, Samsung PM9A1 MZVL21T0HCLR
291 Points -5%
Przeciętny Intel Core i7-14700HX, NVIDIA GeForce RTX 4070 Laptop GPU
  (274 - 307, n=2)
291 Points -5%
Asus TUF Gaming A17 FA707XI-NS94
NVIDIA GeForce RTX 4070 Laptop GPU, R9 7940HS, WD PC SN560 SDDPNQE-1T00
271 Points -12%
Średnia w klasie Gaming
  (176.4 - 328, n=131, ostatnie 2 lata)
266 Points -13%
Alienware m16 R2
NVIDIA GeForce RTX 4070 Laptop GPU, Ultra 7 155H, Samsung PM9A1 MZVL21T0HCLR
257 Points -16%
Mozilla Kraken 1.1 / Total
Alienware m16 R2
NVIDIA GeForce RTX 4070 Laptop GPU, Ultra 7 155H, Samsung PM9A1 MZVL21T0HCLR
546 ms * -22%
Średnia w klasie Gaming
  (421 - 674, n=156, ostatnie 2 lata)
503 ms * -13%
Asus TUF Gaming A17 FA707XI-NS94
NVIDIA GeForce RTX 4070 Laptop GPU, R9 7940HS, WD PC SN560 SDDPNQE-1T00
481 ms * -8%
Lenovo Legion Pro 5 16IRX9
NVIDIA GeForce RTX 4070 Laptop GPU, i9-14900HX, Samsung PM9A1 MZVL21T0HCLR
449 ms * -0%
Przeciętny Intel Core i7-14700HX, NVIDIA GeForce RTX 4070 Laptop GPU
  (447 - 449, n=3)
448 ms * -0%
Acer Predator Helios Neo 16 (2024)
NVIDIA GeForce RTX 4070 Laptop GPU, i7-14700HX, Samsung PM9A1a MZVL21T0HDLU
447 ms *
HP Omen Transcend 16-u1095ng
NVIDIA GeForce RTX 4070 Laptop GPU, i9-14900HX, Kioxia XG8 KXG80ZNV1T02
438 ms * +2%
Aorus 16X 2024
NVIDIA GeForce RTX 4070 Laptop GPU, i9-14900HX, Gigabyte AG450E1024-SI
436 ms * +2%

* ... im mniej tym lepiej

PCMark 10 Score
8302 pkt.
Pomoc
AIDA64 / Memory Copy
Lenovo Legion Pro 5 16IRX9
Intel Core i9-14900HX, NVIDIA GeForce RTX 4070 Laptop GPU
78979 MB/s +4%
Aorus 16X 2024
Intel Core i9-14900HX, NVIDIA GeForce RTX 4070 Laptop GPU
78854 MB/s +4%
HP Omen Transcend 16-u1095ng
Intel Core i9-14900HX, NVIDIA GeForce RTX 4070 Laptop GPU
78330 MB/s +3%
Acer Predator Helios Neo 16 (2024)
Intel Core i7-14700HX, NVIDIA GeForce RTX 4070 Laptop GPU
75827 MB/s
Przeciętny Intel Core i7-14700HX
  (63949 - 78742, n=7)
71165 MB/s -6%
Średnia w klasie Gaming
  (21842 - 94222, n=164, ostatnie 2 lata)
65857 MB/s -13%
Alienware m16 R2
Intel Core Ultra 7 155H, NVIDIA GeForce RTX 4070 Laptop GPU
63008 MB/s -17%
Asus TUF Gaming A17 FA707XI-NS94
AMD Ryzen 9 7940HS, NVIDIA GeForce RTX 4070 Laptop GPU
59740 MB/s -21%
AIDA64 / Memory Read
Aorus 16X 2024
Intel Core i9-14900HX, NVIDIA GeForce RTX 4070 Laptop GPU
86538 MB/s +4%
Lenovo Legion Pro 5 16IRX9
Intel Core i9-14900HX, NVIDIA GeForce RTX 4070 Laptop GPU
86376 MB/s +4%
HP Omen Transcend 16-u1095ng
Intel Core i9-14900HX, NVIDIA GeForce RTX 4070 Laptop GPU
85070 MB/s +2%
Acer Predator Helios Neo 16 (2024)
Intel Core i7-14700HX, NVIDIA GeForce RTX 4070 Laptop GPU
83034 MB/s
Przeciętny Intel Core i7-14700HX
  (68593 - 86175, n=7)
81347 MB/s -2%
Alienware m16 R2
Intel Core Ultra 7 155H, NVIDIA GeForce RTX 4070 Laptop GPU
76370 MB/s -8%
Średnia w klasie Gaming
  (23681 - 99713, n=164, ostatnie 2 lata)
69568 MB/s -16%
Asus TUF Gaming A17 FA707XI-NS94
AMD Ryzen 9 7940HS, NVIDIA GeForce RTX 4070 Laptop GPU
61456 MB/s -26%
AIDA64 / Memory Write
HP Omen Transcend 16-u1095ng
Intel Core i9-14900HX, NVIDIA GeForce RTX 4070 Laptop GPU
77579 MB/s +11%
Aorus 16X 2024
Intel Core i9-14900HX, NVIDIA GeForce RTX 4070 Laptop GPU
77406 MB/s +11%
Lenovo Legion Pro 5 16IRX9
Intel Core i9-14900HX, NVIDIA GeForce RTX 4070 Laptop GPU
77346 MB/s +10%
Asus TUF Gaming A17 FA707XI-NS94
AMD Ryzen 9 7940HS, NVIDIA GeForce RTX 4070 Laptop GPU
72700 MB/s +4%
Acer Predator Helios Neo 16 (2024)
Intel Core i7-14700HX, NVIDIA GeForce RTX 4070 Laptop GPU
70034 MB/s
Przeciętny Intel Core i7-14700HX
  (64033 - 76689, n=7)
68661 MB/s -2%
Średnia w klasie Gaming
  (22986 - 108954, n=164, ostatnie 2 lata)
68012 MB/s -3%
Alienware m16 R2
Intel Core Ultra 7 155H, NVIDIA GeForce RTX 4070 Laptop GPU
66009 MB/s -6%
AIDA64 / Memory Latency
Alienware m16 R2
Intel Core Ultra 7 155H, NVIDIA GeForce RTX 4070 Laptop GPU
126.2 ns * -39%
Średnia w klasie Gaming
  (59.5 - 259, n=164, ostatnie 2 lata)
94.7 ns * -4%
Asus TUF Gaming A17 FA707XI-NS94
AMD Ryzen 9 7940HS, NVIDIA GeForce RTX 4070 Laptop GPU
91.8 ns * -1%
Acer Predator Helios Neo 16 (2024)
Intel Core i7-14700HX, NVIDIA GeForce RTX 4070 Laptop GPU
91.1 ns *
Przeciętny Intel Core i7-14700HX
  (82.7 - 96.4, n=7)
89.3 ns * +2%
HP Omen Transcend 16-u1095ng
Intel Core i9-14900HX, NVIDIA GeForce RTX 4070 Laptop GPU
86.5 ns * +5%
Lenovo Legion Pro 5 16IRX9
Intel Core i9-14900HX, NVIDIA GeForce RTX 4070 Laptop GPU
83.4 ns * +8%
Aorus 16X 2024
Intel Core i9-14900HX, NVIDIA GeForce RTX 4070 Laptop GPU
82.5 ns * +9%

* ... im mniej tym lepiej

Opóźnienia DPC

System nie wydaje się być przystosowany do przetwarzania wideo i audio w czasie rzeczywistym, a Latency Monitor ujawnił pewne rzucające się w oczy zachowanie podczas naszego testu (surfowanie po Internecie, odtwarzanie wideo 4k, wysokie obciążenie Prime95). Przyszłe aktualizacje oprogramowania mogą przynieść pewną poprawę lub nawet pogorszenie opóźnień.

Monitor opóźnienia
Monitor opóźnienia
Monitor opóźnienia
Monitor opóźnienia
DPC Latencies / LatencyMon - interrupt to process latency (max), Web, Youtube, Prime95
Alienware m16 R2
NVIDIA GeForce RTX 4070 Laptop GPU, Ultra 7 155H, Samsung PM9A1 MZVL21T0HCLR
2037.7 μs * -40%
Asus TUF Gaming A17 FA707XI-NS94
NVIDIA GeForce RTX 4070 Laptop GPU, R9 7940HS, WD PC SN560 SDDPNQE-1T00
1776.4 μs * -22%
HP Omen Transcend 16-u1095ng
NVIDIA GeForce RTX 4070 Laptop GPU, i9-14900HX, Kioxia XG8 KXG80ZNV1T02
1566 μs * -8%
Acer Predator Helios Neo 16 (2024)
NVIDIA GeForce RTX 4070 Laptop GPU, i7-14700HX, Samsung PM9A1a MZVL21T0HDLU
1451.9 μs *
Aorus 16X 2024
NVIDIA GeForce RTX 4070 Laptop GPU, i9-14900HX, Gigabyte AG450E1024-SI
1162.9 μs * +20%
Lenovo Legion Pro 5 16IRX9
NVIDIA GeForce RTX 4070 Laptop GPU, i9-14900HX, Samsung PM9A1 MZVL21T0HCLR
989.1 μs * +32%

* ... im mniej tym lepiej

Rozwiązanie pamięci masowej

Acer wyposażył naszą jednostkę testową w dysk SSD Samsung (1 TB, PCIe 4, M.2 2280), który zapewnia doskonałą szybkość transmisji danych. Pozytywne jest również to, że podczas naszych testów nie wystąpił throttling termiczny. Predator jest w stanie przyjąć łącznie dwa dyski SSD.

Pomiary wszystkich dysków SSD i HDD, które testowaliśmy do tej pory, znajdą Państwo na naszej liście przeglądowej

.</i>
Dysk SSD PCIe 4 służy jako dysk systemowy.
Jest też gniazdo na drugi dysk SSD.
Samsung PM9A1a MZVL21T0HDLU
CDM 5/6 Read Seq Q32T1: 7089 MB/s
CDM 5/6 Write Seq Q32T1: 5225 MB/s
CDM 5/6 Read 4K Q32T1: 708 MB/s
CDM 5/6 Write 4K Q32T1: 539.7 MB/s
CDM 5 Read Seq: 4328 MB/s
CDM 5 Write Seq: 4519 MB/s
CDM 5/6 Read 4K: 94.81 MB/s
CDM 5/6 Write 4K: 264 MB/s
Drive Performance Rating - Percent
Acer Predator Helios Neo 16 (2024)
Samsung PM9A1a MZVL21T0HDLU
93.3 pt
Lenovo Legion Pro 5 16IRX9
Samsung PM9A1 MZVL21T0HCLR
85.3 pt
Aorus 16X 2024
Gigabyte AG450E1024-SI
82.2 pt
Alienware m16 R2
Samsung PM9A1 MZVL21T0HCLR
81.5 pt
Średnia w klasie Gaming
 
71.2 pt
Przeciętny Samsung PM9A1a MZVL21T0HDLU
 
69.6 pt
HP Omen Transcend 16-u1095ng
Kioxia XG8 KXG80ZNV1T02
60.4 pt
Asus TUF Gaming A17 FA707XI-NS94
WD PC SN560 SDDPNQE-1T00
46.2 pt
DiskSpd
seq read
Alienware m16 R2
Samsung PM9A1 MZVL21T0HCLR
4480 (4426.62min - 4479.73max) MB/s +9%
Acer Predator Helios Neo 16 (2024)
Samsung PM9A1a MZVL21T0HDLU
4104 (4091.75min - 4103.68max) MB/s
Lenovo Legion Pro 5 16IRX9
Samsung PM9A1 MZVL21T0HCLR
4037 (3964.04min - 4036.7max) MB/s -2%
Przeciętny Samsung PM9A1a MZVL21T0HDLU
  (3028 - 4104, n=7)
3503 MB/s -15%
Asus TUF Gaming A17 FA707XI-NS94
WD PC SN560 SDDPNQE-1T00
3426 (3325.1min - 3425.77max) MB/s -17%
Średnia w klasie Gaming
  (1319 - 7045, n=148, ostatnie 2 lata)
3422 MB/s -17%
HP Omen Transcend 16-u1095ng
Kioxia XG8 KXG80ZNV1T02
3102 (3080.64min - 3101.78max) MB/s -24%
Aorus 16X 2024
Gigabyte AG450E1024-SI
2620 (2556.56min - 2619.76max) MB/s -36%
seq write
Aorus 16X 2024
Gigabyte AG450E1024-SI
4757 (4720.06min - 4757.31max) MB/s +5%
Acer Predator Helios Neo 16 (2024)
Samsung PM9A1a MZVL21T0HDLU
4533 (4522.27min - 4532.95max) MB/s
Alienware m16 R2
Samsung PM9A1 MZVL21T0HCLR
4371 (4342.15min - 4371.09max) MB/s -4%
Lenovo Legion Pro 5 16IRX9
Samsung PM9A1 MZVL21T0HCLR
4093 (4016.82min - 4092.8max) MB/s -10%
Średnia w klasie Gaming
  (535 - 9307, n=148, ostatnie 2 lata)
3776 MB/s -17%
Przeciętny Samsung PM9A1a MZVL21T0HDLU
  (2979 - 4533, n=7)
3447 MB/s -24%
HP Omen Transcend 16-u1095ng
Kioxia XG8 KXG80ZNV1T02
3038 (2862.26min - 3038.15max) MB/s -33%
Asus TUF Gaming A17 FA707XI-NS94
WD PC SN560 SDDPNQE-1T00
3019 (2871.34min - 3019.1max) MB/s -33%
seq q8 t1 read
Alienware m16 R2
Samsung PM9A1 MZVL21T0HCLR
7079 (6575.14min - 7078.73max) MB/s 0%
Acer Predator Helios Neo 16 (2024)
Samsung PM9A1a MZVL21T0HDLU
7058 (6624.24min - 7058.17max) MB/s
Przeciętny Samsung PM9A1a MZVL21T0HDLU
  (6023 - 7058, n=7)
6871 MB/s -3%
Lenovo Legion Pro 5 16IRX9
Samsung PM9A1 MZVL21T0HCLR
6636 (6205.02min - 6635.75max) MB/s -6%
HP Omen Transcend 16-u1095ng
Kioxia XG8 KXG80ZNV1T02
6388 (5544.27min - 6387.72max) MB/s -9%
Średnia w klasie Gaming
  (2594 - 16089, n=148, ostatnie 2 lata)
6155 MB/s -13%
Aorus 16X 2024
Gigabyte AG450E1024-SI
5181 (4323.23min - 5181.35max) MB/s -27%
Asus TUF Gaming A17 FA707XI-NS94
WD PC SN560 SDDPNQE-1T00
5018 (4387.69min - 5018.48max) MB/s -29%
seq q8 t1 write
Acer Predator Helios Neo 16 (2024)
Samsung PM9A1a MZVL21T0HDLU
5265 (5223.42min - 5264.69max) MB/s
Alienware m16 R2
Samsung PM9A1 MZVL21T0HCLR
5250 (5191.5min - 5250.22max) MB/s 0%
HP Omen Transcend 16-u1095ng
Kioxia XG8 KXG80ZNV1T02
5234 (5167.11min - 5234.47max) MB/s -1%
Przeciętny Samsung PM9A1a MZVL21T0HDLU
  (4913 - 5265, n=7)
5005 MB/s -5%
Lenovo Legion Pro 5 16IRX9
Samsung PM9A1 MZVL21T0HCLR
4949 (4932.28min - 4948.61max) MB/s -6%
Aorus 16X 2024
Gigabyte AG450E1024-SI
4821 (4606.6min - 4820.72max) MB/s -8%
Średnia w klasie Gaming
  (539 - 14571, n=148, ostatnie 2 lata)
4756 MB/s -10%
Asus TUF Gaming A17 FA707XI-NS94
WD PC SN560 SDDPNQE-1T00
3288 (3266.73min - 3287.63max) MB/s -38%
4k q1 t1 read
Acer Predator Helios Neo 16 (2024)
Samsung PM9A1a MZVL21T0HDLU
95.2 (94.25min - 95.19max) MB/s
Lenovo Legion Pro 5 16IRX9
Samsung PM9A1 MZVL21T0HCLR
92.7 (91.49min - 92.68max) MB/s -3%
Alienware m16 R2
Samsung PM9A1 MZVL21T0HCLR
83.5 (82.8min - 83.52max) MB/s -12%
Przeciętny Samsung PM9A1a MZVL21T0HDLU
  (57.3 - 95.2, n=7)
72.2 MB/s -24%
Średnia w klasie Gaming
  (30.6 - 95.9, n=148, ostatnie 2 lata)
65.7 MB/s -31%
Asus TUF Gaming A17 FA707XI-NS94
WD PC SN560 SDDPNQE-1T00
54.3 (54.05min - 54.29max) MB/s -43%
HP Omen Transcend 16-u1095ng
Kioxia XG8 KXG80ZNV1T02
51.3 (50.48min - 51.25max) MB/s -46%
Aorus 16X 2024
Gigabyte AG450E1024-SI
47.2 (45.9min - 47.16max) MB/s -50%
4k q1 t1 write
Aorus 16X 2024
Gigabyte AG450E1024-SI
340 (329.38min - 339.78max) MB/s +26%
Acer Predator Helios Neo 16 (2024)
Samsung PM9A1a MZVL21T0HDLU
270 (268.96min - 269.65max) MB/s
Lenovo Legion Pro 5 16IRX9
Samsung PM9A1 MZVL21T0HCLR
251 (249.74min - 251.16max) MB/s -7%
Średnia w klasie Gaming
  (78 - 397, n=148, ostatnie 2 lata)
223 MB/s -17%
Alienware m16 R2
Samsung PM9A1 MZVL21T0HCLR
198.1 (195.9min - 198.06max) MB/s -27%
Przeciętny Samsung PM9A1a MZVL21T0HDLU
  (119.6 - 270, n=7)
169.9 MB/s -37%
Asus TUF Gaming A17 FA707XI-NS94
WD PC SN560 SDDPNQE-1T00
143.7 (139.68min - 143.66max) MB/s -47%
HP Omen Transcend 16-u1095ng
Kioxia XG8 KXG80ZNV1T02
128.1 (123.78min - 128.05max) MB/s -53%
4k q32 t16 read
Lenovo Legion Pro 5 16IRX9
Samsung PM9A1 MZVL21T0HCLR
4055 (4044.11min - 4055.48max) MB/s +8%
Acer Predator Helios Neo 16 (2024)
Samsung PM9A1a MZVL21T0HDLU
3764 (3700.88min - 3763.72max) MB/s
Alienware m16 R2
Samsung PM9A1 MZVL21T0HCLR
3630 (3471.35min - 3629.9max) MB/s -4%
Aorus 16X 2024
Gigabyte AG450E1024-SI
3302 (3194.22min - 3302.44max) MB/s -12%
Średnia w klasie Gaming
  (417 - 6172, n=148, ostatnie 2 lata)
2587 MB/s -31%
Przeciętny Samsung PM9A1a MZVL21T0HDLU
  (675 - 3896, n=7)
1766 MB/s -53%
Asus TUF Gaming A17 FA707XI-NS94
WD PC SN560 SDDPNQE-1T00
1189 (1150.47min - 1189.25max) MB/s -68%
HP Omen Transcend 16-u1095ng
Kioxia XG8 KXG80ZNV1T02
900 (832.36min - 900.34max) MB/s -76%
4k q32 t16 write
Acer Predator Helios Neo 16 (2024)
Samsung PM9A1a MZVL21T0HDLU
3717 (3584.28min - 3717.4max) MB/s
Lenovo Legion Pro 5 16IRX9
Samsung PM9A1 MZVL21T0HCLR
3542 (3491.17min - 3541.69max) MB/s -5%
Aorus 16X 2024
Gigabyte AG450E1024-SI
3443 (3007.99min - 3443.05max) MB/s -7%
Alienware m16 R2
Samsung PM9A1 MZVL21T0HCLR
3003 (2991.33min - 3002.71max) MB/s -19%
Średnia w klasie Gaming
  (162.3 - 4869, n=148, ostatnie 2 lata)
2148 MB/s -42%
Przeciętny Samsung PM9A1a MZVL21T0HDLU
  (349 - 3717, n=7)
1350 MB/s -64%
Asus TUF Gaming A17 FA707XI-NS94
WD PC SN560 SDDPNQE-1T00
480 (467.08min - 480.46max) MB/s -87%
HP Omen Transcend 16-u1095ng
Kioxia XG8 KXG80ZNV1T02
438 (405.08min - 437.5max) MB/s -88%
AS SSD
Score Total
Acer Predator Helios Neo 16 (2024)
Samsung PM9A1a MZVL21T0HDLU
9056 Points
Aorus 16X 2024
Gigabyte AG450E1024-SI
8778 Points -3%
Lenovo Legion Pro 5 16IRX9
Samsung PM9A1 MZVL21T0HCLR
8364 Points -8%
Alienware m16 R2
Samsung PM9A1 MZVL21T0HCLR
8059 Points -11%
Średnia w klasie Gaming
  (2271 - 13854, n=141, ostatnie 2 lata)
6774 Points -25%
Przeciętny Samsung PM9A1a MZVL21T0HDLU
  (4533 - 9056, n=7)
6168 Points -32%
HP Omen Transcend 16-u1095ng
Kioxia XG8 KXG80ZNV1T02
5138 Points -43%
Asus TUF Gaming A17 FA707XI-NS94
WD PC SN560 SDDPNQE-1T00
4092 Points -55%
Score Read
Acer Predator Helios Neo 16 (2024)
Samsung PM9A1a MZVL21T0HDLU
3368 Points
Lenovo Legion Pro 5 16IRX9
Samsung PM9A1 MZVL21T0HCLR
3233 Points -4%
Aorus 16X 2024
Gigabyte AG450E1024-SI
3152 Points -6%
Alienware m16 R2
Samsung PM9A1 MZVL21T0HCLR
3005 Points -11%
Średnia w klasie Gaming
  (776 - 4721, n=141, ostatnie 2 lata)
2436 Points -28%
Przeciętny Samsung PM9A1a MZVL21T0HDLU
  (1283 - 3368, n=7)
1964 Points -42%
Asus TUF Gaming A17 FA707XI-NS94
WD PC SN560 SDDPNQE-1T00
1571 Points -53%
HP Omen Transcend 16-u1095ng
Kioxia XG8 KXG80ZNV1T02
1458 Points -57%
Score Write
Acer Predator Helios Neo 16 (2024)
Samsung PM9A1a MZVL21T0HDLU
4018 Points
Aorus 16X 2024
Gigabyte AG450E1024-SI
4006 Points 0%
Alienware m16 R2
Samsung PM9A1 MZVL21T0HCLR
3573 Points -11%
Lenovo Legion Pro 5 16IRX9
Samsung PM9A1 MZVL21T0HCLR
3543 Points -12%
Przeciętny Samsung PM9A1a MZVL21T0HDLU
  (2703 - 4018, n=7)
3289 Points -18%
Średnia w klasie Gaming
  (515 - 7208, n=141, ostatnie 2 lata)
3154 Points -22%
HP Omen Transcend 16-u1095ng
Kioxia XG8 KXG80ZNV1T02
3029 Points -25%
Asus TUF Gaming A17 FA707XI-NS94
WD PC SN560 SDDPNQE-1T00
1792 Points -55%
Seq Read
HP Omen Transcend 16-u1095ng
Kioxia XG8 KXG80ZNV1T02
5625.54 MB/s 0%
Acer Predator Helios Neo 16 (2024)
Samsung PM9A1a MZVL21T0HDLU
5622.8 MB/s
Alienware m16 R2
Samsung PM9A1 MZVL21T0HCLR
5592.15 MB/s -1%
Lenovo Legion Pro 5 16IRX9
Samsung PM9A1 MZVL21T0HCLR
5355.36 MB/s -5%
Przeciętny Samsung PM9A1a MZVL21T0HDLU
  (4590 - 5623, n=7)
5163 MB/s -8%
Średnia w klasie Gaming
  (2260 - 12763, n=141, ostatnie 2 lata)
4860 MB/s -14%
Aorus 16X 2024
Gigabyte AG450E1024-SI
4161.31 MB/s -26%
Asus TUF Gaming A17 FA707XI-NS94
WD PC SN560 SDDPNQE-1T00
4011.35 MB/s -29%
Seq Write
Acer Predator Helios Neo 16 (2024)
Samsung PM9A1a MZVL21T0HDLU
4482.43 MB/s
Aorus 16X 2024
Gigabyte AG450E1024-SI
4431.76 MB/s -1%
Alienware m16 R2
Samsung PM9A1 MZVL21T0HCLR
4431.18 MB/s -1%
Lenovo Legion Pro 5 16IRX9
Samsung PM9A1 MZVL21T0HCLR
3950.35 MB/s -12%
Średnia w klasie Gaming
  (495 - 11316, n=141, ostatnie 2 lata)
3728 MB/s -17%
HP Omen Transcend 16-u1095ng
Kioxia XG8 KXG80ZNV1T02
3587.95 MB/s -20%
Przeciętny Samsung PM9A1a MZVL21T0HDLU
  (2443 - 4482, n=7)
3121 MB/s -30%
Asus TUF Gaming A17 FA707XI-NS94
WD PC SN560 SDDPNQE-1T00
2390.9 MB/s -47%
4K Read
Acer Predator Helios Neo 16 (2024)
Samsung PM9A1a MZVL21T0HDLU
84.56 MB/s
Lenovo Legion Pro 5 16IRX9
Samsung PM9A1 MZVL21T0HCLR
82.62 MB/s -2%
Alienware m16 R2
Samsung PM9A1 MZVL21T0HCLR
71.52 MB/s -15%
Przeciętny Samsung PM9A1a MZVL21T0HDLU
  (63.9 - 84.6, n=7)
71.2 MB/s -16%
Średnia w klasie Gaming
  (27.8 - 112.1, n=141, ostatnie 2 lata)
64.8 MB/s -23%
Aorus 16X 2024
Gigabyte AG450E1024-SI
61.86 MB/s -27%
Asus TUF Gaming A17 FA707XI-NS94
WD PC SN560 SDDPNQE-1T00
49.86 MB/s -41%
HP Omen Transcend 16-u1095ng
Kioxia XG8 KXG80ZNV1T02
49.79 MB/s -41%
4K Write
Aorus 16X 2024
Gigabyte AG450E1024-SI
283.44 MB/s +22%
Acer Predator Helios Neo 16 (2024)
Samsung PM9A1a MZVL21T0HDLU
231.38 MB/s
Lenovo Legion Pro 5 16IRX9
Samsung PM9A1 MZVL21T0HCLR
213.76 MB/s -8%
Średnia w klasie Gaming
  (79.4 - 512, n=141, ostatnie 2 lata)
212 MB/s -8%
HP Omen Transcend 16-u1095ng
Kioxia XG8 KXG80ZNV1T02
191.79 MB/s -17%
Przeciętny Samsung PM9A1a MZVL21T0HDLU
  (146.2 - 231, n=7)
179.6 MB/s -22%
Alienware m16 R2
Samsung PM9A1 MZVL21T0HCLR
179.15 MB/s -23%
Asus TUF Gaming A17 FA707XI-NS94
WD PC SN560 SDDPNQE-1T00
171.2 MB/s -26%
4K-64 Read
Acer Predator Helios Neo 16 (2024)
Samsung PM9A1a MZVL21T0HDLU
2721.41 MB/s
Aorus 16X 2024
Gigabyte AG450E1024-SI
2673.76 MB/s -2%
Lenovo Legion Pro 5 16IRX9
Samsung PM9A1 MZVL21T0HCLR
2615.17 MB/s -4%
Alienware m16 R2
Samsung PM9A1 MZVL21T0HCLR
2374.63 MB/s -13%
Średnia w klasie Gaming
  (451 - 3475, n=141, ostatnie 2 lata)
1879 MB/s -31%
Przeciętny Samsung PM9A1a MZVL21T0HDLU
  (705 - 2721, n=7)
1376 MB/s -49%
Asus TUF Gaming A17 FA707XI-NS94
WD PC SN560 SDDPNQE-1T00
1120.03 MB/s -59%
HP Omen Transcend 16-u1095ng
Kioxia XG8 KXG80ZNV1T02
845.48 MB/s -69%
4K-64 Write
Acer Predator Helios Neo 16 (2024)
Samsung PM9A1a MZVL21T0HDLU
3338.79 MB/s
Aorus 16X 2024
Gigabyte AG450E1024-SI
3279.44 MB/s -2%
Alienware m16 R2
Samsung PM9A1 MZVL21T0HCLR
2951.09 MB/s -12%
Lenovo Legion Pro 5 16IRX9
Samsung PM9A1 MZVL21T0HCLR
2933.74 MB/s -12%
Przeciętny Samsung PM9A1a MZVL21T0HDLU
  (2278 - 3339, n=7)
2797 MB/s -16%
Średnia w klasie Gaming
  (277 - 5909, n=141, ostatnie 2 lata)
2573 MB/s -23%
HP Omen Transcend 16-u1095ng
Kioxia XG8 KXG80ZNV1T02
2478.06 MB/s -26%
Asus TUF Gaming A17 FA707XI-NS94
WD PC SN560 SDDPNQE-1T00
1381.35 MB/s -59%
Access Time Read
Asus TUF Gaming A17 FA707XI-NS94
WD PC SN560 SDDPNQE-1T00
0.09 ms * -137%
Aorus 16X 2024
Gigabyte AG450E1024-SI
0.088 ms * -132%
Średnia w klasie Gaming
  (0.016 - 0.379, n=140, ostatnie 2 lata)
0.05724 ms * -51%
HP Omen Transcend 16-u1095ng
Kioxia XG8 KXG80ZNV1T02
0.054 ms * -42%
Alienware m16 R2
Samsung PM9A1 MZVL21T0HCLR
0.047 ms * -24%
Lenovo Legion Pro 5 16IRX9
Samsung PM9A1 MZVL21T0HCLR
0.042 ms * -11%
Przeciętny Samsung PM9A1a MZVL21T0HDLU
  (0.025 - 0.064, n=7)
0.04114 ms * -8%
Acer Predator Helios Neo 16 (2024)
Samsung PM9A1a MZVL21T0HDLU
0.038 ms *
Access Time Write
Asus TUF Gaming A17 FA707XI-NS94
WD PC SN560 SDDPNQE-1T00
0.073 ms * -284%
Alienware m16 R2
Samsung PM9A1 MZVL21T0HCLR
0.07 ms * -268%
Lenovo Legion Pro 5 16IRX9
Samsung PM9A1 MZVL21T0HCLR
0.059 ms * -211%
Średnia w klasie Gaming
  (0.011 - 1.028, n=141, ostatnie 2 lata)
0.04833 ms * -154%
Przeciętny Samsung PM9A1a MZVL21T0HDLU
  (0.019 - 0.027, n=7)
0.02343 ms * -23%
HP Omen Transcend 16-u1095ng
Kioxia XG8 KXG80ZNV1T02
0.02 ms * -5%
Acer Predator Helios Neo 16 (2024)
Samsung PM9A1a MZVL21T0HDLU
0.019 ms *
Aorus 16X 2024
Gigabyte AG450E1024-SI
0.015 ms * +21%

* ... im mniej tym lepiej

Disk Throttling: DiskSpd Read Loop, Queue Depth 8

036072010801440180021602520288032403600396043204680504054005760612064806840Tooltip
Acer Predator Helios Neo 16 (2024) Samsung PM9A1a MZVL21T0HDLU; diskspd 2.0.17 f: Ø7013 (6198.53-7048.48)
Aorus 16X 2024 Gigabyte AG450E1024-SI; diskspd 2.0.17 f: Ø5164 (4823.45-5192.86)
Alienware m16 R2 Samsung PM9A1 MZVL21T0HCLR; diskspd 2.0.17 f: Ø7063 (6446.85-7107.46)
HP Omen Transcend 16-u1095ng Kioxia XG8 KXG80ZNV1T02; diskspd 2.0.17 f: Ø6318 (5640.08-6341.89)
Asus TUF Gaming A17 FA707XI-NS94 WD PC SN560 SDDPNQE-1T00; diskspd 2.0.17 f: Ø5009 (4724.46-5021.44)
Lenovo Legion Pro 5 16IRX9 Samsung PM9A1 MZVL21T0HCLR; diskspd 2.0.17 f: Ø5723 (3286.38-6614.84)

Karta graficzna

Acer dołącza do Core i7 kartę graficzną GeForce RTX 4070pozwalając mu na maksymalne TGP wynoszące 140 watów - co jest najwyższą możliwą wartością. GPU oferuje 4608 jednostek cieniujących, 128-bitową magistralę i szybką pamięć GDDR6, chociaż ta ostatnia jest nieco ograniczona do zaledwie 8 GB. Zaawansowany Optimus jest obsługiwany. Wyniki benchmarków plasują się powyżej średniej dla układów RTX-4070. Różnica między trybami "Performance" i "Turbo" jest minimalna.

Fire Strike (Wydajność, zasilanie sieciowe)
Fire Strike (Turbo, zasilanie sieciowe)
Fire Strike (Zrównoważony, zasilanie sieciowe)
Fire Strike (Ciche, zasilanie sieciowe)
Fire Strike (Zrównoważony, zasilanie bateryjne)
3DMark Performance Rating - Percent
Lenovo Legion Pro 5 16IRX9
NVIDIA GeForce RTX 4070 Laptop GPU, Intel Core i9-14900HX
99.4 pt
Acer Predator Helios Neo 16 (2024)
NVIDIA GeForce RTX 4070 Laptop GPU, Intel Core i7-14700HX
98.9 pt
Asus TUF Gaming A17 FA707XI-NS94
NVIDIA GeForce RTX 4070 Laptop GPU, AMD Ryzen 9 7940HS
98.9 pt
Średnia w klasie Gaming
 
98 pt
Alienware m16 R2
NVIDIA GeForce RTX 4070 Laptop GPU, Intel Core Ultra 7 155H
97.3 pt
Aorus 16X 2024
NVIDIA GeForce RTX 4070 Laptop GPU, Intel Core i9-14900HX
92.4 pt
Przeciętny NVIDIA GeForce RTX 4070 Laptop GPU
 
90.5 pt
HP Omen Transcend 16-u1095ng
NVIDIA GeForce RTX 4070 Laptop GPU, Intel Core i9-14900HX
87.9 pt
3DMark 11 - 1280x720 Performance GPU
Asus TUF Gaming A17 FA707XI-NS94
NVIDIA GeForce RTX 4070 Laptop GPU, AMD Ryzen 9 7940HS
44546 Points 0%
Acer Predator Helios Neo 16 (2024)
NVIDIA GeForce RTX 4070 Laptop GPU, Intel Core i7-14700HX
44538 Points
Lenovo Legion Pro 5 16IRX9
NVIDIA GeForce RTX 4070 Laptop GPU, Intel Core i9-14900HX
43689 Points -2%
Średnia w klasie Gaming
  (1029 - 72178, n=164, ostatnie 2 lata)
43265 Points -3%
Alienware m16 R2
NVIDIA GeForce RTX 4070 Laptop GPU, Intel Core Ultra 7 155H
42296 Points -5%
Aorus 16X 2024
NVIDIA GeForce RTX 4070 Laptop GPU, Intel Core i9-14900HX
41457 Points -7%
Przeciętny NVIDIA GeForce RTX 4070 Laptop GPU
  (24229 - 46434, n=66)
40429 Points -9%
HP Omen Transcend 16-u1095ng
NVIDIA GeForce RTX 4070 Laptop GPU, Intel Core i9-14900HX
39424 Points -11%
3DMark
1920x1080 Fire Strike Graphics
Lenovo Legion Pro 5 16IRX9
NVIDIA GeForce RTX 4070 Laptop GPU, Intel Core i9-14900HX
31105 Points 0%
Acer Predator Helios Neo 16 (2024)
NVIDIA GeForce RTX 4070 Laptop GPU, Intel Core i7-14700HX
31091 Points
Średnia w klasie Gaming
  (781 - 53059, n=176, ostatnie 2 lata)
31047 Points 0%
Alienware m16 R2
NVIDIA GeForce RTX 4070 Laptop GPU, Intel Core Ultra 7 155H
30932 Points -1%
Asus TUF Gaming A17 FA707XI-NS94
NVIDIA GeForce RTX 4070 Laptop GPU, AMD Ryzen 9 7940HS
30438 Points -2%
Aorus 16X 2024
NVIDIA GeForce RTX 4070 Laptop GPU, Intel Core i9-14900HX
29156 Points -6%
Przeciętny NVIDIA GeForce RTX 4070 Laptop GPU
  (12242 - 33451, n=70)
29119 Points -6%
HP Omen Transcend 16-u1095ng
NVIDIA GeForce RTX 4070 Laptop GPU, Intel Core i9-14900HX
28461 Points -8%
2560x1440 Time Spy Graphics
Lenovo Legion Pro 5 16IRX9
NVIDIA GeForce RTX 4070 Laptop GPU, Intel Core i9-14900HX
13336 Points +3%
Asus TUF Gaming A17 FA707XI-NS94
NVIDIA GeForce RTX 4070 Laptop GPU, AMD Ryzen 9 7940HS
13166 Points +2%
Alienware m16 R2
NVIDIA GeForce RTX 4070 Laptop GPU, Intel Core Ultra 7 155H
12997 Points +1%
Średnia w klasie Gaming
  (224 - 22717, n=171, ostatnie 2 lata)
12960 Points 0%
Acer Predator Helios Neo 16 (2024)
NVIDIA GeForce RTX 4070 Laptop GPU, Intel Core i7-14700HX
12900 Points
Aorus 16X 2024
NVIDIA GeForce RTX 4070 Laptop GPU, Intel Core i9-14900HX
12048 Points -7%
Przeciętny NVIDIA GeForce RTX 4070 Laptop GPU
  (5012 - 13391, n=68)
11612 Points -10%
HP Omen Transcend 16-u1095ng
NVIDIA GeForce RTX 4070 Laptop GPU, Intel Core i9-14900HX
11181 Points -13%
3DMark 06 Standard Score
59935 pkt.
3DMark 11 Performance
36334 pkt.
3DMark Fire Strike Score
28501 pkt.
3DMark Time Spy Score
13309 pkt.
Pomoc
Blender
v3.3 Classroom OPTIX/RTX
HP Omen Transcend 16-u1095ng
NVIDIA GeForce RTX 4070 Laptop GPU, Intel Core i9-14900HX (3.3.3)
23 Seconds * -21%
Przeciętny NVIDIA GeForce RTX 4070 Laptop GPU
  (18 - 30, n=67)
21.4 Seconds * -13%
Średnia w klasie Gaming
  (9 - 95, n=161, ostatnie 2 lata)
21 Seconds * -11%
Alienware m16 R2
NVIDIA GeForce RTX 4070 Laptop GPU, Intel Core Ultra 7 155H (3.3.3)
20 Seconds * -5%
Aorus 16X 2024
NVIDIA GeForce RTX 4070 Laptop GPU, Intel Core i9-14900HX (3.3.3)
20 Seconds * -5%
Asus TUF Gaming A17 FA707XI-NS94
NVIDIA GeForce RTX 4070 Laptop GPU, AMD Ryzen 9 7940HS (3.3.3)
19 Seconds * -0%
Lenovo Legion Pro 5 16IRX9
NVIDIA GeForce RTX 4070 Laptop GPU, Intel Core i9-14900HX (3.3.3)
19 Seconds * -0%
Acer Predator Helios Neo 16 (2024)
NVIDIA GeForce RTX 4070 Laptop GPU, Intel Core i7-14700HX (3.3.3)
19 Seconds *
Acer Predator Helios Neo 16 (2024)
NVIDIA GeForce RTX 4070 Laptop GPU, Intel Core i7-14700HX (3.3.3, Turbo)
18 Seconds * +5%
v3.3 Classroom CUDA
Średnia w klasie Gaming
  (16 - 175, n=163, ostatnie 2 lata)
36.5 Seconds * -11%
HP Omen Transcend 16-u1095ng
NVIDIA GeForce RTX 4070 Laptop GPU, Intel Core i9-14900HX (3.3.3)
36 Seconds * -9%
Przeciętny NVIDIA GeForce RTX 4070 Laptop GPU
  (32 - 50, n=66)
34.9 Seconds * -6%
Alienware m16 R2
NVIDIA GeForce RTX 4070 Laptop GPU, Intel Core Ultra 7 155H (3.3.3)
33 Seconds * -0%
Acer Predator Helios Neo 16 (2024)
NVIDIA GeForce RTX 4070 Laptop GPU, Intel Core i7-14700HX (3.3.3)
33 Seconds *
Asus TUF Gaming A17 FA707XI-NS94
NVIDIA GeForce RTX 4070 Laptop GPU, AMD Ryzen 9 7940HS (3.3.3)
32 Seconds * +3%
Lenovo Legion Pro 5 16IRX9
NVIDIA GeForce RTX 4070 Laptop GPU, Intel Core i9-14900HX (3.3.3)
32 Seconds * +3%
Aorus 16X 2024
NVIDIA GeForce RTX 4070 Laptop GPU, Intel Core i9-14900HX (3.3.3)
32 Seconds * +3%
Acer Predator Helios Neo 16 (2024)
NVIDIA GeForce RTX 4070 Laptop GPU, Intel Core i7-14700HX (3.3.3, Turbo)
32 Seconds * +3%
v3.3 Classroom CPU
HP Omen Transcend 16-u1095ng
NVIDIA GeForce RTX 4070 Laptop GPU, Intel Core i9-14900HX (3.3.3)
298 Seconds * -22%
Alienware m16 R2
NVIDIA GeForce RTX 4070 Laptop GPU, Intel Core Ultra 7 155H (3.3.3)
296 Seconds * -21%
Średnia w klasie Gaming
  (138 - 962, n=168, ostatnie 2 lata)
296 Seconds * -21%
Asus TUF Gaming A17 FA707XI-NS94
NVIDIA GeForce RTX 4070 Laptop GPU, AMD Ryzen 9 7940HS (3.3.3)
291 Seconds * -19%
Przeciętny NVIDIA GeForce RTX 4070 Laptop GPU
  (158 - 440, n=66)
289 Seconds * -18%
Acer Predator Helios Neo 16 (2024)
NVIDIA GeForce RTX 4070 Laptop GPU, Intel Core i7-14700HX (3.3.3)
245 Seconds *
Acer Predator Helios Neo 16 (2024)
NVIDIA GeForce RTX 4070 Laptop GPU, Intel Core i7-14700HX (3.3.3, Turbo)
230 Seconds * +6%
Aorus 16X 2024
NVIDIA GeForce RTX 4070 Laptop GPU, Intel Core i9-14900HX (3.3.3)
227 Seconds * +7%
Lenovo Legion Pro 5 16IRX9
NVIDIA GeForce RTX 4070 Laptop GPU, Intel Core i9-14900HX (3.3.3)
205 Seconds * +16%
Geekbench 5.5
OpenCL Score
Aorus 16X 2024
NVIDIA GeForce RTX 4070 Laptop GPU, Intel Core i9-14900HX
126537 Points +11%
Średnia w klasie Gaming
  (5039 - 237138, n=169, ostatnie 2 lata)
124807 Points +10%
Acer Predator Helios Neo 16 (2024)
NVIDIA GeForce RTX 4070 Laptop GPU, Intel Core i7-14700HX (Turbo)
121756 Points +7%
HP Omen Transcend 16-u1095ng
NVIDIA GeForce RTX 4070 Laptop GPU, Intel Core i9-14900HX
118601 Points +4%
Asus TUF Gaming A17 FA707XI-NS94
NVIDIA GeForce RTX 4070 Laptop GPU, AMD Ryzen 9 7940HS
117251 Points +3%
Przeciętny NVIDIA GeForce RTX 4070 Laptop GPU
  (17391 - 132836, n=67)
114405 Points 0%
Acer Predator Helios Neo 16 (2024)
NVIDIA GeForce RTX 4070 Laptop GPU, Intel Core i7-14700HX
113950 Points
Lenovo Legion Pro 5 16IRX9
NVIDIA GeForce RTX 4070 Laptop GPU, Intel Core i9-14900HX
112841 Points -1%
Alienware m16 R2
NVIDIA GeForce RTX 4070 Laptop GPU, Intel Core Ultra 7 155H
111153 Points -2%
Vulkan Score 5.5
Acer Predator Helios Neo 16 (2024)
NVIDIA GeForce RTX 4070 Laptop GPU, Intel Core i7-14700HX (Turbo)
83274 Points +27%
Aorus 16X 2024
NVIDIA GeForce RTX 4070 Laptop GPU, Intel Core i9-14900HX
75575 Points +15%
Średnia w klasie Gaming
  (7995 - 163089, n=108, ostatnie 2 lata)
73161 Points +11%
Przeciętny NVIDIA GeForce RTX 4070 Laptop GPU
  (8146 - 102618, n=37)
67324 Points +2%
Acer Predator Helios Neo 16 (2024)
NVIDIA GeForce RTX 4070 Laptop GPU, Intel Core i7-14700HX
65791 Points
Alienware m16 R2
NVIDIA GeForce RTX 4070 Laptop GPU, Intel Core Ultra 7 155H
65414 Points -1%
Asus TUF Gaming A17 FA707XI-NS94
NVIDIA GeForce RTX 4070 Laptop GPU, AMD Ryzen 9 7940HS
62491 Points -5%
Lenovo Legion Pro 5 16IRX9
NVIDIA GeForce RTX 4070 Laptop GPU, Intel Core i9-14900HX
58476 Points -11%
Geekbench 6.3
GPU OpenCL
Acer Predator Helios Neo 16 (2024)
NVIDIA GeForce RTX 4070 Laptop GPU, Intel Core i7-14700HX (6.2.1, Turbo)
123976 Points +4%
HP Omen Transcend 16-u1095ng
NVIDIA GeForce RTX 4070 Laptop GPU, Intel Core i9-14900HX (6.2.1)
120468 Points +1%
Aorus 16X 2024
NVIDIA GeForce RTX 4070 Laptop GPU, Intel Core i9-14900HX (6.2.1)
120176 Points +1%
Acer Predator Helios Neo 16 (2024)
NVIDIA GeForce RTX 4070 Laptop GPU, Intel Core i7-14700HX (6.2.1)
119119 Points
Asus TUF Gaming A17 FA707XI-NS94
NVIDIA GeForce RTX 4070 Laptop GPU, AMD Ryzen 9 7940HS (6.2.1)
117792 Points -1%
Średnia w klasie Gaming
  (4321 - 207373, n=115, ostatnie 2 lata)
115867 Points -3%
Lenovo Legion Pro 5 16IRX9
NVIDIA GeForce RTX 4070 Laptop GPU, Intel Core i9-14900HX (6.2.1)
115718 Points -3%
Przeciętny NVIDIA GeForce RTX 4070 Laptop GPU
  (85488 - 129836, n=44)
113446 Points -5%
Alienware m16 R2
NVIDIA GeForce RTX 4070 Laptop GPU, Intel Core Ultra 7 155H (6.2.1)
112875 Points -5%
GPU Vulkan
Alienware m16 R2
NVIDIA GeForce RTX 4070 Laptop GPU, Intel Core Ultra 7 155H (6.2.1)
110951 Points +24%
Asus TUF Gaming A17 FA707XI-NS94
NVIDIA GeForce RTX 4070 Laptop GPU, AMD Ryzen 9 7940HS (6.2.1)
107747 Points +20%
Lenovo Legion Pro 5 16IRX9
NVIDIA GeForce RTX 4070 Laptop GPU, Intel Core i9-14900HX (6.2.1)
105334 Points +18%
Acer Predator Helios Neo 16 (2024)
NVIDIA GeForce RTX 4070 Laptop GPU, Intel Core i7-14700HX (6.2.1, Turbo)
93371 Points +4%
Aorus 16X 2024
NVIDIA GeForce RTX 4070 Laptop GPU, Intel Core i9-14900HX (6.2.1)
90584 Points +1%
Acer Predator Helios Neo 16 (2024)
NVIDIA GeForce RTX 4070 Laptop GPU, Intel Core i7-14700HX (6.2.1)
89638 Points
Średnia w klasie Gaming
  (4286 - 196201, n=107, ostatnie 2 lata)
84033 Points -6%
Przeciętny NVIDIA GeForce RTX 4070 Laptop GPU
  (7760 - 120033, n=40)
72103 Points -20%
V-Ray 5 Benchmark
GPU RTX
Średnia w klasie Gaming
  (556 - 3824, n=99, ostatnie 2 lata)
2163 mpaths +20%
Acer Predator Helios Neo 16 (2024)
NVIDIA GeForce RTX 4070 Laptop GPU, Intel Core i7-14700HX (5.0.1, Turbo)
1872 mpaths +4%
Lenovo Legion Pro 5 16IRX9
NVIDIA GeForce RTX 4070 Laptop GPU, Intel Core i9-14900HX (5.0.1)
1868 mpaths +3%
Acer Predator Helios Neo 16 (2024)
NVIDIA GeForce RTX 4070 Laptop GPU, Intel Core i7-14700HX (5.0.1)
1805 mpaths
Asus TUF Gaming A17 FA707XI-NS94
NVIDIA GeForce RTX 4070 Laptop GPU, AMD Ryzen 9 7940HS (5.0.1)
1749 mpaths -3%
Alienware m16 R2
NVIDIA GeForce RTX 4070 Laptop GPU, Intel Core Ultra 7 155H (5.0.1)
1738 mpaths -4%
Aorus 16X 2024
NVIDIA GeForce RTX 4070 Laptop GPU, Intel Core i9-14900HX (5.0.1)
1737 mpaths -4%
Przeciętny NVIDIA GeForce RTX 4070 Laptop GPU
  (171 - 1872, n=38)
1651 mpaths -9%
GPU CUDA
Średnia w klasie Gaming
  (300 - 2797, n=101, ostatnie 2 lata)
1547 mpaths +20%
Lenovo Legion Pro 5 16IRX9
NVIDIA GeForce RTX 4070 Laptop GPU, Intel Core i9-14900HX (5.0.1)
1333 mpaths +3%
Acer Predator Helios Neo 16 (2024)
NVIDIA GeForce RTX 4070 Laptop GPU, Intel Core i7-14700HX (5.0.1, Turbo)
1333 mpaths +3%
Acer Predator Helios Neo 16 (2024)
NVIDIA GeForce RTX 4070 Laptop GPU, Intel Core i7-14700HX (5.0.1)
1289 mpaths
Asus TUF Gaming A17 FA707XI-NS94
NVIDIA GeForce RTX 4070 Laptop GPU, AMD Ryzen 9 7940HS (5.0.1)
1259 mpaths -2%
Alienware m16 R2
NVIDIA GeForce RTX 4070 Laptop GPU, Intel Core Ultra 7 155H (5.0.1)
1259 mpaths -2%
Aorus 16X 2024
NVIDIA GeForce RTX 4070 Laptop GPU, Intel Core i9-14900HX (5.0.1)
1256 mpaths -3%
Przeciętny NVIDIA GeForce RTX 4070 Laptop GPU
  (120 - 1356, n=38)
1198 mpaths -7%
CPU
Lenovo Legion Pro 5 16IRX9
NVIDIA GeForce RTX 4070 Laptop GPU, Intel Core i9-14900HX (5.0.1)
19077 mpaths +18%
Aorus 16X 2024
NVIDIA GeForce RTX 4070 Laptop GPU, Intel Core i9-14900HX (5.0.1)
17465 mpaths +8%
Acer Predator Helios Neo 16 (2024)
NVIDIA GeForce RTX 4070 Laptop GPU, Intel Core i7-14700HX (5.0.1, Turbo)
16485 mpaths +2%
Acer Predator Helios Neo 16 (2024)
NVIDIA GeForce RTX 4070 Laptop GPU, Intel Core i7-14700HX (5.0.1)
16168 mpaths
Średnia w klasie Gaming
  (3562 - 26944, n=104, ostatnie 2 lata)
15076 mpaths -7%
Przeciętny NVIDIA GeForce RTX 4070 Laptop GPU
  (9339 - 20388, n=37)
14340 mpaths -11%
Alienware m16 R2
NVIDIA GeForce RTX 4070 Laptop GPU, Intel Core Ultra 7 155H (5.0.1)
12776 mpaths -21%
Asus TUF Gaming A17 FA707XI-NS94
NVIDIA GeForce RTX 4070 Laptop GPU, AMD Ryzen 9 7940HS (5.0.1)
12383 mpaths -23%
V-Ray Benchmark Next 4.10
GPU
Średnia w klasie Gaming
  (54 - 1334, n=135, ostatnie 2 lata)
695 mpaths +7%
Lenovo Legion Pro 5 16IRX9
NVIDIA GeForce RTX 4070 Laptop GPU, Intel Core i9-14900HX (v4.10.07 )
675 mpaths +4%
Acer Predator Helios Neo 16 (2024)
NVIDIA GeForce RTX 4070 Laptop GPU, Intel Core i7-14700HX (v4.10.07, Turbo)
665 mpaths +2%
Acer Predator Helios Neo 16 (2024)
NVIDIA GeForce RTX 4070 Laptop GPU, Intel Core i7-14700HX (v4.10.07 )
649 mpaths
Przeciętny NVIDIA GeForce RTX 4070 Laptop GPU
  (434 - 686, n=51)
604 mpaths -7%
HP Omen Transcend 16-u1095ng
NVIDIA GeForce RTX 4070 Laptop GPU, Intel Core i9-14900HX (v4.10.07 )
596 mpaths -8%
Aorus 16X 2024
NVIDIA GeForce RTX 4070 Laptop GPU, Intel Core i9-14900HX (v4.10.07 )
587 mpaths -10%
CPU
Lenovo Legion Pro 5 16IRX9
NVIDIA GeForce RTX 4070 Laptop GPU, Intel Core i9-14900HX (v4.10.07 )
28791 ksamples +18%
Aorus 16X 2024
NVIDIA GeForce RTX 4070 Laptop GPU, Intel Core i9-14900HX (v4.10.07 )
26677 ksamples +10%
Acer Predator Helios Neo 16 (2024)
NVIDIA GeForce RTX 4070 Laptop GPU, Intel Core i7-14700HX (v4.10.07, Turbo)
25003 ksamples +3%
Acer Predator Helios Neo 16 (2024)
NVIDIA GeForce RTX 4070 Laptop GPU, Intel Core i7-14700HX (v4.10.07 )
24305 ksamples
HP Omen Transcend 16-u1095ng
NVIDIA GeForce RTX 4070 Laptop GPU, Intel Core i9-14900HX (v4.10.07 )
21634 ksamples -11%
Średnia w klasie Gaming
  (5413 - 37629, n=135, ostatnie 2 lata)
21257 ksamples -13%
Przeciętny NVIDIA GeForce RTX 4070 Laptop GPU
  (12638 - 35173, n=51)
20979 ksamples -14%

* ... im mniej tym lepiej

Wydajność w grach

Predator został zaprojektowany do grania w rozdzielczości QHD przy wysokich i maksymalnych ustawieniach. DLSS 3 i generowanie klatek pozwoliłoby na maksymalne ustawienia, w tym raytracing w wyższych rozdzielczościach, ale dotyczy to tylko gier z odpowiednim wsparciem. Podobnie jak wyniki syntetycznych testów porównawczych, liczba klatek na sekundę również waha się powyżej średniej dla RTX-4070 ("Wydajność" i "Turbo").

Performance Rating - Percent
Lenovo Legion Pro 5 16IRX9
Intel Core i9-14900HX, NVIDIA GeForce RTX 4070 Laptop GPU
99.4 pt
Acer Predator Helios Neo 16 (2024)
Intel Core i7-14700HX, NVIDIA GeForce RTX 4070 Laptop GPU
95.4 pt
Acer Predator Helios Neo 16 (2024)
Intel Core i7-14700HX, NVIDIA GeForce RTX 4070 Laptop GPU
94.3 pt
Aorus 16X 2024
Intel Core i9-14900HX, NVIDIA GeForce RTX 4070 Laptop GPU
89 pt
Średnia w klasie Gaming
 
87.6 pt
HP Omen Transcend 16-u1095ng
Intel Core i9-14900HX, NVIDIA GeForce RTX 4070 Laptop GPU
84.2 pt
Alienware m16 R2 -1!
Intel Core Ultra 7 155H, NVIDIA GeForce RTX 4070 Laptop GPU
83.4 pt
Przeciętny NVIDIA GeForce RTX 4070 Laptop GPU
 
82 pt
Asus TUF Gaming A17 FA707XI-NS94 -1!
AMD Ryzen 9 7940HS, NVIDIA GeForce RTX 4070 Laptop GPU
80.7 pt
The Witcher 3 - 1920x1080 Ultra Graphics & Postprocessing (HBAO+)
Lenovo Legion Pro 5 16IRX9
Intel Core i9-14900HX, NVIDIA GeForce RTX 4070 Laptop GPU
133.7 (126min) fps +5%
Acer Predator Helios Neo 16 (2024)
Intel Core i7-14700HX, NVIDIA GeForce RTX 4070 Laptop GPU (Turbo)
129 fps +1%
Średnia w klasie Gaming
  (18.4 - 216, n=142, ostatnie 2 lata)
127.7 fps 0%
Acer Predator Helios Neo 16 (2024)
Intel Core i7-14700HX, NVIDIA GeForce RTX 4070 Laptop GPU
127.2 (107min) fps
Aorus 16X 2024
Intel Core i9-14900HX, NVIDIA GeForce RTX 4070 Laptop GPU
122 fps -4%
Alienware m16 R2
Intel Core Ultra 7 155H, NVIDIA GeForce RTX 4070 Laptop GPU
121.3 (115min) fps -5%
Asus TUF Gaming A17 FA707XI-NS94
AMD Ryzen 9 7940HS, NVIDIA GeForce RTX 4070 Laptop GPU
120.7 (114min) fps -5%
HP Omen Transcend 16-u1095ng
Intel Core i9-14900HX, NVIDIA GeForce RTX 4070 Laptop GPU
114 fps -10%
Przeciętny NVIDIA GeForce RTX 4070 Laptop GPU
  (69.8 - 133.7, n=56)
112.5 fps -12%
GTA V - 1920x1080 Highest Settings possible AA:4xMSAA + FX AF:16x
Acer Predator Helios Neo 16 (2024)
Intel Core i7-14700HX, NVIDIA GeForce RTX 4070 Laptop GPU (Turbo)
132.2 (9.61min, 90.9P1) fps +3%
Acer Predator Helios Neo 16 (2024)
Intel Core i7-14700HX, NVIDIA GeForce RTX 4070 Laptop GPU
127.8 (8.14min, 90.9P1) fps
Lenovo Legion Pro 5 16IRX9
Intel Core i9-14900HX, NVIDIA GeForce RTX 4070 Laptop GPU
127.2 (5.17min, 83.3P1) fps 0%
HP Omen Transcend 16-u1095ng
Intel Core i9-14900HX, NVIDIA GeForce RTX 4070 Laptop GPU
115.8 (21.8min, 83.3P1) fps -9%
Średnia w klasie Gaming
  (12.1 - 167.7, n=151, ostatnie 2 lata)
112.7 fps -12%
Przeciętny NVIDIA GeForce RTX 4070 Laptop GPU
  (48.3 - 141.6, n=62)
111.2 fps -13%
Aorus 16X 2024
Intel Core i9-14900HX, NVIDIA GeForce RTX 4070 Laptop GPU
107.2 (4.31min, 71.4P1) fps -16%
Final Fantasy XV Benchmark - 1920x1080 High Quality
Lenovo Legion Pro 5 16IRX9
Intel Core i9-14900HX, NVIDIA GeForce RTX 4070 Laptop GPU (1.3)
131 fps +7%
Acer Predator Helios Neo 16 (2024)
Intel Core i7-14700HX, NVIDIA GeForce RTX 4070 Laptop GPU (1.3, Turbo)
128.1 fps +5%
Acer Predator Helios Neo 16 (2024)
Intel Core i7-14700HX, NVIDIA GeForce RTX 4070 Laptop GPU (1.3)
122.1 fps
Asus TUF Gaming A17 FA707XI-NS94
AMD Ryzen 9 7940HS, NVIDIA GeForce RTX 4070 Laptop GPU (1.3)
121.9 fps 0%
Alienware m16 R2
Intel Core Ultra 7 155H, NVIDIA GeForce RTX 4070 Laptop GPU (1.3)
119.3 fps -2%
Średnia w klasie Gaming
  (19.2 - 201, n=163, ostatnie 2 lata)
118.6 fps -3%
Aorus 16X 2024
Intel Core i9-14900HX, NVIDIA GeForce RTX 4070 Laptop GPU (1.3)
111.5 fps -9%
Przeciętny NVIDIA GeForce RTX 4070 Laptop GPU
  (41 - 131.9, n=64)
111 fps -9%
HP Omen Transcend 16-u1095ng
Intel Core i9-14900HX, NVIDIA GeForce RTX 4070 Laptop GPU (1.3)
108.3 fps -11%
Strange Brigade - 1920x1080 ultra AA:ultra AF:16
Lenovo Legion Pro 5 16IRX9
Intel Core i9-14900HX, NVIDIA GeForce RTX 4070 Laptop GPU (1.47.22.14 D3D12)
234 (27.8min, 175.8P1) fps +10%
Średnia w klasie Gaming
  (38.9 - 421, n=158, ostatnie 2 lata)
226 fps +6%
Alienware m16 R2
Intel Core Ultra 7 155H, NVIDIA GeForce RTX 4070 Laptop GPU (1.47.22.14 D3D12)
219 (38.5min, 163.7P1) fps +3%
Acer Predator Helios Neo 16 (2024)
Intel Core i7-14700HX, NVIDIA GeForce RTX 4070 Laptop GPU (1.47.22.14 D3D12, Turbo)
219 (19.1min, 165.9P1) fps +3%
Asus TUF Gaming A17 FA707XI-NS94
AMD Ryzen 9 7940HS, NVIDIA GeForce RTX 4070 Laptop GPU (1.47.22.14 D3D12)
214 (24.3min, 160.5P1) fps 0%
Acer Predator Helios Neo 16 (2024)
Intel Core i7-14700HX, NVIDIA GeForce RTX 4070 Laptop GPU (1.47.22.14 D3D12)
213 (26.4min, 161.7P1) fps
Aorus 16X 2024
Intel Core i9-14900HX, NVIDIA GeForce RTX 4070 Laptop GPU (1.47.22.14 D3D12)
204 (69.2min, 153P1) fps -4%
Przeciętny NVIDIA GeForce RTX 4070 Laptop GPU
  (76.3 - 234, n=62)
196.3 fps -8%
HP Omen Transcend 16-u1095ng
Intel Core i9-14900HX, NVIDIA GeForce RTX 4070 Laptop GPU (1.47.22.14 D3D12)
194.2 (59.2min, 144.5P1) fps -9%
Dota 2 Reborn - 1920x1080 ultra (3/3) best looking
Lenovo Legion Pro 5 16IRX9
Intel Core i9-14900HX, NVIDIA GeForce RTX 4070 Laptop GPU
185.3 (161min) fps +2%
Acer Predator Helios Neo 16 (2024)
Intel Core i7-14700HX, NVIDIA GeForce RTX 4070 Laptop GPU
181.7 (153.5min) fps
Aorus 16X 2024
Intel Core i9-14900HX, NVIDIA GeForce RTX 4070 Laptop GPU
180.9 (156.5min) fps 0%
Acer Predator Helios Neo 16 (2024)
Intel Core i7-14700HX, NVIDIA GeForce RTX 4070 Laptop GPU (Turbo)
175.4 (152.2min) fps -3%
HP Omen Transcend 16-u1095ng
Intel Core i9-14900HX, NVIDIA GeForce RTX 4070 Laptop GPU
154.1 (133.3min) fps -15%
Średnia w klasie Gaming
  (65.1 - 220, n=167, ostatnie 2 lata)
149.7 fps -18%
Przeciętny NVIDIA GeForce RTX 4070 Laptop GPU
  (89.7 - 191.2, n=66)
147.8 fps -19%
Alienware m16 R2
Intel Core Ultra 7 155H, NVIDIA GeForce RTX 4070 Laptop GPU
139.7 (120.9min) fps -23%
Asus TUF Gaming A17 FA707XI-NS94
AMD Ryzen 9 7940HS, NVIDIA GeForce RTX 4070 Laptop GPU
130 (113.9min) fps -28%
X-Plane 11.11 - 1920x1080 high (fps_test=3)
Lenovo Legion Pro 5 16IRX9
Intel Core i9-14900HX, NVIDIA GeForce RTX 4070 Laptop GPU
137.6 fps +9%
Aorus 16X 2024
Intel Core i9-14900HX, NVIDIA GeForce RTX 4070 Laptop GPU
126.4 fps 0%
Acer Predator Helios Neo 16 (2024)
Intel Core i7-14700HX, NVIDIA GeForce RTX 4070 Laptop GPU
126.3 fps
Acer Predator Helios Neo 16 (2024)
Intel Core i7-14700HX, NVIDIA GeForce RTX 4070 Laptop GPU (Turbo)
123.6 fps -2%
HP Omen Transcend 16-u1095ng
Intel Core i9-14900HX, NVIDIA GeForce RTX 4070 Laptop GPU
114.9 fps -9%
Średnia w klasie Gaming
  (32.8 - 166.2, n=170, ostatnie 2 lata)
106 fps -16%
Przeciętny NVIDIA GeForce RTX 4070 Laptop GPU
  (52.1 - 147.9, n=68)
103.8 fps -18%
Alienware m16 R2
Intel Core Ultra 7 155H, NVIDIA GeForce RTX 4070 Laptop GPU
90.8 fps -28%
Asus TUF Gaming A17 FA707XI-NS94
AMD Ryzen 9 7940HS, NVIDIA GeForce RTX 4070 Laptop GPU
80.7 fps -36%
Cyberpunk 2077 2.2 Phantom Liberty
1920x1080 Ultra Preset (FSR off)
Acer Predator Helios Neo 16 (2024)
Intel Core i7-14700HX, NVIDIA GeForce RTX 4070 Laptop GPU (2.02, Turbo)
90.5 (25.3min) fps +9%
Lenovo Legion Pro 5 16IRX9
Intel Core i9-14900HX, NVIDIA GeForce RTX 4070 Laptop GPU (2.02)
87.1 (52.5min) fps +5%
Asus TUF Gaming A17 FA707XI-NS94
AMD Ryzen 9 7940HS, NVIDIA GeForce RTX 4070 Laptop GPU (2.02)
86.3 (61.1min) fps +4%
Średnia w klasie Gaming
  (6.76 - 144.7, n=85, ostatnie 2 lata)
86.1 fps +3%
Acer Predator Helios Neo 16 (2024)
Intel Core i7-14700HX, NVIDIA GeForce RTX 4070 Laptop GPU (2.02)
83.3 (37.9min) fps
Alienware m16 R2
Intel Core Ultra 7 155H, NVIDIA GeForce RTX 4070 Laptop GPU (2.02)
83.1 (28.4min) fps 0%
Przeciętny NVIDIA GeForce RTX 4070 Laptop GPU
  (30.7 - 90.7, n=38)
79 fps -5%
Aorus 16X 2024
Intel Core i9-14900HX, NVIDIA GeForce RTX 4070 Laptop GPU (2.02)
75.8 (32.9min) fps -9%
2560x1440 Ultra Preset (FSR off)
Średnia w klasie Gaming
  (24.8 - 110, n=69, ostatnie 2 lata)
63.6 fps +23%
Acer Predator Helios Neo 16 (2024)
Intel Core i7-14700HX, NVIDIA GeForce RTX 4070 Laptop GPU (2.02, Turbo)
53 (33.8min) fps +3%
Lenovo Legion Pro 5 16IRX9
Intel Core i9-14900HX, NVIDIA GeForce RTX 4070 Laptop GPU (2.02)
52.8 (33.2min) fps +2%
Alienware m16 R2
Intel Core Ultra 7 155H, NVIDIA GeForce RTX 4070 Laptop GPU (2.02)
52.7 (40.5min) fps +2%
Asus TUF Gaming A17 FA707XI-NS94
AMD Ryzen 9 7940HS, NVIDIA GeForce RTX 4070 Laptop GPU (2.02)
51.8 (39.2min) fps 0%
Acer Predator Helios Neo 16 (2024)
Intel Core i7-14700HX, NVIDIA GeForce RTX 4070 Laptop GPU
51.7 fps
Aorus 16X 2024
Intel Core i9-14900HX, NVIDIA GeForce RTX 4070 Laptop GPU (2.02)
49.4 (29.5min) fps -4%
Przeciętny NVIDIA GeForce RTX 4070 Laptop GPU
  (24.8 - 57.1, n=35)
48.8 fps -6%
1920x1080 Ray Tracing Ultra Preset (DLSS off)
Acer Predator Helios Neo 16 (2024)
Intel Core i7-14700HX, NVIDIA GeForce RTX 4070 Laptop GPU (2.02, Turbo)
45.2 (25.9min) fps +4%
Średnia w klasie Gaming
  (11.9 - 77.7, n=57, ostatnie 2 lata)
45.2 fps +4%
Lenovo Legion Pro 5 16IRX9
Intel Core i9-14900HX, NVIDIA GeForce RTX 4070 Laptop GPU (2.02)
44.8 (15.7min) fps +3%
Asus TUF Gaming A17 FA707XI-NS94
AMD Ryzen 9 7940HS, NVIDIA GeForce RTX 4070 Laptop GPU (2.02)
43.6 (33.4min) fps 0%
Acer Predator Helios Neo 16 (2024)
Intel Core i7-14700HX, NVIDIA GeForce RTX 4070 Laptop GPU (2.02)
43.4 (19.4min) fps
Alienware m16 R2
Intel Core Ultra 7 155H, NVIDIA GeForce RTX 4070 Laptop GPU (2.02)
42.4 (28.4min) fps -2%
Aorus 16X 2024
Intel Core i9-14900HX, NVIDIA GeForce RTX 4070 Laptop GPU (2.02)
40.9 (21.5min) fps -6%
Przeciętny NVIDIA GeForce RTX 4070 Laptop GPU
  (19.1 - 46.8, n=22)
40.2 fps -7%
Baldur's Gate 3
1920x1080 Ultra Preset
Alienware m16 R2
Intel Core Ultra 7 155H, NVIDIA GeForce RTX 4070 Laptop GPU
128.5 fps +10%
Lenovo Legion Pro 5 16IRX9
Intel Core i9-14900HX, NVIDIA GeForce RTX 4070 Laptop GPU
125.6 fps +7%
Acer Predator Helios Neo 16 (2024)
Intel Core i7-14700HX, NVIDIA GeForce RTX 4070 Laptop GPU
117 (72.8min, 80.4P0.1, 90.5P1) fps
Asus TUF Gaming A17 FA707XI-NS94
AMD Ryzen 9 7940HS, NVIDIA GeForce RTX 4070 Laptop GPU
114.7 fps -2%
Średnia w klasie Gaming
  (34.5 - 208, n=50, ostatnie 2 lata)
103.9 fps -11%
Przeciętny NVIDIA GeForce RTX 4070 Laptop GPU
  (66.7 - 128.5, n=28)
101.2 fps -14%
2560x1440 Ultra Preset
Lenovo Legion Pro 5 16IRX9
Intel Core i9-14900HX, NVIDIA GeForce RTX 4070 Laptop GPU
89.6 fps +8%
Alienware m16 R2
Intel Core Ultra 7 155H, NVIDIA GeForce RTX 4070 Laptop GPU
88.3 fps +7%
Acer Predator Helios Neo 16 (2024)
Intel Core i7-14700HX, NVIDIA GeForce RTX 4070 Laptop GPU
82.8 (61.9min, 63.9P0.1, 68.7P1) fps
Średnia w klasie Gaming
  (44 - 155.2, n=37, ostatnie 2 lata)
81.6 fps -1%
Asus TUF Gaming A17 FA707XI-NS94
AMD Ryzen 9 7940HS, NVIDIA GeForce RTX 4070 Laptop GPU
81.1 fps -2%
Przeciętny NVIDIA GeForce RTX 4070 Laptop GPU
  (54.4 - 89.6, n=23)
72.5 fps -12%
Assassin's Creed Mirage
1920x1080 Ultra High Preset (Adaptive Quality Off)
Acer Predator Helios Neo 16 (2024)
Intel Core i7-14700HX, NVIDIA GeForce RTX 4070 Laptop GPU
99 (3min, 25P0.1, 57P1) fps
Przeciętny NVIDIA GeForce RTX 4070 Laptop GPU
  (91 - 99, n=6)
96.8 fps -2%
Średnia w klasie Gaming
  (21 - 160, n=17, ostatnie 2 lata)
95.6 fps -3%
2560x1440 Ultra High Preset (Adaptive Quality Off)
Średnia w klasie Gaming
  (44 - 136, n=12, ostatnie 2 lata)
96.5 fps +21%
Acer Predator Helios Neo 16 (2024)
Intel Core i7-14700HX, NVIDIA GeForce RTX 4070 Laptop GPU
80 (4min) fps
Przeciętny NVIDIA GeForce RTX 4070 Laptop GPU
  (73 - 80, n=6)
76.2 fps -5%
Alan Wake 2
1920x1080 High Preset
Średnia w klasie Gaming
  (17.1 - 123.3, n=18, ostatnie 2 lata)
70.8 fps +3%
Acer Predator Helios Neo 16 (2024)
Intel Core i7-14700HX, NVIDIA GeForce RTX 4070 Laptop GPU
68.9 (30.8min, 35.8P0.1, 47.5P1) fps
Przeciętny NVIDIA GeForce RTX 4070 Laptop GPU
  (65.1 - 71, n=6)
68.7 fps 0%
2560x1440 High Preset
Średnia w klasie Gaming
  (22.5 - 87.1, n=13, ostatnie 2 lata)
62 fps +42%
Acer Predator Helios Neo 16 (2024)
Intel Core i7-14700HX, NVIDIA GeForce RTX 4070 Laptop GPU
43.8 (12.5min, 22.8P0.1, 27.7P1) fps
Przeciętny NVIDIA GeForce RTX 4070 Laptop GPU
  (40.2 - 44.5, n=6)
42.5 fps -3%
Horizon Forbidden West
1920x1080 Very High Preset AA:T
Acer Predator Helios Neo 16 (2024)
Intel Core i7-14700HX, NVIDIA GeForce RTX 4070 Laptop GPU
76.7 (55min, 57.7P0.1, 62P1) fps
Aorus 16X 2024
Intel Core i9-14900HX, NVIDIA GeForce RTX 4070 Laptop GPU
71.1 (30.5min, 44P0.1, 51.9P1) fps -7%
Średnia w klasie Gaming
  (14.7 - 125.2, n=11, ostatnie 2 lata)
65.7 fps -14%
Przeciętny NVIDIA GeForce RTX 4070 Laptop GPU
  (53.2 - 76.7, n=10)
64.4 fps -16%
2560x1440 Very High Preset AA:T
Acer Predator Helios Neo 16 (2024)
Intel Core i7-14700HX, NVIDIA GeForce RTX 4070 Laptop GPU
59.1 (46.9min, 47.4P0.1, 49.9P1) fps
Średnia w klasie Gaming
  (24.1 - 98, n=10, ostatnie 2 lata)
55.9 fps -5%
Aorus 16X 2024
Intel Core i9-14900HX, NVIDIA GeForce RTX 4070 Laptop GPU
54.5 (41.8min, 42.4P0.1, 45P1) fps -8%
Przeciętny NVIDIA GeForce RTX 4070 Laptop GPU
  (40.3 - 59.1, n=9)
51.3 fps -13%

Oceniamy stabilność liczby klatek na sekundę przy użyciu The Witcher 3, z grą uruchomioną przez około godzinę (maksymalne ustawienia, FHD). W tym czasie postać w grze nie jest poruszana. Po około 50 minutach liczba klatek na sekundę spada tylko o kilka punktów procentowych w trybie "Wydajność". tryb "Turbo" przeciwdziała temu zachowaniu.

The Witcher 3 FPS Chart

0102030405060708090100110120130Tooltip
Aorus 16X 2024 i9-14900HX, NVIDIA GeForce RTX 4070 Laptop GPU; FPS: Ø118.6 (114-123)
Acer Predator Helios Neo 16 (2024) i7-14700HX, NVIDIA GeForce RTX 4070 Laptop GPU: Ø124.9 (116-131)
Alienware m16 R2 Ultra 7 155H, NVIDIA GeForce RTX 4070 Laptop GPU: Ø110 (97-116)
HP Omen Transcend 16-u1095ng i9-14900HX, NVIDIA GeForce RTX 4070 Laptop GPU: Ø113.2 (109-118)
Asus TUF Gaming A17 FA707XI-NS94 R9 7940HS, NVIDIA GeForce RTX 4070 Laptop GPU: Ø111.2 (105-118)
Lenovo Legion Pro 5 16IRX9 i9-14900HX, NVIDIA GeForce RTX 4070 Laptop GPU: Ø118.3 (114-125)
Acer Predator Helios Neo 16 (2024) i7-14700HX, NVIDIA GeForce RTX 4070 Laptop GPU; Turbo: Ø125.8 (116-132)
The Witcher 3 (Performance)
The Witcher 3 (Turbo)
lowmed.highultraQHD
GTA V (2015) 187.3 185.9 180.9 127.8 95.2
The Witcher 3 (2015) 556.7 390.1 234.9 127.2 93.1
Dota 2 Reborn (2015) 232 208 194.9 181.7
Final Fantasy XV Benchmark (2018) 205 162.8 122.1 88.7
X-Plane 11.11 (2018) 192.8 161.7 126.3
Far Cry 5 (2018) 187 134 122 123 113
Strange Brigade (2018) 490 305 244 213 138.7
Baldur's Gate 3 (2023) 163 135.5 119.1 117 82.8
Cyberpunk 2077 2.2 Phantom Liberty (2023) 110.2 106.3 96.4 83.3 51.7
Assassin's Creed Mirage (2023) 150 141 133 99 80
Alan Wake 2 (2023) 82.8 76.3 68.9 43.8
Horizon Forbidden West (2024) 106.4 101.4 79.8 76.7 59.1

Emisje - laptop Acer wytwarza dużo hałasu

Emisja hałasu

Rozwój hałasu stanowi jedną z największych słabości Predatora. Zgodnie z oczekiwaniami dla swojej klasy, laptop wytwarza dużo hałasu pod obciążeniem. Ale nawet niskie obciążenie (pobieranie gry) prowadzi do słyszalnej pracy wentylatora, wytwarzając kilka świszczących dźwięków. Zachowanie to przejawia się nie tylko w trybach zasilania zorientowanych na wydajność, ale także w profilu "Silent". Okaże się, czy Acer będzie w stanie dostosować to w przyszłej aktualizacji. Możliwe jest również, że nasza jednostka testowa ma wadę.

Hałas

luz
27.8 / 32 / 29.6 dB
obciążenie
45.2 / 55.8 dB
  red to green bar
 
 
30 dB
cichy
40 dB(A)
słyszalny
50 dB(A)
irytujący
 
min: dark, med: mid, max: light   Earthworks M23R, Arta (odległość 15 cm)   hałas otoczenia: 25.2 dB(A)
dB(A) 0102030405060708090Deep BassMiddle BassHigh BassLower RangeMidsHigher MidsLower HighsMid HighsUpper HighsSuper Highs2040.441.340.442.241.138.641.12532.534.831.931.63534.135.33132.630.72929.528.832.528.54035.932.435.333.53330.436.85032.932.831.23333.635.938.26336.528.923.426.423.928.629.18034.621.822.718.219.51946.210024.524.121.319.319.517.530.412522.524.220.116.725.516.224.916025.324.320.817.320.116.227.520030.728.925.818.420.416.833.325030.529.326.315.719.913.332.431534.232.429.517.321.514.836.140037.234.931.618.223.61339.450037.835.832.319.223.512.840.863036.23430.816.92113.338.88003533.229.915.219.91238100036.134.230.414.219.912.439.2125041.339.136.115.822.212.244.2160044.241.837.815.923.712.946.8200042.940.136.215.621.212.746.3250041.338.733.918.820.112.845315041.838.633.714.418.713.145.640004137.532.514.716.513.344.850003935.430.214.414.713.243630040.23527.613.713.813.543.7800035.931.123.613.513.713.441.51000032.827.52013.513.713.238.81250029.123.517.513.513.513.135.11600025.124.916.212.91312.229.6SPL52.449.545.327.832.125.255.8N7.86.34.50.81.40.510median 36.1median 34median 29.9median 15.7median 19.9median 13.2median 39.2Delta5.95.55.71.83.21.25.7hearing rangehide median Fan NoiseAcer Predator Helios Neo 16 (2024)
Acer Predator Helios Neo 16 (2024)
NVIDIA GeForce RTX 4070 Laptop GPU, i7-14700HX, Samsung PM9A1a MZVL21T0HDLU
Aorus 16X 2024
NVIDIA GeForce RTX 4070 Laptop GPU, i9-14900HX, Gigabyte AG450E1024-SI
Alienware m16 R2
NVIDIA GeForce RTX 4070 Laptop GPU, Ultra 7 155H, Samsung PM9A1 MZVL21T0HCLR
HP Omen Transcend 16-u1095ng
NVIDIA GeForce RTX 4070 Laptop GPU, i9-14900HX, Kioxia XG8 KXG80ZNV1T02
Asus TUF Gaming A17 FA707XI-NS94
NVIDIA GeForce RTX 4070 Laptop GPU, R9 7940HS, WD PC SN560 SDDPNQE-1T00
Lenovo Legion Pro 5 16IRX9
NVIDIA GeForce RTX 4070 Laptop GPU, i9-14900HX, Samsung PM9A1 MZVL21T0HCLR
Noise
-7%
11%
3%
2%
7%
wyłączone / środowisko *
25.2
26
-3%
24.7
2%
24
5%
27.9
-11%
23.9
5%
Idle Minimum *
27.8
26
6%
25.3
9%
29
-4%
28.5
-3%
24.3
13%
Idle Average *
32
32
-0%
25.3
21%
30
6%
29.8
7%
24.3
24%
Idle Maximum *
29.6
38
-28%
25.3
15%
31
-5%
29.8
-1%
28.9
2%
Load Average *
45.2
54
-19%
31.7
30%
45
-0%
34.8
23%
45.8
-1%
Load Maximum *
55.8
55
1%
62
-11%
47
16%
57.3
-3%
56.6
-1%
Witcher 3 ultra *
50
53.8
44
57.1
51

* ... im mniej tym lepiej

Temperatury

Pod pełnym obciążeniem laptop nagrzewa się średnio umiarkowanie, ale w niektórych miejscach może to być dość znaczące. Na plus należy jednak zaliczyć fakt, że podpórka pod nadgarstki nadal pozostaje chłodna, osiągając wartości w dolnym zakresie 20°C (68°F). W codziennej pracy (Office, Internet) wartości pozostają w zielonym zakresie.

w stresie
 58 °C36 °C38 °C 
 33 °C43 °C37 °C 
 22 °C22.1 °C24 °C 
maks. w ogóle: 58 °C
średnia: 34.8 °C
45 °C45.2 °C33 °C
33.2 °C31.5 °C31.3 °C
27.7 °C26.3 °C25.7 °C
maks. w ogóle: 45.2 °C
średnia: 33.2 °C
zasilacz  51 °C | temperatura otoczenia 21.2 °C | Fluke t3000FC (calibrated), FIRT 550-Pocket
(±) Średnia temperatura górnej części przy maksymalnym obciążeniu wynosi 34.8 °C / 95 F, w porównaniu do średniej 33.9 °C / ###class_avg_f# ## F dla urządzeń w klasie Gaming.
(-) Maksymalna temperatura w górnej części wynosi 58 °C / 136 F, w porównaniu do średniej 40.4 °C / 105 F , począwszy od 21.2 do 68.8 °C dla klasy Gaming.
(-) Dno nagrzewa się maksymalnie do 45.2 °C / 113 F, w porównaniu do średniej 43.2 °C / 110 F
(+) W stanie bezczynności średnia temperatura górnej części wynosi 26.4 °C / 80 F, w porównaniu ze średnią temperaturą urządzenia wynoszącą 33.9 °C / ### class_avg_f### F.
(+) Podpórki pod nadgarstki i touchpad są chłodniejsze niż temperatura skóry i maksymalnie 24.6 °C / 76.3 F i dlatego są chłodne w dotyku.
(+) Średnia temperatura obszaru podparcia dłoni w podobnych urządzeniach wynosiła 28.9 °C / 84 F (+4.3 °C / 7.7 F).
Rozwój ciepła - góra (praca na biegu jałowym)
Wytwarzanie ciepła - dół (praca na biegu jałowym)
Rozwój ciepła - góra (obciążenie)
Wytwarzanie ciepła - dno (obciążenie)
Acer Predator Helios Neo 16 (2024)
Intel Core i7-14700HX, NVIDIA GeForce RTX 4070 Laptop GPU
Aorus 16X 2024
Intel Core i9-14900HX, NVIDIA GeForce RTX 4070 Laptop GPU
Alienware m16 R2
Intel Core Ultra 7 155H, NVIDIA GeForce RTX 4070 Laptop GPU
HP Omen Transcend 16-u1095ng
Intel Core i9-14900HX, NVIDIA GeForce RTX 4070 Laptop GPU
Asus TUF Gaming A17 FA707XI-NS94
AMD Ryzen 9 7940HS, NVIDIA GeForce RTX 4070 Laptop GPU
Lenovo Legion Pro 5 16IRX9
Intel Core i9-14900HX, NVIDIA GeForce RTX 4070 Laptop GPU
Heat
4%
-4%
1%
26%
-0%
Maximum Upper Side *
58
41
29%
44.8
23%
49
16%
40
31%
43.8
24%
Maximum Bottom *
45.2
41
9%
48
-6%
63
-39%
33.6
26%
55.4
-23%
Idle Upper Side *
31.1
37
-19%
37.2
-20%
30
4%
26.6
14%
32.8
-5%
Idle Bottom *
37.2
38
-2%
42
-13%
29
22%
24.4
34%
36
3%

* ... im mniej tym lepiej

Test warunków skrajnych

Nasz ekstremalny scenariusz testu obciążeniowego (z Prime95 i FurMark działającymi w sposób ciągły) ocenia stabilność systemu pod pełnym obciążeniem. Podczas gdy CPU i GPU rozpoczynają test z wysokimi prędkościami zegara, prędkości te zmieniają się w trakcie testu.

Predator podczas testu warunków skrajnych

Głośniki

Chociaż głośnikom stereo przydałoby się więcej basów, poza tym zapewniają przyzwoity dźwięk.

dB(A) 0102030405060708090Deep BassMiddle BassHigh BassLower RangeMidsHigher MidsLower HighsMid HighsUpper HighsSuper Highs2040.638.639.62534.234.131.7313032.532.14032.230.430.95027.735.928.56321.928.624.58022192010022.317.523.312525.516.231.316037.916.244.220051.316.855.725049.813.354.531549.714.853.640061.21366.250068.712.873.863062.713.368.280070.41275.8100068.612.472.5125065.412.269.9160065.512.970.1200068.112.772.6250060.712.865.631505813.162.9400064.413.369.2500069.513.272630059.713.564.3800063.213.467.51000060.113.2651250057.913.1631600056.812.262.1SPL77.725.282.1N39.20.551.3median 60.7median 13.2median 65.6Delta7.41.27.940.238.141.53751.448.536.534.544.244.429.432.924.739.221.449.129.258.225.563.323.564.621.26716.267.21470.614.377.615.777.812.574.711.770.211.666.911.970.512.369.312.872.913.370.814.176.813.770.91465.513.868.213.270.112.971.612.465.826.584.50.865.9median 13.8median 70.13.53.1hearing rangehide median Pink NoiseAcer Predator Helios Neo 16 (2024)Aorus 16X 2024
Wykres częstotliwości (pola wyboru można zaznaczyć i odznaczyć, aby porównać urządzenia)
Acer Predator Helios Neo 16 (2024) analiza dźwięku

(+) | głośniki mogą odtwarzać stosunkowo głośno (82.1 dB)
Bas 100 - 315 Hz
(-) | prawie brak basu - średnio 21.8% niższa od mediany
(±) | liniowość basu jest średnia (12% delta do poprzedniej częstotliwości)
Średnie 400 - 2000 Hz
(±) | wyższe średnie - średnio 5.6% wyższe niż mediana
(±) | liniowość środka jest średnia (10% delta do poprzedniej częstotliwości)
Wysokie 2–16 kHz
(+) | zrównoważone maksima - tylko 2.4% od mediany
(±) | liniowość wysokich wartości jest średnia (8.8% delta do poprzedniej częstotliwości)
Ogólnie 100 - 16.000 Hz
(±) | liniowość ogólnego dźwięku jest średnia (17.5% różnicy w stosunku do mediany)
W porównaniu do tej samej klasy
» 46% wszystkich testowanych urządzeń w tej klasie było lepszych, 12% podobnych, 42% gorszych
» Najlepszy miał deltę 6%, średnia wynosiła ###średnia###%, najgorsza wynosiła 132%
W porównaniu do wszystkich testowanych urządzeń
» 31% wszystkich testowanych urządzeń było lepszych, 8% podobnych, 61% gorszych
» Najlepszy miał deltę 4%, średnia wynosiła ###średnia###%, najgorsza wynosiła 134%

Aorus 16X 2024 analiza dźwięku

(+) | głośniki mogą odtwarzać stosunkowo głośno (85 dB)
Bas 100 - 315 Hz
(±) | zredukowany bas - średnio 8.5% niższy od mediany
(±) | liniowość basu jest średnia (8.3% delta do poprzedniej częstotliwości)
Średnie 400 - 2000 Hz
(+) | zbalansowane środki średnie - tylko 3.1% od mediany
(+) | średnie są liniowe (5.8% delta do poprzedniej częstotliwości)
Wysokie 2–16 kHz
(+) | zrównoważone maksima - tylko 2.5% od mediany
(±) | liniowość wysokich wartości jest średnia (7% delta do poprzedniej częstotliwości)
Ogólnie 100 - 16.000 Hz
(+) | ogólny dźwięk jest liniowy (8.4% różnicy w stosunku do mediany)
W porównaniu do tej samej klasy
» 1% wszystkich testowanych urządzeń w tej klasie było lepszych, 1% podobnych, 98% gorszych
» Najlepszy miał deltę 6%, średnia wynosiła ###średnia###%, najgorsza wynosiła 132%
W porównaniu do wszystkich testowanych urządzeń
» 2% wszystkich testowanych urządzeń było lepszych, 1% podobnych, 98% gorszych
» Najlepszy miał deltę 4%, średnia wynosiła ###średnia###%, najgorsza wynosiła 134%

Zarządzanie energią - Neo 16 oferuje tylko słabą żywotność baterii

Zużycie energii

Zarówno podczas bezczynności, jak i pracy na baterii, laptop Acer wykazuje zwiększone zużycie energii, które jest wyższe niż u porównywalnych konkurentów. W przeciwnym razie zużycie energii waha się na normalnym poziomie dla używanego sprzętu. Podczas gdy nasz test z The Witcher 3 przebiega ze stałym poborem mocy, zużycie zmienia się podczas kontynuacji testu warunków skrajnych. 330-watowa ładowarka zapewnia wystarczającą moc.

Pobór mocy
wyłączony / stan wstrzymaniadarklight 0.2 / 5.4 W
luzdarkmidlight 26.7 / 24.4 / 32.7 W
obciążenie midlight 122.1 / 241 W
 color bar
Legenda: min: dark, med: mid, max: light        Metrahit Energy
Acer Predator Helios Neo 16 (2024)
i7-14700HX, NVIDIA GeForce RTX 4070 Laptop GPU, Samsung PM9A1a MZVL21T0HDLU, LED, 2560x1600, 16"
Aorus 16X 2024
i9-14900HX, NVIDIA GeForce RTX 4070 Laptop GPU, Gigabyte AG450E1024-SI, IPS, 2560x1600, 16"
Alienware m16 R2
Ultra 7 155H, NVIDIA GeForce RTX 4070 Laptop GPU, Samsung PM9A1 MZVL21T0HCLR, IPS, 2560x1600, 16"
HP Omen Transcend 16-u1095ng
i9-14900HX, NVIDIA GeForce RTX 4070 Laptop GPU, Kioxia XG8 KXG80ZNV1T02, OLED, 2560x1600, 16"
Asus TUF Gaming A17 FA707XI-NS94
R9 7940HS, NVIDIA GeForce RTX 4070 Laptop GPU, WD PC SN560 SDDPNQE-1T00, IPS, 1920x1080, 17.3"
Przeciętny NVIDIA GeForce RTX 4070 Laptop GPU
 
Średnia w klasie Gaming
 
Power Consumption
12%
21%
18%
28%
27%
21%
Idle Minimum *
26.7
13
51%
8.1
70%
10
63%
6.2
77%
Idle Average *
24.4
18
26%
13
47%
18
26%
21.8
11%
Idle Maximum *
32.7
35
-7%
40.3
-23%
32
2%
22
33%
24.3 ?(9 - 55.4, n=56)
26%
Load Average *
122.1
138
-13%
79
35%
128
-5%
59.2
52%
Witcher 3 ultra *
190.6
172.6
9%
188.1
1%
148.4
22%
189.7
-0%
Load Maximum *
241
222
8%
254.9
-6%
242
-0%
247.8
-3%

* ... im mniej tym lepiej

Power Consumption The Witcher 3 / Stress Test

0153045607590105120135150165180195210225240Tooltip
Acer Predator Helios Neo 16 (2024); Witcher 3 ultra: Ø190.6 (179.2-203)
Acer Predator Helios Neo 16 (2024); 1280x720 Prime95 28.10 and Furmark 1.25: Ø174.7 (120.5-241)
Acer Predator Helios Neo 16 (2024); Idle 150cd/m2: Ø26.8 (21.3-32.6)

Power Consumption With External Monitor

0153045607590105120135150165180195210225Tooltip
Acer Predator Helios Neo 16 (2024); Prime95 V2810 Stress (external Monitor): Ø150 (144.6-186)
Acer Predator Helios Neo 16 (2024); 1280x720 FurMark 1.19 GPU Stress Test (external Monitor): Ø177.9 (169.4-226)
Acer Predator Helios Neo 16 (2024); 1920x1080 The Witcher 3 ultra (external Monitor): Ø181.8 (175.6-198.4)
Acer Predator Helios Neo 16 (2024); Idle 1min (external Monitor): Ø26.6 (21.3-39.5)

Żywotność baterii

Czas pracy na baterii okazuje się ogólnie kiepski: Wartości około 4 godzin w naszym teście WiFi ładującym strony internetowe za pomocą skryptu i teście wideo odtwarzającym krótki film Big Buck Bunny (kodowanie H.264, FHD) w ciągłej pętli nie odpowiadają już obecnym standardom. Przy porównywalnej pojemności baterii, konkurenci wykazują się znacznie lepszą wytrzymałością. Wysoki pobór mocy Heliosa ma tutaj negatywny wpływ. Testy żywotności baterii zostały przeprowadzone z włączonym Optimusem.

Wydajność akumulatora
luz
5h 56min
WiFi Websurfing (Edge 124)
3h 47min
Big Buck Bunny H.264 1080p
4h 02min
obciążenie
1h 19min
Acer Predator Helios Neo 16 (2024)
i7-14700HX, NVIDIA GeForce RTX 4070 Laptop GPU, 90.61 Wh
Aorus 16X 2024
i9-14900HX, NVIDIA GeForce RTX 4070 Laptop GPU, 99 Wh
Alienware m16 R2
Ultra 7 155H, NVIDIA GeForce RTX 4070 Laptop GPU, 90 Wh
HP Omen Transcend 16-u1095ng
i9-14900HX, NVIDIA GeForce RTX 4070 Laptop GPU, 97 Wh
Asus TUF Gaming A17 FA707XI-NS94
R9 7940HS, NVIDIA GeForce RTX 4070 Laptop GPU, 90 Wh
Lenovo Legion Pro 5 16IRX9
i9-14900HX, NVIDIA GeForce RTX 4070 Laptop GPU, 80 Wh
Średnia w klasie Gaming
 
Czasy pracy
94%
67%
29%
134%
8%
53%
Reader / Idle
356
753
112%
758
113%
1180
231%
403
13%
H.264
242
541
124%
WiFi v1.3
227
481
112%
483
113%
292
29%
548
141%
290
28%
Load
79
100
27%
60
-24%
103
30%
65
-18%

Za

+ jasny wyświetlacz QHD+ w formacie 16:10 (240 Hz, G-Sync, DCI-P3)
+ dwa gniazda na dyski SSD (PCIe 4, M.2-2280)
+ rozszerzalna/wymienna pamięć robocza
+ Podświetlenie klawiatury RGB
+ pasta termoprzewodząca wykonana z ciekłego metalu
+ Thunderbolt 4
+ Power Delivery

Przeciw

- głośny
- wysoki pobór mocy w trybie bezczynności i przy niskim obciążeniu
- słaba żywotność baterii
- 8 GB pamięci VRAM nie jest przyszłościowe
- powolny czytnik kart pamięci

Werdykt - Potężny laptop, który boryka się z pewnymi problemami

Acer Predator Helios Neo 16 PHN16-72-73Q5, jednostka testowa dostarczona przez Acer Germany.

Helios Neo 16 jest skierowany do graczy i twórców i ma na pokładzie odpowiedni sprzęt Core i7-14700HX, GeForce RTX 4070i jasny 16-calowy wyświetlacz (2560x1600 pikseli, DCI-P3, G-Sync, 240 Hz) w formacie 16:10. CPU i GPU są w stanie pracować ze stale wysokimi taktowaniami, a szybki dysk SSD PCIe 4 (1 TB) zapewnia krótkie czasy ładowania.

Acer Predator Helios Neo 16 oferuje wysoką wydajność i dobry poziom wyposażenia, ale wykazuje też pewne słabości.

Dwa porty USB-C (Thunderbolt 4) ułatwiają integrację laptopa z istniejącymi ustawieniami miejsca pracy, umożliwiając także pewne opcje rozbudowy, takie jak użycie zewnętrznego GPU lub stacji dokującej. Oba porty są w stanie wyprowadzić sygnał DisplayPort, a także obsługują Power Delivery.

Początkowe dobre wrażenie z laptopa jest zepsute przez zużycie energii i wartości emisji: Podczas bezczynnej pracy i przy niskim obciążeniu wentylatory pracują zbyt intensywnie i często osiągają zbyt wysokie obroty. W tych samych warunkach pobór mocy również okazuje się zbyt wysoki, co skutkuje stosunkowo słabą żywotnością baterii. Być może Acer będzie w stanie naprawić te problemy za pomocą przyszłej aktualizacji BIOS-u. Nie możemy również wykluczyć wady naszej jednostki testowej, ponieważ w przeciwnym razie nie bylibyśmy w stanie polecić jej zakupu.

Alternatywą może być Aorus 16X (2024), który oferuje porównywalną wydajność obliczeniową, ale zapewnia znacznie dłuższy czas pracy na baterii.

Cena i dostępność

Podobny model do naszej jednostki testowej Predator Helios Neo 16 jest dostępny w Stanach Zjednoczonych w sklepie internetowym Acer za około 1700 USDa podstawowe modele z tej serii (Core i7-14650HX, GeForce RTX 4060, 16 GB RAM, 1 TB SSD) zaczynają się od 1200 USD. Niektóre modele są również dostępne na Amazon od ~ 1000 USD.

Acer Predator Helios Neo 16 (2024) - 29/04/2024 v7 (old)
Sascha Mölck

Wykonanie
75 / 98 → 76%
Klawiatura
80%
Myszka
86%
Komunikacja
69 / 80 → 87%
Waga
59 / 10-66 → 87%
Akumulator
56 / 95 → 59%
Wyświetlacz
91%
Wydajność w grach
99%
Wydajność w programach użytkowych
97%
Hałas
70 / 90 → 77%
Głośniki
74%
Kamerka
47 / 85 → 55%
Średnio
75%
87%
Gaming - Ważona średnia

Przezroczystość

Wyboru urządzeń do recenzji dokonuje nasza redakcja. Próbka testowa została udostępniona autorowi jako pożyczka od producenta lub sprzedawcy detalicznego na potrzeby tej recenzji. Pożyczkodawca nie miał wpływu na tę recenzję, producent nie otrzymał też kopii tej recenzji przed publikacją. Nie było obowiązku publikowania tej recenzji. Nigdy nie przyjmujemy rekompensaty ani płatności w zamian za nasze recenzje. Jako niezależna firma medialna, Notebookcheck nie podlega władzy producentów, sprzedawców detalicznych ani wydawców.

Tak testuje Notebookcheck

Każdego roku Notebookcheck niezależnie sprawdza setki laptopów i smartfonów, stosując standardowe procedury, aby zapewnić porównywalność wszystkich wyników. Od około 20 lat stale rozwijamy nasze metody badawcze, ustanawiając przy tym standardy branżowe. W naszych laboratoriach testowych doświadczeni technicy i redaktorzy korzystają z wysokiej jakości sprzętu pomiarowego. Testy te obejmują wieloetapowy proces walidacji. Nasz kompleksowy system ocen opiera się na setkach uzasadnionych pomiarów i benchmarków, co pozwala zachować obiektywizm.

Price comparison

Please share our article, every link counts!
Mail Logo
> laptopy testy i recenzje notebooki > Laptopy > Recenzja Acer Predator Helios Neo 16 (2024): Laptop do gier z RTX 4070 i panelem DCI-P3
Sascha Mölck, 2024-05- 9 (Update: 2024-05- 9)