

Recenzja laptopa 2 w 1 Dell Latitude 7450: Wszechstronny biznesowy laptop konwertowalny, który sprawdza się na większości frontów
Obliczone ruchy biznesowe.
Dell Latitude 7450 2-in-1 zapewnia dobrą wydajność dzięki procesorowi Intel Core Ultra 7 165U vPro, oferując jednocześnie solidny zestaw funkcji dostosowanych do potrzeb profesjonalistów biznesowych w podróży. Dell zawiera nawet solidną gamę narzędzi, które zadowolą administratorów IT. Ulepszenia w stosunku do poprzednika są jednak przyrostowe, a konkurenci, w szczególności nowa linia Lenovo ThinkPad, prezentują równie atrakcyjne opcje.Vaidyanathan Subramaniam, 👁 Vaidyanathan Subramaniam (tłumaczenie DeepL / Ninh Duy) Opublikowany 🇺🇸 🇹🇷 ...
Werdykt: Stopniowe, ale mile widziane ulepszenie generacji, które robi wiele rzeczy dobrze
Dell Latitude 7450 2-w-1 to wszechstronny i wydajny komputer konwertowalny dla użytkowników biznesowych w podróży. Aluminiowa konstrukcja jest solidna, bez wygięć i ostrych narożników, a waga jest prawie odpowiednia.
Pomimo smukłej konstrukcji, Latitude 7450 2-in-1 oferuje solidny zestaw opcji łączności, a karta Wi-Fi 7 WLAN zapewnia imponującą przepustowość. Klawiatura i touchpad nie stanowią przeszkody w satysfakcjonującym wprowadzaniu danych.
Ekran dotykowy FHD+ IPS o częstotliwości odświeżania 60 Hz jest odpowiedni dla typowych użytkowników biznesowych dzięki przyzwoitej jasności, pełnemu pokryciu kolorów sRGB i braku PWM. Ogólna wydajność Latitude 7450 2-in-1 jest zgodna z oczekiwaniami dla laptopa z procesorem Intel Core Ultra 7 165U, a konstrukcja Dell jest w stanie zapewnić niskie temperatury powierzchni, umiarkowany poziom hałasu wentylatora i niski pobór mocy w trybie bezczynności.
Istnieje jednak kilka obszarów wymagających poprawy. Jakość kamery internetowej jest zadowalająca, ale z pewnością mogłaby być lepsza, biorąc pod uwagę fakt, że konkurencja już zaczęła przechodzić na czujniki 5 MP lub wyższe.
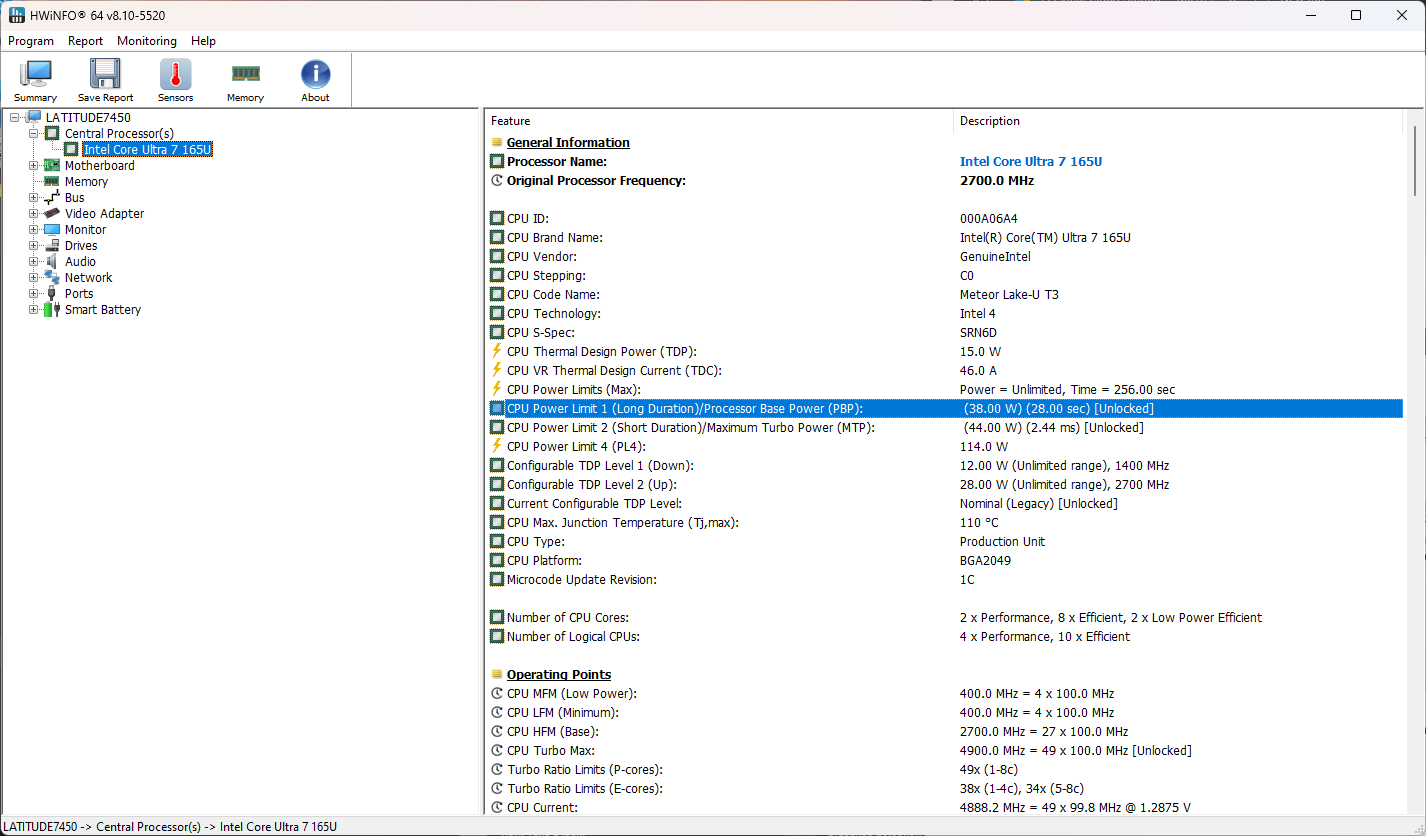
Początkowa wydajność urządzenia była dość słaba, szczególnie w testach jednordzeniowych, co wymagało aktualizacji BIOS-u w celu poprawy. Mimo to procesor ma trudności z utrzymaniem 44 W PL2 w obciążeniach wielordzeniowych. Jest to coś, o czym należy pamiętać, jeśli planują Państwo uruchamiać mocno wielowątkowe aplikacje.
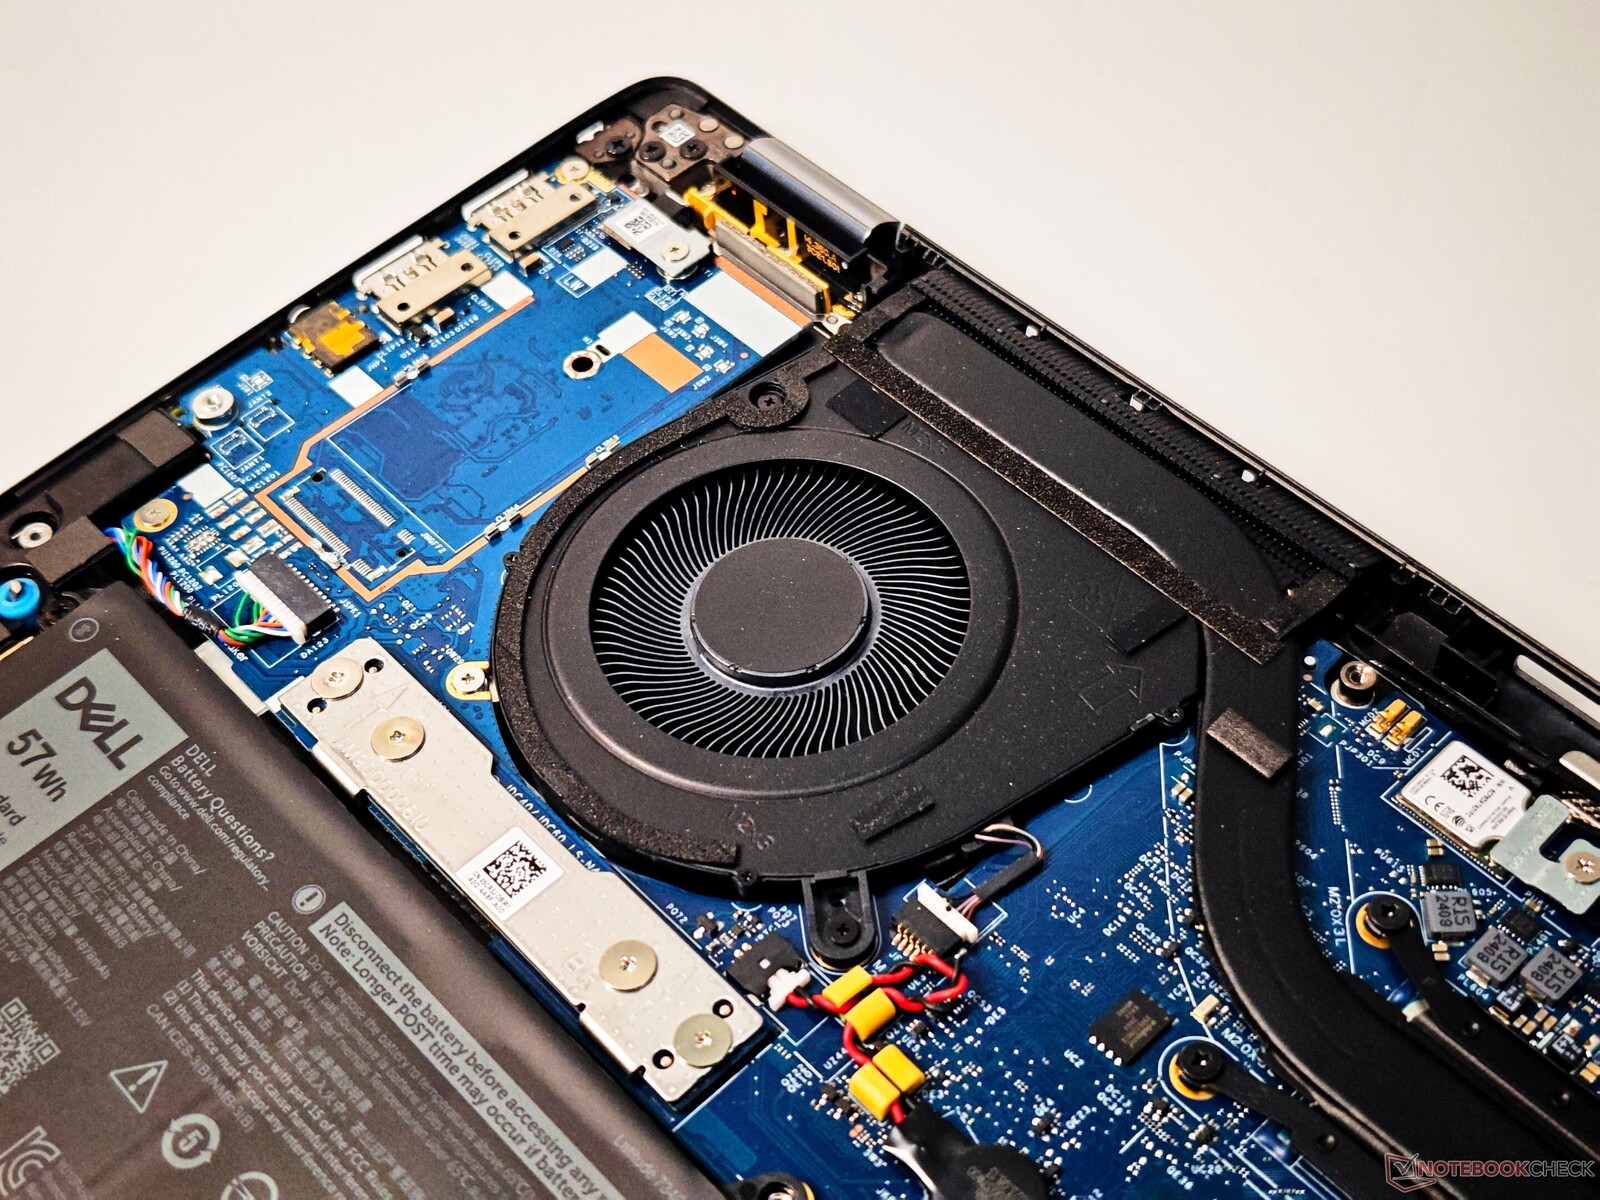
Będą Państwo musieli dokładnie ocenić swoje wymagania biznesowe i odpowiednio skonfigurować zakup, ponieważ nie ma prawie żadnego zakresu zmian wewnętrznych, z wyjątkiem wymiany pojedynczego dysku SSD.
Podczas gdy Latitude 7450 2-in-1 ma kilka zalet, nie ma zbyt wielu istotnych powodów, które uzasadniałyby natychmiastową aktualizację z Latitude 7440.
Za
Przeciw
Cena i dostępność
Dell Latitude 7450 2-w-1 z procesorem Intel Core Ultra 7 165U vPro kosztuje obecnie 2 229 USD w Dell US. Amazon US oferuje wariant z dyskiem SSD o pojemności 256 GB za 1 845 USD.
Strona internetowa Dell India pokazuje znacznie 2,5-krotnie wyższą cenę, wynoszącą 4 22 011 jenów za testowaną konfigurację. Model Latitude 7450 2-in-1 jest również wymieniony na Amazon India, ale jego dostępność jest obecnie nieznana.
Porównanie możliwych alternatyw
Obraz | Model / recenzja | Geizhals | Waga | Wysokość | Ekran |
|---|---|---|---|---|---|
1. 87.7%  | Dell Latitude 7450 2-in-1 Intel Core Ultra 7 165U ⎘ Intel Graphics 4-Core iGPU (Arc) ⎘ 32 GB Pamięć, 512 GB SSD | 1.5 kg | 17.1 mm | 14.00" 1920x1200 162 PPI IPS | |
2. 88.4% v7 (old)  | Lenovo ThinkPad X1 2in1 G9 21KE004AGE Intel Core Ultra 7 165U ⎘ Intel Graphics 4-Core iGPU (Arc) ⎘ 32 GB Pamięć, 1024 GB SSD | 1.3 kg | 15.5 mm | 14.00" 2880x1800 243 PPI OLED | |
3. 88.3% v7 (old)  | Dell Latitude 9450 2-in-1 Intel Core Ultra 7 165U ⎘ Intel Graphics 4-Core iGPU (Arc) ⎘ 32 GB Pamięć | 1.6 kg | 16.28 mm | 14.00" 2560x1600 216 PPI IPS | |
4. 83.3%  | Dell Latitude 7350 Detachable Intel Core Ultra 7 164U ⎘ Intel Graphics 4-Core iGPU (Arc) ⎘ 32 GB Pamięć, 1024 GB SSD | 865 g | 8.9 mm | 13.00" 2880x1920 266 PPI IPS | |
5. 90.4% v7 (old)  | Lenovo ThinkPad T14 G4 21K4S02000 AMD Ryzen 7 PRO 7840U ⎘ AMD Radeon 780M ⎘ 32 GB Pamięć, 1024 GB SSD | 1.5 kg | 17.9 mm | 14.00" 1920x1200 162 PPI IPS LED | |
6. 87.2%  | HP EliteBook x360 1040 G11 Intel Core Ultra 7 165H ⎘ Intel Arc 8-Core iGPU ⎘ 16 GB Pamięć, 512 GB SSD | 1.5 kg | 14.7 mm | 14.00" 1920x1200 162 PPI IPS |
Spis treści
- Werdykt: Stopniowe, ale mile widziane ulepszenie generacji, które robi wiele rzeczy dobrze
- Specyfikacje
- Obudowa i łączność: Aluminiowa konstrukcja klasy premium z przyzwoitymi wejściami/wyjściami
- Urządzenia wejściowe: Ekran dotykowy z obsługą pióra i atramentu
- Wyświetlacz: panel FHD+ IPS 60 Hz bez PWM
- Wydajność: Zmagania Core Ultra 7 165U vPro utrzymujące 44 W PL2 przez długi czas
- Emisje i zużycie energii: Niska temperatura powierzchni i oszczędne zużycie energii
- Notebookcheck Rating
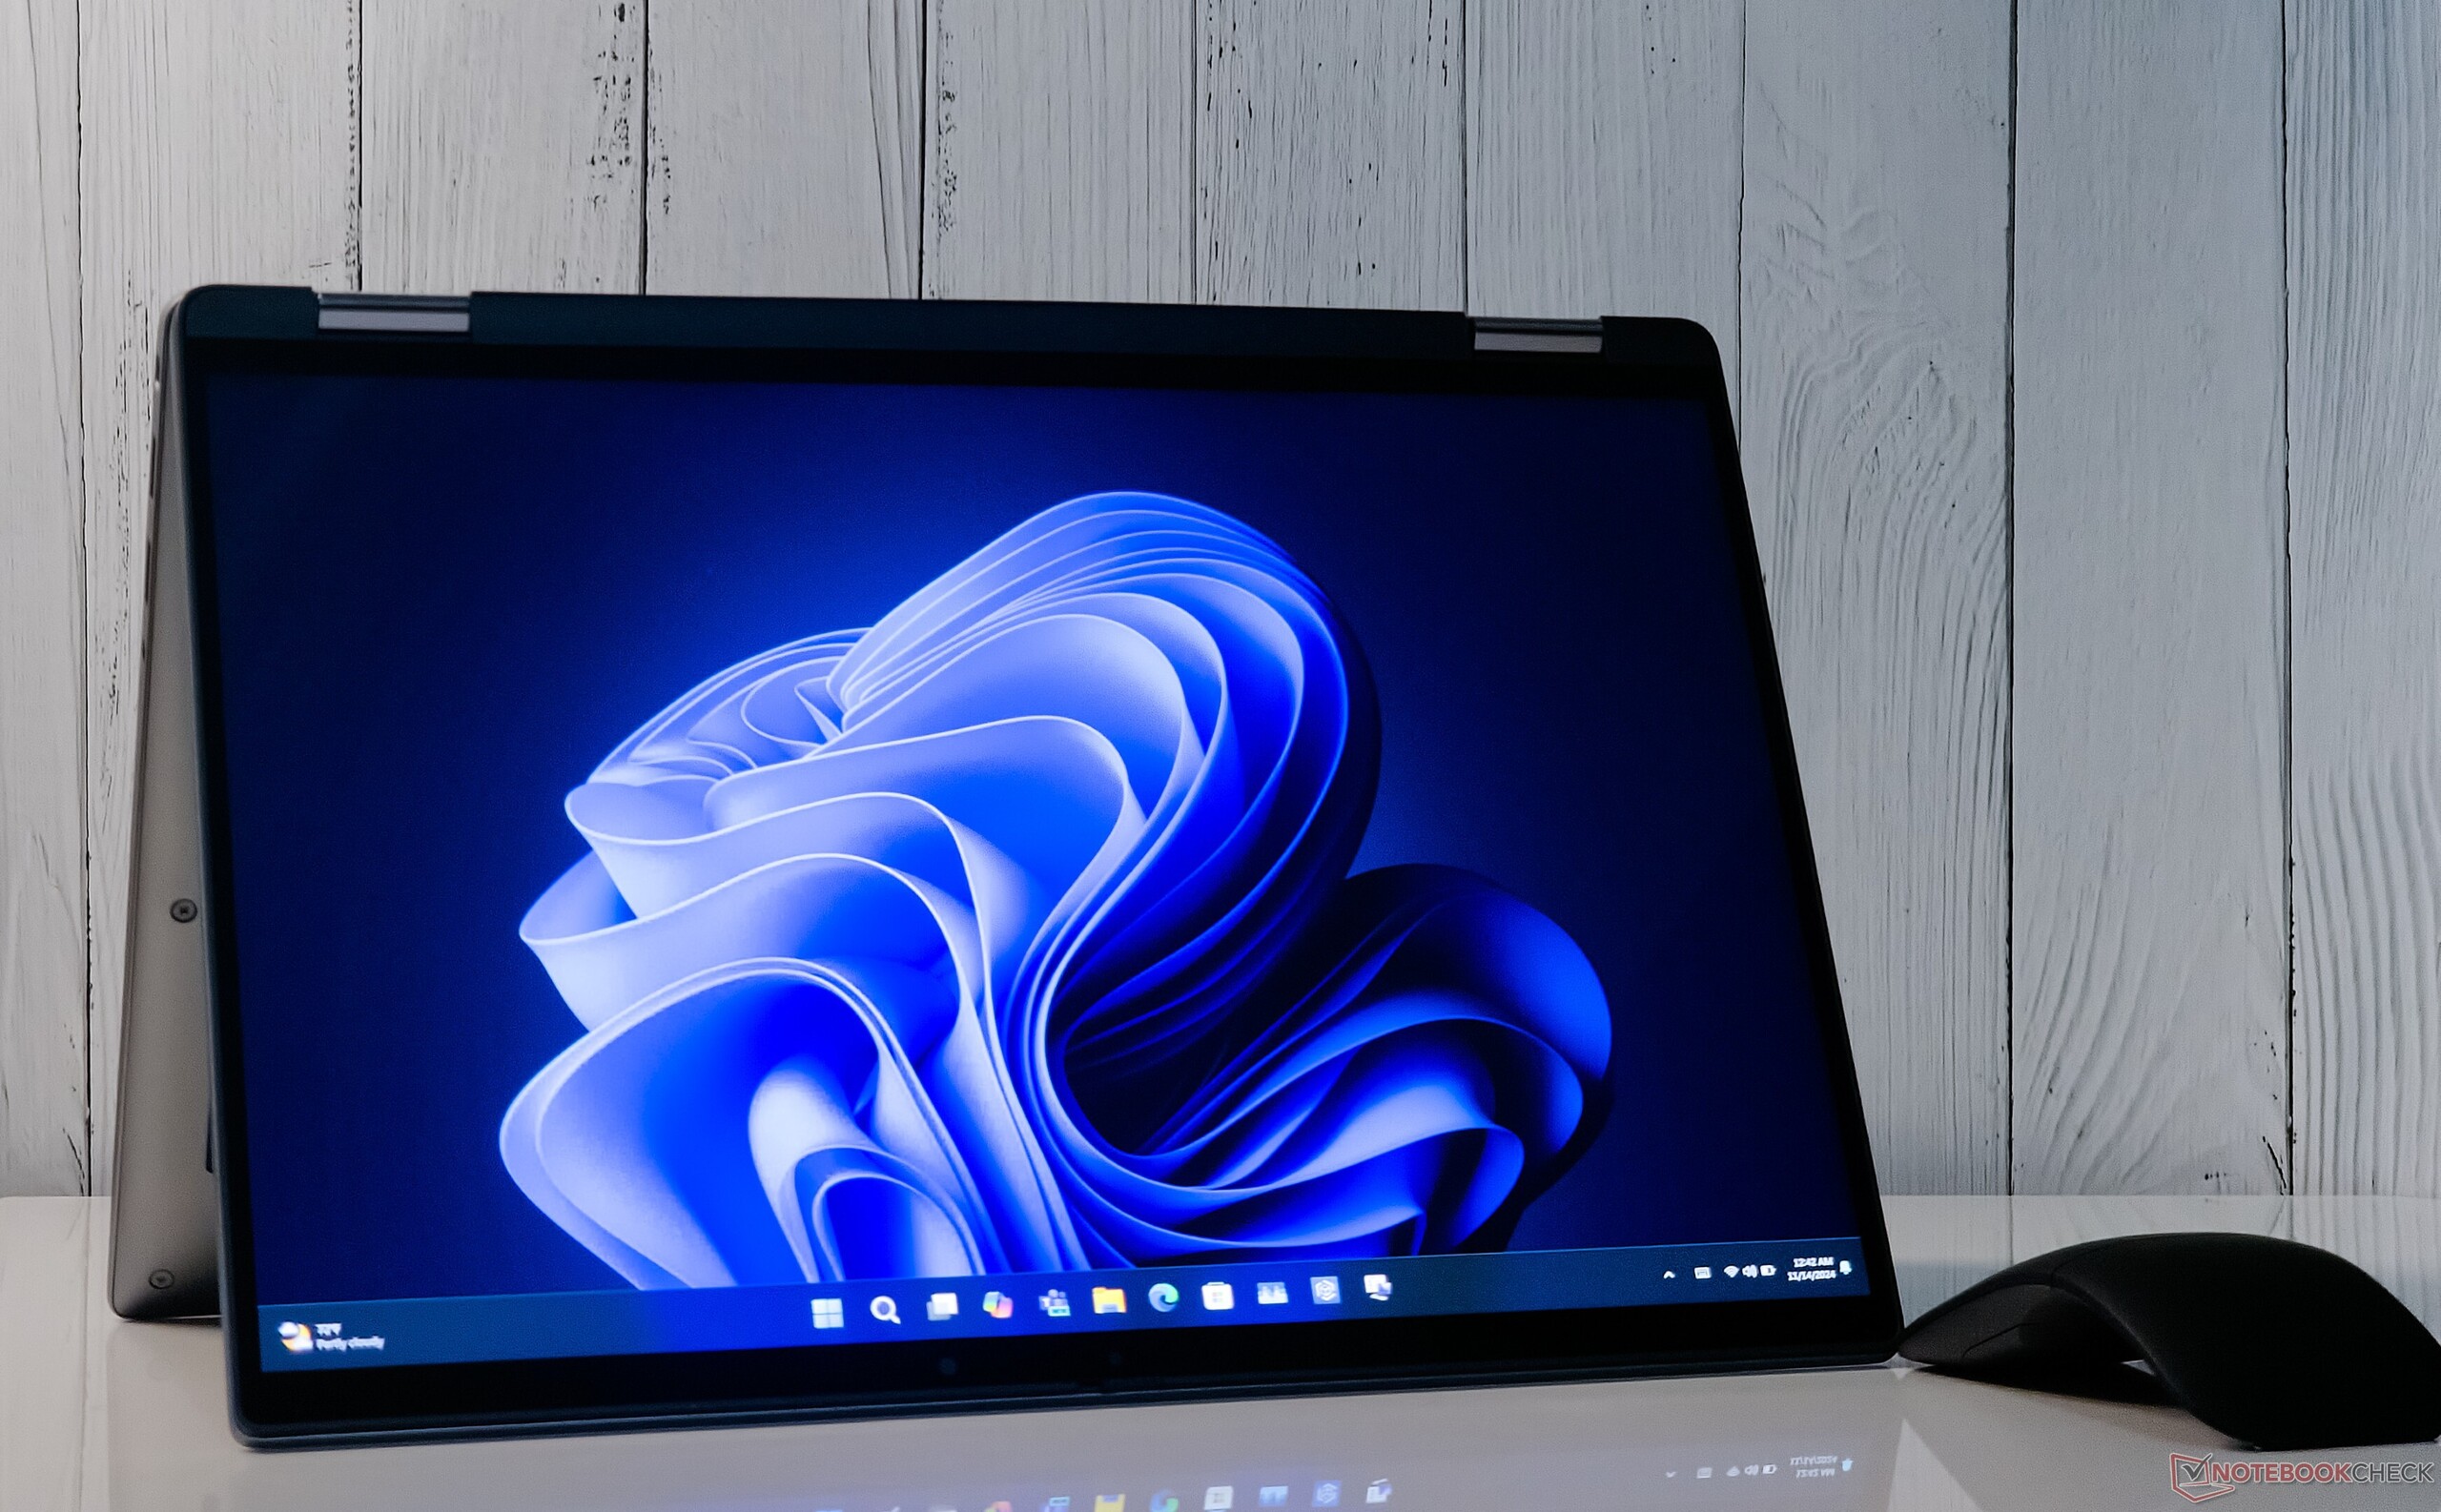
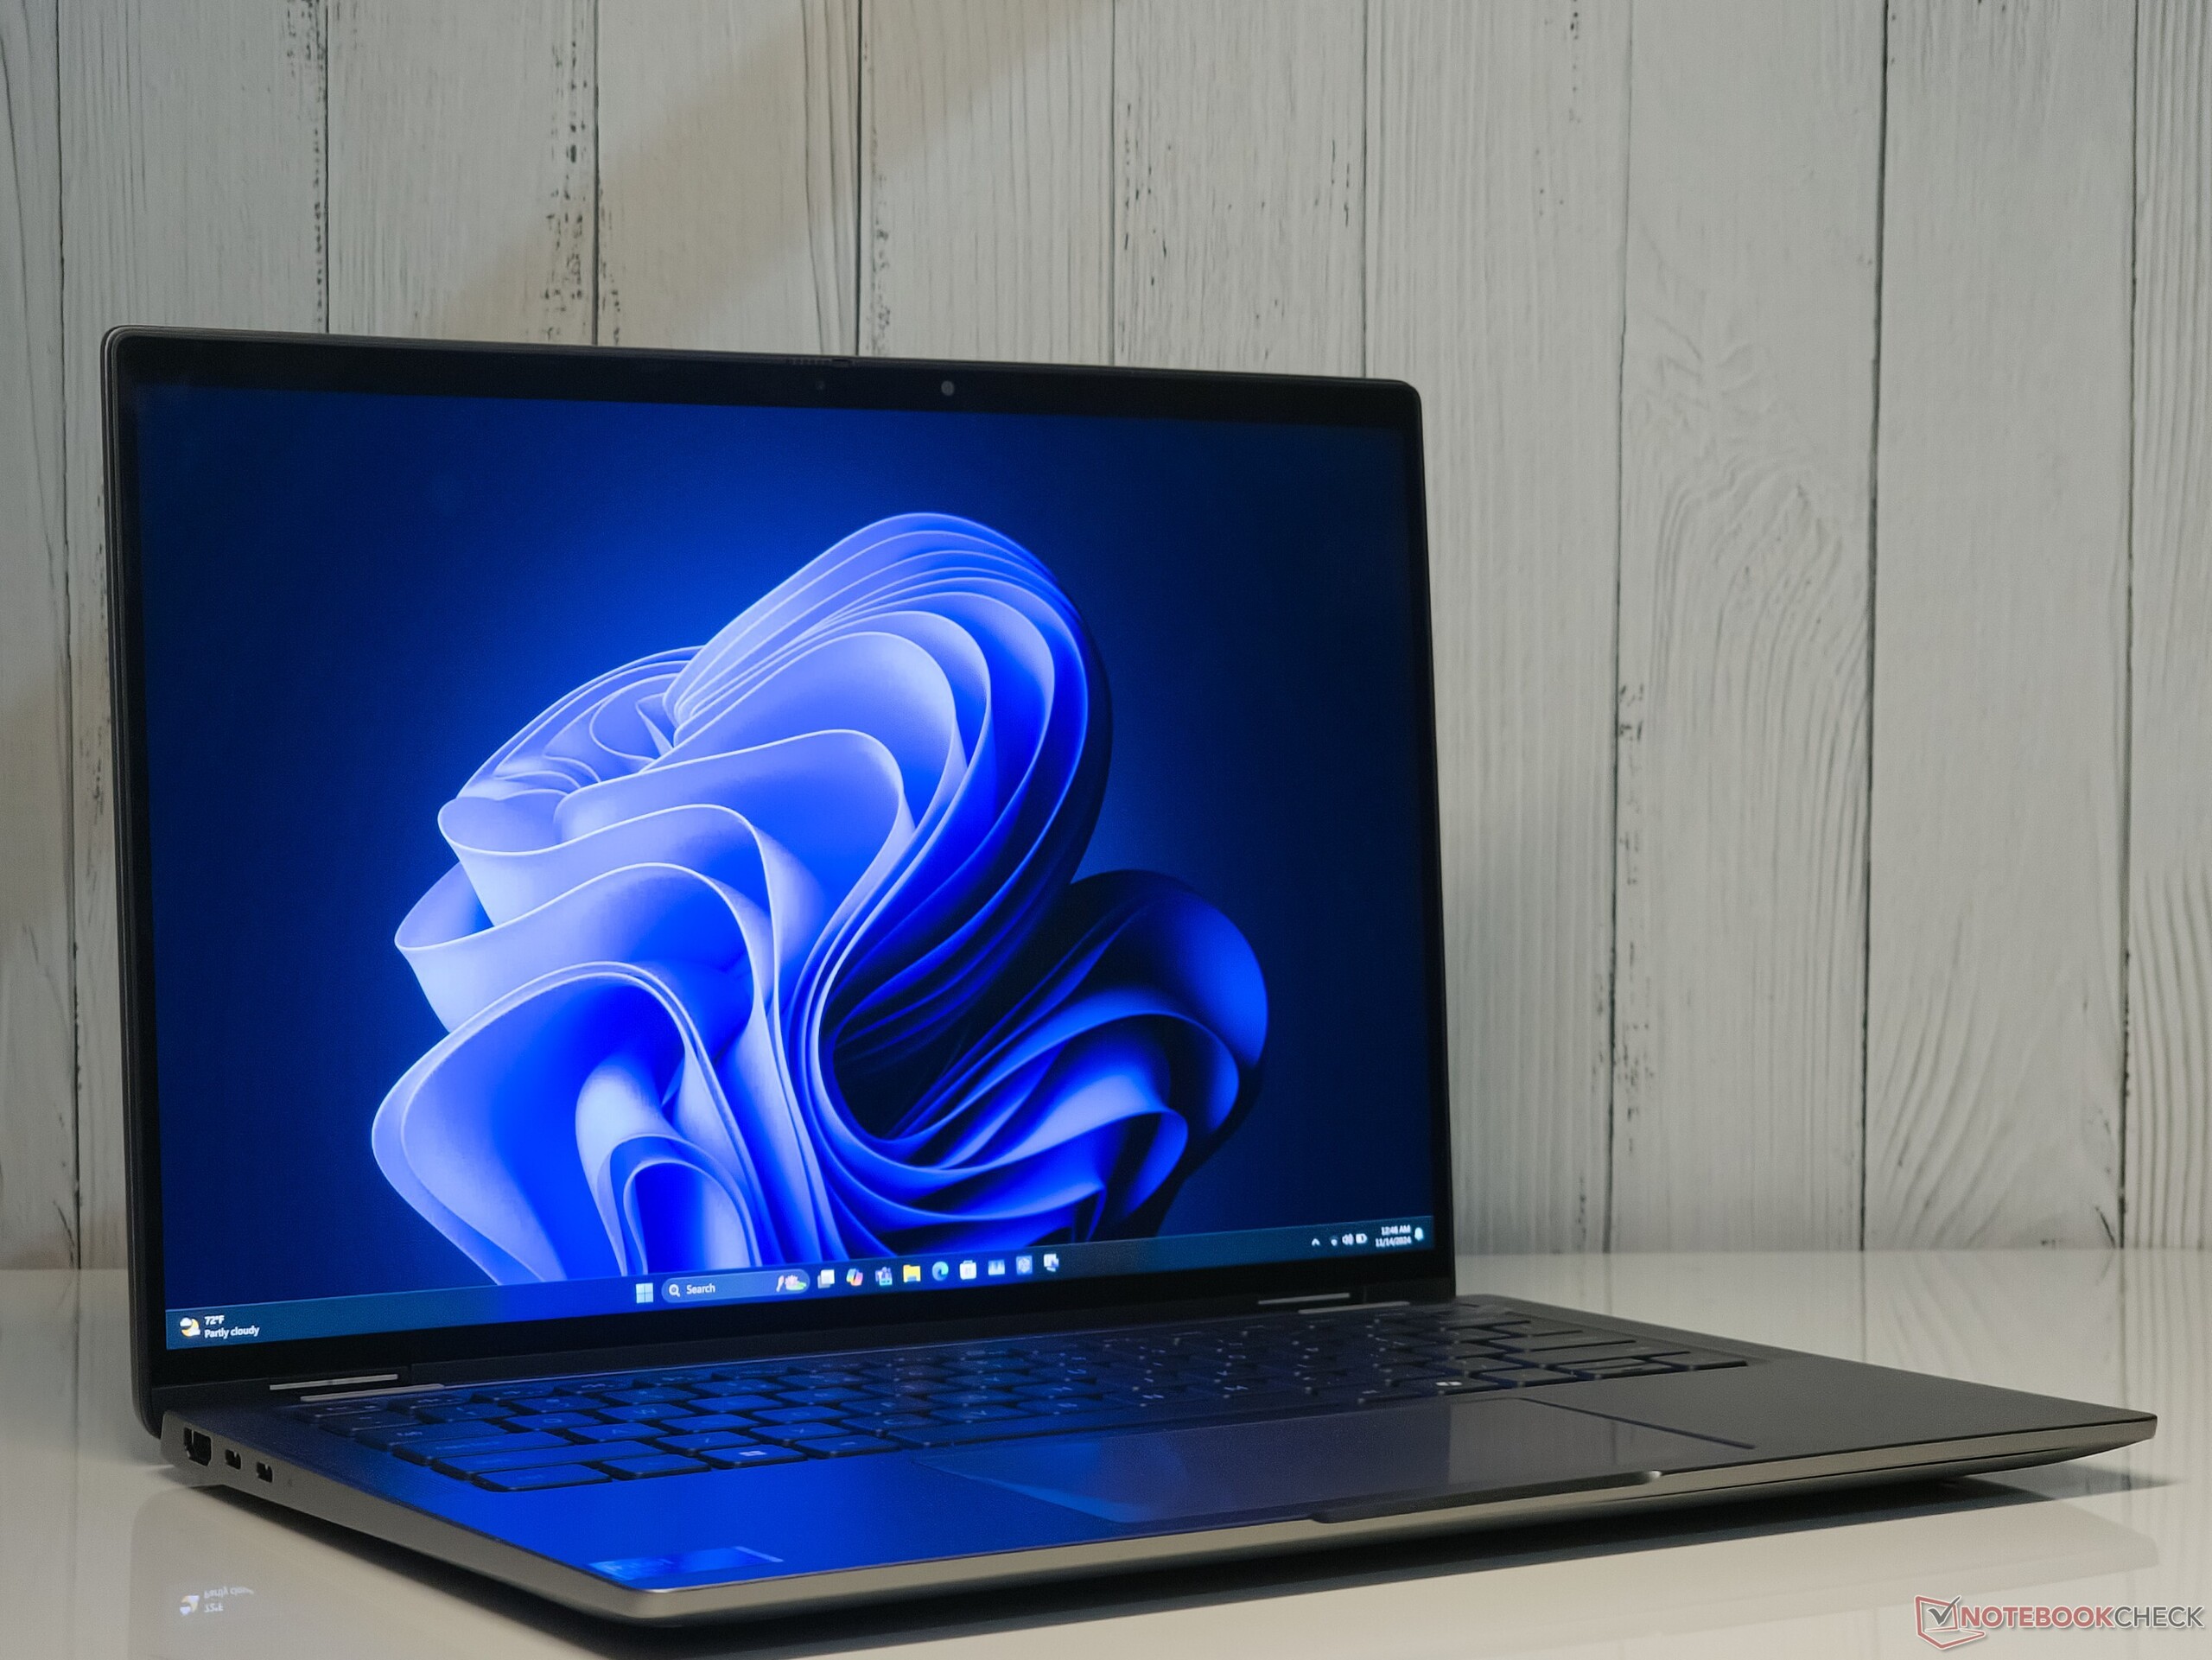
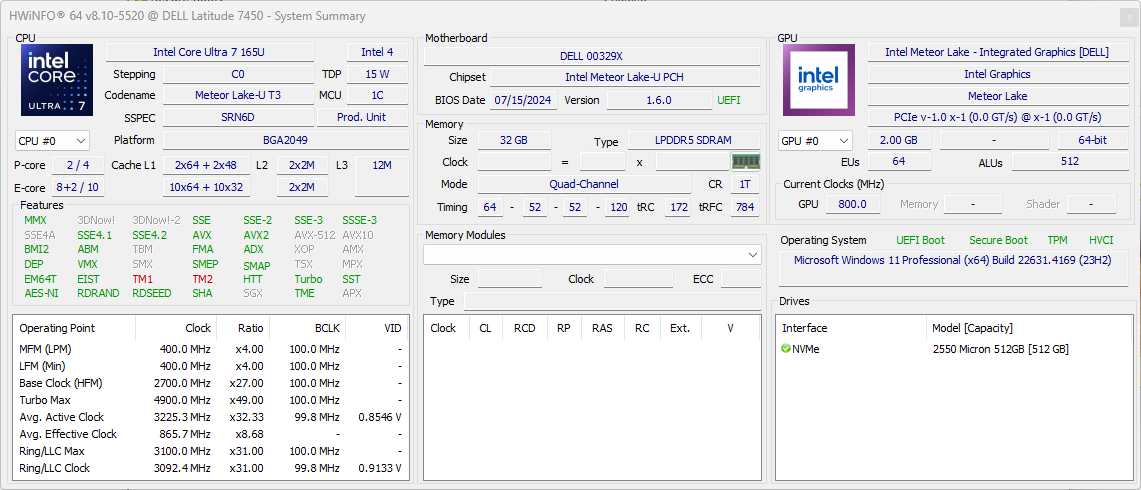
Dell wprowadził w tym roku kilka zmodernizowanych modeli Latitude, wyposażonych w procesory Intel Meteor Lake. Po wcześniejszej recenzji modelu Latitude 9450 2-w-1, Latitude odłączany 7350 i Latitude 7350teraz przyjrzymy się konwertowalnemu modelowi Latitude 7450 2-w-1, który jest również dostępny w konwencjonalnej formie laptopa.
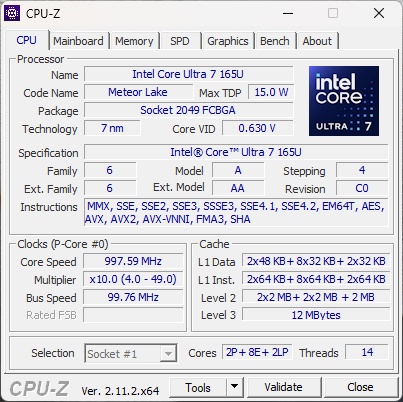
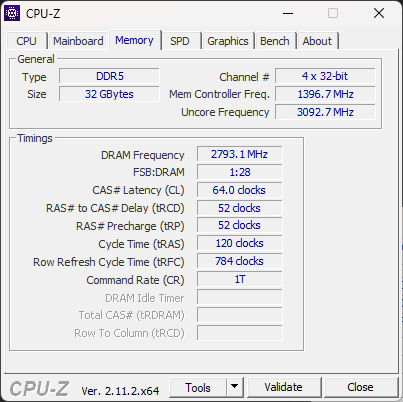
Model 2024 Latitude 7450 to biznesowa oferta firmy Dell z wyższej półki, która jest następcą zeszłorocznego Latitude 7440. Nasza próbka testowa jest zasilana przez procesor Intel Core Ultra 7 165U vPro, wraz z 32 GB pamięci RAM LPDDR5x-6400, 14-calowym wyświetlaczem dotykowym FHD + 60 Hz, Wi-Fi 7 i baterią 57 Whr.
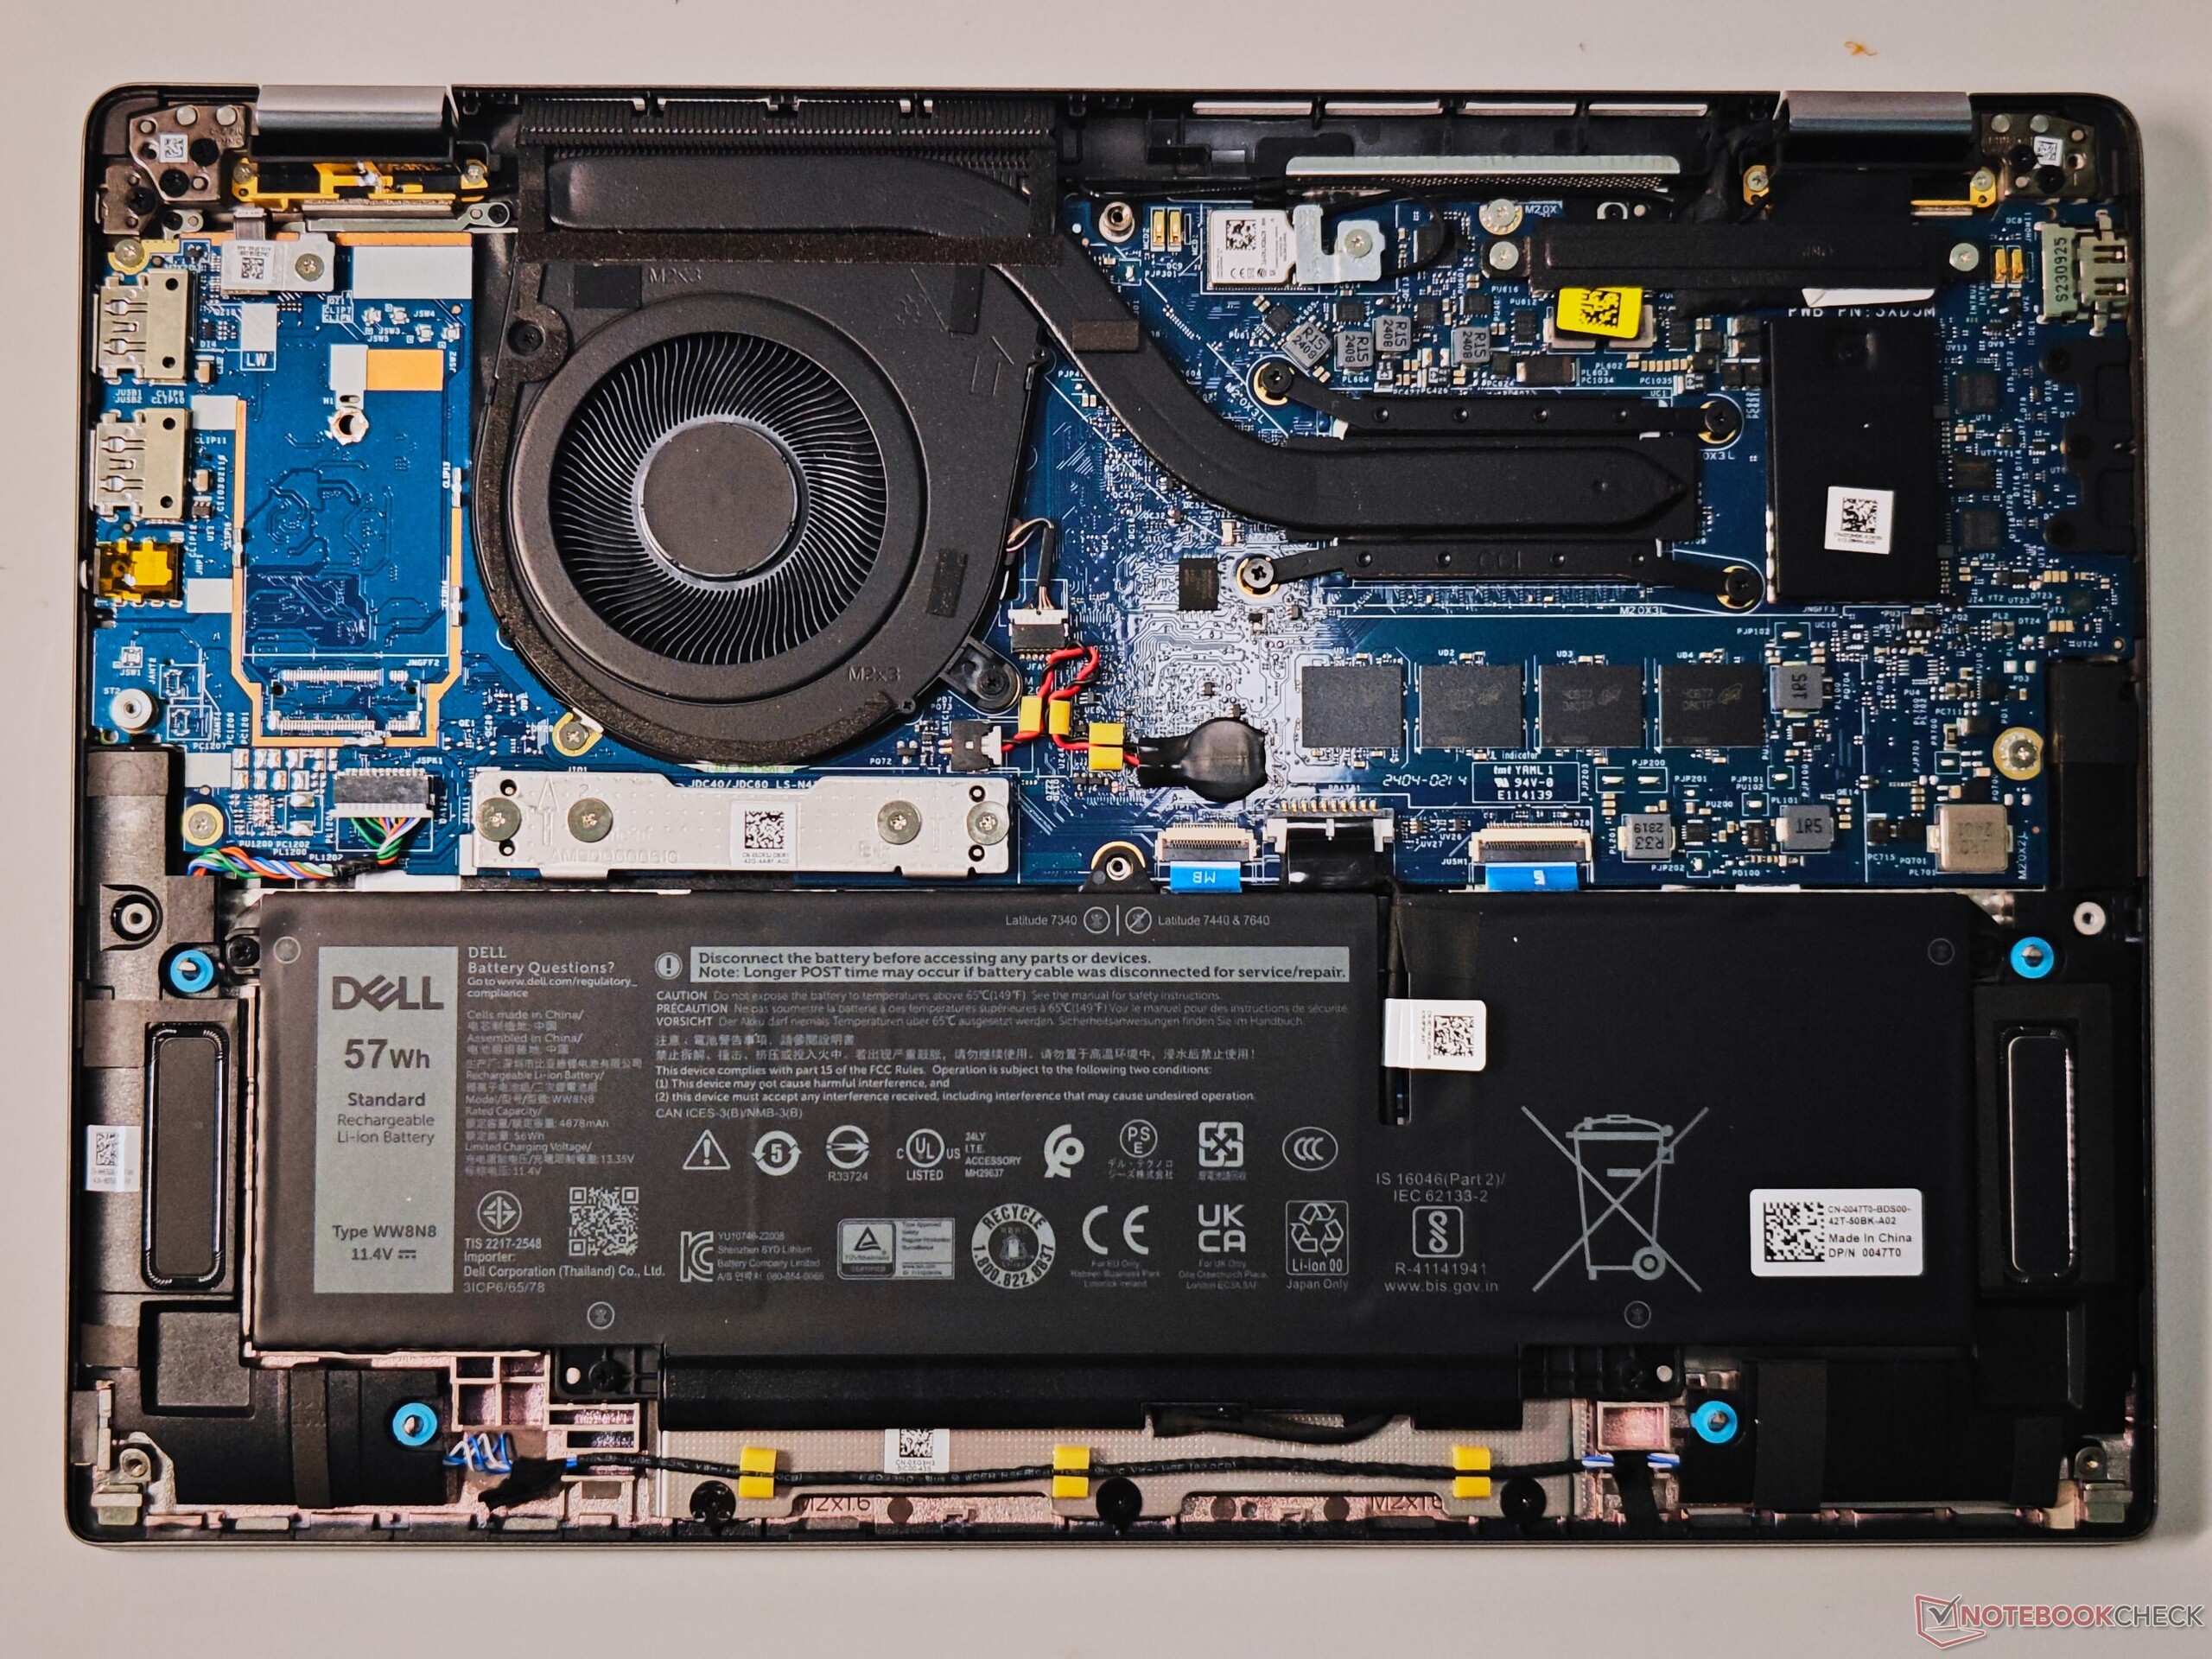
Specyfikacje
Obudowa i łączność: Aluminiowa konstrukcja klasy premium z przyzwoitymi wejściami/wyjściami
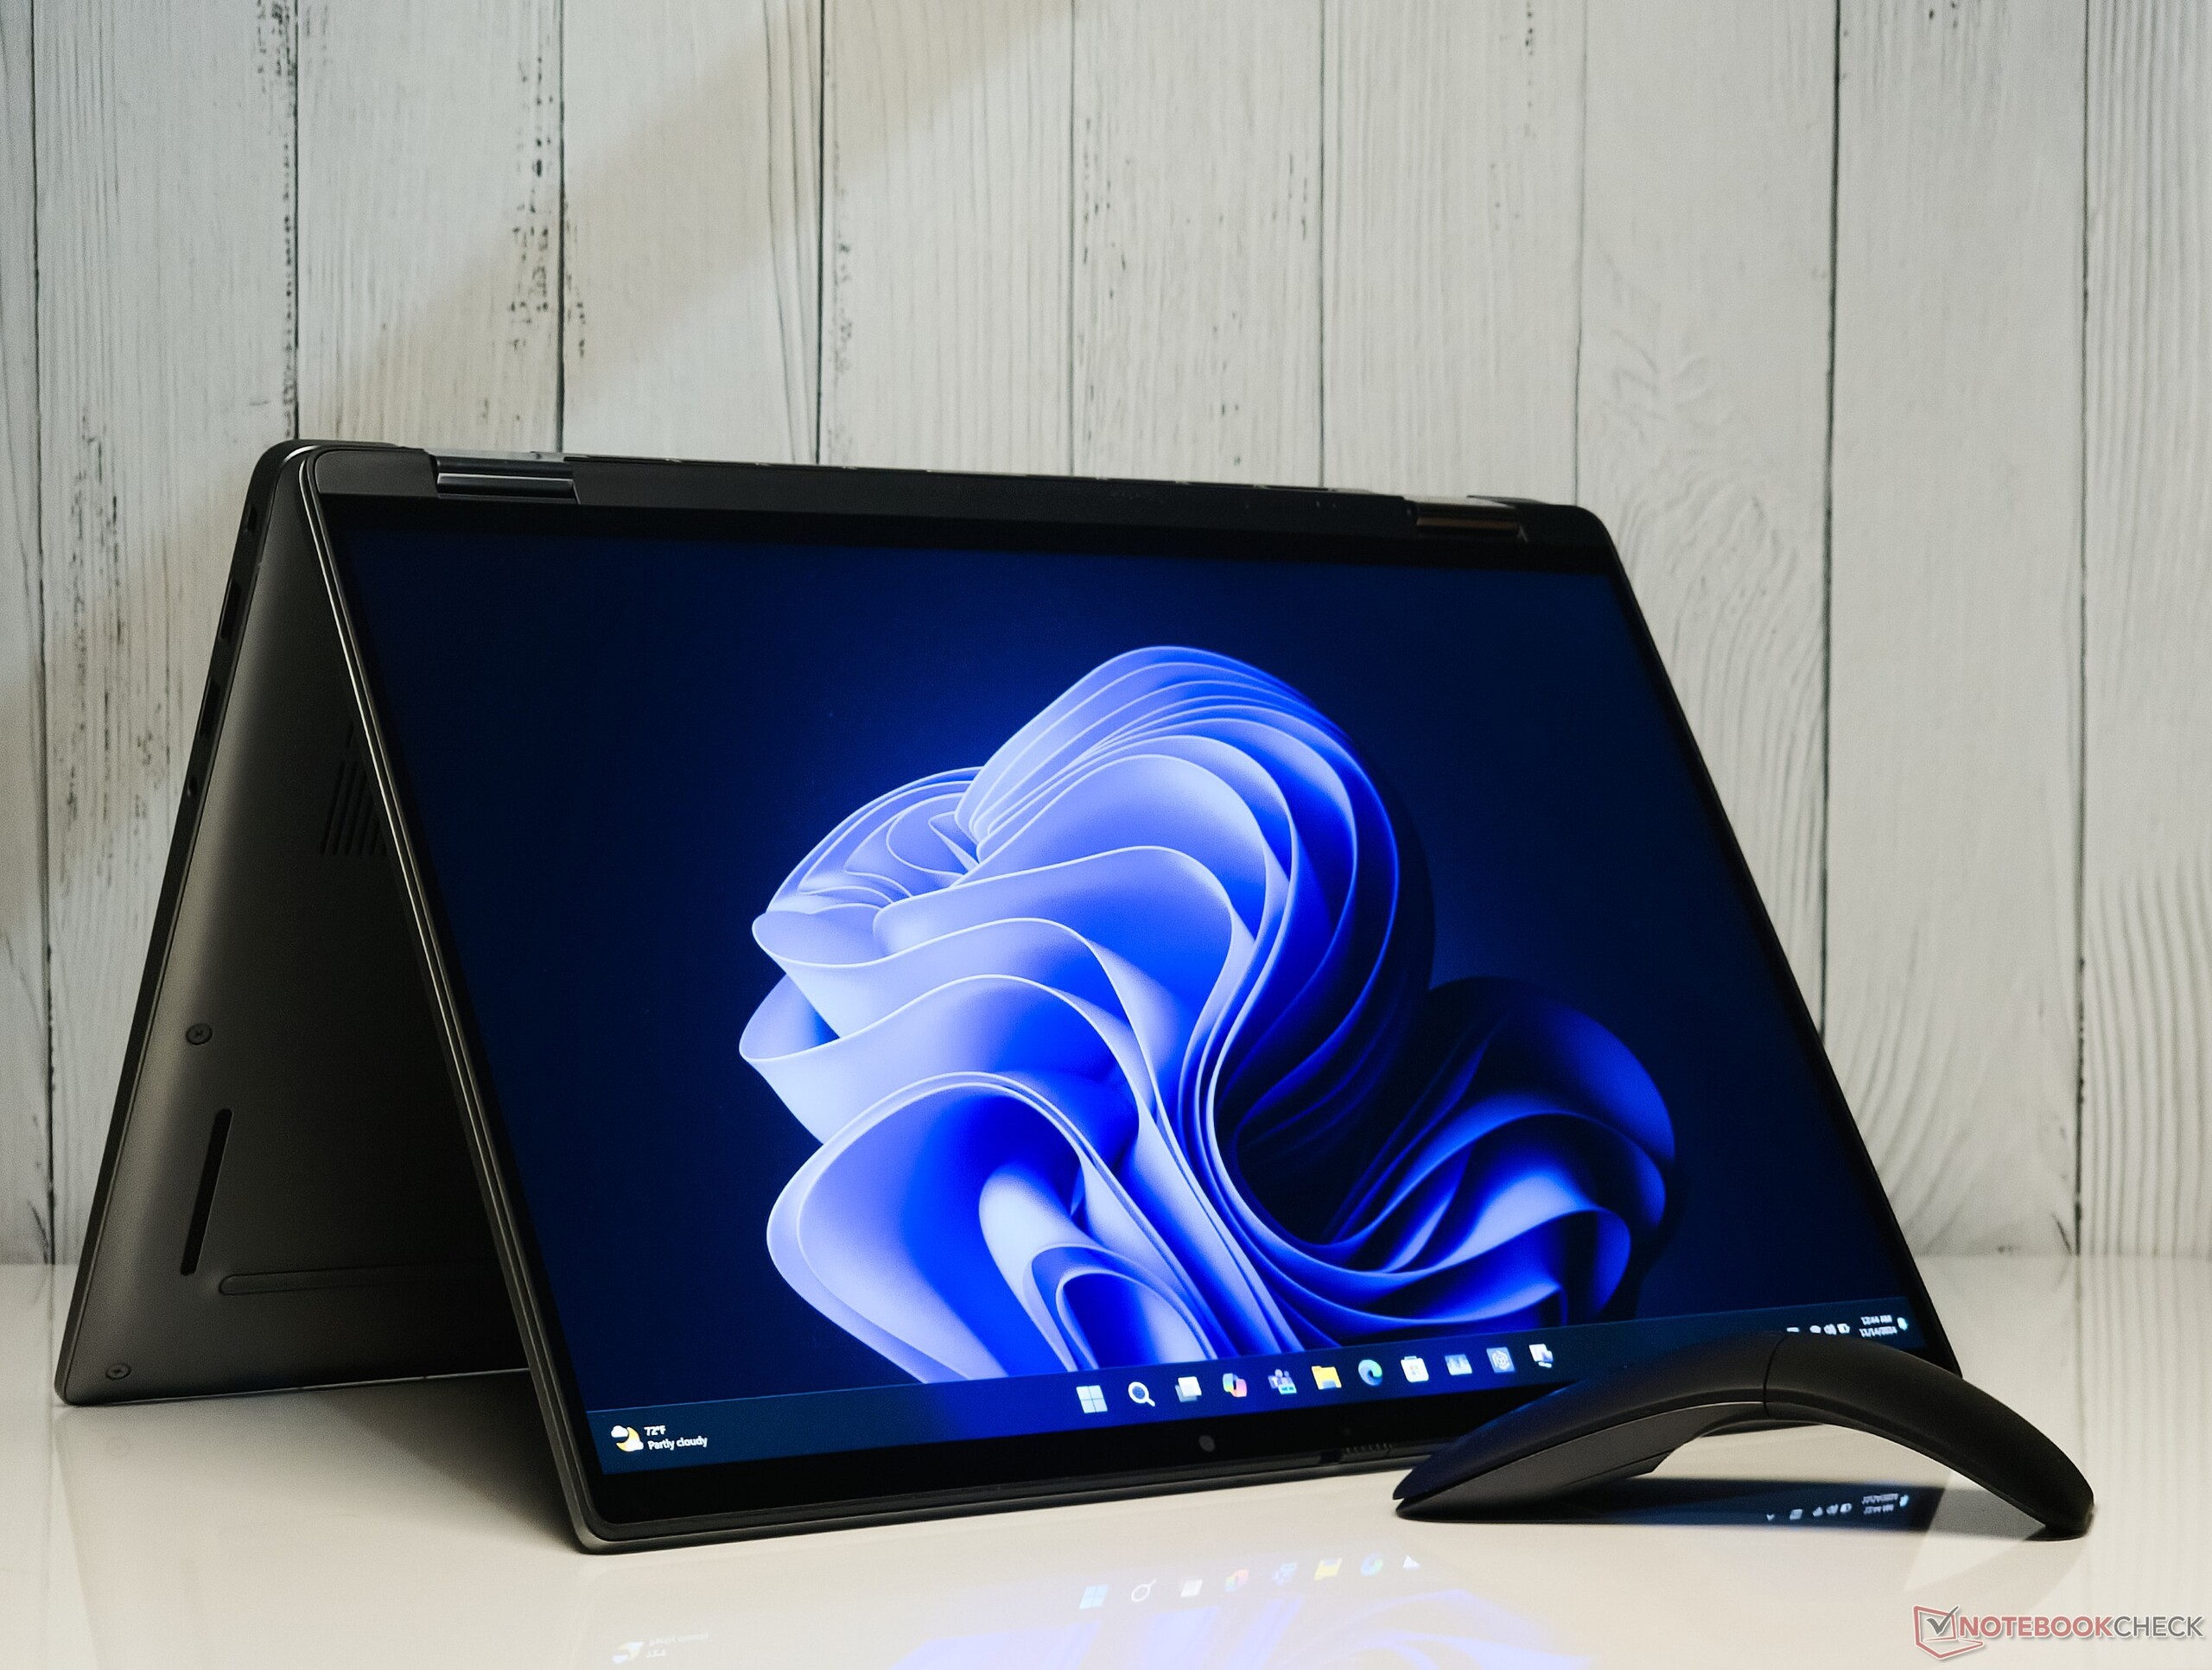
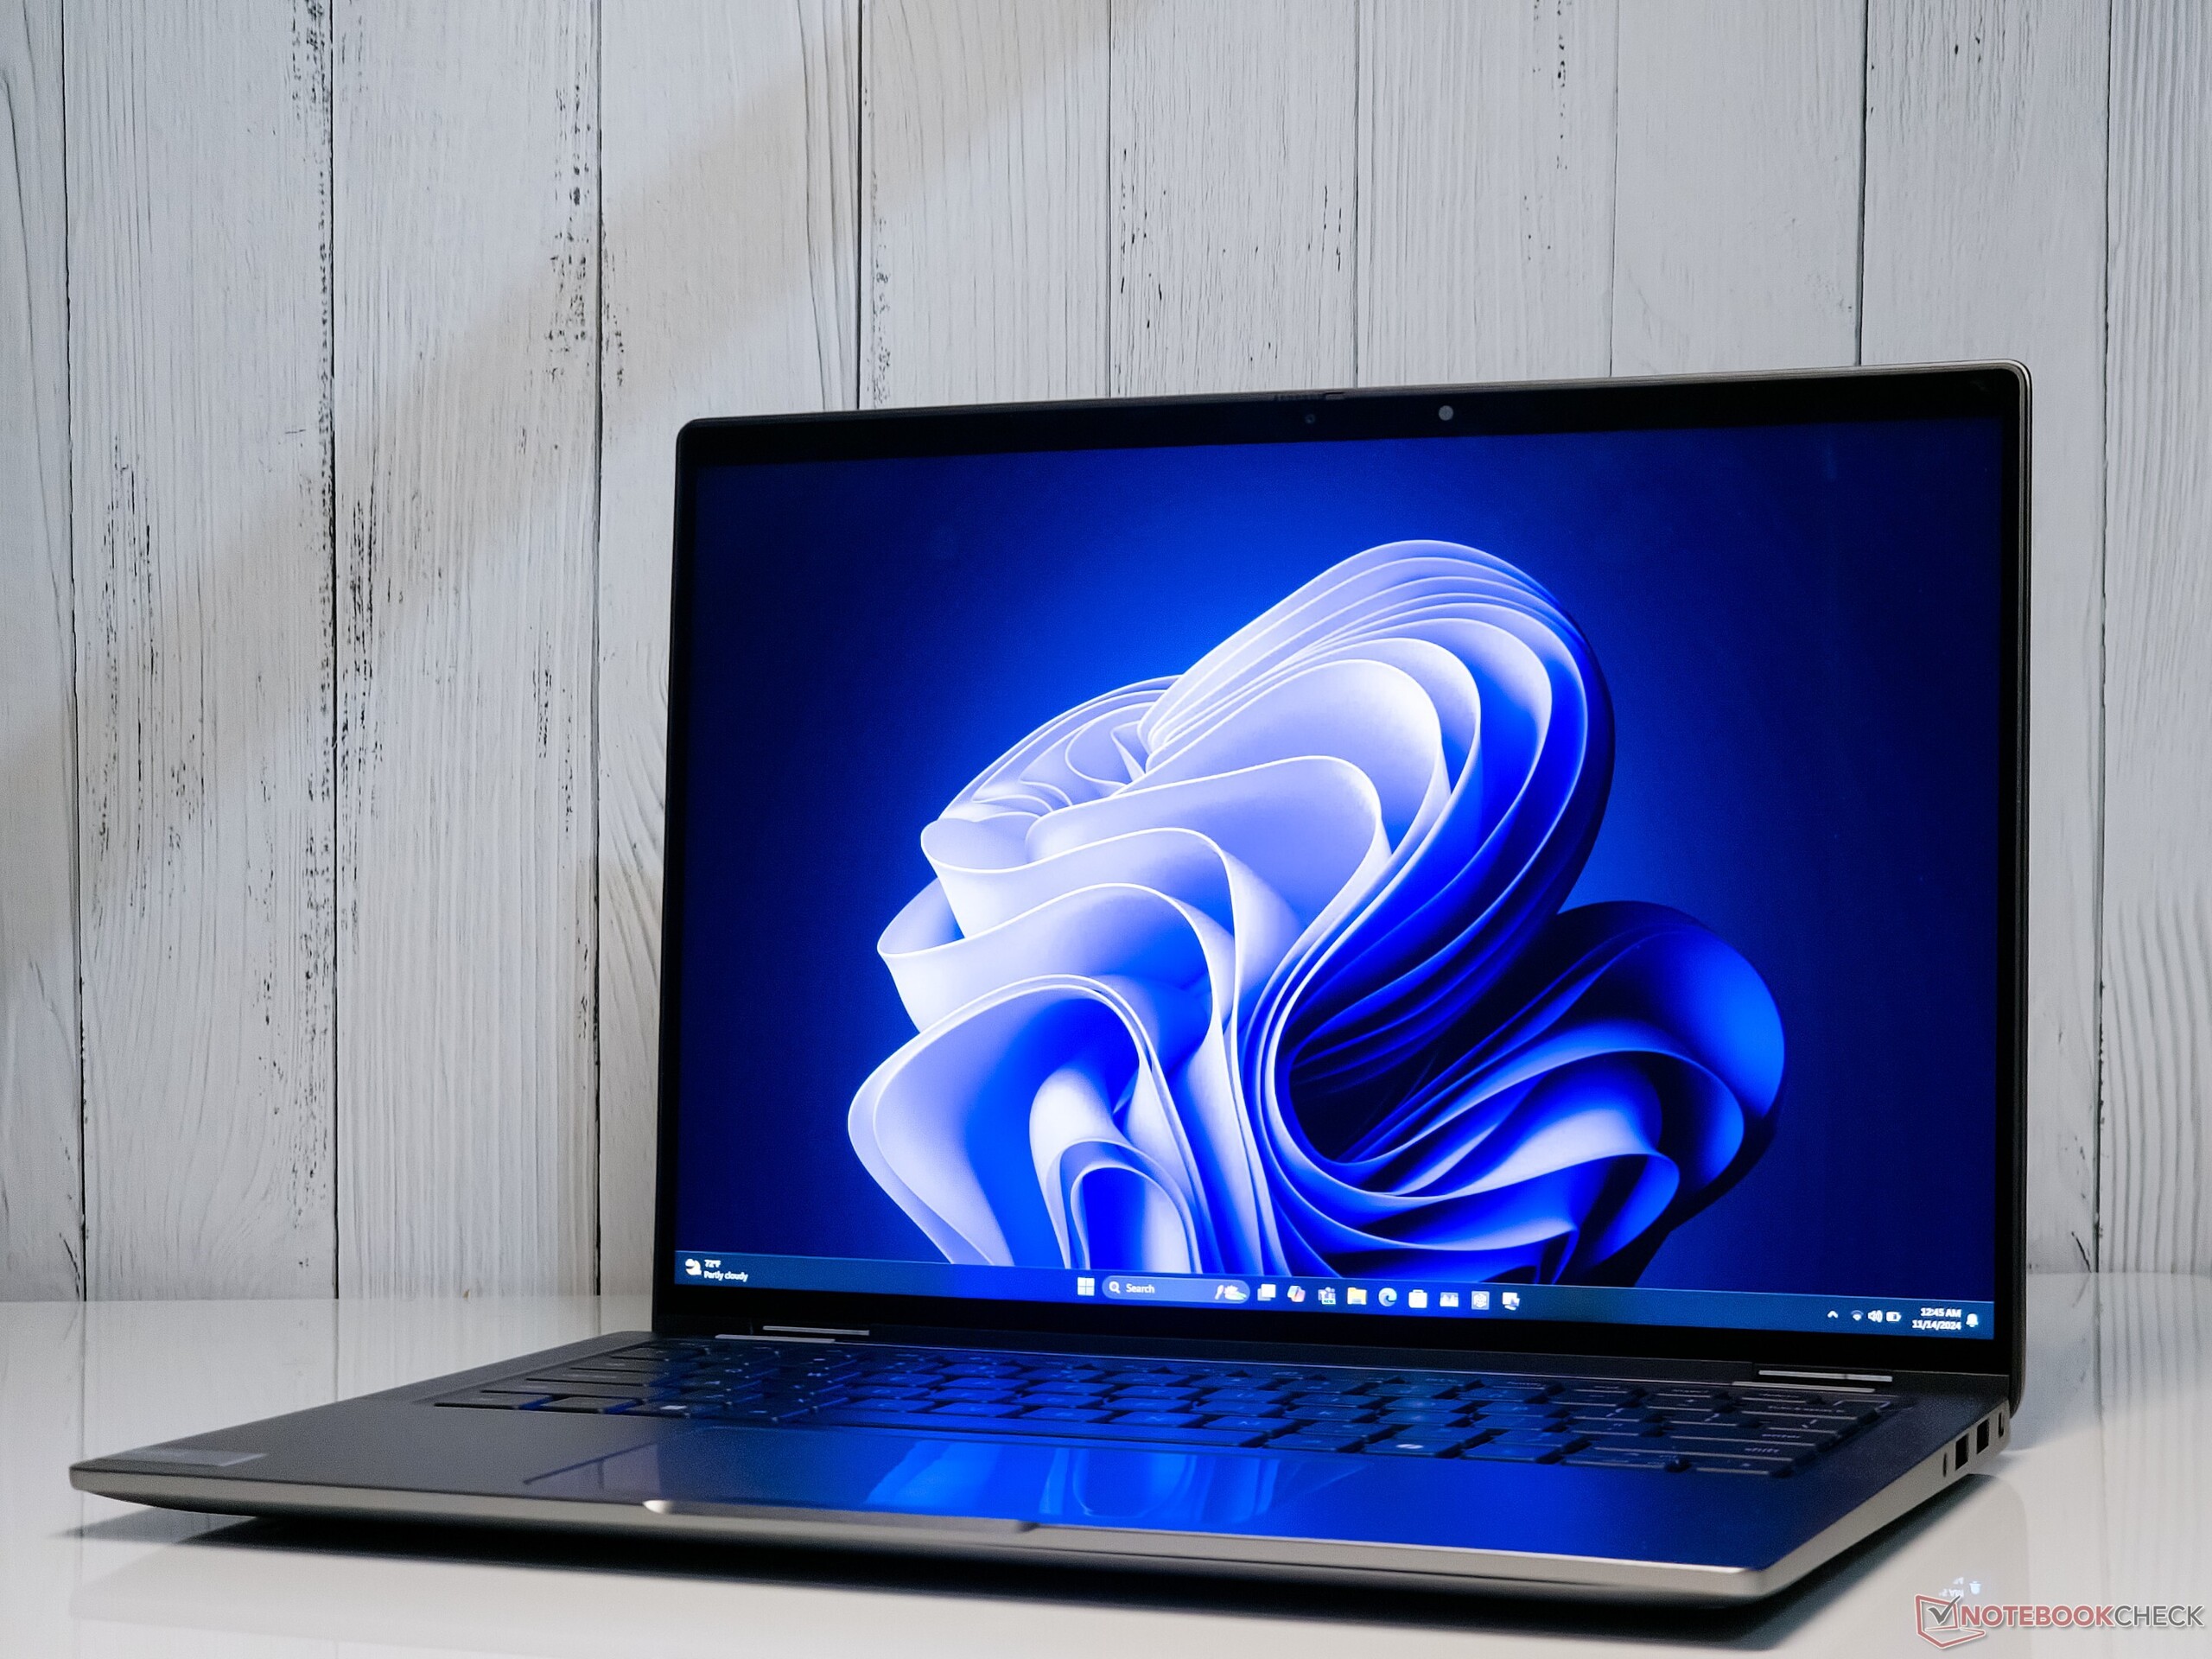
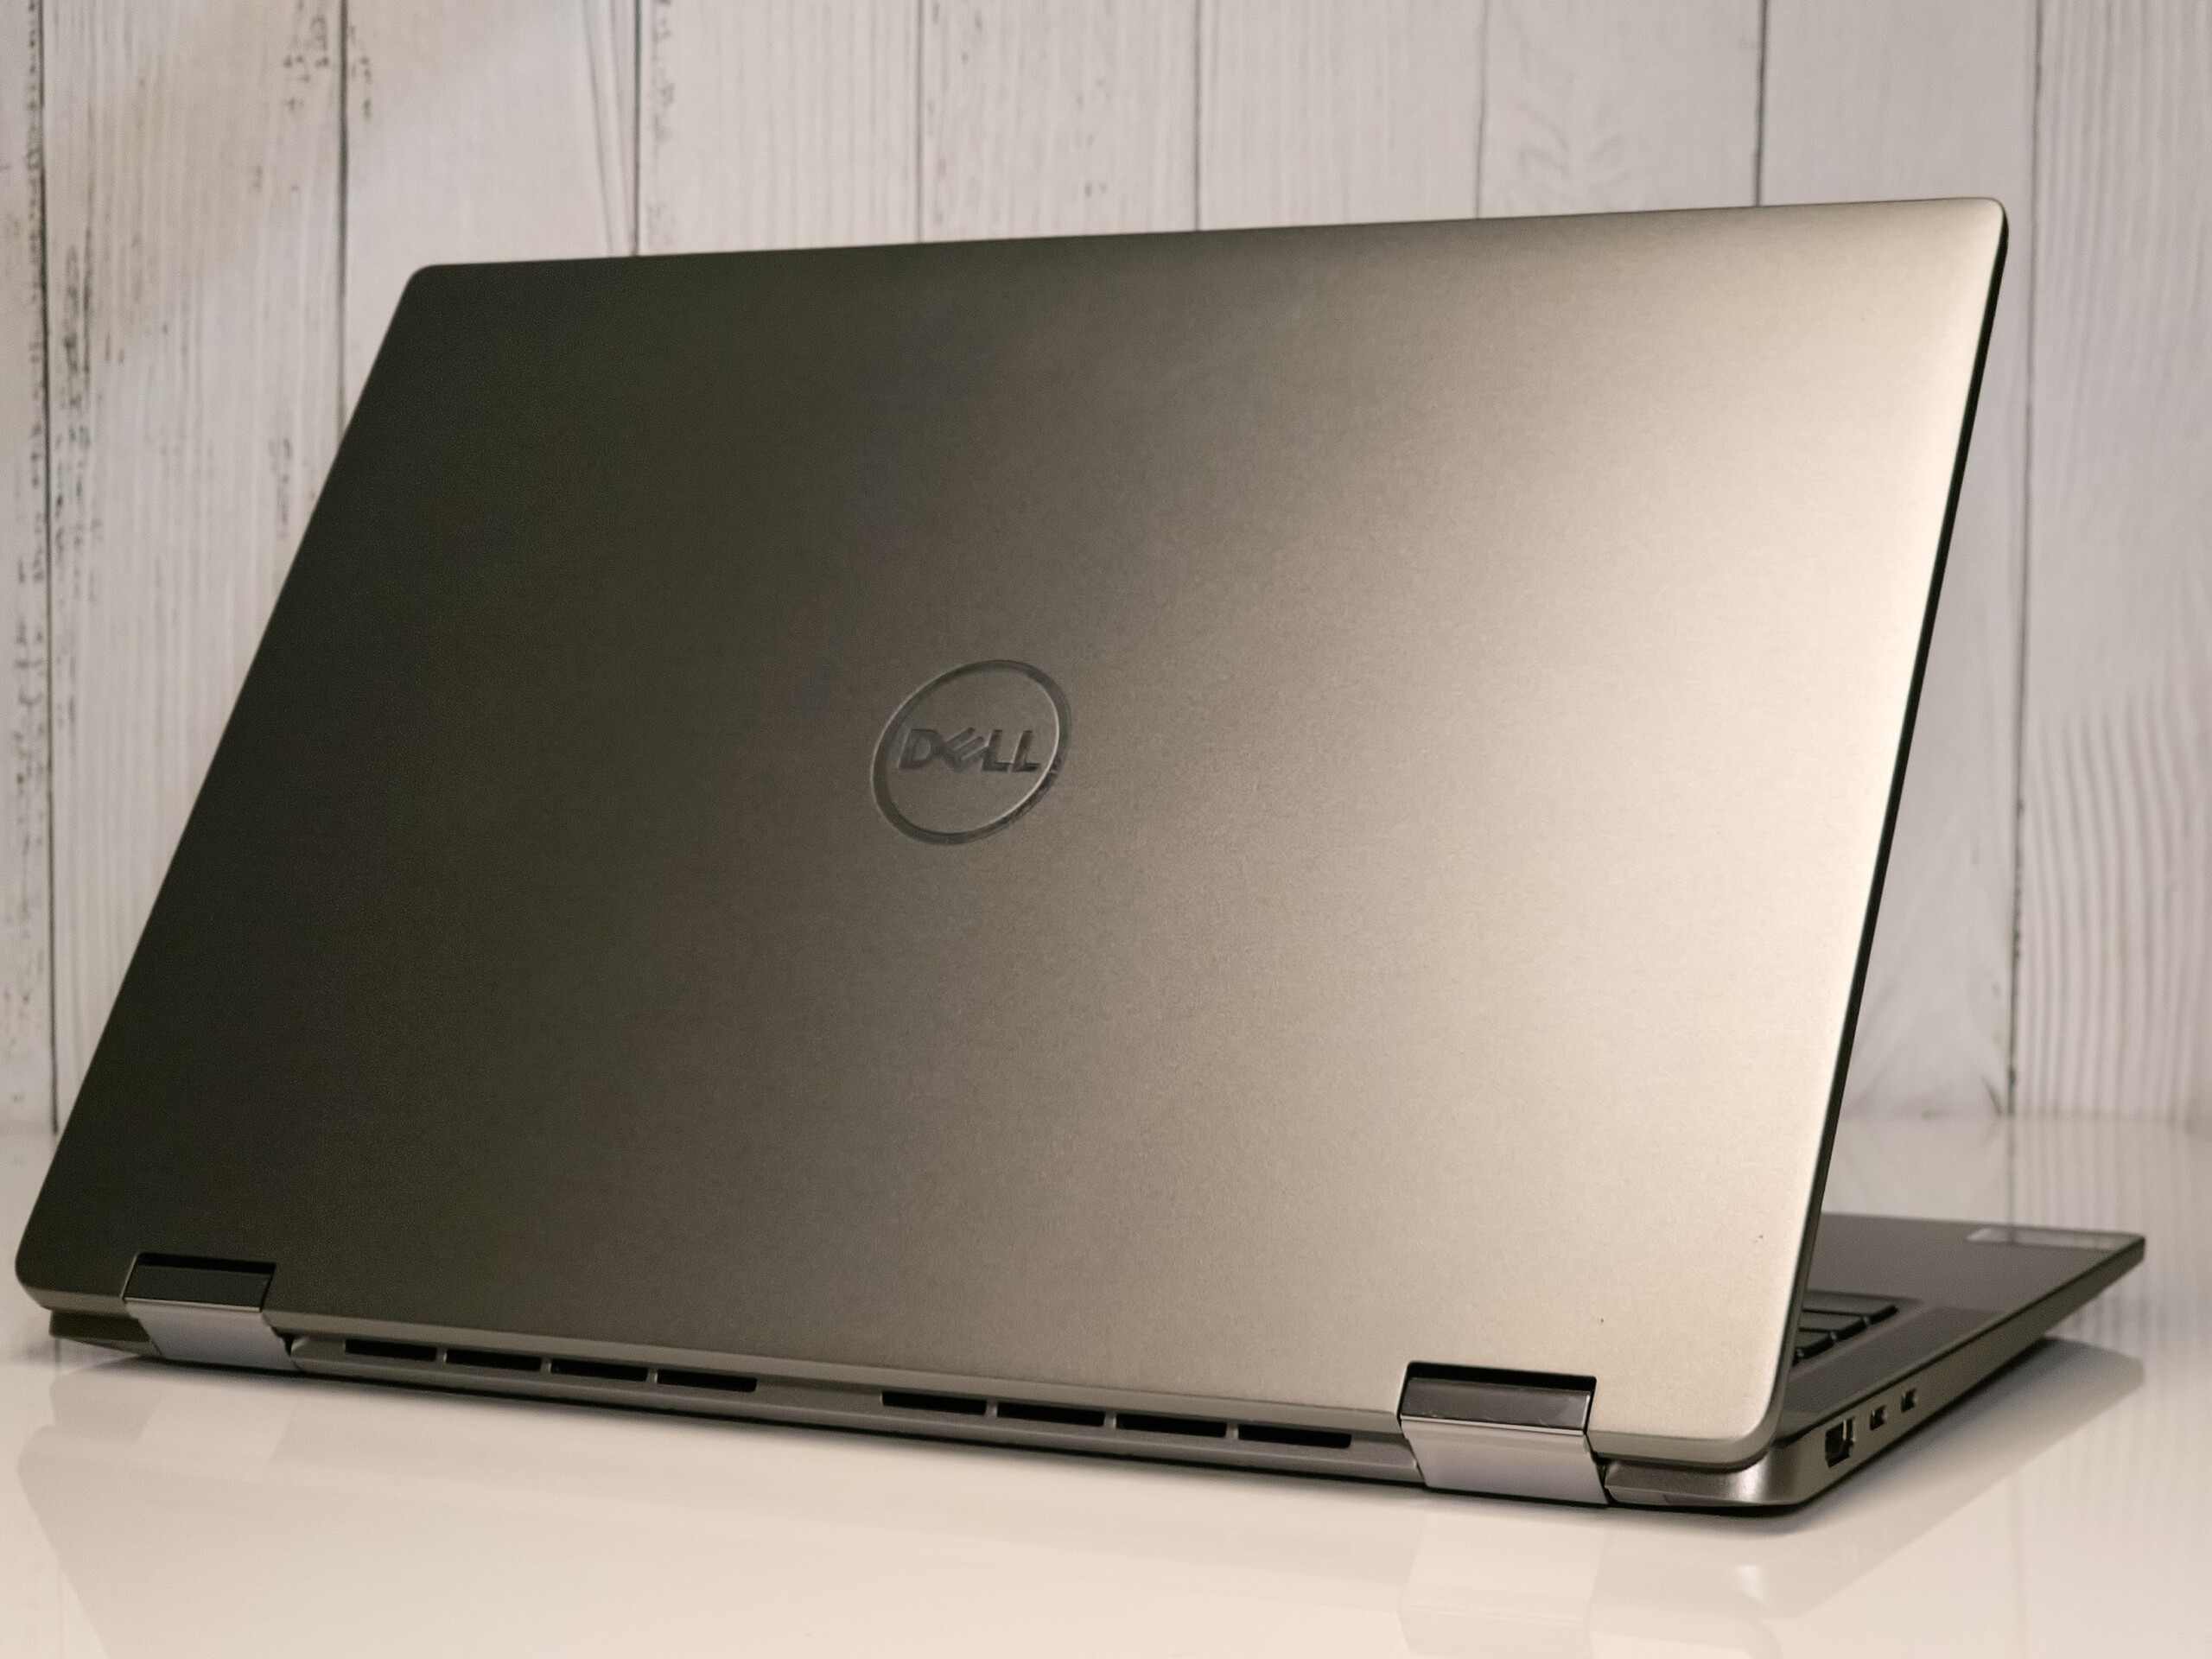
Model Latitude 7450 2-in-1 posiada elegancką, całkowicie aluminiową obudowę w kolorze Titan Grey. Oprócz tego, tradycyjny wariant laptopa ma również magnezową konstrukcję z wykończeniem River Blue.
Aluminiowa konstrukcja jest solidna i wysokiej jakości, bez skrzypienia i skręcania, a obudowa jest w dużej mierze odporna na odciski palców. Wyświetlacz i klawiatura prawie w ogóle się nie uginają. Zawiasy są solidne i pozwalają na pełną wszechstronność konwertowalnego formatu, choć wydają się nieco zbyt sztywne, aby ułatwić obracanie.
Podczas gdy aluminiowa konstrukcja waży 1,5 kg, magnezowe SKU są znacznie lżejsze i ważą 1,3 kg.
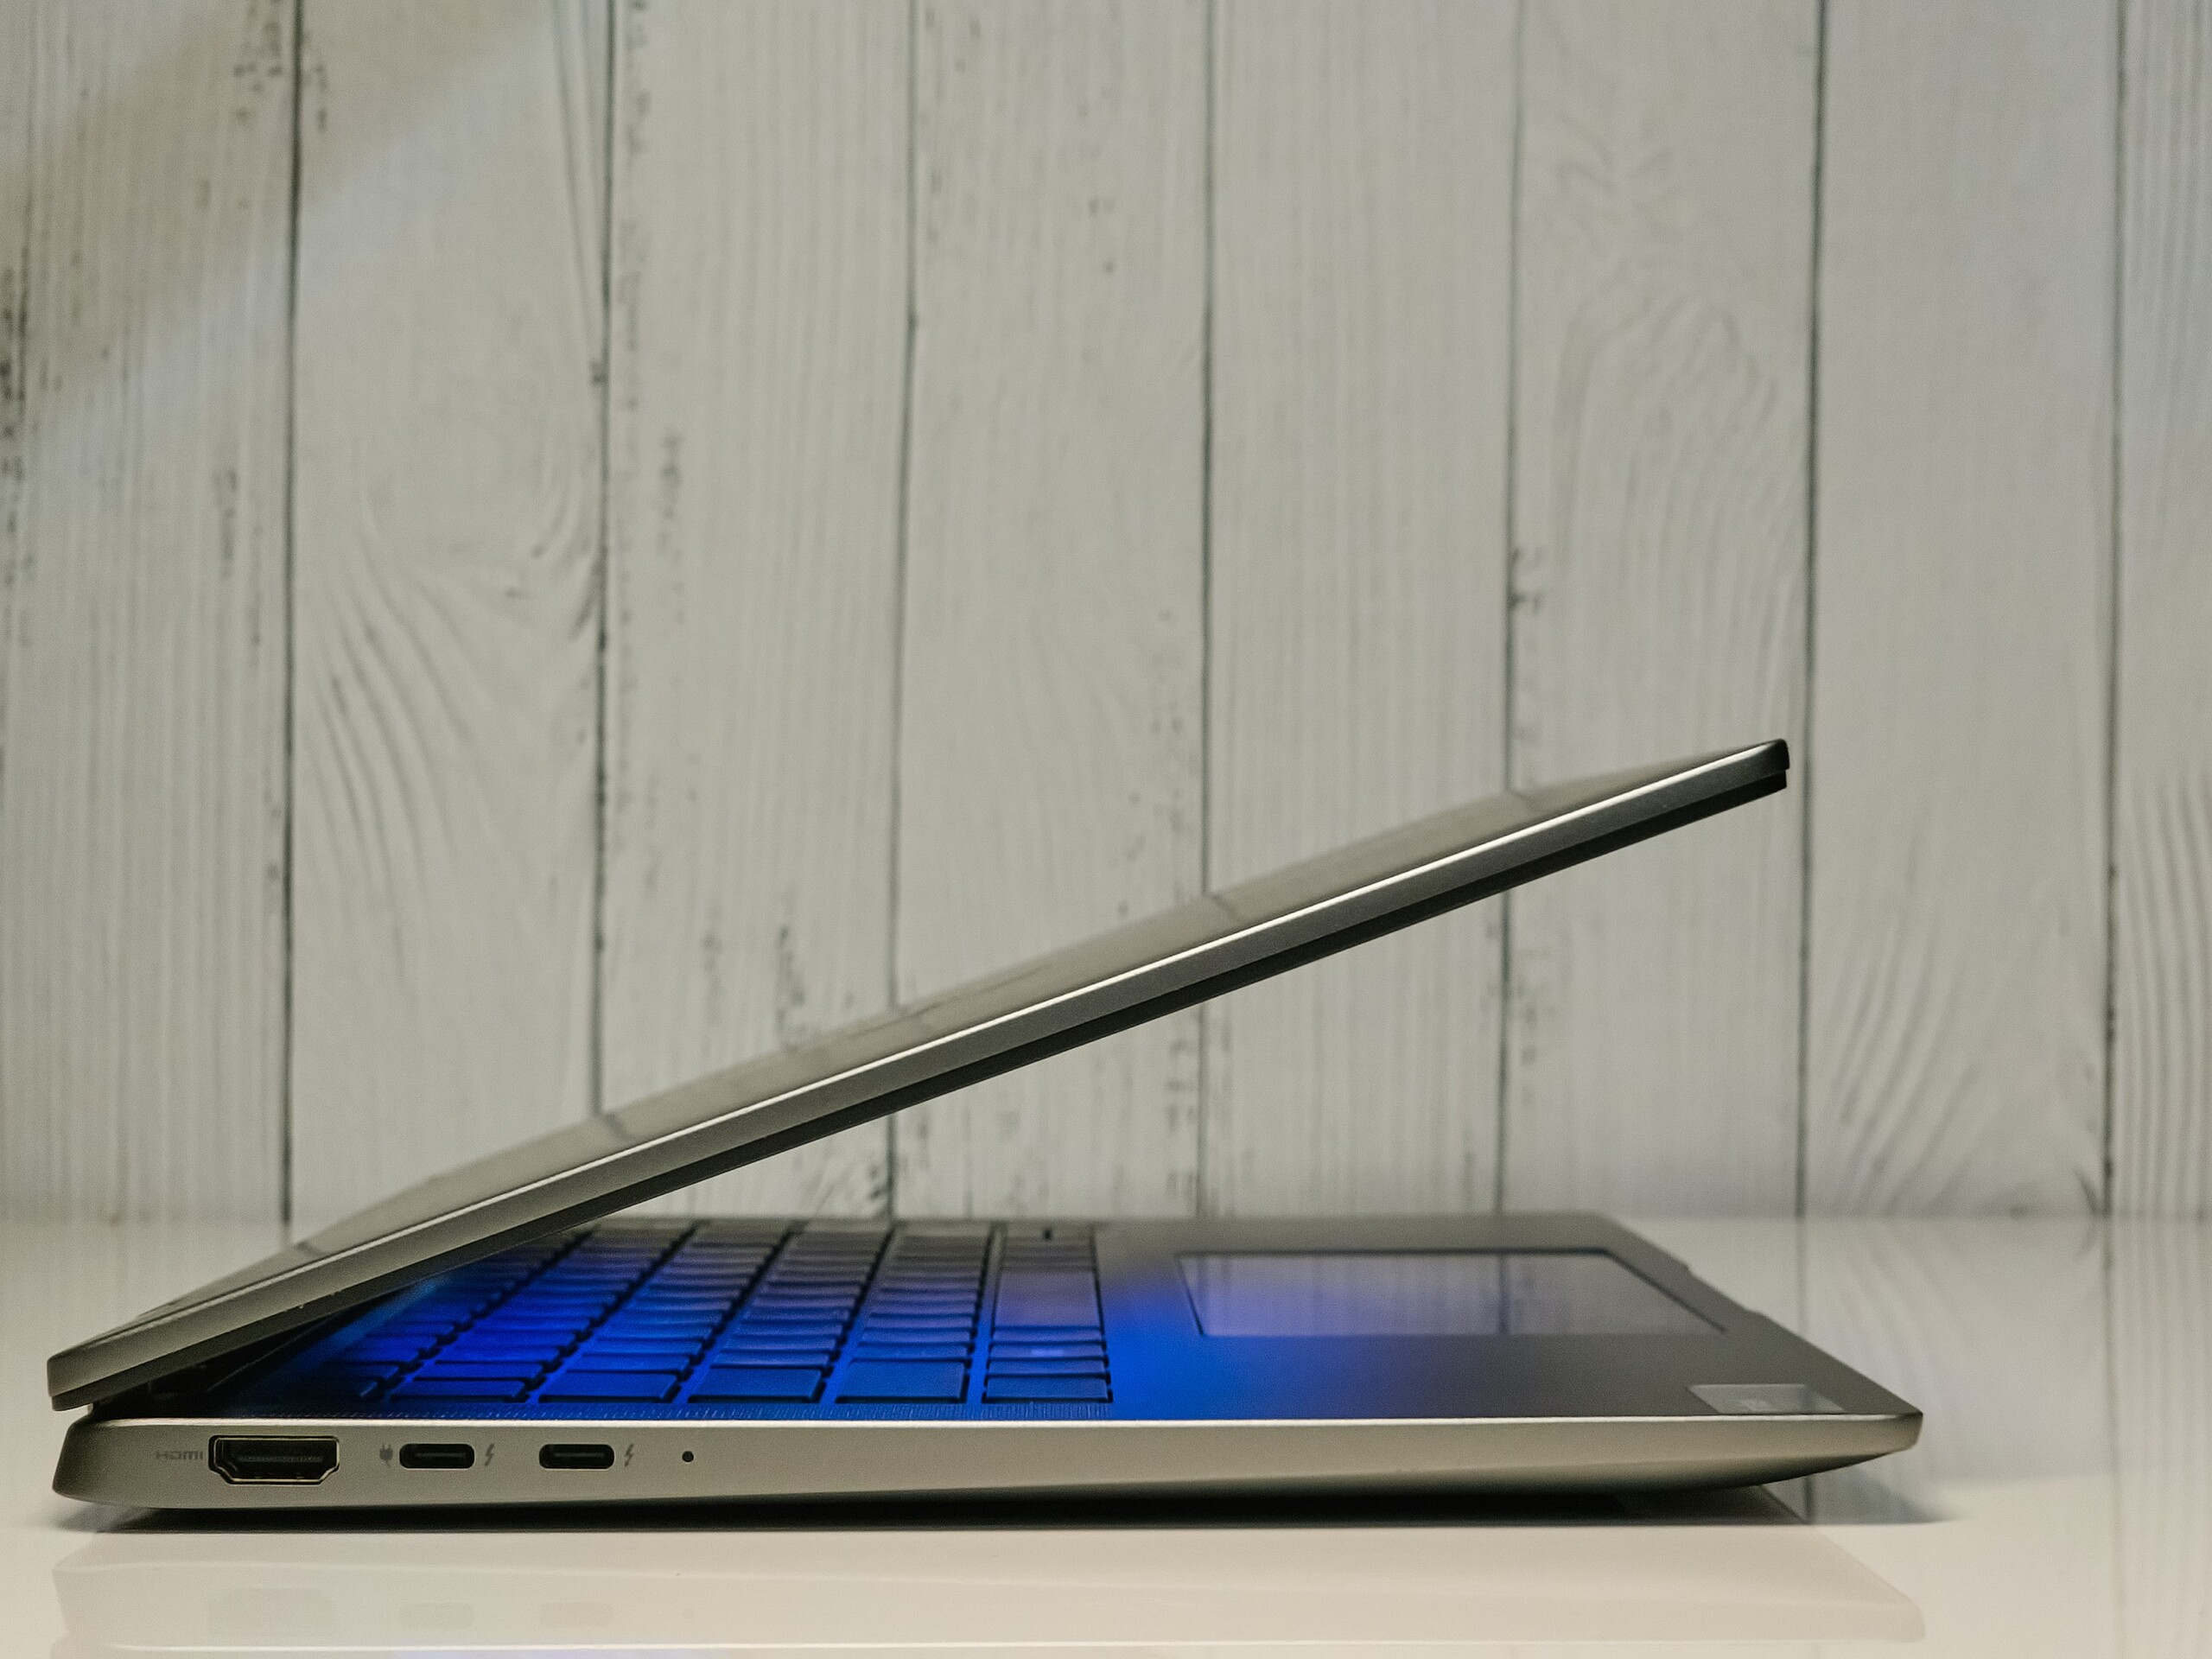
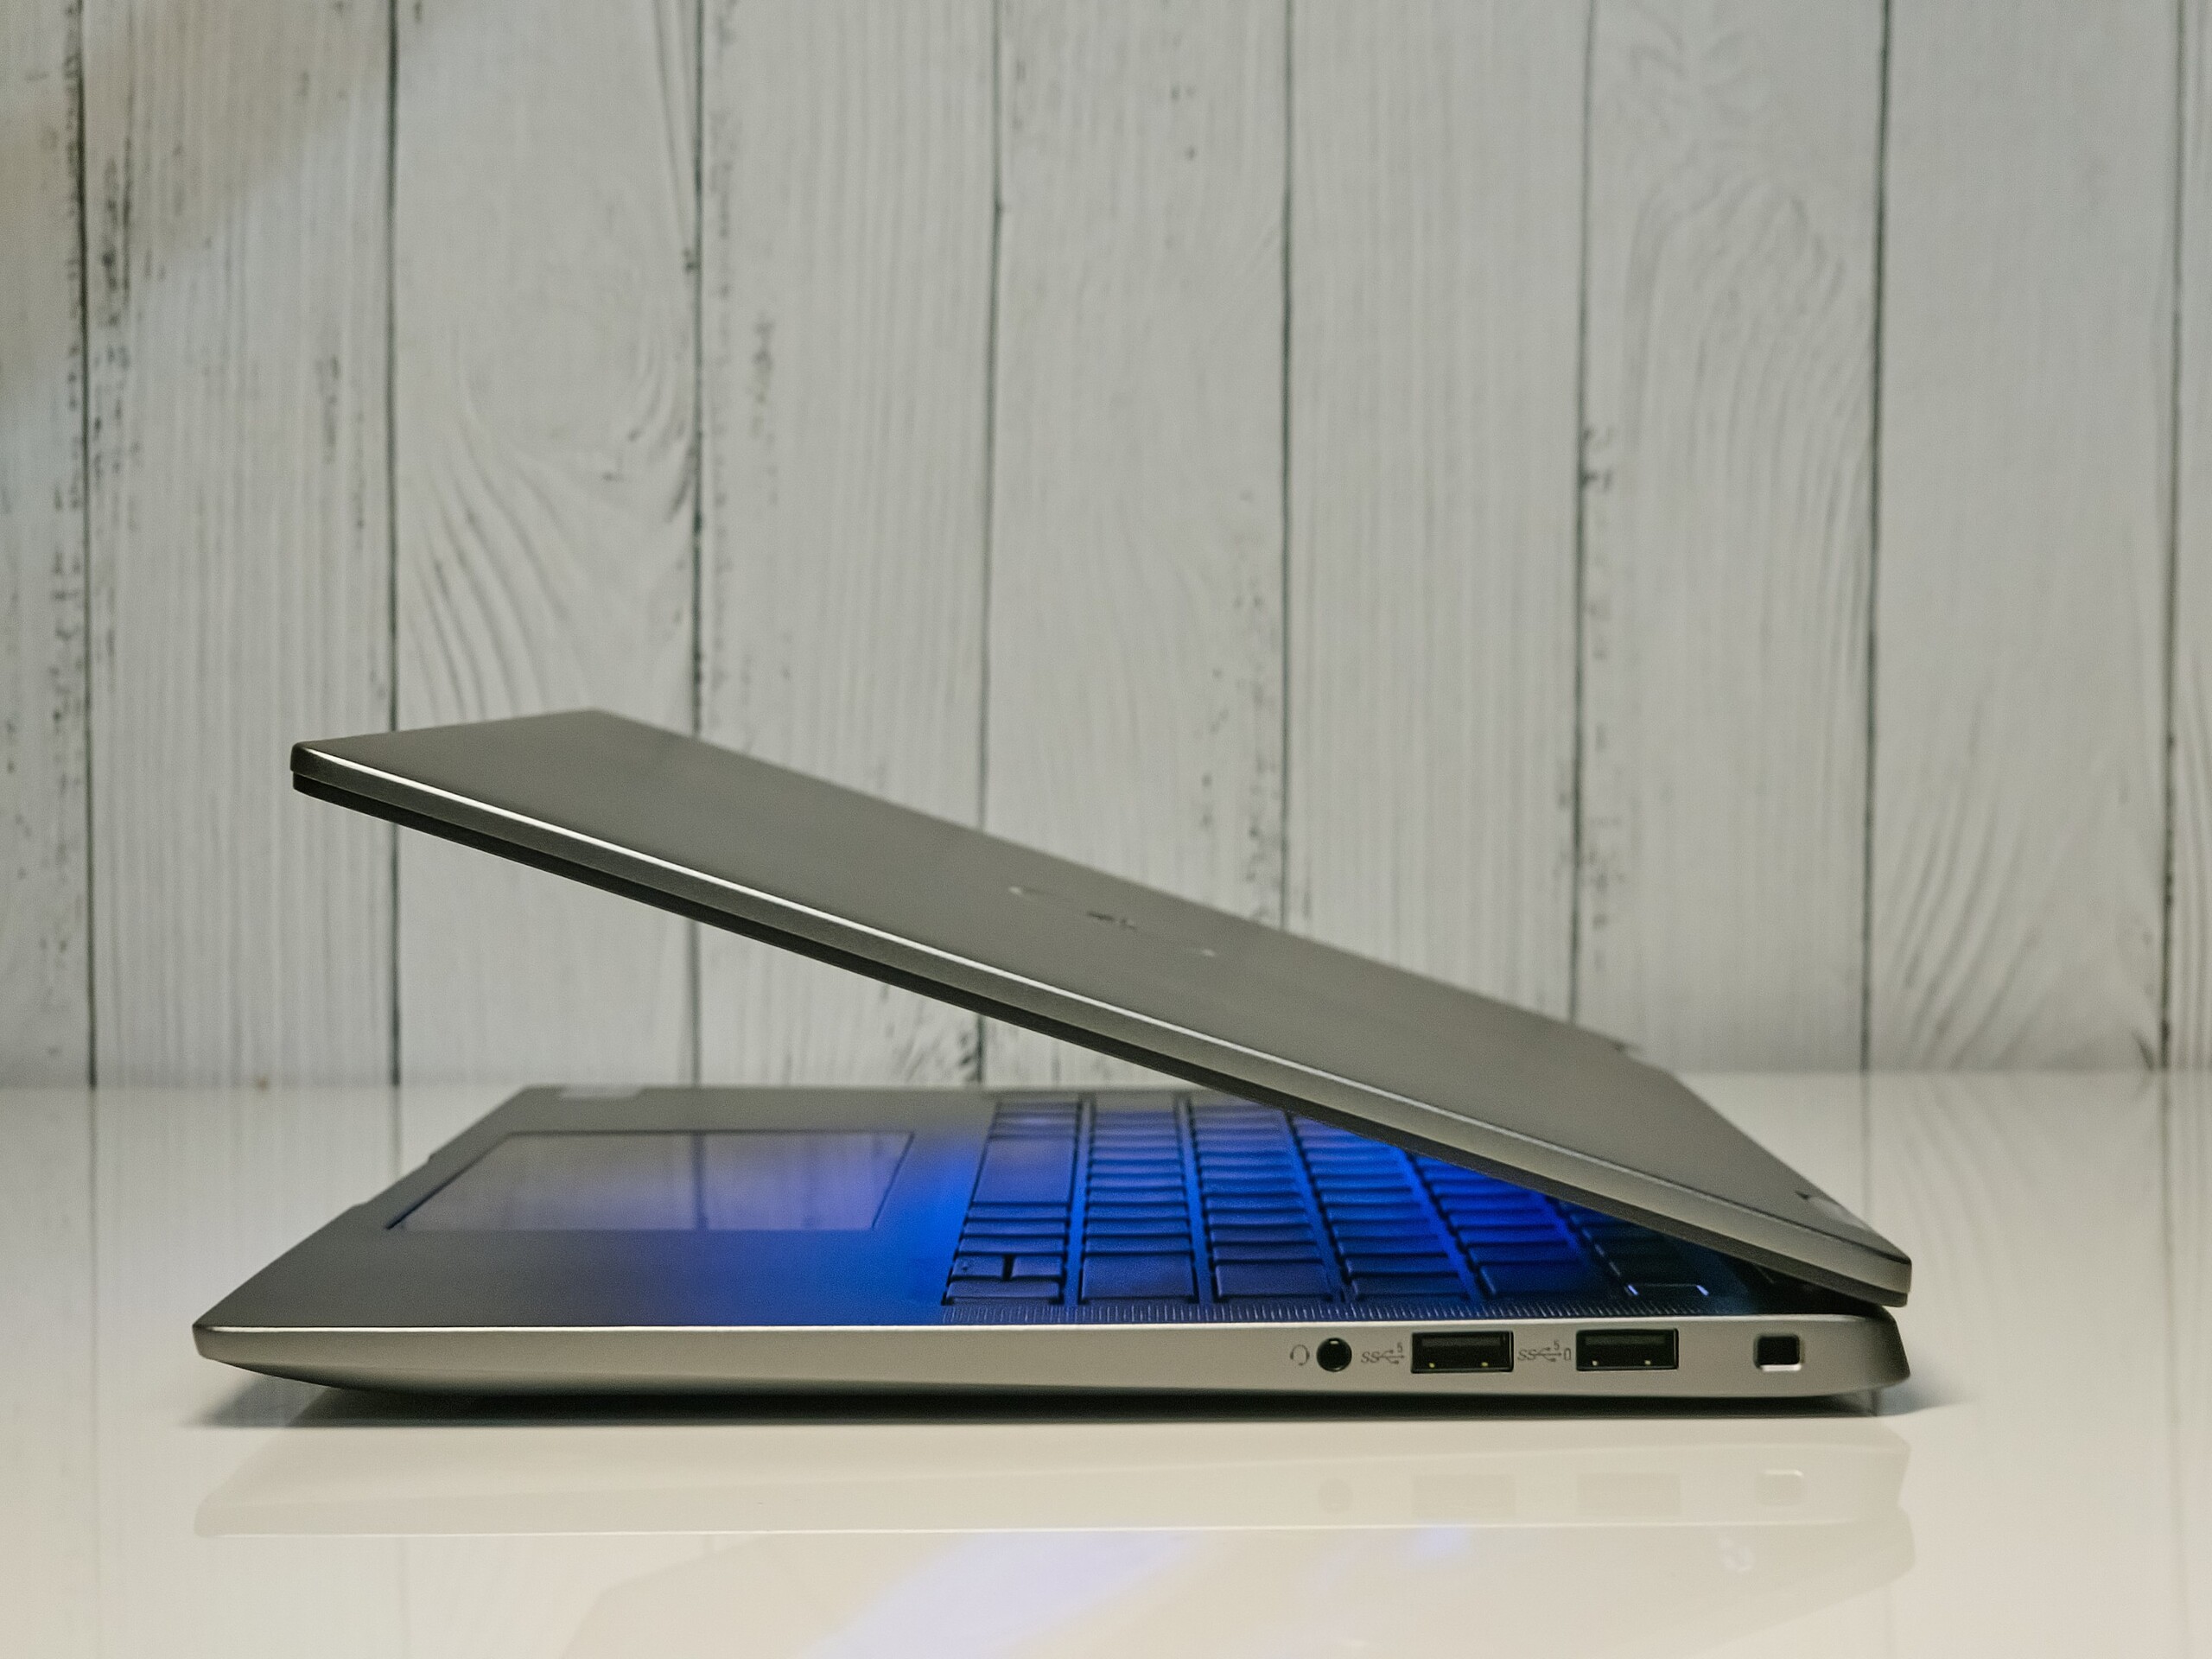
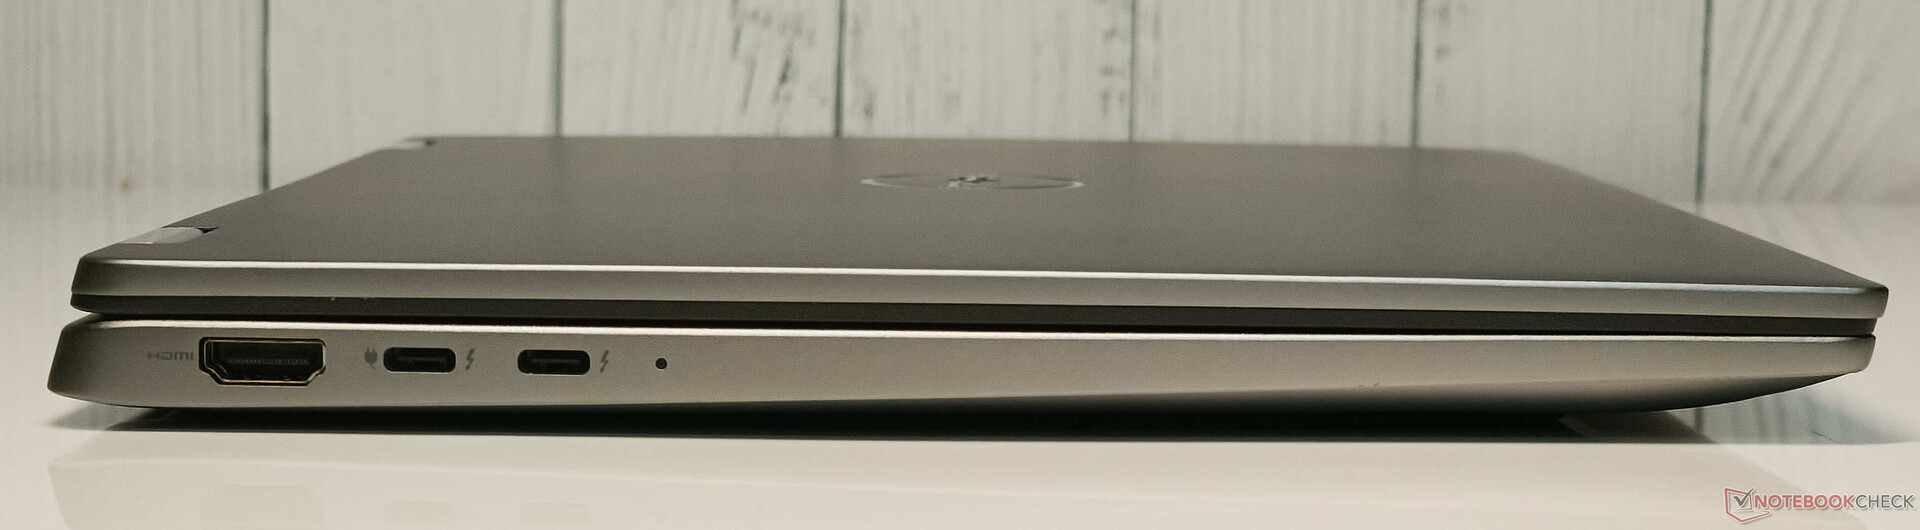
Wybór portów w Latitude 7450 2-w-1 jest podobny do tego, co widzieliśmy w zeszłym roku. Dell po raz kolejny skąpi na dostarczeniu dedykowanego portu Ethernet, ale port HDMI otrzymuje aktualizację do wersji 2.1.
W naszym urządzeniu testowym nie ma gniazda na kartę micro SIM, ale w razie potrzeby można je opcjonalnie skonfigurować.


Karta Intel BE200 Wi-Fi 7 WLAN w Latitude 7450 zapewnia wysoką wydajność zarówno w paśmie 5 GHz, jak i 6 GHz bez dławienia transmisji.
Przepustowość w obu tych pasmach jest niemal identyczna, przy czym pasmo 6 GHz wykazuje o 3,6% większą prędkość odbioru w porównaniu z odpowiednim testem 5 GHz.
Dell Optimizer umożliwia wykorzystanie dwóch połączeń (przewodowego i bezprzewodowego) jednocześnie w celu szybszego pobierania.
Niestety, karta WLAN jest przylutowana i nie można jej wymienić.
| Networking / iperf3 transmit AXE11000 | |
| Lenovo ThinkPad X1 2in1 G9 21KE004AGE | |
| Dell Latitude 7450 2-in-1 | |
| Dell Latitude 9450 2-in-1 | |
| Przeciętny Intel Wi-Fi 7 BE200 320MHz (469 - 1660, n=23) | |
| Średnia w klasie Convertible (131.3 - 1834, n=63, ostatnie 2 lata) | |
| Lenovo ThinkPad T14 G4 21K4S02000 | |
| HP EliteBook x360 1040 G11 | |
| Dell Latitude 7350 Detachable | |
| Networking / iperf3 receive AXE11000 | |
| Dell Latitude 7450 2-in-1 | |
| Lenovo ThinkPad X1 2in1 G9 21KE004AGE | |
| Lenovo ThinkPad T14 G4 21K4S02000 | |
| Dell Latitude 9450 2-in-1 | |
| Przeciętny Intel Wi-Fi 7 BE200 320MHz (838 - 1701, n=23) | |
| Średnia w klasie Convertible (492 - 1755, n=63, ostatnie 2 lata) | |
| HP EliteBook x360 1040 G11 | |
| Dell Latitude 7350 Detachable | |
| Networking / iperf3 transmit AXE11000 6GHz | |
| Lenovo ThinkPad T14 G4 21K4S02000 | |
| Dell Latitude 7450 2-in-1 | |
| HP EliteBook x360 1040 G11 | |
| Dell Latitude 7350 Detachable | |
| Przeciętny Intel Wi-Fi 7 BE200 320MHz (943 - 1653, n=17) | |
| Średnia w klasie Convertible (685 - 1775, n=43, ostatnie 2 lata) | |
| Dell Latitude 9450 2-in-1 | |
| Networking / iperf3 receive AXE11000 6GHz | |
| Lenovo ThinkPad T14 G4 21K4S02000 | |
| Dell Latitude 7450 2-in-1 | |
| Dell Latitude 7350 Detachable | |
| Przeciętny Intel Wi-Fi 7 BE200 320MHz (725 - 1770, n=17) | |
| HP EliteBook x360 1040 G11 | |
| Średnia w klasie Convertible (824 - 1771, n=44, ostatnie 2 lata) | |
| Dell Latitude 9450 2-in-1 | |
Dell oferuje tylko kamerę internetową 1080p z Latitude 7450 2-w-1, podczas gdy wariant laptopa można skonfigurować z kamerą do 5 MP. Jakość obrazu jest odpowiednia do rozmów wideo, pod warunkiem, że jest dobre oświetlenie otoczenia.
Na pokładzie znajduje się czujnik podczerwieni, a także czytnik linii papilarnych na przycisku zasilania do logowania w oparciu o Windows Hello. Dostępna jest również fizyczna migawka prywatności kamery internetowej.
Dodatkowo, aplikacja Dell Optimizer umożliwia skonfigurowanie kilku funkcji wykrywania obecności w celu zwiększenia prywatności.


Zrównoważony rozwój
Dells kładzie nacisk na zrównoważony rozwój w materiałach marketingowych dla serii Latitude. Według firmy, aluminiowe konstrukcje składają się w 50% z aluminium pochodzącego z recyklingu i w 50% z aluminium niskoemisyjnego, podczas gdy opcje magnezowe składają się w 90% z magnezu pochodzącego z recyklingu.
Obudowa zasilacza wykonana jest w 95% z plastiku pochodzącego z recyklingu, a wewnętrzna osłona termiczna wykonana jest w 98% z aluminium pochodzącego z recyklingu.
Ponadto Dell zapewnia, że opakowania serii Latitude są wykonane w całości z materiałów pochodzących z recyklingu lub materiałów odnawialnych, z których wszystkie w 100% nadają się do recyklingu.
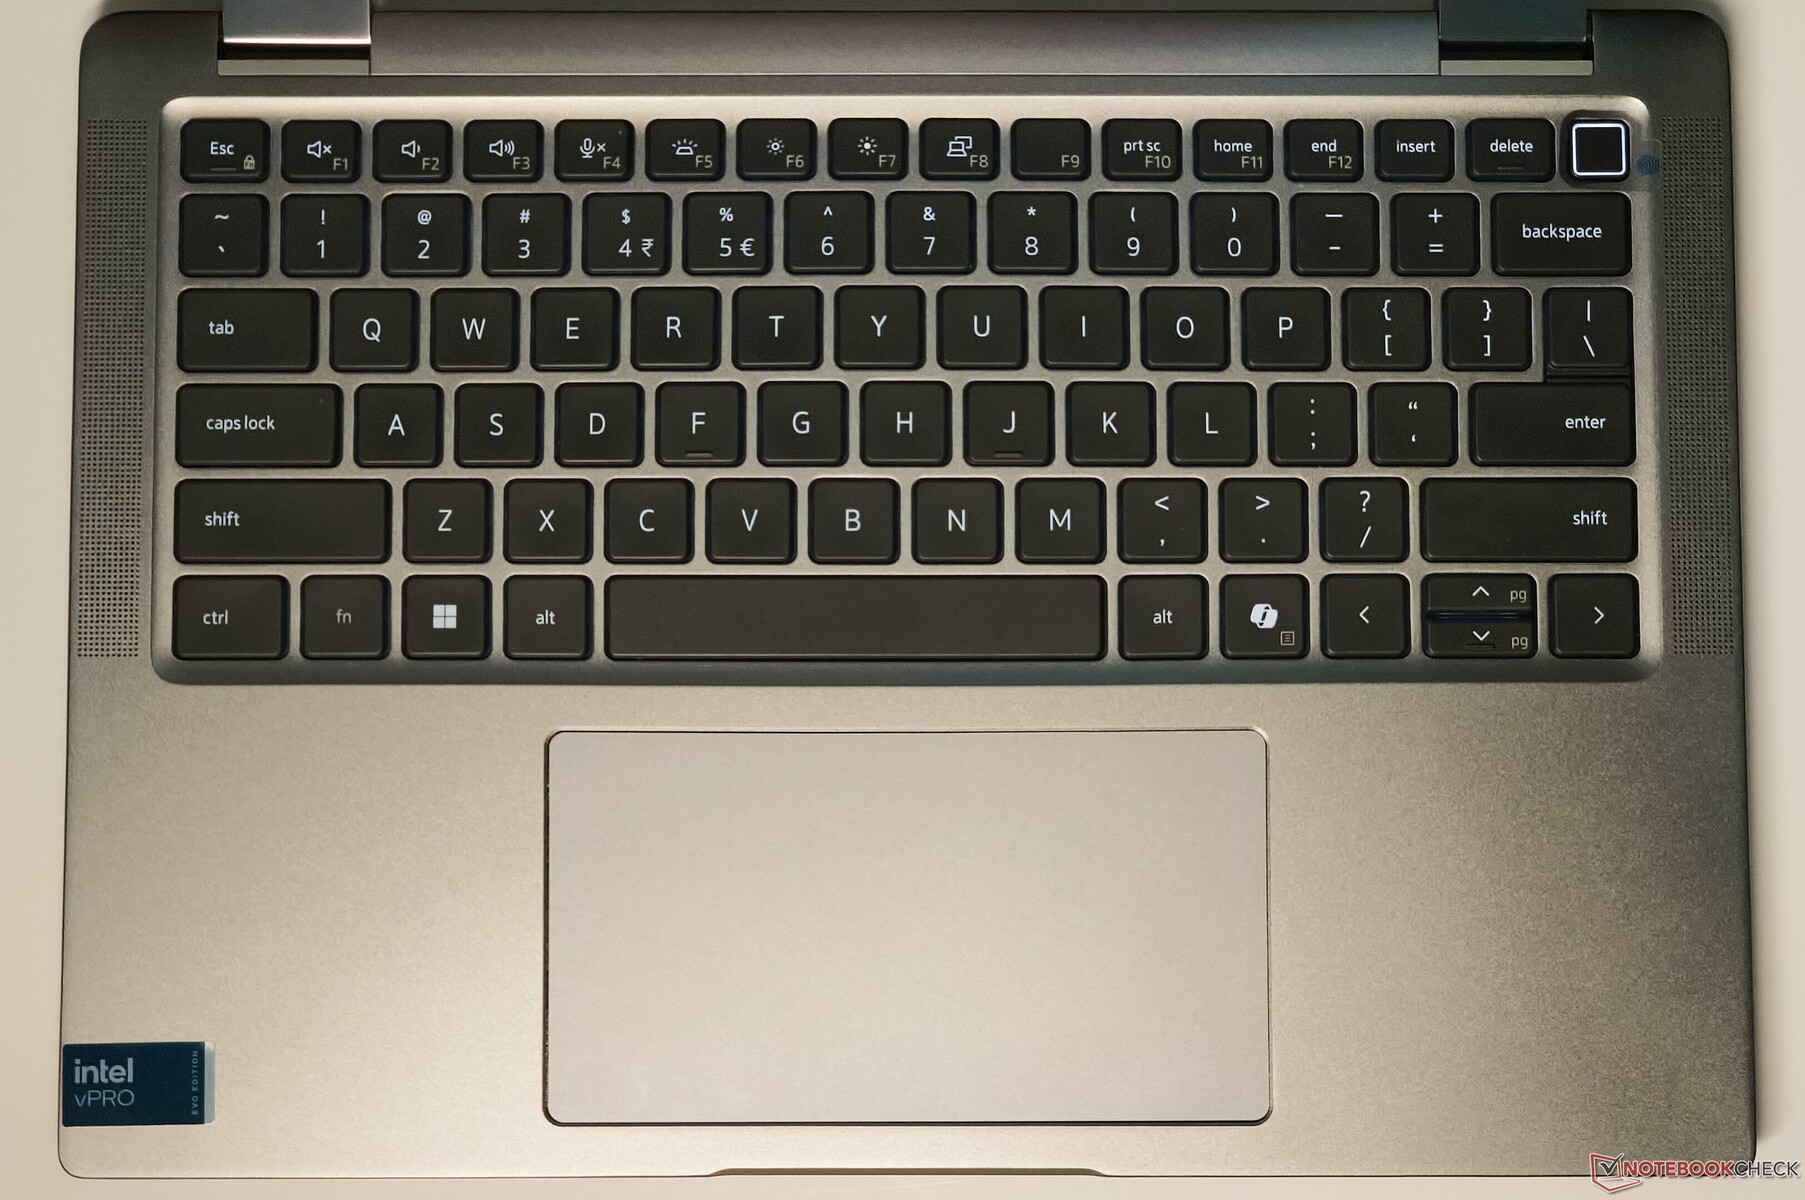
Urządzenia wejściowe: Ekran dotykowy z obsługą pióra i atramentu
Latitude 7450 2-w-1 posiada odporną na zalanie klawiaturę typu chiclet z dedykowanym klawiszem Co-pilot. Klawisze oferują przyzwoity skok i wyczuwalność, co zapewnia bardzo dobre wrażenia podczas pisania. Dwustopniowe białe podświetlenie pomaga w czytelności w ciemności.
Touchpad o wymiarach 13,3 cm x 7 cm jest w dużej mierze niezmieniony w stosunku do zeszłorocznej oferty. Kliknięcia są mocne i mają głęboki skok, choć brzmią nieco głośniej niż preferowane. Powierzchnia oferuje pełne wsparcie dla gestów Windows Precision. Górne rogi są trudne do kliknięcia, ale dolna połowa touchpada jest bardzo responsywna.
Będąc urządzeniem konwertowalnym, Latitude 7450 2-w-1 jest wyposażony w ekran dotykowy, który rozpoznaje 10-palcowy multi-touch i wprowadzanie danych piórem. Dell nie oferuje rysika w pudełku, ale można opcjonalnie kupić Dell Active Pen PN5122W, który oferuje 4096 poziomów nacisku za 40 USD.
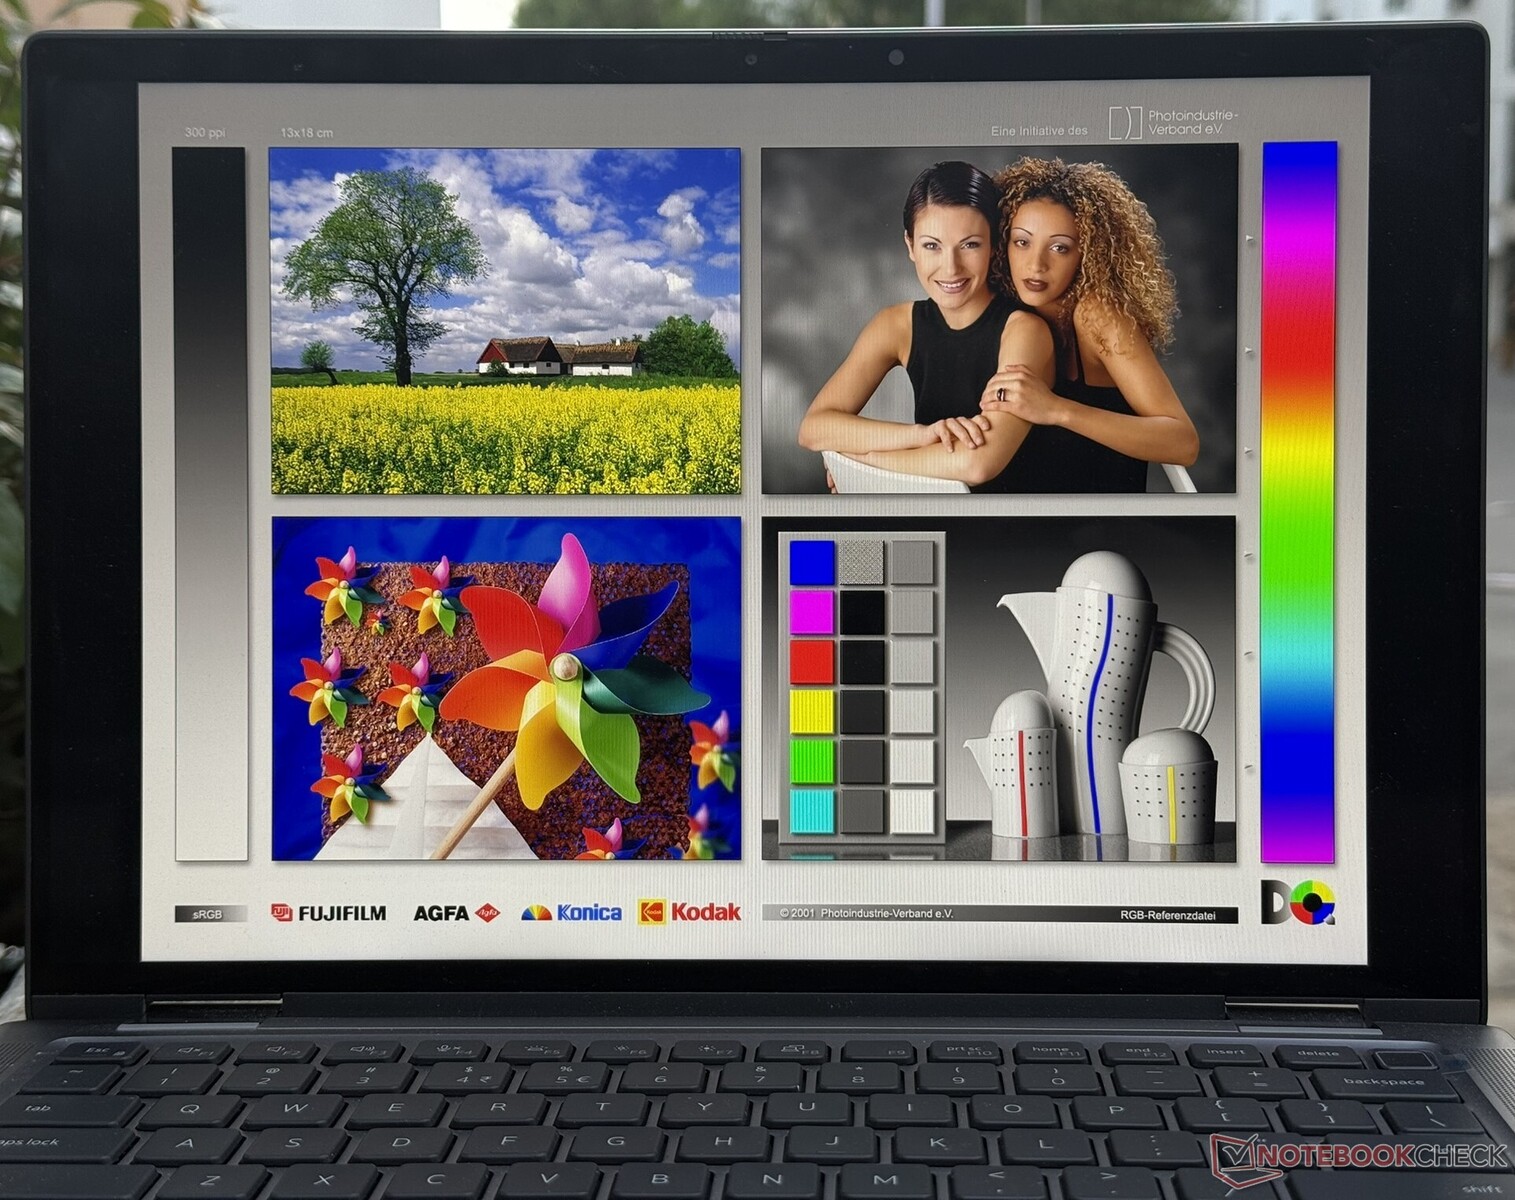
Wyświetlacz: panel FHD+ IPS 60 Hz bez PWM
Dell oferuje 14-calowy dotykowy wyświetlacz IPS 16:10 FHD+ 60 Hz dla Latitude 7450 2-w-1. Zwykły wariant laptopa można opcjonalnie skonfigurować z dotykowym panelem IPS o rozdzielczości QHD+. Niestety, podobnie jak w przypadku większości laptopów biznesowych, wyższe częstotliwości odświeżania nadal pozostają nieuchwytne dla linii Latitude.
Obserwujemy dobrą równomierność rozkładu jasności na poziomie 85% z minimalnym spadkiem podświetlenia. Błyszcząca powierzchnia może jednak rozpraszać uwagę przy bezpośrednim padaniu światła.


| |||||||||||||||||||||||||
rozświetlenie: 85 %
na akumulatorze: 332 cd/m²
kontrast: 1233:1 (czerń: 0.27 cd/m²)
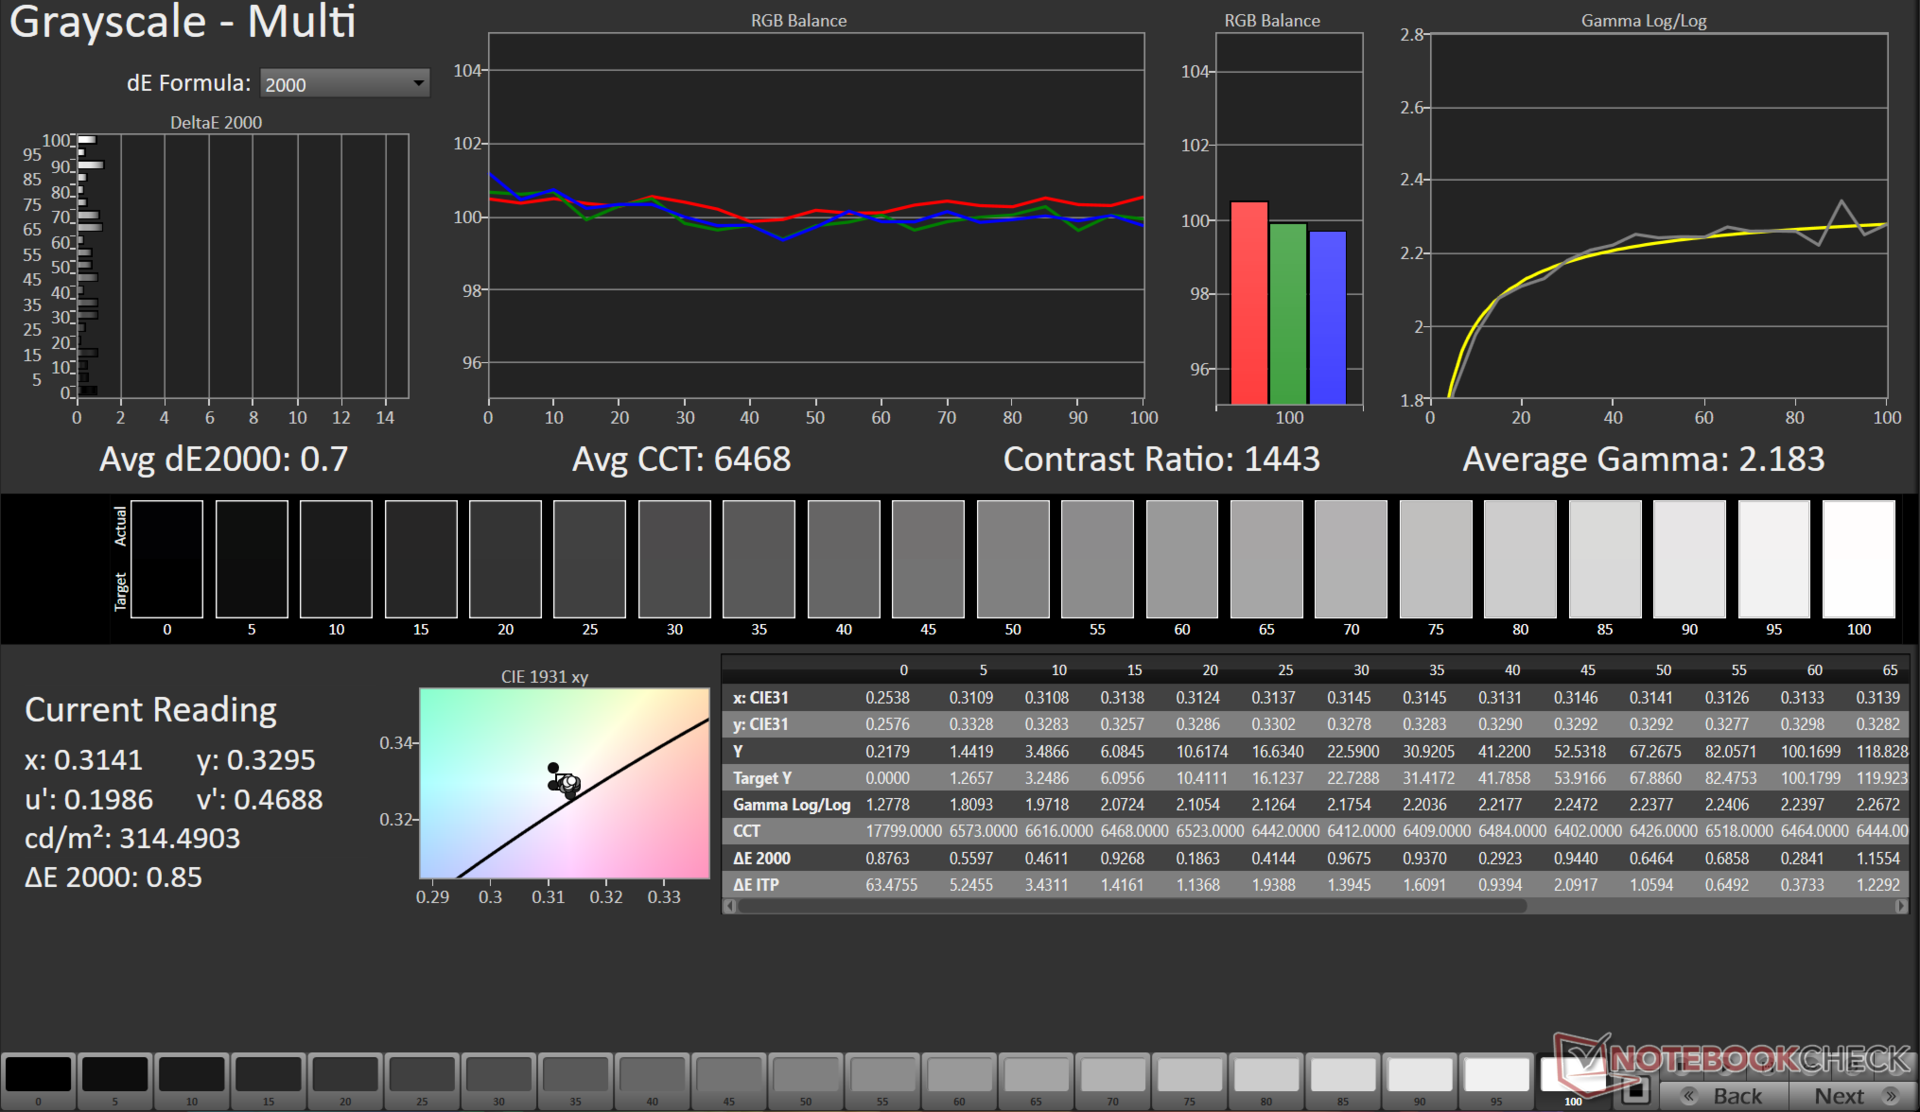
ΔE Color 2.46 | 0.5-29.43 Ø4.87, calibrated: 1.31
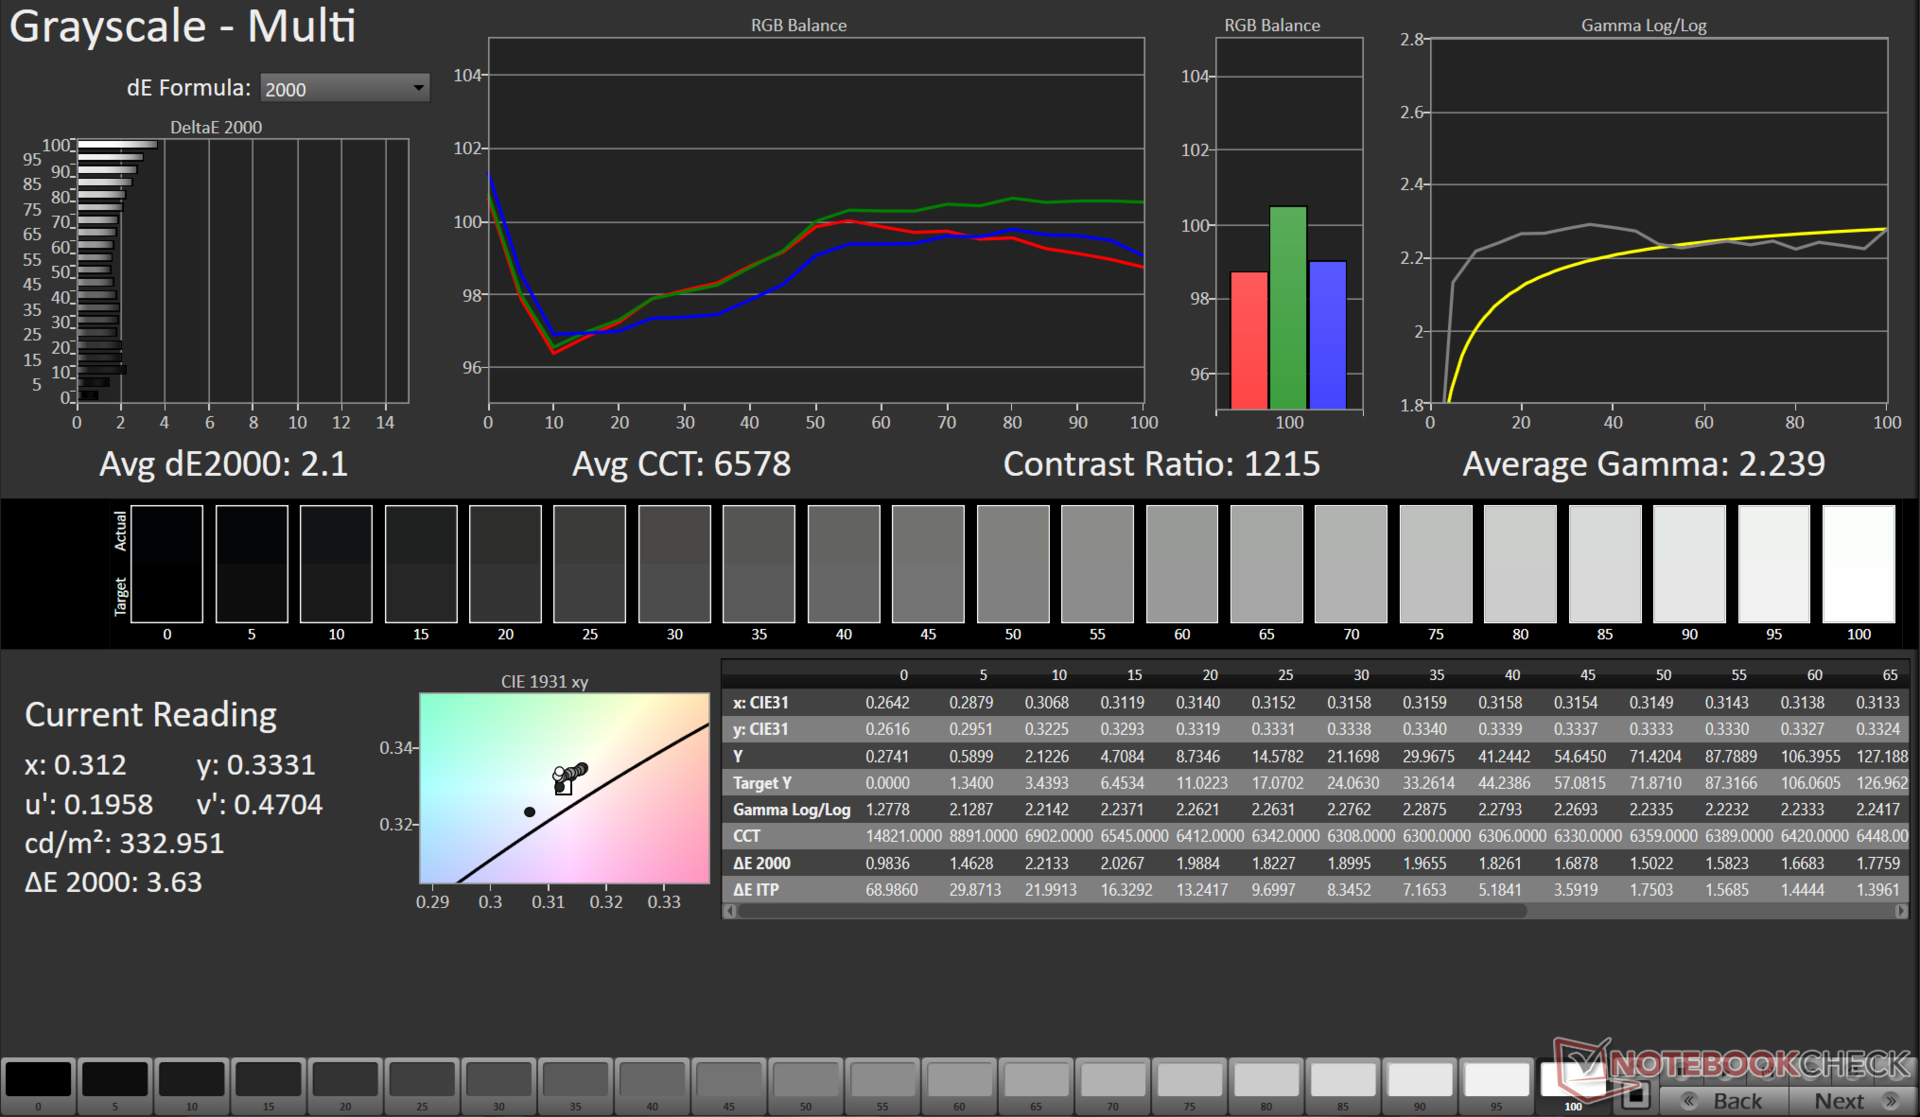
ΔE Greyscale 2.1 | 0.5-98 Ø5.1
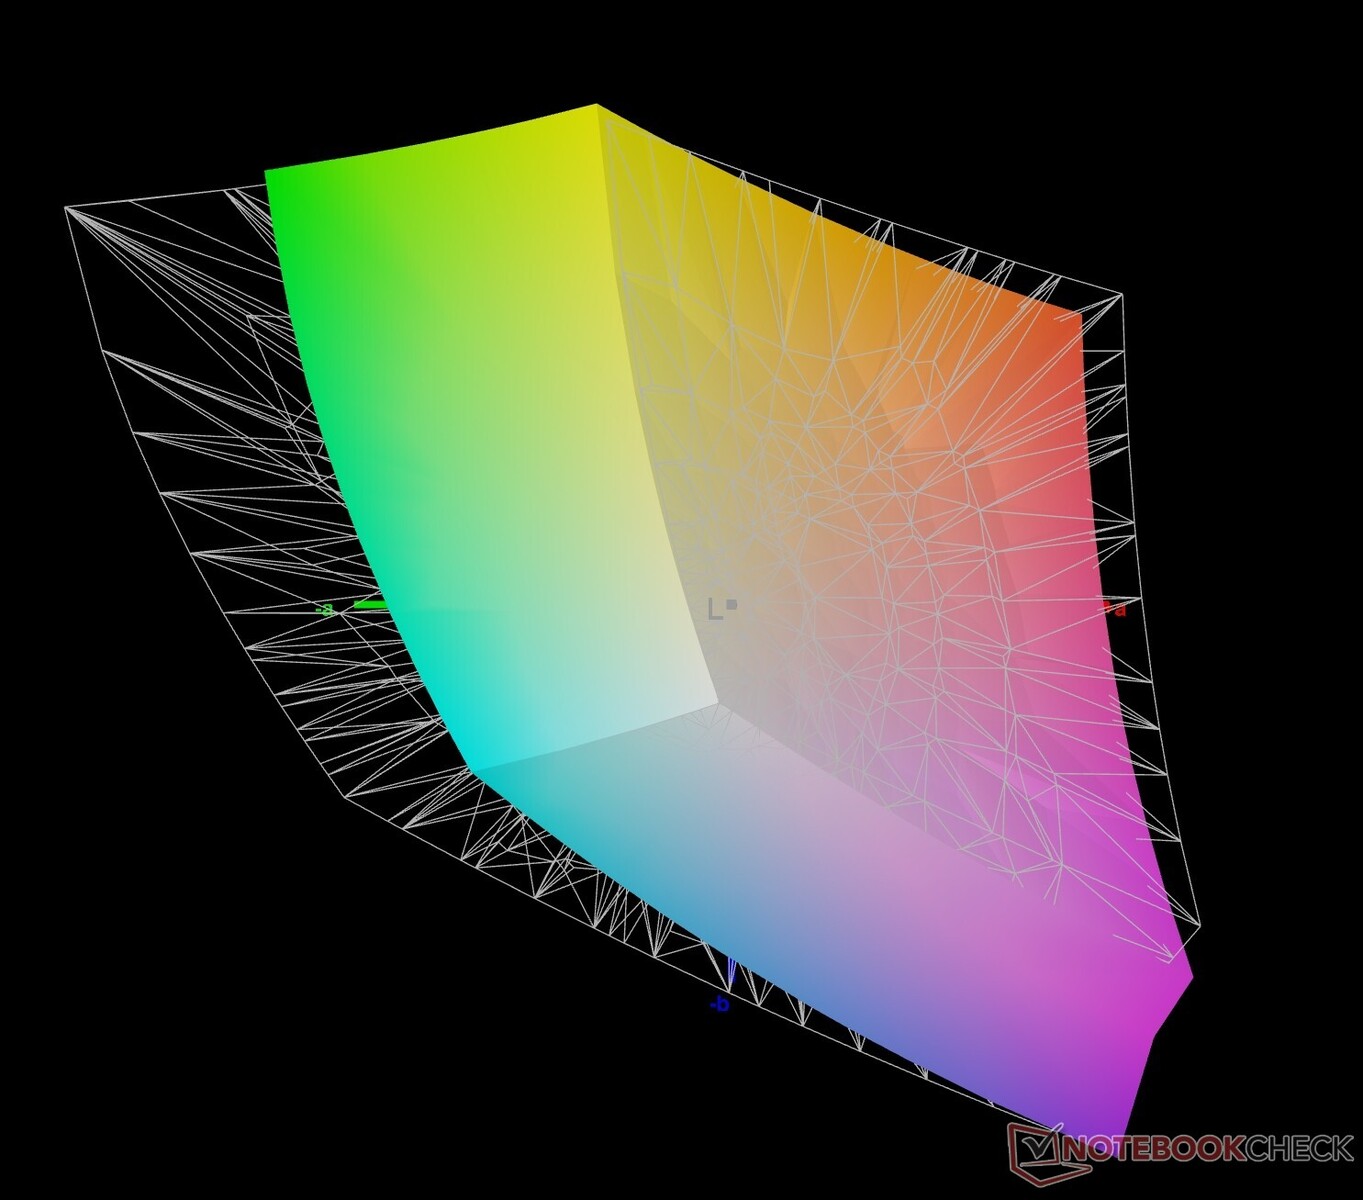
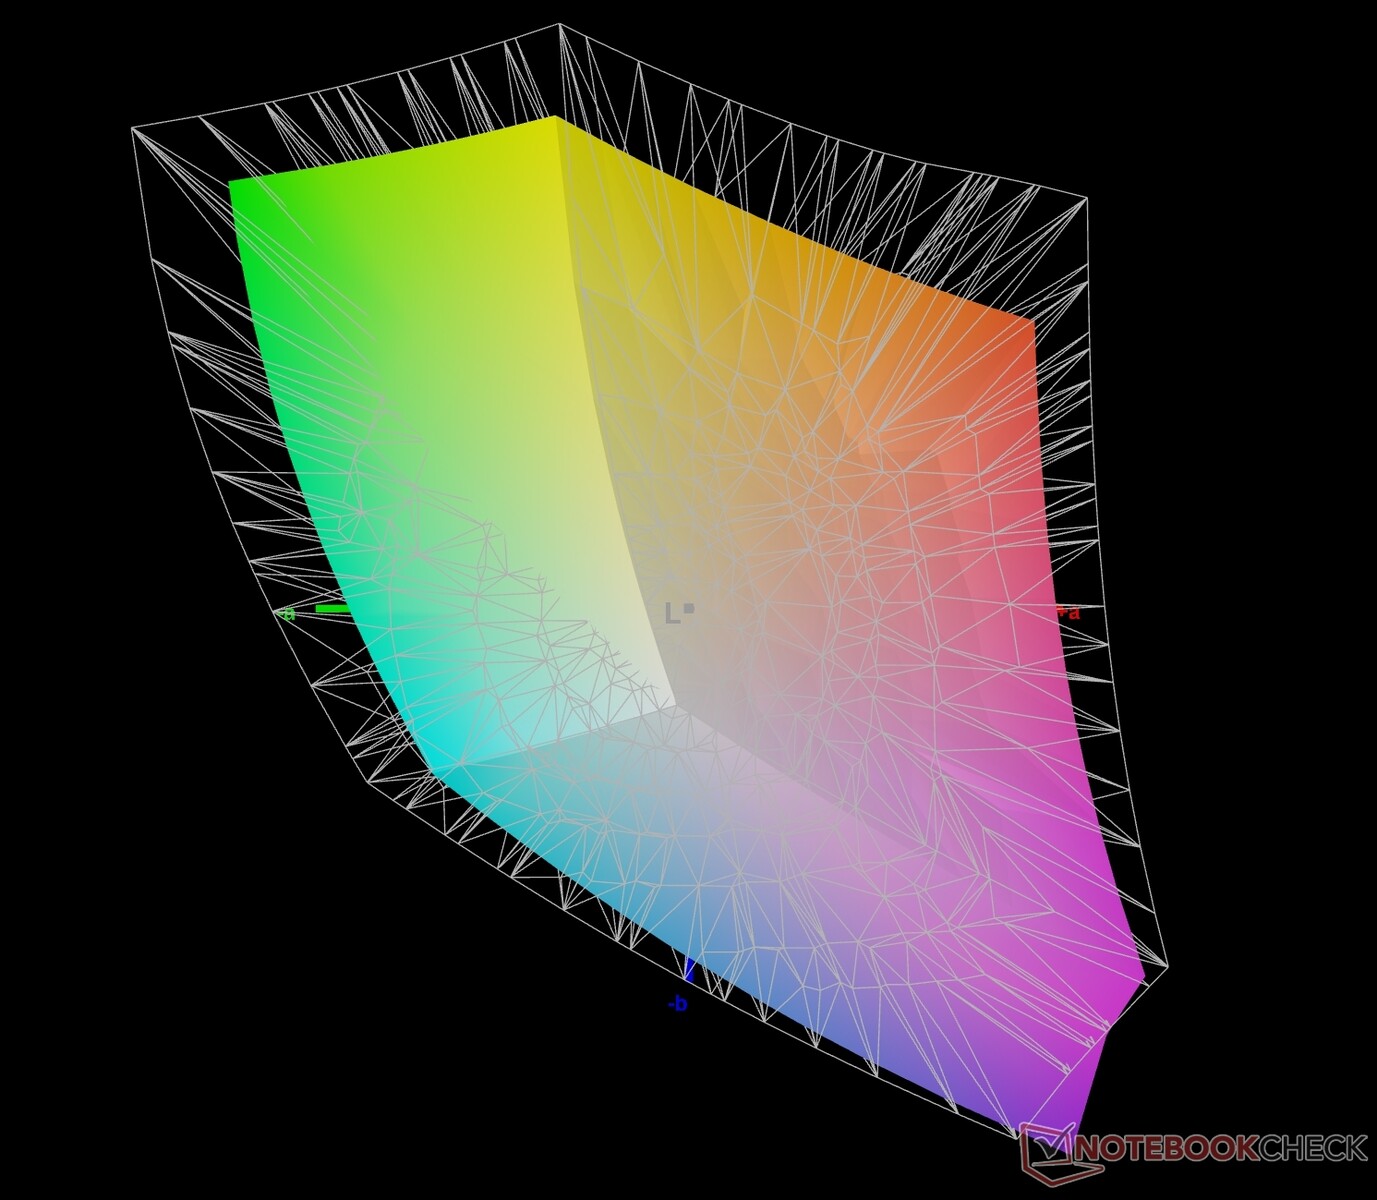
76% AdobeRGB 1998 (Argyll 2.2.0 3D)
100% sRGB (Argyll 2.2.0 3D)
76.5% Display P3 (Argyll 2.2.0 3D)
Gamma: 2.2
| Dell Latitude 7450 2-in-1 BOE NV140WU, IPS, 1920x1200, 14", 60 Hz | Lenovo ThinkPad X1 2in1 G9 21KE004AGE ATNA4ßYK20-0, OLED, 2880x1800, 14", 120 Hz | Dell Latitude 9450 2-in-1 AU Optronics B140QAN, IPS, 2560x1600, 14", 60 Hz | Dell Latitude 7350 Detachable BOE NE13A1M, IPS, 2880x1920, 13", 60 Hz | Lenovo ThinkPad T14 G4 21K4S02000 MNE007JA1-1, IPS LED, 1920x1200, 14", Hz | HP EliteBook x360 1040 G11 CMN1474, IPS, 1920x1200, 14", 60 Hz | |
|---|---|---|---|---|---|---|
| Display | 20% | 3% | -5% | -8% | -6% | |
| Display P3 Coverage | 76.5 | 99.9 31% | 80.6 5% | 70.2 -8% | 67.1 -12% | 69 -10% |
| sRGB Coverage | 100 | 100 0% | 100 0% | 98.9 -1% | 97.8 -2% | 99.2 -1% |
| AdobeRGB 1998 Coverage | 76 | 97.6 28% | 80.1 5% | 72.1 -5% | 69.4 -9% | 71.1 -6% |
| Response Times | 98% | -60% | -13% | -8% | -47% | |
| Response Time Grey 50% / Grey 80% * | 35.65 ? | 0.61 ? 98% | 59.6 ? -67% | 43.8 ? -23% | 38.4 ? -8% | 54.5 ? -53% |
| Response Time Black / White * | 23.35 ? | 0.69 ? 97% | 35.6 ? -52% | 24.1 ? -3% | 25.1 ? -7% | 32.7 ? -40% |
| PWM Frequency | 240 ? | |||||
| Screen | 16% | 15% | 0% | 24% | 11% | |
| Brightness middle | 333 | 412 24% | 501.4 51% | 508.5 53% | 398 20% | 351.3 5% |
| Brightness | 326 | 411 26% | 491 51% | 507 56% | 379 16% | 328 1% |
| Brightness Distribution | 85 | 98 15% | 88 4% | 87 2% | 90 6% | 86 1% |
| Black Level * | 0.27 | 0.32 -19% | 0.24 11% | 0.23 15% | 0.24 11% | |
| Contrast | 1233 | 1567 27% | 2119 72% | 1730 40% | 1464 19% | |
| Colorchecker dE 2000 * | 2.46 | 1.9 23% | 2.52 -2% | 3 -22% | 1.3 47% | 2.29 7% |
| Colorchecker dE 2000 max. * | 4.58 | 3.9 15% | 4.87 -6% | 7.03 -53% | 3.1 32% | 4.55 1% |
| Colorchecker dE 2000 calibrated * | 1.31 | 1.9 -45% | 0.45 66% | 1.28 2% | 1.2 8% | 0.49 63% |
| Greyscale dE 2000 * | 2.1 | 1 52% | 2.8 -33% | 4.6 -119% | 1.4 33% | 2.2 -5% |
| Gamma | 2.2 100% | 2.21 100% | 2.17 101% | 2.17 101% | 2.26 97% | 2.13 103% |
| CCT | 6578 99% | 6361 102% | 6270 104% | 6929 94% | 6448 101% | 6321 103% |
| Całkowita średnia (program / ustawienia) | 45% /
30% | -14% /
2% | -6% /
-3% | 3% /
13% | -14% /
-1% |
* ... im mniej tym lepiej
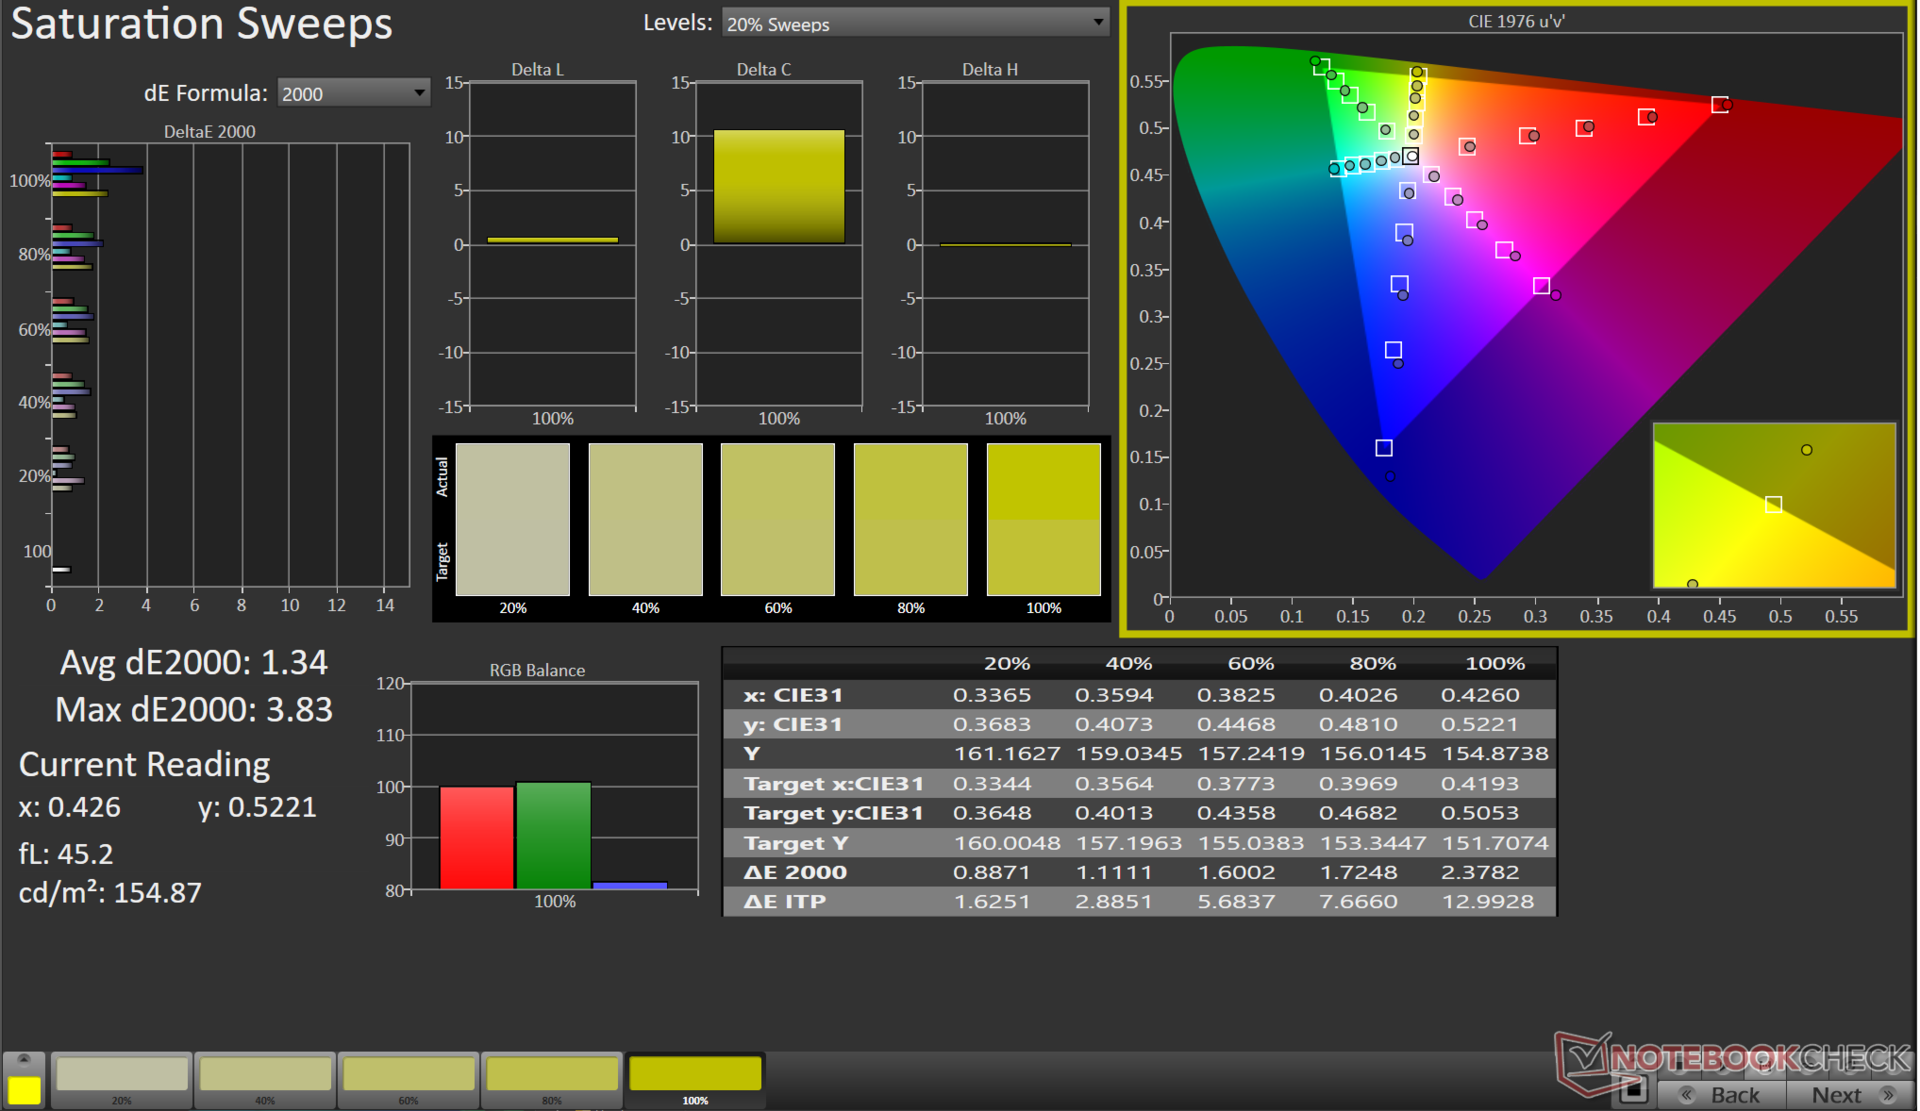
Wyświetlacz oferuje dobre wrażenia wizualne dzięki pełnemu pokryciu spektrum sRGB oraz przyzwoitemu pokryciu Adobe RGB i Display P3.
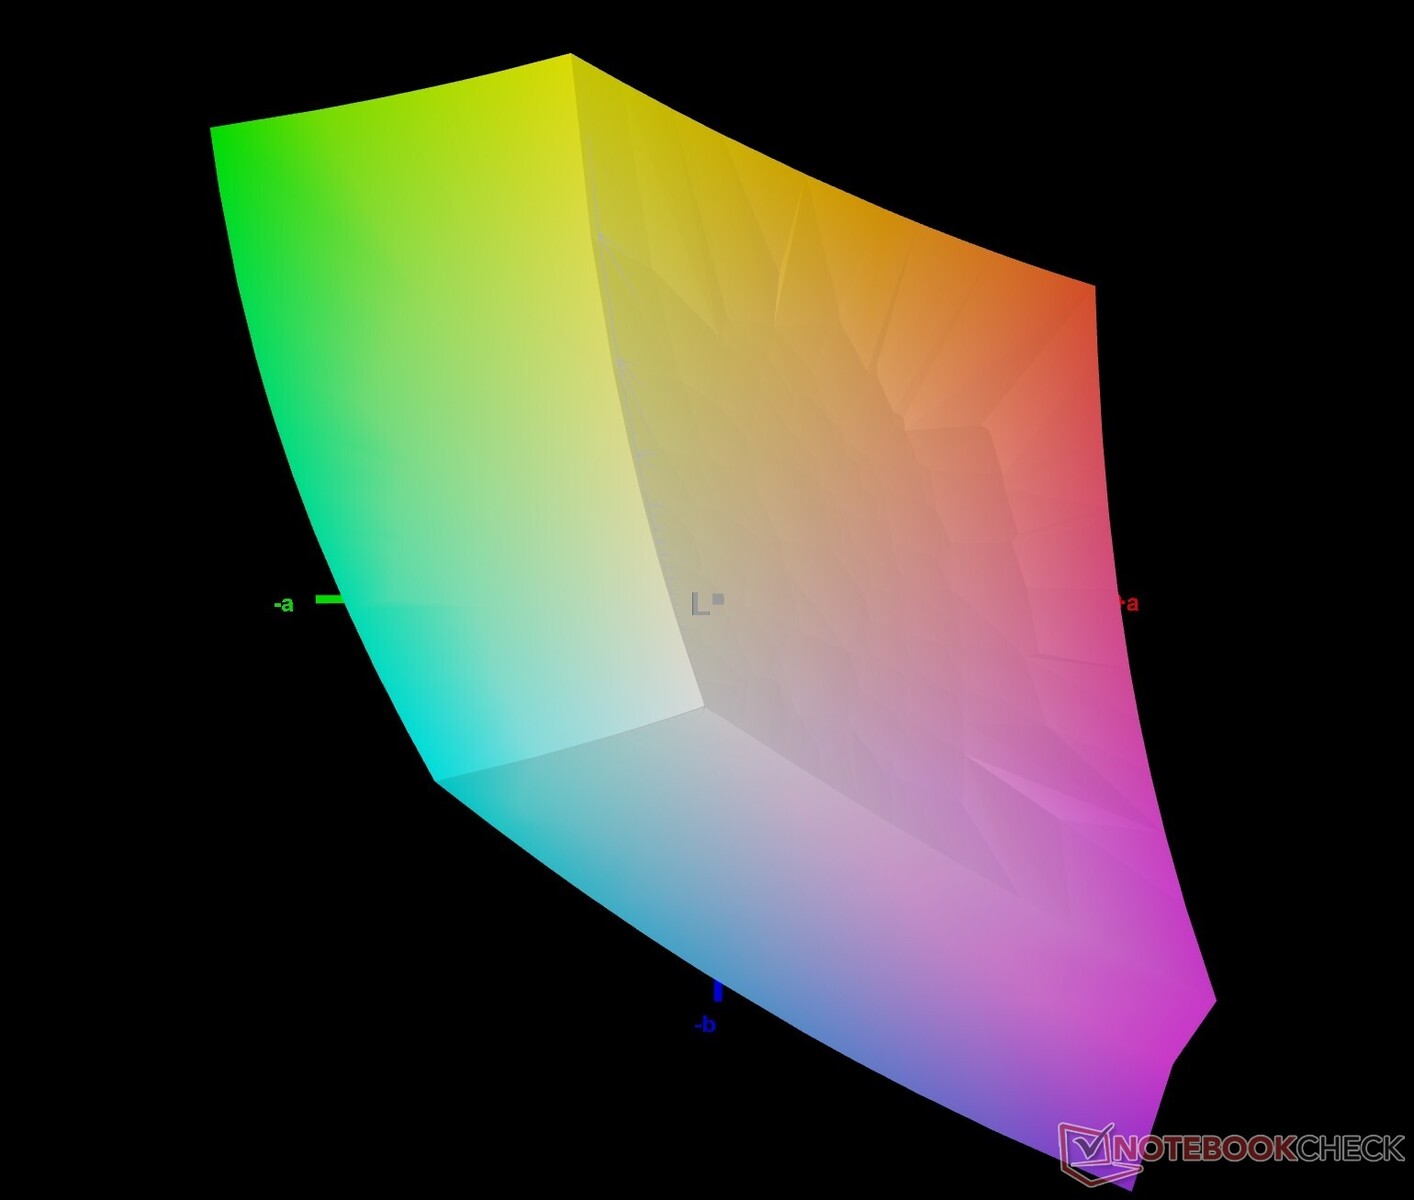
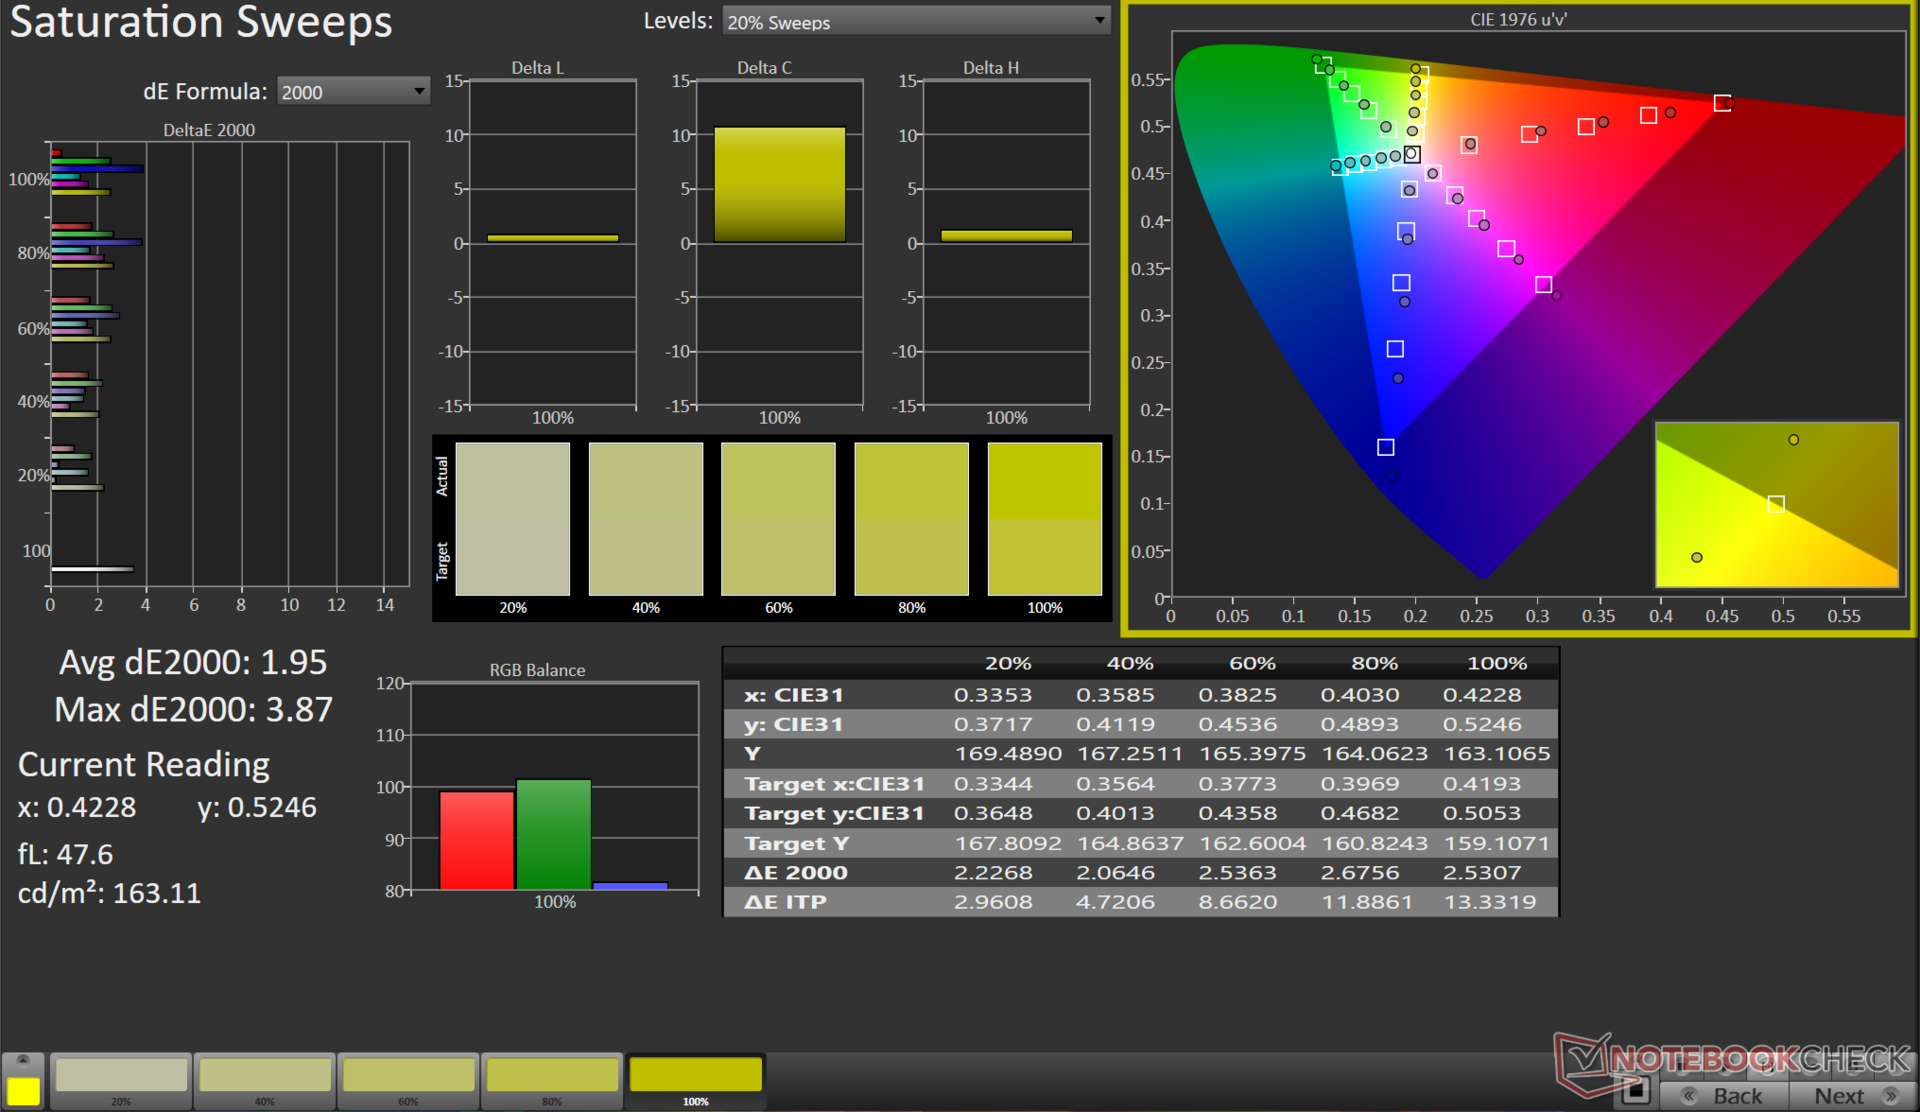
Panel BOE w naszym urządzeniu oferuje akceptowalne wartości DeltaE 2000 po wyjęciu z pudełka. Nasza procedura kalibracji przy użyciu spektrofotometru X-Rite i1Basic Pro 3 i oprogramowania Calman Ultimate firmy Portrait Displays pomaga jeszcze bardziej zaostrzyć wartości DeltaE 2000 w skali szarości i ColorChecker.
Jednak panel nadal cierpi z powodu dużych odchyleń w 100% niebieskiej części widma.


Wyświetl czasy reakcji
| ↔ Czas reakcji od czerni do bieli | ||
|---|---|---|
| 23.35 ms ... wzrost ↗ i spadek ↘ łącznie | ↗ 11.77 ms wzrost | 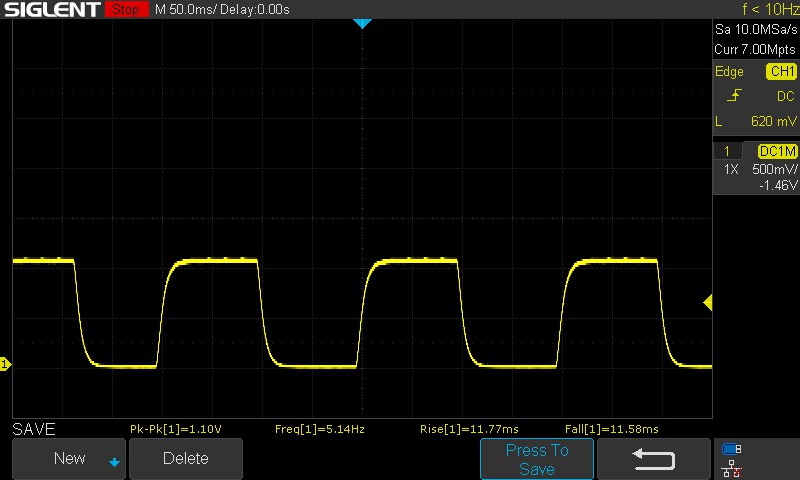 |
| ↘ 11.58 ms upadek | ||
| W naszych testach ekran wykazuje dobry współczynnik reakcji, ale może być zbyt wolny dla graczy rywalizujących ze sobą. Dla porównania, wszystkie testowane urządzenia wahają się od 0.1 (minimum) do 240 (maksimum) ms. » 50 % wszystkich urządzeń jest lepszych. Oznacza to, że zmierzony czas reakcji jest gorszy od średniej wszystkich testowanych urządzeń (20.8 ms). | ||
| ↔ Czas reakcji 50% szarości do 80% szarości | ||
| 35.65 ms ... wzrost ↗ i spadek ↘ łącznie | ↗ 16.01 ms wzrost | 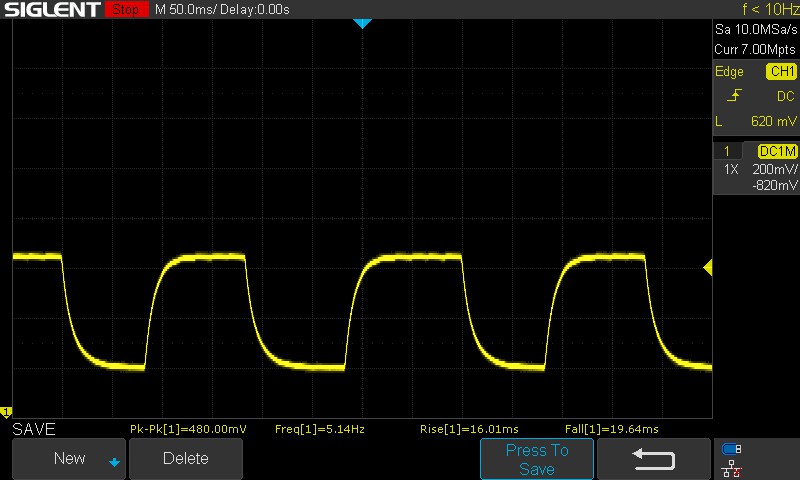 |
| ↘ 19.64 ms upadek | ||
| W naszych testach ekran wykazuje powolne tempo reakcji, co będzie niezadowalające dla graczy. Dla porównania, wszystkie testowane urządzenia wahają się od 0.165 (minimum) do 636 (maksimum) ms. » 47 % wszystkich urządzeń jest lepszych. Oznacza to, że zmierzony czas reakcji jest zbliżony do średniej wszystkich testowanych urządzeń (32.5 ms). | ||
Migotanie ekranu / PWM (modulacja szerokości impulsu)
| Migotanie ekranu/nie wykryto PWM | ≤ 100 % ustawienia jasności |  | |
Dla porównania: 53 % wszystkich testowanych urządzeń nie używa PWM do przyciemniania wyświetlacza. Jeśli wykryto PWM, zmierzono średnio 8519 (minimum: 5 - maksimum: 343500) Hz. | |||
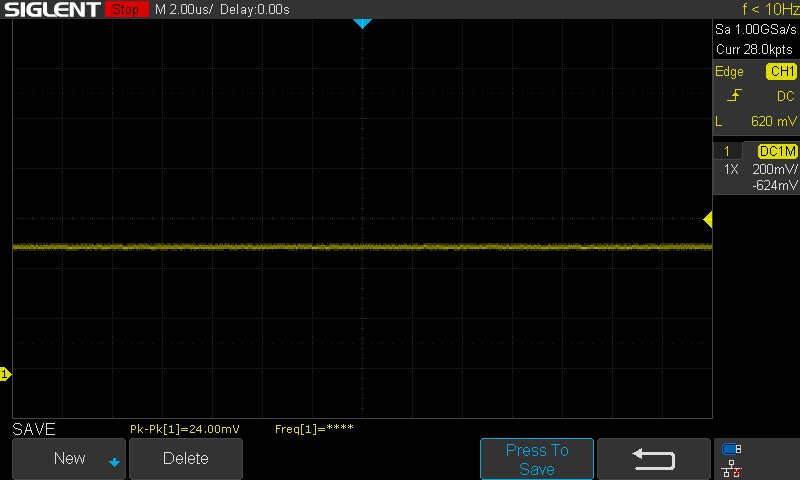
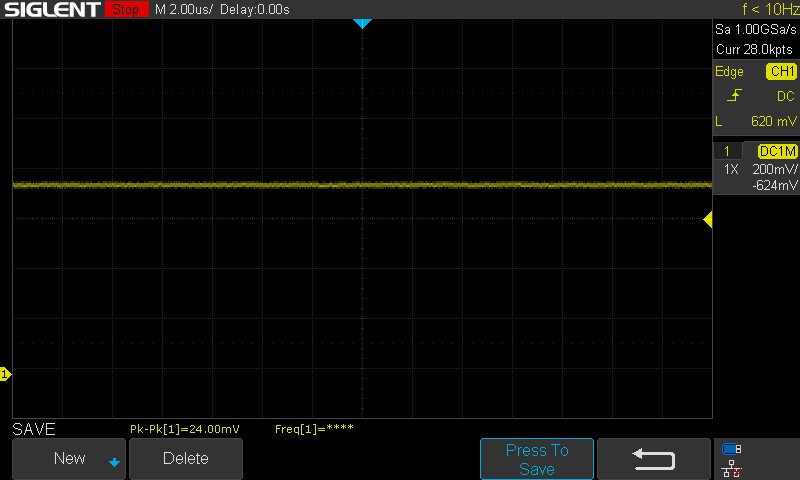

Aby uzyskać więcej informacji, proszę zapoznać się z naszym artykułem "Dlaczego PWM to taki ból głowy" i naszą Tabela rankingowa PWM.
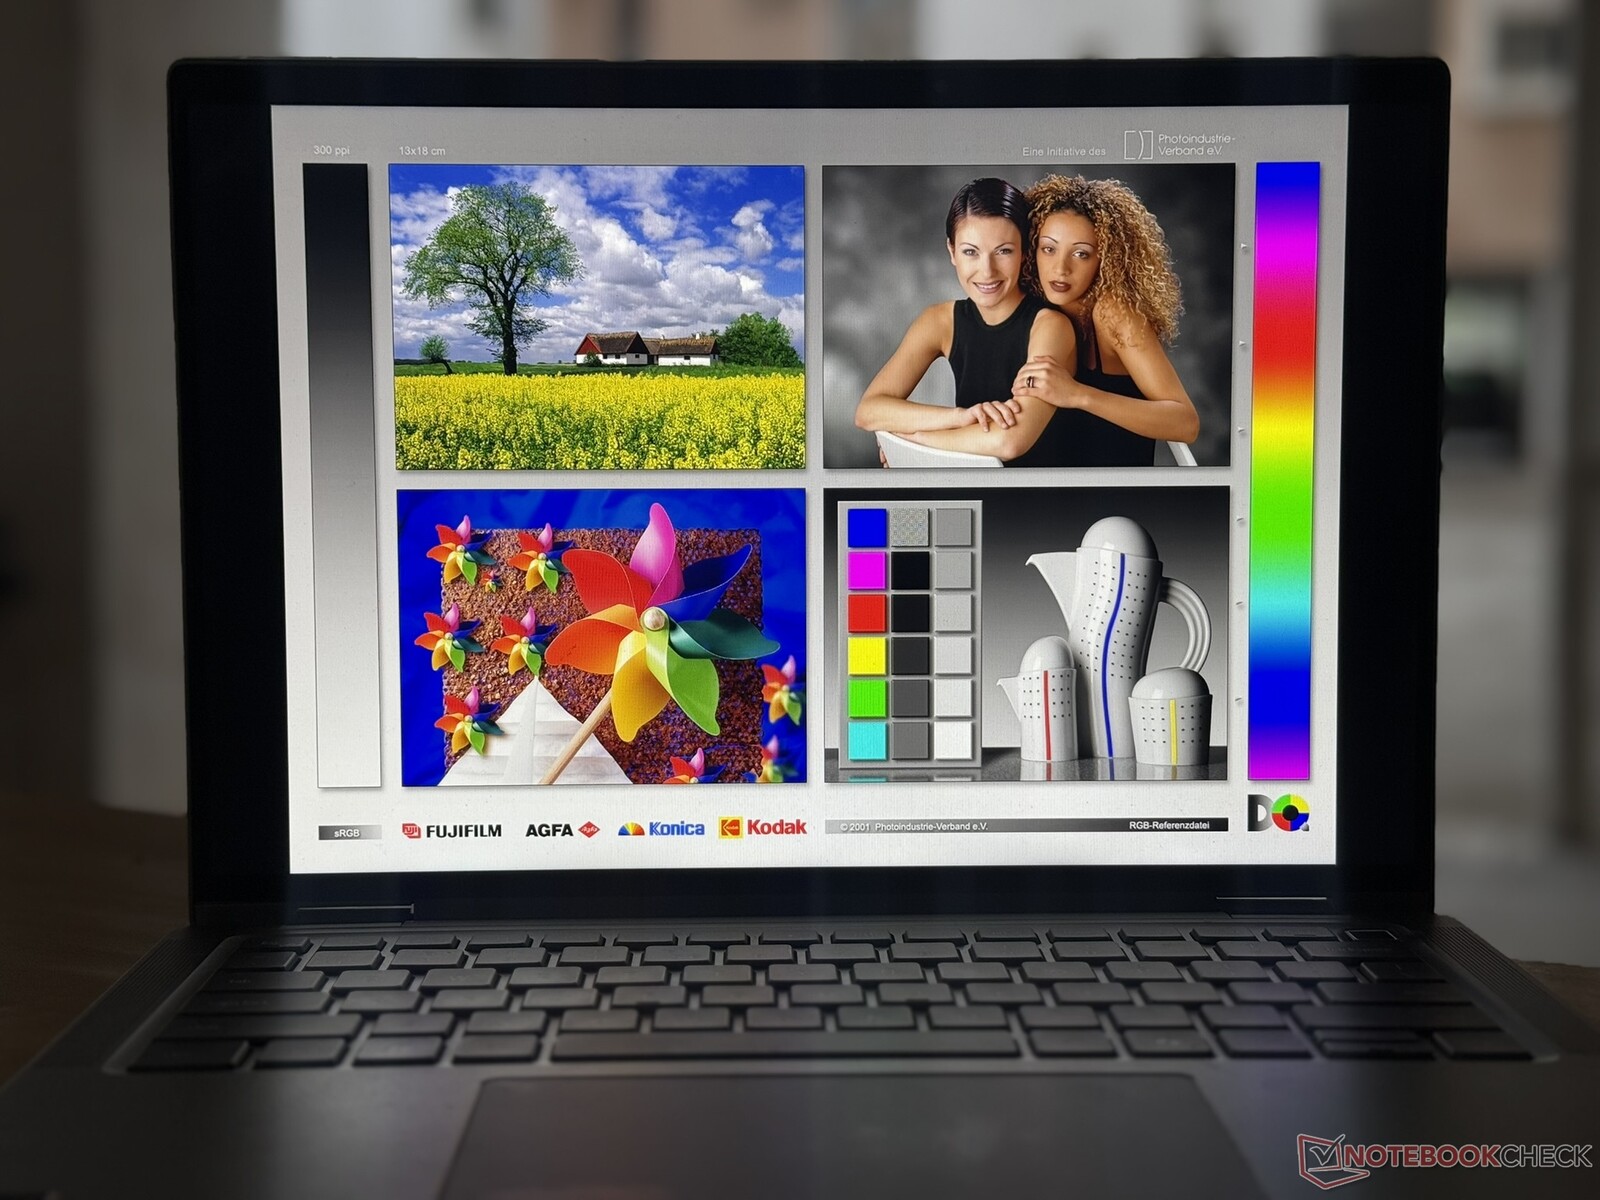
Błyszczący wyświetlacz może sprawić, że oglądanie w bezpośrednim świetle słonecznym będzie nieco irytujące. Kąty widzenia są stosunkowo stabilne, bez większej utraty jasności lub informacji o kolorze w skrajnych przypadkach.

Wydajność: Zmagania Core Ultra 7 165U vPro utrzymujące 44 W PL2 przez długi czas
Latitude 7450 2-in-1 może być skonfigurowany z procesorem Intel Core Ultra 5 135U vPro lub Core Ultra 7 165U vPro.
Dodatkowe opcje procesorów, takie jak Core Ultra 5 125U, Core Ultra 7 155Ui 28 W Core Ultra 7 165H vPro są dostępne dla tradycyjnych laptopów.
Warunki testowania
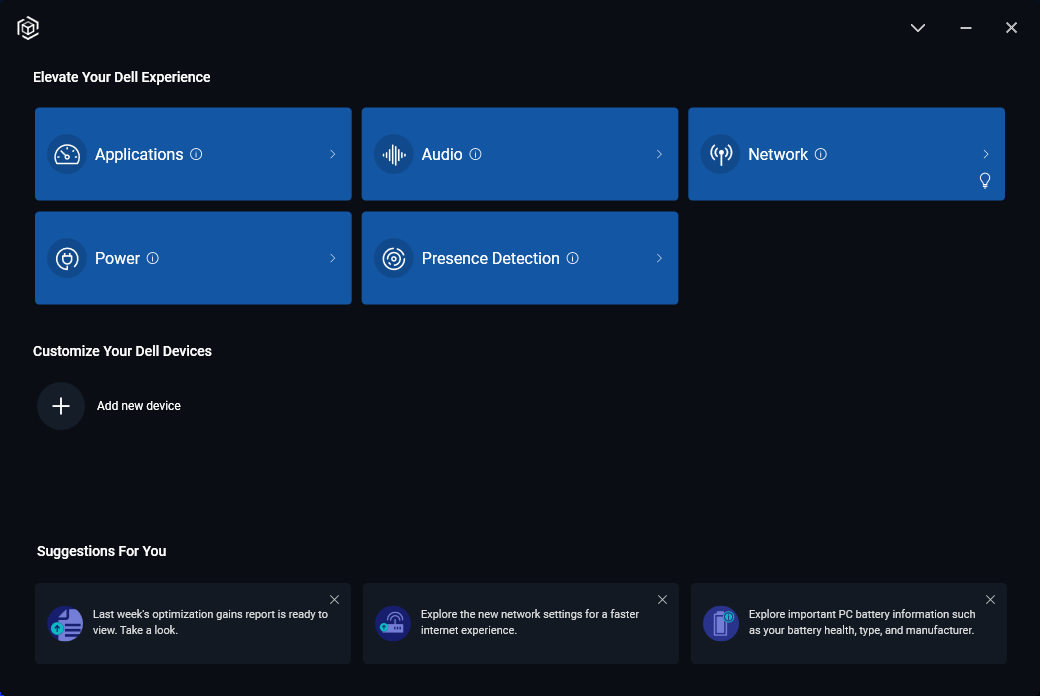
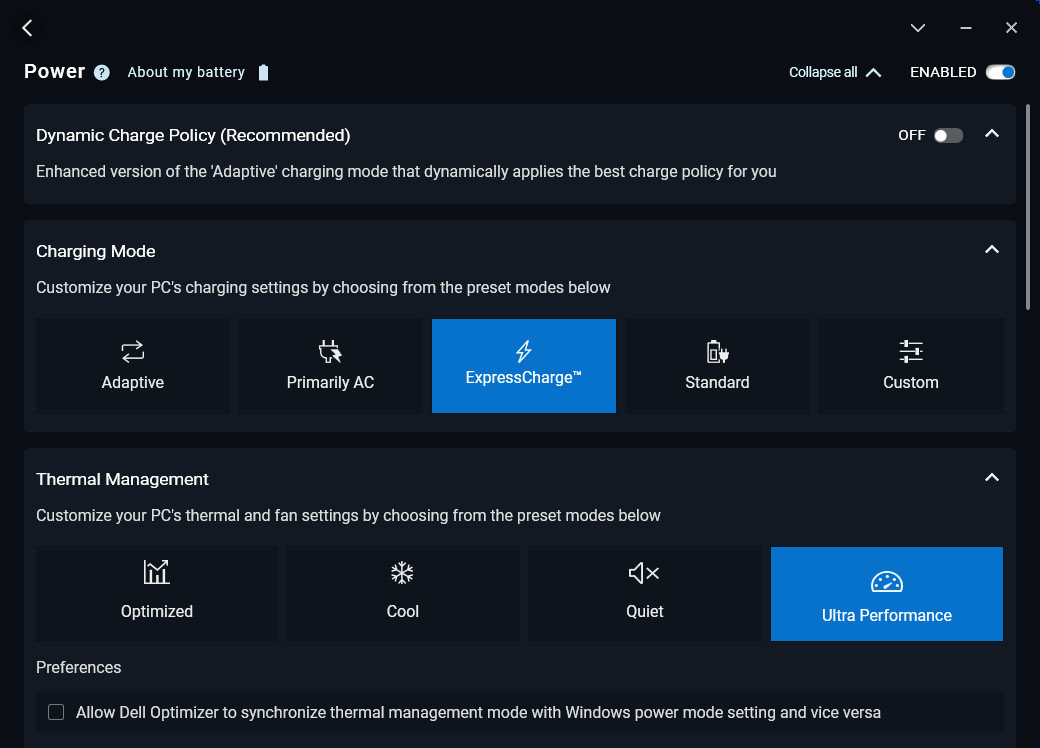
Dell oferuje cztery tryby wydajności do wyboru za pośrednictwem aplikacji Dell Optimizer, która jest pobierana osobno i nie jest częścią obrazu fabrycznego.
Użyliśmy trybu Ultra Performance dla wszystkich testów porównawczych i trybu Quiet dla testów żywotności baterii. Możliwe jest również zsynchronizowanie profili wydajności Dell Optimizer z trybami zasilania systemu Windows.
| Tryb wydajności | PL1 (PBP) / Tau | PL2 (MTP) / Tau | Cinebench R15 Multi score | Cinebench R15 Multi score (30 pętli) |
|---|---|---|---|---|
| Cichy | 11 W / 28 s | 44 W / 2,44 ms | 1680 (+2,5%) | 889 (-26%) |
| Chłodny | 30 W / 28 s | 44 W / 2,44 ms | 1345 (-17,8%) | 1026 (-15%) |
| Zoptymalizowany | 35 W / 28 s | 44 W / 2,44 ms | - | - |
| Ultra Performance | 38 W / 28 s | 44 W / 2,44 ms | 1638 (100%) | 1209 (100%) |
Procesor
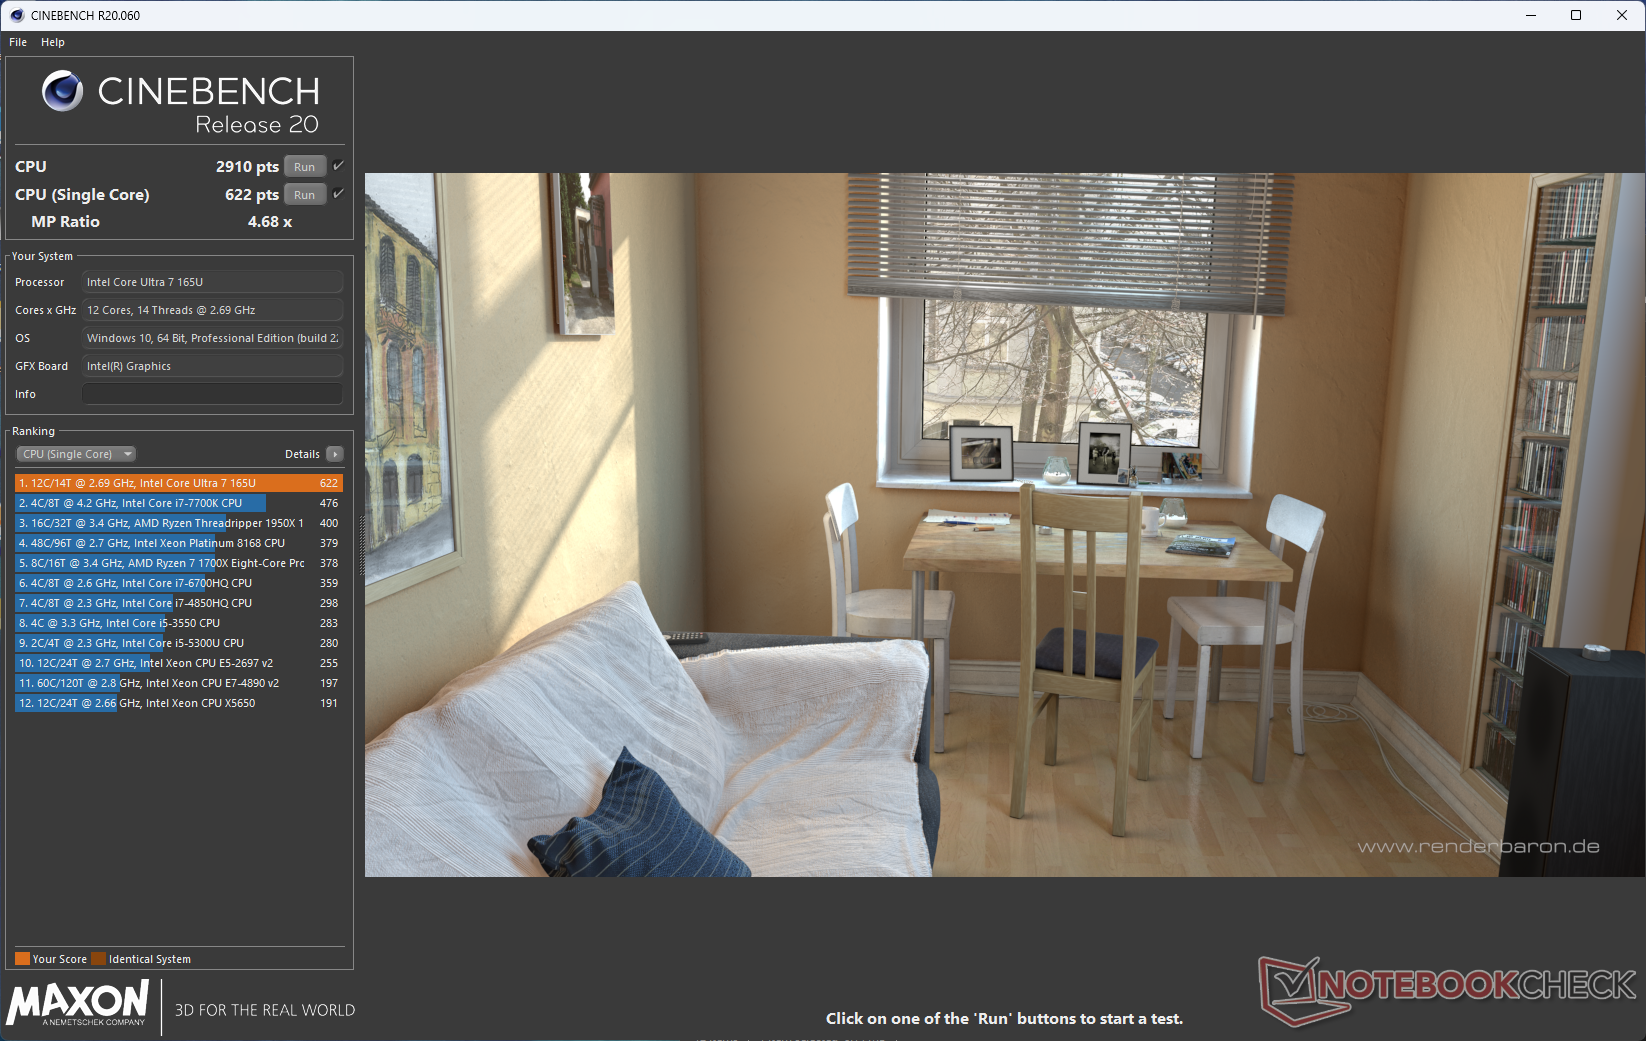
Core Ultra 7 165U w Latitude 7450 2-in-1 osiąga wyniki na poziomie średniej dla tego procesora.
Na uwagę zasługuje fakt, że urządzenie osiągnęło raczej słabe wyniki w testach porównawczych pojedynczego rdzenia z dostarczoną wersją BIOS-u. Zachęcamy użytkowników do aktualizacji do najnowszej wersji 1.60 lub wyższej, która naprawia ten problem.
Lenovo ThinkPad X1 2 Lenovo ThinkPad X1 2-w-1 G9 z tym samym procesorem jest w stanie dorównać skumulowanej wydajności Latitude pomimo pracy przy niższej mocy 40 W PL2.
Niemniej jednak, Latitude 7450 2-in-1 osiąga nieznacznie lepsze wyniki niż ThinkPad X1 2-in-1 w testach jednordzeniowych Geekbench 6.3 i zbiorczych AIDA64.
Obserwujemy dławienie procesora w wielordzeniowej pętli Cinebench R15, podobne do tego, co zaobserwowano wcześniej w przypadku modelu Latitude 7440 wyposażonym w Core i5-1345U.
Cinebench R15 Multi Loop
Cinebench R23: Multi Core | Single Core
Cinebench R20: CPU (Multi Core) | CPU (Single Core)
Cinebench R15: CPU Multi 64Bit | CPU Single 64Bit
Blender: v2.79 BMW27 CPU
7-Zip 18.03: 7z b 4 | 7z b 4 -mmt1
Geekbench 6.4: Multi-Core | Single-Core
Geekbench 5.5: Multi-Core | Single-Core
HWBOT x265 Benchmark v2.2: 4k Preset
LibreOffice : 20 Documents To PDF
R Benchmark 2.5: Overall mean
| CPU Performance Rating | |
| HP EliteBook x360 1040 G11 | |
| Lenovo ThinkPad T14 G4 21K4S02000 | |
| Dell Latitude 9450 2-in-1 | |
| Średnia w klasie Convertible | |
| Dell Latitude 7450 2-in-1 | |
| Lenovo ThinkPad X1 2in1 G9 21KE004AGE | |
| Przeciętny Intel Core Ultra 7 165U | |
| Dell Latitude 7440 -2! | |
| Dell Latitude 7350 Detachable | |
| Cinebench R23 / Multi Core | |
| HP EliteBook x360 1040 G11 | |
| Lenovo ThinkPad T14 G4 21K4S02000 | |
| Średnia w klasie Convertible (2949 - 29063, n=64, ostatnie 2 lata) | |
| Dell Latitude 9450 2-in-1 | |
| Dell Latitude 7450 2-in-1 | |
| Lenovo ThinkPad X1 2in1 G9 21KE004AGE | |
| Przeciętny Intel Core Ultra 7 165U (8498 - 10797, n=4) | |
| Dell Latitude 7440 | |
| Dell Latitude 7350 Detachable | |
| Cinebench R23 / Single Core | |
| HP EliteBook x360 1040 G11 | |
| Dell Latitude 7440 | |
| Lenovo ThinkPad T14 G4 21K4S02000 | |
| Dell Latitude 9450 2-in-1 | |
| Dell Latitude 7450 2-in-1 | |
| Średnia w klasie Convertible (914 - 2163, n=64, ostatnie 2 lata) | |
| Lenovo ThinkPad X1 2in1 G9 21KE004AGE | |
| Przeciętny Intel Core Ultra 7 165U (1507 - 1709, n=4) | |
| Dell Latitude 7350 Detachable | |
| Cinebench R20 / CPU (Multi Core) | |
| HP EliteBook x360 1040 G11 | |
| Lenovo ThinkPad T14 G4 21K4S02000 | |
| Średnia w klasie Convertible (1124 - 11357, n=63, ostatnie 2 lata) | |
| Dell Latitude 9450 2-in-1 | |
| Dell Latitude 7450 2-in-1 | |
| Lenovo ThinkPad X1 2in1 G9 21KE004AGE | |
| Przeciętny Intel Core Ultra 7 165U (3254 - 4176, n=4) | |
| Dell Latitude 7440 | |
| Dell Latitude 7350 Detachable | |
| Cinebench R20 / CPU (Single Core) | |
| Lenovo ThinkPad T14 G4 21K4S02000 | |
| HP EliteBook x360 1040 G11 | |
| Dell Latitude 9450 2-in-1 | |
| Dell Latitude 7440 | |
| Średnia w klasie Convertible (348 - 827, n=63, ostatnie 2 lata) | |
| Dell Latitude 7450 2-in-1 | |
| Przeciętny Intel Core Ultra 7 165U (604 - 661, n=4) | |
| Lenovo ThinkPad X1 2in1 G9 21KE004AGE | |
| Dell Latitude 7350 Detachable | |
| Cinebench R15 / CPU Multi 64Bit | |
| HP EliteBook x360 1040 G11 | |
| Lenovo ThinkPad T14 G4 21K4S02000 | |
| Średnia w klasie Convertible (478 - 4830, n=66, ostatnie 2 lata) | |
| Dell Latitude 9450 2-in-1 | |
| Dell Latitude 7450 2-in-1 | |
| Lenovo ThinkPad X1 2in1 G9 21KE004AGE | |
| Przeciętny Intel Core Ultra 7 165U (1428 - 1667, n=4) | |
| Dell Latitude 7440 | |
| Dell Latitude 7350 Detachable | |
| Cinebench R15 / CPU Single 64Bit | |
| Lenovo ThinkPad T14 G4 21K4S02000 | |
| HP EliteBook x360 1040 G11 | |
| Dell Latitude 9450 2-in-1 | |
| Średnia w klasie Convertible (149.8 - 317, n=63, ostatnie 2 lata) | |
| Dell Latitude 7440 | |
| Dell Latitude 7450 2-in-1 | |
| Przeciętny Intel Core Ultra 7 165U (220 - 252, n=4) | |
| Lenovo ThinkPad X1 2in1 G9 21KE004AGE | |
| Dell Latitude 7350 Detachable | |
| Blender / v2.79 BMW27 CPU | |
| Dell Latitude 7350 Detachable | |
| Średnia w klasie Convertible (107 - 1051, n=61, ostatnie 2 lata) | |
| Przeciętny Intel Core Ultra 7 165U (310 - 380, n=4) | |
| Dell Latitude 7450 2-in-1 | |
| Lenovo ThinkPad X1 2in1 G9 21KE004AGE | |
| Dell Latitude 7440 | |
| Dell Latitude 9450 2-in-1 | |
| Lenovo ThinkPad T14 G4 21K4S02000 | |
| HP EliteBook x360 1040 G11 | |
| 7-Zip 18.03 / 7z b 4 | |
| Lenovo ThinkPad T14 G4 21K4S02000 | |
| HP EliteBook x360 1040 G11 | |
| Dell Latitude 9450 2-in-1 | |
| Średnia w klasie Convertible (12977 - 121368, n=63, ostatnie 2 lata) | |
| Lenovo ThinkPad X1 2in1 G9 21KE004AGE | |
| Dell Latitude 7440 | |
| Dell Latitude 7450 2-in-1 | |
| Przeciętny Intel Core Ultra 7 165U (30898 - 43441, n=4) | |
| Dell Latitude 7350 Detachable | |
| 7-Zip 18.03 / 7z b 4 -mmt1 | |
| Lenovo ThinkPad T14 G4 21K4S02000 | |
| Dell Latitude 7440 | |
| HP EliteBook x360 1040 G11 | |
| Średnia w klasie Convertible (3672 - 6540, n=63, ostatnie 2 lata) | |
| Lenovo ThinkPad X1 2in1 G9 21KE004AGE | |
| Dell Latitude 9450 2-in-1 | |
| Dell Latitude 7450 2-in-1 | |
| Przeciętny Intel Core Ultra 7 165U (4644 - 4960, n=4) | |
| Dell Latitude 7350 Detachable | |
| Geekbench 6.4 / Multi-Core | |
| HP EliteBook x360 1040 G11 | |
| Średnia w klasie Convertible (2291 - 21269, n=54, ostatnie 2 lata) | |
| Dell Latitude 9450 2-in-1 | |
| Dell Latitude 7450 2-in-1 | |
| Przeciętny Intel Core Ultra 7 165U (9308 - 9944, n=4) | |
| Lenovo ThinkPad X1 2in1 G9 21KE004AGE | |
| Dell Latitude 7350 Detachable | |
| Lenovo ThinkPad T14 G4 21K4S02000 | |
| Geekbench 6.4 / Single-Core | |
| HP EliteBook x360 1040 G11 | |
| Dell Latitude 7450 2-in-1 | |
| Dell Latitude 9450 2-in-1 | |
| Średnia w klasie Convertible (1003 - 2978, n=55, ostatnie 2 lata) | |
| Lenovo ThinkPad X1 2in1 G9 21KE004AGE | |
| Przeciętny Intel Core Ultra 7 165U (2092 - 2359, n=5) | |
| Dell Latitude 7350 Detachable | |
| Lenovo ThinkPad T14 G4 21K4S02000 | |
| Geekbench 5.5 / Multi-Core | |
| HP EliteBook x360 1040 G11 | |
| Lenovo ThinkPad T14 G4 21K4S02000 | |
| Średnia w klasie Convertible (2188 - 22023, n=63, ostatnie 2 lata) | |
| Dell Latitude 9450 2-in-1 | |
| Dell Latitude 7450 2-in-1 | |
| Lenovo ThinkPad X1 2in1 G9 21KE004AGE | |
| Przeciętny Intel Core Ultra 7 165U (8028 - 8719, n=4) | |
| Dell Latitude 7440 | |
| Dell Latitude 7350 Detachable | |
| Geekbench 5.5 / Single-Core | |
| Lenovo ThinkPad T14 G4 21K4S02000 | |
| HP EliteBook x360 1040 G11 | |
| Dell Latitude 7450 2-in-1 | |
| Dell Latitude 9450 2-in-1 | |
| Lenovo ThinkPad X1 2in1 G9 21KE004AGE | |
| Przeciętny Intel Core Ultra 7 165U (1714 - 1740, n=4) | |
| Średnia w klasie Convertible (806 - 2275, n=63, ostatnie 2 lata) | |
| Dell Latitude 7440 | |
| Dell Latitude 7350 Detachable | |
| HWBOT x265 Benchmark v2.2 / 4k Preset | |
| HP EliteBook x360 1040 G11 | |
| Lenovo ThinkPad T14 G4 21K4S02000 | |
| Dell Latitude 9450 2-in-1 | |
| Średnia w klasie Convertible (3.43 - 36.2, n=63, ostatnie 2 lata) | |
| Dell Latitude 7450 2-in-1 | |
| Lenovo ThinkPad X1 2in1 G9 21KE004AGE | |
| Przeciętny Intel Core Ultra 7 165U (9.06 - 12.3, n=4) | |
| Dell Latitude 7440 | |
| Dell Latitude 7350 Detachable | |
| LibreOffice / 20 Documents To PDF | |
| HP EliteBook x360 1040 G11 | |
| Średnia w klasie Convertible (42.7 - 84.3, n=62, ostatnie 2 lata) | |
| Dell Latitude 7450 2-in-1 | |
| Przeciętny Intel Core Ultra 7 165U (43.5 - 56.4, n=4) | |
| Lenovo ThinkPad X1 2in1 G9 21KE004AGE | |
| Dell Latitude 7350 Detachable | |
| Lenovo ThinkPad T14 G4 21K4S02000 | |
| Dell Latitude 7440 | |
| Dell Latitude 9450 2-in-1 | |
| R Benchmark 2.5 / Overall mean | |
| Dell Latitude 7350 Detachable | |
| Przeciętny Intel Core Ultra 7 165U (0.4881 - 0.555, n=4) | |
| Średnia w klasie Convertible (0.3985 - 0.84, n=62, ostatnie 2 lata) | |
| Lenovo ThinkPad X1 2in1 G9 21KE004AGE | |
| Dell Latitude 7450 2-in-1 | |
| Dell Latitude 7440 | |
| Dell Latitude 9450 2-in-1 | |
| HP EliteBook x360 1040 G11 | |
| Lenovo ThinkPad T14 G4 21K4S02000 | |
* ... im mniej tym lepiej
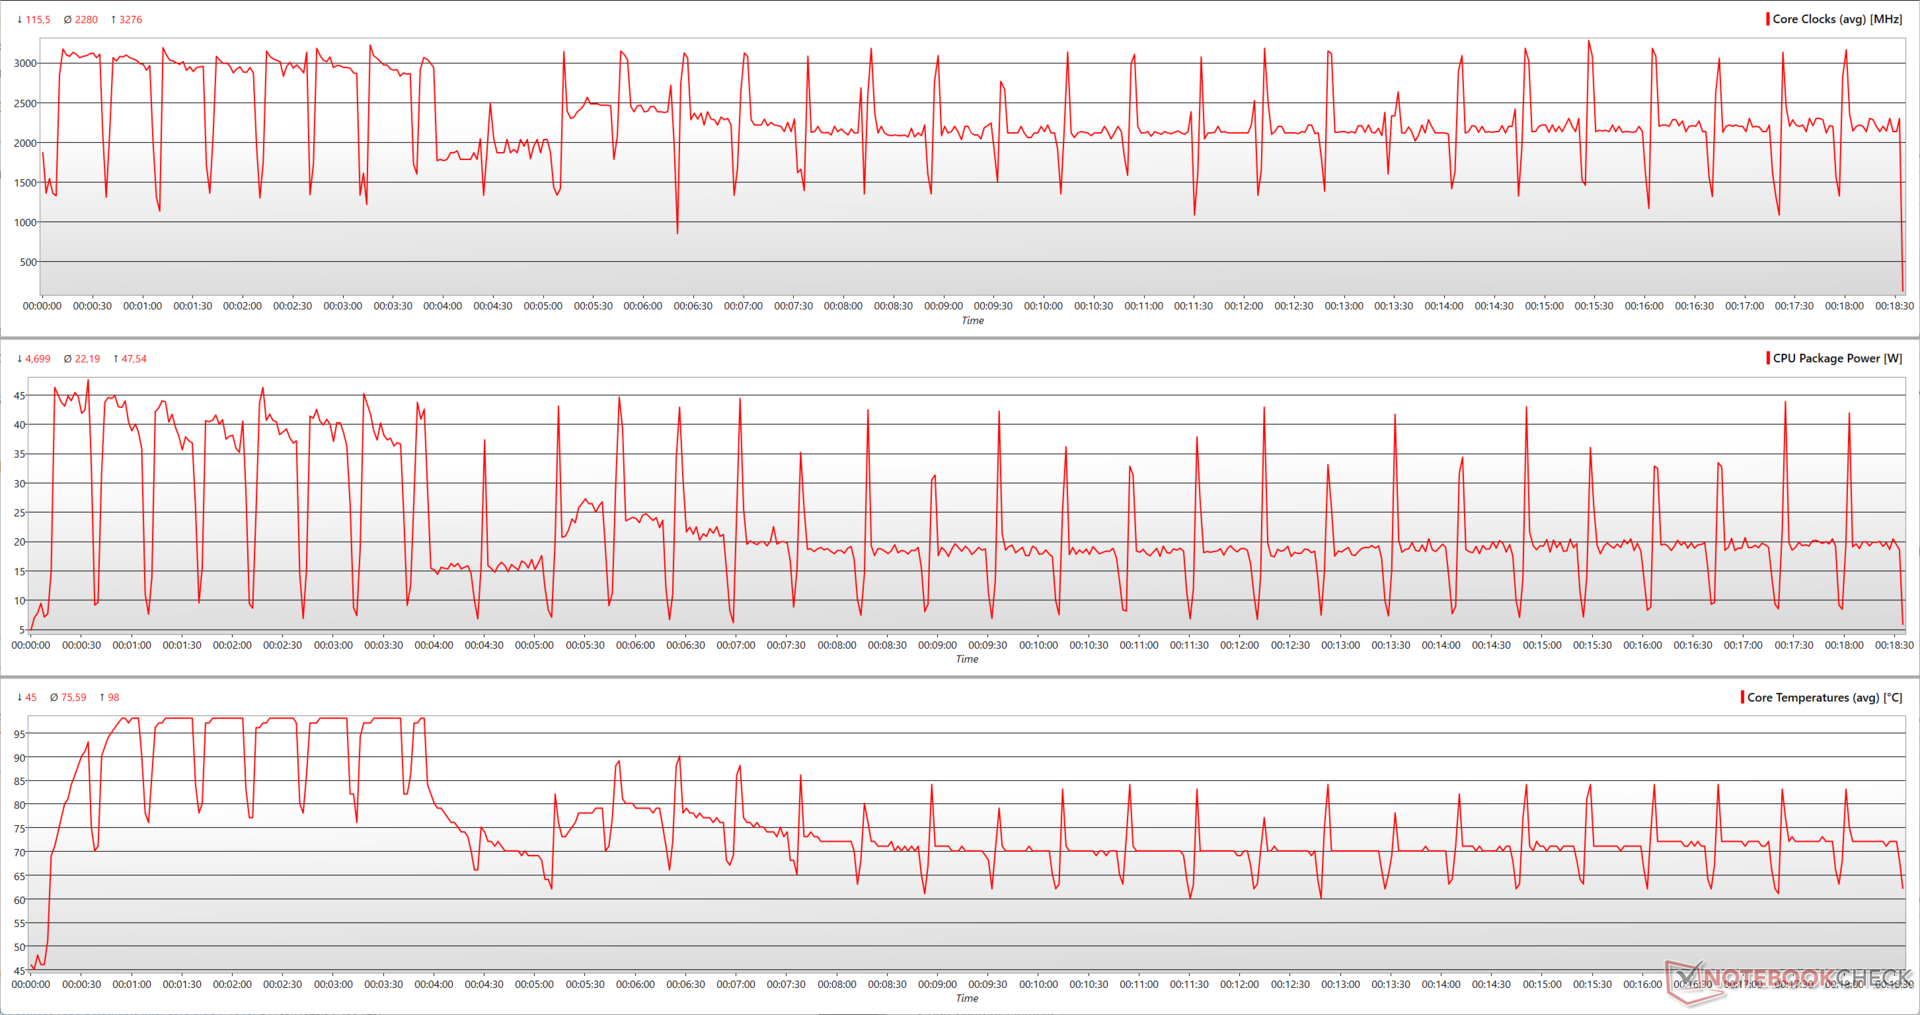
Analiza wskaźników procesora podczas wielordzeniowej pętli Cinebench R15 pokazuje, że procesor Core Ultra 7 165U Latitude 7450 2-w-1 może chwilowo wykorzystywać 47,5 W, osiągając szczytowe taktowanie 3,27 GHz na początku uruchomienia.
Chociaż procesor stara się utrzymać poziom mocy między 40 W a 45 W na początku większości pętli w teście, ma trudności z utrzymaniem tego poziomu i ostatecznie spada do średnio 22 W, co skutkuje średnimi zegarami 2,28 GHz. Widzimy ten wzorzec również w naszych wielordzeniowych testach zużycia energii, do których przejdziemy wkrótce.
Zauważalne spadki mocy i prędkości zegara występują w 9. pętli przed odzyskaniem, co pokrywa się ze spadkiem wyników zaobserwowanym na powyższym wykresie pętli.
Wynik wielordzeniowy Cinebench R20 spada o 29,8% na baterii, podczas gdy wydajność jednordzeniowa pozostaje mniej więcej podobna.
AIDA64: FP32 Ray-Trace | FPU Julia | CPU SHA3 | CPU Queen | FPU SinJulia | FPU Mandel | CPU AES | CPU ZLib | FP64 Ray-Trace | CPU PhotoWorxx
| Performance Rating | |
| Lenovo ThinkPad T14 G4 21K4S02000 | |
| HP EliteBook x360 1040 G11 | |
| Średnia w klasie Convertible | |
| Dell Latitude 7450 2-in-1 | |
| Dell Latitude 9450 2-in-1 | |
| Lenovo ThinkPad X1 2in1 G9 21KE004AGE | |
| Przeciętny Intel Core Ultra 7 165U | |
| Dell Latitude 7440 | |
| Dell Latitude 7350 Detachable | |
| AIDA64 / FP32 Ray-Trace | |
| Lenovo ThinkPad T14 G4 21K4S02000 | |
| HP EliteBook x360 1040 G11 | |
| Średnia w klasie Convertible (2179 - 64158, n=64, ostatnie 2 lata) | |
| Dell Latitude 9450 2-in-1 | |
| Dell Latitude 7450 2-in-1 | |
| Dell Latitude 7440 | |
| Lenovo ThinkPad X1 2in1 G9 21KE004AGE | |
| Przeciętny Intel Core Ultra 7 165U (6218 - 9685, n=4) | |
| Dell Latitude 7350 Detachable | |
| AIDA64 / FPU Julia | |
| Lenovo ThinkPad T14 G4 21K4S02000 | |
| HP EliteBook x360 1040 G11 | |
| Średnia w klasie Convertible (11392 - 183760, n=63, ostatnie 2 lata) | |
| Dell Latitude 7450 2-in-1 | |
| Dell Latitude 9450 2-in-1 | |
| Lenovo ThinkPad X1 2in1 G9 21KE004AGE | |
| Dell Latitude 7440 | |
| Przeciętny Intel Core Ultra 7 165U (32054 - 47555, n=4) | |
| Dell Latitude 7350 Detachable | |
| AIDA64 / CPU SHA3 | |
| Lenovo ThinkPad T14 G4 21K4S02000 | |
| HP EliteBook x360 1040 G11 | |
| Dell Latitude 7450 2-in-1 | |
| Średnia w klasie Convertible (797 - 8151, n=63, ostatnie 2 lata) | |
| Lenovo ThinkPad X1 2in1 G9 21KE004AGE | |
| Dell Latitude 9450 2-in-1 | |
| Przeciętny Intel Core Ultra 7 165U (1739 - 2694, n=4) | |
| Dell Latitude 7440 | |
| Dell Latitude 7350 Detachable | |
| AIDA64 / CPU Queen | |
| Lenovo ThinkPad T14 G4 21K4S02000 | |
| HP EliteBook x360 1040 G11 | |
| Średnia w klasie Convertible (22413 - 145339, n=63, ostatnie 2 lata) | |
| Dell Latitude 7440 | |
| Dell Latitude 7450 2-in-1 | |
| Lenovo ThinkPad X1 2in1 G9 21KE004AGE | |
| Przeciętny Intel Core Ultra 7 165U (45867 - 47345, n=4) | |
| Dell Latitude 9450 2-in-1 | |
| Dell Latitude 7350 Detachable | |
| AIDA64 / FPU SinJulia | |
| Lenovo ThinkPad T14 G4 21K4S02000 | |
| HP EliteBook x360 1040 G11 | |
| Średnia w klasie Convertible (1120 - 29155, n=63, ostatnie 2 lata) | |
| Dell Latitude 9450 2-in-1 | |
| Dell Latitude 7450 2-in-1 | |
| Lenovo ThinkPad X1 2in1 G9 21KE004AGE | |
| Przeciętny Intel Core Ultra 7 165U (4547 - 5776, n=4) | |
| Dell Latitude 7440 | |
| Dell Latitude 7350 Detachable | |
| AIDA64 / FPU Mandel | |
| Lenovo ThinkPad T14 G4 21K4S02000 | |
| HP EliteBook x360 1040 G11 | |
| Średnia w klasie Convertible (5749 - 97193, n=63, ostatnie 2 lata) | |
| Dell Latitude 7450 2-in-1 | |
| Dell Latitude 9450 2-in-1 | |
| Lenovo ThinkPad X1 2in1 G9 21KE004AGE | |
| Dell Latitude 7440 | |
| Przeciętny Intel Core Ultra 7 165U (15677 - 23352, n=4) | |
| Dell Latitude 7350 Detachable | |
| AIDA64 / CPU AES | |
| Lenovo ThinkPad T14 G4 21K4S02000 | |
| HP EliteBook x360 1040 G11 | |
| Średnia w klasie Convertible (21774 - 169089, n=63, ostatnie 2 lata) | |
| Dell Latitude 7450 2-in-1 | |
| Dell Latitude 9450 2-in-1 | |
| Lenovo ThinkPad X1 2in1 G9 21KE004AGE | |
| Przeciętny Intel Core Ultra 7 165U (36912 - 50177, n=4) | |
| Dell Latitude 7440 | |
| Dell Latitude 7350 Detachable | |
| AIDA64 / CPU ZLib | |
| HP EliteBook x360 1040 G11 | |
| Lenovo ThinkPad T14 G4 21K4S02000 | |
| Dell Latitude 7450 2-in-1 | |
| Lenovo ThinkPad X1 2in1 G9 21KE004AGE | |
| Dell Latitude 9450 2-in-1 | |
| Średnia w klasie Convertible (218 - 2001, n=63, ostatnie 2 lata) | |
| Przeciętny Intel Core Ultra 7 165U (518 - 794, n=4) | |
| Dell Latitude 7440 | |
| Dell Latitude 7350 Detachable | |
| AIDA64 / FP64 Ray-Trace | |
| Lenovo ThinkPad T14 G4 21K4S02000 | |
| HP EliteBook x360 1040 G11 | |
| Średnia w klasie Convertible (1169 - 34297, n=63, ostatnie 2 lata) | |
| Dell Latitude 9450 2-in-1 | |
| Dell Latitude 7450 2-in-1 | |
| Dell Latitude 7440 | |
| Lenovo ThinkPad X1 2in1 G9 21KE004AGE | |
| Przeciętny Intel Core Ultra 7 165U (3182 - 4965, n=4) | |
| Dell Latitude 7350 Detachable | |
| AIDA64 / CPU PhotoWorxx | |
| Dell Latitude 9450 2-in-1 | |
| HP EliteBook x360 1040 G11 | |
| Lenovo ThinkPad X1 2in1 G9 21KE004AGE | |
| Przeciętny Intel Core Ultra 7 165U (41747 - 49113, n=4) | |
| Dell Latitude 7450 2-in-1 | |
| Średnia w klasie Convertible (13761 - 81626, n=63, ostatnie 2 lata) | |
| Dell Latitude 7350 Detachable | |
| Dell Latitude 7440 | |
| Lenovo ThinkPad T14 G4 21K4S02000 | |
Proszę sprawdzić nasz dedykowany Intel Core Ultra 7 165U aby uzyskać więcej informacji i porównać wydajność.
Wydajność systemu
Latitude 7450 2-in-1 oferuje odpowiednią wydajność w testach systemowych. Nie sprawia wrażenia ociężałego w codziennej produktywności i jest w stanie dobrze obsługiwać większość aplikacji biznesowych i biurowych.
CrossMark: Overall | Productivity | Creativity | Responsiveness
AIDA64: Memory Copy | Memory Read | Memory Write | Memory Latency
WebXPRT 3: Overall
WebXPRT 4: Overall
Mozilla Kraken 1.1: Total
| PCMark 10 / Score | |
| HP EliteBook x360 1040 G11 | |
| Lenovo ThinkPad T14 G4 21K4S02000 | |
| Dell Latitude 7450 2-in-1 | |
| Średnia w klasie Convertible (3229 - 9125, n=61, ostatnie 2 lata) | |
| Dell Latitude 9450 2-in-1 | |
| Przeciętny Intel Core Ultra 7 165U, Intel Graphics 4-Core iGPU (Arc) (5893 - 6421, n=4) | |
| Dell Latitude 7350 Detachable | |
| Lenovo ThinkPad X1 2in1 G9 21KE004AGE | |
| Dell Latitude 7440 | |
| PCMark 10 / Essentials | |
| Dell Latitude 9450 2-in-1 | |
| Dell Latitude 7450 2-in-1 | |
| Przeciętny Intel Core Ultra 7 165U, Intel Graphics 4-Core iGPU (Arc) (10937 - 11238, n=4) | |
| HP EliteBook x360 1040 G11 | |
| Lenovo ThinkPad X1 2in1 G9 21KE004AGE | |
| Lenovo ThinkPad T14 G4 21K4S02000 | |
| Dell Latitude 7440 | |
| Średnia w klasie Convertible (7233 - 12005, n=61, ostatnie 2 lata) | |
| Dell Latitude 7350 Detachable | |
| PCMark 10 / Productivity | |
| Lenovo ThinkPad T14 G4 21K4S02000 | |
| Dell Latitude 7350 Detachable | |
| Dell Latitude 7450 2-in-1 | |
| HP EliteBook x360 1040 G11 | |
| Średnia w klasie Convertible (5062 - 10800, n=61, ostatnie 2 lata) | |
| Przeciętny Intel Core Ultra 7 165U, Intel Graphics 4-Core iGPU (Arc) (7722 - 8751, n=4) | |
| Dell Latitude 9450 2-in-1 | |
| Lenovo ThinkPad X1 2in1 G9 21KE004AGE | |
| Dell Latitude 7440 | |
| PCMark 10 / Digital Content Creation | |
| HP EliteBook x360 1040 G11 | |
| Lenovo ThinkPad T14 G4 21K4S02000 | |
| Średnia w klasie Convertible (2496 - 16551, n=61, ostatnie 2 lata) | |
| Dell Latitude 7450 2-in-1 | |
| Dell Latitude 9450 2-in-1 | |
| Przeciętny Intel Core Ultra 7 165U, Intel Graphics 4-Core iGPU (Arc) (6229 - 7325, n=4) | |
| Lenovo ThinkPad X1 2in1 G9 21KE004AGE | |
| Dell Latitude 7350 Detachable | |
| Dell Latitude 7440 | |
| CrossMark / Overall | |
| HP EliteBook x360 1040 G11 | |
| Lenovo ThinkPad T14 G4 21K4S02000 | |
| Dell Latitude 7450 2-in-1 | |
| Przeciętny Intel Core Ultra 7 165U, Intel Graphics 4-Core iGPU (Arc) (1471 - 1570, n=4) | |
| Dell Latitude 9450 2-in-1 | |
| Średnia w klasie Convertible (524 - 2274, n=63, ostatnie 2 lata) | |
| Lenovo ThinkPad X1 2in1 G9 21KE004AGE | |
| Dell Latitude 7350 Detachable | |
| CrossMark / Productivity | |
| Lenovo ThinkPad T14 G4 21K4S02000 | |
| HP EliteBook x360 1040 G11 | |
| Przeciętny Intel Core Ultra 7 165U, Intel Graphics 4-Core iGPU (Arc) (1448 - 1571, n=4) | |
| Dell Latitude 9450 2-in-1 | |
| Dell Latitude 7450 2-in-1 | |
| Średnia w klasie Convertible (554 - 1925, n=63, ostatnie 2 lata) | |
| Lenovo ThinkPad X1 2in1 G9 21KE004AGE | |
| Dell Latitude 7350 Detachable | |
| CrossMark / Creativity | |
| HP EliteBook x360 1040 G11 | |
| Lenovo ThinkPad T14 G4 21K4S02000 | |
| Dell Latitude 7450 2-in-1 | |
| Średnia w klasie Convertible (550 - 2949, n=63, ostatnie 2 lata) | |
| Dell Latitude 9450 2-in-1 | |
| Przeciętny Intel Core Ultra 7 165U, Intel Graphics 4-Core iGPU (Arc) (1555 - 1685, n=4) | |
| Lenovo ThinkPad X1 2in1 G9 21KE004AGE | |
| Dell Latitude 7350 Detachable | |
| CrossMark / Responsiveness | |
| Lenovo ThinkPad T14 G4 21K4S02000 | |
| Przeciętny Intel Core Ultra 7 165U, Intel Graphics 4-Core iGPU (Arc) (1305 - 1538, n=4) | |
| HP EliteBook x360 1040 G11 | |
| Dell Latitude 9450 2-in-1 | |
| Dell Latitude 7450 2-in-1 | |
| Lenovo ThinkPad X1 2in1 G9 21KE004AGE | |
| Średnia w klasie Convertible (381 - 1868, n=63, ostatnie 2 lata) | |
| Dell Latitude 7350 Detachable | |
| AIDA64 / Memory Copy | |
| HP EliteBook x360 1040 G11 | |
| Dell Latitude 9450 2-in-1 | |
| Przeciętny Intel Core Ultra 7 165U, Intel Graphics 4-Core iGPU (Arc) (69844 - 84739, n=4) | |
| Dell Latitude 7450 2-in-1 | |
| Średnia w klasie Convertible (29473 - 158525, n=63, ostatnie 2 lata) | |
| Dell Latitude 7350 Detachable | |
| Lenovo ThinkPad X1 2in1 G9 21KE004AGE | |
| Lenovo ThinkPad T14 G4 21K4S02000 | |
| Dell Latitude 7440 | |
| AIDA64 / Memory Read | |
| HP EliteBook x360 1040 G11 | |
| Średnia w klasie Convertible (28905 - 126517, n=63, ostatnie 2 lata) | |
| Lenovo ThinkPad X1 2in1 G9 21KE004AGE | |
| Dell Latitude 9450 2-in-1 | |
| Przeciętny Intel Core Ultra 7 165U, Intel Graphics 4-Core iGPU (Arc) (52264 - 59571, n=4) | |
| Dell Latitude 7450 2-in-1 | |
| Dell Latitude 7350 Detachable | |
| Lenovo ThinkPad T14 G4 21K4S02000 | |
| Dell Latitude 7440 | |
| AIDA64 / Memory Write | |
| Lenovo ThinkPad T14 G4 21K4S02000 | |
| HP EliteBook x360 1040 G11 | |
| Średnia w klasie Convertible (30110 - 216896, n=63, ostatnie 2 lata) | |
| Dell Latitude 7440 | |
| Lenovo ThinkPad X1 2in1 G9 21KE004AGE | |
| Dell Latitude 9450 2-in-1 | |
| Przeciętny Intel Core Ultra 7 165U, Intel Graphics 4-Core iGPU (Arc) (56033 - 64848, n=4) | |
| Dell Latitude 7450 2-in-1 | |
| Dell Latitude 7350 Detachable | |
| AIDA64 / Memory Latency | |
| Dell Latitude 7350 Detachable | |
| Dell Latitude 7450 2-in-1 | |
| Dell Latitude 9450 2-in-1 | |
| Przeciętny Intel Core Ultra 7 165U, Intel Graphics 4-Core iGPU (Arc) (137.8 - 146.4, n=4) | |
| HP EliteBook x360 1040 G11 | |
| Lenovo ThinkPad X1 2in1 G9 21KE004AGE | |
| Lenovo ThinkPad T14 G4 21K4S02000 | |
| Średnia w klasie Convertible (7.7 - 173, n=62, ostatnie 2 lata) | |
| Dell Latitude 7440 | |
| WebXPRT 3 / Overall | |
| Dell Latitude 7450 2-in-1 | |
| Lenovo ThinkPad T14 G4 21K4S02000 | |
| Przeciętny Intel Core Ultra 7 165U, Intel Graphics 4-Core iGPU (Arc) (261 - 399, n=4) | |
| HP EliteBook x360 1040 G11 | |
| Dell Latitude 9450 2-in-1 | |
| Średnia w klasie Convertible (171 - 426, n=66, ostatnie 2 lata) | |
| Dell Latitude 7440 | |
| Lenovo ThinkPad X1 2in1 G9 21KE004AGE | |
| Dell Latitude 7350 Detachable | |
| WebXPRT 4 / Overall | |
| Dell Latitude 7450 2-in-1 | |
| HP EliteBook x360 1040 G11 | |
| Przeciętny Intel Core Ultra 7 165U, Intel Graphics 4-Core iGPU (Arc) (242 - 314, n=4) | |
| Dell Latitude 9450 2-in-1 | |
| Dell Latitude 7440 | |
| Lenovo ThinkPad X1 2in1 G9 21KE004AGE | |
| Średnia w klasie Convertible (91.2 - 317, n=62, ostatnie 2 lata) | |
| Dell Latitude 7350 Detachable | |
| Mozilla Kraken 1.1 / Total | |
| Dell Latitude 7350 Detachable | |
| Lenovo ThinkPad X1 2in1 G9 21KE004AGE | |
| Średnia w klasie Convertible (407 - 1089, n=66, ostatnie 2 lata) | |
| Dell Latitude 7440 | |
| Lenovo ThinkPad T14 G4 21K4S02000 | |
| Dell Latitude 9450 2-in-1 | |
| HP EliteBook x360 1040 G11 | |
| Przeciętny Intel Core Ultra 7 165U, Intel Graphics 4-Core iGPU (Arc) (407 - 562, n=4) | |
| Dell Latitude 7450 2-in-1 | |
* ... im mniej tym lepiej
| PCMark 8 Home Score Accelerated v2 | 4775 pkt. | |
| PCMark 8 Work Score Accelerated v2 | 5305 pkt. | |
| PCMark 10 Score | 6421 pkt. | |
Pomoc | ||
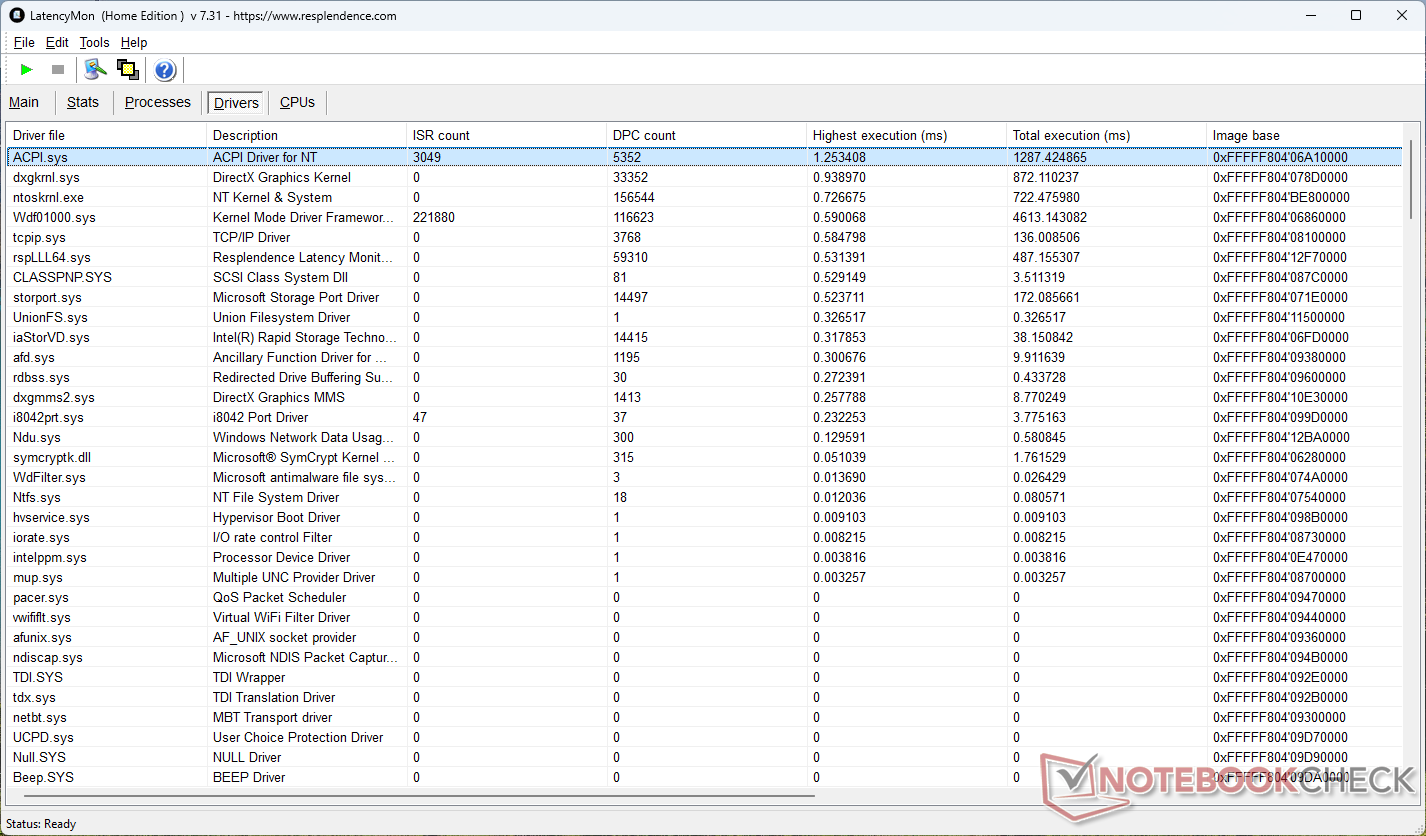
Opóźnienie DPC
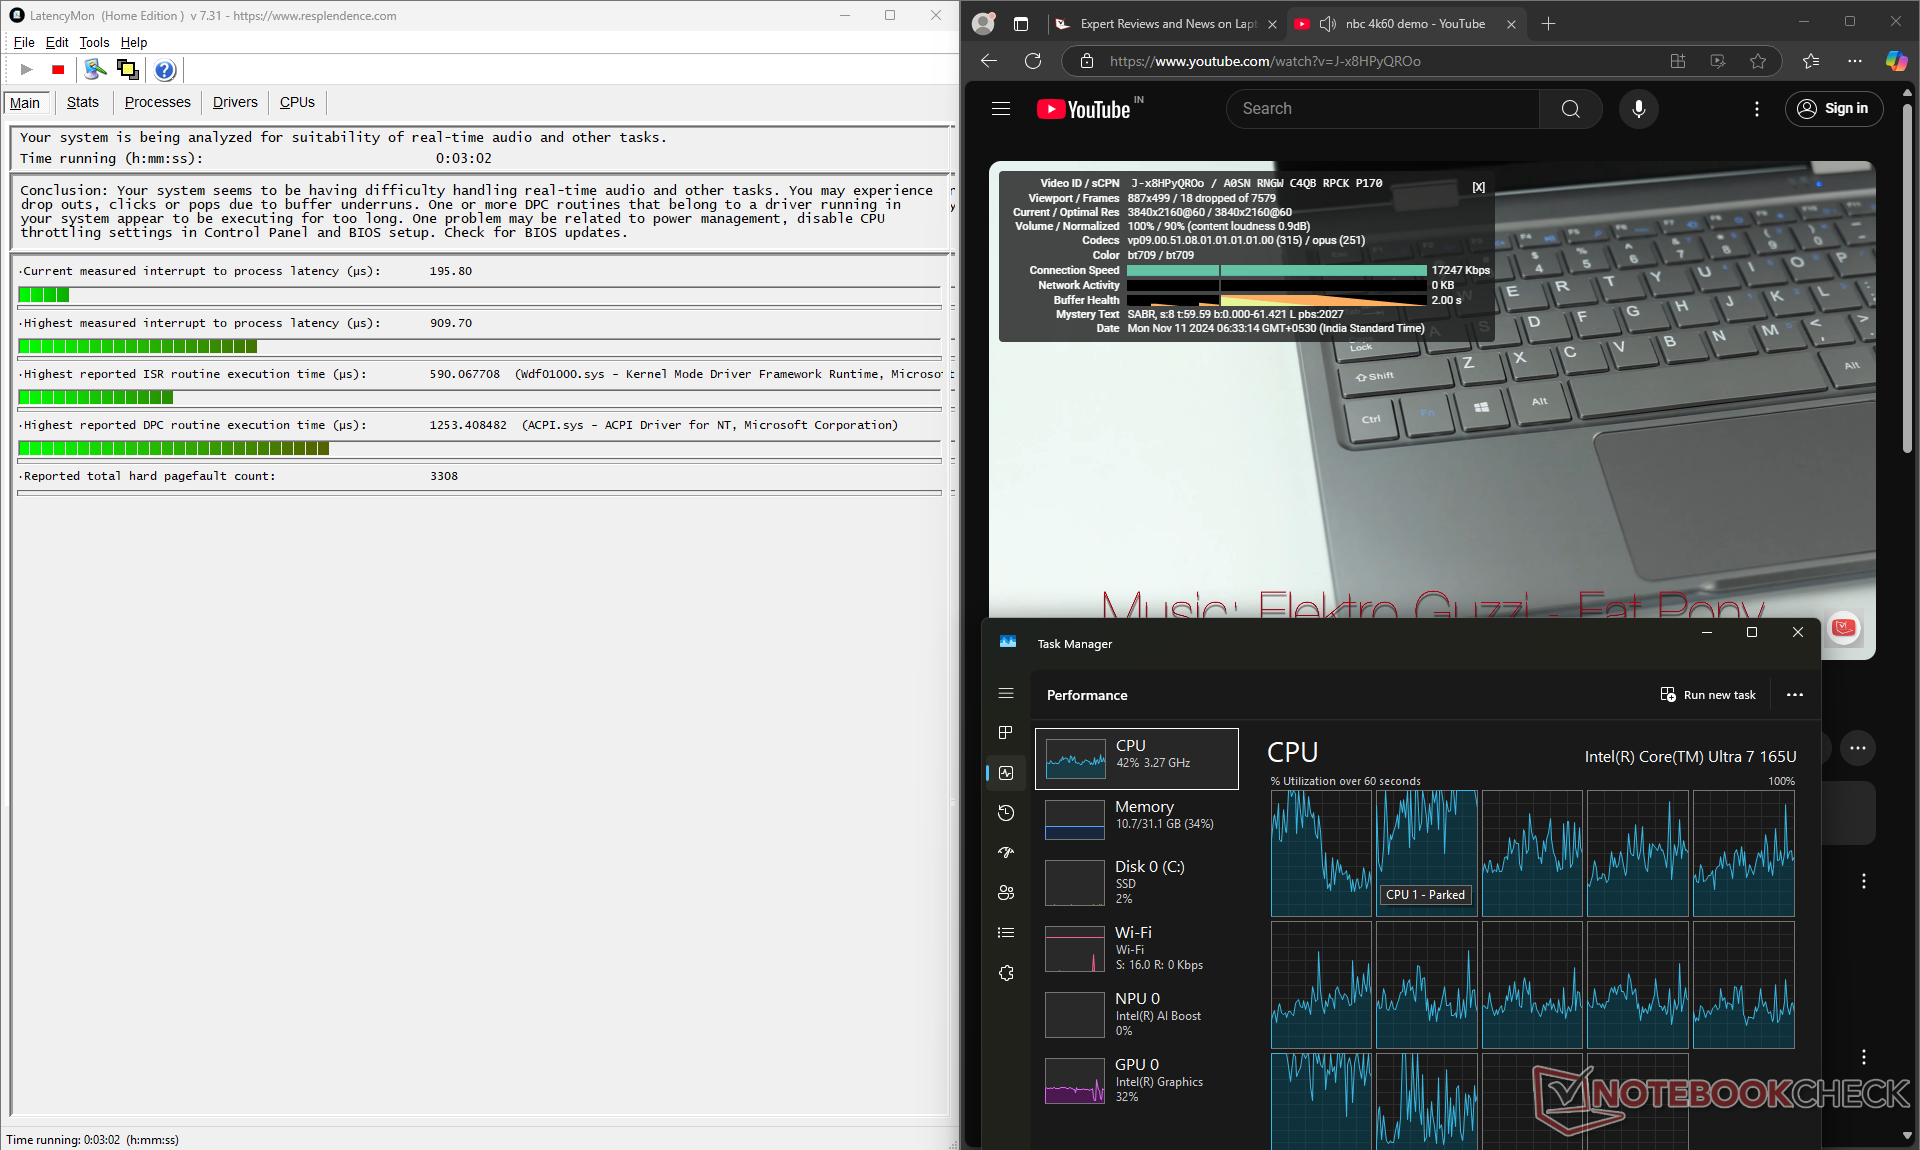
Karta Latitude 7450 2-w-1 wykazuje rozsądne opóźnienia między przerwaniami a procesami w naszej standardowej procedurze testowej, co powinno sprawić, że będzie ona odpowiednia do pracy z dźwiękiem i obrazem w czasie rzeczywistym.
| DPC Latencies / LatencyMon - interrupt to process latency (max), Web, Youtube, Prime95 | |
| HP EliteBook x360 1040 G11 | |
| Dell Latitude 9450 2-in-1 | |
| Dell Latitude 7350 Detachable | |
| Dell Latitude 7440 | |
| Dell Latitude 7450 2-in-1 | |
| Lenovo ThinkPad X1 2in1 G9 21KE004AGE | |
| Lenovo ThinkPad T14 G4 21K4S02000 | |
* ... im mniej tym lepiej
Nasza Tabela rankingowa opóźnień DPC przedstawia przegląd zmierzonych opóźnień w recenzowanych laptopach.
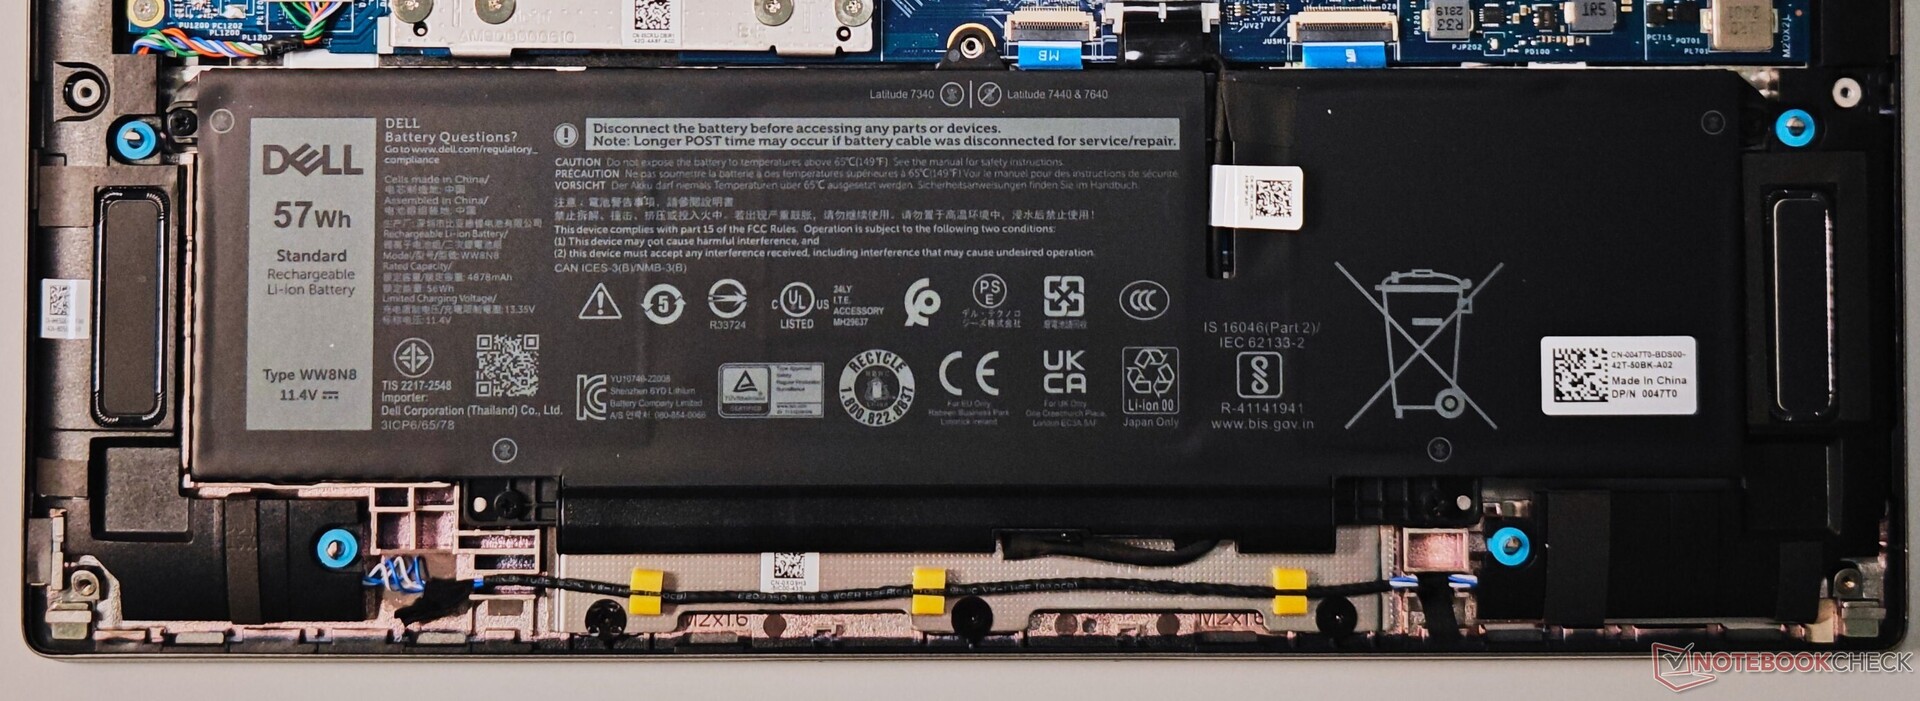
Urządzenia pamięci masowej
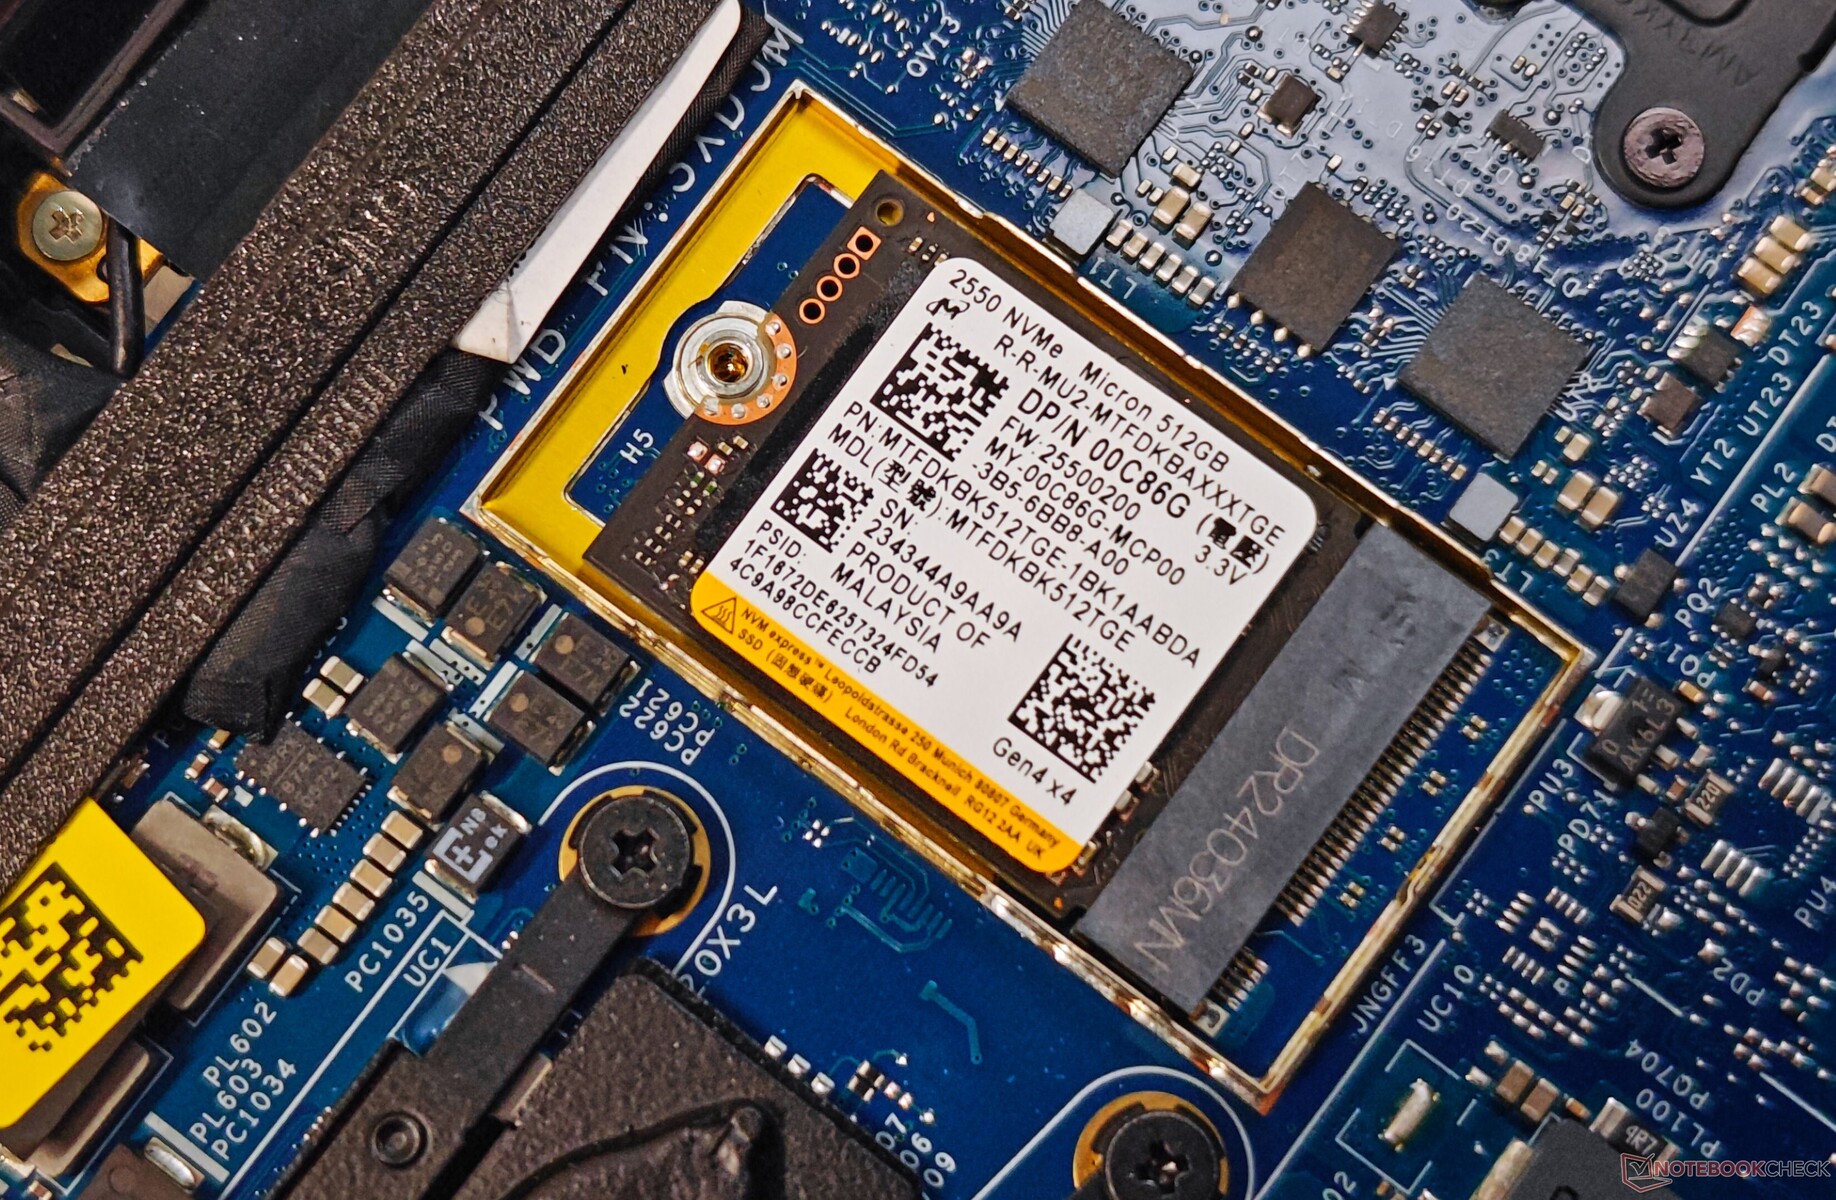
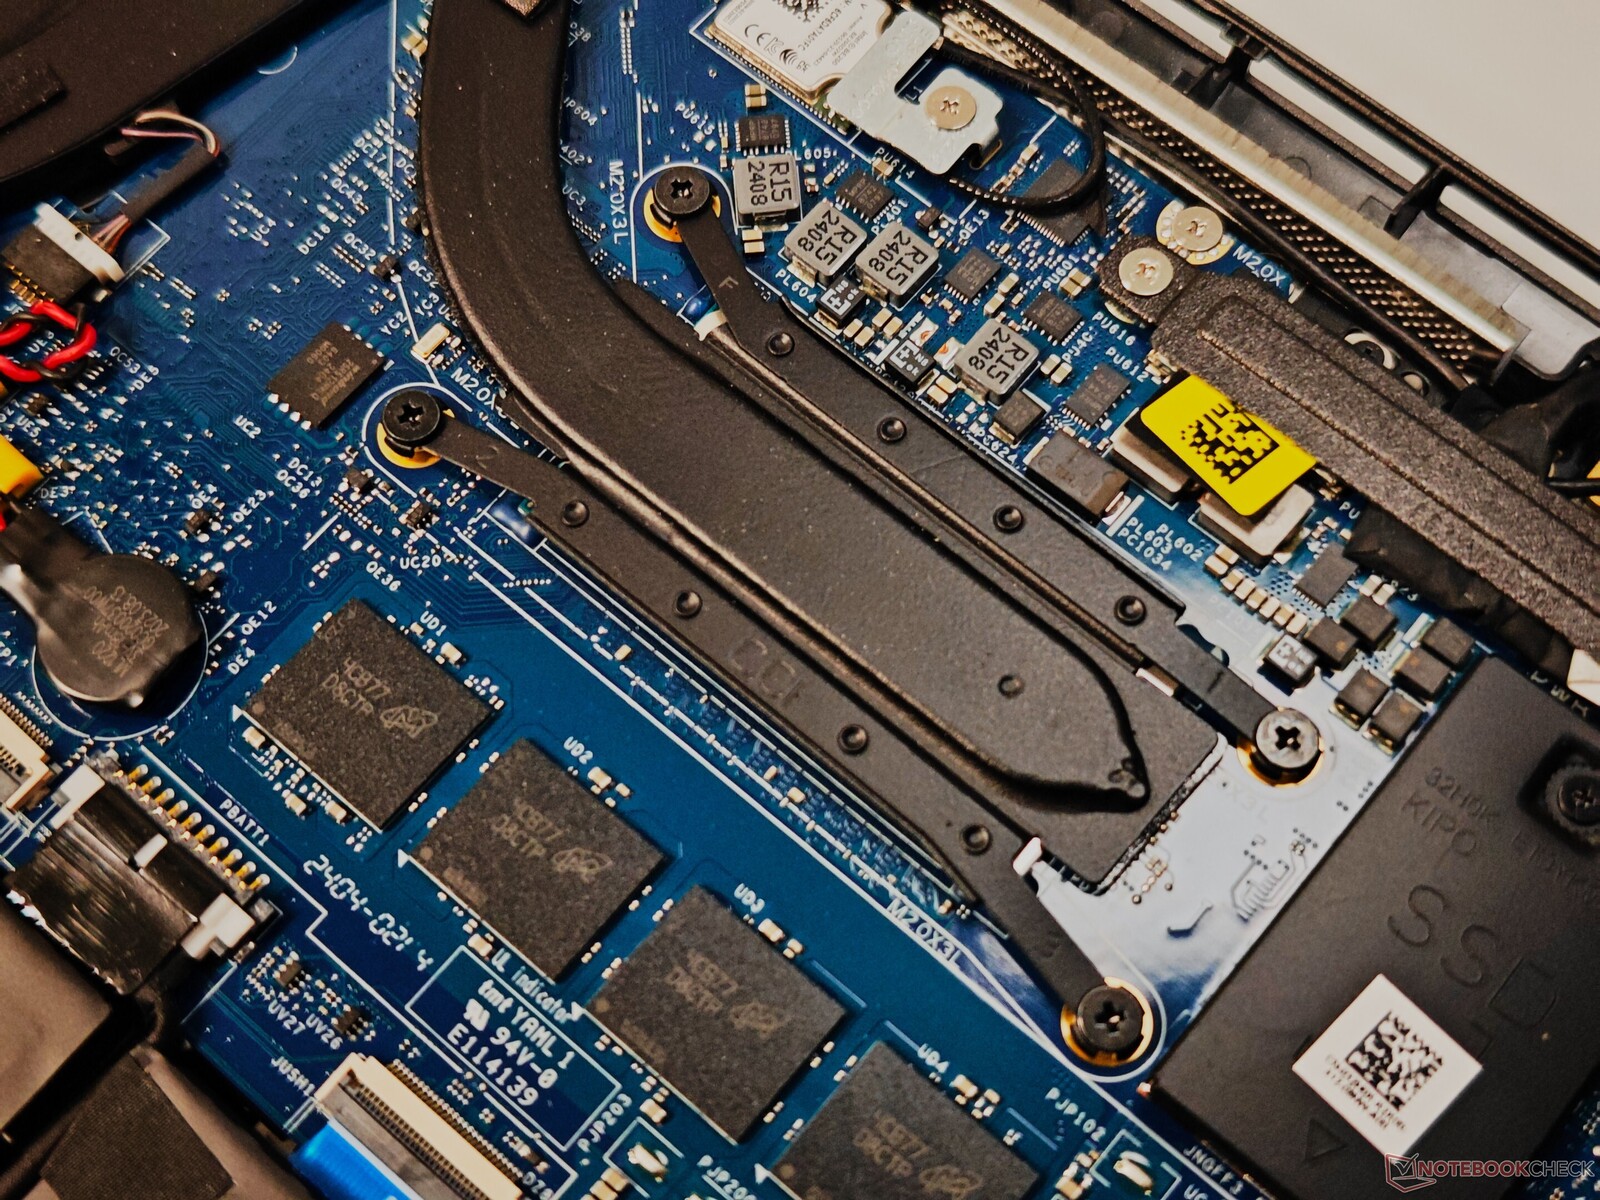
Dell zastosował dysk SSD M.2 2230 NVMe w Latitude 7450 2-in-1 zamiast konwencjonalnego formatu M.2 2280.
Nasz egzemplarz został wyposażony w dysk Micron 2550 o pojemności 512 GB, który ustępuje wariantowi 1 TB zastosowanemu w modelu Latitude 7350 Detachable o 6% w ogólnych testach porównawczych pamięci masowej.
Dysk SSD wykazuje dość stałą wydajność w naszym teście pętli odczytu DiskSpd, z minimalnymi problemami z dławieniem. Nie ma możliwości dodania kolejnego dysku SSD M.2 lub SATA.

* ... im mniej tym lepiej
Disk throttling: DiskSpd Read Loop, Queue Depth 8
Więcej porównań wydajności można znaleźć na naszej dedykowanej stronie Strona z testami porównawczymi dysków SSD.
Wydajność GPU
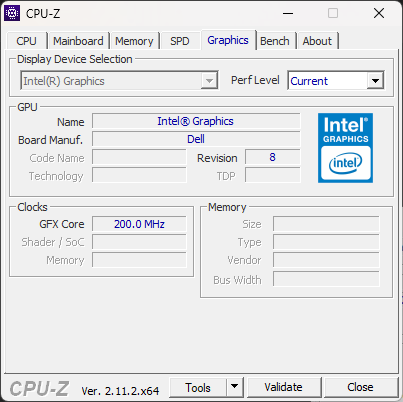
Zintegrowany Arc 4-cores iGPU wypada zgodnie z oczekiwaniami w testach 3DMark i Blender OneAPI. Ogólna wydajność 3DMark jest o 9% lepsza niż średnie wyniki dla tego iGPU i o 40% wyższa niż w przypadku Iris Xe Graphics G7 z 80 EU w Latitude 7440.
| 3DMark 11 Performance | 7632 pkt. | |
| 3DMark Ice Storm Standard Score | 125758 pkt. | |
| 3DMark Cloud Gate Standard Score | 24122 pkt. | |
| 3DMark Fire Strike Score | 5295 pkt. | |
| 3DMark Fire Strike Extreme Score | 2624 pkt. | |
| 3DMark Time Spy Score | 2318 pkt. | |
| 3DMark Steel Nomad Score | 427 pkt. | |
| 3DMark Steel Nomad Light Score | 1749 pkt. | |
| 3DMark Steel Nomad Light Unlimited Score | 1753 pkt. | |
Pomoc | ||
* ... im mniej tym lepiej
Latitude 7450 2-in-1 nie jest laptopem do gier, ale Arc iGPU radzi sobie lepiej niż jego odpowiedniki w testach gier 1080p.
| Baldur's Gate 3 - 1920x1080 Ultra Preset | |
| Średnia w klasie Convertible (9.2 - 85.3, n=28, ostatnie 2 lata) | |
| HP EliteBook x360 1040 G11 | |
| Dell Latitude 7450 2-in-1 | |
| Dell Latitude 7350 Detachable | |
| Dell Latitude 9450 2-in-1 | |
| GTA V - 1920x1080 Highest Settings possible AA:4xMSAA + FX AF:16x | |
| Lenovo ThinkPad T14 G4 21K4S02000 | |
| Średnia w klasie Convertible (7.14 - 114.3, n=53, ostatnie 2 lata) | |
| HP EliteBook x360 1040 G11 | |
| Lenovo ThinkPad X1 2in1 G9 21KE004AGE | |
| Dell Latitude 7450 2-in-1 | |
| Dell Latitude 7440 | |
| Dell Latitude 7350 Detachable | |
Cyberpunk 2077 1080p Ultra FPS Chart
| low | med. | high | ultra | |
|---|---|---|---|---|
| GTA V (2015) | 102.8 | 91.7 | 22.2 | 8.91 |
| Dota 2 Reborn (2015) | 96.2 | 67.3 | 52.9 | 60.4 |
| Final Fantasy XV Benchmark (2018) | 46.6 | 25.2 | 18.5 | |
| X-Plane 11.11 (2018) | 41.2 | 31.9 | 27.1 | |
| Far Cry 5 (2018) | 50 | 25 | 23 | 21 |
| Strange Brigade (2018) | 117.1 | 51.4 | 40.7 | 31.2 |
| Baldur's Gate 3 (2023) | 21.5 | 16.1 | 14.6 | 13.9 |
| Cyberpunk 2077 2.2 Phantom Liberty (2023) | 19.4 | 15.8 | 12.7 | 10.8 |
Nasz dedykowany 4-rdzeniowe iGPU Intel Arc znajdą Państwo więcej informacji i porównań wydajności.
Emisje i zużycie energii: Niska temperatura powierzchni i oszczędne zużycie energii
Hałas systemowy
Latitude 7450 2-w-1 działa cicho we wszystkich trybach wydajności, a wentylatory włączają się tylko pod zauważalnym obciążeniem.
Poziom hałasu wentylatorów utrzymuje się poniżej 40 dB(A) w profilu Ultra Performance.
Zaobserwowaliśmy nieco wyższy poziom hałasu podczas umiarkowanego obciążenia graficznego (średnie obciążenie) w porównaniu do sytuacji, gdy system był pod łącznym pełnym obciążeniem (Prime95 w miejscu dużych FFT i FurMark 1280 x 720 bez AA) lub podczas grania.
Hałas
| luz |
| 23.53 / 23.53 / 23.53 dB |
| obciążenie |
| 38.54 / 38.21 dB |
 | ||
30 dB cichy 40 dB(A) słyszalny 50 dB(A) irytujący |
||
min: | ||
| Dell Latitude 7450 2-in-1 Intel Core Ultra 7 165U, Intel Graphics 4-Core iGPU (Arc) | Lenovo ThinkPad X1 2in1 G9 21KE004AGE Intel Core Ultra 7 165U, Intel Graphics 4-Core iGPU (Arc) | Dell Latitude 9450 2-in-1 Intel Core Ultra 7 165U, Intel Graphics 4-Core iGPU (Arc) | Dell Latitude 7350 Detachable Intel Core Ultra 7 164U, Intel Graphics 4-Core iGPU (Arc) | Lenovo ThinkPad T14 G4 21K4S02000 AMD Ryzen 7 PRO 7840U, AMD Radeon 780M | HP EliteBook x360 1040 G11 Intel Core Ultra 7 165H, Intel Arc 8-Core iGPU | |
|---|---|---|---|---|---|---|
| Noise | -12% | -4% | -3% | 7% | -3% | |
| wyłączone / środowisko * | 23.03 | 24.5 -6% | 23.9 -4% | 22.9 1% | 23.1 -0% | 23 -0% |
| Idle Minimum * | 23.53 | 24.5 -4% | 23.9 -2% | 22.9 3% | 23.1 2% | 23 2% |
| Idle Average * | 23.53 | 28 -19% | 23.9 -2% | 22.9 3% | 23.1 2% | 23 2% |
| Idle Maximum * | 23.53 | 29.8 -27% | 23.9 -2% | 24.4 -4% | 23.1 2% | 23 2% |
| Load Average * | 38.54 | 41.7 -8% | 36.4 6% | 29.7 23% | 26.5 31% | 31 20% |
| Cyberpunk 2077 ultra * | 38.2 | 47.2 -24% | 45.7 -20% | |||
| Load Maximum * | 38.21 | 41.7 -9% | 44.7 -17% | 47.2 -24% | 35.78 6% | 47.7 -25% |
| Witcher 3 ultra * | 41.7 | 44.7 | 35.7 |
* ... im mniej tym lepiej
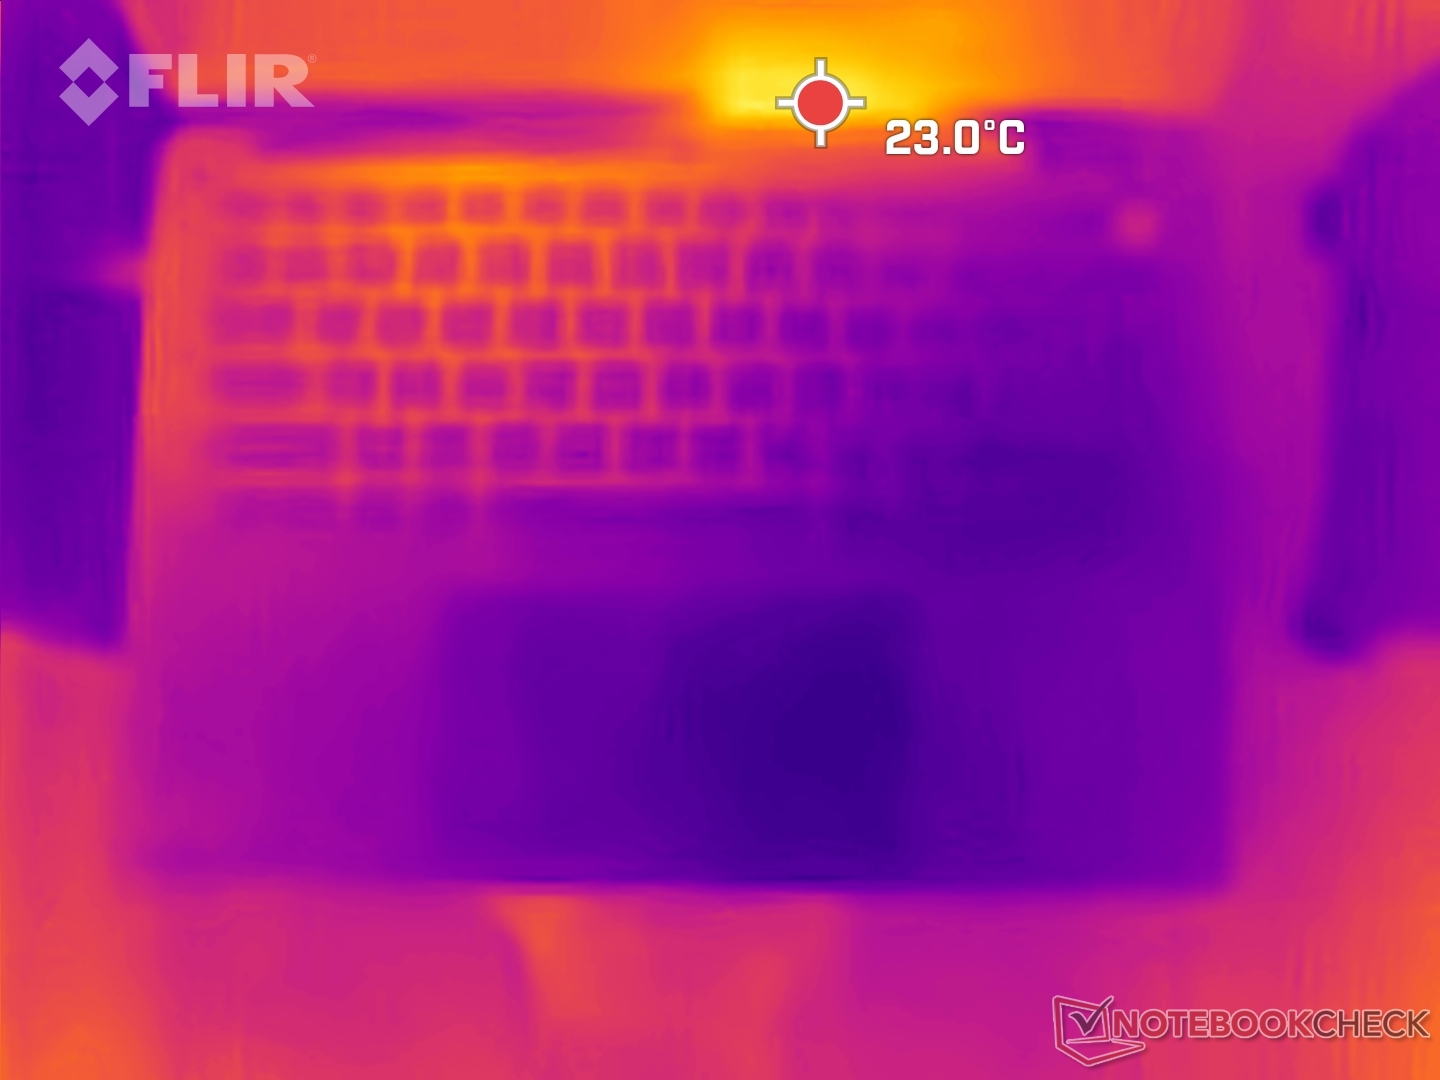
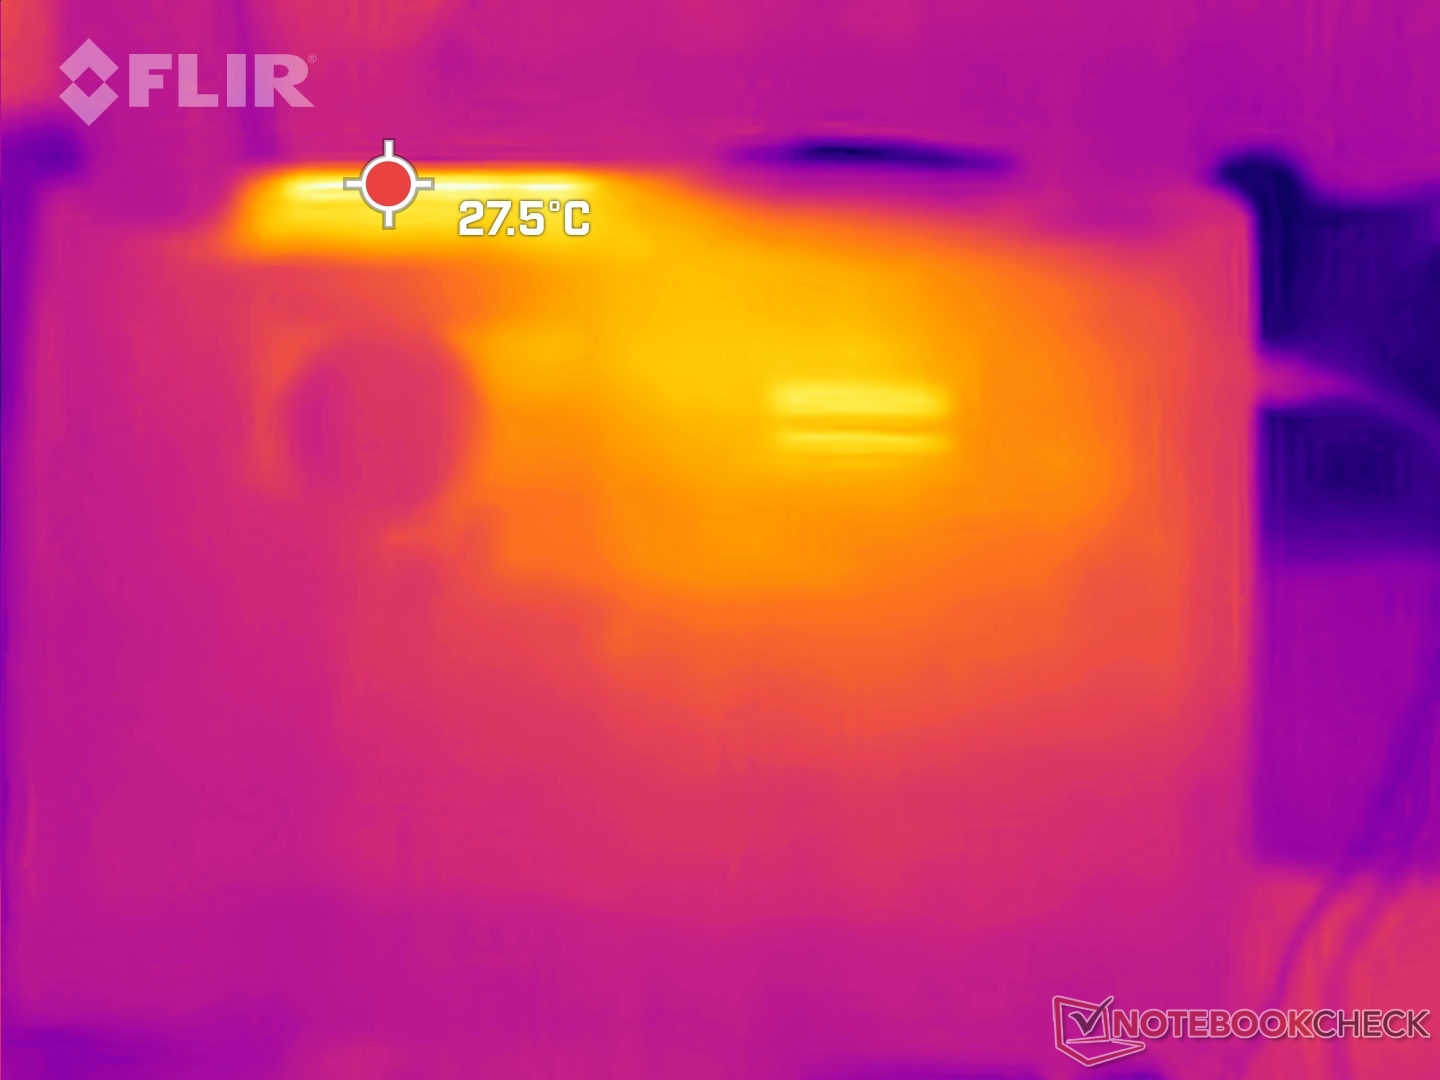
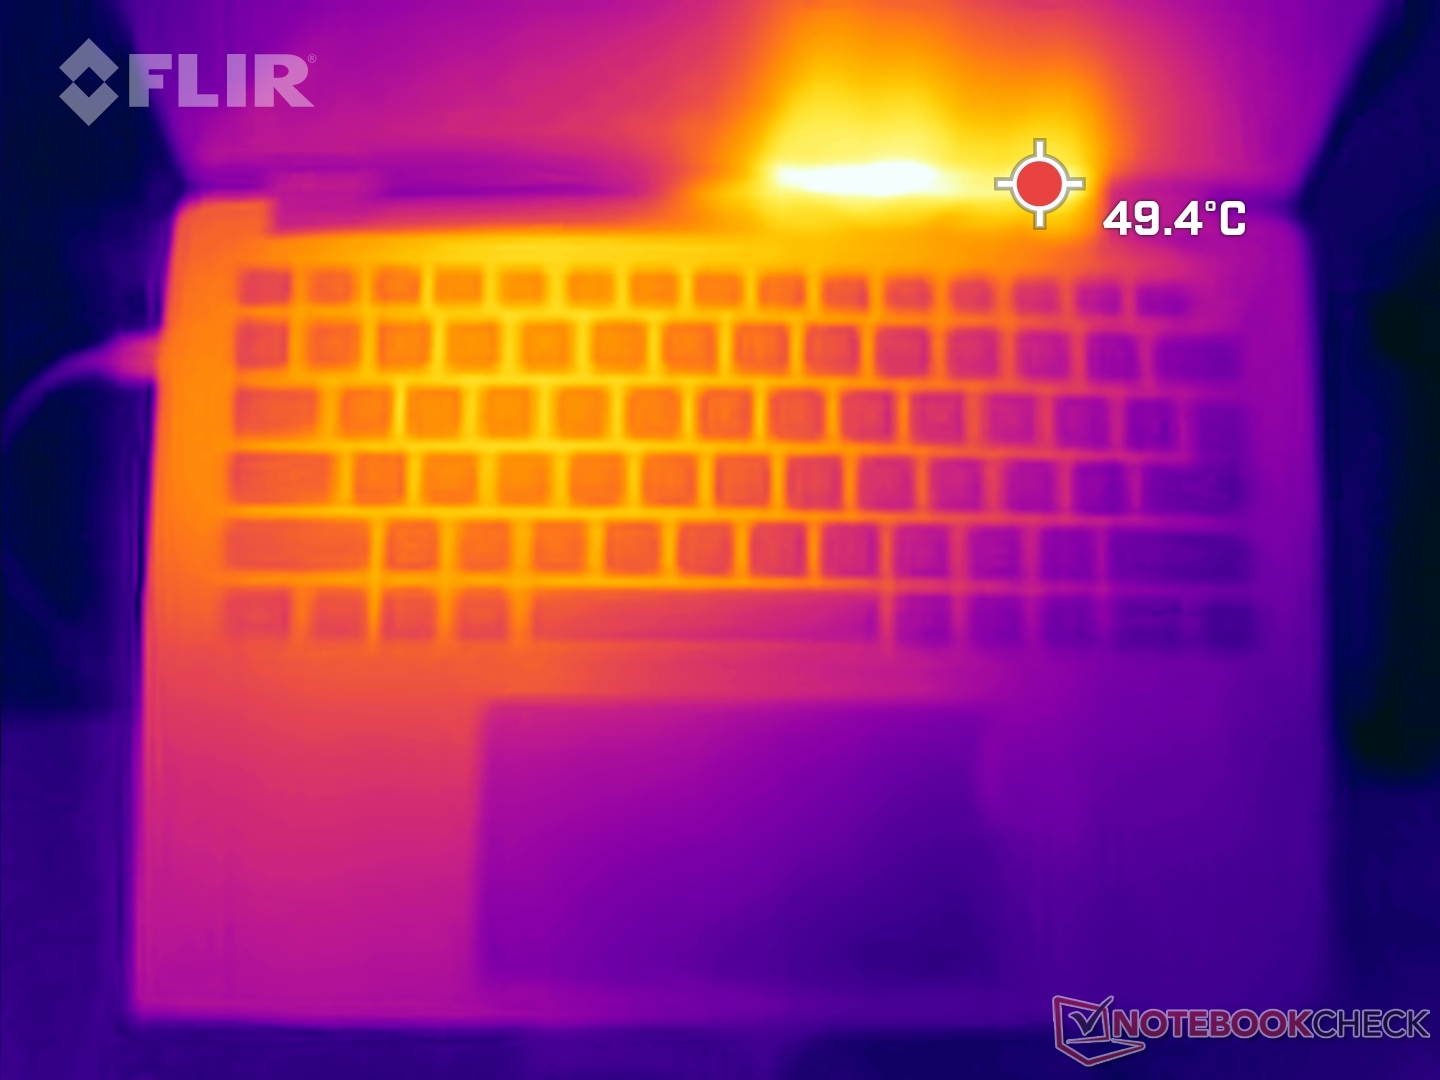
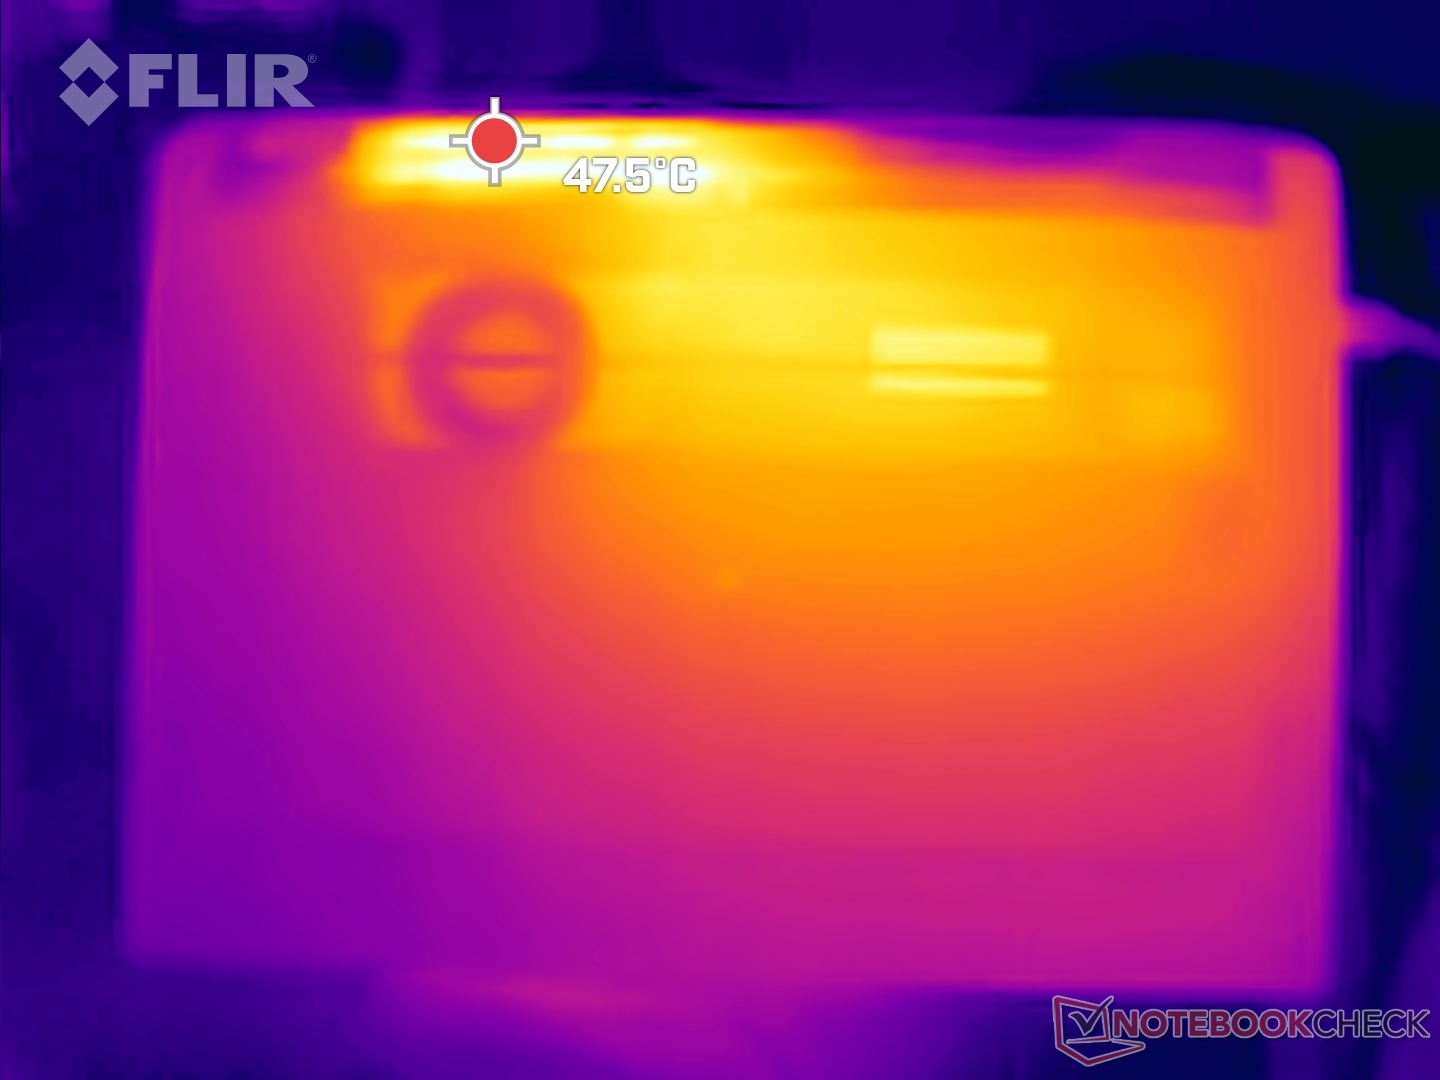
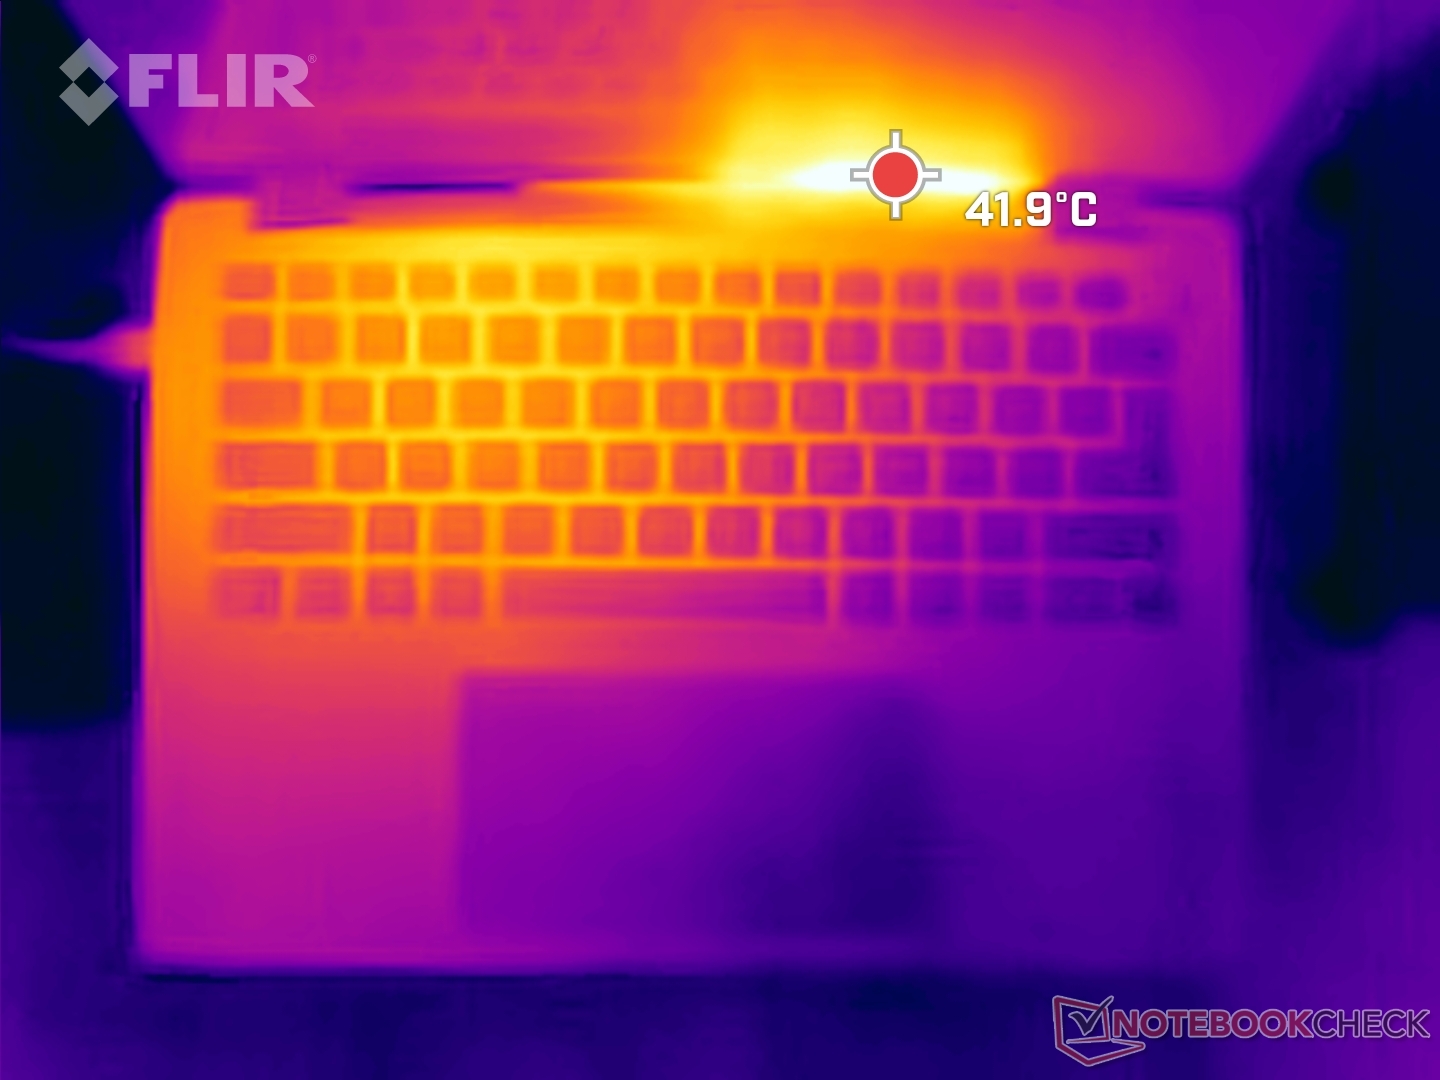
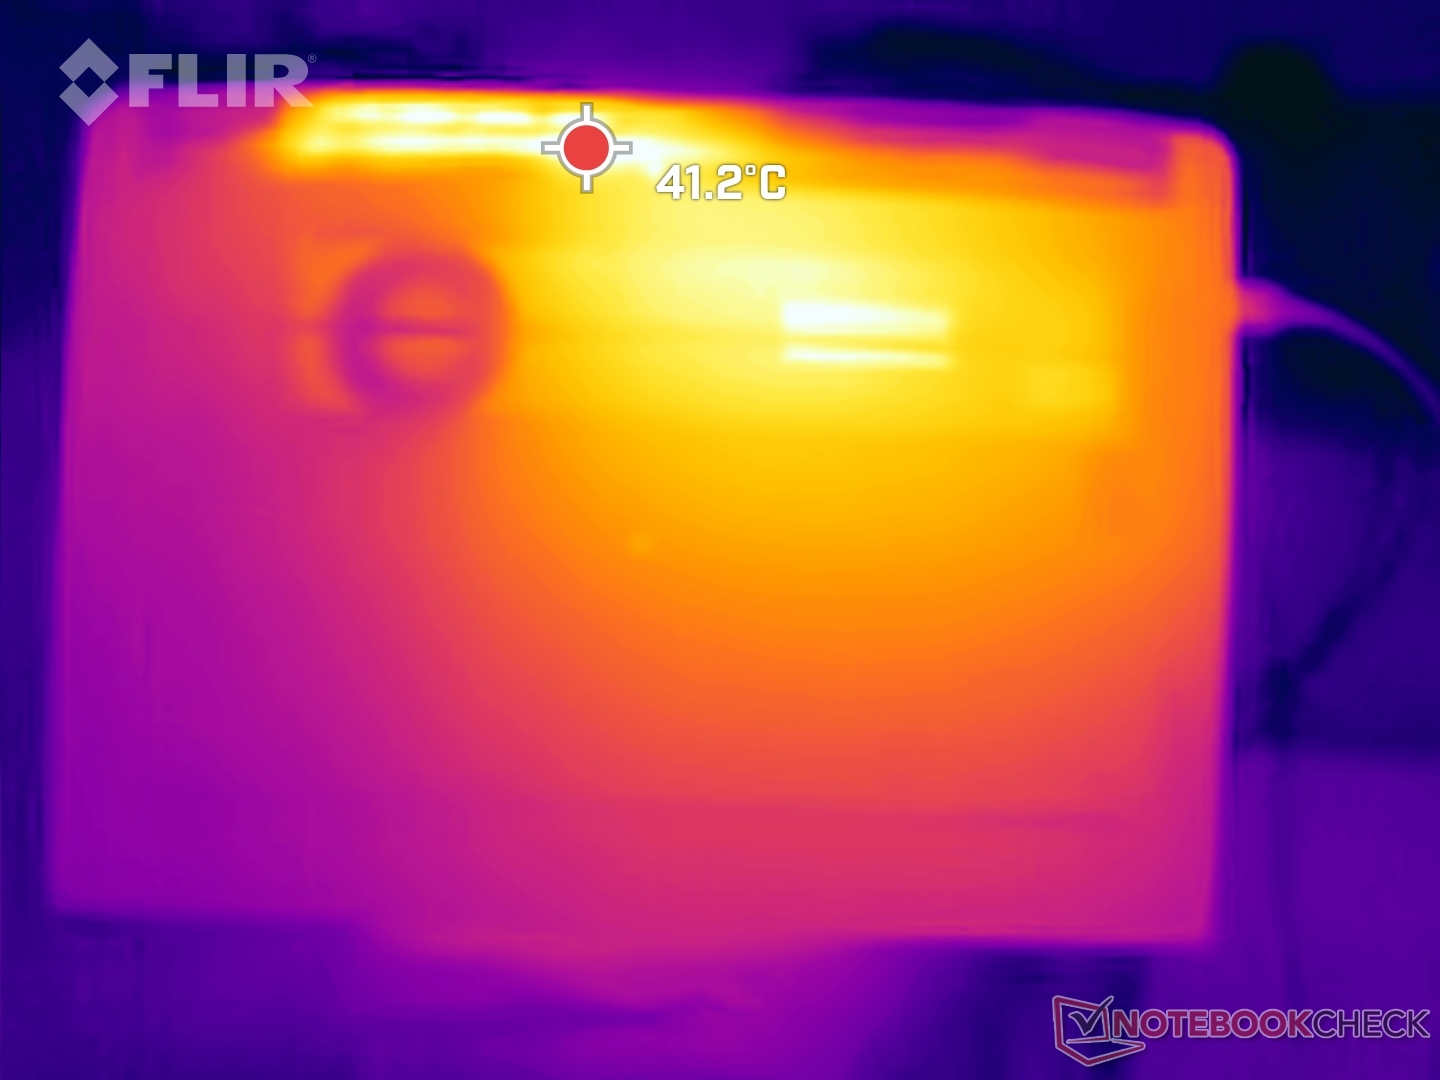
Temperatury powierzchni
Temperatury powierzchni są w większości przypadków znośne. Ekstremalne obciążenia mogą potencjalnie rozgrzać spód do 45°C, ale jest mało prawdopodobne, aby użytkownicy napotkali to podczas regularnego użytkowania.
(±) Maksymalna temperatura w górnej części wynosi 41.2 °C / 106 F, w porównaniu do średniej 35.3 °C / 96 F , począwszy od 19.6 do 60 °C dla klasy Convertible.
(±) Dno nagrzewa się maksymalnie do 45 °C / 113 F, w porównaniu do średniej 36.8 °C / 98 F
(+) W stanie bezczynności średnia temperatura górnej części wynosi 25.7 °C / 78 F, w porównaniu ze średnią temperaturą urządzenia wynoszącą 30.2 °C / ### class_avg_f### F.
(±) 3: The average temperature for the upper side is 34.4 °C / 94 F, compared to the average of 30.2 °C / 86 F for the class Convertible.
(+) Podpórki pod nadgarstki i touchpad są chłodniejsze niż temperatura skóry i maksymalnie 31.6 °C / 88.9 F i dlatego są chłodne w dotyku.
(-) Średnia temperatura obszaru podparcia dłoni w podobnych urządzeniach wynosiła 28 °C / 82.4 F (-3.6 °C / -6.5 F).
| Dell Latitude 7450 2-in-1 Intel Core Ultra 7 165U, Intel Graphics 4-Core iGPU (Arc) | Lenovo ThinkPad X1 2in1 G9 21KE004AGE Intel Core Ultra 7 165U, Intel Graphics 4-Core iGPU (Arc) | Dell Latitude 9450 2-in-1 Intel Core Ultra 7 165U, Intel Graphics 4-Core iGPU (Arc) | Dell Latitude 7350 Detachable Intel Core Ultra 7 164U, Intel Graphics 4-Core iGPU (Arc) | Lenovo ThinkPad T14 G4 21K4S02000 AMD Ryzen 7 PRO 7840U, AMD Radeon 780M | HP EliteBook x360 1040 G11 Intel Core Ultra 7 165H, Intel Arc 8-Core iGPU | |
|---|---|---|---|---|---|---|
| Heat | 4% | 6% | 1% | -1% | 3% | |
| Maximum Upper Side * | 41.2 | 42.9 -4% | 35.4 14% | 38.4 7% | 43.5 -6% | 39 5% |
| Maximum Bottom * | 45 | 43.6 3% | 37.8 16% | 40.6 10% | 47.4 -5% | 43.6 3% |
| Idle Upper Side * | 27.2 | 24.4 10% | 27.2 -0% | 28.2 -4% | 24.9 8% | 24.4 10% |
| Idle Bottom * | 26.2 | 24.9 5% | 28.2 -8% | 28.6 -9% | 26 1% | 27.4 -5% |
* ... im mniej tym lepiej
Głośniki
Poczwórne głośniki Latitude 7450 2-in-1 generują przyzwoity dźwięk o wystarczającej głośności i zrównoważonych średnich i wysokich tonach. Osoby pragnące lepszej jakości mogą skorzystać z zewnętrznych połączeń audio za pośrednictwem gniazda combo audio 3,5 mm lub Bluetooth 5.4.
Dell Latitude 7450 2-in-1 analiza dźwięku
(±) | głośność głośnika jest średnia, ale dobra (81 dB)
Bas 100 - 315 Hz
(±) | zredukowany bas - średnio 10.9% niższy od mediany
(±) | liniowość basu jest średnia (10.5% delta do poprzedniej częstotliwości)
Średnie 400 - 2000 Hz
(+) | zbalansowane środki średnie - tylko 3.2% od mediany
(+) | średnie są liniowe (5.4% delta do poprzedniej częstotliwości)
Wysokie 2–16 kHz
(+) | zrównoważone maksima - tylko 3.3% od mediany
(+) | wzloty są liniowe (4.6% delta do poprzedniej częstotliwości)
Ogólnie 100 - 16.000 Hz
(+) | ogólny dźwięk jest liniowy (10.9% różnicy w stosunku do mediany)
W porównaniu do tej samej klasy
» 7% wszystkich testowanych urządzeń w tej klasie było lepszych, 2% podobnych, 91% gorszych
» Najlepszy miał deltę 6%, średnia wynosiła ###średnia###%, najgorsza wynosiła 57%
W porównaniu do wszystkich testowanych urządzeń
» 5% wszystkich testowanych urządzeń było lepszych, 1% podobnych, 93% gorszych
» Najlepszy miał deltę 4%, średnia wynosiła ###średnia###%, najgorsza wynosiła 134%
Apple MacBook Pro 16 2021 M1 Pro analiza dźwięku
(+) | głośniki mogą odtwarzać stosunkowo głośno (84.7 dB)
Bas 100 - 315 Hz
(+) | dobry bas - tylko 3.8% od mediany
(+) | bas jest liniowy (5.2% delta do poprzedniej częstotliwości)
Średnie 400 - 2000 Hz
(+) | zbalansowane środki średnie - tylko 1.3% od mediany
(+) | średnie są liniowe (2.1% delta do poprzedniej częstotliwości)
Wysokie 2–16 kHz
(+) | zrównoważone maksima - tylko 1.9% od mediany
(+) | wzloty są liniowe (2.7% delta do poprzedniej częstotliwości)
Ogólnie 100 - 16.000 Hz
(+) | ogólny dźwięk jest liniowy (4.6% różnicy w stosunku do mediany)
W porównaniu do tej samej klasy
» 0% wszystkich testowanych urządzeń w tej klasie było lepszych, 0% podobnych, 100% gorszych
» Najlepszy miał deltę 5%, średnia wynosiła ###średnia###%, najgorsza wynosiła 45%
W porównaniu do wszystkich testowanych urządzeń
» 0% wszystkich testowanych urządzeń było lepszych, 0% podobnych, 100% gorszych
» Najlepszy miał deltę 4%, średnia wynosiła ###średnia###%, najgorsza wynosiła 134%
Zużycie energii
Procesor Core Ultra 7 165U w Latitude 7450 2-in-1 jest bardzo oszczędny, a jego zużycie energii w stanie spoczynku jest porównywalne do tego, które oferują procesory AMD Ryzen 7 PRO 7840U w Lenovo ThinkPad T14 G4.
Model Latitude 9450 2-w-1 i ThinkPad X1 2-in-1, oba zasilane przez Core Ultra 7 165U, wykazują ogólnie znacznie wyższe zużycie energii, głównie z powodu wyższego poboru mocy w trybie bezczynności.
| wyłączony / stan wstrzymania | |
| luz | |
| obciążenie |
|
Legenda:
min: | |
| Dell Latitude 7450 2-in-1 Ultra 7 165U, Graphics 4-Core, IPS, 1920x1200, 14" | Lenovo ThinkPad X1 2in1 G9 21KE004AGE Ultra 7 165U, Graphics 4-Core, OLED, 2880x1800, 14" | Dell Latitude 9450 2-in-1 Ultra 7 165U, Graphics 4-Core, IPS, 2560x1600, 14" | Dell Latitude 7350 Detachable Ultra 7 164U, Graphics 4-Core, IPS, 2880x1920, 13" | Lenovo ThinkPad T14 G4 21K4S02000 R7 PRO 7840U, Radeon 780M, IPS LED, 1920x1200, 14" | HP EliteBook x360 1040 G11 Ultra 7 165H, Arc 8-Core, IPS, 1920x1200, 14" | Przeciętny Intel Graphics 4-Core iGPU (Arc) | Średnia w klasie Convertible | |
|---|---|---|---|---|---|---|---|---|
| Power Consumption | -70% | -26% | -5% | 1% | -7% | -16% | -39% | |
| Idle Minimum * | 2.23 | 7.3 -227% | 3.2 -43% | 3.6 -61% | 3.3 -48% | 1.8 19% | 3.67 ? -65% | 4.82 ? -116% |
| Idle Average * | 5.36 | 10.1 -88% | 6.4 -19% | 6.1 -14% | 5.6 -4% | 4.4 18% | 6.69 ? -25% | 7.74 ? -44% |
| Idle Maximum * | 6.8 | 10.4 -53% | 10.8 -59% | 6.7 1% | 6.1 10% | 4.5 34% | 8.18 ? -20% | 10.3 ? -51% |
| Load Average * | 51.2 | 45.7 11% | 54.6 -7% | 33.7 34% | 40.1 22% | 40.7 21% | 40.3 ? 21% | 45.4 ? 11% |
| Cyberpunk 2077 ultra * | 29.5 | 37 -25% | 56.5 -92% | |||||
| Cyberpunk 2077 ultra external monitor * | 34.6 | 31.8 8% | 54.6 -58% | |||||
| Load Maximum * | 69.9 | 64.1 8% | 70.2 -0% | 55.1 21% | 51.8 26% | 66 6% | 65 ? 7% | 67.5 ? 3% |
| Witcher 3 ultra * | 35.2 | 35.5 | 41.4 |
* ... im mniej tym lepiej
Poniższe wykresy wielordzeniowego poboru mocy Cinebench naśladują nasze wcześniejsze obserwacje w odniesieniu do mocy pakietów.
System chłodzenia Latitude 7450 2-in-1 najwyraźniej ma trudności z utrzymaniem limitu 48 W PL2 przez długi czas, szczególnie podczas obciążeń wielordzeniowych. Możliwe, że Dell stosuje agresywne środki dławienia termicznego w momencie, gdy temperatura rdzenia osiągnie 100 °C.
Power consumption: Cyberpunk 2077 / Stress test
Power consumption: External monitor
Żywotność baterii
Bateria Latitude 7450 2-in-1 o pojemności 57 Wh zapewnia dobry czas pracy w naszych testach przeglądania sieci WLAN i odtwarzania zapętlonego wideo 1080p H.264 przy 150 nitach.
Konwersja powinna być w stanie z łatwością przetrwać typowy dzień roboczy, zwłaszcza gdy jest używana przy niższych poziomach jasności z włączoną dynamiczną częstotliwością odświeżania.
Dołączony zasilacz o mocy 65 W obsługuje szybkie ładowanie ExpressCharge, a pełne naładowanie od zera zajmuje nieco ponad godzinę.
Ponadto Dell Optimizer oferuje precyzyjną kontrolę ładowania, w tym opcje dynamicznej polityki ładowania i harmonogramu ładowania na dzień.
| Dell Latitude 7450 2-in-1 Ultra 7 165U, Graphics 4-Core, 57 Wh | Lenovo ThinkPad X1 2in1 G9 21KE004AGE Ultra 7 165U, Graphics 4-Core, 57 Wh | Dell Latitude 9450 2-in-1 Ultra 7 165U, Graphics 4-Core, 60 Wh | Dell Latitude 7350 Detachable Ultra 7 164U, Graphics 4-Core, 46.5 Wh | Lenovo ThinkPad T14 G4 21K4S02000 R7 PRO 7840U, Radeon 780M, 52.5 Wh | HP EliteBook x360 1040 G11 Ultra 7 165H, Arc 8-Core, 68 Wh | Średnia w klasie Convertible | |
|---|---|---|---|---|---|---|---|
| Czasy pracy | -25% | 23% | -6% | 10% | 47% | 8% | |
| H.264 | 741 | 540 -27% | 898 ? 21% | ||||
| WiFi v1.3 | 660 | 509 -23% | 815 23% | 619 -6% | 729 10% | 969 47% | 628 ? -5% |
| Load | 89 | 143 | 98 | 100 | 99 | 113.2 ? | |
| Reader / Idle | 1300 | 1493 | 3353 | 1387 ? |
Notebookcheck Rating
Dell Latitude 7450 2-in-1
- 13/11/2024 v8
Vaidyanathan Subramaniam
 Total Sustainability Score:
Dell Latitude 7450 2-in-1
- 13/11/2024 v8
Vaidyanathan Subramaniam
Total Sustainability Score: Przezroczystość
Wyboru urządzeń do recenzji dokonuje nasza redakcja. Próbka testowa została udostępniona autorowi jako pożyczka od producenta lub sprzedawcy detalicznego na potrzeby tej recenzji. Pożyczkodawca nie miał wpływu na tę recenzję, producent nie otrzymał też kopii tej recenzji przed publikacją. Nie było obowiązku publikowania tej recenzji. Nigdy nie przyjmujemy rekompensaty ani płatności w zamian za nasze recenzje. Jako niezależna firma medialna, Notebookcheck nie podlega władzy producentów, sprzedawców detalicznych ani wydawców.
Tak testuje Notebookcheck
Każdego roku Notebookcheck niezależnie sprawdza setki laptopów i smartfonów, stosując standardowe procedury, aby zapewnić porównywalność wszystkich wyników. Od około 20 lat stale rozwijamy nasze metody badawcze, ustanawiając przy tym standardy branżowe. W naszych laboratoriach testowych doświadczeni technicy i redaktorzy korzystają z wysokiej jakości sprzętu pomiarowego. Testy te obejmują wieloetapowy proces walidacji. Nasz kompleksowy system ocen opiera się na setkach uzasadnionych pomiarów i benchmarków, co pozwala zachować obiektywizm.
