Recenzja laptopa Dell XPS 13 9340 - Kompaktowy subnotebook z długim czasem pracy i kilkoma wadami
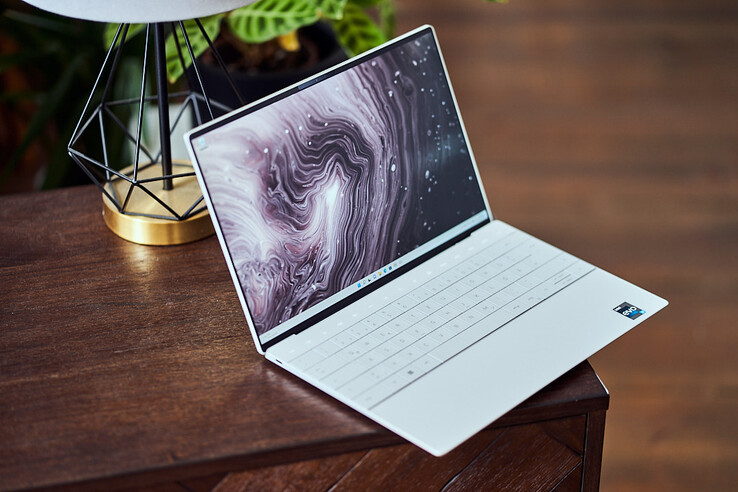
Po wcześniejszych testach nowych 14- i 16-calowych modeli z najnowszej serii XPS, nadszedł czas, aby przyjrzeć się kompaktowemu Dell XPS 13 9340. Stary XPS 13 Plusktóry zainspirował design nowych modeli, nie jest już dostępny. Dell oferuje jednak odchudzonego XPS 13 9315 ze starymi procesorami Alder Lake, a także konwencjonalnymi urządzeniami wejściowymi - poza tym mają identyczną obudowę.
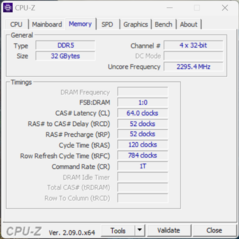
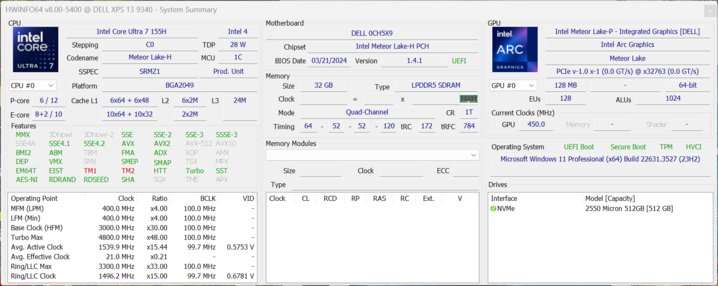
Nasze urządzenie testowe jest wyposażone w nowy procesor Meteor Lake - Core Ultra 7 155H- a także 32 GB pamięci RAM, dysk SSD PCIe 512 GB i panel Full HD. Cena wywoławcza Dell za tę konfigurację wynosi 1599 USD (cena wprowadzająca z Core Ultra 5 i 16 GB pamięci RAM wynosi 1149 USD). Cenę tę można podnieść maksymalnie do 2 659 USD (Core Ultra 7, 64 GB RAM, 2-TB SSD, QHD+).
Potencjalni konkurenci w porównaniu
Ocena | Data | Model | Waga | Wysokość | Rozmiar | Rezolucja | Cena |
|---|---|---|---|---|---|---|---|
| 86.5 % v7 (old) | 05/2024 | Dell XPS 13 9340 Core Ultra 7 Ultra 7 155H, Arc 8-Core | 1.2 kg | 15.3 mm | 13.40" | 1920x1200 | |
| 92.4 % v7 (old) | 03/2024 | Apple MacBook Air 13 M3 10C GPU M3, M3 10-Core GPU | 1.2 kg | 11.3 mm | 13.60" | 2560x1664 | |
| 85.4 % v7 (old) | 05/2023 | Asus ZenBook S13 OLED UX5304 i7-1355U, Iris Xe G7 96EUs | 1 kg | 11.8 mm | 13.30" | 2880x1800 | |
| 89.5 % v7 (old) | 01/2024 | Lenovo ThinkPad Z13 Gen 2 R7 PRO 7840U, Radeon 780M | 1.2 kg | 13.99 mm | 13.30" | 2880x1800 | |
| 91.9 % v7 (old) | 07/2023 | HP Dragonfly G4 i7-1365U, Iris Xe G7 96EUs | 1.1 kg | 16.3 mm | 13.50" | 1920x1280 |
Obudowa - stabilne aluminium
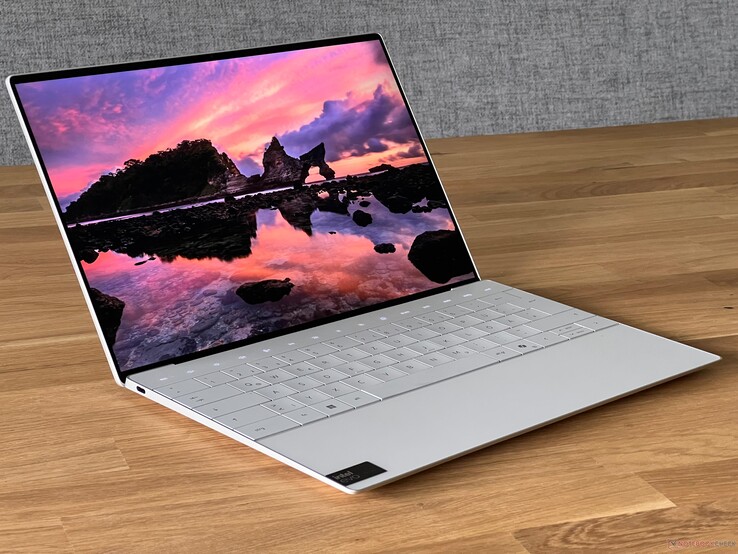
Dell wprowadził swój obecny design XPS jakiś czas temu w XPS 13 Plus, a teraz używa go w całej serii. Uważamy, że konstrukcja działa najlepiej na małym XPS 13 9340, ponieważ urządzenie wydaje się niezwykle kompaktowe (szczególnie w porównaniu z nieporęcznym XPS 14). Oprócz srebrnego wariantu, producent oferuje również ciemnoszary model. Urządzenie wygląda na wysokiej jakości i nie zauważyliśmy żadnych problemów z budową. Co więcej, nie wydaje się być magnesem na odciski palców.
Pokrywę wyświetlacza można łatwo otworzyć jedną ręką, a oprócz unikalnych urządzeń wejściowych (więcej o tym później), smukłe ramki laptopa natychmiast przyciągają wzrok. Zawiasy są dobrze wyregulowane, jednak maksymalny kąt otwarcia ekranu jest ograniczony do ~135 stopni. Stabilność jednostki bazowej jest świetna i nawet przy użyciu dużej siły nacisku byliśmy w stanie tylko nieznacznie wgnieść klawiaturę. To samo można powiedzieć o pokrywie wyświetlacza, z której nie byliśmy w stanie wydobyć żadnych błędów obrazu.
XPS 13 9340 jest najbardziej kompaktowym urządzeniem w naszej grupie porównawczej i nie zajmuje dużo miejsca. Jest to przydatne na przykład podczas podróży (pociągiem, samolotem). Ważąc nieco ponad 1,2 kg, nie jest to jednak najlżejszy model. Dostarczony w zestawie 60-watowy zasilacz jest również dość kompaktowy i wraz z kablem USB-C dodaje kolejne 256 gramów do wagi.
Łączność - XPS 13 bez gniazda audio
W porównaniu z dwoma większymi rodzeństwami, XPS 13 musi nadrobić sporo zaległości, jeśli chodzi o porty, ponieważ zarówno czytnik kart, jak i gniazdo audio zostały usunięte. Ma tylko jeden port USB-C z Thunderbolt 4 po każdej stronie. W praktyce miło jest, że można podłączyć zasilacz po obu stronach, ale często pozostawia to tylko jeden port do wykorzystania.
Komunikacja
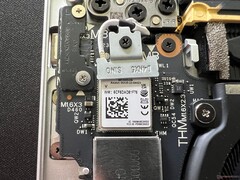
Moduł WLAN Intel BE200 obsługuje już Wi-Fi 7, a także Bluetooth 5.4. Podczas naszego testu WLAN zapewnił ogólnie wysokie i stabilne prędkości transferu w połączeniu z naszym routerem referencyjnym firmy Asus. Nie odnotowaliśmy żadnych problemów podczas całej fazy testów.
| Networking | |
| Dell XPS 13 9340 Core Ultra 7 | |
| iperf3 transmit AXE11000 | |
| iperf3 receive AXE11000 | |
| Apple MacBook Air 13 M3 10C GPU | |
| iperf3 transmit AXE11000 | |
| iperf3 receive AXE11000 | |
| Asus ZenBook S13 OLED UX5304 | |
| iperf3 transmit AXE11000 | |
| iperf3 receive AXE11000 | |
| Lenovo ThinkPad Z13 Gen 2 | |
| iperf3 transmit AXE11000 | |
| iperf3 receive AXE11000 | |
| iperf3 transmit AXE11000 6GHz | |
| iperf3 receive AXE11000 6GHz | |
| HP Dragonfly G4 | |
| iperf3 transmit AXE11000 | |
| iperf3 receive AXE11000 | |
| iperf3 transmit AXE11000 6GHz | |
| iperf3 receive AXE11000 6GHz | |
| Dell XPS 13 Plus 9320 Core i7-1360P | |
| iperf3 transmit AXE11000 | |
| iperf3 receive AXE11000 | |
| iperf3 transmit AXE11000 6GHz | |
| iperf3 receive AXE11000 6GHz | |
Kamera internetowa
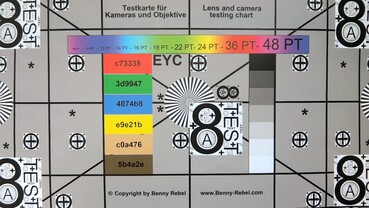
Kamera 1080p zainstalowana w górnej krawędzi wyświetlacza robi przyzwoite zdjęcia, a w połączeniu z procesorem Meteor Lake, efekty studyjne (takie jak miękkie ogniskowanie tła) mają być częścią systemu operacyjnego laptopa. Ponadto urządzenie może korzystać z kamery na podczerwień do rozpoznawania twarzy za pośrednictwem Windows Hello.

Konserwacja
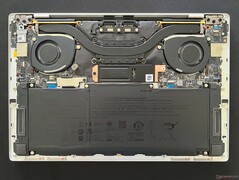
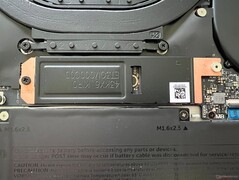
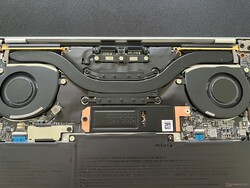
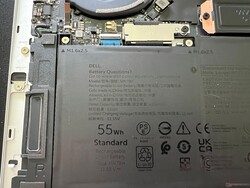
Dolna pokrywa jest zabezpieczona śrubami Torx (T5) i można ją łatwo zdjąć. Wewnątrz opcje konserwacji ograniczają się jednak do czyszczenia wentylatorów i wymiany dysku SSD M.2-2280, który znajduje się pod dodatkową pokrywą. Bateria jest przykręcana i w razie potrzeby można ją wymienić.
Urządzenia wejściowe - Klawiatura wymaga przyzwyczajenia i irytujące klawisze funkcyjne
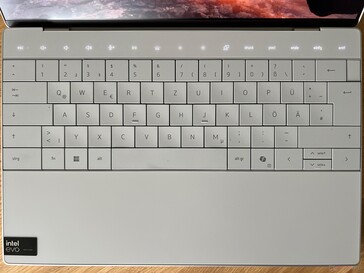
Podobnie jak w starym XPS 13 Plus, konstrukcja klawiatury tego modelu nie posiada żadnych odstępów pomiędzy poszczególnymi klawiszami. Same klawisze są lekko wklęsłe i ogólnie wygodnie się na nich pisze, ponieważ ich naciśnięcia są precyzyjne. Zauważyliśmy jednak kilka problemów, a mianowicie często przypadkowo trafialiśmy w niewłaściwy klawisz i zdecydowanie trzeba przyzwyczaić się do klawiatury. Nieco irytujące wydały nam się również małe pionowe klawisze strzałek, w które ledwo można trafić większymi palcami. Ponadto dźwięk większych klawiszy (spacja, enter) jest znacznie głośniejszy. Przycisk zasilania (w tym skaner linii papilarnych) znajduje się w prawym górnym rogu, w miejscu, w którym zwykle oczekuje się klawisza Esc - i to prowadzi nas do kolejnego problemu.
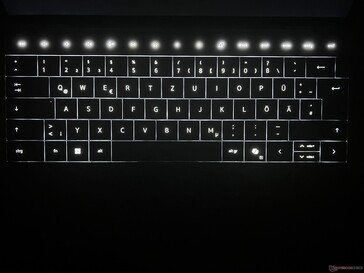
Klawisze funkcyjne są zainstalowane jako pasek dotykowy, który w praktyce nie dodaje żadnej dodatkowej wartości dla użytkowników - zamiast tego jest raczej irytujący. Oznacza to, że nie można nawet nacisnąć klawisza Esc na ślepo i za każdym razem trzeba patrzeć na klawisze. Jego podświetlenie jest również pewnym problemem, ponieważ wyłącza się natychmiast w okresach bezczynności, podczas gdy nie robiło tego podczas wielogodzinnego odtwarzania wideo bez żadnych wejść. Co więcej, jeśli wyłączysz podświetlenie klawiatury, nie będziesz wiedział, gdzie musisz nacisnąć, co prowadzi do tego, że użytkownicy mogą uderzać w niewłaściwe klawisze, zanim podświetlenie zostanie ponownie włączone. Samo białe podświetlenie jest stale regulowane za pomocą czujnika i nie można w ogóle zmienić jego intensywności - przynajmniej nie mogliśmy znaleźć takiej opcji. Czujnik nie jest również zainteresowany tym, czy dezaktywowałeś podświetlenie chwilę wcześniej, ponieważ gdy tylko zmienią się warunki oświetlenia otoczenia, podświetlenie zostanie ponownie aktywowane.
Touchpad jest w pełni zintegrowany z podpórką pod nadgarstki i nie ma żadnych widocznych granic. Touchpad wykorzystuje całą wysokość podpórki pod nadgarstki, a jego szerokość rozciąga się od środka lewego klawisza Alt do tuż pod nowym klawiszem Copilot. Ogólnie rzecz biorąc, działa dobrze, jest przyjemny i gładki, a kliknięcie haptyczne jest przyjemne. Z kolei od czasu do czasu napotykaliśmy problemy, jeśli opuściliśmy obszar lub rozpoczęliśmy ruchy nieco obok rzeczywistego obszaru touchpada. W przeciwieństwie do paska dotykowego, jest to jednak tylko drobny punkt krytyki.
Wyświetlacz - podstawowy XPS z częstotliwością odświeżania 120 Hz
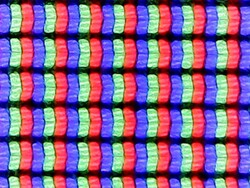
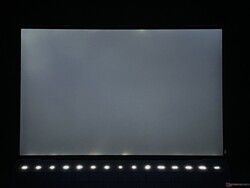
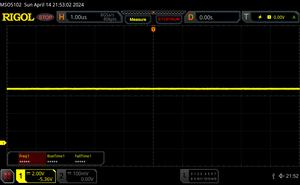
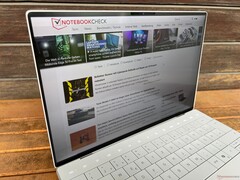
Nowy XPS 13 9340 jest dostępny z trzema różnymi 13,4-calowymi wyświetlaczami IPS. Opcjonalnie można wybrać panel 3K z częstotliwością odświeżania 60 Hz (400 cd/m², dopłata 300 USD), a także ekran dotykowy QHD+ z częstotliwością odświeżania 120 Hz (500 cd/m², dopłata 300 USD). Nasz testowy egzemplarz został jednak wyposażony w podstawowy panel o rozdzielczości 1 920 x 1 200 i bez funkcji dotykowej. W subiektywnym odczuciu, jakość obrazu zyskuje na wyższej częstotliwości 120 Hz, dzięki czemu ruchy wyglądają bardzo płynnie. Ponadto, wyświetlane treści są wystarczająco ostre, ale kolory nie wyglądają tak żywo jak na panelach OLED. Co więcej, jasne obszary wyglądają nieco ziarniście. Wyświetlacz nie wykorzystuje migotania PWM, ale jego czasy reakcji są nieco powolne. Krwawienie podświetlenia nie jest zbyt dużym problemem, a jego jasność jest regulowana automatycznie za pomocą czujnika.
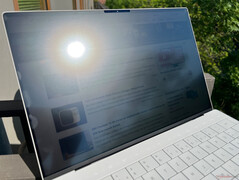
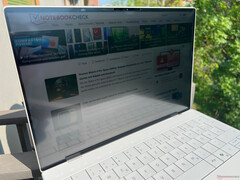
Dell deklaruje jasność na poziomie 500 cd/m², czego nie udało się osiągnąć w naszym teście. Zmierzyliśmy maksymalnie 429 cd/m² i średnio tylko nieco ponad 400 cd/m². Jego wartość czerni jest przyzwoita i wynosi 0,28, co przynajmniej prowadzi do bardzo dobrego maksymalnego współczynnika kontrastu wynoszącego ~ 1500:1. Kolejnym problemem jest minimalna jasność wynosząca prawie 45 cd/m², która jest po prostu zbyt wysoka.
| |||||||||||||||||||||||||
rozświetlenie: 90 %
na akumulatorze: 429 cd/m²
kontrast: 1532:1 (czerń: 0.28 cd/m²)
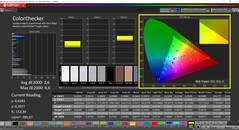
ΔE Color 2.6 | 0.5-29.43 Ø4.87, calibrated: 1.4
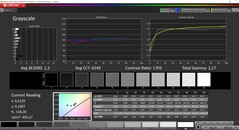
ΔE Greyscale 4 | 0.5-98 Ø5.1
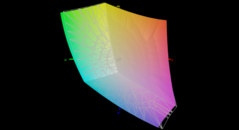
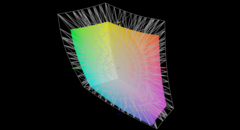
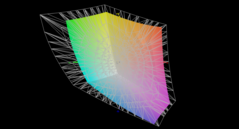
71.7% AdobeRGB 1998 (Argyll 2.2.0 3D)
97.8% sRGB (Argyll 2.2.0 3D)
69.4% Display P3 (Argyll 2.2.0 3D)
Gamma: 2.23
| Dell XPS 13 9340 Core Ultra 7 SHP1593, IPS, 1920x1200, 13.4" | Apple MacBook Air 13 M3 10C GPU IPS, 2560x1664, 13.6" | Asus ZenBook S13 OLED UX5304 SDC417B, OLED, 2880x1800, 13.3" | Lenovo ThinkPad Z13 Gen 2 ATNA33AA02-0, OLED, 2880x1800, 13.3" | HP Dragonfly G4 Chi Mei CMN13C0, IPS, 1920x1280, 13.5" | Dell XPS 13 Plus 9320 Core i7-1360P Samsung 134XK04, OLED, 3456x2160, 13.4" | |
|---|---|---|---|---|---|---|
| Display | 22% | 27% | 27% | -1% | 27% | |
| Display P3 Coverage | 69.4 | 98.4 42% | 99.7 44% | 99.7 44% | 68.4 -1% | 99.7 44% |
| sRGB Coverage | 97.8 | 99.9 2% | 100 2% | 100 2% | 98.3 1% | 100 2% |
| AdobeRGB 1998 Coverage | 71.7 | 87.9 23% | 96.9 35% | 97.3 36% | 70.4 -2% | 96.8 35% |
| Response Times | 11% | 95% | 94% | -13% | 94% | |
| Response Time Grey 50% / Grey 80% * | 43.2 ? | 34.5 ? 20% | 2 ? 95% | 2.1 ? 95% | 48.8 ? -13% | 2.18 ? 95% |
| Response Time Black / White * | 27.6 ? | 27.2 ? 1% | 1.6 ? 94% | 2.2 ? 92% | 31.3 ? -13% | 2.08 ? 92% |
| PWM Frequency | 240 ? | 60.1 ? | 238.6 ? | |||
| Screen | 17% | 30% | 29% | 14% | -39% | |
| Brightness middle | 429 | 525 22% | 361 -16% | 372 -13% | 408.8 -5% | 361.7 -16% |
| Brightness | 407 | 506 24% | 365 -10% | 375 -8% | 399 -2% | 367 -10% |
| Brightness Distribution | 90 | 92 2% | 98 9% | 99 10% | 90 0% | 96 7% |
| Black Level * | 0.28 | 0.42 -50% | 0.32 -14% | |||
| Contrast | 1532 | 1250 -18% | 1278 -17% | |||
| Colorchecker dE 2000 * | 2.6 | 1.4 46% | 1.2 54% | 0.88 66% | 2.02 22% | 4.83 -86% |
| Colorchecker dE 2000 max. * | 6.6 | 2.8 58% | 1.9 71% | 3.22 51% | 3.84 42% | 9.34 -42% |
| Colorchecker dE 2000 calibrated * | 1.4 | 0.61 56% | 3.97 -184% | |||
| Greyscale dE 2000 * | 4 | 2 50% | 1.2 70% | 1.2 70% | 2.3 42% | 1.8 55% |
| Gamma | 2.23 99% | 2.2 100% | 2.27 97% | 2.18 101% | 2.2 100% | 2.33 94% |
| CCT | 7332 89% | 6876 95% | 6486 100% | 6326 103% | 6203 105% | 6438 101% |
| Całkowita średnia (program / ustawienia) | 17% /
17% | 51% /
41% | 50% /
40% | 0% /
7% | 27% /
-1% |
* ... im mniej tym lepiej
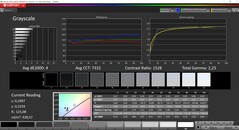
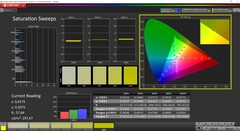
Zmierzyliśmy panel za pomocą profesjonalnego oprogramowania CalMAN (X-Rite i1 Pro 2) i od razu po wyjęciu z pudełka jego kalibracja nie jest szczególnie dobra. Zauważyliśmy znaczny niebieski odcień, a jego temperatura barwowa jest zbyt niska. Co więcej, jego odchylenia w skali szarości i sporo odchyleń kolorów przekraczają docelową wartość 3. Korzystając z naszej własnej kalibracji (profil można pobrać bezpłatnie powyżej), byliśmy w stanie znacznie poprawić jego odwzorowanie, jednak zmniejsza to maksymalną jasność ekranu o około 25 cd/m². Niewielka przestrzeń barw sRGB jest niemal w całości pokryta, więc można wykorzystać panel również do edycji zdjęć.
Wyświetl czasy reakcji
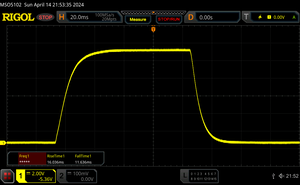
| ↔ Czas reakcji od czerni do bieli | ||
|---|---|---|
| 27.6 ms ... wzrost ↗ i spadek ↘ łącznie | ↗ 16 ms wzrost | |
| ↘ 11.6 ms upadek | ||
| W naszych testach ekran wykazuje stosunkowo powolne tempo reakcji i może być zbyt wolny dla graczy. Dla porównania, wszystkie testowane urządzenia wahają się od 0.1 (minimum) do 240 (maksimum) ms. » 68 % wszystkich urządzeń jest lepszych. Oznacza to, że zmierzony czas reakcji jest gorszy od średniej wszystkich testowanych urządzeń (20.8 ms). | ||
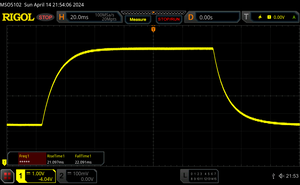
| ↔ Czas reakcji 50% szarości do 80% szarości | ||
| 43.2 ms ... wzrost ↗ i spadek ↘ łącznie | ↗ 21.1 ms wzrost | |
| ↘ 22.1 ms upadek | ||
| W naszych testach ekran wykazuje powolne tempo reakcji, co będzie niezadowalające dla graczy. Dla porównania, wszystkie testowane urządzenia wahają się od 0.165 (minimum) do 636 (maksimum) ms. » 70 % wszystkich urządzeń jest lepszych. Oznacza to, że zmierzony czas reakcji jest gorszy od średniej wszystkich testowanych urządzeń (32.5 ms). | ||
Migotanie ekranu / PWM (modulacja szerokości impulsu)
| Migotanie ekranu/nie wykryto PWM | |||
Dla porównania: 53 % wszystkich testowanych urządzeń nie używa PWM do przyciemniania wyświetlacza. Jeśli wykryto PWM, zmierzono średnio 8516 (minimum: 5 - maksimum: 343500) Hz. | |||
Wydajność - XPS 13 z maksymalnie 64 GB pamięci RAM
Dell oferuje nowy XPS 13 9340 tylko z procesorami Intel Meteor Lake (Core Ultra 5/7) i nie ma dedykowanych kart graficznych. Do wyboru jest 8, 16, 32 lub 64 GB pamięci RAM (8 GB tylko z Core Ultra 7 155H, Core Ultra 5 125H dostępny jest tylko z 16 GB).
Warunki testowania
W oprogramowaniu MyDell dostępne są różne tryby wydajności, ale nie można ich przełączać za pomocą kombinacji klawiszy. Do poniższych testów użyliśmy trybu zoptymalizowanego.
Procesor - Core Ultra 7 155H
Procesor Core Ultra 7 155H należy do obecnej generacji Meteor Lake od Intela i jest następcą starego Core i7-13700H. W XPS 13 procesor może zużywać maksymalnie 45 watów w krótkich seriach, ale przy ciągłym obciążeniu balansuje na poziomie około 24 watów po 5 minutach (~ 40% mniejsza wydajność). Na początku testów wielordzeniowych jego wydajność była przyzwoita, ale niewiele lepsza od starego Core i7-1360P z dwoma wydajnymi rdzeniami mniej. Co więcej, jego wydajność jednordzeniowa jest również gorsza niż w starym XPS 13. Apple's M3 SoC był również znacznie szybszy podczas testów jednordzeniowych, ale w testach wielordzeniowych był wolniejszy. Podczas pracy na baterii procesor może zużywać 42 waty przez krótką chwilę, po czym natychmiast spada do 20 watów. Oznacza to, że jego wydajność wielordzeniowa z dala od gniazdka jest o około 43% niższa. Więcej testów porównawczych procesora można znaleźć w naszej sekcji technicznej.
Cinebench R15 Multi continuous test
Cinebench R23: Multi Core | Single Core
Cinebench R20: CPU (Multi Core) | CPU (Single Core)
Cinebench R15: CPU Multi 64Bit | CPU Single 64Bit
Blender: v2.79 BMW27 CPU
7-Zip 18.03: 7z b 4 | 7z b 4 -mmt1
Geekbench 6.4: Multi-Core | Single-Core
Geekbench 5.5: Multi-Core | Single-Core
HWBOT x265 Benchmark v2.2: 4k Preset
LibreOffice : 20 Documents To PDF
R Benchmark 2.5: Overall mean
| CPU Performance Rating | |
| Przeciętny Intel Core Ultra 7 155H | |
| Lenovo ThinkPad Z13 Gen 2 | |
| Apple MacBook Air 13 M3 10C GPU -9! | |
| Dell XPS 13 9340 Core Ultra 7 | |
| Dell XPS 13 Plus 9320 Core i7-1360P -2! | |
| Średnia w klasie Subnotebook | |
| HP Dragonfly G4 -2! | |
| Asus ZenBook S13 OLED UX5304 -2! | |
| Cinebench R23 / Multi Core | |
| Przeciętny Intel Core Ultra 7 155H (9769 - 19007, n=52) | |
| Lenovo ThinkPad Z13 Gen 2 | |
| Dell XPS 13 9340 Core Ultra 7 | |
| Średnia w klasie Subnotebook (1555 - 21812, n=76, ostatnie 2 lata) | |
| Dell XPS 13 Plus 9320 Core i7-1360P | |
| Apple MacBook Air 13 M3 10C GPU | |
| HP Dragonfly G4 | |
| Asus ZenBook S13 OLED UX5304 | |
| Cinebench R23 / Single Core | |
| Apple MacBook Air 13 M3 10C GPU | |
| HP Dragonfly G4 | |
| Dell XPS 13 Plus 9320 Core i7-1360P | |
| Asus ZenBook S13 OLED UX5304 | |
| Przeciętny Intel Core Ultra 7 155H (1496 - 1815, n=52) | |
| Lenovo ThinkPad Z13 Gen 2 | |
| Dell XPS 13 9340 Core Ultra 7 | |
| Średnia w klasie Subnotebook (358 - 2165, n=76, ostatnie 2 lata) | |
| Cinebench R20 / CPU (Multi Core) | |
| Przeciętny Intel Core Ultra 7 155H (3798 - 7409, n=50) | |
| Lenovo ThinkPad Z13 Gen 2 | |
| Dell XPS 13 9340 Core Ultra 7 | |
| Średnia w klasie Subnotebook (579 - 8541, n=71, ostatnie 2 lata) | |
| Dell XPS 13 Plus 9320 Core i7-1360P | |
| HP Dragonfly G4 | |
| Asus ZenBook S13 OLED UX5304 | |
| Cinebench R20 / CPU (Single Core) | |
| Dell XPS 13 Plus 9320 Core i7-1360P | |
| HP Dragonfly G4 | |
| Asus ZenBook S13 OLED UX5304 | |
| Lenovo ThinkPad Z13 Gen 2 | |
| Przeciętny Intel Core Ultra 7 155H (601 - 696, n=50) | |
| Dell XPS 13 9340 Core Ultra 7 | |
| Średnia w klasie Subnotebook (128 - 826, n=71, ostatnie 2 lata) | |
| Cinebench R15 / CPU Multi 64Bit | |
| Przeciętny Intel Core Ultra 7 155H (1932 - 2880, n=56) | |
| Dell XPS 13 9340 Core Ultra 7 | |
| Lenovo ThinkPad Z13 Gen 2 | |
| Dell XPS 13 Plus 9320 Core i7-1360P | |
| Średnia w klasie Subnotebook (327 - 3345, n=77, ostatnie 2 lata) | |
| Asus ZenBook S13 OLED UX5304 | |
| HP Dragonfly G4 | |
| Cinebench R15 / CPU Single 64Bit | |
| Dell XPS 13 Plus 9320 Core i7-1360P | |
| Lenovo ThinkPad Z13 Gen 2 | |
| HP Dragonfly G4 | |
| Dell XPS 13 9340 Core Ultra 7 | |
| Średnia w klasie Subnotebook (72.4 - 322, n=72, ostatnie 2 lata) | |
| Przeciętny Intel Core Ultra 7 155H (99.6 - 268, n=52) | |
| Asus ZenBook S13 OLED UX5304 | |
| Blender / v2.79 BMW27 CPU | |
| Apple MacBook Air 13 M3 10C GPU | |
| Asus ZenBook S13 OLED UX5304 | |
| Asus ZenBook S13 OLED UX5304 | |
| HP Dragonfly G4 | |
| Średnia w klasie Subnotebook (159 - 2271, n=75, ostatnie 2 lata) | |
| Dell XPS 13 Plus 9320 Core i7-1360P | |
| Dell XPS 13 9340 Core Ultra 7 | |
| Lenovo ThinkPad Z13 Gen 2 | |
| Przeciętny Intel Core Ultra 7 155H (175 - 381, n=47) | |
| 7-Zip 18.03 / 7z b 4 | |
| Przeciętny Intel Core Ultra 7 155H (41739 - 70254, n=50) | |
| Lenovo ThinkPad Z13 Gen 2 | |
| Dell XPS 13 9340 Core Ultra 7 | |
| Dell XPS 13 Plus 9320 Core i7-1360P | |
| Średnia w klasie Subnotebook (11668 - 77867, n=67, ostatnie 2 lata) | |
| HP Dragonfly G4 | |
| Asus ZenBook S13 OLED UX5304 | |
| 7-Zip 18.03 / 7z b 4 -mmt1 | |
| HP Dragonfly G4 | |
| Asus ZenBook S13 OLED UX5304 | |
| Lenovo ThinkPad Z13 Gen 2 | |
| Dell XPS 13 Plus 9320 Core i7-1360P | |
| Średnia w klasie Subnotebook (2643 - 6442, n=69, ostatnie 2 lata) | |
| Dell XPS 13 9340 Core Ultra 7 | |
| Przeciętny Intel Core Ultra 7 155H (4594 - 5621, n=50) | |
| Geekbench 6.4 / Multi-Core | |
| Przeciętny Intel Core Ultra 7 155H (7732 - 13656, n=55) | |
| Lenovo ThinkPad Z13 Gen 2 | |
| Apple MacBook Air 13 M3 10C GPU | |
| Dell XPS 13 9340 Core Ultra 7 | |
| Średnia w klasie Subnotebook (2244 - 17489, n=72, ostatnie 2 lata) | |
| Geekbench 6.4 / Single-Core | |
| Apple MacBook Air 13 M3 10C GPU | |
| Średnia w klasie Subnotebook (960 - 3655, n=67, ostatnie 2 lata) | |
| Lenovo ThinkPad Z13 Gen 2 | |
| Dell XPS 13 9340 Core Ultra 7 | |
| Przeciętny Intel Core Ultra 7 155H (1901 - 2473, n=52) | |
| Geekbench 5.5 / Multi-Core | |
| Przeciętny Intel Core Ultra 7 155H (10017 - 13556, n=52) | |
| Dell XPS 13 9340 Core Ultra 7 | |
| Lenovo ThinkPad Z13 Gen 2 | |
| Dell XPS 13 Plus 9320 Core i7-1360P | |
| Apple MacBook Air 13 M3 10C GPU | |
| Średnia w klasie Subnotebook (2557 - 17218, n=68, ostatnie 2 lata) | |
| HP Dragonfly G4 | |
| Asus ZenBook S13 OLED UX5304 | |
| Geekbench 5.5 / Single-Core | |
| Apple MacBook Air 13 M3 10C GPU | |
| HP Dragonfly G4 | |
| Lenovo ThinkPad Z13 Gen 2 | |
| Dell XPS 13 Plus 9320 Core i7-1360P | |
| Średnia w klasie Subnotebook (726 - 2350, n=68, ostatnie 2 lata) | |
| Asus ZenBook S13 OLED UX5304 | |
| Dell XPS 13 9340 Core Ultra 7 | |
| Przeciętny Intel Core Ultra 7 155H (1462 - 1824, n=52) | |
| HWBOT x265 Benchmark v2.2 / 4k Preset | |
| Lenovo ThinkPad Z13 Gen 2 | |
| Przeciętny Intel Core Ultra 7 155H (9.93 - 21.2, n=50) | |
| Dell XPS 13 9340 Core Ultra 7 | |
| Dell XPS 13 Plus 9320 Core i7-1360P | |
| Średnia w klasie Subnotebook (0.97 - 25.1, n=70, ostatnie 2 lata) | |
| HP Dragonfly G4 | |
| Asus ZenBook S13 OLED UX5304 | |
| LibreOffice / 20 Documents To PDF | |
| Średnia w klasie Subnotebook (38.5 - 220, n=68, ostatnie 2 lata) | |
| Przeciętny Intel Core Ultra 7 155H (37.5 - 79.2, n=49) | |
| Lenovo ThinkPad Z13 Gen 2 | |
| Dell XPS 13 9340 Core Ultra 7 | |
| Asus ZenBook S13 OLED UX5304 | |
| Dell XPS 13 Plus 9320 Core i7-1360P | |
| HP Dragonfly G4 | |
| R Benchmark 2.5 / Overall mean | |
| Średnia w klasie Subnotebook (0.403 - 1.456, n=70, ostatnie 2 lata) | |
| Dell XPS 13 9340 Core Ultra 7 | |
| Przeciętny Intel Core Ultra 7 155H (0.4457 - 0.53, n=49) | |
| Lenovo ThinkPad Z13 Gen 2 | |
| Asus ZenBook S13 OLED UX5304 | |
| Dell XPS 13 Plus 9320 Core i7-1360P | |
| HP Dragonfly G4 | |
* ... im mniej tym lepiej
AIDA64: FP32 Ray-Trace | FPU Julia | CPU SHA3 | CPU Queen | FPU SinJulia | FPU Mandel | CPU AES | CPU ZLib | FP64 Ray-Trace | CPU PhotoWorxx
| Performance Rating | |
| Lenovo ThinkPad Z13 Gen 2 | |
| Przeciętny Intel Core Ultra 7 155H | |
| Dell XPS 13 9340 Core Ultra 7 | |
| Średnia w klasie Subnotebook | |
| Dell XPS 13 Plus 9320 Core i7-1360P | |
| HP Dragonfly G4 | |
| Asus ZenBook S13 OLED UX5304 | |
| AIDA64 / FP32 Ray-Trace | |
| Lenovo ThinkPad Z13 Gen 2 | |
| Przeciętny Intel Core Ultra 7 155H (6670 - 18470, n=50) | |
| Średnia w klasie Subnotebook (1135 - 32888, n=70, ostatnie 2 lata) | |
| Dell XPS 13 9340 Core Ultra 7 | |
| Dell XPS 13 Plus 9320 Core i7-1360P | |
| HP Dragonfly G4 | |
| Asus ZenBook S13 OLED UX5304 | |
| AIDA64 / FPU Julia | |
| Lenovo ThinkPad Z13 Gen 2 | |
| Przeciętny Intel Core Ultra 7 155H (40905 - 93181, n=50) | |
| Dell XPS 13 9340 Core Ultra 7 | |
| Średnia w klasie Subnotebook (5218 - 123315, n=70, ostatnie 2 lata) | |
| Dell XPS 13 Plus 9320 Core i7-1360P | |
| HP Dragonfly G4 | |
| Asus ZenBook S13 OLED UX5304 | |
| AIDA64 / CPU SHA3 | |
| Lenovo ThinkPad Z13 Gen 2 | |
| Przeciętny Intel Core Ultra 7 155H (1940 - 4436, n=50) | |
| Dell XPS 13 9340 Core Ultra 7 | |
| Średnia w klasie Subnotebook (444 - 5287, n=70, ostatnie 2 lata) | |
| Dell XPS 13 Plus 9320 Core i7-1360P | |
| HP Dragonfly G4 | |
| Asus ZenBook S13 OLED UX5304 | |
| AIDA64 / CPU Queen | |
| Lenovo ThinkPad Z13 Gen 2 | |
| Dell XPS 13 Plus 9320 Core i7-1360P | |
| Przeciętny Intel Core Ultra 7 155H (64698 - 94181, n=50) | |
| Dell XPS 13 9340 Core Ultra 7 | |
| Średnia w klasie Subnotebook (10579 - 115682, n=70, ostatnie 2 lata) | |
| HP Dragonfly G4 | |
| Asus ZenBook S13 OLED UX5304 | |
| AIDA64 / FPU SinJulia | |
| Lenovo ThinkPad Z13 Gen 2 | |
| Przeciętny Intel Core Ultra 7 155H (5639 - 10647, n=50) | |
| Dell XPS 13 9340 Core Ultra 7 | |
| Średnia w klasie Subnotebook (744 - 18418, n=70, ostatnie 2 lata) | |
| Dell XPS 13 Plus 9320 Core i7-1360P | |
| HP Dragonfly G4 | |
| Asus ZenBook S13 OLED UX5304 | |
| AIDA64 / FPU Mandel | |
| Lenovo ThinkPad Z13 Gen 2 | |
| Przeciętny Intel Core Ultra 7 155H (18236 - 47685, n=50) | |
| Dell XPS 13 9340 Core Ultra 7 | |
| Średnia w klasie Subnotebook (3341 - 65433, n=70, ostatnie 2 lata) | |
| Dell XPS 13 Plus 9320 Core i7-1360P | |
| HP Dragonfly G4 | |
| Asus ZenBook S13 OLED UX5304 | |
| AIDA64 / CPU AES | |
| Przeciętny Intel Core Ultra 7 155H (45713 - 152179, n=50) | |
| Lenovo ThinkPad Z13 Gen 2 | |
| Dell XPS 13 9340 Core Ultra 7 | |
| Średnia w klasie Subnotebook (638 - 161430, n=70, ostatnie 2 lata) | |
| Dell XPS 13 Plus 9320 Core i7-1360P | |
| HP Dragonfly G4 | |
| Asus ZenBook S13 OLED UX5304 | |
| AIDA64 / CPU ZLib | |
| Przeciętny Intel Core Ultra 7 155H (557 - 1250, n=50) | |
| Lenovo ThinkPad Z13 Gen 2 | |
| Dell XPS 13 9340 Core Ultra 7 | |
| Dell XPS 13 Plus 9320 Core i7-1360P | |
| Średnia w klasie Subnotebook (164.9 - 1379, n=70, ostatnie 2 lata) | |
| HP Dragonfly G4 | |
| Asus ZenBook S13 OLED UX5304 | |
| AIDA64 / FP64 Ray-Trace | |
| Lenovo ThinkPad Z13 Gen 2 | |
| Przeciętny Intel Core Ultra 7 155H (3569 - 9802, n=50) | |
| Średnia w klasie Subnotebook (610 - 17495, n=70, ostatnie 2 lata) | |
| Dell XPS 13 9340 Core Ultra 7 | |
| Dell XPS 13 Plus 9320 Core i7-1360P | |
| HP Dragonfly G4 | |
| Asus ZenBook S13 OLED UX5304 | |
| AIDA64 / CPU PhotoWorxx | |
| Dell XPS 13 9340 Core Ultra 7 | |
| Dell XPS 13 Plus 9320 Core i7-1360P | |
| Przeciętny Intel Core Ultra 7 155H (32719 - 54223, n=50) | |
| Średnia w klasie Subnotebook (6569 - 64588, n=70, ostatnie 2 lata) | |
| Asus ZenBook S13 OLED UX5304 | |
| Lenovo ThinkPad Z13 Gen 2 | |
| HP Dragonfly G4 | |
Wydajność systemu
XPS 13 jest responsywnym urządzeniem w codziennym użytkowaniu, a jego wyniki benchmarków również były w porządku. Podczas naszych testów nie wykryliśmy żadnych problemów ze stabilnością.
CrossMark: Overall | Productivity | Creativity | Responsiveness
WebXPRT 3: Overall
WebXPRT 4: Overall
Mozilla Kraken 1.1: Total
| PCMark 10 / Score | |
| Lenovo ThinkPad Z13 Gen 2 | |
| Przeciętny Intel Core Ultra 7 155H, Intel Arc 8-Core iGPU (4809 - 7529, n=34) | |
| Dell XPS 13 9340 Core Ultra 7 | |
| Średnia w klasie Subnotebook (4993 - 7788, n=59, ostatnie 2 lata) | |
| Dell XPS 13 Plus 9320 Core i7-1360P | |
| HP Dragonfly G4 | |
| Asus ZenBook S13 OLED UX5304 | |
| PCMark 10 / Essentials | |
| Dell XPS 13 Plus 9320 Core i7-1360P | |
| Lenovo ThinkPad Z13 Gen 2 | |
| HP Dragonfly G4 | |
| Dell XPS 13 9340 Core Ultra 7 | |
| Asus ZenBook S13 OLED UX5304 | |
| Średnia w klasie Subnotebook (9363 - 11331, n=59, ostatnie 2 lata) | |
| Przeciętny Intel Core Ultra 7 155H, Intel Arc 8-Core iGPU (7605 - 11289, n=34) | |
| PCMark 10 / Productivity | |
| Lenovo ThinkPad Z13 Gen 2 | |
| Przeciętny Intel Core Ultra 7 155H, Intel Arc 8-Core iGPU (6042 - 10591, n=34) | |
| Średnia w klasie Subnotebook (5435 - 10623, n=59, ostatnie 2 lata) | |
| Dell XPS 13 9340 Core Ultra 7 | |
| Dell XPS 13 Plus 9320 Core i7-1360P | |
| HP Dragonfly G4 | |
| Asus ZenBook S13 OLED UX5304 | |
| PCMark 10 / Digital Content Creation | |
| Przeciętny Intel Core Ultra 7 155H, Intel Arc 8-Core iGPU (4985 - 10709, n=34) | |
| Lenovo ThinkPad Z13 Gen 2 | |
| Średnia w klasie Subnotebook (5305 - 12442, n=59, ostatnie 2 lata) | |
| Dell XPS 13 9340 Core Ultra 7 | |
| Dell XPS 13 Plus 9320 Core i7-1360P | |
| HP Dragonfly G4 | |
| Asus ZenBook S13 OLED UX5304 | |
| CrossMark / Overall | |
| Apple MacBook Air 13 M3 10C GPU | |
| Dell XPS 13 Plus 9320 Core i7-1360P | |
| Dell XPS 13 9340 Core Ultra 7 | |
| Przeciętny Intel Core Ultra 7 155H, Intel Arc 8-Core iGPU (1366 - 1903, n=34) | |
| HP Dragonfly G4 | |
| Asus ZenBook S13 OLED UX5304 | |
| Średnia w klasie Subnotebook (365 - 2018, n=68, ostatnie 2 lata) | |
| Lenovo ThinkPad Z13 Gen 2 | |
| CrossMark / Productivity | |
| Apple MacBook Air 13 M3 10C GPU | |
| Dell XPS 13 Plus 9320 Core i7-1360P | |
| HP Dragonfly G4 | |
| Dell XPS 13 9340 Core Ultra 7 | |
| Przeciętny Intel Core Ultra 7 155H, Intel Arc 8-Core iGPU (1291 - 1798, n=33) | |
| Asus ZenBook S13 OLED UX5304 | |
| Średnia w klasie Subnotebook (364 - 1875, n=68, ostatnie 2 lata) | |
| Lenovo ThinkPad Z13 Gen 2 | |
| CrossMark / Creativity | |
| Apple MacBook Air 13 M3 10C GPU | |
| Dell XPS 13 Plus 9320 Core i7-1360P | |
| Dell XPS 13 9340 Core Ultra 7 | |
| Lenovo ThinkPad Z13 Gen 2 | |
| Przeciętny Intel Core Ultra 7 155H, Intel Arc 8-Core iGPU (1519 - 1929, n=33) | |
| Średnia w klasie Subnotebook (372 - 2396, n=68, ostatnie 2 lata) | |
| HP Dragonfly G4 | |
| Asus ZenBook S13 OLED UX5304 | |
| CrossMark / Responsiveness | |
| Dell XPS 13 Plus 9320 Core i7-1360P | |
| Przeciętny Intel Core Ultra 7 155H, Intel Arc 8-Core iGPU (939 - 1802, n=33) | |
| Dell XPS 13 9340 Core Ultra 7 | |
| Asus ZenBook S13 OLED UX5304 | |
| HP Dragonfly G4 | |
| Apple MacBook Air 13 M3 10C GPU | |
| Średnia w klasie Subnotebook (312 - 1899, n=68, ostatnie 2 lata) | |
| Lenovo ThinkPad Z13 Gen 2 | |
| WebXPRT 3 / Overall | |
| Apple MacBook Air 13 M3 10C GPU | |
| Dell XPS 13 Plus 9320 Core i7-1360P | |
| Średnia w klasie Subnotebook (156 - 479, n=67, ostatnie 2 lata) | |
| HP Dragonfly G4 | |
| Lenovo ThinkPad Z13 Gen 2 | |
| Asus ZenBook S13 OLED UX5304 | |
| Przeciętny Intel Core Ultra 7 155H, Intel Arc 8-Core iGPU (252 - 299, n=34) | |
| Dell XPS 13 9340 Core Ultra 7 | |
| WebXPRT 4 / Overall | |
| Apple MacBook Air 13 M3 10C GPU | |
| Dell XPS 13 Plus 9320 Core i7-1360P | |
| HP Dragonfly G4 | |
| Średnia w klasie Subnotebook (132 - 348, n=68, ostatnie 2 lata) | |
| Dell XPS 13 9340 Core Ultra 7 | |
| Asus ZenBook S13 OLED UX5304 | |
| Przeciętny Intel Core Ultra 7 155H, Intel Arc 8-Core iGPU (166.4 - 309, n=29) | |
| Lenovo ThinkPad Z13 Gen 2 | |
| Mozilla Kraken 1.1 / Total | |
| Lenovo ThinkPad Z13 Gen 2 | |
| Przeciętny Intel Core Ultra 7 155H, Intel Arc 8-Core iGPU (517 - 614, n=35) | |
| Dell XPS 13 9340 Core Ultra 7 | |
| Asus ZenBook S13 OLED UX5304 | |
| Średnia w klasie Subnotebook (278 - 1104, n=76, ostatnie 2 lata) | |
| Dell XPS 13 Plus 9320 Core i7-1360P | |
| HP Dragonfly G4 | |
| Apple MacBook Air 13 M3 10C GPU | |
* ... im mniej tym lepiej
| PCMark 10 Score | 6555 pkt. | |
Pomoc | ||
| AIDA64 / Memory Copy | |
| Dell XPS 13 9340 Core Ultra 7 | |
| Przeciętny Intel Core Ultra 7 155H (62397 - 96791, n=50) | |
| Średnia w klasie Subnotebook (14554 - 109035, n=70, ostatnie 2 lata) | |
| Dell XPS 13 Plus 9320 Core i7-1360P | |
| Lenovo ThinkPad Z13 Gen 2 | |
| Asus ZenBook S13 OLED UX5304 | |
| HP Dragonfly G4 | |
| AIDA64 / Memory Read | |
| Dell XPS 13 9340 Core Ultra 7 | |
| Przeciętny Intel Core Ultra 7 155H (60544 - 90647, n=50) | |
| Średnia w klasie Subnotebook (15948 - 122210, n=70, ostatnie 2 lata) | |
| Dell XPS 13 Plus 9320 Core i7-1360P | |
| Lenovo ThinkPad Z13 Gen 2 | |
| Asus ZenBook S13 OLED UX5304 | |
| HP Dragonfly G4 | |
| AIDA64 / Memory Write | |
| Lenovo ThinkPad Z13 Gen 2 | |
| Dell XPS 13 Plus 9320 Core i7-1360P | |
| Średnia w klasie Subnotebook (15709 - 117898, n=70, ostatnie 2 lata) | |
| Dell XPS 13 9340 Core Ultra 7 | |
| Przeciętny Intel Core Ultra 7 155H (58692 - 93451, n=50) | |
| Asus ZenBook S13 OLED UX5304 | |
| HP Dragonfly G4 | |
| AIDA64 / Memory Latency | |
| Przeciętny Intel Core Ultra 7 155H (116.2 - 233, n=50) | |
| Lenovo ThinkPad Z13 Gen 2 | |
| Dell XPS 13 9340 Core Ultra 7 | |
| Średnia w klasie Subnotebook (7.2 - 187.8, n=69, ostatnie 2 lata) | |
| Dell XPS 13 Plus 9320 Core i7-1360P | |
| HP Dragonfly G4 | |
| Asus ZenBook S13 OLED UX5304 | |
* ... im mniej tym lepiej
Opóźnienia DPC
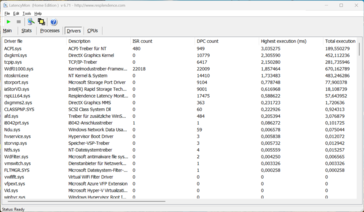
W naszym standardowym teście opóźnień (surfowanie po sieci, odtwarzanie filmów 4K na YouTube, obciążenie procesora), urządzenie testowe z aktualną wersją BIOS-u nie wykazało żadnych ograniczeń podczas korzystania z aplikacji audio w czasie rzeczywistym. Chociaż jeden sterownik wykazał odchylenie, ważna wartość "przerwania do opóźnienia procesu" była bardzo niska.
| DPC Latencies / LatencyMon - interrupt to process latency (max), Web, Youtube, Prime95 | |
| Dell XPS 13 Plus 9320 Core i7-1360P | |
| Lenovo ThinkPad Z13 Gen 2 | |
| Asus ZenBook S13 OLED UX5304 | |
| HP Dragonfly G4 | |
| Dell XPS 13 9340 Core Ultra 7 | |
* ... im mniej tym lepiej
Urządzenie pamięci masowej
Nasze urządzenie testowe zostało wyposażone w dysk SSD PCIe 4.0 Micron 2550 o pojemności 512 GB, z czego 371 GB jest nadal wolne do wykorzystania po pierwszym uruchomieniu. Jego prędkości transferu są w porządku, z maksymalną wartością ponad 4 GB/s i nie ma zauważalnego spadku wydajności nawet przy długotrwałym obciążeniu. Dalsze benchmarki dysków SSD znajdą Państwo tutaj.
* ... im mniej tym lepiej
Reading continuous performance: DiskSpd Read Loop, Queue Depth 8
Karta graficzna
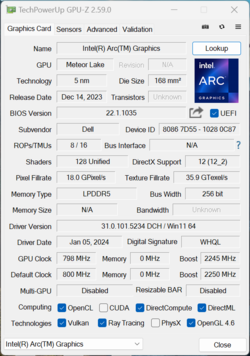
Obliczeniami graficznymi zajmuje się nowy układ Intel Arc Graphicsktóry jest szybszą wersją z 8 rdzeniami Xe w połączeniu z procesorem Core Ultra 7 155H. Wydajność GPU jest ogólnie znacznie wyższa niż starego Iris Xe Graphics G7i szybki układ AMD Radeon 780M można również pokonać w większości testów porównawczych. Z drugiej strony, podczas testów w grach, iGPU AMD generalnie wciąż było na czele; Intel musi jeszcze popracować nad swoimi sterownikami.
Zasadniczo jego wydajność w grach jest wystarczająco dobra dla wielu starszych gier o średnich i wysokich detalach, a także nie odnotowaliśmy żadnych spadków klatek - choć jego wydajność nie pozostała stabilna. Osiągając zaledwie 70%, nie przeszedł testu obciążeniowego Time Spy, a nasz test Witcher 3 test wykazał również znaczną utratę wydajności po kilku minutach. Wydajność GPU spada minimalnie w trybie bateryjnym (8%). Dalsze testy porównawcze GPU są dostępne tutaj.
| 3DMark 11 Performance | 9575 pkt. | |
| 3DMark Fire Strike Score | 6900 pkt. | |
| 3DMark Time Spy Score | 3106 pkt. | |
Pomoc | ||
* ... im mniej tym lepiej
| Performance Rating - Percent | |
| Lenovo ThinkPad Z13 Gen 2 -1! | |
| Średnia w klasie Subnotebook | |
| Dell XPS 13 9340 Core Ultra 7 | |
| Dell XPS 13 Plus 9320 Core i7-1360P | |
| HP Dragonfly G4 | |
| Asus ZenBook S13 OLED UX5304 | |
| The Witcher 3 - 1920x1080 Ultra Graphics & Postprocessing (HBAO+) | |
| Lenovo ThinkPad Z13 Gen 2 | |
| Średnia w klasie Subnotebook (8.5 - 43.7, n=50, ostatnie 2 lata) | |
| Dell XPS 13 9340 Core Ultra 7 | |
| Dell XPS 13 Plus 9320 Core i7-1360P | |
| HP Dragonfly G4 | |
| Asus ZenBook S13 OLED UX5304 | |
| GTA V - 1920x1080 Highest Settings possible AA:4xMSAA + FX AF:16x | |
| Średnia w klasie Subnotebook (7.81 - 53, n=67, ostatnie 2 lata) | |
| Dell XPS 13 9340 Core Ultra 7 | |
| Dell XPS 13 Plus 9320 Core i7-1360P | |
| HP Dragonfly G4 | |
| Asus ZenBook S13 OLED UX5304 | |
| Final Fantasy XV Benchmark - 1920x1080 High Quality | |
| Lenovo ThinkPad Z13 Gen 2 | |
| Dell XPS 13 9340 Core Ultra 7 | |
| Średnia w klasie Subnotebook (11.9 - 44.2, n=72, ostatnie 2 lata) | |
| Dell XPS 13 Plus 9320 Core i7-1360P | |
| HP Dragonfly G4 | |
| Asus ZenBook S13 OLED UX5304 | |
| Strange Brigade - 1920x1080 ultra AA:ultra AF:16 | |
| Lenovo ThinkPad Z13 Gen 2 | |
| Średnia w klasie Subnotebook (17.7 - 70.7, n=71, ostatnie 2 lata) | |
| Dell XPS 13 9340 Core Ultra 7 | |
| Dell XPS 13 Plus 9320 Core i7-1360P | |
| HP Dragonfly G4 | |
| Asus ZenBook S13 OLED UX5304 | |
| Dota 2 Reborn - 1920x1080 ultra (3/3) best looking | |
| Lenovo ThinkPad Z13 Gen 2 | |
| Dell XPS 13 9340 Core Ultra 7 | |
| Średnia w klasie Subnotebook (13 - 99.5, n=75, ostatnie 2 lata) | |
| Dell XPS 13 Plus 9320 Core i7-1360P | |
| HP Dragonfly G4 | |
| Asus ZenBook S13 OLED UX5304 | |
Witcher 3 FPS diagram
| low | med. | high | ultra | |
|---|---|---|---|---|
| GTA V (2015) | 157.8 | 129.8 | 32.8 | 14.7 |
| The Witcher 3 (2015) | 152 | 89 | 47 | 20.8 |
| Dota 2 Reborn (2015) | 106.2 | 89.8 | 72 | 65.2 |
| Final Fantasy XV Benchmark (2018) | 61.3 | 36.2 | 26.4 | |
| X-Plane 11.11 (2018) | 53 | 40.7 | 30.8 | |
| Far Cry 5 (2018) | 57 | 33 | 30 | 28 |
| Strange Brigade (2018) | 156 | 68 | 54 | 41 |
| F1 23 (2023) | 67.9 | 60.5 | 39.5 | 10.7 |
Emisje - często ciche w codziennym użytkowaniu
Emisja hałasu
Układ chłodzenia XPS 13 składa się z dwóch wentylatorów i rurki cieplnej. W trybie bezczynności i podczas wykonywania prostych zadań laptop generalnie pozostaje cichy lub bardzo cichy. Gdy tylko zażądamy więcej od procesora lub iGPU, chłodzenie szybko staje się słyszalne. Zmierzyliśmy między 37-42 dB(A), ale nie było żadnych wysokich dźwięków. Podsumowując, XPS 13 wypada w tym aspekcie podobnie do swojego poprzednika i jest jednym z głośniejszych modeli w polu porównawczym. Podczas korzystania z opcjonalnego trybu wydajności ultra, jego emisja hałasu wzrasta do 47 dB(A), a w trybie cichym odnotowaliśmy 32 dB(A). Z naszego urządzenia testowego nie wydobywały się żadne dodatkowe dźwięki elektroniczne.
Hałas
| luz |
| 25.1 / 25.1 / 25.1 dB |
| obciążenie |
| 37.4 / 42.5 dB |
 | ||
30 dB cichy 40 dB(A) słyszalny 50 dB(A) irytujący |
||
min: | ||
| Dell XPS 13 9340 Core Ultra 7 Arc 8-Core, Ultra 7 155H, Micron 2550 512GB | Apple MacBook Air 13 M3 10C GPU M3 10-Core GPU, M3, Apple SSD AP0512Z | Asus ZenBook S13 OLED UX5304 Iris Xe G7 96EUs, i7-1355U, Samsung PM9A1 MZVL21T0HCLR | Lenovo ThinkPad Z13 Gen 2 Radeon 780M, R7 PRO 7840U, SK hynix BC901 HFS001TEJ4X164N | HP Dragonfly G4 Iris Xe G7 96EUs, i7-1365U, Micron 3400 MTFDKBA512TFH 512GB | Dell XPS 13 Plus 9320 Core i7-1360P Iris Xe G7 96EUs, i7-1360P, Samsung PM9A1 MZVL2512HCJQ | |
|---|---|---|---|---|---|---|
| Noise | 6% | -1% | 11% | 3% | ||
| wyłączone / środowisko * | 25.1 | 23.3 7% | 25.1 -0% | 23.3 7% | 23.7 6% | |
| Idle Minimum * | 25.1 | 23.3 7% | 25.8 -3% | 23.5 6% | 24 4% | |
| Idle Average * | 25.1 | 23.3 7% | 25.8 -3% | 23.5 6% | 24 4% | |
| Idle Maximum * | 25.1 | 23.3 7% | 28.3 -13% | 26.8 -7% | 24.4 3% | |
| Load Average * | 37.4 | 37.7 -1% | 28.3 24% | 27.2 27% | 37 1% | |
| Witcher 3 ultra * | 42.5 | 40.1 6% | 44.8 -5% | 32.7 23% | 42.1 1% | |
| Load Maximum * | 42.5 | 40.1 6% | 44.8 -5% | 35 18% | 42 1% |
* ... im mniej tym lepiej
Temperatura
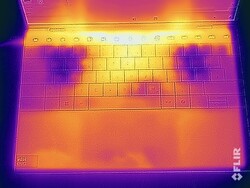
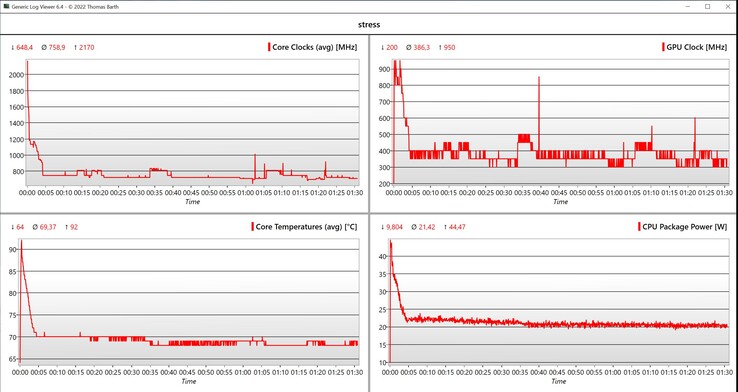
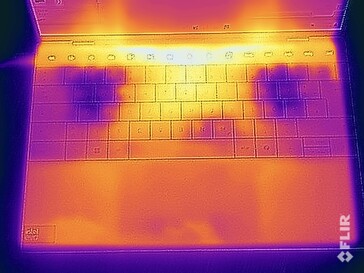
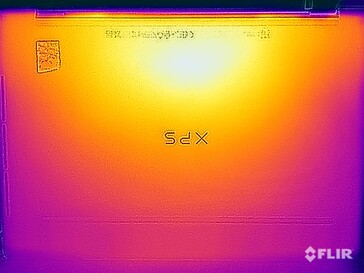
Powierzchnie XPS 13 pozostają bardzo chłodne w trybie bezczynności i podczas prostych zadań, i nie odnotowaliśmy żadnych problemów. Podczas grania lub pod dużym obciążeniem, spód laptopa w szczególności staje się zauważalnie ciepły przy około 110 °F (44 °C). Nie ma jednak żadnych ograniczeń podczas korzystania z urządzenia i nie trzeba się też martwić o klawiaturę. Jedynie pasek dotykowy robi się bardzo ciepły w środkowej części. Podczas testu obciążeniowego procesor na krótko zużył do 45 watów, a następnie szybko spadł do około 24 watów. Następnie XPS pozostawał w tym zakresie przez pewien czas, zanim wartość ostatecznie ustabilizowała się na poziomie około 21 watów.
(±) Maksymalna temperatura w górnej części wynosi 41 °C / 106 F, w porównaniu do średniej 35.9 °C / 97 F , począwszy od 21.4 do 59 °C dla klasy Subnotebook.
(±) Dno nagrzewa się maksymalnie do 43.5 °C / 110 F, w porównaniu do średniej 39.3 °C / 103 F
(+) W stanie bezczynności średnia temperatura górnej części wynosi 24.6 °C / 76 F, w porównaniu ze średnią temperaturą urządzenia wynoszącą 30.8 °C / ### class_avg_f### F.
(±) Podczas gry w Wiedźmina 3 średnia temperatura górnej części wynosi 33.3 °C / 92 F, w porównaniu do średniej temperatury urządzenia wynoszącej 30.8 °C / ## #class_avg_f### F.
(+) Podparcia dłoni i touchpad osiągają maksymalną temperaturę skóry (32.5 °C / 90.5 F) i dlatego nie są gorące.
(-) Średnia temperatura obszaru podparcia dłoni w podobnych urządzeniach wynosiła 28.2 °C / 82.8 F (-4.3 °C / -7.7 F).
| Dell XPS 13 9340 Core Ultra 7 Intel Core Ultra 7 155H, Intel Arc 8-Core iGPU | Apple MacBook Air 13 M3 10C GPU Apple M3, Apple M3 10-Core GPU | Asus ZenBook S13 OLED UX5304 Intel Core i7-1355U, Intel Iris Xe Graphics G7 96EUs | Lenovo ThinkPad Z13 Gen 2 AMD Ryzen 7 PRO 7840U, AMD Radeon 780M | HP Dragonfly G4 Intel Core i7-1365U, Intel Iris Xe Graphics G7 96EUs | Dell XPS 13 Plus 9320 Core i7-1360P Intel Core i7-1360P, Intel Iris Xe Graphics G7 96EUs | |
|---|---|---|---|---|---|---|
| Heat | 4% | -6% | -2% | -3% | -1% | |
| Maximum Upper Side * | 41 | 44.3 -8% | 43.1 -5% | 46.2 -13% | 38.6 6% | 43.8 -7% |
| Maximum Bottom * | 43.5 | 43.4 -0% | 45 -3% | 48.4 -11% | 40.4 7% | 44.4 -2% |
| Idle Upper Side * | 25.3 | 22.3 12% | 27.3 -8% | 23.2 8% | 28.2 -11% | 24 5% |
| Idle Bottom * | 25.5 | 22.1 13% | 27.8 -9% | 23 10% | 29 -14% | 25.2 1% |
* ... im mniej tym lepiej
Głośniki
XPS wyposażony jest w system dźwiękowy z czterema głośnikami, a jego ogólna wydajność jest całkiem dobra, a moduły tylko trochę brakuje, jeśli chodzi o basy. Mimo to głośniki są zwykle wystarczające do słuchania muzyki w tle lub strumieniowania z Netflix.
Dell XPS 13 9340 Core Ultra 7 analiza dźwięku
(+) | głośniki mogą odtwarzać stosunkowo głośno (83.2 dB)
Bas 100 - 315 Hz
(-) | prawie brak basu - średnio 17% niższa od mediany
(±) | liniowość basu jest średnia (9.3% delta do poprzedniej częstotliwości)
Średnie 400 - 2000 Hz
(+) | zbalansowane środki średnie - tylko 2.1% od mediany
(+) | średnie są liniowe (4.7% delta do poprzedniej częstotliwości)
Wysokie 2–16 kHz
(+) | zrównoważone maksima - tylko 2.5% od mediany
(+) | wzloty są liniowe (4.6% delta do poprzedniej częstotliwości)
Ogólnie 100 - 16.000 Hz
(+) | ogólny dźwięk jest liniowy (11.6% różnicy w stosunku do mediany)
W porównaniu do tej samej klasy
» 12% wszystkich testowanych urządzeń w tej klasie było lepszych, 3% podobnych, 85% gorszych
» Najlepszy miał deltę 5%, średnia wynosiła ###średnia###%, najgorsza wynosiła 53%
W porównaniu do wszystkich testowanych urządzeń
» 7% wszystkich testowanych urządzeń było lepszych, 2% podobnych, 91% gorszych
» Najlepszy miał deltę 4%, średnia wynosiła ###średnia###%, najgorsza wynosiła 134%
Apple MacBook Air 13 M3 10C GPU analiza dźwięku
(+) | głośniki mogą odtwarzać stosunkowo głośno (83.2 dB)
Bas 100 - 315 Hz
(±) | zredukowany bas - średnio 13.3% niższy od mediany
(±) | liniowość basu jest średnia (11.3% delta do poprzedniej częstotliwości)
Średnie 400 - 2000 Hz
(+) | zbalansowane środki średnie - tylko 0.4% od mediany
(+) | średnie są liniowe (1.6% delta do poprzedniej częstotliwości)
Wysokie 2–16 kHz
(+) | zrównoważone maksima - tylko 4.5% od mediany
(+) | wzloty są liniowe (1.9% delta do poprzedniej częstotliwości)
Ogólnie 100 - 16.000 Hz
(+) | ogólny dźwięk jest liniowy (10.7% różnicy w stosunku do mediany)
W porównaniu do tej samej klasy
» 8% wszystkich testowanych urządzeń w tej klasie było lepszych, 3% podobnych, 89% gorszych
» Najlepszy miał deltę 5%, średnia wynosiła ###średnia###%, najgorsza wynosiła 53%
W porównaniu do wszystkich testowanych urządzeń
» 5% wszystkich testowanych urządzeń było lepszych, 1% podobnych, 94% gorszych
» Najlepszy miał deltę 4%, średnia wynosiła ###średnia###%, najgorsza wynosiła 134%
Zarządzanie energią - długi czas pracy przy 60 Hz
Zużycie energii
Przy maksymalnym zużyciu energii w stanie spoczynku wynoszącym mniej niż 8 watów, nowy XPS 13 jest bardzo oszczędny. Zmierzyliśmy maksymalnie 62,7 W, ale jest to limit 60-watowego zasilacza. Zużycie laptopa może ponownie spaść po krótkim czasie, ale bateria musi w międzyczasie nadrobić tę różnicę. W trakcie testu zużycie energii ustabilizowało się na poziomie około 37 watów.
| wyłączony / stan wstrzymania | |
| luz | |
| obciążenie |
|
Legenda:
min: | |
| Dell XPS 13 9340 Core Ultra 7 Ultra 7 155H, Arc 8-Core, Micron 2550 512GB, IPS, 1920x1200, 13.4" | Apple MacBook Air 13 M3 10C GPU M3, M3 10-Core GPU, Apple SSD AP0512Z, IPS, 2560x1664, 13.6" | Asus ZenBook S13 OLED UX5304 i7-1355U, Iris Xe G7 96EUs, Samsung PM9A1 MZVL21T0HCLR, OLED, 2880x1800, 13.3" | Lenovo ThinkPad Z13 Gen 2 R7 PRO 7840U, Radeon 780M, SK hynix BC901 HFS001TEJ4X164N, OLED, 2880x1800, 13.3" | HP Dragonfly G4 i7-1365U, Iris Xe G7 96EUs, Micron 3400 MTFDKBA512TFH 512GB, IPS, 1920x1280, 13.5" | Dell XPS 13 Plus 9320 Core i7-1360P i7-1360P, Iris Xe G7 96EUs, Samsung PM9A1 MZVL2512HCJQ, OLED, 3456x2160, 13.4" | Przeciętny Intel Arc 8-Core iGPU | Średnia w klasie Subnotebook | |
|---|---|---|---|---|---|---|---|---|
| Power Consumption | 18% | -5% | -18% | 0% | -31% | -33% | -8% | |
| Idle Minimum * | 3.8 | 1.95 49% | 5.8 -53% | 5.8 -53% | 4.1 -8% | 6.9 -82% | 5.34 ? -41% | 4.3 ? -13% |
| Idle Average * | 7 | 8.7 -24% | 8.5 -21% | 6.2 11% | 7.5 -7% | 7.4 -6% | 8.54 ? -22% | 7.33 ? -5% |
| Idle Maximum * | 7.3 | 8.9 -22% | 8.8 -21% | 12.7 -74% | 8.2 -12% | 13.6 -86% | 11.9 ? -63% | 9.07 ? -24% |
| Load Average * | 52.6 | 34.3 35% | 35.1 33% | 27.2 48% | 35.5 33% | 43.5 17% | 54 ? -3% | 45.2 ? 14% |
| Witcher 3 ultra * | 38.3 | 28.6 25% | 27.6 28% | 54.1 -41% | 37.5 2% | 48 -25% | ||
| Load Maximum * | 62.7 | 35.4 44% | 59.5 5% | 61.4 2% | 66.5 -6% | 63.3 -1% | 84.9 ? -35% | 69 ? -10% |
* ... im mniej tym lepiej
Power consumption Witcher 3 / stress test
Power consumption with external monitor
Czas trwania
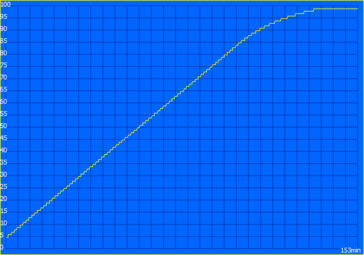
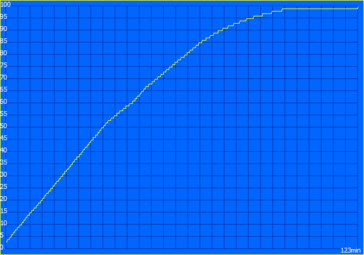
Bateria urządzenia o pojemności 55 Wh zapewnia dobry czas pracy. W naszym teście WLAN przy 150 cd/m² (odpowiada to 51% maksymalnej jasności naszego urządzenia testowego), zmierzyliśmy bardzo dobry czas pracy wynoszący prawie 13 godzin przy 60 Hz (nieco poniżej 11 godzin przy 120 Hz), co oznacza, że XPS 13 mógł zostać pobity tylko przez MacBooka Air 13 M3 i HP Dragonfly G4. Stary XPS 13 z panelem OLED o wysokiej rozdzielczości osiągnął nieco ponad 7 godzin. Przy maksymalnej jasności test WLAN nadal trwał prawie 9 godzin (60 Hz), a wyższa częstotliwość odświeżania prawie nie wpłynęła na wyniki (tylko 10 minut mniej przy 120 Hz). Podczas testu wideo przy 150 cd/m², nowy procesor Meteor Lake z konstrukcją kafelkową po raz kolejny dał się zauważyć, ponieważ dwa wydajne rdzenie na płytce SoC wykonały tutaj całą pracę. Rezultatem jest znakomite 17,5 godziny, które nawet nieznacznie pokonało MacBooka Air 13. W najgorszym przypadku laptop może zgasnąć po nieco ponad 2 godzinach.
| Dell XPS 13 9340 Core Ultra 7 Ultra 7 155H, Arc 8-Core, 55 Wh | Apple MacBook Air 13 M3 10C GPU M3, M3 10-Core GPU, 52.6 Wh | Asus ZenBook S13 OLED UX5304 i7-1355U, Iris Xe G7 96EUs, 63 Wh | Lenovo ThinkPad Z13 Gen 2 R7 PRO 7840U, Radeon 780M, 51.5 Wh | HP Dragonfly G4 i7-1365U, Iris Xe G7 96EUs, 68 Wh | Dell XPS 13 Plus 9320 Core i7-1360P i7-1360P, Iris Xe G7 96EUs, 55 Wh | Średnia w klasie Subnotebook | |
|---|---|---|---|---|---|---|---|
| Czasy pracy | 16% | -7% | -39% | 36% | -43% | -6% | |
| H.264 | 1053 | 1044 -1% | 829 -21% | 961 ? -9% | |||
| WiFi v1.3 | 769 | 914 19% | 678 -12% | 469 -39% | 954 24% | 436 -43% | 757 ? -2% |
| Load | 131 | 171 31% | 146 11% | 192 47% | 121.3 ? -7% |
Za
Przeciw
Werdykt - XPS 13 pozostaje kompaktowym towarzyszem, ale podstawowy wyświetlacz i pasek dotykowy są rozczarowujące
Nowy XPS 13 wykorzystuje starą konstrukcję XPS 13 Plus, taką samą jak ta, której Dell używa teraz również w większych XPS 14 i XPS 16. Zwłaszcza w porównaniu do potężnego XPS 14, 13-calowy model wydaje się bardzo kompaktowy, a dzięki wąskim ramkom jest również jednym z najcieńszych urządzeń w polu porównawczym. Pod względem jakości nie mamy prawie na co narzekać, jednak przy wadze 1,2 kg nie jest on szczególnie lekki. Kolejnym plusem jest świetna żywotność baterii - przynajmniej w połączeniu z podstawowym wyświetlaczem.
W tym miejscu sytuacja staje się nieco trudniejsza dla XPS 13, ponieważ podstawowy panel wcale nie jest tak imponujący. Choć obraz na matowym panelu IPS wygląda dobrze, a jego częstotliwość odświeżania 120 Hz pomaga w ruchu, panel urządzenia testowego wyraźnie nie osiągnął deklarowanej przez producenta jasności 500 cd/m² podczas naszego testu - plus, nie jest on zbyt dobrze skalibrowany (niebieski odcień w stanie dostarczonym). Wyższe wartości jasności byłyby pomocne zwłaszcza na zewnątrz. Sytuacja z łącznością jest równie trudna, ponieważ ma tylko 2x USB-C. Pamięci RAM nie można rozszerzyć, ale można przynajmniej wybrać XPS z maksymalnie 64 GB pamięci RAM.
XPS 13 9340 imponuje kompaktowymi rozmiarami i długim czasem pracy - przynajmniej w połączeniu z podstawowym wyświetlaczem. Problemem są jednak skromne opcje łączności, a także irytujący pasek dotykowy z klawiszami funkcyjnymi.
Urządzenia wejściowe laptopa są nieco bardziej problematyczne. Bezramkowy touchpad działa dobrze w praktyce, ale klawiatura jest większym problemem. Ze względu na brak odstępów między klawiszami, nie można ich dobrze wyczuć, co prowadzi do wielu przypadkowych literówek. Szkoda, bo poza tym klawiatura jest całkiem wygodna do pisania. Co więcej, intensywności podświetlenia nie można regulować, a czujnik aktywuje je przy najmniejszych zmianach oświetlenia - niezależnie od tego, czy tego chcemy, czy nie. Z kolei o touchbarze urządzenia nie możemy powiedzieć nic pozytywnego, gdyż jest on po prostu irytujący w codziennym użytkowaniu. Nie można go używać na ślepo, nie można stwierdzić, który klawisz jest który przy wyłączonym podświetleniu (często prowadzi to do przypadkowego naciśnięcia niewłaściwego klawisza), a klawisze funkcyjne pozostawały stale podświetlone podczas odtwarzania filmów podczas naszego testu, co jest bardzo irytujące.
Wydajność CPU nowego procesora Meteor Lake jest lepsza niż jego poprzednika tylko w krótkich seriach. Jego wydajność graficzna również wykazuje poprawę, jednak nie pozostaje stabilna - na przykład podczas grania. Mimo to jego wydajność jest oczywiście całkowicie wystarczająca do codziennych zadań. W porównaniu do swoich konkurentów, nowy XPS 13 nie ma jednak łatwo. Jednym z jego głównych konkurentów jest MacBook Air który nadal imponuje pasywnym chłodzeniem i większą liczbą portów. ThinkPad ThinkPad Z13 z procesorem AMD oferuje wyższą i bardziej stabilną wydajność. Ponadto testujemy obecnie nowego ThinkBooka 13x G4, kolejnego konkurenta XPS 13, który może pochwalić się wyświetlaczem IPS o wysokiej rozdzielczości.
Cena i dostępność
Nowy XPS 13 9340 można nabyć bezpośrednio za pośrednictwem strony internetowej Dell. Ceny zaczynają się od 1149 USD za wariant podstawowy.
Dell XPS 13 9340 Core Ultra 7
- 14/05/2024 v7 (old)
Andreas Osthoff
Przezroczystość
Wyboru urządzeń do recenzji dokonuje nasza redakcja. Próbka testowa została udostępniona autorowi jako pożyczka od producenta lub sprzedawcy detalicznego na potrzeby tej recenzji. Pożyczkodawca nie miał wpływu na tę recenzję, producent nie otrzymał też kopii tej recenzji przed publikacją. Nie było obowiązku publikowania tej recenzji. Nigdy nie przyjmujemy rekompensaty ani płatności w zamian za nasze recenzje. Jako niezależna firma medialna, Notebookcheck nie podlega władzy producentów, sprzedawców detalicznych ani wydawców.
Tak testuje Notebookcheck
Każdego roku Notebookcheck niezależnie sprawdza setki laptopów i smartfonów, stosując standardowe procedury, aby zapewnić porównywalność wszystkich wyników. Od około 20 lat stale rozwijamy nasze metody badawcze, ustanawiając przy tym standardy branżowe. W naszych laboratoriach testowych doświadczeni technicy i redaktorzy korzystają z wysokiej jakości sprzętu pomiarowego. Testy te obejmują wieloetapowy proces walidacji. Nasz kompleksowy system ocen opiera się na setkach uzasadnionych pomiarów i benchmarków, co pozwala zachować obiektywizm.


