Notebookcheck Logo
Teaser

Recenzja laptopa Gigabyte G5 KF5 2024: RTX 4060 w okazyjnej cenie - czy oferta jest tego warta?

Mega okazja?

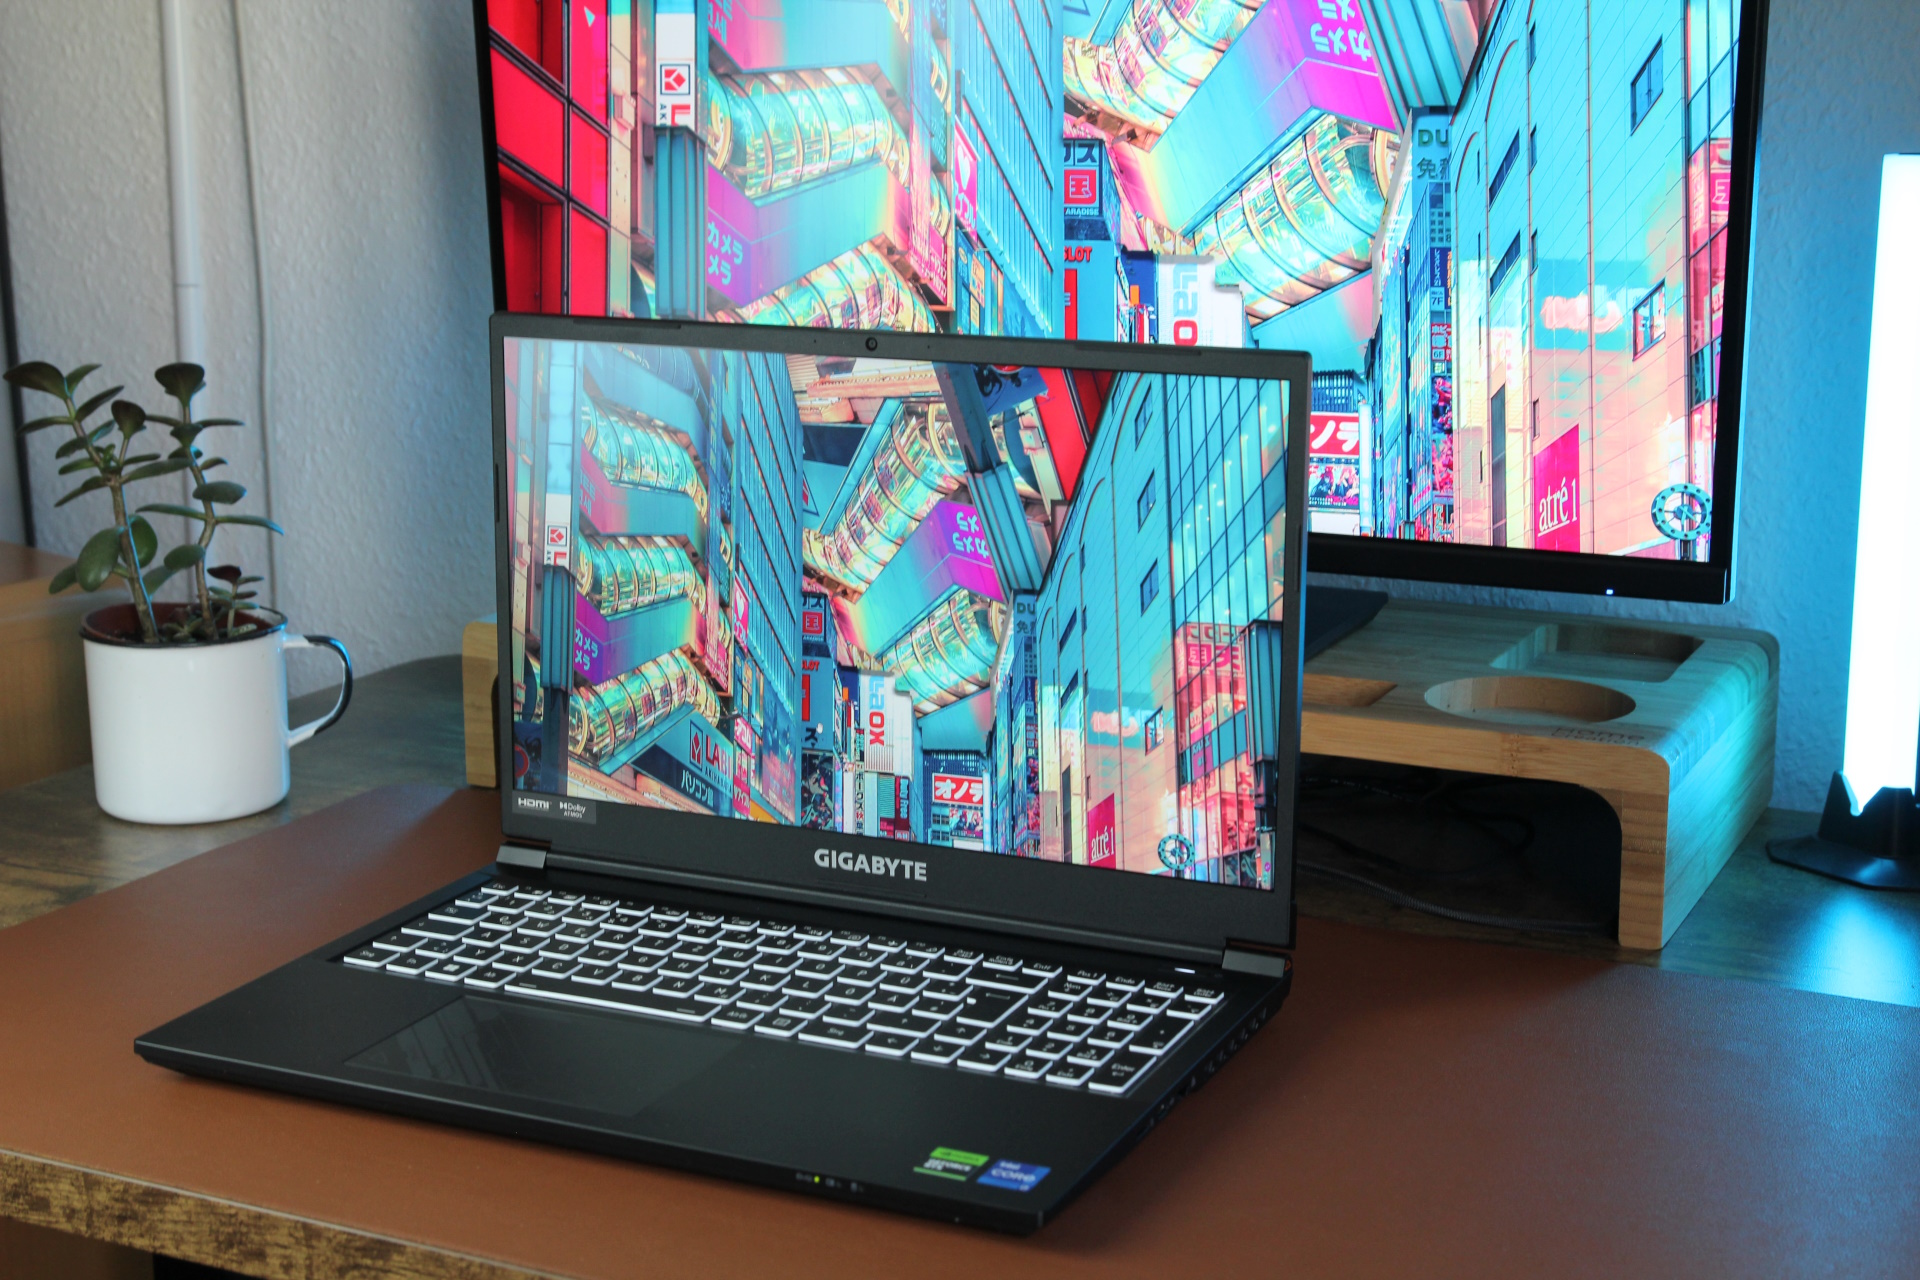
Procesor Intel Core i7-13620H, karta graficzna RTX 4060, a do tego 16 GB pamięci RAM i dysk SSD o pojemności 1 TB - wszystko to za 899 euro. W tej chwili nie można dostać gracza RTX 4060 znacznie taniej. Sprawdzamy, czy najnowszy G5 jest wart swojej ceny i kandyduje do naszej listy najlepszych laptopów do gier.
Christian Hintze, 👁 Christian Hintze (tłumaczenie DeepL / Ninh Duy) Published 🇺🇸 🇩🇪 ...
Alder Lake Deal Gaming Geforce GPU Laptop / Notebook Nvidia Raptor Lake

Werdykt - Układ chłodzenia jako problematyczny obszar

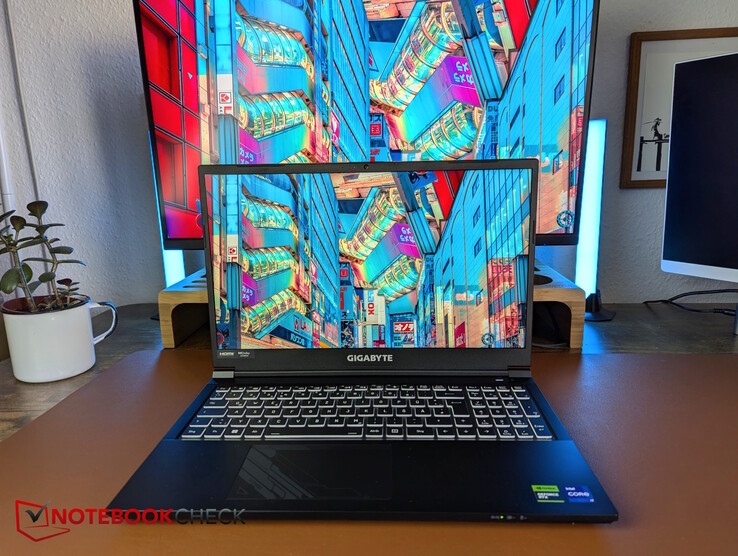
Laptop z RTX 4060 za jedyne 899 euro ma swój urok i można zaakceptować kamerkę internetową 720p, brak portu Thunderbolt, a może nawet nieco wyższy poziom hałasu. G5 robi też kilka rzeczy zaskakująco dobrze: subtelny design jest przyjemny, klawiatura jest więcej niż solidna, raczej przeciętny wyświetlacz świeci z wysoką dokładnością kolorów, a wydajność procesora jest nieco powyżej średniej.

To, co jednak nie jest w porządku, to system chłodzenia: jeśli procesor stale osiąga 100 °C podczas grania, niekoniecznie sprzyja to trwałości sprzętu. Nic dziwnego, że laptop jest też dość głośny. Być może jest to wada naszego modelu testowego, ale poprzednik również borykał się z problemami temperaturowymi. Nie rozumiemy, dlaczego Gigabyte nie naprawił tego słabego punktu pomiędzy dwoma generacjami laptopów. Jeśli producent odkryje usterkę w naszym modelu, zaktualizujemy test.

Za

+ niska cena
+ 2 gniazda na dyski SSD M.2
+ dobra klawiatura
+ skalibrowany wyświetlacz jest bardzo wierny kolorom (sRGB)
+ dobra wydajność procesora

Przeciw

- brak Thunderbolt
- kamera internetowa 720p
- brak przełącznika MUX
- Procesor nagrzewa się zbyt mocno podczas grania
- Dławienie dysku SSD
- wysokie opóźnienia
- wydajność grafiki nieco poniżej średniej
- przeciążony system chłodzenia
- stosunkowo głośny

Cena i dostępność

Niektóre jednostki SKU Gigabyte G5 KF5 2024 są dostępne w różnych sklepach internetowych, w tym Amazon.

Bestpreis 939€ hardwarecamp24
GIGABYTE G5 KF5-H3DE554KD, Core i7-13620H, 16GB RAM, 1TB SSD, GeForce RTX 4060, DE

Price comparison

Potencjalni konkurenci w porównaniu

Image
Model / Review
Geizhals
Weight
Height
Display
1.
76.3%
Gigabyte G5 KF5 2024
Intel Core i7-13620H ⎘
NVIDIA GeForce RTX 4060 Laptop GPU ⎘
16 GB Pamięć, 1024 GB SSD
Bestpreis 939€ hardwarecamp24
2 kg22.7 mm15.60"
1920x1080
141 PPI
IPS
2.
79%
Lenovo LOQ 15IRX9
Lenovo LOQ 15IRX9
Intel Core i5-13450HX ⎘
NVIDIA GeForce RTX 4060 Laptop GPU ⎘
16 GB Pamięć, 1024 GB SSD
Bestpreis 995€ computeruniverse.net
2. 995€ Cyberport.de
3. 999€ hardwarecamp24
2.4 kg23.9 mm15.60"
1920x1080
141 PPI
IPS
3.
80.3%
Asus TUF Gaming A15 FA507UV
AMD Ryzen 9 8945H ⎘
NVIDIA GeForce RTX 4060 Laptop GPU ⎘
16 GB Pamięć, 1024 GB SSD
Bestpreis 1268.26€ TechnikLaden
2. 1268.28€ 1ashop.at
3. 1268.28€ haym.infotec
2.1 kg22.4 mm15.60"
1920x1080
141 PPI
IPS
4.
82.3%
Lenovo Legion Pro 5 16IRX9 G9
Intel Core i7-14700HX ⎘
NVIDIA GeForce RTX 4060 Laptop GPU ⎘
32 GB Pamięć, 1024 GB SSD
Bestpreis 1568.98€ Jacob Elektronik direkt
2. 1569€ PC-KING
3. 1582.16€ Jacob Elektronik direkt (AT)
2.5 kg26.55 mm16.00"
2560x1600
189 PPI
IPS
5.
83.4%
Dell Inspiron 16 Plus 7640
Intel Core Ultra 7 155H ⎘
NVIDIA GeForce RTX 4060 Laptop GPU ⎘
16 GB Pamięć, 1024 GB SSD
Listenpreis 1300 USD
Geizhals Suche
2.2 kg19.9 mm16.00"
2560x1600
189 PPI
IPS

Seria G5 to przystępne cenowo wejście Gigabyte na rynek laptopów do gier. W porównaniu do poprzednika z procesorem Intel Gen12 Alder Lake, model 2024 otrzymał aktualizację do Intel Gen13 Raptor Lake, a mianowicie Core i7-13620H i układ RTX 4060 pozostaje oczywiście, podobnie jak 16 GB pamięci RAM, podczas gdy pojemność dysku SSD została podwojona do 1 TB. Za jedyne 899 euro jest jeszcze tańszy niż jego poprzednik, co czyni go jedną z najniższych cen w historii w tym segmencie wydajności. Sprawdzamy, czy obecny G5 KF5 jest interesujący dla tych, którzy chcą zaoszczędzić pieniądze, czy też tnie zbyt wiele zakrętów.

Oprócz poprzednika, porównujemy również system z innymi budżetowymi laptopami do gier, takimi jak LOQ 15i Asus TUF Gaming A15 (2024) ale także z droższymi urządzeniami ze względu na brak alternatyw Lenovo Legion Pro 5 16IRX9 G9 i Dell Inspiron 16 Plus 7640.

Specyfikacja - Core i7-13620H i RTX 4060 za mniej niż 900 euro

G5 KF5 (G5 Rodzina)
Procesor
Intel Core i7-13620H 10 x 1.8 - 4.9 GHz, Raptor Lake-H
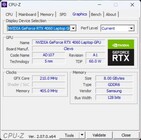
Karta grafiki
NVIDIA GeForce RTX 4060 Laptop GPU - 8 GB VRAM, 75 W TDP, Geforce 565.90, Optimus
Pamięć
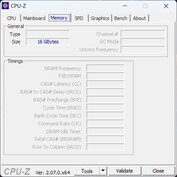
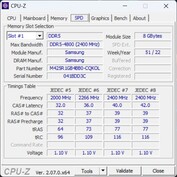
16 GB 
, 2x 8 GB Samsung DDR5-4800
Matryca
15.60 cali 16:9, 1920 x 1080 pikseli 141 PPI, Sharp SHP153F (LQ156M1JW30), IPS, refleksująca: nie, HDR, 360 Hz
Chipset
Intel Alder Lake-P PCH
Dysk twardy
Gigabyte AG450E1024-SI, 1024 GB 
, 876 GB wolne miejsce
Karta dźwiękowa
Intel Raptor Lake-P/U/H PCH - cAVS
Złącza
1 USB 2.0, 1 USB 3.0, 2 USB 3.1 Gen2, 1 HDMI, 1 DisplayPort, 1 blokada Kensingtona, gniazda audio: Headset + Microphone, czytnik kart: MicroSD Reader
Łączność
Realtek Semiconductor RTL8168/8111 PCI-E Gigabit Ethernet NIC (10/100/1000MBit/s), Intel Wi-Fi 6E AX211 (a/b/g/h/n = Wi-Fi 4/ac = Wi-Fi 5/ax = Wi-Fi 6/ Wi-Fi 6E 6 GHz), Bluetooth Bluetooth 5.2
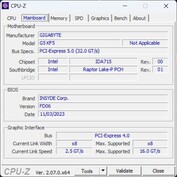
Gabaryty
wysokość x szerokość x głębokość (mm): 22.7 x 360 x 238
Akumulator
54 Wh litowo-jonowy
System operacyjny
Microsoft Windows 11 Home
Camera
kamerka: 720p IR Webcam
Primary Camera: 0.9 MPix
Inne
klawiatura: Chiclet 1 Zone RGB, podświetlanie klawiatury: tak, 24 miesiące(y) gwarancji
Waga
2.018 kg, zasilacz: 478 g
Cena
899 Euro
Note: The manufacturer may use components from different suppliers including display panels, drives or memory sticks with similar specifications.


Obudowa i funkcje: Plastikowa obudowa w kolorze Iron Gray

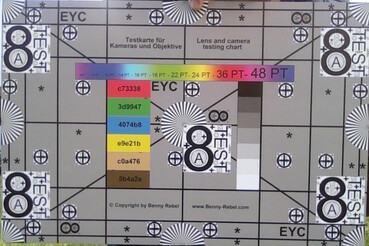
Zewnętrznie, praktycznie nic nie zmieniło się w stosunku do poprzednika, ponieważ skopiowano również plastikowy design Clevo ("Iron Gray") z Gigabyte G5 KE (wtedy jeszcze z RTX 3060). Co ciekawe, dawna obsługa Thunderbolt 4 lewego portu USB-C została usunięta. Oszczędności poczyniono również na kamerce internetowej, która ma tylko rozdzielczość 720p i jest dość rozmyta; ma również duże odchylenia kolorów.

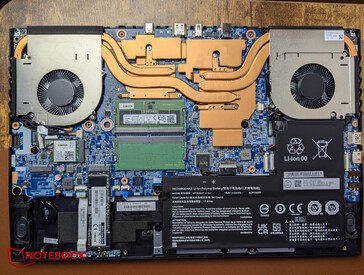
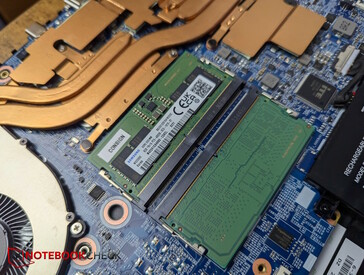
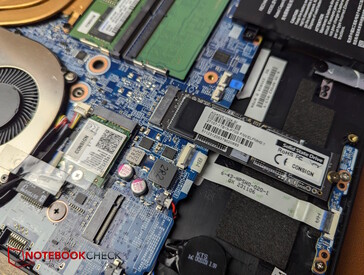
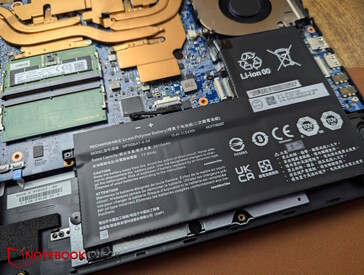
W celu konserwacji należy odkręcić 13 śrub krzyżakowych, z których dwie są pokryte naklejką plombującą, co może unieważnić gwarancję, jeśli nie zostanie wykonane prawidłowo. Wewnątrz mamy dostęp do dwóch gniazd M.2 SSD, wyjmowanego modułu WiFi, baterii, dwóch gniazd RAM i układu chłodzenia.

Bez płyty bazowej
Bez płyty bazowej
DDR5 RAM
DDR5 RAM
Dwa gniazda M.2 SSD oraz moduł WiFi
Bateria
Bateria

Podstawa trzeszczy i lekko trzeszczy, gdy próbuje się ją przekręcić. Pokrywa kołysze się tylko nieznacznie podczas regulacji i otwiera się maksymalnie do 140 stopni.

Porównanie rozmiarów

363.4 mm 261.75 mm 26.55 mm 2.5 kg359.86 mm 258.7 mm 23.9 mm 2.4 kg360 mm 238 mm 22.7 mm 2 kg360 mm 238 mm 22.7 mm 1.9 kg356.78 mm 250.6 mm 19.9 mm 2.2 kg354 mm 251 mm 22.4 mm 2.1 kg297 mm 210 mm 1 mm 5.7 g
Po lewej: Kensington, USB-A 3.0, USB-A 2.0, gniazdo mikrofonu, gniazdo słuchawek
Prawo: Czytnik microSD, USB-C 3.2 Gen2, LAN (1 GbE)
Tył: USB-C 3.2 Gen2, HDMI 2.1, MiniDP 1.4, zasilanie
SD Card Reader
average JPG Copy Test (av. of 3 runs)
Average of class Gaming
  (19 - 202, n=87, last 2 years)
95.9 MB/s +36%
Gigabyte G5 KF5 2024
Intel Core i7-13620H
70.6 (55.19min - 75.59max) MB/s
Gigabyte G5 KF
Intel Core i5-12500H
69.8 (63.44min - 75.35max) MB/s -1%
Dell Inspiron 16 Plus 7640
Intel Core Ultra 7 155H (Angelbird AV Pro V60)
22.2 MB/s -69%
maximum AS SSD Seq Read Test (1GB)
Average of class Gaming
  (25.8 - 269, n=88, last 2 years)
120 MB/s +32%
Gigabyte G5 KF5 2024
Intel Core i7-13620H
90.74 MB/s
Gigabyte G5 KF
Intel Core i5-12500H
89.47 MB/s -1%
Dell Inspiron 16 Plus 7640
Intel Core Ultra 7 155H (Angelbird AV Pro V60)
28.7 MB/s -68%
Networking
iperf3 transmit AXE11000
Lenovo Legion Pro 5 16IRX9 G9
Intel Wi-Fi 6E AX211
1549 (752min - 1707max) MBit/s +8%
Gigabyte G5 KF5 2024
Intel Wi-Fi 6E AX211
1432 (1380min - 1467max) MBit/s
Gigabyte G5 KF
Intel Wi-Fi 6E AX211
1347 (1198min - 1410max) MBit/s -6%
Average Intel Wi-Fi 6E AX211
  (64 - 1921, n=242)
1231 MBit/s -14%
Average of class Gaming
  (469 - 1843, n=148, last 2 years)
1230 MBit/s -14%
Lenovo LOQ 15IRX9
Realtek RTL8852BE
830 (747min - 873max) MBit/s -42%
Dell Inspiron 16 Plus 7640
Intel Wi-Fi 6E AX211
811 (428min - 1008max) MBit/s -43%
Asus TUF Gaming A15 FA507UV
Realtek RTL8852BE
806 (513min - 843max) MBit/s -44%
iperf3 receive AXE11000
Gigabyte G5 KF5 2024
Intel Wi-Fi 6E AX211
1650 (1563min - 1691max) MBit/s
Gigabyte G5 KF
Intel Wi-Fi 6E AX211
1631 (1392min - 1669max) MBit/s -1%
Lenovo Legion Pro 5 16IRX9 G9
Intel Wi-Fi 6E AX211
1477 (1386min - 1517max) MBit/s -10%
Average of class Gaming
  (680 - 1890, n=148, last 2 years)
1392 MBit/s -16%
Average Intel Wi-Fi 6E AX211
  (582 - 1890, n=242)
1382 MBit/s -16%
Dell Inspiron 16 Plus 7640
Intel Wi-Fi 6E AX211
1000 (899min - 1078max) MBit/s -39%
Lenovo LOQ 15IRX9
Realtek RTL8852BE
975 (950min - 986max) MBit/s -41%
Asus TUF Gaming A15 FA507UV
Realtek RTL8852BE
956 (936min - 974max) MBit/s -42%
iperf3 transmit AXE11000 6GHz
Gigabyte G5 KF
Intel Wi-Fi 6E AX211
1594 (1547min - 1650max) MBit/s +2%
Lenovo Legion Pro 5 16IRX9 G9
Intel Wi-Fi 6E AX211
1585 (1369min - 1655max) MBit/s +1%
Gigabyte G5 KF5 2024
Intel Wi-Fi 6E AX211
1566 (780min - 1615max) MBit/s
Average of class Gaming
  (648 - 1878, n=68, last 2 years)
1429 MBit/s -9%
Average Intel Wi-Fi 6E AX211
  (385 - 1851, n=214)
1368 MBit/s -13%
Dell Inspiron 16 Plus 7640
Intel Wi-Fi 6E AX211
705 (634min - 769max) MBit/s -55%
iperf3 receive AXE11000 6GHz
Gigabyte G5 KF
Intel Wi-Fi 6E AX211
1654 (1581min - 1671max) MBit/s +4%
Gigabyte G5 KF5 2024
Intel Wi-Fi 6E AX211
1585 (1568min - 1606max) MBit/s
Lenovo Legion Pro 5 16IRX9 G9
Intel Wi-Fi 6E AX211
1540 (774min - 1556max) MBit/s -3%
Average Intel Wi-Fi 6E AX211
  (700 - 1857, n=213)
1493 MBit/s -6%
Average of class Gaming
  (853 - 1788, n=68, last 2 years)
1488 MBit/s -6%
Dell Inspiron 16 Plus 7640
Intel Wi-Fi 6E AX211
700 (607min - 805max) MBit/s -56%
05010015020025030035040045050055060065070075080085090095010001050110011501200125013001350140014501500155016001650Tooltip
Gigabyte G5 KF5 2024 Intel Wi-Fi 6E AX211; iperf3 transmit AXE11000 6GHz; iperf 3.1.3: Ø1540 (780-1615)
Gigabyte G5 KF5 2024 Intel Wi-Fi 6E AX211; iperf3 receive AXE11000 6GHz; iperf 3.1.3: Ø1584 (1568-1606)
Gigabyte G5 KF5 2024 Intel Wi-Fi 6E AX211; iperf3 transmit AXE11000; iperf 3.1.3: Ø1432 (1380-1467)
Lenovo LOQ 15IRX9 Realtek RTL8852BE; iperf3 transmit AXE11000; iperf 3.1.3: Ø830 (747-873)
Asus TUF Gaming A15 FA507UV Realtek RTL8852BE; iperf3 transmit AXE11000; iperf 3.1.3: Ø806 (513-843)
Gigabyte G5 KF5 2024 Intel Wi-Fi 6E AX211; iperf3 receive AXE11000; iperf 3.1.3: Ø1649 (1563-1691)
Lenovo LOQ 15IRX9 Realtek RTL8852BE; iperf3 receive AXE11000; iperf 3.1.3: Ø974 (950-986)
Asus TUF Gaming A15 FA507UV Realtek RTL8852BE; iperf3 receive AXE11000; iperf 3.1.3: Ø956 (936-974)
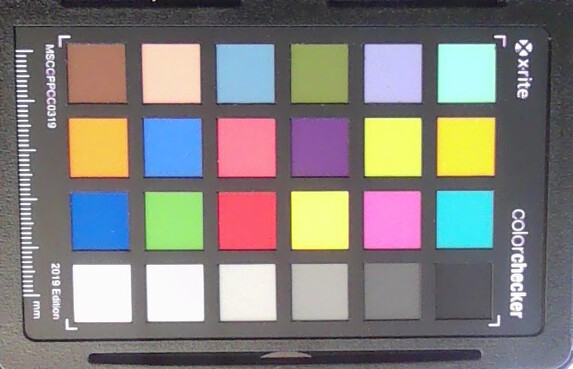
ColorChecker
19.3 ∆E
18.5 ∆E
23.1 ∆E
23.1 ∆E
20.4 ∆E
18 ∆E
23.3 ∆E
27.9 ∆E
17.2 ∆E
14 ∆E
17.4 ∆E
25.2 ∆E
26.2 ∆E
24.5 ∆E
20.6 ∆E
15.6 ∆E
19.3 ∆E
29.3 ∆E
1.8 ∆E
10.7 ∆E
20.7 ∆E
22.4 ∆E
21.5 ∆E
12.8 ∆E
ColorChecker Gigabyte G5 KF5 2024: 19.7 ∆E min: 1.76 - max: 29.31 ∆E

Zrównoważony rozwój

Chociaż Gigabyte dostarcza G5 w kartonowym pudełku, laptop do gier i zasilacz są nadal zapakowane w plastikowe torby i chronione przed wstrząsami materiałami Styrodur. Materiały pochodzące z recyklingu najwyraźniej nie są wykorzystywane, a producent nie podaje żadnych informacji na temat emisji CO2 podczas produkcji G5.

Urządzenia wejściowe - G5 z dobrymi urządzeniami wejściowymi

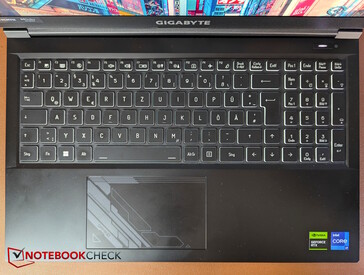
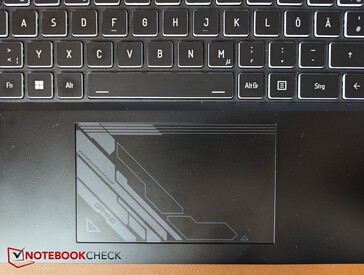
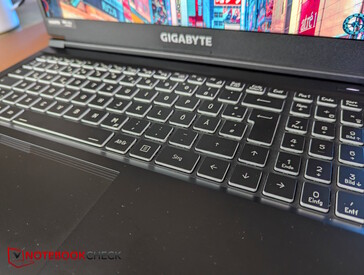
Układ i oznaczenia są nieco inne niż w G5 KE, ale podążają za bezpośrednim poprzednikiem G5 KF z większym klawiszem Enter i cieńszymi, wyraźniejszymi oznaczeniami. Układ jest przejrzysty, a napisy czytelne nawet bez podświetlenia. Jednostrefowe podświetlenie klawiatury można skonfigurować w kolorach, a jasność można regulować na czterech poziomach. Punkt nacisku jest przyjemny przy średnim skoku, a sprzężenie zwrotne jest dobre. Pisanie jest szybkie przy umiarkowanej emisji hałasu.

Touchpad ma wymiary ok. 12 x 7,2 cm i oferuje przyzwoite właściwości ślizgowe, które tylko nieznacznie słabną przy bardzo powolnych ruchach. Odgłosy klikania zintegrowanych przycisków myszy są umiarkowane.

Klawiatura
Klawiatura
Panel dotykowy
Panel dotykowy
Przyciski bez podświetlenia
Podświetlenie
Podświetlenie

Wyświetlacz - Gigabyte z ostrym wyświetlaczem FHD

Brak poważnego krwawienia podświetlenia
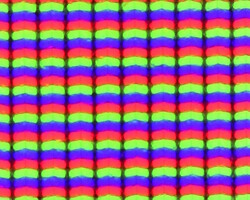
Struktura subpikseli

Gigabyte zmienił wyświetlacz w G5. Ostatnie modele G5 korzystały z panelu Chi-Mei, ale nasza próbka testowa ma teraz matowy ekran Full HD IPS firmy Sharp z maksymalną częstotliwością odświeżania 144 Hz.

Średnio ekran świeci z jasnością nieco ponad 300 nitów, co w dzisiejszych czasach mieści się w dolnym zakresie. Równomierność podświetlenia wynosi 87 procent.

Poziom czerni i kontrast są przeciętne. Panel nie przełącza pikseli zbyt szybko, ale nie jest też szczególnie powolny. Krwawienie podświetlenia nie jest problemem, podobnie jak PWM.

Subiektywnie podsumowując, mamy do czynienia z przyzwoitym wyświetlaczem w swojej cenie, który z pewnością nie należy do najlepszych w swojej klasie, ale niezawodnie spełnia swoje zadanie. Aby uzyskać wyższą rozdzielczość, jaśniejsze kolory i kontrast, a także inne technologie paneli (OLED, MiniLED), trzeba będzie głębiej sięgnąć do kieszeni.

297
cd/m²
306
cd/m²
302
cd/m²
307
cd/m²
342
cd/m²
317
cd/m²
299
cd/m²
299
cd/m²
299
cd/m²
podświetlenie ekranu
Sharp SHP153F (LQ156M1JW30) tested with X-Rite i1Pro 3
maksimum: 342 cd/m² (Nits) średnia: 307.6 cd/m² Minimum: 18.8 cd/m²
rozświetlenie: 87 %
na akumulatorze: 342 cd/m²
kontrast: 1179:1 (czerń: 0.29 cd/m²)
ΔE Color 2.46 | 0.5-29.43 Ø4.91, calibrated: 0.82
ΔE Greyscale 3.03 | 0.5-98 Ø5.2
68.8% AdobeRGB 1998 (Argyll 2.2.0 3D)
98.9% sRGB (Argyll 2.2.0 3D)
67.9% Display P3 (Argyll 2.2.0 3D)
Gamma: 2.51
Gigabyte G5 KF5 2024
Sharp SHP153F (LQ156M1JW30), IPS, 1920x1080, 15.6", 360 Hz
Gigabyte G5 KF
Chi Mei N156HRA-EA1, IPS, 1920x1080, 15.6", 144 Hz
Lenovo LOQ 15IRX9
BOE NJ NE156FHM-NX9, IPS, 1920x1080, 15.6", 144 Hz
Asus TUF Gaming A15 FA507UV
AU Optronics B156HAN15.H, IPS, 1920x1080, 15.6", 144 Hz
Lenovo Legion Pro 5 16IRX9 G9
BOE NE160QDM-NZB, IPS, 2560x1600, 16", 240 Hz
Dell Inspiron 16 Plus 7640
AU Optronics B160QAN, IPS, 2560x1600, 16", 120 Hz
Display
-35%
5%
3%
25%
8%
Display P3 Coverage
67.9
43.2
-36%
73.7
9%
70.5
4%
99.22
46%
76
12%
sRGB Coverage
98.9
64.3
-35%
99.1
0%
98.5
0%
99.93
1%
99.8
1%
AdobeRGB 1998 Coverage
68.8
44.7
-35%
72.6
6%
72.7
6%
87.81
28%
76.7
11%
Response Times
-58%
-191%
-152%
29%
-99%
Response Time Grey 50% / Grey 80% *
13 ?(6.6, 6.4)
25.1 ?(11.7, 13.4)
-93%
42.2 ?(19.1, 23.1)
-225%
31.7 ?(14.7, 17)
-144%
4.8 ?(2.2, 2.6)
63%
25.6 ?(12.3, 13.3)
-97%
Response Time Black / White *
8.8 ?(4.6, 4.2)
10.8 ?(9.9, 7.9)
-23%
22.6 ?(11.2, 11.4)
-157%
22.9 ?(11.7, 11.2)
-160%
9.2 ?(4.6, 4.6)
-5%
17.6 ?(8.5, 9.1)
-100%
PWM Frequency
Screen
-134%
-3%
-13%
-4%
8%
Brightness middle
342
297
-13%
306
-11%
315
-8%
518
51%
314.7
-8%
Brightness
308
275
-11%
287
-7%
303
-2%
491
59%
291
-6%
Brightness Distribution
87
85
-2%
88
1%
90
3%
90
3%
89
2%
Black Level *
0.29
0.34
-17%
0.21
28%
0.25
14%
0.36
-24%
0.28
3%
Contrast
1179
874
-26%
1457
24%
1260
7%
1439
22%
1124
-5%
Colorchecker dE 2000 *
2.46
6.23
-153%
2.25
9%
2.26
8%
4.32
-76%
1.62
34%
Colorchecker dE 2000 max. *
4.12
20.93
-408%
4.84
-17%
7.37
-79%
6.37
-55%
2.94
29%
Colorchecker dE 2000 calibrated *
0.82
4.74
-478%
1.45
-77%
1.03
-26%
0.75
9%
1.08
-32%
Greyscale dE 2000 *
3.03
5.92
-95%
2.4
21%
4
-32%
3.66
-21%
1.3
57%
Gamma
2.51 88%
2.49 88%
2.259 97%
2.116 104%
2.19 100%
2.26 97%
CCT
7056 92%
6279 104%
6790 96%
7570 86%
6841 95%
6385 102%
Total Average (Program / Settings)
-76% / -102%
-63% / -28%
-54% / -29%
17% / 7%
-28% / -7%

* ... im mniej tym lepiej

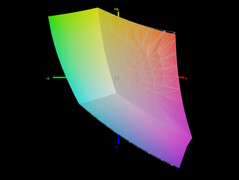
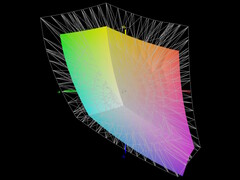
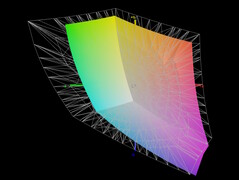
Biorąc pod uwagę zastosowany panel, z pewnością nie jest zaskakujące, że spośród zwykłych przestrzeni kolorów tylko sRGB jest prawie całkowicie pokryty.

sRGB
sRGB
Wyświetlacz P3
Wyświetlacz P3
AdobeRGB
AdobeRGB

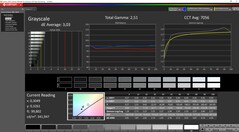
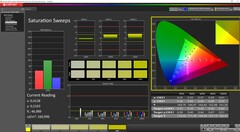
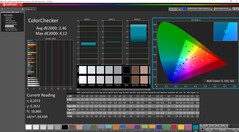
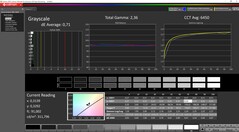
Kolory i skala szarości wyświetlacza są fabrycznie w porządku, ale wartości DeltaE można znacznie zmniejszyć za pomocą naszej ręcznej kalibracji za pomocą kolorymetru Xrite i oprogramowania Calman, dzięki czemu odchylenia w skali szarości spadają z 3,03 do zaledwie 0,71 i z 2,46 do zaledwie 0,82 w ColorChecker. Panel jest zatem dość dokładny kolorystycznie i nadaje się nawet do lekkich zadań edycji zdjęć i wideo, o ile przestrzeń kolorów sRGB jest wystarczająca.

Skala szarości
Skala szarości
Nasycenie
Nasycenie
ColorChecker
ColorChecker
Kalibracja skali szarości
Kalibracja nasycenia
ColorChecker skalibrowany

Display Response Times

Display response times show how fast the screen is able to change from one color to the next. Slow response times can lead to afterimages and can cause moving objects to appear blurry (ghosting). Gamers of fast-paced 3D titles should pay special attention to fast response times.
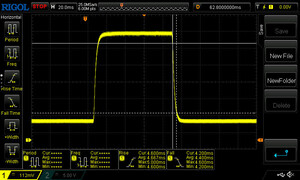
       Response Time Black to White
8.8 ms ... rise ↗ and fall ↘ combined↗ 4.6 ms rise
↘ 4.2 ms fall
The screen shows fast response rates in our tests and should be suited for gaming.
In comparison, all tested devices range from 0.1 (minimum) to 240 (maximum) ms. » 21 % of all devices are better.
This means that the measured response time is better than the average of all tested devices (20.9 ms).
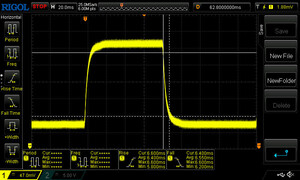
       Response Time 50% Grey to 80% Grey
13 ms ... rise ↗ and fall ↘ combined↗ 6.6 ms rise
↘ 6.4 ms fall
The screen shows good response rates in our tests, but may be too slow for competitive gamers.
In comparison, all tested devices range from 0.165 (minimum) to 636 (maximum) ms. » 23 % of all devices are better.
This means that the measured response time is better than the average of all tested devices (32.8 ms).

Screen Flickering / PWM (Pulse-Width Modulation)

To dim the screen, some notebooks will simply cycle the backlight on and off in rapid succession - a method called Pulse Width Modulation (PWM) . This cycling frequency should ideally be undetectable to the human eye. If said frequency is too low, users with sensitive eyes may experience strain or headaches or even notice the flickering altogether.
Screen flickering / PWM not detected

In comparison: 53 % of all tested devices do not use PWM to dim the display. If PWM was detected, an average of 8715 (minimum: 5 - maximum: 343500) Hz was measured.

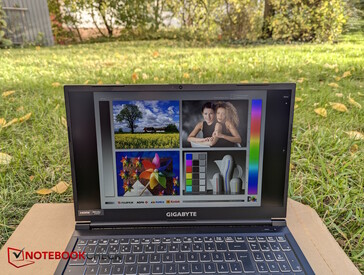
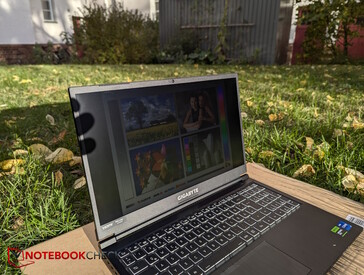
Na zewnątrz, 300 nitów nie jest idealne, ale użyteczne. Za wszelką cenę należy unikać światła słonecznego.

Na zewnątrz w cieniu
Na zewnątrz w bezpośrednim świetle słonecznym
Stabilne kąty widzenia IPS

Wydajność - najwyższa CPU, niższa GPU

Nasz G5 KF5 jest wyposażony w Intel Core i7-13620H i kartę RTX 4060 a także 16 GB pamięci RAM DDR5 i dysk SSD o pojemności 1 TB. G5 jest również dostępny jako model MF5, w którym to przypadku słabszy RTX 4050 co wydaje się być jedyną różnicą. Dzięki tej kombinacji sprzętowej G5 jest pozycjonowany jako budżetowy gracz i jest również w stanie poradzić sobie z niektórymi lekkimi zadaniami twórców.

Warunki testu

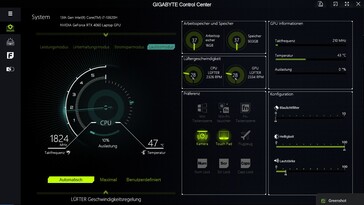
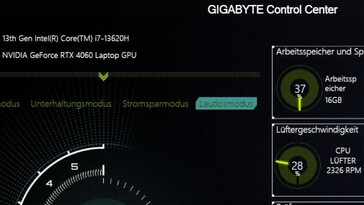
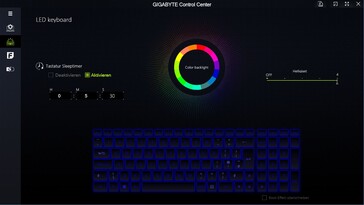
Gigabyte Control Center jest preinstalowany na G5. Oprogramowanie nie jest szczególnie rozbudowane (brak przełącznika MUX) i rzadko widzieliśmy tak rozpikselowane, nieatrakcyjne centrum sterowania. Przynajmniej znajdziemy cztery profile wydajności (cichy, oszczędzanie energii, rozrywka, wydajność) oprócz ustawień klawiatury. Wybraliśmy tryb wydajności do naszych testów porównawczych i użyliśmy trybu oszczędzania energii do testów baterii. Ponieważ nie jest wcale jasne, w jaki sposób tryby te oddziałują lub wpływają na tryby zasilania systemu Windows, ustawiliśmy również system Windows na tryb wydajności (lub tryb oszczędzania energii w testach baterii).

Centrum sterowania Gigabyte
Pikselowany wygląd nie jest zbyt ładny (w powiększeniu).
Makra klawiatury i podświetlenie
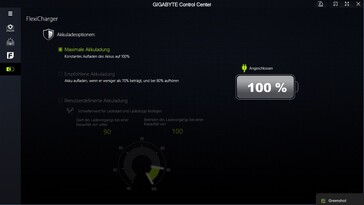
Ustawienia ładowania akumulatora

Procesor

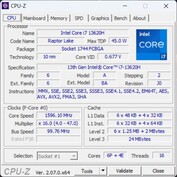
Procesor Intel Core i7-13620H to wysokiej klasy procesor do laptopów z 6 rdzeniami P i 4 rdzeniami E, łącznie 16 wątkami i częstotliwością taktowania od 1,8 (podstawowy zegar rdzeni E) do 4,9 GHz (jednordzeniowy rdzeń turbo P). Jednostka graficzna Intel Xe z tylko 64 z 96 EU jest zintegrowana.

W naszym teście wytrzymałości Cinebench R15, w pierwszych czterech przebiegach występuje tylko niewielki spadek punktów, po czym wydajność pozostaje na stałym poziomie. Ogólnie rzecz biorąc, procesor w G5 radzi sobie nieco lepiej niż przeciętny laptop z tym samym CPU z naszej bazy danych, a nawet pokonuje Core i5-13450HX w teście LOQ 15. W porównaniu do poprzednika, wydajność procesora wzrosła o 21 procent.

W trybie bateryjnym wydajność w Cinebench R15 spada o około 35 procent.

Cinebench R15/Tryb Wydajność Rozrywka Cicha praca Oszczędzanie energii Bateria
Wynik 2,396 2,296 840 768 1,555
TDP początkowo 93, z czasem spada do 65 W początkowo 85, później krótko 65, następnie 45 W początkowo 28, później 20, następnie 15 W 15 W 36 W

Cinebench R15 Multi loop

0210420630840105012601470168018902100231025202730294031503360357037803990Tooltip
Gigabyte G5 KF5 2024 Intel Core i7-13620H: Ø2161 (2113.38-2395.78)
Gigabyte G5 KF Intel Core i5-12500H: Ø1808 (1783.56-2001.16)
Lenovo LOQ 15IRX9 Intel Core i5-13450HX: Ø2170 (2104.93-2503.76)
Asus TUF Gaming A15 FA507UV AMD Ryzen 9 8945H: Ø2688 (2638-2777.2)
Lenovo Legion Pro 5 16IRX9 G9 Intel Core i7-14700HX: Ø3774 (3668.72-4136.93)
Dell Inspiron 16 Plus 7640 Intel Core Ultra 7 155H: Ø2341 (1793.16-2787.26)
CPU Performance Rating: Percent
Cinebench R23: Multi Core | Single Core
Cinebench R20: CPU (Multi Core) | CPU (Single Core)
Cinebench R15: CPU Multi 64Bit | CPU Single 64Bit
Blender: v2.79 BMW27 CPU
7-Zip 18.03: 7z b 4 | 7z b 4 -mmt1
Geekbench 6.3: Multi-Core | Single-Core
Geekbench 5.5: Multi-Core | Single-Core
HWBOT x265 Benchmark v2.2: 4k Preset
LibreOffice : 20 Documents To PDF
R Benchmark 2.5: Overall mean
CPU Performance Rating
Lenovo Legion Pro 5 16IRX9 G9
Intel Core i7-14700HX
86.7 pt
Average of class Gaming
 
73.7 pt
Asus TUF Gaming A15 FA507UV
AMD Ryzen 9 8945H
68.1 pt
Dell Inspiron 16 Plus 7640
Intel Core Ultra 7 155H
63.8 pt
Gigabyte G5 KF5 2024
Intel Core i7-13620H
61.6 pt
Average Intel Core i7-13620H
 
59.9 pt
Lenovo LOQ 15IRX9
Intel Core i5-13450HX
58.4 pt
Gigabyte G5 KF
Intel Core i5-12500H
51 pt
Cinebench R23 / Multi Core
Lenovo Legion Pro 5 16IRX9 G9
Intel Core i7-14700HX
28122 Points +91%
Average of class Gaming
  (5668 - 36249, n=190, last 2 years)
21953 Points +49%
Dell Inspiron 16 Plus 7640
Intel Core Ultra 7 155H
17675 (14726min - 17675max) Points +20%
Asus TUF Gaming A15 FA507UV
AMD Ryzen 9 8945H
17423 Points +19%
Lenovo LOQ 15IRX9
Intel Core i5-13450HX
16797 Points +14%
Gigabyte G5 KF5 2024
Intel Core i7-13620H
14686 Points
Average Intel Core i7-13620H
  (10819 - 15496, n=5)
14303 Points -3%
Gigabyte G5 KF
Intel Core i5-12500H
13471 Points -8%
Cinebench R23 / Single Core
Lenovo Legion Pro 5 16IRX9 G9
Intel Core i7-14700HX
2128 Points +14%
Average of class Gaming
  (1136 - 2235, n=189, last 2 years)
1893 Points +2%
Gigabyte G5 KF5 2024
Intel Core i7-13620H
1862 Points
Average Intel Core i7-13620H
  (1805 - 1871, n=5)
1843 Points -1%
Asus TUF Gaming A15 FA507UV
AMD Ryzen 9 8945H
1814 Points -3%
Dell Inspiron 16 Plus 7640
Intel Core Ultra 7 155H
1733 Points -7%
Lenovo LOQ 15IRX9
Intel Core i5-13450HX
1710 Points -8%
Gigabyte G5 KF
Intel Core i5-12500H
1690 Points -9%
Cinebench R20 / CPU (Multi Core)
Lenovo Legion Pro 5 16IRX9 G9
Intel Core i7-14700HX
10498 Points +89%
Average of class Gaming
  (2179 - 13832, n=187, last 2 years)
8336 Points +50%
Asus TUF Gaming A15 FA507UV
AMD Ryzen 9 8945H
6859 Points +23%
Dell Inspiron 16 Plus 7640
Intel Core Ultra 7 155H
6807 Points +22%
Lenovo LOQ 15IRX9
Intel Core i5-13450HX
6532 Points +18%
Gigabyte G5 KF5 2024
Intel Core i7-13620H
5558 Points
Average Intel Core i7-13620H
  (4214 - 5905, n=5)
5426 Points -2%
Gigabyte G5 KF
Intel Core i5-12500H
5115 Points -8%
Cinebench R20 / CPU (Single Core)
Lenovo Legion Pro 5 16IRX9 G9
Intel Core i7-14700HX
818 Points +17%
Average of class Gaming
  (439 - 856, n=187, last 2 years)
727 Points +4%
Average Intel Core i7-13620H
  (693 - 719, n=5)
704 Points +1%
Gigabyte G5 KF5 2024
Intel Core i7-13620H
697 Points
Asus TUF Gaming A15 FA507UV
AMD Ryzen 9 8945H
670 Points -4%
Dell Inspiron 16 Plus 7640
Intel Core Ultra 7 155H
666 Points -4%
Lenovo LOQ 15IRX9
Intel Core i5-13450HX
652 Points -6%
Gigabyte G5 KF
Intel Core i5-12500H
651 Points -7%
Cinebench R15 / CPU Multi 64Bit
Lenovo Legion Pro 5 16IRX9 G9
Intel Core i7-14700HX
4137 (3668.72min - 4136.93max) Points +73%
Average of class Gaming
  (905 - 5663, n=194, last 2 years)
3433 Points +43%
Dell Inspiron 16 Plus 7640
Intel Core Ultra 7 155H
2787 (1793.16min - 2787.26max) Points +16%
Asus TUF Gaming A15 FA507UV
AMD Ryzen 9 8945H
2777 Points +16%
Lenovo LOQ 15IRX9
Intel Core i5-13450HX
2503 Points +4%
Gigabyte G5 KF5 2024
Intel Core i7-13620H
2396 (2113.38min - 2395.78max) Points
Average Intel Core i7-13620H
  (1681 - 2492, n=5)
2239 Points -7%
Gigabyte G5 KF
Intel Core i5-12500H
2001 Points -16%
Cinebench R15 / CPU Single 64Bit
Lenovo Legion Pro 5 16IRX9 G9
Intel Core i7-14700HX
300 Points +12%
Asus TUF Gaming A15 FA507UV
AMD Ryzen 9 8945H
284 Points +6%
Average of class Gaming
  (191.9 - 318, n=191, last 2 years)
278 Points +3%
Gigabyte G5 KF5 2024
Intel Core i7-13620H
269 Points
Average Intel Core i7-13620H
  (258 - 269, n=5)
263 Points -2%
Dell Inspiron 16 Plus 7640
Intel Core Ultra 7 155H
255 Points -5%
Lenovo LOQ 15IRX9
Intel Core i5-13450HX
239 Points -11%
Gigabyte G5 KF
Intel Core i5-12500H
233 Points -13%
Blender / v2.79 BMW27 CPU
Gigabyte G5 KF
Intel Core i5-12500H
256 Seconds * -17%
Average Intel Core i7-13620H
  (215 - 289, n=5)
238 Seconds * -9%
Lenovo LOQ 15IRX9
Intel Core i5-13450HX
229 Seconds * -5%
Gigabyte G5 KF5 2024
Intel Core i7-13620H
218 Seconds *
Dell Inspiron 16 Plus 7640
Intel Core Ultra 7 155H
191 Seconds * +12%
Asus TUF Gaming A15 FA507UV
AMD Ryzen 9 8945H
182 Seconds * +17%
Average of class Gaming
  (87 - 555, n=182, last 2 years)
169.7 Seconds * +22%
Lenovo Legion Pro 5 16IRX9 G9
Intel Core i7-14700HX
126 Seconds * +42%
7-Zip 18.03 / 7z b 4
Lenovo Legion Pro 5 16IRX9 G9
Intel Core i7-14700HX
104730 MIPS +73%
Average of class Gaming
  (23795 - 140932, n=186, last 2 years)
85566 MIPS +41%
Asus TUF Gaming A15 FA507UV
AMD Ryzen 9 8945H
73222 MIPS +21%
Dell Inspiron 16 Plus 7640
Intel Core Ultra 7 155H
61730 MIPS +2%
Gigabyte G5 KF5 2024
Intel Core i7-13620H
60545 MIPS
Lenovo LOQ 15IRX9
Intel Core i5-13450HX
59026 MIPS -3%
Average Intel Core i7-13620H
  (45983 - 62324, n=5)
56733 MIPS -6%
Gigabyte G5 KF
Intel Core i5-12500H
49343 MIPS -19%
7-Zip 18.03 / 7z b 4 -mmt1
Lenovo Legion Pro 5 16IRX9 G9
Intel Core i7-14700HX
6979 MIPS +14%
Asus TUF Gaming A15 FA507UV
AMD Ryzen 9 8945H
6615 MIPS +9%
Average of class Gaming
  (4199 - 7581, n=186, last 2 years)
6318 MIPS +4%
Gigabyte G5 KF5 2024
Intel Core i7-13620H
6096 MIPS
Average Intel Core i7-13620H
  (5742 - 6326, n=5)
5994 MIPS -2%
Dell Inspiron 16 Plus 7640
Intel Core Ultra 7 155H
5461 MIPS -10%
Lenovo LOQ 15IRX9
Intel Core i5-13450HX
5370 MIPS -12%
Gigabyte G5 KF
Intel Core i5-12500H
5258 MIPS -14%
Geekbench 6.3 / Multi-Core
Lenovo Legion Pro 5 16IRX9 G9
Intel Core i7-14700HX
17562 Points +37%
Average of class Gaming
  (5340 - 19665, n=112, last 2 years)
14207 Points +11%
Dell Inspiron 16 Plus 7640
Intel Core Ultra 7 155H
13018 Points +2%
Gigabyte G5 KF5 2024
Intel Core i7-13620H
12779 Points
Lenovo LOQ 15IRX9
Intel Core i5-13450HX
12684 Points -1%
Asus TUF Gaming A15 FA507UV
AMD Ryzen 9 8945H
12662 Points -1%
Average Intel Core i7-13620H
  (9131 - 13077, n=4)
11886 Points -7%
Gigabyte G5 KF
Intel Core i5-12500H
8714 Points -32%
Geekbench 6.3 / Single-Core
Lenovo Legion Pro 5 16IRX9 G9
Intel Core i7-14700HX
2884 Points +13%
Asus TUF Gaming A15 FA507UV
AMD Ryzen 9 8945H
2711 Points +7%
Average of class Gaming
  (1490 - 3129, n=112, last 2 years)
2651 Points +4%
Average Intel Core i7-13620H
  (2544 - 2605, n=4)
2586 Points +2%
Gigabyte G5 KF5 2024
Intel Core i7-13620H
2544 Points
Dell Inspiron 16 Plus 7640
Intel Core Ultra 7 155H
2401 Points -6%
Lenovo LOQ 15IRX9
Intel Core i5-13450HX
2381 Points -6%
Gigabyte G5 KF
Intel Core i5-12500H
2239 Points -12%
Geekbench 5.5 / Multi-Core
Lenovo Legion Pro 5 16IRX9 G9
Intel Core i7-14700HX
19597 Points +68%
Average of class Gaming
  (4557 - 23194, n=187, last 2 years)
15073 Points +29%
Dell Inspiron 16 Plus 7640
Intel Core Ultra 7 155H
12600 Points +8%
Lenovo LOQ 15IRX9
Intel Core i5-13450HX
12005 Points +3%
Asus TUF Gaming A15 FA507UV
AMD Ryzen 9 8945H
11949 Points +2%
Gigabyte G5 KF5 2024
Intel Core i7-13620H
11699 Points
Average Intel Core i7-13620H
  (8357 - 12223, n=5)
11000 Points -6%
Gigabyte G5 KF
Intel Core i5-12500H
8194 Points -30%
Geekbench 5.5 / Single-Core
Lenovo Legion Pro 5 16IRX9 G9
Intel Core i7-14700HX
2133 Points +19%
Asus TUF Gaming A15 FA507UV
AMD Ryzen 9 8945H
1991 Points +11%
Average of class Gaming
  (986 - 2210, n=187, last 2 years)
1897 Points +5%
Average Intel Core i7-13620H
  (1793 - 1865, n=5)
1823 Points +1%
Gigabyte G5 KF5 2024
Intel Core i7-13620H
1799 Points
Dell Inspiron 16 Plus 7640
Intel Core Ultra 7 155H
1793 Points 0%
Lenovo LOQ 15IRX9
Intel Core i5-13450HX
1696 Points -6%
Gigabyte G5 KF
Intel Core i5-12500H
1618 Points -10%
HWBOT x265 Benchmark v2.2 / 4k Preset
Lenovo Legion Pro 5 16IRX9 G9
Intel Core i7-14700HX
27.4 fps +55%
Average of class Gaming
  (6.72 - 38.9, n=186, last 2 years)
23.6 fps +33%
Asus TUF Gaming A15 FA507UV
AMD Ryzen 9 8945H
21.9 fps +24%
Dell Inspiron 16 Plus 7640
Intel Core Ultra 7 155H
19.5 fps +10%
Gigabyte G5 KF5 2024
Intel Core i7-13620H
17.7 fps
Lenovo LOQ 15IRX9
Intel Core i5-13450HX
17.5 fps -1%
Average Intel Core i7-13620H
  (12.9 - 17.7, n=5)
16.2 fps -8%
Gigabyte G5 KF
Intel Core i5-12500H
14.2 fps -20%
LibreOffice / 20 Documents To PDF
Lenovo LOQ 15IRX9
Intel Core i5-13450HX
59.3 s * -15%
Lenovo Legion Pro 5 16IRX9 G9
Intel Core i7-14700HX
52.3 s * -2%
Gigabyte G5 KF5 2024
Intel Core i7-13620H
51.4 s *
Gigabyte G5 KF
Intel Core i5-12500H
50.1 s * +3%
Average of class Gaming
  (31.4 - 199, n=183, last 2 years)
48.1 s * +6%
Average Intel Core i7-13620H
  (41.5 - 56.8, n=5)
47.8 s * +7%
Asus TUF Gaming A15 FA507UV
AMD Ryzen 9 8945H
47.5 s * +8%
Dell Inspiron 16 Plus 7640
Intel Core Ultra 7 155H
43.5 s * +15%
R Benchmark 2.5 / Overall mean
Gigabyte G5 KF
Intel Core i5-12500H
0.535 sec * -20%
Lenovo LOQ 15IRX9
Intel Core i5-13450HX
0.4838 sec * -8%
Dell Inspiron 16 Plus 7640
Intel Core Ultra 7 155H
0.4709 sec * -6%
Average Intel Core i7-13620H
  (0.4438 - 0.4509, n=5)
0.4471 sec * -0%
Gigabyte G5 KF5 2024
Intel Core i7-13620H
0.446 sec *
Average of class Gaming
  (0.3609 - 0.759, n=187, last 2 years)
0.4368 sec * +2%
Asus TUF Gaming A15 FA507UV
AMD Ryzen 9 8945H
0.4298 sec * +4%
Lenovo Legion Pro 5 16IRX9 G9
Intel Core i7-14700HX
0.4003 sec * +10%

* ... im mniej tym lepiej

Cinebench R15 CPU Multi 64Bit
2396 Points
Cinebench R15 OpenGL 64Bit
209 fps
Cinebench R15 Ref. Match 64Bit
99.6 %
Cinebench R15 CPU Single 64Bit
269 Points
Cinebench R20 CPU (Multi Core)
5558 Points
Cinebench R20 CPU (Single Core)
697 Points
Cinebench R23 Single Core
1862 Points
Cinebench R23 Multi Core
14686 Points
Pomoc
Performance Rating
Lenovo Legion Pro 5 16IRX9 G9
Intel Core i7-14700HX, NVIDIA GeForce RTX 4060 Laptop GPU
94.1 pt
Asus TUF Gaming A15 FA507UV
AMD Ryzen 9 8945H, NVIDIA GeForce RTX 4060 Laptop GPU
89 pt
Average of class Gaming
 
82.9 pt
Dell Inspiron 16 Plus 7640
Intel Core Ultra 7 155H, NVIDIA GeForce RTX 4060 Laptop GPU
58.8 pt
Lenovo LOQ 15IRX9
Intel Core i5-13450HX, NVIDIA GeForce RTX 4060 Laptop GPU
58.2 pt
Gigabyte G5 KF
Intel Core i5-12500H, NVIDIA GeForce RTX 4060 Laptop GPU
52.7 pt
Gigabyte G5 KF5 2024
Intel Core i7-13620H, NVIDIA GeForce RTX 4060 Laptop GPU
49.7 pt
Average Intel Core i7-13620H
 
49.4 pt
AIDA64 / FP32 Ray-Trace
Asus TUF Gaming A15 FA507UV
AMD Ryzen 9 8945H, NVIDIA GeForce RTX 4060 Laptop GPU
28698 KRay/s +125%
Lenovo Legion Pro 5 16IRX9 G9
Intel Core i7-14700HX, NVIDIA GeForce RTX 4060 Laptop GPU
23676 KRay/s +86%
Average of class Gaming
  (4986 - 60169, n=183, last 2 years)
21914 KRay/s +72%
Dell Inspiron 16 Plus 7640
Intel Core Ultra 7 155H, NVIDIA GeForce RTX 4060 Laptop GPU
14038 KRay/s +10%
Lenovo LOQ 15IRX9
Intel Core i5-13450HX, NVIDIA GeForce RTX 4060 Laptop GPU
13747 KRay/s +8%
Gigabyte G5 KF5 2024
Intel Core i7-13620H, NVIDIA GeForce RTX 4060 Laptop GPU
12760 KRay/s
Average Intel Core i7-13620H
  (10779 - 13601, n=5)
12202 KRay/s -4%
Gigabyte G5 KF
Intel Core i5-12500H, NVIDIA GeForce RTX 4060 Laptop GPU
11802 KRay/s -8%
AIDA64 / FPU Julia
Asus TUF Gaming A15 FA507UV
AMD Ryzen 9 8945H, NVIDIA GeForce RTX 4060 Laptop GPU
122466 Points +88%
Lenovo Legion Pro 5 16IRX9 G9
Intel Core i7-14700HX, NVIDIA GeForce RTX 4060 Laptop GPU
116556 Points +79%
Average of class Gaming
  (25360 - 252486, n=183, last 2 years)
106726 Points +64%
Lenovo LOQ 15IRX9
Intel Core i5-13450HX, NVIDIA GeForce RTX 4060 Laptop GPU
71834 Points +10%
Dell Inspiron 16 Plus 7640
Intel Core Ultra 7 155H, NVIDIA GeForce RTX 4060 Laptop GPU
70839 Points +9%
Gigabyte G5 KF5 2024
Intel Core i7-13620H, NVIDIA GeForce RTX 4060 Laptop GPU
65073 Points
Average Intel Core i7-13620H
  (54287 - 67187, n=5)
62844 Points -3%
Gigabyte G5 KF
Intel Core i5-12500H, NVIDIA GeForce RTX 4060 Laptop GPU
59683 Points -8%
AIDA64 / CPU SHA3
Lenovo Legion Pro 5 16IRX9 G9
Intel Core i7-14700HX, NVIDIA GeForce RTX 4060 Laptop GPU
5567 MB/s +110%
Asus TUF Gaming A15 FA507UV
AMD Ryzen 9 8945H, NVIDIA GeForce RTX 4060 Laptop GPU
5113 MB/s +92%
Average of class Gaming
  (1339 - 10389, n=183, last 2 years)
4910 MB/s +85%
Lenovo LOQ 15IRX9
Intel Core i5-13450HX, NVIDIA GeForce RTX 4060 Laptop GPU
3530 MB/s +33%
Dell Inspiron 16 Plus 7640
Intel Core Ultra 7 155H, NVIDIA GeForce RTX 4060 Laptop GPU
3277 MB/s +23%
Gigabyte G5 KF
Intel Core i5-12500H, NVIDIA GeForce RTX 4060 Laptop GPU
2983 MB/s +12%
Gigabyte G5 KF5 2024
Intel Core i7-13620H, NVIDIA GeForce RTX 4060 Laptop GPU
2657 MB/s
Average Intel Core i7-13620H
  (2357 - 2773, n=5)
2605 MB/s -2%
AIDA64 / CPU Queen
Lenovo Legion Pro 5 16IRX9 G9
Intel Core i7-14700HX, NVIDIA GeForce RTX 4060 Laptop GPU
152200 Points +94%
Asus TUF Gaming A15 FA507UV
AMD Ryzen 9 8945H, NVIDIA GeForce RTX 4060 Laptop GPU
125950 Points +60%
Average of class Gaming
  (50699 - 200651, n=183, last 2 years)
117145 Points +49%
Dell Inspiron 16 Plus 7640
Intel Core Ultra 7 155H, NVIDIA GeForce RTX 4060 Laptop GPU
87819 Points +12%
Lenovo LOQ 15IRX9
Intel Core i5-13450HX, NVIDIA GeForce RTX 4060 Laptop GPU
86148 Points +10%
Gigabyte G5 KF
Intel Core i5-12500H, NVIDIA GeForce RTX 4060 Laptop GPU
79989 Points +2%
Gigabyte G5 KF5 2024
Intel Core i7-13620H, NVIDIA GeForce RTX 4060 Laptop GPU
78523 Points
Average Intel Core i7-13620H
  (66885 - 78867, n=5)
76259 Points -3%
AIDA64 / FPU SinJulia
Asus TUF Gaming A15 FA507UV
AMD Ryzen 9 8945H, NVIDIA GeForce RTX 4060 Laptop GPU
15856 Points +95%
Lenovo Legion Pro 5 16IRX9 G9
Intel Core i7-14700HX, NVIDIA GeForce RTX 4060 Laptop GPU
14434 Points +78%
Average of class Gaming
  (4800 - 32988, n=183, last 2 years)
13258 Points +63%
Dell Inspiron 16 Plus 7640
Intel Core Ultra 7 155H, NVIDIA GeForce RTX 4060 Laptop GPU
9893 Points +22%
Lenovo LOQ 15IRX9
Intel Core i5-13450HX, NVIDIA GeForce RTX 4060 Laptop GPU
9344 Points +15%
Gigabyte G5 KF5 2024
Intel Core i7-13620H, NVIDIA GeForce RTX 4060 Laptop GPU
8124 Points
Average Intel Core i7-13620H
  (6737 - 8421, n=5)
7775 Points -4%
Gigabyte G5 KF
Intel Core i5-12500H, NVIDIA GeForce RTX 4060 Laptop GPU
7322 Points -10%
AIDA64 / FPU Mandel
Asus TUF Gaming A15 FA507UV
AMD Ryzen 9 8945H, NVIDIA GeForce RTX 4060 Laptop GPU
65523 Points +108%
Lenovo Legion Pro 5 16IRX9 G9
Intel Core i7-14700HX, NVIDIA GeForce RTX 4060 Laptop GPU
58380 Points +85%
Average of class Gaming
  (12321 - 134044, n=183, last 2 years)
53700 Points +70%
Dell Inspiron 16 Plus 7640
Intel Core Ultra 7 155H, NVIDIA GeForce RTX 4060 Laptop GPU
35006 Points +11%
Lenovo LOQ 15IRX9
Intel Core i5-13450HX, NVIDIA GeForce RTX 4060 Laptop GPU
34956 Points +11%
Gigabyte G5 KF5 2024
Intel Core i7-13620H, NVIDIA GeForce RTX 4060 Laptop GPU
31508 Points
Average Intel Core i7-13620H
  (27242 - 32787, n=5)
30835 Points -2%
Gigabyte G5 KF
Intel Core i5-12500H, NVIDIA GeForce RTX 4060 Laptop GPU
29112 Points -8%
AIDA64 / CPU AES
Lenovo Legion Pro 5 16IRX9 G9
Intel Core i7-14700HX, NVIDIA GeForce RTX 4060 Laptop GPU
113157 MB/s +109%
Average of class Gaming
  (19065 - 328679, n=183, last 2 years)
109216 MB/s +102%
Gigabyte G5 KF
Intel Core i5-12500H, NVIDIA GeForce RTX 4060 Laptop GPU
105881 MB/s +96%
Asus TUF Gaming A15 FA507UV
AMD Ryzen 9 8945H, NVIDIA GeForce RTX 4060 Laptop GPU
90481 MB/s +67%
Lenovo LOQ 15IRX9
Intel Core i5-13450HX, NVIDIA GeForce RTX 4060 Laptop GPU
70330 MB/s +30%
Dell Inspiron 16 Plus 7640
Intel Core Ultra 7 155H, NVIDIA GeForce RTX 4060 Laptop GPU
68050 MB/s +26%
Average Intel Core i7-13620H
  (52697 - 85895, n=5)
61535 MB/s +14%
Gigabyte G5 KF5 2024
Intel Core i7-13620H, NVIDIA GeForce RTX 4060 Laptop GPU
54096 MB/s
AIDA64 / CPU ZLib
Lenovo Legion Pro 5 16IRX9 G9
Intel Core i7-14700HX, NVIDIA GeForce RTX 4060 Laptop GPU
1682 MB/s +115%
Average of class Gaming
  (373 - 2409, n=183, last 2 years)
1367 MB/s +75%
Asus TUF Gaming A15 FA507UV
AMD Ryzen 9 8945H, NVIDIA GeForce RTX 4060 Laptop GPU
1150 MB/s +47%
Dell Inspiron 16 Plus 7640
Intel Core Ultra 7 155H, NVIDIA GeForce RTX 4060 Laptop GPU
1045 MB/s +34%
Lenovo LOQ 15IRX9
Intel Core i5-13450HX, NVIDIA GeForce RTX 4060 Laptop GPU
1002 MB/s +28%
Gigabyte G5 KF
Intel Core i5-12500H, NVIDIA GeForce RTX 4060 Laptop GPU
864 MB/s +10%
Gigabyte G5 KF5 2024
Intel Core i7-13620H, NVIDIA GeForce RTX 4060 Laptop GPU
782 MB/s
Average Intel Core i7-13620H
  (697 - 835, n=5)
778 MB/s -1%
AIDA64 / FP64 Ray-Trace
Asus TUF Gaming A15 FA507UV
AMD Ryzen 9 8945H, NVIDIA GeForce RTX 4060 Laptop GPU
15513 KRay/s +128%
Lenovo Legion Pro 5 16IRX9 G9
Intel Core i7-14700HX, NVIDIA GeForce RTX 4060 Laptop GPU
12928 KRay/s +90%
Average of class Gaming
  (2540 - 31796, n=183, last 2 years)
11803 KRay/s +74%
Lenovo LOQ 15IRX9
Intel Core i5-13450HX, NVIDIA GeForce RTX 4060 Laptop GPU
7428 KRay/s +9%
Dell Inspiron 16 Plus 7640
Intel Core Ultra 7 155H, NVIDIA GeForce RTX 4060 Laptop GPU
7347 KRay/s +8%
Gigabyte G5 KF5 2024
Intel Core i7-13620H, NVIDIA GeForce RTX 4060 Laptop GPU
6800 KRay/s
Average Intel Core i7-13620H
  (6077 - 7364, n=5)
6709 KRay/s -1%
Gigabyte G5 KF
Intel Core i5-12500H, NVIDIA GeForce RTX 4060 Laptop GPU
6169 KRay/s -9%
AIDA64 / CPU PhotoWorxx
Lenovo Legion Pro 5 16IRX9 G9
Intel Core i7-14700HX, NVIDIA GeForce RTX 4060 Laptop GPU
49671 MPixel/s +59%
Average of class Gaming
  (10805 - 60161, n=184, last 2 years)
40243 MPixel/s +29%
Dell Inspiron 16 Plus 7640
Intel Core Ultra 7 155H, NVIDIA GeForce RTX 4060 Laptop GPU
39530 MPixel/s +27%
Lenovo LOQ 15IRX9
Intel Core i5-13450HX, NVIDIA GeForce RTX 4060 Laptop GPU
36764 MPixel/s +18%
Asus TUF Gaming A15 FA507UV
AMD Ryzen 9 8945H, NVIDIA GeForce RTX 4060 Laptop GPU
33410 MPixel/s +7%
Average Intel Core i7-13620H
  (22766 - 34544, n=5)
31208 MPixel/s 0%
Gigabyte G5 KF5 2024
Intel Core i7-13620H, NVIDIA GeForce RTX 4060 Laptop GPU
31165 MPixel/s
Gigabyte G5 KF
Intel Core i5-12500H, NVIDIA GeForce RTX 4060 Laptop GPU
27635 MPixel/s -11%

Wydajność systemu

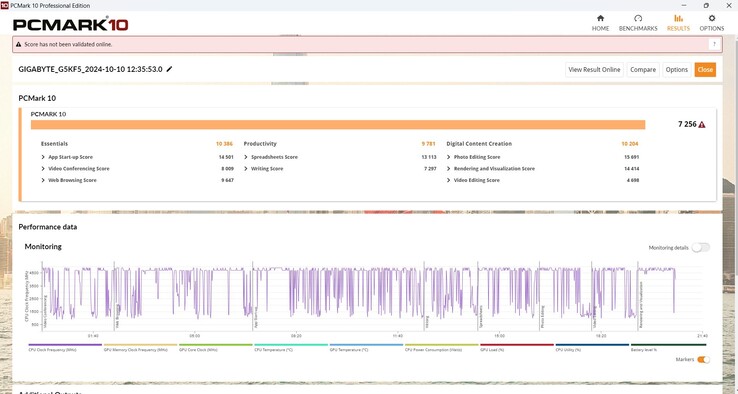
Wyniki G5 w PCMark 10 nie wyróżniają się niczym szczególnym i plasują się w środku stawki. W CrossMarku nasz Gigabyte radzi sobie na oczekiwanym poziomie. Rzadko odnotowywaliśmy jakiekolwiek problemy w trybie Windows, jedynie podczas przewijania przeglądarki może pojawić się kilka czkawek.

PCMark 10
PCMark 10
PCMark 10 / Score
Lenovo Legion Pro 5 16IRX9 G9
NVIDIA GeForce RTX 4060 Laptop GPU, i7-14700HX, Samsung PM9A1 MZVL21T0HCLR
8278 Points +14%
Asus TUF Gaming A15 FA507UV
NVIDIA GeForce RTX 4060 Laptop GPU, R9 8945H, WD PC SN560 SDDPNQE-1T00
7943 Points +9%
Average of class Gaming
  (5776 - 9852, n=164, last 2 years)
7803 Points +8%
Gigabyte G5 KF5 2024
NVIDIA GeForce RTX 4060 Laptop GPU, i7-13620H, Gigabyte AG450E1024-SI
7256 Points
Dell Inspiron 16 Plus 7640
NVIDIA GeForce RTX 4060 Laptop GPU, Ultra 7 155H, SK hynix BC901 HFS001TEJ4X164N
7042 Points -3%
Average Intel Core i7-13620H, NVIDIA GeForce RTX 4060 Laptop GPU
  (6678 - 7256, n=3)
7031 Points -3%
Lenovo LOQ 15IRX9
NVIDIA GeForce RTX 4060 Laptop GPU, i5-13450HX, Micron 2400 MTFDKCD1T0QFM
6929 Points -5%
Gigabyte G5 KF
NVIDIA GeForce RTX 4060 Laptop GPU, i5-12500H, SSSTC CA6-8D512
6318 Points -13%
PCMark 10 / Essentials
Lenovo Legion Pro 5 16IRX9 G9
NVIDIA GeForce RTX 4060 Laptop GPU, i7-14700HX, Samsung PM9A1 MZVL21T0HCLR
11087 Points +7%
Asus TUF Gaming A15 FA507UV
NVIDIA GeForce RTX 4060 Laptop GPU, R9 8945H, WD PC SN560 SDDPNQE-1T00
10873 Points +5%
Average of class Gaming
  (9057 - 12334, n=163, last 2 years)
10833 Points +4%
Gigabyte G5 KF5 2024
NVIDIA GeForce RTX 4060 Laptop GPU, i7-13620H, Gigabyte AG450E1024-SI
10386 Points
Average Intel Core i7-13620H, NVIDIA GeForce RTX 4060 Laptop GPU
  (9909 - 10809, n=3)
10368 Points 0%
Gigabyte G5 KF
NVIDIA GeForce RTX 4060 Laptop GPU, i5-12500H, SSSTC CA6-8D512
10328 Points -1%
Dell Inspiron 16 Plus 7640
NVIDIA GeForce RTX 4060 Laptop GPU, Ultra 7 155H, SK hynix BC901 HFS001TEJ4X164N
10279 Points -1%
Lenovo LOQ 15IRX9
NVIDIA GeForce RTX 4060 Laptop GPU, i5-13450HX, Micron 2400 MTFDKCD1T0QFM
9379 Points -10%
PCMark 10 / Productivity
Asus TUF Gaming A15 FA507UV
NVIDIA GeForce RTX 4060 Laptop GPU, R9 8945H, WD PC SN560 SDDPNQE-1T00
10269 Points +5%
Average of class Gaming
  (6662 - 14612, n=163, last 2 years)
9904 Points +1%
Lenovo Legion Pro 5 16IRX9 G9
NVIDIA GeForce RTX 4060 Laptop GPU, i7-14700HX, Samsung PM9A1 MZVL21T0HCLR
9823 Points 0%
Gigabyte G5 KF5 2024
NVIDIA GeForce RTX 4060 Laptop GPU, i7-13620H, Gigabyte AG450E1024-SI
9781 Points
Gigabyte G5 KF
NVIDIA GeForce RTX 4060 Laptop GPU, i5-12500H, SSSTC CA6-8D512
9736 Points 0%
Average Intel Core i7-13620H, NVIDIA GeForce RTX 4060 Laptop GPU
  (8642 - 9781, n=3)
9244 Points -5%
Lenovo LOQ 15IRX9
NVIDIA GeForce RTX 4060 Laptop GPU, i5-13450HX, Micron 2400 MTFDKCD1T0QFM
8800 Points -10%
Dell Inspiron 16 Plus 7640
NVIDIA GeForce RTX 4060 Laptop GPU, Ultra 7 155H, SK hynix BC901 HFS001TEJ4X164N
8079 Points -17%
PCMark 10 / Digital Content Creation
Lenovo Legion Pro 5 16IRX9 G9
NVIDIA GeForce RTX 4060 Laptop GPU, i7-14700HX, Samsung PM9A1 MZVL21T0HCLR
14135 Points +39%
Asus TUF Gaming A15 FA507UV
NVIDIA GeForce RTX 4060 Laptop GPU, R9 8945H, WD PC SN560 SDDPNQE-1T00
12182 Points +19%
Average of class Gaming
  (6703 - 18475, n=163, last 2 years)
12134 Points +19%
Dell Inspiron 16 Plus 7640
NVIDIA GeForce RTX 4060 Laptop GPU, Ultra 7 155H, SK hynix BC901 HFS001TEJ4X164N
11413 Points +12%
Lenovo LOQ 15IRX9
NVIDIA GeForce RTX 4060 Laptop GPU, i5-13450HX, Micron 2400 MTFDKCD1T0QFM
10937 Points +7%
Gigabyte G5 KF5 2024
NVIDIA GeForce RTX 4060 Laptop GPU, i7-13620H, Gigabyte AG450E1024-SI
10204 Points
Average Intel Core i7-13620H, NVIDIA GeForce RTX 4060 Laptop GPU
  (9437 - 10204, n=3)
9848 Points -3%
Gigabyte G5 KF
NVIDIA GeForce RTX 4060 Laptop GPU, i5-12500H, SSSTC CA6-8D512
6807 Points -33%
CrossMark / Overall
Lenovo Legion Pro 5 16IRX9 G9
NVIDIA GeForce RTX 4060 Laptop GPU, i7-14700HX, Samsung PM9A1 MZVL21T0HCLR
2132 Points +7%
Gigabyte G5 KF5 2024
NVIDIA GeForce RTX 4060 Laptop GPU, i7-13620H, Gigabyte AG450E1024-SI
1986 Points
Average Intel Core i7-13620H, NVIDIA GeForce RTX 4060 Laptop GPU
  (1857 - 1986, n=3)
1929 Points -3%
Average of class Gaming
  (1247 - 2344, n=145, last 2 years)
1910 Points -4%
Lenovo LOQ 15IRX9
NVIDIA GeForce RTX 4060 Laptop GPU, i5-13450HX, Micron 2400 MTFDKCD1T0QFM
1804 Points -9%
Asus TUF Gaming A15 FA507UV
NVIDIA GeForce RTX 4060 Laptop GPU, R9 8945H, WD PC SN560 SDDPNQE-1T00
1800 Points -9%
Gigabyte G5 KF
NVIDIA GeForce RTX 4060 Laptop GPU, i5-12500H, SSSTC CA6-8D512
1744 Points -12%
Dell Inspiron 16 Plus 7640
NVIDIA GeForce RTX 4060 Laptop GPU, Ultra 7 155H, SK hynix BC901 HFS001TEJ4X164N
1685 Points -15%
CrossMark / Productivity
Lenovo Legion Pro 5 16IRX9 G9
NVIDIA GeForce RTX 4060 Laptop GPU, i7-14700HX, Samsung PM9A1 MZVL21T0HCLR
1973 Points +3%
Gigabyte G5 KF5 2024
NVIDIA GeForce RTX 4060 Laptop GPU, i7-13620H, Gigabyte AG450E1024-SI
1908 Points
Average Intel Core i7-13620H, NVIDIA GeForce RTX 4060 Laptop GPU
  (1765 - 1908, n=3)
1847 Points -3%
Average of class Gaming
  (1299 - 2204, n=145, last 2 years)
1809 Points -5%
Asus TUF Gaming A15 FA507UV
NVIDIA GeForce RTX 4060 Laptop GPU, R9 8945H, WD PC SN560 SDDPNQE-1T00
1761 Points -8%
Lenovo LOQ 15IRX9
NVIDIA GeForce RTX 4060 Laptop GPU, i5-13450HX, Micron 2400 MTFDKCD1T0QFM
1728 Points -9%
Gigabyte G5 KF
NVIDIA GeForce RTX 4060 Laptop GPU, i5-12500H, SSSTC CA6-8D512
1708 Points -10%
Dell Inspiron 16 Plus 7640
NVIDIA GeForce RTX 4060 Laptop GPU, Ultra 7 155H, SK hynix BC901 HFS001TEJ4X164N
1592 Points -17%
CrossMark / Creativity
Lenovo Legion Pro 5 16IRX9 G9
NVIDIA GeForce RTX 4060 Laptop GPU, i7-14700HX, Samsung PM9A1 MZVL21T0HCLR
2399 Points +16%
Average of class Gaming
  (1275 - 2660, n=145, last 2 years)
2097 Points +1%
Gigabyte G5 KF5 2024
NVIDIA GeForce RTX 4060 Laptop GPU, i7-13620H, Gigabyte AG450E1024-SI
2067 Points
Average Intel Core i7-13620H, NVIDIA GeForce RTX 4060 Laptop GPU
  (2013 - 2067, n=3)
2042 Points -1%
Dell Inspiron 16 Plus 7640
NVIDIA GeForce RTX 4060 Laptop GPU, Ultra 7 155H, SK hynix BC901 HFS001TEJ4X164N
1929 Points -7%
Asus TUF Gaming A15 FA507UV
NVIDIA GeForce RTX 4060 Laptop GPU, R9 8945H, WD PC SN560 SDDPNQE-1T00
1918 Points -7%
Lenovo LOQ 15IRX9
NVIDIA GeForce RTX 4060 Laptop GPU, i5-13450HX, Micron 2400 MTFDKCD1T0QFM
1904 Points -8%
Gigabyte G5 KF
NVIDIA GeForce RTX 4060 Laptop GPU, i5-12500H, SSSTC CA6-8D512
1760 Points -15%
CrossMark / Responsiveness
Gigabyte G5 KF5 2024
NVIDIA GeForce RTX 4060 Laptop GPU, i7-13620H, Gigabyte AG450E1024-SI
1989 Points
Lenovo Legion Pro 5 16IRX9 G9
NVIDIA GeForce RTX 4060 Laptop GPU, i7-14700HX, Samsung PM9A1 MZVL21T0HCLR
1885 Points -5%
Average Intel Core i7-13620H, NVIDIA GeForce RTX 4060 Laptop GPU
  (1734 - 1989, n=3)
1866 Points -6%
Gigabyte G5 KF
NVIDIA GeForce RTX 4060 Laptop GPU, i5-12500H, SSSTC CA6-8D512
1804 Points -9%
Lenovo LOQ 15IRX9
NVIDIA GeForce RTX 4060 Laptop GPU, i5-13450HX, Micron 2400 MTFDKCD1T0QFM
1748 Points -12%
Average of class Gaming
  (1030 - 2330, n=145, last 2 years)
1709 Points -14%
Asus TUF Gaming A15 FA507UV
NVIDIA GeForce RTX 4060 Laptop GPU, R9 8945H, WD PC SN560 SDDPNQE-1T00
1593 Points -20%
Dell Inspiron 16 Plus 7640
NVIDIA GeForce RTX 4060 Laptop GPU, Ultra 7 155H, SK hynix BC901 HFS001TEJ4X164N
1333 Points -33%
WebXPRT 3 / Overall
Average Intel Core i7-13620H, NVIDIA GeForce RTX 4060 Laptop GPU
  (292 - 319, n=3)
310 Points
Asus TUF Gaming A15 FA507UV
NVIDIA GeForce RTX 4060 Laptop GPU, R9 8945H, WD PC SN560 SDDPNQE-1T00
308 Points
Average of class Gaming
  (215 - 480, n=161, last 2 years)
304 Points
Lenovo Legion Pro 5 16IRX9 G9
NVIDIA GeForce RTX 4060 Laptop GPU, i7-14700HX, Samsung PM9A1 MZVL21T0HCLR
301 Points
Dell Inspiron 16 Plus 7640
NVIDIA GeForce RTX 4060 Laptop GPU, Ultra 7 155H, SK hynix BC901 HFS001TEJ4X164N
290 Points
Lenovo LOQ 15IRX9
NVIDIA GeForce RTX 4060 Laptop GPU, i5-13450HX, Micron 2400 MTFDKCD1T0QFM
262 Points
Gigabyte G5 KF
NVIDIA GeForce RTX 4060 Laptop GPU, i5-12500H, SSSTC CA6-8D512
246 Points
WebXPRT 4 / Overall
Lenovo Legion Pro 5 16IRX9 G9
NVIDIA GeForce RTX 4060 Laptop GPU, i7-14700HX, Samsung PM9A1 MZVL21T0HCLR
273 Points
Average Intel Core i7-13620H, NVIDIA GeForce RTX 4060 Laptop GPU
  ()
270 Points
Average of class Gaming
  (176.4 - 328, n=150, last 2 years)
267 Points
Asus TUF Gaming A15 FA507UV
NVIDIA GeForce RTX 4060 Laptop GPU, R9 8945H, WD PC SN560 SDDPNQE-1T00
263 Points
Dell Inspiron 16 Plus 7640
NVIDIA GeForce RTX 4060 Laptop GPU, Ultra 7 155H, SK hynix BC901 HFS001TEJ4X164N
257 Points
Lenovo LOQ 15IRX9
NVIDIA GeForce RTX 4060 Laptop GPU, i5-13450HX, Micron 2400 MTFDKCD1T0QFM
243 Points
Mozilla Kraken 1.1 / Total
Gigabyte G5 KF
NVIDIA GeForce RTX 4060 Laptop GPU, i5-12500H, SSSTC CA6-8D512
562 ms * -10%
Gigabyte G5 KF
NVIDIA GeForce RTX 4060 Laptop GPU, i5-12500H, SSSTC CA6-8D512
562 ms * -10%
Lenovo LOQ 15IRX9
NVIDIA GeForce RTX 4060 Laptop GPU, i5-13450HX, Micron 2400 MTFDKCD1T0QFM
550 ms * -7%
Dell Inspiron 16 Plus 7640
NVIDIA GeForce RTX 4060 Laptop GPU, Ultra 7 155H, SK hynix BC901 HFS001TEJ4X164N
519 ms * -1%
Gigabyte G5 KF5 2024
NVIDIA GeForce RTX 4060 Laptop GPU, i7-13620H, Gigabyte AG450E1024-SI
513 ms *
Average Intel Core i7-13620H, NVIDIA GeForce RTX 4060 Laptop GPU
  (508 - 516, n=4)
511 ms * -0%
Asus TUF Gaming A15 FA507UV
NVIDIA GeForce RTX 4060 Laptop GPU, R9 8945H, WD PC SN560 SDDPNQE-1T00
505 ms * +2%
Average of class Gaming
  (421 - 674, n=176, last 2 years)
502 ms * +2%
Lenovo Legion Pro 5 16IRX9 G9
NVIDIA GeForce RTX 4060 Laptop GPU, i7-14700HX, Samsung PM9A1 MZVL21T0HCLR
467 ms * +9%

* ... im mniej tym lepiej

PCMark 10 Score
7256 pkt.
Pomoc
AIDA64 / Memory Copy
Lenovo Legion Pro 5 16IRX9 G9
Intel Core i7-14700HX, NVIDIA GeForce RTX 4060 Laptop GPU
78742 MB/s +53%
Average of class Gaming
  (21842 - 94222, n=183, last 2 years)
65434 MB/s +27%
Dell Inspiron 16 Plus 7640
Intel Core Ultra 7 155H, NVIDIA GeForce RTX 4060 Laptop GPU
63520 MB/s +24%
Asus TUF Gaming A15 FA507UV
AMD Ryzen 9 8945H, NVIDIA GeForce RTX 4060 Laptop GPU
61823 MB/s +20%
Lenovo LOQ 15IRX9
Intel Core i5-13450HX, NVIDIA GeForce RTX 4060 Laptop GPU
58673 MB/s +14%
Gigabyte G5 KF5 2024
Intel Core i7-13620H, NVIDIA GeForce RTX 4060 Laptop GPU
51393 MB/s
Average Intel Core i7-13620H
  (38066 - 53927, n=5)
50052 MB/s -3%
Gigabyte G5 KF
Intel Core i5-12500H, NVIDIA GeForce RTX 4060 Laptop GPU
43470 MB/s -15%
AIDA64 / Memory Read
Lenovo Legion Pro 5 16IRX9 G9
Intel Core i7-14700HX, NVIDIA GeForce RTX 4060 Laptop GPU
86175 MB/s +47%
Dell Inspiron 16 Plus 7640
Intel Core Ultra 7 155H, NVIDIA GeForce RTX 4060 Laptop GPU
77153 MB/s +31%
Average of class Gaming
  (23681 - 99713, n=183, last 2 years)
69366 MB/s +18%
Lenovo LOQ 15IRX9
Intel Core i5-13450HX, NVIDIA GeForce RTX 4060 Laptop GPU
68109 MB/s +16%
Asus TUF Gaming A15 FA507UV
AMD Ryzen 9 8945H, NVIDIA GeForce RTX 4060 Laptop GPU
61696 MB/s +5%
Gigabyte G5 KF5 2024
Intel Core i7-13620H, NVIDIA GeForce RTX 4060 Laptop GPU
58755 MB/s
Average Intel Core i7-13620H
  (40342 - 61853, n=5)
56860 MB/s -3%
Gigabyte G5 KF
Intel Core i5-12500H, NVIDIA GeForce RTX 4060 Laptop GPU
47117 MB/s -20%
AIDA64 / Memory Write
Asus TUF Gaming A15 FA507UV
AMD Ryzen 9 8945H, NVIDIA GeForce RTX 4060 Laptop GPU
78716 MB/s +54%
Lenovo Legion Pro 5 16IRX9 G9
Intel Core i7-14700HX, NVIDIA GeForce RTX 4060 Laptop GPU
76689 MB/s +50%
Average of class Gaming
  (22986 - 108954, n=183, last 2 years)
67198 MB/s +31%
Dell Inspiron 16 Plus 7640
Intel Core Ultra 7 155H, NVIDIA GeForce RTX 4060 Laptop GPU
65616 MB/s +28%
Lenovo LOQ 15IRX9
Intel Core i5-13450HX, NVIDIA GeForce RTX 4060 Laptop GPU
59981 MB/s +17%
Gigabyte G5 KF5 2024
Intel Core i7-13620H, NVIDIA GeForce RTX 4060 Laptop GPU
51235 MB/s
Average Intel Core i7-13620H
  (38595 - 54111, n=5)
49719 MB/s -3%
Gigabyte G5 KF
Intel Core i5-12500H, NVIDIA GeForce RTX 4060 Laptop GPU
46588 MB/s -9%
AIDA64 / Memory Latency
Dell Inspiron 16 Plus 7640
Intel Core Ultra 7 155H, NVIDIA GeForce RTX 4060 Laptop GPU
120.2 ns * -14%
Gigabyte G5 KF5 2024
Intel Core i7-13620H, NVIDIA GeForce RTX 4060 Laptop GPU
105.6 ns *
Average Intel Core i7-13620H
  (75.9 - 108.2, n=5)
99.8 ns * +5%
Lenovo LOQ 15IRX9
Intel Core i5-13450HX, NVIDIA GeForce RTX 4060 Laptop GPU
94.2 ns * +11%
Average of class Gaming
  (59.5 - 259, n=183, last 2 years)
93.7 ns * +11%
Asus TUF Gaming A15 FA507UV
AMD Ryzen 9 8945H, NVIDIA GeForce RTX 4060 Laptop GPU
92.6 ns * +12%
Gigabyte G5 KF
Intel Core i5-12500H, NVIDIA GeForce RTX 4060 Laptop GPU
83.8 ns * +21%
Lenovo Legion Pro 5 16IRX9 G9
Intel Core i7-14700HX, NVIDIA GeForce RTX 4060 Laptop GPU
82.7 ns * +22%

* ... im mniej tym lepiej

Opóźnienia DPC

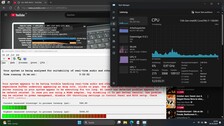
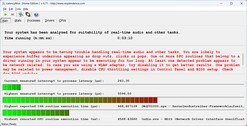
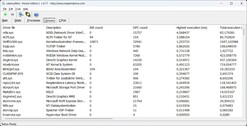
Nawet podczas przesuwania wskaźnika myszy po uruchomieniu LatencyMon wykrywane są wyższe opóźnienia, które rosną z każdą nową akcją (otwarcie przeglądarki, otwarcie wielu kart, odtwarzanie wideo). Nasz film na YouTube ma również dwie porzucone klatki. Ogólnie rzecz biorąc, wartości opóźnień są wyraźnie zbyt wysokie, nawet w porównaniu. Niezwykle wysokie obciążenie iGPU wynoszące 89% podczas odtwarzania filmu z YouTube jest również zauważalne.

YouTube
YouTube
LatencyMon Main
LatencyMon Main
Sterowniki LatencyMon
DPC Latencies / LatencyMon - interrupt to process latency (max), Web, Youtube, Prime95
Gigabyte G5 KF5 2024
NVIDIA GeForce RTX 4060 Laptop GPU, i7-13620H, Gigabyte AG450E1024-SI
5596.5 μs *
Gigabyte G5 KF
NVIDIA GeForce RTX 4060 Laptop GPU, i5-12500H, SSSTC CA6-8D512
1905 μs * +66%
Lenovo LOQ 15IRX9
NVIDIA GeForce RTX 4060 Laptop GPU, i5-13450HX, Micron 2400 MTFDKCD1T0QFM
1689.3 μs * +70%
Lenovo Legion Pro 5 16IRX9 G9
NVIDIA GeForce RTX 4060 Laptop GPU, i7-14700HX, Samsung PM9A1 MZVL21T0HCLR
951.7 μs * +83%
Asus TUF Gaming A15 FA507UV
NVIDIA GeForce RTX 4060 Laptop GPU, R9 8945H, WD PC SN560 SDDPNQE-1T00
790.8 μs * +86%
Dell Inspiron 16 Plus 7640
NVIDIA GeForce RTX 4060 Laptop GPU, Ultra 7 155H, SK hynix BC901 HFS001TEJ4X164N
770.1 μs * +86%

* ... im mniej tym lepiej

Pamięć masowa

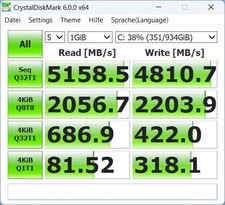
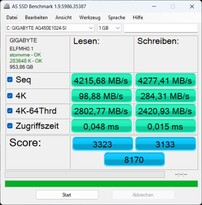
Producent zastosował w naszej próbce testowej dysk SSD NVMe z 1 TB pamięci własnej marki Gigabyte. Oferuje on transfer sekwencyjny na poziomie od 4000 do 5000 MB/s. Oznacza to, że zazwyczaj jest on nawet nieco szybszy od wymienionych tutaj konkurentów.

Jednak nie jest w stanie utrzymać tej wydajności z powodu dławienia termicznego w naszym teście wytrzymałości po 16 przejściu DiskSpd. Po tym czasie wydajność znacznie się waha i drastycznie spada.

Crystaldiskmark 6
Crystaldiskmark 6
AS SSD
AS SSD
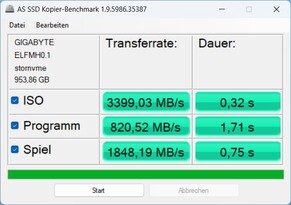
Kopia AS SSD
Kopia AS SSD
Gigabyte AG450E1024-SI
CDM 5/6 Read Seq Q32T1: 5159 MB/s
CDM 5/6 Write Seq Q32T1: 4811 MB/s
CDM 5/6 Read 4K Q32T1: 687 MB/s
CDM 5/6 Write 4K Q32T1: 422 MB/s
CDM 5/6 Read 4K: 81.5 MB/s
CDM 5/6 Write 4K: 318 MB/s
CDM 6 Write 4K Q8T8: 2204 MB/s
CDM 6 Read 4K Q8T8: 2057 MB/s
Drive Performance Rating - Percent
Gigabyte G5 KF5 2024
Gigabyte AG450E1024-SI
90.1 pt
Average Gigabyte AG450E1024-SI
 
86.6 pt
Lenovo Legion Pro 5 16IRX9 G9
Samsung PM9A1 MZVL21T0HCLR
86.4 pt
Gigabyte G5 KF
SSSTC CA6-8D512
86.3 pt
Average of class Gaming
 
77.4 pt
Lenovo LOQ 15IRX9
Micron 2400 MTFDKCD1T0QFM
68.8 pt
Asus TUF Gaming A15 FA507UV
WD PC SN560 SDDPNQE-1T00
63.7 pt
Dell Inspiron 16 Plus 7640
SK hynix BC901 HFS001TEJ4X164N
44.7 pt
DiskSpd
seq read
Gigabyte G5 KF
SSSTC CA6-8D512
4094 (1992.5min - 4093.83max) MB/s +37%
Lenovo Legion Pro 5 16IRX9 G9
Samsung PM9A1 MZVL21T0HCLR
3497 (3441.46min - 3497.42max) MB/s +17%
Average of class Gaming
  (1319 - 7045, n=165, last 2 years)
3475 MB/s +17%
Gigabyte G5 KF5 2024
Gigabyte AG450E1024-SI
2981 (2922.38min - 2980.98max) MB/s
Asus TUF Gaming A15 FA507UV
WD PC SN560 SDDPNQE-1T00
2943 (2931.61min - 2942.92max) MB/s -1%
Average Gigabyte AG450E1024-SI
  (2366 - 2981, n=3)
2656 MB/s -11%
Lenovo LOQ 15IRX9
Micron 2400 MTFDKCD1T0QFM
2364 (2348.18min - 2364.12max) MB/s -21%
Dell Inspiron 16 Plus 7640
SK hynix BC901 HFS001TEJ4X164N
2253 (2222.1min - 2252.66max) MB/s -24%
seq write
Gigabyte G5 KF5 2024
Gigabyte AG450E1024-SI
4772 (4589.99min - 4772.17max) MB/s
Average Gigabyte AG450E1024-SI
  (4659 - 4772, n=3)
4729 MB/s -1%
Gigabyte G5 KF
SSSTC CA6-8D512
3870 (2222.52min - 3870.29max) MB/s -19%
Average of class Gaming
  (535 - 9307, n=165, last 2 years)
3812 MB/s -20%
Lenovo Legion Pro 5 16IRX9 G9
Samsung PM9A1 MZVL21T0HCLR
3403 (3360.48min - 3402.53max) MB/s -29%
Asus TUF Gaming A15 FA507UV
WD PC SN560 SDDPNQE-1T00
3126 (3069.81min - 3126.43max) MB/s -34%
Lenovo LOQ 15IRX9
Micron 2400 MTFDKCD1T0QFM
3103 (3061.84min - 3102.82max) MB/s -35%
Dell Inspiron 16 Plus 7640
SK hynix BC901 HFS001TEJ4X164N
2368 (2226.29min - 2367.89max) MB/s -50%
seq q8 t1 read
Gigabyte G5 KF
SSSTC CA6-8D512
6922 (6017.7min - 6922.07max) MB/s +41%
Lenovo Legion Pro 5 16IRX9 G9
Samsung PM9A1 MZVL21T0HCLR
6599 (5813.31min - 6598.9max) MB/s +35%
Average of class Gaming
  (2594 - 16089, n=165, last 2 years)
6323 MB/s +29%
Average Gigabyte AG450E1024-SI
  (4897 - 5181, n=3)
5077 MB/s +4%
Gigabyte G5 KF5 2024
Gigabyte AG450E1024-SI
4897 (4033.03min - 4896.79max) MB/s
Asus TUF Gaming A15 FA507UV
WD PC SN560 SDDPNQE-1T00
4869 (4298.53min - 4868.87max) MB/s -1%
Lenovo LOQ 15IRX9
Micron 2400 MTFDKCD1T0QFM
4611 (4173.71min - 4610.79max) MB/s -6%
Dell Inspiron 16 Plus 7640
SK hynix BC901 HFS001TEJ4X164N
3290 (2756.65min - 3289.51max) MB/s -33%
seq q8 t1 write
Lenovo Legion Pro 5 16IRX9 G9
Samsung PM9A1 MZVL21T0HCLR
4934 (4925.79min - 4933.55max) MB/s +2%
Average of class Gaming
  (539 - 14571, n=165, last 2 years)
4851 MB/s +1%
Gigabyte G5 KF5 2024
Gigabyte AG450E1024-SI
4817 (4142.4min - 4817.36max) MB/s
Average Gigabyte AG450E1024-SI
  (4775 - 4821, n=3)
4804 MB/s 0%
Dell Inspiron 16 Plus 7640
SK hynix BC901 HFS001TEJ4X164N
4053 (3806.69min - 4053.03max) MB/s -16%
Gigabyte G5 KF
SSSTC CA6-8D512
3975 (1794.3min - 3974.73max) MB/s -17%
Lenovo LOQ 15IRX9
Micron 2400 MTFDKCD1T0QFM
3612 (3558.24min - 3612.04max) MB/s -25%
Asus TUF Gaming A15 FA507UV
WD PC SN560 SDDPNQE-1T00
3140 (3055.76min - 3139.87max) MB/s -35%
4k q1 t1 read
Gigabyte G5 KF
SSSTC CA6-8D512
81.7 MB/s 0%
Gigabyte G5 KF5 2024
Gigabyte AG450E1024-SI
81.5 (80.26min - 81.51max) MB/s
Lenovo Legion Pro 5 16IRX9 G9
Samsung PM9A1 MZVL21T0HCLR
80.5 (78.06min - 80.5max) MB/s -1%
Average of class Gaming
  (30.6 - 95.9, n=165, last 2 years)
66 MB/s -19%
Asus TUF Gaming A15 FA507UV
WD PC SN560 SDDPNQE-1T00
62.9 (61.89min - 62.92max) MB/s -23%
Average Gigabyte AG450E1024-SI
  (47.2 - 81.5, n=3)
61.6 MB/s -24%
Lenovo LOQ 15IRX9
Micron 2400 MTFDKCD1T0QFM
54.4 (52.28min - 54.35max) MB/s -33%
Dell Inspiron 16 Plus 7640
SK hynix BC901 HFS001TEJ4X164N
44.5 (43.13min - 44.5max) MB/s -45%
4k q1 t1 write
Gigabyte G5 KF5 2024
Gigabyte AG450E1024-SI
330 (328.21min - 330.19max) MB/s
Average Gigabyte AG450E1024-SI
  (298 - 340, n=3)
323 MB/s -2%
Gigabyte G5 KF
SSSTC CA6-8D512
296 (231.06min - 296.08max) MB/s -10%
Lenovo LOQ 15IRX9
Micron 2400 MTFDKCD1T0QFM
266 (259.13min - 265.64max) MB/s -19%
Lenovo Legion Pro 5 16IRX9 G9
Samsung PM9A1 MZVL21T0HCLR
251 (246.36min - 251.38max) MB/s -24%
Asus TUF Gaming A15 FA507UV
WD PC SN560 SDDPNQE-1T00
229 (227.99min - 229max) MB/s -31%
Average of class Gaming
  (78 - 397, n=165, last 2 years)
224 MB/s -32%
Dell Inspiron 16 Plus 7640
SK hynix BC901 HFS001TEJ4X164N
123 (117.55min - 122.97max) MB/s -63%
4k q32 t16 read
Lenovo Legion Pro 5 16IRX9 G9
Samsung PM9A1 MZVL21T0HCLR
4117 (4077.22min - 4117.27max) MB/s +18%
Gigabyte G5 KF5 2024
Gigabyte AG450E1024-SI
3485 (3458.58min - 3485.22max) MB/s
Average Gigabyte AG450E1024-SI
  (3293 - 3485, n=3)
3360 MB/s -4%
Gigabyte G5 KF
SSSTC CA6-8D512
3181 (1310.9min - 3180.87max) MB/s -9%
Lenovo LOQ 15IRX9
Micron 2400 MTFDKCD1T0QFM
2852 (1702.21min - 2851.88max) MB/s -18%
Average of class Gaming
  (417 - 6172, n=165, last 2 years)
2571 MB/s -26%
Asus TUF Gaming A15 FA507UV
WD PC SN560 SDDPNQE-1T00
1544 (1272.83min - 1543.53max) MB/s -56%
Dell Inspiron 16 Plus 7640
SK hynix BC901 HFS001TEJ4X164N
575 (568.91min - 575.1max) MB/s -84%
4k q32 t16 write
Lenovo Legion Pro 5 16IRX9 G9
Samsung PM9A1 MZVL21T0HCLR
3534 (3522.28min - 3534.26max) MB/s +11%
Average Gigabyte AG450E1024-SI
  (3074 - 3443, n=3)
3237 MB/s +1%
Gigabyte G5 KF5 2024
Gigabyte AG450E1024-SI
3195 (3175.09min - 3194.61max) MB/s
Lenovo LOQ 15IRX9
Micron 2400 MTFDKCD1T0QFM
2535 (2457.97min - 2535.38max) MB/s -21%
Gigabyte G5 KF
SSSTC CA6-8D512
2147 (1232.2min - 2146.52max) MB/s -33%
Average of class Gaming
  (162.3 - 4869, n=165, last 2 years)
2137 MB/s -33%
Asus TUF Gaming A15 FA507UV
WD PC SN560 SDDPNQE-1T00
2038 (1836.85min - 2038.27max) MB/s -36%
Dell Inspiron 16 Plus 7640
SK hynix BC901 HFS001TEJ4X164N
394 (375.37min - 394.14max) MB/s -88%
AS SSD
Score Total
Average Gigabyte AG450E1024-SI
  (7807 - 8778, n=3)
8252 Points +1%
Gigabyte G5 KF5 2024
Gigabyte AG450E1024-SI
8170 Points
Lenovo Legion Pro 5 16IRX9 G9
Samsung PM9A1 MZVL21T0HCLR
7769 Points -5%
Gigabyte G5 KF
SSSTC CA6-8D512
7237 Points -11%
Average of class Gaming
  (2271 - 13854, n=156, last 2 years)
6746 Points -17%
Lenovo LOQ 15IRX9
Micron 2400 MTFDKCD1T0QFM
5947 Points -27%
Asus TUF Gaming A15 FA507UV
WD PC SN560 SDDPNQE-1T00
5043 Points -38%
Dell Inspiron 16 Plus 7640
SK hynix BC901 HFS001TEJ4X164N
4307 Points -47%
Score Read
Gigabyte G5 KF5 2024
Gigabyte AG450E1024-SI
3323 Points
Average Gigabyte AG450E1024-SI
  (3051 - 3323, n=3)
3175 Points -4%
Gigabyte G5 KF
SSSTC CA6-8D512
3127 Points -6%
Lenovo Legion Pro 5 16IRX9 G9
Samsung PM9A1 MZVL21T0HCLR
2963 Points -11%
Average of class Gaming
  (776 - 4721, n=156, last 2 years)
2446 Points -26%
Lenovo LOQ 15IRX9
Micron 2400 MTFDKCD1T0QFM
2363 Points -29%
Asus TUF Gaming A15 FA507UV
WD PC SN560 SDDPNQE-1T00
1749 Points -47%
Dell Inspiron 16 Plus 7640
SK hynix BC901 HFS001TEJ4X164N
1260 Points -62%
Score Write
Average Gigabyte AG450E1024-SI
  (3133 - 4006, n=3)
3443 Points +10%
Lenovo Legion Pro 5 16IRX9 G9
Samsung PM9A1 MZVL21T0HCLR
3262 Points +4%
Gigabyte G5 KF5 2024
Gigabyte AG450E1024-SI
3133 Points
Average of class Gaming
  (515 - 7208, n=156, last 2 years)
3112 Points -1%
Gigabyte G5 KF
SSSTC CA6-8D512
2608 Points -17%
Dell Inspiron 16 Plus 7640
SK hynix BC901 HFS001TEJ4X164N
2482 Points -21%
Asus TUF Gaming A15 FA507UV
WD PC SN560 SDDPNQE-1T00
2449 Points -22%
Lenovo LOQ 15IRX9
Micron 2400 MTFDKCD1T0QFM
2414 Points -23%
Seq Read
Gigabyte G5 KF
SSSTC CA6-8D512
5712.7 MB/s +36%
Average of class Gaming
  (2260 - 12763, n=156, last 2 years)
4945 MB/s +17%
Asus TUF Gaming A15 FA507UV
WD PC SN560 SDDPNQE-1T00
4260.13 MB/s +1%
Gigabyte G5 KF5 2024
Gigabyte AG450E1024-SI
4215 MB/s
Average Gigabyte AG450E1024-SI
  (4161 - 4215, n=3)
4196 MB/s 0%
Dell Inspiron 16 Plus 7640
SK hynix BC901 HFS001TEJ4X164N
4056.14 MB/s -4%
Lenovo LOQ 15IRX9
Micron 2400 MTFDKCD1T0QFM
3796.49 MB/s -10%
Lenovo Legion Pro 5 16IRX9 G9
Samsung PM9A1 MZVL21T0HCLR
3027 MB/s -28%
Seq Write
Average Gigabyte AG450E1024-SI
  (4234 - 4432, n=3)
4314 MB/s +1%
Gigabyte G5 KF5 2024
Gigabyte AG450E1024-SI
4277 MB/s
Average of class Gaming
  (495 - 11316, n=156, last 2 years)
3760 MB/s -12%
Gigabyte G5 KF
SSSTC CA6-8D512
3701.25 MB/s -13%
Lenovo Legion Pro 5 16IRX9 G9
Samsung PM9A1 MZVL21T0HCLR
3510 MB/s -18%
Asus TUF Gaming A15 FA507UV
WD PC SN560 SDDPNQE-1T00
3100.95 MB/s -27%
Lenovo LOQ 15IRX9
Micron 2400 MTFDKCD1T0QFM
3051.23 MB/s -29%
Dell Inspiron 16 Plus 7640
SK hynix BC901 HFS001TEJ4X164N
2267 MB/s -47%
4K Read
Gigabyte G5 KF5 2024
Gigabyte AG450E1024-SI
98.9 MB/s
Average Gigabyte AG450E1024-SI
  (61.9 - 98.9, n=3)
79.7 MB/s -19%
Gigabyte G5 KF
SSSTC CA6-8D512
79.16 MB/s -20%
Lenovo Legion Pro 5 16IRX9 G9
Samsung PM9A1 MZVL21T0HCLR
75.4 MB/s -24%
Average of class Gaming
  (27.8 - 112.1, n=156, last 2 years)
65.2 MB/s -34%
Asus TUF Gaming A15 FA507UV
WD PC SN560 SDDPNQE-1T00
56.75 MB/s -43%
Lenovo LOQ 15IRX9
Micron 2400 MTFDKCD1T0QFM
53.84 MB/s -46%
Dell Inspiron 16 Plus 7640
SK hynix BC901 HFS001TEJ4X164N
49.59 MB/s -50%
4K Write
Gigabyte G5 KF5 2024
Gigabyte AG450E1024-SI
284 MB/s
Gigabyte G5 KF
SSSTC CA6-8D512
282.28 MB/s -1%
Average Gigabyte AG450E1024-SI
  (255 - 284, n=3)
274 MB/s -4%
Lenovo LOQ 15IRX9
Micron 2400 MTFDKCD1T0QFM
226.41 MB/s -20%
Lenovo Legion Pro 5 16IRX9 G9
Samsung PM9A1 MZVL21T0HCLR
217 MB/s -24%
Average of class Gaming
  (108.8 - 512, n=156, last 2 years)
213 MB/s -25%
Asus TUF Gaming A15 FA507UV
WD PC SN560 SDDPNQE-1T00
187.56 MB/s -34%
Dell Inspiron 16 Plus 7640
SK hynix BC901 HFS001TEJ4X164N
164.61 MB/s -42%
4K-64 Read
Gigabyte G5 KF5 2024
Gigabyte AG450E1024-SI
2803 MB/s
Average Gigabyte AG450E1024-SI
  (2551 - 2803, n=3)
2676 MB/s -5%
Lenovo Legion Pro 5 16IRX9 G9
Samsung PM9A1 MZVL21T0HCLR
2585 MB/s -8%
Gigabyte G5 KF
SSSTC CA6-8D512
2476.84 MB/s -12%
Lenovo LOQ 15IRX9
Micron 2400 MTFDKCD1T0QFM
1929.3 MB/s -31%
Average of class Gaming
  (451 - 3475, n=156, last 2 years)
1881 MB/s -33%
Asus TUF Gaming A15 FA507UV
WD PC SN560 SDDPNQE-1T00
1266.17 MB/s -55%
Dell Inspiron 16 Plus 7640
SK hynix BC901 HFS001TEJ4X164N
804.71 MB/s -71%
4K-64 Write
Average Gigabyte AG450E1024-SI
  (2421 - 3279, n=3)
2738 MB/s +13%
Lenovo Legion Pro 5 16IRX9 G9
Samsung PM9A1 MZVL21T0HCLR
2694 MB/s +11%
Average of class Gaming
  (277 - 5909, n=156, last 2 years)
2527 MB/s +4%
Gigabyte G5 KF5 2024
Gigabyte AG450E1024-SI
2421 MB/s
Dell Inspiron 16 Plus 7640
SK hynix BC901 HFS001TEJ4X164N
2090.45 MB/s -14%
Gigabyte G5 KF
SSSTC CA6-8D512
1955.15 MB/s -19%
Asus TUF Gaming A15 FA507UV
WD PC SN560 SDDPNQE-1T00
1951.29 MB/s -19%
Lenovo LOQ 15IRX9
Micron 2400 MTFDKCD1T0QFM
1882 MB/s -22%
Access Time Read
Dell Inspiron 16 Plus 7640
SK hynix BC901 HFS001TEJ4X164N
0.093 ms * -94%
Average Gigabyte AG450E1024-SI
  (0.048 - 0.088, n=3)
0.06767 ms * -41%
Asus TUF Gaming A15 FA507UV
WD PC SN560 SDDPNQE-1T00
0.063 ms * -31%
Average of class Gaming
  (0.016 - 0.379, n=155, last 2 years)
0.05576 ms * -16%
Gigabyte G5 KF5 2024
Gigabyte AG450E1024-SI
0.048 ms *
Lenovo LOQ 15IRX9
Micron 2400 MTFDKCD1T0QFM
0.033 ms * +31%
Lenovo Legion Pro 5 16IRX9 G9
Samsung PM9A1 MZVL21T0HCLR
0.032 ms * +33%
Gigabyte G5 KF
SSSTC CA6-8D512
0.025 ms * +48%
Access Time Write
Dell Inspiron 16 Plus 7640
SK hynix BC901 HFS001TEJ4X164N
0.318 ms * -2020%
Lenovo LOQ 15IRX9
Micron 2400 MTFDKCD1T0QFM
0.097 ms * -547%
Average of class Gaming
  (0.011 - 1.028, n=156, last 2 years)
0.04728 ms * -215%
Lenovo Legion Pro 5 16IRX9 G9
Samsung PM9A1 MZVL21T0HCLR
0.02 ms * -33%
Asus TUF Gaming A15 FA507UV
WD PC SN560 SDDPNQE-1T00
0.02 ms * -33%
Gigabyte G5 KF
SSSTC CA6-8D512
0.017 ms * -13%
Gigabyte G5 KF5 2024
Gigabyte AG450E1024-SI
0.015 ms *
Average Gigabyte AG450E1024-SI
  (0.015 - 0.015, n=3)
0.015 ms * -0%

* ... im mniej tym lepiej

Continuous read: DiskSpd Read Loop, Queue Depth 8

033567010051340167520102345268030153350368540204355469050255360569560306365Tooltip
Gigabyte G5 KF5 2024 Gigabyte AG450E1024-SI; diskspd 2.0.17 f: Ø3808 (1282.15-5176.82)
Lenovo LOQ 15IRX9 Micron 2400 MTFDKCD1T0QFM; diskspd 2.0.17 f: Ø3364 (2261.87-4608.28)
Asus TUF Gaming A15 FA507UV WD PC SN560 SDDPNQE-1T00; diskspd 2.0.17 f: Ø4300 (3774.46-4795.98)
Lenovo Legion Pro 5 16IRX9 G9 Samsung PM9A1 MZVL21T0HCLR; diskspd 2.0.17 f: Ø4251 (3284.07-6624.06)

Grafika

Karta graficzna RTX 4060 w G5 maksymalne TGP wynosi 75 W, co jest raczej przeciętną wartością. Prawdopodobnie dlatego też G5 rozczarowuje w syntetycznych benchmarkach 3D. Jedynie w teście Cloud Gate, który nie jest już obsługiwany, osiąga nadspodziewanie dobrą wartość. Jego pozostałe wyniki są raczej odzwierciedleniem poprzednika i są o około 6 procent gorsze od przeciętnego laptopa z RTX 4060 z naszej bazy danych. Z wyjątkiem Dell Inspiron 16 Plus 7640 wszyscy konkurenci są szybsi, zwłaszcza Legion 5 Pro, przynajmniej jeśli wykluczyć test Cloud Gate.

Obraz jest podobny w grach: G5 nadal radzi sobie dobrze w tytułach obciążających procesor, ale nie jest w stanie nadążyć za konkurencją w grach intensywnie wykorzystujących GPU. Ponadto, w przeciwieństwie do większości innych laptopów, nasz test wytrzymałości Cyberpunk 2077 wykazał ciągły spadek liczby klatek na sekundę w czasie. To niestabilne zachowanie wskazuje na przeciążony układ chłodzenia, a dławienie dysku SSD również na to wskazuje, więcej na ten temat poniżej. Pomimo stosunkowo słabej wydajności, na RTX 4060 w G5 można zagrać w niemal każdą grę w rozdzielczości Full HD przy średnich lub maksymalnych detalach.

W trybie bateryjnym, całe 73 procent wydajności 3D jest tracone w kolejnym uruchomieniu Fire Strike.

3DMark 11
3DMark 11
Cloud Gate
Cloud Gate
Fire Strike
Fire Strike
Time Spy
Time Spy
3DMark Performance Rating - Percent
Average of class Gaming
 
96.1 pt
Lenovo Legion Pro 5 16IRX9 G9
NVIDIA GeForce RTX 4060 Laptop GPU, Intel Core i7-14700HX
83.8 pt
Asus TUF Gaming A15 FA507UV -1!
NVIDIA GeForce RTX 4060 Laptop GPU, AMD Ryzen 9 8945H
83.4 pt
Gigabyte G5 KF5 2024
NVIDIA GeForce RTX 4060 Laptop GPU, Intel Core i7-13620H
81.6 pt
Average NVIDIA GeForce RTX 4060 Laptop GPU
 
81.3 pt
Lenovo LOQ 15IRX9 -1!
NVIDIA GeForce RTX 4060 Laptop GPU, Intel Core i5-13450HX
80.7 pt
Gigabyte G5 KF
NVIDIA GeForce RTX 4060 Laptop GPU, Intel Core i5-12500H
78.2 pt
Dell Inspiron 16 Plus 7640 -1!
NVIDIA GeForce RTX 4060 Laptop GPU, Intel Core Ultra 7 155H
67.7 pt
3DMark 11 - 1280x720 Performance GPU
Average of class Gaming
  (1029 - 72178, n=183, last 2 years)
43810 Points +33%
Lenovo Legion Pro 5 16IRX9 G9
NVIDIA GeForce RTX 4060 Laptop GPU, Intel Core i7-14700HX
36945 Points +12%
Asus TUF Gaming A15 FA507UV
NVIDIA GeForce RTX 4060 Laptop GPU, AMD Ryzen 9 8945H
36493 Points +11%
Lenovo LOQ 15IRX9
NVIDIA GeForce RTX 4060 Laptop GPU, Intel Core i5-13450HX
35608 Points +8%
Average NVIDIA GeForce RTX 4060 Laptop GPU
  (28136 - 38912, n=56)
34832 Points +6%
Gigabyte G5 KF
NVIDIA GeForce RTX 4060 Laptop GPU, Intel Core i5-12500H
33490 Points +2%
Gigabyte G5 KF5 2024
NVIDIA GeForce RTX 4060 Laptop GPU, Intel Core i7-13620H
32903 Points
Dell Inspiron 16 Plus 7640
NVIDIA GeForce RTX 4060 Laptop GPU, Intel Core Ultra 7 155H
30097 Points -9%
3DMark
1280x720 Cloud Gate Standard Graphics
Gigabyte G5 KF5 2024
NVIDIA GeForce RTX 4060 Laptop GPU, Intel Core i7-13620H
170179 Points
Average NVIDIA GeForce RTX 4060 Laptop GPU
  (81407 - 180228, n=28)
149832 Points -12%
Gigabyte G5 KF
NVIDIA GeForce RTX 4060 Laptop GPU, Intel Core i5-12500H
148762 Points -13%
Average of class Gaming
  (15902 - 193851, n=101, last 2 years)
143583 Points -16%
Lenovo Legion Pro 5 16IRX9 G9
NVIDIA GeForce RTX 4060 Laptop GPU, Intel Core i7-14700HX
138926 Points -18%
1920x1080 Fire Strike Graphics
Average of class Gaming
  (781 - 53059, n=194, last 2 years)
31415 Points +23%
Asus TUF Gaming A15 FA507UV
NVIDIA GeForce RTX 4060 Laptop GPU, AMD Ryzen 9 8945H
28015 Points +10%
Lenovo Legion Pro 5 16IRX9 G9
NVIDIA GeForce RTX 4060 Laptop GPU, Intel Core i7-14700HX
27046 Points +6%
Lenovo LOQ 15IRX9
NVIDIA GeForce RTX 4060 Laptop GPU, Intel Core i5-13450HX
27026 Points +6%
Average NVIDIA GeForce RTX 4060 Laptop GPU
  (20533 - 29656, n=53)
25748 Points +1%
Gigabyte G5 KF5 2024
NVIDIA GeForce RTX 4060 Laptop GPU, Intel Core i7-13620H
25556 Points
Gigabyte G5 KF
NVIDIA GeForce RTX 4060 Laptop GPU, Intel Core i5-12500H
24789 Points -3%
Dell Inspiron 16 Plus 7640
NVIDIA GeForce RTX 4060 Laptop GPU, Intel Core Ultra 7 155H
22476 Points -12%
2560x1440 Time Spy Graphics
Average of class Gaming
  (224 - 22717, n=189, last 2 years)
13118 Points +43%
Lenovo Legion Pro 5 16IRX9 G9
NVIDIA GeForce RTX 4060 Laptop GPU, Intel Core i7-14700HX
10919 Points +19%
Asus TUF Gaming A15 FA507UV
NVIDIA GeForce RTX 4060 Laptop GPU, AMD Ryzen 9 8945H
10189 Points +11%
Average NVIDIA GeForce RTX 4060 Laptop GPU
  (7484 - 11451, n=55)
9936 Points +8%
Lenovo LOQ 15IRX9
NVIDIA GeForce RTX 4060 Laptop GPU, Intel Core i5-13450HX
9830 Points +7%
Gigabyte G5 KF
NVIDIA GeForce RTX 4060 Laptop GPU, Intel Core i5-12500H
9199 Points 0%
Gigabyte G5 KF5 2024
NVIDIA GeForce RTX 4060 Laptop GPU, Intel Core i7-13620H
9183 Points
Dell Inspiron 16 Plus 7640
NVIDIA GeForce RTX 4060 Laptop GPU, Intel Core Ultra 7 155H
8229 Points -10%
3DMark 11 Performance
29001 pkt.
3DMark Cloud Gate Standard Score
58918 pkt.
3DMark Fire Strike Score
20767 pkt.
3DMark Time Spy Score
9497 pkt.
Pomoc
Blender
v3.3 Classroom OPTIX/RTX
Lenovo LOQ 15IRX9
NVIDIA GeForce RTX 4060 Laptop GPU, Intel Core i5-13450HX
25 Seconds * -0%
Gigabyte G5 KF5 2024
NVIDIA GeForce RTX 4060 Laptop GPU, Intel Core i7-13620H
25 Seconds *
Gigabyte G5 KF
NVIDIA GeForce RTX 4060 Laptop GPU, Intel Core i5-12500H
24 Seconds * +4%
Dell Inspiron 16 Plus 7640
NVIDIA GeForce RTX 4060 Laptop GPU, Intel Core Ultra 7 155H
24 Seconds * +4%
Average NVIDIA GeForce RTX 4060 Laptop GPU
  (19 - 28, n=52)
23 Seconds * +8%
Lenovo Legion Pro 5 16IRX9 G9
NVIDIA GeForce RTX 4060 Laptop GPU, Intel Core i7-14700HX
21 Seconds * +16%
Asus TUF Gaming A15 FA507UV
NVIDIA GeForce RTX 4060 Laptop GPU, AMD Ryzen 9 8945H
21 Seconds * +16%
Average of class Gaming
  (9 - 95, n=179, last 2 years)
20.9 Seconds * +16%
v3.3 Classroom CUDA
Dell Inspiron 16 Plus 7640
NVIDIA GeForce RTX 4060 Laptop GPU, Intel Core Ultra 7 155H
44 Seconds * -2%
Lenovo LOQ 15IRX9
NVIDIA GeForce RTX 4060 Laptop GPU, Intel Core i5-13450HX
44 Seconds * -2%
Average NVIDIA GeForce RTX 4060 Laptop GPU
  (39 - 53, n=52)
43.2 Seconds * -0%
Gigabyte G5 KF5 2024
NVIDIA GeForce RTX 4060 Laptop GPU, Intel Core i7-13620H
43 Seconds *
Gigabyte G5 KF
NVIDIA GeForce RTX 4060 Laptop GPU, Intel Core i5-12500H
42 Seconds * +2%
Lenovo Legion Pro 5 16IRX9 G9
NVIDIA GeForce RTX 4060 Laptop GPU, Intel Core i7-14700HX
41 Seconds * +5%
Asus TUF Gaming A15 FA507UV
NVIDIA GeForce RTX 4060 Laptop GPU, AMD Ryzen 9 8945H
41 Seconds * +5%
Average of class Gaming
  (16 - 175, n=185, last 2 years)
36.9 Seconds * +14%
v3.3 Classroom CPU
Gigabyte G5 KF
NVIDIA GeForce RTX 4060 Laptop GPU, Intel Core i5-12500H
452 Seconds * -20%
Lenovo LOQ 15IRX9
NVIDIA GeForce RTX 4060 Laptop GPU, Intel Core i5-13450HX
397 Seconds * -5%
Gigabyte G5 KF5 2024
NVIDIA GeForce RTX 4060 Laptop GPU, Intel Core i7-13620H
378 Seconds *
Dell Inspiron 16 Plus 7640
NVIDIA GeForce RTX 4060 Laptop GPU, Intel Core Ultra 7 155H
365 Seconds * +3%
Average NVIDIA GeForce RTX 4060 Laptop GPU
  (189 - 452, n=52)
311 Seconds * +18%
Average of class Gaming
  (138 - 962, n=188, last 2 years)
294 Seconds * +22%
Asus TUF Gaming A15 FA507UV
NVIDIA GeForce RTX 4060 Laptop GPU, AMD Ryzen 9 8945H
293 Seconds * +22%
Lenovo Legion Pro 5 16IRX9 G9
NVIDIA GeForce RTX 4060 Laptop GPU, Intel Core i7-14700HX
228 Seconds * +40%

* ... im mniej tym lepiej

Performance Rating - Percent
Average of class Gaming
 
92.3 pt
Lenovo Legion Pro 5 16IRX9 G9
Intel Core i7-14700HX, NVIDIA GeForce RTX 4060 Laptop GPU
90 pt
Asus TUF Gaming A15 FA507UV
AMD Ryzen 9 8945H, NVIDIA GeForce RTX 4060 Laptop GPU
80.8 pt
Lenovo LOQ 15IRX9 -1!
Intel Core i5-13450HX, NVIDIA GeForce RTX 4060 Laptop GPU
79.6 pt
Gigabyte G5 KF5 2024
Intel Core i7-13620H, NVIDIA GeForce RTX 4060 Laptop GPU
79.2 pt
Gigabyte G5 KF
Intel Core i5-12500H, NVIDIA GeForce RTX 4060 Laptop GPU
74.4 pt
Dell Inspiron 16 Plus 7640 -1!
Intel Core Ultra 7 155H, NVIDIA GeForce RTX 4060 Laptop GPU
68.9 pt
Baldur's Gate 3 - 1920x1080 Ultra Preset
Average of class Gaming
  (34.5 - 208, n=45, last 2 years)
103.5 fps +23%
Asus TUF Gaming A15 FA507UV
AMD Ryzen 9 8945H, NVIDIA GeForce RTX 4060 Laptop GPU
93.9 (67.7min, 75.2P0.1, 79P1) fps +12%
Gigabyte G5 KF5 2024
Intel Core i7-13620H, NVIDIA GeForce RTX 4060 Laptop GPU
84 fps
Dell Inspiron 16 Plus 7640
Intel Core Ultra 7 155H, NVIDIA GeForce RTX 4060 Laptop GPU
76.7 fps -9%
Gigabyte G5 KF
Intel Core i5-12500H, NVIDIA GeForce RTX 4060 Laptop GPU
75.1 (28.1min, 36.6P0.1, 54.5P1) fps -11%
Lenovo Legion Pro 5 16IRX9 G9
Intel Core i7-14700HX, NVIDIA GeForce RTX 4060 Laptop GPU
66.5 fps -21%
GTA V - 1920x1080 Highest Settings possible AA:4xMSAA + FX AF:16x
Lenovo Legion Pro 5 16IRX9 G9
Intel Core i7-14700HX, NVIDIA GeForce RTX 4060 Laptop GPU
124.9 (3.49min, 76.9P1) fps +22%
Average of class Gaming
  (12.1 - 167.7, n=170, last 2 years)
113.7 fps +11%
Lenovo LOQ 15IRX9
Intel Core i5-13450HX, NVIDIA GeForce RTX 4060 Laptop GPU
112.6 (5.45min, 76.9P1) fps +10%
Gigabyte G5 KF
Intel Core i5-12500H, NVIDIA GeForce RTX 4060 Laptop GPU
107.6 (4.17min, 66.7P1) fps +5%
Asus TUF Gaming A15 FA507UV
AMD Ryzen 9 8945H, NVIDIA GeForce RTX 4060 Laptop GPU
107.2 (4.45min, 76.9P1) fps +5%
Gigabyte G5 KF5 2024
Intel Core i7-13620H, NVIDIA GeForce RTX 4060 Laptop GPU
102.4 (8.53min, 71.4P1) fps
Final Fantasy XV Benchmark - 1920x1080 High Quality
Average of class Gaming
  (19.2 - 201, n=182, last 2 years)
119.9 fps +29%
Lenovo Legion Pro 5 16IRX9 G9
Intel Core i7-14700HX, NVIDIA GeForce RTX 4060 Laptop GPU
106.1 fps +14%
Asus TUF Gaming A15 FA507UV
AMD Ryzen 9 8945H, NVIDIA GeForce RTX 4060 Laptop GPU
100.7 fps +8%
Lenovo LOQ 15IRX9
Intel Core i5-13450HX, NVIDIA GeForce RTX 4060 Laptop GPU
99.9 fps +7%
Gigabyte G5 KF5 2024
Intel Core i7-13620H, NVIDIA GeForce RTX 4060 Laptop GPU
93.2 fps
Gigabyte G5 KF
Intel Core i5-12500H, NVIDIA GeForce RTX 4060 Laptop GPU
91.9 fps -1%
Dell Inspiron 16 Plus 7640
Intel Core Ultra 7 155H, NVIDIA GeForce RTX 4060 Laptop GPU
78.8 fps -15%
Strange Brigade - 1920x1080 ultra AA:ultra AF:16
Average of class Gaming
  (38.9 - 421, n=179, last 2 years)
229 fps +34%
Lenovo Legion Pro 5 16IRX9 G9
Intel Core i7-14700HX, NVIDIA GeForce RTX 4060 Laptop GPU
199.9 (40.2min, 143.4P1) fps +17%
Asus TUF Gaming A15 FA507UV
AMD Ryzen 9 8945H, NVIDIA GeForce RTX 4060 Laptop GPU
184.2 (41min, 136.6P1) fps +8%
Lenovo LOQ 15IRX9
Intel Core i5-13450HX, NVIDIA GeForce RTX 4060 Laptop GPU
182.7 (43.5min, 133.1P1) fps +7%
Gigabyte G5 KF
Intel Core i5-12500H, NVIDIA GeForce RTX 4060 Laptop GPU
172.1 (71.6min, 126.4P1) fps +1%
Gigabyte G5 KF5 2024
Intel Core i7-13620H, NVIDIA GeForce RTX 4060 Laptop GPU
170.8 (53.4min, 126.3P1) fps
Dell Inspiron 16 Plus 7640
Intel Core Ultra 7 155H, NVIDIA GeForce RTX 4060 Laptop GPU
153.5 (48min, 114.7P1) fps -10%
Dota 2 Reborn - 1920x1080 ultra (3/3) best looking
Lenovo Legion Pro 5 16IRX9 G9
Intel Core i7-14700HX, NVIDIA GeForce RTX 4060 Laptop GPU
183.8 (158.1min) fps +19%
Gigabyte G5 KF5 2024
Intel Core i7-13620H, NVIDIA GeForce RTX 4060 Laptop GPU
154.5 (133.1min) fps
Average of class Gaming
  (65.1 - 220, n=187, last 2 years)
151.2 fps -2%
Lenovo LOQ 15IRX9
Intel Core i5-13450HX, NVIDIA GeForce RTX 4060 Laptop GPU
141 (122.7min) fps -9%
Asus TUF Gaming A15 FA507UV
AMD Ryzen 9 8945H, NVIDIA GeForce RTX 4060 Laptop GPU
139.5 (122.4min) fps -10%
Dell Inspiron 16 Plus 7640
Intel Core Ultra 7 155H, NVIDIA GeForce RTX 4060 Laptop GPU
135.1 (116.3min) fps -13%
Gigabyte G5 KF
Intel Core i5-12500H, NVIDIA GeForce RTX 4060 Laptop GPU
131.2 (115min) fps -15%
X-Plane 11.11 - 1920x1080 high (fps_test=3)
Lenovo Legion Pro 5 16IRX9 G9
Intel Core i7-14700HX, NVIDIA GeForce RTX 4060 Laptop GPU
135.1 fps +32%
Average of class Gaming
  (32.8 - 166.2, n=194, last 2 years)
108.4 fps +6%
Gigabyte G5 KF5 2024
Intel Core i7-13620H, NVIDIA GeForce RTX 4060 Laptop GPU
102 fps
Lenovo LOQ 15IRX9
Intel Core i5-13450HX, NVIDIA GeForce RTX 4060 Laptop GPU
92.2 fps -10%
Asus TUF Gaming A15 FA507UV
AMD Ryzen 9 8945H, NVIDIA GeForce RTX 4060 Laptop GPU
91.7 fps -10%
Gigabyte G5 KF
Intel Core i5-12500H, NVIDIA GeForce RTX 4060 Laptop GPU
87.1 fps -15%
Dell Inspiron 16 Plus 7640
Intel Core Ultra 7 155H, NVIDIA GeForce RTX 4060 Laptop GPU
86.5 fps -15%

Cyberpunk 2077 ultra FPS chart

05101520253035404550556065Tooltip
Gigabyte G5 KF5 2024 i7-13620H, NVIDIA GeForce RTX 4060 Laptop GPU: Ø57.1 (51.9-62.1)
Lenovo LOQ 15IRX9 i5-13450HX, NVIDIA GeForce RTX 4060 Laptop GPU: Ø65.1 (61.4-65.8)
Asus TUF Gaming A15 FA507UV R9 8945H, NVIDIA GeForce RTX 4060 Laptop GPU: Ø66.8 (63.8-67.8)
Lenovo Legion Pro 5 16IRX9 G9 i7-14700HX, NVIDIA GeForce RTX 4060 Laptop GPU: Ø68.5 (65-69.4)
lowmed.highultra
GTA V (2015) 186.4 181.2 170.6 102.4
Dota 2 Reborn (2015) 188.7 172.3 164.9 154.5
Final Fantasy XV Benchmark (2018) 187.2 129.6 93.2
X-Plane 11.11 (2018) 159.3 131.1 102
Strange Brigade (2018) 441 253 192.3 170.8
Baldur's Gate 3 (2023) 125 98 86 84
Cyberpunk 2077 2.1 Phantom Liberty (2023) 114 91 77.2 68.2

Emisje i energia - Przeciążony układ chłodzenia

Emisja hałasu

W trybie wydajności wentylatory są często włączone, a hałas wynosi około 27,87 dB. W naszym teście 3dMark06 wentylatory pozostają na tym poziomie przez długi czas, ale następnie zwiększają się do maksymalnej prędkości 54,82 dB na krótko przed końcem, którą zmierzyliśmy również w Cyberpoint 2077 lub w naszym teście warunków skrajnych. Poprzednik również był tak głośny, bezpośrednia konkurencja pozostaje nieco cichsza, Legion Pro 5 przynajmniej osiąga podobny poziom hałasu, ale także osiąga lepsze wyniki niż nasz G5.

Ponadto, głośny odgłos klikania przy dużym obciążeniu 3D jest niepokojący w naszym modelu testowym. Wygląda to tak, jakby coś wewnątrz okresowo (ok. 2-3 Hz) obijało się o obudowę, co nie robi dobrego wrażenia. Jeśli podniesiemy laptopa i zmienimy jego położenie w dłoni, hałas zmienia się i może również całkowicie zniknąć. Jeśli ponownie go odłożymy, hałas zwykle pojawia się ponownie. W części serwisowej otworzyliśmy obudowę dopiero po tych ustaleniach, ale nie byliśmy w stanie odkryć żadnych luźnych części.
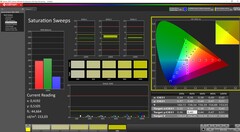
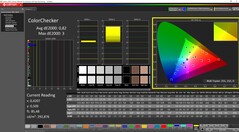
Hałas

luz
23 / 23 / 27.87 dB
obciążenie
54.82 / 54.82 dB
  red to green bar
 
 
30 dB
cichy
40 dB(A)
słyszalny
50 dB(A)
irytujący
 
min: dark, med: mid, max: light   Earthworks M23R, Arta (odległość 15 cm)   environment noise: 23 dB(A)
dB(A) 0102030405060708090Deep BassMiddle BassHigh BassLower RangeMidsHigher MidsLower HighsMid HighsUpper HighsSuper Highs2032.534.832.52525.525.325.53128.926.528.94024.620.824.65025.423.225.46326.828.226.88024.118.524.110023.822.223.812522.114.822.116025.713.925.720027.121.227.12503014.83031533.811.333.840034.69.834.650035.49.935.463036.510.336.580037.710.237.7100043.110.243.1125043.610.243.6160045.910.545.920004511.245250045.31245.3315043.611.643.6400043.812.243.8500042.912.642.9630041.112.441.1800036.712.436.71000033.912.733.9125003112.5311600025.911.725.9SPL54.823.954.8N9.30.59.3median 36.5median 12median 36.5Delta7.61.87.641.636.235.645.641.438.637.929.637.136.147.848.141.344.245.134.232.428.231.132.830.429.730.130.928.340.529.725.326.237.628.920.619.818.52931.422.320.41929.432.822.824.717.329.129.526.126.219.128.831.82422.520.730.532.122.722.116.430.730.921.722.21431.935.425.825.412.834.53731.235.812.538.636.425.527.7123837.325.426.311.738.538.924.926.911.940.438.221.923.912.14038.221.323.312.240.436.420.121.412.438.835.718.620.313.13836.117.818.313.138.33416.716.113.336.431.614.814.913.134.530.114.813.913.233.625.116.113.913.628.721.515.413.513.225.317.714.813.112.721.515.113.612.312.117.847.734.136.425.149.76.11.92.20.76.9median 32.8median 21.7median 22.1median 13.1median 34.55.44.45.21.85hearing rangehide median Fan NoiseGigabyte G5 KF5 2024Lenovo LOQ 15IRX9
Gigabyte G5 KF5 2024
NVIDIA GeForce RTX 4060 Laptop GPU, i7-13620H, Gigabyte AG450E1024-SI
Gigabyte G5 KF
NVIDIA GeForce RTX 4060 Laptop GPU, i5-12500H, SSSTC CA6-8D512
Lenovo LOQ 15IRX9
NVIDIA GeForce RTX 4060 Laptop GPU, i5-13450HX, Micron 2400 MTFDKCD1T0QFM
Asus TUF Gaming A15 FA507UV
NVIDIA GeForce RTX 4060 Laptop GPU, R9 8945H, WD PC SN560 SDDPNQE-1T00
Lenovo Legion Pro 5 16IRX9 G9
NVIDIA GeForce RTX 4060 Laptop GPU, i7-14700HX, Samsung PM9A1 MZVL21T0HCLR
Dell Inspiron 16 Plus 7640
NVIDIA GeForce RTX 4060 Laptop GPU, Ultra 7 155H, SK hynix BC901 HFS001TEJ4X164N
Noise
7%
-9%
1%
5%
9%
off / environment *
23
23
-0%
25
-9%
25
-9%
23
-0%
23.8
-3%
Idle Minimum *
23
23
-0%
26
-13%
25
-9%
23
-0%
24.2
-5%
Idle Average *
23
23
-0%
34
-48%
27
-17%
23
-0%
24.2
-5%
Idle Maximum *
27.87
28
-0%
36
-29%
33
-18%
25
10%
24.2
13%
Load Average *
54.82
29.94
45%
48
12%
40
27%
45.18
18%
28.9
47%
Cyberpunk 2077 ultra *
54.82
48
12%
45
18%
52.69
4%
Load Maximum *
54.82
55.5
-1%
50
9%
46
16%
53.13
3%
51
7%
Witcher 3 ultra *
55.05
51

* ... im mniej tym lepiej

Temperatura

Pomimo dość głośnych wentylatorów w stresie, temperatury powierzchni nie są wcale niskie. Zmierzyliśmy gorący punkt do 67 °C na spodzie, centralnie w kierunku wyświetlacza. To trochę za dużo jak na nasz gust. Niestety, Gigabyte nie zoptymalizował tutaj równie gorącego poprzednika.

Temperatura GPU wzrasta do 88 °C zarówno w testach obciążeniowych, jak i w grach. Temperatura procesora jest jeszcze gorsza: podczas gdy w teście obciążeniowym wynosi już 76-82 °C, w grach stale rośnie do 100 °C i nie spada dalej. Nie jest to idealna sytuacja dla trwałości sprzętu! Jednocześnie wyjaśnia to ciągły spadek liczby klatek na sekundę w Cyberpunk 2077 pokazany powyżej.

Temperatura procesora wzrasta do 100 °C podczas grania!
 45 °C50 °C39 °C 
 41 °C41 °C32 °C 
 25 °C33 °C27 °C 
maks. w ogóle: 50 °C
średnia: 37 °C
44 °C66 °C53 °C
31 °C39 °C28 °C
29 °C24 °C23 °C
maks. w ogóle: 66 °C
średnia: 37.4 °C
zasilacz  56 °C | temperatura otoczenia 18.5 °C | Fluke t3000FC (calibrated), Fluke 62 Mini
(±) The average temperature for the upper side under maximal load is 37 °C / 99 F, compared to the average of 33.9 °C / 93 F for the devices in the class Gaming.
(-) The maximum temperature on the upper side is 50 °C / 122 F, compared to the average of 40.5 °C / 105 F, ranging from 21.2 to 68.8 °C for the class Gaming.
(-) The bottom heats up to a maximum of 66 °C / 151 F, compared to the average of 43.2 °C / 110 F
(+) In idle usage, the average temperature for the upper side is 27.9 °C / 82 F, compared to the device average of 33.9 °C / 93 F.
(±) 3: The average temperature for the upper side is 36.8 °C / 98 F, compared to the average of 33.9 °C / 93 F for the class Gaming.
(+) The palmrests and touchpad are reaching skin temperature as a maximum (33 °C / 91.4 F) and are therefore not hot.
(-) The average temperature of the palmrest area of similar devices was 28.9 °C / 84 F (-4.1 °C / -7.4 F).
Gigabyte G5 KF5 2024
Intel Core i7-13620H, NVIDIA GeForce RTX 4060 Laptop GPU
Gigabyte G5 KF
Intel Core i5-12500H, NVIDIA GeForce RTX 4060 Laptop GPU
Lenovo LOQ 15IRX9
Intel Core i5-13450HX, NVIDIA GeForce RTX 4060 Laptop GPU
Asus TUF Gaming A15 FA507UV
AMD Ryzen 9 8945H, NVIDIA GeForce RTX 4060 Laptop GPU
Lenovo Legion Pro 5 16IRX9 G9
Intel Core i7-14700HX, NVIDIA GeForce RTX 4060 Laptop GPU
Dell Inspiron 16 Plus 7640
Intel Core Ultra 7 155H, NVIDIA GeForce RTX 4060 Laptop GPU
Heat
-1%
5%
8%
-1%
15%
Maximum Upper Side *
50
54
-8%
47
6%
53
-6%
50
-0%
43.4
13%
Maximum Bottom *
66
61
8%
58
12%
46
30%
57
14%
41.6
37%
Idle Upper Side *
32
34
-6%
32
-0%
32
-0%
36
-13%
32.8
-3%
Idle Bottom *
37
36
3%
36
3%
34
8%
39
-5%
32.4
12%

* ... im mniej tym lepiej

Głośnik

Dwa głośniki stereo znajdują się po bokach z przodu i promieniują w dół. Nie są one szczególnie głośne i brakuje im basów, choć tony wysokie są liniowe. Zalecamy podłączenie słuchawek do gniazda audio podczas grania.

dB(A) 0102030405060708090Deep BassMiddle BassHigh BassLower RangeMidsHigher MidsLower HighsMid HighsUpper HighsSuper Highs2027.634.827.62524.225.324.23125.826.525.84021.620.821.65022.723.222.76324.628.224.68017.418.517.410020.422.220.412519.114.819.116018.313.918.320028.721.228.725037.714.837.731547.111.347.1400539.85350057.29.957.263058.210.358.280068.610.268.610007110.271125059.410.259.4160070.510.570.520007311.273250071.21271.2315066.611.666.6400067.212.267.2500063.312.663.3630059.312.459.3800059.512.459.51000054.712.754.7125004812.5481600047.511.747.5SPL79.823.979.8N41.10.541.1median 58.2median 12median 58.2Delta12.91.812.945.63937.135.844.251.331.134.430.931.326.234.518.529.2193617.343.719.147.920.75216.458.31458.412.861.712.566.61267.811.767.311.966.912.163.712.263.712.464.913.16413.16013.358.513.166.313.271.813.677.113.272.712.768.812.167.425.180.70.747.7median 13.1median 641.85.3hearing rangehide median Pink NoiseGigabyte G5 KF5 2024Lenovo LOQ 15IRX9
Frequency diagram (checkboxes can be checked and unchecked to compare devices)
Gigabyte G5 KF5 2024 audio analysis

(±) | speaker loudness is average but good (79.8 dB)
Bass 100 - 315 Hz
(-) | nearly no bass - on average 29.6% lower than median
(±) | linearity of bass is average (12.3% delta to prev. frequency)
Mids 400 - 2000 Hz
(±) | higher mids - on average 7.2% higher than median
(±) | linearity of mids is average (13.3% delta to prev. frequency)
Highs 2 - 16 kHz
(±) | higher highs - on average 5.9% higher than median
(+) | highs are linear (6.1% delta to prev. frequency)
Overall 100 - 16.000 Hz
(±) | linearity of overall sound is average (29.1% difference to median)
Compared to same class
» 94% of all tested devices in this class were better, 2% similar, 4% worse
» The best had a delta of 6%, average was 18%, worst was 132%
Compared to all devices tested
» 85% of all tested devices were better, 3% similar, 12% worse
» The best had a delta of 4%, average was 25%, worst was 134%

Lenovo LOQ 15IRX9 audio analysis

(±) | speaker loudness is average but good (81 dB)
Bass 100 - 315 Hz
(±) | reduced bass - on average 14.6% lower than median
(±) | linearity of bass is average (9.6% delta to prev. frequency)
Mids 400 - 2000 Hz
(+) | balanced mids - only 2.1% away from median
(+) | mids are linear (3.6% delta to prev. frequency)
Highs 2 - 16 kHz
(±) | higher highs - on average 5.9% higher than median
(±) | linearity of highs is average (8.2% delta to prev. frequency)
Overall 100 - 16.000 Hz
(+) | overall sound is linear (14.7% difference to median)
Compared to same class
» 27% of all tested devices in this class were better, 7% similar, 66% worse
» The best had a delta of 6%, average was 18%, worst was 132%
Compared to all devices tested
» 17% of all tested devices were better, 4% similar, 79% worse
» The best had a delta of 4%, average was 25%, worst was 134%

Zużycie energii

W trybie oszczędzania energii pobór mocy w stanie spoczynku wynosi zaledwie 5,2 W. W innych profilach wydajnościowych pobór mocy wzrasta jednak do około 20 W.

W grach (Cyberpunk 2077) zmierzyliśmy średni pobór mocy na poziomie 144 W. W teście warunków skrajnych odnotowano nawet 165 W przez krótkie okresy. Niewielki zasilacz (ok. 13,6 x 6,7 x 2,3 cm (dł. x szer. x wys.)) został zaprojektowany na 150 W i powinien być w stanie poradzić sobie ze wszystkimi zmierzonymi średnimi poborami i pochłonąć krótkie szczyty. Nie pozostaje jednak zbyt wiele miejsca na ładowanie podczas wymagających sesji gamingowych.

Pobór mocy
wyłączony / stan wstrzymaniadarklight 0.1 / 1 W
luzdarkmidlight 5.2 / 19.6 / 23 W
obciążenie midlight 84 / 165 W
 color bar
Legenda: min: dark, med: mid, max: light        Metrahit Energy

Energieaufnahme Cyberpunk / Stresstest

0102030405060708090100110120130140150160Tooltip
Gigabyte G5 KF5 2024; 1280x720 Prime95 28.10 and Furmark 1.25: Ø141.1 (137.37-165.27)
Gigabyte G5 KF5 2024; Idle 150cd/m2: Ø21.7 (20.81-27.463)
Gigabyte G5 KF5 2024; Cyberpunk 2077 FHD ultra no FSR 150cd: Ø143.9 (137.73-151.57)

Power consumption with the external monitor

0102030405060708090100110120130140Tooltip
Gigabyte G5 KF5 2024; Prime95 V2810 Stress (external Monitor): Ø111.5 (97.03-142.09)
Gigabyte G5 KF5 2024; Cinebench R15 Multi (external Monitor): Ø125.6 (119.31-140.51)
Gigabyte G5 KF5 2024; Cinebench R23 Multi (external Monitor): Ø128.4 (110.8-142.44)
Gigabyte G5 KF5 2024; 1280x720 FurMark 1.19 GPU Stress Test (external Monitor): Ø125.5 (119.52-130.45)
Gigabyte G5 KF5 2024; Idle 1min (external Monitor): Ø19.2 (18.333-20.862)
Gigabyte G5 KF5 2024; Cyberpunk 2077 FHD ultra no FSR (external Monitor): Ø144 (140.8-147.04)

Żywotność baterii

Niska cena znajduje również odzwierciedlenie w pojemności baterii, która wynosi zaledwie 54 Wh. Wymieniona konkurencja ma do zaoferowania od 60 do 90 Wh. Niemniej jednak, nasz G5 wypada całkiem dobrze pod względem czasu pracy na baterii, zwłaszcza w porównaniu do LOQ 15 (60 Wh) i Legion Pro 5 (80 Wh), gdzie może nawet osiągnąć lepsze czasy pracy WiFi (5,5 do 7 godzin) i wideo (6 godzin).

Wydajność akumulatora
WiFi Websurfing
7h 15min
WiFi Websurfing max. Brightness
5h 23min
Big Buck Bunny H.264 1080p
6h 03min
obciążenie
1h 05min
Gigabyte G5 KF5 2024
i7-13620H, NVIDIA GeForce RTX 4060 Laptop GPU, 54 Wh
Gigabyte G5 KF
i5-12500H, NVIDIA GeForce RTX 4060 Laptop GPU, 54 Wh
Lenovo LOQ 15IRX9
i5-13450HX, NVIDIA GeForce RTX 4060 Laptop GPU, 60 Wh
Asus TUF Gaming A15 FA507UV
R9 8945H, NVIDIA GeForce RTX 4060 Laptop GPU, 90 Wh
Lenovo Legion Pro 5 16IRX9 G9
i7-14700HX, NVIDIA GeForce RTX 4060 Laptop GPU, 80 Wh
Dell Inspiron 16 Plus 7640
Ultra 7 155H, NVIDIA GeForce RTX 4060 Laptop GPU, 90 Wh
Average of class Gaming
 
Czasy pracy
-3%
-26%
61%
6%
84%
10%
H.264
363
268
-26%
312
-14%
WiFi v1.3
435
316
-27%
320
-26%
702
61%
308
-29%
799
84%
Load
65
94
45%
105
62%
Reader / Idle
514

Ogólna ocena Notebookcheck

Laptop z RTX 4060 za 899 euro: Pomimo pewnych kompromisów, takich jak kamera internetowa 720p i brak portu Thunderbolt, Gigabyte G5 imponuje solidną konstrukcją, dobrą klawiaturą i wysoką dokładnością kolorów wyświetlacza. Jednak jego system chłodzenia wydaje się być zbyt słaby, co uniemożliwia nam polecenie go do zakupu.

Gigabyte G5 KF5 2024 - 17/10/2024 v8
Christian Hintze

Wykonanie
73 / 98 → 75%
Klawiatura
84%
Myszka
82%
Komunikacja
61 / 80 → 77%
Waga
63 / 10-68 → 91%
Akumulator
76 / 95 → 79%
Wyświetlacz
81%
Wydajność w grach
73%
Wydajność w programach użytkowych
84%
AI Performance
94%
Temperatura
75 / 95 → 79%
Hałas
67 / 90 → 75%
Głośniki
60%
Kamerka
24 / 75 → 32%
Średnio
57%
76%
Gaming - Ważona średnia
CO2 Emissions
No Data
Materials
0%
Packaging
15%
Power Use
77.1%
Repairability
50%
Software Updates
22.3%
Recycle Logo Total Sustainability Score: 27.4%

Transparency

The selection of devices to be reviewed is made by our editorial team. The test sample was provided to the author as a loan by the manufacturer or retailer for the purpose of this review. The lender had no influence on this review, nor did the manufacturer receive a copy of this review before publication. There was no obligation to publish this review. We never accept compensation or payment in return for our reviews. As an independent media company, Notebookcheck is not subjected to the authority of manufacturers, retailers or publishers.

This is how Notebookcheck is testing

Every year, Notebookcheck independently reviews hundreds of laptops and smartphones using standardized procedures to ensure that all results are comparable. We have continuously developed our test methods for around 20 years and set industry standards in the process. In our test labs, high-quality measuring equipment is utilized by experienced technicians and editors. These tests involve a multi-stage validation process. Our complex rating system is based on hundreds of well-founded measurements and benchmarks, which maintains objectivity. Further information on our test methods can be found here.

Please share our article, every link counts!
Mail Logo
> laptopy testy i recenzje notebooki > Laptopy > Recenzja laptopa Gigabyte G5 KF5 2024: RTX 4060 w okazyjnej cenie - czy oferta jest tego warta?
Christian Hintze, 2024-10-24 (Update: 2024-10-24)