

Recenzja laptopa HP Victus 16 (2024): Moc RTX 4060 w połączeniu z długim czasem pracy

Seria Victus firmy HP składa się z laptopów do gier klasy podstawowej i średniej - niniejsze urządzenie testowe można zaliczyć do tej drugiej: Procesor Raptor Lake, GeForce RTX 406016 GB pamięci RAM i dysk SSD o pojemności 512 GB składają się na całkowity pakiet kosztujący około 1600 USD. Wśród konkurentów znajdują się takie urządzenia jak Gigabyte G6X 9KG (2024), Dell G16, Asus TUF Gaming A16 FA617XS i Lenovo Legion 5 16IRX G9.
Wersja 2024 Victus 16 jest zbudowana identycznie jak model 2023. Przetestowaliśmy już dwie inkarnacje tego ostatniego (RTX 4050 i RTX 4070).
Potencjalni konkurenci w porównaniu
Ocena | Data | Model | Waga | Wysokość | Rozmiar | Rezolucja | Cena |
|---|---|---|---|---|---|---|---|
| 84.3 % v7 (old) | 05/2024 | HP Victus 16 (2024) i7-14700HX, NVIDIA GeForce RTX 4060 Laptop GPU | 2.4 kg | 23.9 mm | 16.10" | 1920x1080 | |
| 83.2 % v7 (old) | 03/2024 | Gigabyte G6X 9KG (2024) i7-13650HX, NVIDIA GeForce RTX 4060 Laptop GPU | 2.6 kg | 25.1 mm | 16.00" | 1920x1200 | |
| 85.5 % v7 (old) | 02/2024 | Dell G16, i7-13650HX, RTX 4060 i7-13650HX, NVIDIA GeForce RTX 4060 Laptop GPU | 2.8 kg | 25.65 mm | 16.00" | 2560x1600 | |
| 89.1 % v7 (old) | 02/2024 | Lenovo Legion 5 16IRX G9 i7-14650HX, NVIDIA GeForce RTX 4060 Laptop GPU | 2.4 kg | 25.2 mm | 16.00" | 2560x1600 | |
| 86.9 % v7 (old) | 06/2023 | Asus TUF Gaming A16 FA617XS R9 7940HS, Radeon RX 7600S | 2.2 kg | 22.1 mm | 16.00" | 1920x1200 |
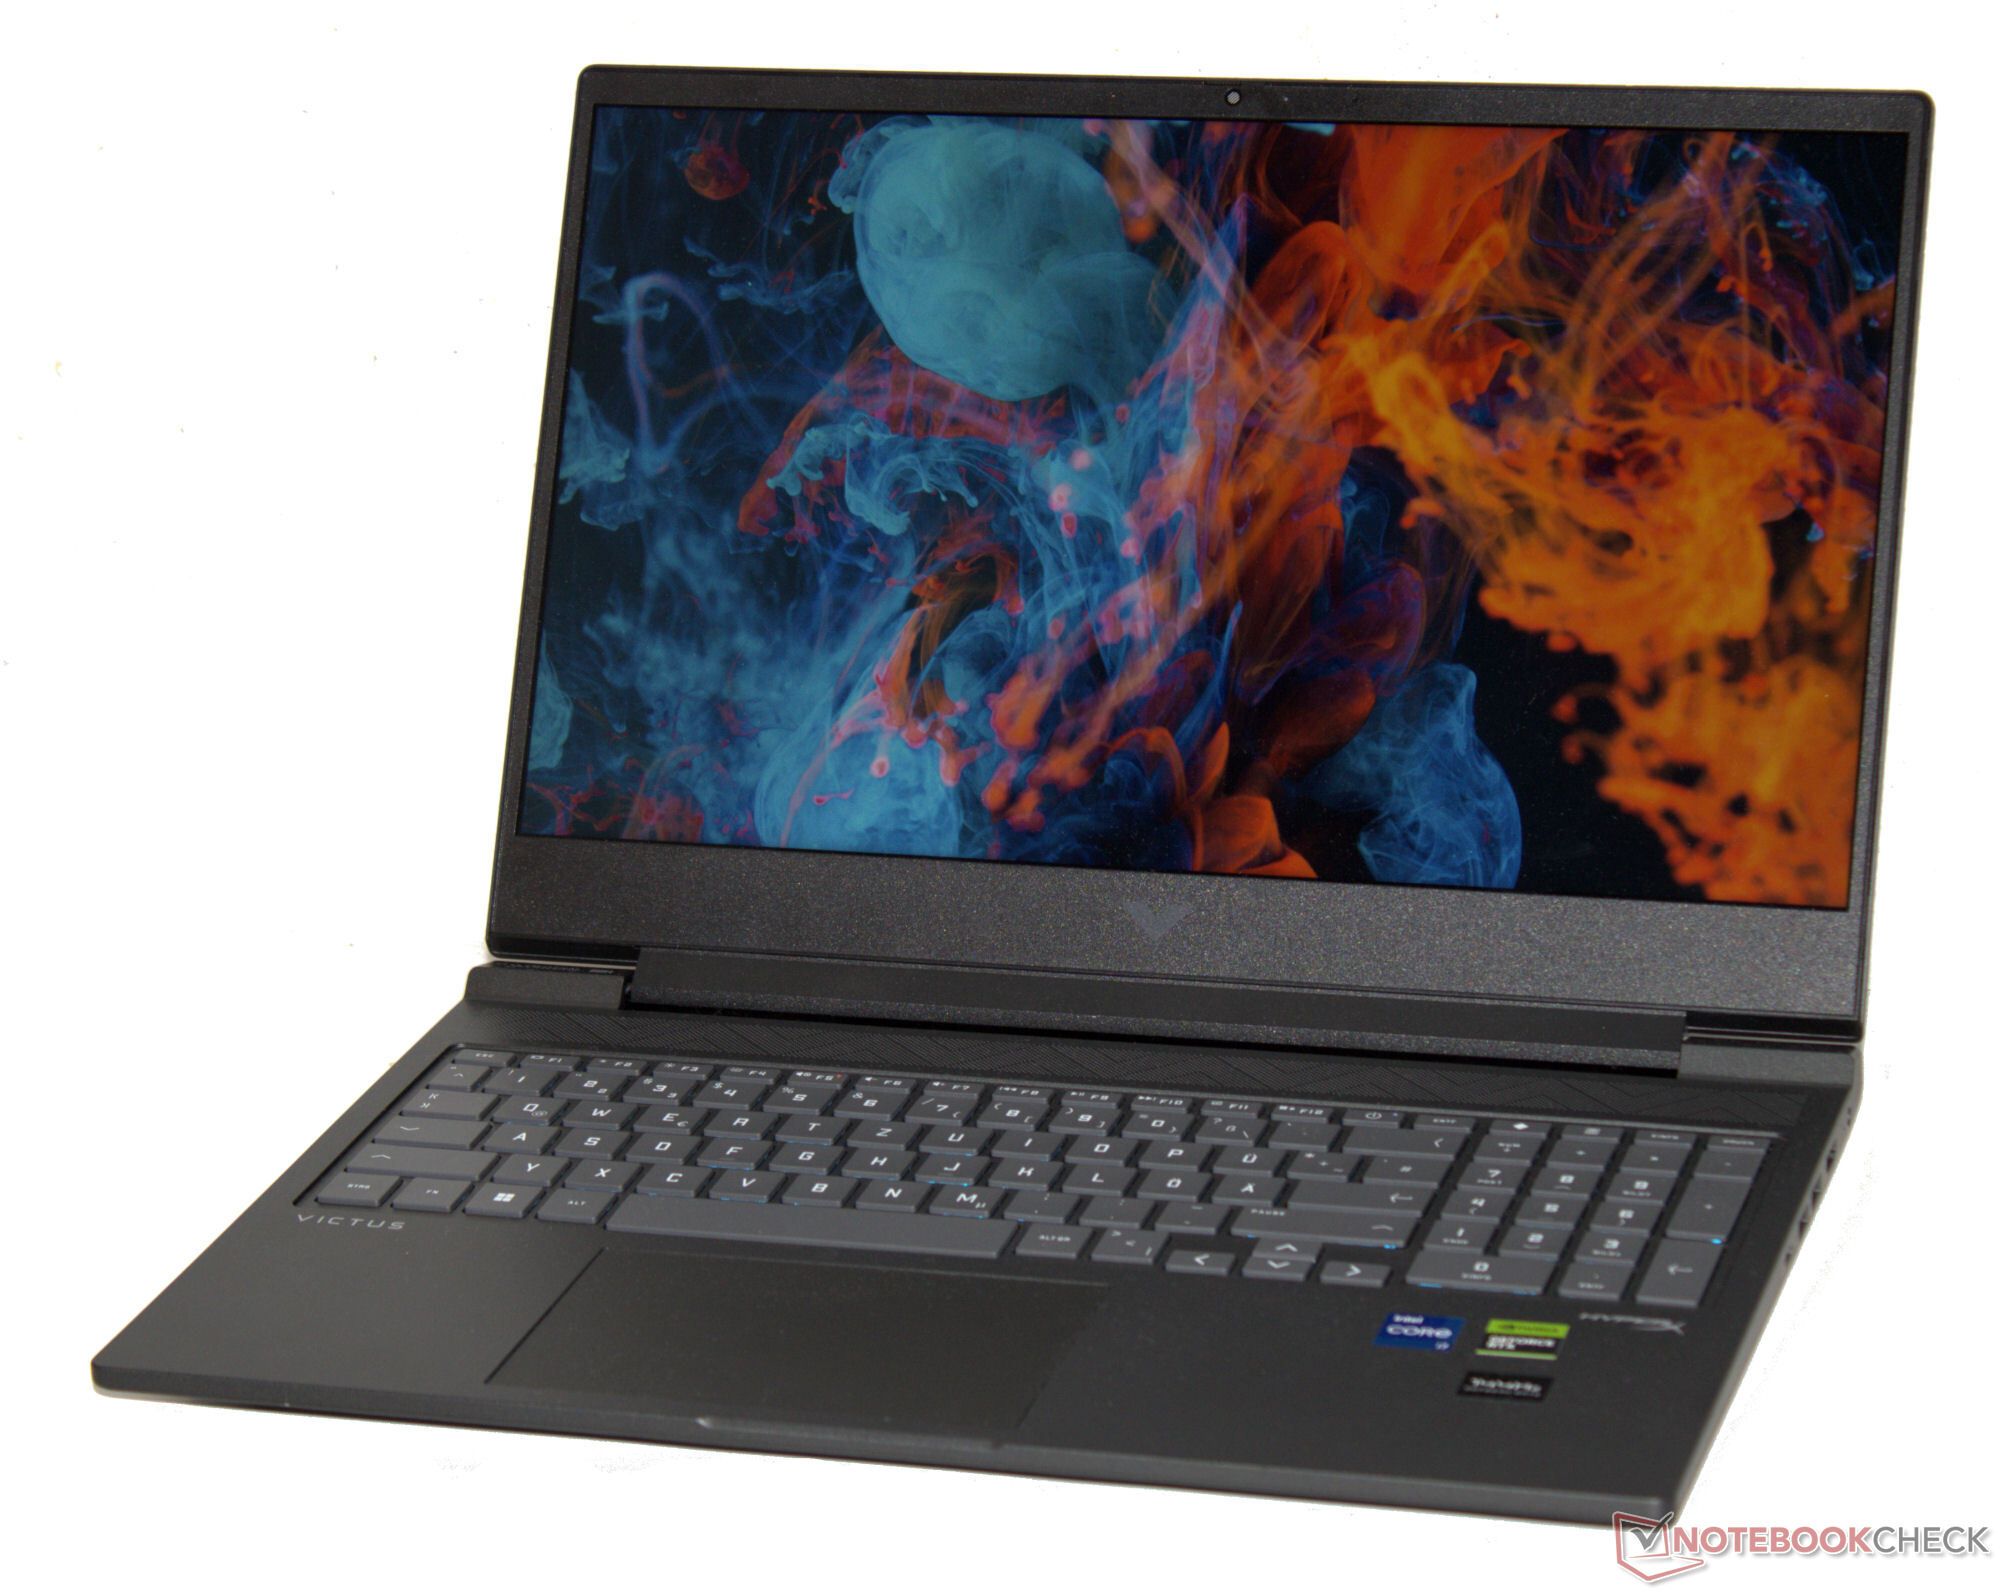
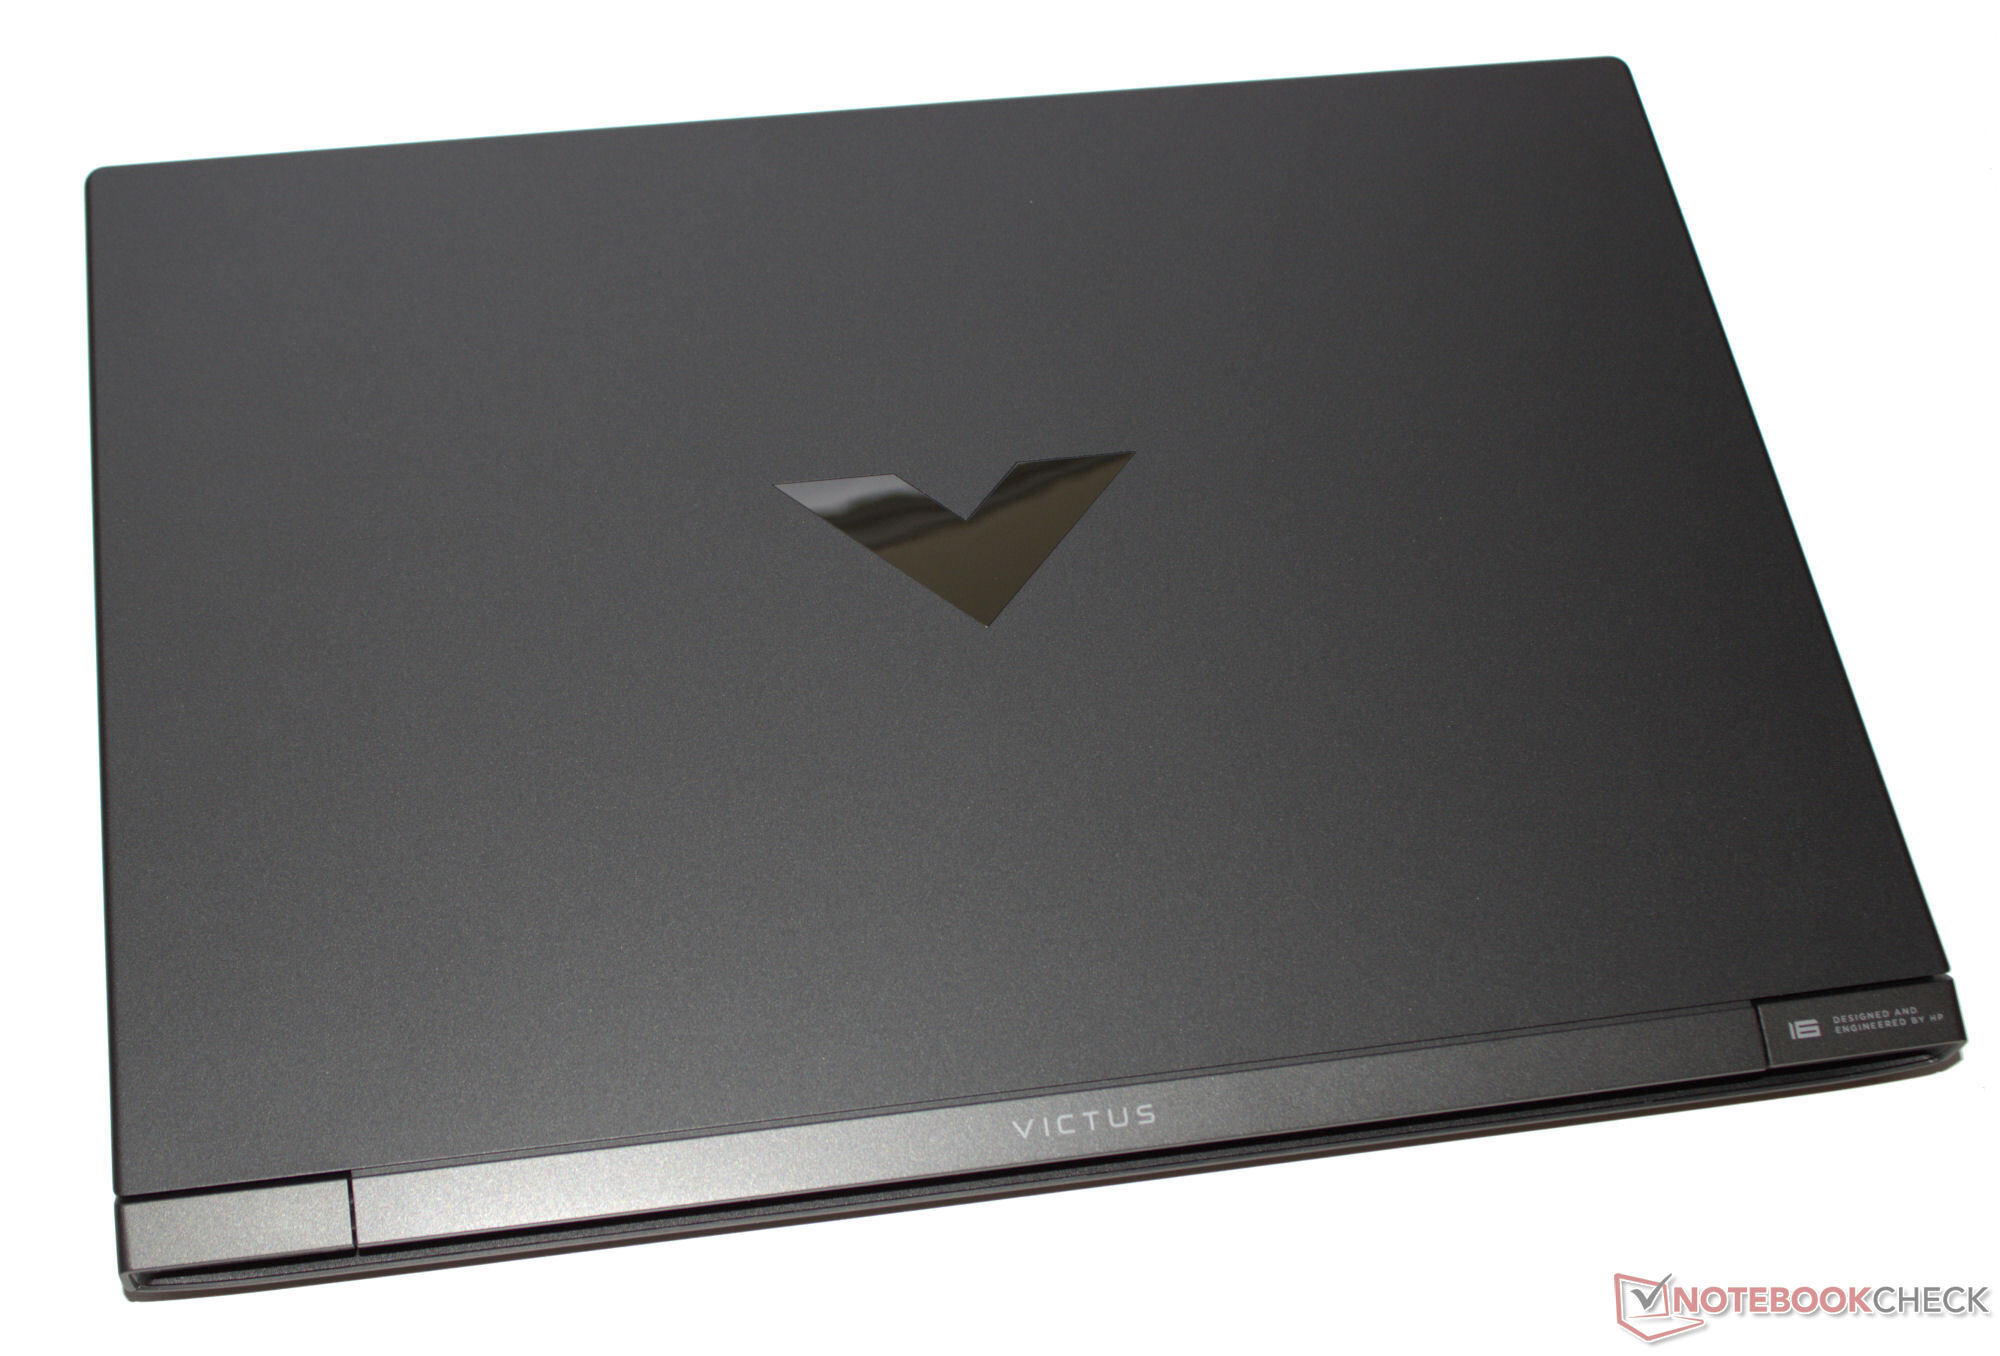
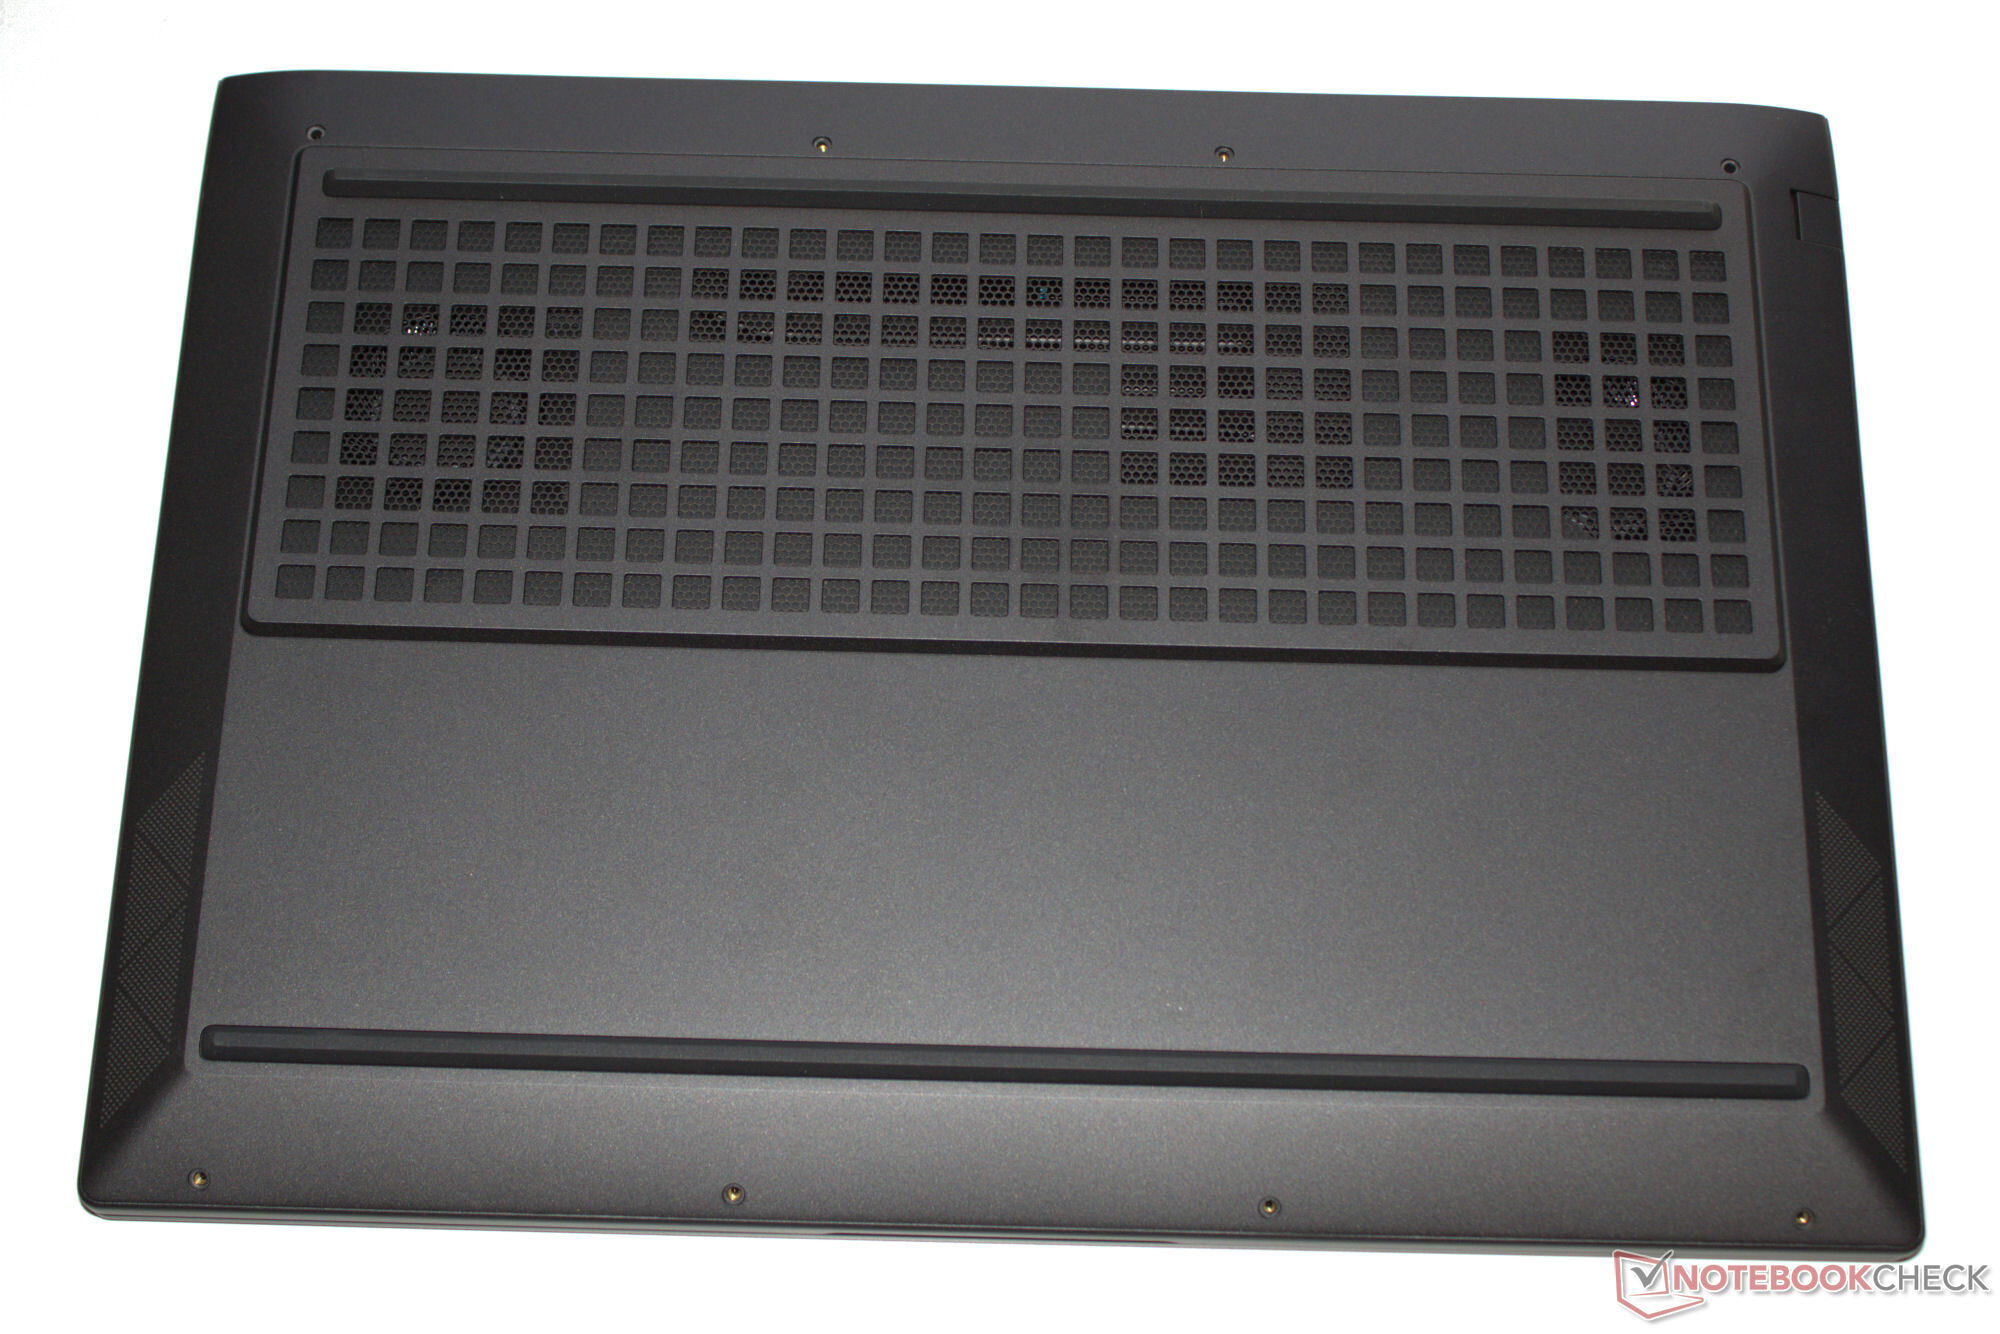
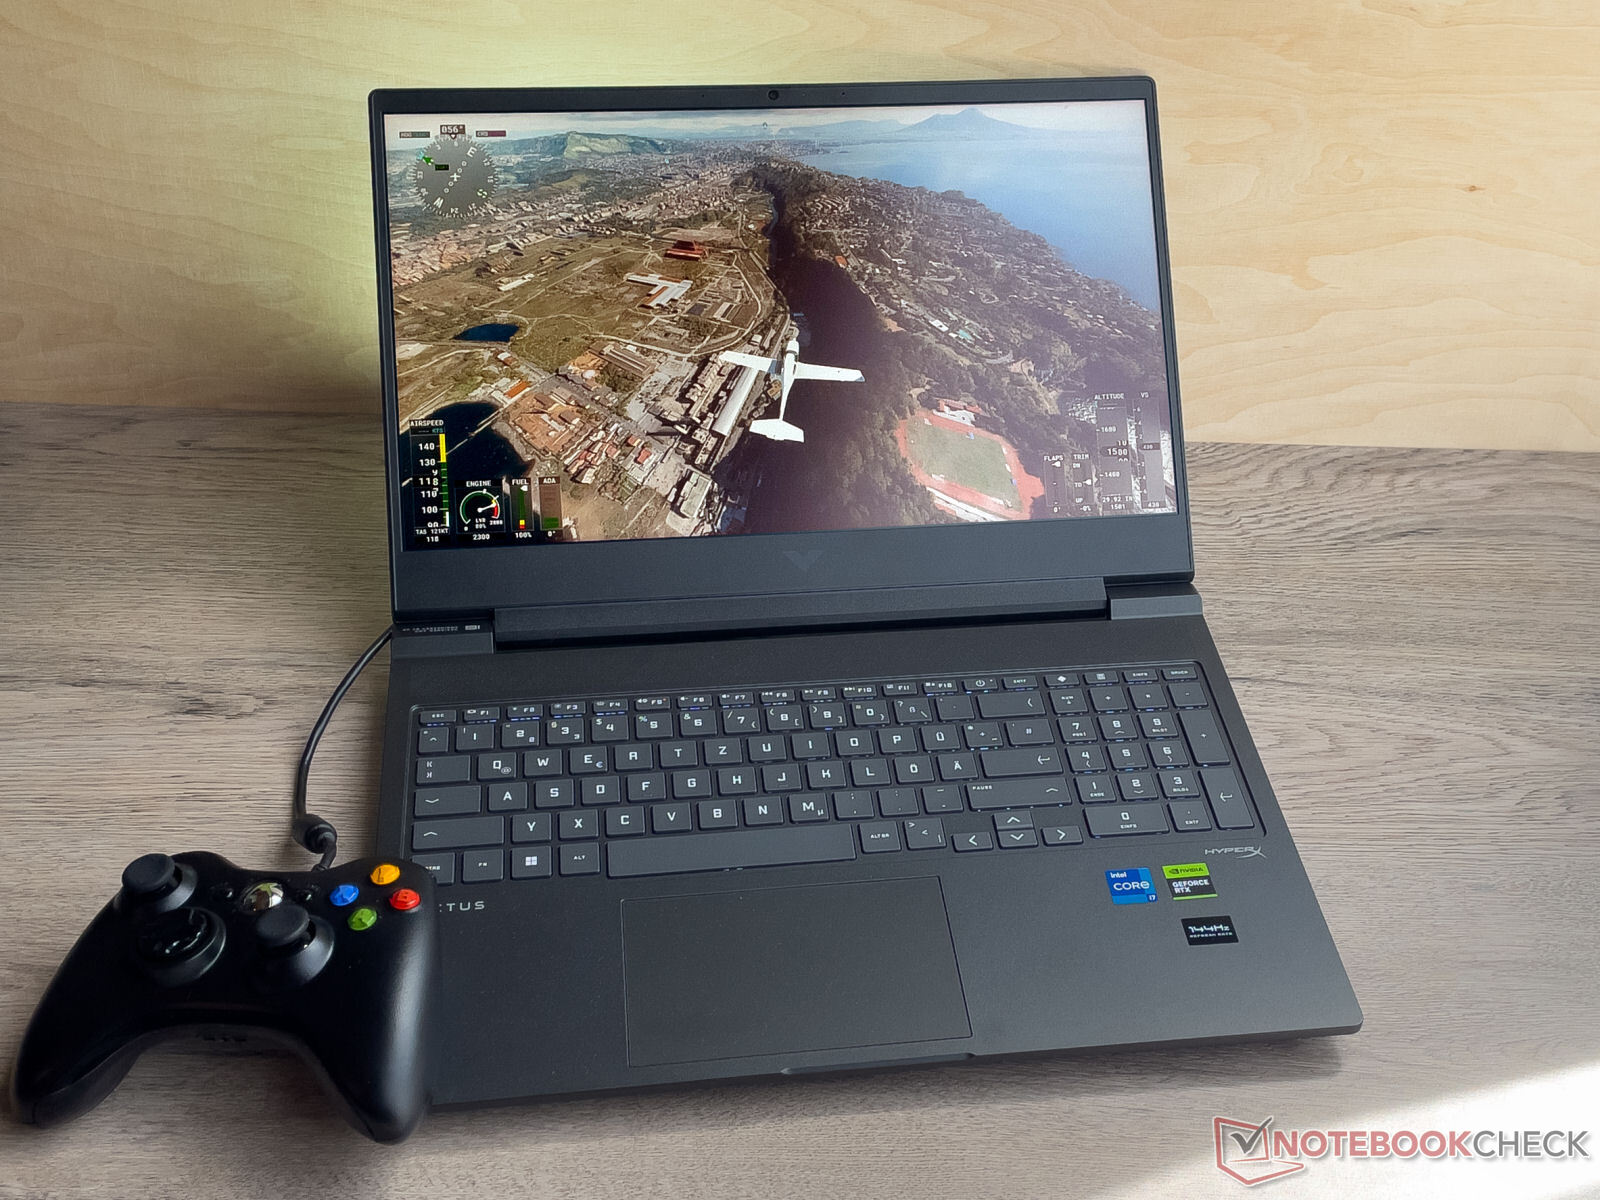
Obudowa i łączność - HP Victus posiada funkcję Power Delivery
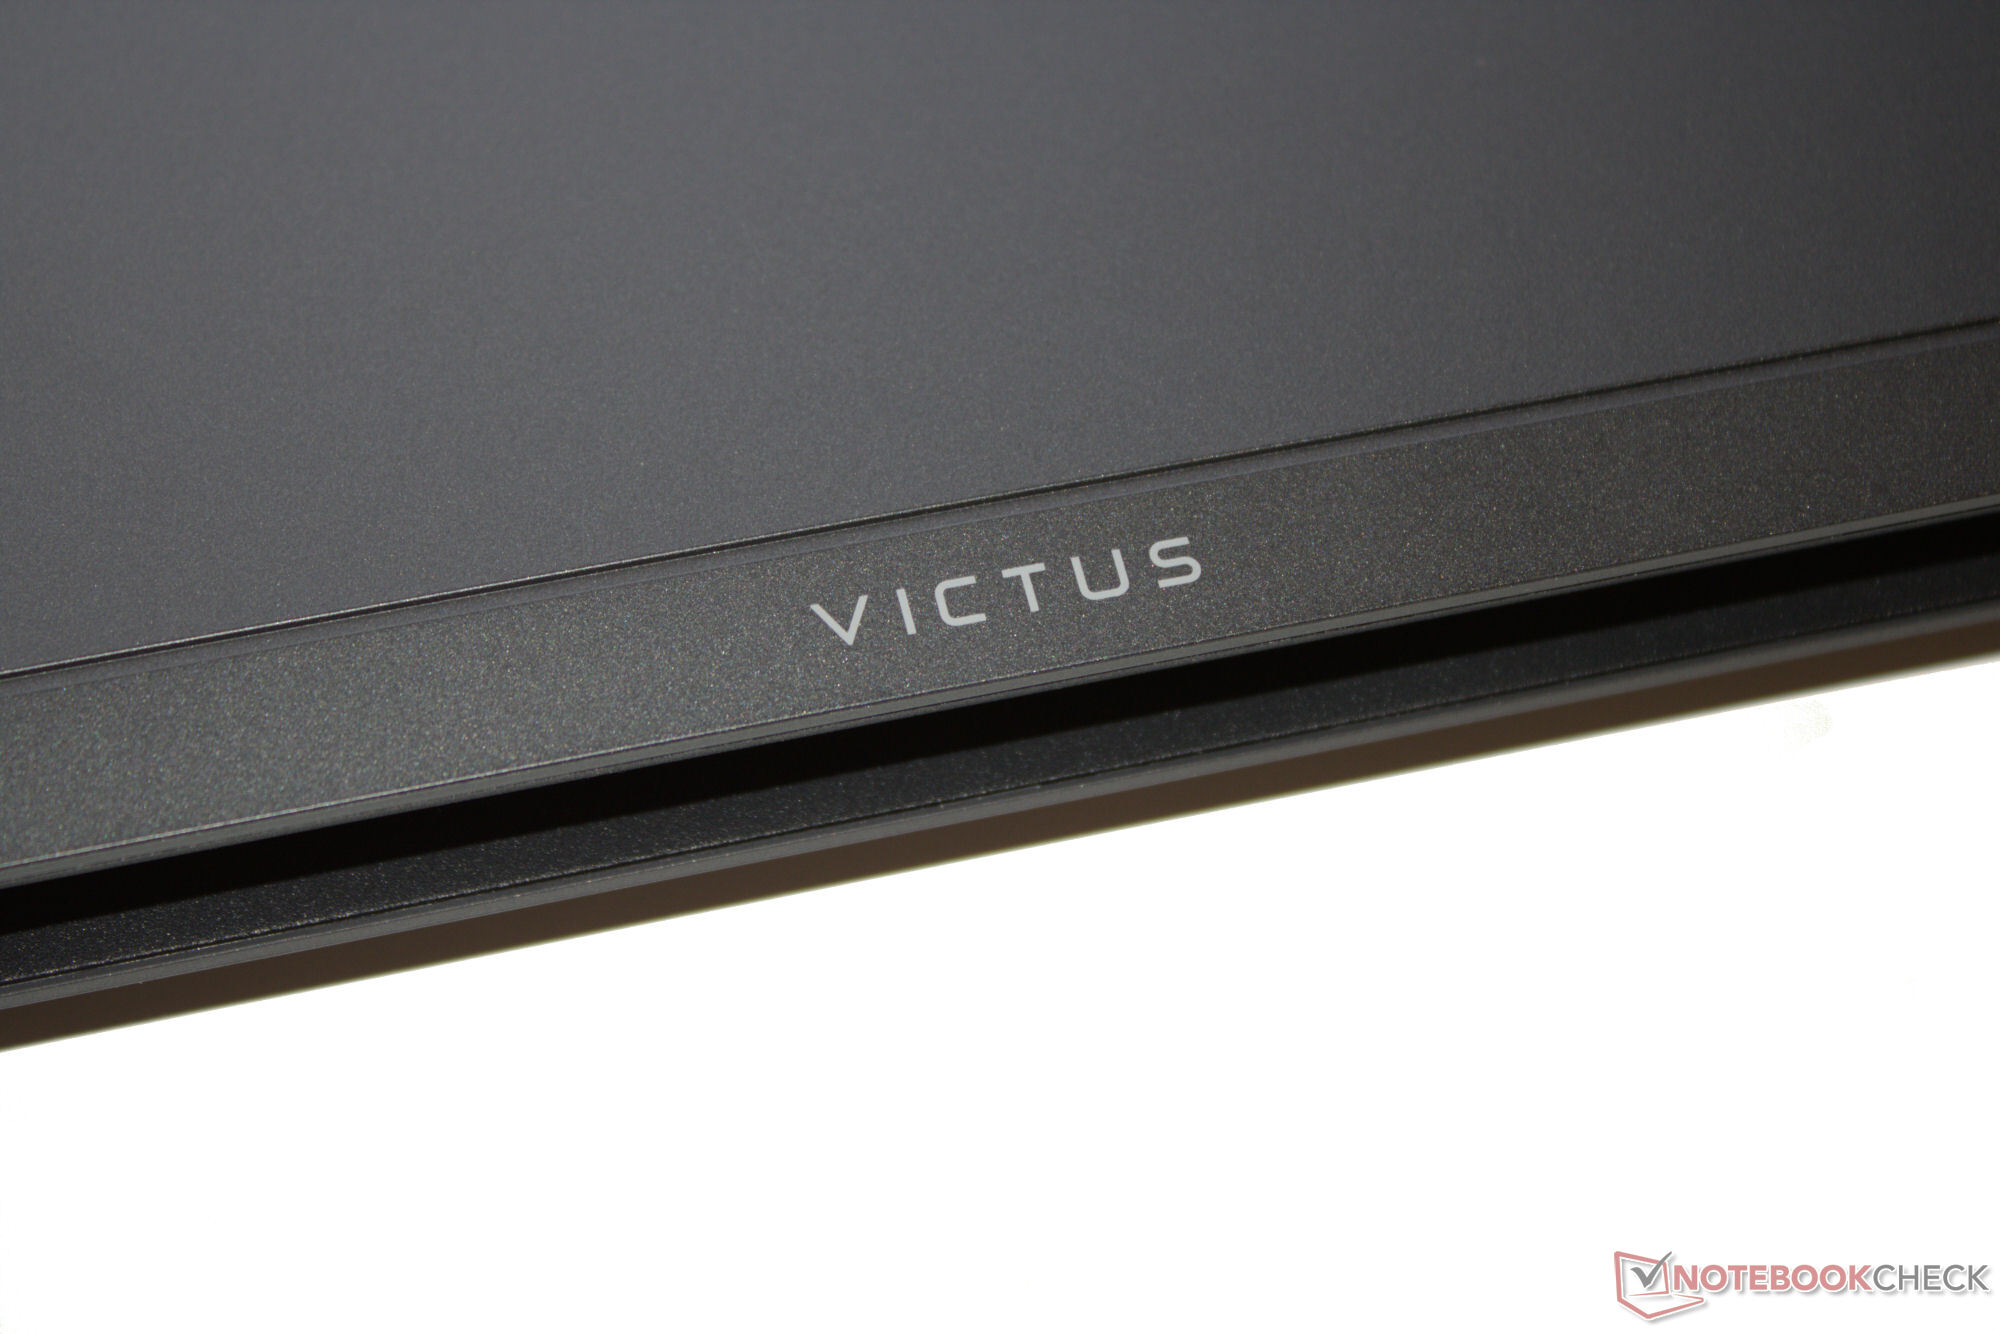
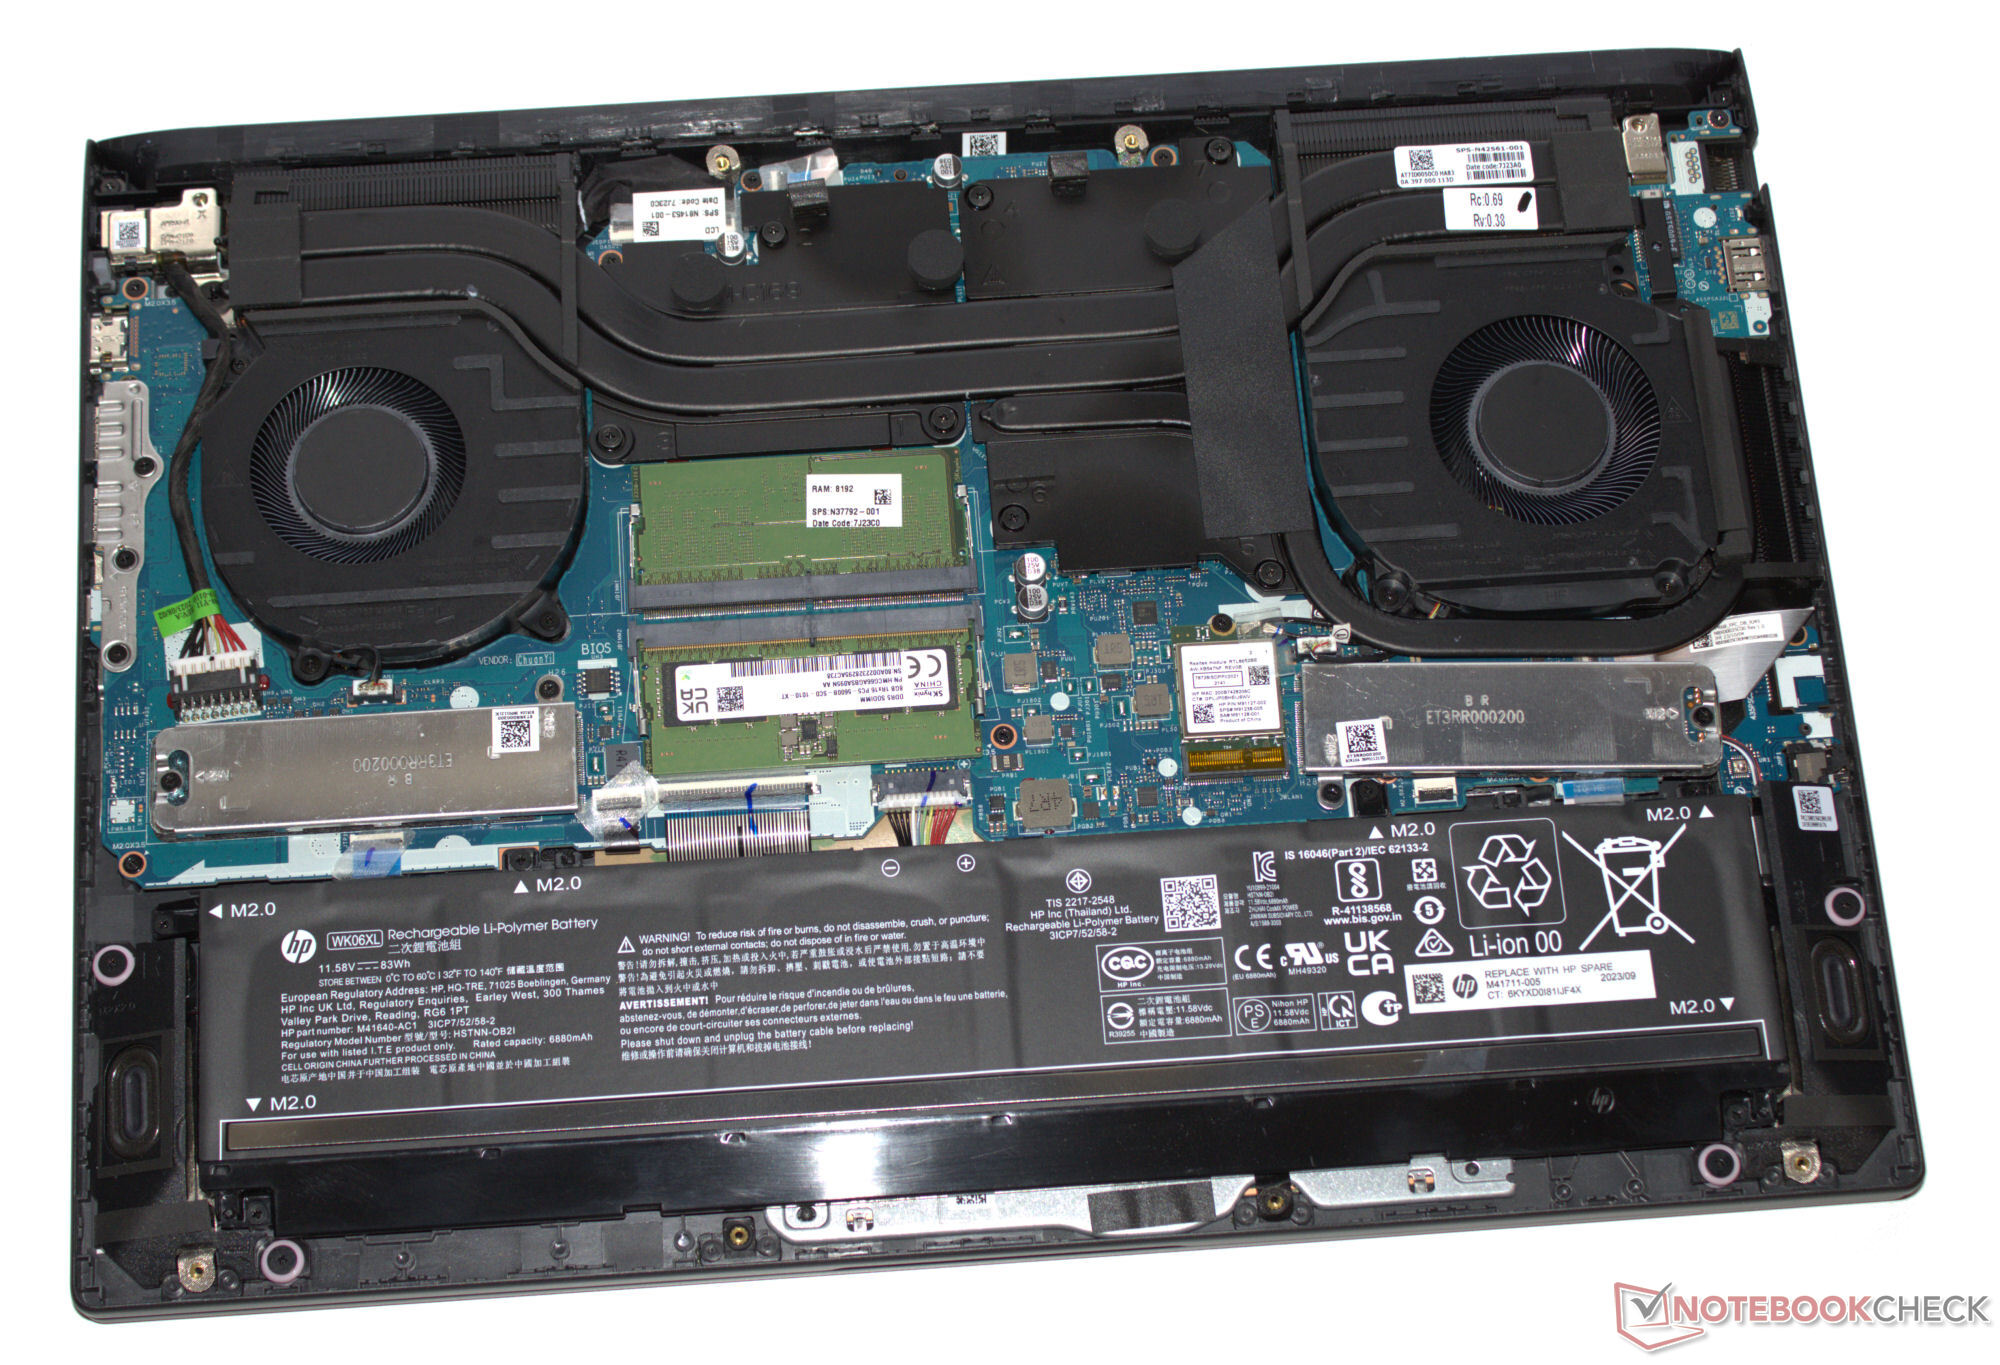
Nie można oczekiwać wysokiej jakości materiałów: Cała obudowa laptopa wykonana jest z matowego plastiku w kolorze "Mica Silver" - ciemnoszarej antracytowej czerni. Pokrywę i podstawę można skręcać. Na okrojonej obudowie nie zastosowano żadnych elementów LED, a najbardziej rzucającym się w oczy dodatkiem jest logo Victus z tyłu pokrywy urządzenia. Dostęp do baterii (przykręcanej, a nie przyklejanej), a także reszty sprzętu można uzyskać po zdjęciu dolnej części obudowy.
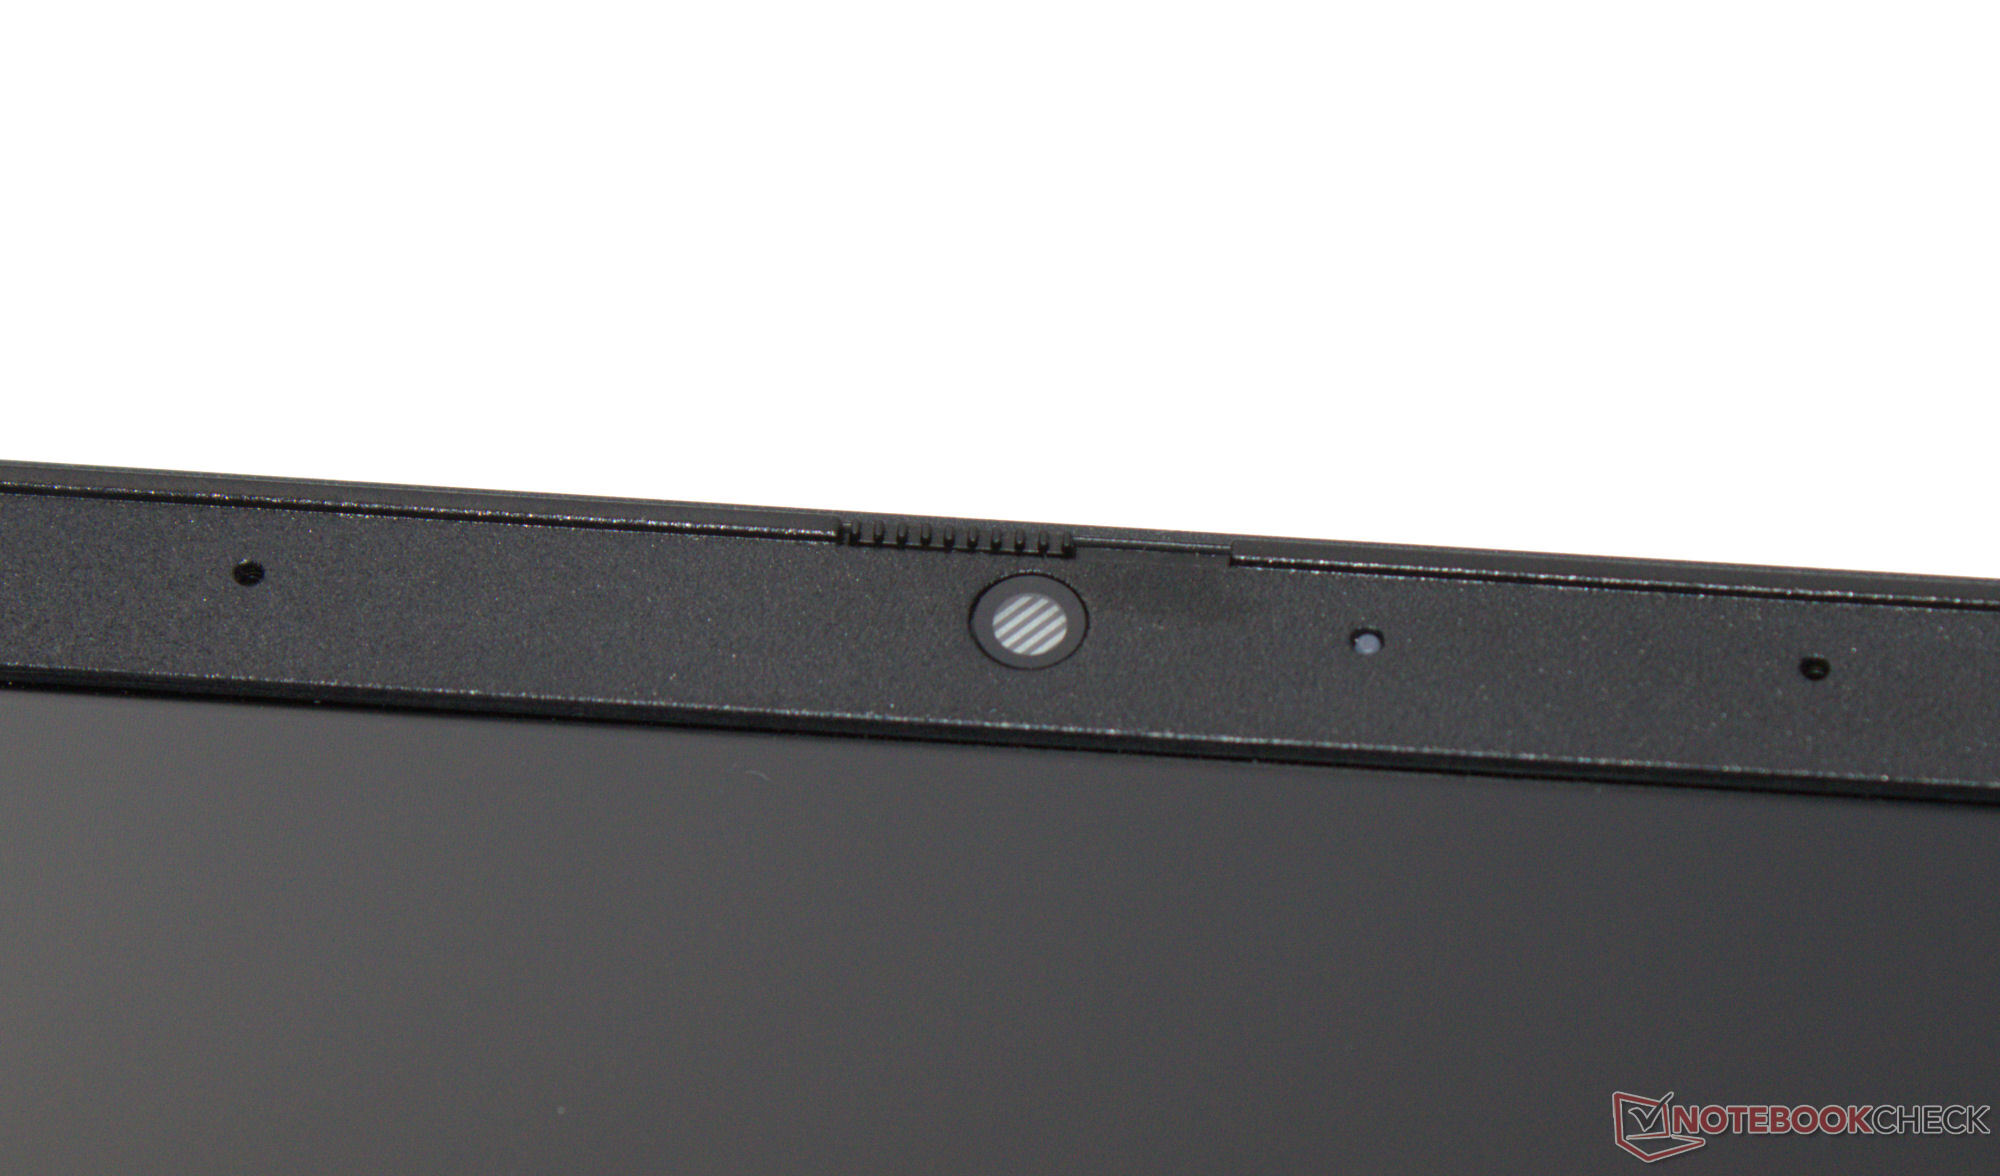
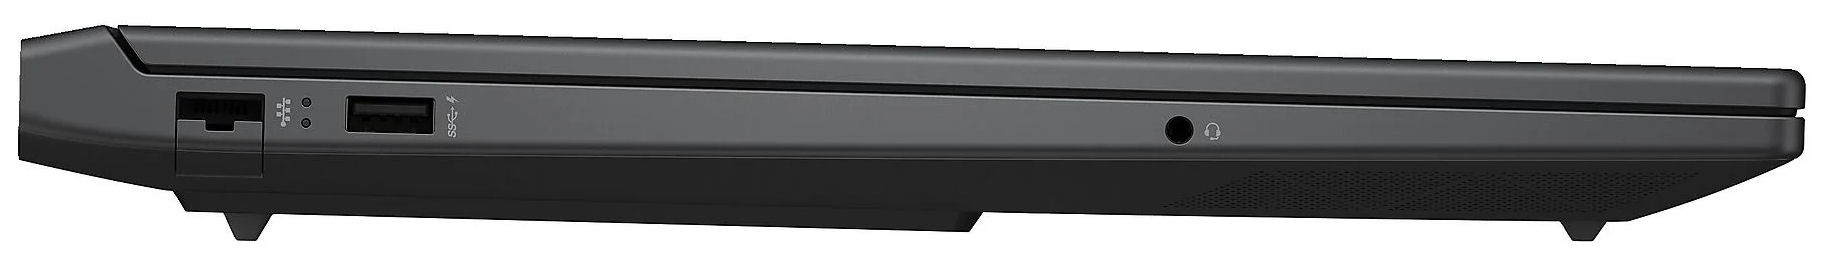
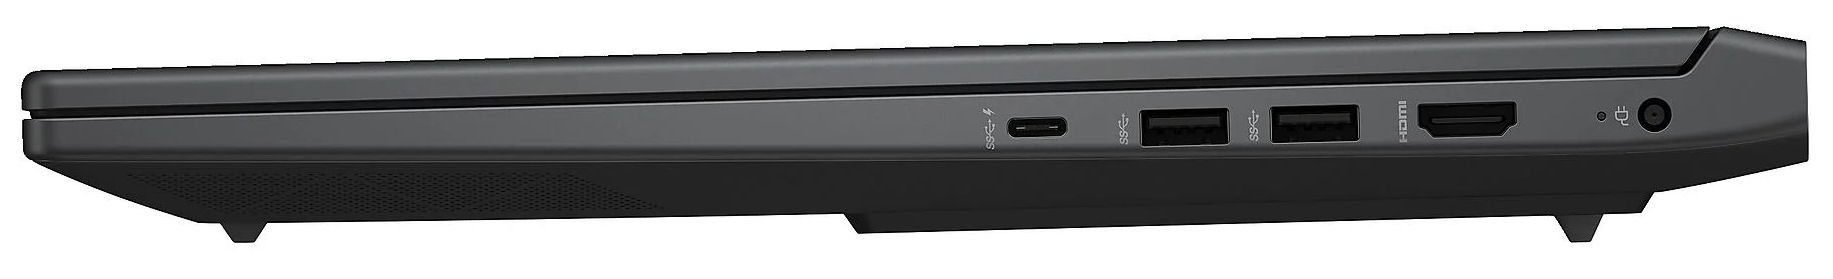
Na próżno szukać tu Thunderbolta i USB 4: Wszystkie cztery porty USB (3x USB-A, 1x USB-C) są zgodne ze standardem USB 3.2 Gen 1. Port USB-C obsługuje funkcję Power Delivery i może wyprowadzać sygnał DisplayPort. W sumie laptop posiada dwa wyjścia wideo (1x HDMI, 1x DP). Jego kamera internetowa (2,1 MP, z osłoną) zapewnia przeciętne wyniki. Laptop nie jest wyposażony w czytnik kart SD.
Victus jest wyposażony w układ Realtek WiFi 6 (RTL8852BE), który nie może konkurować z konkurencyjnymi układami Intela: Zmierzone przez nas prędkości transmisji danych WiFi były przyzwoite, ale nie dorównywały dzisiejszym możliwościom.

 NVIDIA GeForce RTX 4060 Laptop GPU, i7-14700HX, Kioxia XG8 KXG80ZNV512G")
 NVIDIA GeForce RTX 4060 Laptop GPU, i7-14700HX, Kioxia XG8 KXG80ZNV512G")
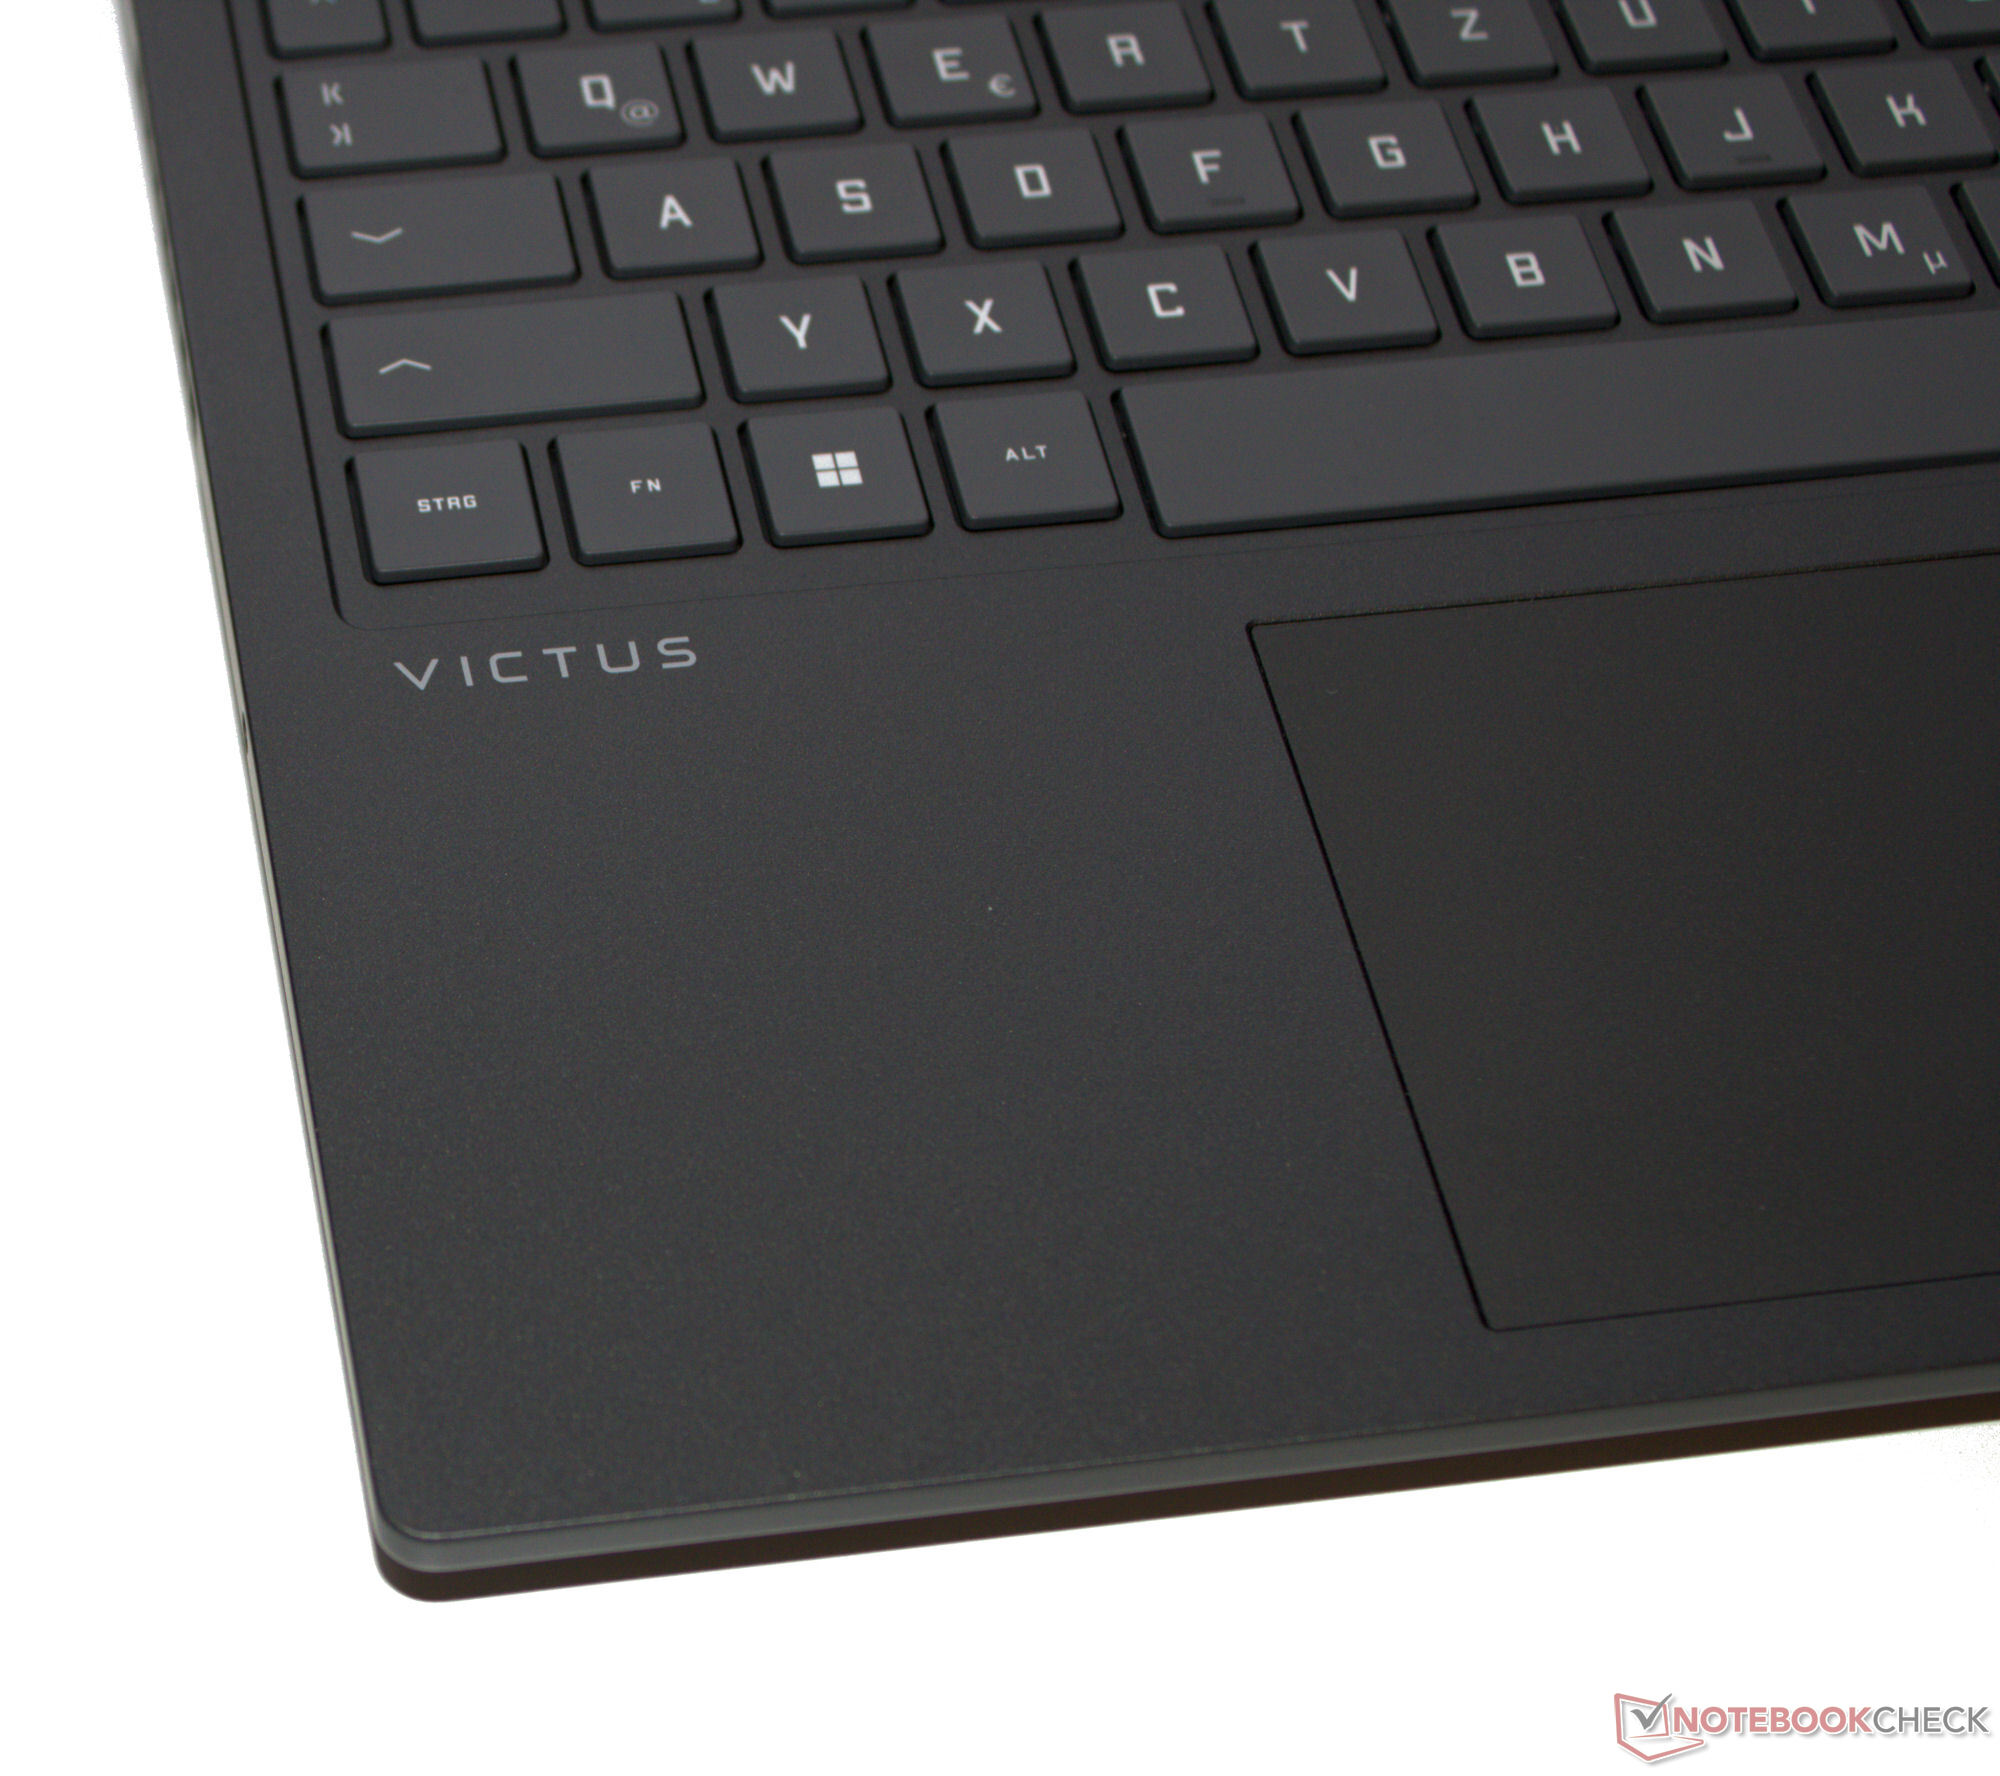
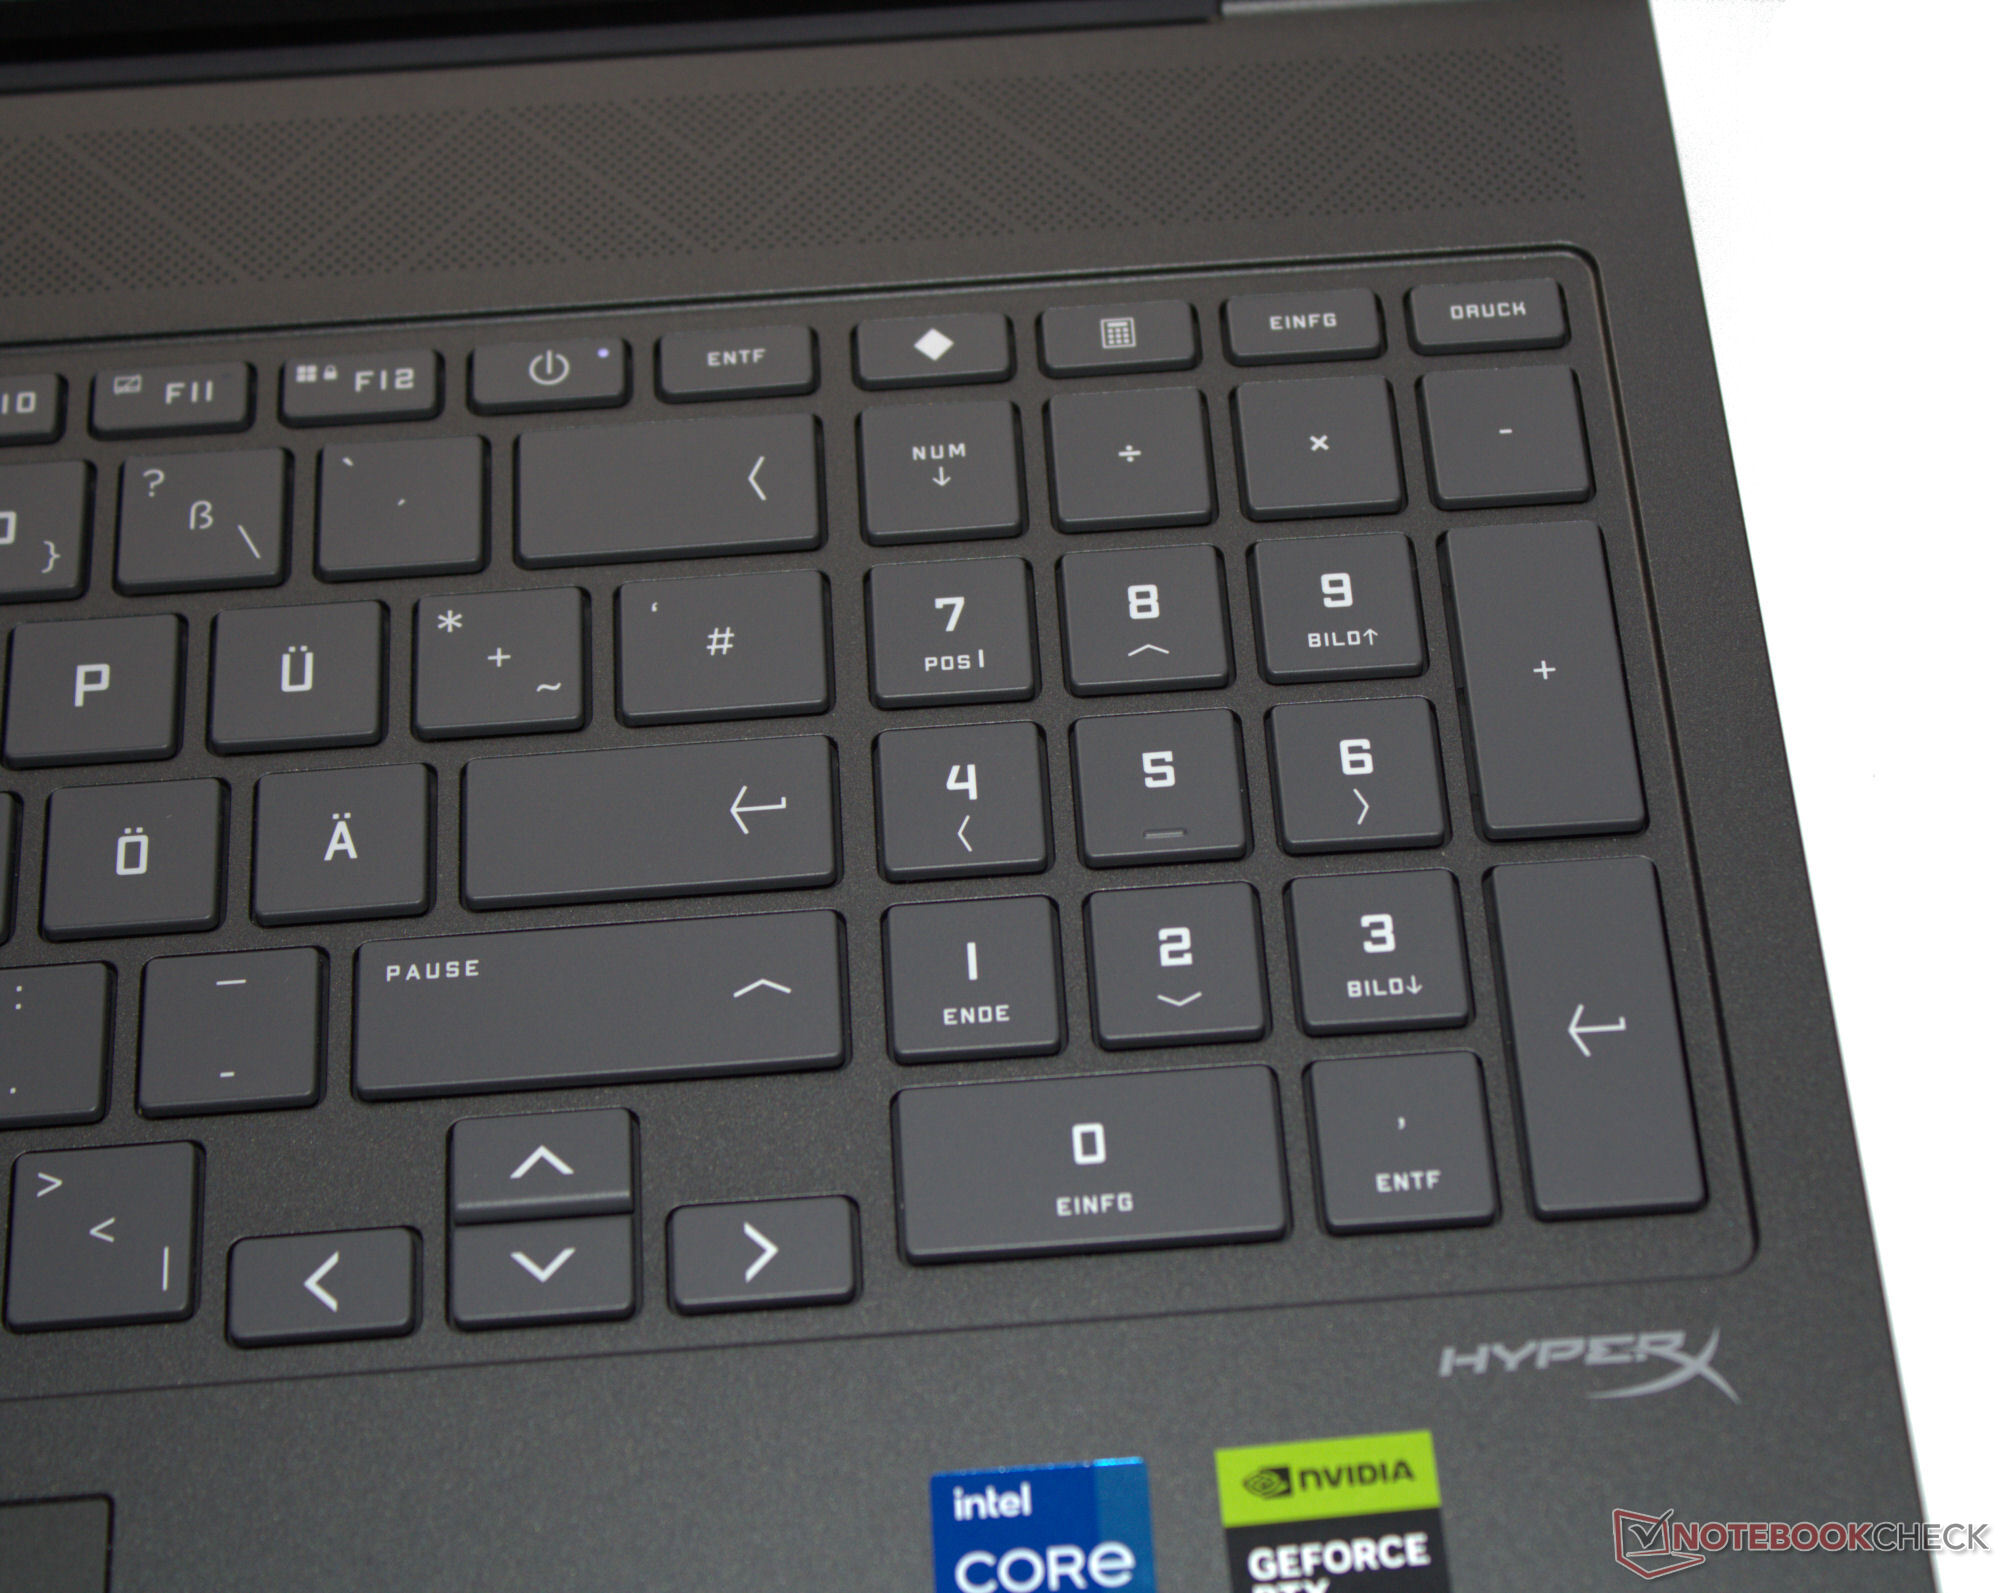
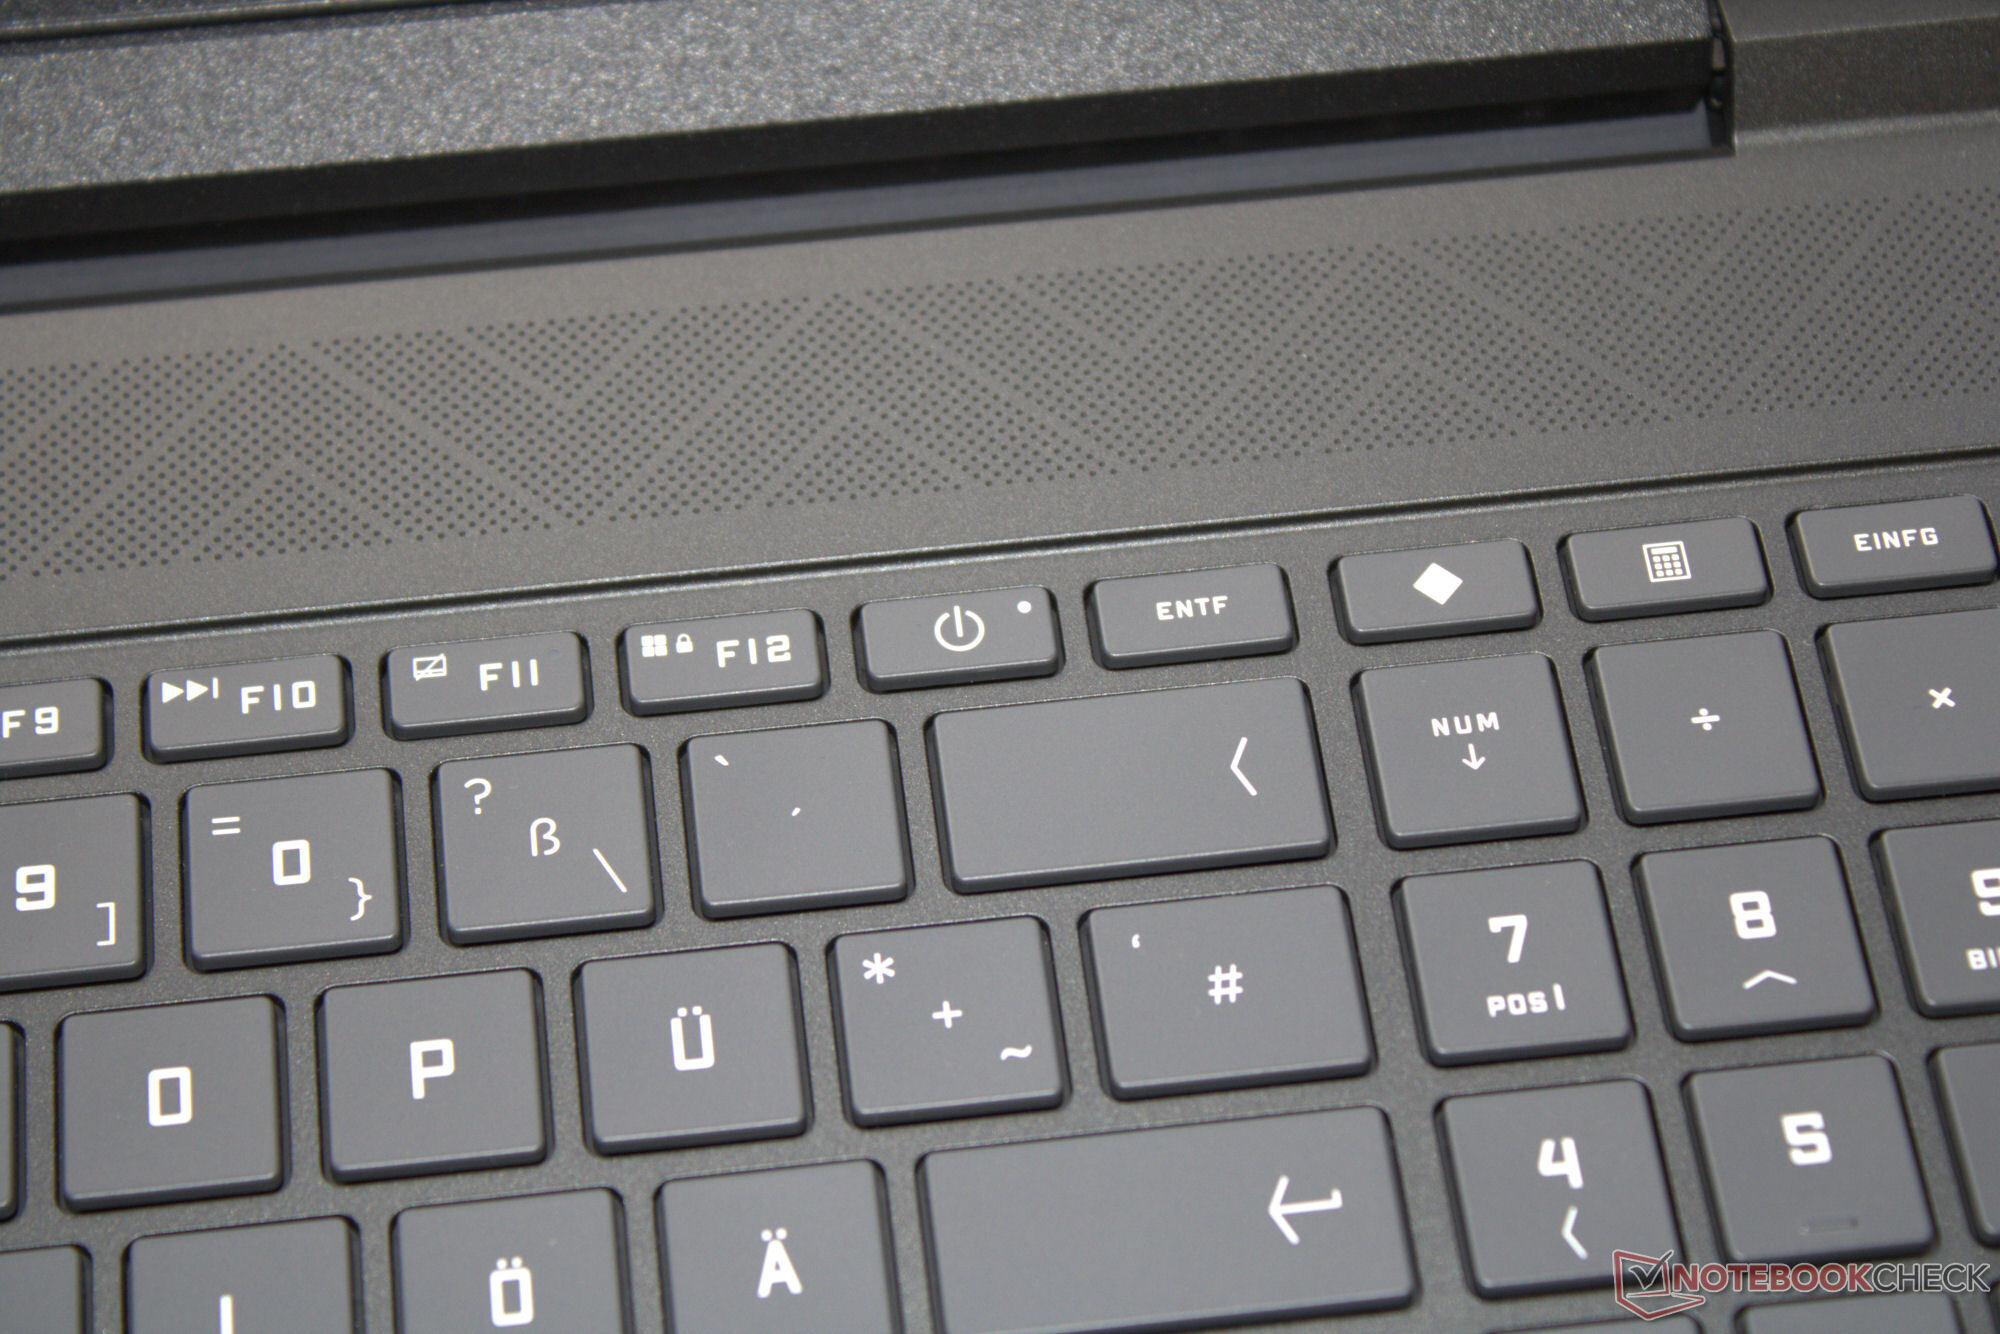
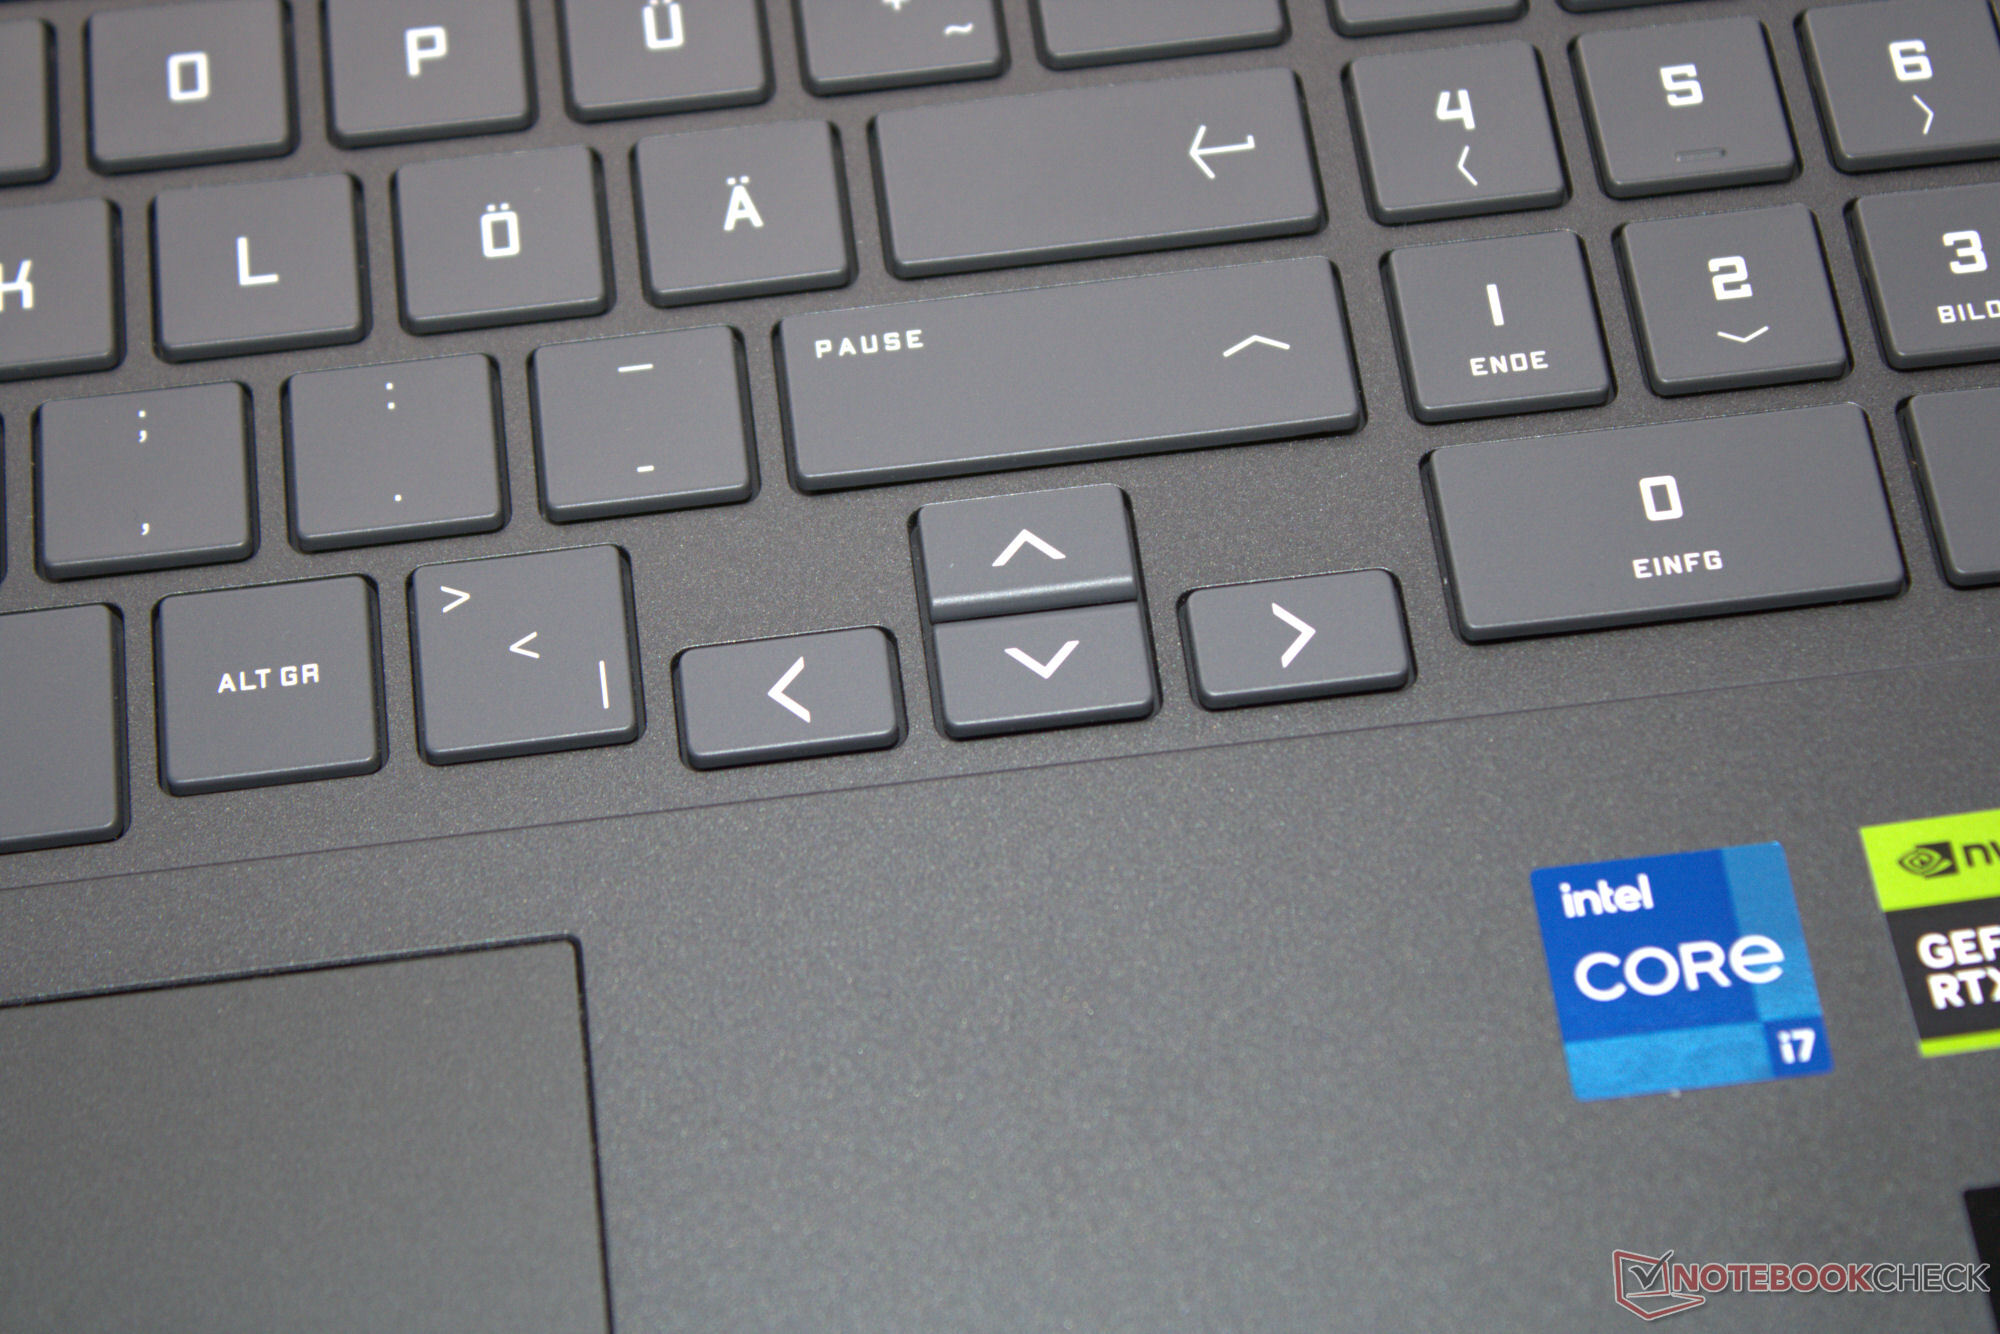
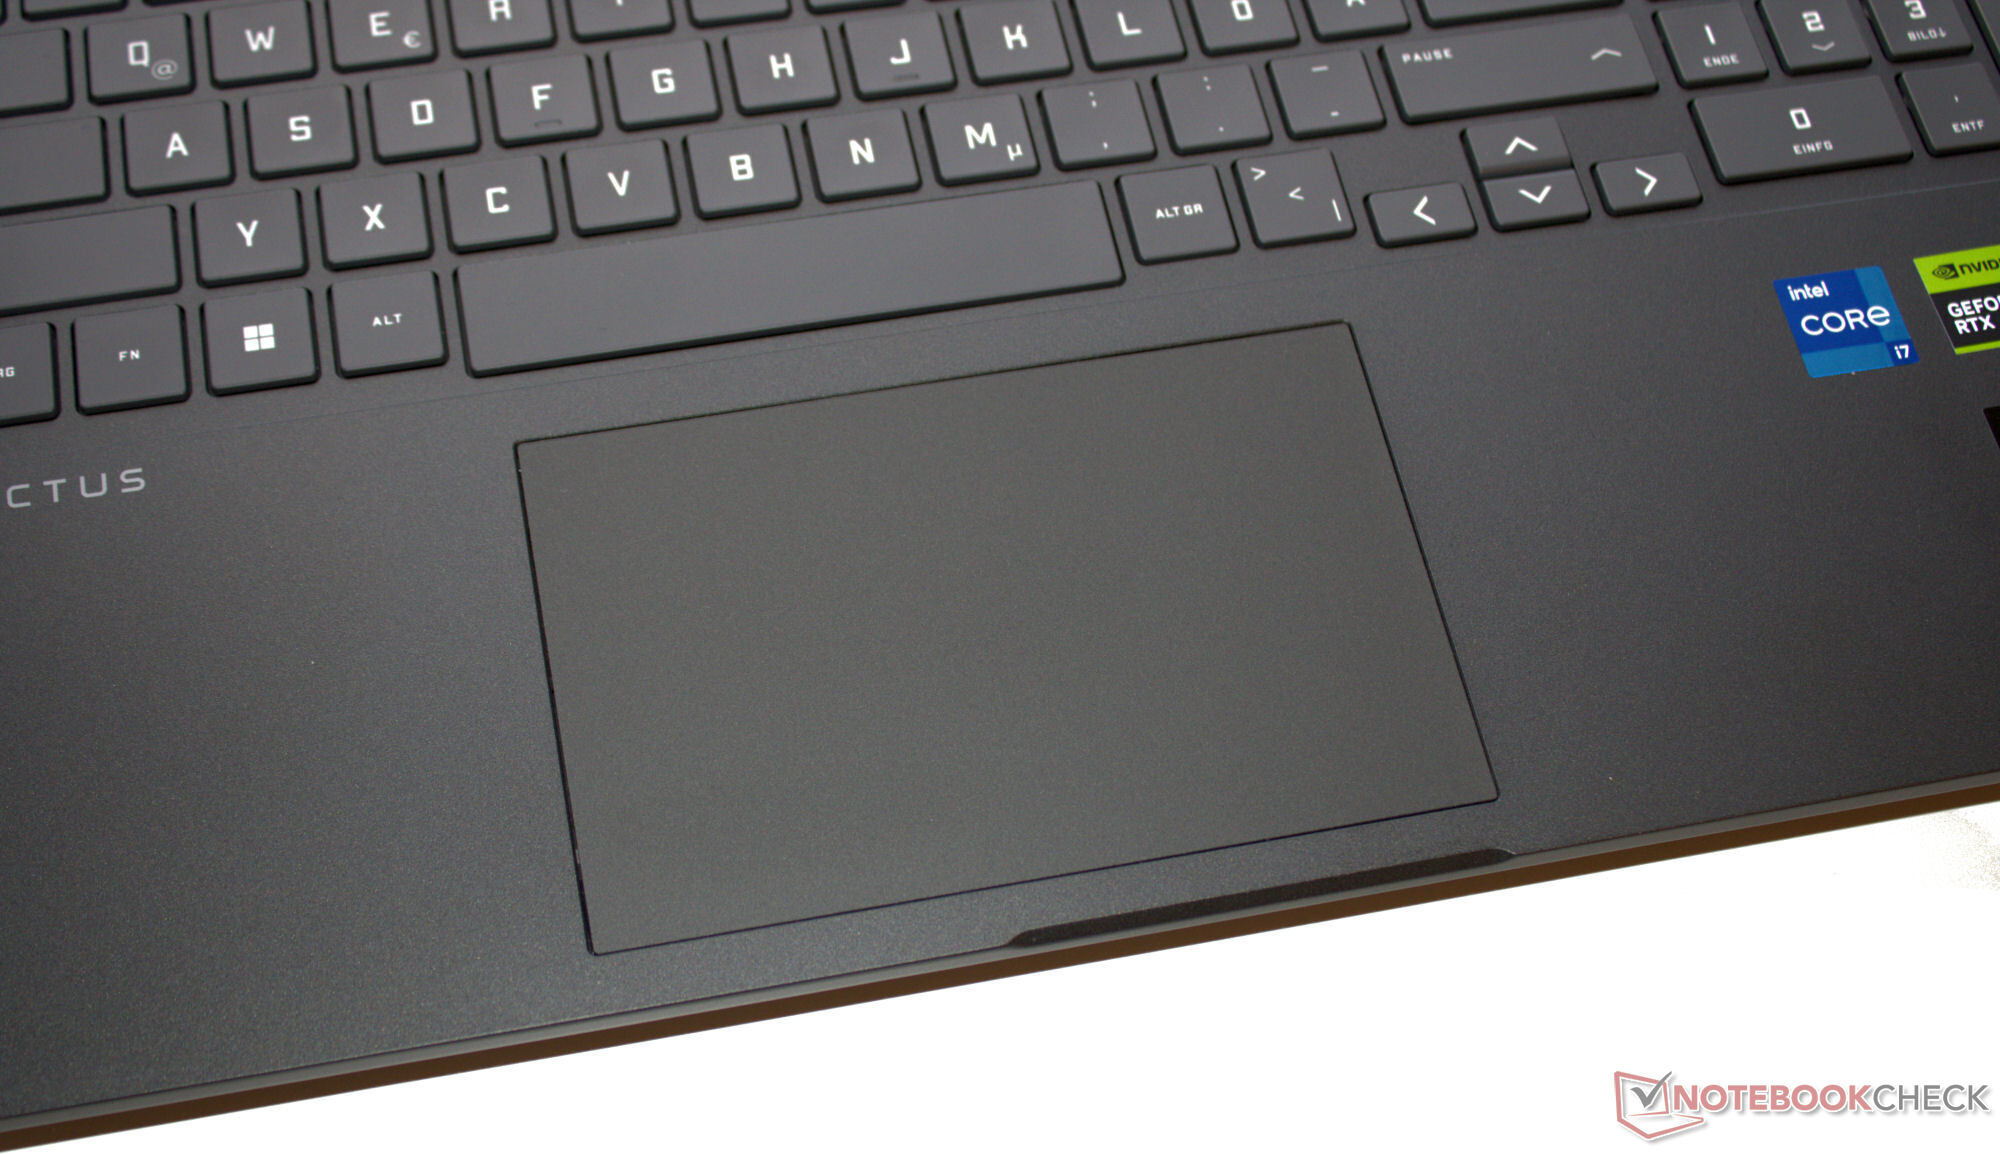
Urządzenia wejściowe - laptop HP z małymi klawiszami strzałek
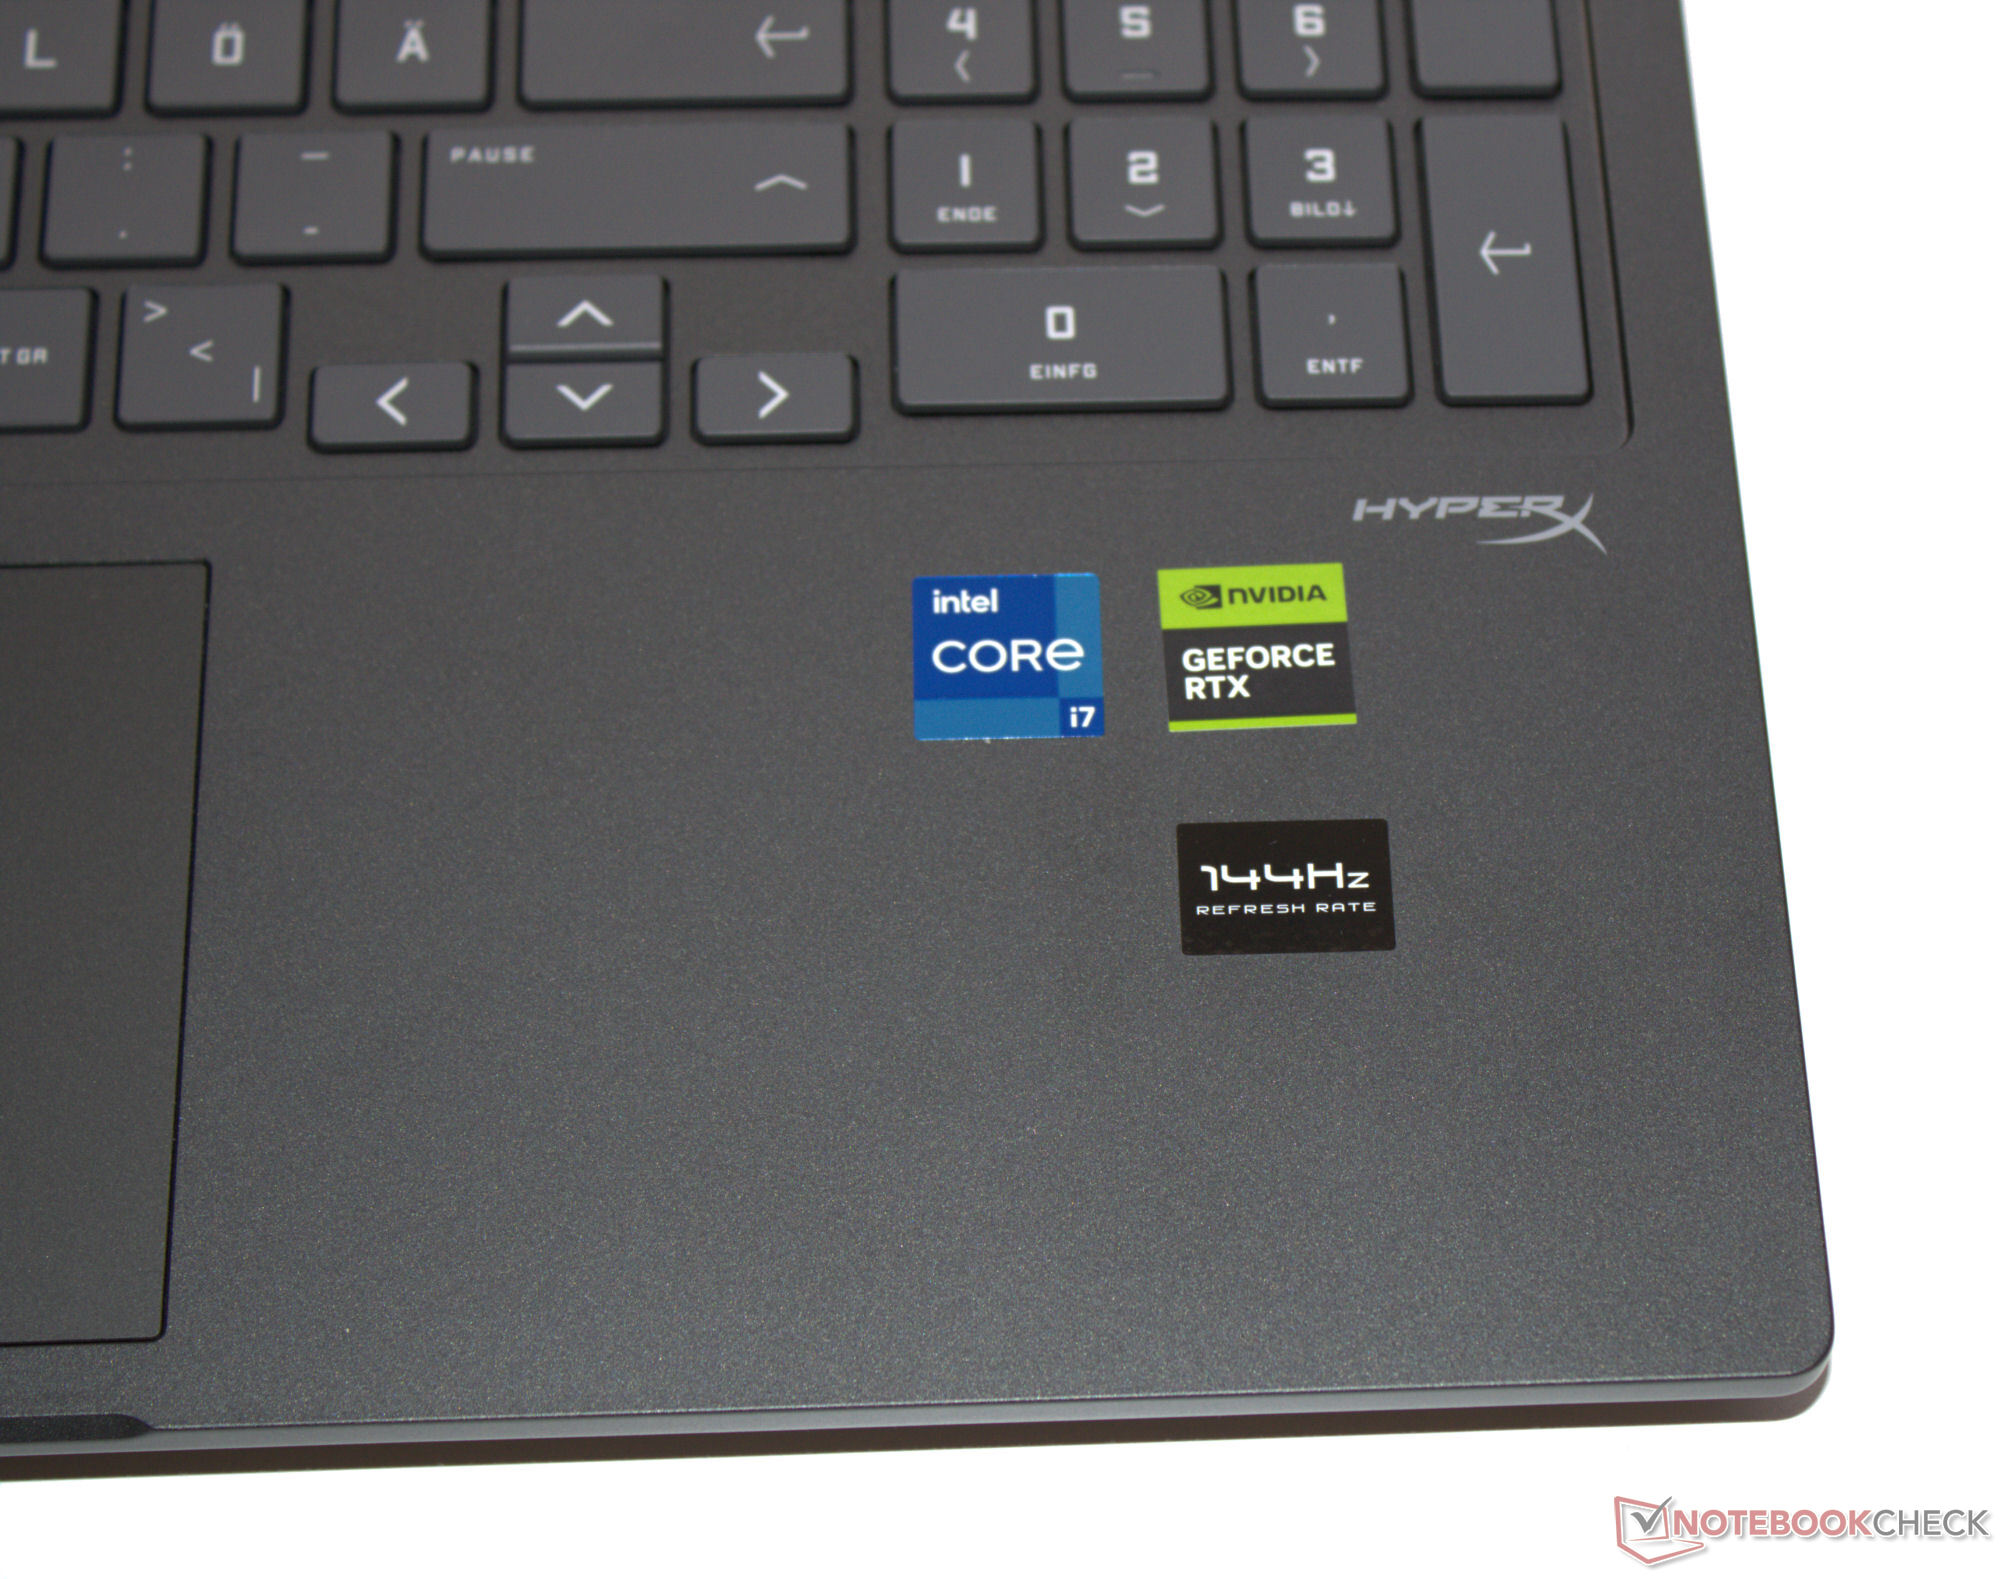
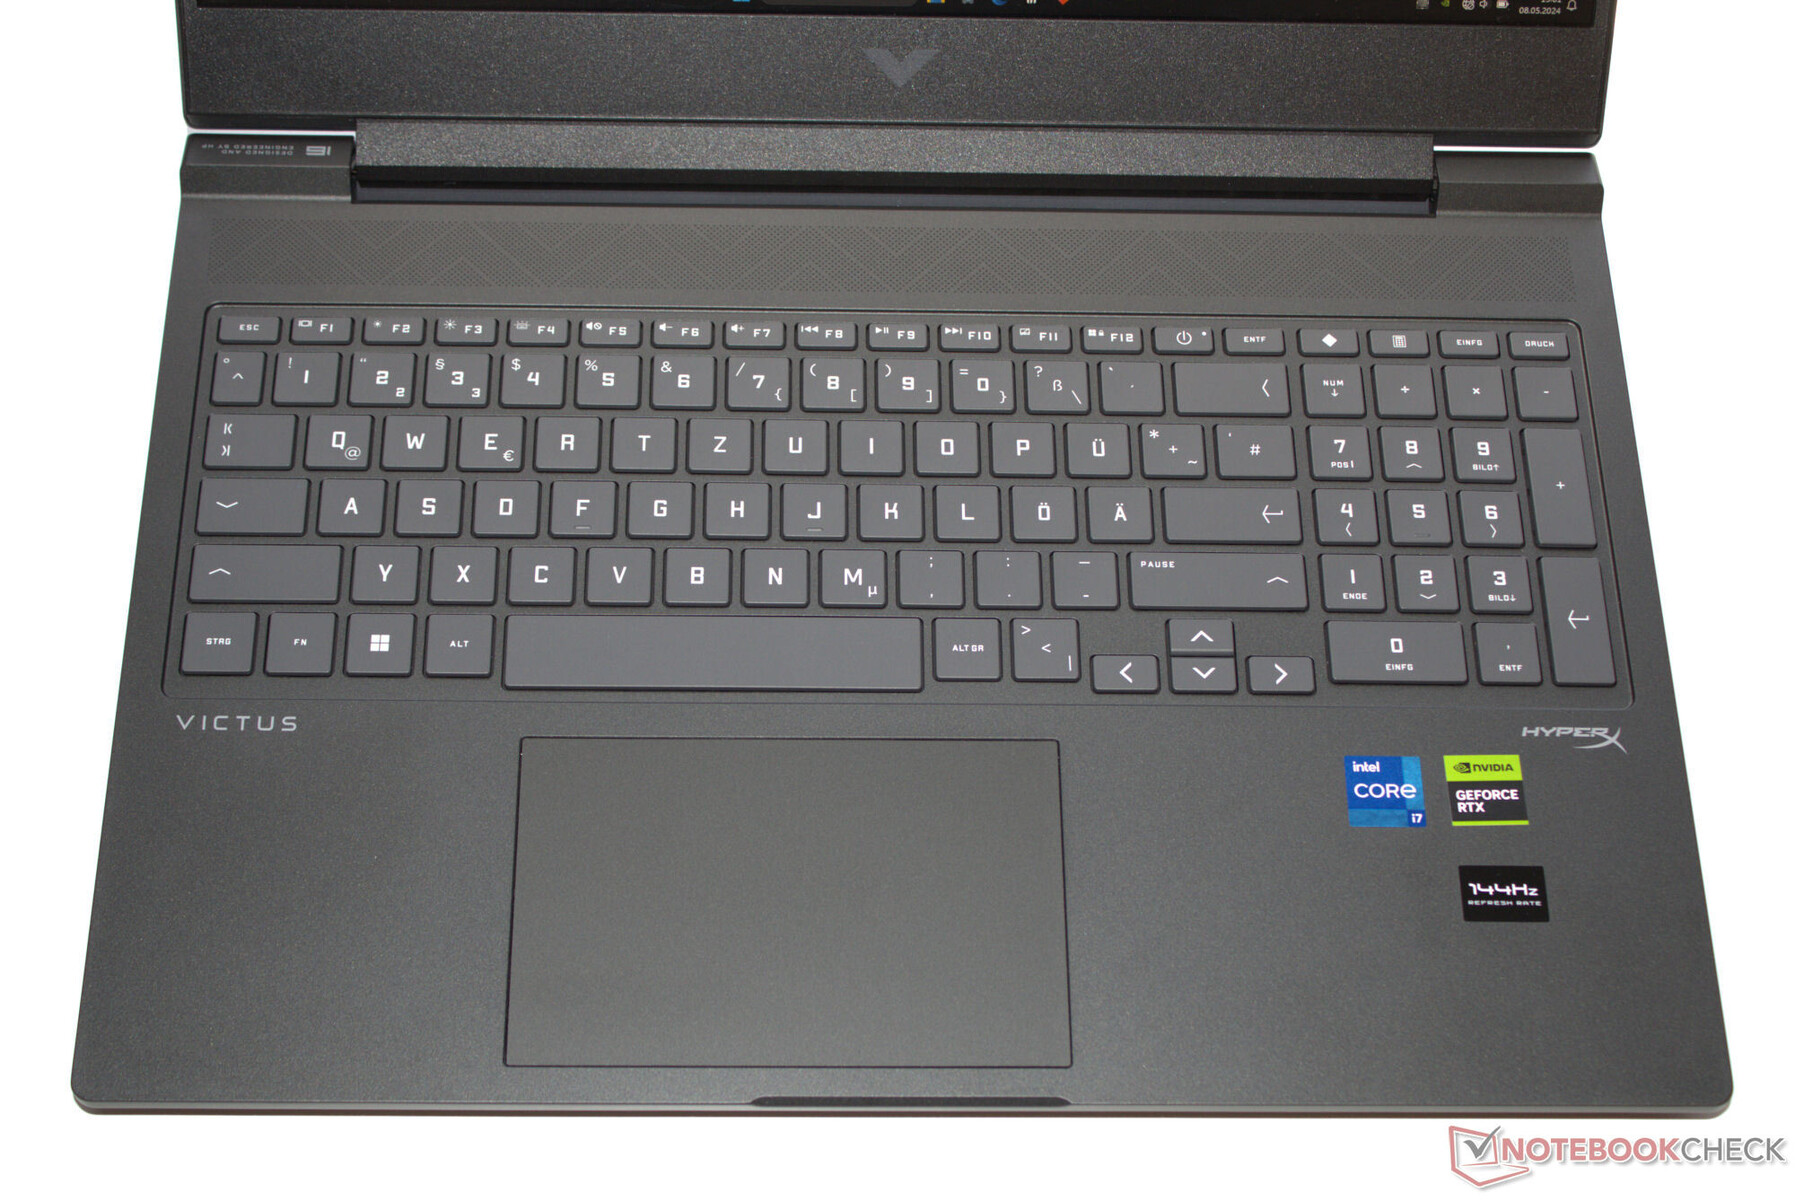
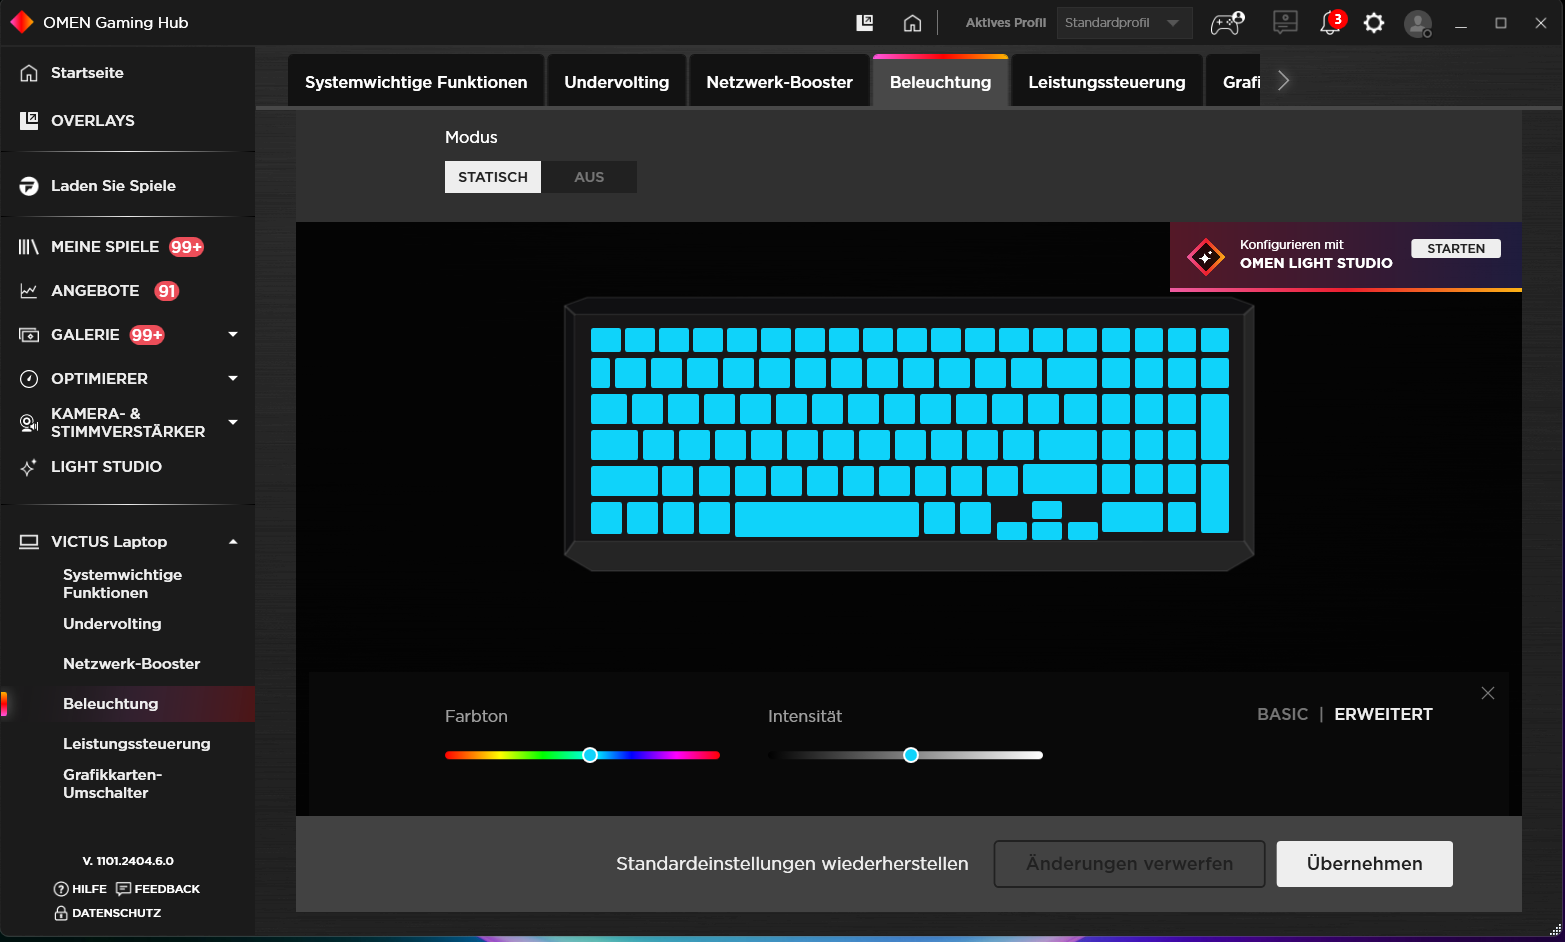
Gładkie klawisze klawiatury typu chiclet (podświetlenie RGB, klawiatura numeryczna) charakteryzują się krótkim skokiem i wyraźnym punktem nacisku. Ich opór mógłby być nieco bardziej wyraźny. Klawiatura lekko odbija się podczas pisania. Negatywy: Zarówno klawisze strzałek, jak i klawisz Enter są stosunkowo małe. Clickpad (12,5 x 7,5 cm) z krótkim skokiem i wyraźnym punktem nacisku działa jako zamiennik myszy.
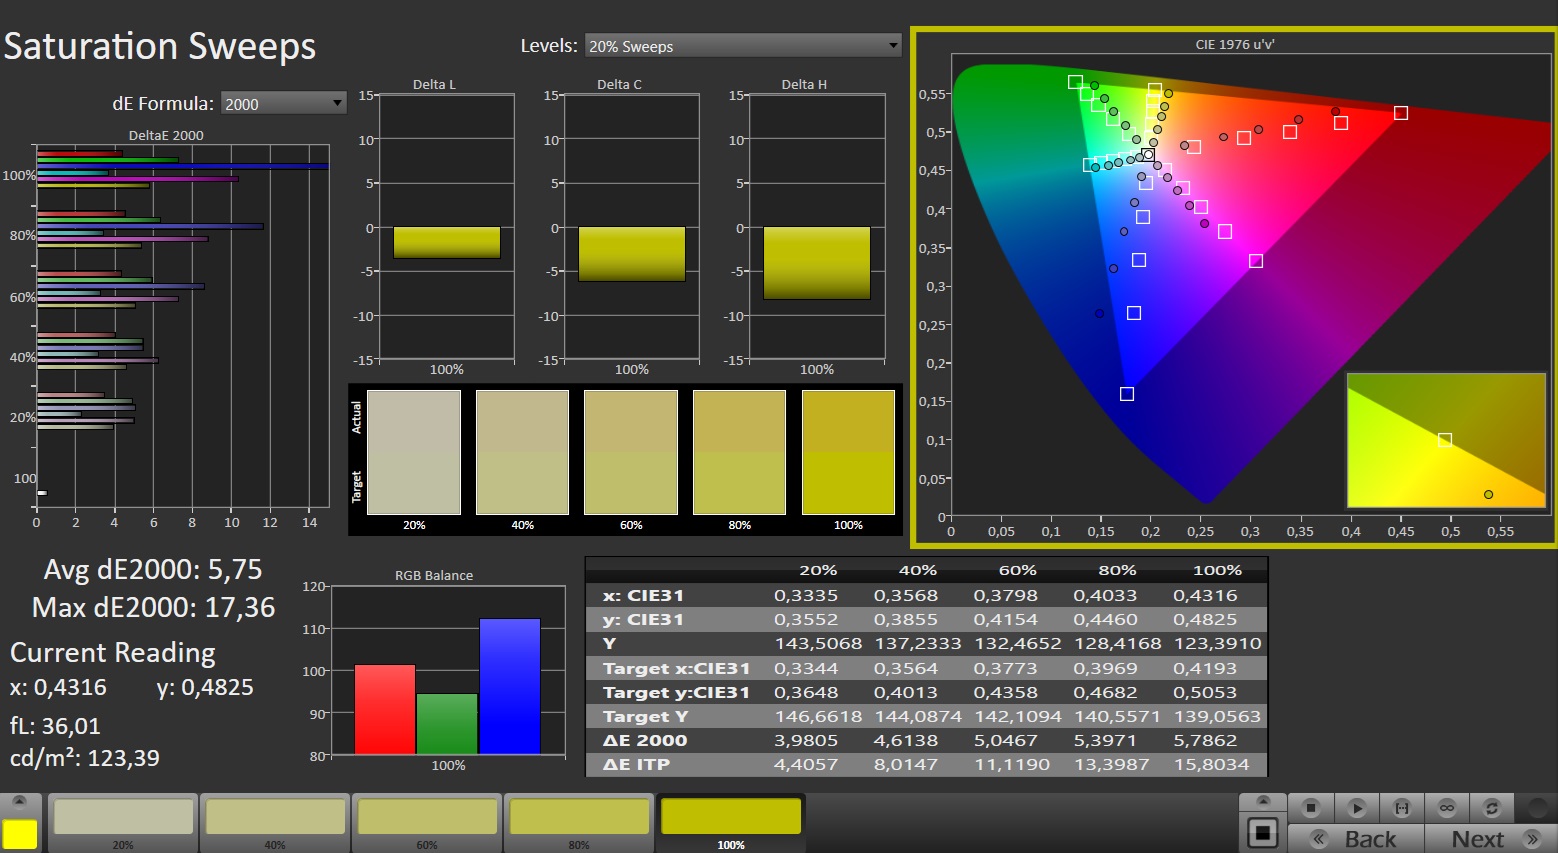
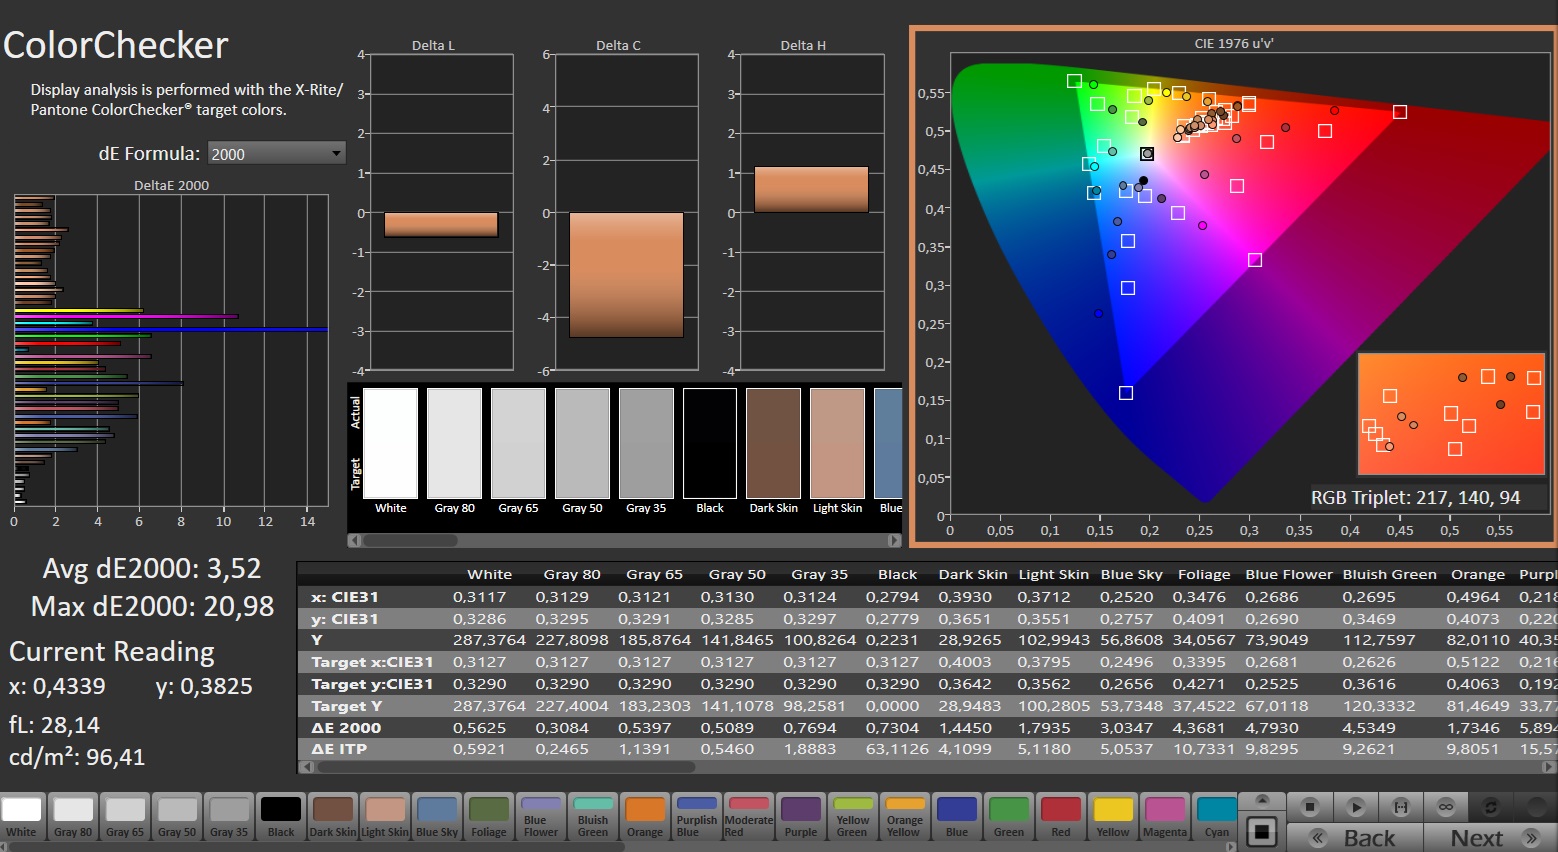
Wyświetlacz - panel IPS o niskiej dokładności odwzorowania kolorów
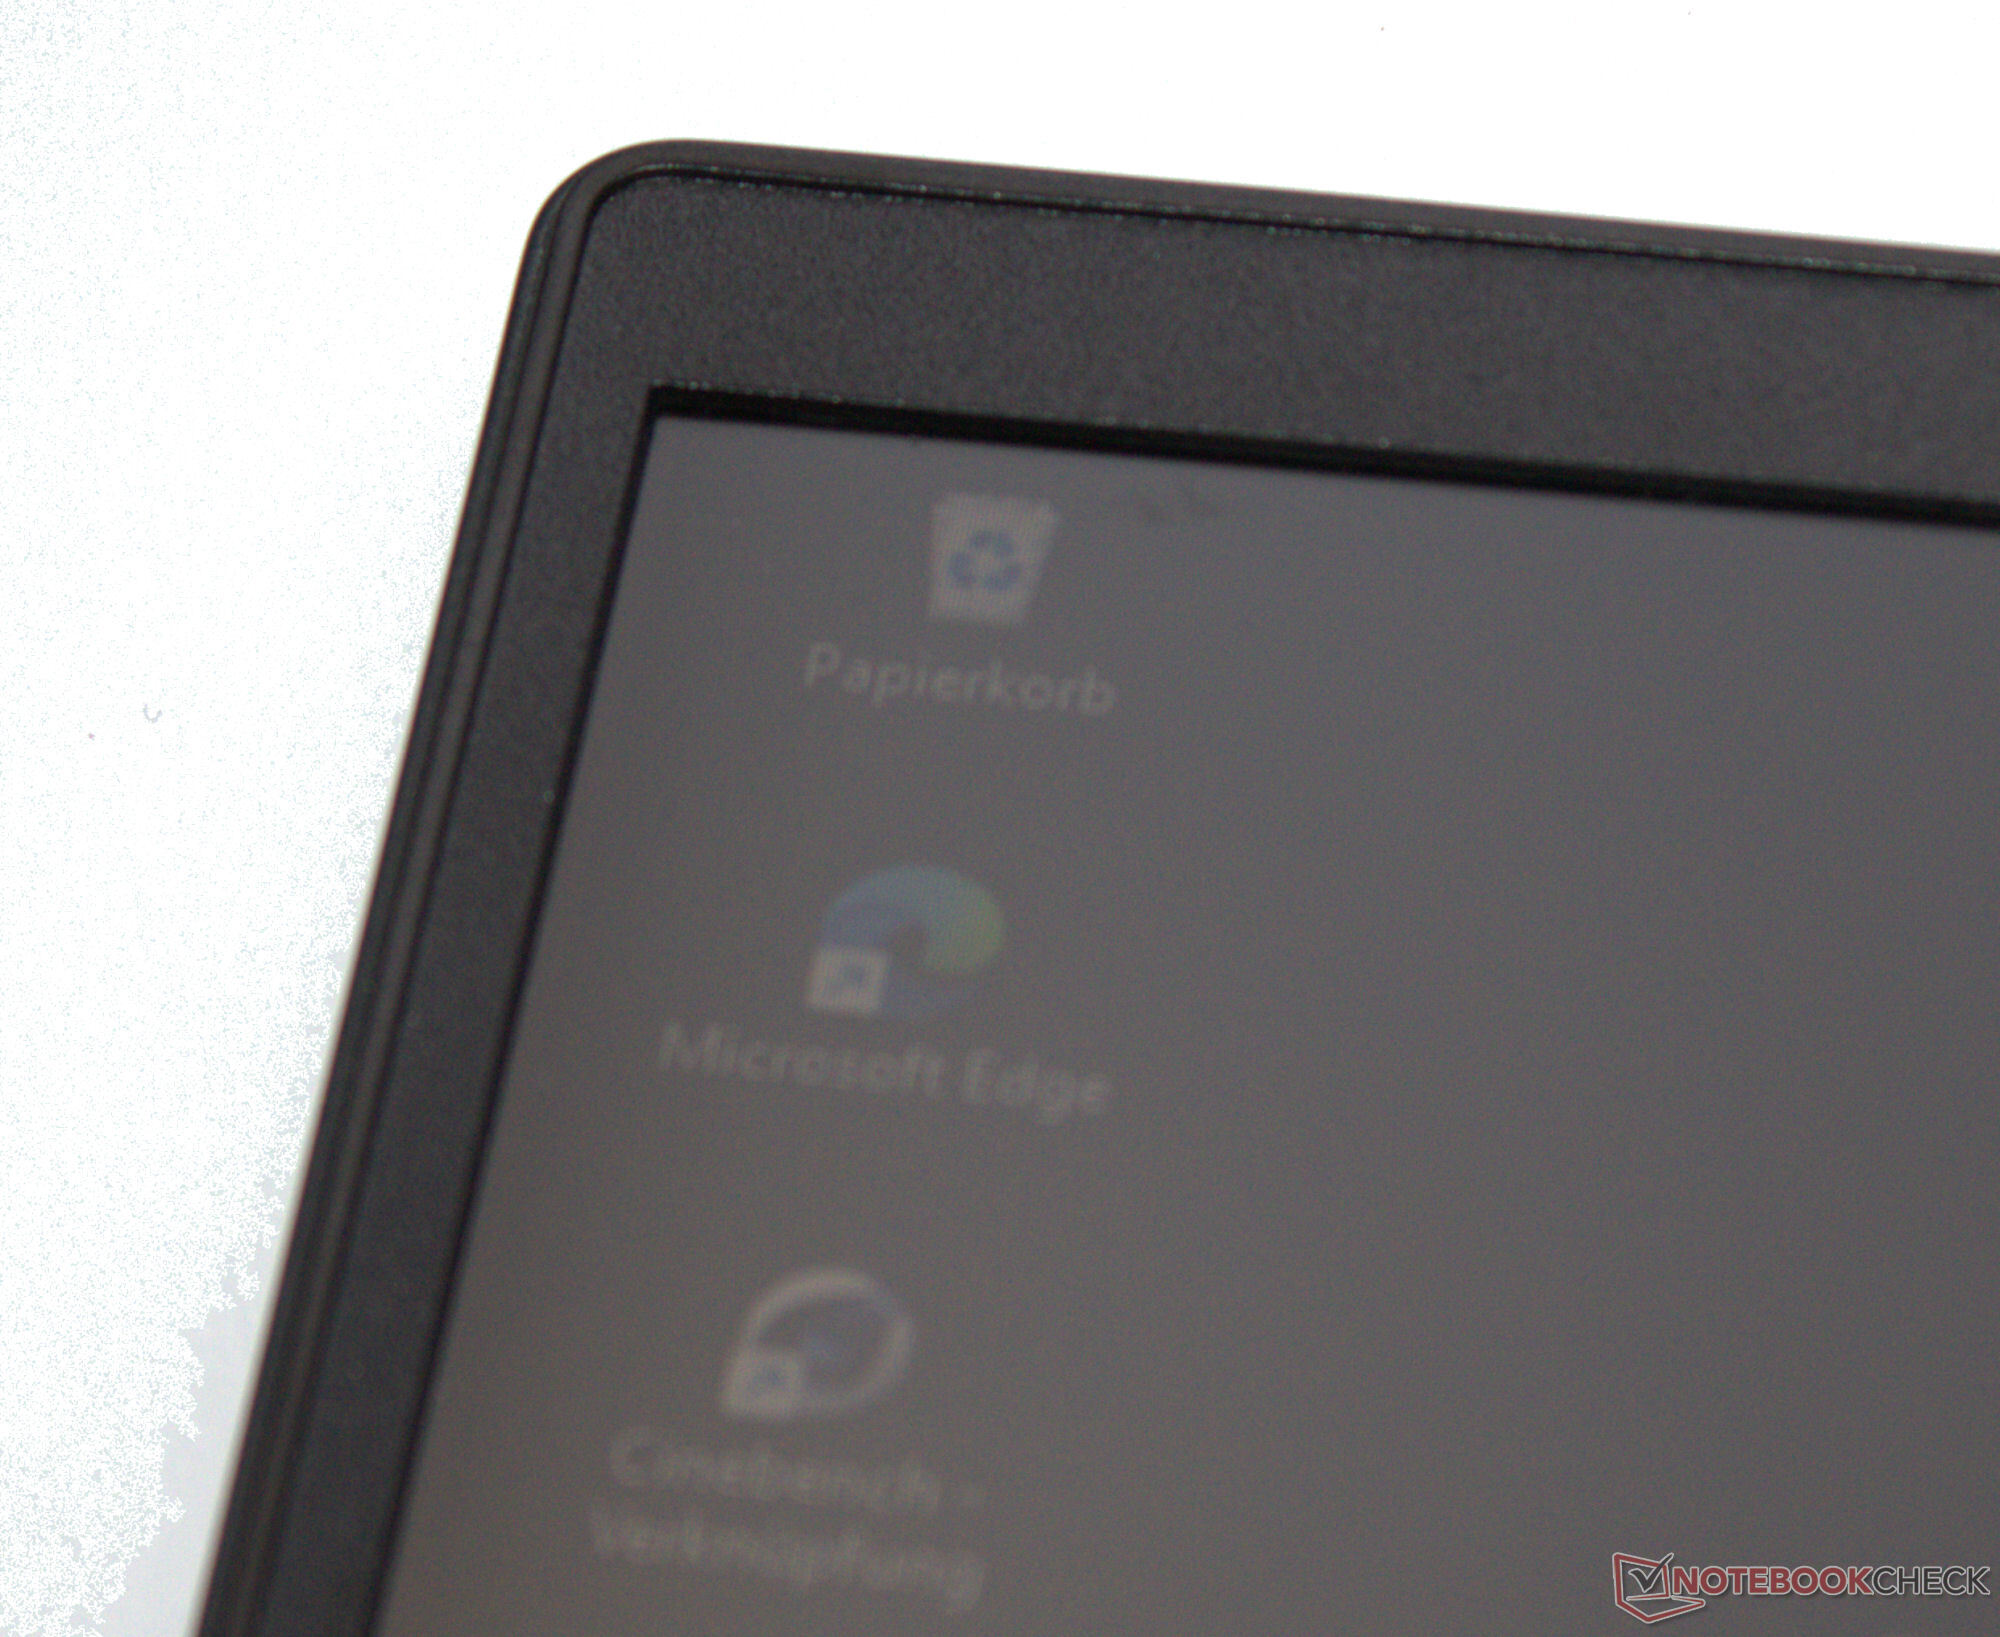
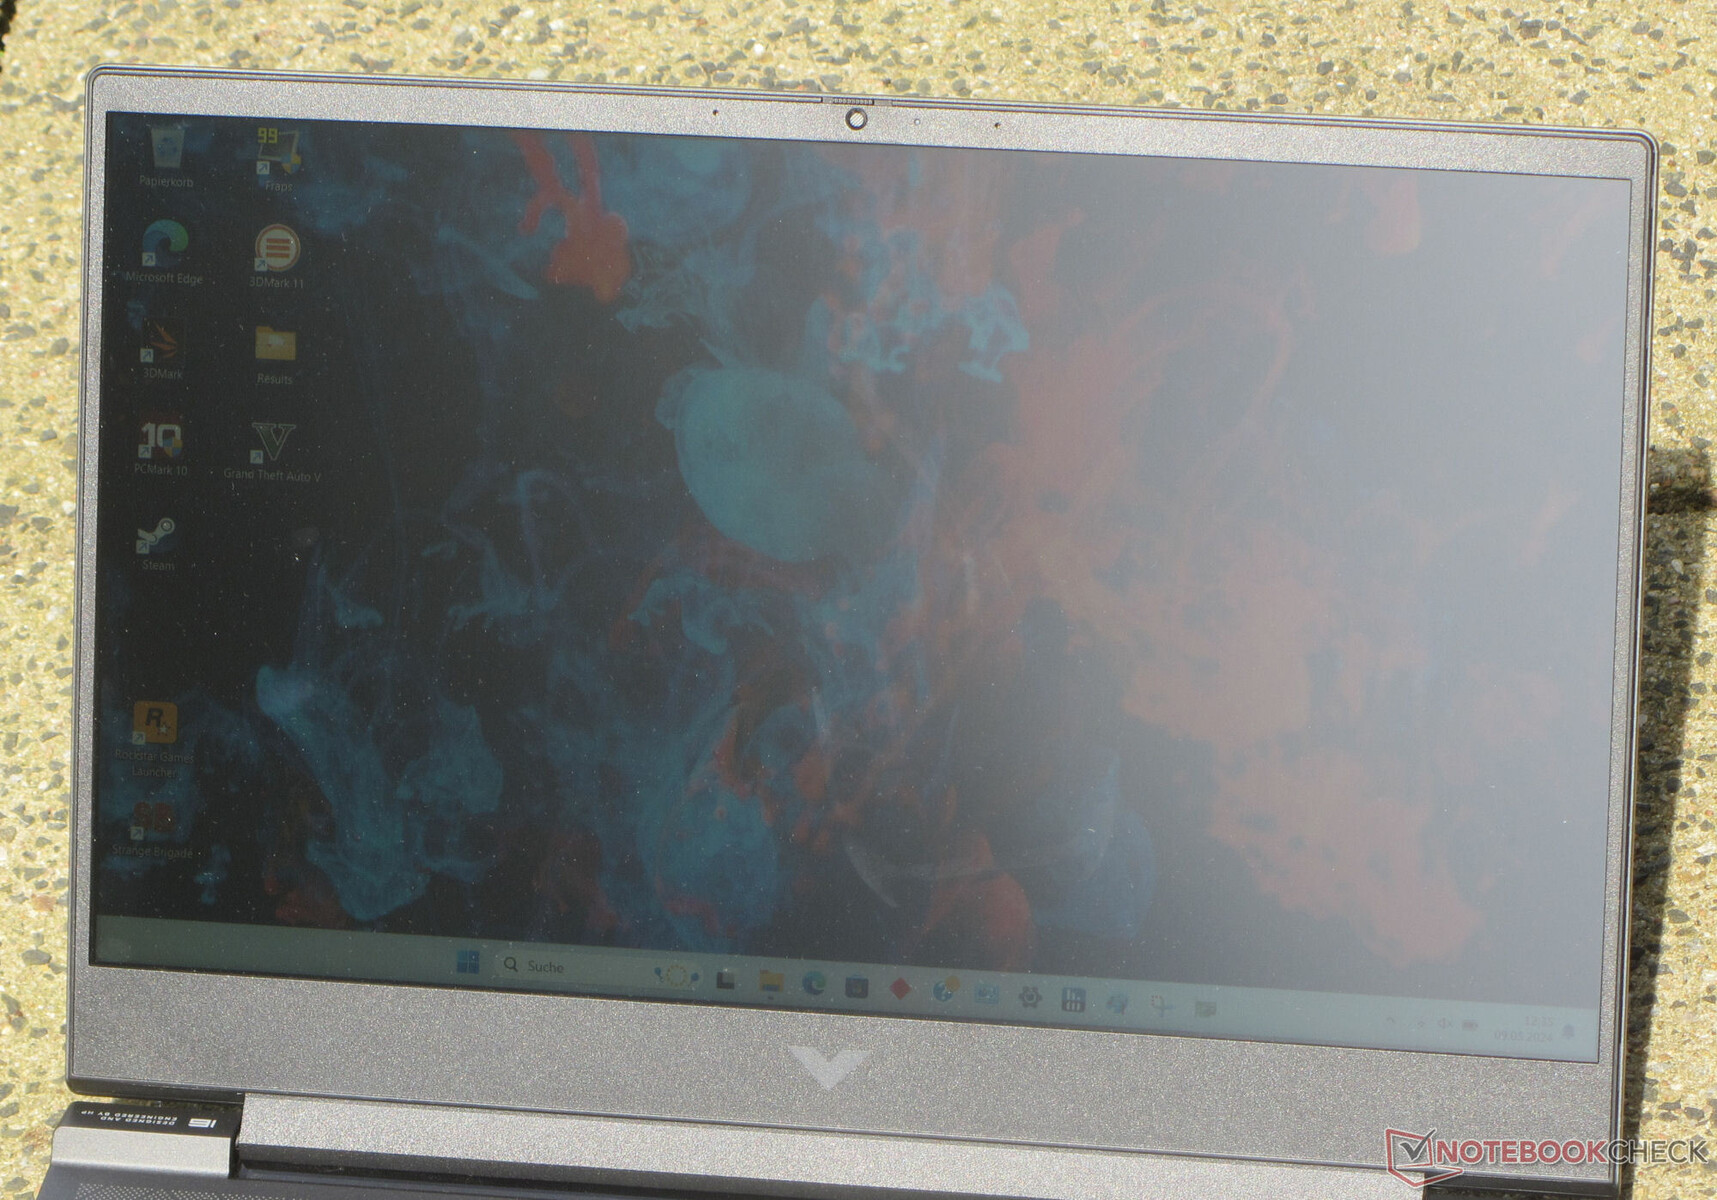
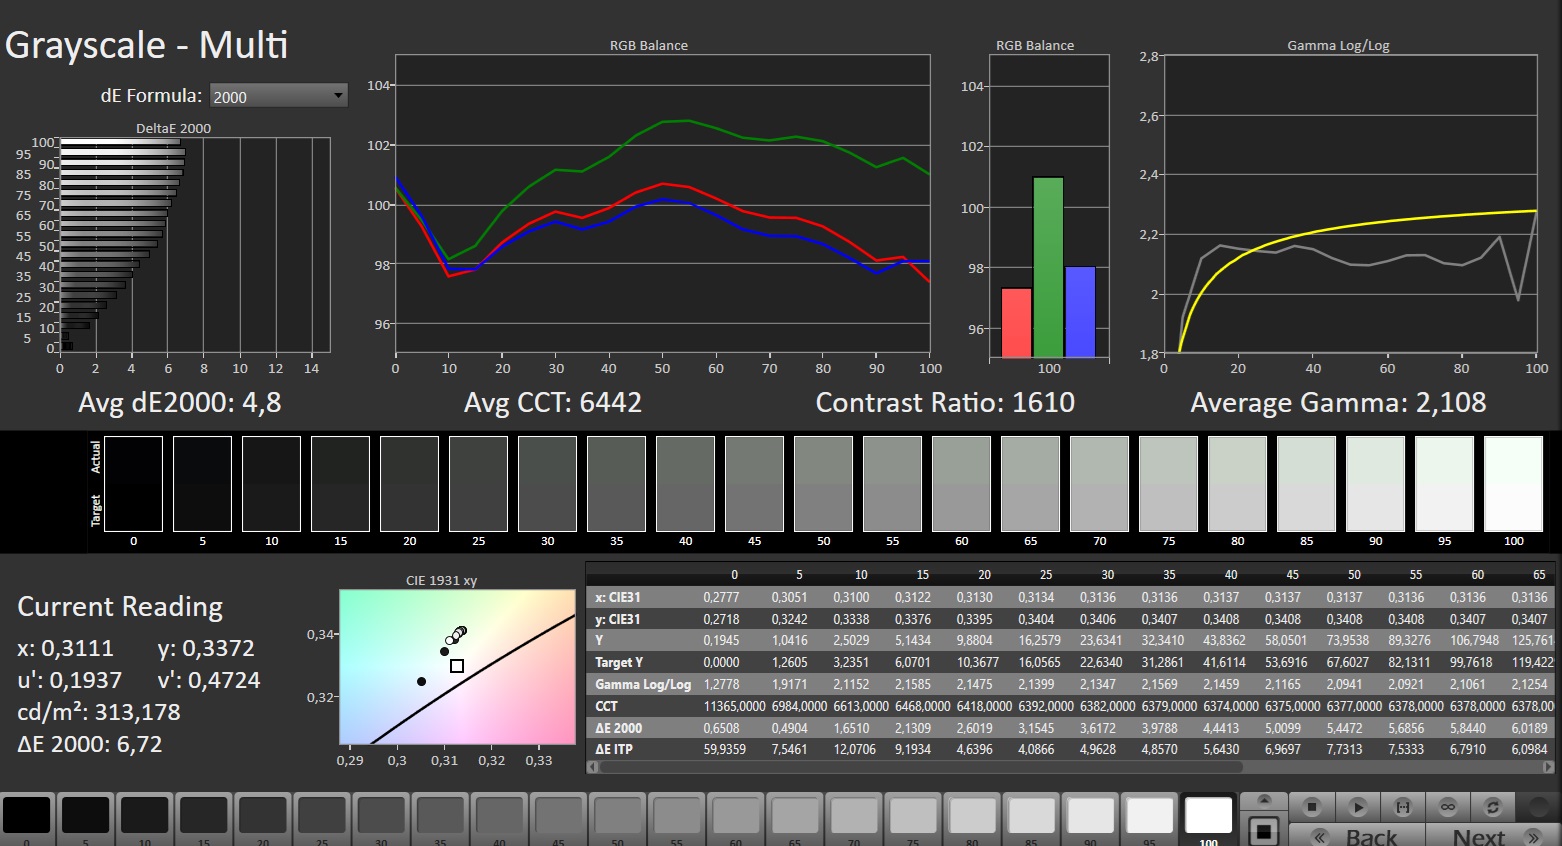
HP wyposażyło Victusa w stabilny pod kątem widzenia panel 144 Hz (FHD, IPS) o proporcjach 16:9. Nie wykazuje on żadnego migotania PWM na wszystkich poziomach jasności. Jasność i kontrast 16,1-calowego wyświetlacza są przeznaczone do użytku w pomieszczeniach - wartość docelowa (> 300 cd/m²) nie została do końca osiągnięta. Z wyświetlacza można czytać na zewnątrz, o ile słońce nie świeci zbyt mocno.
| |||||||||||||||||||||||||
rozświetlenie: 86 %
na akumulatorze: 287 cd/m²
kontrast: 1511:1 (czerń: 0.19 cd/m²)
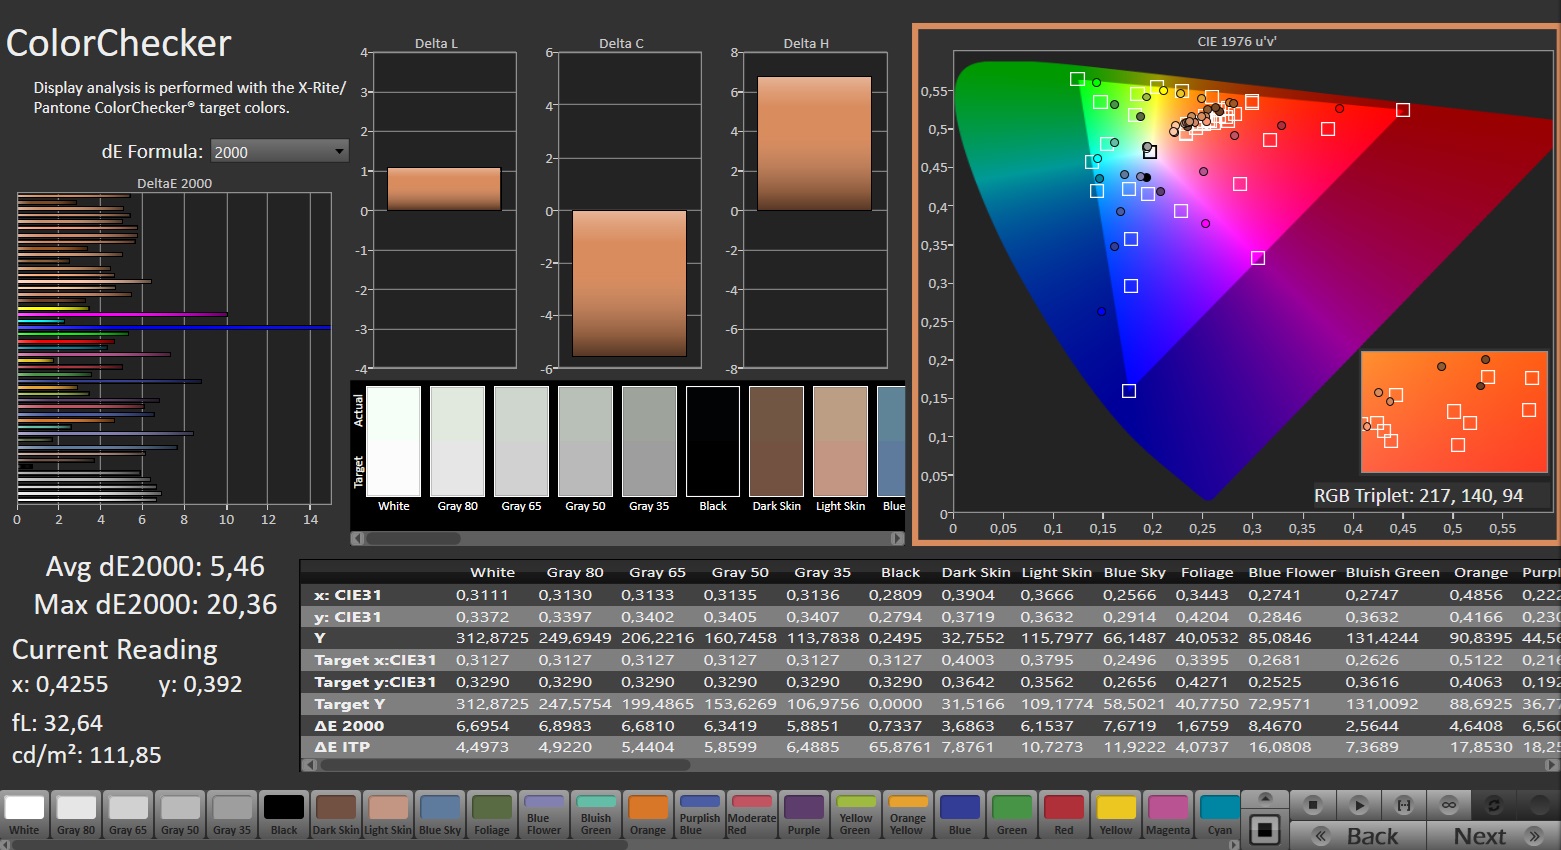
ΔE Color 5.46 | 0.5-29.43 Ø4.87, calibrated: 3.52
ΔE Greyscale 4.8 | 0.5-98 Ø5.1
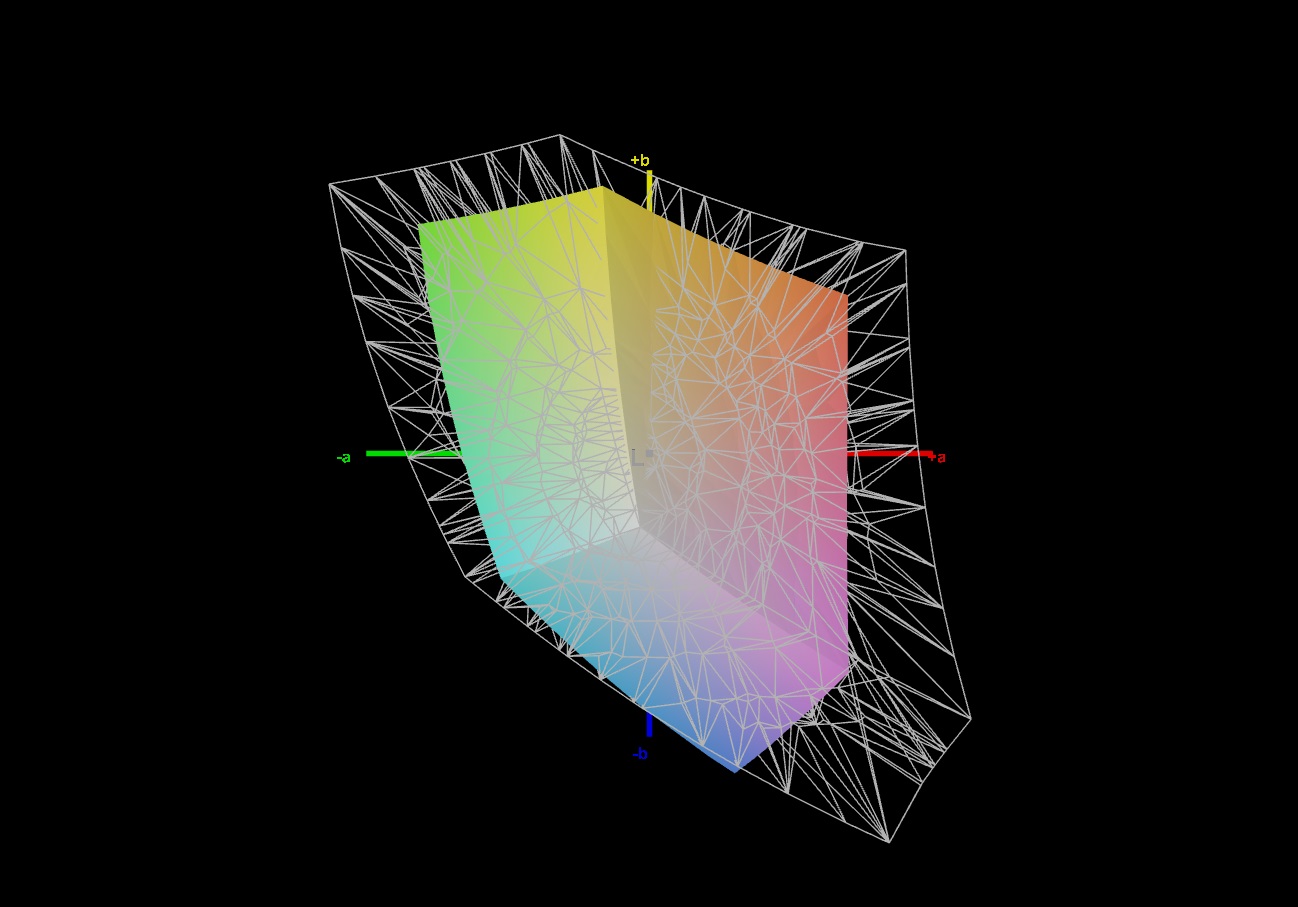
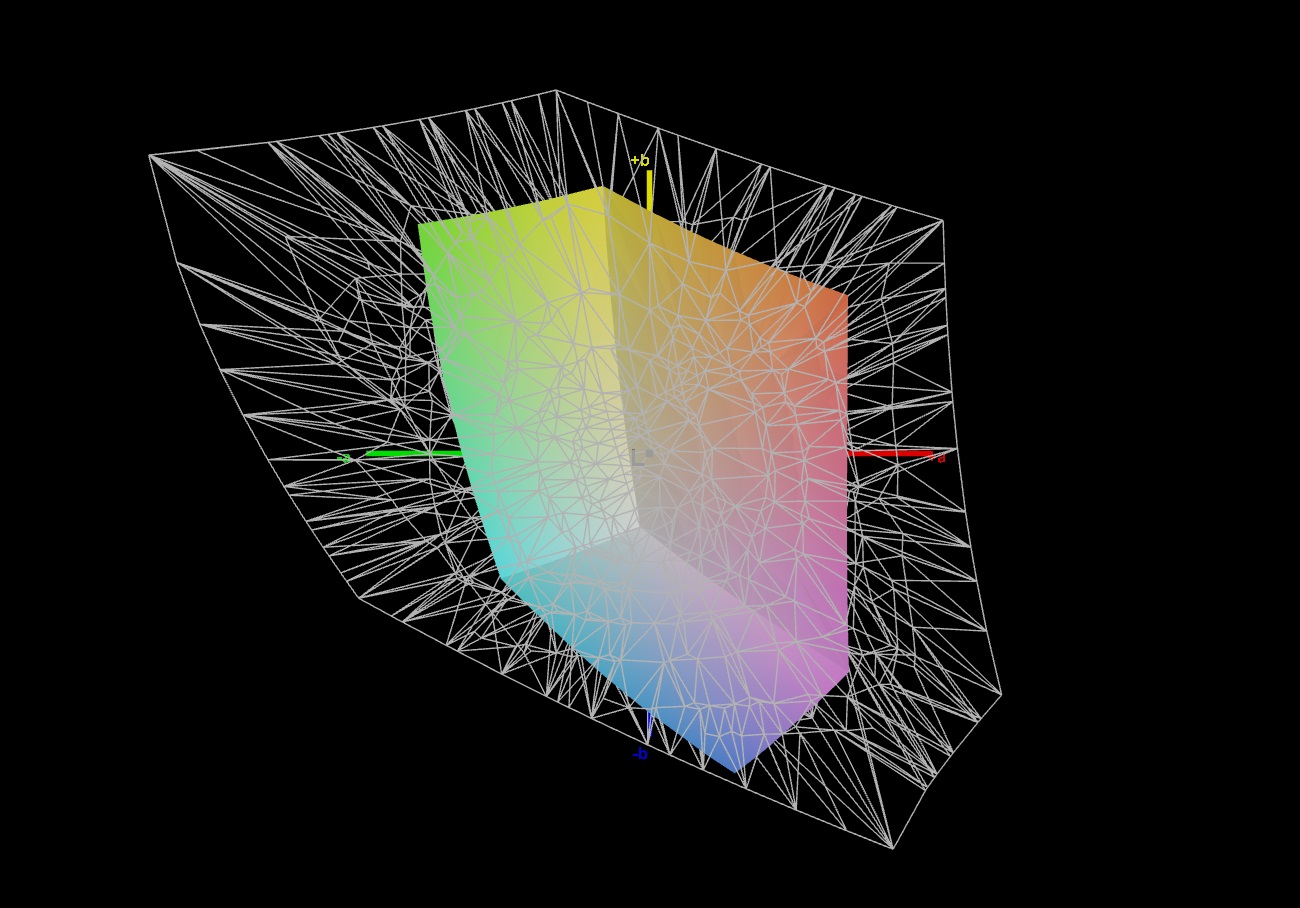
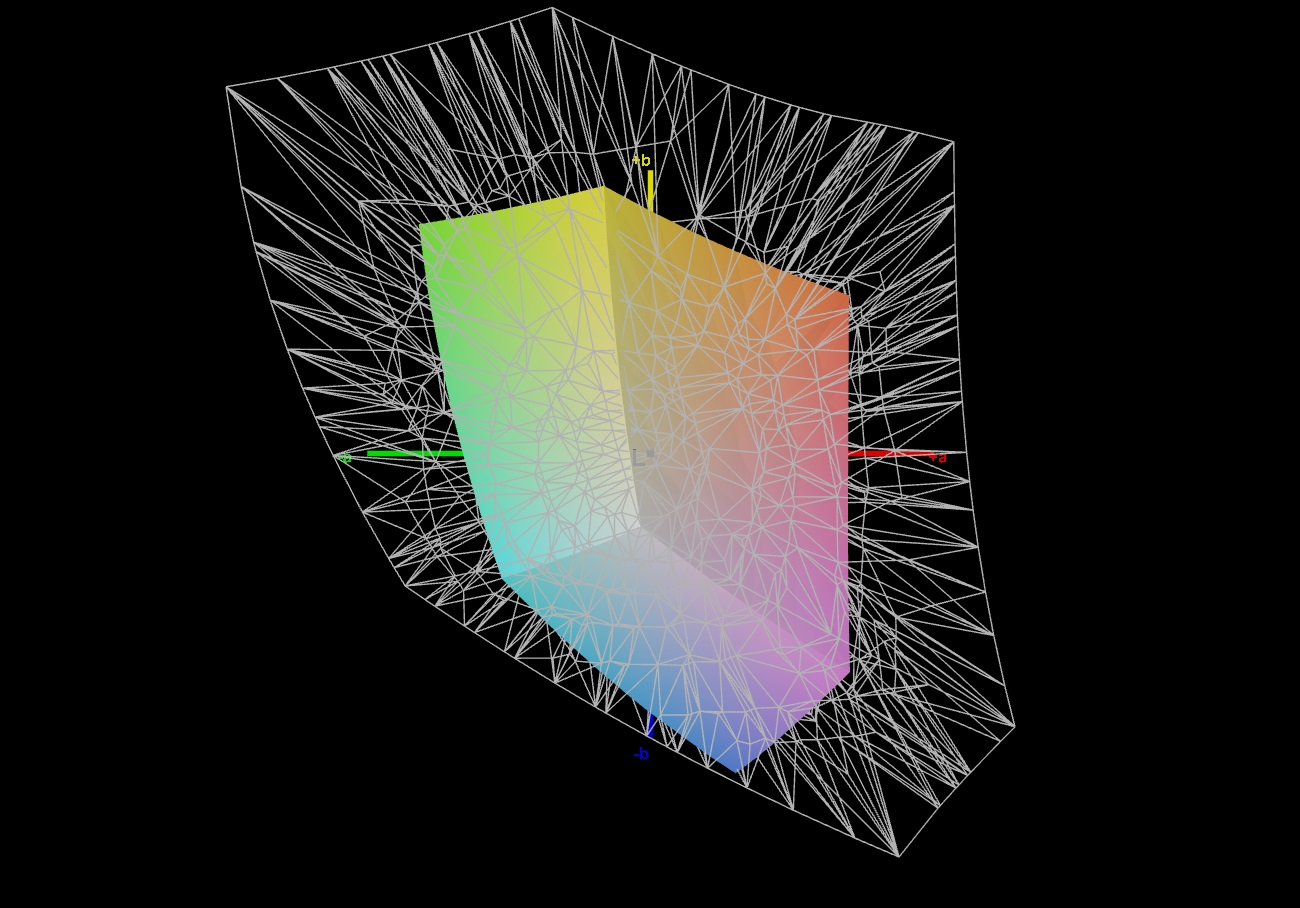
42.7% AdobeRGB 1998 (Argyll 2.2.0 3D)
61.7% sRGB (Argyll 2.2.0 3D)
41.3% Display P3 (Argyll 2.2.0 3D)
Gamma: 2.108
| HP Victus 16 (2024) Chi Mei CMN163E, IPS, 1920x1080, 16.1" | Gigabyte G6X 9KG (2024) BOE NE160WUM-NX6, IPS, 1920x1200, 16" | Dell G16, i7-13650HX, RTX 4060 Chi Mei CMN161D (160GME), IPS, 2560x1600, 16" | Lenovo Legion 5 16IRX G9 NE160QDM-NZ3, IPS, 2560x1600, 16" | Asus TUF Gaming A16 FA617XS BOE NE160WUM-NX2, IPS, 1920x1200, 16" | |
|---|---|---|---|---|---|
| Display | 1% | 62% | 70% | 64% | |
| Display P3 Coverage | 41.3 | 41.8 1% | 67.5 63% | 72.4 75% | 69.3 68% |
| sRGB Coverage | 61.7 | 62.4 1% | 98.5 60% | 100 62% | 97.3 58% |
| AdobeRGB 1998 Coverage | 42.7 | 43.3 1% | 69.3 62% | 74.1 74% | 70.7 66% |
| Response Times | -29% | 59% | 55% | 46% | |
| Response Time Grey 50% / Grey 80% * | 28.6 ? | 40.5 ? -42% | 7.6 ? 73% | 12.5 ? 56% | 15.6 ? 45% |
| Response Time Black / White * | 18.7 ? | 21.6 ? -16% | 10.4 ? 44% | 8.7 ? 53% | 10 ? 47% |
| PWM Frequency | |||||
| Screen | 6% | 21% | 45% | 29% | |
| Brightness middle | 287 | 353 23% | 369 29% | 526 83% | 301 5% |
| Brightness | 288 | 318 10% | 344 19% | 500 74% | 294 2% |
| Brightness Distribution | 86 | 81 -6% | 89 3% | 87 1% | 94 9% |
| Black Level * | 0.19 | 0.21 -11% | 0.26 -37% | 0.33 -74% | 0.21 -11% |
| Contrast | 1511 | 1681 11% | 1419 -6% | 1594 5% | 1433 -5% |
| Colorchecker dE 2000 * | 5.46 | 5.21 5% | 3.04 44% | 1.2 78% | 1.79 67% |
| Colorchecker dE 2000 max. * | 20.36 | 19.95 2% | 5.56 73% | 2.1 90% | 3.48 83% |
| Colorchecker dE 2000 calibrated * | 3.52 | 3.61 -3% | 2.35 33% | 1 72% | 1.2 66% |
| Greyscale dE 2000 * | 4.8 | 3.6 25% | 3.38 30% | 1.3 73% | 2.5 48% |
| Gamma | 2.108 104% | 2.367 93% | 2.47 89% | 2.23 99% | 2.265 97% |
| CCT | 6442 101% | 7138 91% | 6040 108% | 6391 102% | 6157 106% |
| Całkowita średnia (program / ustawienia) | -7% /
0% | 47% /
35% | 57% /
52% | 46% /
39% |
* ... im mniej tym lepiej
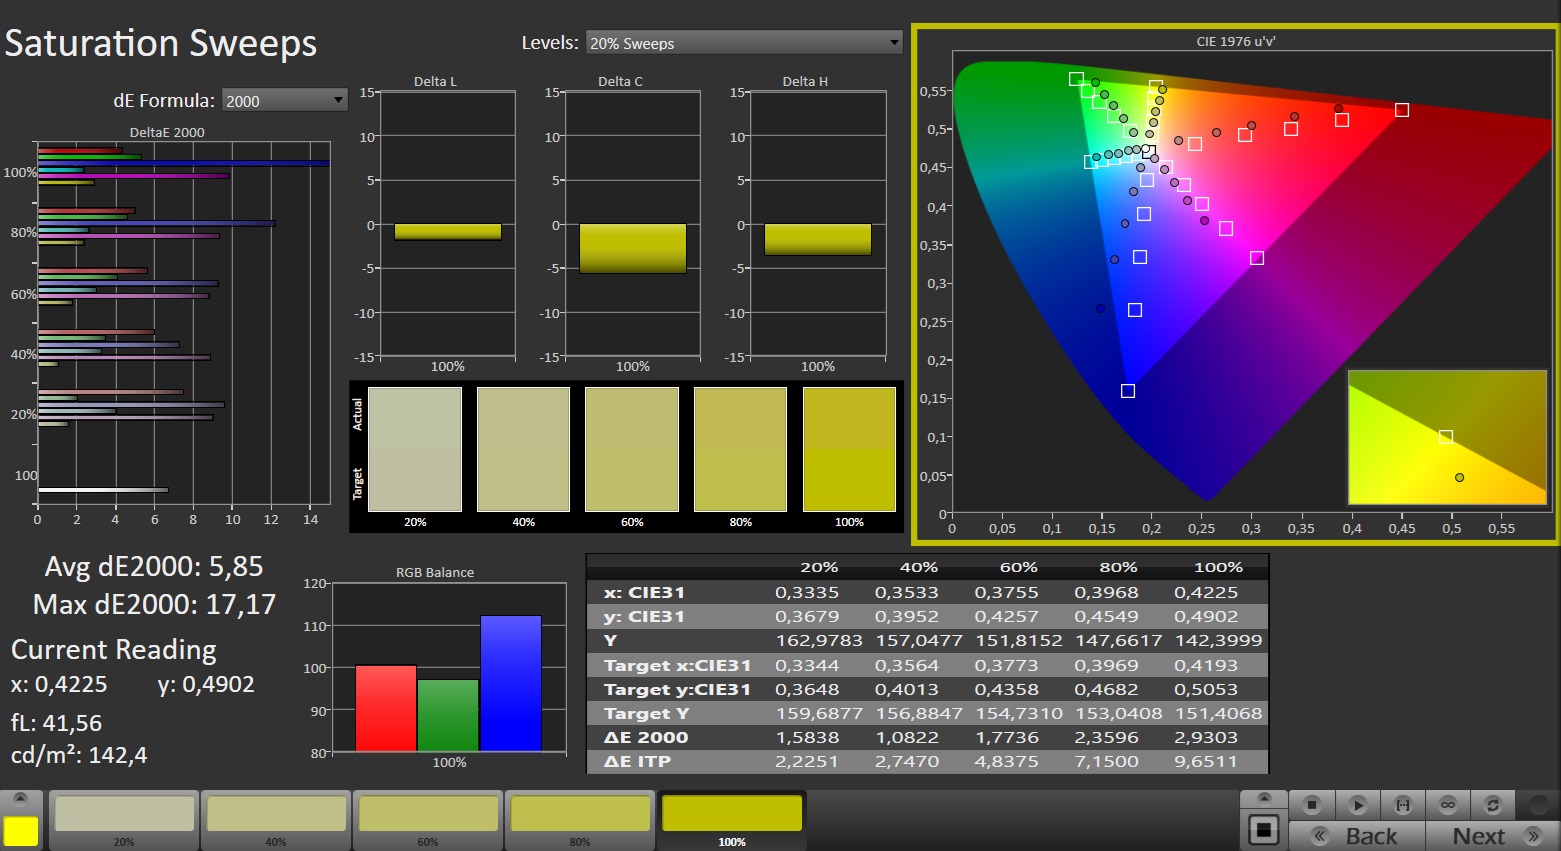
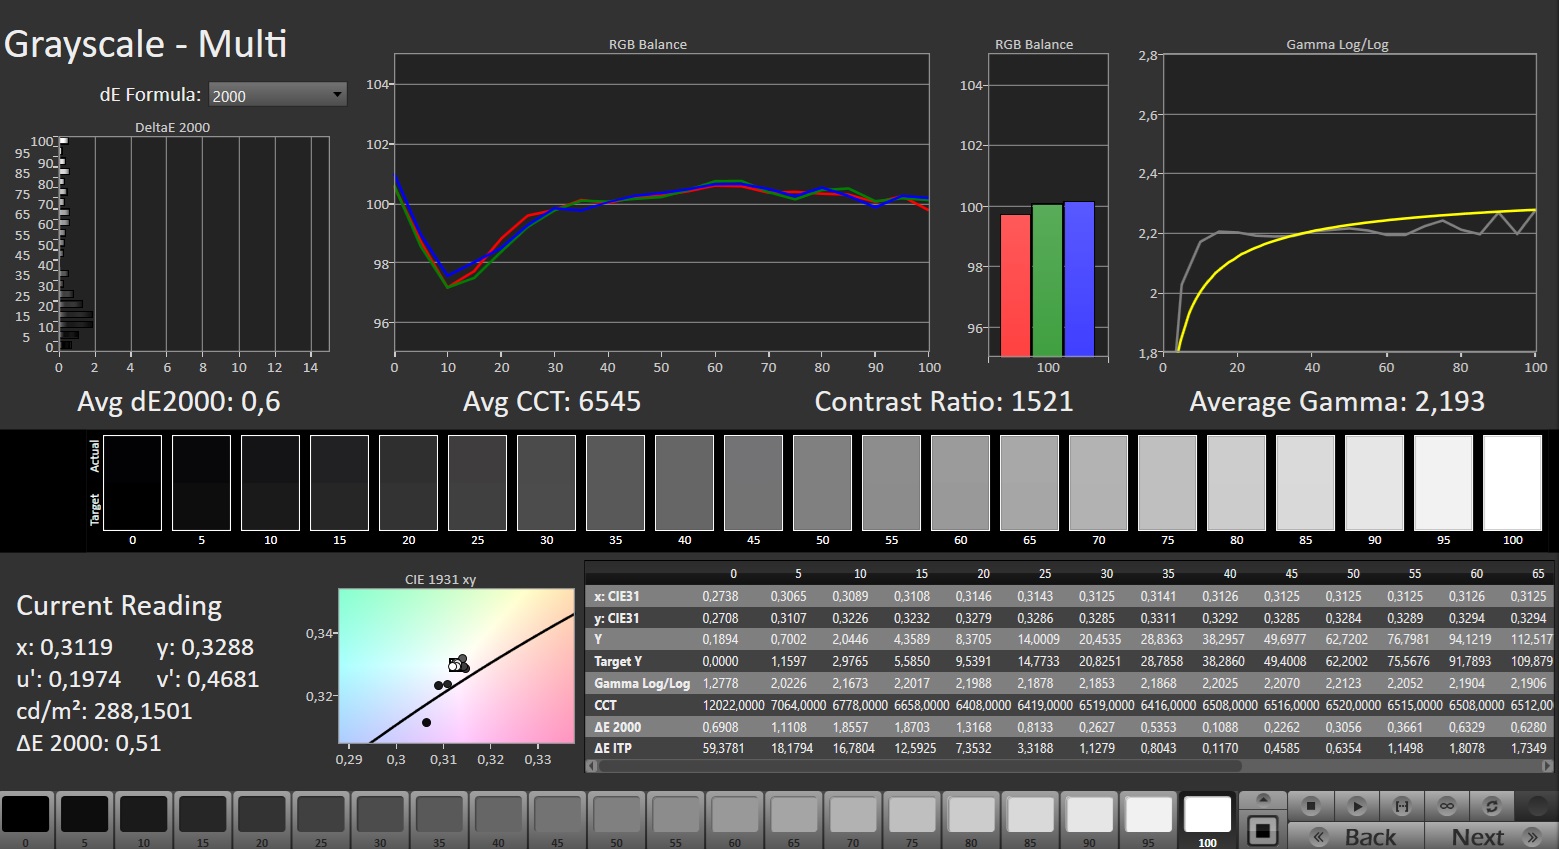
Panel nie jest w stanie odwzorować popularnych przestrzeni barw (AdobeRGB, sRGB, DCI-P3). Pod tym względem ekrany niektórych konkurentów oferują więcej. Odwzorowanie kolorów również nie jest najlepsze: Jego fabryczne odchylenie wynosi 5,5, a kalibracja zmniejsza wartość do około 3,5 - w każdym razie jego cel (DeltaE < 3) został pominięty.
Wyświetl czasy reakcji
| ↔ Czas reakcji od czerni do bieli | ||
|---|---|---|
| 18.7 ms ... wzrost ↗ i spadek ↘ łącznie | ↗ 9.6 ms wzrost | 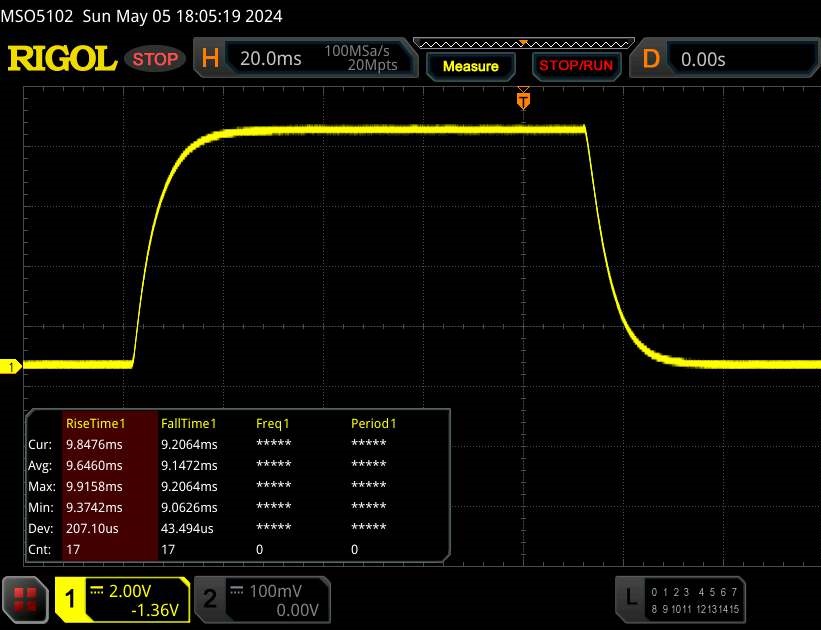 |
| ↘ 9.1 ms upadek | ||
| W naszych testach ekran wykazuje dobry współczynnik reakcji, ale może być zbyt wolny dla graczy rywalizujących ze sobą. Dla porównania, wszystkie testowane urządzenia wahają się od 0.1 (minimum) do 240 (maksimum) ms. » 38 % wszystkich urządzeń jest lepszych. Oznacza to, że zmierzony czas reakcji jest lepszy od średniej wszystkich testowanych urządzeń (20.8 ms). | ||
| ↔ Czas reakcji 50% szarości do 80% szarości | ||
| 28.6 ms ... wzrost ↗ i spadek ↘ łącznie | ↗ 13.3 ms wzrost | 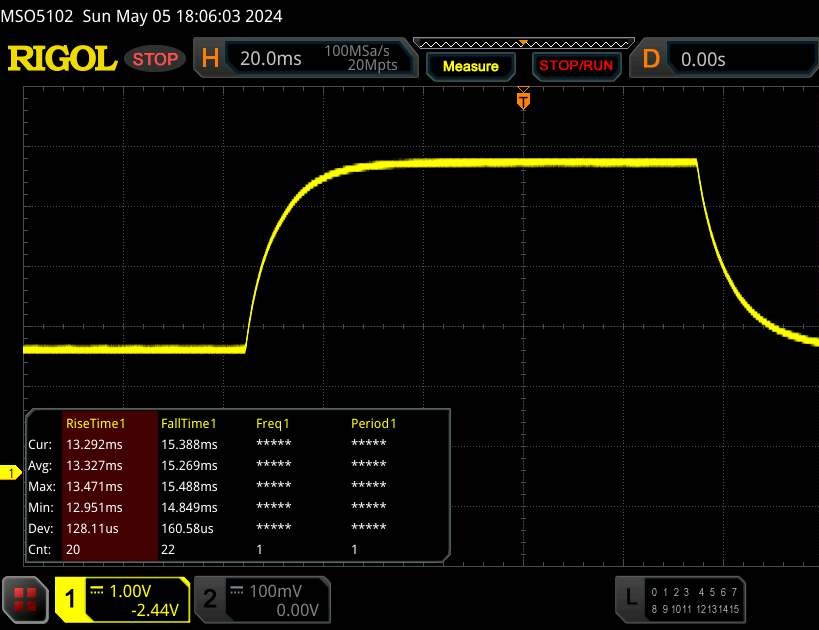 |
| ↘ 15.3 ms upadek | ||
| W naszych testach ekran wykazuje stosunkowo powolne tempo reakcji i może być zbyt wolny dla graczy. Dla porównania, wszystkie testowane urządzenia wahają się od 0.165 (minimum) do 636 (maksimum) ms. » 35 % wszystkich urządzeń jest lepszych. Oznacza to, że zmierzony czas reakcji jest lepszy od średniej wszystkich testowanych urządzeń (32.5 ms). | ||
Migotanie ekranu / PWM (modulacja szerokości impulsu)
| Migotanie ekranu/nie wykryto PWM | 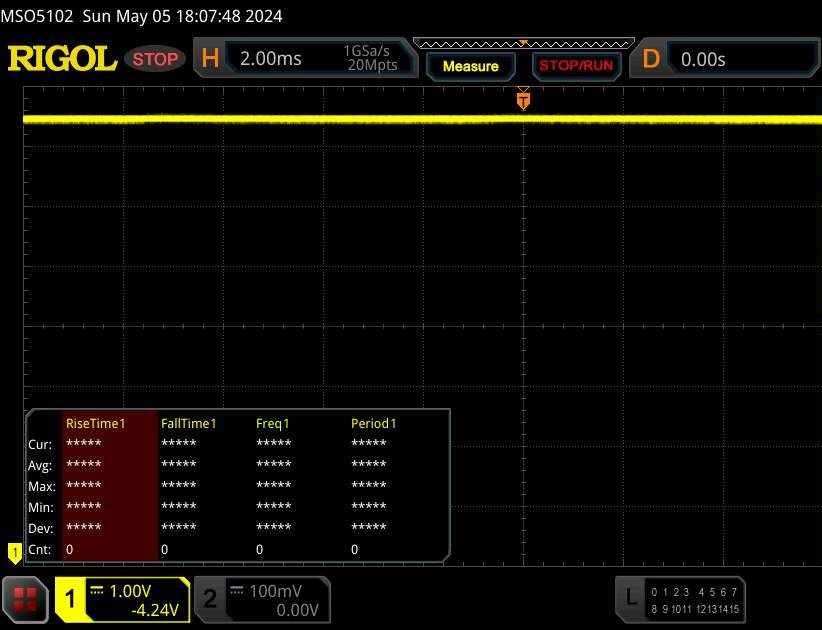 | ||
Dla porównania: 53 % wszystkich testowanych urządzeń nie używa PWM do przyciemniania wyświetlacza. Jeśli wykryto PWM, zmierzono średnio 8516 (minimum: 5 - maksimum: 343500) Hz. | |||
Wydajność - Raptor Lake i Ada Lovelace zapewniają parę
HP ma w swojej ofercie różne warianty konfiguracji Victus 16. Obecnie najtańszą wersję serii Victus 16 r1000 można znaleźć za około 1300 USD (Core i5-14500HX, GeForce RTX 4050, 16 GB RAM, 512 GB SSD, bez systemu Windows). W przypadku niniejszego urządzenia testowego musieliby Państwo wydać około 1600 USD.
Warunki testowania
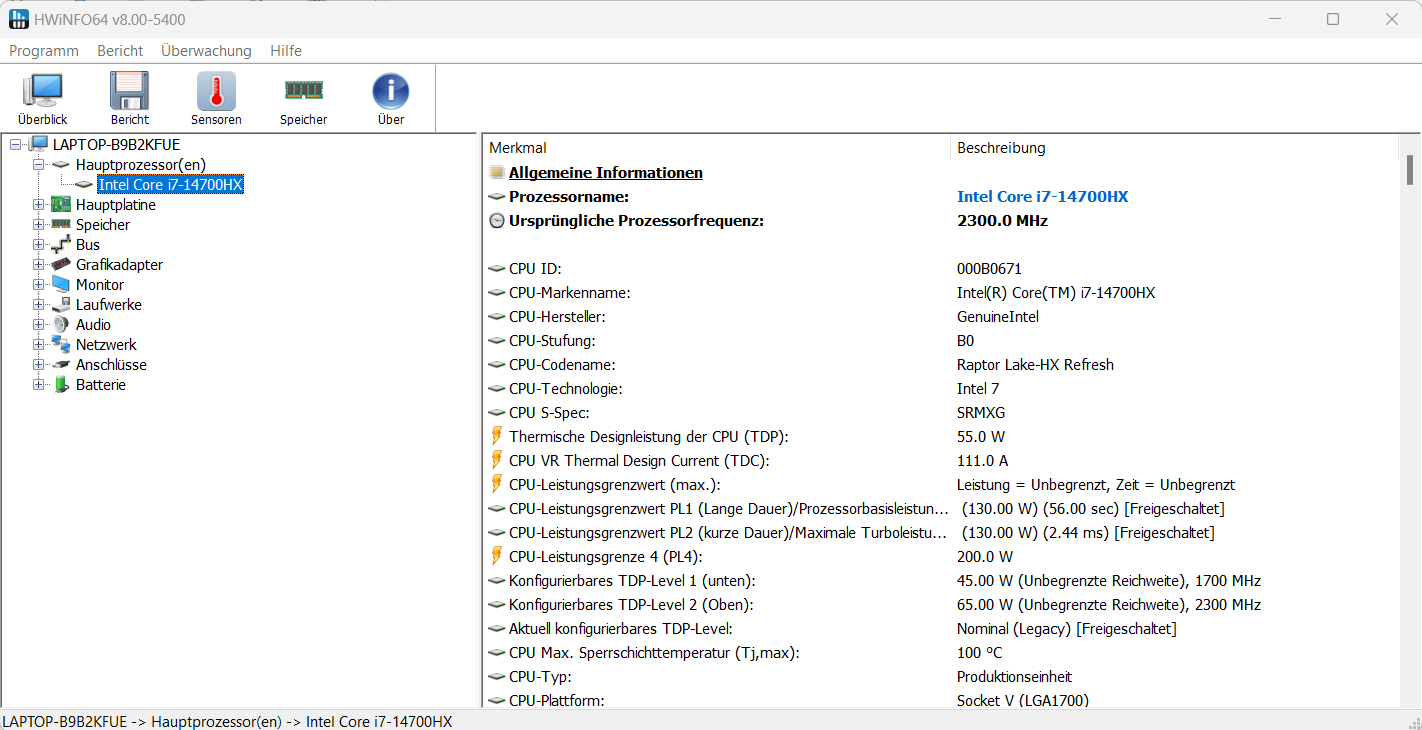
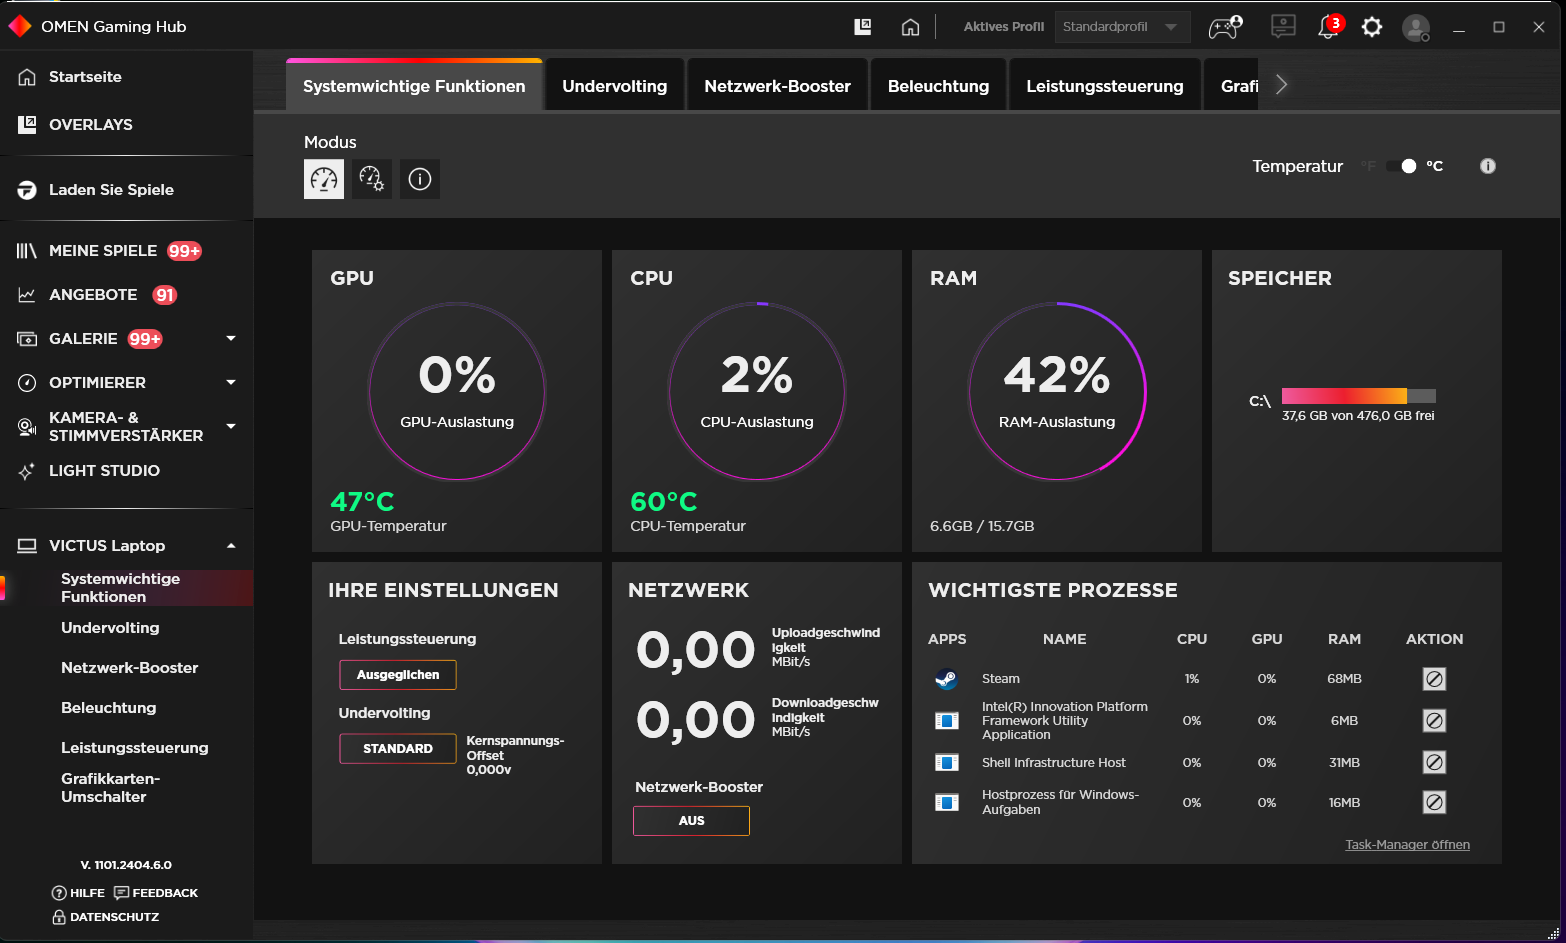
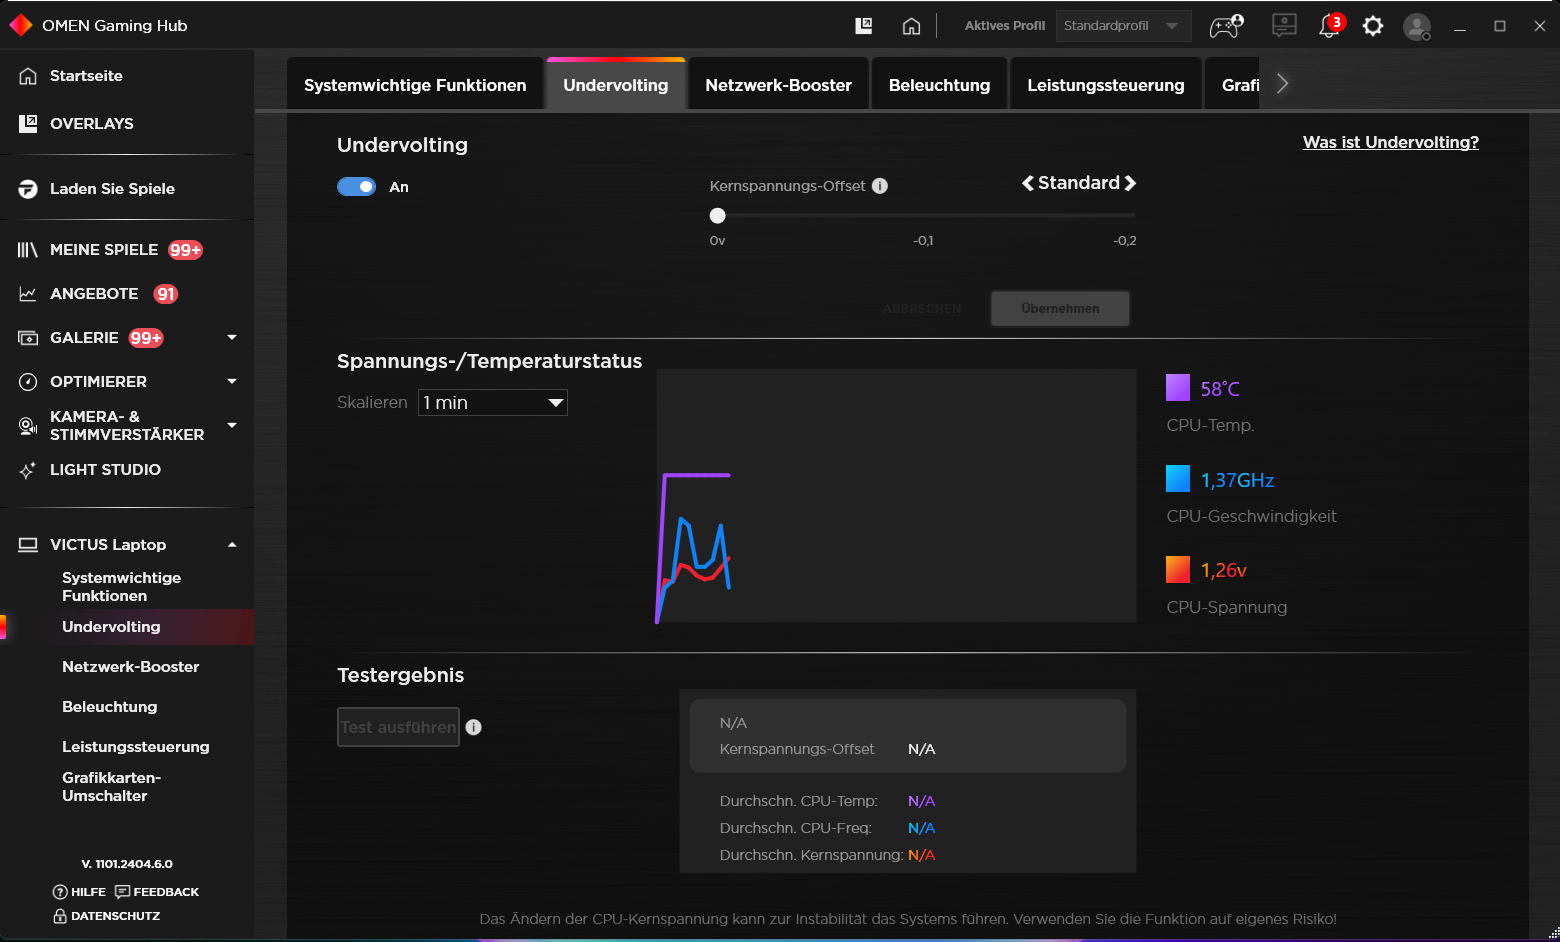
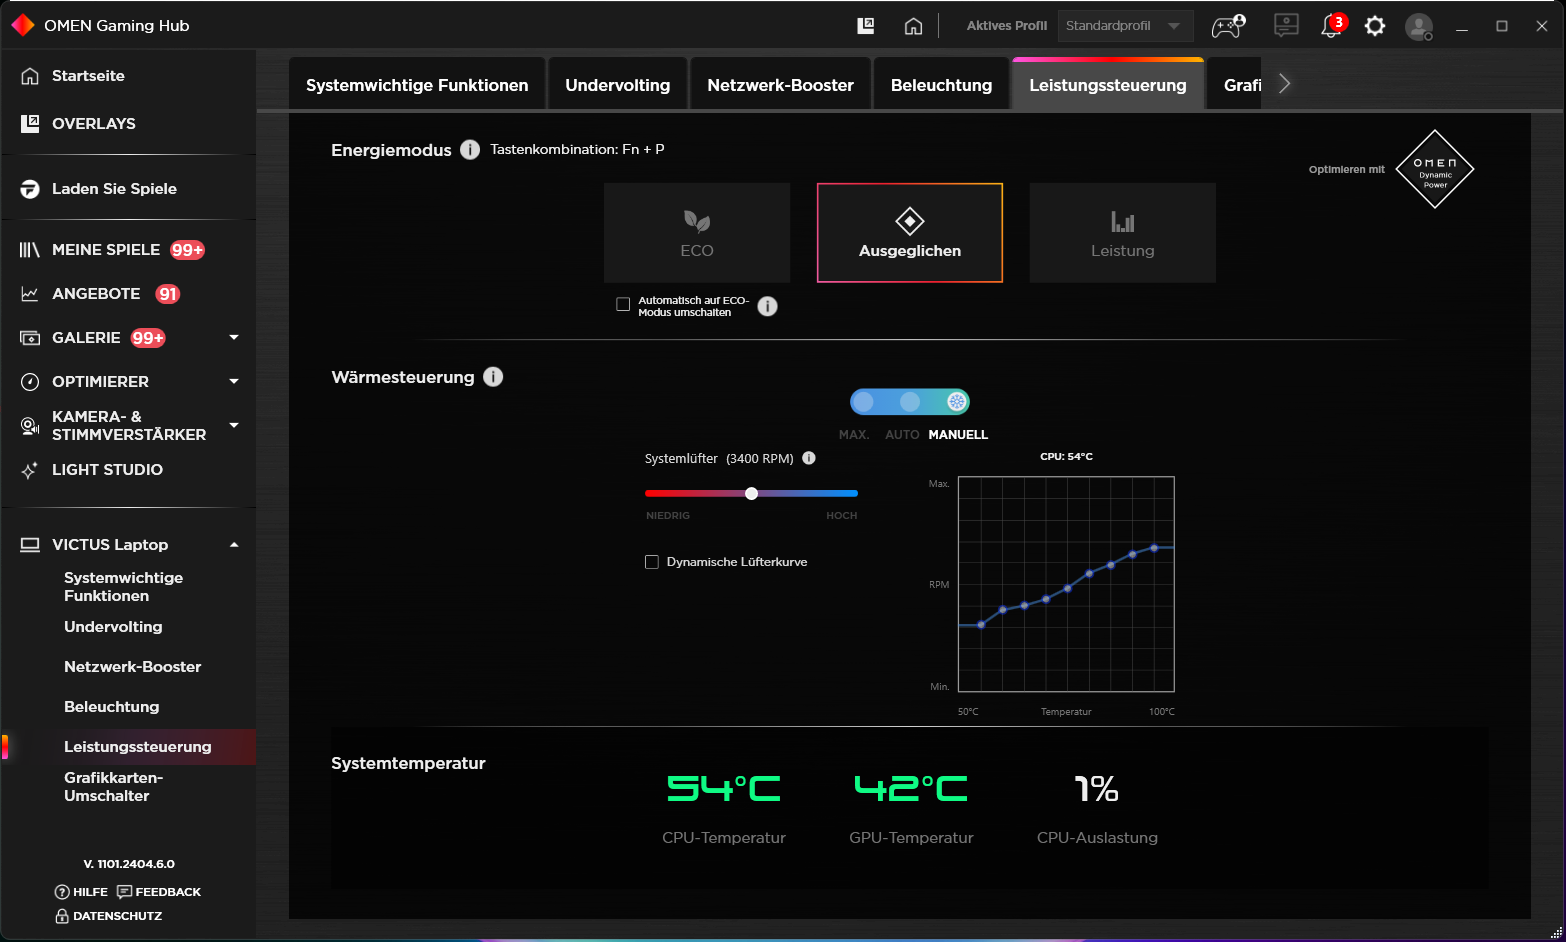
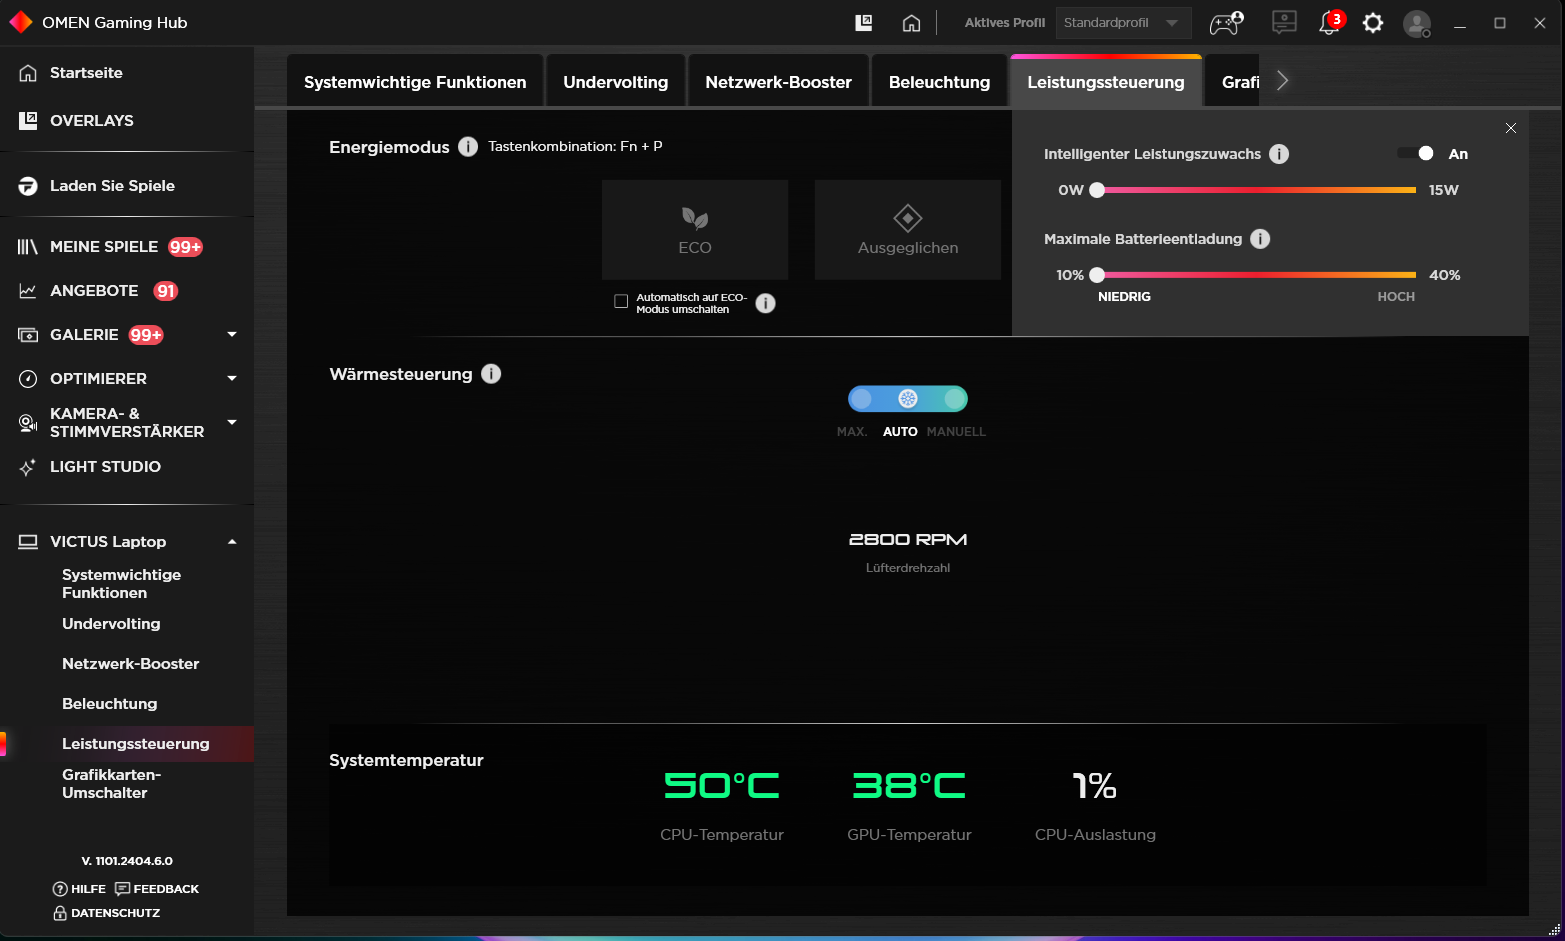
Użytkownicy mają do wyboru trzy tryby systemowe HP (patrz tabela). Podczas naszych testów korzystaliśmy z trybów "Balanced" (benchmarki) i "ECO" (testy baterii). Szybkiej zmiany trybów można dokonać za pomocą kombinacji klawiszy (Fn + P). "Omen Gaming Hub" (centrum sterowania laptopa) również pozwala wybrać tryb. Umożliwia on również między innymi podkręcenie procesora i ustawienie indywidualnej krzywej wentylatora.
| Zrównoważony | Wydajność | Eco | |
|---|---|---|---|
| Limit mocy 1 (HWInfo) | 130 watów | 130 watów | 130 watów |
| Limit mocy 2 (HWInfo) | 130 watów | 130 watów | 130 watów |
| Wydajność (Witcher 3) | 98 fps | 100 fps | 60 fps (zablokowane) |
| Hałas (Witcher 3) | 43 dB(A) | 52 dB(A) | 38 dB(A) |
Procesor
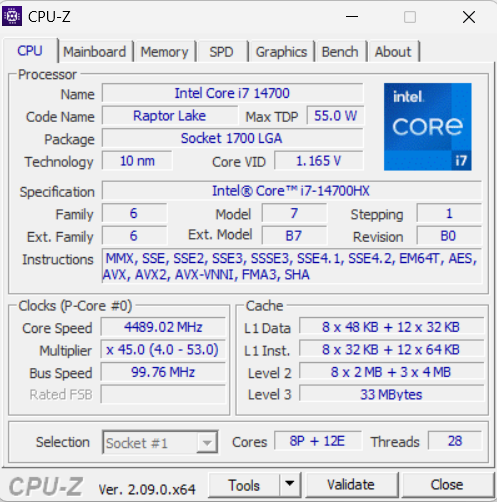
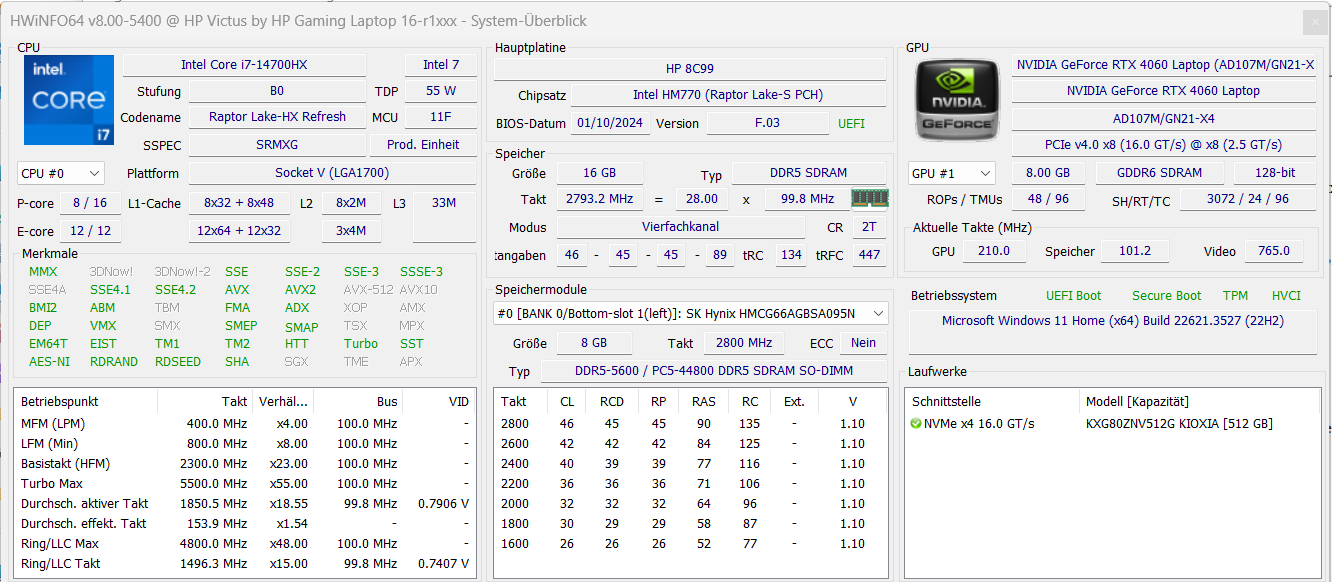
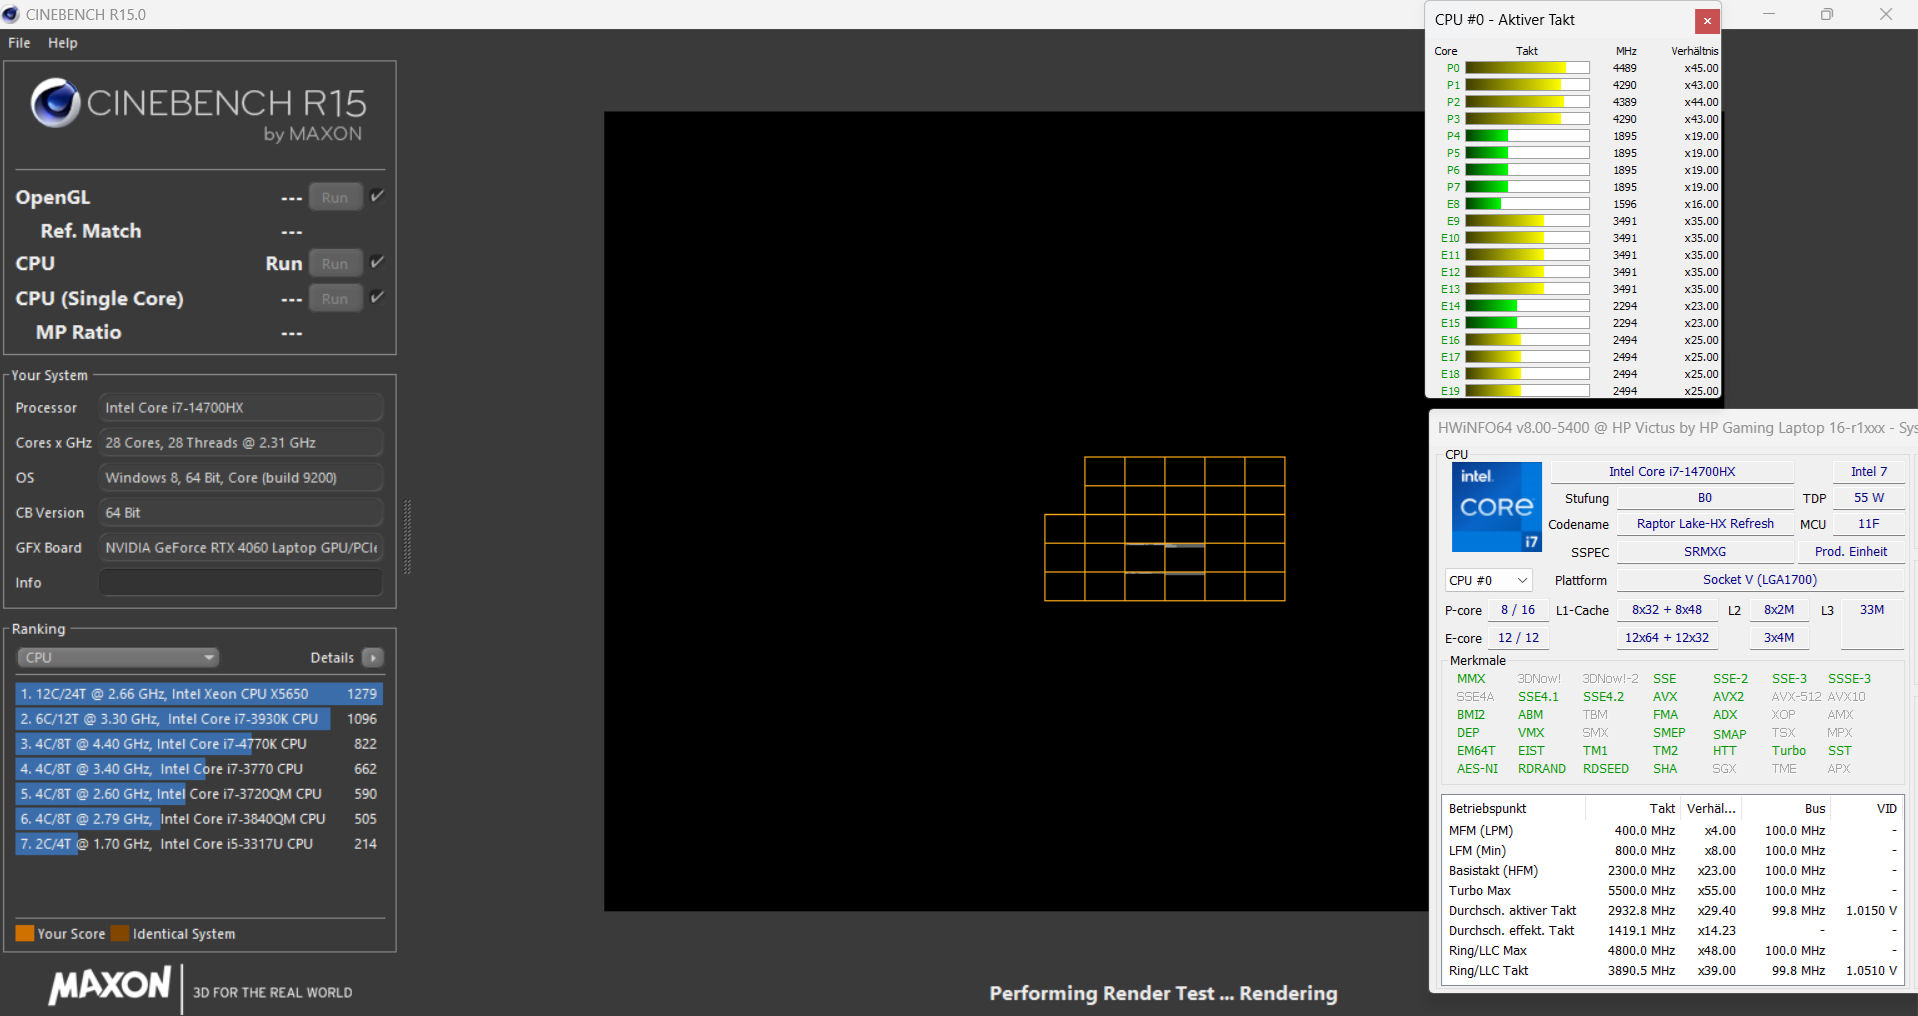
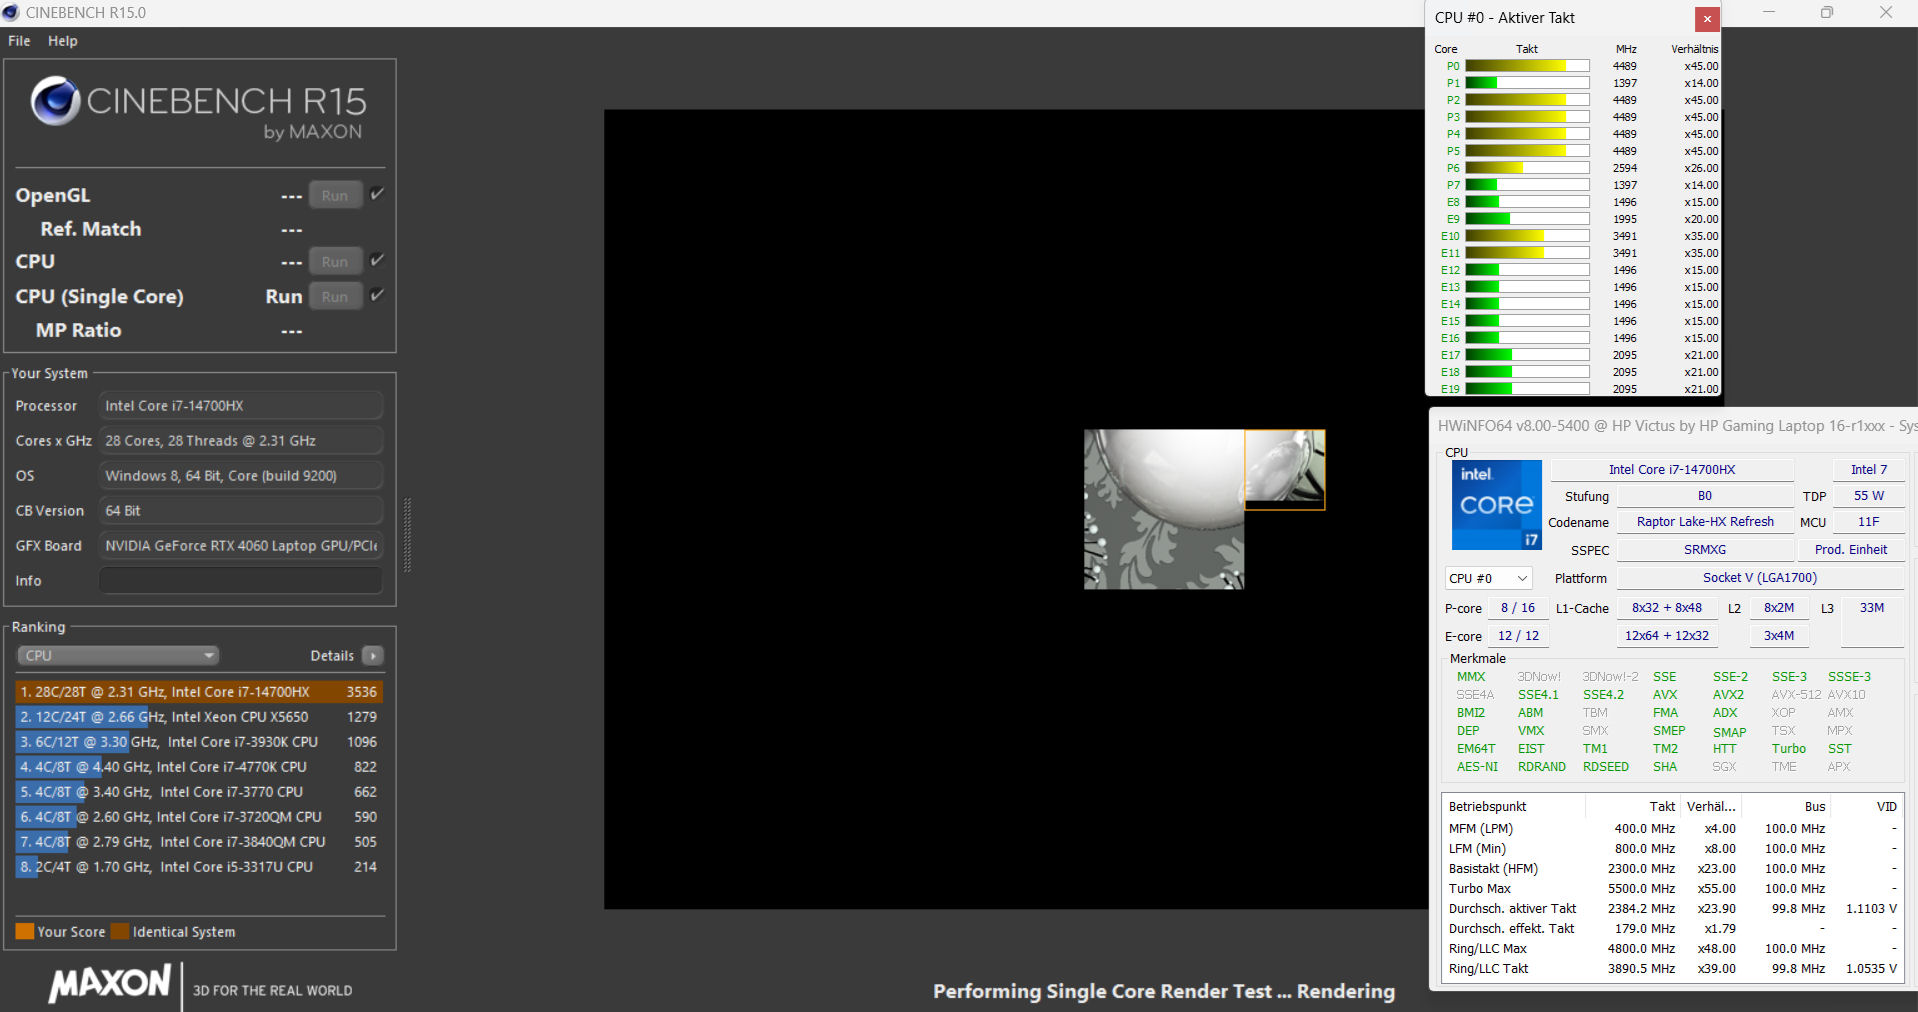
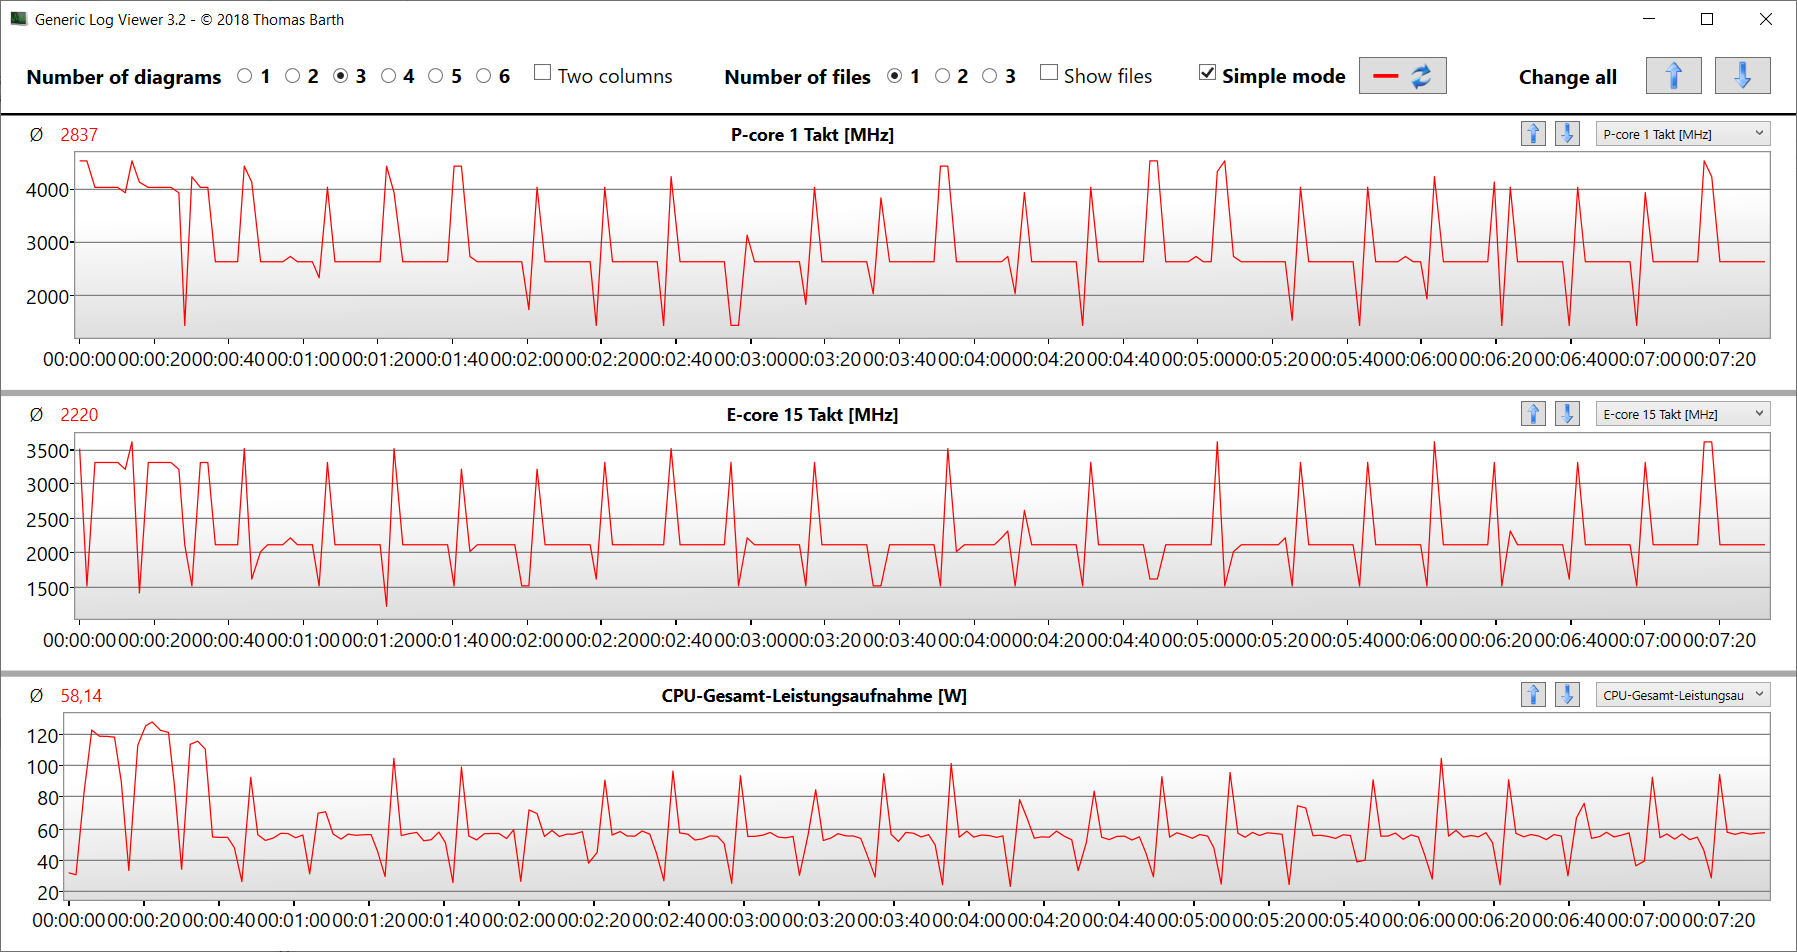
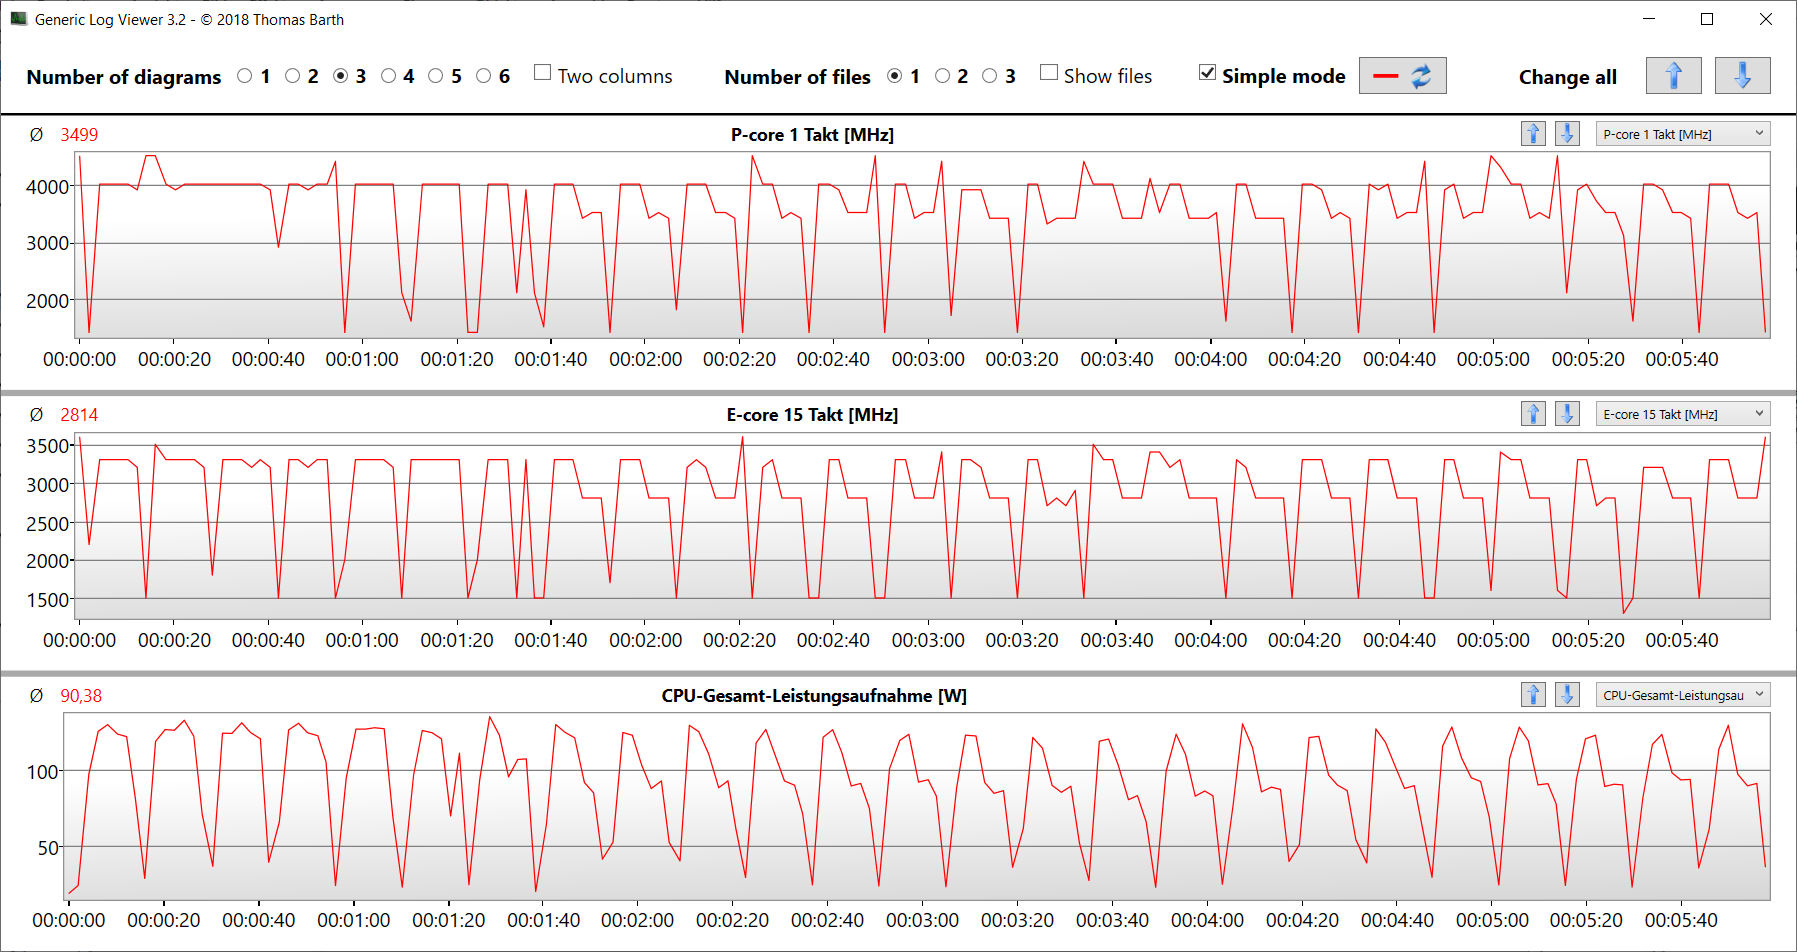
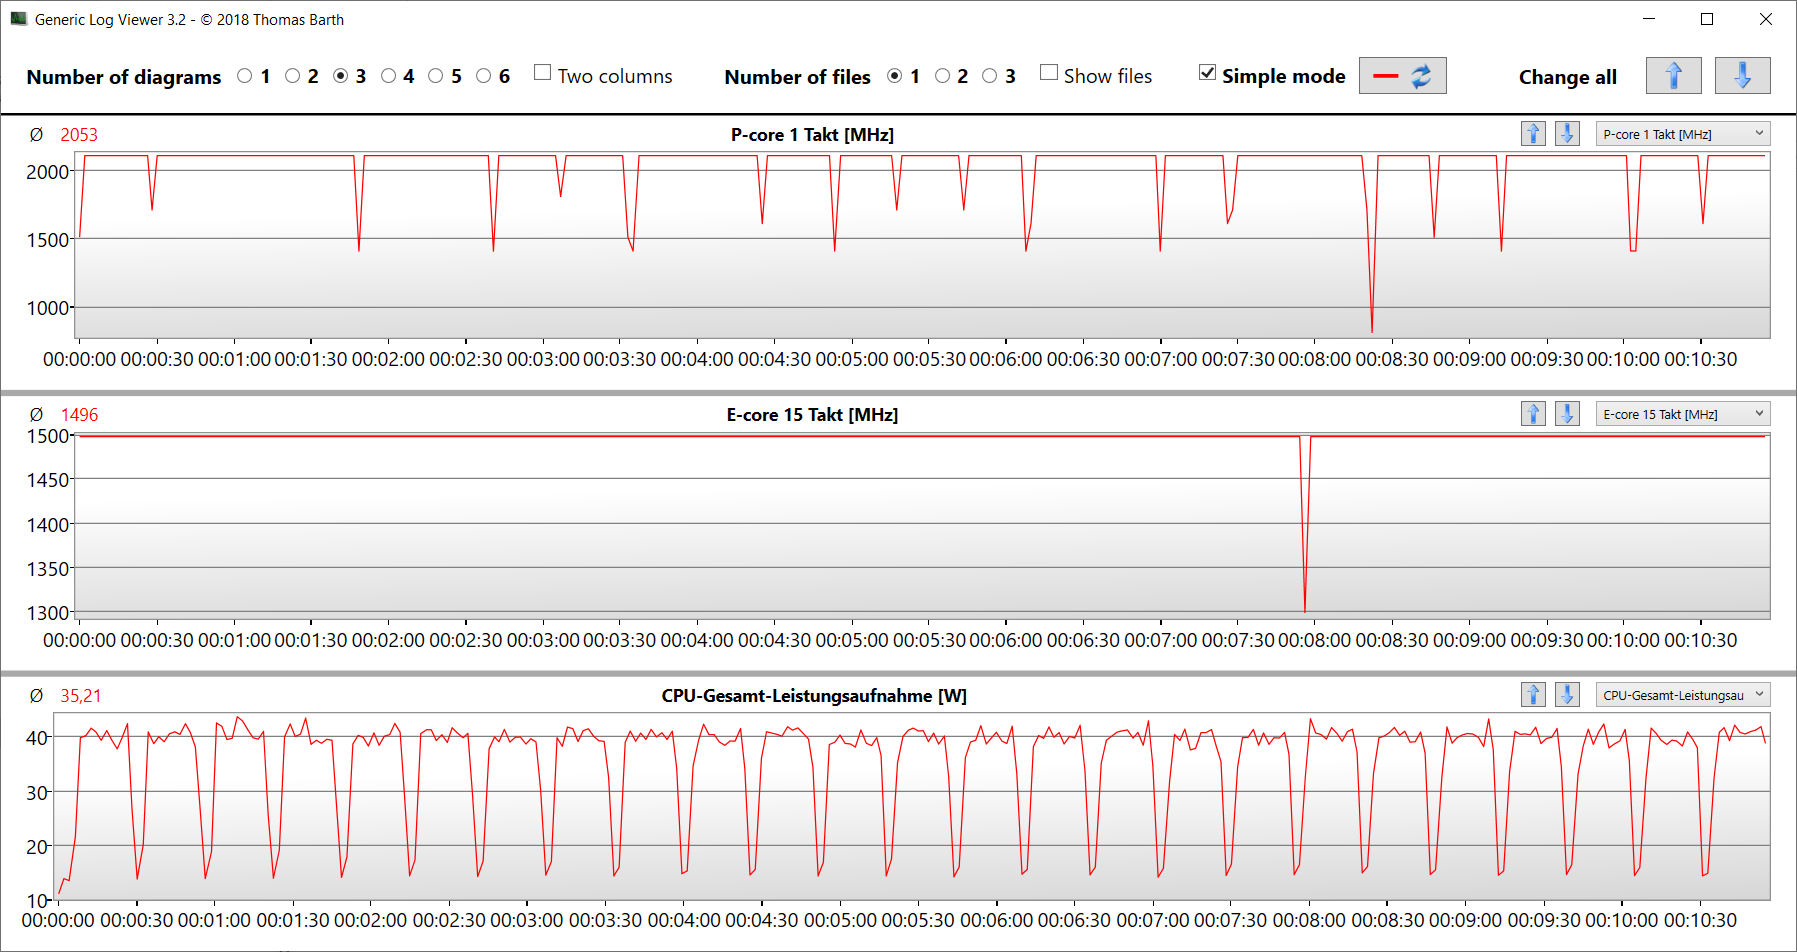
Procesor Core i7-14700HX(Raptor Lake) 20 rdzeni CPU (8P + 12E = 28 wątków) osiąga maksymalne częstotliwości taktowania 5,5 GHz (P) i 3,9 GHz (E). Stałe obciążenie wielowątkowe (CB15 Loop) prowadzi do spadku częstotliwości taktowania od pierwszego do czwartego uruchomienia ("Balanced"). Następnie utrzymuje się na stałym poziomie. "Wydajność" skutkuje stale wyższą częstotliwością taktowania.
Wyniki benchmarków były nieco rozczarowujące: Pomimo czterech dodatkowych rdzeni CPU i wyższych częstotliwości taktowania, procesor nie był w stanie zdystansować Legion 5 16IRX G9's Core i7-14650HX. Jego wydajność wielowątkowa jest praktycznie taka sama, podczas gdy 14650HX jest wyraźnym zwycięzcą, jeśli chodzi o wydajność jednowątkową.
Cinebench R15 Multi continuous test
| CPU Performance Rating - Percent | |
| Lenovo Legion 5 16IRX G9 | |
| Przeciętny Intel Core i7-14700HX | |
| HP Victus 16 (2024) | |
| Średnia w klasie Gaming | |
| HP Victus 16 (2024) | |
| Dell G16, i7-13650HX, RTX 4060 | |
| Gigabyte G6X 9KG (2024) | |
| Asus TUF Gaming A16 FA617XS -2! | |
| Cinebench R20 | |
| CPU (Multi Core) | |
| Lenovo Legion 5 16IRX G9 | |
| HP Victus 16 (2024) | |
| Przeciętny Intel Core i7-14700HX (8361 - 10498, n=7) | |
| HP Victus 16 (2024) (Leistung) | |
| Średnia w klasie Gaming (2179 - 15517, n=151, ostatnie 2 lata) | |
| Dell G16, i7-13650HX, RTX 4060 | |
| Gigabyte G6X 9KG (2024) | |
| Asus TUF Gaming A16 FA617XS | |
| CPU (Single Core) | |
| Przeciętny Intel Core i7-14700HX (651 - 821, n=7) | |
| Lenovo Legion 5 16IRX G9 | |
| Średnia w klasie Gaming (439 - 866, n=151, ostatnie 2 lata) | |
| Dell G16, i7-13650HX, RTX 4060 | |
| Asus TUF Gaming A16 FA617XS | |
| Gigabyte G6X 9KG (2024) | |
| HP Victus 16 (2024) (Leistung) | |
| HP Victus 16 (2024) | |
| Cinebench R15 | |
| CPU Multi 64Bit | |
| HP Victus 16 (2024) | |
| Lenovo Legion 5 16IRX G9 | |
| Przeciętny Intel Core i7-14700HX (3328 - 4137, n=7) | |
| HP Victus 16 (2024) (Leistung) | |
| Średnia w klasie Gaming (905 - 6074, n=154, ostatnie 2 lata) | |
| Dell G16, i7-13650HX, RTX 4060 | |
| Gigabyte G6X 9KG (2024) | |
| Asus TUF Gaming A16 FA617XS | |
| CPU Single 64Bit | |
| Lenovo Legion 5 16IRX G9 | |
| Asus TUF Gaming A16 FA617XS | |
| Przeciętny Intel Core i7-14700HX (238 - 304, n=7) | |
| Średnia w klasie Gaming (191.9 - 343, n=151, ostatnie 2 lata) | |
| Dell G16, i7-13650HX, RTX 4060 | |
| Gigabyte G6X 9KG (2024) | |
| HP Victus 16 (2024) (Leistung) | |
| HP Victus 16 (2024) | |
| Blender - v2.79 BMW27 CPU | |
| Gigabyte G6X 9KG (2024) | |
| Asus TUF Gaming A16 FA617XS | |
| Średnia w klasie Gaming (81 - 555, n=144, ostatnie 2 lata) | |
| HP Victus 16 (2024) | |
| Dell G16, i7-13650HX, RTX 4060 | |
| Przeciętny Intel Core i7-14700HX (126 - 184, n=7) | |
| Lenovo Legion 5 16IRX G9 | |
| HP Victus 16 (2024) (Leistung) | |
| Geekbench 6.4 | |
| Multi-Core | |
| Przeciętny Intel Core i7-14700HX (14807 - 17562, n=7) | |
| Lenovo Legion 5 16IRX G9 (6.2.1) | |
| HP Victus 16 (2024) (6.2.1, Leistung) | |
| HP Victus 16 (2024) (6.2.1) | |
| Średnia w klasie Gaming (5340 - 21668, n=119, ostatnie 2 lata) | |
| Dell G16, i7-13650HX, RTX 4060 (6.2.1) | |
| Gigabyte G6X 9KG (2024) (6.2.1) | |
| Single-Core | |
| Przeciętny Intel Core i7-14700HX (2378 - 2975, n=7) | |
| Lenovo Legion 5 16IRX G9 (6.2.1) | |
| Średnia w klasie Gaming (1490 - 3219, n=119, ostatnie 2 lata) | |
| Dell G16, i7-13650HX, RTX 4060 (6.2.1) | |
| Gigabyte G6X 9KG (2024) (6.2.1) | |
| HP Victus 16 (2024) (6.2.1, Leistung) | |
| HP Victus 16 (2024) (6.2.1) | |
| HWBOT x265 Benchmark v2.2 - 4k Preset | |
| HP Victus 16 (2024) (Leistung) | |
| Lenovo Legion 5 16IRX G9 | |
| Przeciętny Intel Core i7-14700HX (22 - 27.4, n=7) | |
| Średnia w klasie Gaming (6.72 - 42.9, n=148, ostatnie 2 lata) | |
| HP Victus 16 (2024) | |
| Asus TUF Gaming A16 FA617XS | |
| Dell G16, i7-13650HX, RTX 4060 | |
| Gigabyte G6X 9KG (2024) | |
| LibreOffice - 20 Documents To PDF | |
| HP Victus 16 (2024) (6.3.4.2) | |
| Dell G16, i7-13650HX, RTX 4060 (6.3.4.2) | |
| Średnia w klasie Gaming (19 - 96.6, n=147, ostatnie 2 lata) | |
| Przeciętny Intel Core i7-14700HX (41.9 - 55.3, n=7) | |
| Lenovo Legion 5 16IRX G9 (6.3.4.2) | |
| HP Victus 16 (2024) (6.3.4.2. Leistung) | |
| Asus TUF Gaming A16 FA617XS | |
| Gigabyte G6X 9KG (2024) (6.3.4.2) | |
| R Benchmark 2.5 - Overall mean | |
| HP Victus 16 (2024) | |
| HP Victus 16 (2024) (Leistung) | |
| Średnia w klasie Gaming (0.3609 - 0.759, n=150, ostatnie 2 lata) | |
| Gigabyte G6X 9KG (2024) | |
| Asus TUF Gaming A16 FA617XS | |
| Dell G16, i7-13650HX, RTX 4060 | |
| Dell G16, i7-13650HX, RTX 4060 | |
| Lenovo Legion 5 16IRX G9 | |
| Przeciętny Intel Core i7-14700HX (0.3821 - 0.4896, n=7) | |
* ... im mniej tym lepiej
AIDA64: FP32 Ray-Trace | FPU Julia | CPU SHA3 | CPU Queen | FPU SinJulia | FPU Mandel | CPU AES | CPU ZLib | FP64 Ray-Trace | CPU PhotoWorxx
| Performance Rating | |
| HP Victus 16 (2024) | |
| Asus TUF Gaming A16 FA617XS | |
| Przeciętny Intel Core i7-14700HX | |
| Średnia w klasie Gaming | |
| Lenovo Legion 5 16IRX G9 | |
| Dell G16, i7-13650HX, RTX 4060 | |
| HP Victus 16 (2024) | |
| Gigabyte G6X 9KG (2024) | |
| AIDA64 / FP32 Ray-Trace | |
| Asus TUF Gaming A16 FA617XS (v6.75.6100) | |
| Średnia w klasie Gaming (4986 - 81639, n=147, ostatnie 2 lata) | |
| HP Victus 16 (2024) (v6.92.6600, Leistung) | |
| Przeciętny Intel Core i7-14700HX (16932 - 23676, n=7) | |
| Lenovo Legion 5 16IRX G9 (v6.92.6600) | |
| Dell G16, i7-13650HX, RTX 4060 (v6.92.6600) | |
| HP Victus 16 (2024) (v6.92.6600) | |
| Gigabyte G6X 9KG (2024) (v6.92.6600) | |
| AIDA64 / FPU Julia | |
| Asus TUF Gaming A16 FA617XS (v6.75.6100) | |
| HP Victus 16 (2024) (v6.92.6600, Leistung) | |
| Przeciętny Intel Core i7-14700HX (86338 - 116556, n=7) | |
| Średnia w klasie Gaming (25360 - 252486, n=147, ostatnie 2 lata) | |
| Lenovo Legion 5 16IRX G9 (v6.92.6600) | |
| Dell G16, i7-13650HX, RTX 4060 (v6.92.6600) | |
| HP Victus 16 (2024) (v6.92.6600) | |
| Gigabyte G6X 9KG (2024) (v6.92.6600) | |
| AIDA64 / CPU SHA3 | |
| HP Victus 16 (2024) (v6.92.6600, Leistung) | |
| Przeciętny Intel Core i7-14700HX (4008 - 5567, n=7) | |
| Średnia w klasie Gaming (1339 - 10389, n=147, ostatnie 2 lata) | |
| Asus TUF Gaming A16 FA617XS (v6.75.6100) | |
| Dell G16, i7-13650HX, RTX 4060 (v6.92.6600) | |
| Lenovo Legion 5 16IRX G9 (v6.92.6600) | |
| HP Victus 16 (2024) (v6.92.6600) | |
| Gigabyte G6X 9KG (2024) (v6.92.6600) | |
| AIDA64 / CPU Queen | |
| Przeciętny Intel Core i7-14700HX (129836 - 152200, n=7) | |
| HP Victus 16 (2024) (v6.92.6600, Leistung) | |
| HP Victus 16 (2024) (v6.92.6600) | |
| Asus TUF Gaming A16 FA617XS (v6.75.6100) | |
| Średnia w klasie Gaming (50699 - 200651, n=147, ostatnie 2 lata) | |
| Gigabyte G6X 9KG (2024) (v6.92.6600) | |
| Dell G16, i7-13650HX, RTX 4060 (v6.92.6600) | |
| Lenovo Legion 5 16IRX G9 (v6.92.6600) | |
| AIDA64 / FPU SinJulia | |
| Asus TUF Gaming A16 FA617XS (v6.75.6100) | |
| Przeciętny Intel Core i7-14700HX (11704 - 14434, n=7) | |
| Średnia w klasie Gaming (4800 - 32988, n=147, ostatnie 2 lata) | |
| HP Victus 16 (2024) (v6.92.6600, Leistung) | |
| Lenovo Legion 5 16IRX G9 (v6.92.6600) | |
| HP Victus 16 (2024) (v6.92.6600) | |
| Dell G16, i7-13650HX, RTX 4060 (v6.92.6600) | |
| Gigabyte G6X 9KG (2024) (v6.92.6600) | |
| AIDA64 / FPU Mandel | |
| Asus TUF Gaming A16 FA617XS (v6.75.6100) | |
| Średnia w klasie Gaming (12321 - 134044, n=147, ostatnie 2 lata) | |
| HP Victus 16 (2024) (v6.92.6600, Leistung) | |
| Przeciętny Intel Core i7-14700HX (42125 - 58380, n=7) | |
| Lenovo Legion 5 16IRX G9 (v6.92.6600) | |
| Dell G16, i7-13650HX, RTX 4060 (v6.92.6600) | |
| HP Victus 16 (2024) (v6.92.6600) | |
| Gigabyte G6X 9KG (2024) (v6.92.6600) | |
| AIDA64 / CPU AES | |
| HP Victus 16 (2024) (v6.92.6600, Leistung) | |
| Średnia w klasie Gaming (19065 - 328679, n=147, ostatnie 2 lata) | |
| Przeciętny Intel Core i7-14700HX (82161 - 113157, n=7) | |
| Lenovo Legion 5 16IRX G9 (v6.92.6600) | |
| Asus TUF Gaming A16 FA617XS (v6.75.6100) | |
| Dell G16, i7-13650HX, RTX 4060 (v6.92.6600) | |
| HP Victus 16 (2024) (v6.92.6600) | |
| Gigabyte G6X 9KG (2024) (v6.92.6600) | |
| AIDA64 / CPU ZLib | |
| HP Victus 16 (2024) (v6.92.6600, Leistung) | |
| Przeciętny Intel Core i7-14700HX (1177 - 1682, n=7) | |
| Średnia w klasie Gaming (373 - 2531, n=147, ostatnie 2 lata) | |
| Lenovo Legion 5 16IRX G9 (v6.92.6600) | |
| Dell G16, i7-13650HX, RTX 4060 (v6.92.6600) | |
| HP Victus 16 (2024) (v6.92.6600) | |
| Gigabyte G6X 9KG (2024) (v6.92.6600) | |
| Asus TUF Gaming A16 FA617XS (v6.75.6100) | |
| AIDA64 / FP64 Ray-Trace | |
| Asus TUF Gaming A16 FA617XS (v6.75.6100) | |
| Średnia w klasie Gaming (2540 - 43430, n=147, ostatnie 2 lata) | |
| Przeciętny Intel Core i7-14700HX (9029 - 12928, n=7) | |
| HP Victus 16 (2024) (v6.92.6600, Leistung) | |
| Dell G16, i7-13650HX, RTX 4060 (v6.92.6600) | |
| Lenovo Legion 5 16IRX G9 (v6.92.6600) | |
| HP Victus 16 (2024) (v6.92.6600) | |
| Gigabyte G6X 9KG (2024) (v6.92.6600) | |
| AIDA64 / CPU PhotoWorxx | |
| Przeciętny Intel Core i7-14700HX (39151 - 49671, n=7) | |
| Średnia w klasie Gaming (10805 - 60161, n=147, ostatnie 2 lata) | |
| HP Victus 16 (2024) (v6.92.6600) | |
| HP Victus 16 (2024) (v6.92.6600, Leistung) | |
| Gigabyte G6X 9KG (2024) (v6.92.6600) | |
| Dell G16, i7-13650HX, RTX 4060 (v6.92.6600) | |
| Lenovo Legion 5 16IRX G9 (v6.92.6600) | |
| Asus TUF Gaming A16 FA617XS (v6.75.6100) | |
Wydajność systemu
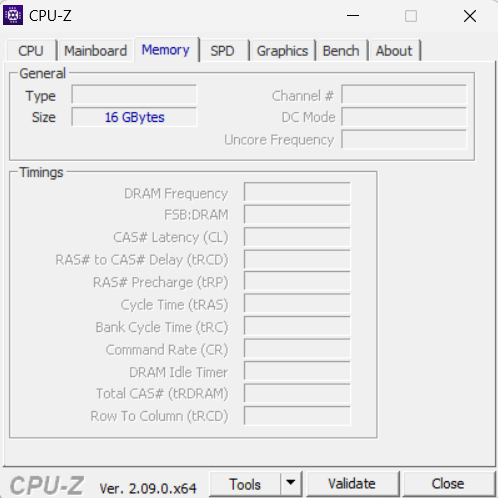
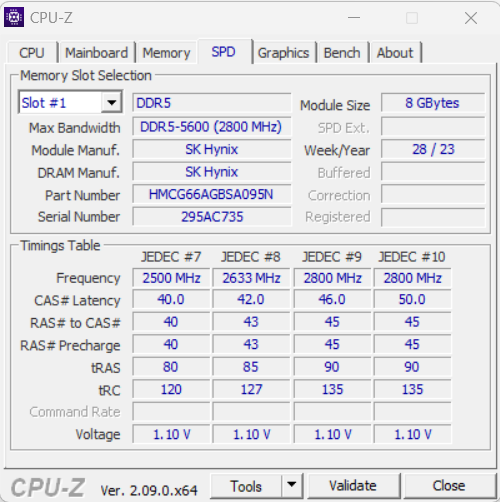
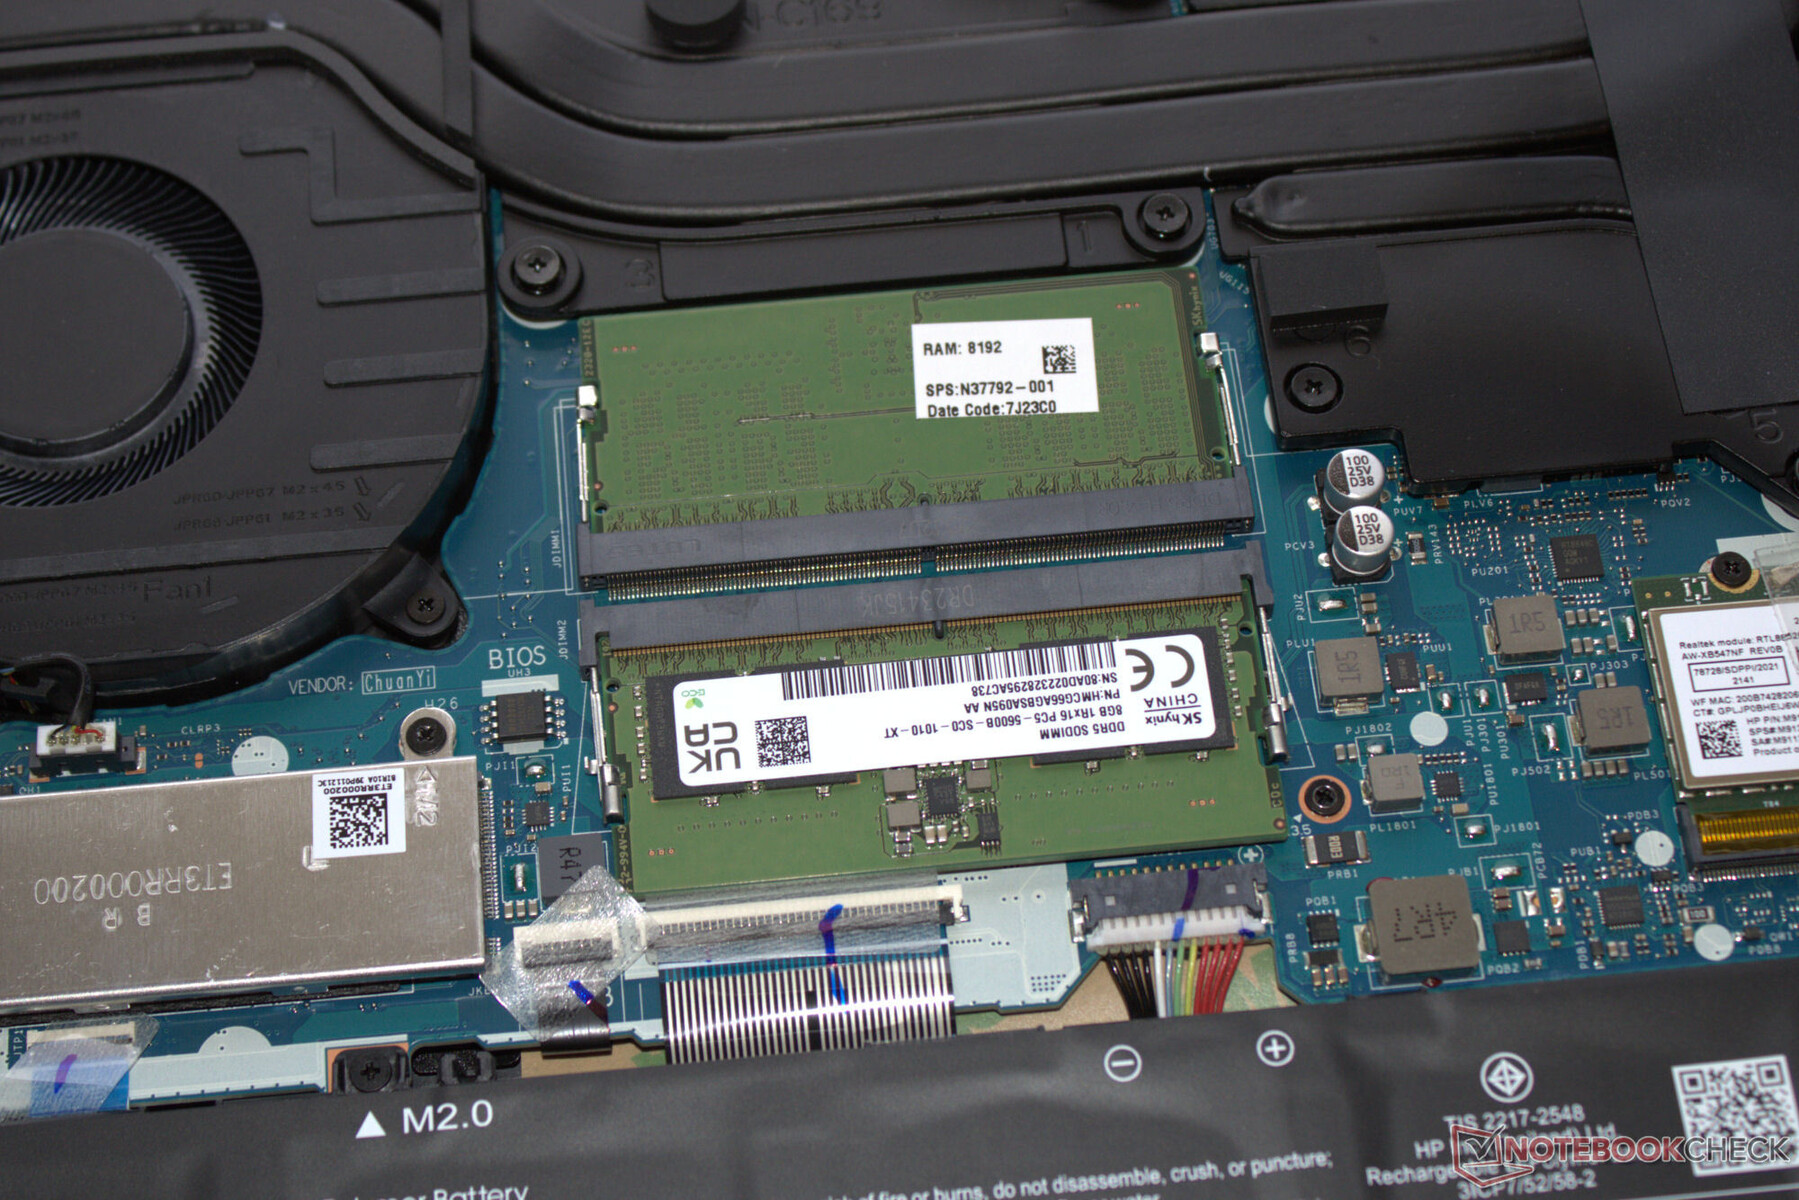
Płynnie działający system zapewnia wystarczającą wydajność dla wymagających aplikacji, takich jak gry, renderowanie i strumieniowanie. Szybkość transferu pamięci RAM jest na normalnym poziomie dla pamięci DDR5-5600 RAM.
CrossMark: Overall | Productivity | Creativity | Responsiveness
WebXPRT 3: Overall
WebXPRT 4: Overall
Mozilla Kraken 1.1: Total
| PCMark 10 / Score | |
| Asus TUF Gaming A16 FA617XS | |
| Przeciętny Intel Core i7-14700HX, NVIDIA GeForce RTX 4060 Laptop GPU (7528 - 8278, n=2) | |
| Średnia w klasie Gaming (5776 - 9852, n=133, ostatnie 2 lata) | |
| Lenovo Legion 5 16IRX G9 | |
| Gigabyte G6X 9KG (2024) | |
| HP Victus 16 (2024) | |
| Dell G16, i7-13650HX, RTX 4060 | |
| PCMark 10 / Essentials | |
| Przeciętny Intel Core i7-14700HX, NVIDIA GeForce RTX 4060 Laptop GPU (10778 - 11087, n=2) | |
| Asus TUF Gaming A16 FA617XS | |
| Lenovo Legion 5 16IRX G9 | |
| HP Victus 16 (2024) | |
| Średnia w klasie Gaming (9057 - 12600, n=133, ostatnie 2 lata) | |
| Gigabyte G6X 9KG (2024) | |
| Dell G16, i7-13650HX, RTX 4060 | |
| PCMark 10 / Productivity | |
| Asus TUF Gaming A16 FA617XS | |
| Gigabyte G6X 9KG (2024) | |
| Dell G16, i7-13650HX, RTX 4060 | |
| HP Victus 16 (2024) | |
| Średnia w klasie Gaming (6662 - 14612, n=133, ostatnie 2 lata) | |
| Przeciętny Intel Core i7-14700HX, NVIDIA GeForce RTX 4060 Laptop GPU (9823 - 9910, n=2) | |
| Lenovo Legion 5 16IRX G9 | |
| PCMark 10 / Digital Content Creation | |
| Przeciętny Intel Core i7-14700HX, NVIDIA GeForce RTX 4060 Laptop GPU (10841 - 14135, n=2) | |
| Średnia w klasie Gaming (6807 - 18475, n=133, ostatnie 2 lata) | |
| Lenovo Legion 5 16IRX G9 | |
| Asus TUF Gaming A16 FA617XS | |
| Dell G16, i7-13650HX, RTX 4060 | |
| Gigabyte G6X 9KG (2024) | |
| HP Victus 16 (2024) | |
| CrossMark / Overall | |
| Lenovo Legion 5 16IRX G9 | |
| Przeciętny Intel Core i7-14700HX, NVIDIA GeForce RTX 4060 Laptop GPU (1923 - 2132, n=2) | |
| Gigabyte G6X 9KG (2024) | |
| HP Victus 16 (2024) | |
| Średnia w klasie Gaming (1247 - 2344, n=114, ostatnie 2 lata) | |
| Dell G16, i7-13650HX, RTX 4060 | |
| Asus TUF Gaming A16 FA617XS | |
| CrossMark / Productivity | |
| Lenovo Legion 5 16IRX G9 | |
| Przeciętny Intel Core i7-14700HX, NVIDIA GeForce RTX 4060 Laptop GPU (1782 - 1973, n=2) | |
| Gigabyte G6X 9KG (2024) | |
| Średnia w klasie Gaming (1299 - 2204, n=114, ostatnie 2 lata) | |
| HP Victus 16 (2024) | |
| Dell G16, i7-13650HX, RTX 4060 | |
| Asus TUF Gaming A16 FA617XS | |
| CrossMark / Creativity | |
| Lenovo Legion 5 16IRX G9 | |
| Przeciętny Intel Core i7-14700HX, NVIDIA GeForce RTX 4060 Laptop GPU (2107 - 2399, n=2) | |
| HP Victus 16 (2024) | |
| Średnia w klasie Gaming (1275 - 2660, n=114, ostatnie 2 lata) | |
| Gigabyte G6X 9KG (2024) | |
| Dell G16, i7-13650HX, RTX 4060 | |
| Asus TUF Gaming A16 FA617XS | |
| CrossMark / Responsiveness | |
| Gigabyte G6X 9KG (2024) | |
| Lenovo Legion 5 16IRX G9 | |
| Przeciętny Intel Core i7-14700HX, NVIDIA GeForce RTX 4060 Laptop GPU (1835 - 1885, n=2) | |
| HP Victus 16 (2024) | |
| Średnia w klasie Gaming (1030 - 2330, n=114, ostatnie 2 lata) | |
| Dell G16, i7-13650HX, RTX 4060 | |
| Asus TUF Gaming A16 FA617XS | |
| WebXPRT 3 / Overall | |
| Lenovo Legion 5 16IRX G9 | |
| Gigabyte G6X 9KG (2024) | |
| Średnia w klasie Gaming (215 - 480, n=127, ostatnie 2 lata) | |
| Przeciętny Intel Core i7-14700HX, NVIDIA GeForce RTX 4060 Laptop GPU (276 - 301, n=2) | |
| HP Victus 16 (2024) | |
| Dell G16, i7-13650HX, RTX 4060 | |
| WebXPRT 4 / Overall | |
| Lenovo Legion 5 16IRX G9 | |
| Średnia w klasie Gaming (176.4 - 335, n=115, ostatnie 2 lata) | |
| Asus TUF Gaming A16 FA617XS | |
| Przeciętny Intel Core i7-14700HX, NVIDIA GeForce RTX 4060 Laptop GPU (251 - 273, n=2) | |
| Gigabyte G6X 9KG (2024) | |
| HP Victus 16 (2024) | |
| Mozilla Kraken 1.1 / Total | |
| HP Victus 16 (2024) | |
| Gigabyte G6X 9KG (2024) | |
| Dell G16, i7-13650HX, RTX 4060 | |
| Przeciętny Intel Core i7-14700HX, NVIDIA GeForce RTX 4060 Laptop GPU (467 - 542, n=2) | |
| Asus TUF Gaming A16 FA617XS | |
| Średnia w klasie Gaming (409 - 674, n=139, ostatnie 2 lata) | |
| Lenovo Legion 5 16IRX G9 | |
* ... im mniej tym lepiej
| PCMark 10 Score | 7528 pkt. | |
Pomoc | ||
| AIDA64 / Memory Copy | |
| Przeciętny Intel Core i7-14700HX (63949 - 78742, n=7) | |
| HP Victus 16 (2024) | |
| Średnia w klasie Gaming (21750 - 97515, n=147, ostatnie 2 lata) | |
| Gigabyte G6X 9KG (2024) | |
| Lenovo Legion 5 16IRX G9 | |
| Asus TUF Gaming A16 FA617XS | |
| Dell G16, i7-13650HX, RTX 4060 | |
| AIDA64 / Memory Read | |
| Przeciętny Intel Core i7-14700HX (68593 - 86175, n=7) | |
| HP Victus 16 (2024) | |
| Lenovo Legion 5 16IRX G9 | |
| Średnia w klasie Gaming (22956 - 102937, n=147, ostatnie 2 lata) | |
| Gigabyte G6X 9KG (2024) | |
| Dell G16, i7-13650HX, RTX 4060 | |
| Asus TUF Gaming A16 FA617XS | |
| AIDA64 / Memory Write | |
| Asus TUF Gaming A16 FA617XS | |
| Przeciętny Intel Core i7-14700HX (64033 - 76689, n=7) | |
| Średnia w klasie Gaming (22297 - 108954, n=147, ostatnie 2 lata) | |
| HP Victus 16 (2024) | |
| Gigabyte G6X 9KG (2024) | |
| Dell G16, i7-13650HX, RTX 4060 | |
| Lenovo Legion 5 16IRX G9 | |
| AIDA64 / Memory Latency | |
| HP Victus 16 (2024) | |
| Średnia w klasie Gaming (59.5 - 259, n=147, ostatnie 2 lata) | |
| Dell G16, i7-13650HX, RTX 4060 | |
| Asus TUF Gaming A16 FA617XS | |
| Gigabyte G6X 9KG (2024) | |
| Lenovo Legion 5 16IRX G9 | |
| Przeciętny Intel Core i7-14700HX (82.7 - 96.4, n=7) | |
* ... im mniej tym lepiej
Opóźnienia DPC
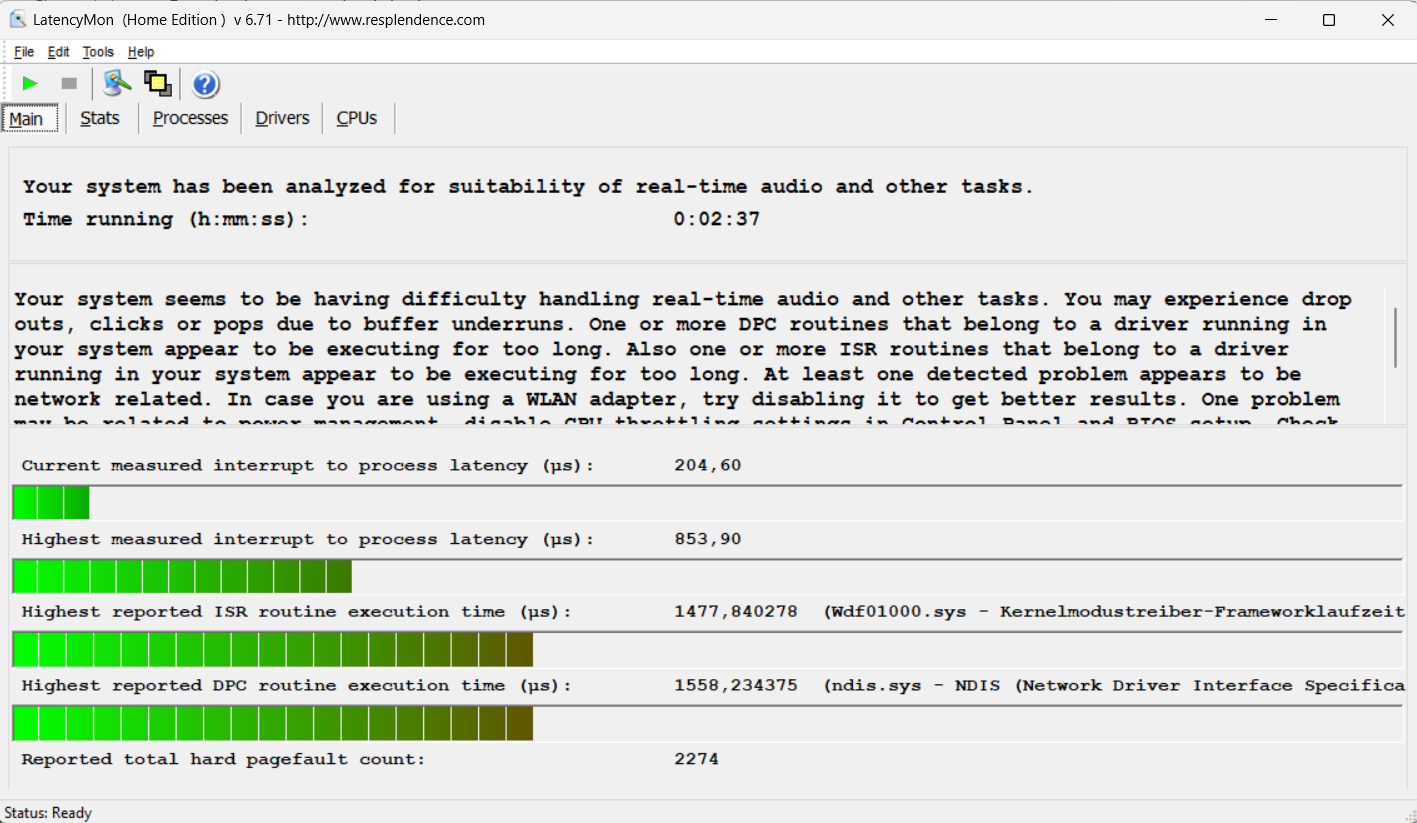
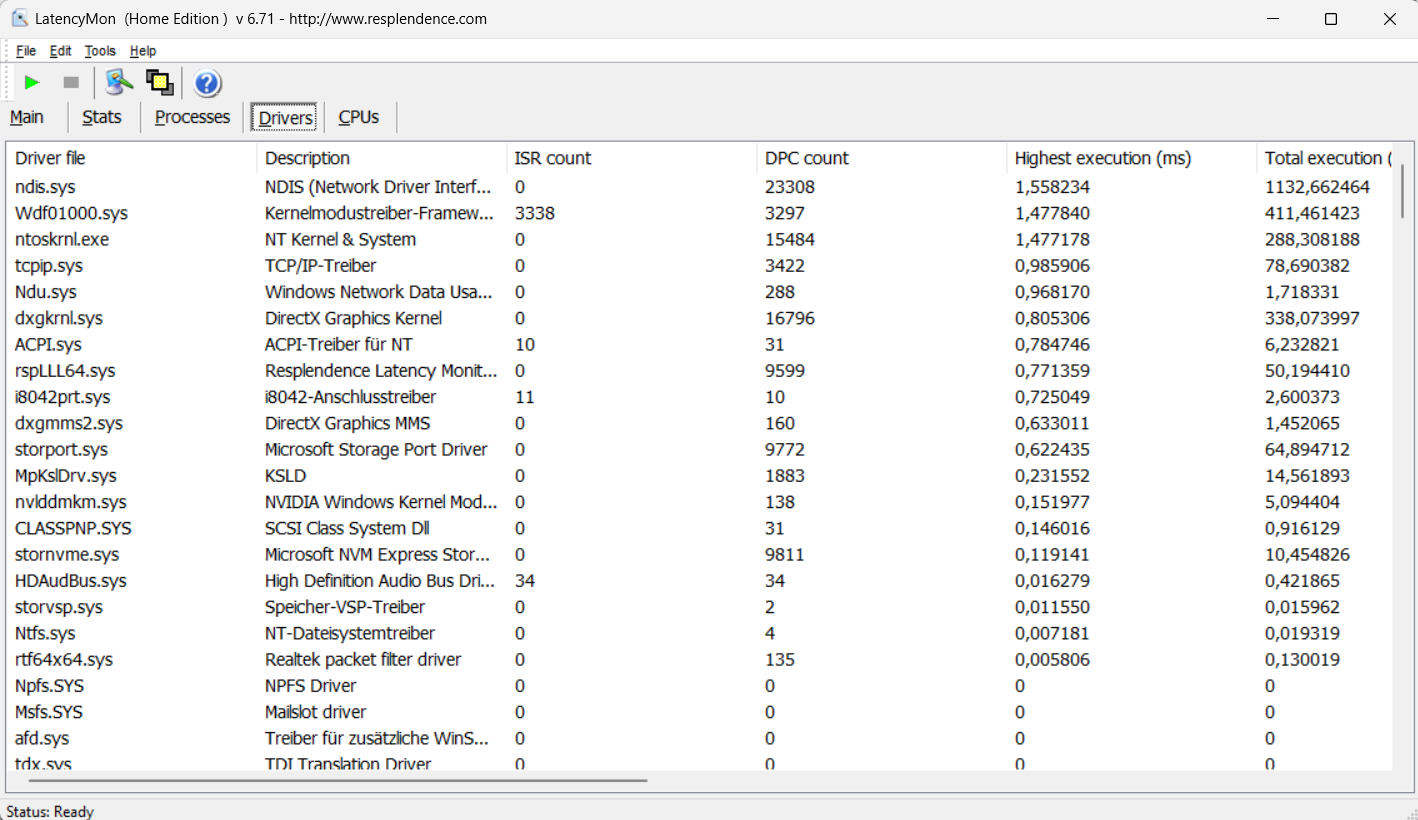
Sprawdzenie opóźnień laptopa (surfowanie po sieci, odtwarzanie wideo 4k, wysokie obciążenie Prime95) ujawniło pewne anomalie. Obecna kombinacja sprzętu i oprogramowania nie wydaje się być odpowiednia do edycji wideo i audio w czasie rzeczywistym. Przyszłe aktualizacje oprogramowania mogą doprowadzić do zmian.
| DPC Latencies / LatencyMon - interrupt to process latency (max), Web, Youtube, Prime95 | |
| Gigabyte G6X 9KG (2024) | |
| Lenovo Legion 5 16IRX G9 | |
| Asus TUF Gaming A16 FA617XS | |
| Dell G16, i7-13650HX, RTX 4060 | |
| HP Victus 16 (2024) | |
* ... im mniej tym lepiej
Urządzenia pamięci masowej
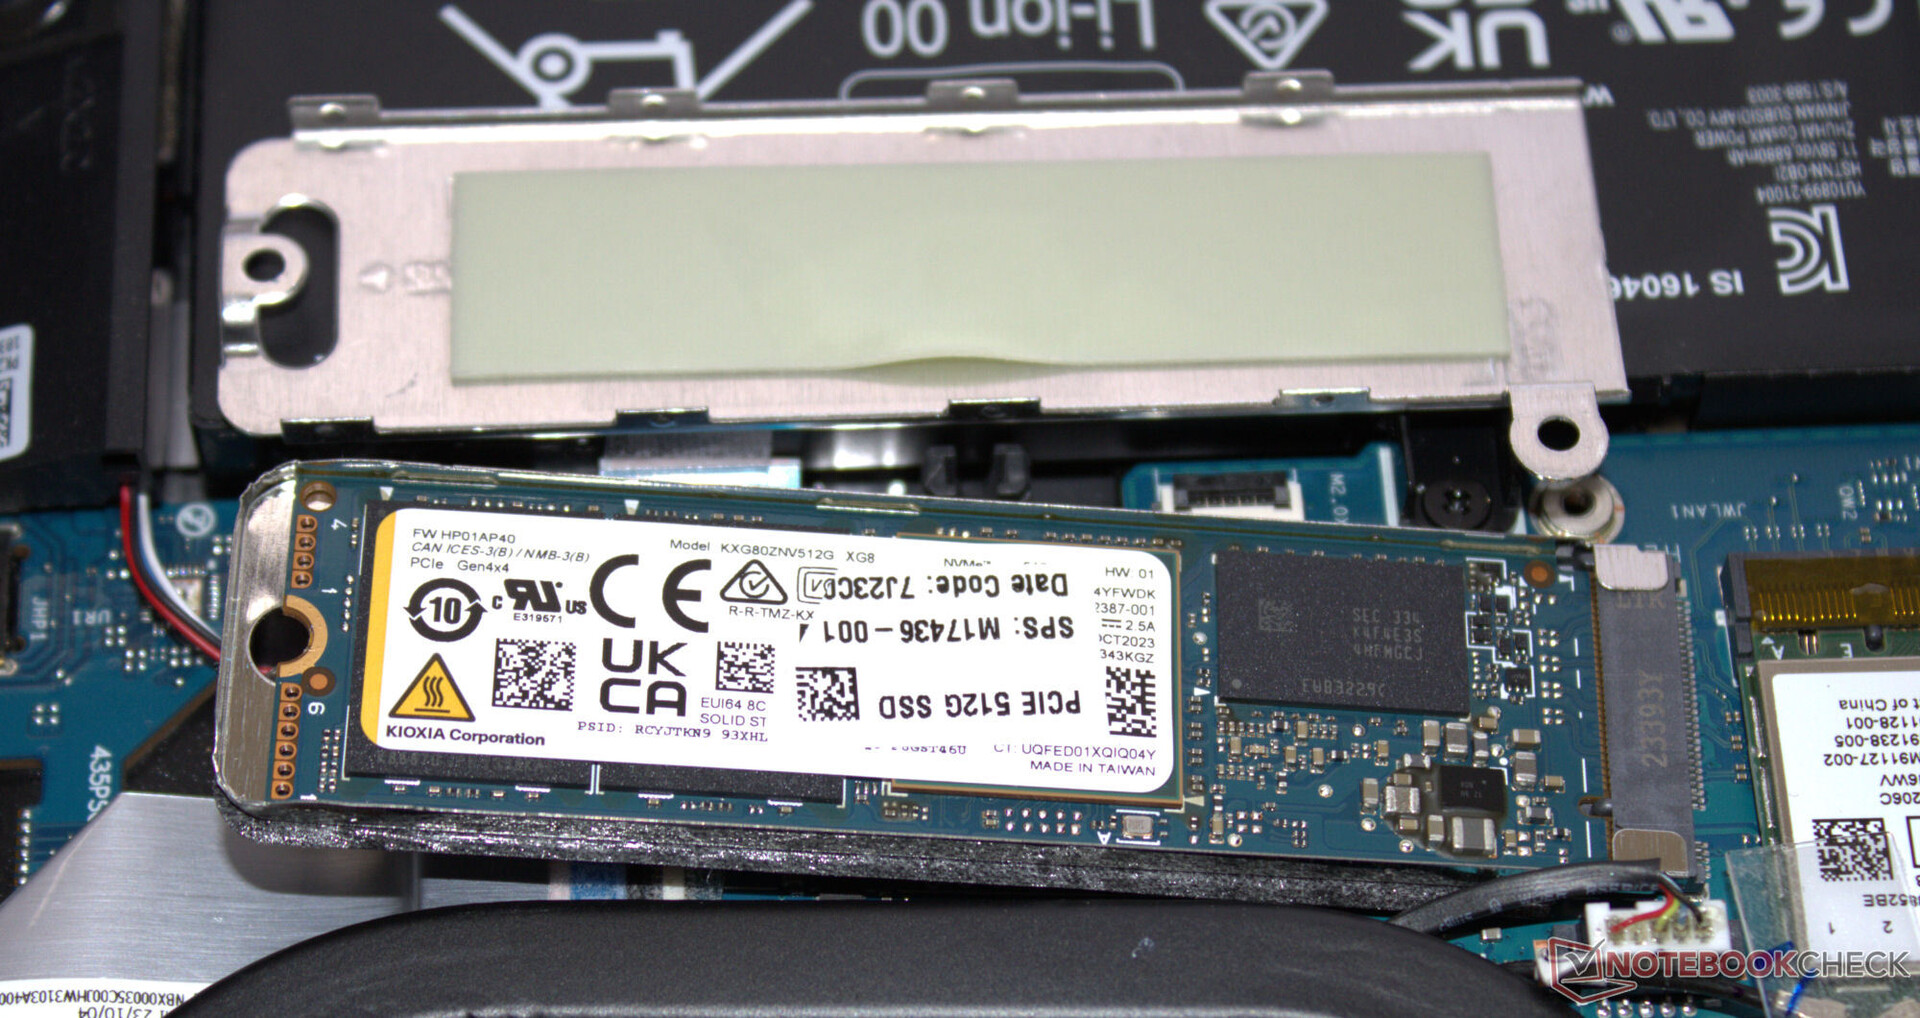
Dysk SSD PCIe 4 (M.2-2280) firmy Kioxia ma pojemność 512 GB i zapewnia dobre prędkości transferu. W trakcie trwania pętli DiskSpd jego szybkość transmisji danych spadała krok po kroku do niższego poziomu w wyniku dławienia termicznego. Laptop posiada miejsce na drugi dysk SSD.

* ... im mniej tym lepiej
Reading continuous performance: DiskSpd Read Loop, Queue Depth 8
Karta graficzna
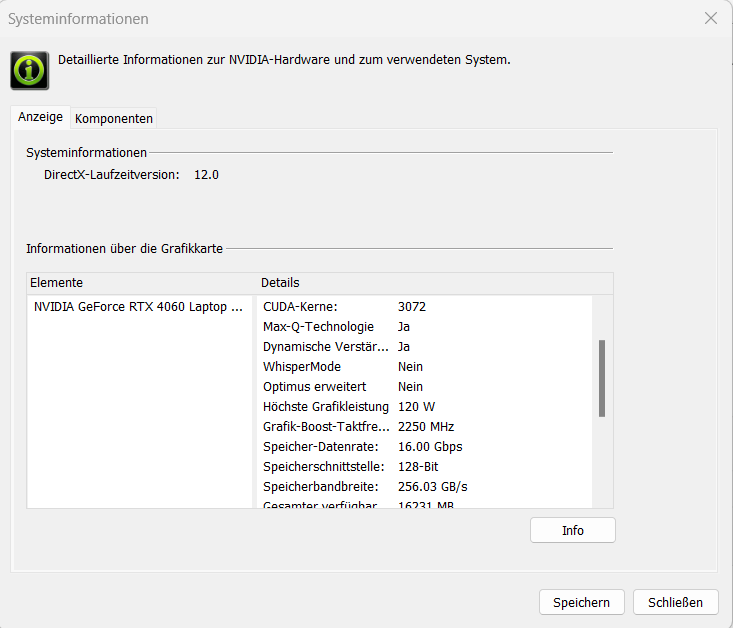
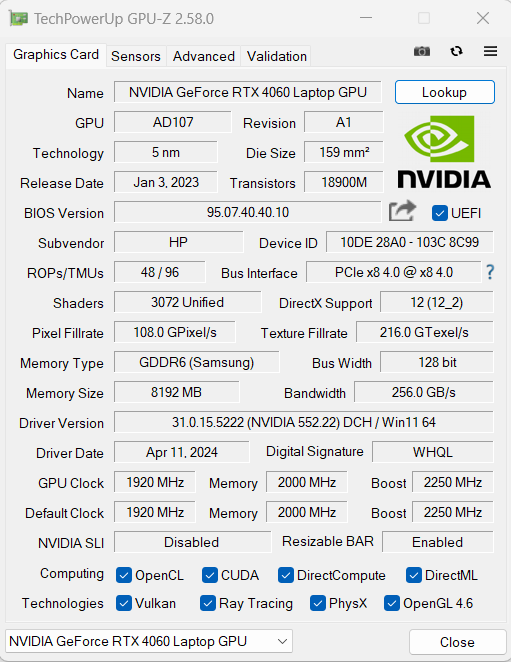
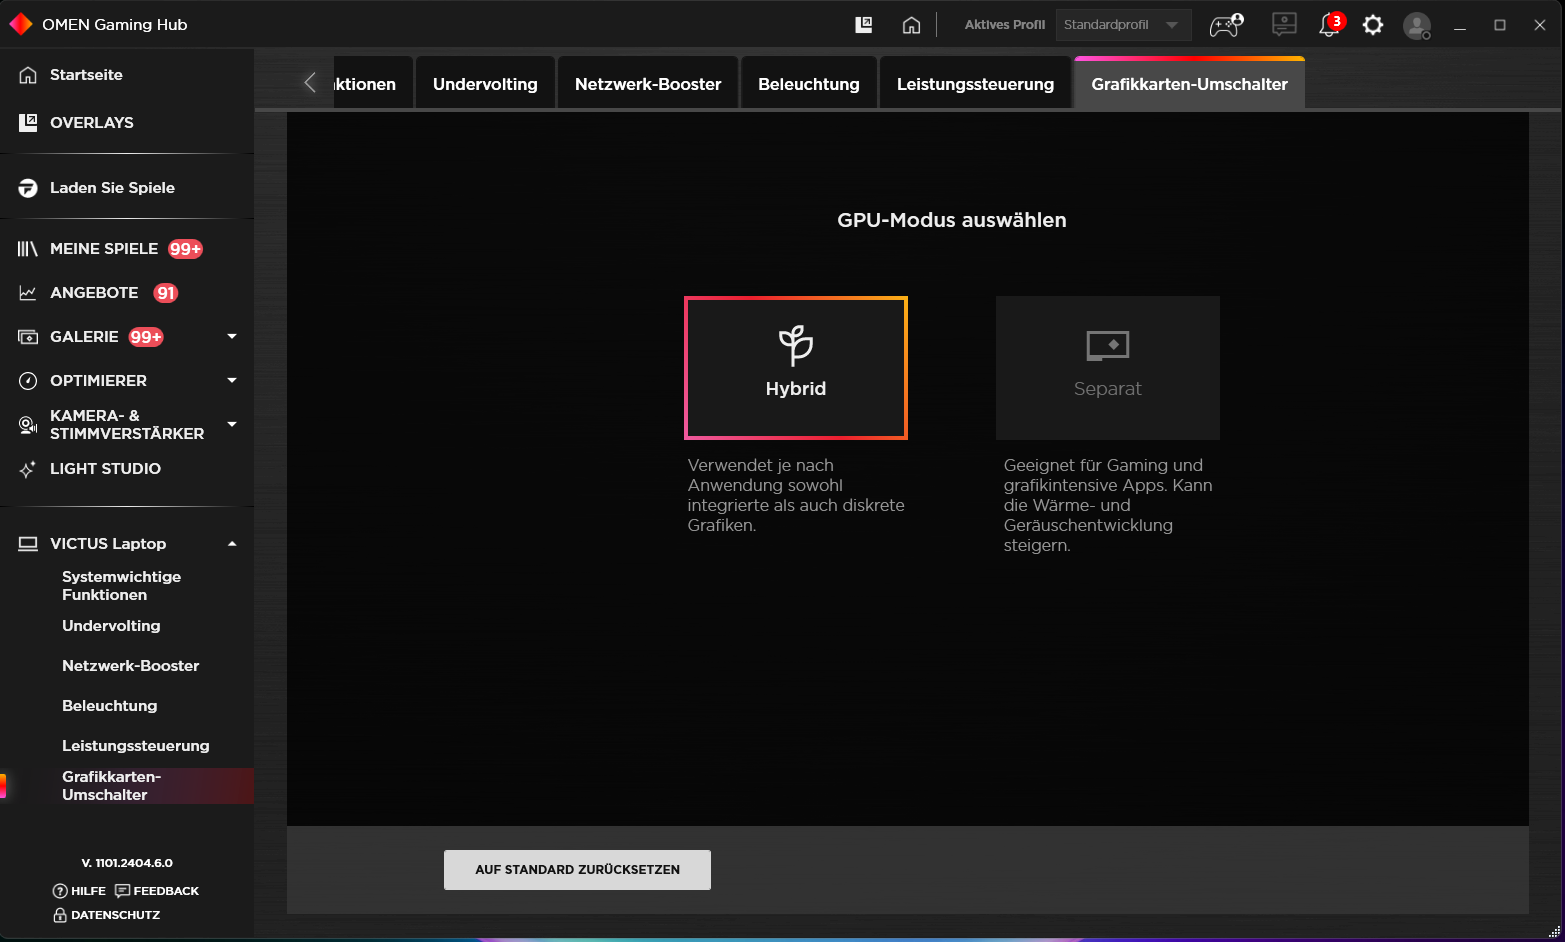
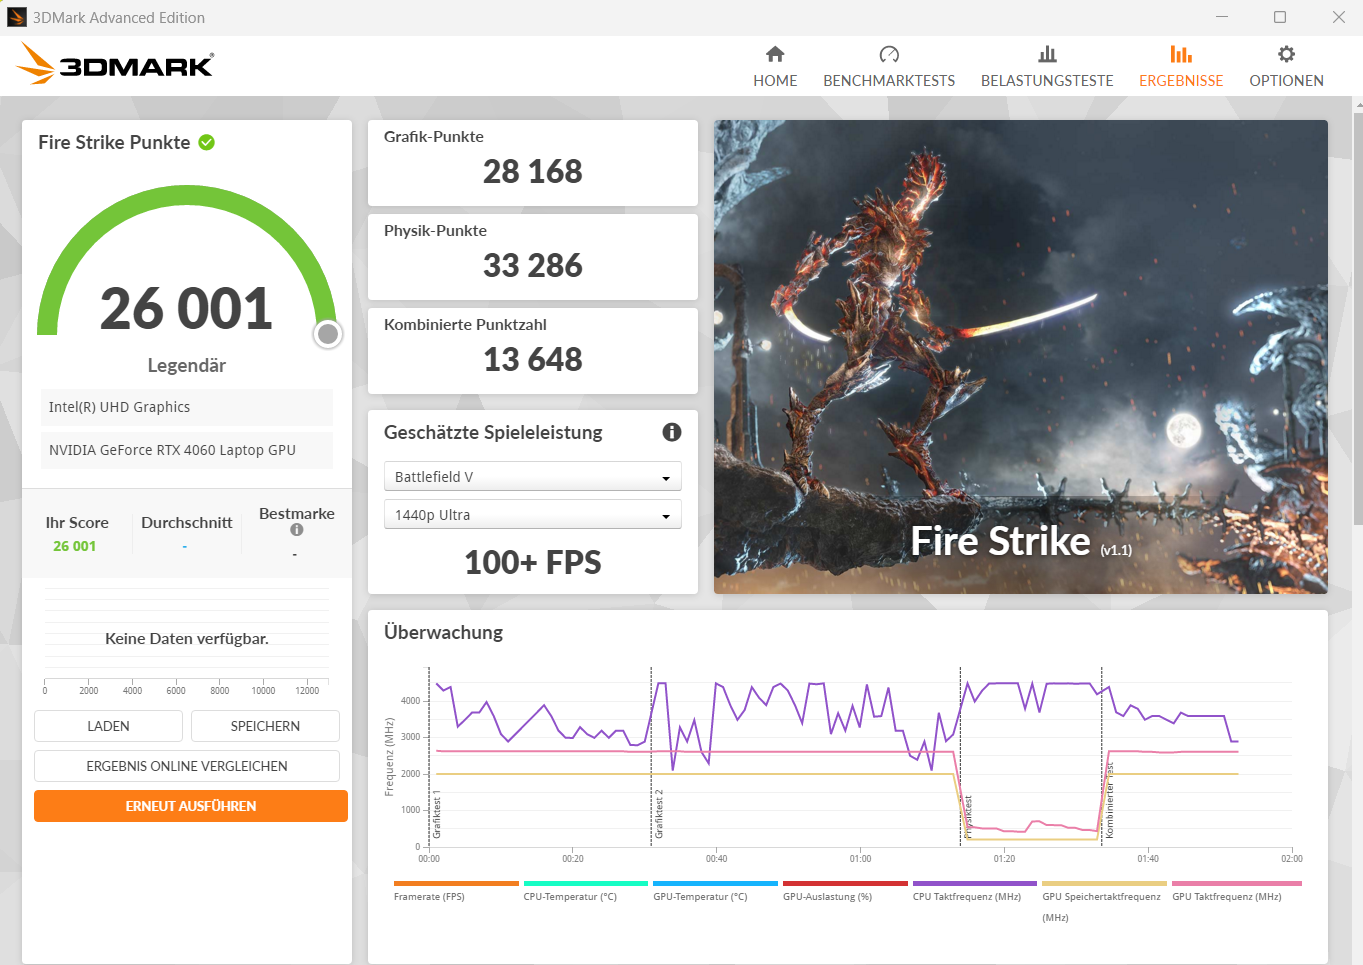
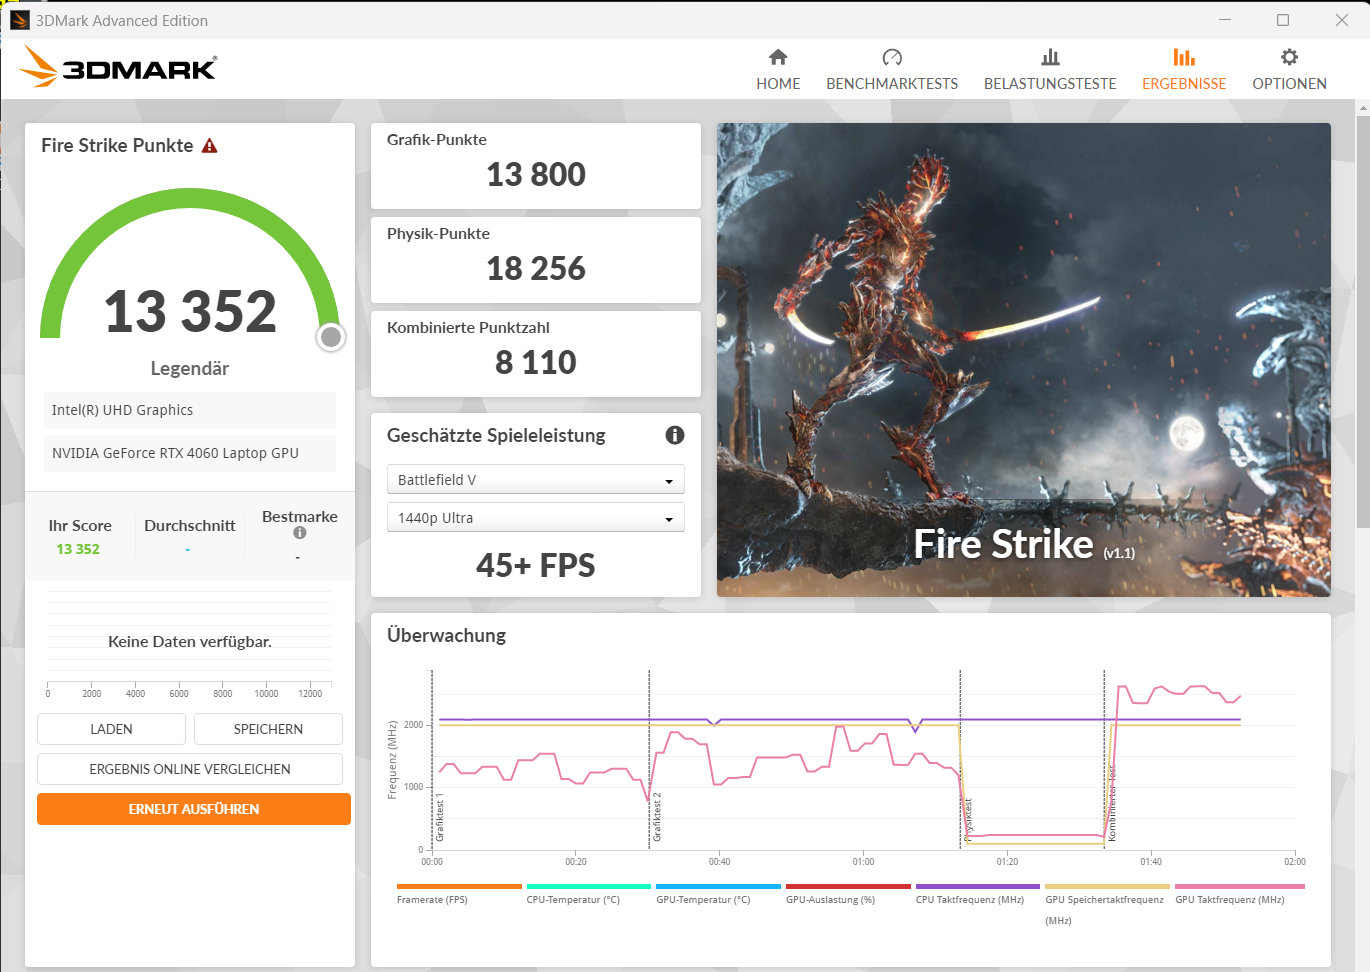
Średniej klasy GeForce RTX 4060 GPU (3 072 jednostek cieniujących, 128-bitowa magistrala, 8 GB GDDR6, 120 W) umożliwia rozgrywkę w rozdzielczości FHD przy ustawieniach od wysokich do maksymalnych. Wartości benchmarków i liczba klatek na sekundę były nieco powyżej średniej RTX 4060 ("Zrównoważony"). Profil "Wydajność" zaowocował niewielką przewagą. Zaawansowany Optimus nie jest obsługiwany. Oznacza to, że zmiana pomiędzy dGPU i Optimus wymaga ponownego uruchomienia.


| 3DMark Performance Rating - Percent | |
| Średnia w klasie Gaming | |
| Lenovo Legion 5 16IRX G9 | |
| HP Victus 16 (2024) | |
| Dell G16, i7-13650HX, RTX 4060 | |
| Gigabyte G6X 9KG (2024) | |
| HP Victus 16 (2024) | |
| Przeciętny NVIDIA GeForce RTX 4060 Laptop GPU | |
| Asus TUF Gaming A16 FA617XS | |
| 3DMark 11 - 1280x720 Performance GPU | |
| Średnia w klasie Gaming (10741 - 72178, n=143, ostatnie 2 lata) | |
| Lenovo Legion 5 16IRX G9 | |
| HP Victus 16 (2024) (Leistung) | |
| Dell G16, i7-13650HX, RTX 4060 | |
| Gigabyte G6X 9KG (2024) | |
| HP Victus 16 (2024) | |
| Przeciętny NVIDIA GeForce RTX 4060 Laptop GPU (28136 - 38912, n=57) | |
| Asus TUF Gaming A16 FA617XS | |
| 3DMark | |
| 1920x1080 Fire Strike Graphics | |
| Średnia w klasie Gaming (2913 - 56116, n=155, ostatnie 2 lata) | |
| HP Victus 16 (2024) (Leistung) | |
| Lenovo Legion 5 16IRX G9 | |
| Gigabyte G6X 9KG (2024) | |
| Dell G16, i7-13650HX, RTX 4060 | |
| HP Victus 16 (2024) | |
| Asus TUF Gaming A16 FA617XS | |
| Przeciętny NVIDIA GeForce RTX 4060 Laptop GPU (20533 - 29656, n=54) | |
| 2560x1440 Time Spy Graphics | |
| Średnia w klasie Gaming (2295 - 24599, n=151, ostatnie 2 lata) | |
| Lenovo Legion 5 16IRX G9 | |
| HP Victus 16 (2024) (Leistung) | |
| Dell G16, i7-13650HX, RTX 4060 | |
| Przeciętny NVIDIA GeForce RTX 4060 Laptop GPU (7484 - 11451, n=56) | |
| HP Victus 16 (2024) | |
| Gigabyte G6X 9KG (2024) | |
| Asus TUF Gaming A16 FA617XS | |
| 3DMark 11 Performance | 30439 pkt. | |
| 3DMark Fire Strike Score | 24569 pkt. | |
| 3DMark Time Spy Score | 10542 pkt. | |
Pomoc | ||
| Blender | |
| v3.3 Classroom OPTIX/RTX | |
| Dell G16, i7-13650HX, RTX 4060 (3.3.3) | |
| Lenovo Legion 5 16IRX G9 (3.3.3) | |
| Przeciętny NVIDIA GeForce RTX 4060 Laptop GPU (19 - 28, n=53) | |
| HP Victus 16 (2024) (3.3.3) | |
| Średnia w klasie Gaming (10 - 95, n=143, ostatnie 2 lata) | |
| HP Victus 16 (2024) (3.3.3, Leistung) | |
| Gigabyte G6X 9KG (2024) (3.3.3) | |
| v3.3 Classroom CUDA | |
| Dell G16, i7-13650HX, RTX 4060 (3.3.3) | |
| Przeciętny NVIDIA GeForce RTX 4060 Laptop GPU (39 - 53, n=53) | |
| Lenovo Legion 5 16IRX G9 (3.3.3) | |
| HP Victus 16 (2024) (3.3.3) | |
| HP Victus 16 (2024) (3.3.3, Leistung) | |
| Gigabyte G6X 9KG (2024) (3.3.3) | |
| Średnia w klasie Gaming (16 - 175, n=145, ostatnie 2 lata) | |
| v3.3 Classroom CPU | |
| Gigabyte G6X 9KG (2024) (3.3.3) | |
| HP Victus 16 (2024) (3.3.3) | |
| Przeciętny NVIDIA GeForce RTX 4060 Laptop GPU (189 - 452, n=53) | |
| Średnia w klasie Gaming (123 - 962, n=150, ostatnie 2 lata) | |
| Asus TUF Gaming A16 FA617XS (3.3.3) | |
| Dell G16, i7-13650HX, RTX 4060 (3.3.3) | |
| Lenovo Legion 5 16IRX G9 (3.3.3) | |
| HP Victus 16 (2024) (3.3.3, Leistung) | |
| Geekbench 5.5 | |
| OpenCL Score | |
| Średnia w klasie Gaming (5039 - 270235, n=150, ostatnie 2 lata) | |
| HP Victus 16 (2024) (Leistung) | |
| Gigabyte G6X 9KG (2024) | |
| Dell G16, i7-13650HX, RTX 4060 | |
| HP Victus 16 (2024) | |
| Przeciętny NVIDIA GeForce RTX 4060 Laptop GPU (5039 - 112238, n=53) | |
| Asus TUF Gaming A16 FA617XS | |
| Lenovo Legion 5 16IRX G9 | |
| Vulkan Score 5.5 | |
| HP Victus 16 (2024) (Leistung) | |
| Średnia w klasie Gaming (9296 - 176078, n=103, ostatnie 2 lata) | |
| Przeciętny NVIDIA GeForce RTX 4060 Laptop GPU (28838 - 87612, n=31) | |
| HP Victus 16 (2024) | |
| Gigabyte G6X 9KG (2024) | |
| Asus TUF Gaming A16 FA617XS | |
| Geekbench 6.4 | |
| GPU OpenCL | |
| Średnia w klasie Gaming (4321 - 234213, n=118, ostatnie 2 lata) | |
| Gigabyte G6X 9KG (2024) (6.2.1) | |
| HP Victus 16 (2024) (6.2.1) | |
| Dell G16, i7-13650HX, RTX 4060 (6.2.1) | |
| Przeciętny NVIDIA GeForce RTX 4060 Laptop GPU (4321 - 100831, n=40) | |
| HP Victus 16 (2024) (6.2.1, Leistung) | |
| Lenovo Legion 5 16IRX G9 (6.2.1) | |
| GPU Vulkan | |
| Gigabyte G6X 9KG (2024) (6.2.1) | |
| HP Victus 16 (2024) (6.2.1, Leistung) | |
| HP Victus 16 (2024) (6.2.1) | |
| Średnia w klasie Gaming (4286 - 231659, n=110, ostatnie 2 lata) | |
| Przeciętny NVIDIA GeForce RTX 4060 Laptop GPU (4286 - 101001, n=36) | |
| Lenovo Legion 5 16IRX G9 (6.2.1) | |
| Dell G16, i7-13650HX, RTX 4060 (6.2.1) | |
| V-Ray 5 Benchmark | |
| GPU RTX | |
| Średnia w klasie Gaming (556 - 4011, n=88, ostatnie 2 lata) | |
| Gigabyte G6X 9KG (2024) (5.0.1) | |
| HP Victus 16 (2024) (5.0.1) | |
| HP Victus 16 (2024) (5.0.1, Leistung) | |
| Dell G16, i7-13650HX, RTX 4060 (5.0.1) | |
| Przeciętny NVIDIA GeForce RTX 4060 Laptop GPU (1387 - 1817, n=28) | |
| GPU CUDA | |
| Średnia w klasie Gaming (300 - 3229, n=90, ostatnie 2 lata) | |
| Gigabyte G6X 9KG (2024) (5.0.1) | |
| HP Victus 16 (2024) (5.0.1) | |
| HP Victus 16 (2024) (5.0.1, Leistung) | |
| Przeciętny NVIDIA GeForce RTX 4060 Laptop GPU (957 - 1294, n=29) | |
| Dell G16, i7-13650HX, RTX 4060 (5.0.1) | |
| Asus TUF Gaming A16 FA617XS (5.0.1) | |
| CPU | |
| HP Victus 16 (2024) (5.0.1) | |
| Średnia w klasie Gaming (3562 - 30302, n=92, ostatnie 2 lata) | |
| HP Victus 16 (2024) (5.0.1) | |
| Przeciętny NVIDIA GeForce RTX 4060 Laptop GPU (8364 - 21065, n=28) | |
| Asus TUF Gaming A16 FA617XS (5.0.1) | |
| Gigabyte G6X 9KG (2024) (5.0.1) | |
| Dell G16, i7-13650HX, RTX 4060 (5.0.1) | |
| V-Ray Benchmark Next 4.10 | |
| GPU | |
| Średnia w klasie Gaming (54 - 1317, n=122, ostatnie 2 lata) | |
| Lenovo Legion 5 16IRX G9 (v4.10.07 ) | |
| Gigabyte G6X 9KG (2024) (v4.10.07 ) | |
| HP Victus 16 (2024) (v4.10.07, Leistung) | |
| Przeciętny NVIDIA GeForce RTX 4060 Laptop GPU (483 - 715, n=46) | |
| HP Victus 16 (2024) (v4.10.07 ) | |
| Asus TUF Gaming A16 FA617XS (v4.10.07 ) | |
| CPU | |
| HP Victus 16 (2024) (v4.10.07, Leistung) | |
| Lenovo Legion 5 16IRX G9 (v4.10.07 ) | |
| HP Victus 16 (2024) (v4.10.07 ) | |
| Średnia w klasie Gaming (5413 - 44129, n=122, ostatnie 2 lata) | |
| Przeciętny NVIDIA GeForce RTX 4060 Laptop GPU (12680 - 32360, n=46) | |
| Gigabyte G6X 9KG (2024) (v4.10.07 ) | |
| Asus TUF Gaming A16 FA617XS (v4.10.07 ) | |
* ... im mniej tym lepiej
| Performance Rating - Percent | |
| Lenovo Legion 5 16IRX G9 | |
| Średnia w klasie Gaming | |
| HP Victus 16 (2024) | |
| Dell G16, i7-13650HX, RTX 4060 | |
| Gigabyte G6X 9KG (2024) | |
| HP Victus 16 (2024) | |
| Przeciętny NVIDIA GeForce RTX 4060 Laptop GPU | |
| Asus TUF Gaming A16 FA617XS | |
| The Witcher 3 - 1920x1080 Ultra Graphics & Postprocessing (HBAO+) | |
| Średnia w klasie Gaming (18.4 - 214, n=119, ostatnie 2 lata) | |
| Dell G16, i7-13650HX, RTX 4060 | |
| HP Victus 16 (2024) | |
| Przeciętny NVIDIA GeForce RTX 4060 Laptop GPU (77 - 159.7, n=42) | |
| Gigabyte G6X 9KG (2024) | |
| HP Victus 16 (2024) | |
| Asus TUF Gaming A16 FA617XS | |
| Lenovo Legion 5 16IRX G9 | |
| GTA V - 1920x1080 Highest Settings possible AA:4xMSAA + FX AF:16x | |
| Lenovo Legion 5 16IRX G9 | |
| Dell G16, i7-13650HX, RTX 4060 | |
| HP Victus 16 (2024) | |
| Gigabyte G6X 9KG (2024) | |
| Średnia w klasie Gaming (12.1 - 168.2, n=132, ostatnie 2 lata) | |
| HP Victus 16 (2024) | |
| Przeciętny NVIDIA GeForce RTX 4060 Laptop GPU (76.9 - 126.3, n=48) | |
| Asus TUF Gaming A16 FA617XS | |
| Final Fantasy XV Benchmark - 1920x1080 High Quality | |
| Średnia w klasie Gaming (19.2 - 201, n=144, ostatnie 2 lata) | |
| Lenovo Legion 5 16IRX G9 | |
| HP Victus 16 (2024) | |
| Dell G16, i7-13650HX, RTX 4060 | |
| Gigabyte G6X 9KG (2024) | |
| HP Victus 16 (2024) | |
| Przeciętny NVIDIA GeForce RTX 4060 Laptop GPU (75.1 - 109.8, n=51) | |
| Asus TUF Gaming A16 FA617XS | |
| Strange Brigade - 1920x1080 ultra AA:ultra AF:16 | |
| Średnia w klasie Gaming (38.9 - 420, n=140, ostatnie 2 lata) | |
| Lenovo Legion 5 16IRX G9 | |
| Dell G16, i7-13650HX, RTX 4060 | |
| HP Victus 16 (2024) | |
| Gigabyte G6X 9KG (2024) | |
| Przeciętny NVIDIA GeForce RTX 4060 Laptop GPU (135.3 - 210, n=50) | |
| HP Victus 16 (2024) | |
| Asus TUF Gaming A16 FA617XS | |
| Dota 2 Reborn - 1920x1080 ultra (3/3) best looking | |
| Lenovo Legion 5 16IRX G9 | |
| HP Victus 16 (2024) | |
| HP Victus 16 (2024) | |
| Dell G16, i7-13650HX, RTX 4060 | |
| Średnia w klasie Gaming (65.1 - 220, n=148, ostatnie 2 lata) | |
| Przeciętny NVIDIA GeForce RTX 4060 Laptop GPU (115 - 183.8, n=53) | |
| Gigabyte G6X 9KG (2024) | |
| Asus TUF Gaming A16 FA617XS | |
| X-Plane 11.11 - 1920x1080 high (fps_test=3) | |
| Lenovo Legion 5 16IRX G9 | |
| HP Victus 16 (2024) | |
| Dell G16, i7-13650HX, RTX 4060 | |
| Gigabyte G6X 9KG (2024) | |
| Średnia w klasie Gaming (32.8 - 166.2, n=151, ostatnie 2 lata) | |
| Przeciętny NVIDIA GeForce RTX 4060 Laptop GPU (60.7 - 141.1, n=54) | |
| HP Victus 16 (2024) | |
| Asus TUF Gaming A16 FA617XS | |
| Cyberpunk 2077 2.2 Phantom Liberty | |
| 1920x1080 Ultra Preset (FSR off) | |
| Średnia w klasie Gaming (6.76 - 158, n=90, ostatnie 2 lata) | |
| Lenovo Legion 5 16IRX G9 (2.02) | |
| HP Victus 16 (2024) (2.02, Leistung) | |
| Przeciętny NVIDIA GeForce RTX 4060 Laptop GPU (56.4 - 93.1, n=31) | |
| Dell G16, i7-13650HX, RTX 4060 (2.11) | |
| Gigabyte G6X 9KG (2024) (2.02) | |
| HP Victus 16 (2024) (2.02) | |
| 2560x1440 Ultra Preset (FSR off) | |
| Średnia w klasie Gaming (24.8 - 106.8, n=70, ostatnie 2 lata) | |
| Lenovo Legion 5 16IRX G9 (2.02) | |
| Dell G16, i7-13650HX, RTX 4060 (2.11) | |
| Przeciętny NVIDIA GeForce RTX 4060 Laptop GPU (32.9 - 51.8, n=19) | |
| 1920x1080 Ray Tracing Ultra Preset (DLSS off) | |
| Średnia w klasie Gaming (11.9 - 77.7, n=57, ostatnie 2 lata) | |
| HP Victus 16 (2024) (2.02, Leistung) | |
| Przeciętny NVIDIA GeForce RTX 4060 Laptop GPU (23.6 - 37.4, n=21) | |
| Gigabyte G6X 9KG (2024) (2.02) | |
| HP Victus 16 (2024) (2.02) | |
| Dragon's Dogma 2 - 1920x1080 High Preset | |
| Średnia w klasie Gaming (49.5 - 80, n=8, ostatnie 2 lata) | |
| HP Victus 16 (2024) | |
| Przeciętny NVIDIA GeForce RTX 4060 Laptop GPU (57.2 - 67.7, n=5) | |
| Razer Blade 14 Mid 23 | |
| Palworld - 1920x1080 Epic Preset AA:TSR | |
| Razer Blade 14 Mid 23 | |
| Przeciętny NVIDIA GeForce RTX 4060 Laptop GPU (83.9 - 87.8, n=2) | |
| HP Victus 16 (2024) | |
| Średnia w klasie Gaming (20.9 - 150.9, n=8, ostatnie 2 lata) | |
| The Finals | |
| 1920x1080 Epic Preset | |
| Razer Blade 14 Mid 23 | |
| Przeciętny NVIDIA GeForce RTX 4060 Laptop GPU (122.3 - 126, n=2) | |
| HP Victus 16 (2024) | |
| Średnia w klasie Gaming (24.8 - 211, n=12, ostatnie 2 lata) | |
| 1920x1080 Epic Preset + Epic RTX Global Illumination | |
| Średnia w klasie Gaming (51.1 - 190.8, n=7, ostatnie 2 lata) | |
| Razer Blade 14 Mid 23 | |
| Przeciętny NVIDIA GeForce RTX 4060 Laptop GPU (116.8 - 121.1, n=2) | |
| HP Victus 16 (2024) | |
| EA Sports WRC - 1920x1080 Ultra Preset AA:Epic AF:16x | |
| HP Victus 16 (2024) | |
| Przeciętny NVIDIA GeForce RTX 4060 Laptop GPU (78.4 - 79.6, n=2) | |
| Razer Blade 14 Mid 23 | |
| Średnia w klasie Gaming (15.4 - 115.1, n=7, ostatnie 2 lata) | |
| Enshrouded - 1920x1080 Max. Quality AA:FX | |
| HP Victus 16 (2024) | |
| Średnia w klasie Gaming (9.48 - 101.5, n=12, ostatnie 2 lata) | |
| Przeciętny NVIDIA GeForce RTX 4060 Laptop GPU (43 - 51.1, n=2) | |
| Razer Blade 14 Mid 23 | |
Witcher 3 FPS diagram
| low | med. | high | ultra | |
|---|---|---|---|---|
| GTA V (2015) | 185.8 | 181.2 | 176.1 | 110.2 |
| The Witcher 3 (2015) | 448.6 | 297.7 | 181.9 | 99.9 |
| Dota 2 Reborn (2015) | 198.1 | 177.8 | 168.4 | 149.7 |
| Final Fantasy XV Benchmark (2018) | 208 | 135.3 | 98.1 | |
| X-Plane 11.11 (2018) | 154.4 | 129.2 | 100.3 | |
| Strange Brigade (2018) | 406 | 253 | 205 | 179 |
| Cyberpunk 2077 2.2 Phantom Liberty (2023) | 113.6 | 90 | 76.9 | 67.1 |
| EA Sports WRC (2023) | 129.3 | 93.7 | 85.2 | 79.6 |
| The Finals (2023) | 196.7 | 161.7 | 155.9 | 122.3 |
| Palworld (2024) | 139.2 | 116.3 | 91.8 | 83.9 |
| Enshrouded (2024) | 85.5 | 71.2 | 59.7 | 51.1 |
| Dragon's Dogma 2 (2024) | 67.1 | 63.3 |
Emisja i moc - laptop do gier o imponującym czasie pracy
Emisja hałasu
Wentylatory są zwykle utrzymywane na możliwie najniższym poziomie i obracają się szybciej tylko wtedy, gdy nie ma innej opcji. Mimo to emisja hałasu przez urządzenie wzrasta do 48 dB(A) przy pełnym obciążeniu ("Balanced"). "Wydajność" skutkuje jeszcze wyższymi wartościami. Znacznie cichsze użytkowanie można osiągnąć w trybie "Eco".
W trybie bezczynności lub przy niskim obciążeniu możliwe jest, że wentylatory pozostaną całkowicie nieruchome. W tym celu należy jednak wyłączyć opcję biosu HP "wentylator zawsze włączony" (która jest domyślnie aktywna). W przeciwnym razie zapewnia ona, że wentylatory są zawsze uruchomione.
Hałas
| luz |
| 28 / 29 / 33 dB |
| obciążenie |
| 45 / 48 dB |
 | ||
30 dB cichy 40 dB(A) słyszalny 50 dB(A) irytujący |
||
min: | ||
| HP Victus 16 (2024) NVIDIA GeForce RTX 4060 Laptop GPU, i7-14700HX, Kioxia XG8 KXG80ZNV512G | Gigabyte G6X 9KG (2024) NVIDIA GeForce RTX 4060 Laptop GPU, i7-13650HX, Gigabyte AG450E1024-SI | Dell G16, i7-13650HX, RTX 4060 NVIDIA GeForce RTX 4060 Laptop GPU, i7-13650HX, WD PC SN740 SDDPNQD-1T00 | Lenovo Legion 5 16IRX G9 NVIDIA GeForce RTX 4060 Laptop GPU, i7-14650HX, Samsung PM9A1 MZVL21T0HCLR | Asus TUF Gaming A16 FA617XS Radeon RX 7600S, R9 7940HS, Micron 2400 MTFDKBA512QFM | |
|---|---|---|---|---|---|
| Noise | -10% | 13% | -3% | 2% | |
| wyłączone / środowisko * | 25 | 26 -4% | 23 8% | 24 4% | 25 -0% |
| Idle Minimum * | 28 | 30 -7% | 23 18% | 24 14% | 25 11% |
| Idle Average * | 29 | 32 -10% | 23 21% | 28.8 1% | 26 10% |
| Idle Maximum * | 33 | 35 -6% | 27.96 15% | 32 3% | 28 15% |
| Load Average * | 45 | 51 -13% | 27.96 38% | 45.5 -1% | 43 4% |
| Witcher 3 ultra * | 43 | 51 -19% | 47.89 -11% | 53.1 -23% | 51 -19% |
| Load Maximum * | 48 | 54 -13% | 47.89 -0% | 55.7 -16% | 53 -10% |
* ... im mniej tym lepiej
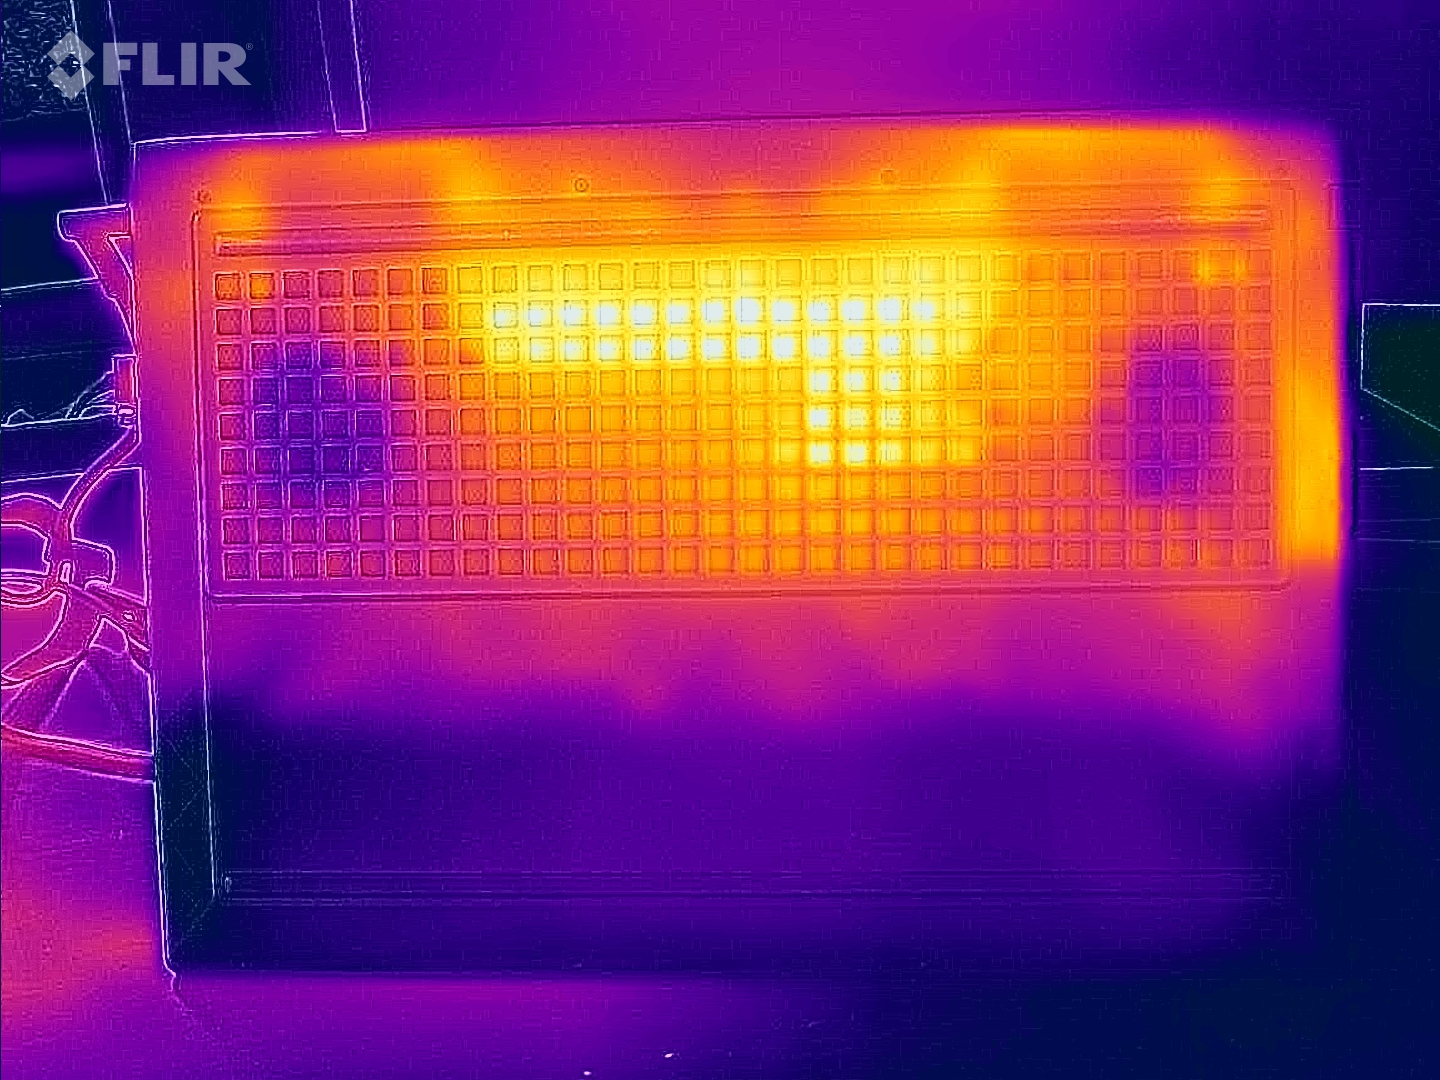
Temperatura
Test warunków skrajnych i Witcher 3 powodują znaczne nagrzewanie się laptopa. Temperatury rzędu 50 °C były osiągane w niektórych momentach podczas testów. W codziennym użytkowaniu (biuro, Internet), wartości generalnie pozostają w zielonym zakresie.
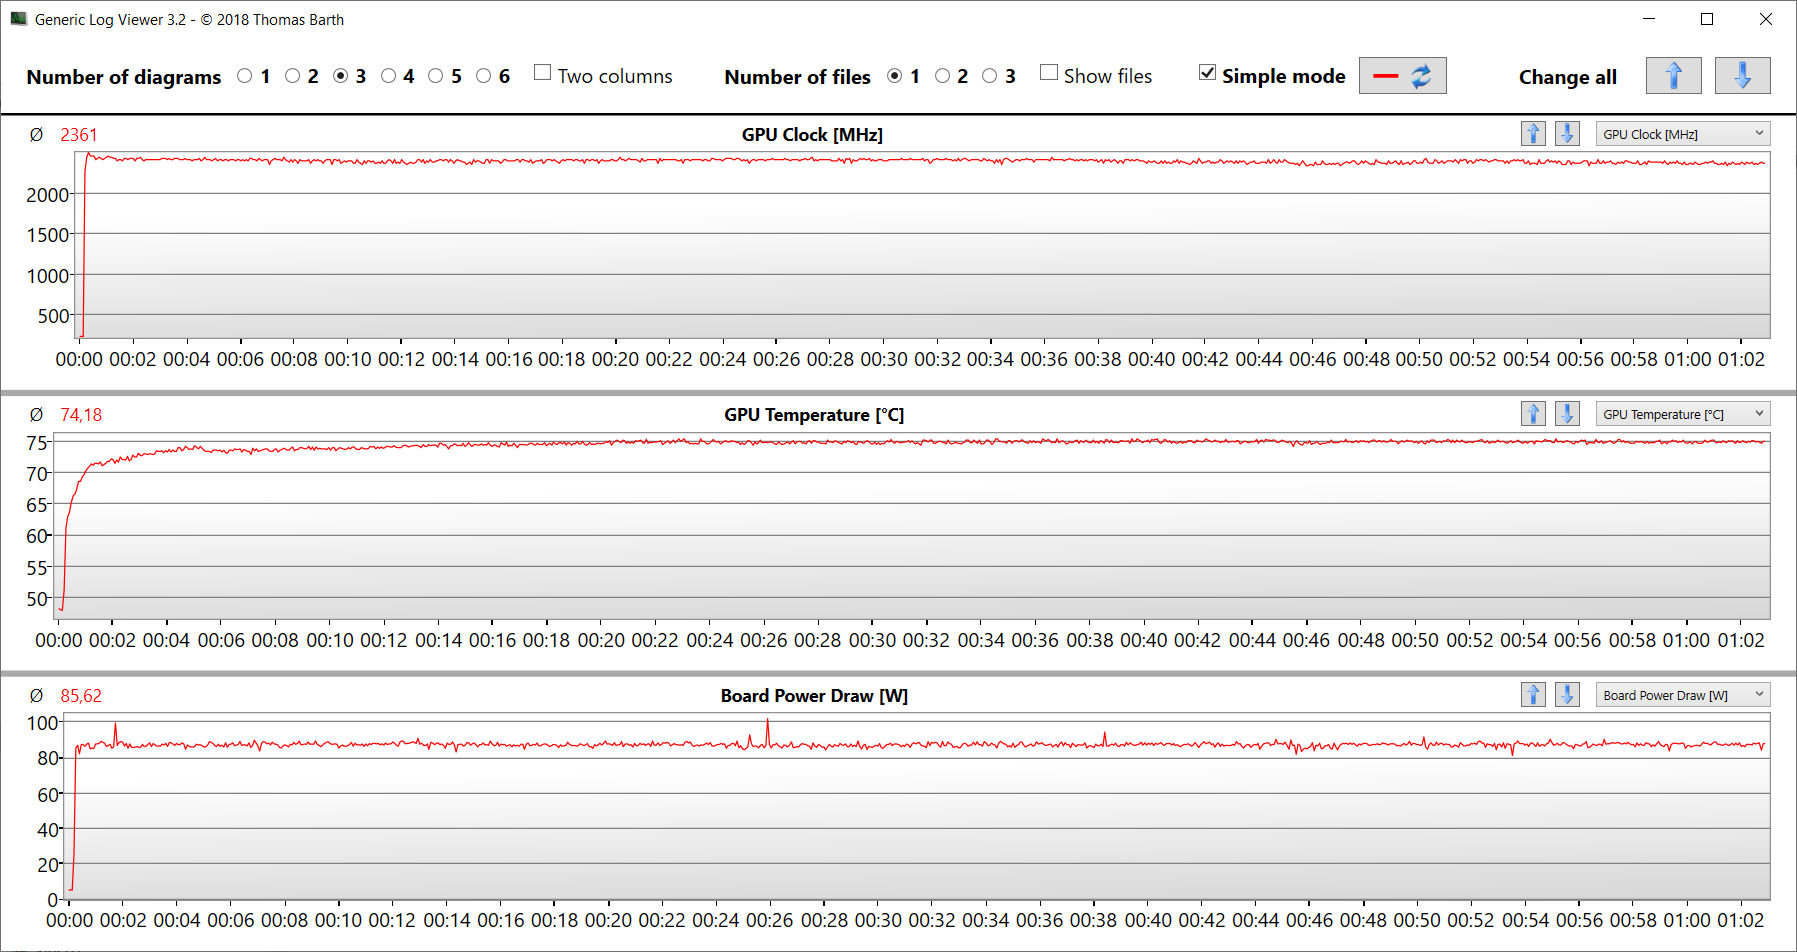
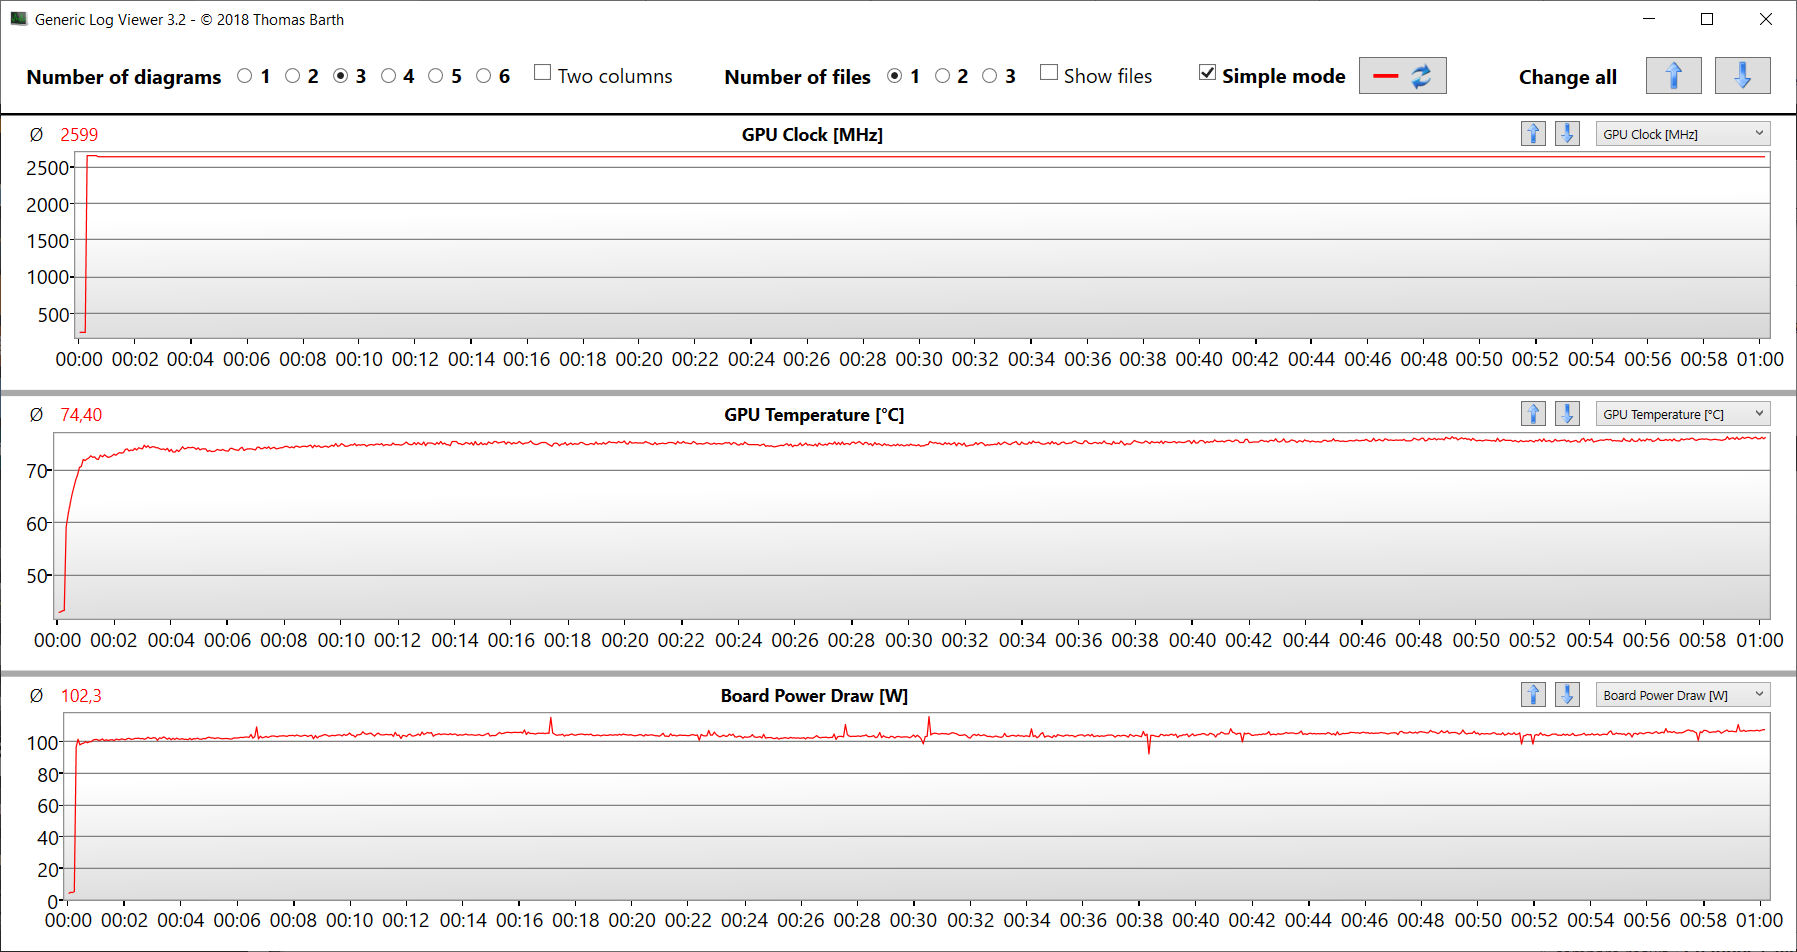
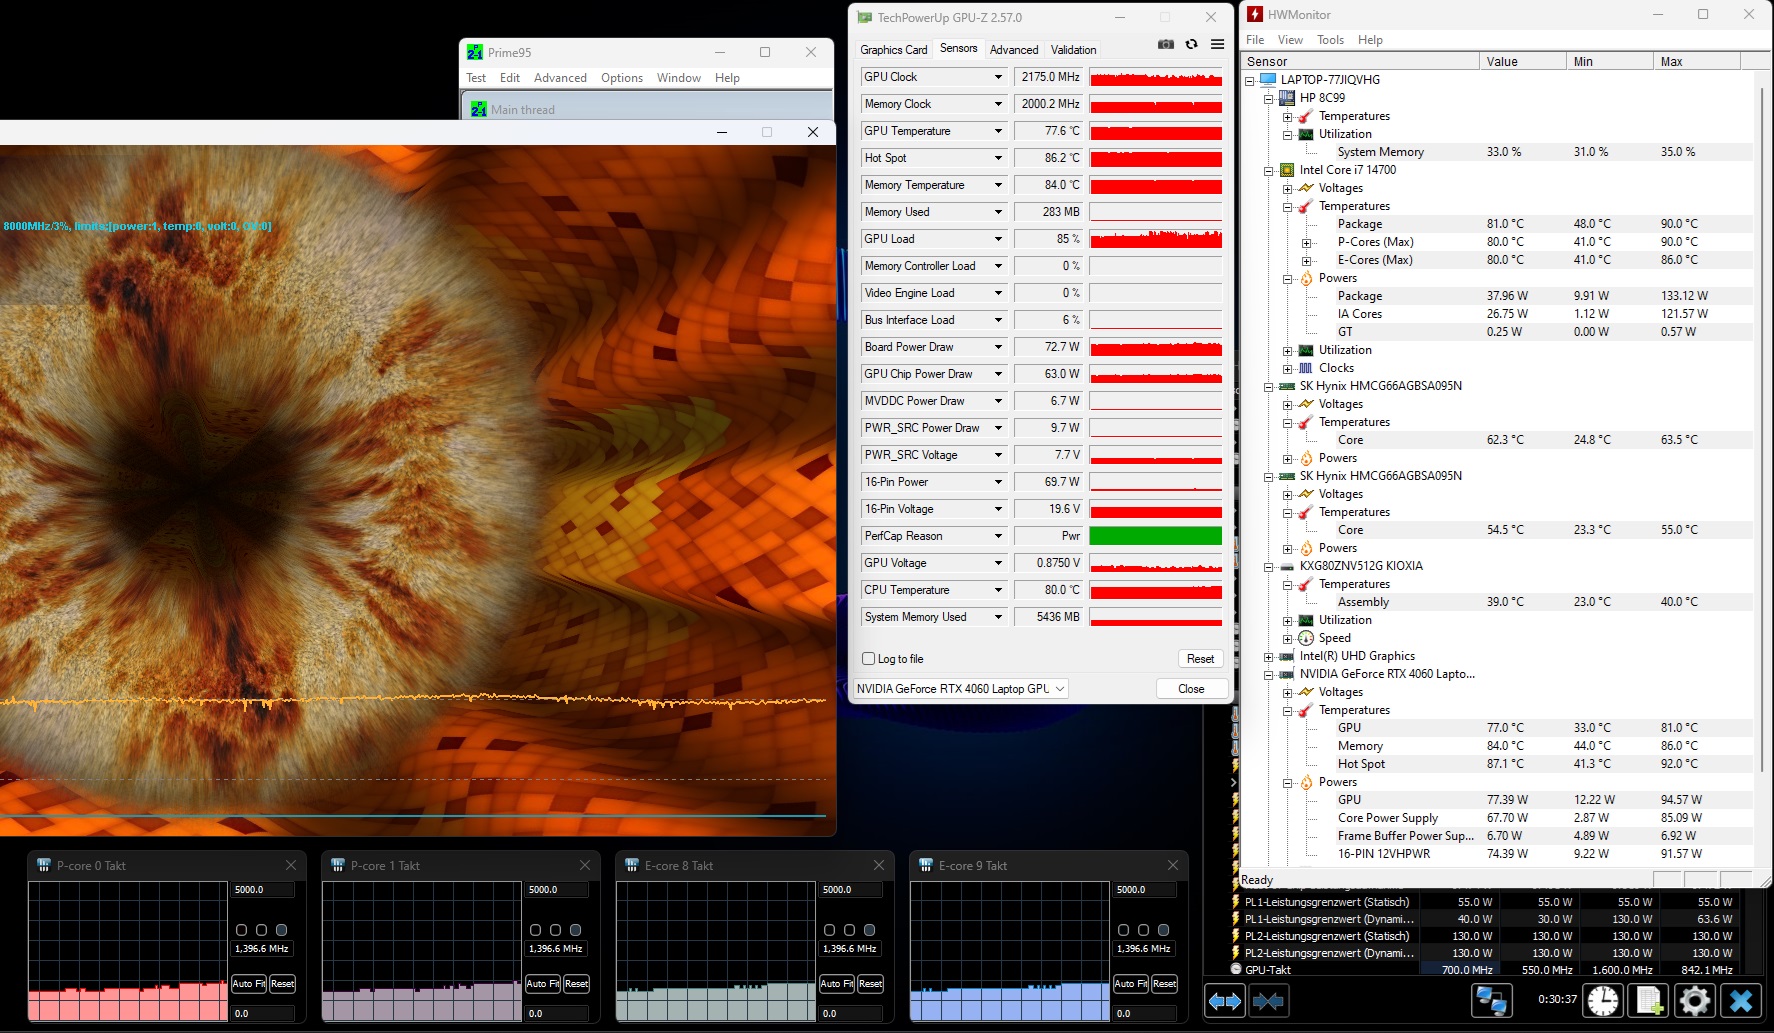
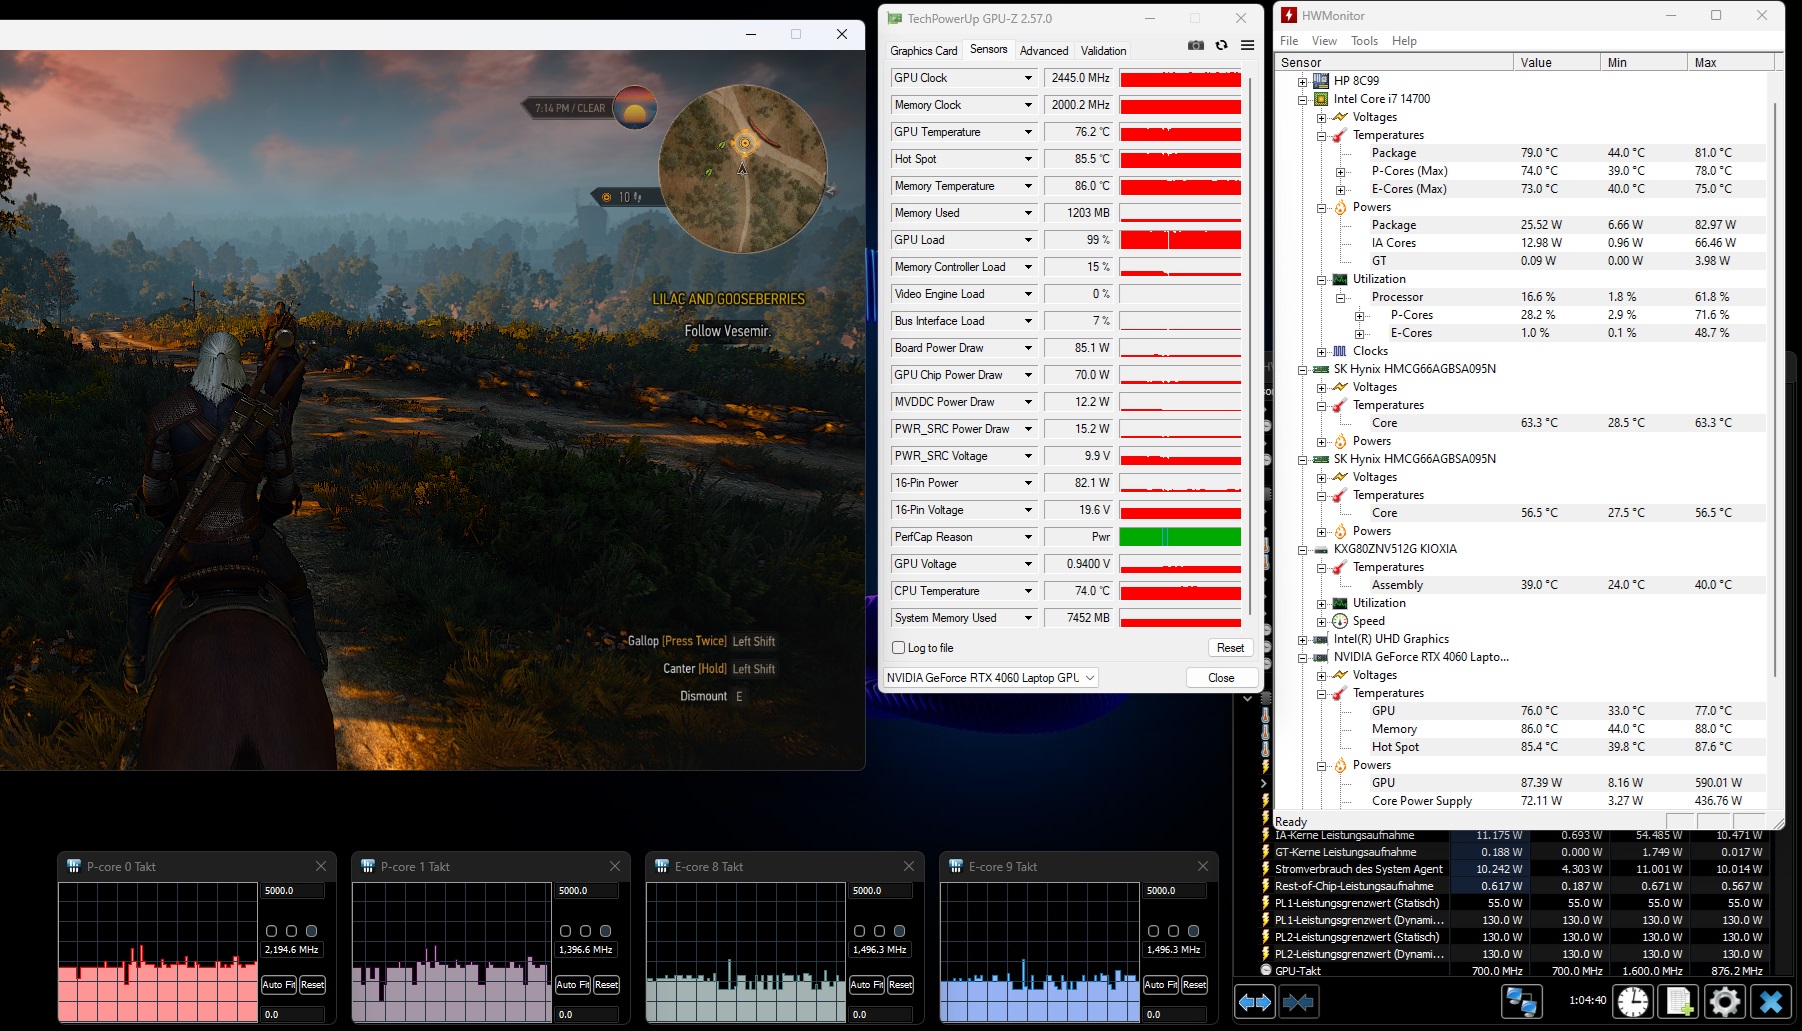
Ekstremalny scenariusz testu obciążeniowego (Prime95 i Furmark w trybie ciągłym) sprawdza stabilność systemu pod pełnym obciążeniem. Zegar procesora wahał się na początku, ale później ustabilizował się na niskim poziomie. Karta graficzna pracowała z niemal pełną mocą.
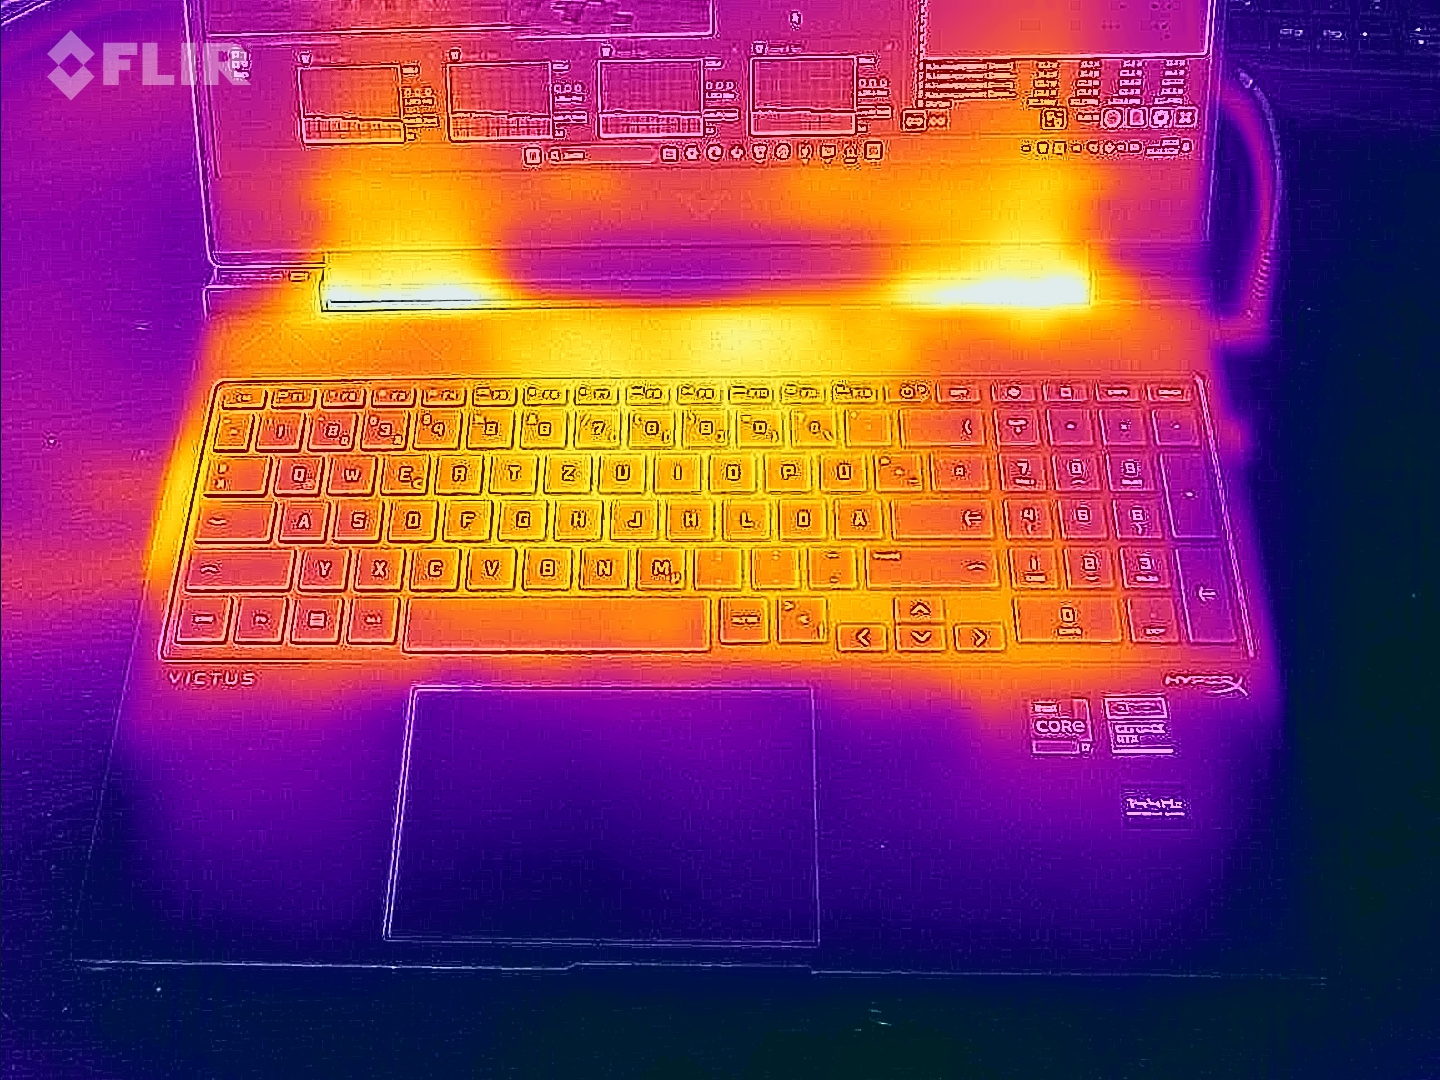
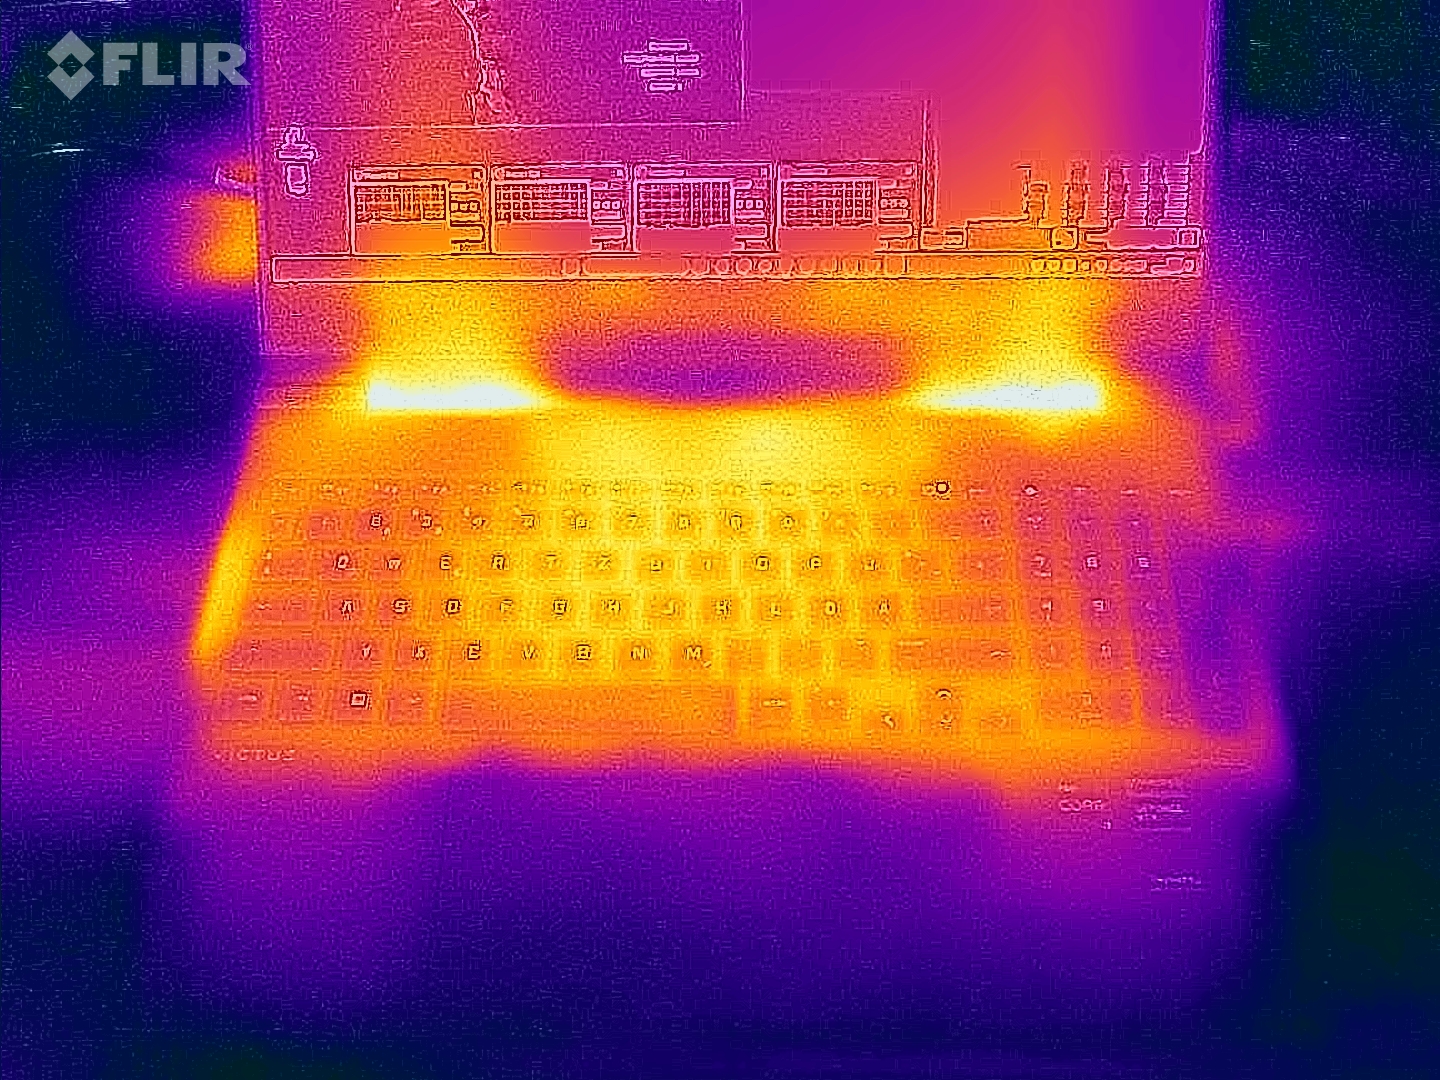
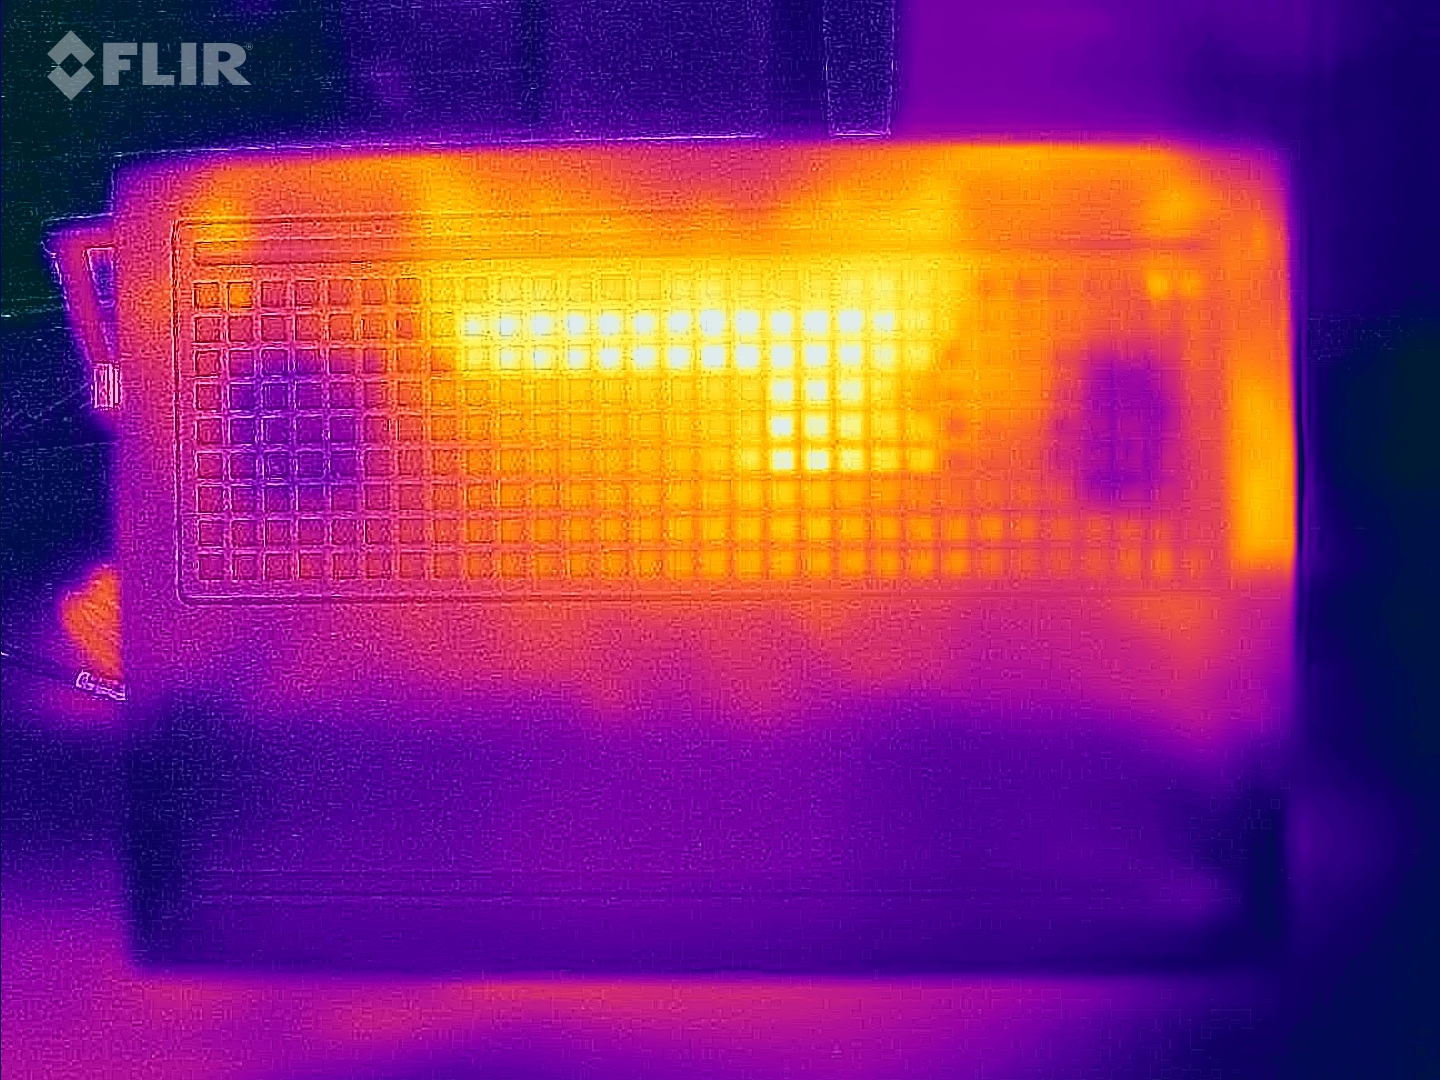
(-) Maksymalna temperatura w górnej części wynosi 50 °C / 122 F, w porównaniu do średniej 40.4 °C / 105 F , począwszy od 21.2 do 68.8 °C dla klasy Gaming.
(-) Dno nagrzewa się maksymalnie do 50 °C / 122 F, w porównaniu do średniej 43.2 °C / 110 F
(+) W stanie bezczynności średnia temperatura górnej części wynosi 24.7 °C / 76 F, w porównaniu ze średnią temperaturą urządzenia wynoszącą 33.9 °C / ### class_avg_f### F.
(-) Podczas gry w Wiedźmina 3 średnia temperatura górnej części wynosi 38.3 °C / 101 F, w porównaniu do średniej temperatury urządzenia wynoszącej 33.9 °C / ## #class_avg_f### F.
(+) Podpórki pod nadgarstki i touchpad są chłodniejsze niż temperatura skóry i maksymalnie 31 °C / 87.8 F i dlatego są chłodne w dotyku.
(-) Średnia temperatura obszaru podparcia dłoni w podobnych urządzeniach wynosiła 28.9 °C / 84 F (-2.1 °C / -3.8 F).
| HP Victus 16 (2024) Intel Core i7-14700HX, NVIDIA GeForce RTX 4060 Laptop GPU | Gigabyte G6X 9KG (2024) Intel Core i7-13650HX, NVIDIA GeForce RTX 4060 Laptop GPU | Dell G16, i7-13650HX, RTX 4060 Intel Core i7-13650HX, NVIDIA GeForce RTX 4060 Laptop GPU | Lenovo Legion 5 16IRX G9 Intel Core i7-14650HX, NVIDIA GeForce RTX 4060 Laptop GPU | Asus TUF Gaming A16 FA617XS AMD Ryzen 9 7940HS, AMD Radeon RX 7600S | |
|---|---|---|---|---|---|
| Heat | -10% | -22% | -7% | -9% | |
| Maximum Upper Side * | 50 | 41 18% | 49 2% | 40.4 19% | 53 -6% |
| Maximum Bottom * | 50 | 43 14% | 58 -16% | 43.8 12% | 48 4% |
| Idle Upper Side * | 25 | 32 -28% | 35 -40% | 30.3 -21% | 30 -20% |
| Idle Bottom * | 26 | 37 -42% | 35 -35% | 35.3 -36% | 30 -15% |
* ... im mniej tym lepiej
Głośniki
Głośniki stereo laptopa generują ogólnie przyzwoity dźwięk, choć przydałoby się więcej basów.
HP Victus 16 (2024) analiza dźwięku
(+) | głośniki mogą odtwarzać stosunkowo głośno (82 dB)
Bas 100 - 315 Hz
(-) | prawie brak basu - średnio 20.3% niższa od mediany
(±) | liniowość basu jest średnia (13.3% delta do poprzedniej częstotliwości)
Średnie 400 - 2000 Hz
(+) | zbalansowane środki średnie - tylko 1.6% od mediany
(+) | średnie są liniowe (3.3% delta do poprzedniej częstotliwości)
Wysokie 2–16 kHz
(+) | zrównoważone maksima - tylko 3.1% od mediany
(+) | wzloty są liniowe (4.7% delta do poprzedniej częstotliwości)
Ogólnie 100 - 16.000 Hz
(+) | ogólny dźwięk jest liniowy (14% różnicy w stosunku do mediany)
W porównaniu do tej samej klasy
» 21% wszystkich testowanych urządzeń w tej klasie było lepszych, 7% podobnych, 72% gorszych
» Najlepszy miał deltę 6%, średnia wynosiła ###średnia###%, najgorsza wynosiła 132%
W porównaniu do wszystkich testowanych urządzeń
» 14% wszystkich testowanych urządzeń było lepszych, 4% podobnych, 82% gorszych
» Najlepszy miał deltę 4%, średnia wynosiła ###średnia###%, najgorsza wynosiła 134%
Gigabyte G6X 9KG (2024) analiza dźwięku
(+) | głośniki mogą odtwarzać stosunkowo głośno (82 dB)
Bas 100 - 315 Hz
(-) | prawie brak basu - średnio 24.9% niższa od mediany
(±) | liniowość basu jest średnia (13.7% delta do poprzedniej częstotliwości)
Średnie 400 - 2000 Hz
(+) | zbalansowane środki średnie - tylko 4.1% od mediany
(+) | średnie są liniowe (5.4% delta do poprzedniej częstotliwości)
Wysokie 2–16 kHz
(+) | zrównoważone maksima - tylko 2.2% od mediany
(±) | liniowość wysokich wartości jest średnia (7.4% delta do poprzedniej częstotliwości)
Ogólnie 100 - 16.000 Hz
(±) | liniowość ogólnego dźwięku jest średnia (17.2% różnicy w stosunku do mediany)
W porównaniu do tej samej klasy
» 45% wszystkich testowanych urządzeń w tej klasie było lepszych, 11% podobnych, 44% gorszych
» Najlepszy miał deltę 6%, średnia wynosiła ###średnia###%, najgorsza wynosiła 132%
W porównaniu do wszystkich testowanych urządzeń
» 29% wszystkich testowanych urządzeń było lepszych, 8% podobnych, 63% gorszych
» Najlepszy miał deltę 4%, średnia wynosiła ###średnia###%, najgorsza wynosiła 134%
Zużycie energii
Zużycie energii jest całkiem normalne dla zainstalowanego sprzętu. Podczas gdy test Witcher 3 test został przeprowadzony przy stałym poborze mocy, zapotrzebowanie laptopa wahało się na początku testu warunków skrajnych. Zasilacz (230 W) jest wystarczającej wielkości.
| wyłączony / stan wstrzymania | |
| luz | |
| obciążenie |
|
Legenda:
min: | |
Power consumption Witcher 3 / stress test
Power consumption with external monitor
Czas trwania
16,1-calowe urządzenie osiągnęło czas pracy 8:31 godzin podczas naszego praktycznego testu WLAN (ilustrującego obciążenie podczas uzyskiwania dostępu do stron internetowych za pomocą skryptu) - to bardzo dobra wartość. W polu porównawczym tylko Asus TUF Gaming A16 wypadł lepiej.
Za
Przeciw
Werdykt - solidny laptop do gier średniej klasy
Victus umożliwia granie w rozdzielczości FHD przy ustawieniach od wysokich do maksymalnych. Wymaganą moc zapewnia procesor Core i7-14700HX i karta graficzna GeForce RTX 4060. Szkoda: Wydajność jednordzeniowa procesora jest nieco poniżej tego, co mogłoby być możliwe. Standardowo dla tej klasy, jego emisję można obniżyć do umiarkowanych wartości, rezygnując z części wydajności. Pozytywne: Poniżej pełnego obciążenia emisja hałasu laptopa jest akceptowalna.
Chciwość pamięci masowej w HP: Laptop do gier za 1600 USD musi oferować więcej pamięci masowej.
HP nie wskoczyło na modę 16:10 - zamiast tego pozostało wierne proporcjom 16:9: Zainstalowany 16,1-calowy panel (FHD, 144 Hz) jest w porządku - jednak biorąc pod uwagę cenę urządzenia wynoszącą około 1600 USD, powinien on naprawdę oferować lepsze pokrycie przestrzeni kolorów. 512 GB pamięci masowej to niewiele jak na laptop do gier. Również w tym aspekcie można by oczekiwać więcej za tę cenę.
HP nie wyposażyło tego laptopa w nowoczesne złącza, takie jak Thunderbolt 4/USB 4, ale mimo to nie zapomniało o przydatnych funkcjach, takich jak Power Delivery - baterię można ładować za pomocą zasilacza USB-C (100 W). Pozytywne: W pełni naładowana bateria wystarcza na czas pracy WiFi wynoszący około 8,5 godziny - wartość, o której wiele innych laptopów do gier może tylko pomarzyć.
Realną alternatywą może być Gigabyte G6X 9KG (2024). Ten laptop oferuje porównywalną moc obliczeniową i podobnie dobre czasy pracy, ale zamiast panelu 16:9 ma panel 16:10.
Cena i dostępność
HP Victus 16 (2024) można obecnie kupić na Amazon za około 1 333 USD. Jest to wariant z procesorem Core i7-13700HX, kartą graficzną NVIDIA GeForce RTX 4060, 64 GB pamięci RAM DDR5 i dyskiem SSD o pojemności 2 TB.
Mogą Państwo również skonfigurować niestandardowy wariant za pośrednictwem strony internetowej HP.
HP Victus 16 (2024)
- 14/05/2024 v7 (old)
Sascha Mölck
Przezroczystość
Wyboru urządzeń do recenzji dokonuje nasza redakcja. Próbka testowa została udostępniona autorowi jako pożyczka od producenta lub sprzedawcy detalicznego na potrzeby tej recenzji. Pożyczkodawca nie miał wpływu na tę recenzję, producent nie otrzymał też kopii tej recenzji przed publikacją. Nie było obowiązku publikowania tej recenzji. Nigdy nie przyjmujemy rekompensaty ani płatności w zamian za nasze recenzje. Jako niezależna firma medialna, Notebookcheck nie podlega władzy producentów, sprzedawców detalicznych ani wydawców.
Tak testuje Notebookcheck
Każdego roku Notebookcheck niezależnie sprawdza setki laptopów i smartfonów, stosując standardowe procedury, aby zapewnić porównywalność wszystkich wyników. Od około 20 lat stale rozwijamy nasze metody badawcze, ustanawiając przy tym standardy branżowe. W naszych laboratoriach testowych doświadczeni technicy i redaktorzy korzystają z wysokiej jakości sprzętu pomiarowego. Testy te obejmują wieloetapowy proces walidacji. Nasz kompleksowy system ocen opiera się na setkach uzasadnionych pomiarów i benchmarków, co pozwala zachować obiektywizm.Price comparison

