

Recenzja laptopa MSI Sword 16 HX: Gamingowa potęga stłumiona przez mało imponujący ekran
Potrzebuje więcej czasu na osełce.
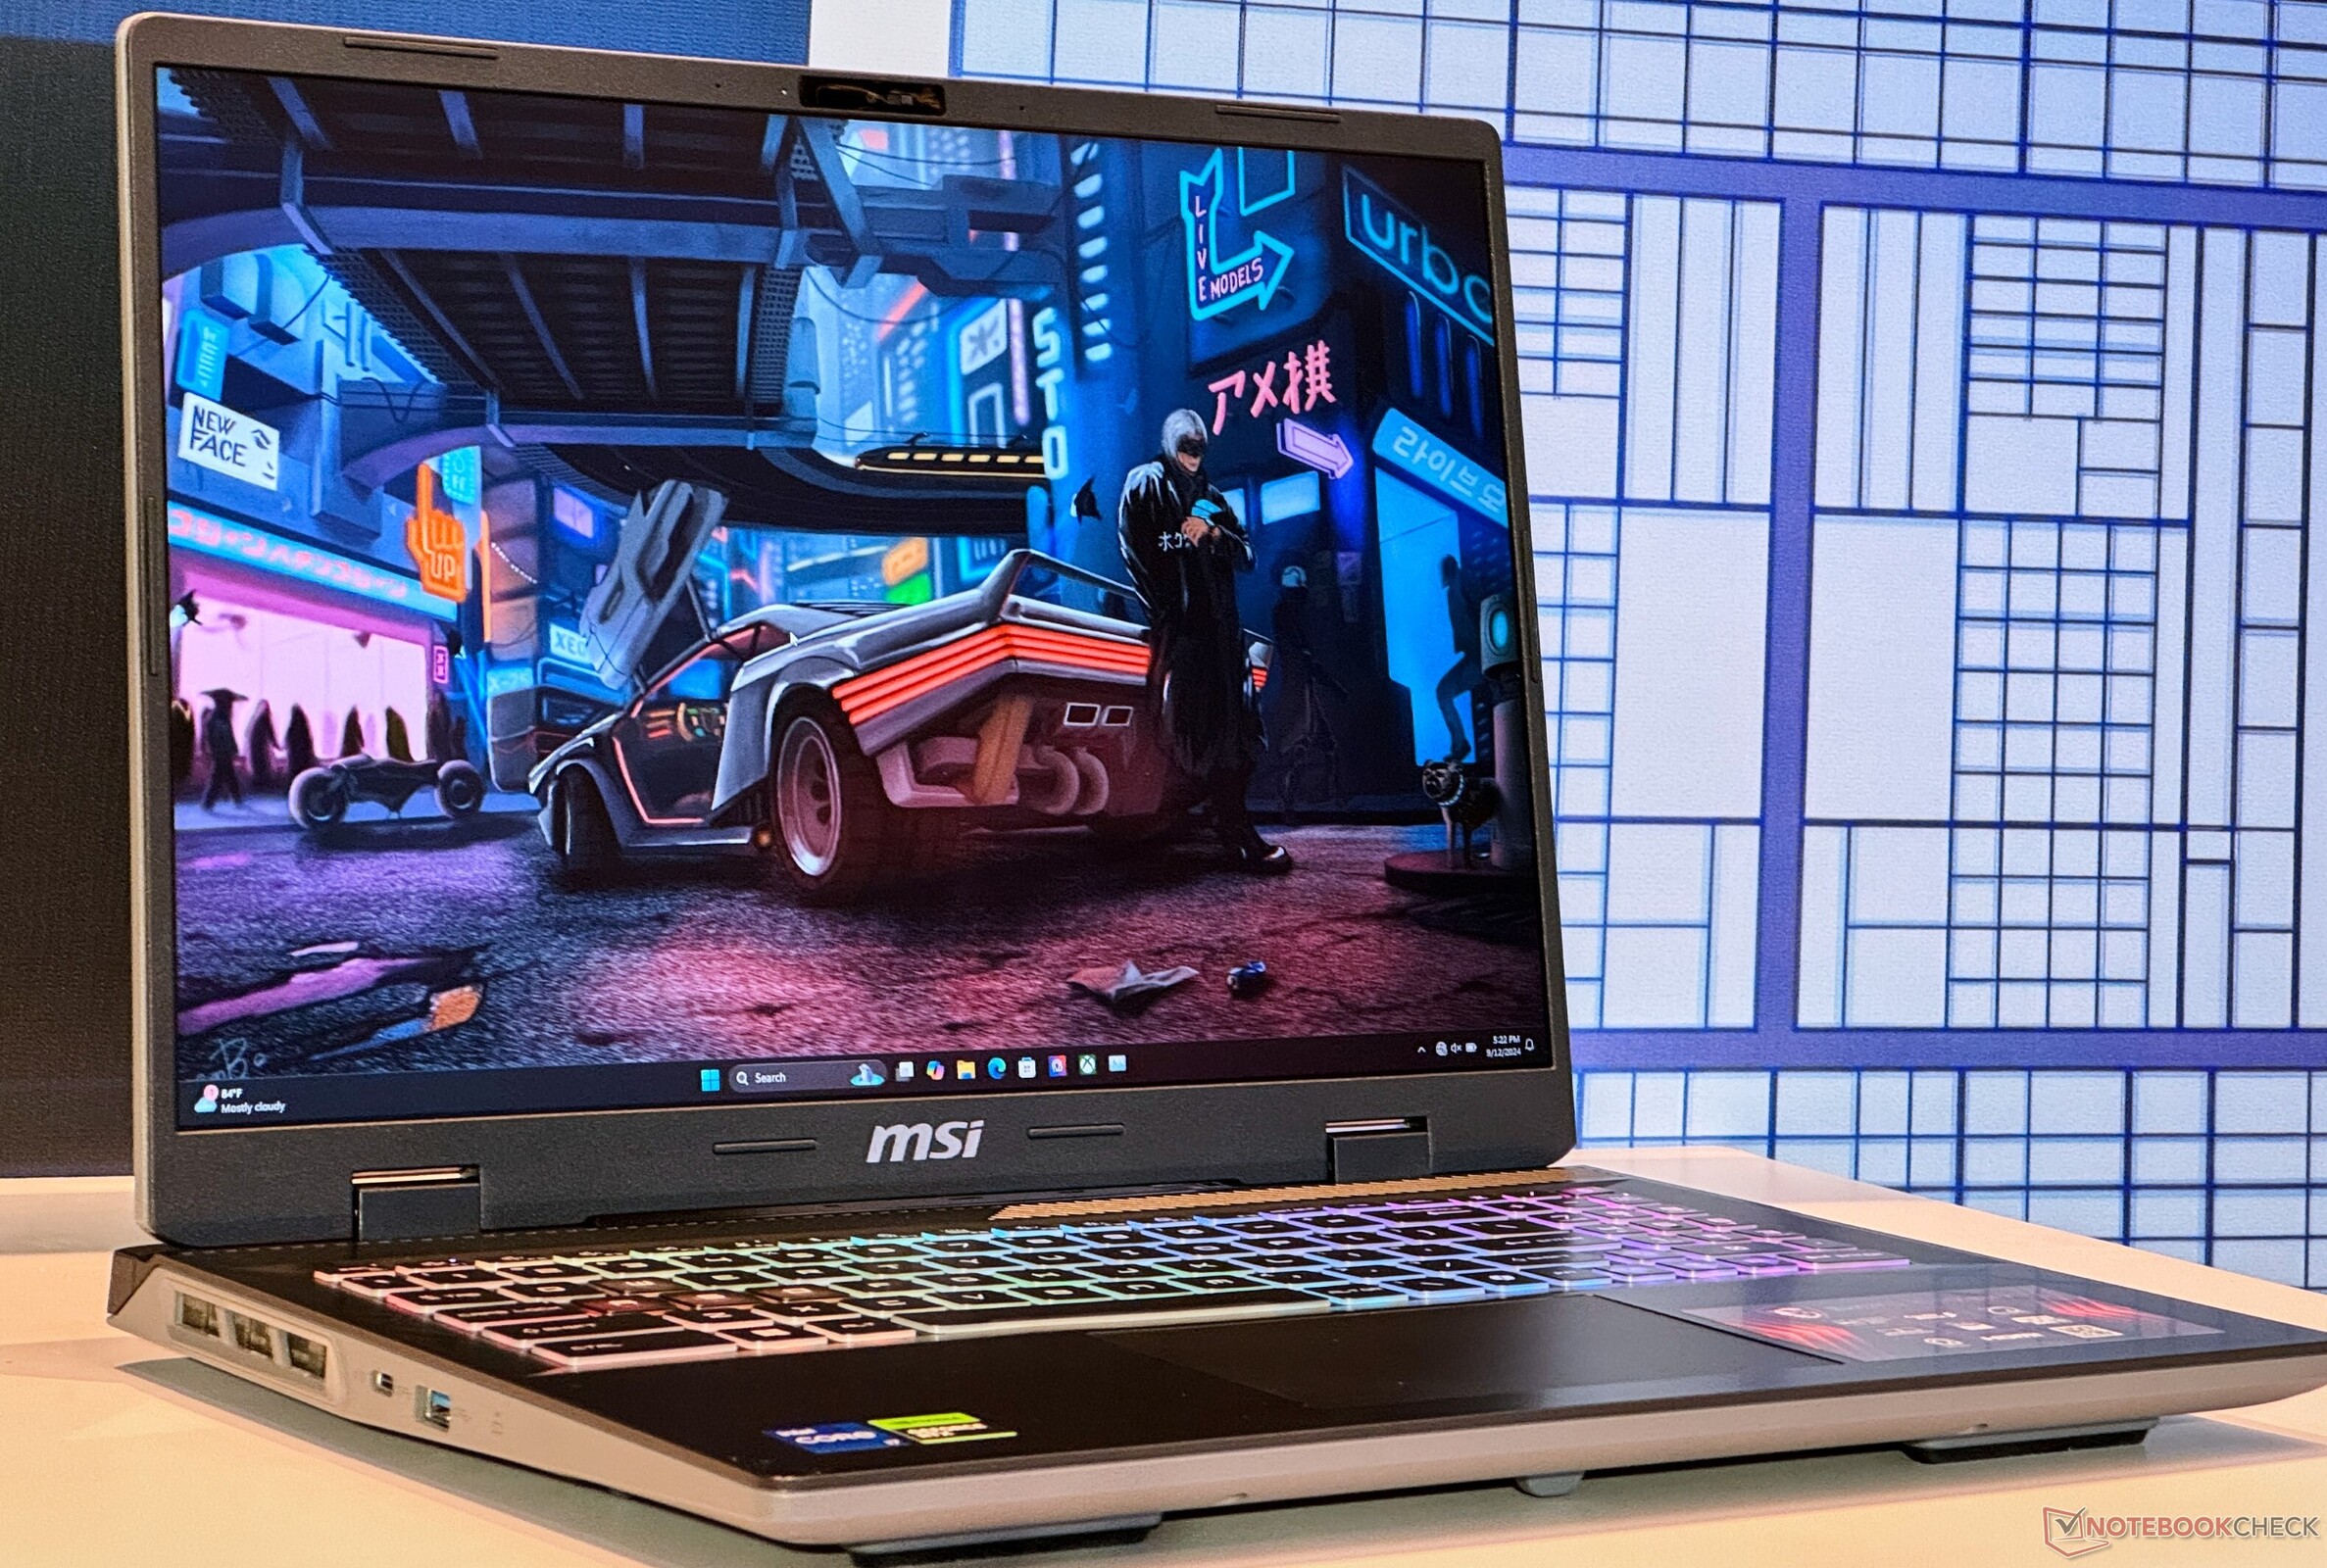
MSI Sword 16 HX ma wszystkie dzwonki i gwizdki współczesnego laptopa do gier, wraz z procesorem Intel Core i7-14700HX, 115-watową kartą graficzną Nvidia GeForce RTX 4070, 16 GB pamięci RAM DDR5, 1 TB SSD i 16-calowym ekranem 144 Hz WUXGA (1920 x 1200). W tej recenzji określamy, jak Sword 16 HX wypada na tle innych komputerów z podobnym sprzętem i przyglądamy się niektórym z jego mocnych stron i kompromisów.Anil Ganti, 👁 Vaidyanathan Subramaniam (tłumaczenie DeepL / Ninh Duy) Opublikowany 🇺🇸 🇩🇪 ...
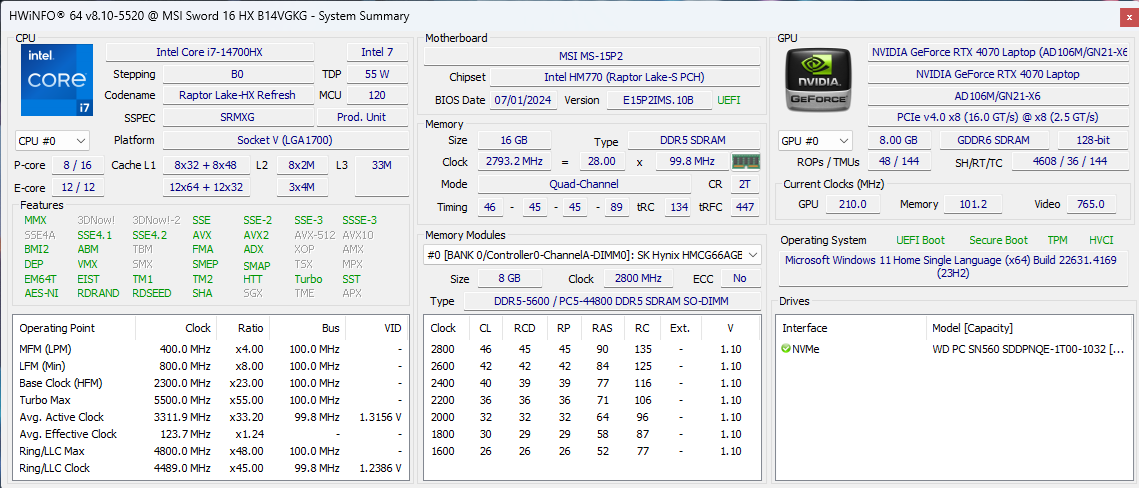
MSI Sword 16 HX znajduje się pośrodku repertuaru firmy i ma na celu zrównoważenie ceny i wydajności. Ten konkretny wariant jest wyposażony w potężny sprzęt, w tym oparty na Raptor Lake HX Intel Core i7-14700HXoparty na Ada Lovelace Nvidia GeForce RTX 407016 GB pamięci RAM DDR5-5600 i 1 TB wbudowanej pamięci masowej.
Zasadniczo jest to jeden z lepszych laptopów do gier Intel/Nvidia, które można kupić nawet dzisiaj, ponieważ Raptor Lake-HX pokonuje Meteor Lake pod względem surowej wydajności. W Indiach Sword 16 HX kosztuje 1 73 990 ₹ (2 071 USD), ale w chwili pisania tego tekstu można go kupić za 1 38 790 ₹ (1 654 USD).
Potencjalni konkurenci w porównaniu
Ocena | Wersja | Data | Model | Waga | Wysokość | Rozmiar | Rezolucja | Cena |
|---|---|---|---|---|---|---|---|---|
| 79 % | v8 | 10/2024 | MSI Sword 16 HX B14VGKG i7-14700HX, NVIDIA GeForce RTX 4070 Laptop GPU | 2.3 kg | 27.7 mm | 16.00" | 1920x1200 | |
| 80.4 % | v8 | 07/2024 | HP Omen 17-db0079ng R7 8845HS, NVIDIA GeForce RTX 4070 Laptop GPU | 2.8 kg | 30.1 mm | 17.30" | 2560x1440 | |
| 90.8 % v7 (old) | v7 (old) | 04/2024 | Lenovo Legion 7 16 IRX G9 i9-14900HX, NVIDIA GeForce RTX 4070 Laptop GPU | 2.3 kg | 19.8 mm | 16.00" | 3200x2000 | |
| 86.8 % v7 (old) | v7 (old) | 05/2024 | Acer Predator Helios Neo 16 (2024) i7-14700HX, NVIDIA GeForce RTX 4070 Laptop GPU | 2.6 kg | 25.95 mm | 16.00" | 2560x1600 | |
| 90.2 % v7 (old) | v7 (old) | 03/2024 | Alienware m16 R2 Ultra 7 155H, NVIDIA GeForce RTX 4070 Laptop GPU | 2.5 kg | 23.5 mm | 16.00" | 2560x1600 | |
| 88.4 % v7 (old) | v7 (old) | 04/2023 | Asus ROG Strix G17 G713PI R9 7945HX, NVIDIA GeForce RTX 4070 Laptop GPU | 2.8 kg | 30.7 mm | 17.30" | 2560x1440 | |
| 85.1 % v7 (old) | v7 (old) | 09/2023 | HP Victus 16-r0077ng i7-13700H, NVIDIA GeForce RTX 4070 Laptop GPU | 2.4 kg | 24 mm | 16.10" | 1920x1080 |
Uwaga: Niedawno zaktualizowaliśmy nasz system oceny i wyniki wersji 8 nie są porównywalne z wynikami wersji 7. Więcej informacji znajdą Państwo tutaj .
Obudowa: Tworzywo sztuczne o solidnej konstrukcji
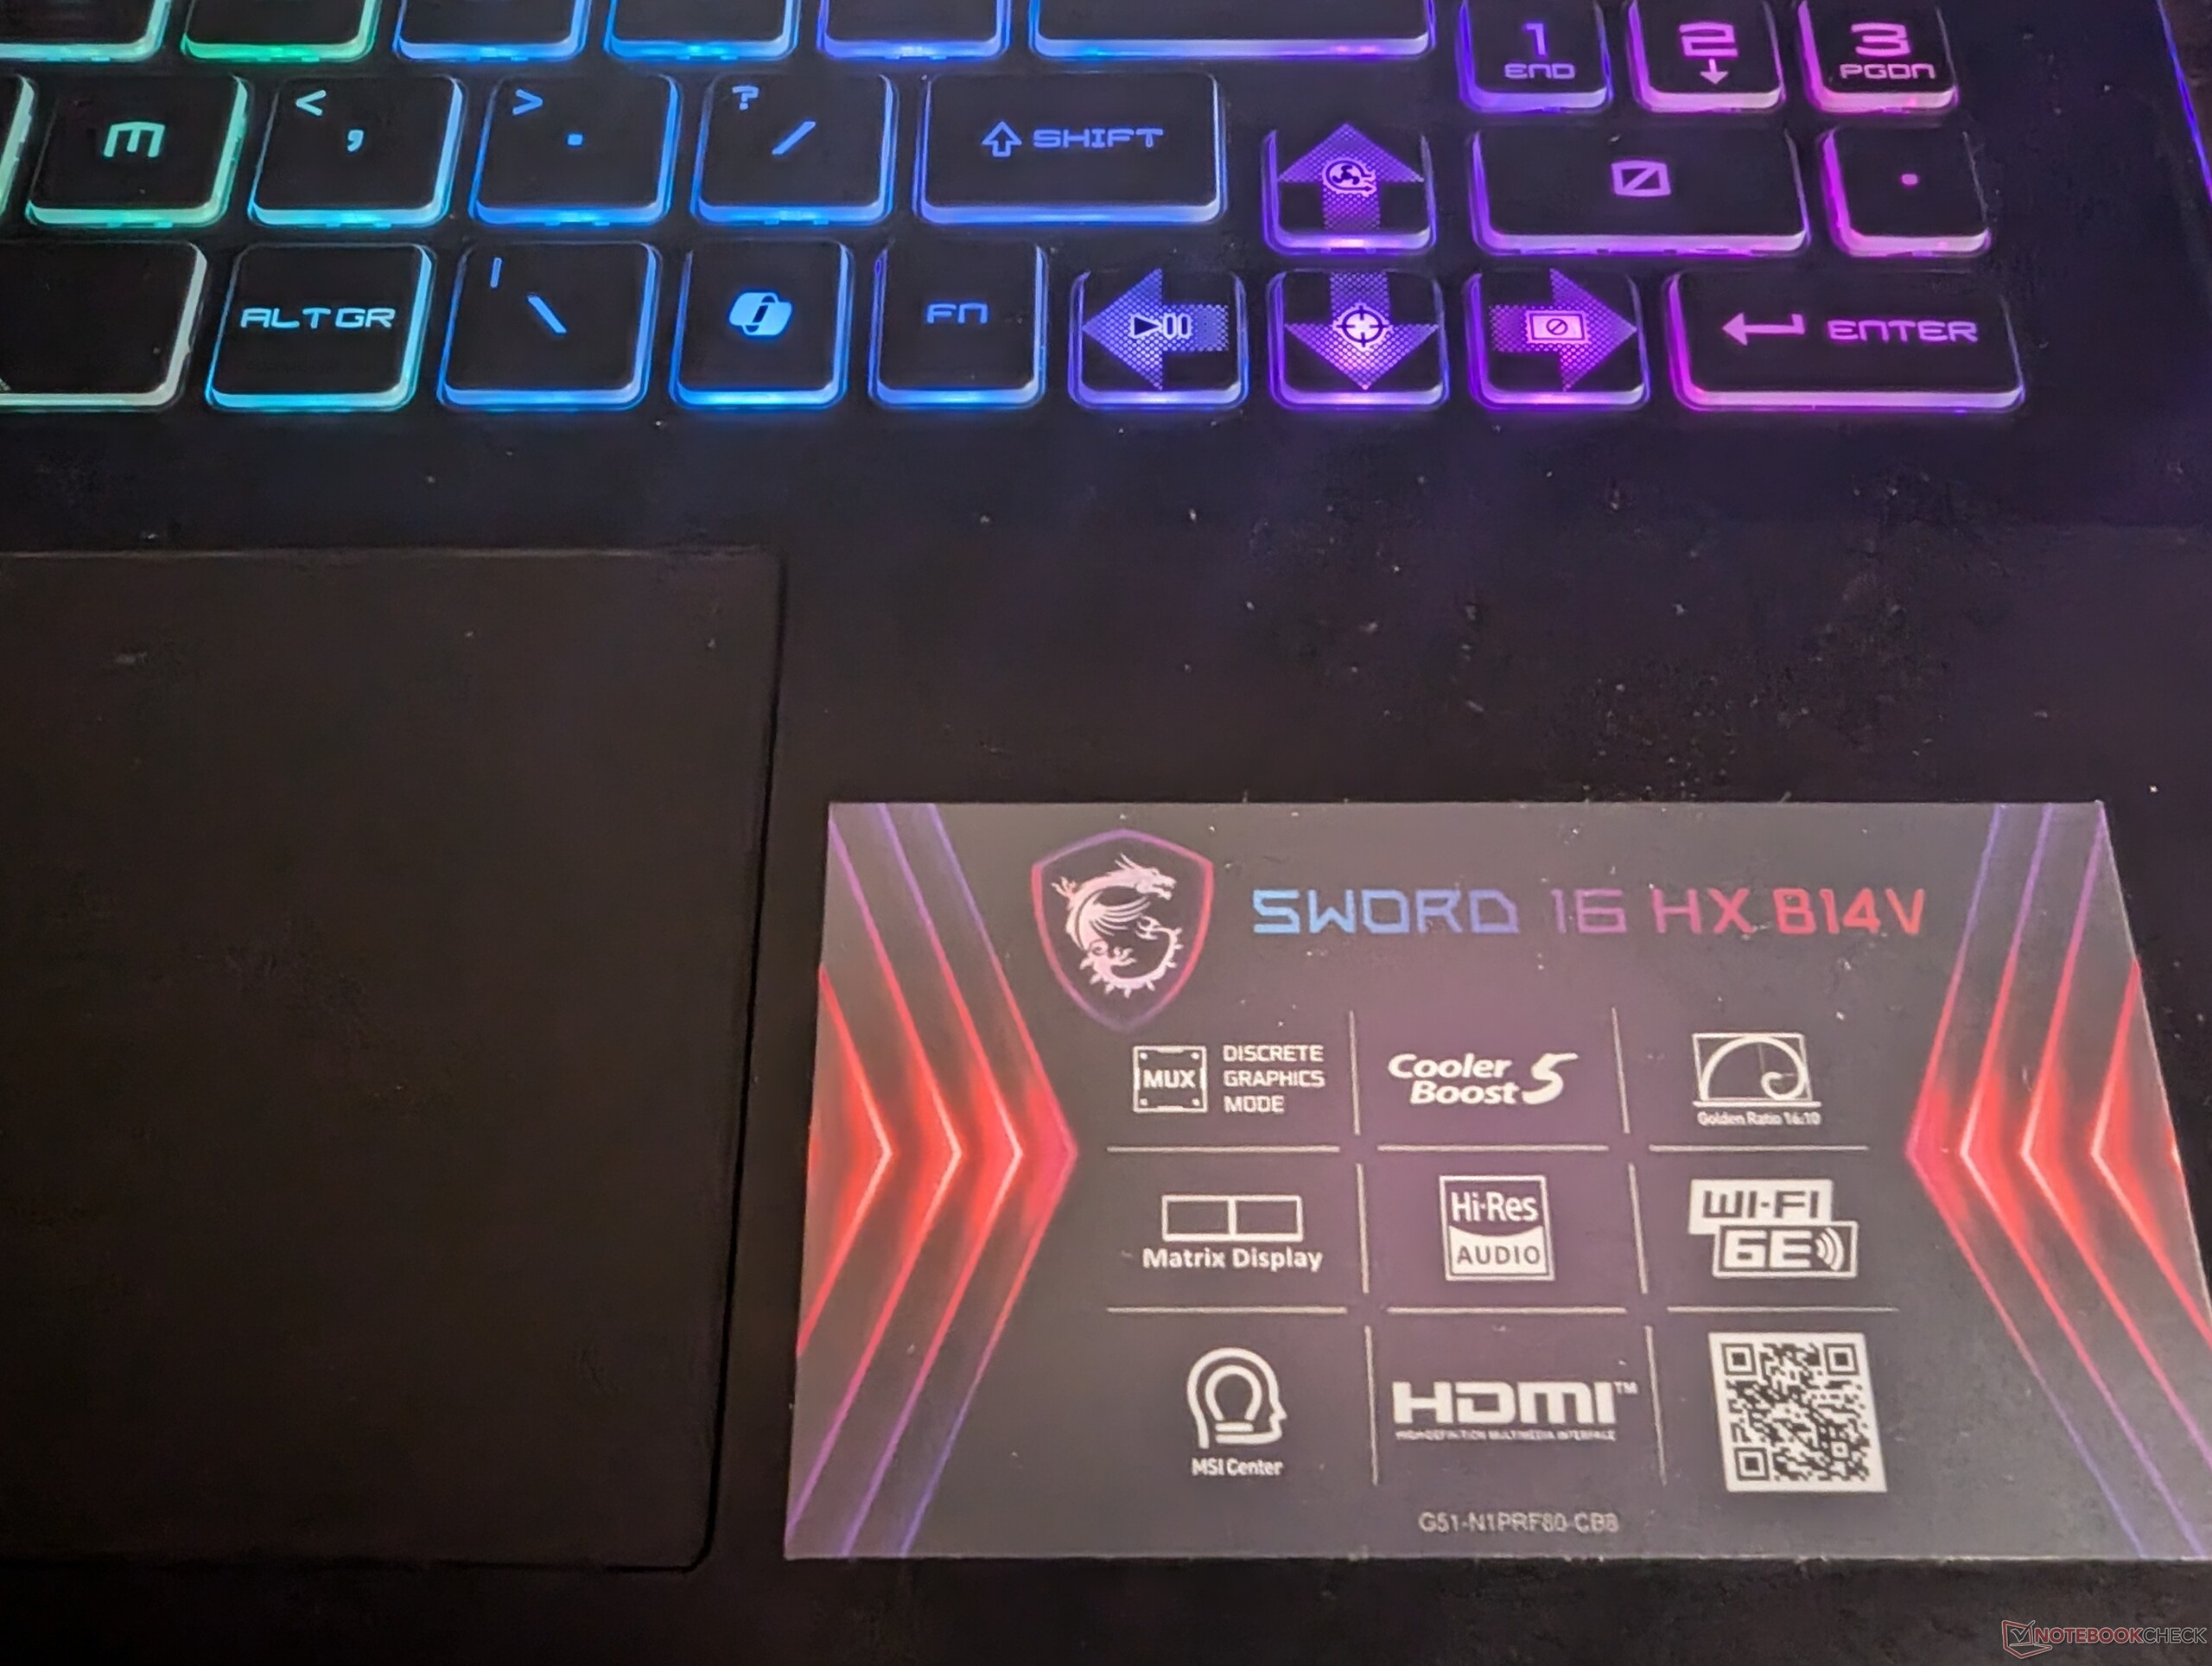
MSI Sword 16 HX ma standardową plastikową obudowę. Otrzymaliśmy jedną z ciemniejszych wersji kolorystycznych, która niestety jest magnesem na odciski palców i tłuszcz. Z tyłu znajduje się logo MSI (i malutkie pod ekranem), a obok gładzika naklejki podkreślające jego kluczowe funkcje.
Pomimo plastikowej konstrukcji, obudowa jest solidna i wykazuje minimalne ugięcie. Ekran i zawiasy są sztywne i nie skręcają się zbytnio przy niewielkim nacisku. W przeciwieństwie do niektórych bardziej premium ofert, nie można otworzyć ekranu jednym palcem bez poruszenia laptopa.
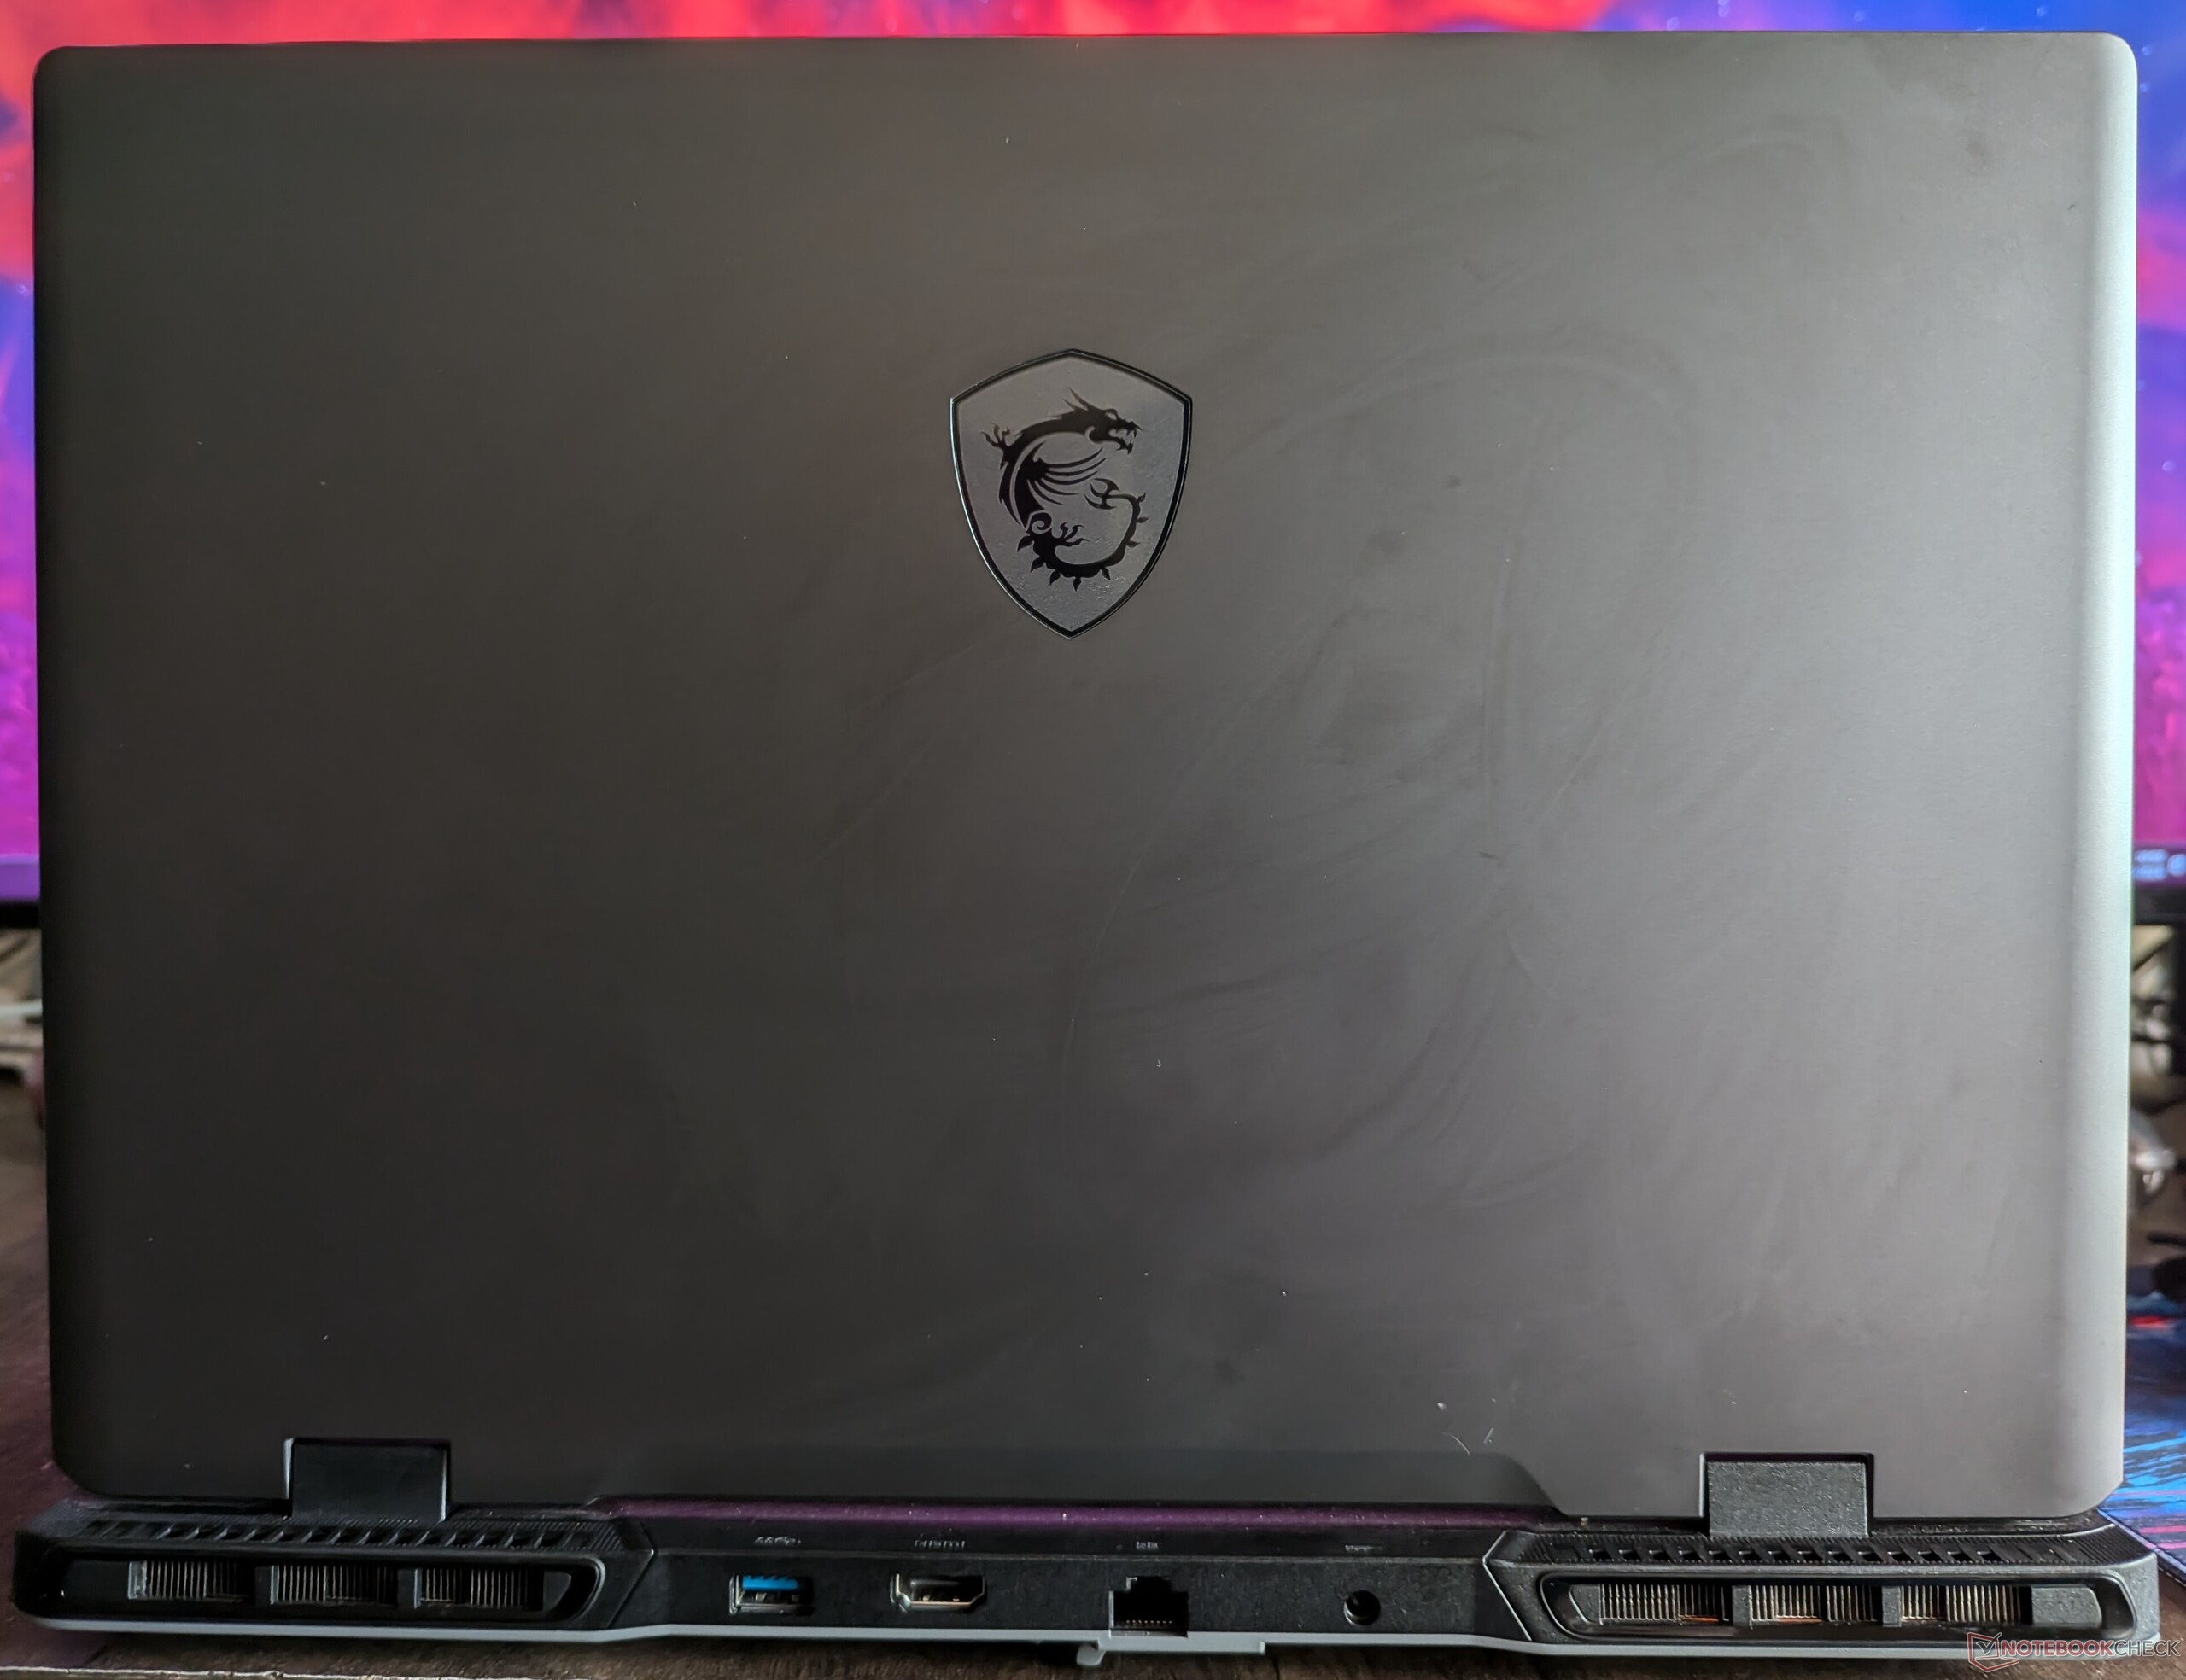
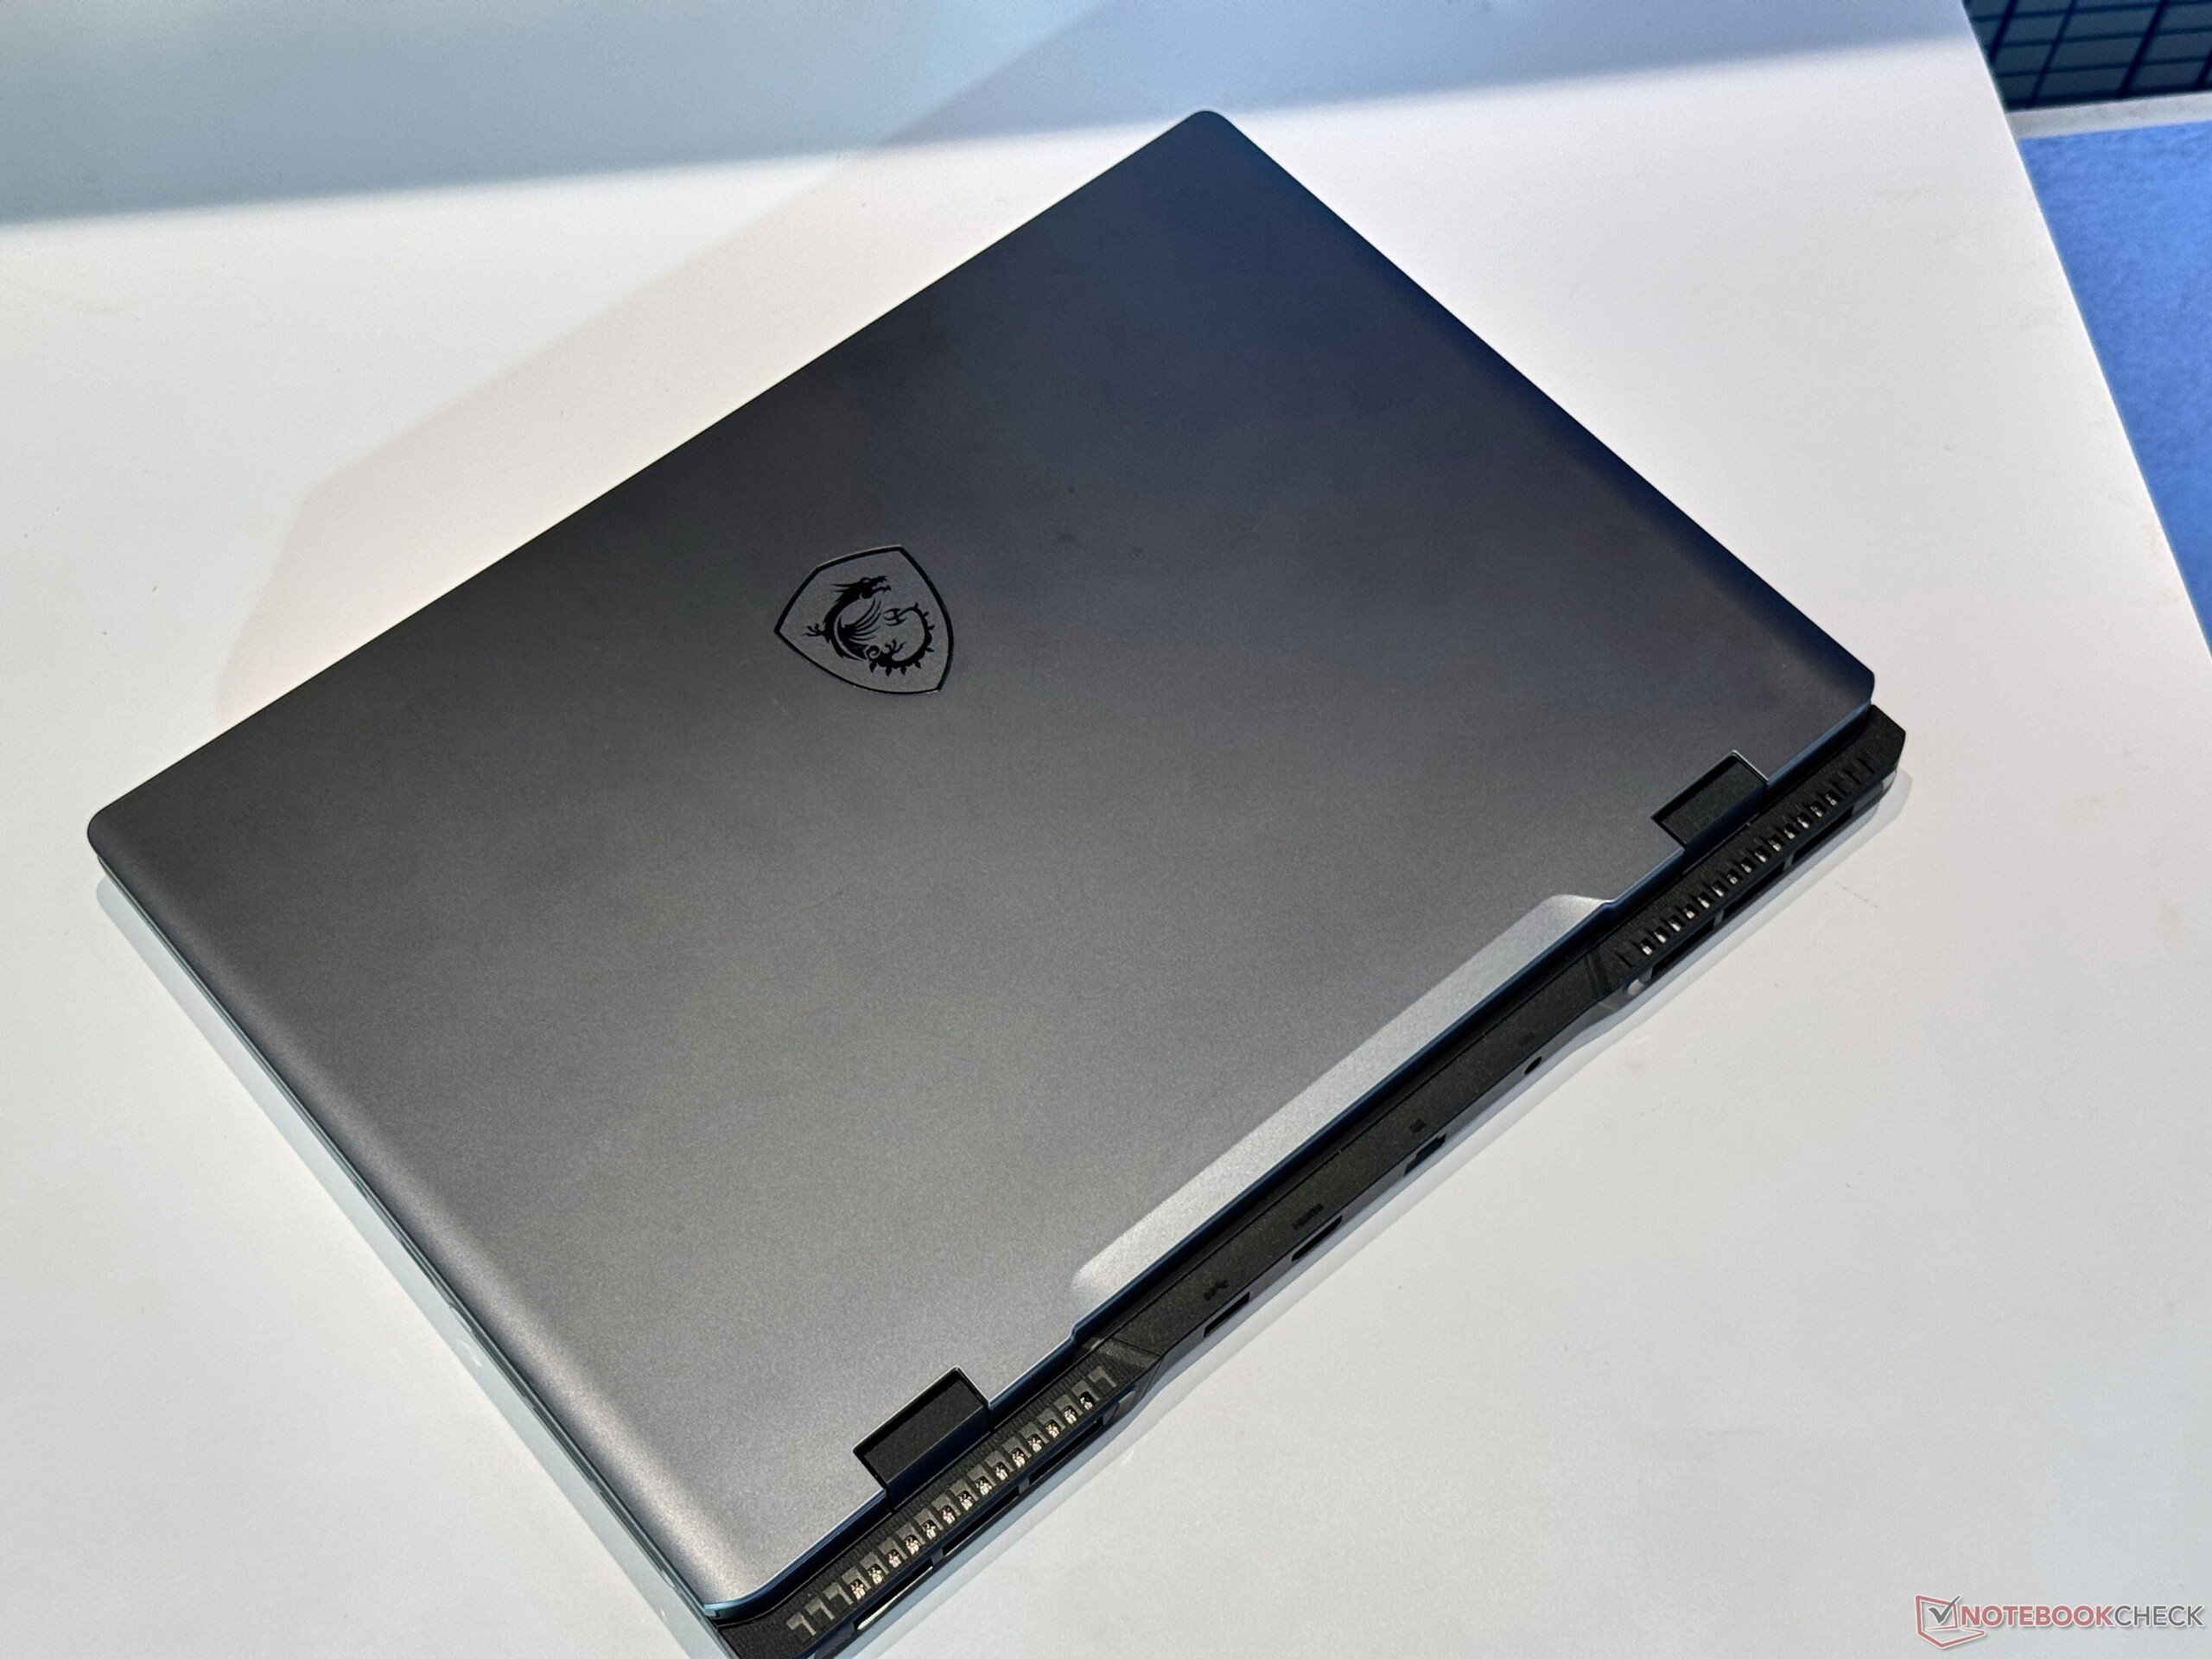
Ważący 2,3 kg MSI Sword 16 HX nie jest urządzeniem, które można nazwać przenośnym, ale można go nosić w plecaku.
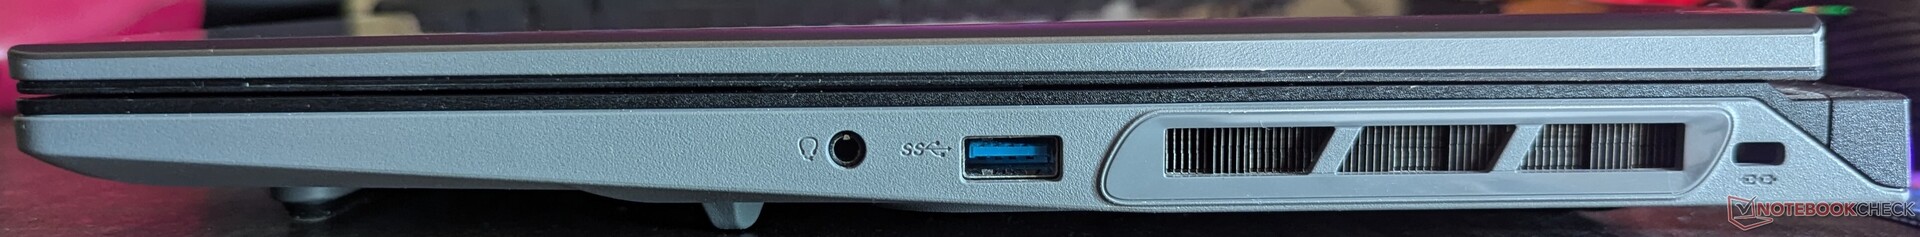
Łączność: Niesamowicie szybkie Wi-Fi 6E i Ethernet
Laptopy do gier są często używane jako komputery stacjonarne i potrzebują dużej ilości wejść/wyjść, aby spełnić tę rolę. Zauważyliśmy jednak kilka problemów z portami. Po pierwsze, nie można ładować laptopa za pomocą portu USB typu C. Zmusza to do korzystania z ładowarki z bolcem z tyłu, która znajduje się tuż obok otworów wentylacyjnych.
Powoduje to umieszczenie kabla ładującego pod kątem prostym tuż przed otworem wentylacyjnym i poddanie go ciągłemu podmuchowi gorącego powietrza. Z czasem ciepło może potencjalnie uszkodzić plastikową izolację i sprawić, że kabel stanie się bezużyteczny.
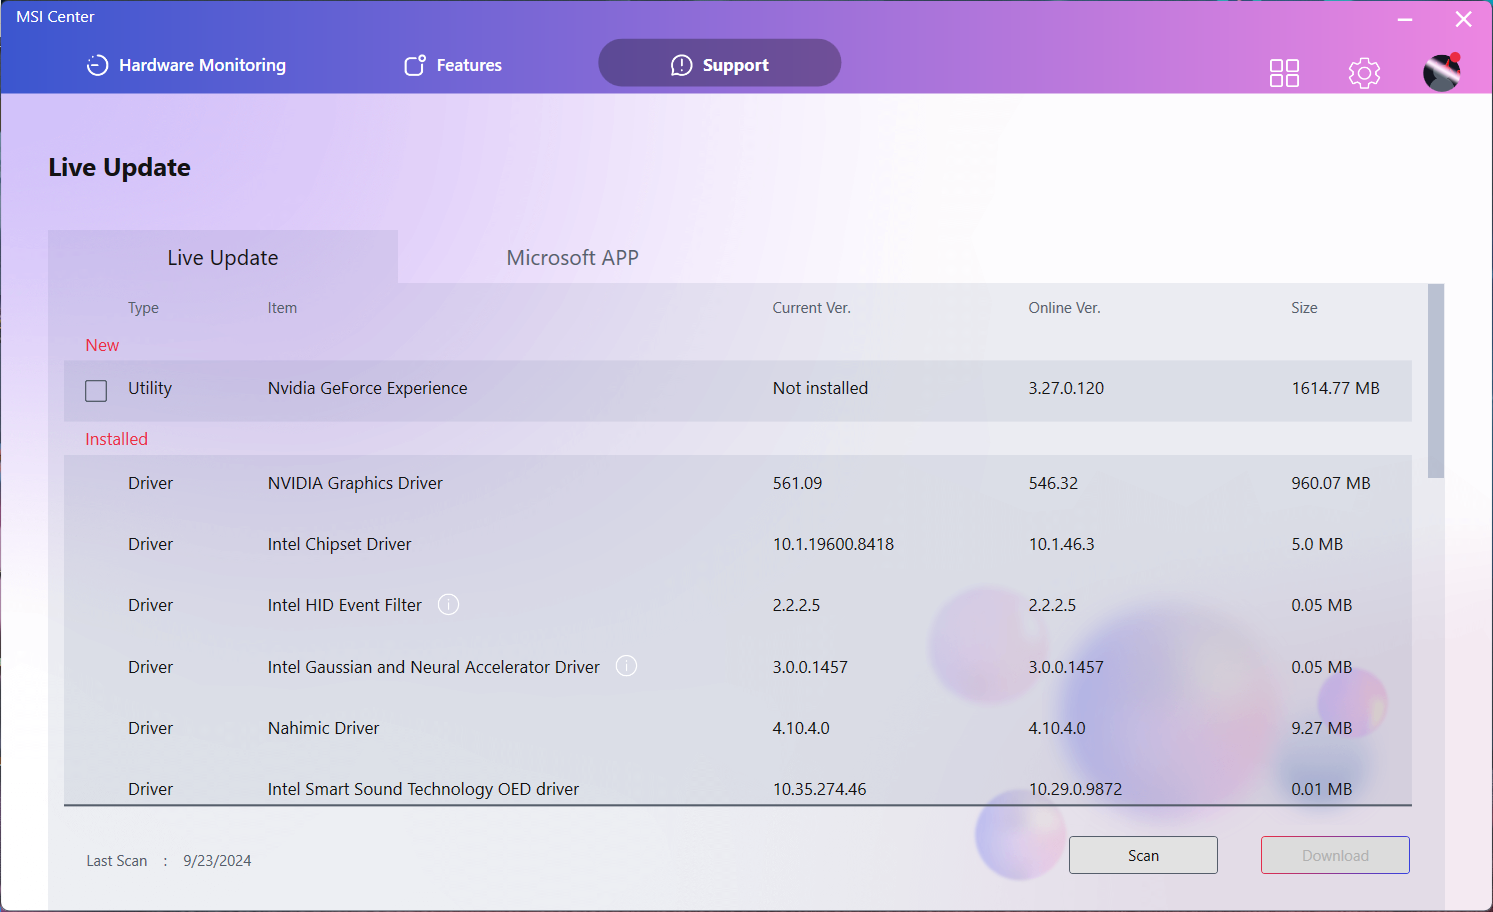
Co więcej, dołączony port HDMI odmówił pracy w rozdzielczości 1440p 144 Hz na naszym zewnętrznym monitorze i z jakiegoś powodu ograniczył się do 100 Hz. Skontaktowaliśmy się z MSI, które dostarczyło nam zaktualizowany BIOS (E15P2IMS.10D), który rozwiązuje ten problem. Ten BIOS jest również dostępny na stronie wsparcia laptopa https://www.msi.com/Laptop/Sword-16-HX-B14VX/support?sub_product=Sword-16-HX-B14VGKGale nie mogliśmy go zainstalować w naszej jednostce testowej.


Komunikacja
Sword 16 HX jest wyposażony w radio Wi-Fi 6E firmy Intel. W idealnych warunkach można z łatwością uzyskać prędkość transferu ponad 1 Gb/s w pasmach 5 GHz i 6 GHz.
Ci, którzy szukają gwarantowanej prędkości i niskich opóźnień, mogą polegać na gnieździe Ethernet RJ45.
| Networking / iperf3 transmit AXE11000 | |
| Lenovo Legion 7 16 IRX G9 | |
| Asus ROG Strix G17 G713PI | |
| MSI Sword 16 HX B14VGKG | |
| Przeciętny Intel Wi-Fi 6E AX211 (64 - 1921, n=251) | |
| Średnia w klasie Gaming (469 - 1843, n=122, ostatnie 2 lata) | |
| Alienware m16 R2 | |
| Acer Predator Helios Neo 16 (2024) | |
| HP Omen 17-db0079ng | |
| HP Victus 16-r0077ng | |
| Networking / iperf3 receive AXE11000 | |
| Lenovo Legion 7 16 IRX G9 | |
| Asus ROG Strix G17 G713PI | |
| MSI Sword 16 HX B14VGKG | |
| Średnia w klasie Gaming (680 - 1744, n=122, ostatnie 2 lata) | |
| Przeciętny Intel Wi-Fi 6E AX211 (582 - 1890, n=251) | |
| Alienware m16 R2 | |
| Acer Predator Helios Neo 16 (2024) | |
| HP Omen 17-db0079ng | |
| HP Victus 16-r0077ng | |
| Networking / iperf3 transmit AXE11000 6GHz | |
| MSI Sword 16 HX B14VGKG | |
| Acer Predator Helios Neo 16 (2024) | |
| Średnia w klasie Gaming (648 - 2355, n=56, ostatnie 2 lata) | |
| Alienware m16 R2 | |
| Przeciętny Intel Wi-Fi 6E AX211 (385 - 1851, n=217) | |
| Networking / iperf3 receive AXE11000 6GHz | |
| Acer Predator Helios Neo 16 (2024) | |
| MSI Sword 16 HX B14VGKG | |
| Przeciętny Intel Wi-Fi 6E AX211 (700 - 1857, n=217) | |
| Średnia w klasie Gaming (853 - 1788, n=56, ostatnie 2 lata) | |
| Alienware m16 R2 | |
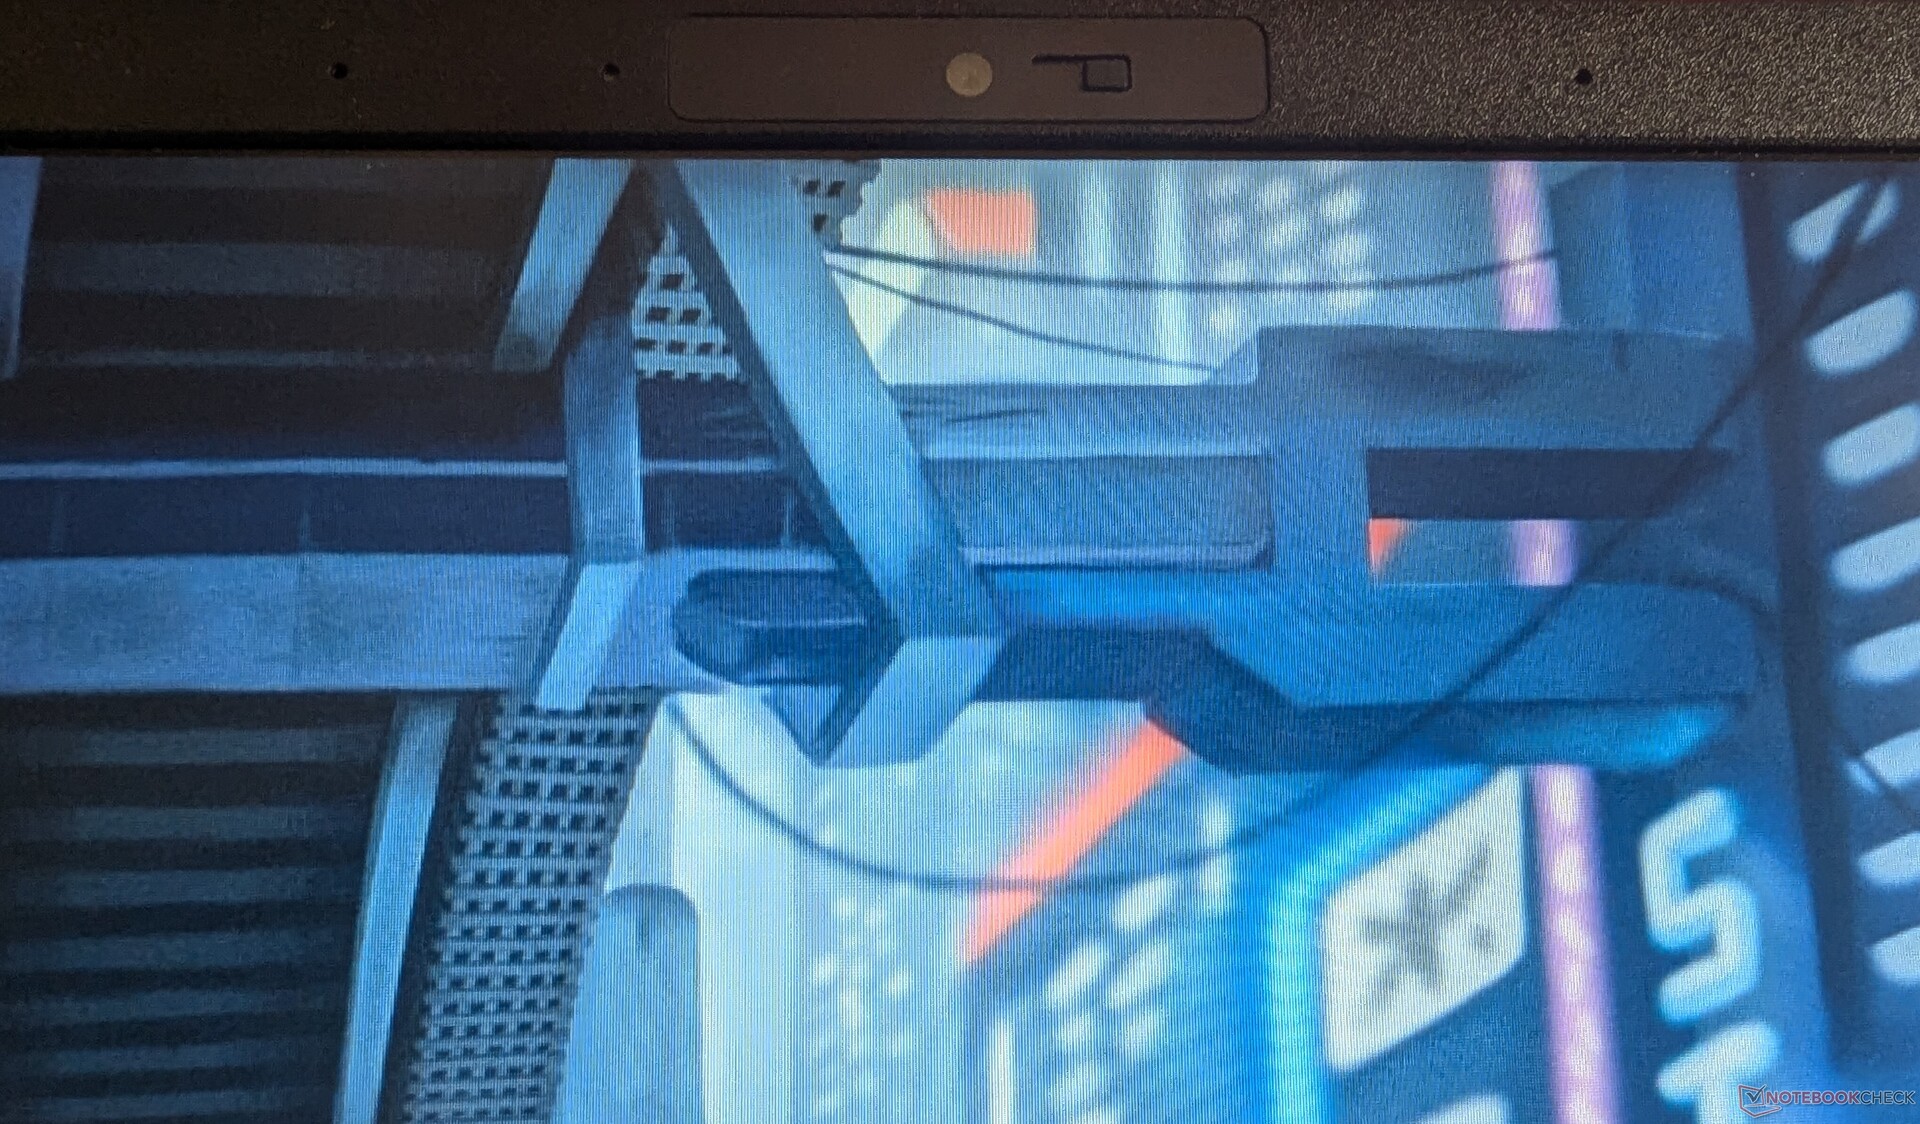
Kamera internetowa
MSI wykorzystuje starą kamerę internetową 1080p w Sword 16 HX. Nie jest ona szczególnie dokładna pod względem odwzorowania kolorów i ma problemy z prawidłowym odwzorowaniem odcieni niebieskiego.
Jeśli chcą Państwo prowadzić transmisje na żywo, lepiej zainwestować w zewnętrzną kamerę internetową. W przeciwnym razie powinna działać dobrze do codziennego użytku, a nawet jest wyposażona w fizyczną przesłonę prywatności.


Bezpieczeństwo
Poza przesłoną prywatności kamery internetowej, MSI Sword 16 HX posiada standardowy moduł TPM 2.0 i gniazdo blokady Kensington dla bezpieczeństwa.
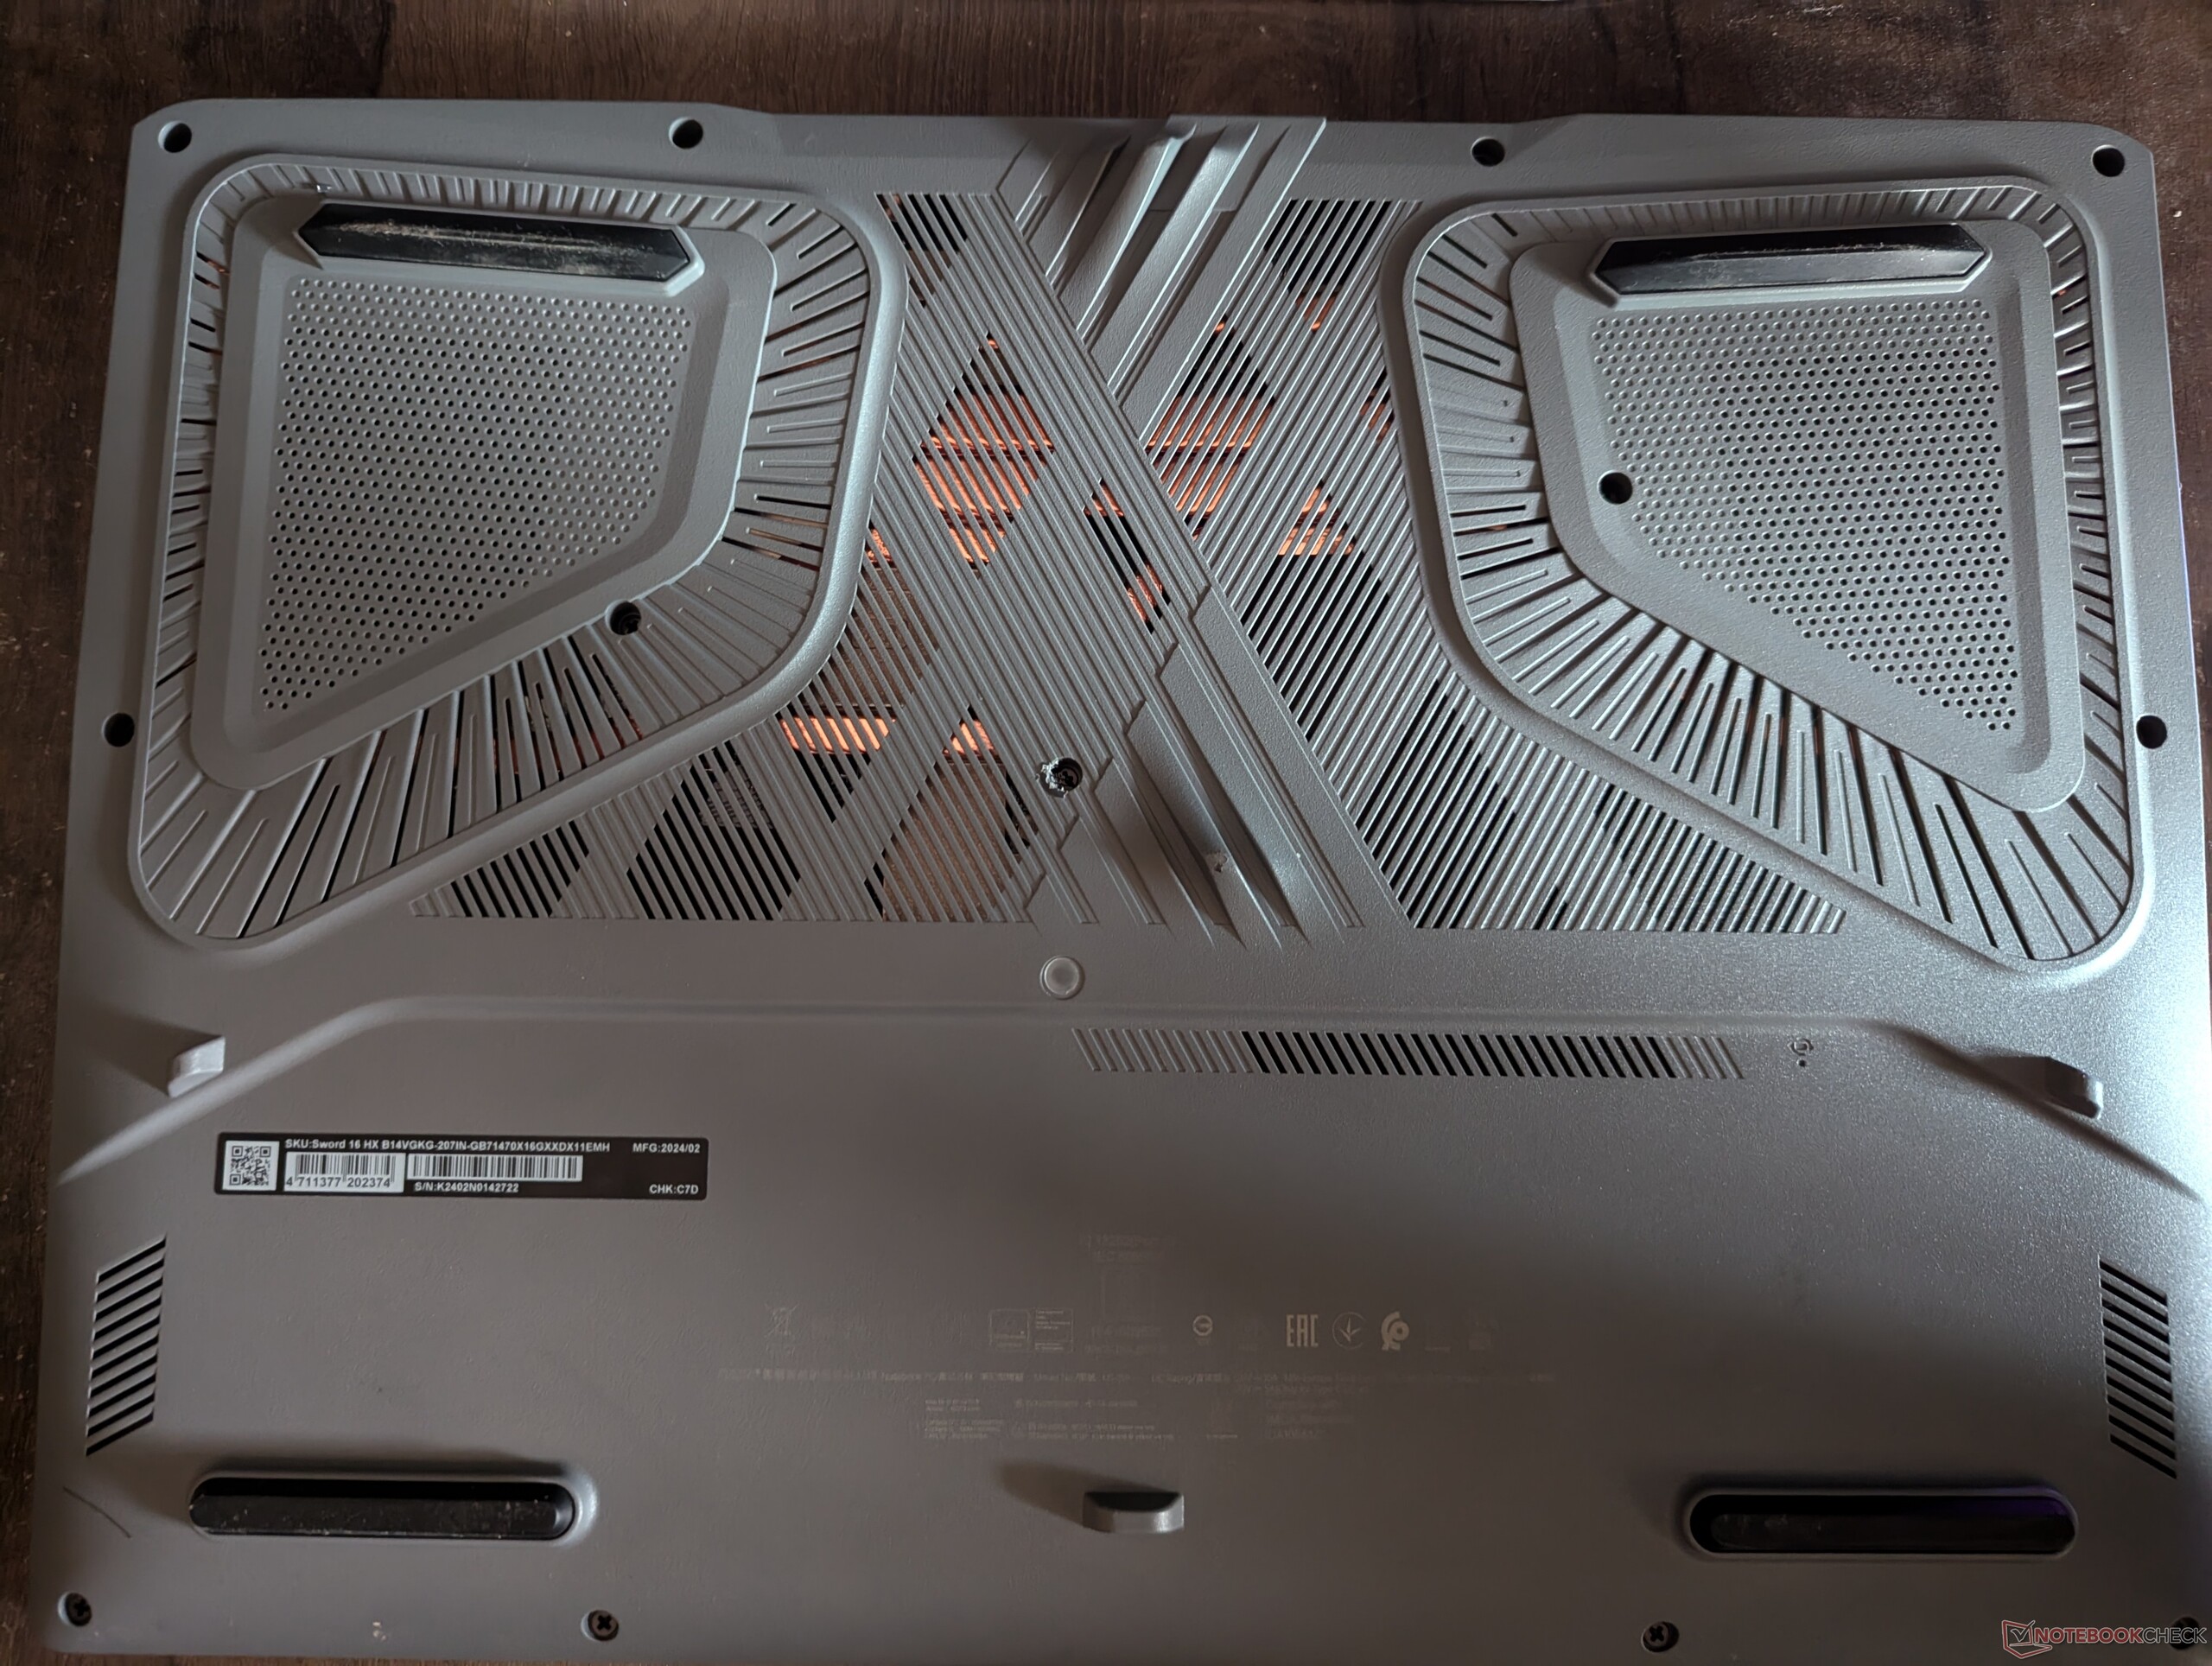
Konserwacja
Otwieranie MSI Sword 16 HX może być nieco kłopotliwe. Łącznie znajduje się tam 12 śrubek, z których jedna jest ukryta pod naklejką "Gwarancja nieważna w przypadku usunięcia".
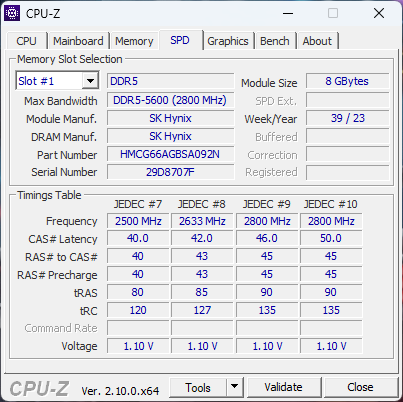
Jednak po wejściu do środka zarówno pamięć RAM, jak i dysk SSD można wymienić. Ten pierwszy można rozszerzyć do 96 GB, a drugi zawiera jeden slot PCIe Gen4 i jeden PCIe Gen5.
Niestety, nie jesteśmy w stanie opublikować zdjęć wnętrza Sword 16, ponieważ MSI poprosiło nas, abyśmy go nie demontowali.
Zrównoważony rozwój
Pudełko MSI Sword 16 HX zawiera wiele niepotrzebnych kartonowych opakowań. Poza niewielką ilością polistyrenu i zbędnego plastiku, większość zawartości jest wykonana z tektury i może zostać poddana recyklingowi.
Strona internetowa MSI poświęcona CSR podaje, że firma osiągnęła 58,9% redukcję emisji CO2e w zakresie 1+2 do końca 2022 roku i dąży do 80% redukcji CO2e do 2030 roku.
Akcesoria i gwarancja
MSI oferuje standardową roczną międzynarodową i dwuletnią krajową gwarancję na Sword 16 HX w Indiach. Obecnie nie są dostępne żadne rozszerzone plany gwarancyjne bezpośrednio od MSI, ale Państwa doświadczenia mogą się różnić w zależności od sprzedawców zewnętrznych.
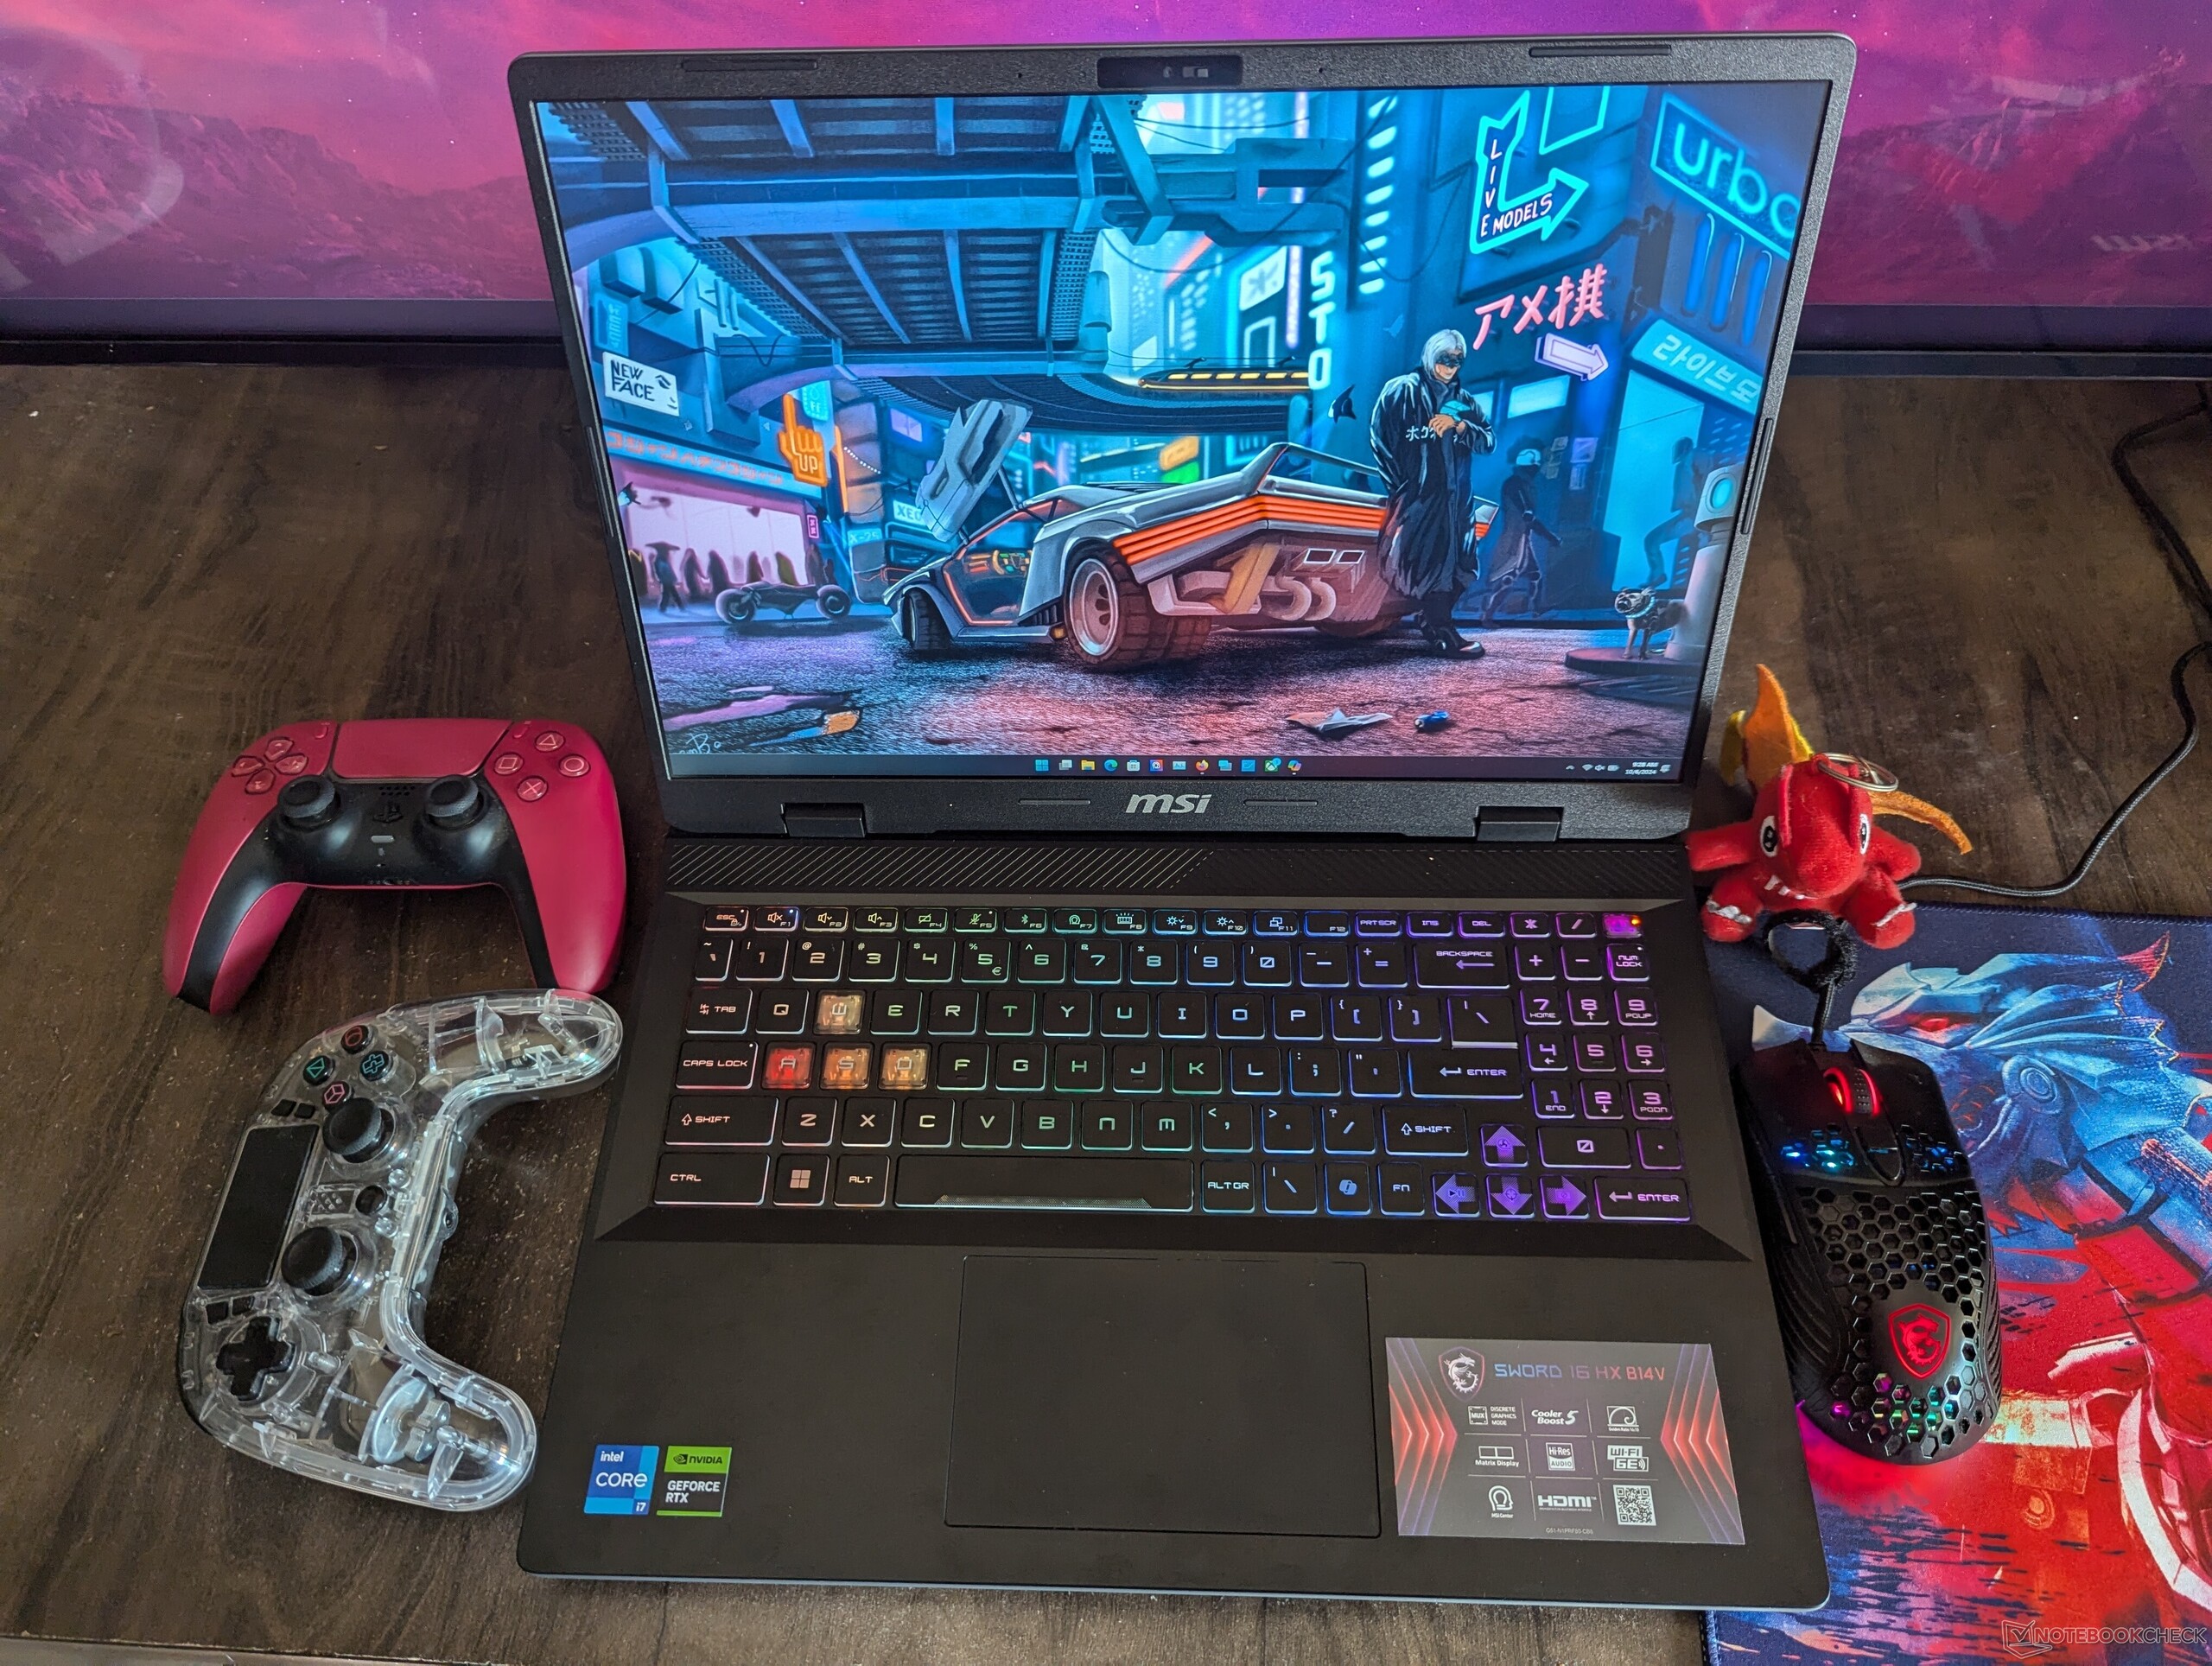
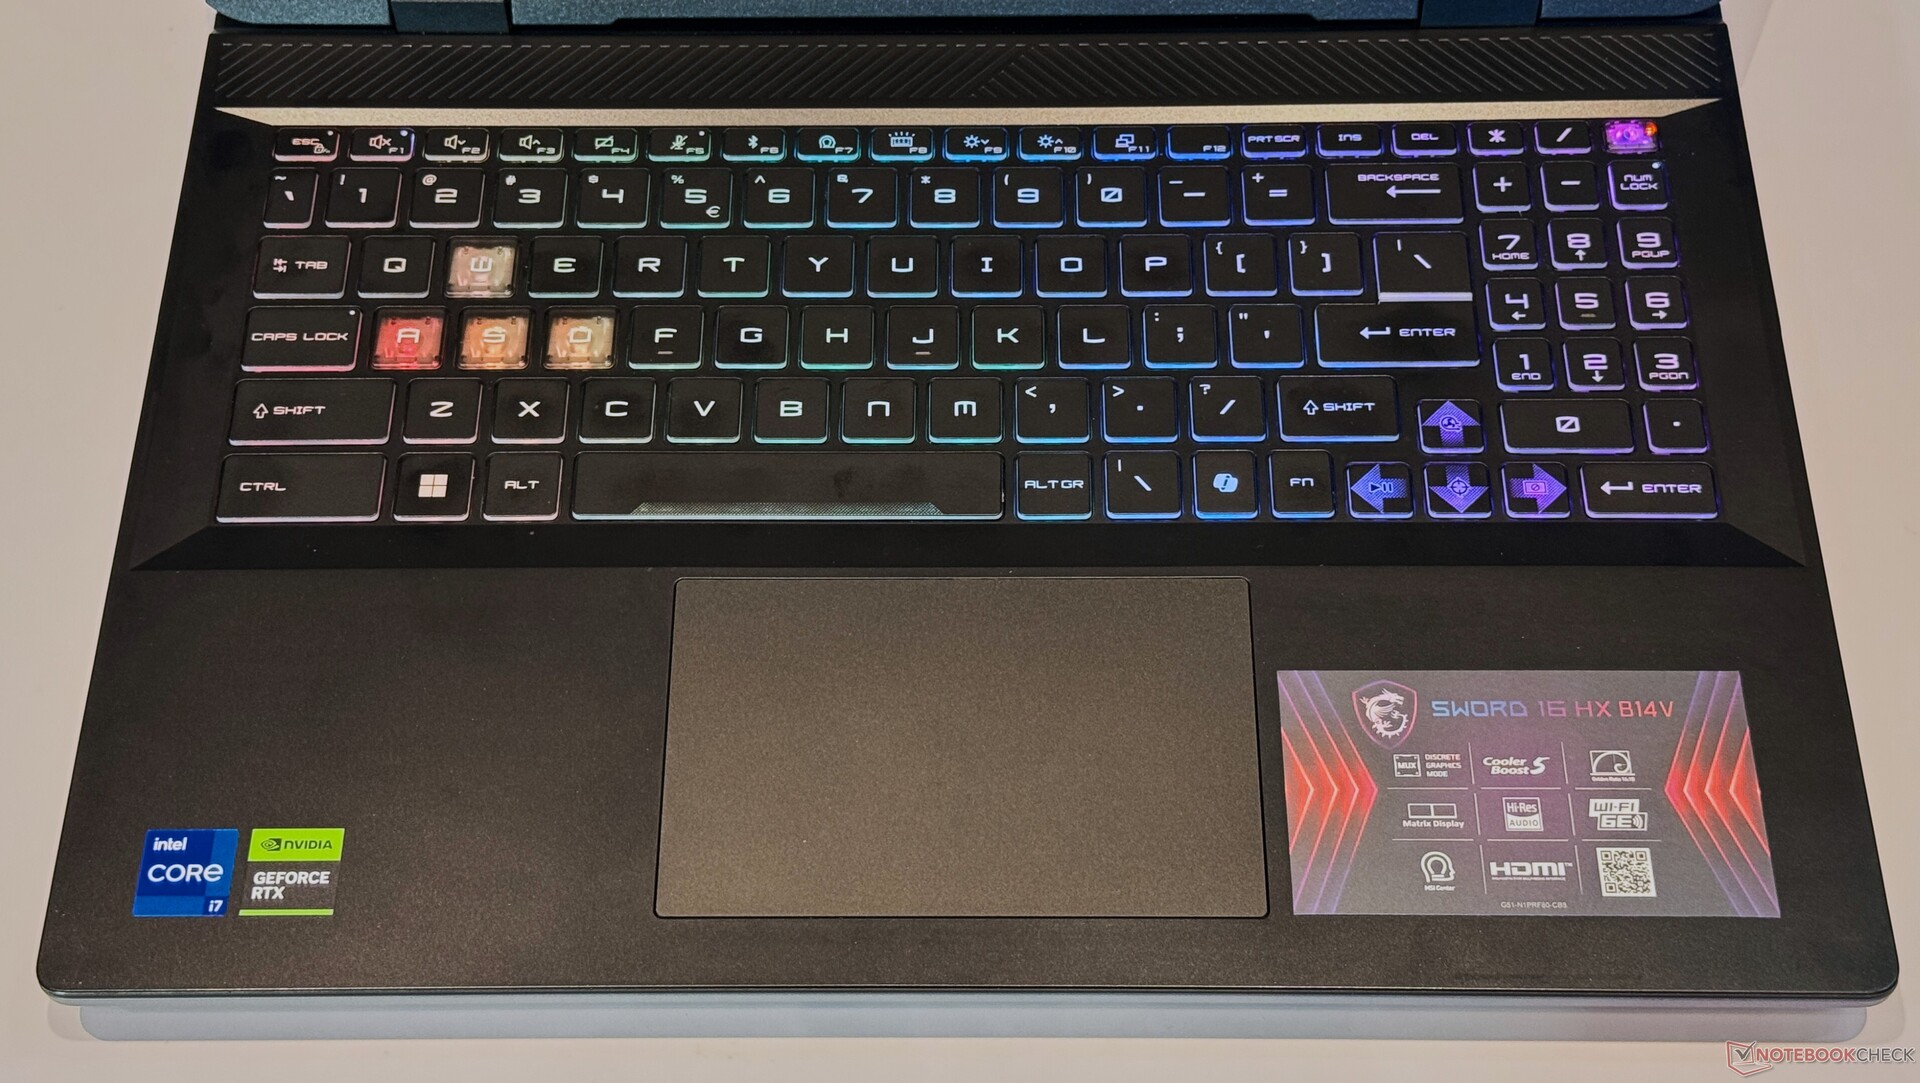
Urządzenia wejściowe: Duża klawiatura RGB z mniej niż idealnym gładzikiem
Sword 16 HX jest wyposażony w standardową klawiaturę i gładzik, które można znaleźć w większości laptopów do gier.
Klawiatura
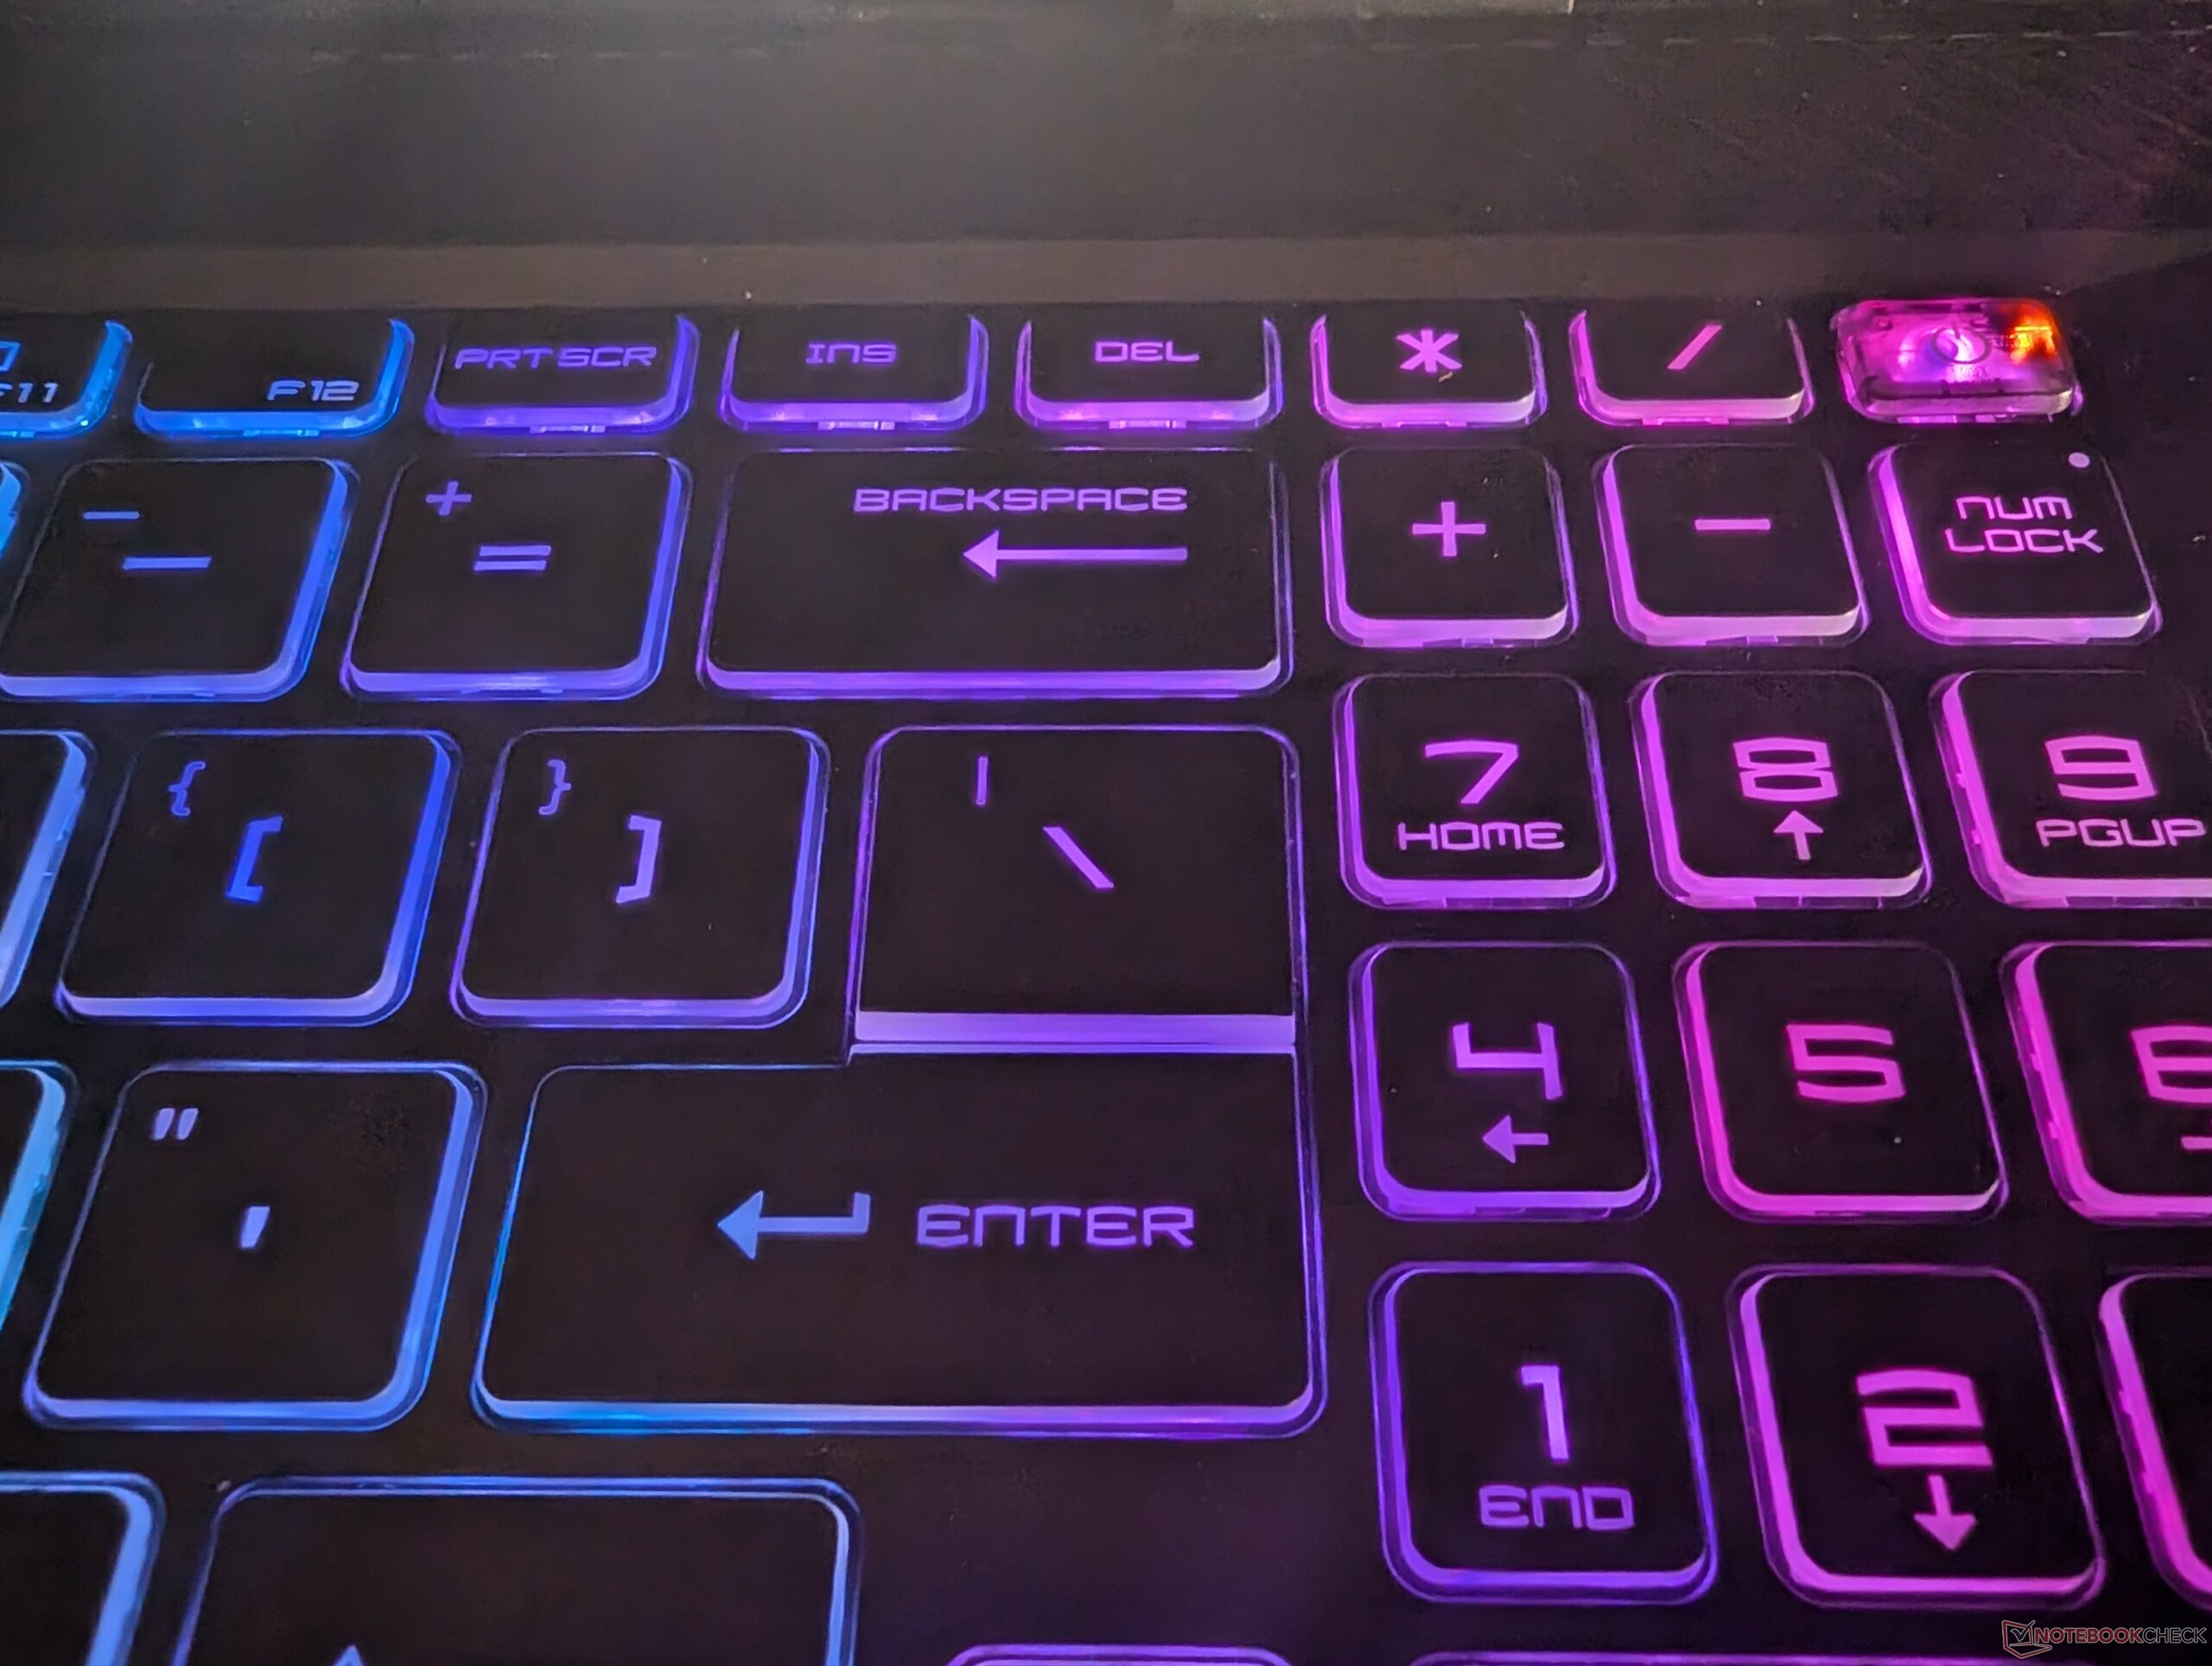
Jego 16-calowa obudowa pozwala MSI na dołączenie do Sword 16 pełnego Numpada. Klawisze Numpad mogą być odrobinę za małe dla osób z dużymi palcami.
Sama klawiatura jest solidna i nie ugina się pod naciskiem. Ponadto same klawisze były wygodne do pisania i nie wymagały dużej siły aktywacji.
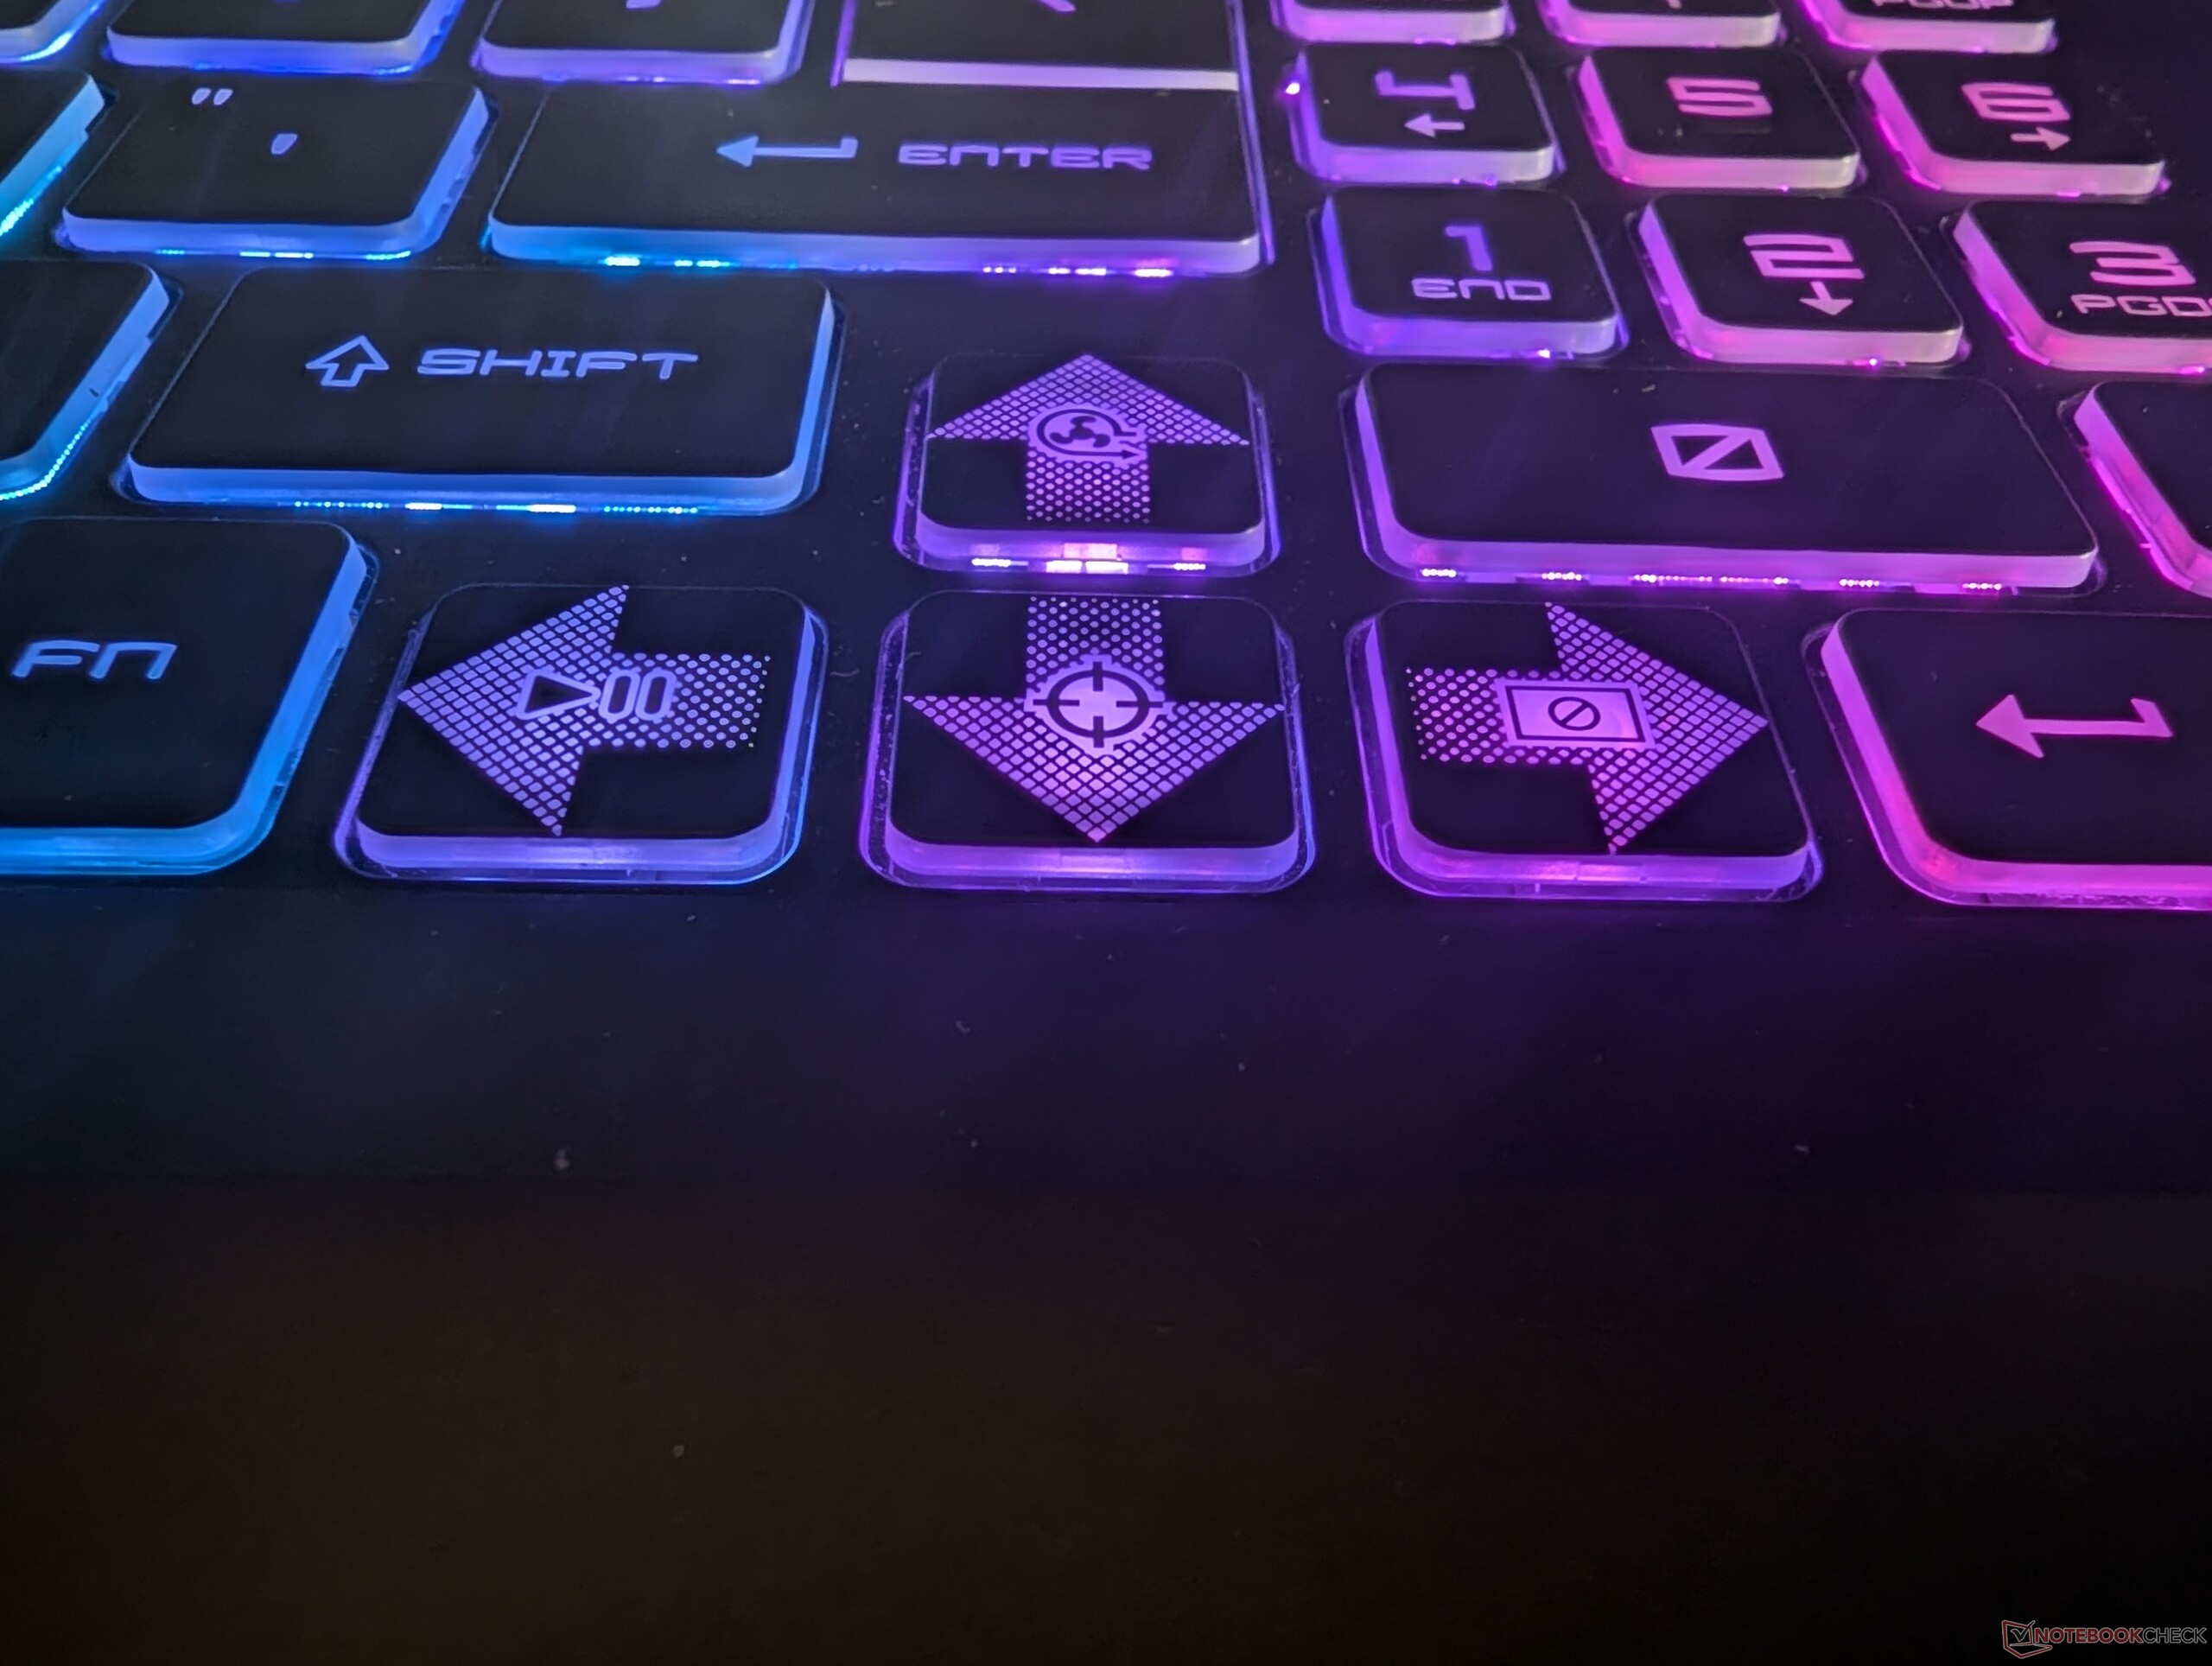
Klawiaturę można wzbogacić o podświetlenie RGB, które można skonfigurować poprzez Mystic Light w MSI Center. Przycisk zasilania i klawisze W/A/S/D są przezroczyste i mogą nie każdemu przypaść do gustu.
Pomimo braku dedykowanego NPU, Sword 16 HX posiada dedykowany klawisz Windows Copilot kosztem prawego Ctrl.
Dedykowany klawisz funkcyjny może być używany do uzyskiwania dostępu do często używanych funkcji, takich jak przełączanie profili w locie, dźwięk, jasność ekranu i jasność podświetlenia klawiatury. MSI Centre umożliwia zamianę klawiszy "Win" i "Fn".
Panel dotykowy
MSI Sword 16 HX obsługuje wszystkie gesty dotykowe systemu Windows. Podczas gdy gładzik jest dość dokładny i dobrze radzi sobie z nadążaniem za palcem nawet na krawędziach, jego odrzucanie dłoni pozostawia wiele do życzenia.
Zbyt mocne naciśnięcie gładzika najczęściej kończy się przypadkowymi kliknięciami. Na szczęście gładzik można całkowicie wyłączyć, naciskając jednocześnie klawisze "Fn" i "F4". Jeśli muszą Państwo korzystać z gładzika jako głównego urządzenia wejściowego, proszę upewnić się, że klikanie odbywa się w dolnej części, ponieważ górna strona nie klika tak łatwo.
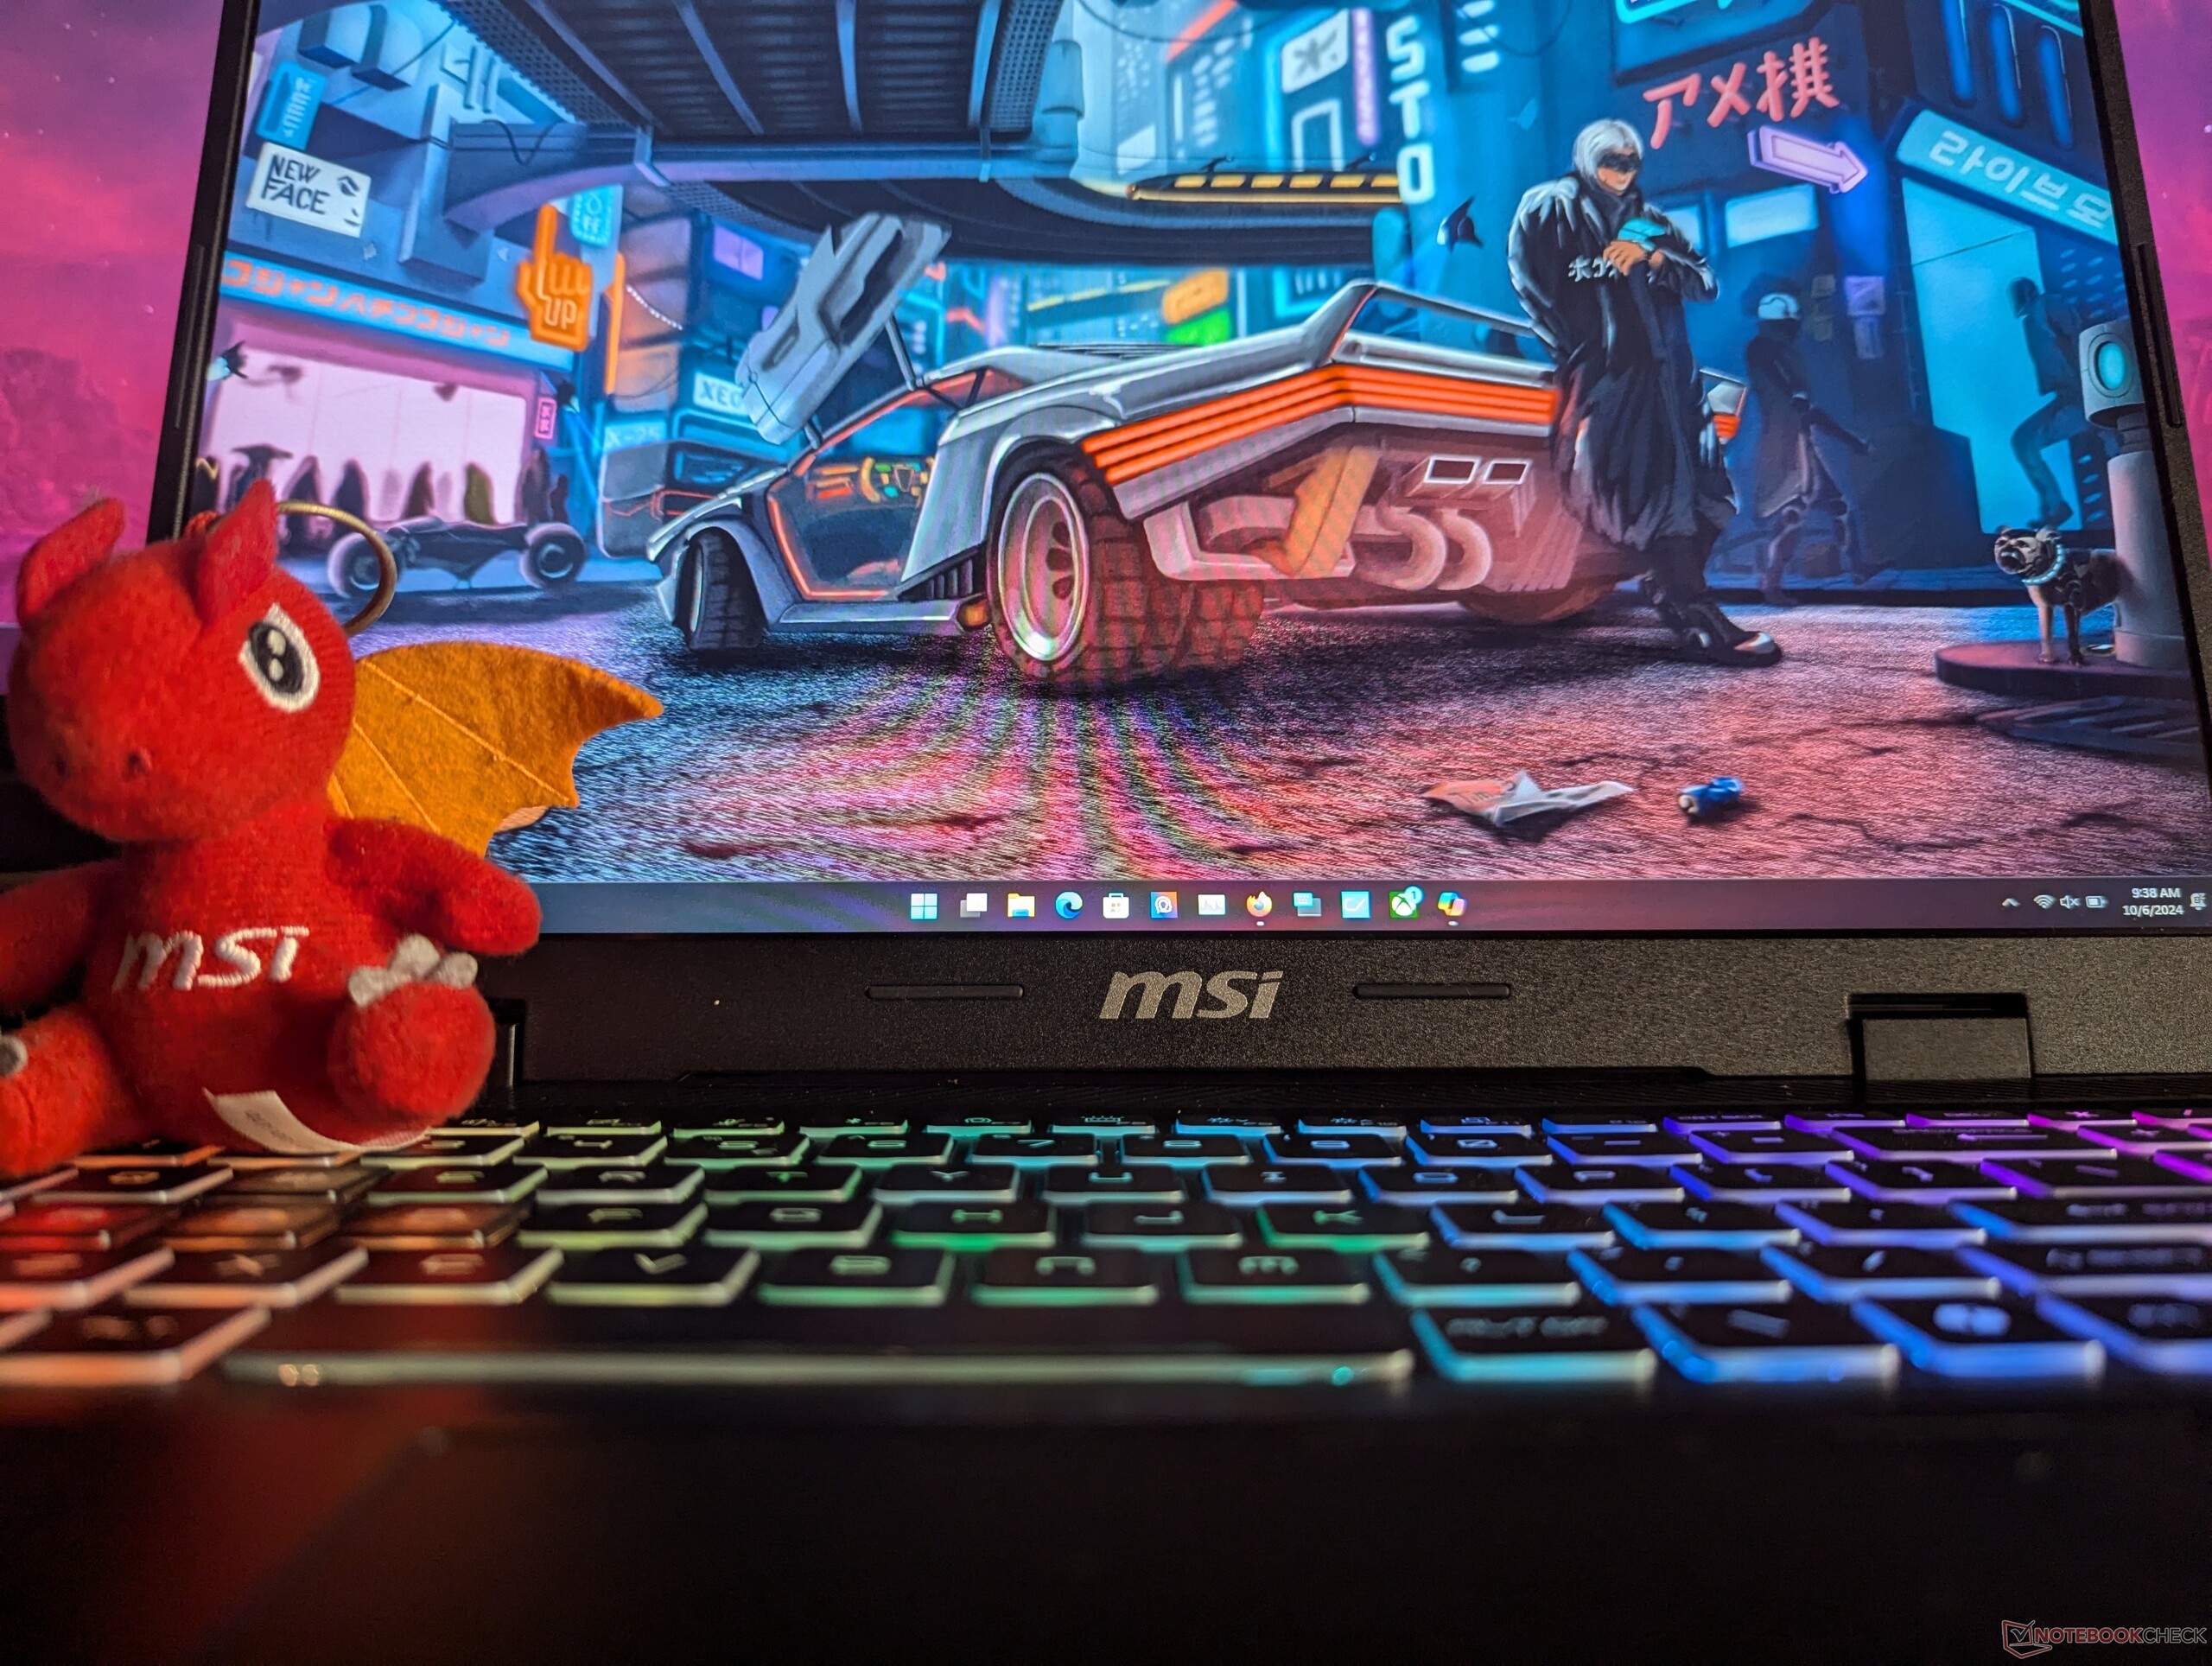
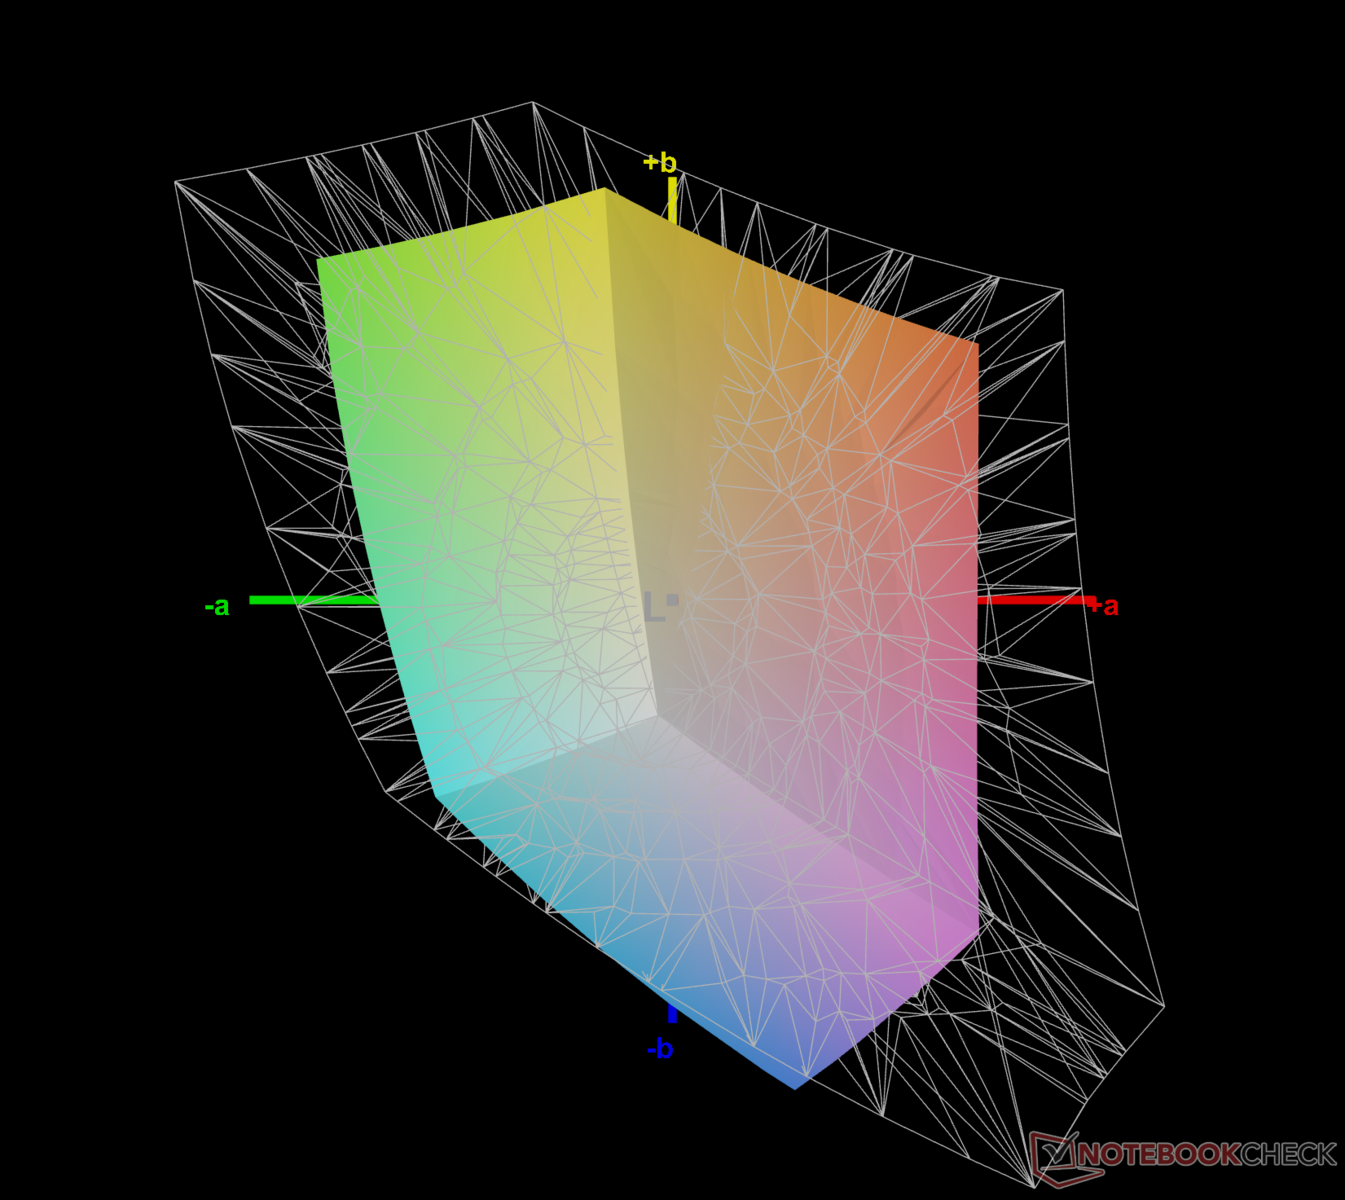
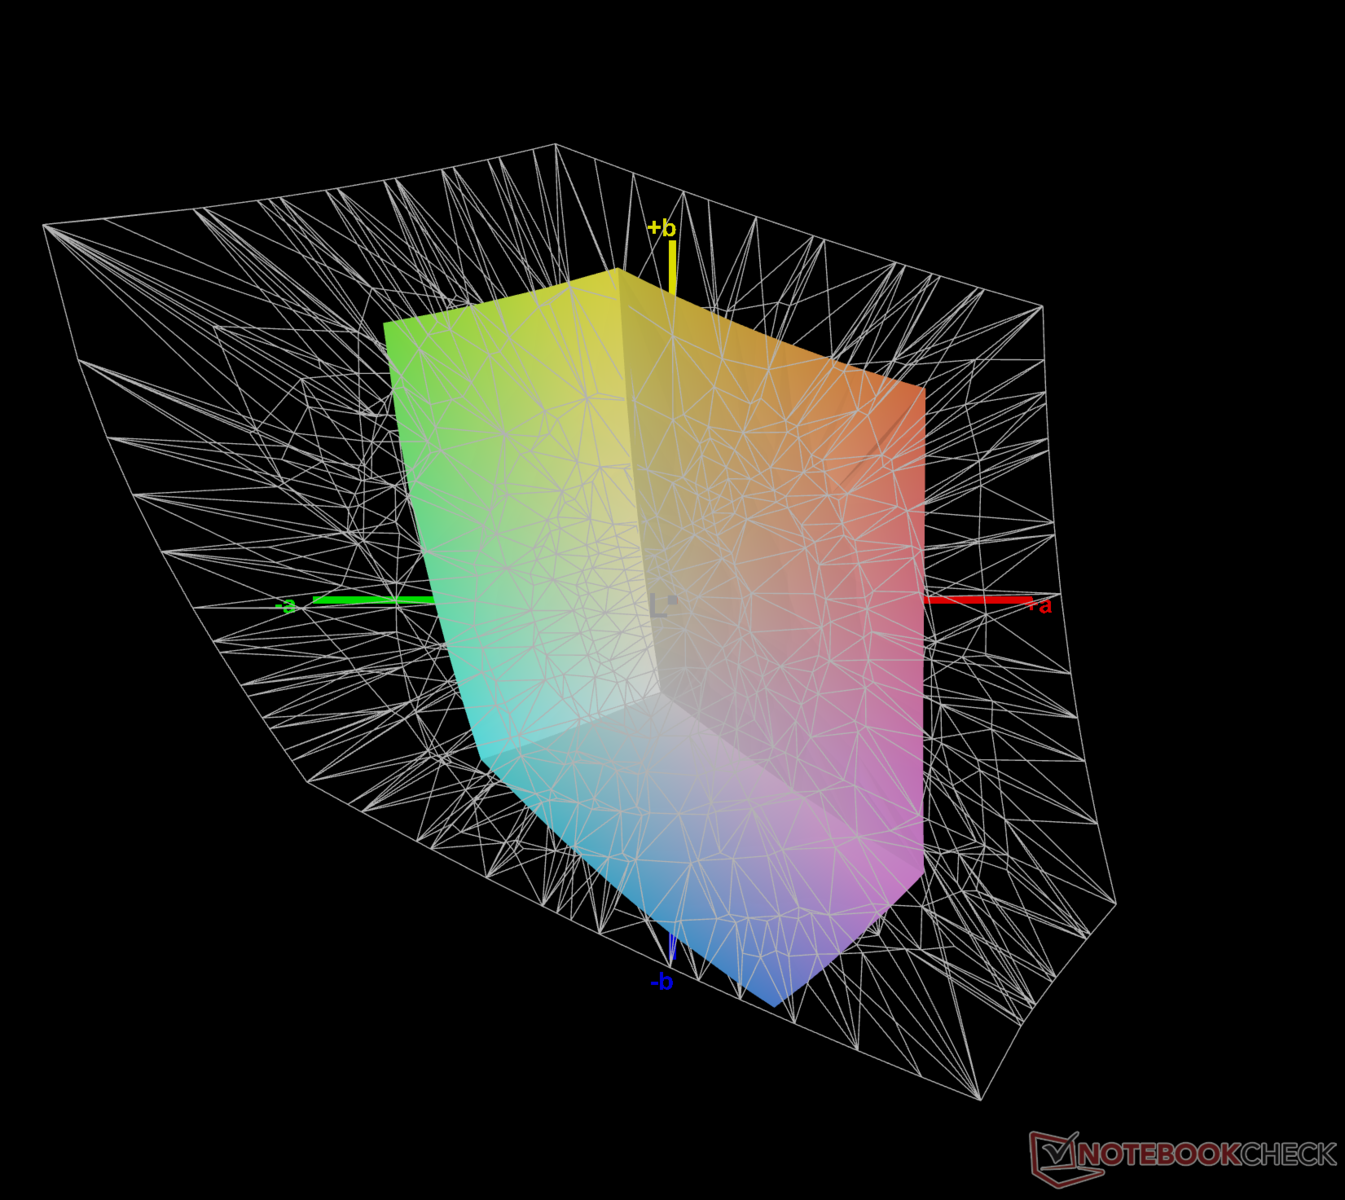
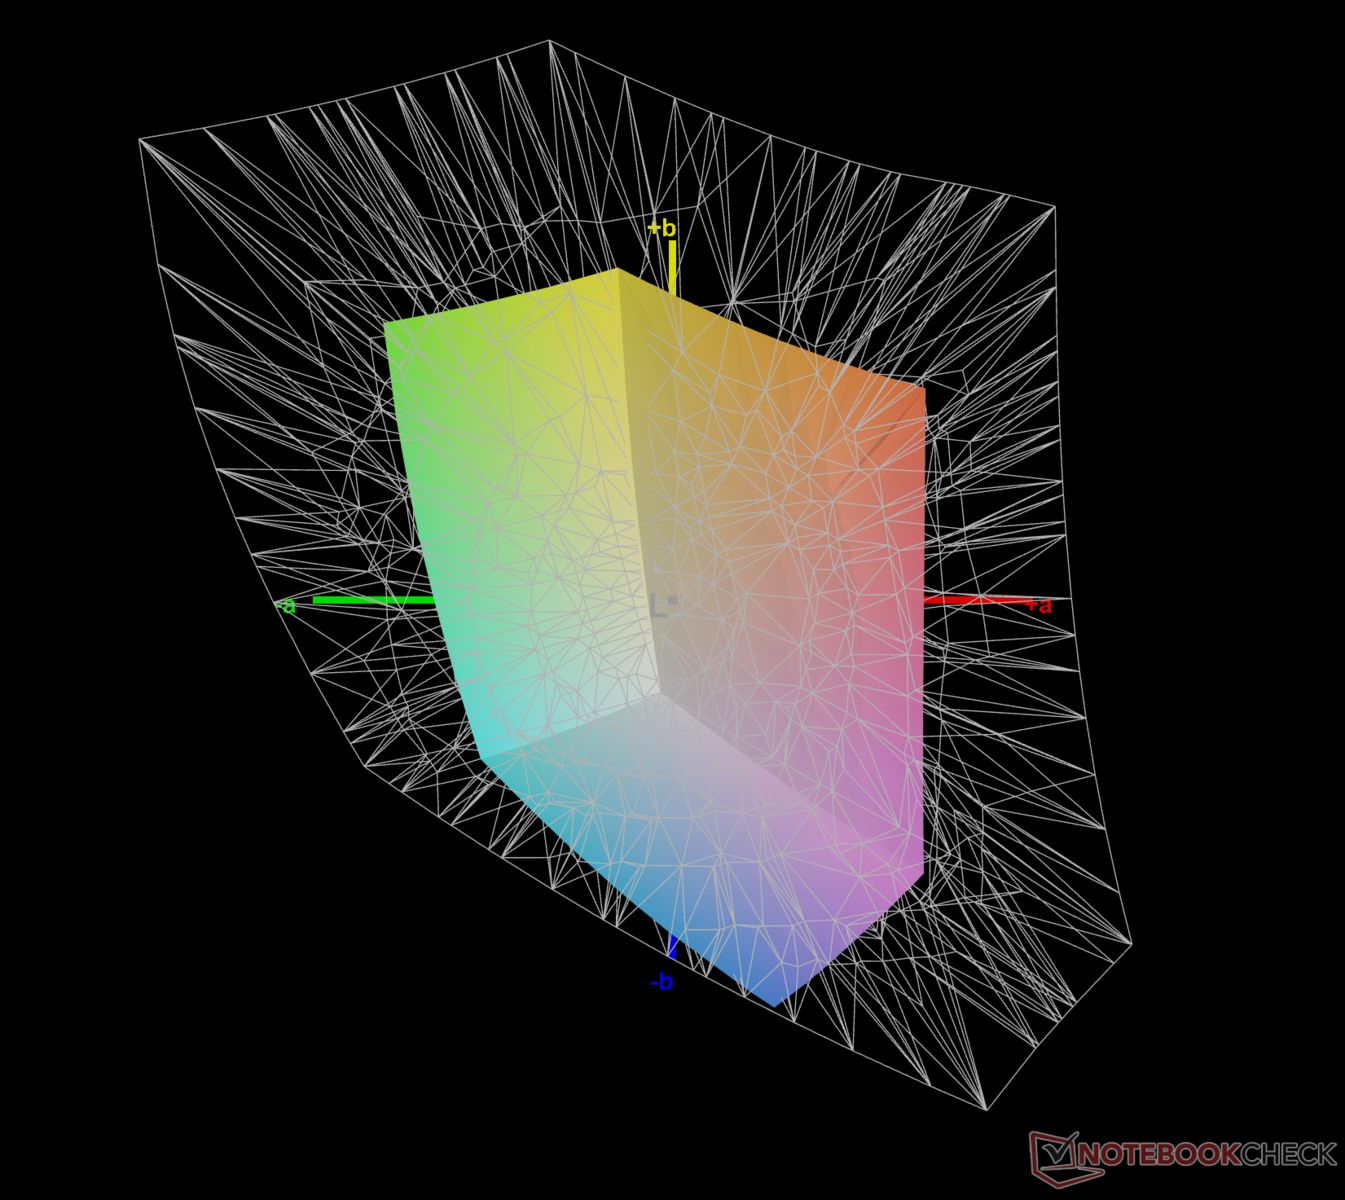
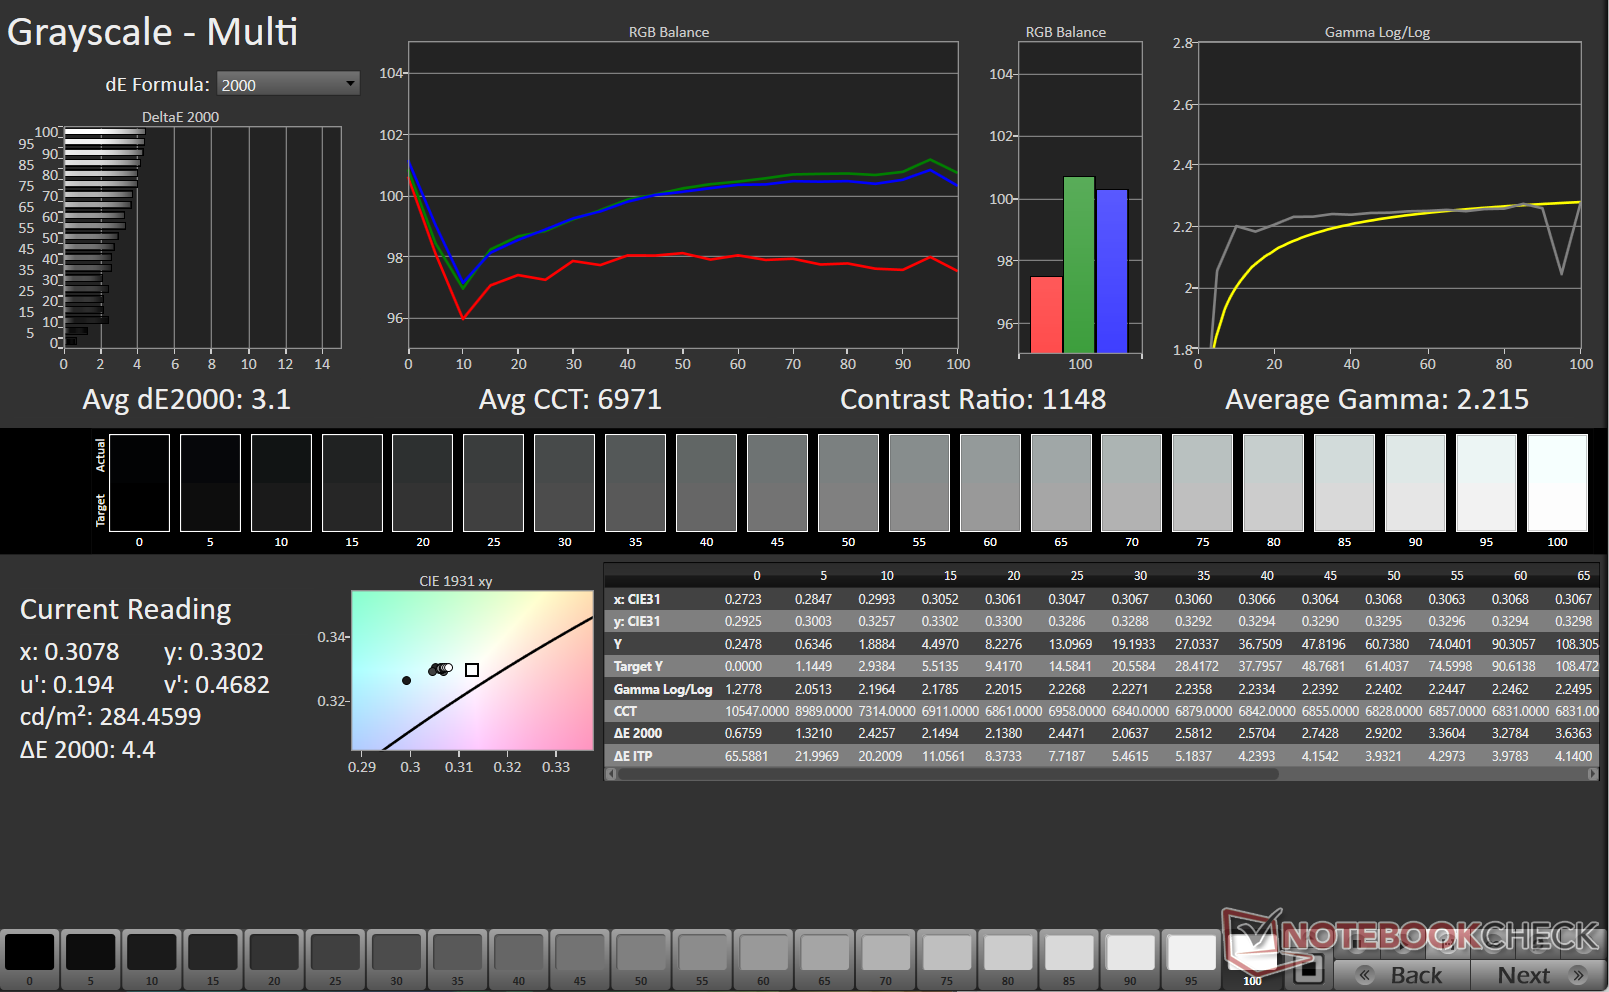
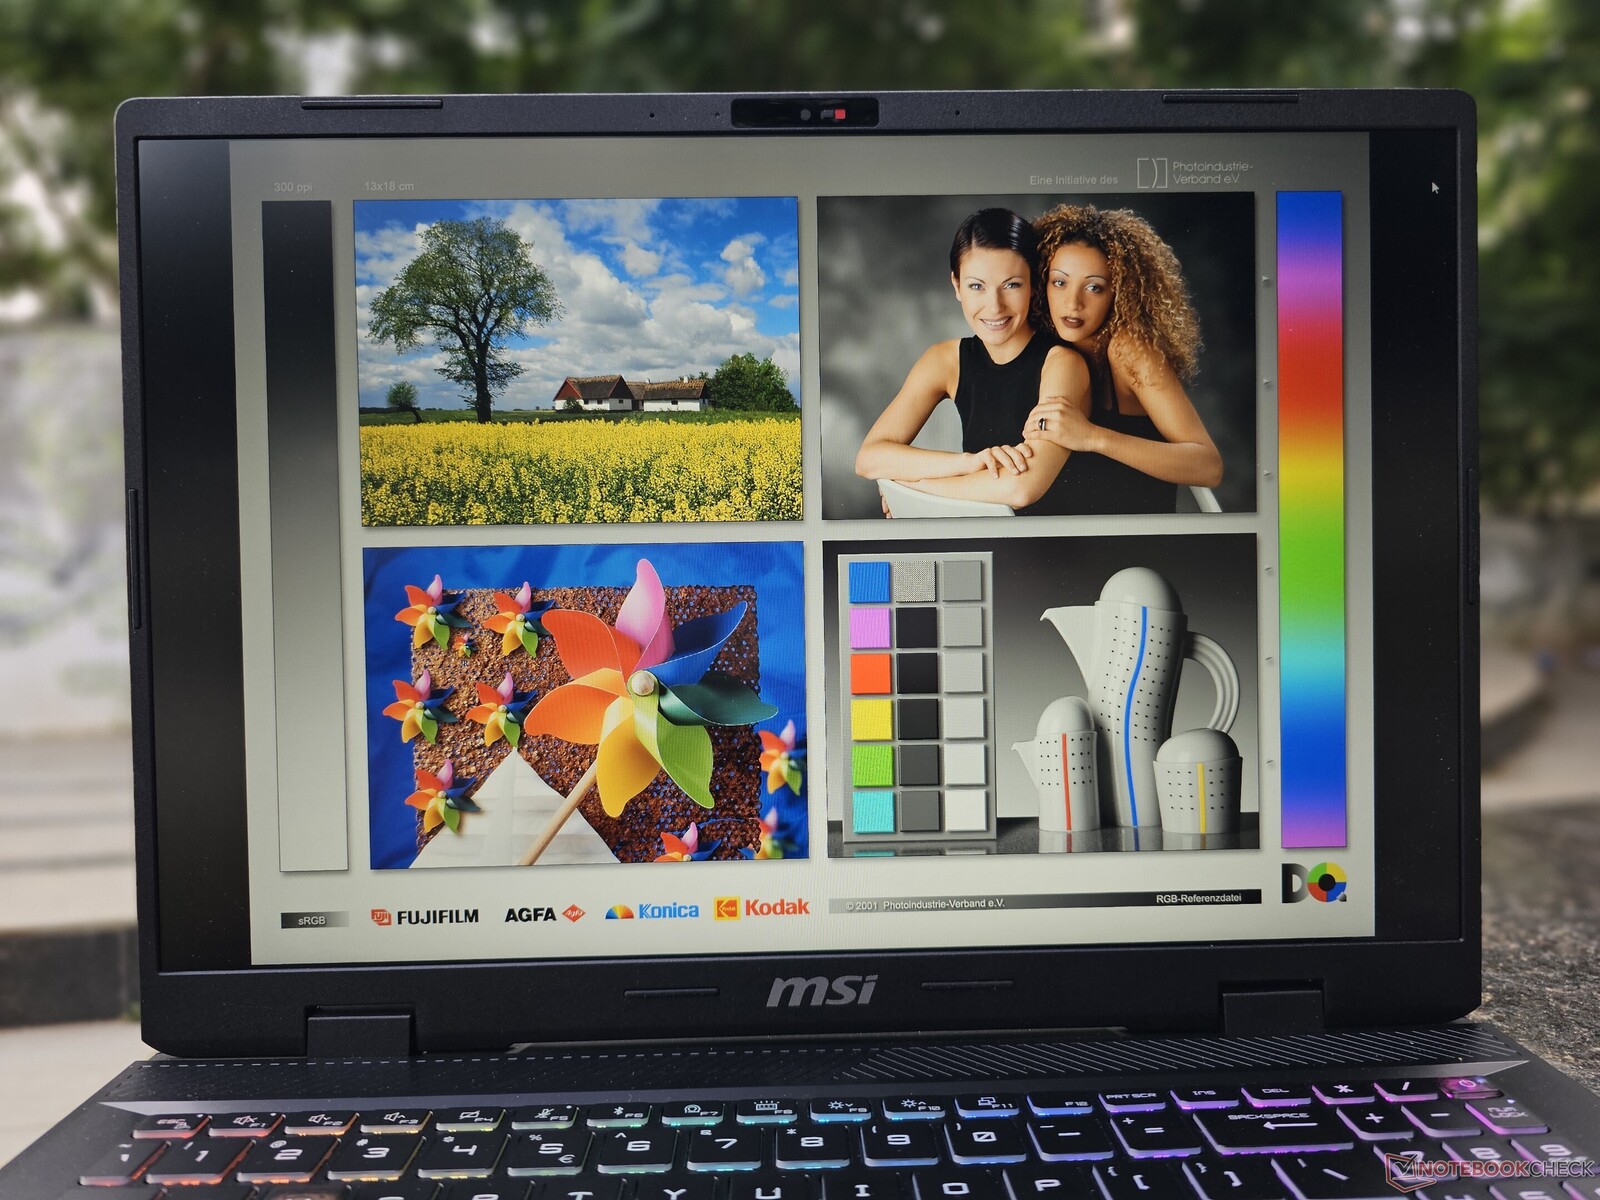
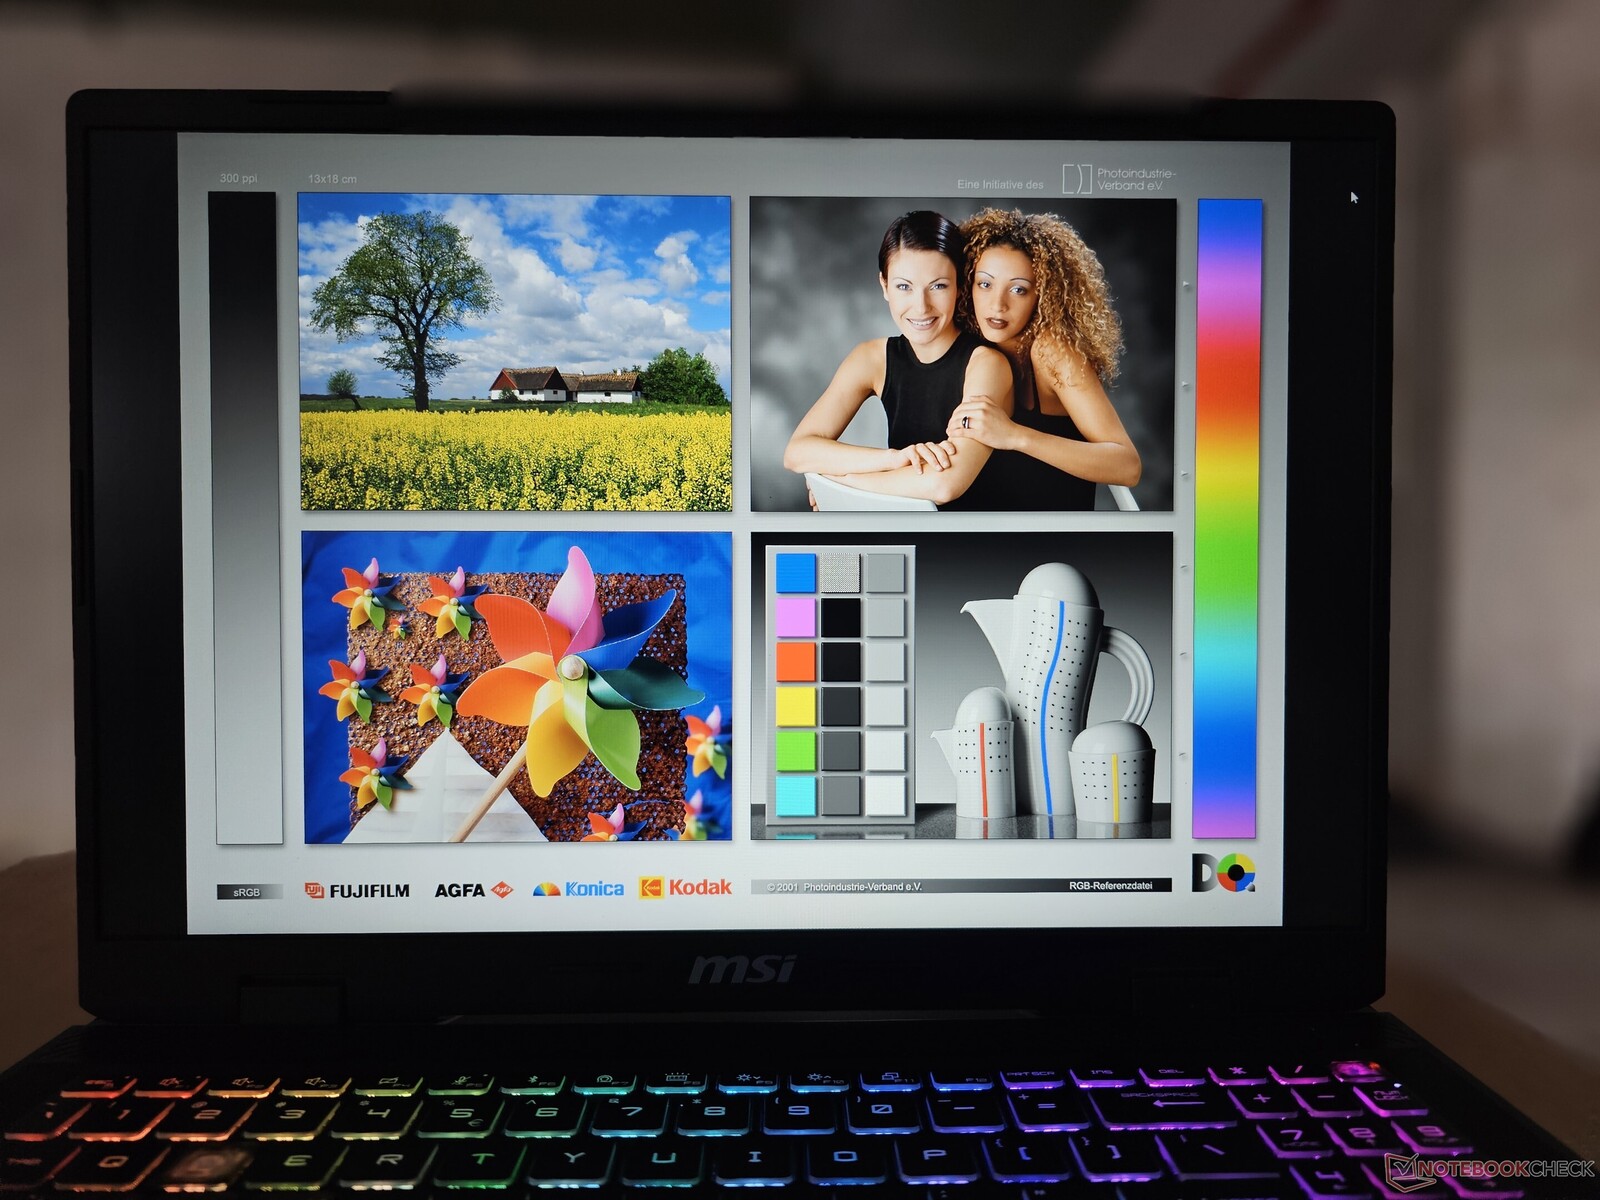
Wyświetlacz: Sub-par ekran ze słabą dokładnością kolorów i słabą jasnością
Nasz wariant Sword 16 HX wykorzystuje ten sam wyświetlacz co MSI Raider GE68 HX 13VF który testowaliśmy w zeszłym roku. Sword 16 HX wyposażony jest w 16-calowy panel FHD+ (1 920 x 1 200) IPS taktowany zegarem 144 Hz. Dostępna jest również wersja o wyższej rozdzielczości z rozdzielczością QHD+ (2560 x 1600) i taką samą częstotliwością odświeżania.
Jego maksymalna jasność sięga 312 nitów, ale nie jest równomierna. Na szczęście matowy wyświetlacz ma minimalne podświetlenie. Jednak czas reakcji od szarego do szarego jest dość wysoki i wynosi 26,32 ms, podobnie jak od białego do białego (17,17 ms).
Prawdopodobnie lepiej będzie podłączyć go do zewnętrznego wyświetlacza, jeśli chcą Państwo grać konkurencyjnie. Wybór panelu przez MSI jest zastanawiający, ponieważ Sword 16 jest więcej niż zdolny do uruchamiania tytułów o wysokiej wierności, tylko po to, aby ich wrażenia z oglądania były tłumione przez jego ekran poniżej normy.


| |||||||||||||||||||||||||
rozświetlenie: 87 %
na akumulatorze: 283 cd/m²
kontrast: 1196:1 (czerń: 0.24 cd/m²)
ΔE Color 4.24 | 0.5-29.43 Ø4.87, calibrated: 3.39
ΔE Greyscale 3.1 | 0.5-98 Ø5.1
43.3% AdobeRGB 1998 (Argyll 2.2.0 3D)
62.2% sRGB (Argyll 2.2.0 3D)
41.8% Display P3 (Argyll 2.2.0 3D)
Gamma: 2.21
| MSI Sword 16 HX B14VGKG Chi Mei N160JME-GTK, IPS, 1920x1200, 16", 144 Hz | HP Omen 17-db0079ng BOE0B67, IPS, 2560x1440, 17.3", 240 Hz | Lenovo Legion 7 16 IRX G9 MNG007ZA1-2, IPS, 3200x2000, 16", 165 Hz | Acer Predator Helios Neo 16 (2024) Chi Mei N160GME-GTB, LED, 2560x1600, 16", 240 Hz | Alienware m16 R2 BOE NE16NYH, IPS, 2560x1600, 16", 240 Hz | Asus ROG Strix G17 G713PI BOE0B69, IPS, 2560x1440, 17.3", 240 Hz | HP Victus 16-r0077ng CMN162D, IPS, 1920x1080, 16.1", 144 Hz | |
|---|---|---|---|---|---|---|---|
| Display | 56% | 96% | 96% | 65% | 98% | 59% | |
| Display P3 Coverage | 41.8 | 66.2 58% | 95 127% | 95.9 129% | 71 70% | 98.3 135% | 66.7 60% |
| sRGB Coverage | 62.2 | 95.5 54% | 100 61% | 99.8 60% | 100 61% | 100 61% | 98 58% |
| AdobeRGB 1998 Coverage | 43.3 | 68.1 57% | 87.2 101% | 86.4 100% | 71.4 65% | 85.9 98% | 69 59% |
| Response Times | 49% | 52% | 65% | 64% | 65% | 51% | |
| Response Time Grey 50% / Grey 80% * | 26.32 ? | 14.4 ? 45% | 14.4 ? 45% | 5 ? 81% | 5.7 ? 78% | 5.3 ? 80% | 13.3 ? 49% |
| Response Time Black / White * | 17.17 ? | 8.3 ? 52% | 7.2 ? 58% | 8.8 ? 49% | 8.7 ? 49% | 8.6 ? 50% | 8.2 ? 52% |
| PWM Frequency | |||||||
| Screen | 24% | 32% | 33% | 29% | 26% | 31% | |
| Brightness middle | 287 | 363 26% | 412 44% | 521 82% | 345.8 20% | 327 14% | 308 7% |
| Brightness | 289 | 341 18% | 396 37% | 506 75% | 337 17% | 320 11% | 285 -1% |
| Brightness Distribution | 87 | 84 -3% | 89 2% | 85 -2% | 87 0% | 89 2% | 85 -2% |
| Black Level * | 0.24 | 0.38 -58% | 0.43 -79% | 0.44 -83% | 0.3 -25% | 0.38 -58% | 0.25 -4% |
| Contrast | 1196 | 955 -20% | 958 -20% | 1184 -1% | 1153 -4% | 861 -28% | 1232 3% |
| Colorchecker dE 2000 * | 4.24 | 1.74 59% | 0.9 79% | 1.74 59% | 1.99 53% | 1.01 76% | 1.3 69% |
| Colorchecker dE 2000 max. * | 21.42 | 5.39 75% | 2 91% | 3.88 82% | 3.52 84% | 4.01 81% | 2.76 87% |
| Colorchecker dE 2000 calibrated * | 3.39 | 1.43 58% | 0.6 82% | 0.52 85% | 0.62 82% | 0.41 88% | 0.92 73% |
| Greyscale dE 2000 * | 3.1 | 1.3 58% | 1.4 55% | 3 3% | 2.1 32% | 1.6 48% | 1.7 45% |
| Gamma | 2.21 100% | 2.235 98% | 2.23 99% | 2.164 102% | 2.32 95% | 2.168 101% | 2.167 102% |
| CCT | 6971 93% | 6346 102% | 6731 97% | 6816 95% | 6369 102% | 6659 98% | 6767 96% |
| Całkowita średnia (program / ustawienia) | 43% /
34% | 60% /
49% | 65% /
51% | 53% /
42% | 63% /
47% | 47% /
40% |
* ... im mniej tym lepiej
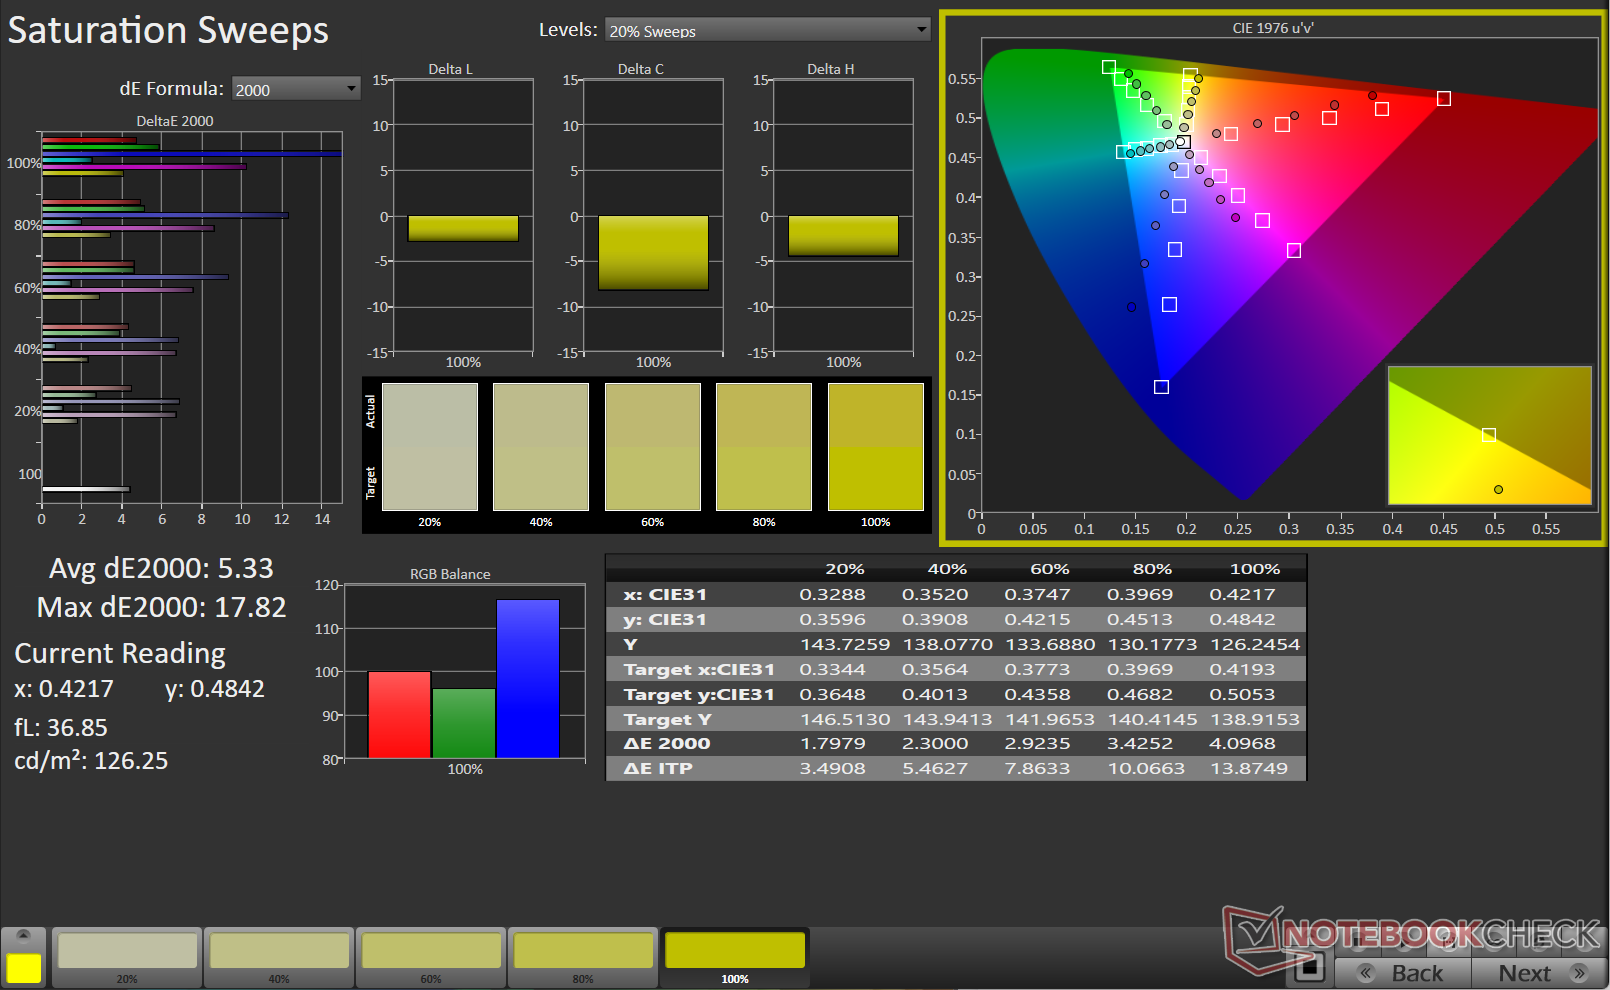
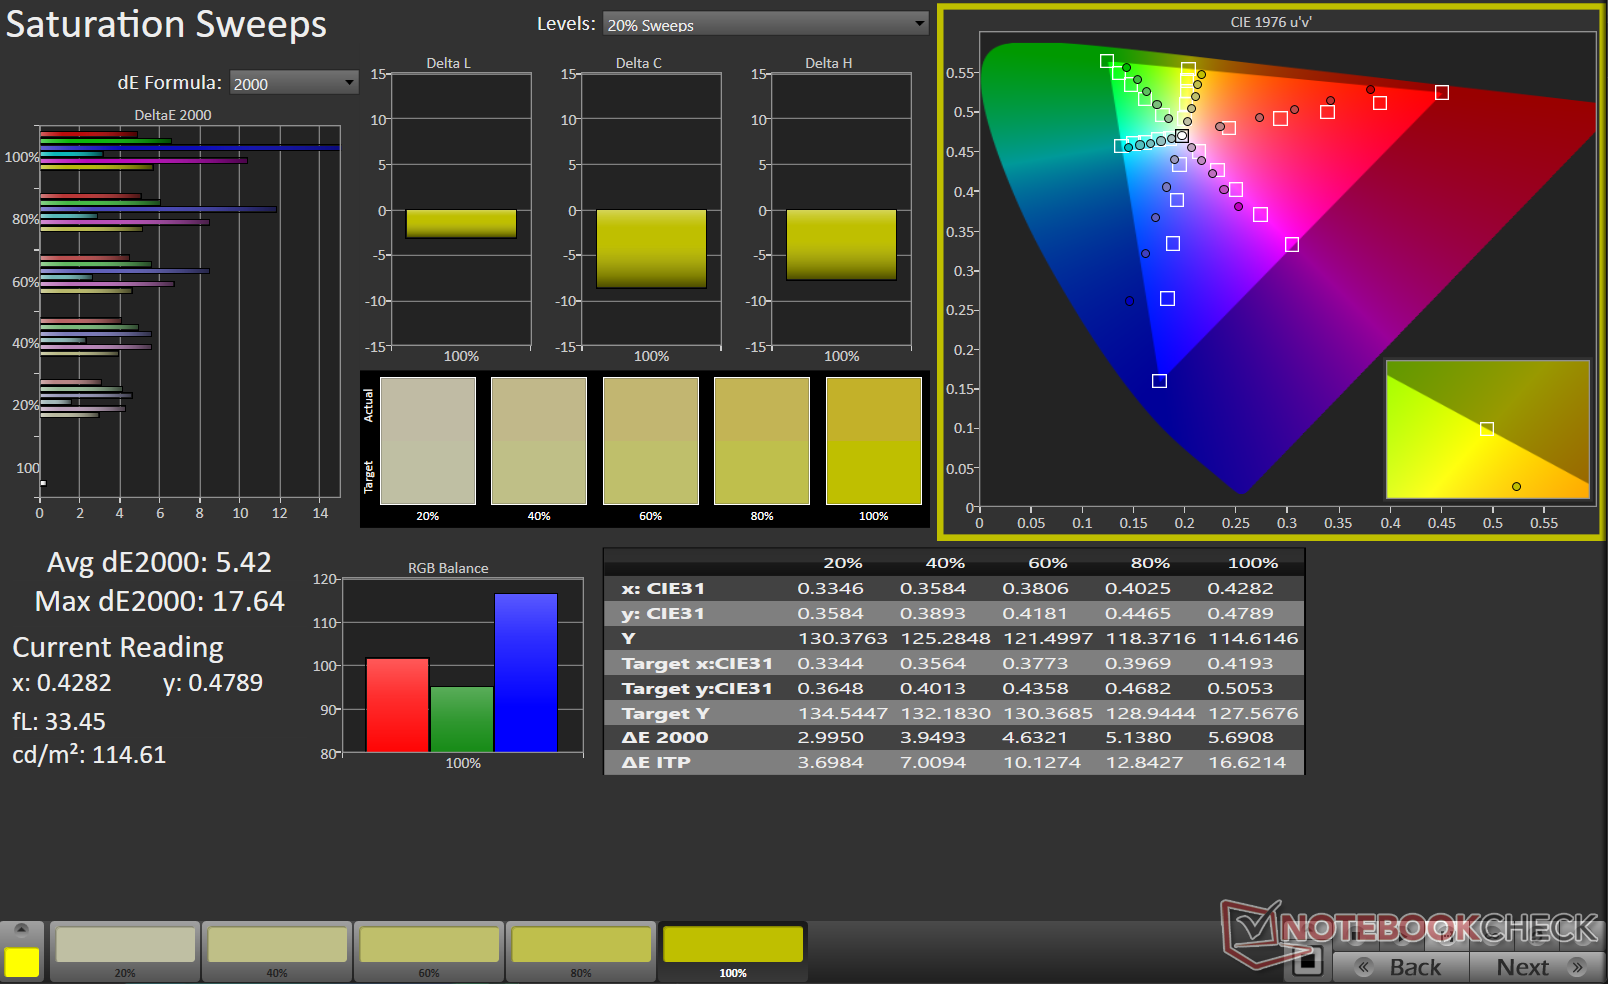
Niestety, dokładność odwzorowania kolorów nie należy do mocnych stron Sword 16, o czym świadczy słabe pokrycie gam kolorów sRGB, Adobe RGB i Display P3.
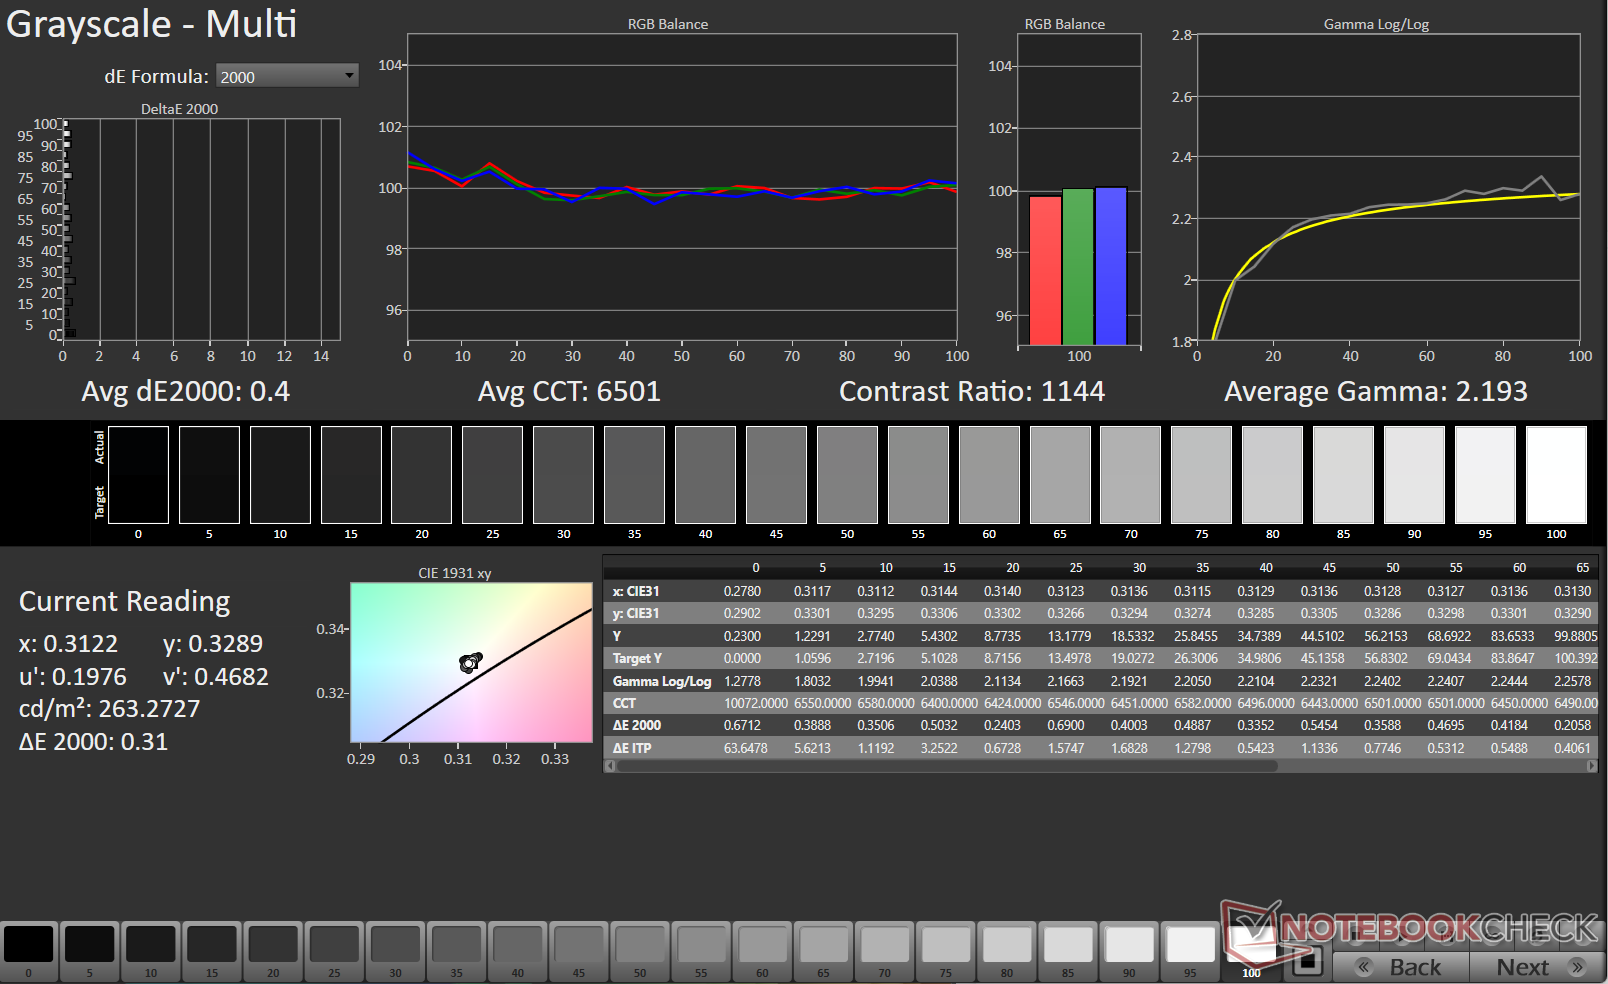
Używając kalibracji kolorów Portrait Displays Calman ze spektrofotometrem X-Rite i1Basic Pro 3, mogliśmy uzyskać zmniejszenie deltaE 2000 w skali szarości. Jednak nawet po kalibracji, wartości ColorChecker nie uległy znacznej poprawie.


Wyświetl czasy reakcji
| ↔ Czas reakcji od czerni do bieli | ||
|---|---|---|
| 17.17 ms ... wzrost ↗ i spadek ↘ łącznie | ↗ 9.26 ms wzrost | 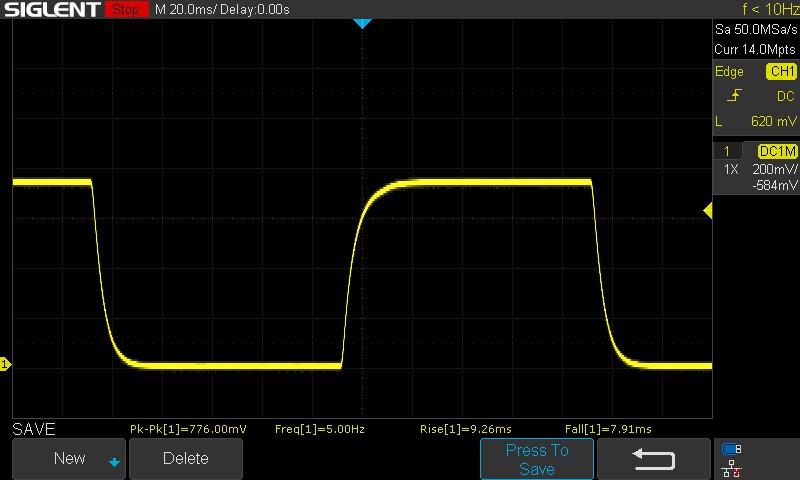 |
| ↘ 7.91 ms upadek | ||
| W naszych testach ekran wykazuje dobry współczynnik reakcji, ale może być zbyt wolny dla graczy rywalizujących ze sobą. Dla porównania, wszystkie testowane urządzenia wahają się od 0.1 (minimum) do 240 (maksimum) ms. » 36 % wszystkich urządzeń jest lepszych. Oznacza to, że zmierzony czas reakcji jest lepszy od średniej wszystkich testowanych urządzeń (20.8 ms). | ||
| ↔ Czas reakcji 50% szarości do 80% szarości | ||
| 26.32 ms ... wzrost ↗ i spadek ↘ łącznie | ↗ 13.37 ms wzrost | 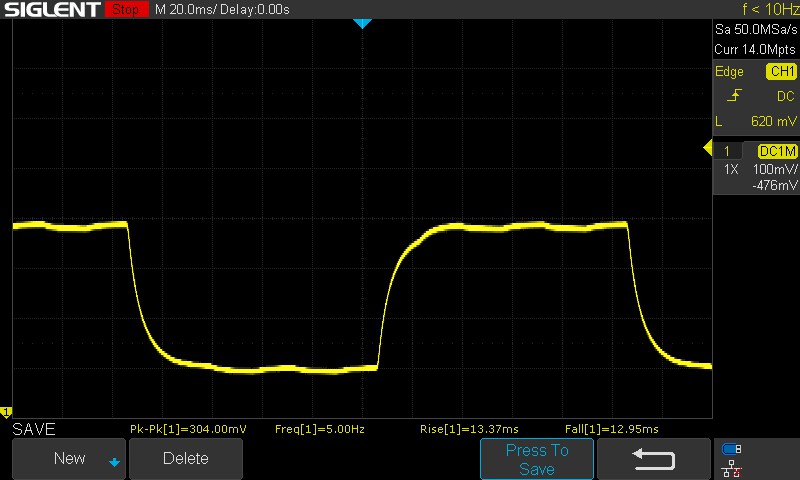 |
| ↘ 12.95 ms upadek | ||
| W naszych testach ekran wykazuje stosunkowo powolne tempo reakcji i może być zbyt wolny dla graczy. Dla porównania, wszystkie testowane urządzenia wahają się od 0.165 (minimum) do 636 (maksimum) ms. » 33 % wszystkich urządzeń jest lepszych. Oznacza to, że zmierzony czas reakcji jest lepszy od średniej wszystkich testowanych urządzeń (32.5 ms). | ||
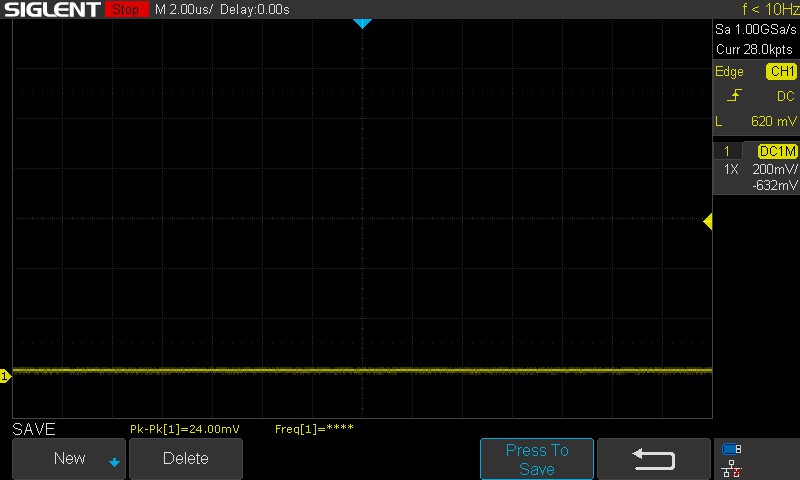
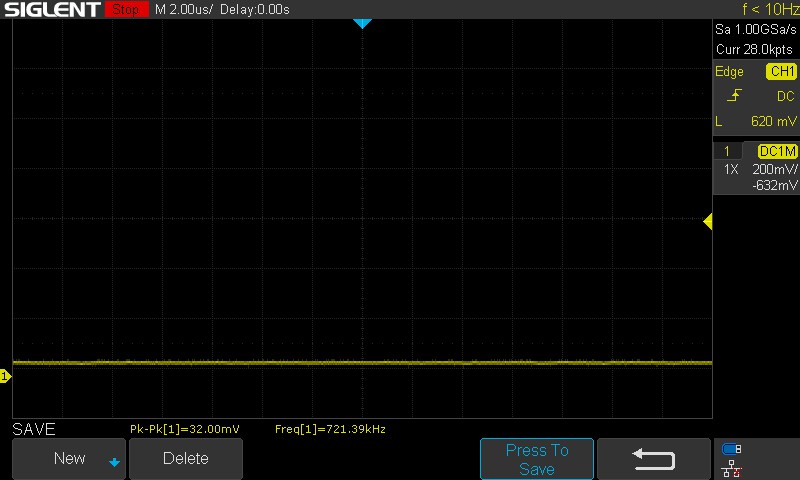
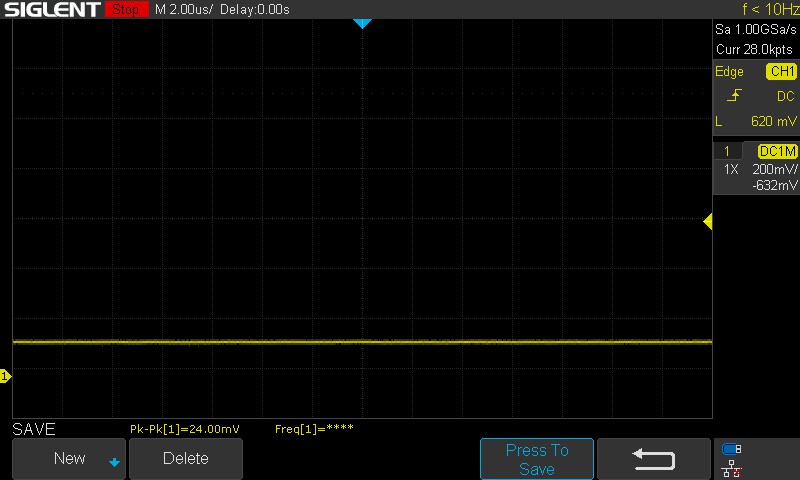
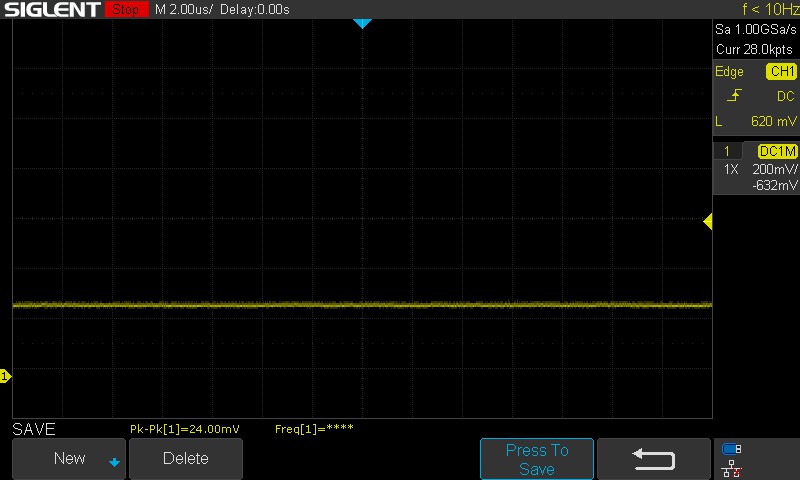
Migotanie ekranu / PWM (modulacja szerokości impulsu)
| Migotanie ekranu/nie wykryto PWM | ≤ 100 % ustawienia jasności | 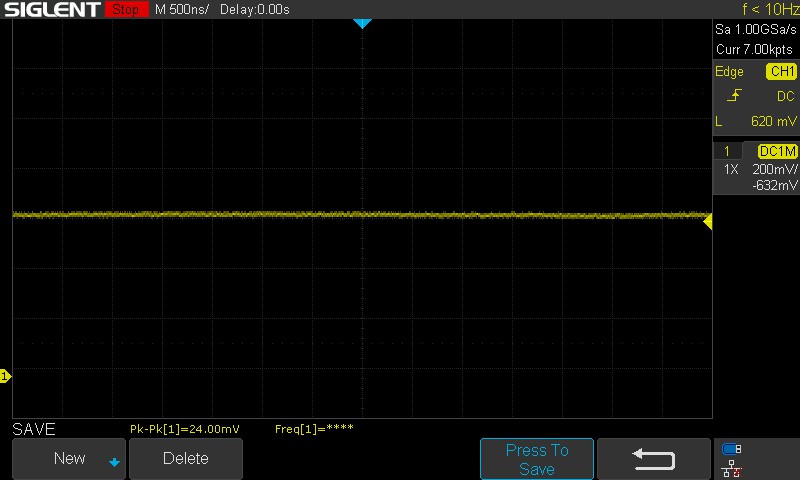 | |
Dla porównania: 53 % wszystkich testowanych urządzeń nie używa PWM do przyciemniania wyświetlacza. Jeśli wykryto PWM, zmierzono średnio 8516 (minimum: 5 - maksimum: 343500) Hz. | |||
Nie wykryliśmy żadnego PWM we wszystkich testowanych poziomach jasności.


Aby uzyskać więcej informacji, proszę zapoznać się z naszym artykułem "Dlaczego PWM to taki ból głowy?", a także naszą Tabela rankingowa PWM w której znajdą Państwo porównanie zmierzonego PWM we wszystkich recenzowanych urządzeniach.
Ekran MSI Sword 16 jest wystarczająco jasny do użytku na zewnątrz. Odradzamy jednak korzystanie z niego w bezpośrednim świetle słonecznym, ponieważ może ono łatwo przytłoczyć ekran laptopa.

Panel IPS zapewnia przyzwoite kąty widzenia, ale zauważalna jest utrata szczegółów ze względu na mniej niż idealną dokładność kolorów panelu.
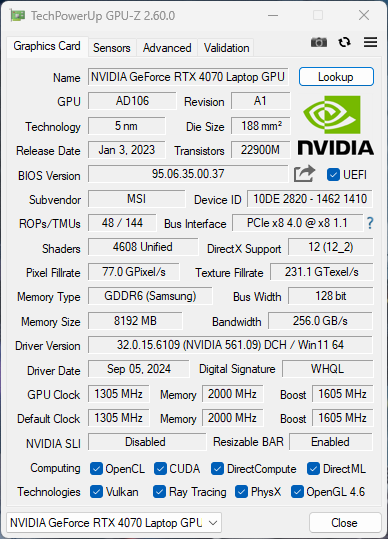
Wydajność: Core i7-14700HX i GeForce RTX 4070 tworzą potężne połączenie
Do Państwa dyspozycji oddajemy wyposażony wariant MSI Sword 16 HX z kartą graficzną Nvidia GeForce TX 4070 Laptop GPU i procesorem Intel Core i7-14700HX. Inne możliwe konfiguracje zachowują ten sam procesor, ale zastępują GPU kartą RTX 4060 i RTX 4050.
Podczas gdy wielu (słusznie) uznałoby 8 GB pamięci VRAM za nieco za mało, nadal można na niej grać w rozdzielczości do 4K przy kilku kompromisach.
Warunki testowania
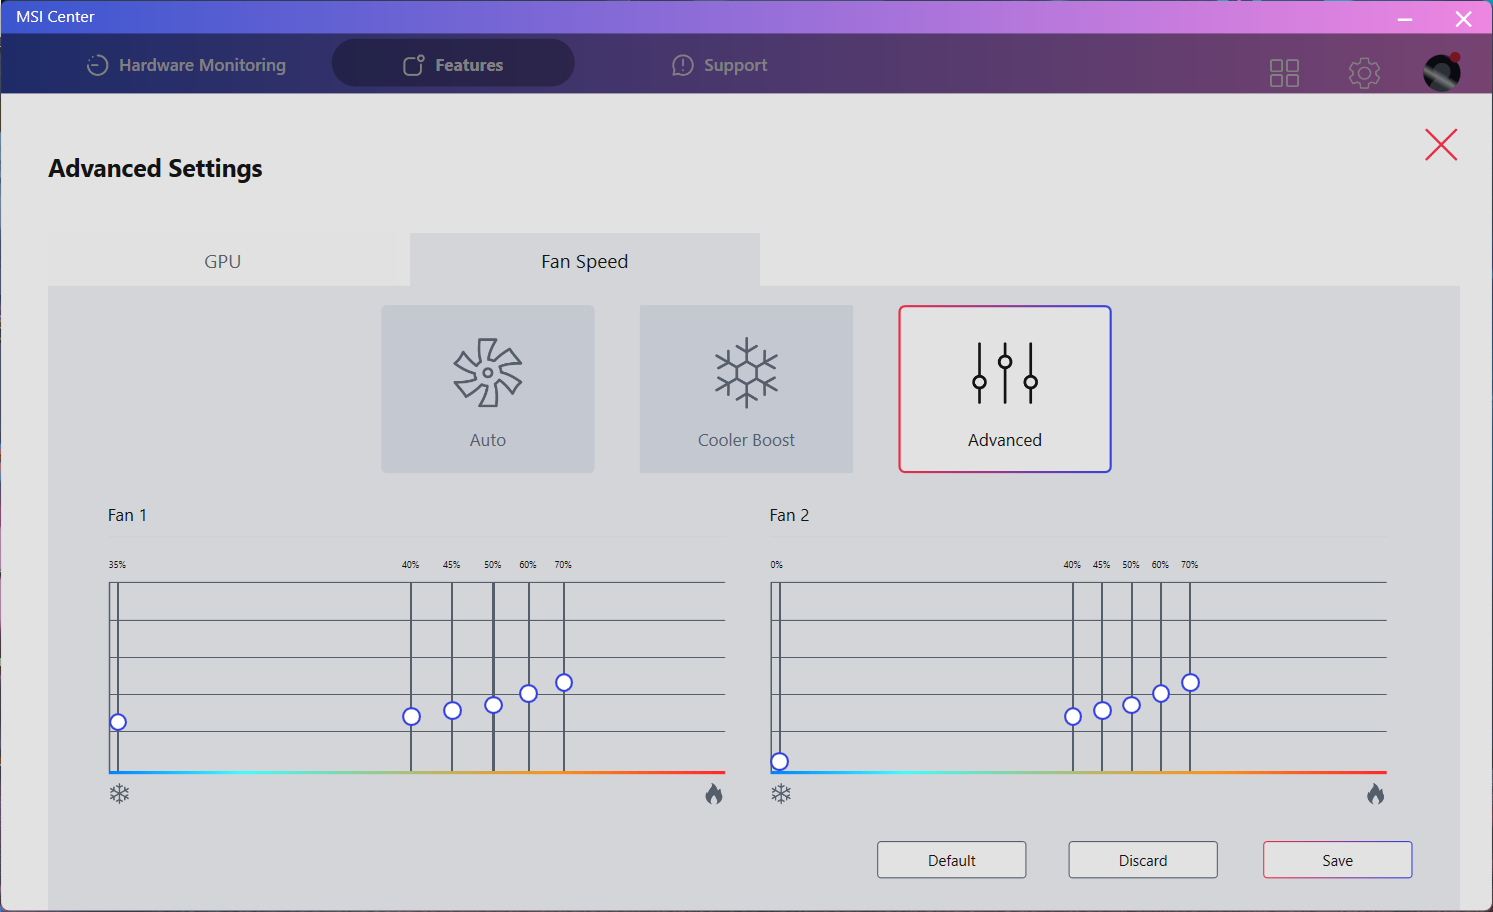
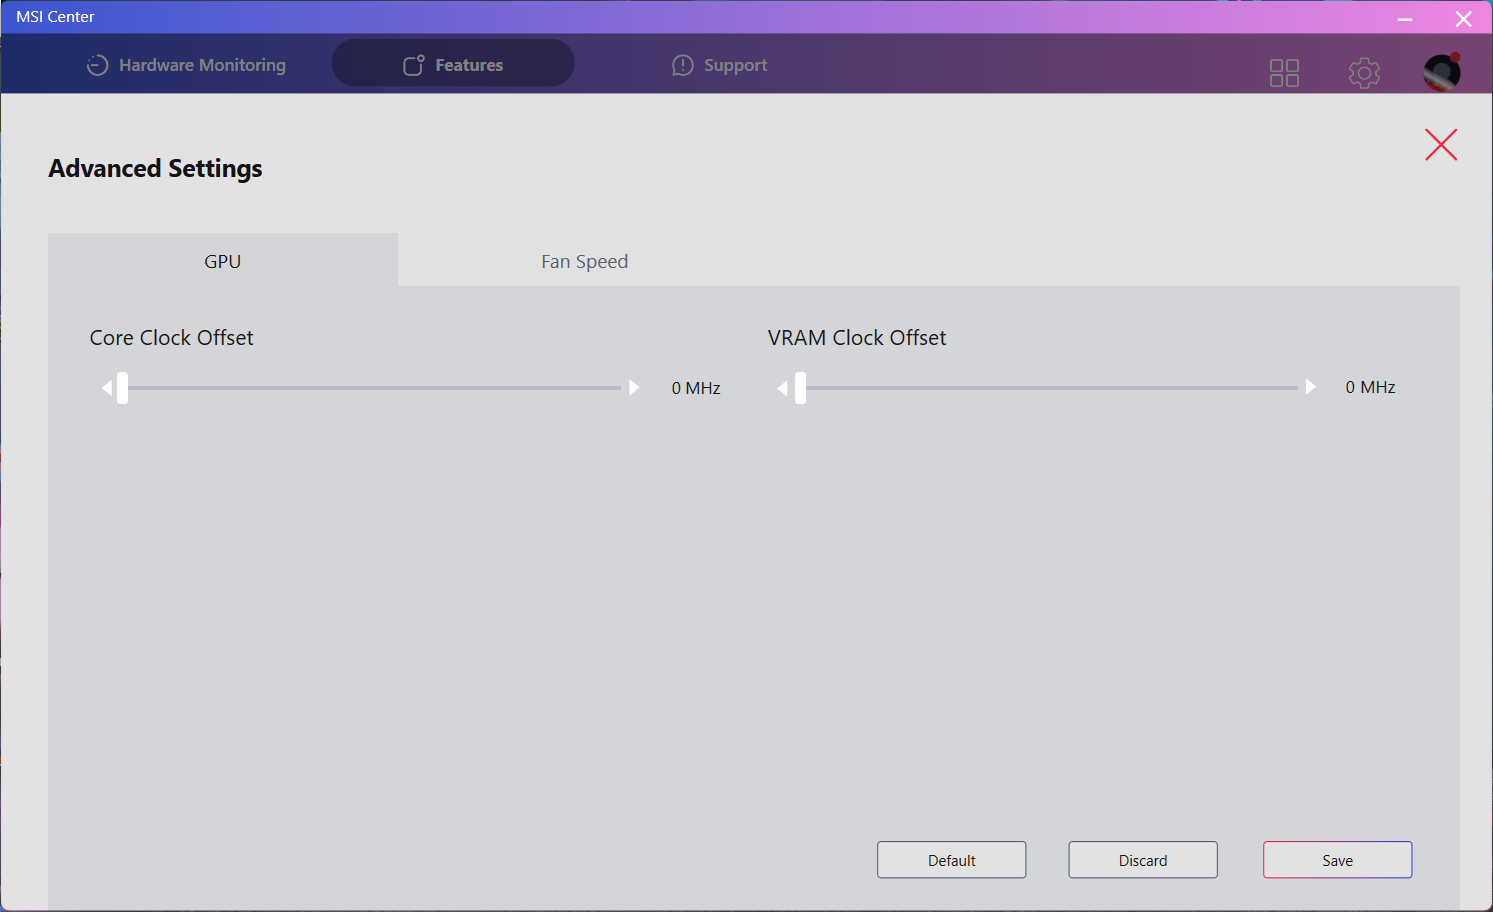
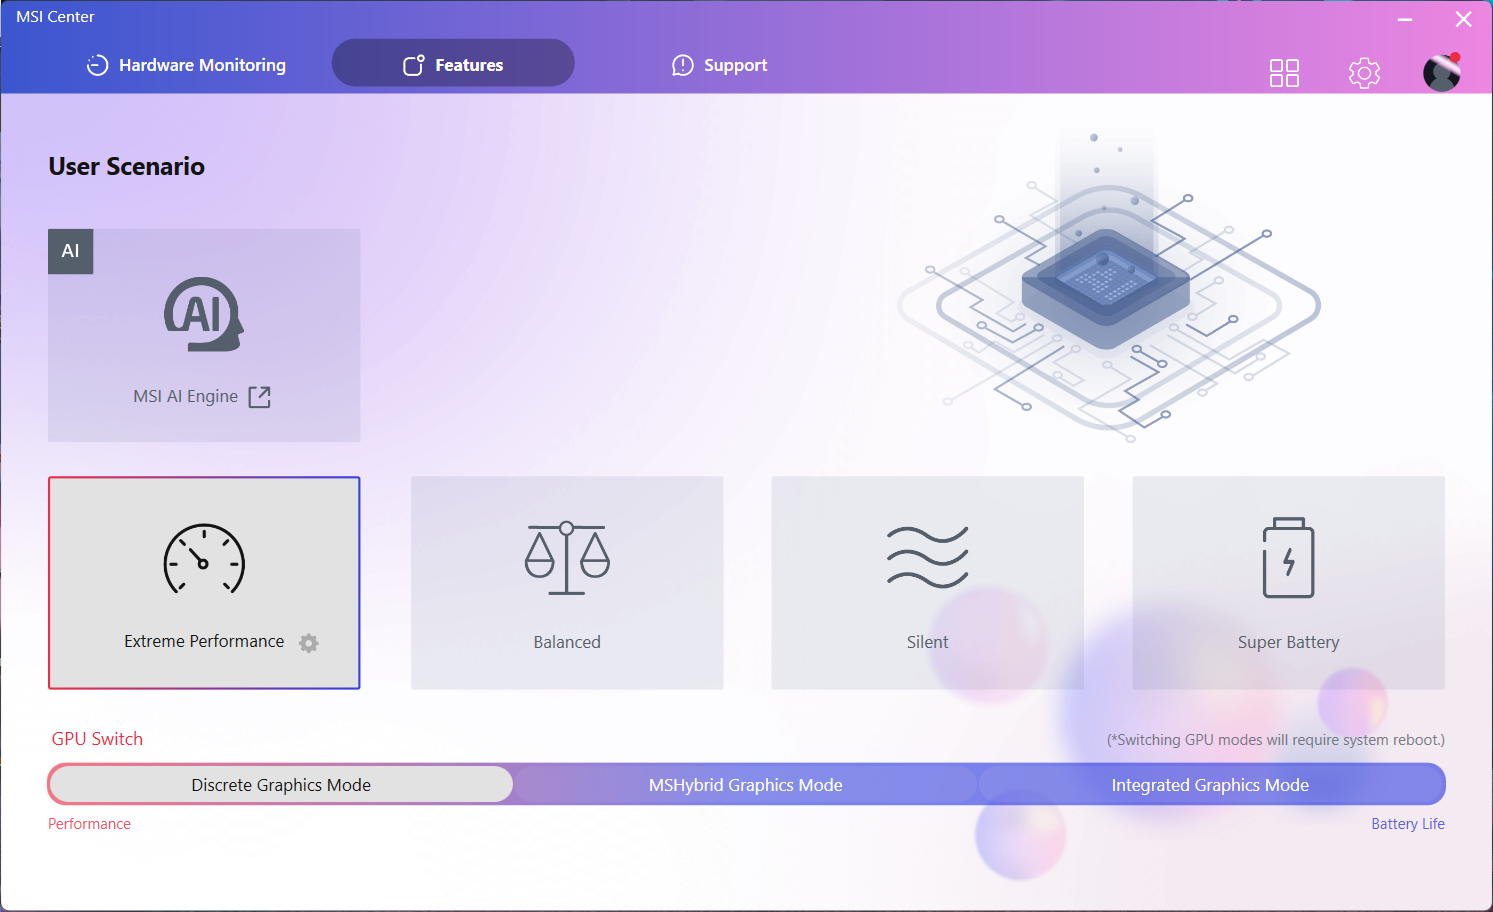
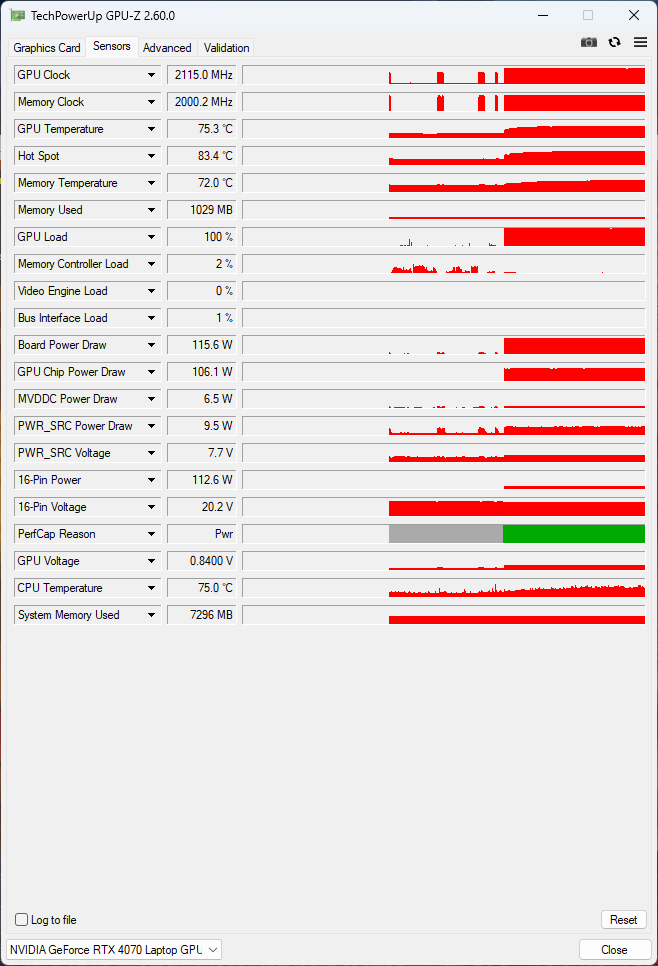
MSI oferuje cztery tryby wydajności Sword 16: Extreme Performance, Balanced, Silent i Super Battery. Użyliśmy trybu Extreme Performance do wszystkich naszych testów w grach i Super Battery do testów żywotności baterii. Wartości PL1 i PL2 dla procesora zostały ograniczone odpowiednio do 100 i 120 watów, podczas gdy GPU jest reklamowane do 115 watów. Przełączanie między profilami można wykonywać ręcznie za pośrednictwem MSI Center lub naciskając klawisze "Fn" i "F7".
| Tryb wydajności | PL1 | PL2 | CinebenchR15 | CinebenchR15 (25 pętli) |
|---|---|---|---|---|
| Ekstremalna wydajność | 100 | 120 | 3,264 (100%) | 3,198 (100%) |
| Balanced | 60 | 80 | 2,978 (-8.76%) | 2,728 (-14%) |
| Cichy | 45 | 60 | 2 198 (-32%) | 1 361 (-57%) |
Procesor
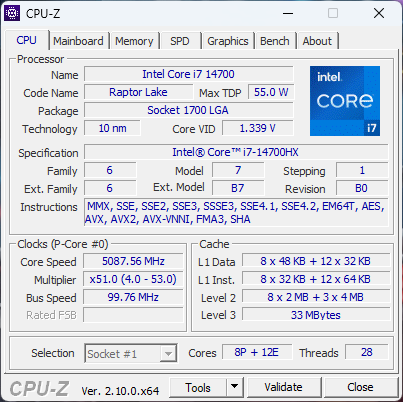
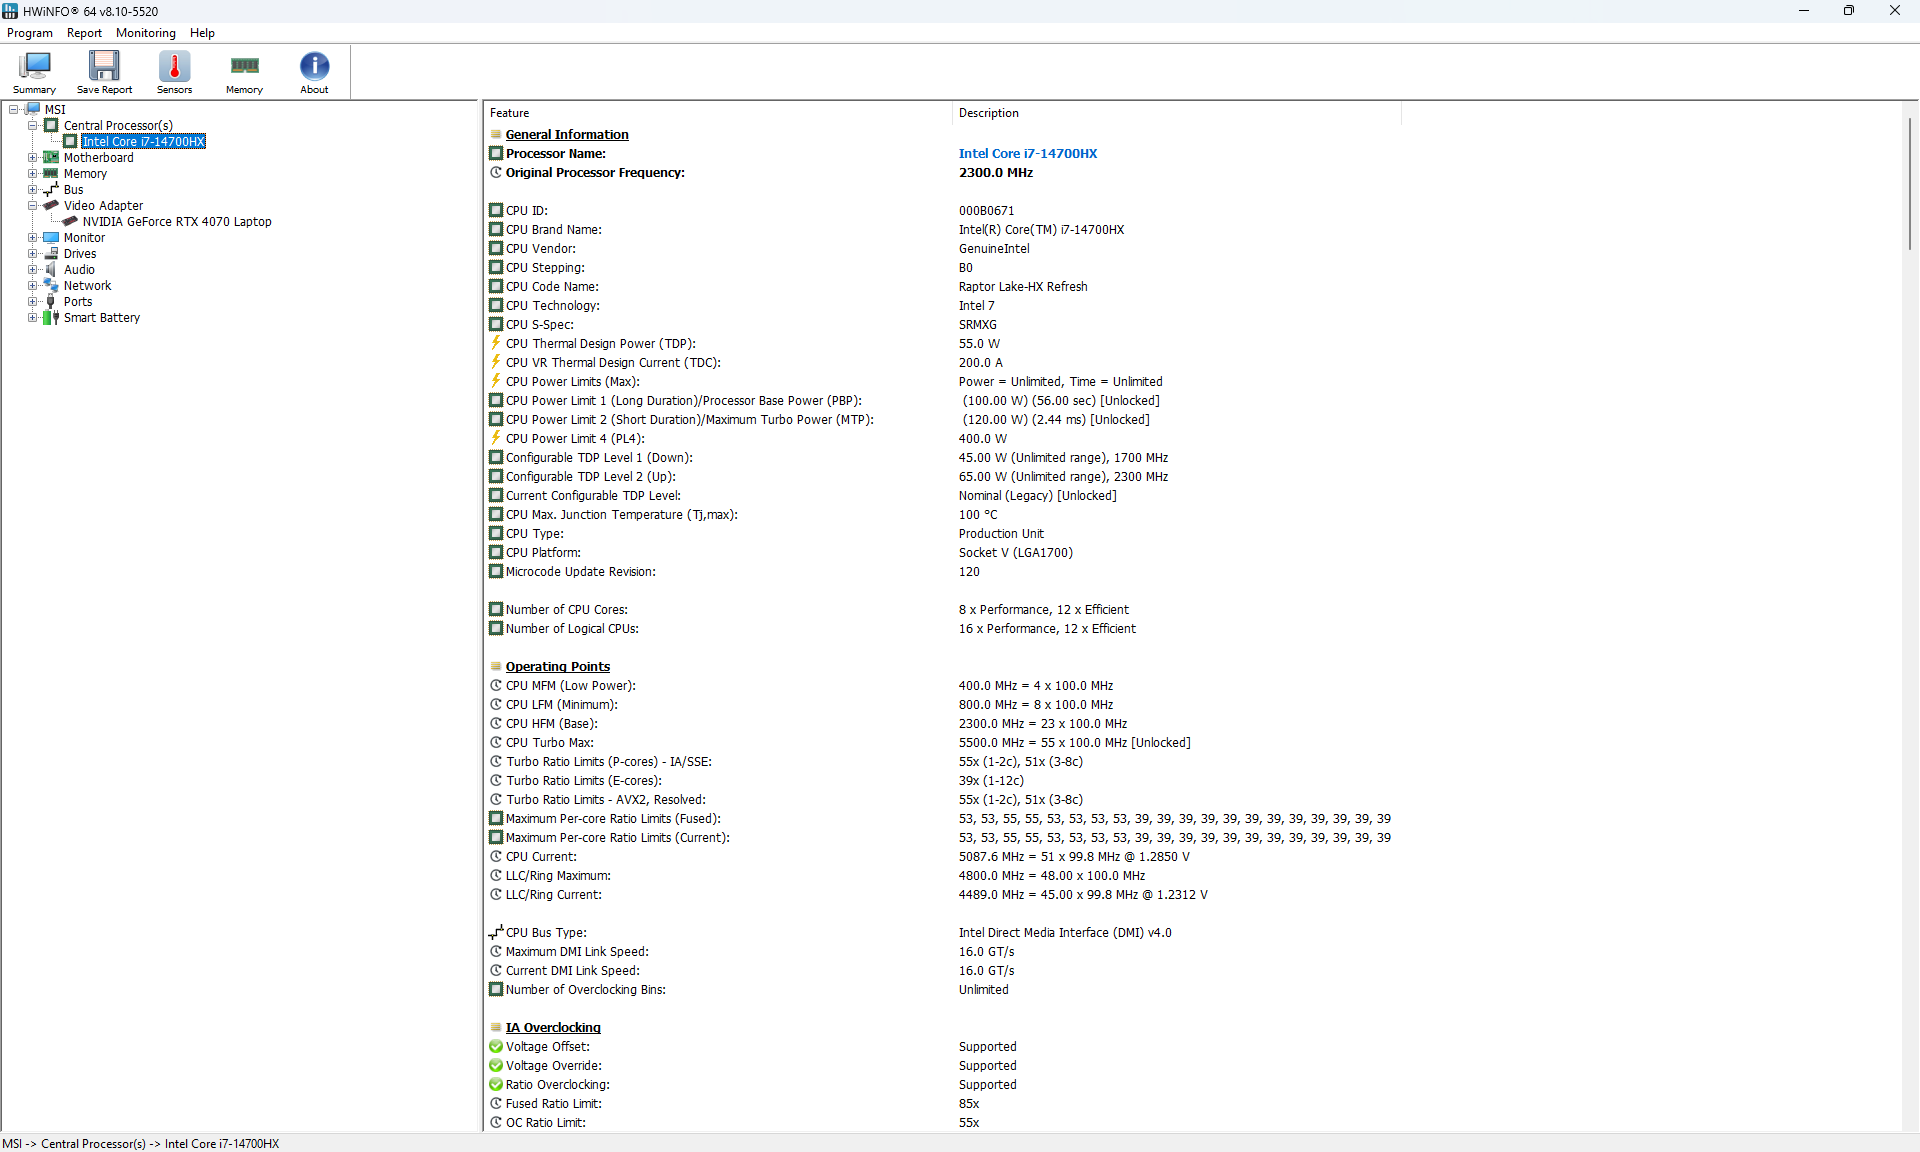
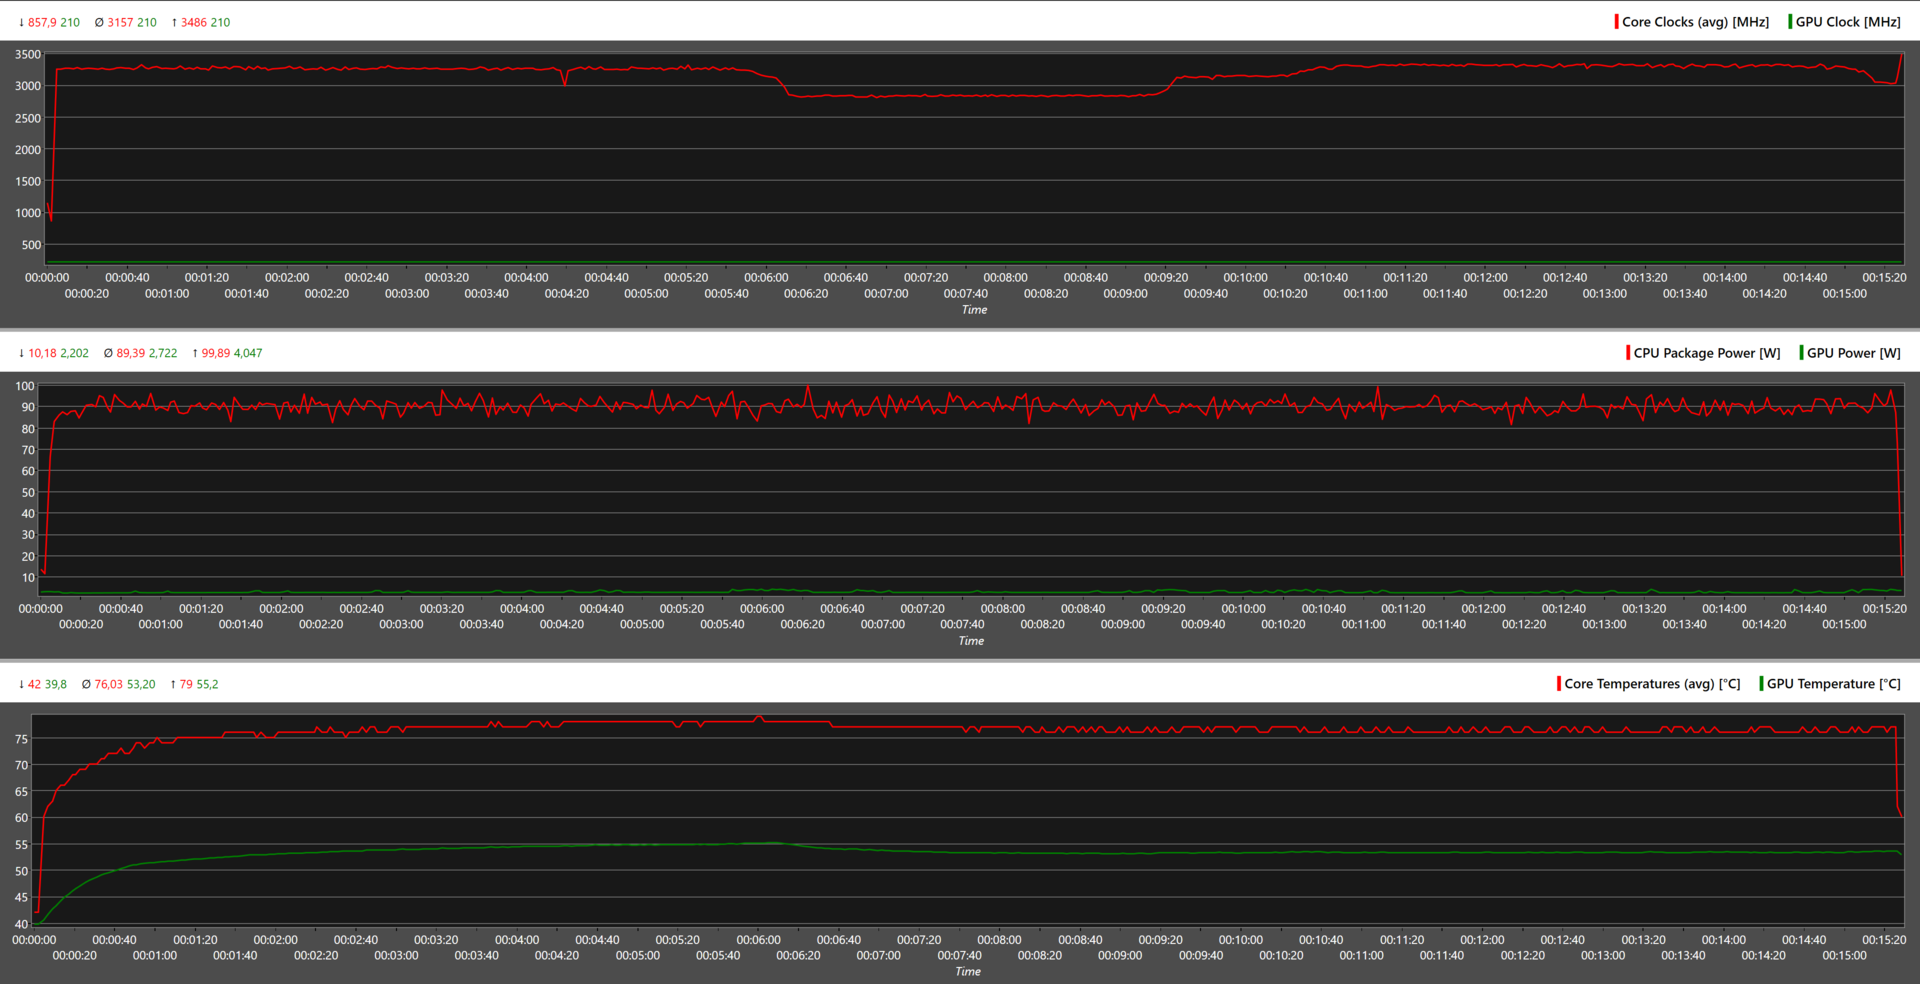
Intel Core i7-14700HX to procesor drugiej generacji Raptor Lake-HX z 8 wydajnymi i 12 wydajnymi rdzeniami. Według oficjalnej specyfikacji Intela, pierwszy z nich może zwiększyć taktowanie do 5,2 GHz, a drugi do 3,9 GHz.
W trybie ekstremalnej wydajności, 25-pętlowy wielordzeniowy przebieg Cinebench R15 ujawnia, że procesor jest w stanie osiągnąć szczytowe taktowanie 4,3 GHz, zużywając przy tym do 96 W mocy. Jego wynik pozostaje mniej więcej stały przez cały czas trwania testu, wahając się między 3327 a 3250 punktami.
W trybie zrównoważonym można zaobserwować, że moc pakietu procesora osiąga maksimum na poziomie 85 W, a następnie osiada na poziomie 55 W. Podobnie, zwiększa się do 3,6 GHz i spada do 2,3 GHz, gdzie pozostaje przez cały czas trwania biegu.
Proszę odnieść się do naszego dedykowanego Intel Core i7-14700HX aby uzyskać więcej informacji na temat tego procesora.

Cinebench R15 Multi Loop
Cinebench R23: Multi Core | Single Core
Cinebench R20: CPU (Multi Core) | CPU (Single Core)
Cinebench R15: CPU Multi 64Bit | CPU Single 64Bit
Blender: v2.79 BMW27 CPU
7-Zip 18.03: 7z b 4 | 7z b 4 -mmt1
Geekbench 6.4: Multi-Core | Single-Core
Geekbench 5.5: Multi-Core | Single-Core
HWBOT x265 Benchmark v2.2: 4k Preset
LibreOffice : 20 Documents To PDF
R Benchmark 2.5: Overall mean
| CPU Performance Rating | |
| Lenovo Legion 7 16 IRX G9 | |
| Asus ROG Strix G17 G713PI -2! | |
| Acer Predator Helios Neo 16 (2024) | |
| Przeciętny Intel Core i7-14700HX | |
| MSI Sword 16 HX B14VGKG | |
| Średnia w klasie Gaming | |
| Alienware m16 R2 -1! | |
| HP Omen 17-db0079ng | |
| HP Victus 16-r0077ng | |
| Cinebench R23 / Multi Core | |
| Asus ROG Strix G17 G713PI | |
| Lenovo Legion 7 16 IRX G9 | |
| Przeciętny Intel Core i7-14700HX (22313 - 28122, n=7) | |
| Acer Predator Helios Neo 16 (2024) | |
| MSI Sword 16 HX B14VGKG | |
| Średnia w klasie Gaming (5668 - 39652, n=151, ostatnie 2 lata) | |
| Alienware m16 R2 | |
| HP Omen 17-db0079ng | |
| HP Victus 16-r0077ng | |
| Cinebench R23 / Single Core | |
| Lenovo Legion 7 16 IRX G9 | |
| MSI Sword 16 HX B14VGKG | |
| Acer Predator Helios Neo 16 (2024) | |
| Przeciętny Intel Core i7-14700HX (1702 - 2144, n=7) | |
| Średnia w klasie Gaming (1136 - 2252, n=151, ostatnie 2 lata) | |
| Asus ROG Strix G17 G713PI | |
| Alienware m16 R2 | |
| HP Victus 16-r0077ng | |
| HP Omen 17-db0079ng | |
| Cinebench R20 / CPU (Multi Core) | |
| Lenovo Legion 7 16 IRX G9 | |
| Asus ROG Strix G17 G713PI | |
| Przeciętny Intel Core i7-14700HX (8361 - 10498, n=7) | |
| MSI Sword 16 HX B14VGKG | |
| Acer Predator Helios Neo 16 (2024) | |
| Średnia w klasie Gaming (2179 - 15517, n=151, ostatnie 2 lata) | |
| Alienware m16 R2 | |
| HP Omen 17-db0079ng | |
| HP Victus 16-r0077ng | |
| Cinebench R20 / CPU (Single Core) | |
| Lenovo Legion 7 16 IRX G9 | |
| MSI Sword 16 HX B14VGKG | |
| Acer Predator Helios Neo 16 (2024) | |
| Przeciętny Intel Core i7-14700HX (651 - 821, n=7) | |
| Średnia w klasie Gaming (439 - 866, n=151, ostatnie 2 lata) | |
| Asus ROG Strix G17 G713PI | |
| HP Omen 17-db0079ng | |
| Alienware m16 R2 | |
| HP Victus 16-r0077ng | |
| Cinebench R15 / CPU Multi 64Bit | |
| Asus ROG Strix G17 G713PI | |
| Lenovo Legion 7 16 IRX G9 | |
| Przeciętny Intel Core i7-14700HX (3328 - 4137, n=7) | |
| Acer Predator Helios Neo 16 (2024) | |
| MSI Sword 16 HX B14VGKG | |
| Średnia w klasie Gaming (905 - 6074, n=154, ostatnie 2 lata) | |
| Alienware m16 R2 | |
| HP Omen 17-db0079ng | |
| HP Victus 16-r0077ng | |
| Cinebench R15 / CPU Single 64Bit | |
| Lenovo Legion 7 16 IRX G9 | |
| MSI Sword 16 HX B14VGKG | |
| Asus ROG Strix G17 G713PI | |
| Acer Predator Helios Neo 16 (2024) | |
| Przeciętny Intel Core i7-14700HX (238 - 304, n=7) | |
| Średnia w klasie Gaming (191.9 - 343, n=151, ostatnie 2 lata) | |
| HP Omen 17-db0079ng | |
| Alienware m16 R2 | |
| HP Victus 16-r0077ng | |
| Blender / v2.79 BMW27 CPU | |
| HP Victus 16-r0077ng | |
| HP Omen 17-db0079ng | |
| Średnia w klasie Gaming (81 - 555, n=144, ostatnie 2 lata) | |
| Przeciętny Intel Core i7-14700HX (126 - 184, n=7) | |
| MSI Sword 16 HX B14VGKG | |
| Acer Predator Helios Neo 16 (2024) | |
| Lenovo Legion 7 16 IRX G9 | |
| Asus ROG Strix G17 G713PI | |
| 7-Zip 18.03 / 7z b 4 | |
| Asus ROG Strix G17 G713PI | |
| Lenovo Legion 7 16 IRX G9 | |
| Przeciętny Intel Core i7-14700HX (84799 - 104730, n=7) | |
| Acer Predator Helios Neo 16 (2024) | |
| MSI Sword 16 HX B14VGKG | |
| Średnia w klasie Gaming (23795 - 144064, n=149, ostatnie 2 lata) | |
| Alienware m16 R2 | |
| HP Victus 16-r0077ng | |
| HP Omen 17-db0079ng | |
| 7-Zip 18.03 / 7z b 4 -mmt1 | |
| Asus ROG Strix G17 G713PI | |
| Lenovo Legion 7 16 IRX G9 | |
| MSI Sword 16 HX B14VGKG | |
| Acer Predator Helios Neo 16 (2024) | |
| Przeciętny Intel Core i7-14700HX (5641 - 7041, n=7) | |
| Średnia w klasie Gaming (4199 - 7573, n=149, ostatnie 2 lata) | |
| HP Victus 16-r0077ng | |
| HP Omen 17-db0079ng | |
| Alienware m16 R2 | |
| Geekbench 6.4 / Multi-Core | |
| Lenovo Legion 7 16 IRX G9 | |
| Acer Predator Helios Neo 16 (2024) | |
| Przeciętny Intel Core i7-14700HX (14807 - 17562, n=7) | |
| MSI Sword 16 HX B14VGKG | |
| Średnia w klasie Gaming (5340 - 21668, n=119, ostatnie 2 lata) | |
| HP Omen 17-db0079ng | |
| Alienware m16 R2 | |
| HP Victus 16-r0077ng | |
| Geekbench 6.4 / Single-Core | |
| Lenovo Legion 7 16 IRX G9 | |
| Acer Predator Helios Neo 16 (2024) | |
| MSI Sword 16 HX B14VGKG | |
| Przeciętny Intel Core i7-14700HX (2378 - 2975, n=7) | |
| Średnia w klasie Gaming (1490 - 3219, n=119, ostatnie 2 lata) | |
| HP Omen 17-db0079ng | |
| HP Victus 16-r0077ng | |
| Alienware m16 R2 | |
| Geekbench 5.5 / Multi-Core | |
| Lenovo Legion 7 16 IRX G9 | |
| Asus ROG Strix G17 G713PI | |
| Acer Predator Helios Neo 16 (2024) | |
| Przeciętny Intel Core i7-14700HX (15705 - 19597, n=7) | |
| MSI Sword 16 HX B14VGKG | |
| Średnia w klasie Gaming (4557 - 25855, n=148, ostatnie 2 lata) | |
| Alienware m16 R2 | |
| HP Omen 17-db0079ng | |
| HP Victus 16-r0077ng | |
| Geekbench 5.5 / Single-Core | |
| Acer Predator Helios Neo 16 (2024) | |
| Lenovo Legion 7 16 IRX G9 | |
| MSI Sword 16 HX B14VGKG | |
| Asus ROG Strix G17 G713PI | |
| Przeciętny Intel Core i7-14700HX (1700 - 2133, n=7) | |
| Średnia w klasie Gaming (986 - 2423, n=148, ostatnie 2 lata) | |
| HP Omen 17-db0079ng | |
| Alienware m16 R2 | |
| HP Victus 16-r0077ng | |
| HWBOT x265 Benchmark v2.2 / 4k Preset | |
| Asus ROG Strix G17 G713PI | |
| Lenovo Legion 7 16 IRX G9 | |
| Przeciętny Intel Core i7-14700HX (22 - 27.4, n=7) | |
| Acer Predator Helios Neo 16 (2024) | |
| MSI Sword 16 HX B14VGKG | |
| Średnia w klasie Gaming (6.72 - 42.9, n=148, ostatnie 2 lata) | |
| Alienware m16 R2 | |
| HP Omen 17-db0079ng | |
| HP Victus 16-r0077ng | |
| LibreOffice / 20 Documents To PDF | |
| HP Omen 17-db0079ng | |
| HP Victus 16-r0077ng | |
| Alienware m16 R2 | |
| Średnia w klasie Gaming (19 - 96.6, n=147, ostatnie 2 lata) | |
| Przeciętny Intel Core i7-14700HX (41.9 - 55.3, n=7) | |
| Asus ROG Strix G17 G713PI | |
| Lenovo Legion 7 16 IRX G9 | |
| MSI Sword 16 HX B14VGKG | |
| Acer Predator Helios Neo 16 (2024) | |
| R Benchmark 2.5 / Overall mean | |
| HP Victus 16-r0077ng | |
| HP Omen 17-db0079ng | |
| Alienware m16 R2 | |
| Średnia w klasie Gaming (0.3609 - 0.759, n=150, ostatnie 2 lata) | |
| Przeciętny Intel Core i7-14700HX (0.3821 - 0.4896, n=7) | |
| Asus ROG Strix G17 G713PI | |
| MSI Sword 16 HX B14VGKG | |
| Lenovo Legion 7 16 IRX G9 | |
| Acer Predator Helios Neo 16 (2024) | |
* ... im mniej tym lepiej
AIDA64: FP32 Ray-Trace | FPU Julia | CPU SHA3 | CPU Queen | FPU SinJulia | FPU Mandel | CPU AES | CPU ZLib | FP64 Ray-Trace | CPU PhotoWorxx
| Performance Rating | |
| Asus ROG Strix G17 G713PI | |
| Lenovo Legion 7 16 IRX G9 | |
| Acer Predator Helios Neo 16 (2024) | |
| Przeciętny Intel Core i7-14700HX | |
| HP Omen 17-db0079ng | |
| Średnia w klasie Gaming | |
| MSI Sword 16 HX B14VGKG | |
| Alienware m16 R2 | |
| HP Victus 16-r0077ng | |
| AIDA64 / FP32 Ray-Trace | |
| Asus ROG Strix G17 G713PI | |
| HP Omen 17-db0079ng | |
| Lenovo Legion 7 16 IRX G9 | |
| Średnia w klasie Gaming (4986 - 81639, n=147, ostatnie 2 lata) | |
| Acer Predator Helios Neo 16 (2024) | |
| Przeciętny Intel Core i7-14700HX (16932 - 23676, n=7) | |
| MSI Sword 16 HX B14VGKG | |
| Alienware m16 R2 | |
| HP Victus 16-r0077ng | |
| AIDA64 / FPU Julia | |
| Asus ROG Strix G17 G713PI | |
| Lenovo Legion 7 16 IRX G9 | |
| HP Omen 17-db0079ng | |
| Przeciętny Intel Core i7-14700HX (86338 - 116556, n=7) | |
| Acer Predator Helios Neo 16 (2024) | |
| Średnia w klasie Gaming (25360 - 252486, n=147, ostatnie 2 lata) | |
| MSI Sword 16 HX B14VGKG | |
| Alienware m16 R2 | |
| HP Victus 16-r0077ng | |
| AIDA64 / CPU SHA3 | |
| Asus ROG Strix G17 G713PI | |
| Lenovo Legion 7 16 IRX G9 | |
| Przeciętny Intel Core i7-14700HX (4008 - 5567, n=7) | |
| Acer Predator Helios Neo 16 (2024) | |
| Średnia w klasie Gaming (1339 - 10389, n=147, ostatnie 2 lata) | |
| HP Omen 17-db0079ng | |
| MSI Sword 16 HX B14VGKG | |
| Alienware m16 R2 | |
| HP Victus 16-r0077ng | |
| AIDA64 / CPU Queen | |
| Asus ROG Strix G17 G713PI | |
| Acer Predator Helios Neo 16 (2024) | |
| Lenovo Legion 7 16 IRX G9 | |
| Przeciętny Intel Core i7-14700HX (129836 - 152200, n=7) | |
| MSI Sword 16 HX B14VGKG | |
| HP Omen 17-db0079ng | |
| Średnia w klasie Gaming (50699 - 200651, n=147, ostatnie 2 lata) | |
| HP Victus 16-r0077ng | |
| Alienware m16 R2 | |
| AIDA64 / FPU SinJulia | |
| Asus ROG Strix G17 G713PI | |
| HP Omen 17-db0079ng | |
| Lenovo Legion 7 16 IRX G9 | |
| Acer Predator Helios Neo 16 (2024) | |
| Przeciętny Intel Core i7-14700HX (11704 - 14434, n=7) | |
| Średnia w klasie Gaming (4800 - 32988, n=147, ostatnie 2 lata) | |
| MSI Sword 16 HX B14VGKG | |
| Alienware m16 R2 | |
| HP Victus 16-r0077ng | |
| AIDA64 / FPU Mandel | |
| Asus ROG Strix G17 G713PI | |
| HP Omen 17-db0079ng | |
| Acer Predator Helios Neo 16 (2024) | |
| Średnia w klasie Gaming (12321 - 134044, n=147, ostatnie 2 lata) | |
| Przeciętny Intel Core i7-14700HX (42125 - 58380, n=7) | |
| MSI Sword 16 HX B14VGKG | |
| Alienware m16 R2 | |
| Lenovo Legion 7 16 IRX G9 | |
| HP Victus 16-r0077ng | |
| AIDA64 / CPU AES | |
| Asus ROG Strix G17 G713PI | |
| Lenovo Legion 7 16 IRX G9 | |
| Średnia w klasie Gaming (19065 - 328679, n=147, ostatnie 2 lata) | |
| Przeciętny Intel Core i7-14700HX (82161 - 113157, n=7) | |
| Acer Predator Helios Neo 16 (2024) | |
| MSI Sword 16 HX B14VGKG | |
| HP Omen 17-db0079ng | |
| Alienware m16 R2 | |
| HP Victus 16-r0077ng | |
| AIDA64 / CPU ZLib | |
| Asus ROG Strix G17 G713PI | |
| Lenovo Legion 7 16 IRX G9 | |
| Przeciętny Intel Core i7-14700HX (1177 - 1682, n=7) | |
| Acer Predator Helios Neo 16 (2024) | |
| MSI Sword 16 HX B14VGKG | |
| Średnia w klasie Gaming (373 - 2531, n=147, ostatnie 2 lata) | |
| Alienware m16 R2 | |
| HP Omen 17-db0079ng | |
| HP Victus 16-r0077ng | |
| AIDA64 / FP64 Ray-Trace | |
| Asus ROG Strix G17 G713PI | |
| HP Omen 17-db0079ng | |
| Lenovo Legion 7 16 IRX G9 | |
| Średnia w klasie Gaming (2540 - 43430, n=147, ostatnie 2 lata) | |
| Acer Predator Helios Neo 16 (2024) | |
| Przeciętny Intel Core i7-14700HX (9029 - 12928, n=7) | |
| MSI Sword 16 HX B14VGKG | |
| Alienware m16 R2 | |
| HP Victus 16-r0077ng | |
| AIDA64 / CPU PhotoWorxx | |
| Lenovo Legion 7 16 IRX G9 | |
| Acer Predator Helios Neo 16 (2024) | |
| Przeciętny Intel Core i7-14700HX (39151 - 49671, n=7) | |
| HP Omen 17-db0079ng | |
| Średnia w klasie Gaming (10805 - 60161, n=147, ostatnie 2 lata) | |
| Alienware m16 R2 | |
| MSI Sword 16 HX B14VGKG | |
| HP Victus 16-r0077ng | |
| Asus ROG Strix G17 G713PI | |
Wydajność systemu
Wydajny procesor i układ graficzny Sword 16 HX sprawiają, że codzienne zadania, takie jak rozmowy wideo, arkusze Excela itp. są bardzo łatwe do wykonania. Aby wydłużyć czas pracy na baterii, konieczne może być jednak przełączenie się na mniej energochłonny tryb (cichy/zrównoważony).
CrossMark: Overall | Productivity | Creativity | Responsiveness
WebXPRT 3: Overall
WebXPRT 4: Overall
Mozilla Kraken 1.1: Total
| PCMark 10 / Score | |
| MSI Sword 16 HX B14VGKG | |
| Przeciętny Intel Core i7-14700HX, NVIDIA GeForce RTX 4070 Laptop GPU (8302 - 8512, n=2) | |
| Acer Predator Helios Neo 16 (2024) | |
| Lenovo Legion 7 16 IRX G9 | |
| Średnia w klasie Gaming (5776 - 9852, n=133, ostatnie 2 lata) | |
| HP Omen 17-db0079ng | |
| Alienware m16 R2 | |
| Asus ROG Strix G17 G713PI | |
| HP Victus 16-r0077ng | |
| PCMark 10 / Essentials | |
| Acer Predator Helios Neo 16 (2024) | |
| Przeciętny Intel Core i7-14700HX, NVIDIA GeForce RTX 4070 Laptop GPU (10939 - 11708, n=2) | |
| Asus ROG Strix G17 G713PI | |
| Lenovo Legion 7 16 IRX G9 | |
| MSI Sword 16 HX B14VGKG | |
| Średnia w klasie Gaming (9057 - 12600, n=133, ostatnie 2 lata) | |
| HP Victus 16-r0077ng | |
| HP Omen 17-db0079ng | |
| Alienware m16 R2 | |
| PCMark 10 / Productivity | |
| Asus ROG Strix G17 G713PI | |
| MSI Sword 16 HX B14VGKG | |
| Przeciętny Intel Core i7-14700HX, NVIDIA GeForce RTX 4070 Laptop GPU (10273 - 10925, n=2) | |
| Acer Predator Helios Neo 16 (2024) | |
| HP Omen 17-db0079ng | |
| Średnia w klasie Gaming (6662 - 14612, n=133, ostatnie 2 lata) | |
| Lenovo Legion 7 16 IRX G9 | |
| Alienware m16 R2 | |
| HP Victus 16-r0077ng | |
| PCMark 10 / Digital Content Creation | |
| MSI Sword 16 HX B14VGKG | |
| Przeciętny Intel Core i7-14700HX, NVIDIA GeForce RTX 4070 Laptop GPU (12909 - 14003, n=2) | |
| Lenovo Legion 7 16 IRX G9 | |
| Alienware m16 R2 | |
| Acer Predator Helios Neo 16 (2024) | |
| Średnia w klasie Gaming (6807 - 18475, n=133, ostatnie 2 lata) | |
| HP Omen 17-db0079ng | |
| HP Victus 16-r0077ng | |
| Asus ROG Strix G17 G713PI | |
| CrossMark / Overall | |
| Lenovo Legion 7 16 IRX G9 | |
| Acer Predator Helios Neo 16 (2024) | |
| Przeciętny Intel Core i7-14700HX, NVIDIA GeForce RTX 4070 Laptop GPU (2138 - 2235, n=2) | |
| MSI Sword 16 HX B14VGKG | |
| Asus ROG Strix G17 G713PI | |
| Średnia w klasie Gaming (1247 - 2344, n=114, ostatnie 2 lata) | |
| Alienware m16 R2 | |
| HP Omen 17-db0079ng | |
| CrossMark / Productivity | |
| Lenovo Legion 7 16 IRX G9 | |
| Acer Predator Helios Neo 16 (2024) | |
| Przeciętny Intel Core i7-14700HX, NVIDIA GeForce RTX 4070 Laptop GPU (2035 - 2093, n=2) | |
| MSI Sword 16 HX B14VGKG | |
| Asus ROG Strix G17 G713PI | |
| Średnia w klasie Gaming (1299 - 2204, n=114, ostatnie 2 lata) | |
| Alienware m16 R2 | |
| HP Omen 17-db0079ng | |
| CrossMark / Creativity | |
| Acer Predator Helios Neo 16 (2024) | |
| Lenovo Legion 7 16 IRX G9 | |
| Przeciętny Intel Core i7-14700HX, NVIDIA GeForce RTX 4070 Laptop GPU (2311 - 2455, n=2) | |
| Asus ROG Strix G17 G713PI | |
| MSI Sword 16 HX B14VGKG | |
| Średnia w klasie Gaming (1275 - 2660, n=114, ostatnie 2 lata) | |
| Alienware m16 R2 | |
| HP Omen 17-db0079ng | |
| CrossMark / Responsiveness | |
| Lenovo Legion 7 16 IRX G9 | |
| Acer Predator Helios Neo 16 (2024) | |
| Przeciętny Intel Core i7-14700HX, NVIDIA GeForce RTX 4070 Laptop GPU (1960 - 2053, n=2) | |
| MSI Sword 16 HX B14VGKG | |
| Średnia w klasie Gaming (1030 - 2330, n=114, ostatnie 2 lata) | |
| Asus ROG Strix G17 G713PI | |
| Alienware m16 R2 | |
| HP Omen 17-db0079ng | |
| WebXPRT 3 / Overall | |
| Lenovo Legion 7 16 IRX G9 | |
| Acer Predator Helios Neo 16 (2024) | |
| Asus ROG Strix G17 G713PI | |
| Przeciętny Intel Core i7-14700HX, NVIDIA GeForce RTX 4070 Laptop GPU (302 - 323, n=2) | |
| MSI Sword 16 HX B14VGKG | |
| Średnia w klasie Gaming (215 - 480, n=127, ostatnie 2 lata) | |
| Alienware m16 R2 | |
| HP Victus 16-r0077ng | |
| HP Victus 16-r0077ng | |
| HP Omen 17-db0079ng | |
| WebXPRT 4 / Overall | |
| Acer Predator Helios Neo 16 (2024) | |
| Lenovo Legion 7 16 IRX G9 | |
| Przeciętny Intel Core i7-14700HX, NVIDIA GeForce RTX 4070 Laptop GPU (274 - 307, n=2) | |
| Asus ROG Strix G17 G713PI | |
| MSI Sword 16 HX B14VGKG | |
| Średnia w klasie Gaming (176.4 - 335, n=115, ostatnie 2 lata) | |
| Alienware m16 R2 | |
| HP Victus 16-r0077ng | |
| HP Victus 16-r0077ng | |
| Mozilla Kraken 1.1 / Total | |
| HP Omen 17-db0079ng | |
| Alienware m16 R2 | |
| HP Victus 16-r0077ng | |
| HP Victus 16-r0077ng | |
| Średnia w klasie Gaming (409 - 674, n=139, ostatnie 2 lata) | |
| Asus ROG Strix G17 G713PI | |
| MSI Sword 16 HX B14VGKG | |
| MSI Sword 16 HX B14VGKG | |
| Przeciętny Intel Core i7-14700HX, NVIDIA GeForce RTX 4070 Laptop GPU (447 - 449, n=3) | |
| Acer Predator Helios Neo 16 (2024) | |
| Lenovo Legion 7 16 IRX G9 | |
* ... im mniej tym lepiej
| PCMark 10 Score | 8512 pkt. | |
Pomoc | ||
| AIDA64 / Memory Copy | |
| Lenovo Legion 7 16 IRX G9 | |
| Acer Predator Helios Neo 16 (2024) | |
| Przeciętny Intel Core i7-14700HX (63949 - 78742, n=7) | |
| MSI Sword 16 HX B14VGKG | |
| HP Omen 17-db0079ng | |
| Średnia w klasie Gaming (21750 - 97515, n=147, ostatnie 2 lata) | |
| Alienware m16 R2 | |
| HP Victus 16-r0077ng | |
| Asus ROG Strix G17 G713PI | |
| AIDA64 / Memory Read | |
| Lenovo Legion 7 16 IRX G9 | |
| MSI Sword 16 HX B14VGKG | |
| Acer Predator Helios Neo 16 (2024) | |
| Przeciętny Intel Core i7-14700HX (68593 - 86175, n=7) | |
| Alienware m16 R2 | |
| HP Victus 16-r0077ng | |
| Średnia w klasie Gaming (22956 - 102937, n=147, ostatnie 2 lata) | |
| HP Omen 17-db0079ng | |
| Asus ROG Strix G17 G713PI | |
| AIDA64 / Memory Write | |
| HP Omen 17-db0079ng | |
| Lenovo Legion 7 16 IRX G9 | |
| Acer Predator Helios Neo 16 (2024) | |
| Przeciętny Intel Core i7-14700HX (64033 - 76689, n=7) | |
| Średnia w klasie Gaming (22297 - 108954, n=147, ostatnie 2 lata) | |
| Alienware m16 R2 | |
| MSI Sword 16 HX B14VGKG | |
| HP Victus 16-r0077ng | |
| Asus ROG Strix G17 G713PI | |
| AIDA64 / Memory Latency | |
| Alienware m16 R2 | |
| HP Omen 17-db0079ng | |
| Średnia w klasie Gaming (59.5 - 259, n=147, ostatnie 2 lata) | |
| HP Victus 16-r0077ng | |
| Acer Predator Helios Neo 16 (2024) | |
| Przeciętny Intel Core i7-14700HX (82.7 - 96.4, n=7) | |
| Asus ROG Strix G17 G713PI | |
| Lenovo Legion 7 16 IRX G9 | |
| MSI Sword 16 HX B14VGKG | |
* ... im mniej tym lepiej
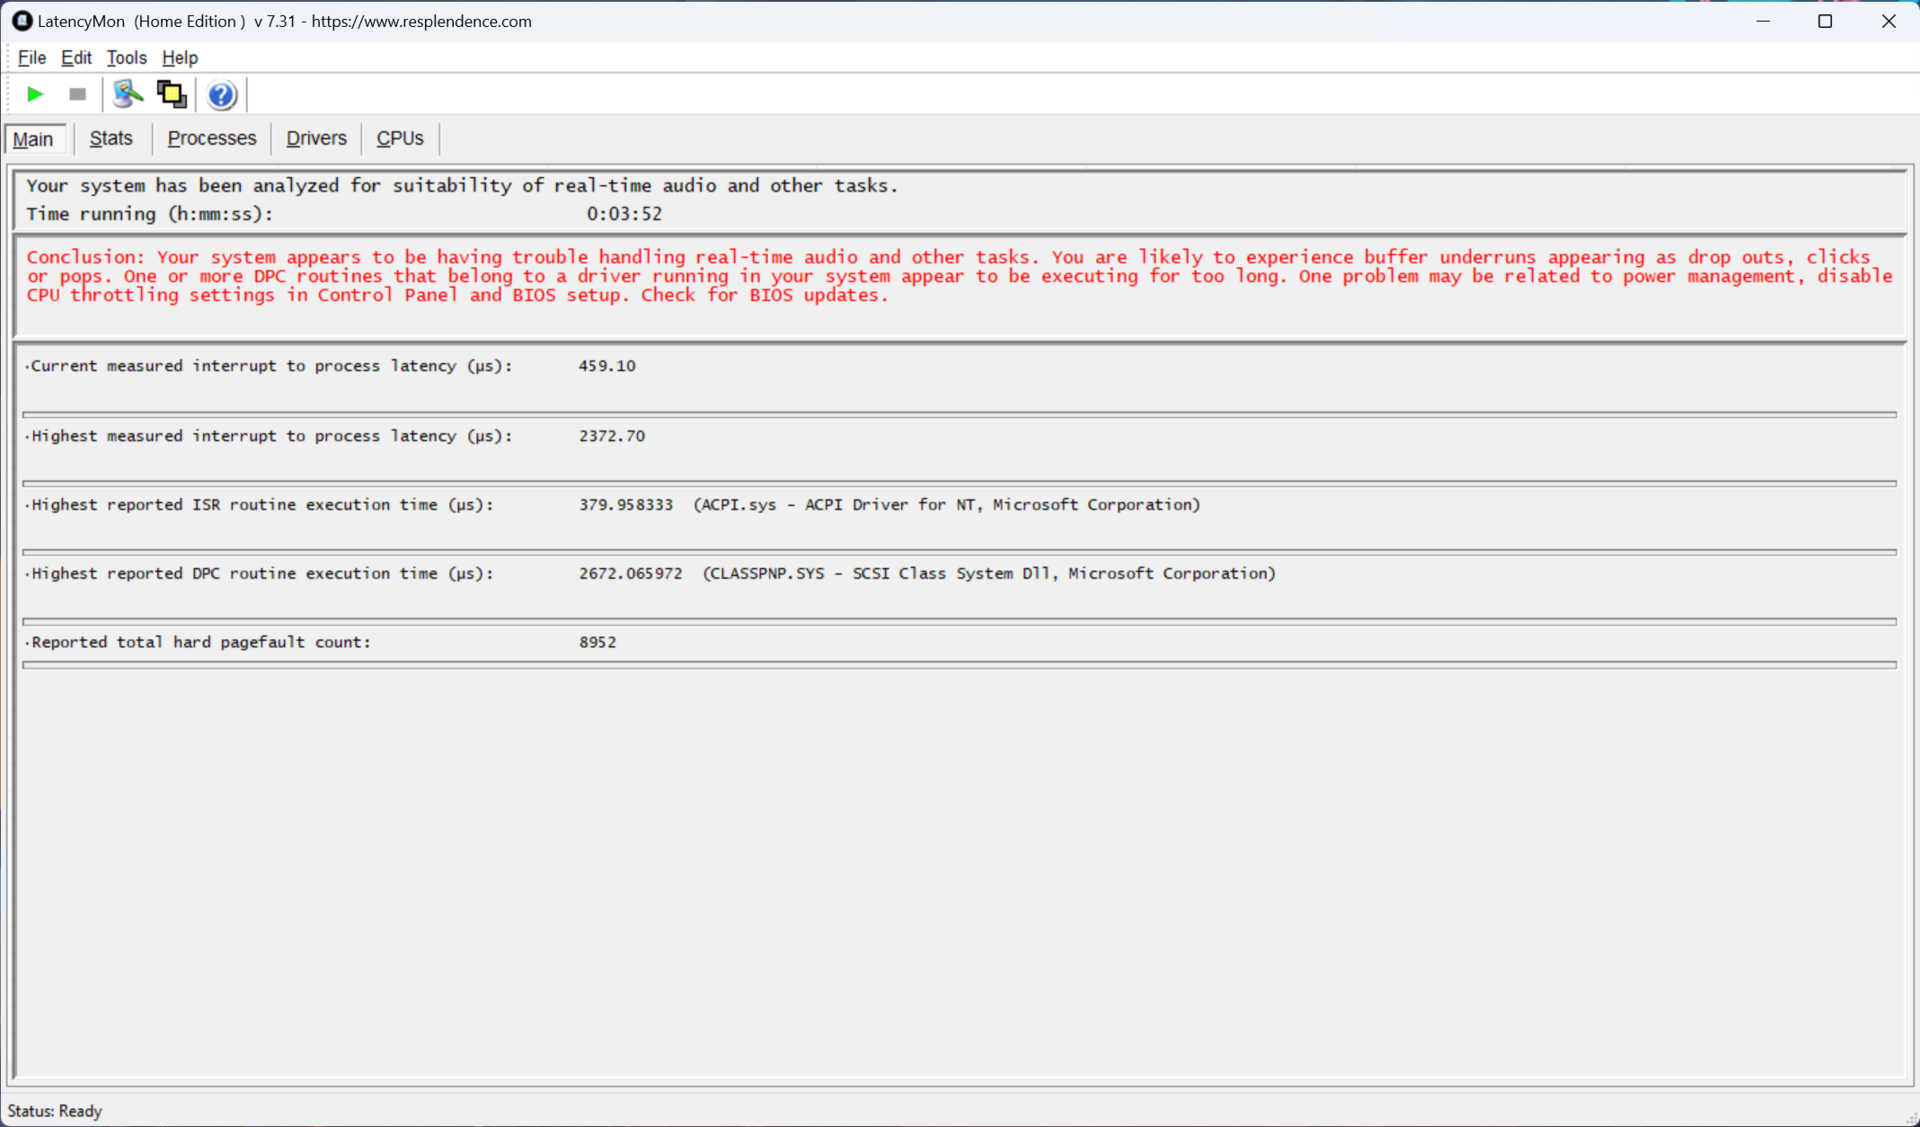
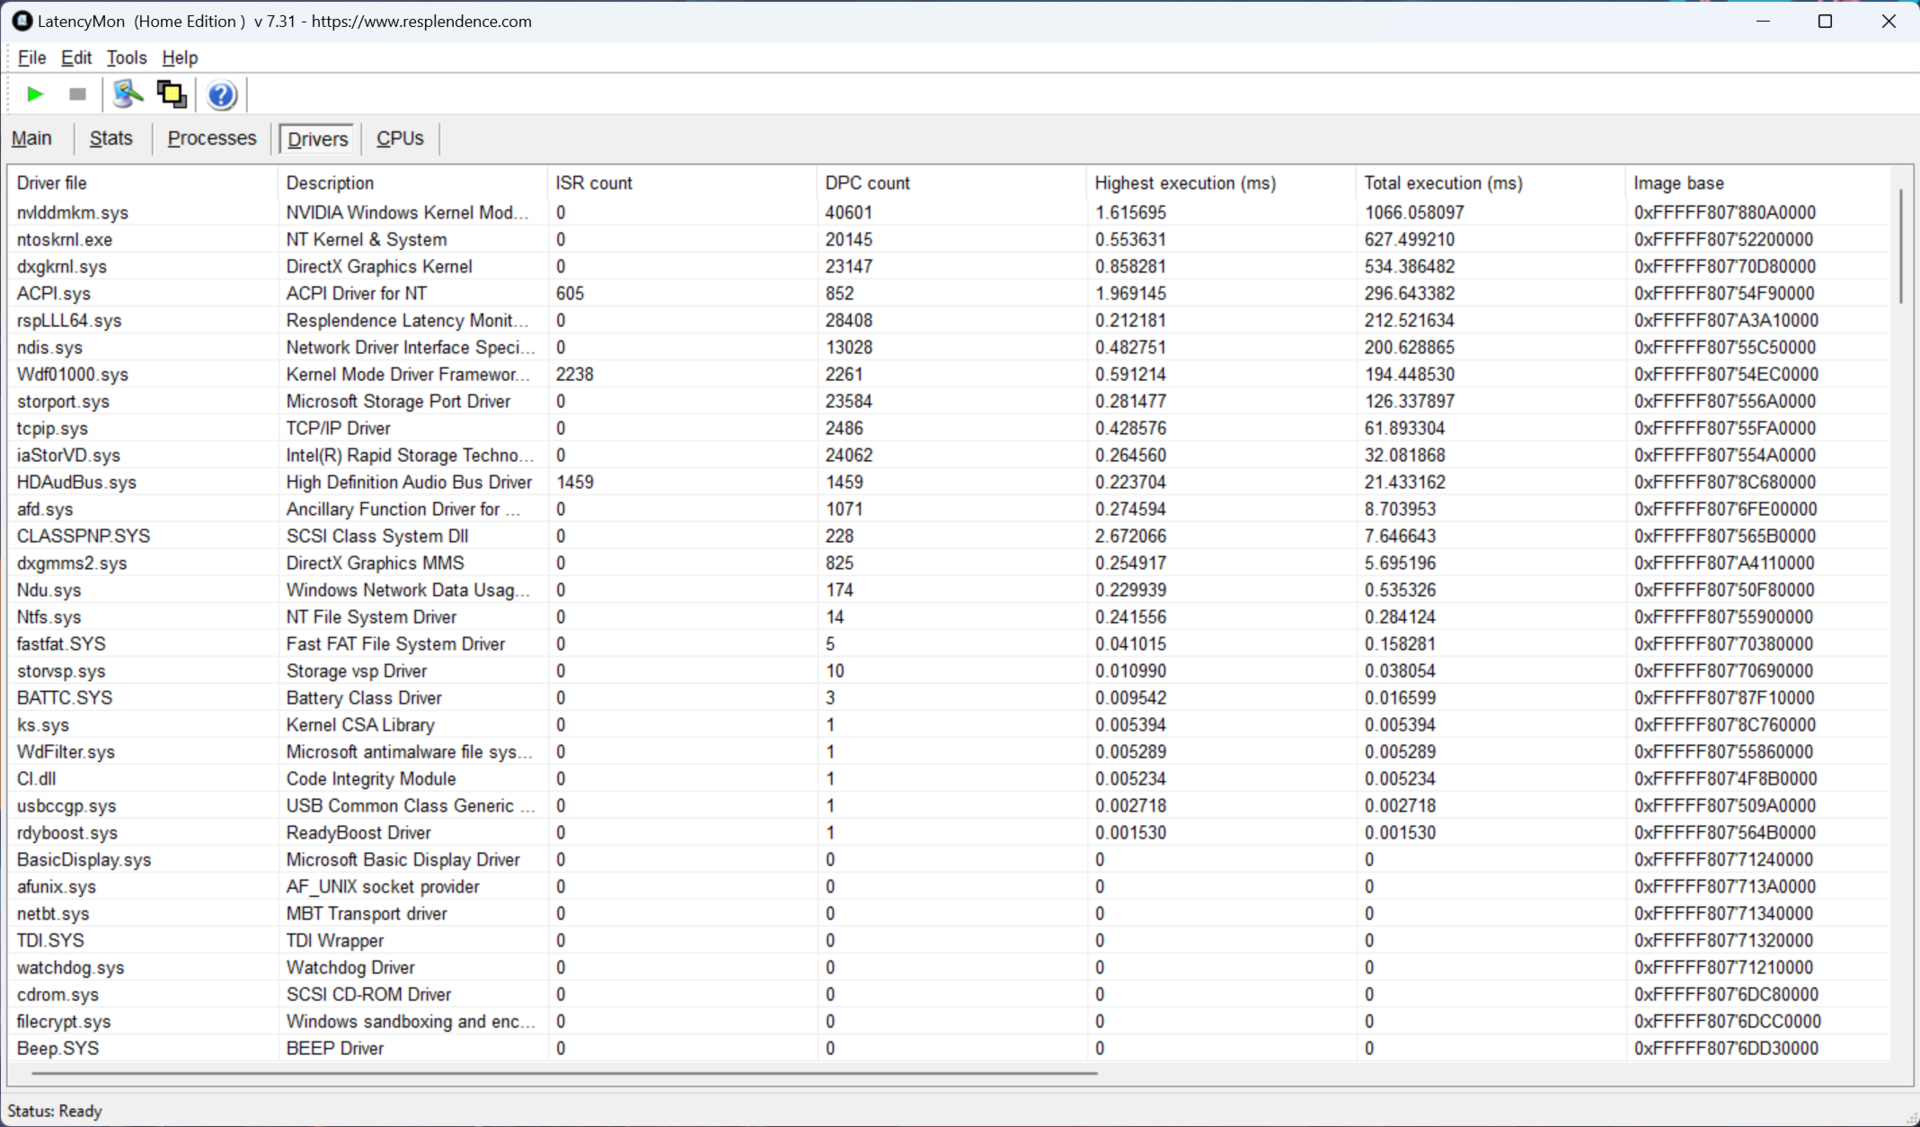
Opóźnienie DPC
MSI Sword 16 HX nie jest niestety idealna do zastosowań związanych z edycją audio i wideo w czasie rzeczywistym. Jej opóźnienie DPC jest wyższe ze względu na sterowniki Nvidii. Przyszła aktualizacja oprogramowania powinna naprawić ten problem.
| DPC Latencies / LatencyMon - interrupt to process latency (max), Web, Youtube, Prime95 | |
| MSI Sword 16 HX B14VGKG | |
| Alienware m16 R2 | |
| HP Omen 17-db0079ng | |
| HP Victus 16-r0077ng | |
| Lenovo Legion 7 16 IRX G9 | |
| Asus ROG Strix G17 G713PI | |
| Acer Predator Helios Neo 16 (2024) | |
* ... im mniej tym lepiej
Urządzenia pamięci masowej
Niestety, Western Digital PC SN560 NVMe SSD w Sword 16 HX jest jednym z wolniejszych dysków dostępnych na rynku. Jest on zdecydowanie lepszy od konkurencyjnych ofert Samsunga, Kioxia i SK Hynix.
Ponieważ nie mogliśmy zajrzeć do środka, nie wiemy, gdzie podłączony jest dysk SSD PC SN560, ale prawdopodobnie jest on umieszczony w gnieździe PCIe Gen5.

* ... im mniej tym lepiej
Disk Throttling: DiskSpd Read Loop, Queue Depth 8
Wydajność GPU
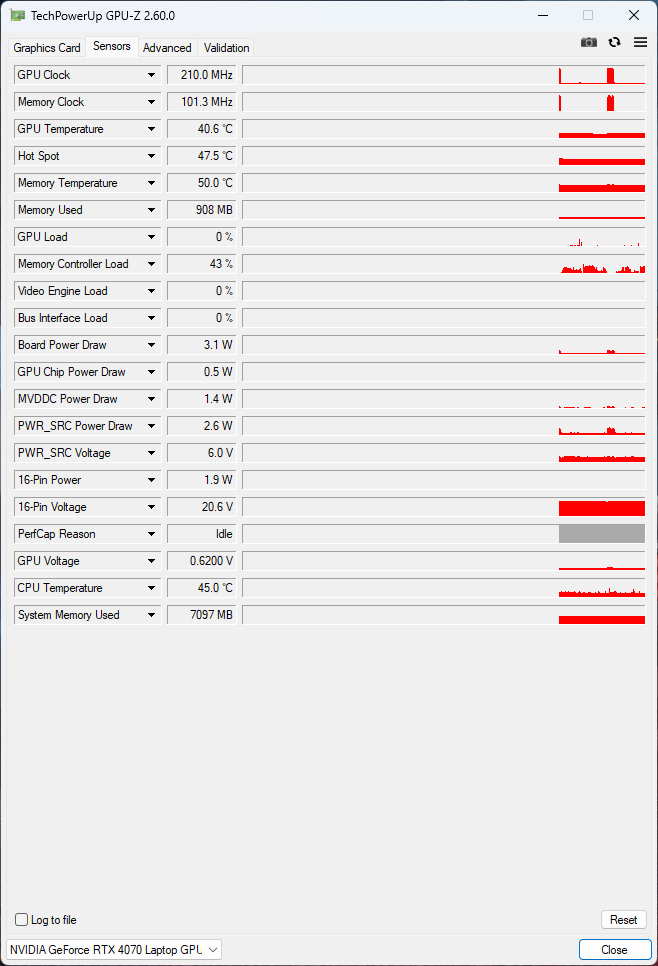
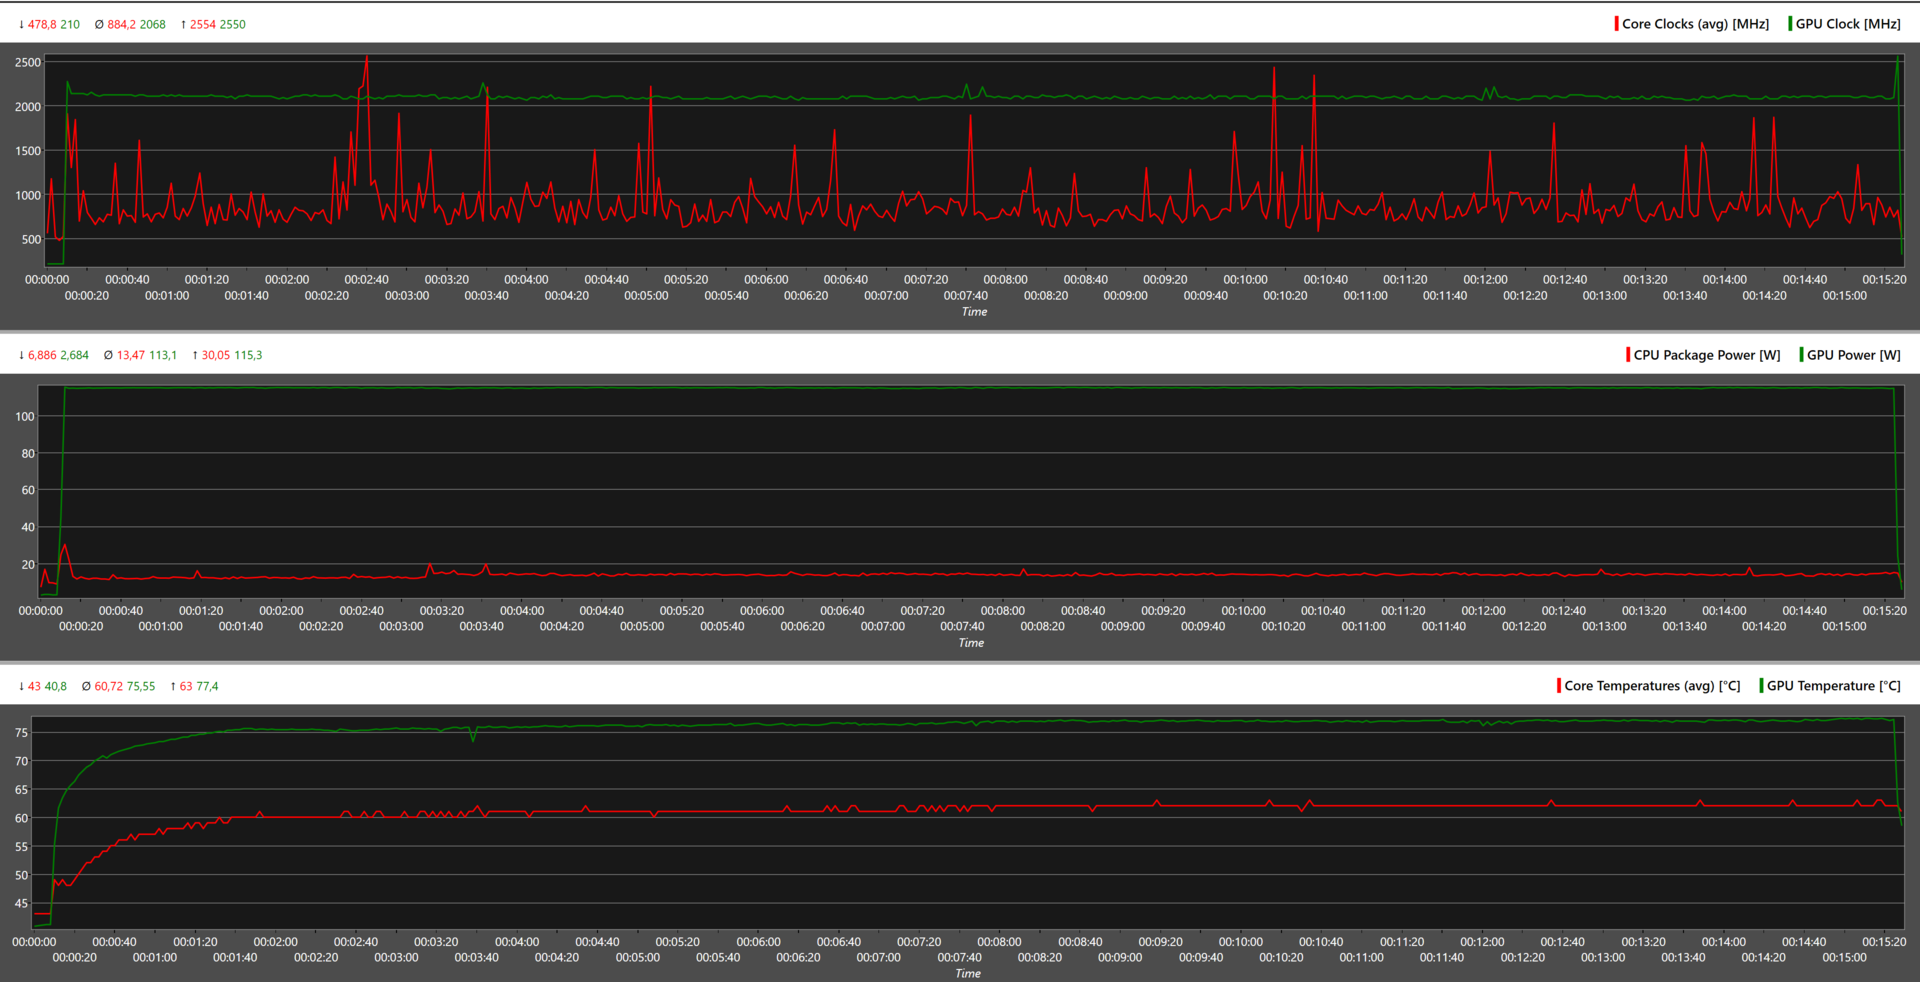
The Nvidia GeForce RTX 4070 znaleziony w MSI Sword 16 HX nie jest jednym z najszybszych, jakie testowaliśmy, ale możemy to przypisać jego 115-watowemu TDP w porównaniu do 140-watowego w innych. Decyzja MSI o zastosowaniu 115-watowego wariantu ma sens, ponieważ chłodzenie 150-watowego wariantu byłoby wyzwaniem w tym przedziale cenowym.
To powiedziawszy, obecna konfiguracja MSI nadaje priorytet GPU nad CPU. W mieszanym obciążeniu CPU i GPU, GeForce RTX 4070 konsekwentnie działa przy 115 W, podczas gdy Core i7-14700HX utrzymuje się na stałym poziomie około 86 W.
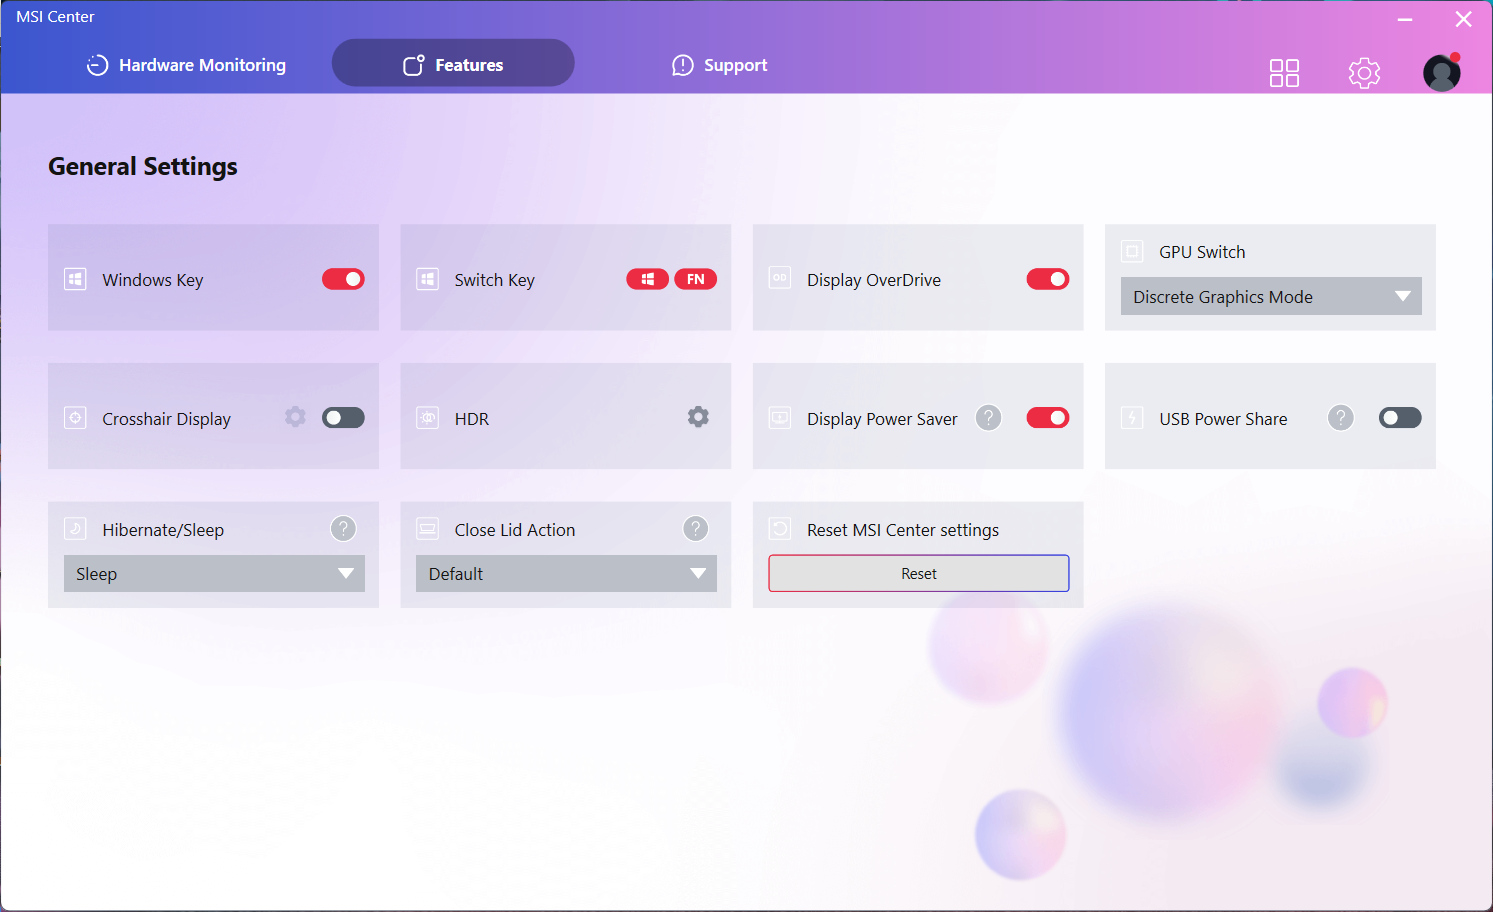
Ogólnie rzecz biorąc, wydajność laptopa w testach syntetycznych jest akceptowalna i jest zgodna z innymi 115-watowymi jednostkami SKU RTX 4070. MSI pozwala przełączać się między nim a iGPU za pomocą oprogramowania. Przełączanie między GPU wymaga jednak ponownego uruchomienia komputera. Istnieje również opcja automatycznego przełączania między dGPU i iGPU w systemie Windows.
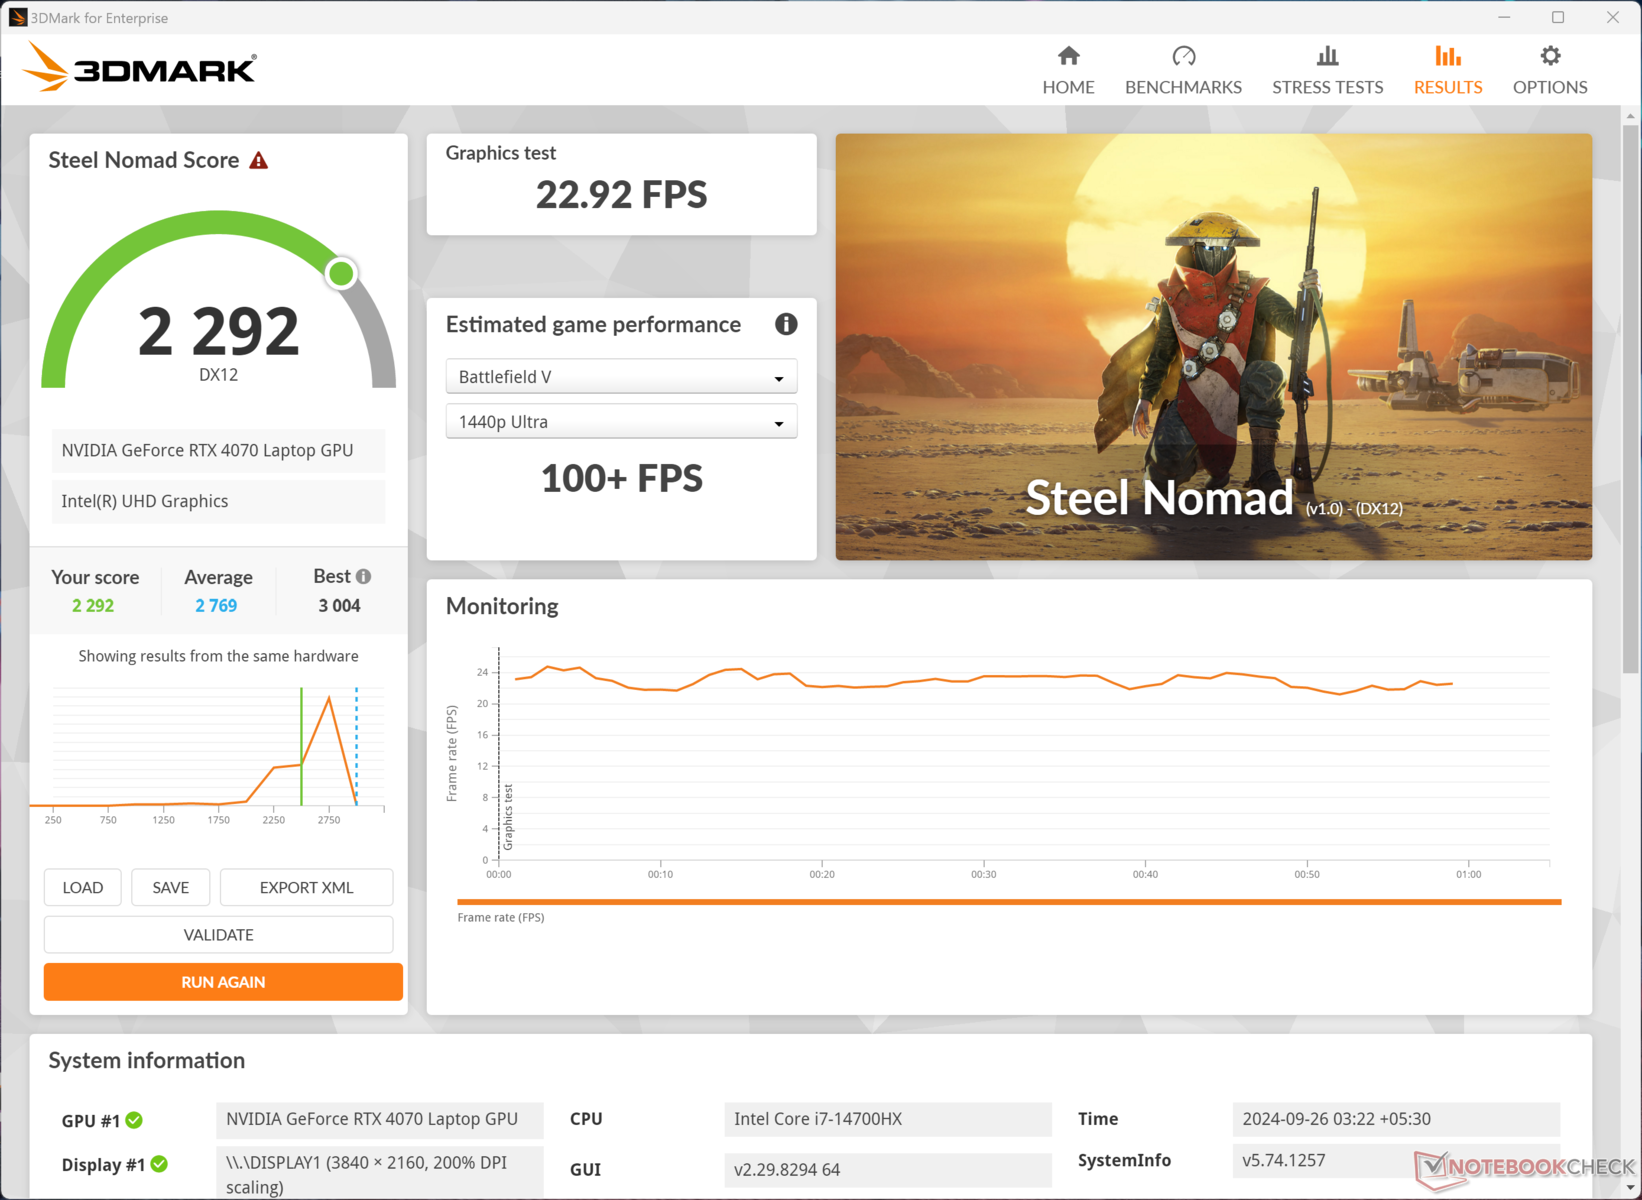
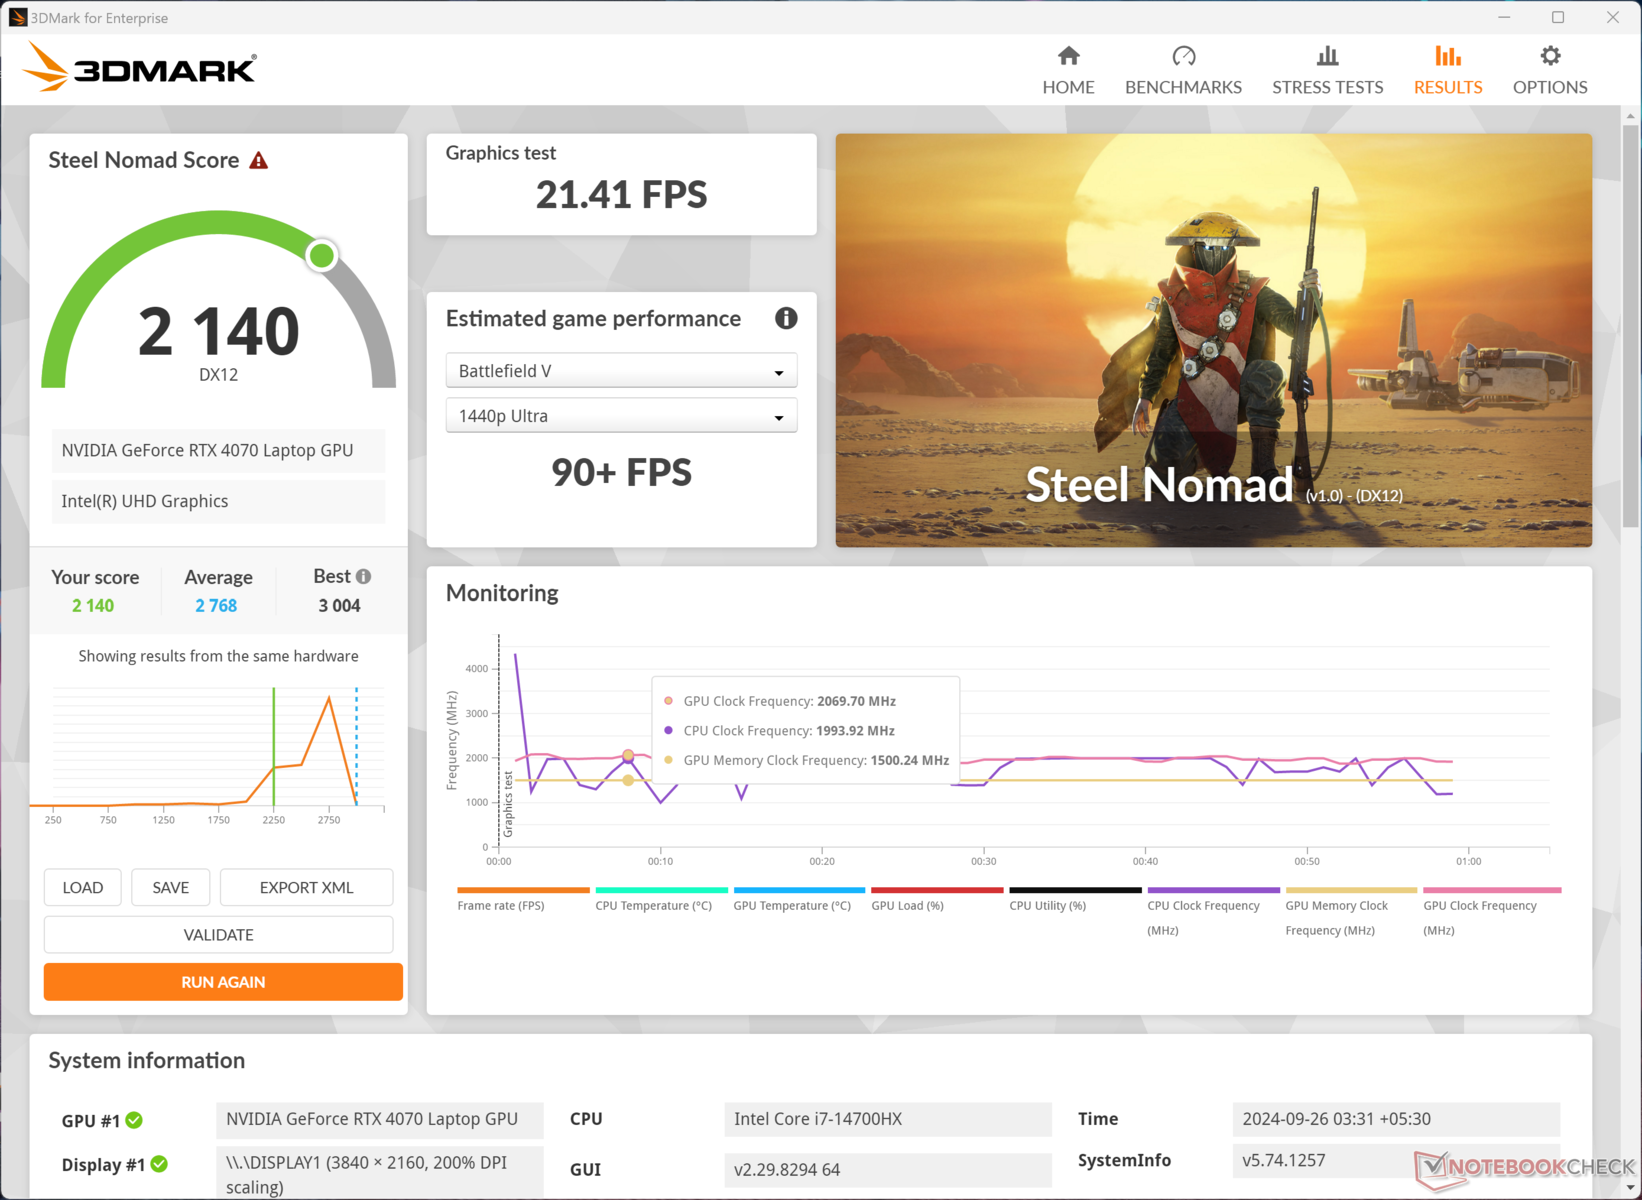
Zauważalny jest spadek wydajności GPU podczas przełączania się pomiędzy różnymi profilami zasilania. W 3DMark Steel Nomad, Sword 16 uzyskał 2643 punktów na profilu Extreme Performance. Liczba ta spada do 2,140 (-19%) na profilu Silent.

| 3DMark Cloud Gate Standard Score | 59887 pkt. | |
| 3DMark Fire Strike Score | 28285 pkt. | |
| 3DMark Fire Strike Extreme Score | 14311 pkt. | |
| 3DMark Steel Nomad Score | 2991 pkt. | |
Pomoc | ||
| Blender / v3.3 Classroom OPTIX/RTX | |
| HP Victus 16-r0077ng | |
| HP Omen 17-db0079ng | |
| Przeciętny NVIDIA GeForce RTX 4070 Laptop GPU (18 - 30, n=67) | |
| Średnia w klasie Gaming (10 - 95, n=143, ostatnie 2 lata) | |
| MSI Sword 16 HX B14VGKG | |
| Asus ROG Strix G17 G713PI | |
| Alienware m16 R2 | |
| Lenovo Legion 7 16 IRX G9 | |
| Acer Predator Helios Neo 16 (2024) | |
| Blender / v3.3 Classroom CUDA | |
| Średnia w klasie Gaming (16 - 175, n=145, ostatnie 2 lata) | |
| HP Victus 16-r0077ng | |
| Przeciętny NVIDIA GeForce RTX 4070 Laptop GPU (32 - 50, n=66) | |
| Asus ROG Strix G17 G713PI | |
| MSI Sword 16 HX B14VGKG | |
| Alienware m16 R2 | |
| Acer Predator Helios Neo 16 (2024) | |
| HP Omen 17-db0079ng | |
| Lenovo Legion 7 16 IRX G9 | |
| Blender / v3.3 Classroom CPU | |
| HP Victus 16-r0077ng | |
| HP Omen 17-db0079ng | |
| Średnia w klasie Gaming (123 - 962, n=150, ostatnie 2 lata) | |
| Alienware m16 R2 | |
| Przeciętny NVIDIA GeForce RTX 4070 Laptop GPU (158 - 440, n=66) | |
| MSI Sword 16 HX B14VGKG | |
| Acer Predator Helios Neo 16 (2024) | |
| Lenovo Legion 7 16 IRX G9 | |
| Asus ROG Strix G17 G713PI | |
* ... im mniej tym lepiej
Wydajność w grach
Jako laptop do gier, Sword 16 HX ma jeden cel... grać w gry. Nic dziwnego, że potrafi to robić całkiem dobrze. Pomijając słaby ekran, kombinacja CPU/GPU może z łatwością uruchomić nawet najbardziej wymagające tytuły z przyzwoitą liczbą klatek na sekundę.
Wszystkie testowane przez nas tytuły radziły sobie całkiem dobrze w rozdzielczości 1440p. z drugiej strony, granie w rozdzielczości 4K może być wyzwaniem, szczególnie w przypadku nowszych tytułów. Jeśli koniecznie chcą Państwo grać w 4K, to trzeba albo wydać trochę więcej gotówki na laptopa z RTX 4080/4090, albo polegać na DLSS/FSR lub nawet XeSS.
| The Witcher 3 - 1920x1080 Ultra Graphics & Postprocessing (HBAO+) | |
| Acer Predator Helios Neo 16 (2024) | |
| MSI Sword 16 HX B14VGKG | |
| Średnia w klasie Gaming (18.4 - 214, n=119, ostatnie 2 lata) | |
| Alienware m16 R2 | |
| Asus ROG Strix G17 G713PI | |
| HP Victus 16-r0077ng | |
| Lenovo Legion 7 16 IRX G9 | |
| GTA V - 1920x1080 Highest Settings possible AA:4xMSAA + FX AF:16x | |
| Acer Predator Helios Neo 16 (2024) | |
| Lenovo Legion 7 16 IRX G9 | |
| Asus ROG Strix G17 G713PI | |
| HP Victus 16-r0077ng | |
| Średnia w klasie Gaming (12.1 - 168.2, n=132, ostatnie 2 lata) | |
| MSI Sword 16 HX B14VGKG | |
| HP Omen 17-db0079ng | |
| Final Fantasy XV Benchmark - 1920x1080 High Quality | |
| Acer Predator Helios Neo 16 (2024) | |
| Lenovo Legion 7 16 IRX G9 | |
| Alienware m16 R2 | |
| HP Omen 17-db0079ng | |
| Średnia w klasie Gaming (19.2 - 201, n=144, ostatnie 2 lata) | |
| Asus ROG Strix G17 G713PI | |
| MSI Sword 16 HX B14VGKG | |
| HP Victus 16-r0077ng | |
| GTA V | |
| 1920x1080 Highest Settings possible AA:4xMSAA + FX AF:16x | |
| Acer Predator Helios Neo 16 (2024) | |
| Lenovo Legion 7 16 IRX G9 | |
| Asus ROG Strix G17 G713PI | |
| HP Victus 16-r0077ng | |
| Średnia w klasie Gaming (12.1 - 168.2, n=132, ostatnie 2 lata) | |
| Przeciętny NVIDIA GeForce RTX 4070 Laptop GPU (48.3 - 141.6, n=62) | |
| MSI Sword 16 HX B14VGKG | |
| HP Omen 17-db0079ng | |
| 2560x1440 Highest Settings possible AA:4xMSAA + FX AF:16x | |
| Średnia w klasie Gaming (36.9 - 163.3, n=82, ostatnie 2 lata) | |
| Acer Predator Helios Neo 16 (2024) | |
| Lenovo Legion 7 16 IRX G9 | |
| HP Omen 17-db0079ng | |
| MSI Sword 16 HX B14VGKG | |
| Przeciętny NVIDIA GeForce RTX 4070 Laptop GPU (36.9 - 102.2, n=50) | |
| 3840x2160 High/On (Advanced Graphics Off) AA:FX AF:8x | |
| Średnia w klasie Gaming (68.8 - 183.2, n=31, ostatnie 2 lata) | |
| MSI Sword 16 HX B14VGKG | |
| Przeciętny NVIDIA GeForce RTX 4070 Laptop GPU (53 - 99.8, n=16) | |
GraCyberpunk 2077 2.1 działała bez żadnych problemów przez przedłużoną 20-minutową pętlę. W międzyczasie zdarzały się spadki liczby klatek na sekundę, ale były one niewielkie i nie wpłynęły w żaden znaczący sposób na wrażenia z rozgrywki.
Cyberpunk 2077 1080p Ultra FPS Chart
| low | med. | high | ultra | QHD DLSS | QHD | 4K DLSS | 4K | |
|---|---|---|---|---|---|---|---|---|
| GTA V (2015) | 174.4 | 171.6 | 164.5 | 105.9 | 87.6 | 88.8 | ||
| The Witcher 3 (2015) | 428 | 328 | 239 | 125.4 | 91.1 | |||
| Dota 2 Reborn (2015) | 194.7 | 174.6 | 170.6 | 158.6 | 134.6 | |||
| Final Fantasy XV Benchmark (2018) | 215 | 151.9 | 110.6 | 45 | ||||
| X-Plane 11.11 (2018) | 187.5 | 164.7 | 128.4 | 112.8 | ||||
| Far Cry 5 (2018) | 173 | 153 | 145 | 138 | 113 | 61 | ||
| Strange Brigade (2018) | 420 | 282 | 233 | 195.7 | 133.9 | 66.7 | ||
| Far Cry 6 (2021) | 150.2 | 132.1 | 120.8 | 96.3 | 74.5 | 12.8 | ||
| Baldur's Gate 3 (2023) | 155.4 | 132.5 | 113.8 | 113.6 | 85.7 | 66.4 | 43.5 | |
| Cyberpunk 2077 2.2 Phantom Liberty (2023) | 116.3 | 110.2 | 94.1 | 83.6 | 51.8 | 21.9 | ||
| F1 24 (2024) | 249 | 212 | 193.9 | 68.9 | 44.8 | 35.4 | 21.8 | |
| Black Myth: Wukong (2024) | 89.8 | 68.5 | 54.1 | 34.7 | 39.2 | 25.7 | 26.2 | 12.6 |
Emisje: Głośna i gorąca praca
Hałas systemowy
Jedną z pierwszych rzeczy, które zauważyliśmy w Sword 16, jest głośność wentylatorów pod obciążeniem. Nawet po umieszczeniu w odległości kilku stóp, hałas może sięgać nawet 55 dB(A) podczas grania. Niekoniecznie jest to zła rzecz, ponieważ laptop potrzebuje całego chłodzenia, jakie może uzyskać, aby utrzymać temperaturę w ryzach.
Hałas
| luz |
| 23.31 / 23.31 / 23.31 dB |
| obciążenie |
| 42.71 / 50.34 dB |
 | ||
30 dB cichy 40 dB(A) słyszalny 50 dB(A) irytujący |
||
min: | ||
| Tryb wydajności (PL1 / PL2) | Bezczynność dB(A) | Obciążenie średnie dB(A) | Obciążenie maksymalne dB(A) | Cyberpunk 2077 1080p Ultra dB(A) |
|---|---|---|---|---|
| Cichy (45 / 60 W) | 23.31 | 30.35 | 36.74 | 36.72 / 44 fps |
| Zrównoważony (60 / 80 W) | 23.31 | 42.30 | 42.61 | 42.20 / 65 fps |
| Ekstremalne (100/120 W) | 23.44 | 42.71 | 50.34 | 50.40 / 82 fps |
| CoolerBoost (100 / 120 W) | 55.02 | 55.02 | 55.02 | 55.02 / 82 fps |
| MSI Sword 16 HX B14VGKG i7-14700HX, NVIDIA GeForce RTX 4070 Laptop GPU | HP Omen 17-db0079ng R7 8845HS, NVIDIA GeForce RTX 4070 Laptop GPU | Lenovo Legion 7 16 IRX G9 i9-14900HX, NVIDIA GeForce RTX 4070 Laptop GPU | Acer Predator Helios Neo 16 (2024) i7-14700HX, NVIDIA GeForce RTX 4070 Laptop GPU | Alienware m16 R2 Ultra 7 155H, NVIDIA GeForce RTX 4070 Laptop GPU | Asus ROG Strix G17 G713PI R9 7945HX, NVIDIA GeForce RTX 4070 Laptop GPU | HP Victus 16-r0077ng i7-13700H, NVIDIA GeForce RTX 4070 Laptop GPU | |
|---|---|---|---|---|---|---|---|
| Noise | -12% | -1% | -18% | -5% | -12% | -13% | |
| wyłączone / środowisko * | 23.31 | 25 -7% | 24.5 -5% | 25.2 -8% | 24.7 -6% | 25 -7% | 25 -7% |
| Idle Minimum * | 23.31 | 25 -7% | 24.5 -5% | 27.8 -19% | 25.3 -9% | 26 -12% | 28 -20% |
| Idle Average * | 23.31 | 29 -24% | 24.5 -5% | 32 -37% | 25.3 -9% | 29 -24% | 29 -24% |
| Idle Maximum * | 23.31 | 33 -42% | 24.5 -5% | 29.6 -27% | 25.3 -9% | 30 -29% | 30 -29% |
| Load Average * | 42.71 | 45 -5% | 34.8 19% | 45.2 -6% | 31.7 26% | 46 -8% | 43 -1% |
| Cyberpunk 2077 ultra * | 50.4 | 48 5% | |||||
| Load Maximum * | 50.34 | 52 -3% | 54.1 -7% | 55.8 -11% | 62 -23% | 47 7% | 48 5% |
| Witcher 3 ultra * | 54.1 | 53.8 | 46 | 46 |
* ... im mniej tym lepiej
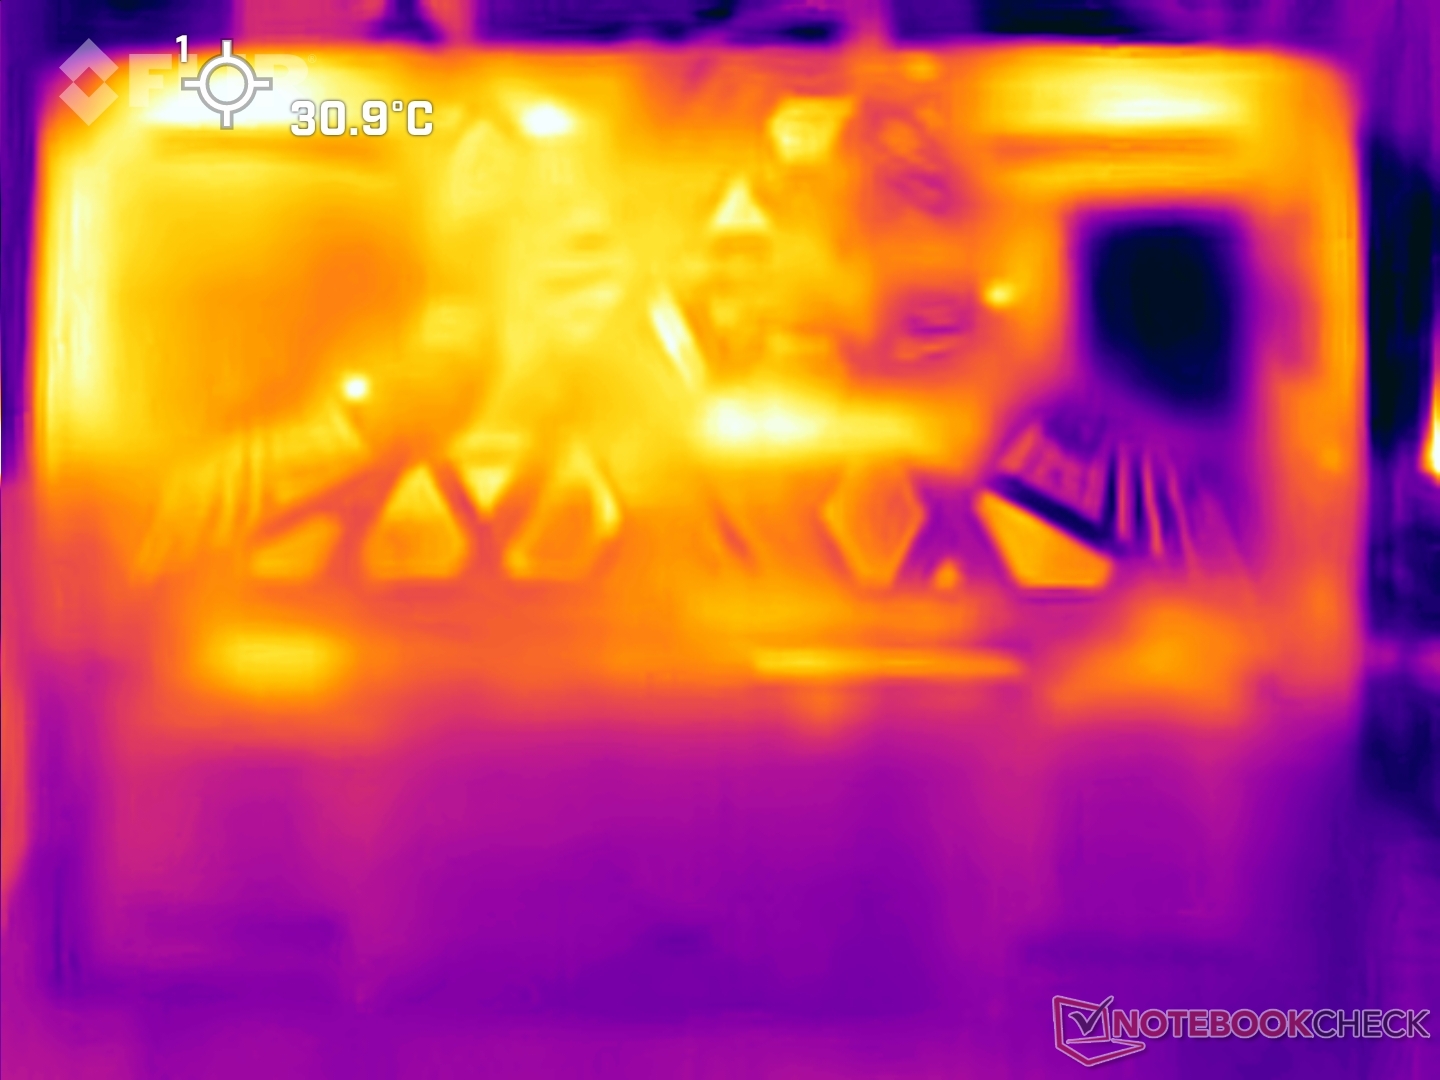
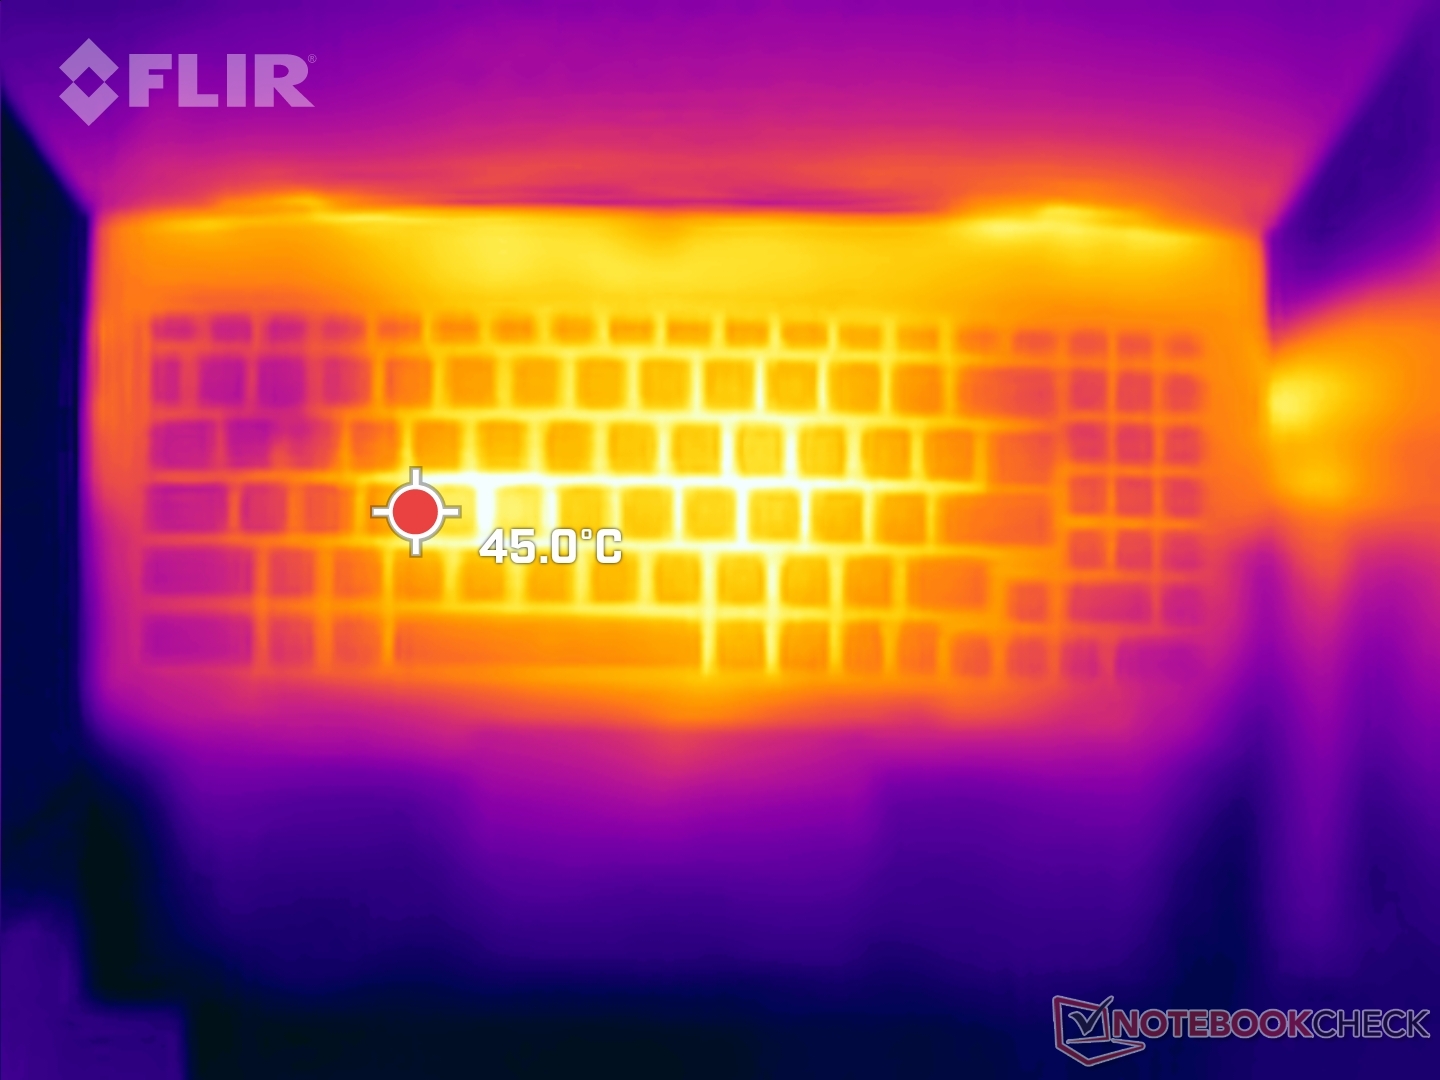
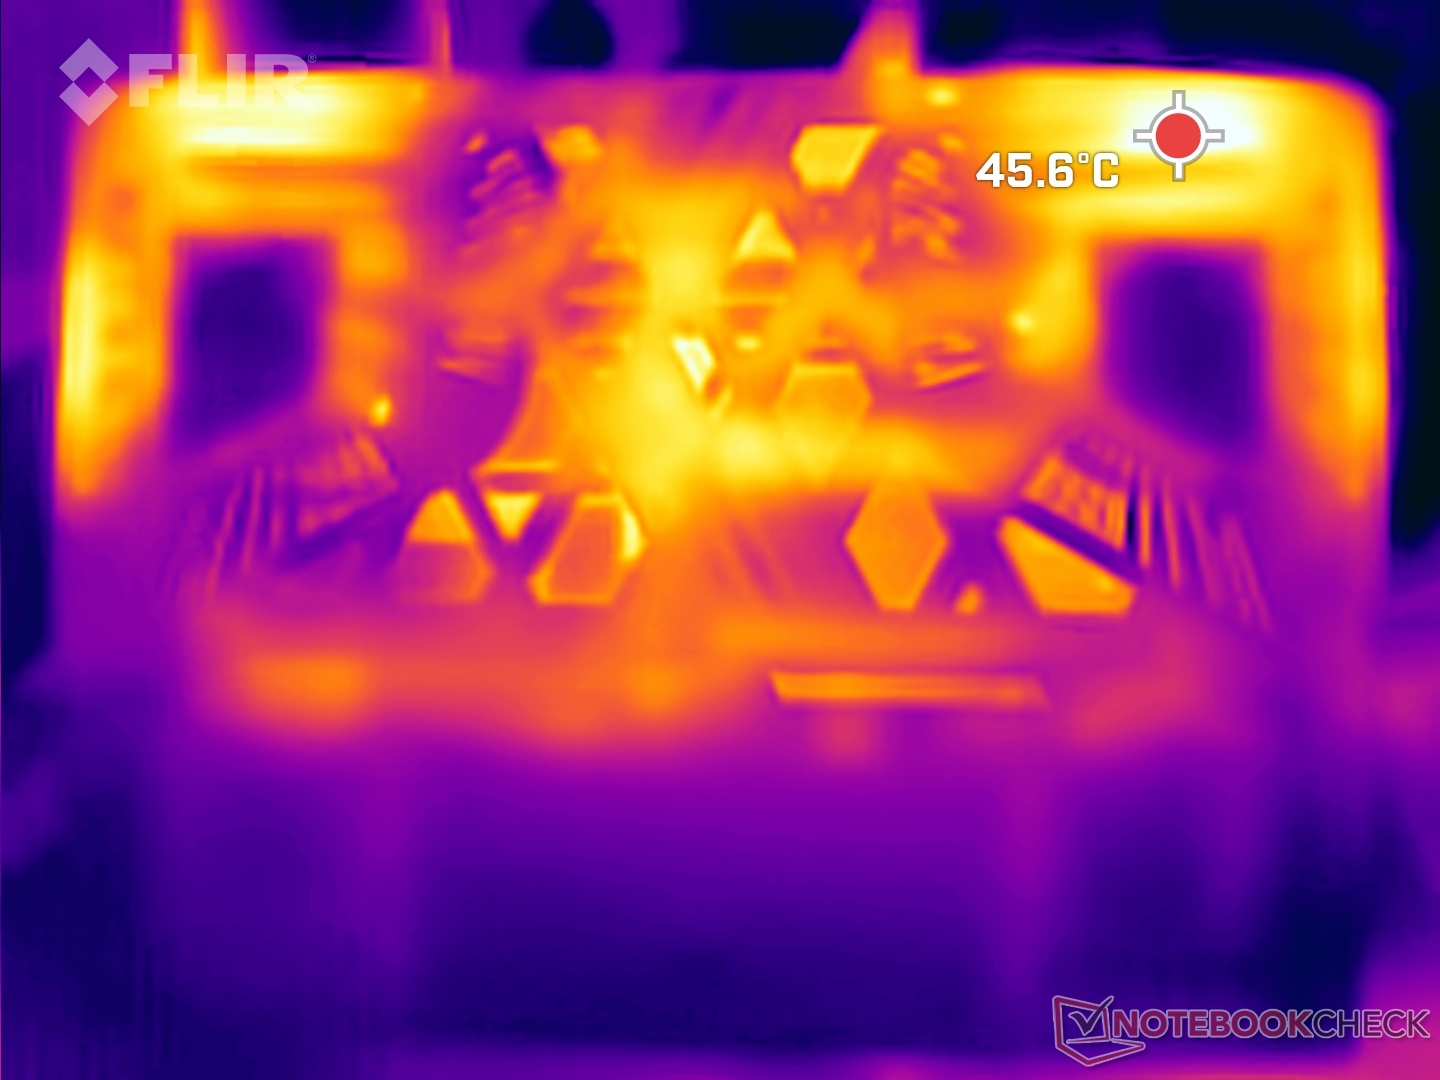
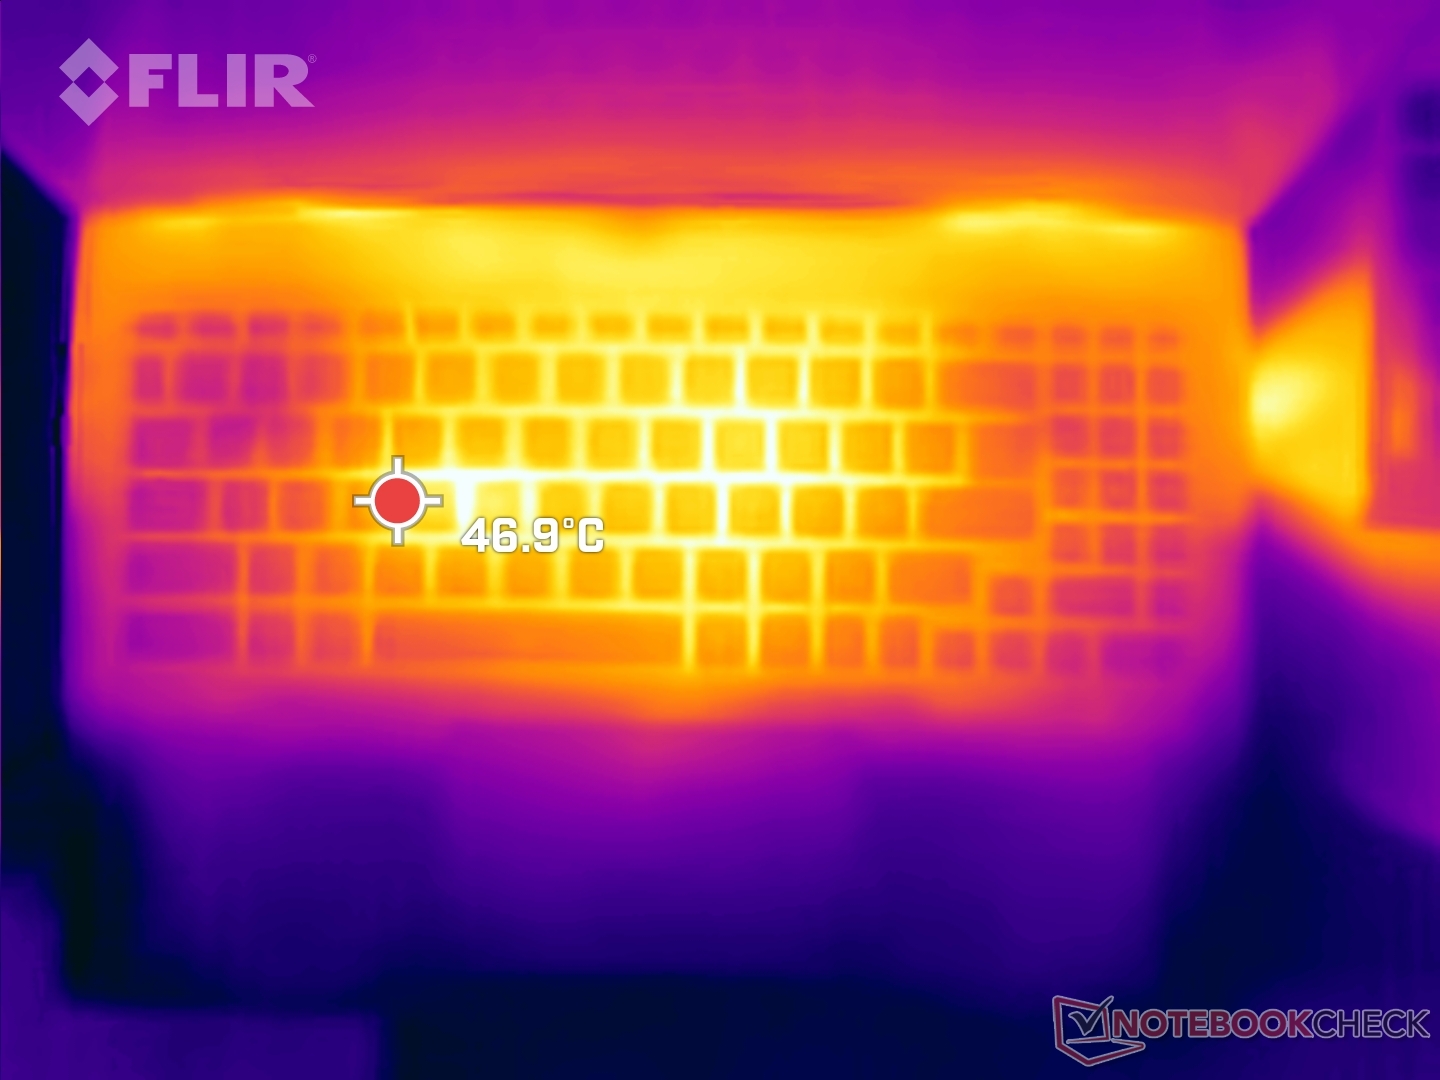
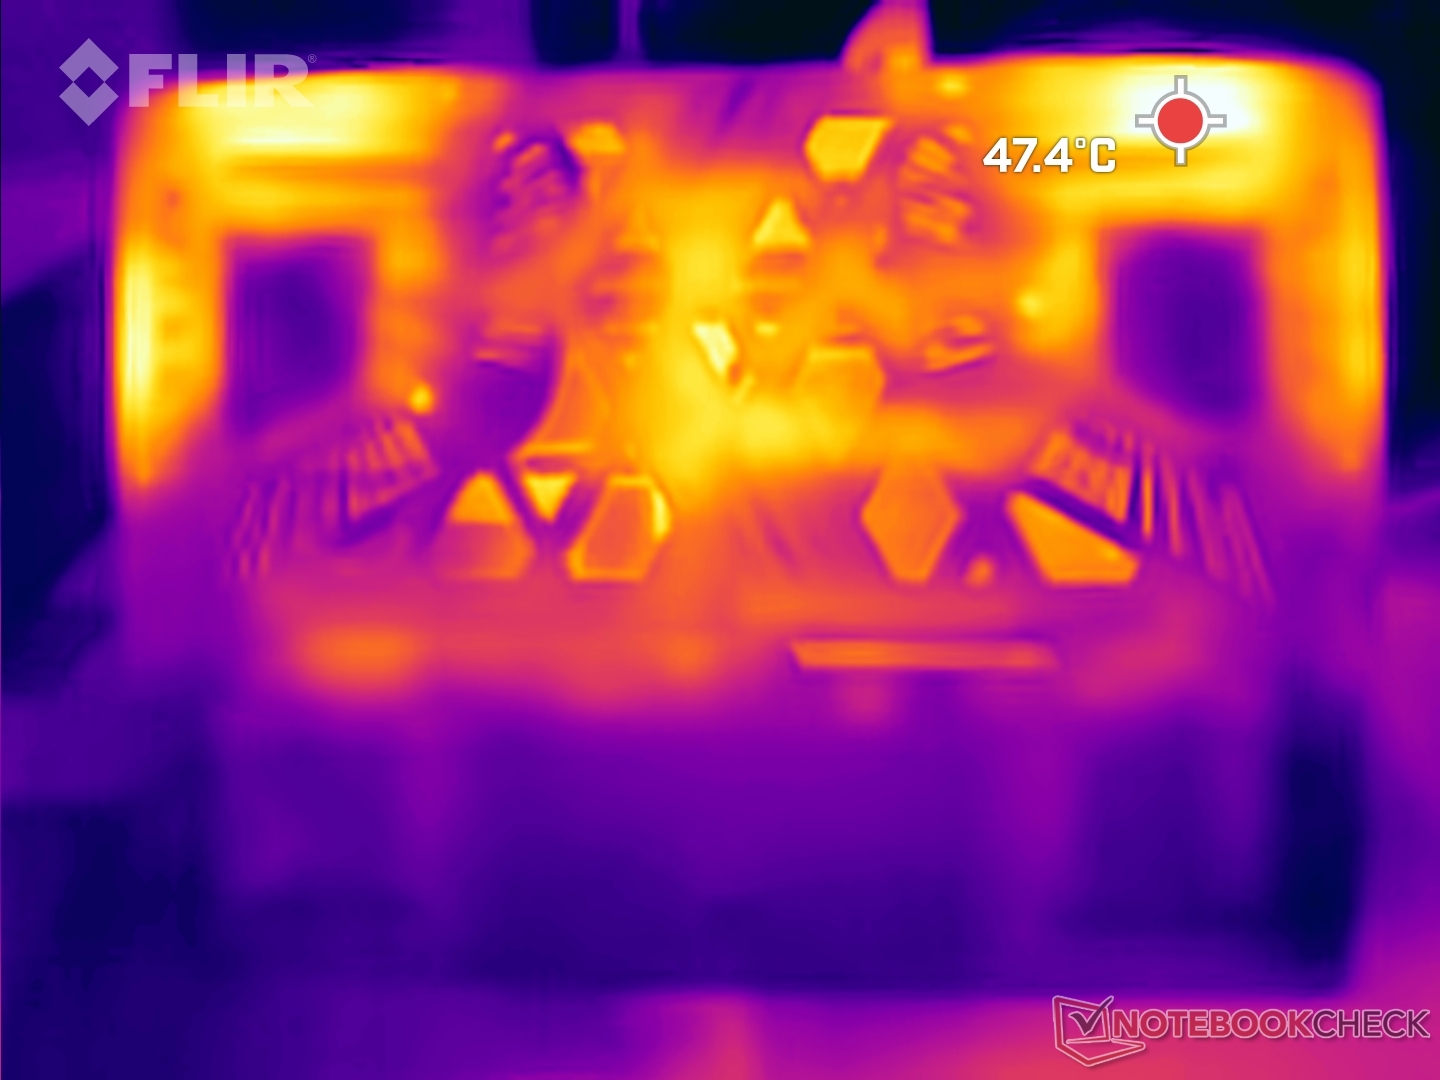
Temperatura
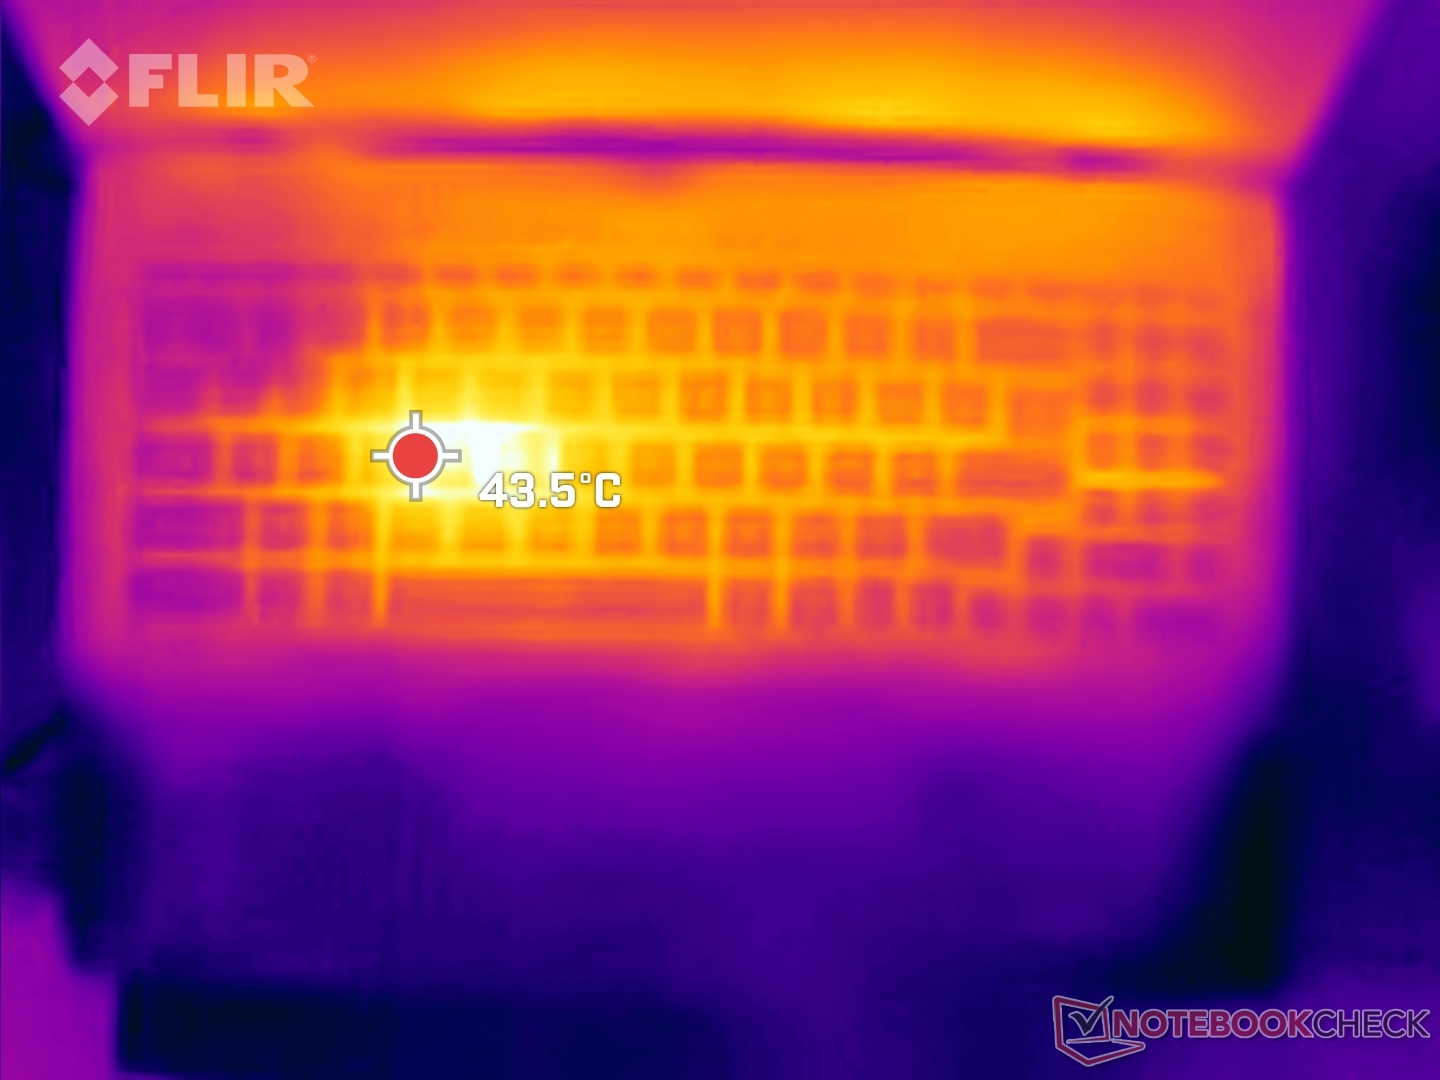
Wszystkie wentylatory i urządzenia odprowadzające ciepło powodują, że Sword 16 staje się gorący w dotyku podczas grania. W Cyberpunk 2077 2.1 można wyczuć, że klawiatura nagrzewa się jeszcze bardziej.
Może ona z łatwością osiągnąć nawet 45 °C w pobliżu klawiatury i 48 °C w lewym górnym rogu, tuż obok złącza zasilania.
(-) Maksymalna temperatura w górnej części wynosi 47.8 °C / 118 F, w porównaniu do średniej 40.4 °C / 105 F , począwszy od 21.2 do 68.8 °C dla klasy Gaming.
(-) Dno nagrzewa się maksymalnie do 45.8 °C / 114 F, w porównaniu do średniej 43.2 °C / 110 F
(+) W stanie bezczynności średnia temperatura górnej części wynosi 31.2 °C / 88 F, w porównaniu ze średnią temperaturą urządzenia wynoszącą 33.9 °C / ### class_avg_f### F.
(-) 3: The average temperature for the upper side is 40.4 °C / 105 F, compared to the average of 33.9 °C / 93 F for the class Gaming.
(+) Podpórki pod nadgarstki i touchpad są chłodniejsze niż temperatura skóry i maksymalnie 31.8 °C / 89.2 F i dlatego są chłodne w dotyku.
(-) Średnia temperatura obszaru podparcia dłoni w podobnych urządzeniach wynosiła 28.9 °C / 84 F (-2.9 °C / -5.2 F).
| MSI Sword 16 HX B14VGKG Intel Core i7-14700HX, NVIDIA GeForce RTX 4070 Laptop GPU | HP Omen 17-db0079ng AMD Ryzen 7 8845HS, NVIDIA GeForce RTX 4070 Laptop GPU | Lenovo Legion 7 16 IRX G9 Intel Core i9-14900HX, NVIDIA GeForce RTX 4070 Laptop GPU | Acer Predator Helios Neo 16 (2024) Intel Core i7-14700HX, NVIDIA GeForce RTX 4070 Laptop GPU | Alienware m16 R2 Intel Core Ultra 7 155H, NVIDIA GeForce RTX 4070 Laptop GPU | Asus ROG Strix G17 G713PI AMD Ryzen 9 7945HX, NVIDIA GeForce RTX 4070 Laptop GPU | HP Victus 16-r0077ng Intel Core i7-13700H, NVIDIA GeForce RTX 4070 Laptop GPU | |
|---|---|---|---|---|---|---|---|
| Heat | 13% | 9% | -7% | -9% | 6% | -5% | |
| Maximum Upper Side * | 47.8 | 44 8% | 43.7 9% | 58 -21% | 44.8 6% | 42 12% | 51 -7% |
| Maximum Bottom * | 45.8 | 45 2% | 42.9 6% | 45.2 1% | 48 -5% | 41 10% | 54 -18% |
| Idle Upper Side * | 38.6 | 26 33% | 29.1 25% | 31.1 19% | 37.2 4% | 33 15% | 37 4% |
| Idle Bottom * | 29.6 | 27 9% | 30.6 -3% | 37.2 -26% | 42 -42% | 34 -15% | 29 2% |
* ... im mniej tym lepiej
Test warunków skrajnych
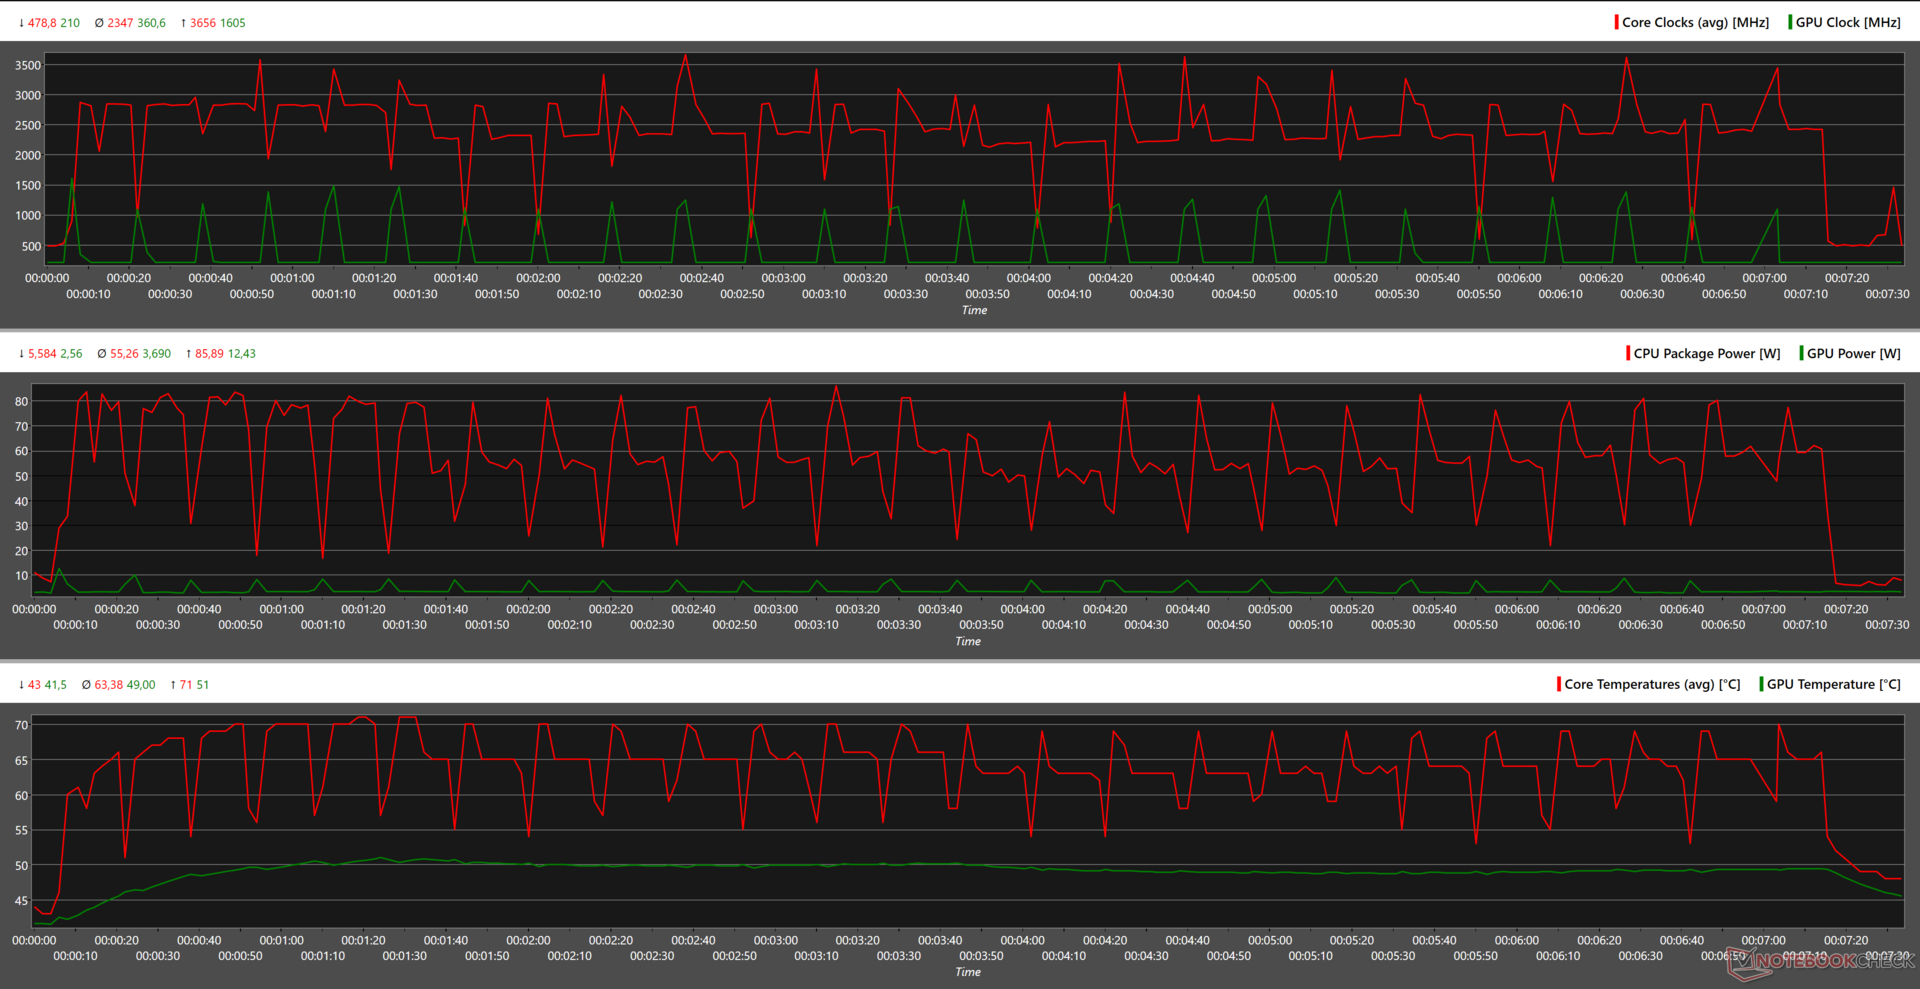
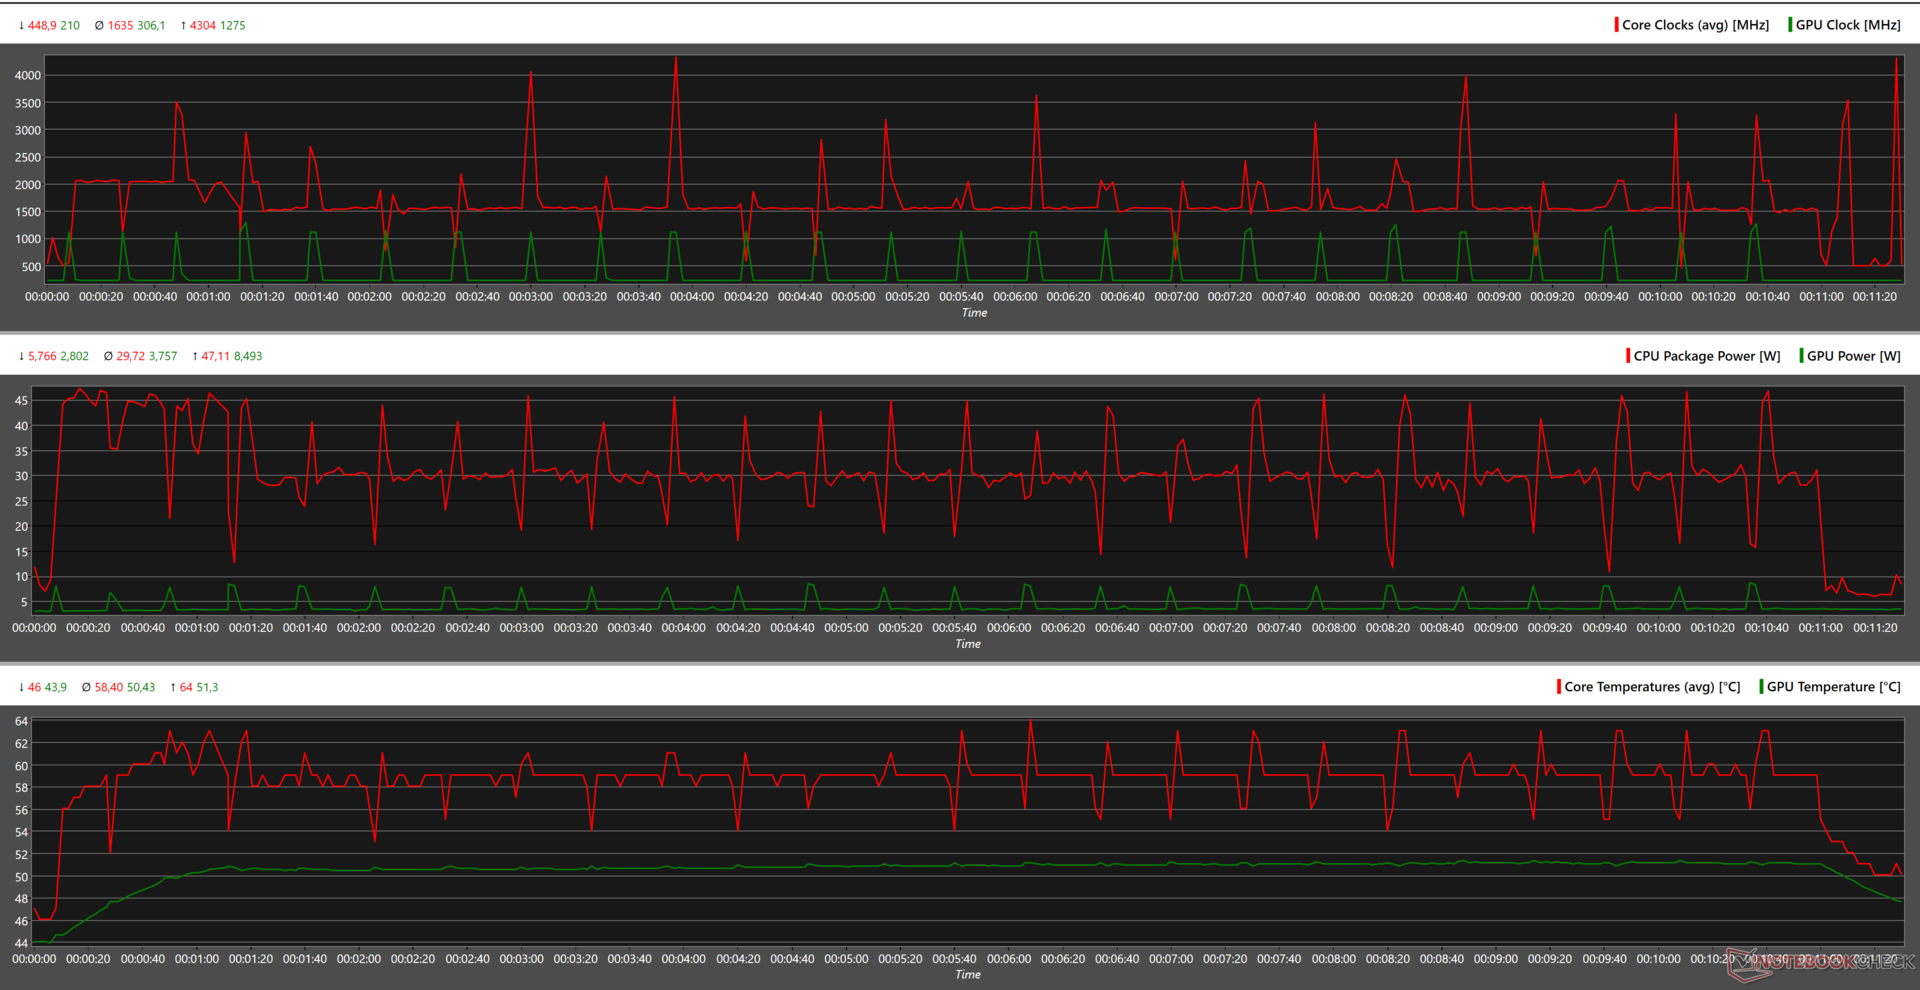
Uderzenie w Sword 16 HX połączonym obciążeniem Prime95 i Furmark popycha jego CPU i GPU do granic możliwości. Procesor Core i7-14700HX zaczyna od 4,3 GHz, a następnie osiąga 2,6 GHz. Karta graficzna Nvidia GeForce RTX 4070 utrzymuje stabilną częstotliwość 2,0 GHz przez cały czas trwania testu.
CPU i GPU walczą o moc, przy czym ten pierwszy pobiera stałe 62 waty, a drugi stara się osiągnąć szczytową wartość 115 watów.
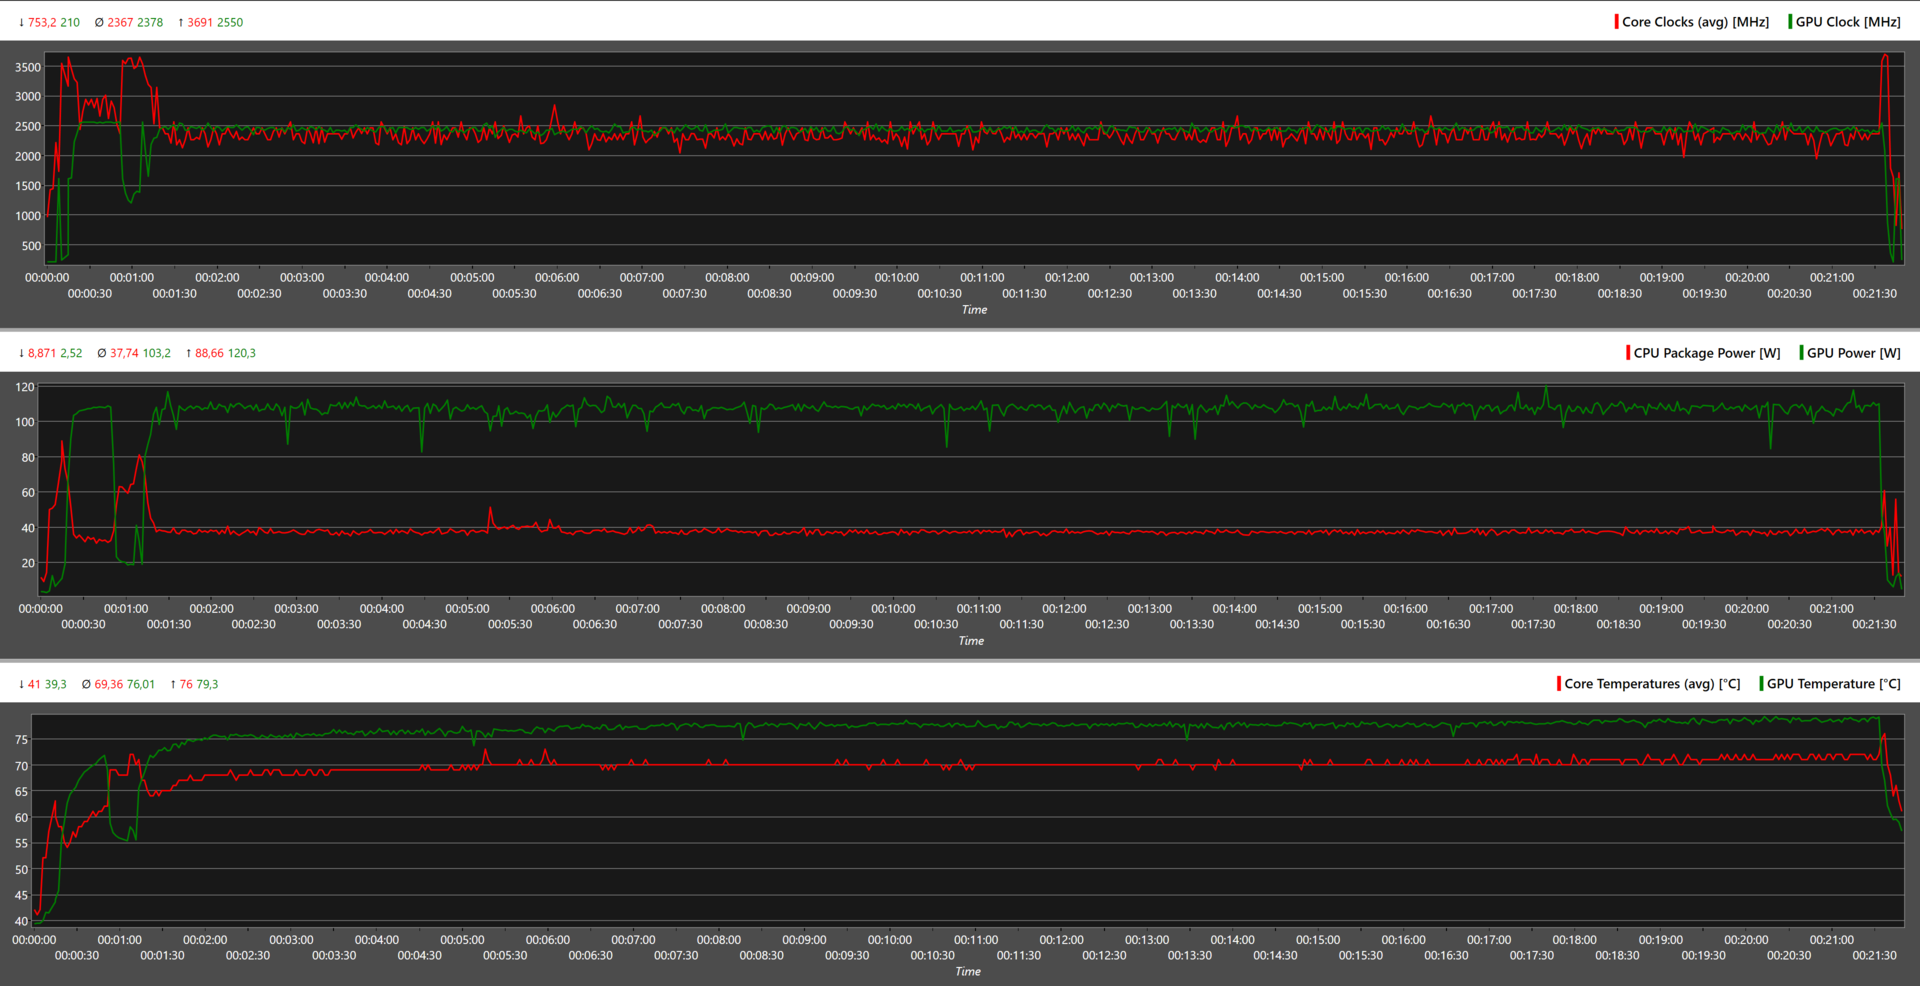
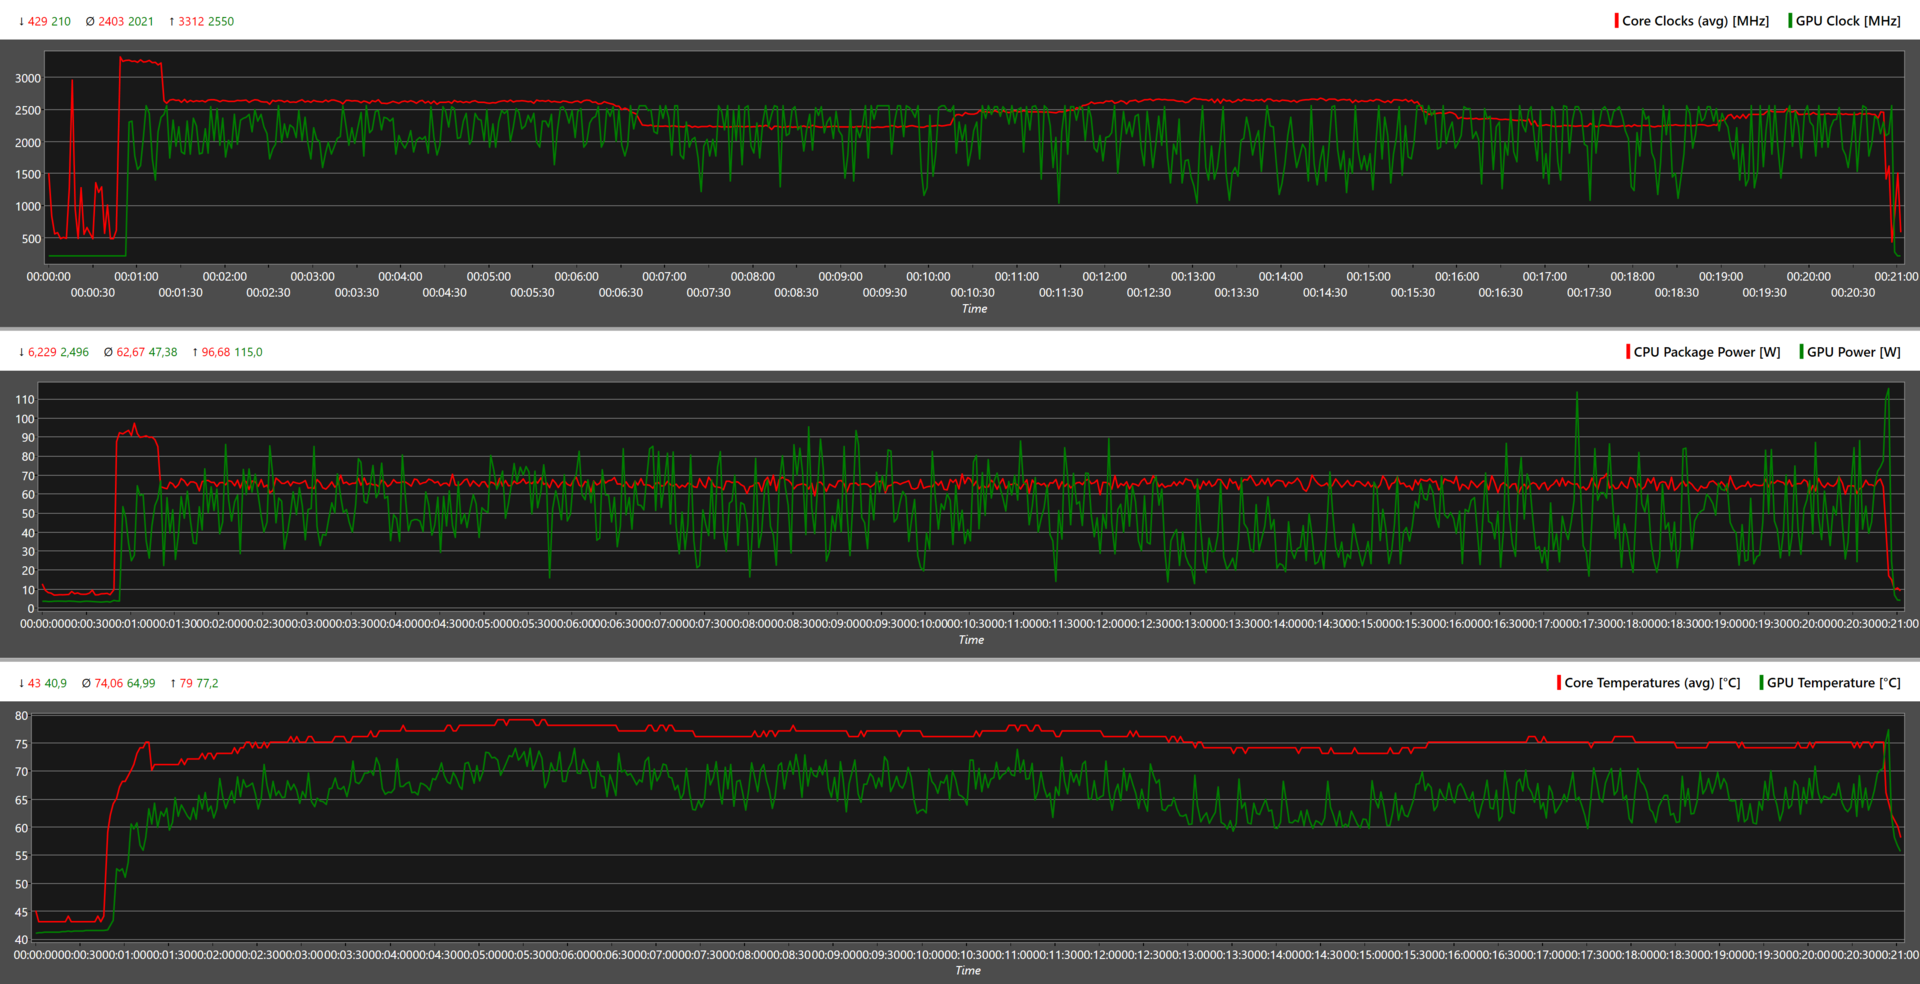
| TaktowanieCPU (GHz) | Taktowanie GPU (MHz) | Średnia temperatura CPU (°C) | Średnia temperatura GPU (°C) | |
| System bezczynności | 0.726 | 769 | 43 | 41 |
| Prime95 Stress | 3.5 | 60.8 | 79 | 60 |
| Prime95 + FurMark Stress | 2.6 | 2,000 | 77 | 71 |
| Cyberpunk 2077 Stres | 2.6 | 2,300 | 73 | 83 |
Głośniki
Jako laptop średniej klasy, MSI Sword 16 idzie na kompromis w kwestii jakości głośników. Jego basy są rozczarowujące, a średnie i wysokie są prawie akceptowalne. Nawet jeśli chcą Państwo korzystać z wbudowanych głośników, istnieje ryzyko, że zostaną one zagłuszone przez przytłaczający hałas wentylatora. Na szczęście można podłączyć własne urządzenia audio za pomocą dołączonego gniazda audio 3,5 mm, Bluetooth 5.3, a nawet USB-C.
MSI Sword 16 HX B14VGKG analiza dźwięku
(±) | głośność głośnika jest średnia, ale dobra (77.9 dB)
Bas 100 - 315 Hz
(-) | prawie brak basu - średnio 19.7% niższa od mediany
(±) | liniowość basu jest średnia (13.5% delta do poprzedniej częstotliwości)
Średnie 400 - 2000 Hz
(+) | zbalansowane środki średnie - tylko 3.4% od mediany
(+) | średnie są liniowe (6.3% delta do poprzedniej częstotliwości)
Wysokie 2–16 kHz
(+) | zrównoważone maksima - tylko 2.3% od mediany
(+) | wzloty są liniowe (4.8% delta do poprzedniej częstotliwości)
Ogólnie 100 - 16.000 Hz
(±) | liniowość ogólnego dźwięku jest średnia (15.2% różnicy w stosunku do mediany)
W porównaniu do tej samej klasy
» 31% wszystkich testowanych urządzeń w tej klasie było lepszych, 6% podobnych, 63% gorszych
» Najlepszy miał deltę 6%, średnia wynosiła ###średnia###%, najgorsza wynosiła 132%
W porównaniu do wszystkich testowanych urządzeń
» 20% wszystkich testowanych urządzeń było lepszych, 4% podobnych, 77% gorszych
» Najlepszy miał deltę 4%, średnia wynosiła ###średnia###%, najgorsza wynosiła 134%
Apple MacBook Pro 16 2021 M1 Pro analiza dźwięku
(+) | głośniki mogą odtwarzać stosunkowo głośno (84.7 dB)
Bas 100 - 315 Hz
(+) | dobry bas - tylko 3.8% od mediany
(+) | bas jest liniowy (5.2% delta do poprzedniej częstotliwości)
Średnie 400 - 2000 Hz
(+) | zbalansowane środki średnie - tylko 1.3% od mediany
(+) | średnie są liniowe (2.1% delta do poprzedniej częstotliwości)
Wysokie 2–16 kHz
(+) | zrównoważone maksima - tylko 1.9% od mediany
(+) | wzloty są liniowe (2.7% delta do poprzedniej częstotliwości)
Ogólnie 100 - 16.000 Hz
(+) | ogólny dźwięk jest liniowy (4.6% różnicy w stosunku do mediany)
W porównaniu do tej samej klasy
» 0% wszystkich testowanych urządzeń w tej klasie było lepszych, 0% podobnych, 100% gorszych
» Najlepszy miał deltę 5%, średnia wynosiła ###średnia###%, najgorsza wynosiła 45%
W porównaniu do wszystkich testowanych urządzeń
» 0% wszystkich testowanych urządzeń było lepszych, 0% podobnych, 100% gorszych
» Najlepszy miał deltę 4%, średnia wynosiła ###średnia###%, najgorsza wynosiła 134%
Zarządzanie energią: Wysoki pobór mocy w trybie bezczynności z krótkimi czasami odtwarzania wideo
Zużycie energii
MSI Sword 16 HX może zużywać do 226 W mocy pod obciążeniem. Jego zasilacz ma moc znamionową 250 W i nie powinien mieć problemów z utrzymaniem go na najwyższym poziomie podczas długich sesji gamingowych.
Raptor Lake-HX (i ogólnie procesory Intel HX) nie zostały zaprojektowane z myślą o niskim poborze mocy, co potwierdza pobór mocy w stanie spoczynku wynoszący 22,39 W.
| wyłączony / stan wstrzymania | |
| luz | |
| obciążenie |
|
Legenda:
min: | |
| MSI Sword 16 HX B14VGKG i7-14700HX, NVIDIA GeForce RTX 4070 Laptop GPU, IPS, 1920x1200, 16" | HP Omen 17-db0079ng R7 8845HS, NVIDIA GeForce RTX 4070 Laptop GPU, IPS, 2560x1440, 17.3" | Lenovo Legion 7 16 IRX G9 i9-14900HX, NVIDIA GeForce RTX 4070 Laptop GPU, IPS, 3200x2000, 16" | Acer Predator Helios Neo 16 (2024) i7-14700HX, NVIDIA GeForce RTX 4070 Laptop GPU, LED, 2560x1600, 16" | Alienware m16 R2 Ultra 7 155H, NVIDIA GeForce RTX 4070 Laptop GPU, IPS, 2560x1600, 16" | Asus ROG Strix G17 G713PI R9 7945HX, NVIDIA GeForce RTX 4070 Laptop GPU, IPS, 2560x1440, 17.3" | HP Victus 16-r0077ng i7-13700H, NVIDIA GeForce RTX 4070 Laptop GPU, IPS, 1920x1080, 16.1" | Przeciętny NVIDIA GeForce RTX 4070 Laptop GPU | Średnia w klasie Gaming | |
|---|---|---|---|---|---|---|---|---|---|
| Power Consumption | 23% | 2% | -17% | 7% | -0% | 25% | 14% | 8% | |
| Idle Minimum * | 19.61 | 6 69% | 15.4 21% | 26.7 -36% | 8.1 59% | 15 24% | 8 59% | 12.8 ? 35% | 13.4 ? 32% |
| Idle Average * | 22.39 | 12 46% | 21.2 5% | 24.4 -9% | 13 42% | 20 11% | 13 42% | 17.8 ? 21% | 18.9 ? 16% |
| Idle Maximum * | 23.51 | 18 23% | 21.9 7% | 32.7 -39% | 40.3 -71% | 29 -23% | 22 6% | 24.3 ? -3% | 26.3 ? -12% |
| Load Average * | 114.8 | 71 38% | 128.5 -12% | 122.1 -6% | 79 31% | 121 -5% | 86 25% | 96.9 ? 16% | 102.7 ? 11% |
| Cyberpunk 2077 ultra * | 183.7 | 197 -7% | |||||||
| Cyberpunk 2077 ultra external monitor * | 181.1 | 191.8 -6% | |||||||
| Witcher 3 ultra * | 179.3 | 188.4 -5% | 190.6 -6% | 188.1 -5% | 179.8 -0% | 141.8 21% | |||
| Load Maximum * | 226 | 228 -1% | 239.1 -6% | 241 -7% | 254.9 -13% | 246 -9% | 233 -3% | 221 ? 2% | 244 ? -8% |
* ... im mniej tym lepiej
Power consumption: Cyberpunk 2077 / Stress test
Power consumption: External monitor
Żywotność baterii
Ponieważ MSI Sword 16 jest średniej klasy laptopem, musi zadowolić się jednostką 65 Wh, która nie wytrzymuje zbyt długo, gdy CPU/GPU są nawet lekko obciążone. Po włączeniu trybu "Super Battery" udało nam się uzyskać do 4 godzin i 40 minut pracy na baterii z ekranem ustawionym na 150 nitów.
Co ciekawe, czas pracy na baterii spadł podczas odtwarzania wideo H.246, prawdopodobnie dlatego, że laptop nie przełączał się automatycznie na iGPU. Jeśli muszą Państwo korzystać z laptopa z dala od sieci elektrycznej, zalecamy przełączenie na tryb "Silent" lub "Super Battery" w celu uzyskania optymalnej żywotności baterii.
| MSI Sword 16 HX B14VGKG i7-14700HX, NVIDIA GeForce RTX 4070 Laptop GPU, 65 Wh | HP Omen 17-db0079ng R7 8845HS, NVIDIA GeForce RTX 4070 Laptop GPU, 83 Wh | Lenovo Legion 7 16 IRX G9 i9-14900HX, NVIDIA GeForce RTX 4070 Laptop GPU, 99.9 Wh | Acer Predator Helios Neo 16 (2024) i7-14700HX, NVIDIA GeForce RTX 4070 Laptop GPU, 90.61 Wh | Alienware m16 R2 Ultra 7 155H, NVIDIA GeForce RTX 4070 Laptop GPU, 90 Wh | Asus ROG Strix G17 G713PI R9 7945HX, NVIDIA GeForce RTX 4070 Laptop GPU, 90 Wh | HP Victus 16-r0077ng i7-13700H, NVIDIA GeForce RTX 4070 Laptop GPU, 83 Wh | Średnia w klasie Gaming | |
|---|---|---|---|---|---|---|---|---|
| Czasy pracy | 109% | 142% | 38% | 41% | 8% | 52% | 113% | |
| H.264 | 129 | 462 258% | 620 381% | 242 88% | 166 29% | 447 ? 247% | ||
| WiFi v1.3 | 280 | 544 94% | 433 55% | 227 -19% | 483 73% | 255 -9% | 426 52% | 387 ? 38% |
| Cyberpunk 2077 ultra 150cd | 80 | 59 -26% | ||||||
| Load | 55 | 49 -11% | 79 44% | 60 9% | 58 5% | 84.5 ? 54% | ||
| Reader / Idle | 356 | 758 | 585 ? | |||||
| Witcher 3 ultra | 64 | 74.7 ? |
Za
Przeciw
Werdykt: Przyzwoity laptop do gier, który nie stara się przyćmić konkurencji
Naszym głównym problemem związanym z MSI Sword 16 HX jest jego ekran. Nie tylko dokładność odwzorowania kolorów jest poniżej normy, ale także czas reakcji jest wysoki, co sprawia, że nie jest on idealny do szybkich gier FPS. Na szczęście można to łatwo zniwelować podłączając zewnętrzny monitor.
Inne dziwactwa obejmują wątpliwie umiejscowione złącze zasilania, wolny dysk SSD i problemy z portem HDMI. Proszę sprawdzić wersję BIOS-u i ją zaktualizować. To powiedziawszy, jest on przeznaczony do grania w gry i spełnia to zadanie całkiem dobrze.
MSI Sword 16 HX dobrze wypełnia lukę między ceną a wydajnością dzięki połączeniu potężnego sprzętu i uczciwej ceny wywoławczej"
Póki co, zestaw Raptor Lake-HX plus Ada Lovelace to najlepsze połączenie, jakie można uzyskać w laptopie do gier. Zauroczenie Intela i AMD sztuczną inteligencją oznacza, że do przyszłego roku nie otrzymamy żadnych nowych SKU o dużej mocy. Bazując na obecnej trajektoriinowe procesory graficzne Nvidia/AMD do laptopów mogą pojawić się jeszcze dłużej.
Przy gwałtownie rosnących kosztach sprzętu PC, MSI Sword 16 HX może służyć jako przyzwoity zamiennik komputera stacjonarnego. Jeśli zależy Państwu na lepszym ekranie i pamięci masowej, warto rozważyć model Acer Predator Helios Neo 16 lub Lenovo Legion 7 16 G9. Oba kosztują mniej więcej tyle samo i są pod tym względem znacznie lepsze niż MSI Sword 16.
Cena i dostępność
Testowany powyżej wariant MSI Sword 16 HX jest obecnie dostępny w sprzedaży detalicznej za 1 38 990 jenów na Amazon India. Wersję o niższej specyfikacji z tym samym procesorem i kartą graficzną GeForce RTX 4060 można nabyć za 1 17 990 jenów.
Uwaga: Niedawno zaktualizowaliśmy nasz system oceny i wyniki wersji 8 nie są porównywalne z wynikami wersji 7. Więcej informacji znajdą Państwo tutaj .
MSI Sword 16 HX B14VGKG
- 08/10/2024 v8
Anil Ganti
 Total Sustainability Score:
 Przezroczystość
Wyboru urządzeń do recenzji dokonuje nasza redakcja. Próbka testowa została udostępniona autorowi jako pożyczka od producenta lub sprzedawcy detalicznego na potrzeby tej recenzji. Pożyczkodawca nie miał wpływu na tę recenzję, producent nie otrzymał też kopii tej recenzji przed publikacją. Nie było obowiązku publikowania tej recenzji. Nigdy nie przyjmujemy rekompensaty ani płatności w zamian za nasze recenzje. Jako niezależna firma medialna, Notebookcheck nie podlega władzy producentów, sprzedawców detalicznych ani wydawców.
Tak testuje Notebookcheck
Każdego roku Notebookcheck niezależnie sprawdza setki laptopów i smartfonów, stosując standardowe procedury, aby zapewnić porównywalność wszystkich wyników. Od około 20 lat stale rozwijamy nasze metody badawcze, ustanawiając przy tym standardy branżowe. W naszych laboratoriach testowych doświadczeni technicy i redaktorzy korzystają z wysokiej jakości sprzętu pomiarowego. Testy te obejmują wieloetapowy proces walidacji. Nasz kompleksowy system ocen opiera się na setkach uzasadnionych pomiarów i benchmarków, co pozwala zachować obiektywizm.Price comparison

