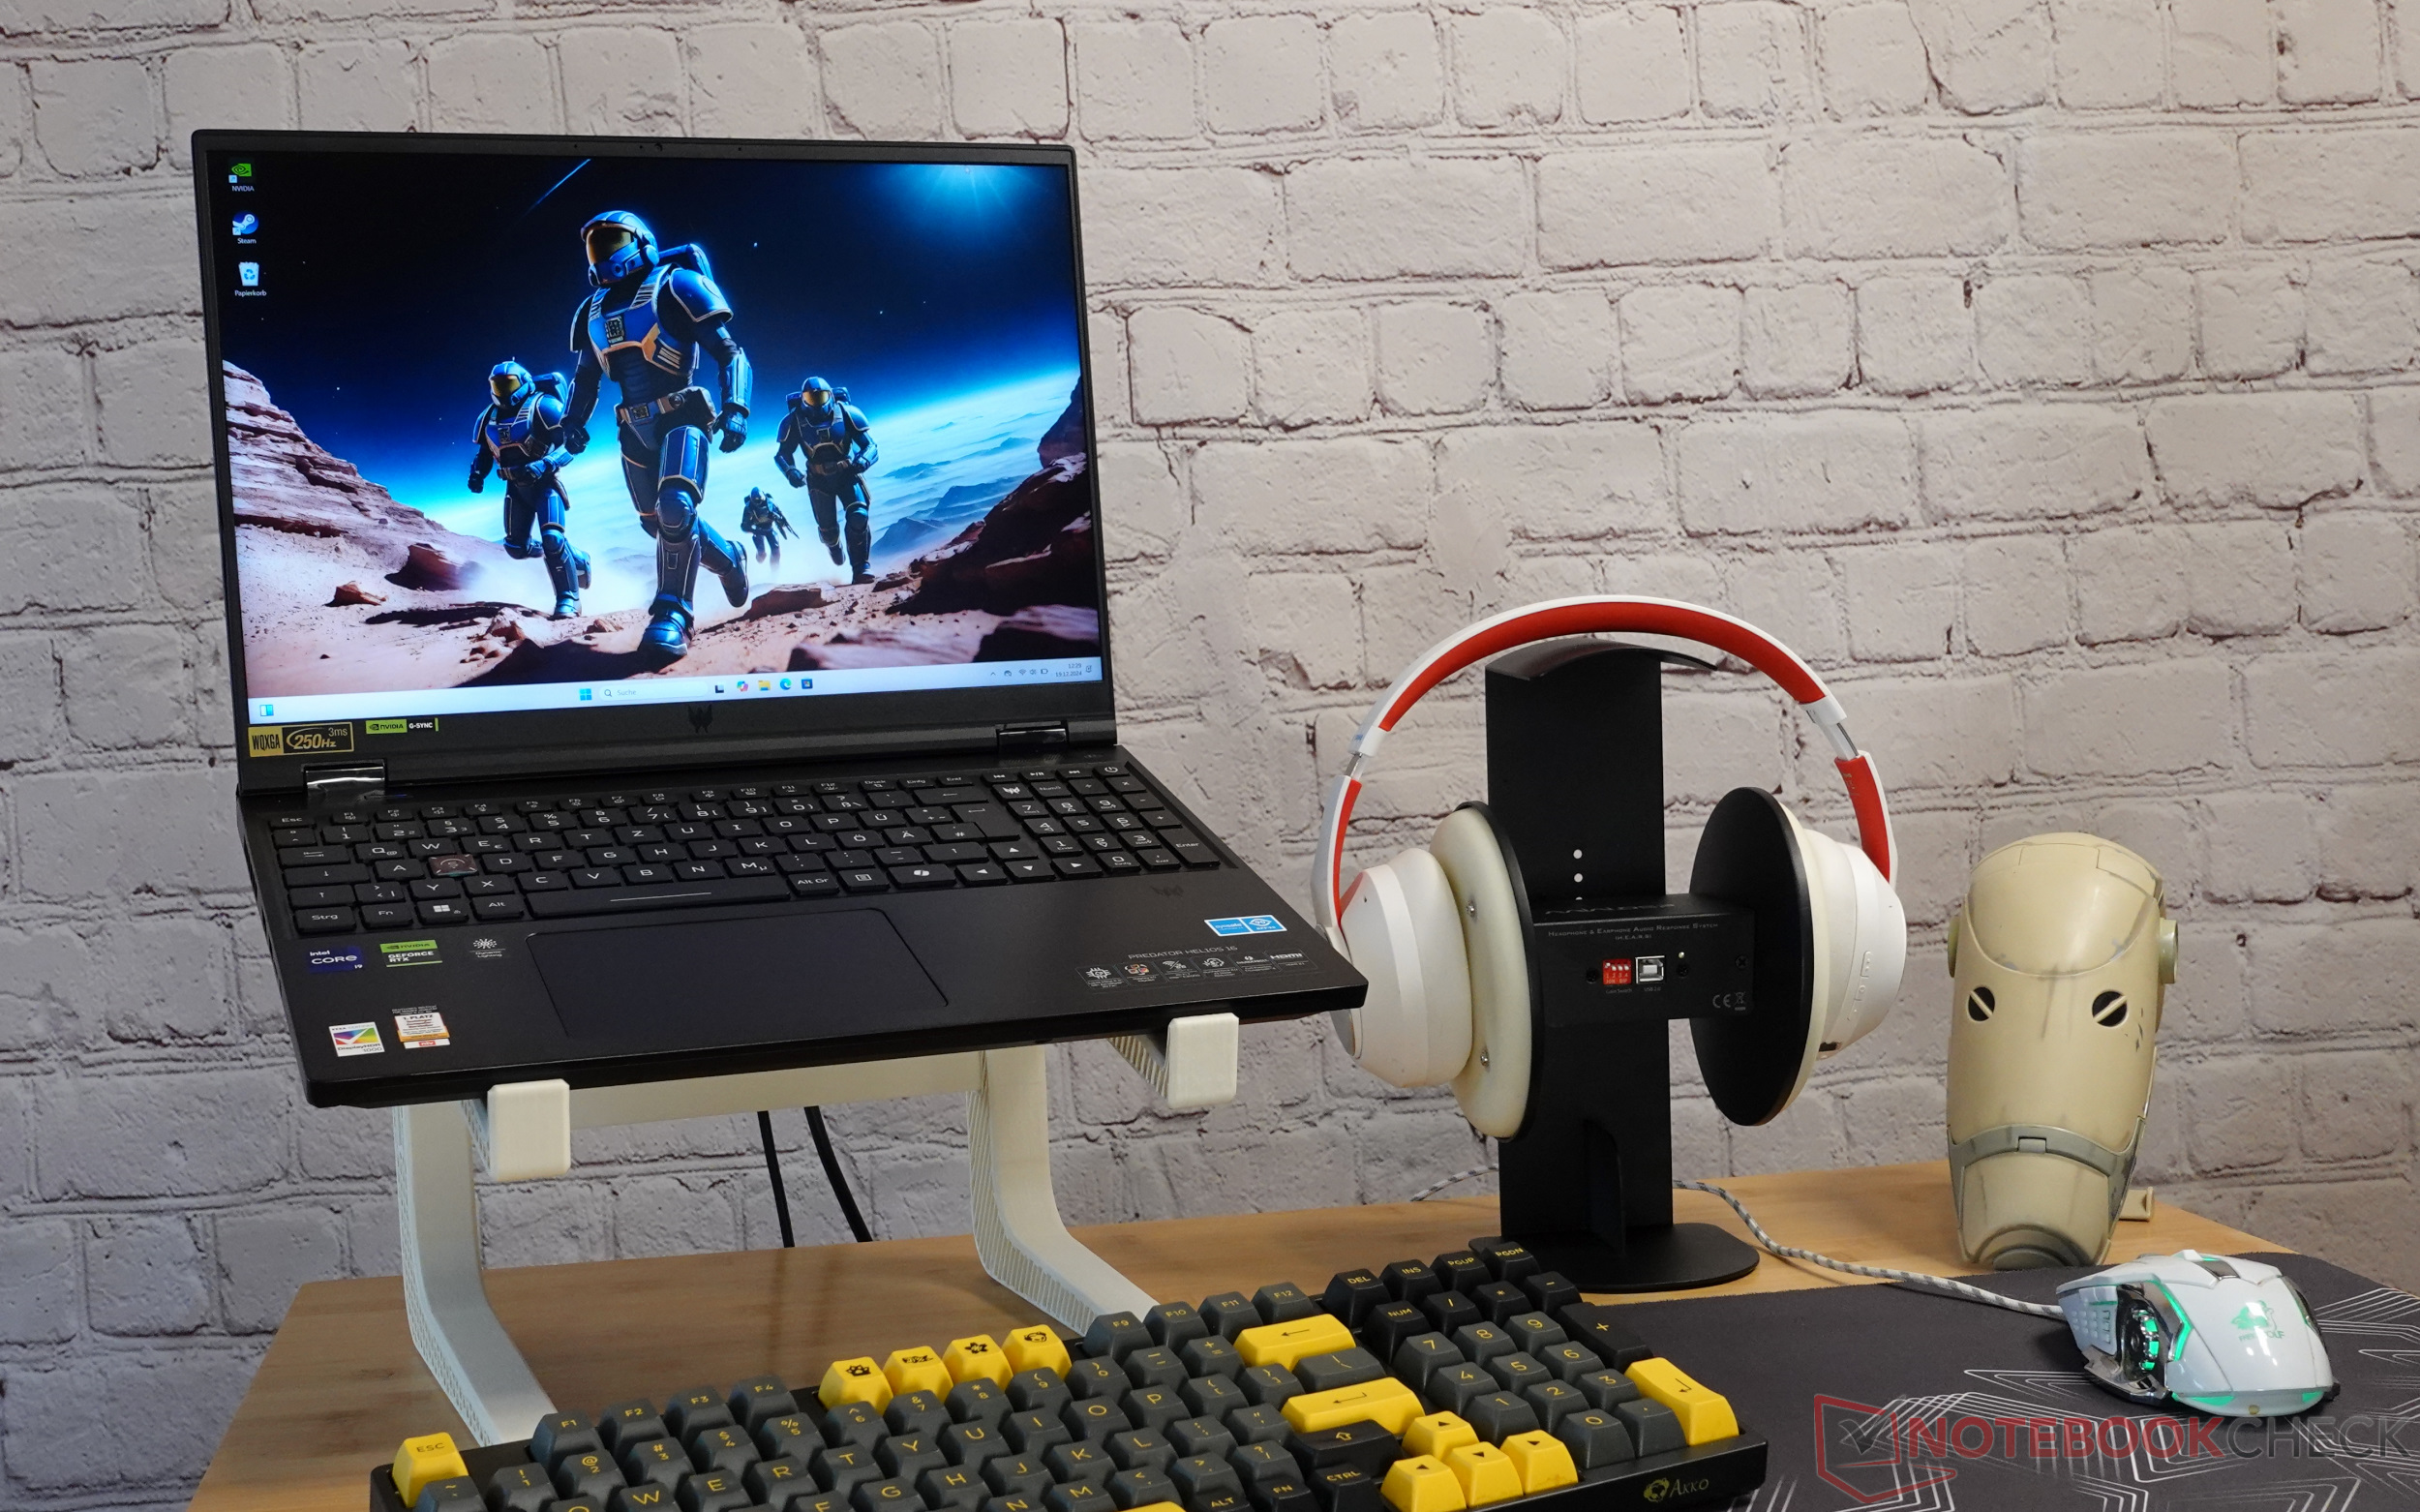
Recenzja laptopa do gier Acer Predator Helios 16 (PH16-72): Drapieżnik z ostrymi zębami i cichymi łapami
Sprzęt najwyższej klasy.
Wysokiej klasy sprzęt, świetny wyświetlacz mini LED i wydajne chłodzenie sprawiają, że Acer Predator Helios 16 to prawdziwe marzenie graczy. W rzeczywistości ten drapieżnik wśród laptopów do gier jest naprawdę cichy. Niemniej jednak, nasza recenzja ujawnia, że wiele zalet laptopa idzie w parze z pewnymi kompromisami.Marc Herter, 👁 Marc Herter (tłumaczenie DeepL / Ninh Duy) Opublikowany 🇺🇸 🇩🇪 ...
Werdykt: Szczytowy drapieżnik, który mruczy jak kot
Acer Predator Helios 16 to potężny laptop do gier o wielu zaletach. Wyjątkowa wydajność, w połączeniu z doskonałym wyświetlaczem mini LED i wydajnym systemem chłodzenia, zapewnia wciągające wrażenia z gry. Szeroki zakres opcji dostosowywania i dobre funkcje dopełniają ogólny pozytywny obraz.
Pod względem wydajności, laptop do gier Acer jest kompleksowo imponującym pakietem, który unika nadmiernie głośnych wentylatorów do rozpraszania ciepła. Oprócz gier, dzięki potężnej karcie RTX 4080 i dużej ilości pamięci RAM, nadaje się również do wszelkiego rodzaju aplikacji AI, edycji wideo lub kreatywnej pracy z Blenderem lub innymi programami 3D.
Trzeba jednak pogodzić się z pewnymi kompromisami. Żywotność baterii nie jest wybitna, a słabo zainstalowany dysk SSD ma tendencję do dławienia się pod długotrwałym obciążeniem.
Ogólnie rzecz biorąc, Acer Predator Helios 16 to dobry wybór dla graczy poszukujących wydajnego i indywidualnie konfigurowalnego laptopa. Jednak każdy, kto przywiązuje szczególną wagę do długiego czasu pracy na baterii, powinien poszukać alternatywy. Na przykład, dwóch konkurentów z naszej bazy danych ma tutaj znacznie lepszą pozycję. Asus ROG Strix Scar 16 i Acer Predator Triton Neo mają lepszą żywotność baterii, a Strix Scar ma porównywalnie podobną specyfikację do naszego recenzowanego urządzenia.
Za
Przeciw
Cena i dostępność
Nasza recenzowana konfiguracja Acer Predator Helios 16 to obecnie najnowocześniejsza wersja tej maszyny do gier. Acer zapowiedział już jednak następcę z najnowszymi procesorami Intel i kartami graficznymi NVIDIA GeForce RTX 5000. Ma on jednak pojawić się na rynku najwcześniej w drugim kwartale 2025 roku.
Zapowiedź następcy już spowodowała spadek ceny obecnego Heliosa 16. Podczas gdy pierwotna cena detaliczna wynosiła 3000 USD, obecnie można go nabyć za około 2500 USD. Dlatego też, jeśli szukają Państwo wydajnego laptopa do gier o doskonałym stosunku ceny do wydajności, powinni Państwo porównać teraz i mieć oko na zmiany cen.
Porównanie możliwych alternatyw
Obraz | Model / recenzja | Cena | Waga | Wysokość | Ekran |
|---|---|---|---|---|---|
| Acer Predator Helios 16 PH16-72 Intel Core i9-14900HX ⎘ NVIDIA GeForce RTX 4080 Laptop GPU ⎘ 32 GB Pamięć, 2048 GB SSD | Amazon: 1. $69.99 330W 230W AC Charger for Ace... 2. $4.99 Silicone Keyboard Cover Skin... 3. $6.79 Keyboard Cover for Acer Pred... | 2.7 kg | 29.6 mm | 16.00" 2560x1600 189 PPI IPS | |
| MSI Raider 18 HX A14V Intel Core i9-14900HX ⎘ NVIDIA GeForce RTX 4080 Laptop GPU ⎘ 64 GB Pamięć, 2048 GB SSD | Amazon: Cena katalogowa: 3400 USD | 3.6 kg | 32 mm | 18.00" 3840x2400 252 PPI Mini-LED | |
| Asus ROG Strix Scar 16 G634JZR Intel Core i9-14900HX ⎘ NVIDIA GeForce RTX 4080 Laptop GPU ⎘ 32 GB Pamięć, 2048 GB SSD | Amazon: $2,899.00 Cena katalogowa: 3199 EUR | 2.7 kg | 30.4 mm | 16.00" 2560x1600 189 PPI Mini LED | |
| Lenovo Legion Pro 7 16IRX9H Intel Core i9-14900HX ⎘ NVIDIA GeForce RTX 4080 Laptop GPU ⎘ 32 GB Pamięć, 1024 GB SSD | Amazon: $3,249.00 Cena katalogowa: 2999 Euro | 2.7 kg | 21.95 mm | 16.00" 2560x1600 189 PPI IPS | |
| Acer Predator Triton Neo 16 PTN16-51-978P Intel Core Ultra 9 185H ⎘ NVIDIA GeForce RTX 4070 Laptop GPU ⎘ 32 GB Pamięć, 1024 GB SSD | Amazon: 1. $1,619.95 acer Predator Triton Neo 16 ... 2. $1,529.75 acer Predator Triton Neo 16 ... 3. $1,773.66 acer Predator Triton Neo 16 ... Cena katalogowa: 1900 EUR | 2 kg | 21 mm | 16.00" 3200x2000 236 PPI IPS | |
| SCHENKER Key 17 Pro (M24) Intel Core i9-14900HX ⎘ NVIDIA GeForce RTX 4090 Laptop GPU ⎘ 32 GB Pamięć, 1024 GB SSD | Cena katalogowa: 4273€ | 3.4 kg | 24.9 mm | 17.30" 3840x2160 255 PPI IPS |
Spis treści
- Werdykt: Szczytowy drapieżnik, który mruczy jak kot
- Specyfikacje
- Przypadek
- Cechy: Szybki i wszechstronny
- Urządzenia wejściowe: Klawiatura MagiKey 3.0
- Wyświetlacz: Mini panel LED o wysokiej rozdzielczości, 1000 cd/m²
- Wydajność: Najlepsze specyfikacje zapewniają wysoką wydajność
- Emisje: Koci drapieżnik z cichymi łapami
- Zarządzanie energią: Wysokie zużycie na biegu jałowym
- Ogólna ocena Notebookcheck
Acer Predator Helios 16 (PH16-72-90ZU) to najwyższej klasy laptop do gier, którego sugerowana cena detaliczna wynosi 3000 USD (obecna cena rynkowa to około 2500 USD), skierowany do graczy i twórców treści poszukujących maksymalnej wydajności i innowacyjnych funkcji. Najważniejsze z nich to wyświetlacz mini LED oferujący doskonałe odwzorowanie kolorów oraz wymienne nakładki na klawisze MagKey 3.0. Helios 16 jest również wyposażony w najnowszy standard WiFi 7, który umożliwia najszybsze możliwe połączenia bezprzewodowe.
Ale nie tylko ten konkretny zestaw funkcji robi wrażenie. Acer wykonał również świetną robotę wewnątrz. Zaawansowane rozwiązanie chłodzenia oparte na dwóch wentylatorach AeroBlade 3D i płynnej metalowej paście termicznej zapewnia, że potężny sprzęt, procesor Procesor Intel Core i9-14900HX i procesor NVIDIA GeForce RTX 4080jest optymalnie chłodzony, a jednocześnie pozostaje stosunkowo cichy. To połączenie wysokiej klasy komponentów i wydajnego chłodzenia prowadzi do doskonałych wyników w testach porównawczych.
Specyfikacje
Przypadek
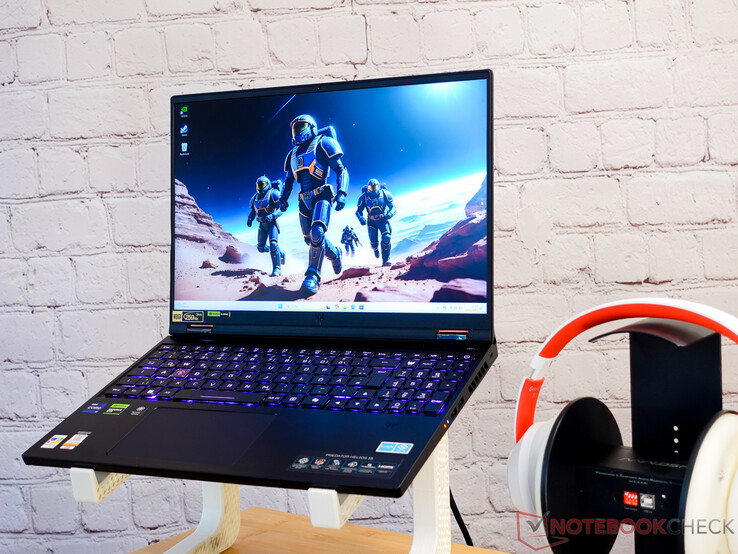
Obudowa Acer Predator Helios 16 została wykonana z eleganckiego aluminium w kolorze od ciemnoniebieskiego do czarnego, które nie tylko wygląda solidnie, ale także nadaje urządzeniu wysoką jakość. Wykonanie jest bezbłędne, z precyzyjnymi szczelinami, które świadczą o uwadze poświęconej przez inżynierów Acer. Nawet gdy znajdujący się w środku sprzęt do gier jest uwikłany w gorące bitwy, powierzchnie pozostają przyjemnie chłodne - prawdziwe błogosławieństwo podczas długich sesji grania.
Konstrukcja Helios 16 jest kanciasta i nowoczesna. Pasek podświetlenia RGB jest dyskretnie ukryty za ekranem, co oznacza, że nie rozprasza użytkownika podczas gry. Logo Predator na podpórce pod nadgarstki i pokrywie ekranu to efektowne graficzne wykrzykniki. Ekran można przyjemnie odchylić do tyłu, co zapewnia ergonomiczną pozycję siedzącą i zapobiega napięciom mięśni szyi. Dwa zawiasy pewnie utrzymują swoją pozycję, ale ich obsługa jest płynna.
Cechy: Szybki i wszechstronny
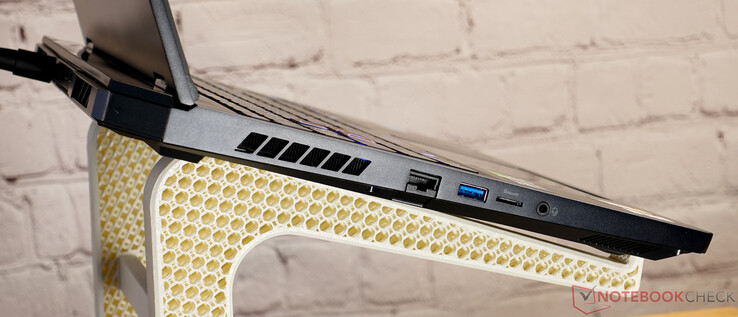
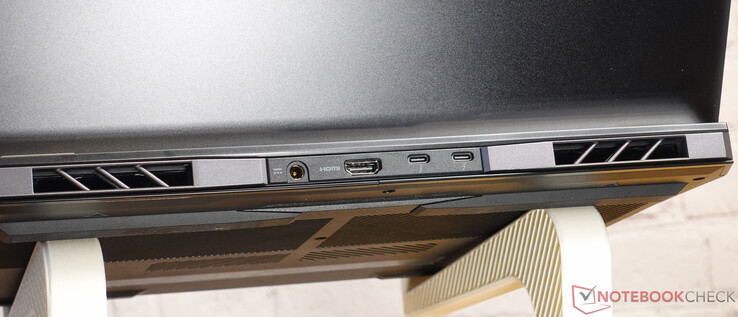
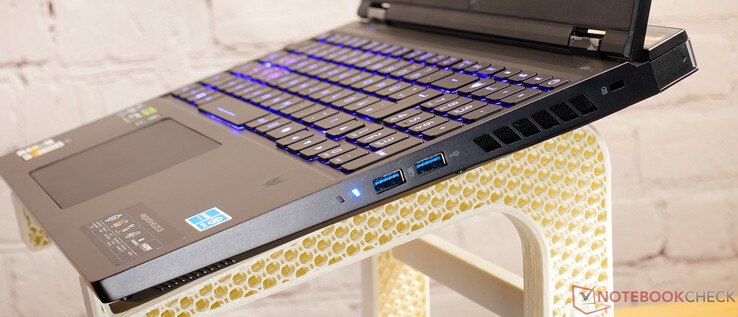
Acer Predator Helios 16 został wyposażony w szereg nowoczesnych portów, które zostały wygodnie rozmieszczone po trzech stronach urządzenia. WiFi 7, najnowszy standard Wi-Fi, zapewnia szybkie połączenia internetowe. Sieci przewodowe są obsługiwane przez 2,5 GBit LAN, którego port znajduje się po lewej stronie.
Podczas gdy porty USB znajdują się na wszystkich trzech bokach, HDMI i DisplayPort (przez USB-C) znajdują się tylko z tyłu. Średnio szybki czytnik kart microSD i gniazdo blokady Kensington uzupełniają wybór portów.
| SD Card Reader | |
| average JPG Copy Test (av. of 3 runs) | |
| Średnia w klasie Gaming (19 - 197.3, n=68, ostatnie 2 lata) | |
| Acer Predator Triton Neo 16 PTN16-51-978P (AV PRO microSD 128 GB V60) | |
| MSI Raider 18 HX A14V (Toshiba Exceria Pro SDXC 64 GB UHS-II) | |
| Acer Predator Helios 16 PH16-72 | |
| maximum AS SSD Seq Read Test (1GB) | |
| Średnia w klasie Gaming (25.8 - 263, n=67, ostatnie 2 lata) | |
| MSI Raider 18 HX A14V (Toshiba Exceria Pro SDXC 64 GB UHS-II) | |
| Acer Predator Helios 16 PH16-72 | |
| Acer Predator Triton Neo 16 PTN16-51-978P (AV PRO microSD 128 GB V60) | |
Kamera internetowa
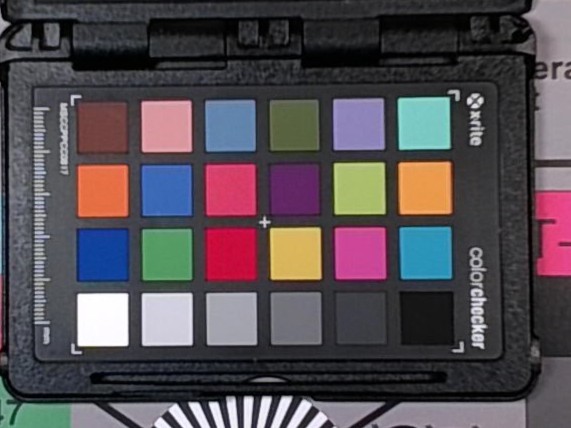
Kamera internetowa Full HD jest dostępna do wideokonferencji i przesyłania strumieniowego, zapewniając standardową jakość obrazu i dobre odwzorowanie kolorów.
Bezpieczeństwo
W erze cyfrowej ochrona wrażliwych danych staje się coraz ważniejsza. Acer Predator Helios 16 uwzględnia ten wymóg i oferuje różne mechanizmy bezpieczeństwa. Urządzenie posiada gniazdo blokady Kensington, które chroni je przed kradzieżą. Na pokładzie znajduje się również TPM 2.0, mechanizm bezpieczeństwa, który zapewnia bezpieczeństwo haseł i kodów szyfrujących. Będą jednak Państwo musieli obejść się bez metod uwierzytelniania biometrycznego, takich jak czujniki linii papilarnych lub rozpoznawanie twarzy.
Akcesoria
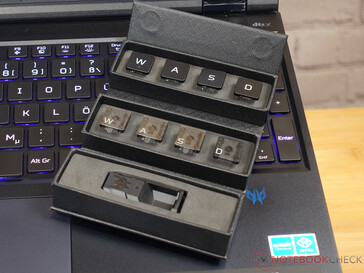
W przypadku Predator Helios 16, Acer położył duży nacisk na personalizację. Kratki wentylatorów można wymienić, aby nadać laptopowi indywidualny charakter. Nakładki na klawisze W, A, S i D również można wymienić, co nie tylko stanowi wizualny akcent, ale także dostosowuje odczucia klawiatury do osobistych preferencji użytkownika.
Zrównoważony rozwój
Kupując laptopa do gier, zrównoważony rozwój prawdopodobnie nie znajduje się na szczycie kryteriów zakupowych. Niestety, Acer nie dostarczył żadnych danych dotyczących śladu CO₂ naszego recenzowanego urządzenia. Nie jesteśmy również w stanie znaleźć rejestracji EPEAT ani niczego podobnego. Laptop do gier jest również dostarczany w pudełku zawierającym dużą ilość piankowego materiału opakowaniowego.
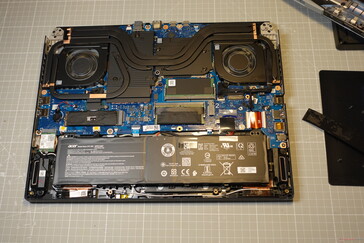
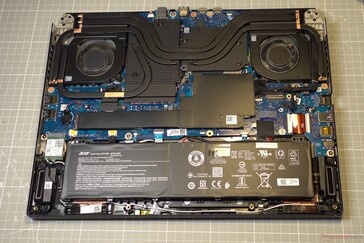
Acer Predator Helios 16 jest jednak przyjemnie łatwy w utrzymaniu. Płyta bazowa jest zabezpieczona kilkoma śrubami Torx, po których można uzyskać dostęp do najważniejszych komponentów. Zarówno moduł Wi-Fi, jak i pamięć RAM można łatwo wymienić - po zdjęciu przyklejonych czarnych plastikowych osłon. Jeśli chodzi o pamięć masową, oprócz już zainstalowanego dysku SSD NVMe, dostępne jest dodatkowe gniazdo M.2 w celu zwiększenia pojemności pamięci masowej.
Urządzenia wejściowe: Klawiatura MagiKey 3.0
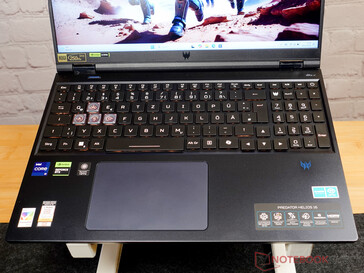
Klawiatura Acer Predator Helios 16 jest więcej niż wystarczająca dla wysokiej jakości laptopa do gier. Funkcja N-Key Rollover zapewnia, że każde naciśnięcie klawisza zostanie zarejestrowane, niezależnie od tego, ile klawiszy zostanie naciśniętych w tym samym czasie. Podświetlenie RGB zanurza klawiaturę w nastrojowym morzu kolorów, dzięki czemu każdy klawisz może mieć swój własny kolor. Specjalną sztuczką są wymienne klawisze WASD, które nie tylko wyróżniają się z wizualnego punktu widzenia, ale także umożliwiają indywidualne haptyczne sprzężenie zwrotne. Acer dołączył do tego laptopa dwie interesujące alternatywy. Dzięki MagClick użytkownik doświadcza unikalnego haptycznego sprzężenia zwrotnego, podczas gdy MagSpeed podkreśla podświetlenie RGB. Ogólnie rzecz biorąc, klawiatura oferuje świetną haptykę i przyjemny punkt nacisku.
Touchpad jest duży i oferuje gładką powierzchnię. Wskaźnik myszy podąża za każdym ruchem szybko i precyzyjnie. Jest jednak jeden mały minus: touchpad został przesunięty nieco w lewo, co oznacza, że klawisze WASD nie są tak łatwo dostępne podczas grania, jak można by oczekiwać w laptopie do gier.
Wyświetlacz: Mini panel LED o wysokiej rozdzielczości, 1000 cd/m²
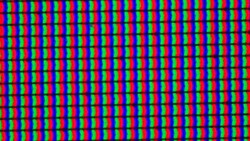
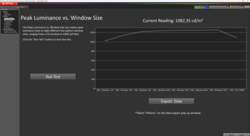
Aby dobrze grać w gry, potrzebny jest szybki ekran. Acer Predator Helios 16 ma znakomity 16-calowy wyświetlacz mini LED o proporcjach 16:10, który wyświetla 250 klatek na sekundę. Rozdzielczość 2560 × 1600 pikseli i gęstość pikseli 189 PPI zapewniają ostry obraz i dużo miejsca do kreatywnej pracy i grania. Dzięki obsłudze HDR1000, ekran świeci z jasnością ponad 1000 cd/m², zapewniając wyraźne i kontrastowe obrazy nawet w jasnym otoczeniu. Nawet bez włączonego HDR, przy około 670 cd/m², jasność jest imponująca.
Kolejnym plusem jest szybki czas reakcji, zwłaszcza przy zmianie z 20% szarości na 80% szarości. Zapewnia to płynne ruchy bez irytującego rozmazywania, co jest szczególnie korzystne w grach pełnych akcji. Przejście z czerni do bieli skutkuje jednak znacznie dłuższym czasem reakcji. Wynika to z przyczyn technicznych i jest typowe dla wyświetlaczy mini-LED. W praktyce jednak efekt ten jest ledwo zauważalny, ponieważ ekstremalne zmiany jasności rzadko występują nawet podczas grania.
| |||||||||||||||||||||||||
rozświetlenie: 92 %
na akumulatorze: 380 cd/m²
kontrast: 6990000:1 (czerń: 0.0001 cd/m²)
ΔE Color 3.89 | 0.5-29.43 Ø4.87, calibrated: 2.17
ΔE Greyscale 5.14 | 0.5-98 Ø5.1
94.12% AdobeRGB 1998 (Argyll 2.2.0 3D)
100% sRGB (Argyll 2.2.0 3D)
99.82% Display P3 (Argyll 2.2.0 3D)
Gamma: 2.018
| Acer Predator Helios 16 PH16-72 AUO43A8, IPS, 2560x1600, 16", 240 Hz | MSI Raider 18 HX A14V AU Optronics B180ZAN1.0, Mini-LED, 3840x2400, 18", 120 Hz | Asus ROG Strix Scar 16 G634JZR BOE NE160QDM-NM7, Mini LED, 2560x1600, 16", 240 Hz | Lenovo Legion Pro 7 16IRX9H BOE CQ NE16QDM-NZB, IPS, 2560x1600, 16", 240 Hz | Acer Predator Triton Neo 16 PTN16-51-978P AU Optronics B160QAN04.S, IPS, 3200x2000, 16", 165 Hz | SCHENKER Key 17 Pro (M24) BOE, IPS, 3840x2160, 17.3", 144 Hz | |
|---|---|---|---|---|---|---|
| Display | -4% | -1% | -3% | -5% | -5% | |
| Display P3 Coverage | 99.82 | 96.6 -3% | 99.8 0% | 98.5 -1% | 94.2 -6% | 93.51 -6% |
| sRGB Coverage | 100 | 99.9 0% | 100 0% | 99.9 0% | 99.7 0% | 99.86 0% |
| AdobeRGB 1998 Coverage | 94.12 | 84.8 -10% | 90.8 -4% | 86.7 -8% | 85.3 -9% | 84.33 -10% |
| Response Times | -19% | 31% | 8% | 10% | 15% | |
| Response Time Grey 50% / Grey 80% * | 7.2 ? | 10.4 ? -44% | 5 ? 31% | 12.6 ? -75% | 12.3 ? -71% | 11.593 ? -61% |
| Response Time Black / White * | 67.6 ? | 75.8 ? -12% | 10.4 ? 85% | 5.8 ? 91% | 5.8 ? 91% | 6 ? 91% |
| PWM Frequency | 2630 | 2606.2 ? -1% | 2040 ? -22% | |||
| Screen | -16% | -44421% | -46643% | -46650% | -60013% | |
| Brightness middle | 699 | 575.7 -18% | 490 -30% | 487 -30% | 458 -34% | 548 -22% |
| Brightness | 672 | 574 -15% | 487 -28% | 460 -32% | 453 -33% | 505 -25% |
| Brightness Distribution | 92 | 94 2% | 94 2% | 88 -4% | 90 -2% | 86 -7% |
| Black Level * | 0.0001 | 0.4 -399900% | 0.42 -419900% | 0.42 -419900% | 0.54 -539900% | |
| Contrast | 6990000 | 1225 -100% | 1160 -100% | 1090 -100% | 1015 -100% | |
| Colorchecker dE 2000 * | 3.89 | 3.56 8% | 1.08 72% | 1.12 71% | 1.58 59% | 3.81 2% |
| Colorchecker dE 2000 max. * | 5.51 | 8.64 -57% | 2.38 57% | 2.26 59% | 3.47 37% | 7.9 -43% |
| Colorchecker dE 2000 calibrated * | 2.17 | 2.69 -24% | 0.9 59% | 0.54 75% | 0.77 65% | 2.54 -17% |
| Greyscale dE 2000 * | 5.14 | 5.6 -9% | 1.1 79% | 1.4 73% | 2.3 55% | 5.4 -5% |
| Gamma | 2.018 109% | 2.34 94% | 2.13 103% | 2.242 98% | 2.201 100% | 2.062 107% |
| CCT | 7113 91% | 7872 83% | 6724 97% | 6809 95% | 6540 99% | 7224 90% |
| Całkowita średnia (program / ustawienia) | -13% /
-14% | -14797% /
-26647% | -15546% /
-29984% | -15548% /
-29989% | -20001% /
-38579% |
* ... im mniej tym lepiej
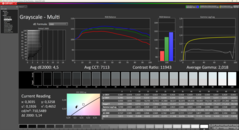
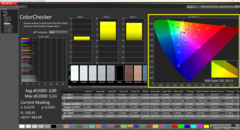
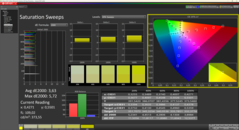
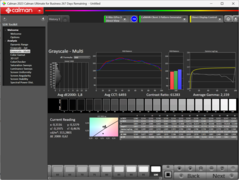
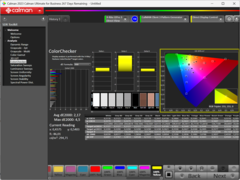
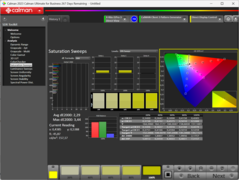
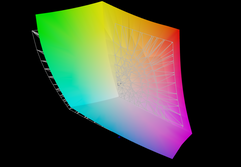
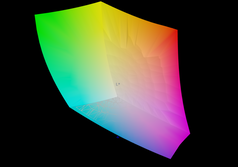
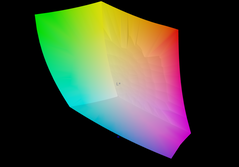
Wyświetlacz Acer Predator Helios 16 pokrywa 99,82% przestrzeni barw DCI-P3, dzięki czemu idealnie nadaje się do kreatywnych zadań, takich jak edycja zdjęć i wideo. Nawet nieskalibrowany ekran imponuje doskonałą dokładnością odwzorowania kolorów. Niewielkie odchylenia kolorów przy średniej wartości Delta-E wynoszącej 3,89 są ledwo zauważalne gołym okiem. Po kalibracji wartość Delta-E spada nawet znacznie poniżej 3, co sprawia, że ekran nadaje się również do zastosowań profesjonalnych.
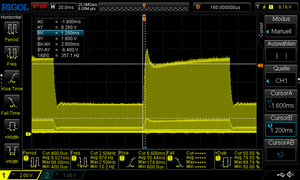
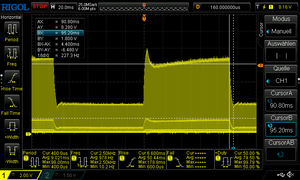
Wyświetl czasy reakcji
| ↔ Czas reakcji od czerni do bieli | ||
|---|---|---|
| 67.6 ms ... wzrost ↗ i spadek ↘ łącznie | ↗ 64.8 ms wzrost | |
| ↘ 2.8 ms upadek | ||
| W naszych testach ekran wykazuje powolne tempo reakcji, co będzie niezadowalające dla graczy. Dla porównania, wszystkie testowane urządzenia wahają się od 0.1 (minimum) do 240 (maksimum) ms. » 100 % wszystkich urządzeń jest lepszych. Oznacza to, że zmierzony czas reakcji jest gorszy od średniej wszystkich testowanych urządzeń (20.8 ms). | ||
| ↔ Czas reakcji 50% szarości do 80% szarości | ||
| 7.2 ms ... wzrost ↗ i spadek ↘ łącznie | ↗ 2.8 ms wzrost | |
| ↘ 4.4 ms upadek | ||
| W naszych testach ekran wykazuje bardzo szybką reakcję i powinien bardzo dobrze nadawać się do szybkich gier. Dla porównania, wszystkie testowane urządzenia wahają się od 0.165 (minimum) do 636 (maksimum) ms. » 17 % wszystkich urządzeń jest lepszych. Oznacza to, że zmierzony czas reakcji jest lepszy od średniej wszystkich testowanych urządzeń (32.5 ms). | ||
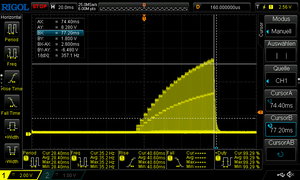
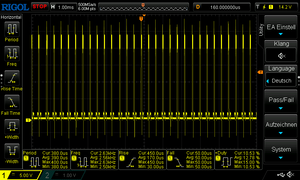
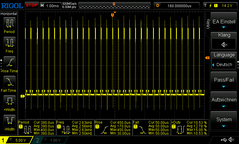
Migotanie ekranu / PWM (modulacja szerokości impulsu)
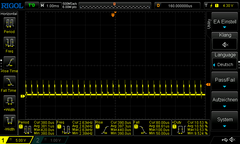
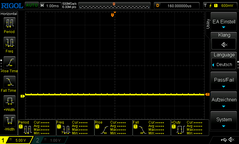
| Wykryto migotanie ekranu/wykryto PWM | 2630 Hz Amplitude: 100 % | ||
Podświetlenie wyświetlacza miga z częstotliwością 2630 Hz (najgorszy przypadek, np. przy użyciu PWM) . Częstotliwość 2630 Hz jest dość wysoka, więc większość użytkowników wrażliwych na PWM nie powinna zauważyć żadnego migotania. Dla porównania: 53 % wszystkich testowanych urządzeń nie używa PWM do przyciemniania wyświetlacza. Jeśli wykryto PWM, zmierzono średnio 8516 (minimum: 5 - maksimum: 343500) Hz. | |||
Dzięki wysokiej jasności wynoszącej ponad 1000 cd/m², Acer Predator Helios 16 może być również używany na zewnątrz, nawet w bezpośrednim świetle słonecznym. Chociaż nie można całkowicie uniknąć odbić na wyświetlaczu, są one ograniczone do minimum. Matowa powierzchnia wyświetlacza również pomaga zminimalizować irytujące odbicia.
Stabilność kąta widzenia mini wyświetlacza LED jest doskonała. Nawet przy ekstremalnych kątach widzenia, kolory i kontrast pozostają stabilne bez zniekształceń lub inwersji. Pozwala to na jednoczesne oglądanie ekranu przez kilka osób bez konieczności rezygnacji z optymalnych wrażeń wizualnych.
Wydajność: Najlepsze specyfikacje zapewniają wysoką wydajność
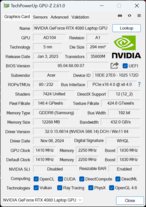
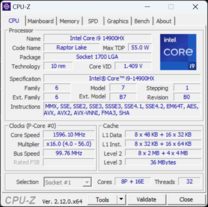
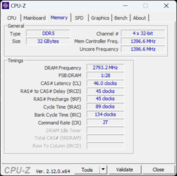
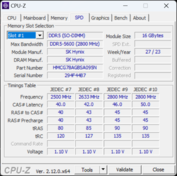
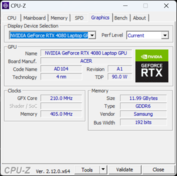
Acer Predator Helios 16 można nabyć w różnych konfiguracjach, aby spełnić indywidualne potrzeby użytkownika. Recenzowane przez nas urządzenie zostało wyposażone w najważniejsze funkcje: Procesor Intel Core i9-14900HX z 24 rdzeniami (32 wątki) i taktowaniem 2,20 GHz odpowiada za ogromną moc obliczeniową. W połączeniu z kartą graficzną GPU laptopa NVIDIA GeForce RTX 4080 z 12 GB dedykowanej pamięci graficznej i 32 GB pamięci RAM DDR5, nawet najbardziej wymagające gry i aplikacje są prostym zadaniem. Dysk SSD PCIe NVMe o pojemności 2 TB gwarantuje błyskawiczne czasy ładowania i płynną wielozadaniowość.
Alternatywnie, konfiguracje z kartą graficzną NVIDIA GeForce RTX 4070 GPU do laptopów lub procesorem Intel Core i7-14700HX lub procesorem Intel Core i7-14700HX. Pamięć RAM jest dostępna w wersjach 16 GB i 32 GB, a dysk SSD ma pojemność 1 lub 2 TB. Oznacza to, że Helios 16 może być optymalnie dostosowany do Państwa budżetu i pożądanej wydajności. W zależności od sprzedawcy dostępne są różne konfiguracje. Począwszy od drugiego kwartału 2025 r Predator Helios 16, z najnowszymi procesorami AI firmy Intel i układami GPU RTX 5000będzie dostępny.
Warunki testu
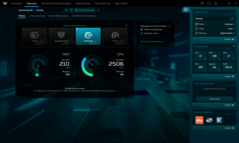
Na wydajność Acer Predator Helios 16 można wpływać za pomocą preinstalowanego oprogramowania PredatorSense. Do wyboru są cztery różne opcje wydajności: "Cichy", "Zrównoważony", "Wydajność" i "Turbo". Po kilku testach, tryb "Wydajność" okazał się optymalnym wyborem dla naszych pozostałych testów porównawczych. Oferuje on najlepszą równowagę między przyjemnym hałasem wentylatora a wysoką wydajnością podczas grania.
Należy zauważyć, że zarządzanie wydajnością Helios 16 jest raczej ostrożne w przypadku 14900HX i powoli zbliża się do docelowych temperatur. Oznacza to, że w niektórych przypadkach może minąć kilka minut, zanim pełna wydajność procesora będzie dostępna dla użytkownika.
Przegląd trybu wydajności
| Tryb wydajności | Pobór mocy CPU Prime95 | Pobór mocy GPU Furmark | Pobór mocy CPU/GPU Prime95 i Furmark | Test porównawczy Cyberpunk 2077 PL QHD |
|---|---|---|---|---|
| Cichy | 55 watów | 95 watów | 50 watów/35 watów | 61 kl |
| Zrównoważony | 85 watów | 115 watów | 65 watów/85 watów | 64 kl |
| Wydajność | 95 watów | 140 watów | 55 watów/ 110 watów | 72 kl |
| Turbo | 120 Watt | 175 Watt | 90 Watt/ 130 Watt | 81 FPS |
Procesor
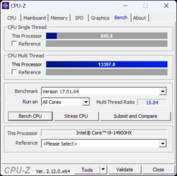
Procesor Intel Core i9-14900HX w laptopie Acer Predator Helios 16 to prawdziwa potęga. Dzięki 24 rdzeniom (8 rdzeni P i 16 rdzeni E), które mogą obsługiwać 32 wątki w tandemie, zapewnia on więcej niż wystarczającą moc obliczeniową dla wymagających gier i aplikacji. Co ciekawe, pobór mocy procesora w trybie boost (PL2) utrzymuje się na poziomie 140 W we wszystkich trybach wydajności.
W Acer Predator Helios 16, procesor i9-14900HX zapewnia ponadprzeciętną wydajność bez konieczności pracy wentylatorów na pełnych obrotach. Wydajne rozwiązanie chłodzące Heliosa 16 pozwala utrzymać procesor pod kontrolą nawet przy dużym obciążeniu, zapewniając jednocześnie przyjemny poziom hałasu. Jest to niezwykłe, przede wszystkim w porównaniu z innymi laptopami do gier, takimi jak Lenovo Legion Pro 7, Asus Asus ROG Strix Scar 16 lub SCHENKER Key 17 Proz których niektóre mają znacznie wyższe wartości PL1 i PL2, ale są znacznie głośniejsze.
Cinebench R15 Multi Continuous Test
Cinebench R23: Multi Core | Single Core
Cinebench R20: CPU (Multi Core) | CPU (Single Core)
Cinebench R15: CPU Multi 64Bit | CPU Single 64Bit
Blender: v2.79 BMW27 CPU
7-Zip 18.03: 7z b 4 | 7z b 4 -mmt1
Geekbench 6.4: Multi-Core | Single-Core
Geekbench 5.5: Multi-Core | Single-Core
HWBOT x265 Benchmark v2.2: 4k Preset
LibreOffice : 20 Documents To PDF
R Benchmark 2.5: Overall mean
| CPU Performance Rating | |
| Lenovo Legion Pro 7 16IRX9H | |
| Asus ROG Strix Scar 16 G634JZR | |
| MSI Raider 18 HX A14V | |
| Acer Predator Helios 16 PH16-72 | |
| Przeciętny Intel Core i9-14900HX | |
| SCHENKER Key 17 Pro (M24) | |
| Średnia w klasie Gaming | |
| Acer Predator Triton Neo 16 PTN16-51-978P | |
| Cinebench R23 / Multi Core | |
| Lenovo Legion Pro 7 16IRX9H | |
| Asus ROG Strix Scar 16 G634JZR | |
| Acer Predator Helios 16 PH16-72 | |
| MSI Raider 18 HX A14V | |
| Przeciętny Intel Core i9-14900HX (17078 - 36249, n=37) | |
| SCHENKER Key 17 Pro (M24) | |
| Średnia w klasie Gaming (5668 - 39652, n=151, ostatnie 2 lata) | |
| Acer Predator Triton Neo 16 PTN16-51-978P | |
| Cinebench R23 / Single Core | |
| Lenovo Legion Pro 7 16IRX9H | |
| Asus ROG Strix Scar 16 G634JZR | |
| MSI Raider 18 HX A14V | |
| Przeciętny Intel Core i9-14900HX (1720 - 2245, n=37) | |
| Acer Predator Helios 16 PH16-72 | |
| SCHENKER Key 17 Pro (M24) | |
| Średnia w klasie Gaming (1136 - 2252, n=151, ostatnie 2 lata) | |
| Acer Predator Triton Neo 16 PTN16-51-978P | |
| Cinebench R20 / CPU (Multi Core) | |
| Lenovo Legion Pro 7 16IRX9H | |
| Asus ROG Strix Scar 16 G634JZR | |
| MSI Raider 18 HX A14V | |
| Acer Predator Helios 16 PH16-72 | |
| Przeciętny Intel Core i9-14900HX (6579 - 13832, n=37) | |
| SCHENKER Key 17 Pro (M24) | |
| Średnia w klasie Gaming (2179 - 15517, n=151, ostatnie 2 lata) | |
| Acer Predator Triton Neo 16 PTN16-51-978P | |
| Cinebench R20 / CPU (Single Core) | |
| MSI Raider 18 HX A14V | |
| Asus ROG Strix Scar 16 G634JZR | |
| Lenovo Legion Pro 7 16IRX9H | |
| Acer Predator Helios 16 PH16-72 | |
| Przeciętny Intel Core i9-14900HX (657 - 859, n=37) | |
| SCHENKER Key 17 Pro (M24) | |
| Średnia w klasie Gaming (439 - 866, n=151, ostatnie 2 lata) | |
| Acer Predator Triton Neo 16 PTN16-51-978P | |
| Cinebench R15 / CPU Multi 64Bit | |
| Asus ROG Strix Scar 16 G634JZR | |
| Lenovo Legion Pro 7 16IRX9H | |
| MSI Raider 18 HX A14V | |
| Acer Predator Helios 16 PH16-72 | |
| Przeciętny Intel Core i9-14900HX (3263 - 5589, n=38) | |
| SCHENKER Key 17 Pro (M24) | |
| Średnia w klasie Gaming (905 - 6074, n=154, ostatnie 2 lata) | |
| Acer Predator Triton Neo 16 PTN16-51-978P | |
| Cinebench R15 / CPU Single 64Bit | |
| Asus ROG Strix Scar 16 G634JZR | |
| Lenovo Legion Pro 7 16IRX9H | |
| MSI Raider 18 HX A14V | |
| Acer Predator Helios 16 PH16-72 | |
| Przeciętny Intel Core i9-14900HX (247 - 323, n=37) | |
| SCHENKER Key 17 Pro (M24) | |
| Średnia w klasie Gaming (191.9 - 343, n=151, ostatnie 2 lata) | |
| Acer Predator Triton Neo 16 PTN16-51-978P | |
| Blender / v2.79 BMW27 CPU | |
| Acer Predator Triton Neo 16 PTN16-51-978P | |
| Średnia w klasie Gaming (81 - 555, n=144, ostatnie 2 lata) | |
| Przeciętny Intel Core i9-14900HX (91 - 206, n=37) | |
| Acer Predator Helios 16 PH16-72 | |
| SCHENKER Key 17 Pro (M24) | |
| Asus ROG Strix Scar 16 G634JZR | |
| MSI Raider 18 HX A14V | |
| Lenovo Legion Pro 7 16IRX9H | |
| 7-Zip 18.03 / 7z b 4 | |
| Lenovo Legion Pro 7 16IRX9H | |
| MSI Raider 18 HX A14V | |
| Asus ROG Strix Scar 16 G634JZR | |
| Przeciętny Intel Core i9-14900HX (66769 - 136645, n=37) | |
| SCHENKER Key 17 Pro (M24) | |
| Acer Predator Helios 16 PH16-72 | |
| Średnia w klasie Gaming (23795 - 144064, n=149, ostatnie 2 lata) | |
| Acer Predator Triton Neo 16 PTN16-51-978P | |
| 7-Zip 18.03 / 7z b 4 -mmt1 | |
| Asus ROG Strix Scar 16 G634JZR | |
| Lenovo Legion Pro 7 16IRX9H | |
| Przeciętny Intel Core i9-14900HX (5452 - 7545, n=37) | |
| Acer Predator Helios 16 PH16-72 | |
| SCHENKER Key 17 Pro (M24) | |
| MSI Raider 18 HX A14V | |
| Średnia w klasie Gaming (4199 - 7573, n=149, ostatnie 2 lata) | |
| Acer Predator Triton Neo 16 PTN16-51-978P | |
| Geekbench 6.4 / Multi-Core | |
| Asus ROG Strix Scar 16 G634JZR | |
| Lenovo Legion Pro 7 16IRX9H | |
| Acer Predator Helios 16 PH16-72 | |
| Przeciętny Intel Core i9-14900HX (13158 - 19665, n=37) | |
| MSI Raider 18 HX A14V | |
| SCHENKER Key 17 Pro (M24) | |
| Średnia w klasie Gaming (5340 - 21668, n=119, ostatnie 2 lata) | |
| Acer Predator Triton Neo 16 PTN16-51-978P | |
| Geekbench 6.4 / Single-Core | |
| Lenovo Legion Pro 7 16IRX9H | |
| Asus ROG Strix Scar 16 G634JZR | |
| MSI Raider 18 HX A14V | |
| Acer Predator Helios 16 PH16-72 | |
| Przeciętny Intel Core i9-14900HX (2419 - 3129, n=37) | |
| Średnia w klasie Gaming (1490 - 3219, n=119, ostatnie 2 lata) | |
| SCHENKER Key 17 Pro (M24) | |
| Acer Predator Triton Neo 16 PTN16-51-978P | |
| Geekbench 5.5 / Multi-Core | |
| Asus ROG Strix Scar 16 G634JZR | |
| Acer Predator Helios 16 PH16-72 | |
| Lenovo Legion Pro 7 16IRX9H | |
| MSI Raider 18 HX A14V | |
| Przeciętny Intel Core i9-14900HX (8618 - 23194, n=37) | |
| SCHENKER Key 17 Pro (M24) | |
| Średnia w klasie Gaming (4557 - 25855, n=148, ostatnie 2 lata) | |
| Acer Predator Triton Neo 16 PTN16-51-978P | |
| Geekbench 5.5 / Single-Core | |
| Asus ROG Strix Scar 16 G634JZR | |
| MSI Raider 18 HX A14V | |
| Lenovo Legion Pro 7 16IRX9H | |
| Przeciętny Intel Core i9-14900HX (1669 - 2210, n=37) | |
| Acer Predator Helios 16 PH16-72 | |
| SCHENKER Key 17 Pro (M24) | |
| Średnia w klasie Gaming (986 - 2423, n=148, ostatnie 2 lata) | |
| Acer Predator Triton Neo 16 PTN16-51-978P | |
| HWBOT x265 Benchmark v2.2 / 4k Preset | |
| Lenovo Legion Pro 7 16IRX9H | |
| MSI Raider 18 HX A14V | |
| Asus ROG Strix Scar 16 G634JZR | |
| Przeciętny Intel Core i9-14900HX (16.8 - 38.9, n=37) | |
| Acer Predator Helios 16 PH16-72 | |
| SCHENKER Key 17 Pro (M24) | |
| Średnia w klasie Gaming (6.72 - 42.9, n=148, ostatnie 2 lata) | |
| Acer Predator Triton Neo 16 PTN16-51-978P | |
| LibreOffice / 20 Documents To PDF | |
| Acer Predator Triton Neo 16 PTN16-51-978P | |
| Asus ROG Strix Scar 16 G634JZR | |
| Średnia w klasie Gaming (19 - 96.6, n=147, ostatnie 2 lata) | |
| SCHENKER Key 17 Pro (M24) | |
| Przeciętny Intel Core i9-14900HX (19 - 85.1, n=37) | |
| Lenovo Legion Pro 7 16IRX9H | |
| MSI Raider 18 HX A14V | |
| Acer Predator Helios 16 PH16-72 | |
| R Benchmark 2.5 / Overall mean | |
| Acer Predator Triton Neo 16 PTN16-51-978P | |
| Średnia w klasie Gaming (0.3609 - 0.759, n=150, ostatnie 2 lata) | |
| SCHENKER Key 17 Pro (M24) | |
| Lenovo Legion Pro 7 16IRX9H | |
| Przeciętny Intel Core i9-14900HX (0.3604 - 0.4859, n=37) | |
| MSI Raider 18 HX A14V | |
| Acer Predator Helios 16 PH16-72 | |
| Asus ROG Strix Scar 16 G634JZR | |
* ... im mniej tym lepiej
AIDA64: FP32 Ray-Trace | FPU Julia | CPU SHA3 | CPU Queen | FPU SinJulia | FPU Mandel | CPU AES | CPU ZLib | FP64 Ray-Trace | CPU PhotoWorxx
| Performance Rating | |
| Lenovo Legion Pro 7 16IRX9H | |
| Asus ROG Strix Scar 16 G634JZR | |
| MSI Raider 18 HX A14V | |
| Przeciętny Intel Core i9-14900HX | |
| Acer Predator Helios 16 PH16-72 | |
| SCHENKER Key 17 Pro (M24) | |
| Średnia w klasie Gaming | |
| Acer Predator Triton Neo 16 PTN16-51-978P | |
| AIDA64 / FP32 Ray-Trace | |
| Lenovo Legion Pro 7 16IRX9H | |
| MSI Raider 18 HX A14V | |
| Asus ROG Strix Scar 16 G634JZR | |
| Przeciętny Intel Core i9-14900HX (13098 - 33474, n=36) | |
| Acer Predator Helios 16 PH16-72 | |
| Średnia w klasie Gaming (4986 - 81639, n=147, ostatnie 2 lata) | |
| SCHENKER Key 17 Pro (M24) | |
| Acer Predator Triton Neo 16 PTN16-51-978P | |
| AIDA64 / FPU Julia | |
| Lenovo Legion Pro 7 16IRX9H | |
| MSI Raider 18 HX A14V | |
| Asus ROG Strix Scar 16 G634JZR | |
| Przeciętny Intel Core i9-14900HX (67573 - 166040, n=36) | |
| Acer Predator Helios 16 PH16-72 | |
| SCHENKER Key 17 Pro (M24) | |
| Średnia w klasie Gaming (25360 - 252486, n=147, ostatnie 2 lata) | |
| Acer Predator Triton Neo 16 PTN16-51-978P | |
| AIDA64 / CPU SHA3 | |
| Lenovo Legion Pro 7 16IRX9H | |
| MSI Raider 18 HX A14V | |
| Asus ROG Strix Scar 16 G634JZR | |
| Przeciętny Intel Core i9-14900HX (3589 - 7979, n=36) | |
| Acer Predator Helios 16 PH16-72 | |
| SCHENKER Key 17 Pro (M24) | |
| Średnia w klasie Gaming (1339 - 10389, n=147, ostatnie 2 lata) | |
| Acer Predator Triton Neo 16 PTN16-51-978P | |
| AIDA64 / CPU Queen | |
| Asus ROG Strix Scar 16 G634JZR | |
| Lenovo Legion Pro 7 16IRX9H | |
| MSI Raider 18 HX A14V | |
| Acer Predator Helios 16 PH16-72 | |
| SCHENKER Key 17 Pro (M24) | |
| Przeciętny Intel Core i9-14900HX (118405 - 148966, n=36) | |
| Średnia w klasie Gaming (50699 - 200651, n=147, ostatnie 2 lata) | |
| Acer Predator Triton Neo 16 PTN16-51-978P | |
| AIDA64 / FPU SinJulia | |
| MSI Raider 18 HX A14V | |
| Lenovo Legion Pro 7 16IRX9H | |
| Asus ROG Strix Scar 16 G634JZR | |
| Acer Predator Helios 16 PH16-72 | |
| Przeciętny Intel Core i9-14900HX (10475 - 18517, n=36) | |
| SCHENKER Key 17 Pro (M24) | |
| Średnia w klasie Gaming (4800 - 32988, n=147, ostatnie 2 lata) | |
| Acer Predator Triton Neo 16 PTN16-51-978P | |
| AIDA64 / FPU Mandel | |
| Lenovo Legion Pro 7 16IRX9H | |
| MSI Raider 18 HX A14V | |
| Asus ROG Strix Scar 16 G634JZR | |
| Przeciętny Intel Core i9-14900HX (32543 - 83662, n=36) | |
| Acer Predator Helios 16 PH16-72 | |
| SCHENKER Key 17 Pro (M24) | |
| Średnia w klasie Gaming (12321 - 134044, n=147, ostatnie 2 lata) | |
| Acer Predator Triton Neo 16 PTN16-51-978P | |
| AIDA64 / CPU AES | |
| Asus ROG Strix Scar 16 G634JZR | |
| Przeciętny Intel Core i9-14900HX (86964 - 241777, n=36) | |
| Lenovo Legion Pro 7 16IRX9H | |
| MSI Raider 18 HX A14V | |
| Acer Predator Helios 16 PH16-72 | |
| SCHENKER Key 17 Pro (M24) | |
| Średnia w klasie Gaming (19065 - 328679, n=147, ostatnie 2 lata) | |
| Acer Predator Triton Neo 16 PTN16-51-978P | |
| AIDA64 / CPU ZLib | |
| Lenovo Legion Pro 7 16IRX9H | |
| MSI Raider 18 HX A14V | |
| Asus ROG Strix Scar 16 G634JZR | |
| Przeciętny Intel Core i9-14900HX (1054 - 2292, n=36) | |
| Acer Predator Helios 16 PH16-72 | |
| SCHENKER Key 17 Pro (M24) | |
| Średnia w klasie Gaming (373 - 2531, n=147, ostatnie 2 lata) | |
| Acer Predator Triton Neo 16 PTN16-51-978P | |
| AIDA64 / FP64 Ray-Trace | |
| Lenovo Legion Pro 7 16IRX9H | |
| MSI Raider 18 HX A14V | |
| Asus ROG Strix Scar 16 G634JZR | |
| Przeciętny Intel Core i9-14900HX (6809 - 18349, n=36) | |
| Acer Predator Helios 16 PH16-72 | |
| Średnia w klasie Gaming (2540 - 43430, n=147, ostatnie 2 lata) | |
| SCHENKER Key 17 Pro (M24) | |
| Acer Predator Triton Neo 16 PTN16-51-978P | |
| AIDA64 / CPU PhotoWorxx | |
| SCHENKER Key 17 Pro (M24) | |
| Asus ROG Strix Scar 16 G634JZR | |
| Acer Predator Helios 16 PH16-72 | |
| Lenovo Legion Pro 7 16IRX9H | |
| Przeciętny Intel Core i9-14900HX (23903 - 54702, n=36) | |
| Acer Predator Triton Neo 16 PTN16-51-978P | |
| MSI Raider 18 HX A14V | |
| Średnia w klasie Gaming (10805 - 60161, n=147, ostatnie 2 lata) | |
Wydajność systemu
Symbioza wysokiej klasy procesora, wydajnej karty graficznej, dużej ilości pamięci RAM i szybkiej pamięci masowej umożliwia płynne i responsywne działanie, które nie pozostawia nic do życzenia, nawet przy intensywnych obliczeniowo zadaniach. Niezależnie od tego, czy chodzi o codzienne cyfrowe życie, zanurzenie się w wirtualnych światach czy kreatywność - Helios 16 z łatwością radzi sobie ze wszystkimi tymi wyzwaniami. Helios 16 błyszczy również w dziedzinie sztucznej inteligencji i zapewnia szybkie wyniki.
CrossMark: Overall | Productivity | Creativity | Responsiveness
WebXPRT 3: Overall
WebXPRT 4: Overall
Mozilla Kraken 1.1: Total
| PCMark 10 / Score | |
| MSI Raider 18 HX A14V | |
| Acer Predator Helios 16 PH16-72 | |
| Lenovo Legion Pro 7 16IRX9H | |
| Przeciętny Intel Core i9-14900HX, NVIDIA GeForce RTX 4080 Laptop GPU (7703 - 9223, n=7) | |
| SCHENKER Key 17 Pro (M24) | |
| Średnia w klasie Gaming (5776 - 9852, n=133, ostatnie 2 lata) | |
| Asus ROG Strix Scar 16 G634JZR | |
| Acer Predator Triton Neo 16 PTN16-51-978P | |
| PCMark 10 / Essentials | |
| Acer Predator Helios 16 PH16-72 | |
| MSI Raider 18 HX A14V | |
| Lenovo Legion Pro 7 16IRX9H | |
| Przeciętny Intel Core i9-14900HX, NVIDIA GeForce RTX 4080 Laptop GPU (11255 - 12600, n=7) | |
| Asus ROG Strix Scar 16 G634JZR | |
| SCHENKER Key 17 Pro (M24) | |
| Średnia w klasie Gaming (9057 - 12600, n=133, ostatnie 2 lata) | |
| Acer Predator Triton Neo 16 PTN16-51-978P | |
| PCMark 10 / Productivity | |
| Lenovo Legion Pro 7 16IRX9H | |
| MSI Raider 18 HX A14V | |
| Acer Predator Helios 16 PH16-72 | |
| Przeciętny Intel Core i9-14900HX, NVIDIA GeForce RTX 4080 Laptop GPU (6662 - 11410, n=7) | |
| Średnia w klasie Gaming (6662 - 14612, n=133, ostatnie 2 lata) | |
| Acer Predator Triton Neo 16 PTN16-51-978P | |
| SCHENKER Key 17 Pro (M24) | |
| Asus ROG Strix Scar 16 G634JZR | |
| PCMark 10 / Digital Content Creation | |
| MSI Raider 18 HX A14V | |
| Asus ROG Strix Scar 16 G634JZR | |
| Przeciętny Intel Core i9-14900HX, NVIDIA GeForce RTX 4080 Laptop GPU (14211 - 16246, n=7) | |
| SCHENKER Key 17 Pro (M24) | |
| Acer Predator Helios 16 PH16-72 | |
| Lenovo Legion Pro 7 16IRX9H | |
| Średnia w klasie Gaming (6807 - 18475, n=133, ostatnie 2 lata) | |
| Acer Predator Triton Neo 16 PTN16-51-978P | |
| CrossMark / Overall | |
| Lenovo Legion Pro 7 16IRX9H | |
| Acer Predator Helios 16 PH16-72 | |
| Przeciętny Intel Core i9-14900HX, NVIDIA GeForce RTX 4080 Laptop GPU (1992 - 2334, n=7) | |
| MSI Raider 18 HX A14V | |
| Asus ROG Strix Scar 16 G634JZR | |
| Średnia w klasie Gaming (1247 - 2344, n=114, ostatnie 2 lata) | |
| CrossMark / Productivity | |
| Lenovo Legion Pro 7 16IRX9H | |
| Acer Predator Helios 16 PH16-72 | |
| Przeciętny Intel Core i9-14900HX, NVIDIA GeForce RTX 4080 Laptop GPU (1812 - 2204, n=7) | |
| MSI Raider 18 HX A14V | |
| Asus ROG Strix Scar 16 G634JZR | |
| Średnia w klasie Gaming (1299 - 2204, n=114, ostatnie 2 lata) | |
| CrossMark / Creativity | |
| Lenovo Legion Pro 7 16IRX9H | |
| Acer Predator Helios 16 PH16-72 | |
| Przeciętny Intel Core i9-14900HX, NVIDIA GeForce RTX 4080 Laptop GPU (2327 - 2500, n=7) | |
| MSI Raider 18 HX A14V | |
| Asus ROG Strix Scar 16 G634JZR | |
| Średnia w klasie Gaming (1275 - 2660, n=114, ostatnie 2 lata) | |
| CrossMark / Responsiveness | |
| Lenovo Legion Pro 7 16IRX9H | |
| Acer Predator Helios 16 PH16-72 | |
| Przeciętny Intel Core i9-14900HX, NVIDIA GeForce RTX 4080 Laptop GPU (1520 - 2254, n=7) | |
| MSI Raider 18 HX A14V | |
| Asus ROG Strix Scar 16 G634JZR | |
| Średnia w klasie Gaming (1030 - 2330, n=114, ostatnie 2 lata) | |
| WebXPRT 3 / Overall | |
| Lenovo Legion Pro 7 16IRX9H | |
| MSI Raider 18 HX A14V | |
| Przeciętny Intel Core i9-14900HX, NVIDIA GeForce RTX 4080 Laptop GPU (310 - 345, n=7) | |
| Acer Predator Helios 16 PH16-72 | |
| Asus ROG Strix Scar 16 G634JZR | |
| SCHENKER Key 17 Pro (M24) | |
| Średnia w klasie Gaming (215 - 480, n=127, ostatnie 2 lata) | |
| Acer Predator Triton Neo 16 PTN16-51-978P | |
| Acer Predator Triton Neo 16 PTN16-51-978P | |
| WebXPRT 4 / Overall | |
| MSI Raider 18 HX A14V | |
| Lenovo Legion Pro 7 16IRX9H | |
| Przeciętny Intel Core i9-14900HX, NVIDIA GeForce RTX 4080 Laptop GPU (300 - 321, n=7) | |
| Asus ROG Strix Scar 16 G634JZR | |
| Acer Predator Helios 16 PH16-72 | |
| SCHENKER Key 17 Pro (M24) | |
| Średnia w klasie Gaming (176.4 - 335, n=115, ostatnie 2 lata) | |
| Acer Predator Triton Neo 16 PTN16-51-978P | |
| Acer Predator Triton Neo 16 PTN16-51-978P | |
| Mozilla Kraken 1.1 / Total | |
| Acer Predator Triton Neo 16 PTN16-51-978P | |
| Acer Predator Triton Neo 16 PTN16-51-978P | |
| Średnia w klasie Gaming (409 - 674, n=139, ostatnie 2 lata) | |
| SCHENKER Key 17 Pro (M24) | |
| MSI Raider 18 HX A14V | |
| Asus ROG Strix Scar 16 G634JZR | |
| Acer Predator Helios 16 PH16-72 | |
| Przeciętny Intel Core i9-14900HX, NVIDIA GeForce RTX 4080 Laptop GPU (437 - 446, n=7) | |
| Lenovo Legion Pro 7 16IRX9H | |
* ... im mniej tym lepiej
| PCMark 10 Score | 9070 pkt. | |
Pomoc | ||
| AIDA64 / Memory Copy | |
| Acer Predator Triton Neo 16 PTN16-51-978P | |
| Acer Predator Helios 16 PH16-72 | |
| Asus ROG Strix Scar 16 G634JZR | |
| SCHENKER Key 17 Pro (M24) | |
| Lenovo Legion Pro 7 16IRX9H | |
| Przeciętny Intel Core i9-14900HX (38028 - 83392, n=36) | |
| Średnia w klasie Gaming (21750 - 97515, n=147, ostatnie 2 lata) | |
| MSI Raider 18 HX A14V | |
| AIDA64 / Memory Read | |
| Asus ROG Strix Scar 16 G634JZR | |
| Lenovo Legion Pro 7 16IRX9H | |
| SCHENKER Key 17 Pro (M24) | |
| Acer Predator Helios 16 PH16-72 | |
| Przeciętny Intel Core i9-14900HX (43306 - 87568, n=36) | |
| Acer Predator Triton Neo 16 PTN16-51-978P | |
| Średnia w klasie Gaming (22956 - 102937, n=147, ostatnie 2 lata) | |
| MSI Raider 18 HX A14V | |
| AIDA64 / Memory Write | |
| Asus ROG Strix Scar 16 G634JZR | |
| SCHENKER Key 17 Pro (M24) | |
| Acer Predator Helios 16 PH16-72 | |
| Acer Predator Triton Neo 16 PTN16-51-978P | |
| Przeciętny Intel Core i9-14900HX (37146 - 80589, n=36) | |
| Lenovo Legion Pro 7 16IRX9H | |
| Średnia w klasie Gaming (22297 - 108954, n=147, ostatnie 2 lata) | |
| MSI Raider 18 HX A14V | |
| AIDA64 / Memory Latency | |
| Acer Predator Triton Neo 16 PTN16-51-978P | |
| MSI Raider 18 HX A14V | |
| Średnia w klasie Gaming (59.5 - 259, n=147, ostatnie 2 lata) | |
| Przeciętny Intel Core i9-14900HX (76.1 - 105, n=36) | |
| SCHENKER Key 17 Pro (M24) | |
| Acer Predator Helios 16 PH16-72 | |
| Asus ROG Strix Scar 16 G634JZR | |
| Lenovo Legion Pro 7 16IRX9H | |
* ... im mniej tym lepiej
Opóźnienia DPC
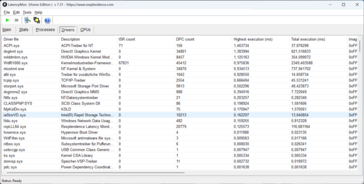
Acer Predator Helios 16 ma stosunkowo niskie opóźnienia DPC. LatencyMon podkreśla jednak, że w pewnych warunkach mogą pojawić się trudności, które mogą objawiać się trzaskami lub zacinaniem się dźwięku. To, czy i w jakim stopniu takie problemy wystąpią, zależy od indywidualnej konfiguracji oprogramowania i używanych sterowników.
| DPC Latencies / LatencyMon - interrupt to process latency (max), Web, Youtube, Prime95 | |
| Asus ROG Strix Scar 16 G634JZR | |
| MSI Raider 18 HX A14V | |
| Acer Predator Triton Neo 16 PTN16-51-978P | |
| SCHENKER Key 17 Pro (M24) | |
| Acer Predator Helios 16 PH16-72 | |
| Lenovo Legion Pro 7 16IRX9H | |
* ... im mniej tym lepiej
Pamięć masowa
Dysk Micron 3400 o pojemności 2 TB umieszczony wewnątrz Predator Helios może być szybki, ale jest raczej sprinterem. Pod długim obciążeniem dysk SSD NVMe zbytnio się nagrzewa, co zmniejsza jego prędkość. Acer ma jednak również kilka osłon na moduły pamięci, które sprawiają, że wyglądają ładniej, ale także powodują gromadzenie się ciepła. Gracze prawdopodobnie mogą jeszcze wprowadzić pewne ulepszenia w tym obszarze.
* ... im mniej tym lepiej
Continuous Performance Read: DiskSpd Read Loop, Queue Depth 8
Karta graficzna
Procesor graficzny NVIDIA GeForce RTX 4080 GPU do laptopów jest jedną z najpotężniejszych kart graficznych na rynku i sprawia, że Acer Predator Helios 16 jest prawdziwą maszyną do gier. Nawet bez aktywacji trybu "Turbo", GPU zapewnia imponującą wydajność, co znajduje odzwierciedlenie w wysokich wynikach w benchmarkach renderowania i sztucznej inteligencji. Choć w wynikach widać przepaść w stosunku do konkurentów z tą samą kartą graficzną, Helios 16 zyskuje punkty dzięki znacznie cichszemu poziomowi hałasu. Chociaż na przykład MSI Raider 18 osiąga 60 dB(A) podczas grania, Acer Predator Helios 16 osiąga tylko 48 dB(A) w naszym trybie testowym. To wyraźna zaleta dla tych, którzy lubią nieco cichszą rozgrywkę.
| 3DMark Cloud Gate Standard Score | 64258 pkt. | |
| 3DMark Fire Strike Score | 31656 pkt. | |
| 3DMark Time Spy Score | 17167 pkt. | |
| 3DMark Steel Nomad Score | 4173 pkt. | |
| 3DMark Steel Nomad Light Score | 17244 pkt. | |
Pomoc | ||
* ... im mniej tym lepiej
| Geekbench ML - 0.6 ONNX DirectML GPU | |
| SCHENKER Key 17 Pro (M24) | |
| Razer Blade 16 Early 2023 | |
| Acer Predator Helios 16 PH16-72 | |
| Minisforum AtomMan G7 Ti | |
| Geekbench AI | |
| Quantized ONNX DirectML GPU 1.1 | |
| Acer Predator Helios 16 PH16-72 | |
| Razer Blade 16 Early 2023 | |
| Minisforum AtomMan G7 Ti | |
| Gigabyte G5 KF5 2024 | |
| MSI Prestige 13 AI Plus Evo A2VMG | |
| Half Precision ONNX DirectML GPU 1.1 | |
| Razer Blade 16 Early 2023 | |
| Acer Predator Helios 16 PH16-72 | |
| Minisforum AtomMan G7 Ti | |
| Gigabyte G5 KF5 2024 | |
| MSI Prestige 13 AI Plus Evo A2VMG | |
| Single Precision ONNX DirectML GPU 1.1 | |
| Razer Blade 16 Early 2023 | |
| Acer Predator Helios 16 PH16-72 | |
| Minisforum AtomMan G7 Ti | |
| Gigabyte G5 KF5 2024 | |
| MSI Prestige 13 AI Plus Evo A2VMG | |
Wydajność w grach
Kompletując sprzęt do gier dla segmentu komputerów stacjonarnych, zazwyczaj wybierają Państwo razem ekran i kartę graficzną. Ekran powinien być w stanie wyświetlić od dwóch do trzech razy więcej obrazów na sekundę niż karta graficzna generuje klatek. Pozwala to skutecznie uniknąć zauważalnego rozrywania ekranu. Z ekranem Predator Helios 16 o częstotliwości odświeżania 250 Hz, 83 do 125 klatek na sekundę powinno być możliwe we wszystkich grach, aby odpowiednio zasilić doskonały ekran.
W większości gier, które testowaliśmy, jest to możliwe przy użyciu najwyższych ustawień jakości i w natywnej rozdzielczości wyświetlacza. Tytuły wykorzystujące technologię Ray Tracing, takie jak Cyberpunk 2077 i F1 2024, również działają znacznie powyżej 60 klatek na sekundę.
Ogólnie rzecz biorąc, Acer Predator Helios 16 robi dobre wrażenie podczas grania.
| Cyberpunk 2077 2.2 Phantom Liberty - 1920x1080 Ultra Preset (FSR off) | |
| MSI Raider 18 HX A14V | |
| Asus ROG Strix Scar 16 G634JZR | |
| Lenovo Legion Pro 7 16IRX9H | |
| SCHENKER Key 17 Pro (M24) | |
| Acer Predator Helios 16 PH16-72 | |
| Średnia w klasie Gaming (6.76 - 158, n=90, ostatnie 2 lata) | |
| Acer Predator Triton Neo 16 PTN16-51-978P | |
| Baldur's Gate 3 - 1920x1080 Ultra Preset | |
| SCHENKER Key 17 Pro (M24) | |
| Acer Predator Helios 16 PH16-72 | |
| Średnia w klasie Gaming (34.5 - 208, n=57, ostatnie 2 lata) | |
| Acer Predator Triton Neo 16 PTN16-51-978P | |
| GTA V - 1920x1080 Highest Settings possible AA:4xMSAA + FX AF:16x | |
| Lenovo Legion Pro 7 16IRX9H | |
| MSI Raider 18 HX A14V | |
| Asus ROG Strix Scar 16 G634JZR | |
| SCHENKER Key 17 Pro (M24) | |
| Acer Predator Helios 16 PH16-72 | |
| Średnia w klasie Gaming (12.1 - 168.2, n=132, ostatnie 2 lata) | |
| Acer Predator Triton Neo 16 PTN16-51-978P | |
| Strange Brigade - 1920x1080 ultra AA:ultra AF:16 | |
| SCHENKER Key 17 Pro (M24) | |
| MSI Raider 18 HX A14V | |
| Lenovo Legion Pro 7 16IRX9H | |
| Asus ROG Strix Scar 16 G634JZR | |
| Acer Predator Helios 16 PH16-72 | |
| Średnia w klasie Gaming (38.9 - 420, n=140, ostatnie 2 lata) | |
W teście długoterminowym gry Cyberpunk 2077, po kilku minutach gry zaobserwowano niewielki spadek liczby klatek na sekundę. Liczba klatek na sekundę utrzymywała się jednak na stałym poziomie powyżej 100 klatek na sekundę. Spadek wydajności wyniósł około 10%.
Cyberpunk 2077 ultra FPS diagram
| low | med. | high | ultra | QHD | 4K | |
|---|---|---|---|---|---|---|
| GTA V (2015) | 184.5 | 171.9 | 112.1 | 106.5 | ||
| Dota 2 Reborn (2015) | 231 | 212 | 201 | 172.7 | 182.4 | |
| Final Fantasy XV Benchmark (2018) | 183.9 | 177.3 | 139 | 116.6 | 71.1 | |
| X-Plane 11.11 (2018) | 185 | 153.3 | 122.6 | 119 | ||
| Strange Brigade (2018) | 337 | 293 | 266 | 197.1 | ||
| Baldur's Gate 3 (2023) | 140 | 99.7 | ||||
| Cyberpunk 2077 2.2 Phantom Liberty (2023) | 144.7 | 104.3 | 106.1 | 72.5 | ||
| Senua's Saga Hellblade 2 (2024) | 62.5 | 40.7 | ||||
| F1 24 (2024) | 233 | 231 | 68.7 | |||
| God of War Ragnarök (2024) | 146.3 | 111.2 |
Emisje: Koci drapieżnik z cichymi łapami
Emisja hałasu
W trybie turbo Acer Predator Helios 16 pręży muskuły i oprócz imponującej wydajności, osiąga również imponujący poziom hałasu do 59,4 dB(A). Jak już wspomniano, tryb wydajności stanowi doskonałą alternatywę dla graczy, którzy lubią nieco ciszej. Tutaj głośność wzrasta maksymalnie do 45,6 dB(A) do 48 dB(A). Głośność ta jest znośna podczas dłuższych sesji, a w połączeniu z dobrymi głośnikami oferuje wciągające wrażenia z gry bez konieczności poświęcania zbyt dużej wydajności.
Jeśli preferują Państwo szczególnie cichą rozgrywkę, Helios 16 może nawet pracować przez dłuższy czas tak, że będzie ledwo słyszalny lub bezgłośny. W trybie zrównoważonym poziom hałasu pod obciążeniem pozostaje przyjemnie dyskretny w tle na poziomie około 35 dB(A) do 39 dB(A). Podczas strumieniowania lub pracy biurowej wentylatory są prawie zawsze niesłyszalne lub bardzo ciche. Cieszy również fakt, że wentylatory laptopa do gier nie wytwarzają żadnych nieprzyjemnych częstotliwości, które mogłyby być irytujące w dłuższej perspektywie.
Hałas
| luz |
| 26.1 / 29.4 / 31.9 dB |
| obciążenie |
| 0 / 45.6 dB |
 | ||
30 dB cichy 40 dB(A) słyszalny 50 dB(A) irytujący |
||
min: | ||
| Acer Predator Helios 16 PH16-72 NVIDIA GeForce RTX 4080 Laptop GPU, i9-14900HX, Micron 3400 2TB MTFDKBA2T0TFH | MSI Raider 18 HX A14V NVIDIA GeForce RTX 4080 Laptop GPU, i9-14900HX, Samsung PM9A1 MZVL22T0HBLB | Asus ROG Strix Scar 16 G634JZR NVIDIA GeForce RTX 4080 Laptop GPU, i9-14900HX, SK hynix PC801 HFS002TEJ9X101N | Lenovo Legion Pro 7 16IRX9H NVIDIA GeForce RTX 4080 Laptop GPU, i9-14900HX, SK Hynix HFS001TEJ9X115N | Acer Predator Triton Neo 16 PTN16-51-978P NVIDIA GeForce RTX 4070 Laptop GPU, Ultra 9 185H, SK Hynix PC801 HFS001TEJ9X125N | SCHENKER Key 17 Pro (M24) NVIDIA GeForce RTX 4090 Laptop GPU, i9-14900HX, Samsung 990 Pro 1 TB | |
|---|---|---|---|---|---|---|
| Noise | -9% | -3% | -11% | -12% | -3% | |
| wyłączone / środowisko * | 26.1 | 23.3 11% | 21.07 19% | 24 8% | 24 8% | 23.41 10% |
| Idle Minimum * | 26.1 | 28.6 -10% | 29.75 -14% | 25 4% | 32 -23% | 25.33 3% |
| Idle Average * | 29.4 | 28.6 3% | 29.75 -1% | 30 -2% | 34 -16% | 25.33 14% |
| Idle Maximum * | 31.9 | 31.3 2% | 29.75 7% | 45 -41% | 40 -25% | 25.33 21% |
| Load Average * | 44.1 | 54.85 | 50 | 48 | 33.57 | |
| Cyberpunk 2077 ultra * | 48.2 | 59.4 -23% | 50 -4% | 61.97 -29% | ||
| Load Maximum * | 45.6 | 62.7 -38% | 58 -27% | 56 -23% | 51 -12% | 62.14 -36% |
| Witcher 3 ultra * | 57.8 | 54 |
* ... im mniej tym lepiej
Temperatura
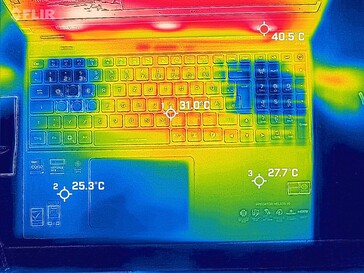
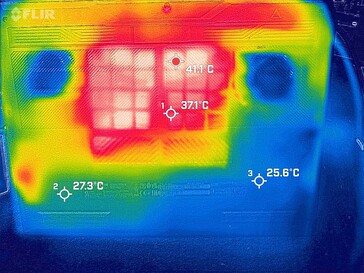
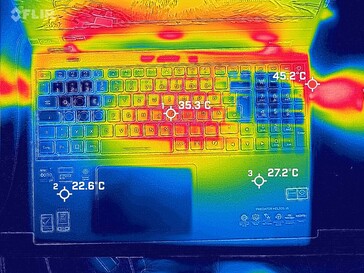
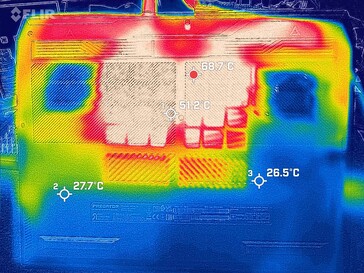
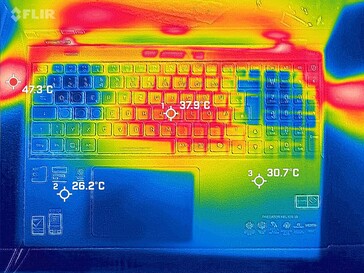
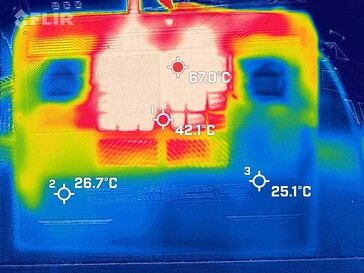
Nawet w najtrudniejszych warunkach, Acer Predator Helios 16 zachowuje zarówno chłodną głowę, jak i chłodną obudowę. Klawisze i podpórki pod nadgarstki zawsze pozostają przyjemnie świeże, nawet gdy dominuje wewnętrzne ciepło z procesora i karty graficznej. Obrazy termiczne mogą pokazywać, że radiatory wewnątrz są gorące, ale to ciepło odpadowe nie dociera do obudowy. Nasza kamera zagląda przez otwory wentylacyjne. Co prawda, w teście obciążeniowym pokrywa podstawy jest wystawiona na działanie dość ciepłych 50°C, ale prawdopodobnie dość rzadko zdarza się, że laptop do gier znajduje się na kolanach pod pełnym obciążeniem. Szczególnie imponujące jest to, że Helios 16 nie traci nerwów nawet podczas grania i w trybie turbo.
(+) Maksymalna temperatura w górnej części wynosi 37.5 °C / 100 F, w porównaniu do średniej 40.4 °C / 105 F , począwszy od 21.2 do 68.8 °C dla klasy Gaming.
(±) Dno nagrzewa się maksymalnie do 43.9 °C / 111 F, w porównaniu do średniej 43.2 °C / 110 F
(+) W stanie bezczynności średnia temperatura górnej części wynosi 28.7 °C / 84 F, w porównaniu ze średnią temperaturą urządzenia wynoszącą 33.9 °C / ### class_avg_f### F.
(+) 3: The average temperature for the upper side is 28.9 °C / 84 F, compared to the average of 33.9 °C / 93 F for the class Gaming.
(+) Podpórki pod nadgarstki i touchpad są chłodniejsze niż temperatura skóry i maksymalnie 30.7 °C / 87.3 F i dlatego są chłodne w dotyku.
(±) Średnia temperatura obszaru podparcia dłoni w podobnych urządzeniach wynosiła 28.9 °C / 84 F (-1.8 °C / -3.3 F).
| Acer Predator Helios 16 PH16-72 Intel Core i9-14900HX, NVIDIA GeForce RTX 4080 Laptop GPU | |
|---|---|
| Heat | |
| Maximum Upper Side * | 37.5 |
| Maximum Bottom * | 43.9 |
| Idle Upper Side * | 31 |
| Idle Bottom * | 42 |
* ... im mniej tym lepiej
Test warunków skrajnych
Aby doprowadzić Acer Predator Helios 16 do granic możliwości, przeprowadziliśmy test obciążeniowy przy użyciu programów Prime95 i FurMark. Te dwa programy poddały CPU i GPU maksymalnemu obciążeniu przez dłuższy czas, symulując najgorszy scenariusz. Zarejestrowaliśmy zmiany temperatury i wydajności w ciągu godziny.
Wynik: Po początkowej fazie przyspieszenia, która może trwać od kilku sekund do dwóch minut, w zależności od trybu wydajności, Helios 16 ustabilizował się na stałym poziomie. Temperatury pozostawały w tolerowanym zakresie i nie zaobserwowano żadnych spadków wydajności. Pokazuje to, że system chłodzenia ciekłym metalem w Heliosie 16 działa wydajnie nawet przy ekstremalnym obciążeniu i chroni sprzęt przed przegrzaniem.
Głośniki
Głośniki Acer Predator Helios 16 zapewniają bogaty dźwięk ze zrównoważonymi niskimi i wyraźnymi średnimi tonami. Maksymalna głośność 81,9 dB(A) wyraźnie przytłacza wentylatory, co oznacza, że są one słyszalne nawet podczas intensywnych sesji gamingowych.
Acer Predator Helios 16 PH16-72 analiza dźwięku
(±) | głośność głośnika jest średnia, ale dobra (81.9 dB)
Bas 100 - 315 Hz
(±) | zredukowany bas - średnio 14.2% niższy od mediany
(±) | liniowość basu jest średnia (11.7% delta do poprzedniej częstotliwości)
Średnie 400 - 2000 Hz
(±) | wyższe średnie - średnio 8.3% wyższe niż mediana
(±) | liniowość środka jest średnia (8.8% delta do poprzedniej częstotliwości)
Wysokie 2–16 kHz
(+) | zrównoważone maksima - tylko 4.2% od mediany
(+) | wzloty są liniowe (6% delta do poprzedniej częstotliwości)
Ogólnie 100 - 16.000 Hz
(±) | liniowość ogólnego dźwięku jest średnia (19% różnicy w stosunku do mediany)
W porównaniu do tej samej klasy
» 62% wszystkich testowanych urządzeń w tej klasie było lepszych, 8% podobnych, 30% gorszych
» Najlepszy miał deltę 6%, średnia wynosiła ###średnia###%, najgorsza wynosiła 132%
W porównaniu do wszystkich testowanych urządzeń
» 42% wszystkich testowanych urządzeń było lepszych, 8% podobnych, 50% gorszych
» Najlepszy miał deltę 4%, średnia wynosiła ###średnia###%, najgorsza wynosiła 134%
SCHENKER Key 17 Pro (M24) analiza dźwięku
(±) | głośność głośnika jest średnia, ale dobra (80.9 dB)
Bas 100 - 315 Hz
(±) | zredukowany bas - średnio 12.7% niższy od mediany
(±) | liniowość basu jest średnia (9.1% delta do poprzedniej częstotliwości)
Średnie 400 - 2000 Hz
(+) | zbalansowane środki średnie - tylko 2.3% od mediany
(+) | średnie są liniowe (5.1% delta do poprzedniej częstotliwości)
Wysokie 2–16 kHz
(+) | zrównoważone maksima - tylko 2.9% od mediany
(±) | liniowość wysokich wartości jest średnia (8.9% delta do poprzedniej częstotliwości)
Ogólnie 100 - 16.000 Hz
(+) | ogólny dźwięk jest liniowy (11.2% różnicy w stosunku do mediany)
W porównaniu do tej samej klasy
» 10% wszystkich testowanych urządzeń w tej klasie było lepszych, 3% podobnych, 87% gorszych
» Najlepszy miał deltę 7%, średnia wynosiła ###średnia###%, najgorsza wynosiła 35%
W porównaniu do wszystkich testowanych urządzeń
» 6% wszystkich testowanych urządzeń było lepszych, 2% podobnych, 92% gorszych
» Najlepszy miał deltę 4%, średnia wynosiła ###średnia###%, najgorsza wynosiła 134%
Zarządzanie energią: Wysokie zużycie na biegu jałowym
Zużycie energii
W trybie bezczynności Acer Predator Helios 16 nie jest najbardziej ekonomiczny. Zużycie energii jest stosunkowo wysokie, co oczywiście wpływa na żywotność baterii. Pod obciążeniem zużycie energii mieści się jednak w oczekiwanym zakresie dla laptopa do gier wyposażonego w tego typu potężny sprzęt. Dlatego też, jeśli szukają Państwo laptopa o maksymalnym czasie pracy na baterii, powinni Państwo poszukać alternatywy. Jednak dla graczy i zaawansowanych użytkowników, którzy chcą wykorzystać pełną wydajność Heliosa 16, zużycie energii jest akceptowalne.
| wyłączony / stan wstrzymania | |
| luz | |
| obciążenie |
|
Legenda:
min: | |
| Acer Predator Helios 16 PH16-72 i9-14900HX, NVIDIA GeForce RTX 4080 Laptop GPU, Micron 3400 2TB MTFDKBA2T0TFH, IPS, 2560x1600, 16" | MSI Raider 18 HX A14V i9-14900HX, NVIDIA GeForce RTX 4080 Laptop GPU, Samsung PM9A1 MZVL22T0HBLB, Mini-LED, 3840x2400, 18" | Asus ROG Strix Scar 16 G634JZR i9-14900HX, NVIDIA GeForce RTX 4080 Laptop GPU, SK hynix PC801 HFS002TEJ9X101N, Mini LED, 2560x1600, 16" | Lenovo Legion Pro 7 16IRX9H i9-14900HX, NVIDIA GeForce RTX 4080 Laptop GPU, SK Hynix HFS001TEJ9X115N, IPS, 2560x1600, 16" | Acer Predator Triton Neo 16 PTN16-51-978P Ultra 9 185H, NVIDIA GeForce RTX 4070 Laptop GPU, SK Hynix PC801 HFS001TEJ9X125N, IPS, 3200x2000, 16" | SCHENKER Key 17 Pro (M24) i9-14900HX, NVIDIA GeForce RTX 4090 Laptop GPU, Samsung 990 Pro 1 TB, IPS, 3840x2160, 17.3" | Przeciętny NVIDIA GeForce RTX 4080 Laptop GPU | Średnia w klasie Gaming | |
|---|---|---|---|---|---|---|---|---|
| Power Consumption | -10% | 40% | 23% | 52% | 24% | 27% | 41% | |
| Idle Minimum * | 31.5 | 27.7 12% | 10.71 66% | 16 49% | 10 68% | 12.16 61% | 16.9 ? 46% | 13.4 ? 57% |
| Idle Average * | 31.5 | 38.3 -22% | 14.75 53% | 21 33% | 15 52% | 15.97 49% | 22 ? 30% | 18.9 ? 40% |
| Idle Maximum * | 47.5 | 47.1 1% | 30 37% | 36 24% | 23 52% | 23.71 50% | 34.1 ? 28% | 26.3 ? 45% |
| Cyberpunk 2077 ultra * | 231 | 313 -35% | 122 47% | 274 -19% | ||||
| Cyberpunk 2077 ultra external monitor * | 270 | 306 -13% | 118.7 56% | 280 -4% | ||||
| Load Maximum * | 313 | 321.8 -3% | 307 2% | 360 -15% | 206 34% | 301 4% | 297 ? 5% | 244 ? 22% |
| Load Average * | 121.2 | 135 | 132 | 80 | 113.06 | 117.9 ? | 102.7 ? | |
| Witcher 3 ultra * | 286 | 267 |
* ... im mniej tym lepiej
Power consumption Cyberpunk / Stress Test
Power consumption with an external monitor
Żywotność baterii
Wyposażony w baterię 90 Wh, można by oczekiwać, że Acer Predator Helios 16 będzie miał przyzwoitą żywotność baterii. Jednak wysoki pobór mocy wynoszący około 30 watów, nawet podczas pracy na biegu jałowym, osłabia tę nadzieję. Helios 16 nie osiąga wybitnych czasów pracy, co może być spowodowane energochłonnym procesorem Intel Core i9-14900HX i GPU, który nie jest optymalnie zarządzany.
Jest jednak nadzieja na poprawę: aktualizacja oprogramowania z ulepszonym zarządzaniem energią może wydłużyć żywotność baterii w przyszłości. Do tego czasu użytkownicy będą musieli zadowolić się podanymi czasami pracy, które jednak mieszczą się w oczekiwanym zakresie dla laptopa do gier w tej kategorii wydajności.
| Acer Predator Helios 16 PH16-72 i9-14900HX, NVIDIA GeForce RTX 4080 Laptop GPU, 90 Wh | MSI Raider 18 HX A14V i9-14900HX, NVIDIA GeForce RTX 4080 Laptop GPU, 99.9 Wh | Asus ROG Strix Scar 16 G634JZR i9-14900HX, NVIDIA GeForce RTX 4080 Laptop GPU, 90 Wh | Lenovo Legion Pro 7 16IRX9H i9-14900HX, NVIDIA GeForce RTX 4080 Laptop GPU, 99.9 Wh | Acer Predator Triton Neo 16 PTN16-51-978P Ultra 9 185H, NVIDIA GeForce RTX 4070 Laptop GPU, 76 Wh | SCHENKER Key 17 Pro (M24) i9-14900HX, NVIDIA GeForce RTX 4090 Laptop GPU, 99 Wh | Średnia w klasie Gaming | |
|---|---|---|---|---|---|---|---|
| Czasy pracy | -29% | 57% | 35% | 60% | 11% | 40% | |
| WiFi v1.3 | 277 | 198 -29% | 434 57% | 373 35% | 444 60% | 203 -27% | 387 ? 40% |
| Cyberpunk 2077 ultra 150cd | 45 | 67 49% | |||||
| Reader / Idle | 264 | 585 ? | |||||
| Load | 76 | 51 | 64 | 84.5 ? | |||
| H.264 | 451 | 447 ? | |||||
| Witcher 3 ultra | 57 | 74.7 ? |
Ogólna ocena Notebookcheck
Acer Predator Helios 16 to niezwykle użyteczny i wydajny laptop do gier, który sprawdza się w niemal każdej dyscyplinie. Szeroki zakres opcji personalizacji pozwala dostosować urządzenie do własnych preferencji. Wydajność jest znakomita, a wentylatory pozostają na przyjemnym poziomie głośności nawet pod obciążeniem. Na szczególną uwagę zasługuje fakt, że Helios 16 oferuje znakomitą wydajność w grach nawet przy ustawieniu cichych wentylatorów. Jedynie czas pracy na baterii mógłby być nieco lepszy.
Acer Predator Helios 16 PH16-72
- 13/01/2025 v8
Marc Herter
Przezroczystość
Wyboru urządzeń do recenzji dokonuje nasza redakcja. Próbka testowa została udostępniona autorowi jako pożyczka od producenta lub sprzedawcy detalicznego na potrzeby tej recenzji. Pożyczkodawca nie miał wpływu na tę recenzję, producent nie otrzymał też kopii tej recenzji przed publikacją. Nie było obowiązku publikowania tej recenzji. Nigdy nie przyjmujemy rekompensaty ani płatności w zamian za nasze recenzje. Jako niezależna firma medialna, Notebookcheck nie podlega władzy producentów, sprzedawców detalicznych ani wydawców.
Tak testuje Notebookcheck
Każdego roku Notebookcheck niezależnie sprawdza setki laptopów i smartfonów, stosując standardowe procedury, aby zapewnić porównywalność wszystkich wyników. Od około 20 lat stale rozwijamy nasze metody badawcze, ustanawiając przy tym standardy branżowe. W naszych laboratoriach testowych doświadczeni technicy i redaktorzy korzystają z wysokiej jakości sprzętu pomiarowego. Testy te obejmują wieloetapowy proces walidacji. Nasz kompleksowy system ocen opiera się na setkach uzasadnionych pomiarów i benchmarków, co pozwala zachować obiektywizm.










 Total Sustainability Score:


