

Recenzja MSI Raider 18 HX A14V: Wydajność Tytana bez ceny Tytana
")
Większe, 18-calowe laptopy do gier powracają do łask, a ich oferta stale się poszerza. MSI oferuje już "najlepsze" 18-calowe wrażenia z grania dzięki modelowi Titan 18 HXale najnowszy model Raider 18 HX jest o jeden poziom niższy pod względem funkcji, aby obniżyć barierę wejścia.
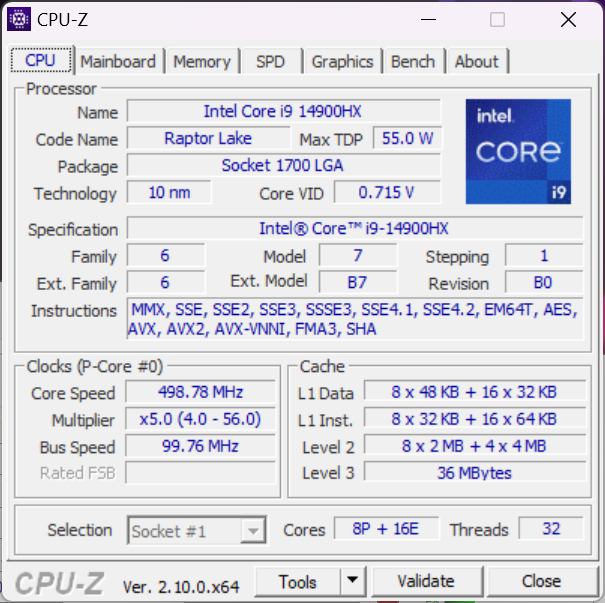
Nasza jednostka testowa to środkowa konfiguracja z procesorem Raptor Lake-R Core i9-14900HX, 175 W GeForce RTX 4080 GPU i wyświetlaczem Mini-LED 3840 x 2400 120 Hz za około 3200 USD w sprzedaży detalicznej. Inne jednostki SKU obejmują zamiast tego Zen 4 Ryzen 9 7945HX, RTX 4070, RTX 4090 lub wyświetlacz IPS QHD+ 2560 x 1600 240 Hz.
Konkurentami Raider 18 HX są inne 18-calowe laptopy do gier, takie jak Razer Blade 18, Alienware m18 R2lub Asus ROG Strix G18.
Więcej recenzji MSI:
Potencjalni konkurenci w porównaniu
Ocena | Wersja | Data | Model | Waga | Wysokość | Rozmiar | Rezolucja | Cena |
|---|---|---|---|---|---|---|---|---|
| 84.7 % | v8 | 09/2024 | MSI Raider 18 HX A14V i9-14900HX, NVIDIA GeForce RTX 4080 Laptop GPU | 3.6 kg | 32 mm | 18.00" | 3840x2400 | |
| 90.5 % v7 (old) | v7 (old) | 05/2024 | Razer Blade 18 2024 RZ09-0509 i9-14900HX, NVIDIA GeForce RTX 4090 Laptop GPU | 3.1 kg | 21.9 mm | 18.00" | 2560x1600 | |
| 89.5 % v7 (old) | v7 (old) | 03/2024 | Alienware m18 R2 i9-14900HX, NVIDIA GeForce RTX 4090 Laptop GPU | 4 kg | 26.7 mm | 18.00" | 2560x1600 | |
| 88.8 % v7 (old) | v7 (old) | 01/2024 | MSI Titan 18 HX A14VIG i9-14900HX, NVIDIA GeForce RTX 4090 Laptop GPU | 3.6 kg | 32.1 mm | 18.00" | 3840x2400 | |
| 87.4 % v7 (old) | v7 (old) | 03/2023 | Asus ROG Strix G18 G814JI i7-13650HX, NVIDIA GeForce RTX 4070 Laptop GPU | 3 kg | 31 mm | 18.00" | 2560x1600 | |
| 87.1 % v7 (old) | v7 (old) | 03/2024 | Acer Predator Helios 18 PH18-72-98MW i9-14900HX, NVIDIA GeForce RTX 4090 Laptop GPU | 3.3 kg | 29.5 mm | 18.00" | 2560x1600 |
Uwaga: Niedawno zaktualizowaliśmy nasz system oceny i wyniki wersji 8 nie są porównywalne z wynikami wersji 7. Więcej informacji znajdą Państwo tutaj .
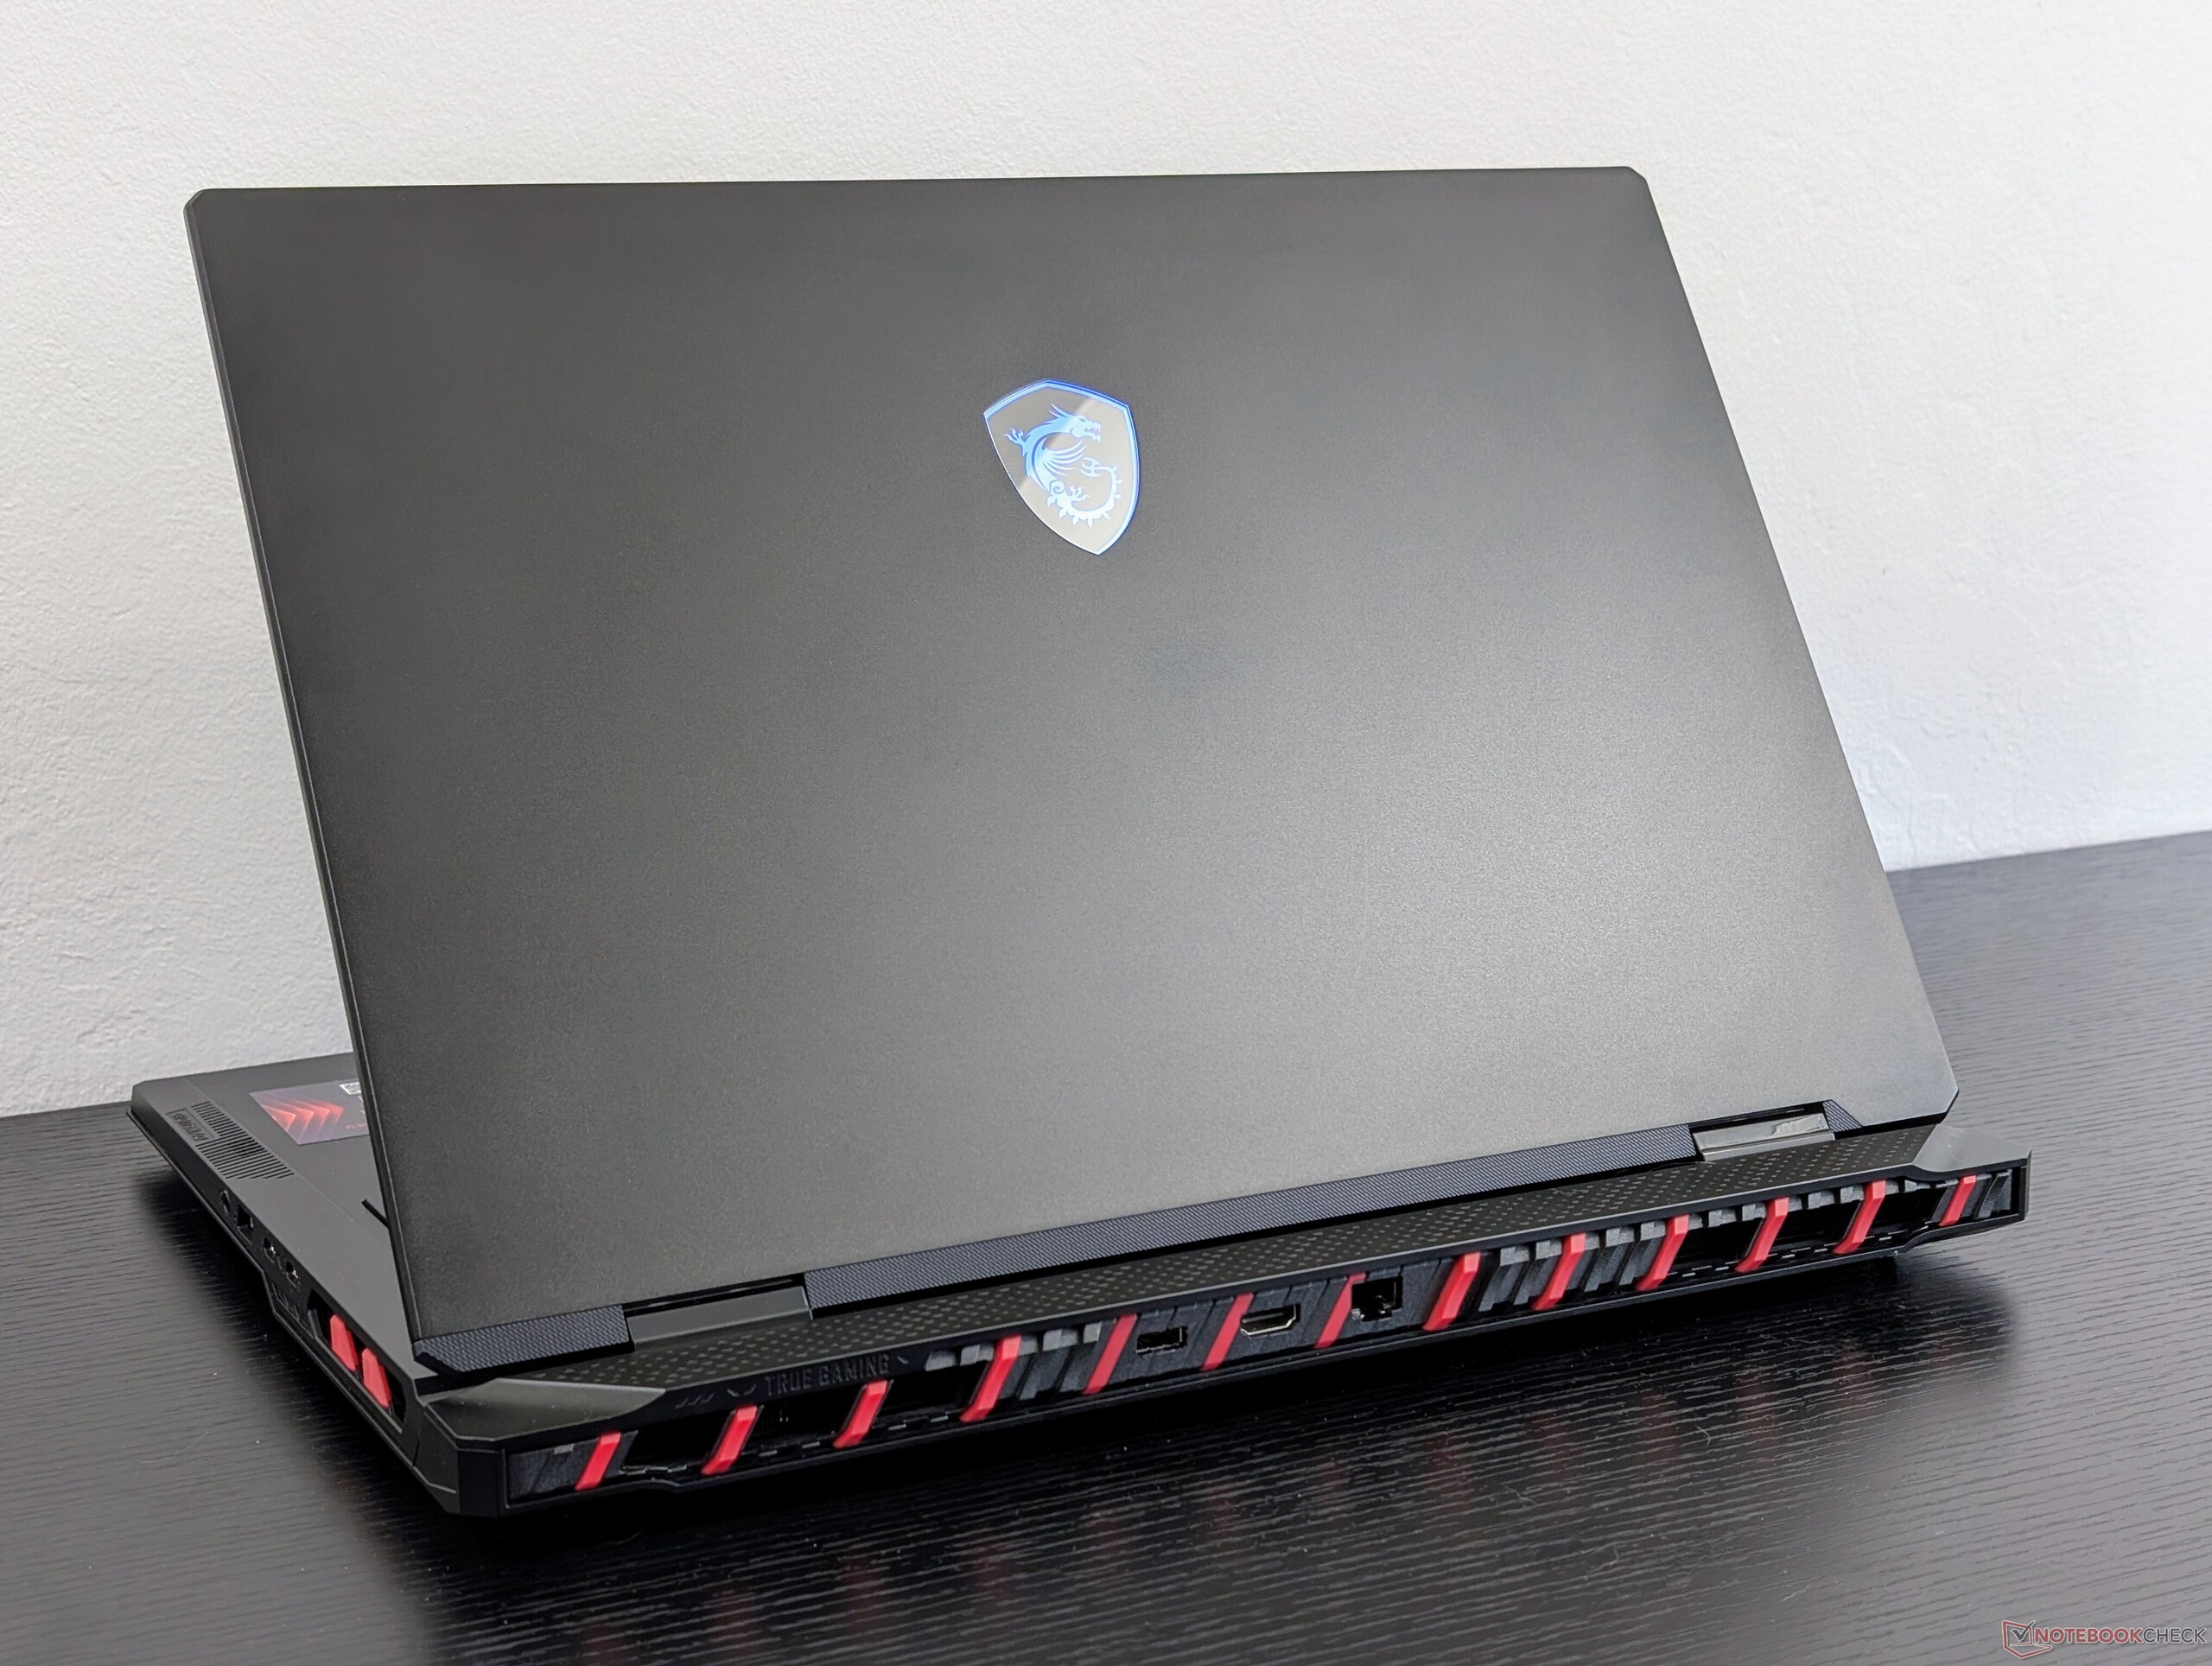
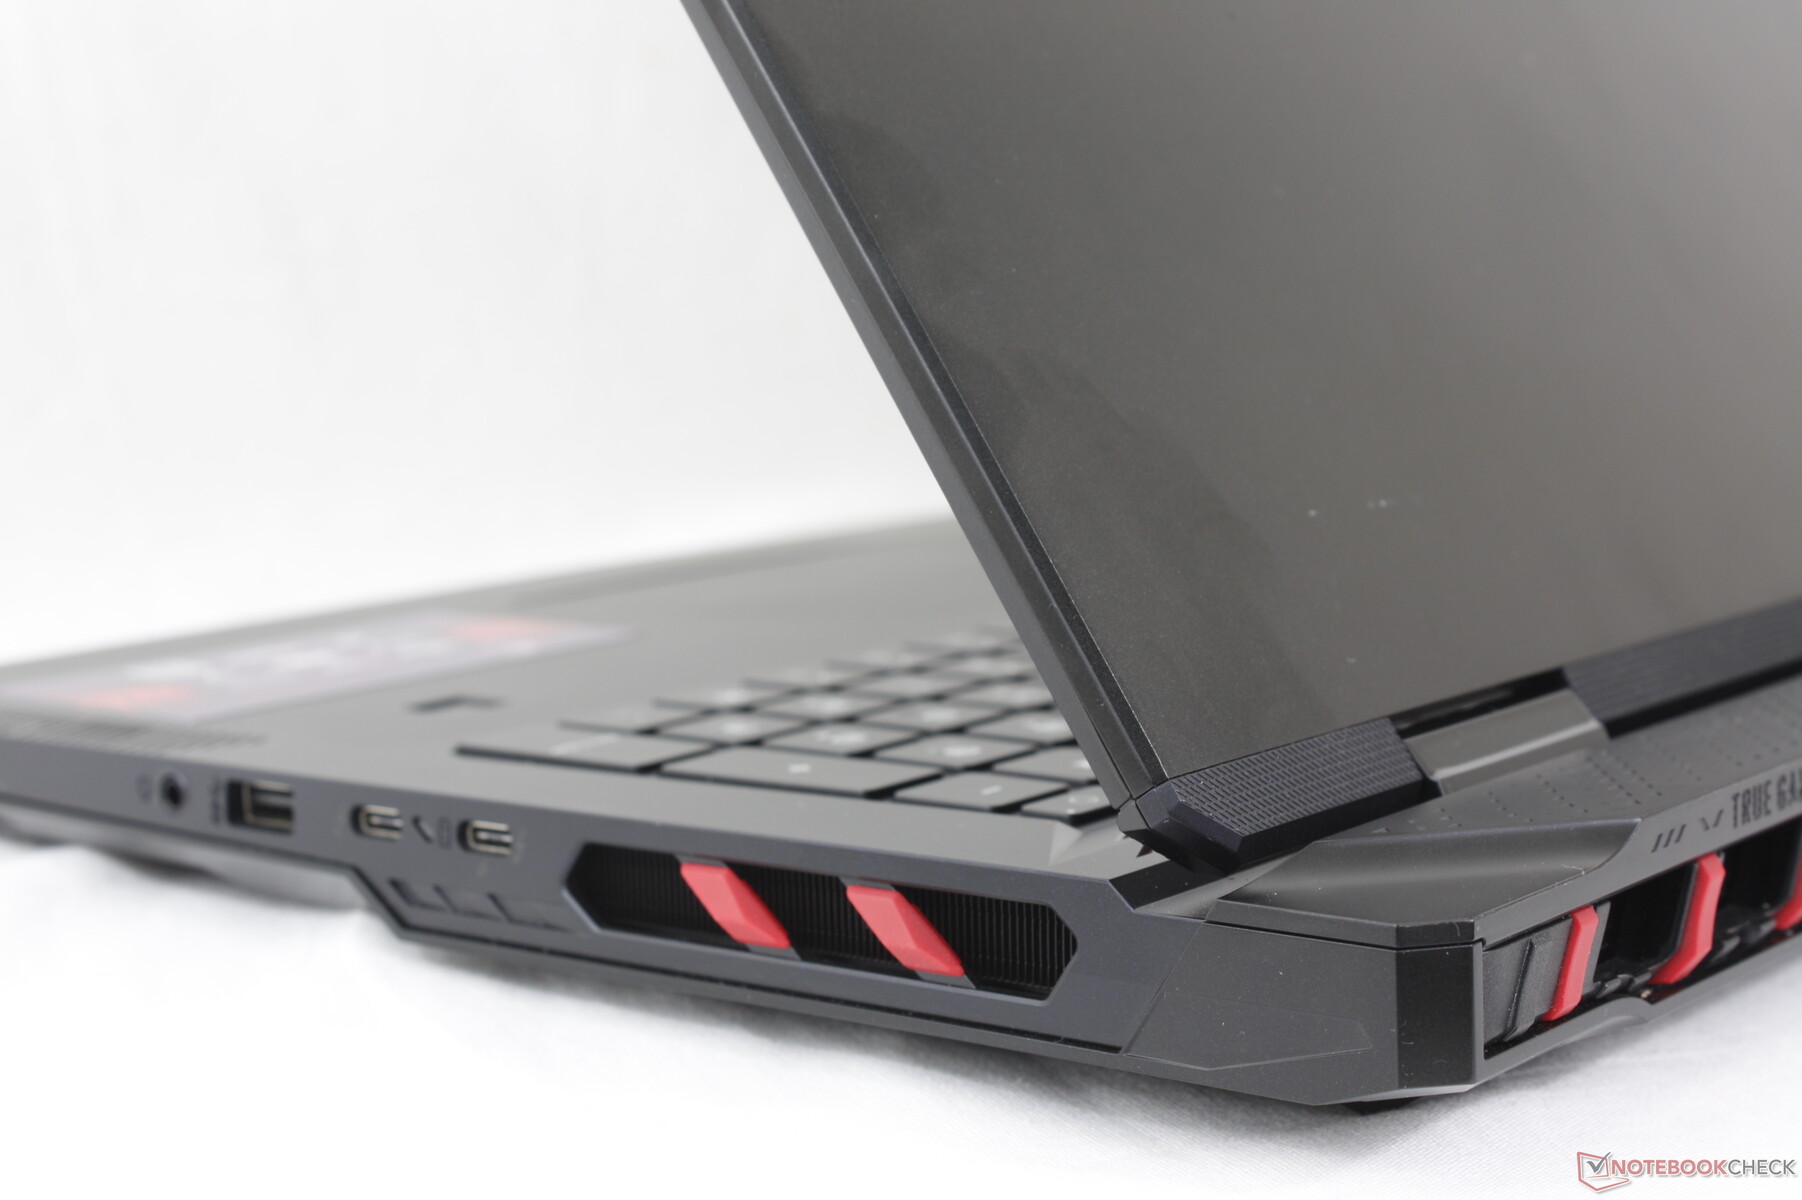
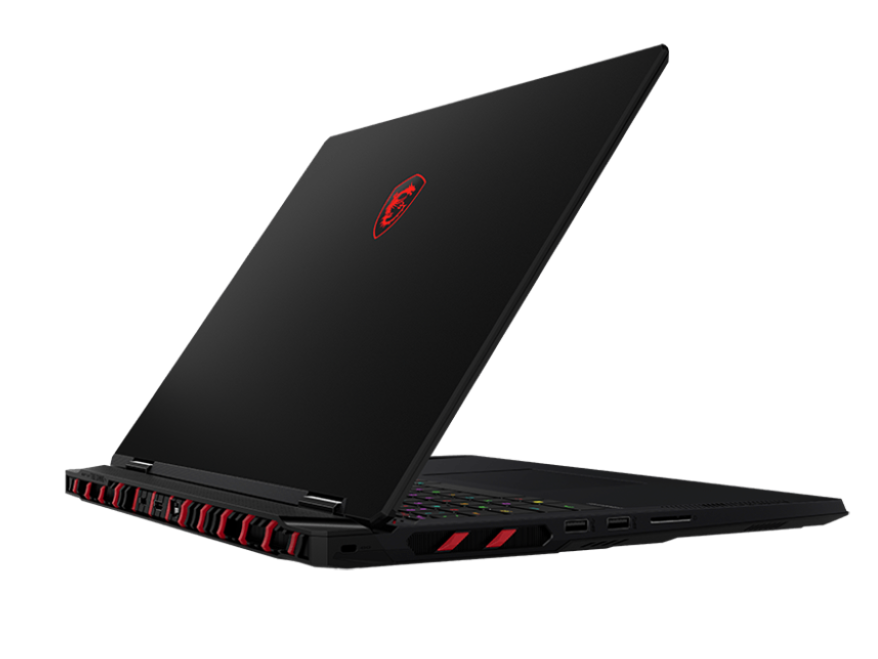
Sprawa - Od niebieskiego smoka do czerwonego
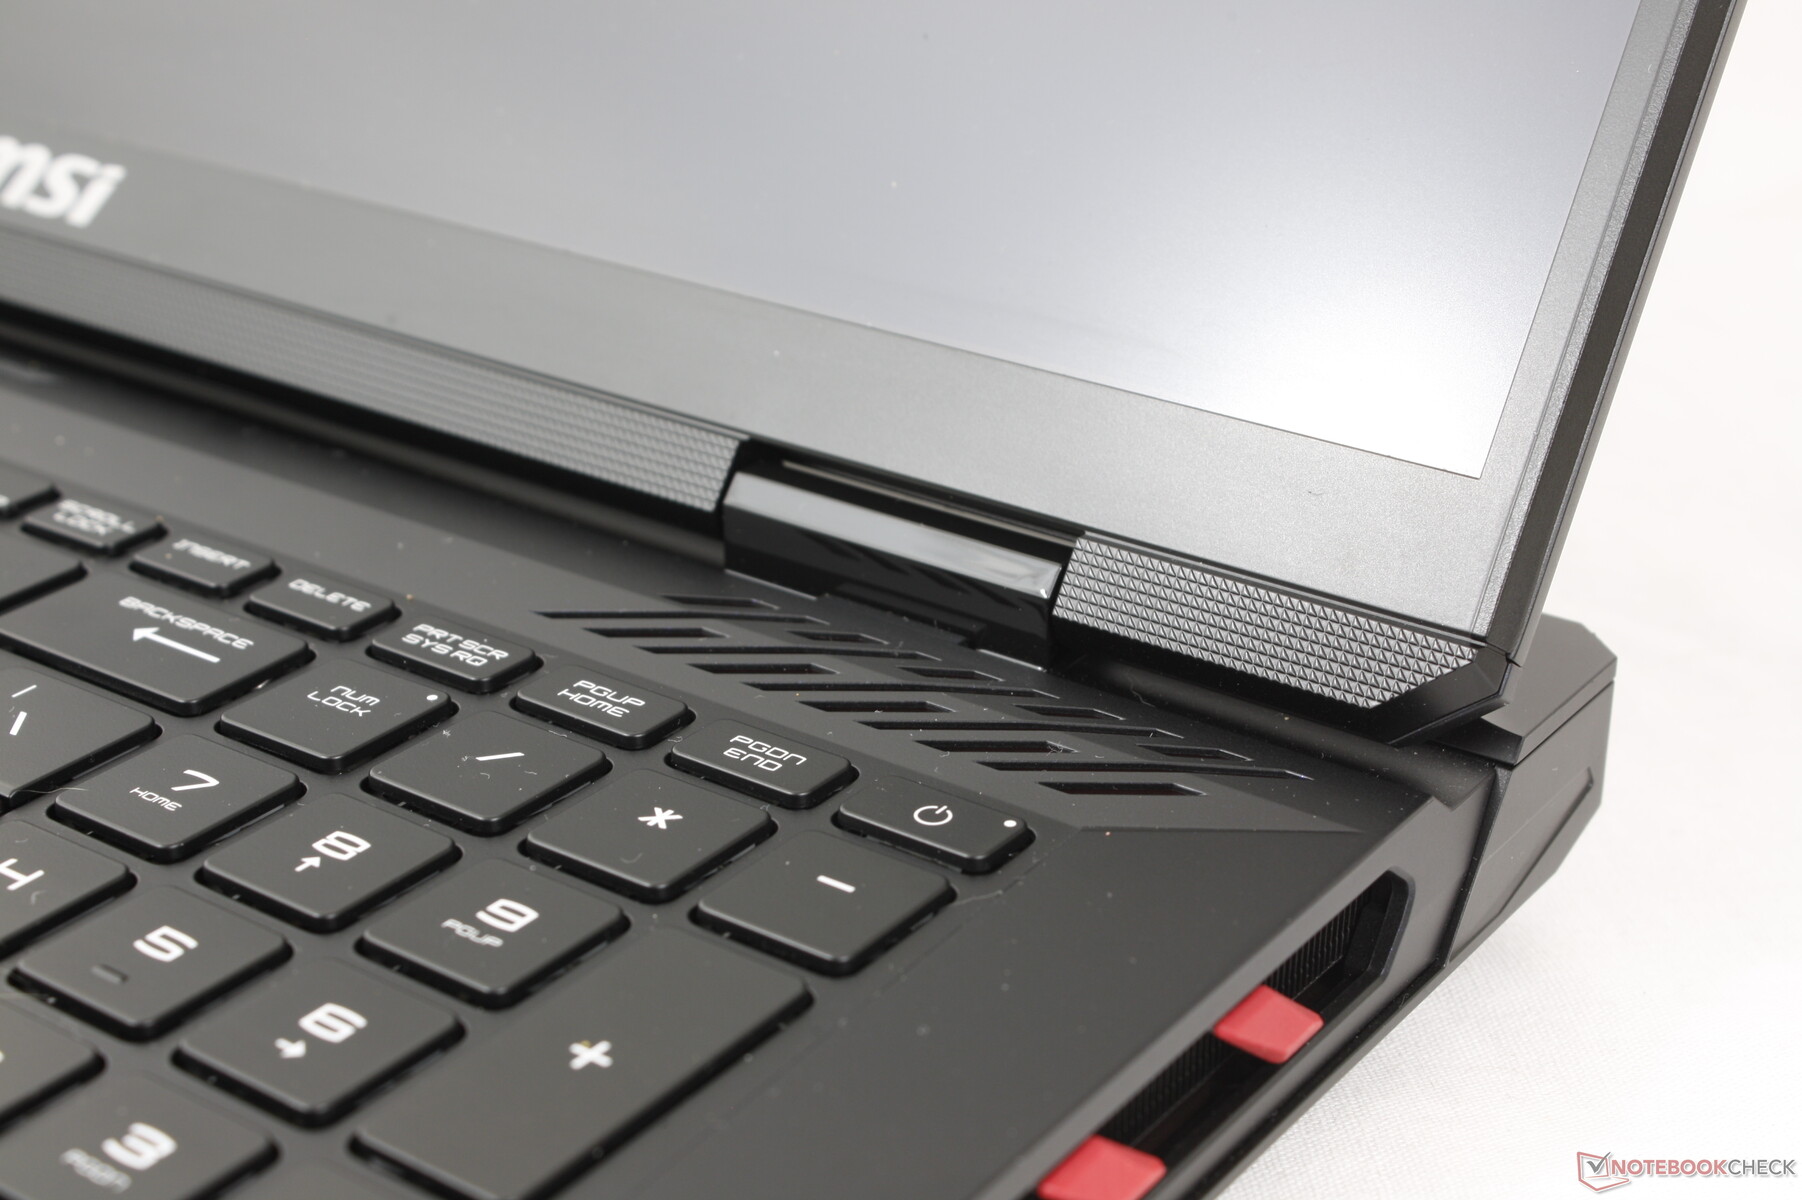
Podwozie jest pochodną modelu Titan 18 HX. Czerwone akcenty Titana są zamiast tego niebieskie w nowym Raiderze, a większość powierzchni jest kruczoczarna zamiast szarej lub srebrnej, co zapewnia ogólnie ciemniejszy wygląd. MSI dodało również pasek LED wzdłuż przedniej krawędzi systemu, podczas gdy brakowało go w Titan. Zmiany są w dużej mierze estetyczne, dzięki czemu Raider nadal wydaje się równie mocny jak jego droższe rodzeństwo, ponieważ podstawowe materiały i szkielet są takie same.
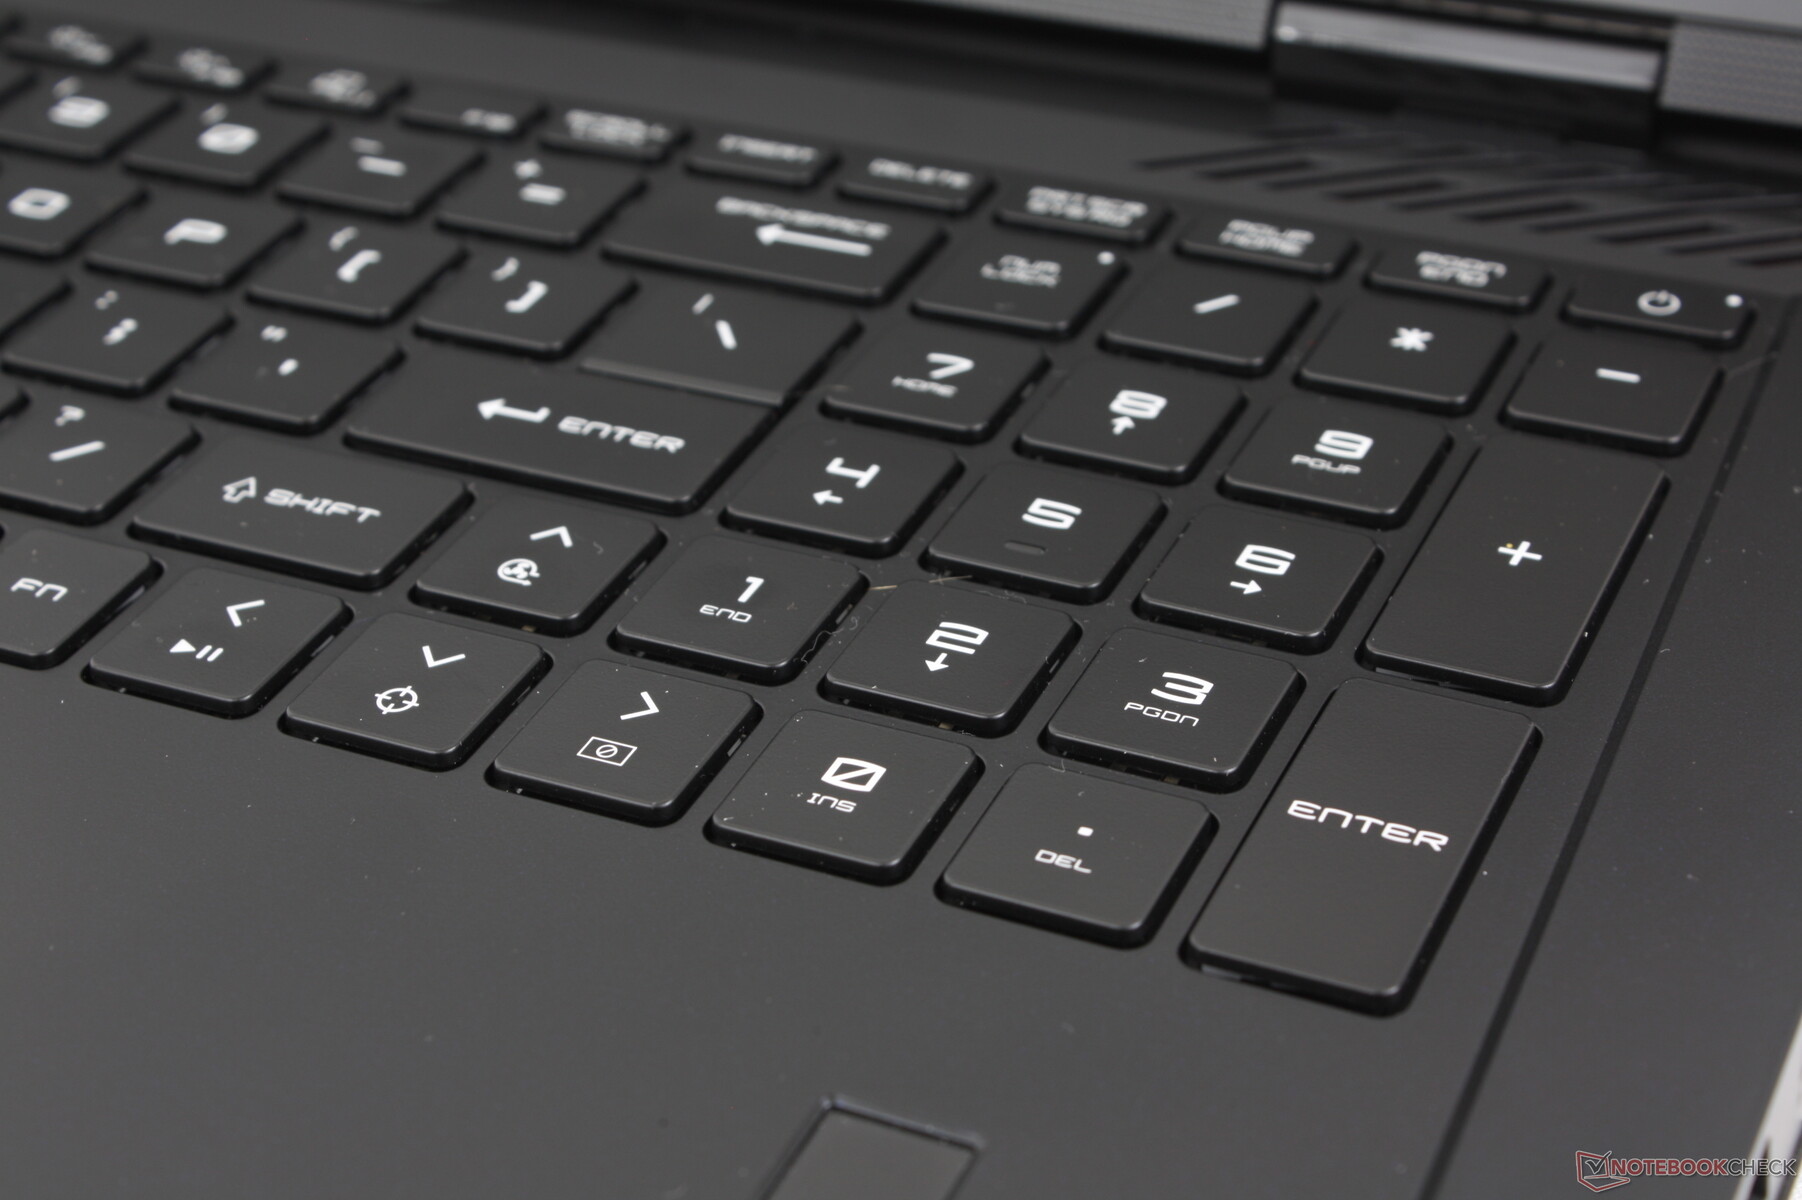
Być może najbardziej zauważalną wizualną różnicą między Raider 18 HX i Titan 18 HX jest przeprojektowana klawiatura. Podczas gdy Titan 18 HX ma bardziej płaski pokład z fantazyjnym szklanym panelem rozciągającym się na podpórki pod nadgarstki i clickpad, Raider przyjmuje bardziej tradycyjne podejście bez szkła i tylko z podstawowym clickpadem.
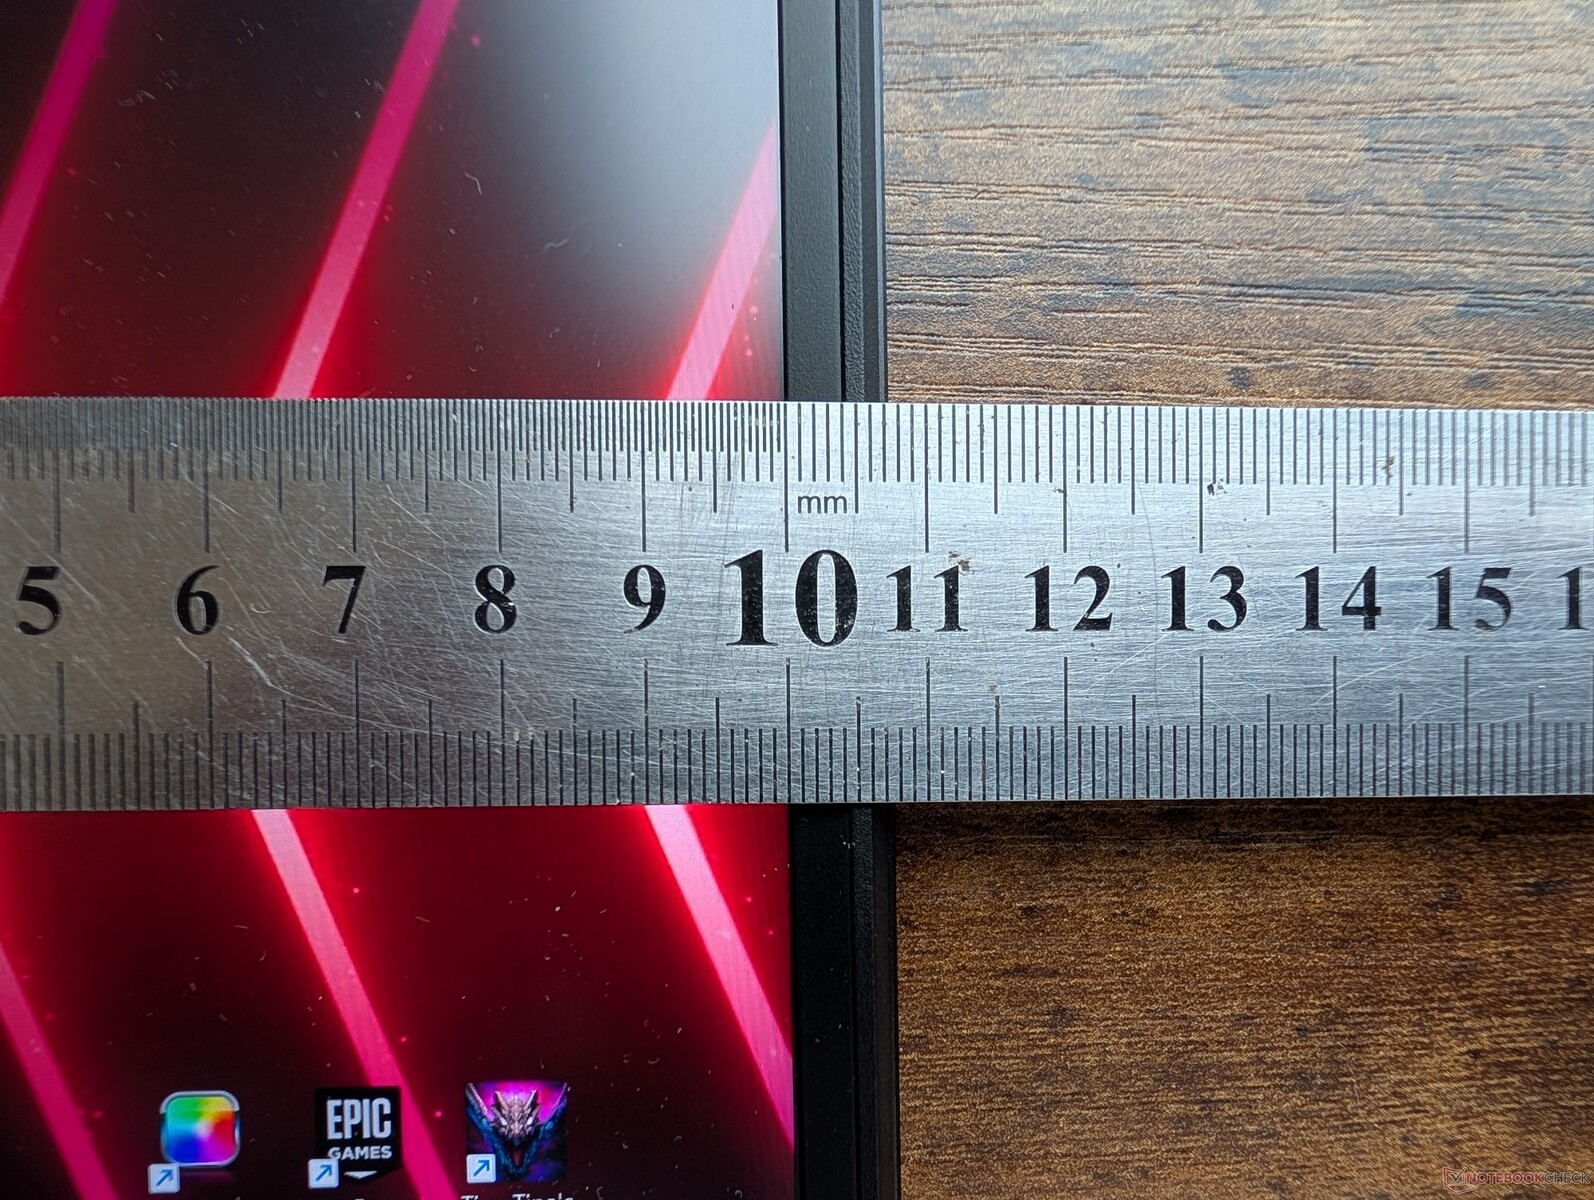
Wymiary i waga są zasadniczo identyczne z Titan 18 HX, pomimo wszystkich zewnętrznych różnic między nimi. Model ten znajduje się zatem w środku stawki, jeśli chodzi o przenośność, podobnie jak alternatywy, takie jak Alienware m18 R2 są cięższe i większe, podczas gdy ROG Strix G18 lub Blade 18 są znacznie lżejsze.
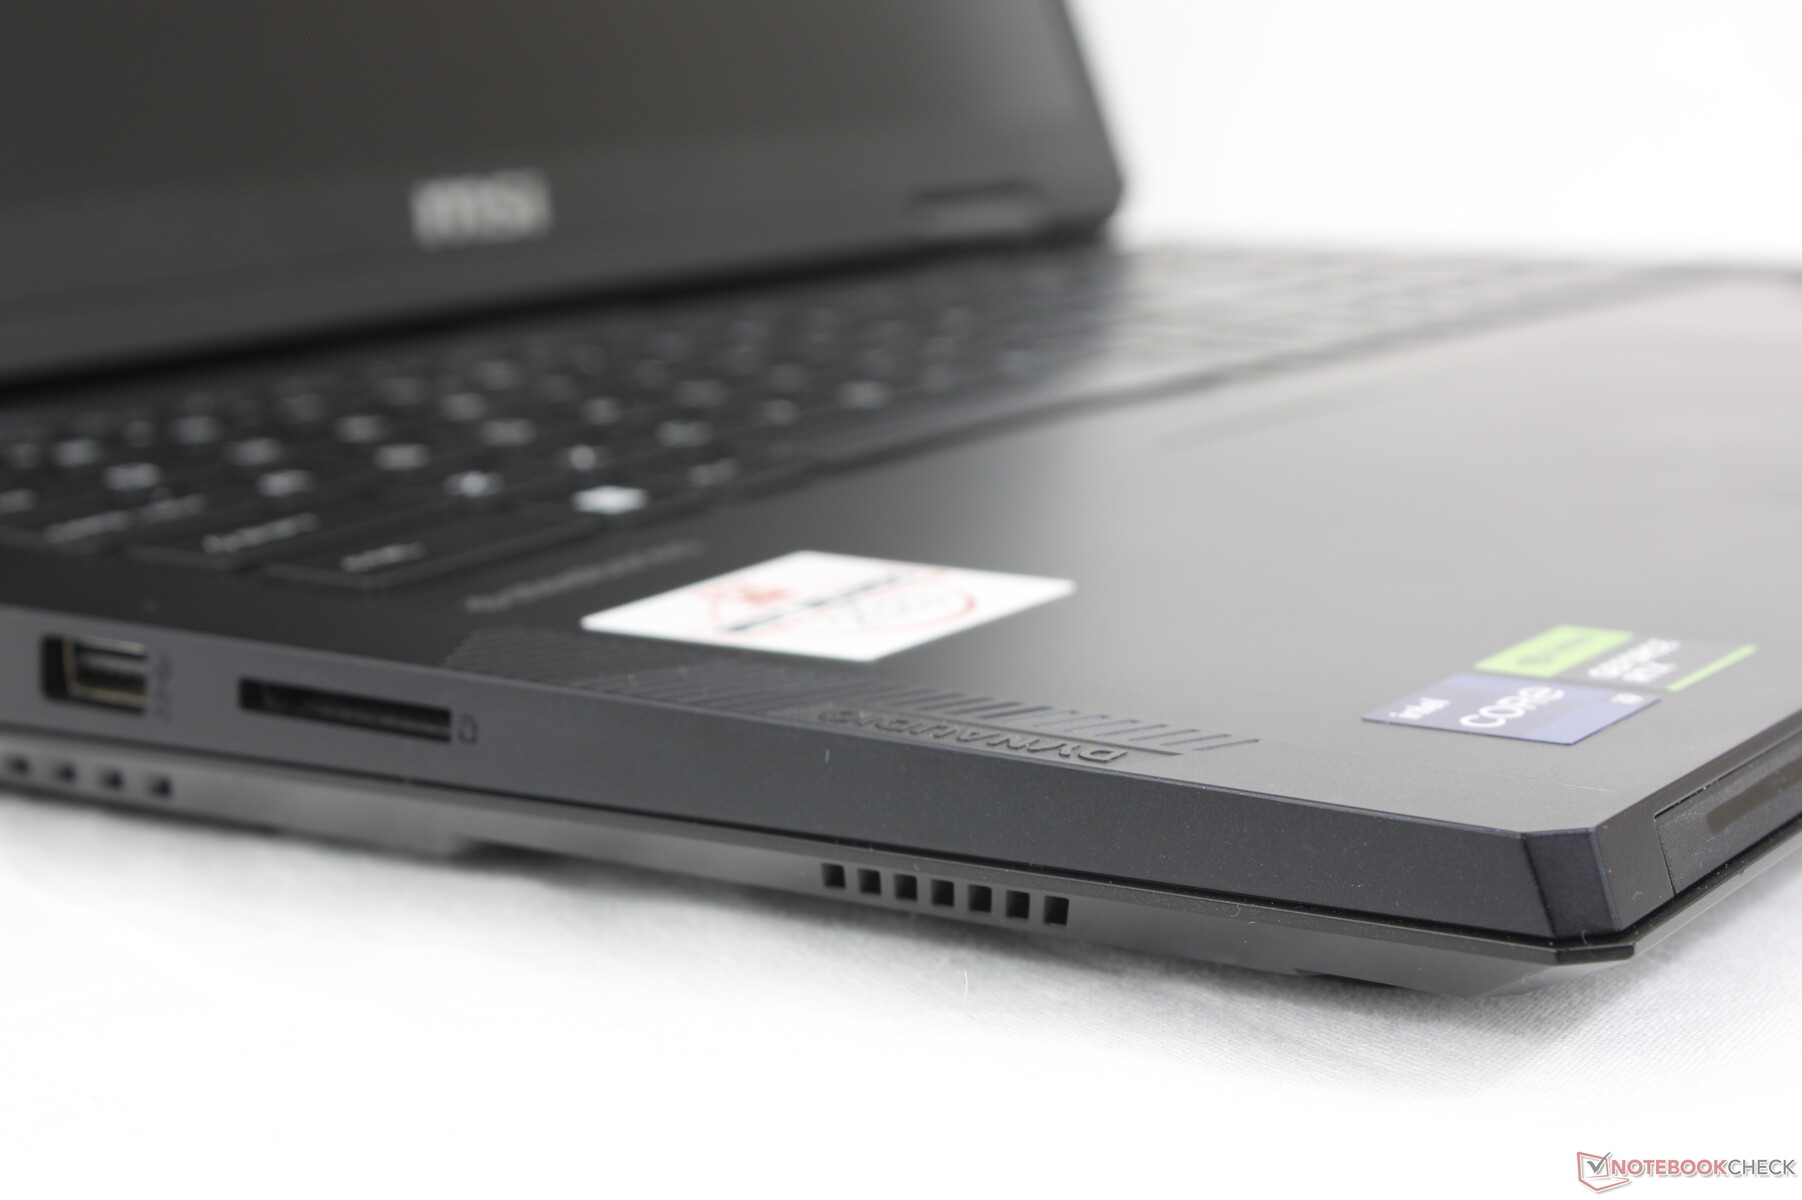
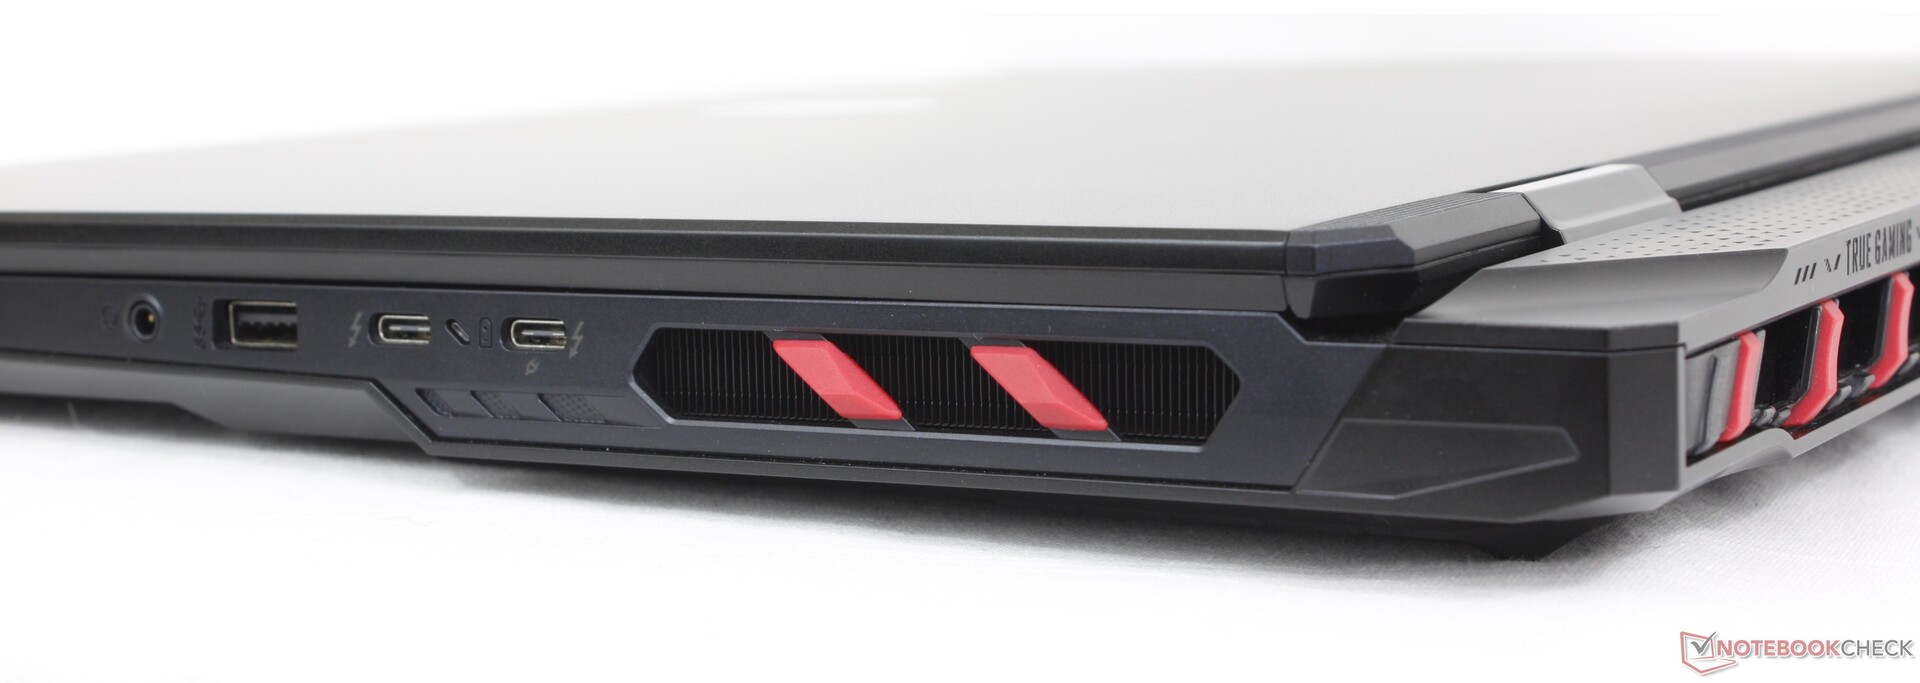
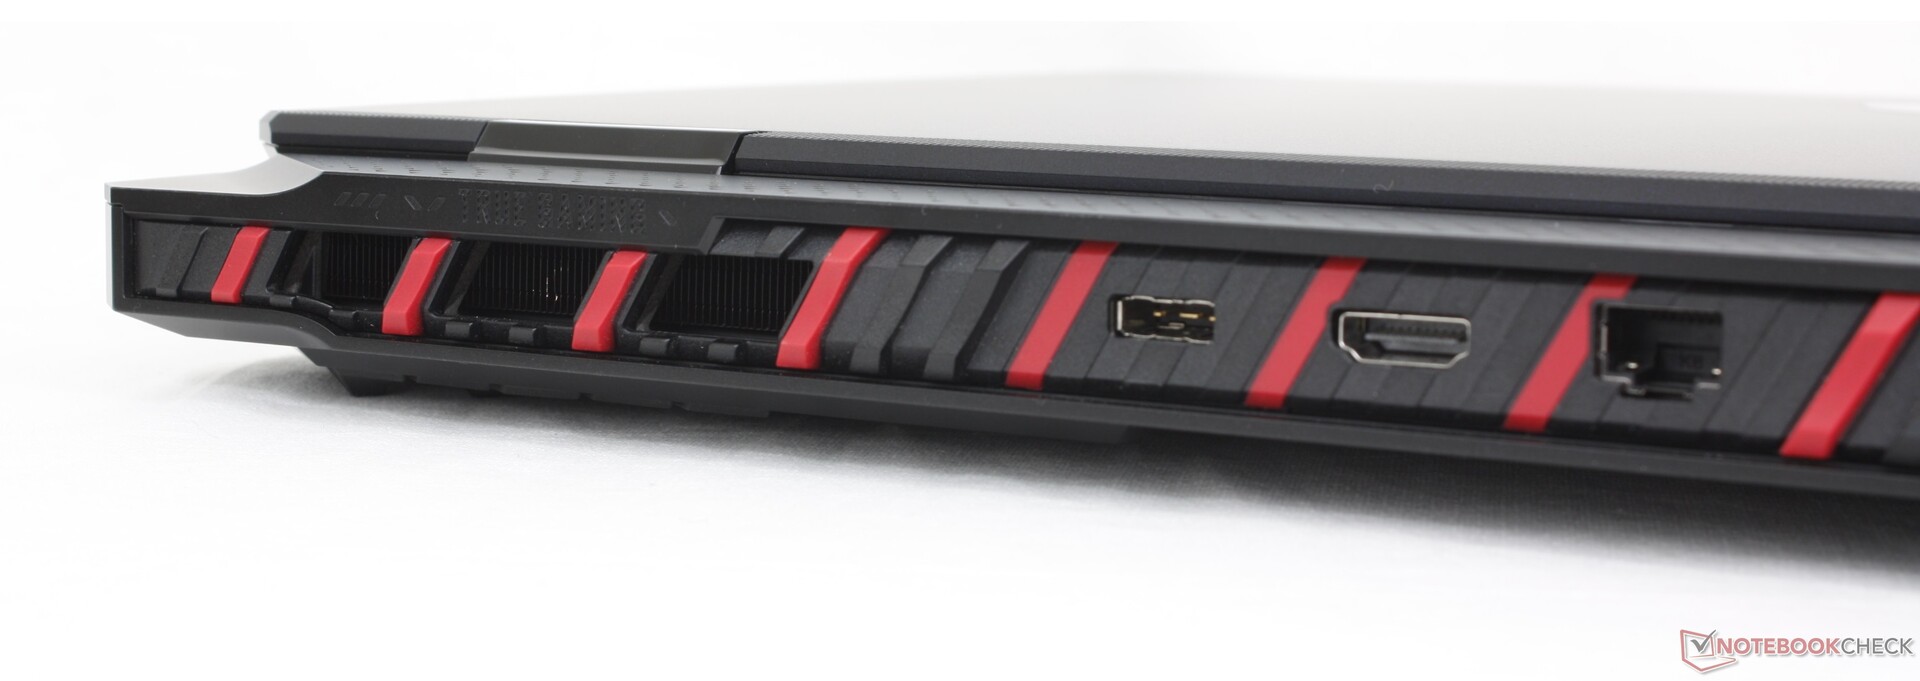
Łączność
Porty i rozmieszczenie są identyczne jak w Titan 18 HX, co jest dużą wskazówką na temat tego, czego można się spodziewać pod maską. Zintegrowane opcje są porównywalne z tym, co znajdą Państwo w modelu Blade 18 lub ROG Strix G18, aczkolwiek w bardzo różnych układach.
Proszę pamiętać, że tylko jeden z dwóch portów USB-C obsługuje Power Delivery. Oba są kompatybilne z DisplayPort.

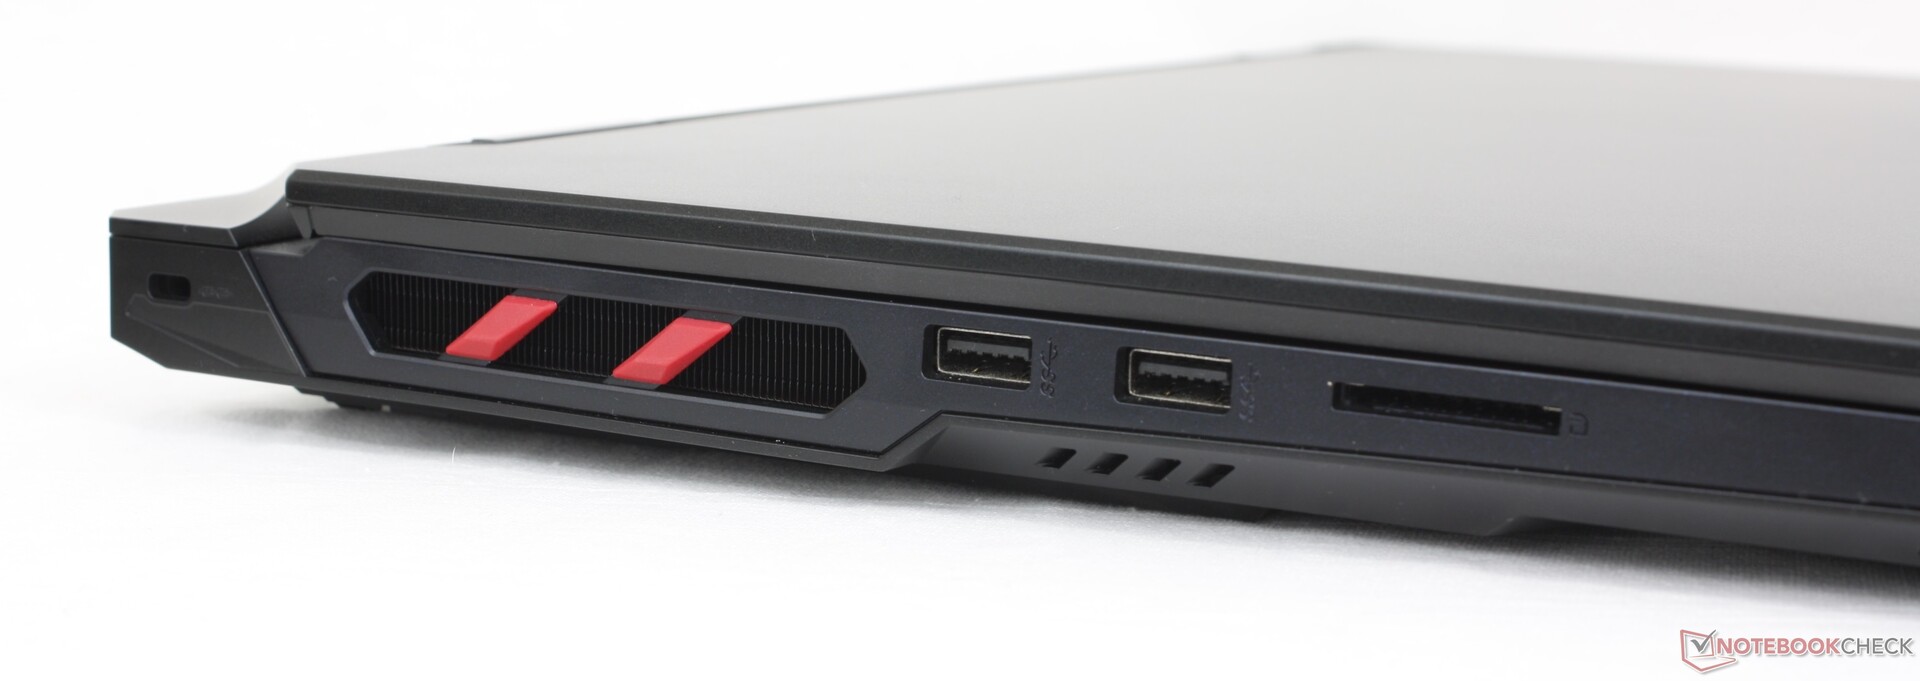
Czytnik kart SD
Przy około 90 MB/s, zintegrowany czytnik SD jest przyzwoity, ale poza tym powolny w stosunku do wysokiej ceny Raider 18 HX. Czytniki kart SD w Razer Blade 18 lub Alienware m18 R2są na przykład ponad dwukrotnie szybsze.
| SD Card Reader | |
| average JPG Copy Test (av. of 3 runs) | |
| Alienware m18 R2 (Toshiba Exceria Pro SDXC 64 GB UHS-II) | |
| Razer Blade 18 2024 RZ09-0509 (Toshiba Exceria Pro SDXC 64 GB UHS-II) | |
| Acer Predator Helios 18 PH18-72-98MW (AV PRO microSD 128 GB V60) | |
| MSI Raider 18 HX A14V (Toshiba Exceria Pro SDXC 64 GB UHS-II) | |
| MSI Titan 18 HX A14VIG (Toshiba Exceria Pro SDXC 64 GB UHS-II) | |
| maximum AS SSD Seq Read Test (1GB) | |
| Razer Blade 18 2024 RZ09-0509 (Toshiba Exceria Pro SDXC 64 GB UHS-II) | |
| Alienware m18 R2 (Toshiba Exceria Pro SDXC 64 GB UHS-II) | |
| MSI Titan 18 HX A14VIG (Toshiba Exceria Pro SDXC 64 GB UHS-II) | |
| MSI Raider 18 HX A14V (Toshiba Exceria Pro SDXC 64 GB UHS-II) | |
| Acer Predator Helios 18 PH18-72-98MW (AV PRO microSD 128 GB V60) | |
Komunikacja
Killer BE1750x jest standardowo wyposażony w łączność Wi-Fi 7 i Bluetooth 5.4. Prędkości transferu są stabilne i niezawodne po sparowaniu z naszym routerem testowym Wi-Fi 6E.
Kamera internetowa
Kamera internetowa 2 MP z podczerwienią i fizyczną migawką jest standardem, podobnie jak w Titan 18 HX. Co ciekawe, kamera wykazuje również podobne problemy z jasnością.


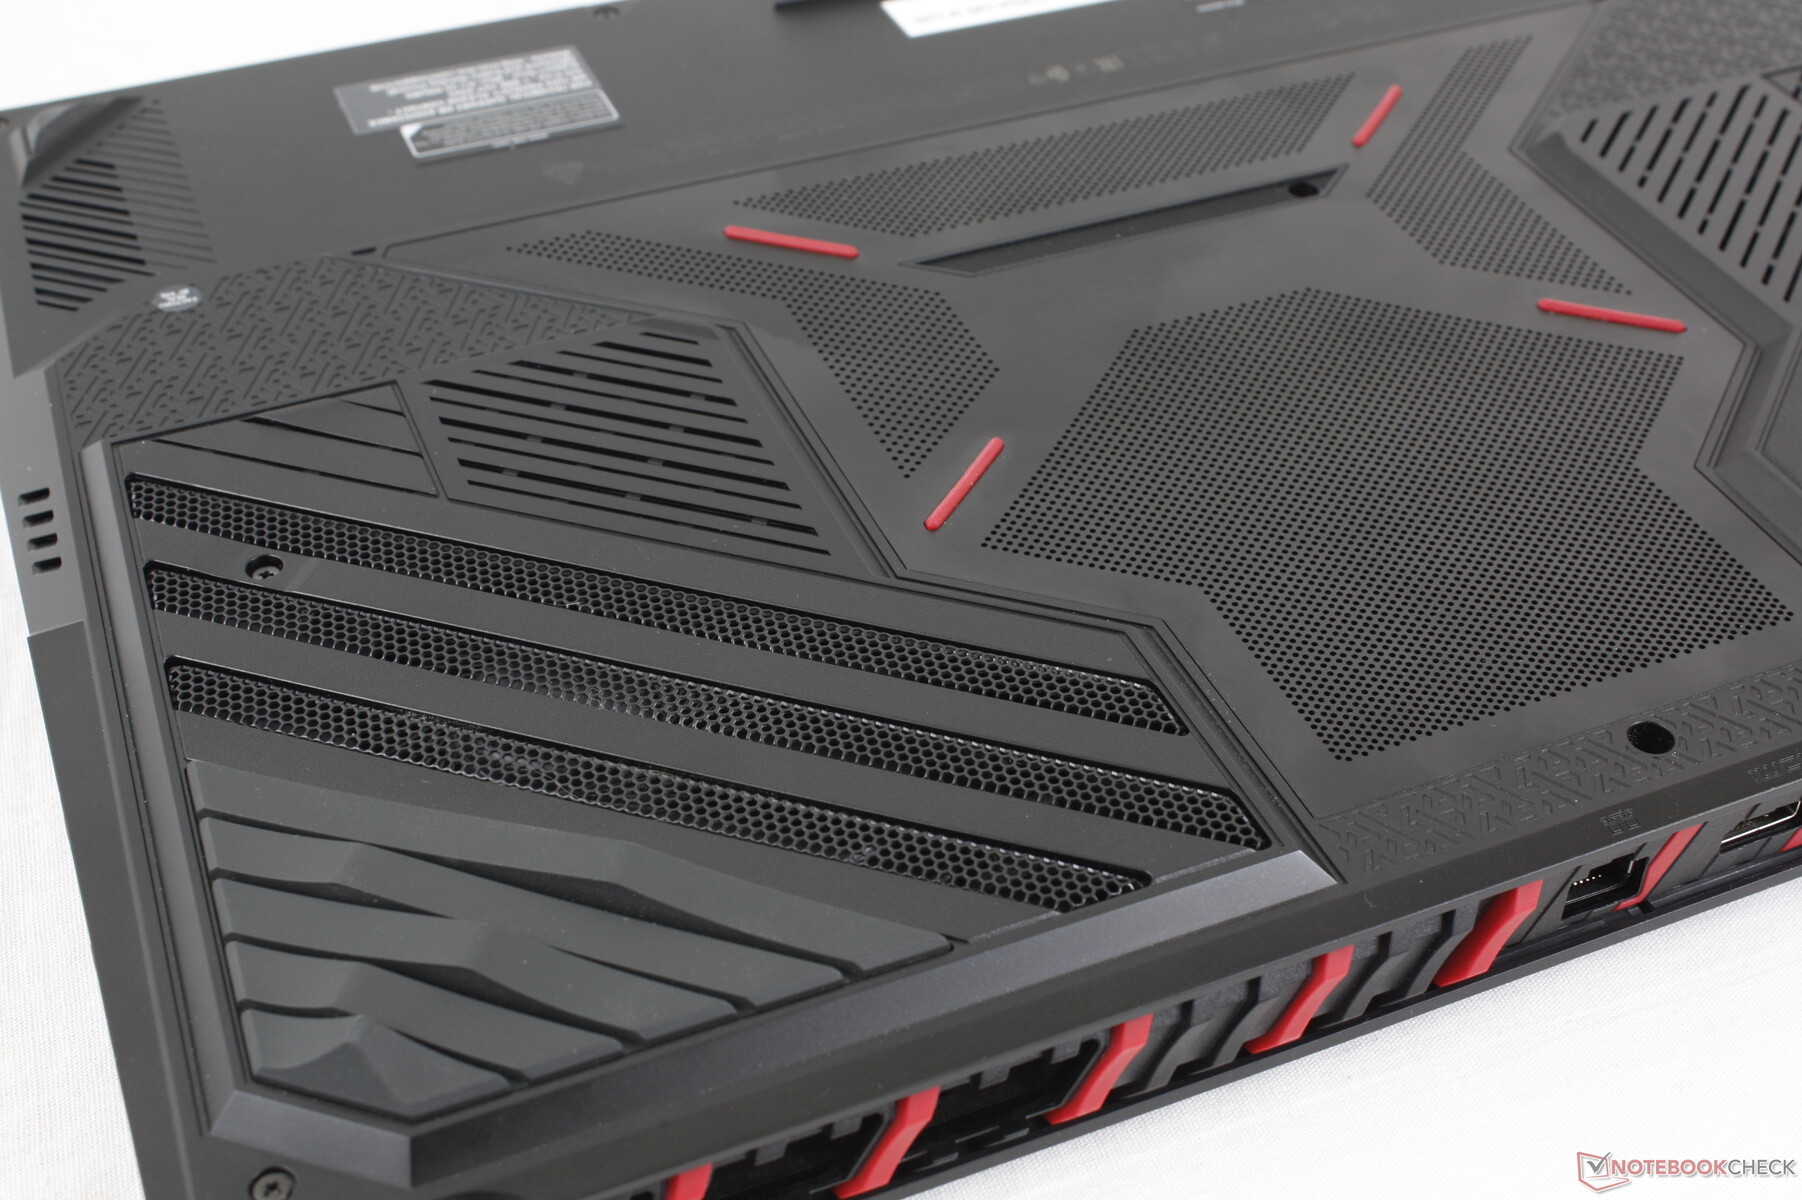
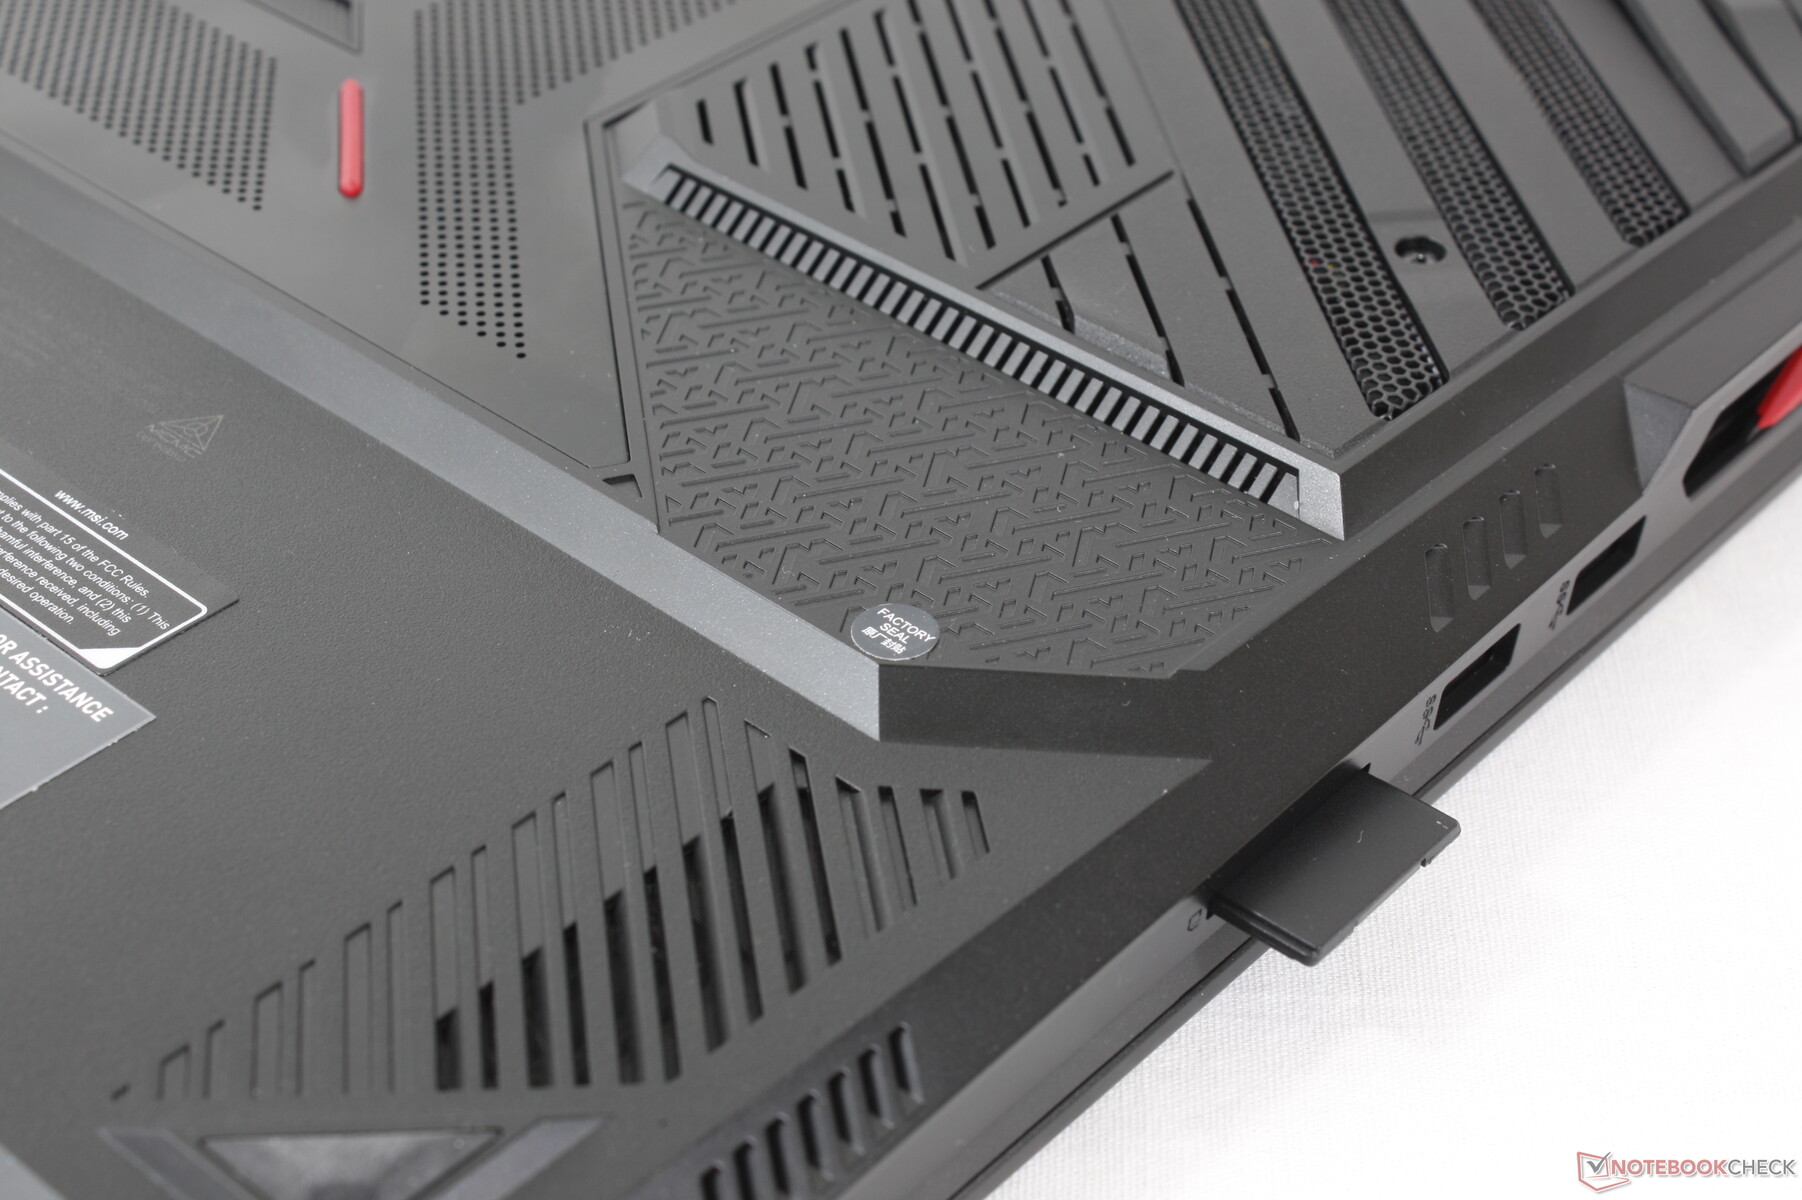
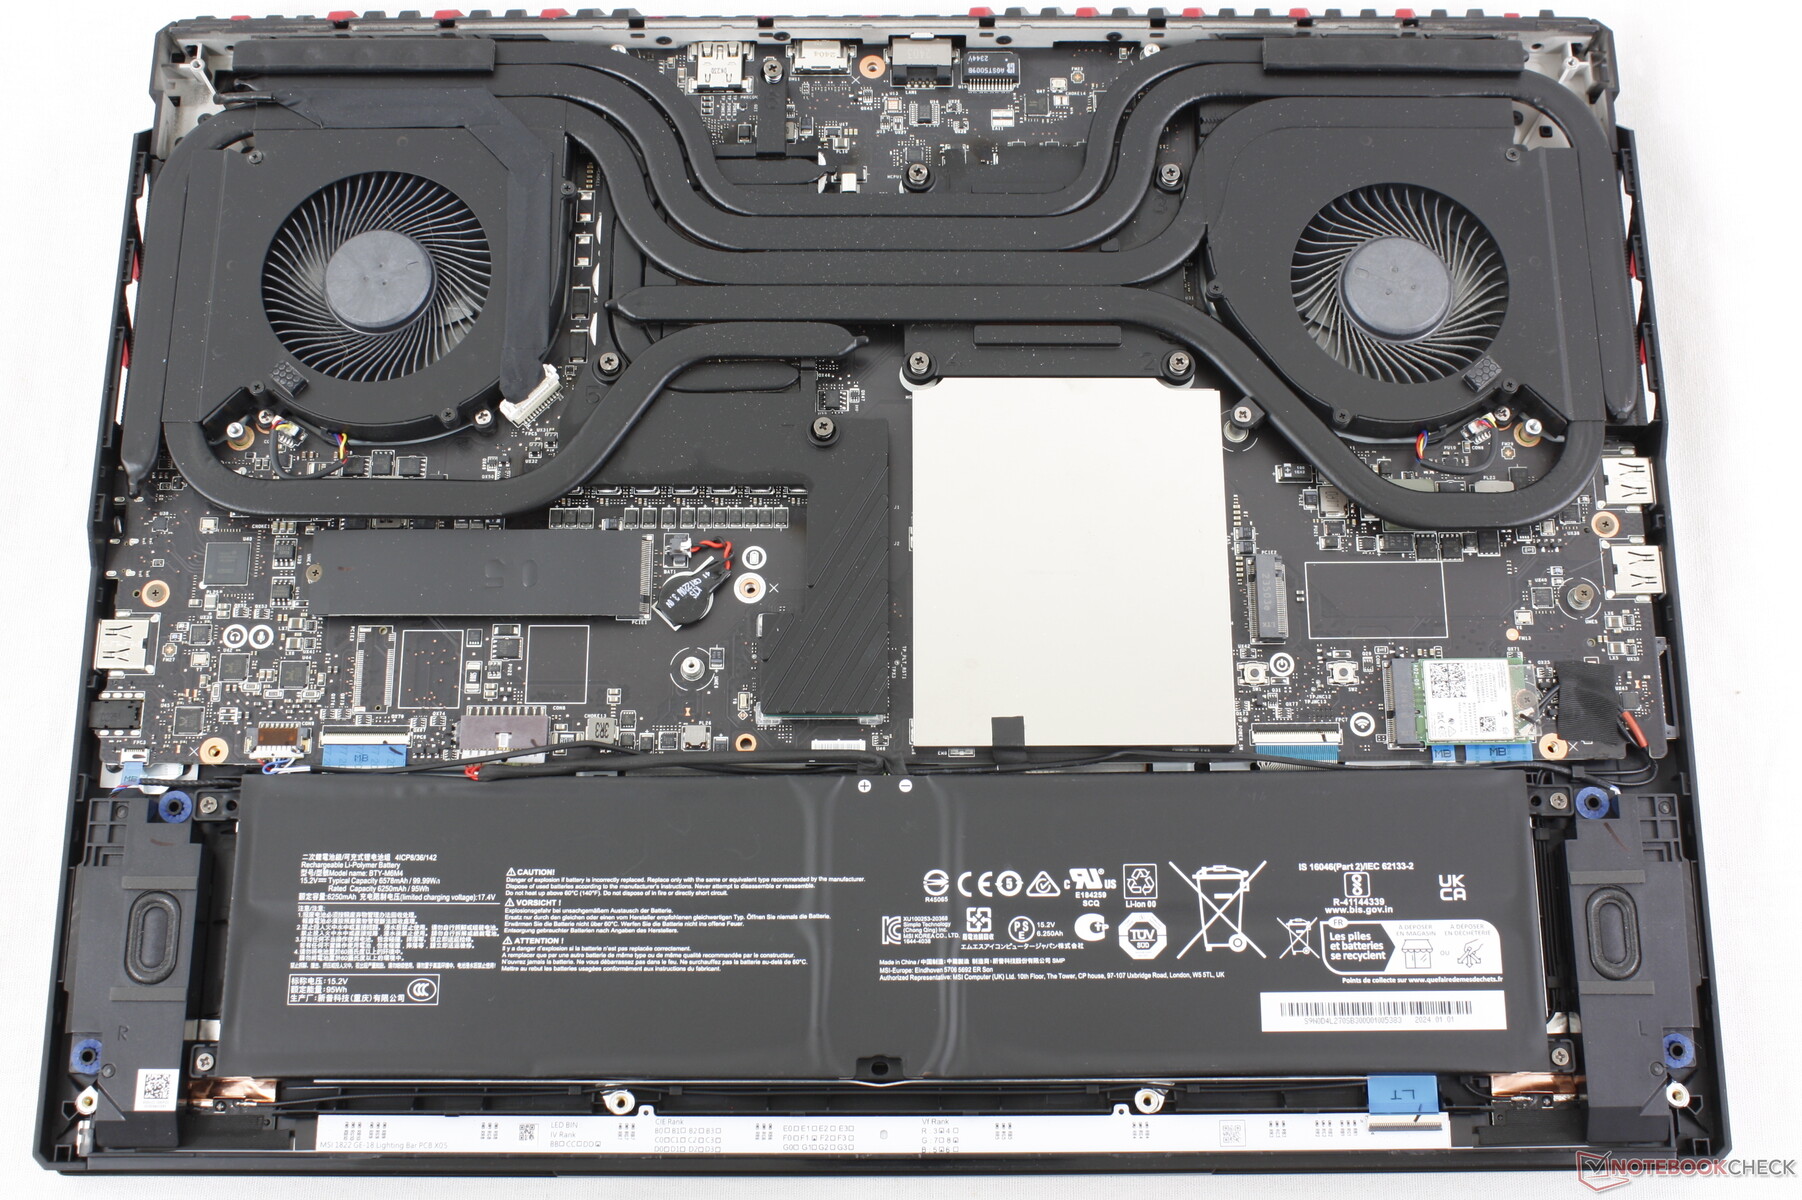
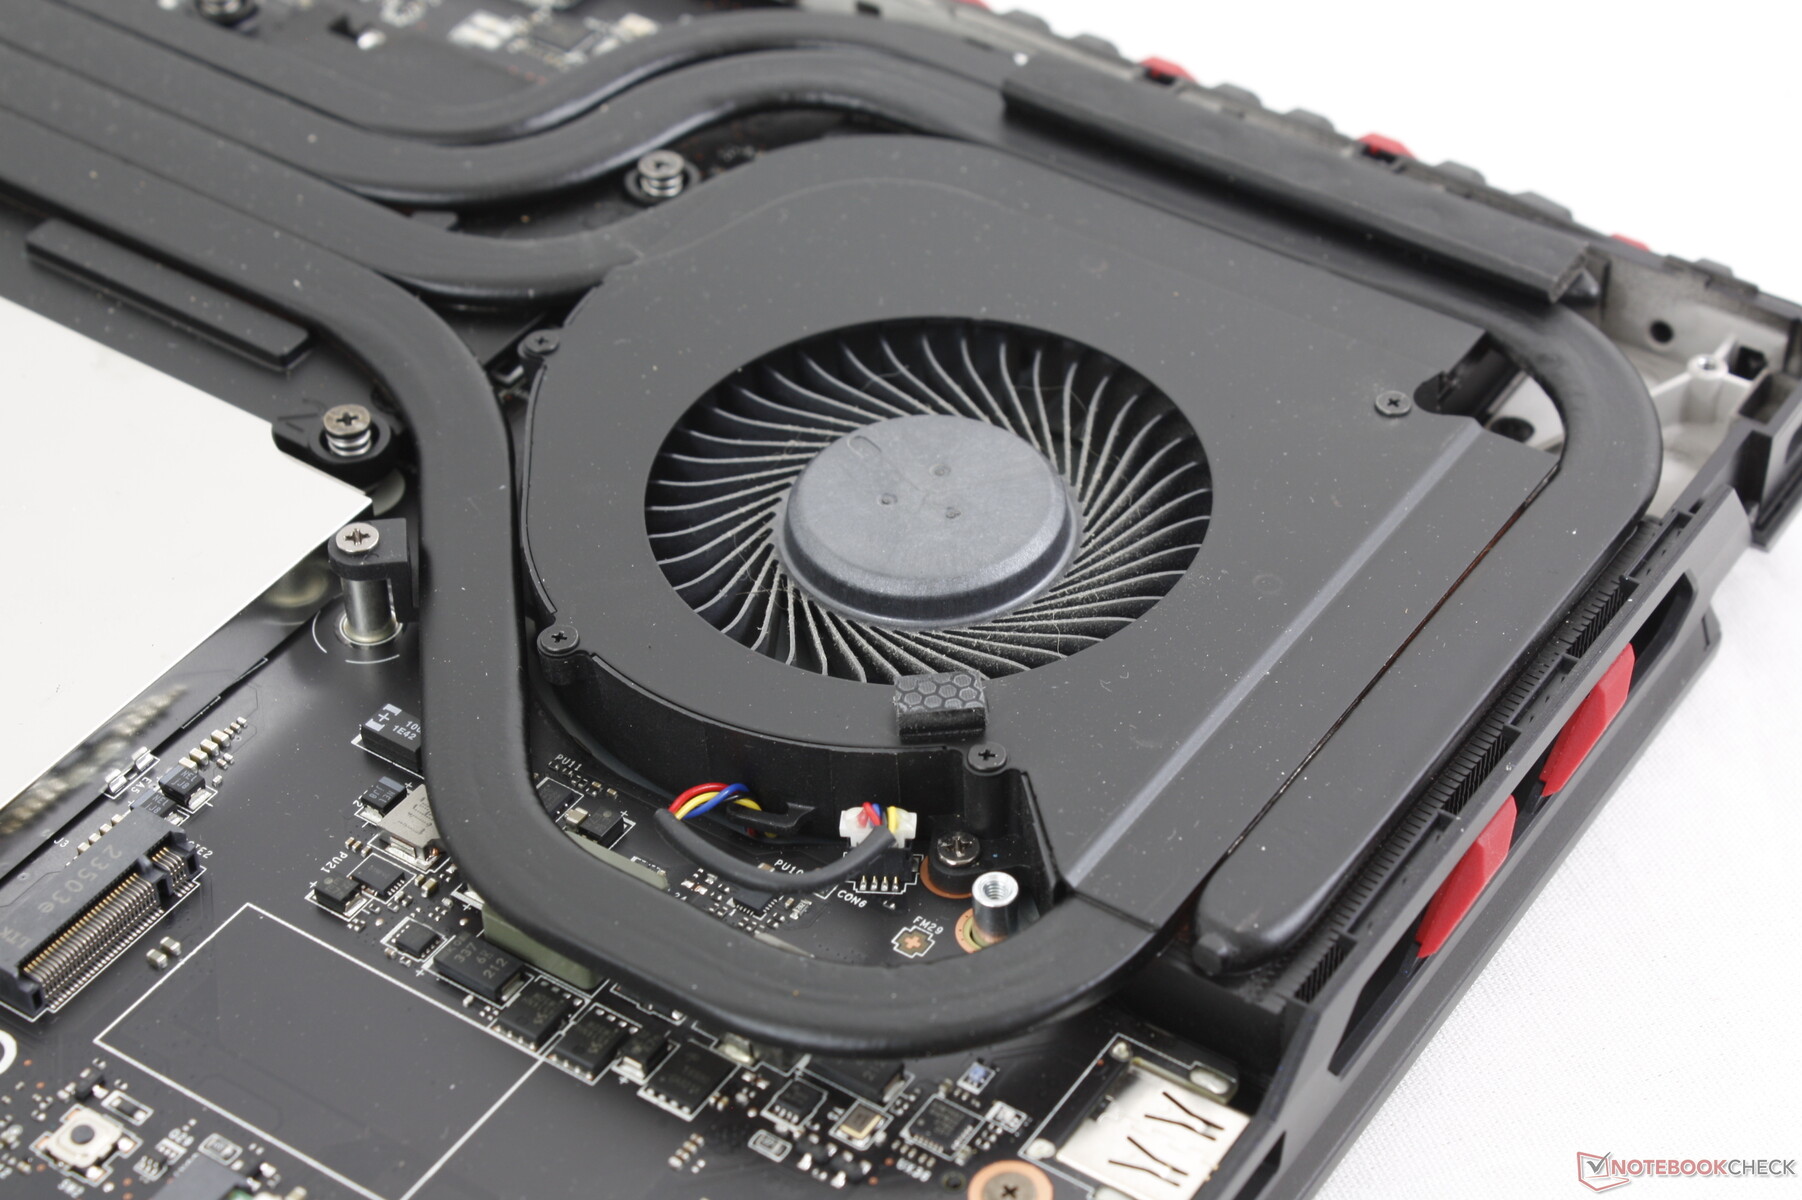
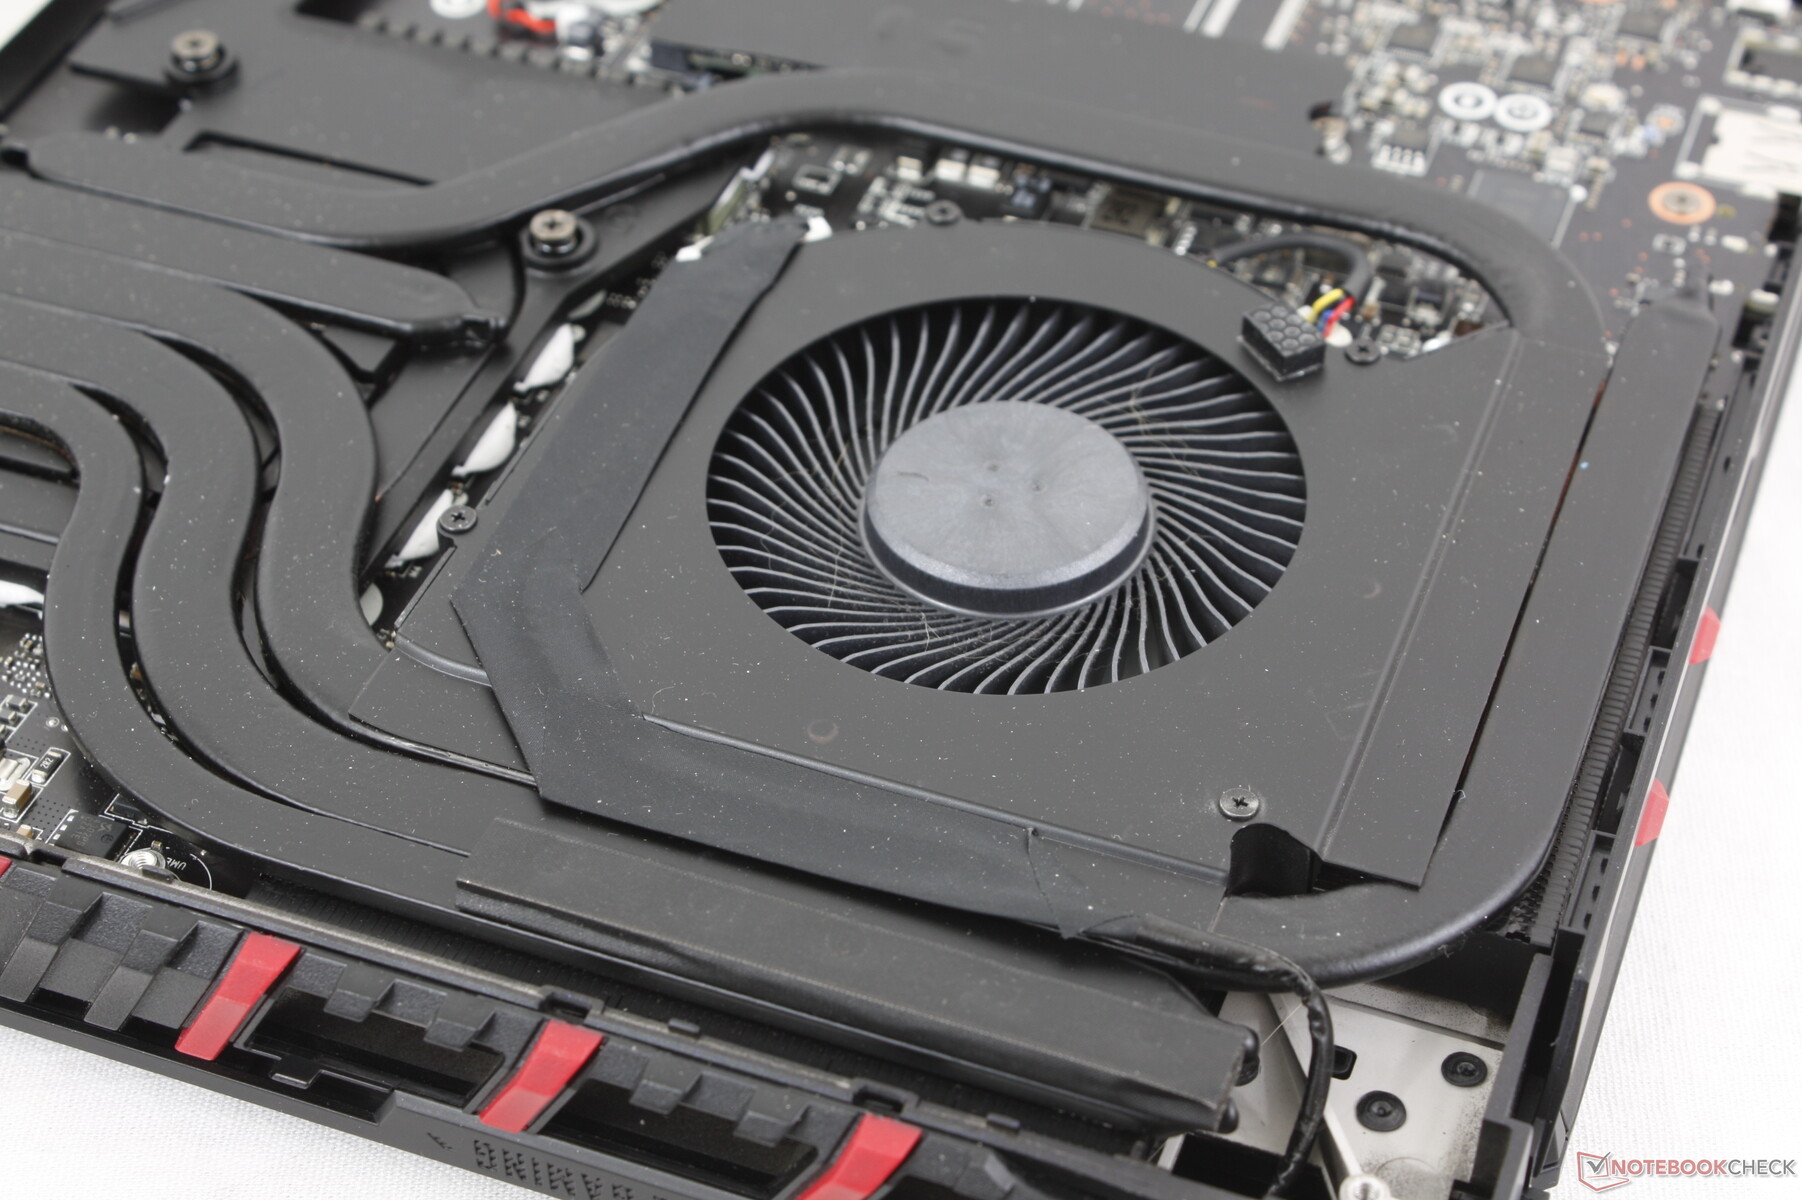
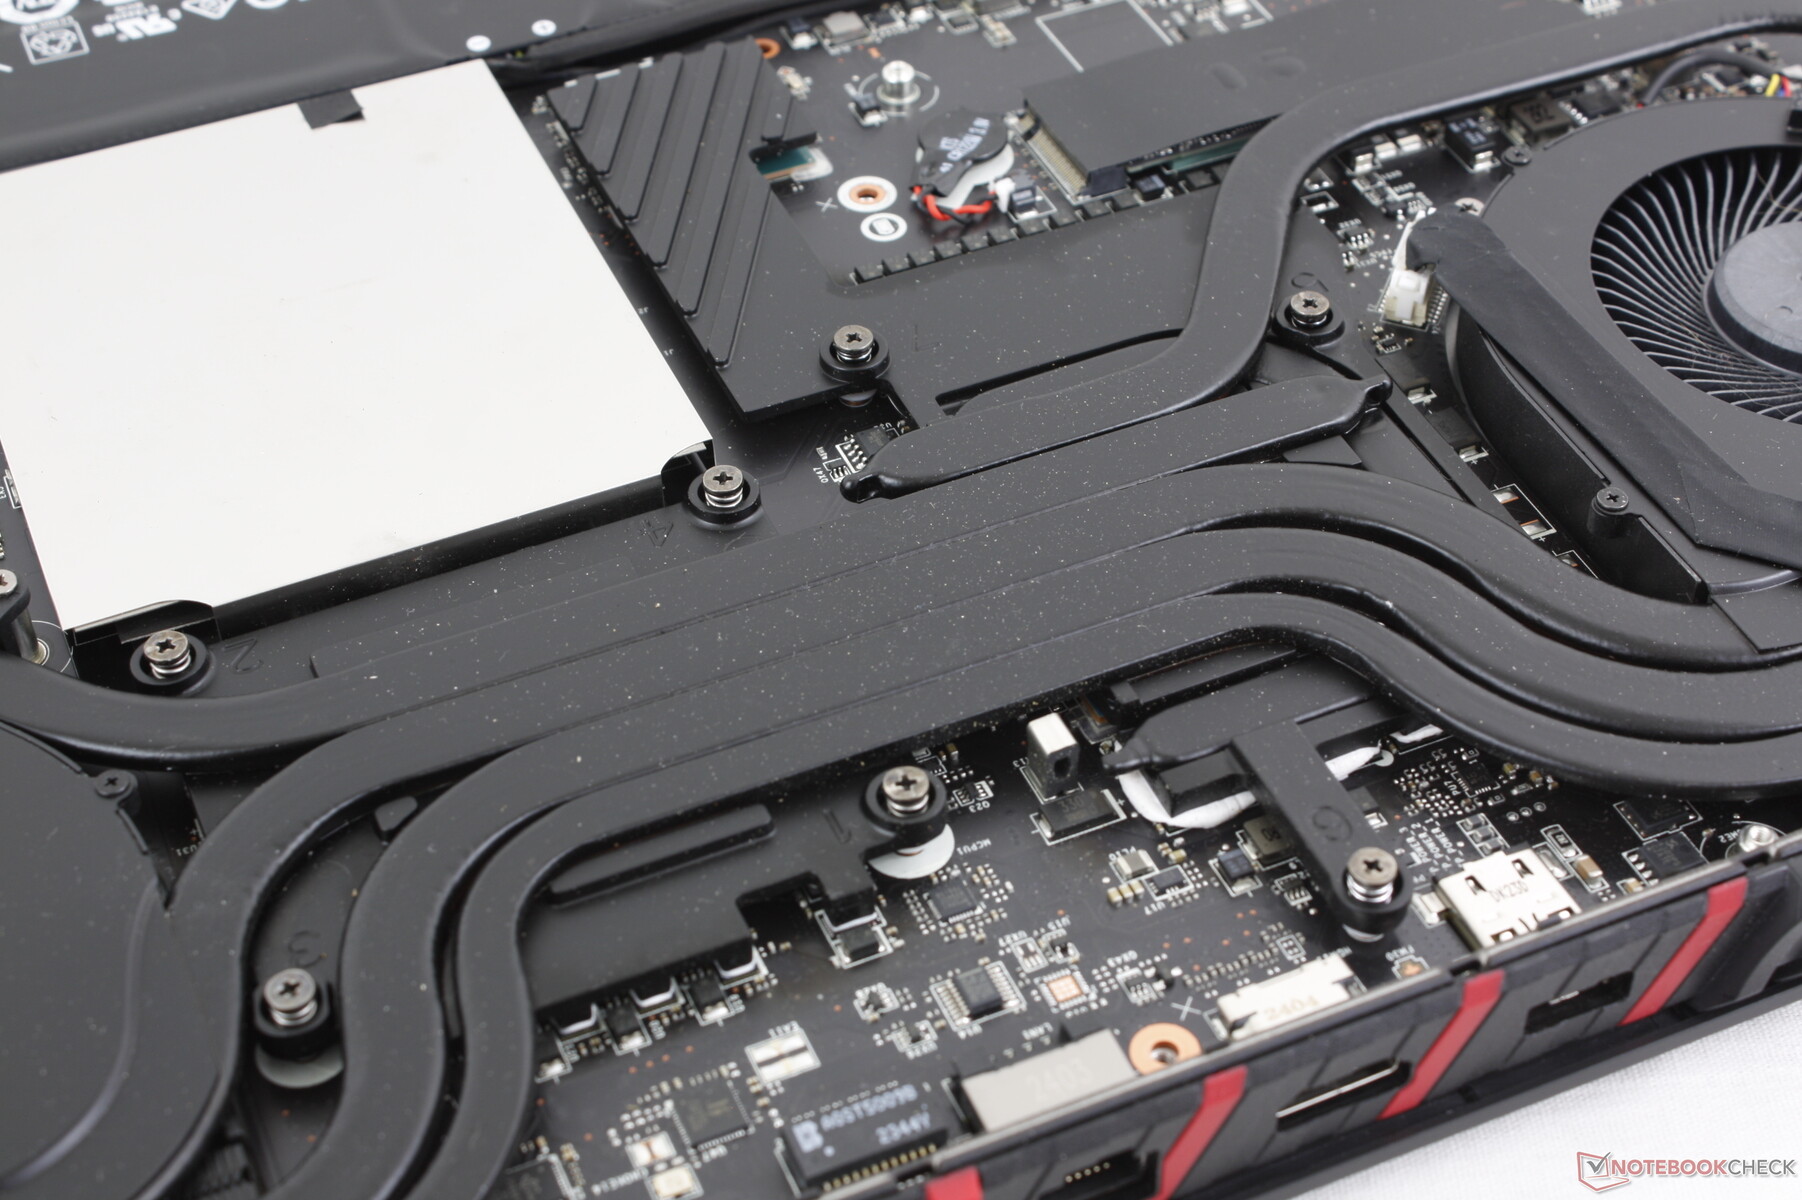
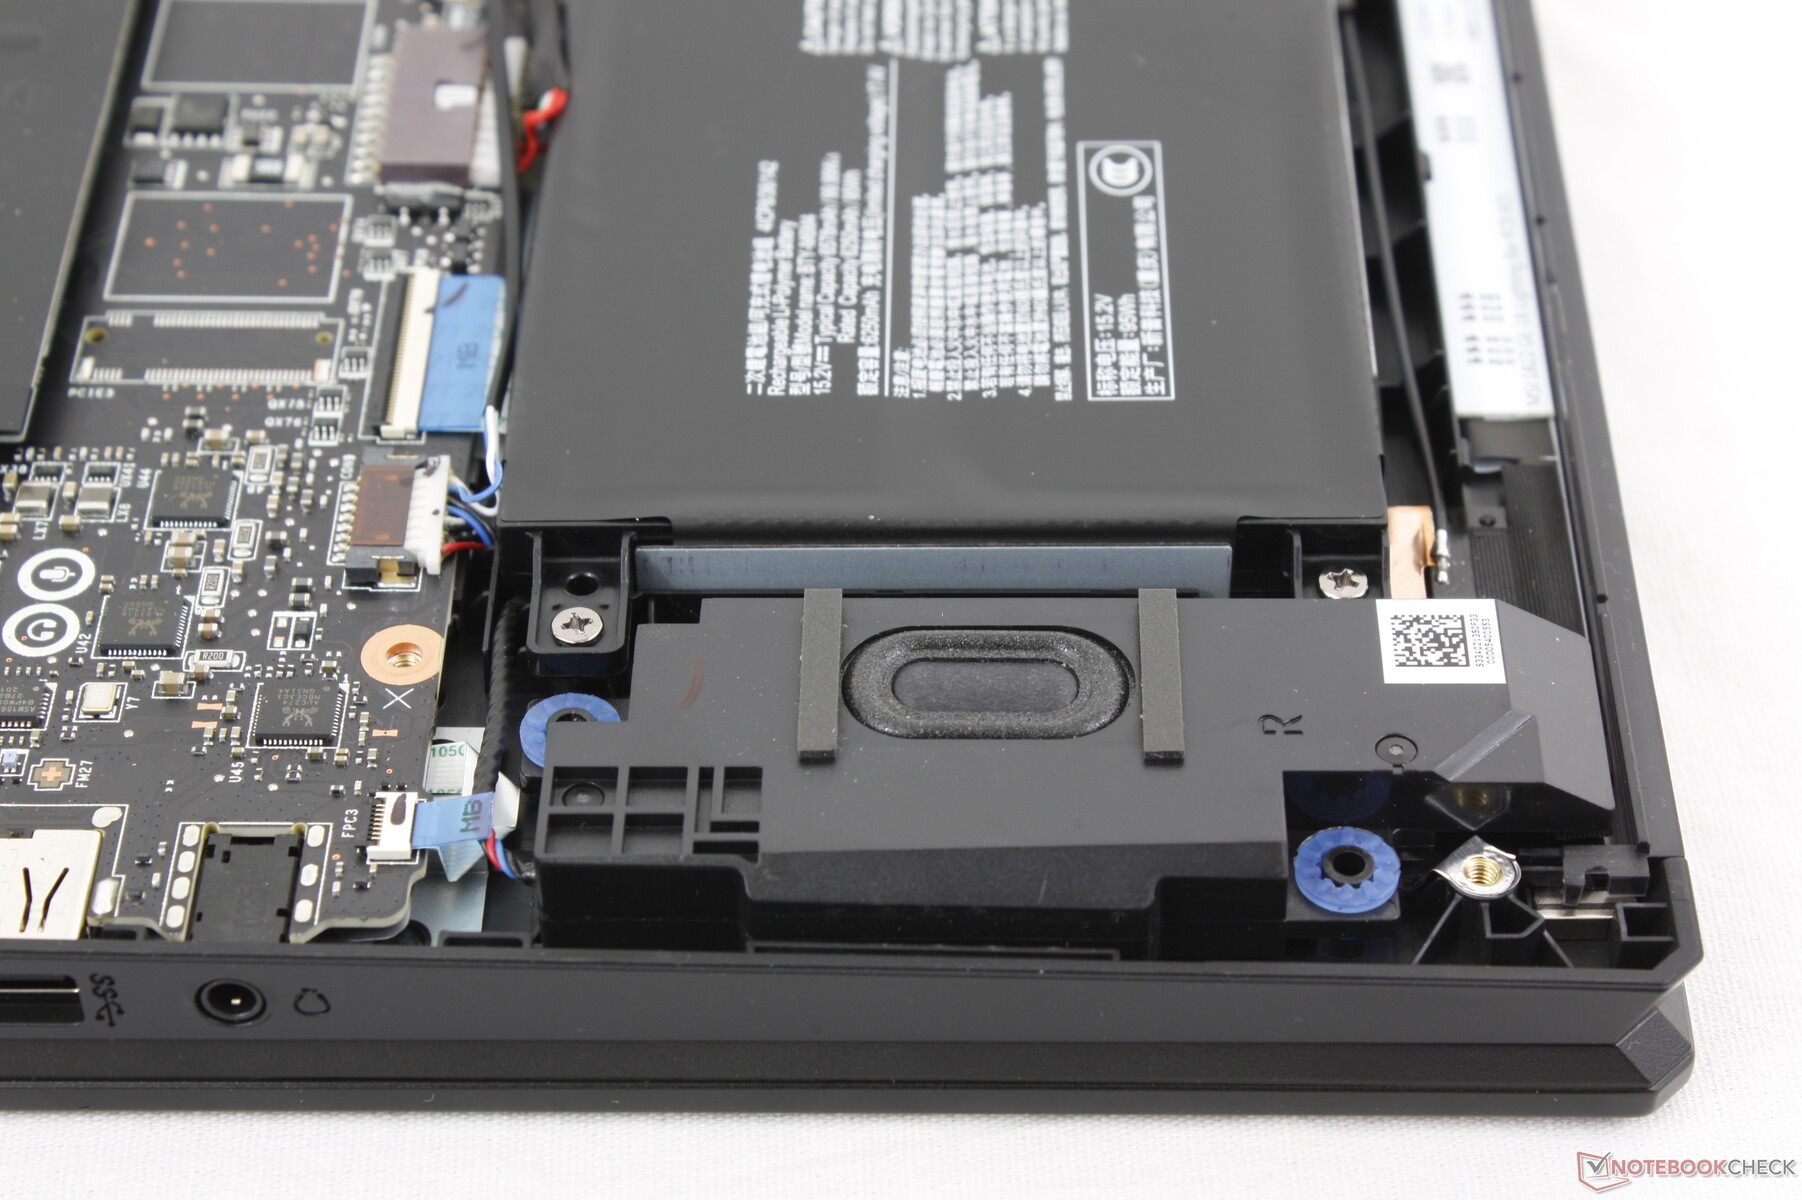
Konserwacja
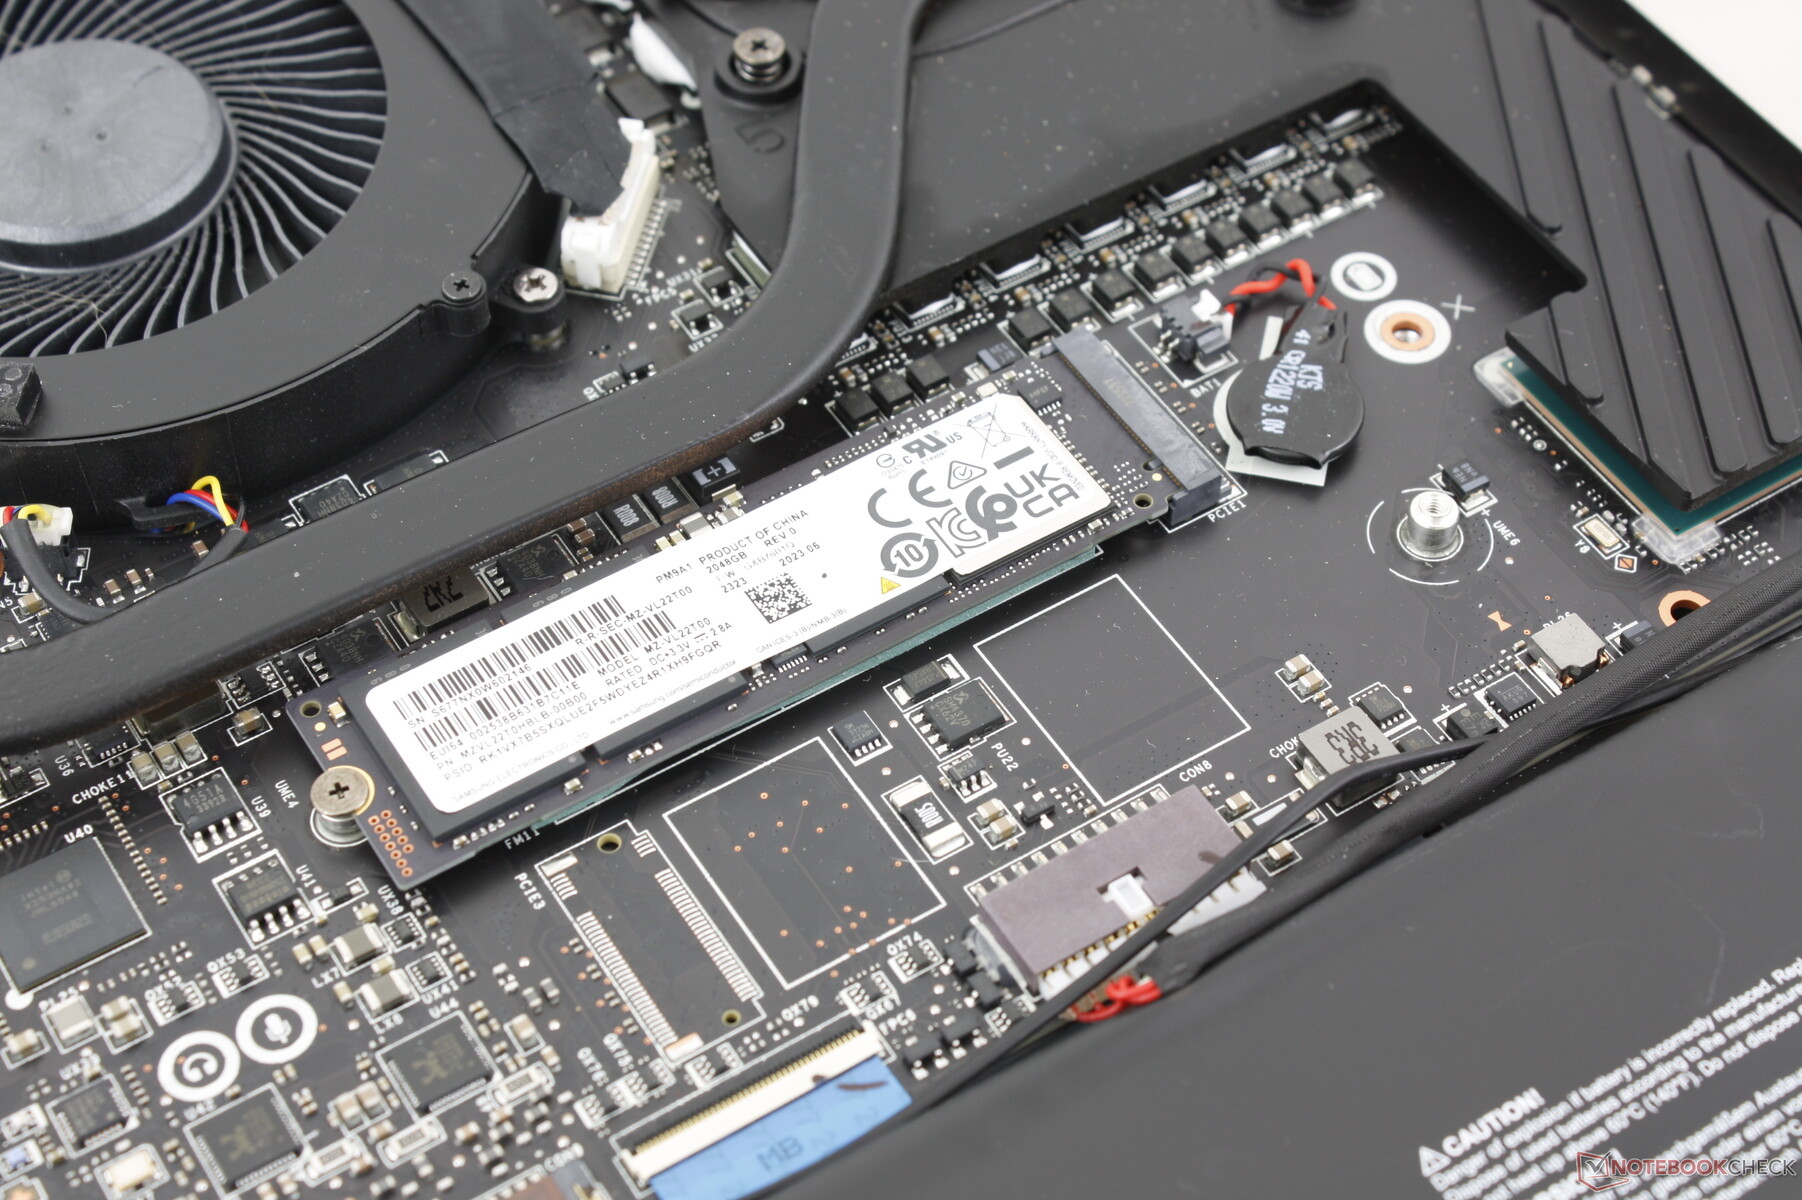
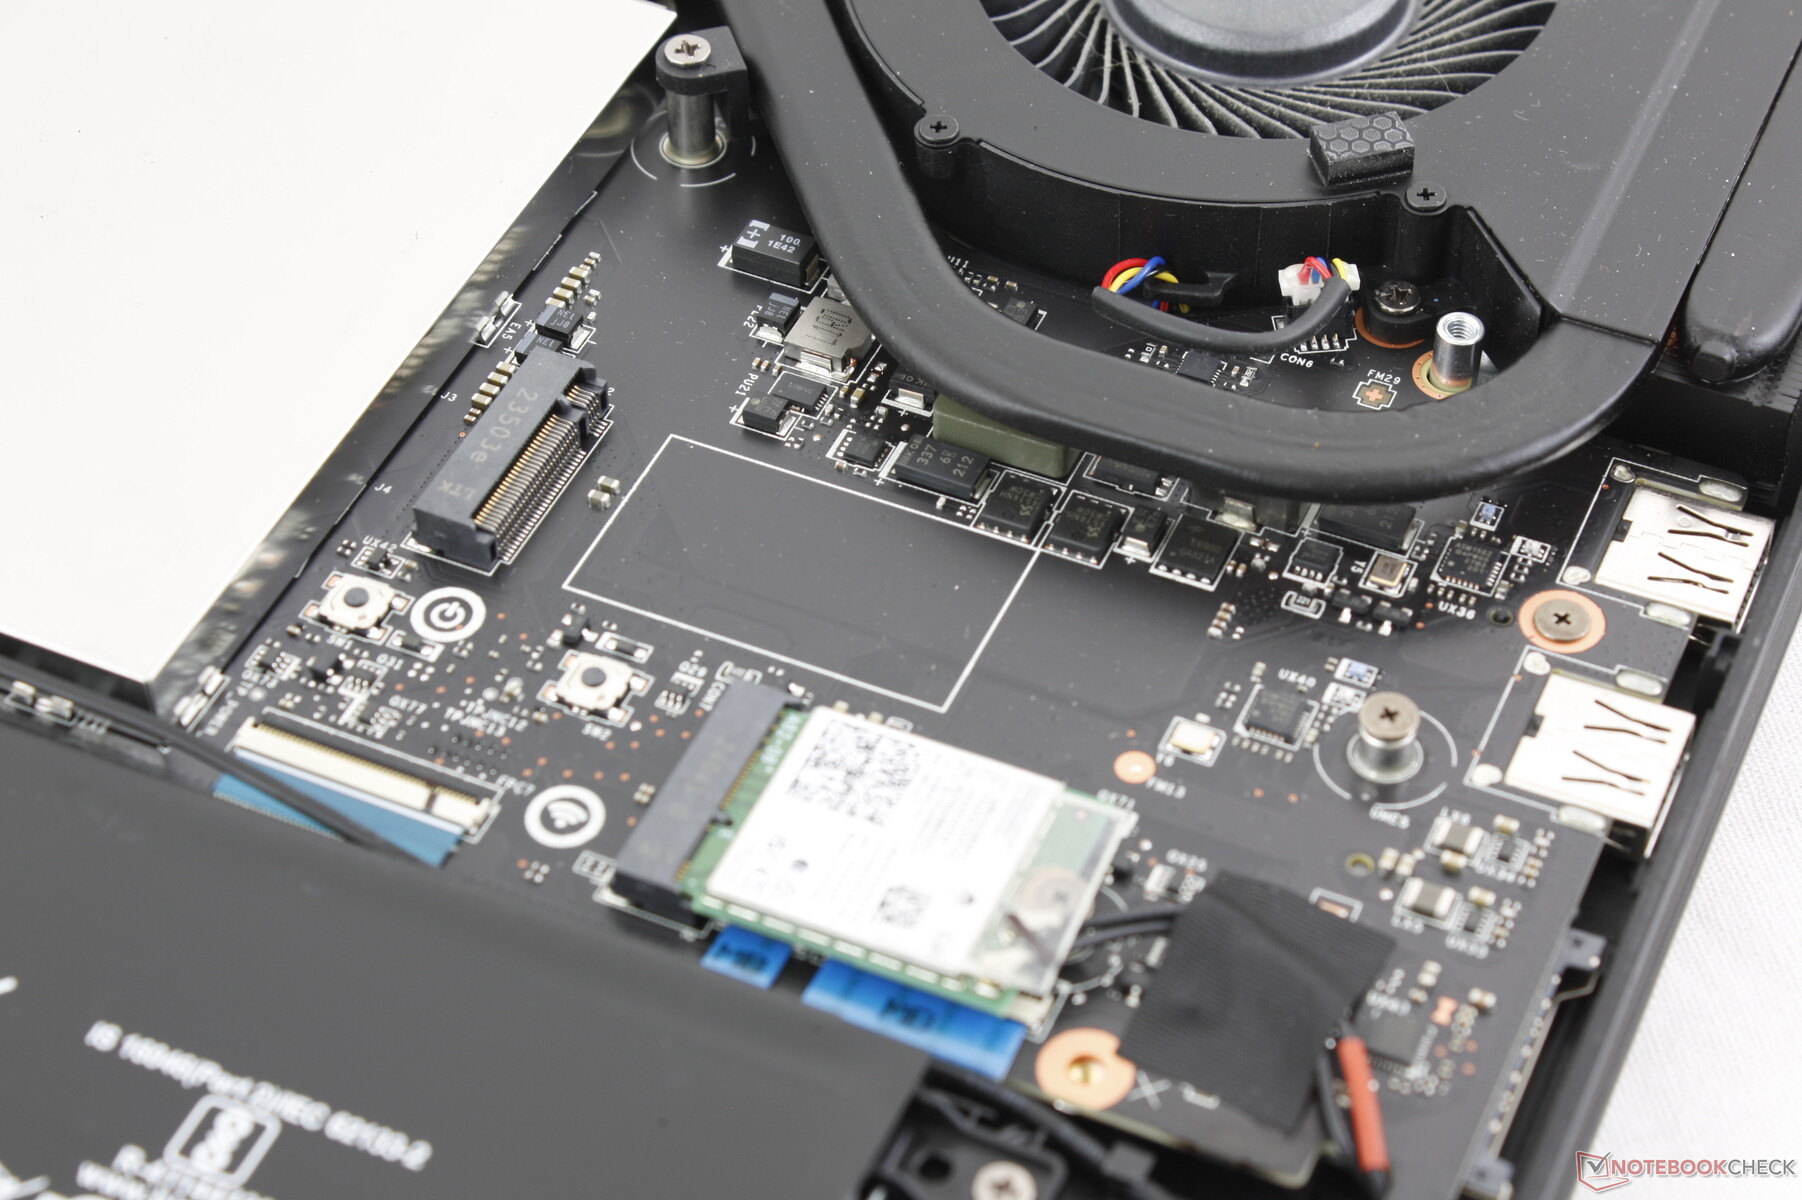
Dolny panel jest zabezpieczony 12 śrubami krzyżakowymi, co umożliwia stosunkowo łatwy demontaż. MSI pozostaje jednak jednym z niewielu producentów z naklejką antysabotażową zakrywającą jedną ze śrub, która musi zostać złamana nawet w przypadku prostych aktualizacji, takich jak pamięć RAM lub pamięć masowa.
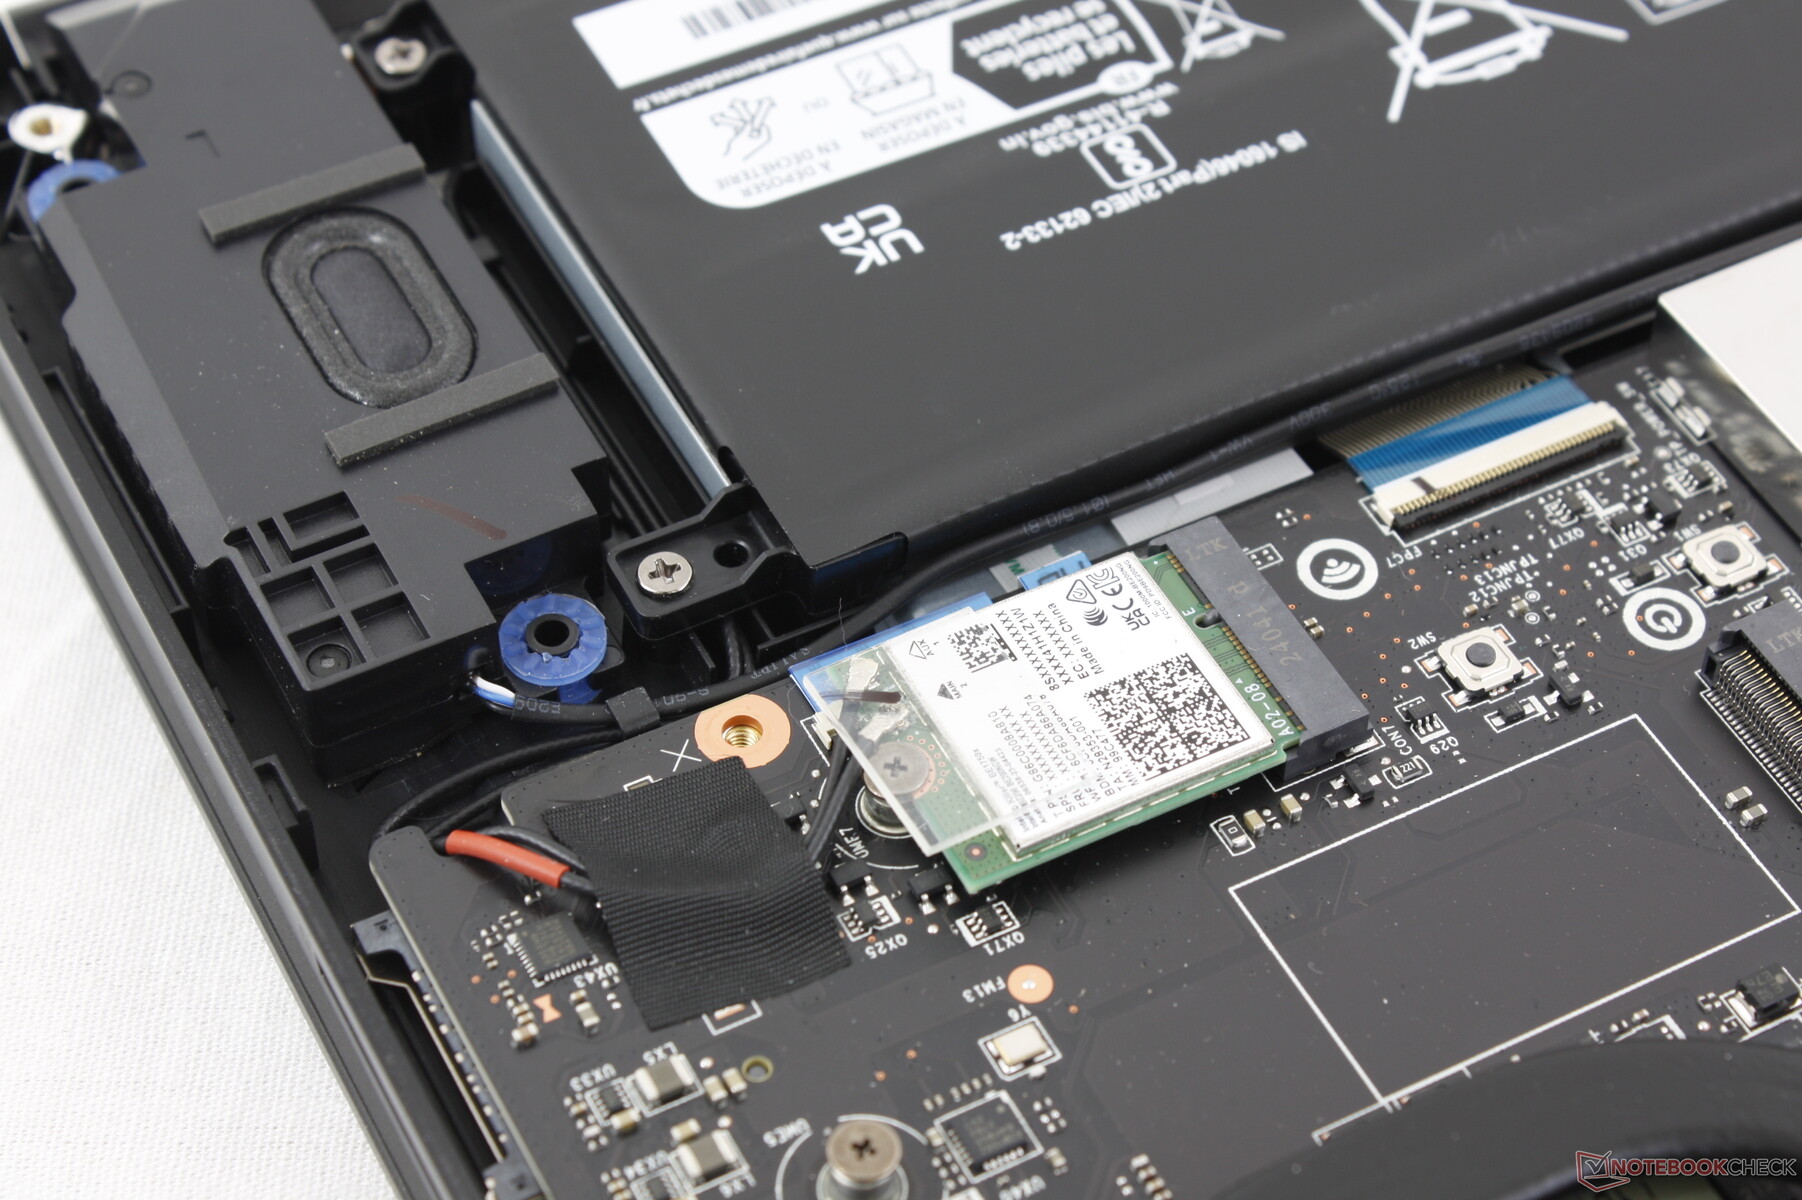
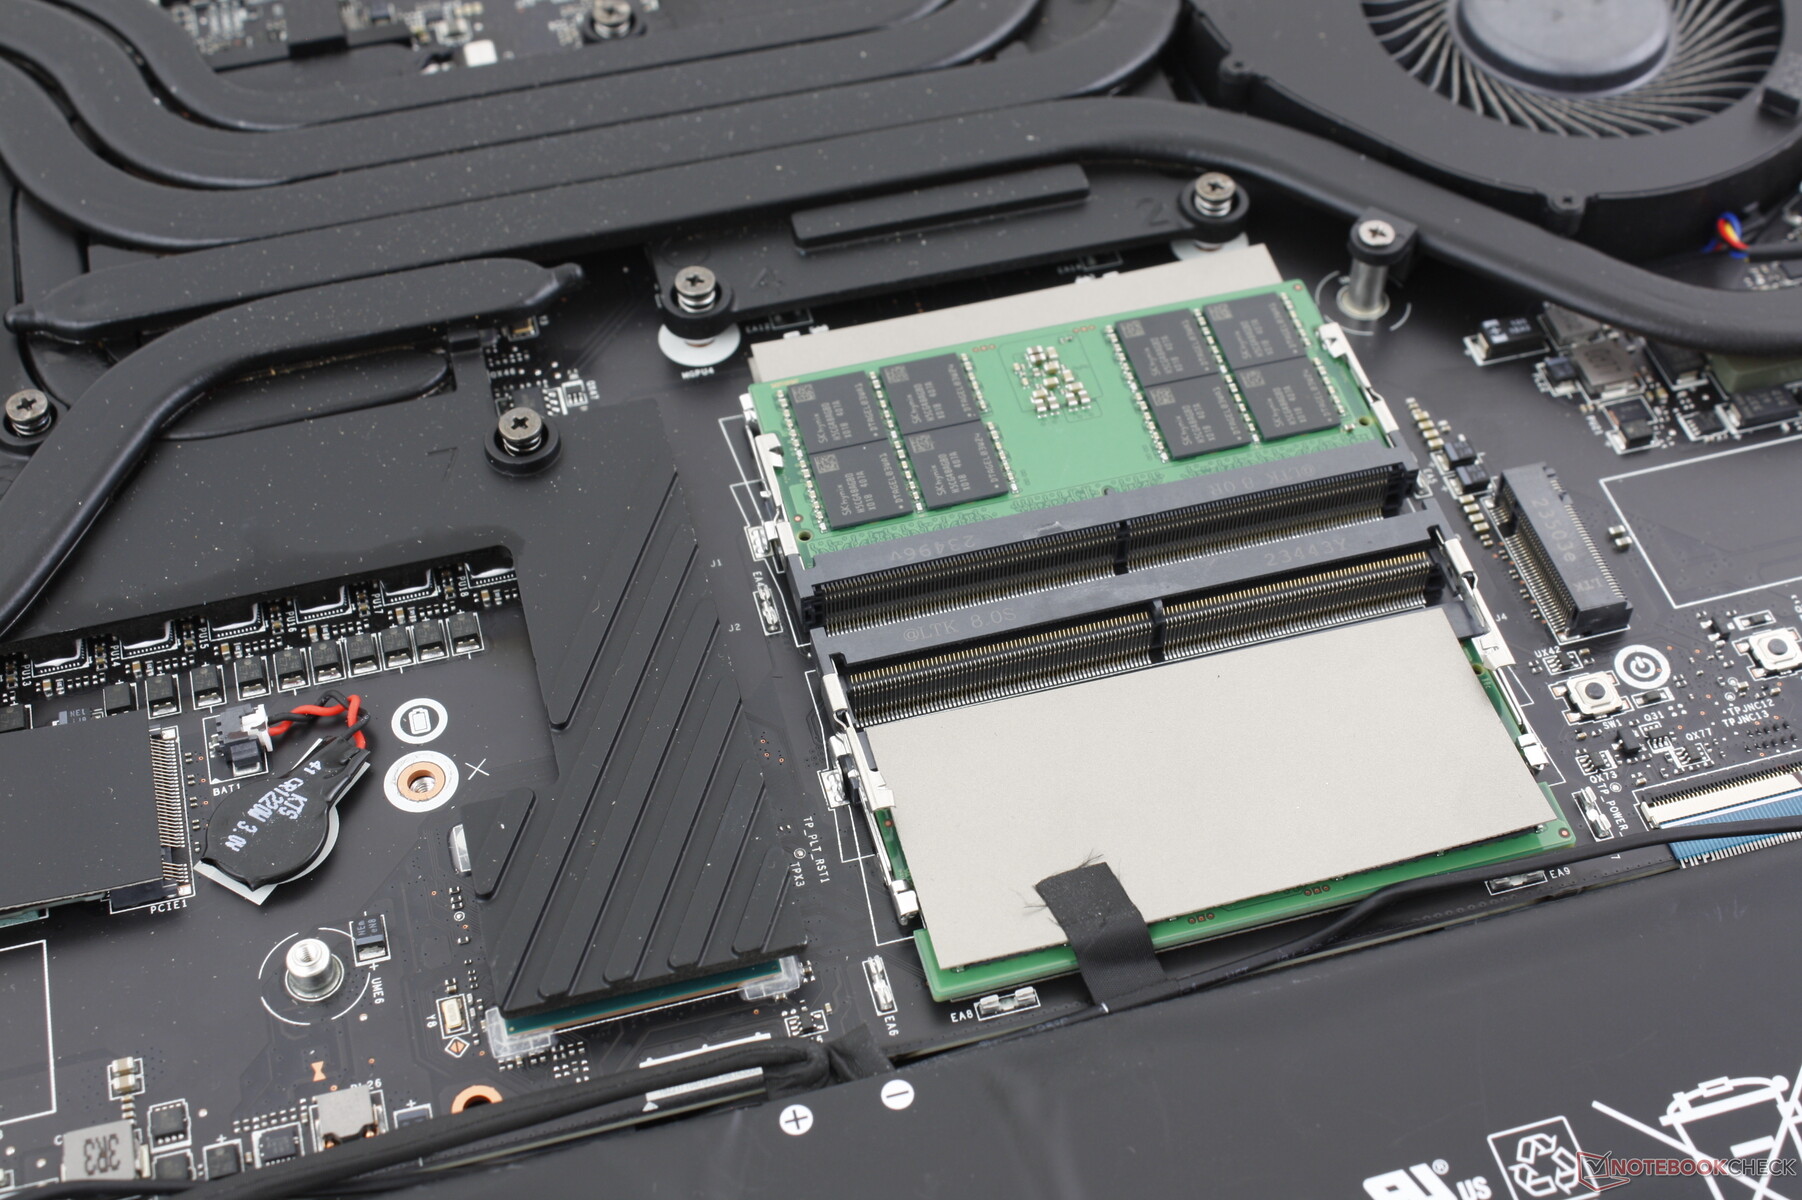
Raider 18 HX posiada wiele takich samych komponentów wewnętrznych jak Titan 18 HX. Użytkownicy mają dostęp do dwóch gniazd M.2 2280 SSD i czterech gniazd DDR5 SODIMM. Proszę zauważyć, że trzecie gniazdo M.2 SSD zostało usunięte z tego modelu; użytkownicy muszą uaktualnić do Titan 18 HX, aby uzyskać taką funkcję.

Zrównoważony rozwój
Opakowanie w pełni nadaje się do recyklingu i jest prawie w całości kartonowe, z niewielką ilością plastikowego opakowania na instrukcję obsługi. Nie ma jednak żadnych informacji na temat materiałów pochodzących z recyklingu użytych podczas produkcji systemu.
Akcesoria i gwarancja
W pudełku nie ma żadnych dodatków poza zasilaczem sieciowym i dokumentacją. Starsze modele Raider były dostarczane z aksamitną ściereczką do czyszczenia, ale wydaje się, że już tak nie jest.
Zwykła roczna ograniczona gwarancja producenta ma zastosowanie w przypadku zakupu w USA.
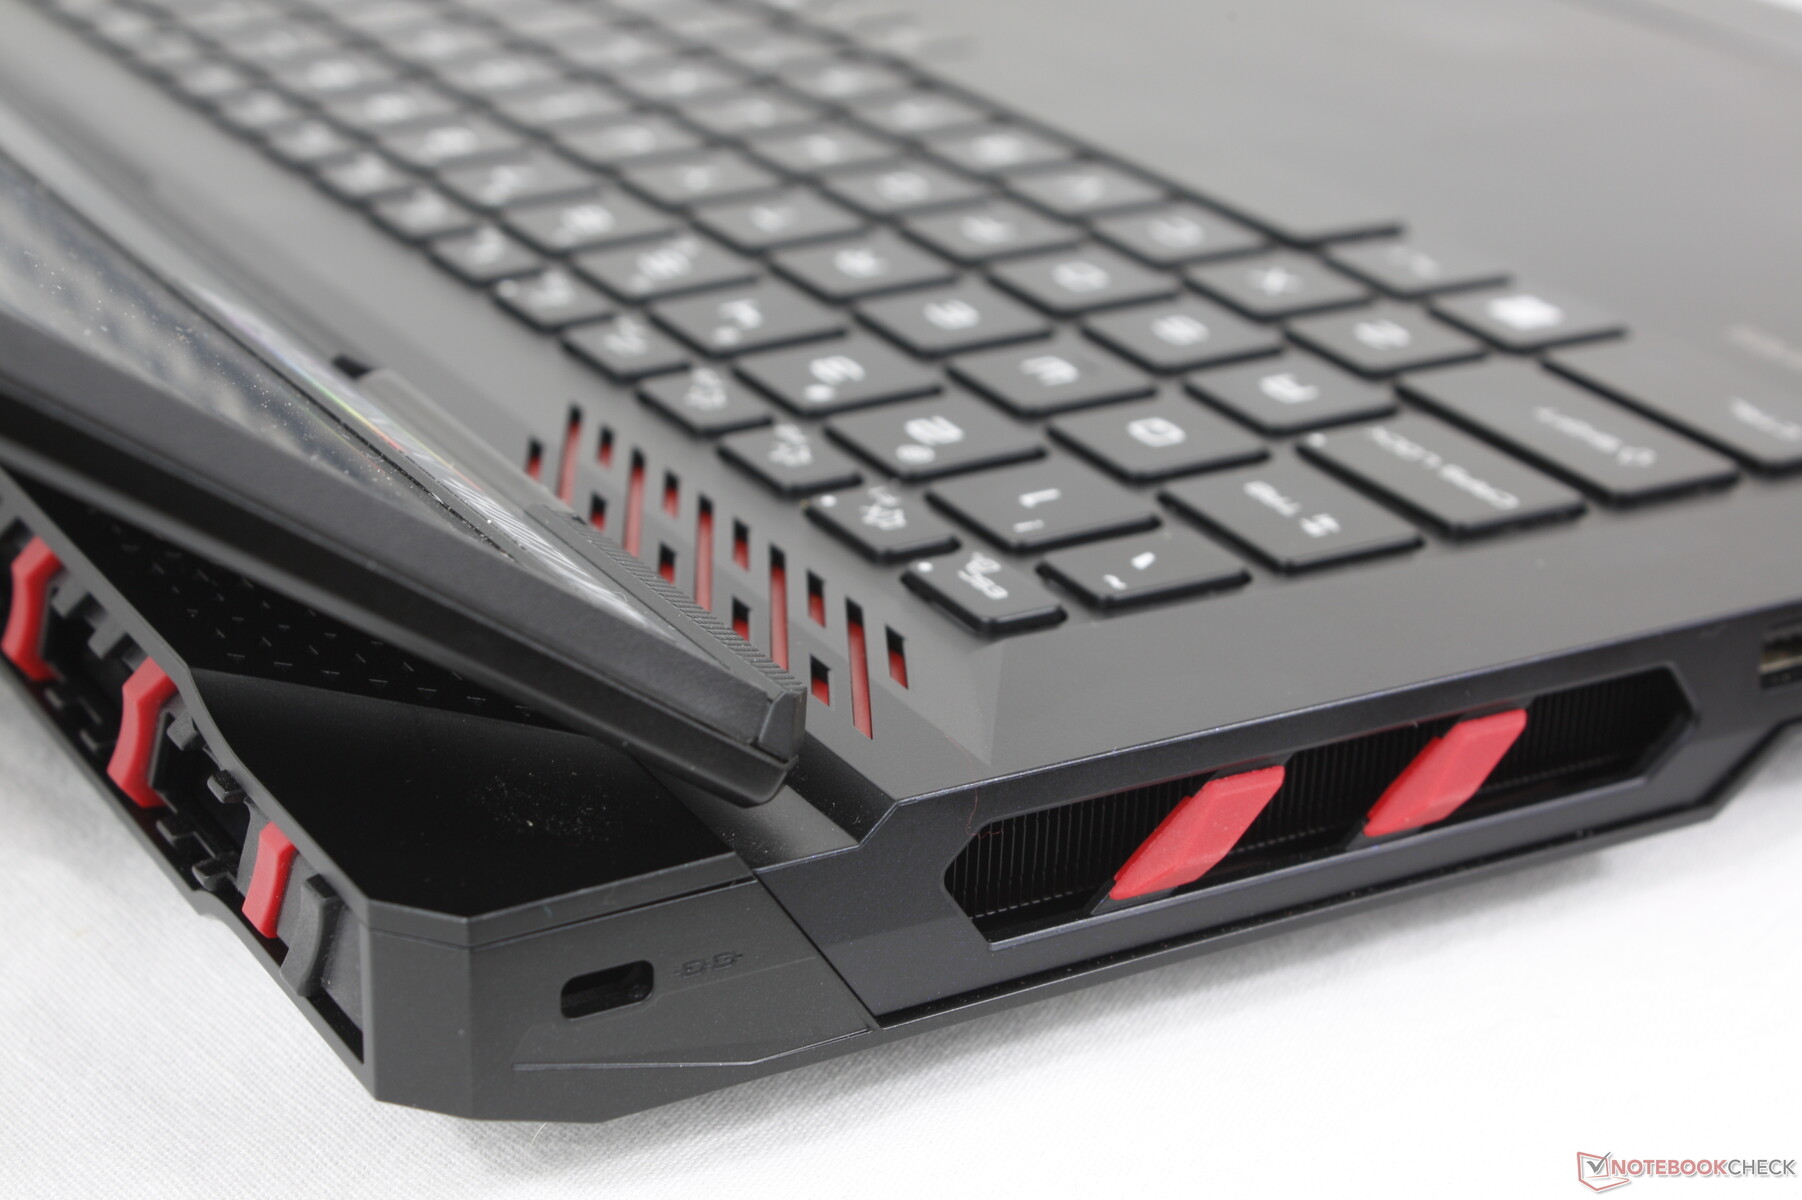
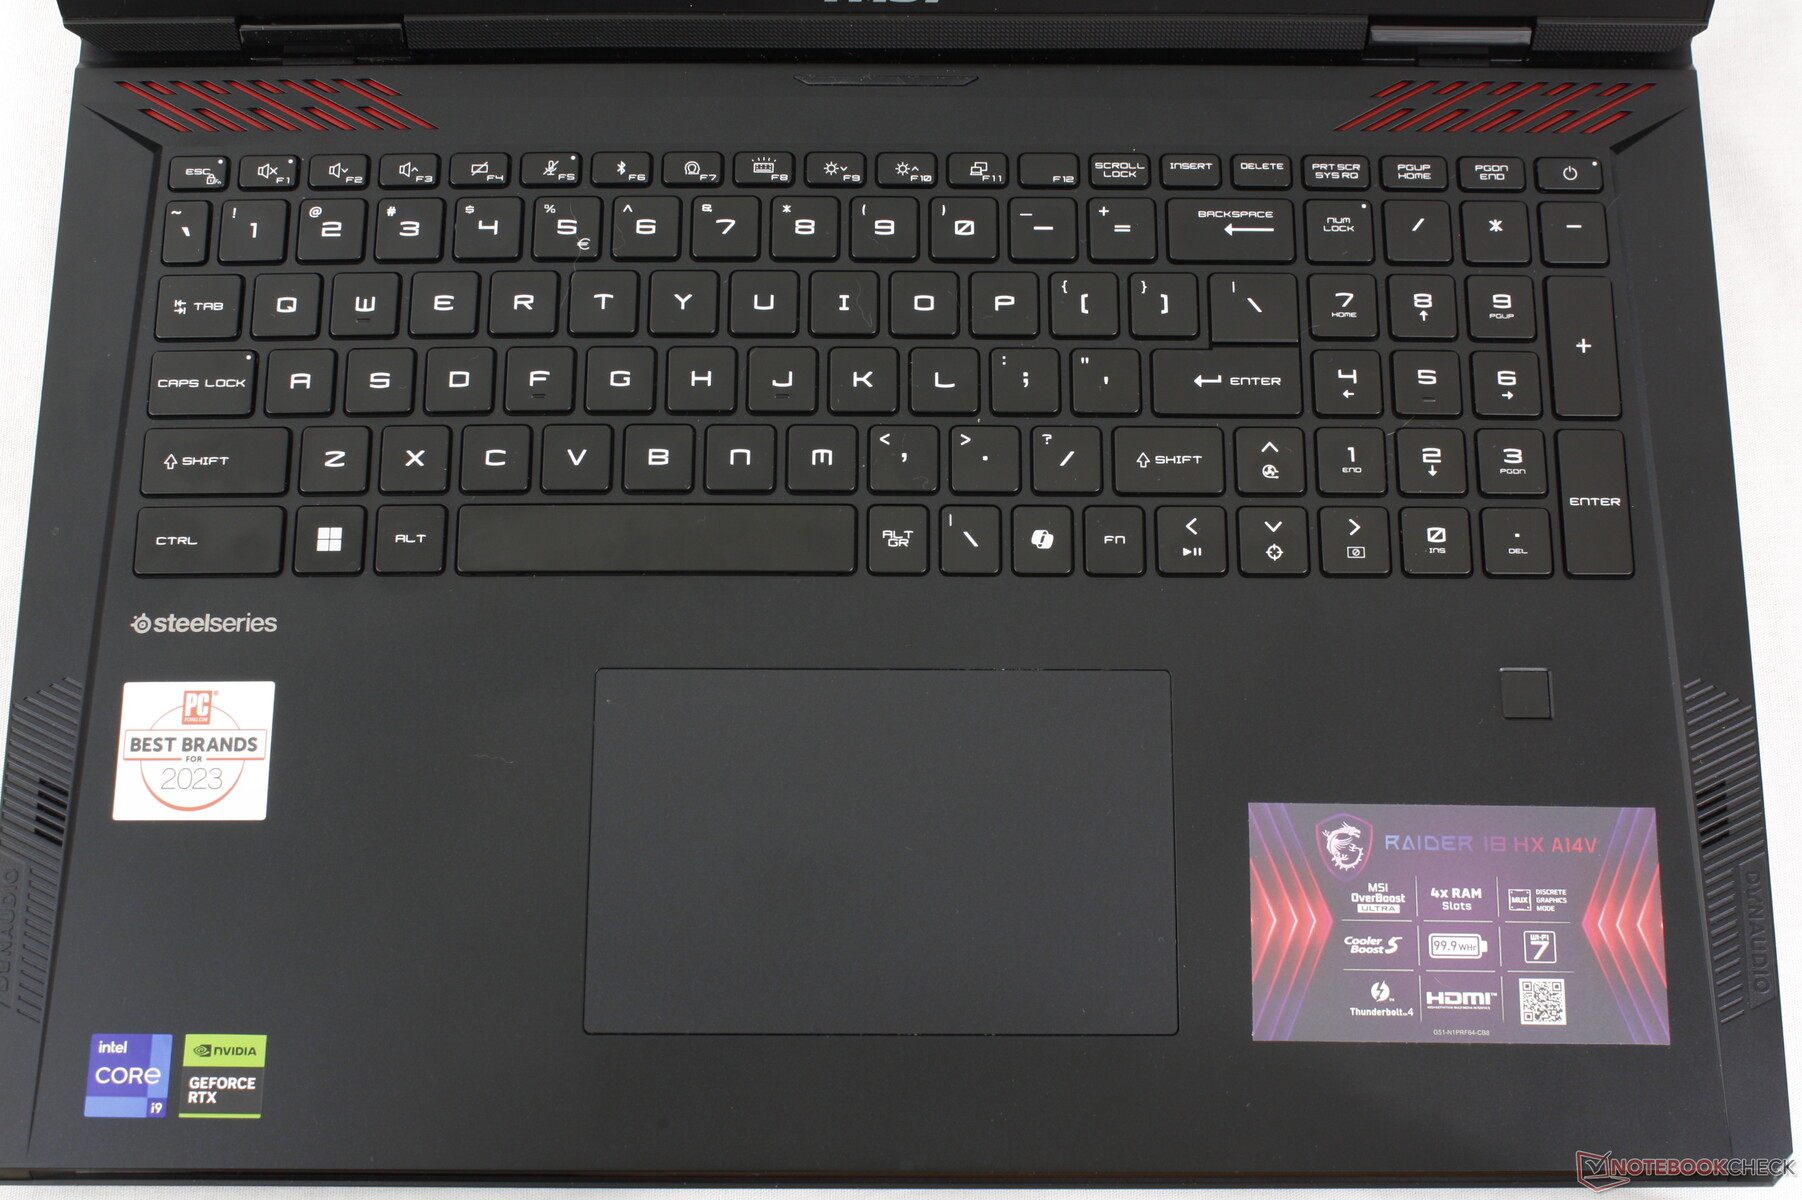
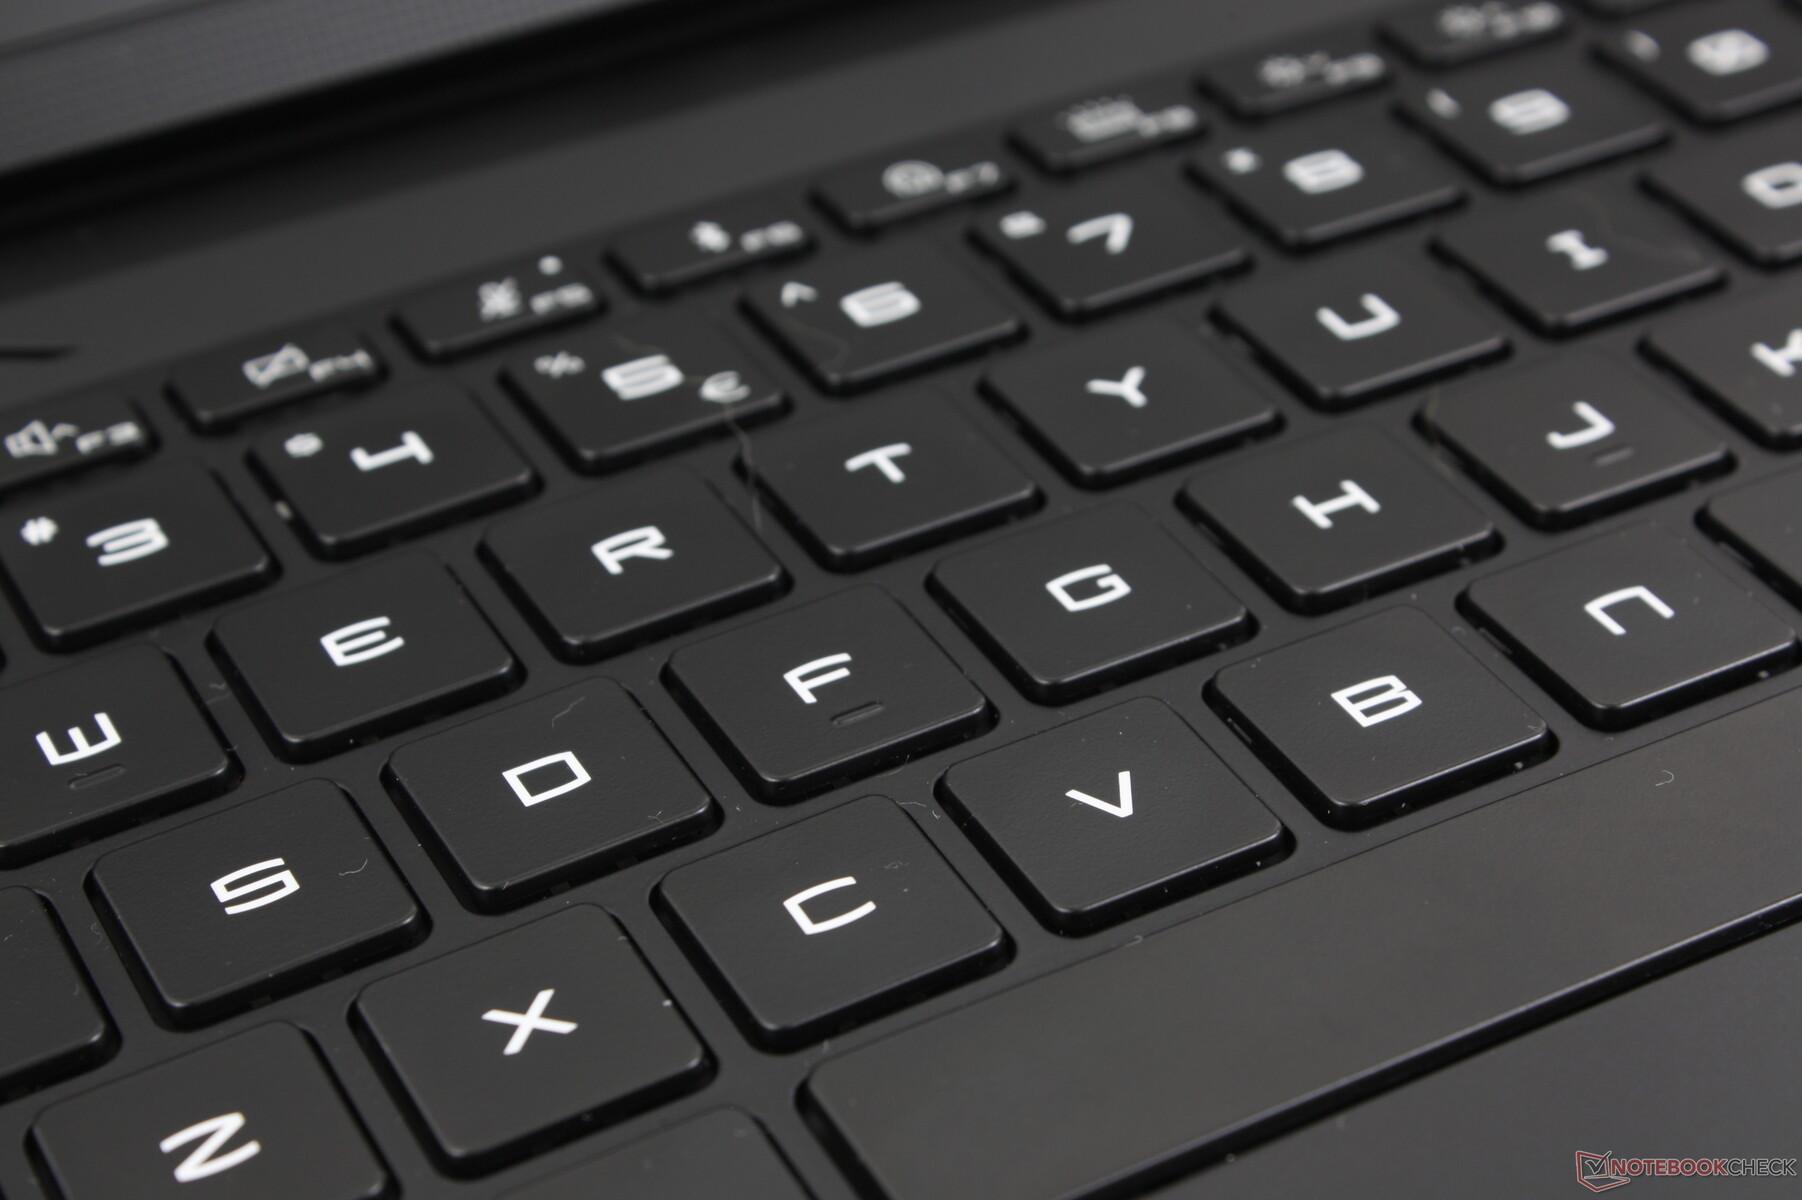
Urządzenia wejściowe - znane ponad wymyślne
Klawiatura
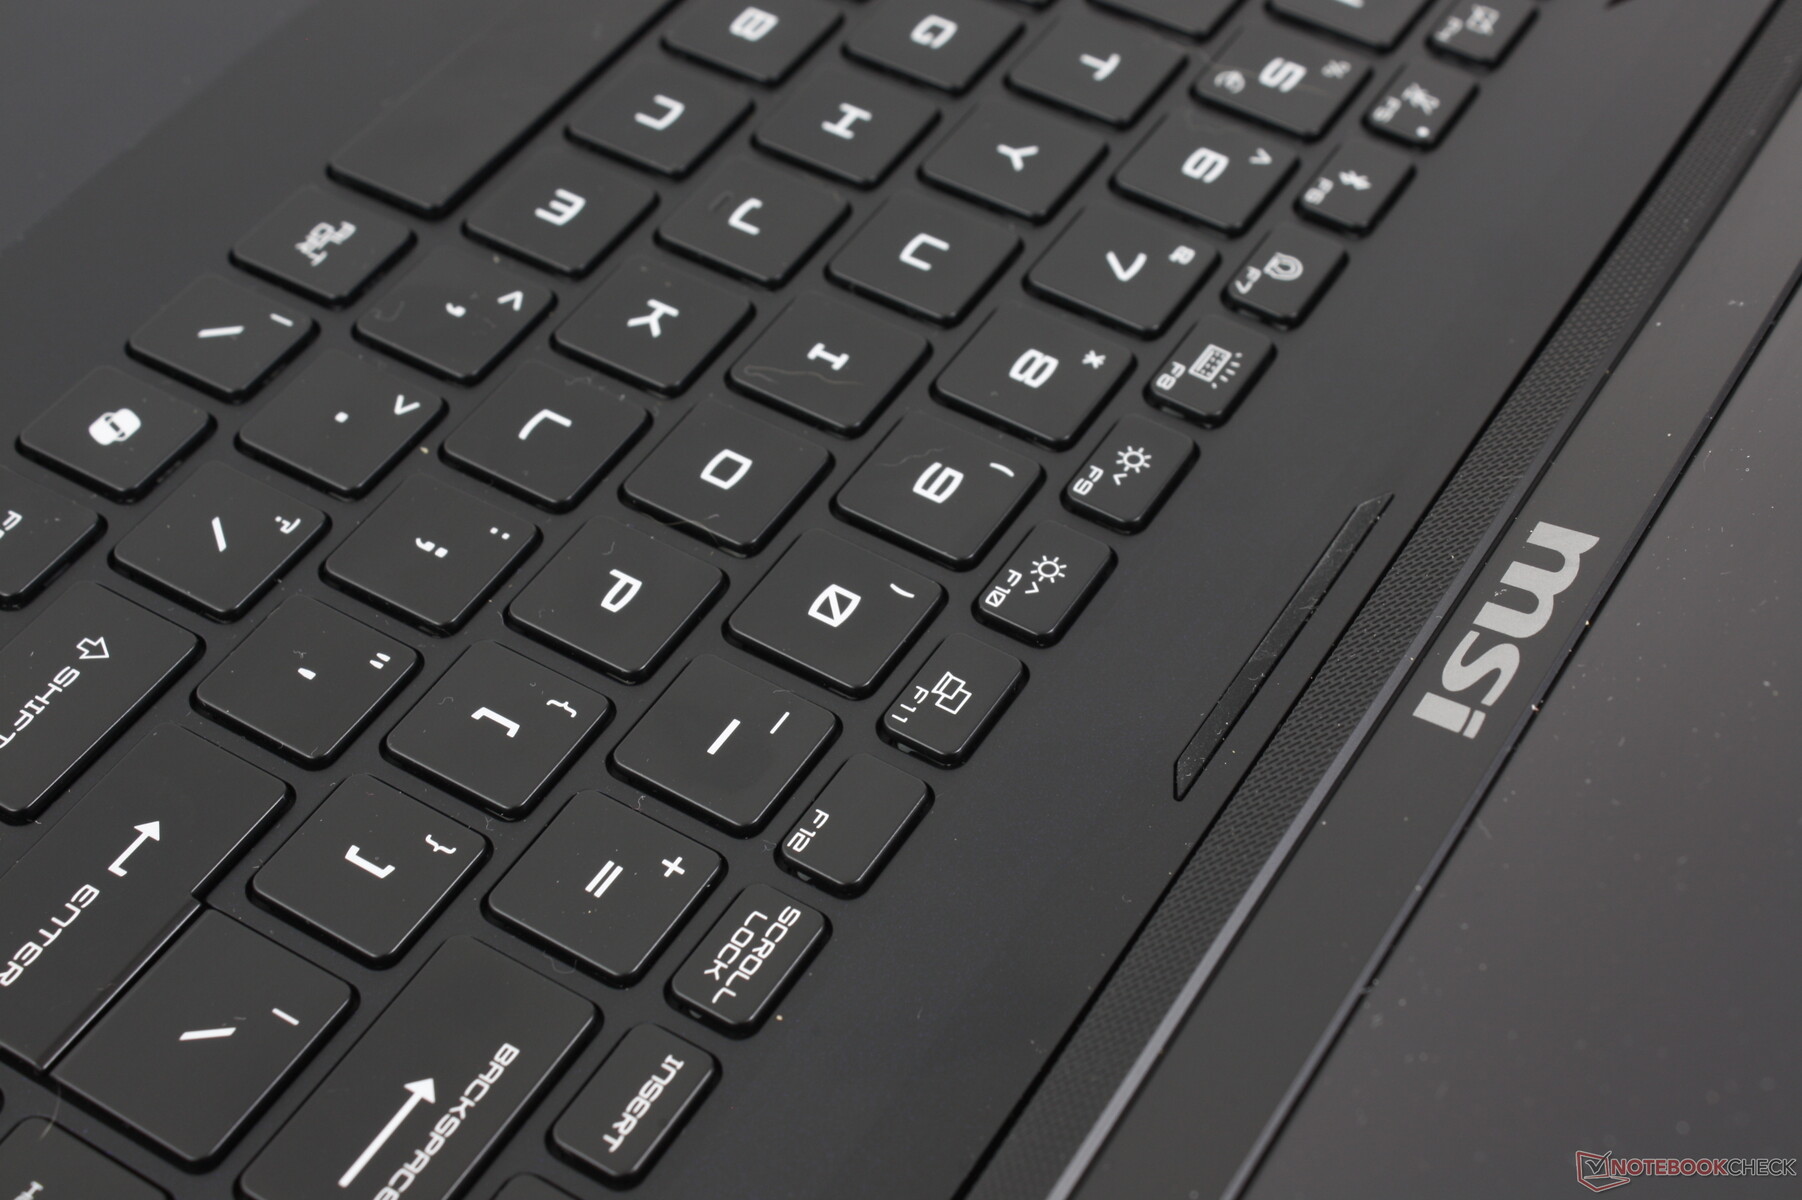
Klawiatura jest wizualnie identyczna z tą w Titan 18 HX, ale z jedną bardzo ważną różnicą: Brak jakichkolwiek opcji mechanicznych CherryMX. Pisanie na Raider 18 HX jest zatem bliższe pisaniu na bardziej tradycyjnych klawiaturach do laptopów, takich jak np MSI Stealth 16 lub starszej generacji modelach Raider. Sprzężenie zwrotne nie jest tak wyraźne ani stanowcze, ale łagodniejszy stukot może być preferowany w środowiskach takich jak sale konferencyjne, sale lekcyjne, biblioteki lub akademiki.
Szczególnie doceniamy pełnowymiarowy numpad i klawisze strzałek, ponieważ są one zwykle węższe i mniejsze niż główne klawisze QWERTY w większości innych laptopów. Praca z arkuszami kalkulacyjnymi jest zatem wygodniejsza na Raider 18 HX niż na Blade 18 lub ROG Strix G18.
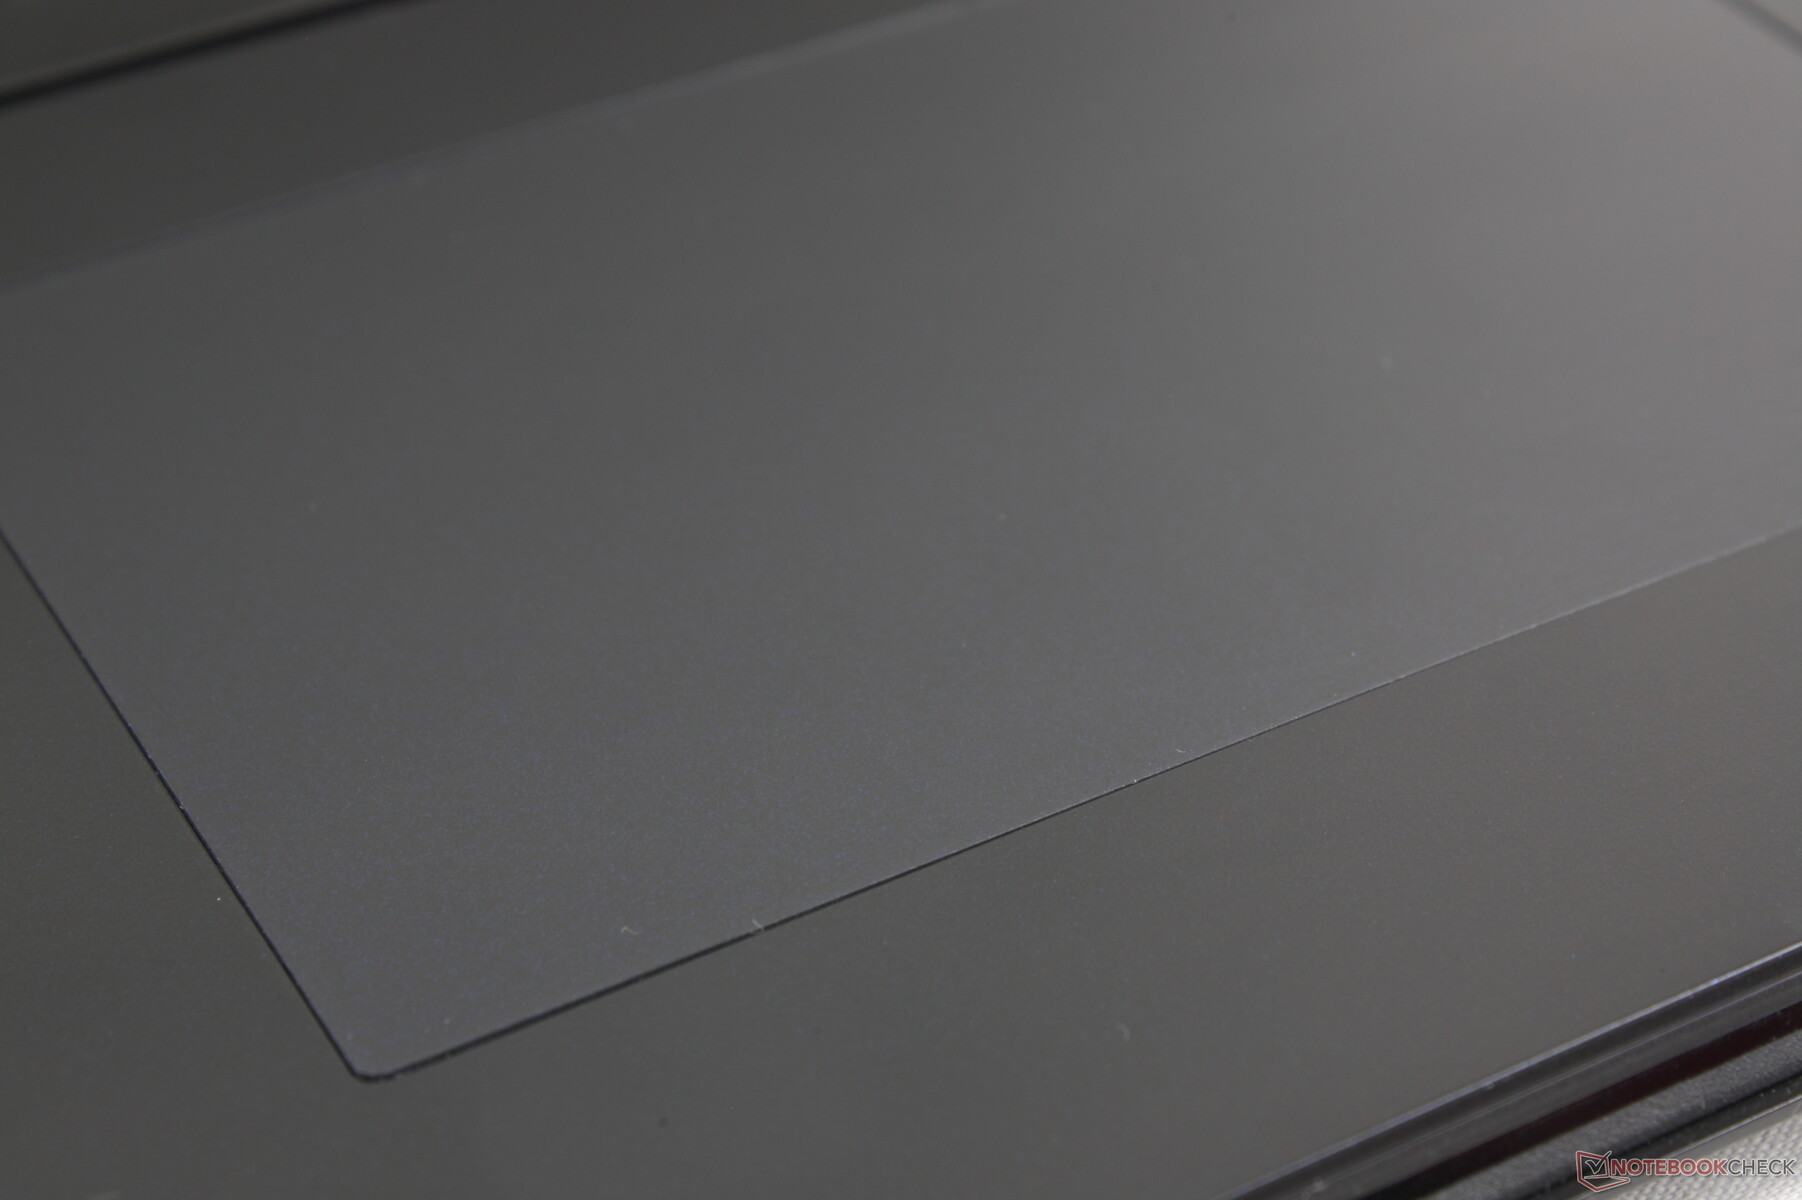
Panel dotykowy
W przeciwieństwie do fantazyjnego, podświetlanego diodami LED, bezkrawędziowego panelu dotykowego w Titan 18 HX, Raider 18 HX wykorzystuje tradycyjny panel dotykowy, zapewniając bardziej znajome odczucia. Rozmiar pozostaje dokładnie taki sam (13 x 8,2 cm) i jest prawdopodobnie wygodniejszy w użyciu, ponieważ nie próbuje być niczym nowym ani naprawiać problemu, który nie istniał w pierwszej kolejności. Trakcja jest bardzo płynna, z odrobiną zacinania się przy wolniejszych prędkościach, co zapewnia dokładność.
Naciśnięcie w celu wprowadzenia kliknięcia jest niestety nadal płytkie i miękkie, z niezadowalającą informacją zwrotną. Lepsze byłoby mocniejsze i bardziej zdecydowane kliknięcie lub nawet powrót dedykowanych klawiszy myszy, ponieważ klawiatura jest dość przestronna.
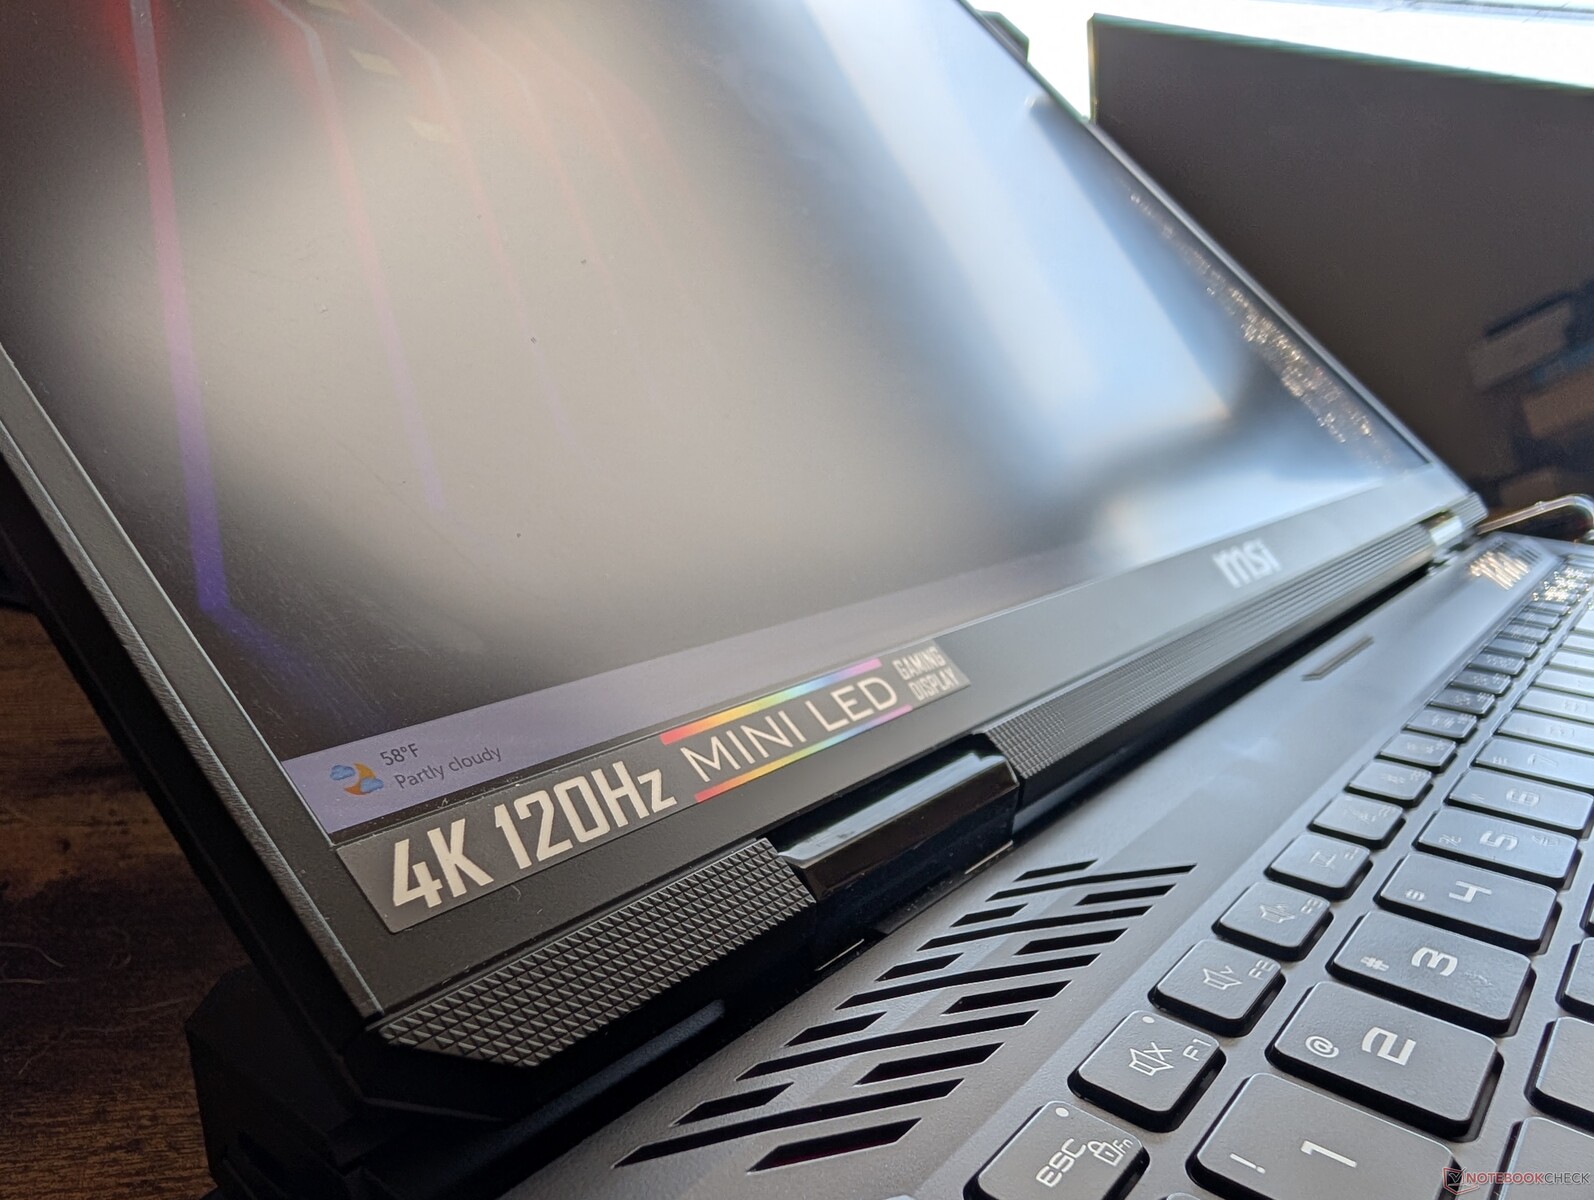
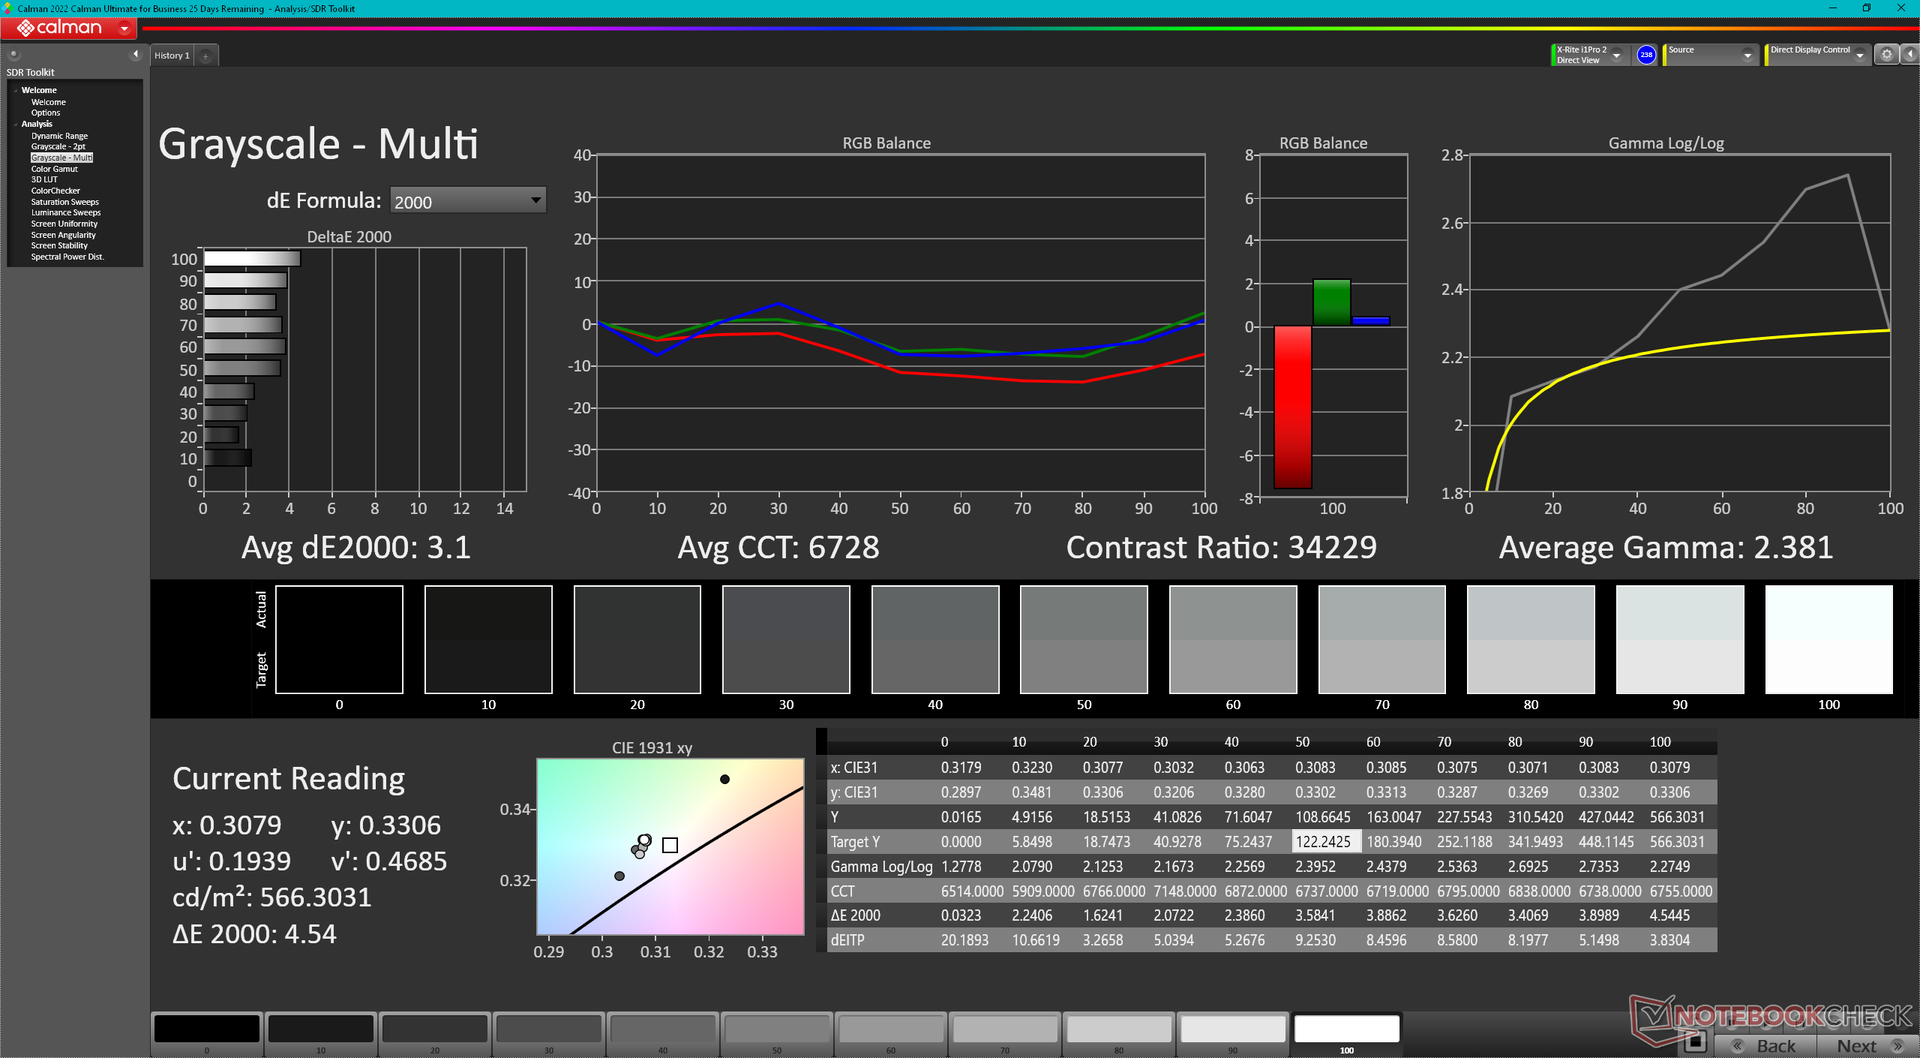
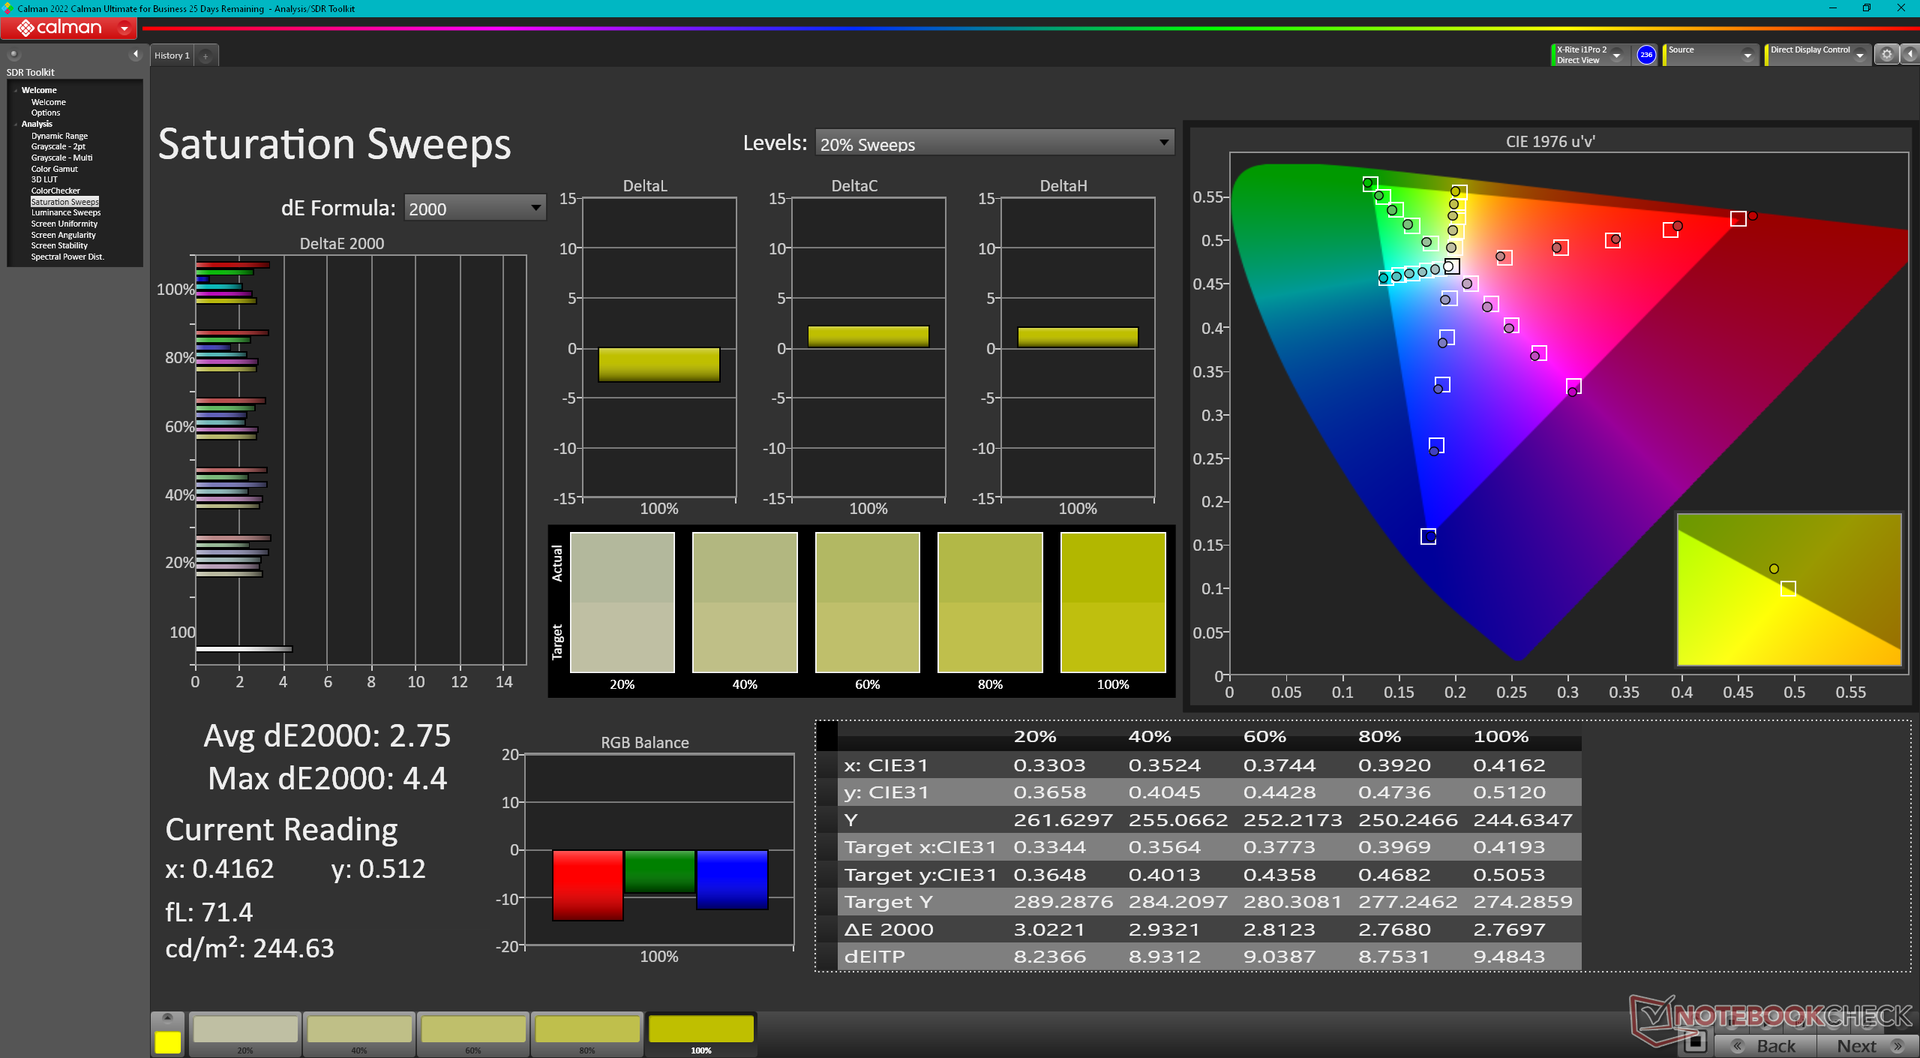
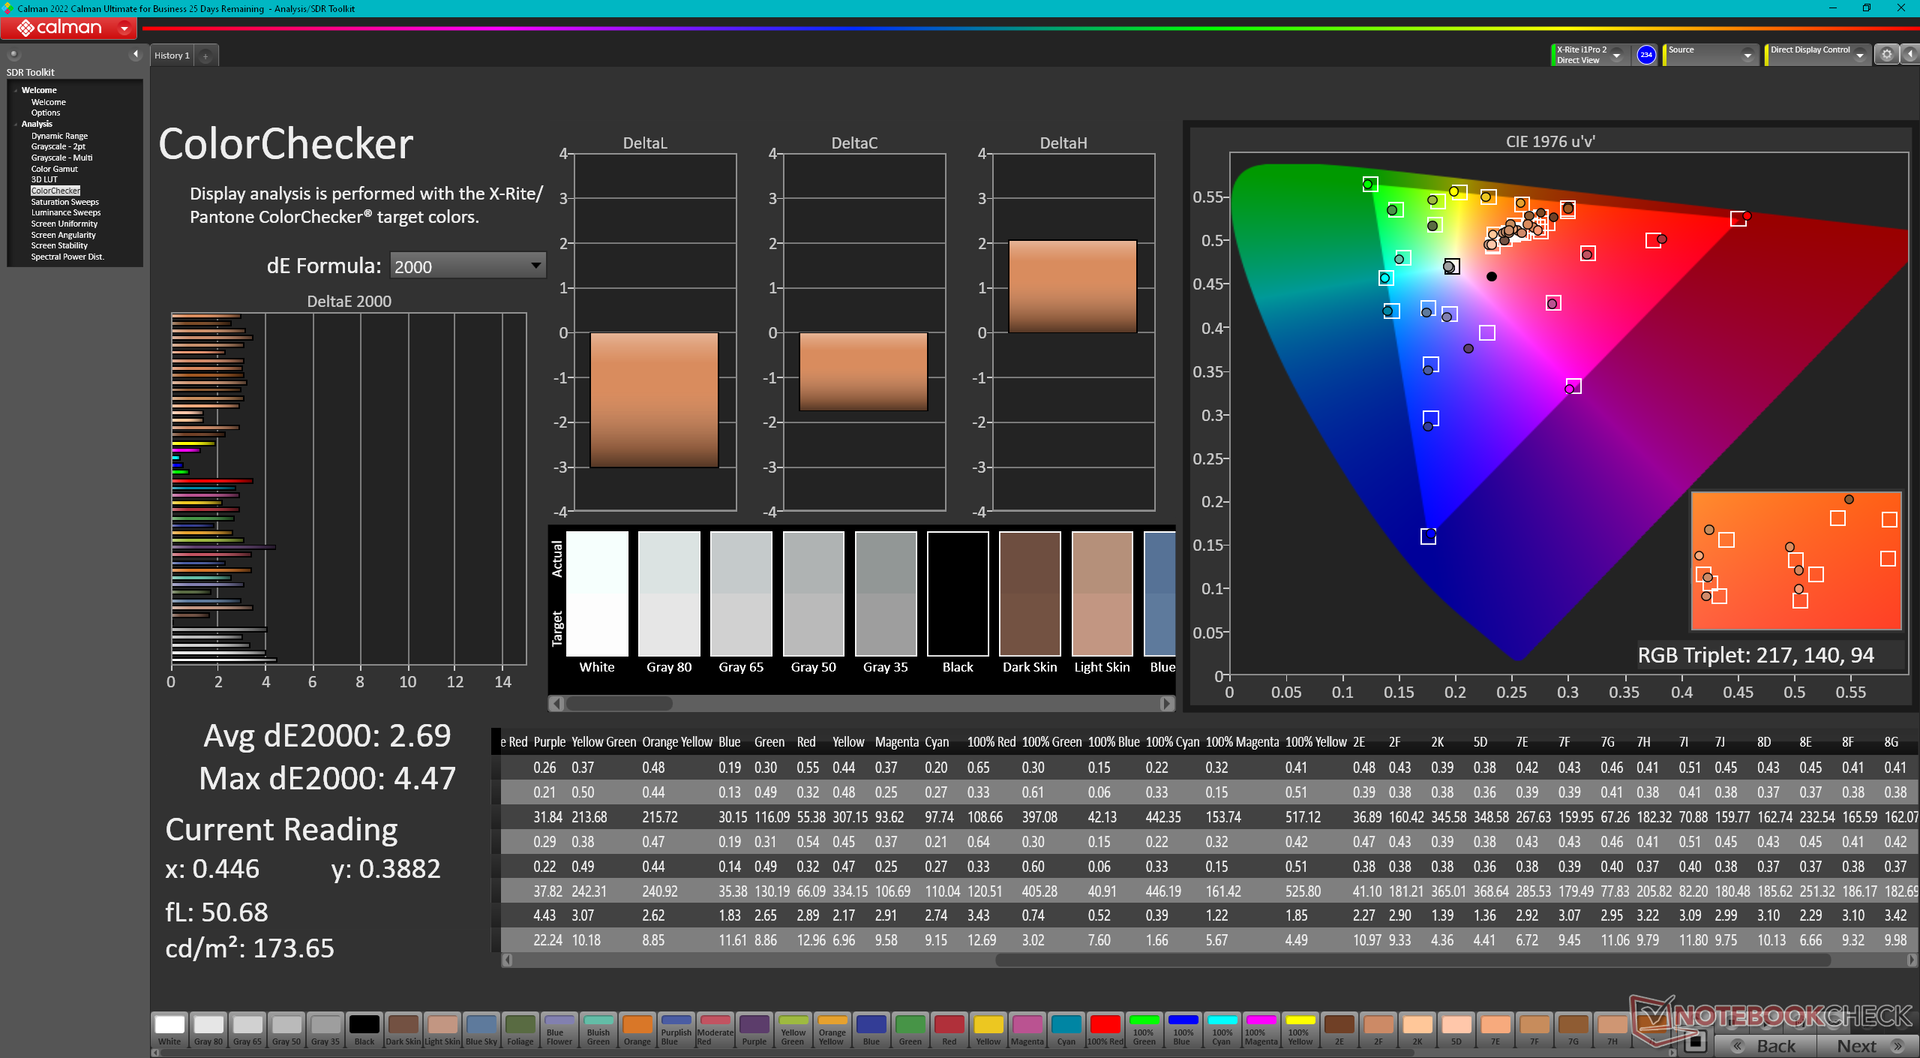
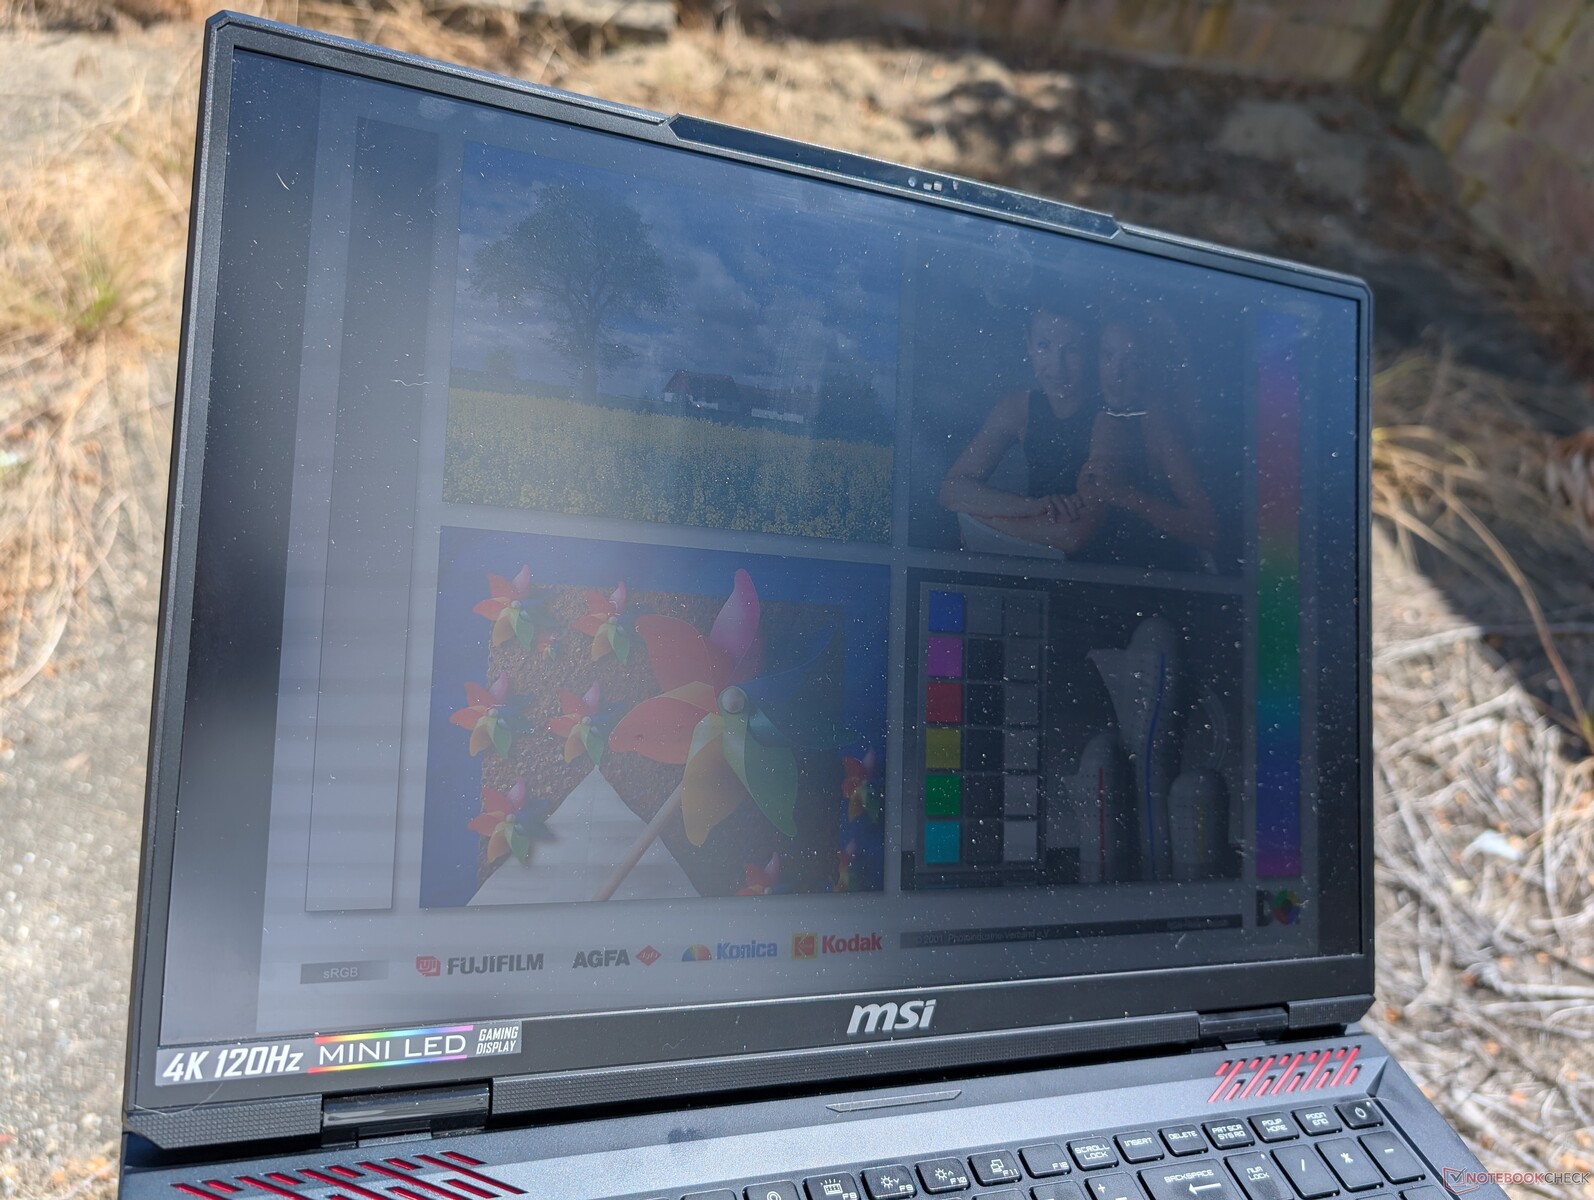
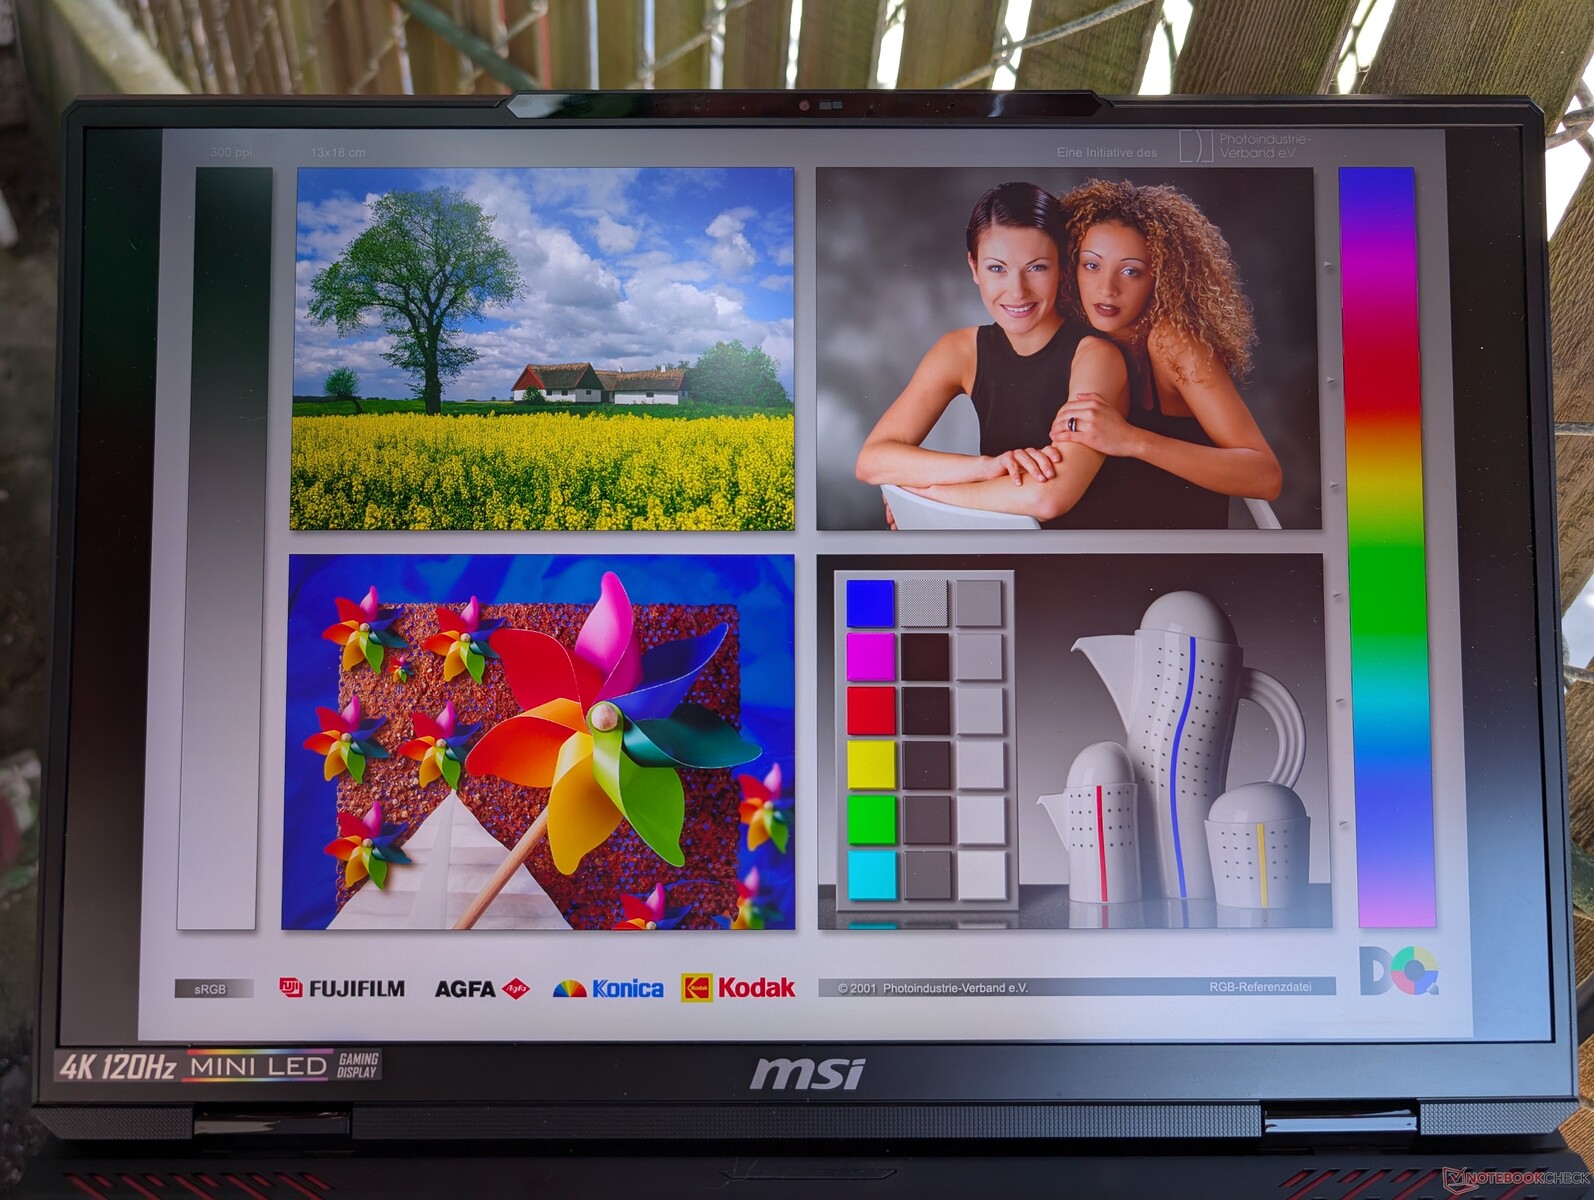
Wyświetlacz - Titan 18 HX Experience za mniej
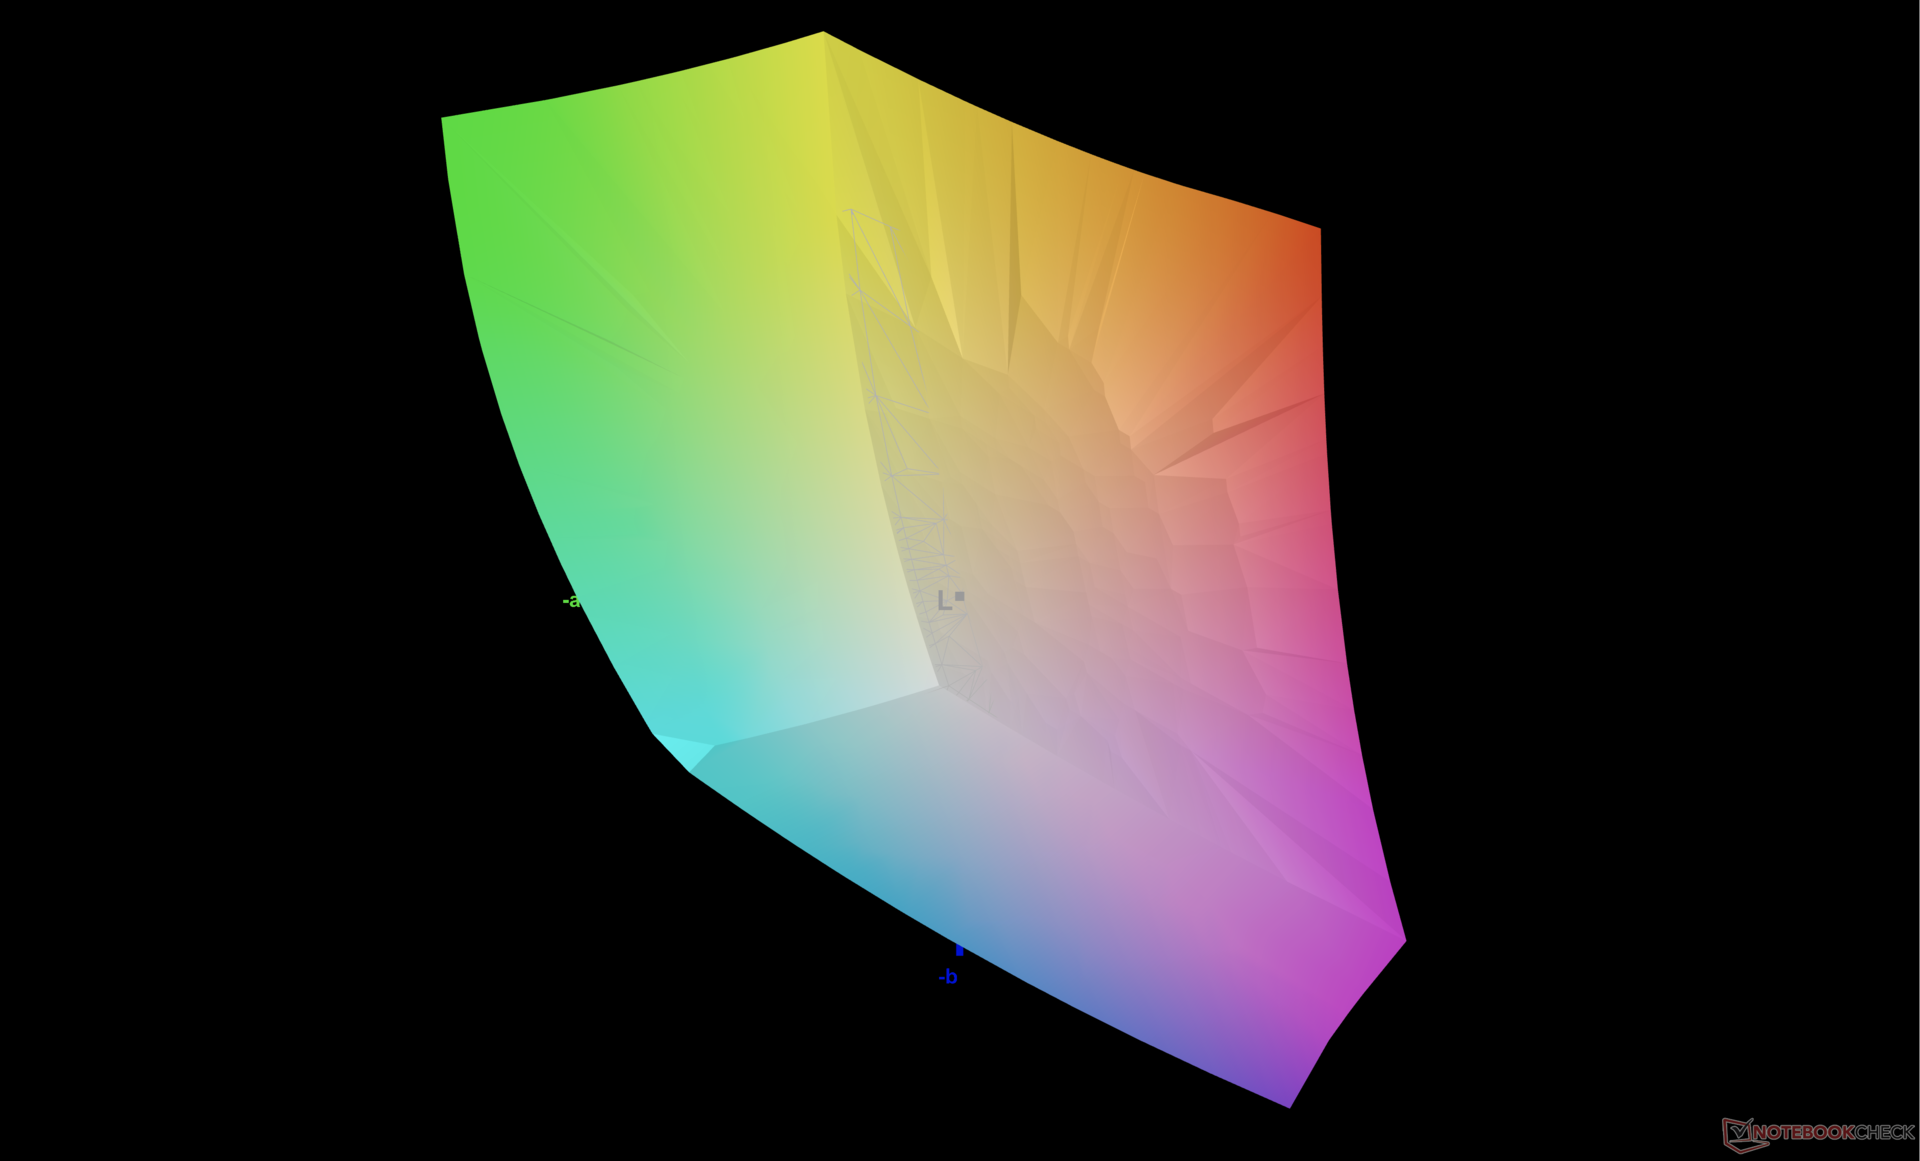
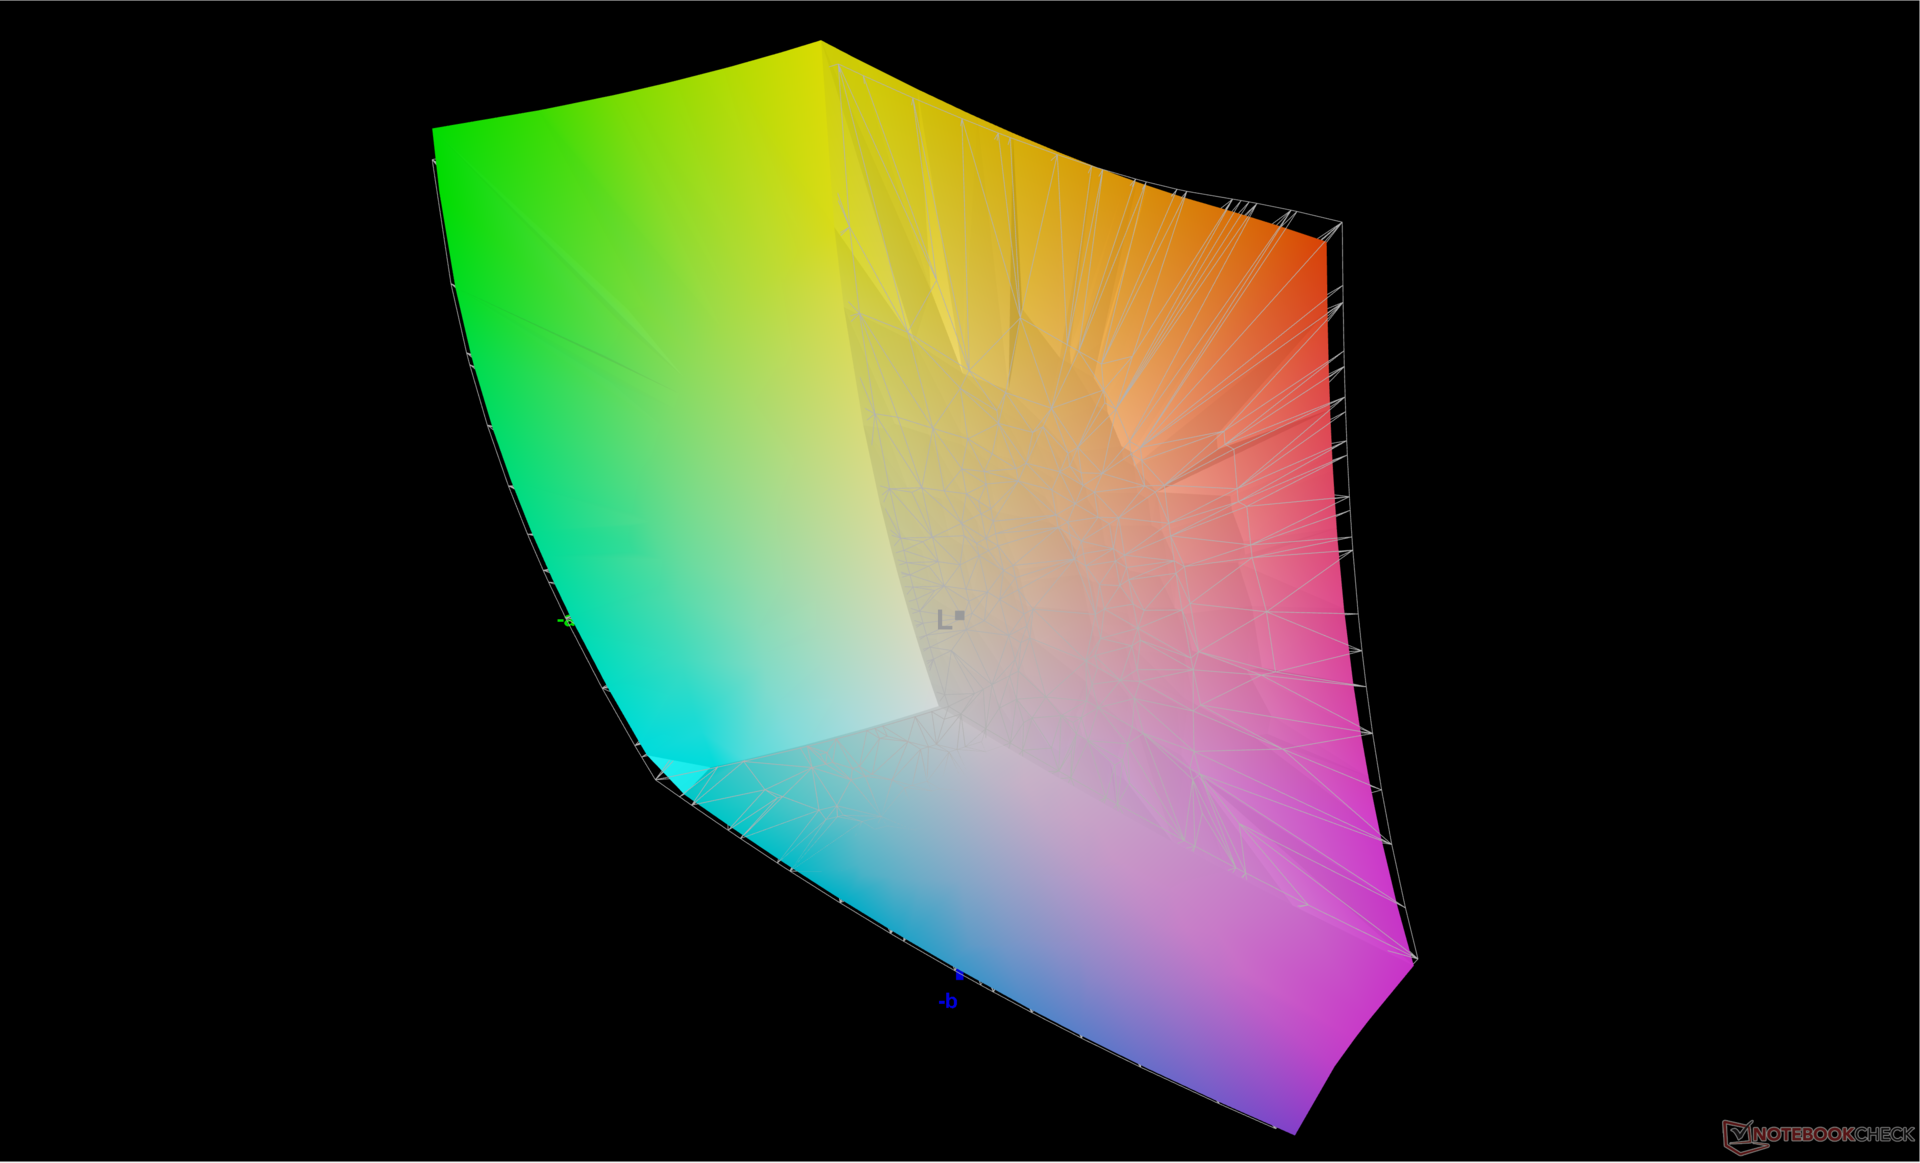
Raider 18 HX jest wyposażony w dokładnie ten sam panel mini-LED AU Optronics B180ZAN01.0 120 Hz, który można znaleźć w Titan 18 HX, zapewniając praktycznie identyczne wrażenia wizualne. Maksymalna jasność osiąga prawie 600 nitów przy wyłączonym HDR lub 935 nitów przy włączonym HDR. W porównaniu do IPS lub OLED, mini-LED zapewnia lepsze wrażenia z oglądania HDR, ponieważ jest w stanie osiągnąć wyższy poziom jasności niż którykolwiek z nich kosztem wyższego zużycia energii. Laptopy z matrycami IPS lub OLED zazwyczaj obsługują co najwyżej HDR600, podczas gdy panele mini-LED często obiecują HDR1000.
| |||||||||||||||||||||||||
rozświetlenie: 94 %
na akumulatorze: 392.2 cd/m²
kontrast: ∞:1 (czerń: 0 cd/m²)
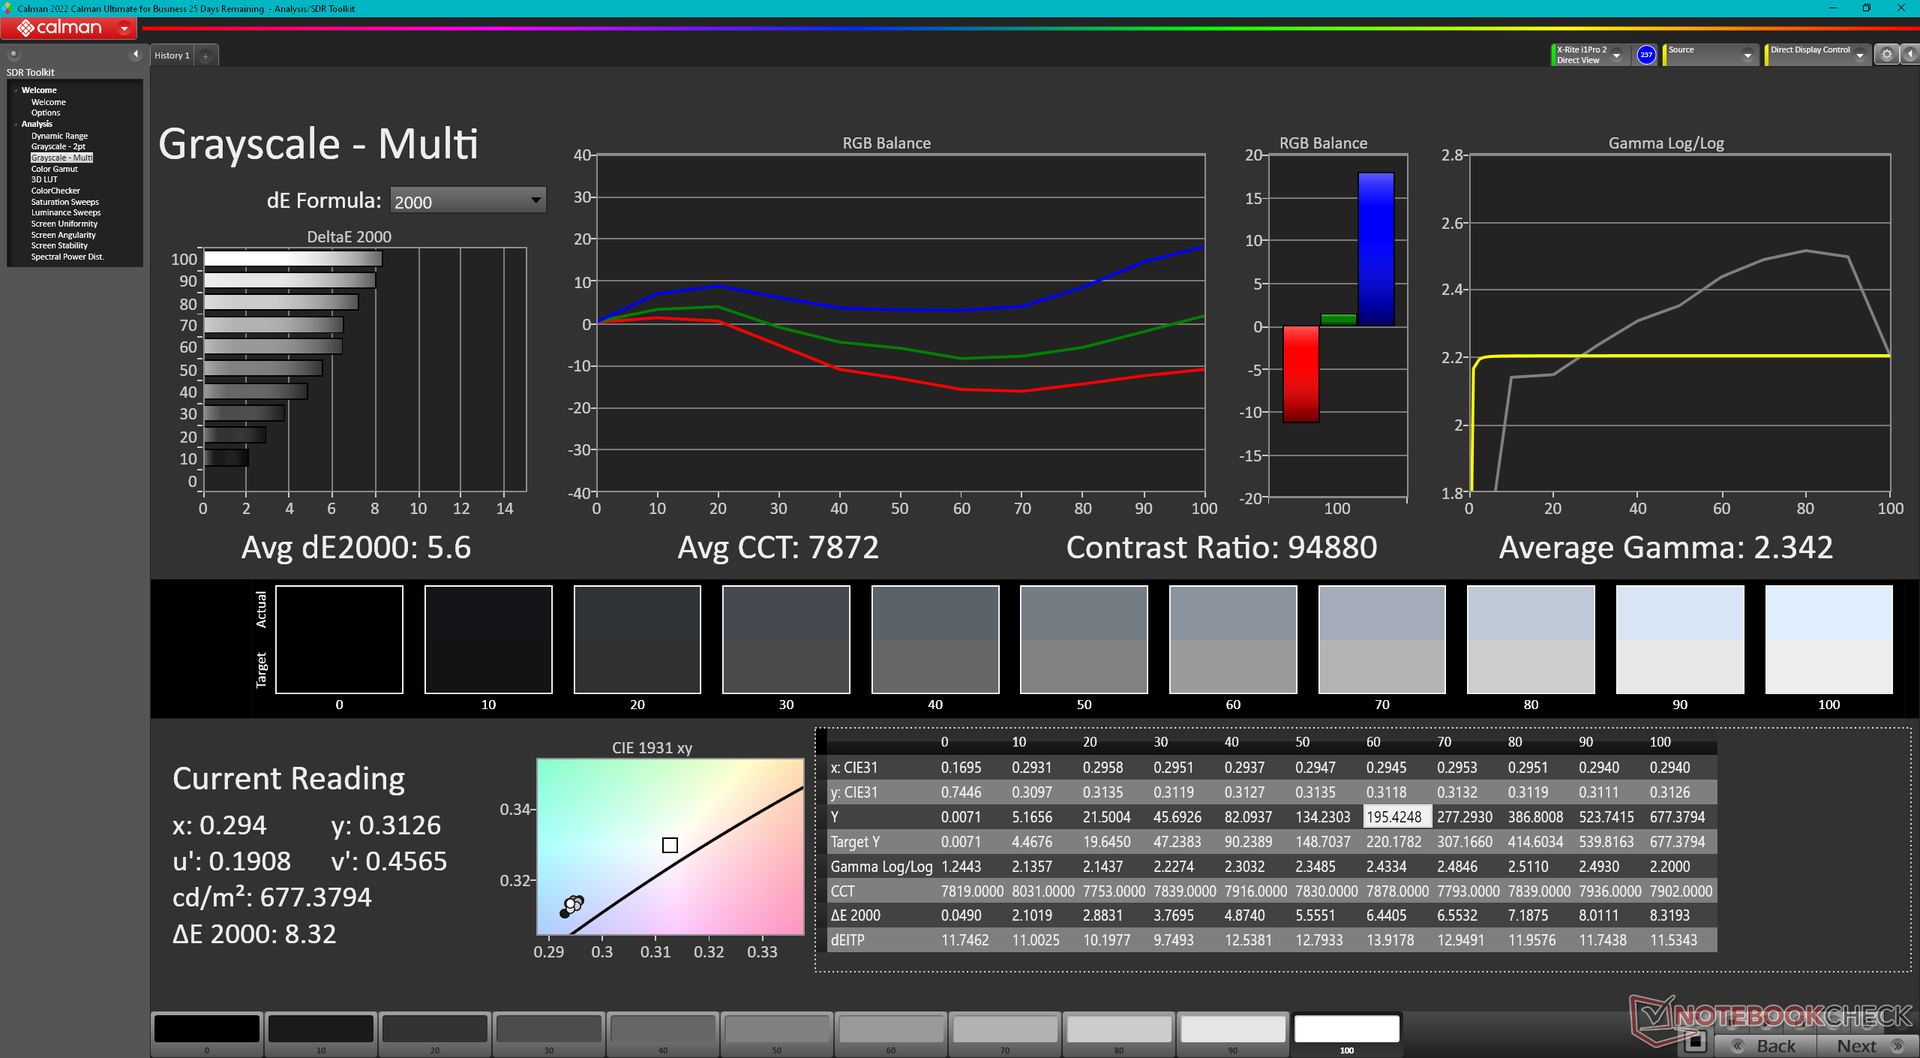
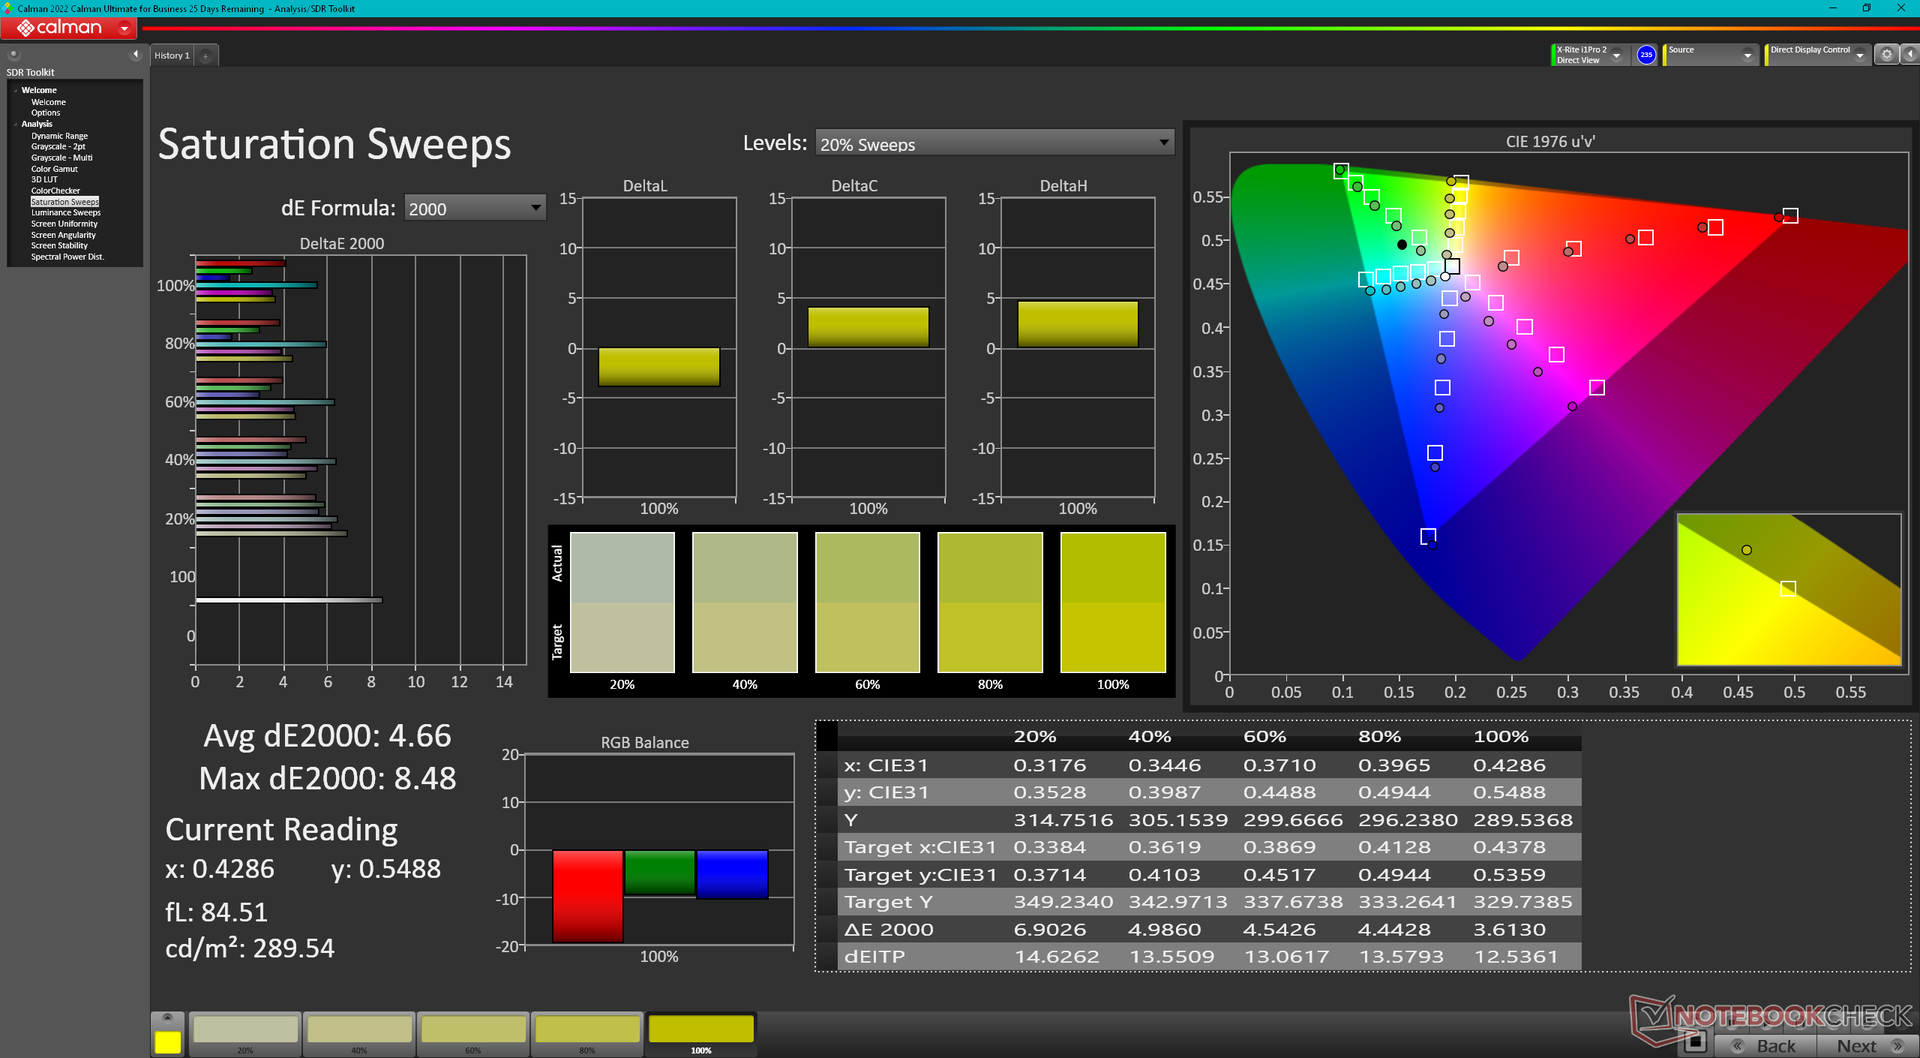
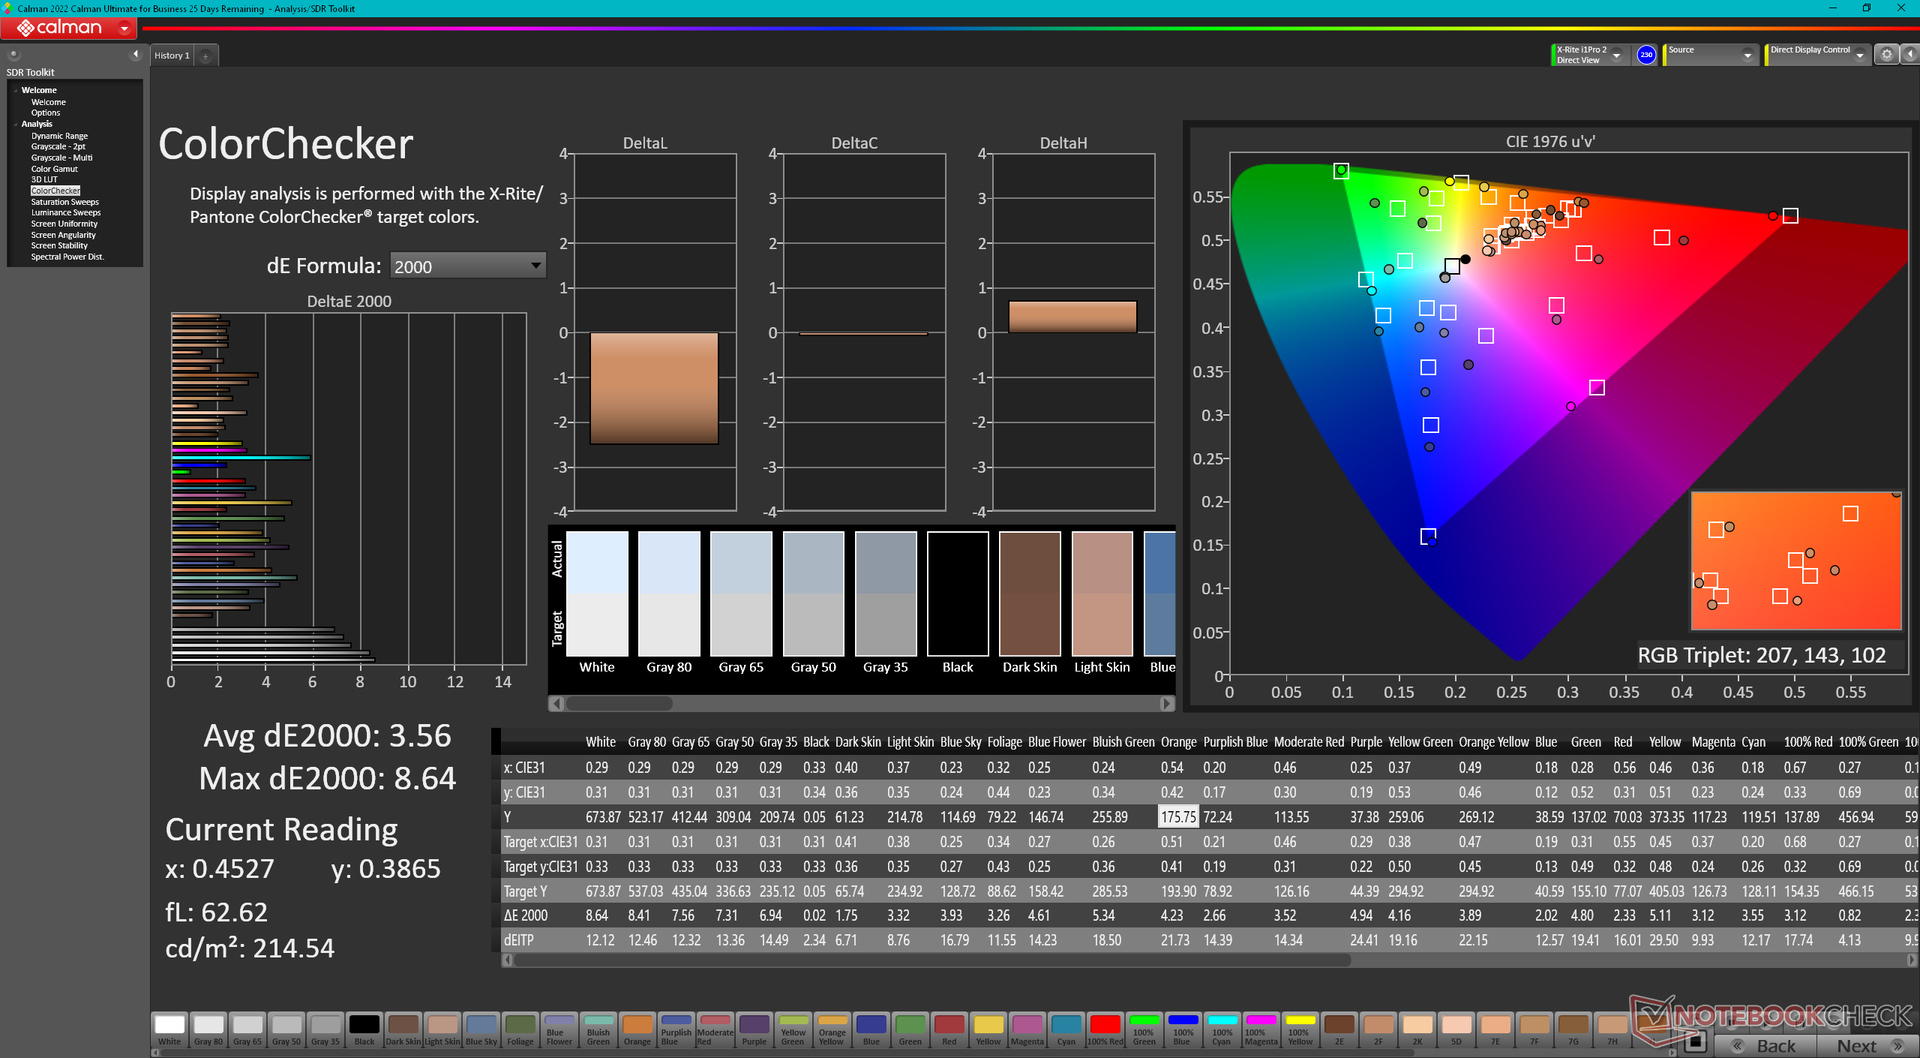
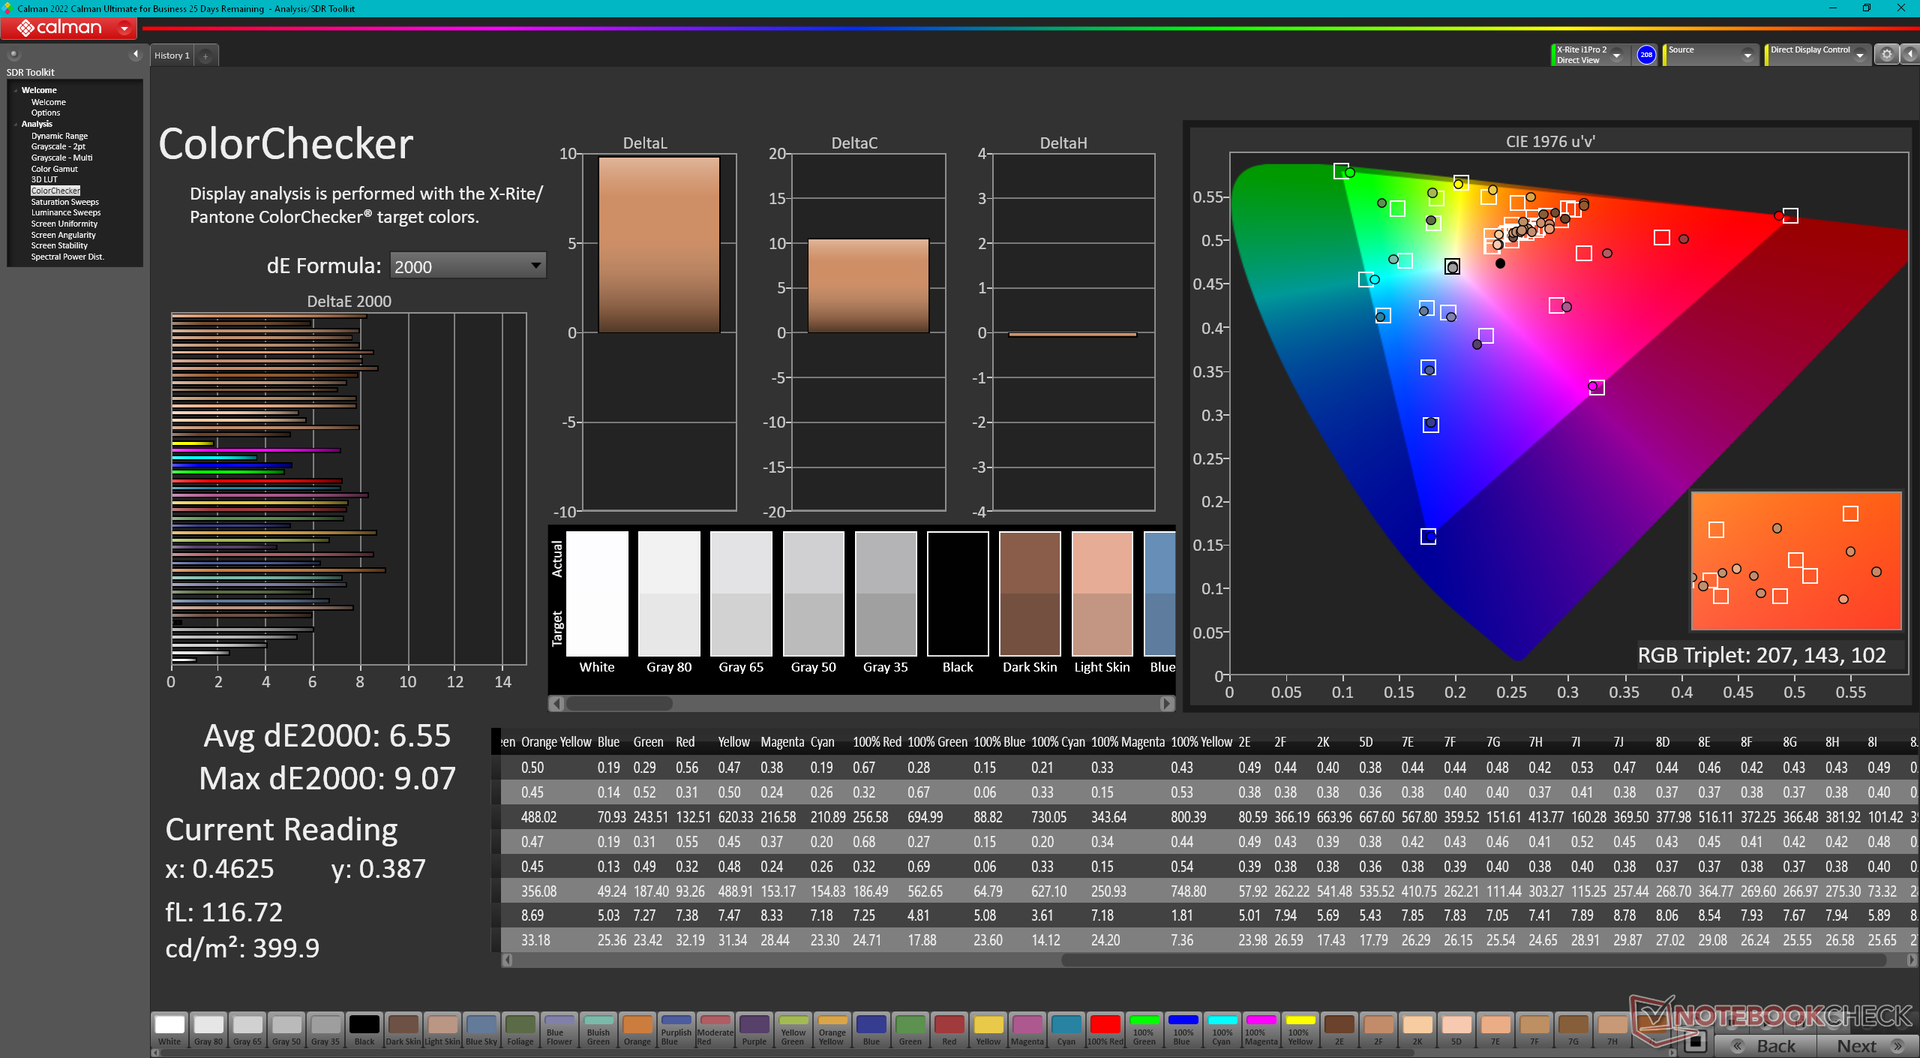
ΔE Color 3.56 | 0.5-29.43 Ø4.87, calibrated: 2.69
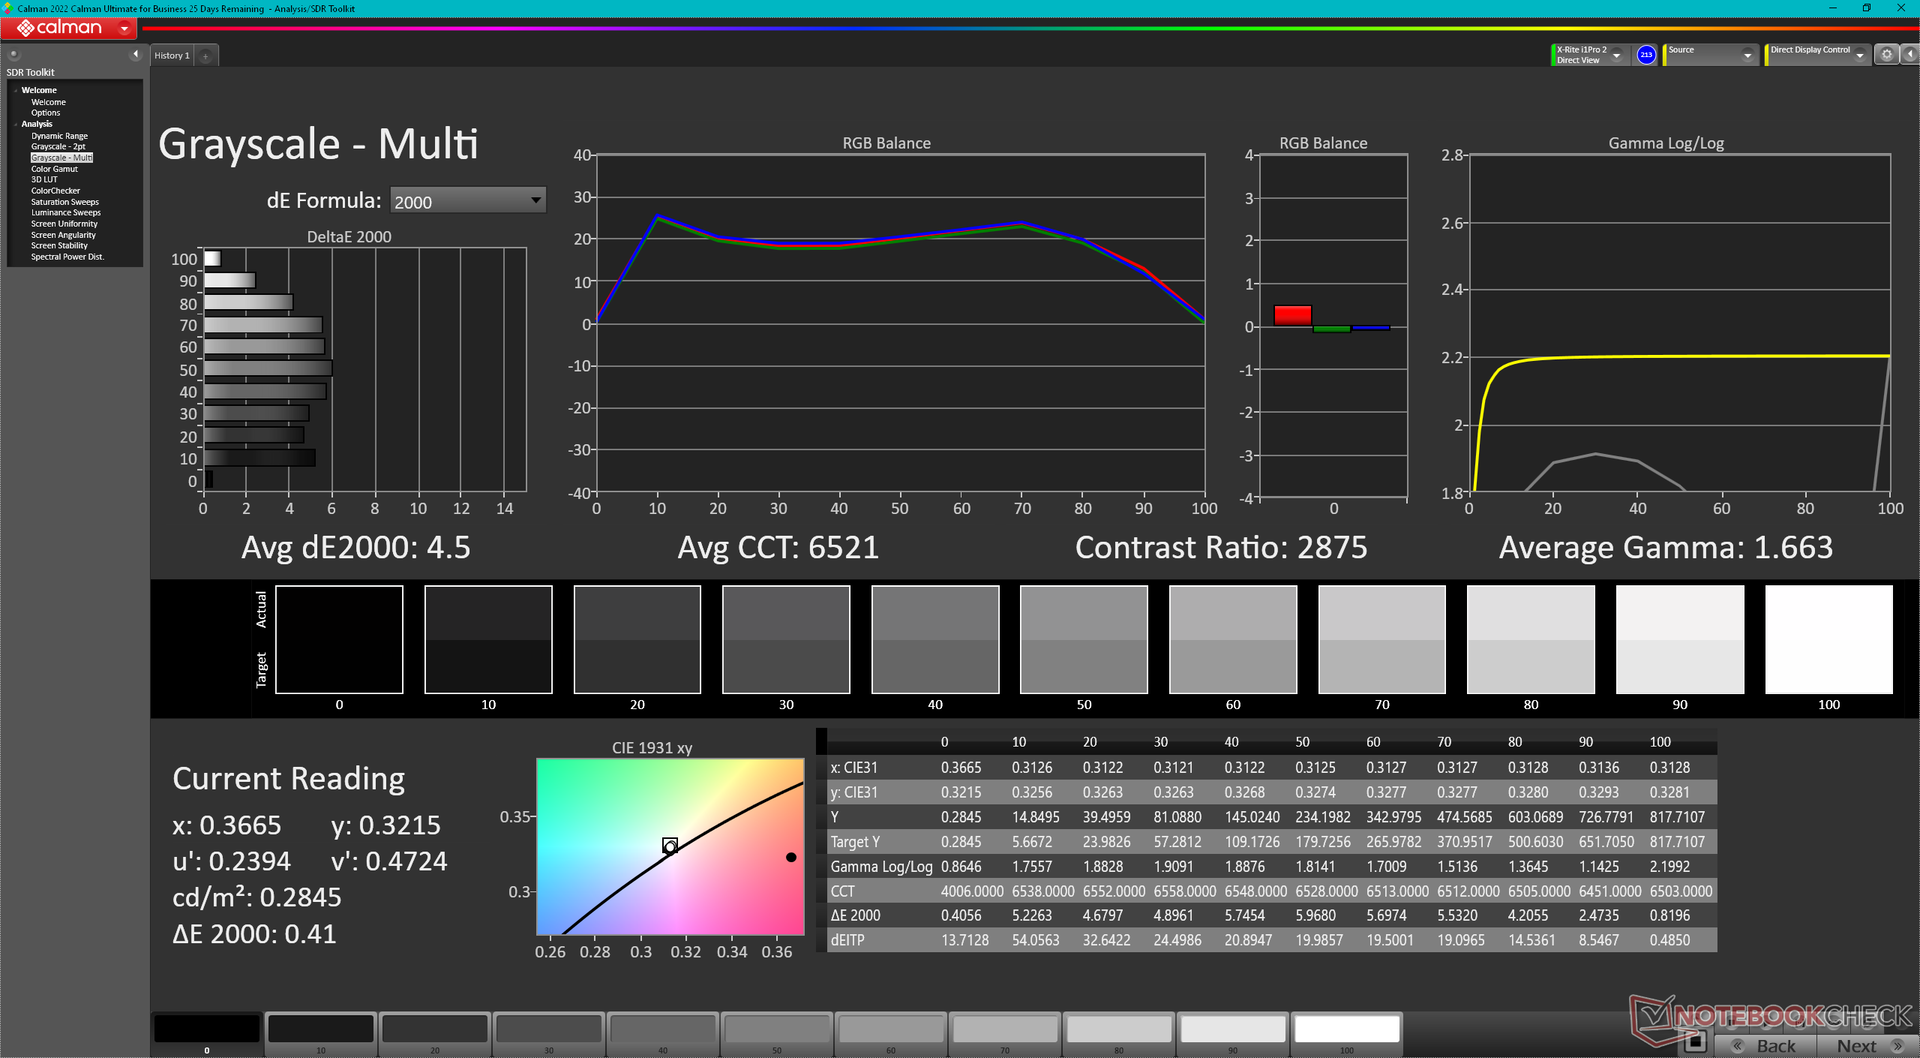
ΔE Greyscale 5.6 | 0.5-98 Ø5.1
84.8% AdobeRGB 1998 (Argyll 2.2.0 3D)
99.9% sRGB (Argyll 2.2.0 3D)
96.6% Display P3 (Argyll 2.2.0 3D)
Gamma: 2.34
| MSI Raider 18 HX A14V AU Optronics B180ZAN1.0, Mini-LED, 3840x2400, 18", 120 Hz | Razer Blade 18 2024 RZ09-0509 BOE NE180QDM-NM1, Mini-LED, 2560x1600, 18", 300 Hz | Alienware m18 R2 BOE NE18NZ1, IPS, 2560x1600, 18", 165 Hz | MSI Titan 18 HX A14VIG AU Optronics B180ZAN01.0, Mini-LED, 3840x2400, 18", 120 Hz | Asus ROG Strix G18 G814JI NE180QDM-NZ2 (BOE0B35), IPS, 2560x1600, 18", 240 Hz | Acer Predator Helios 18 PH18-72-98MW B180QAN01.2 (AUO45A8), Mini-LED, 2560x1600, 18", 250 Hz | |
|---|---|---|---|---|---|---|
| Display | 1% | 2% | 1% | 1% | 4% | |
| Display P3 Coverage | 96.6 | 99 2% | 97.8 1% | 98.1 2% | 98.1 2% | 99.7 3% |
| sRGB Coverage | 99.9 | 100 0% | 99.5 0% | 99.8 0% | 99.9 0% | 100 0% |
| AdobeRGB 1998 Coverage | 84.8 | 86.9 2% | 88.9 5% | 86.2 2% | 85.6 1% | 91.6 8% |
| Response Times | 341% | 68% | 3% | 67% | 62% | |
| Response Time Grey 50% / Grey 80% * | 10.4 ? | 7.6 ? 27% | 5.3 ? 49% | 8.6 ? 17% | 5.6 ? 46% | 8 ? 23% |
| Response Time Black / White * | 75.8 ? | 14 ? 82% | 10.4 ? 86% | 81.8 ? -8% | 9 ? 88% | 17.6 ? 77% |
| PWM Frequency | 2606.2 ? | 26444 ? 915% | 2592 ? -1% | 4832 ? 85% | ||
| Screen | 29% | 8% | 2% | 23% | 24% | |
| Brightness middle | 575.7 | 605.4 5% | 271.8 -53% | 467.5 -19% | 471 -18% | 722 25% |
| Brightness | 574 | 600 5% | 275 -52% | 459 -20% | 422 -26% | 724 26% |
| Brightness Distribution | 94 | 97 3% | 78 -17% | 90 -4% | 83 -12% | 93 -1% |
| Black Level * | 0.62 | 0.27 | 0.47 | 0.04 | ||
| Colorchecker dE 2000 * | 3.56 | 1.53 57% | 2.48 30% | 3.77 -6% | 2.05 42% | 3.4 4% |
| Colorchecker dE 2000 max. * | 8.64 | 4.15 52% | 5.59 35% | 6.12 29% | 4.15 52% | 5.32 38% |
| Colorchecker dE 2000 calibrated * | 2.69 | 0.56 79% | 2.94 -9% | 0.8 70% | 1.6 41% | |
| Greyscale dE 2000 * | 5.6 | 2.6 54% | 3.7 34% | 3.2 43% | 2.8 50% | 3.8 32% |
| Gamma | 2.34 94% | 2.22 99% | 2.2 100% | 2.43 91% | 2.204 100% | 2.383 92% |
| CCT | 7872 83% | 6843 95% | 6355 102% | 6478 100% | 7122 91% | 7051 92% |
| Contrast | 976 | 1007 | 1002 | 18050 | ||
| Całkowita średnia (program / ustawienia) | 124% /
100% | 26% /
16% | 2% /
2% | 30% /
25% | 30% /
28% |
* ... im mniej tym lepiej
Temperatura kolorów po ustawieniu Display P3 i wyłączeniu HDR jest dość chłodna i wynosi 7872. Włączenie HDR automatycznie wyłącza wszelkie ustawienia MSI TrueColor, ale temperatura kolorów również automatycznie staje się cieplejsza przy 6521, aby uzyskać dokładniejsze kolory. MSI nie reklamuje fabrycznej kalibracji dla tego modelu Raider.
Wyświetl czasy reakcji
| ↔ Czas reakcji od czerni do bieli | ||
|---|---|---|
| 75.8 ms ... wzrost ↗ i spadek ↘ łącznie | ↗ 71 ms wzrost | 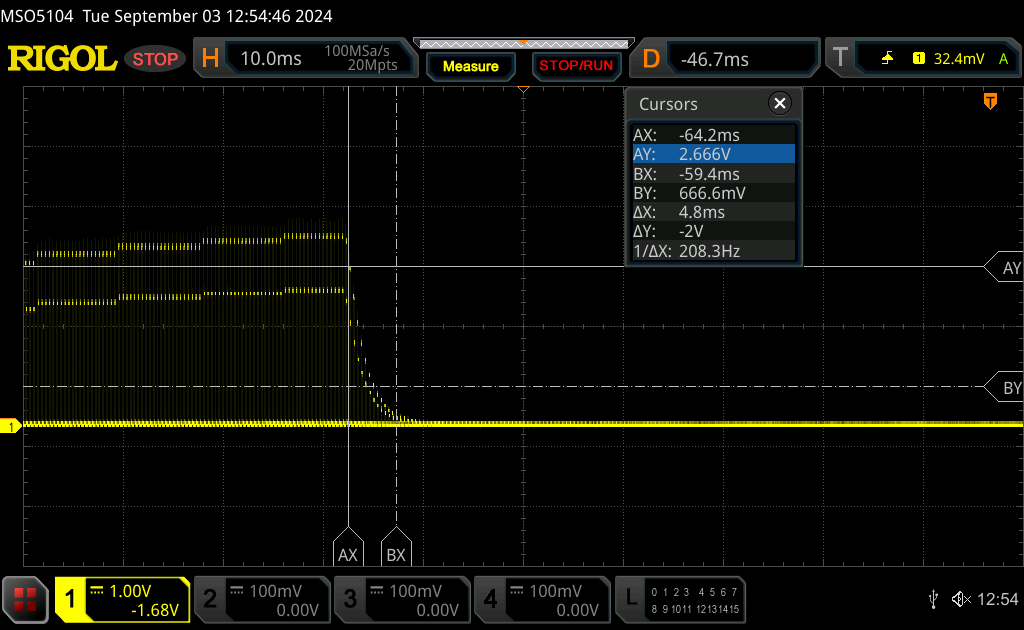 |
| ↘ 4.8 ms upadek | ||
| W naszych testach ekran wykazuje powolne tempo reakcji, co będzie niezadowalające dla graczy. Dla porównania, wszystkie testowane urządzenia wahają się od 0.1 (minimum) do 240 (maksimum) ms. » 100 % wszystkich urządzeń jest lepszych. Oznacza to, że zmierzony czas reakcji jest gorszy od średniej wszystkich testowanych urządzeń (20.8 ms). | ||
| ↔ Czas reakcji 50% szarości do 80% szarości | ||
| 10.4 ms ... wzrost ↗ i spadek ↘ łącznie | ↗ 4.8 ms wzrost | 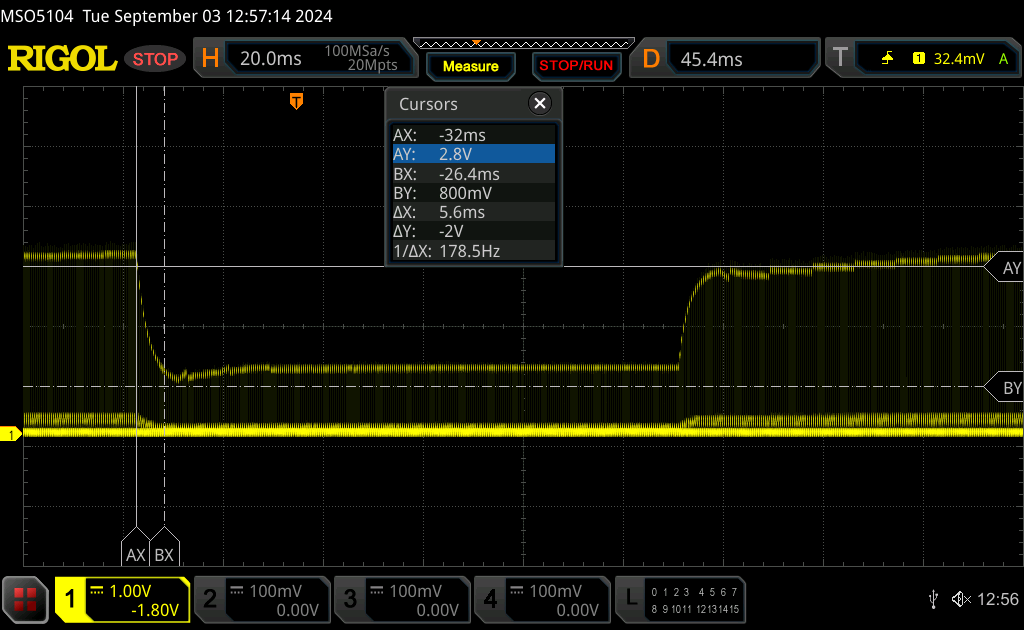 |
| ↘ 5.6 ms upadek | ||
| W naszych testach ekran wykazuje dobry współczynnik reakcji, ale może być zbyt wolny dla graczy rywalizujących ze sobą. Dla porównania, wszystkie testowane urządzenia wahają się od 0.165 (minimum) do 636 (maksimum) ms. » 21 % wszystkich urządzeń jest lepszych. Oznacza to, że zmierzony czas reakcji jest lepszy od średniej wszystkich testowanych urządzeń (32.5 ms). | ||
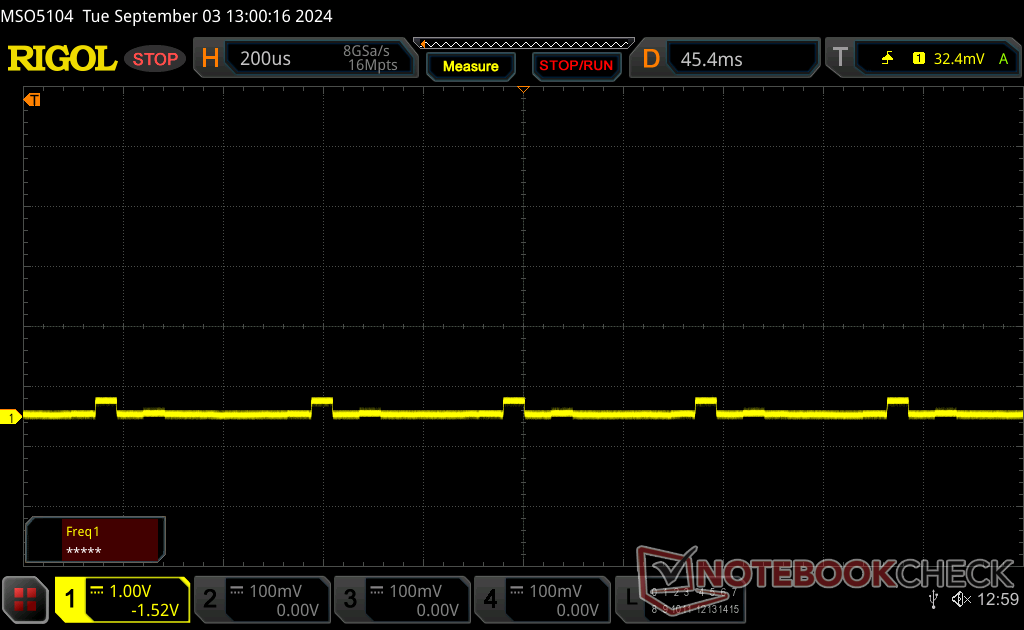
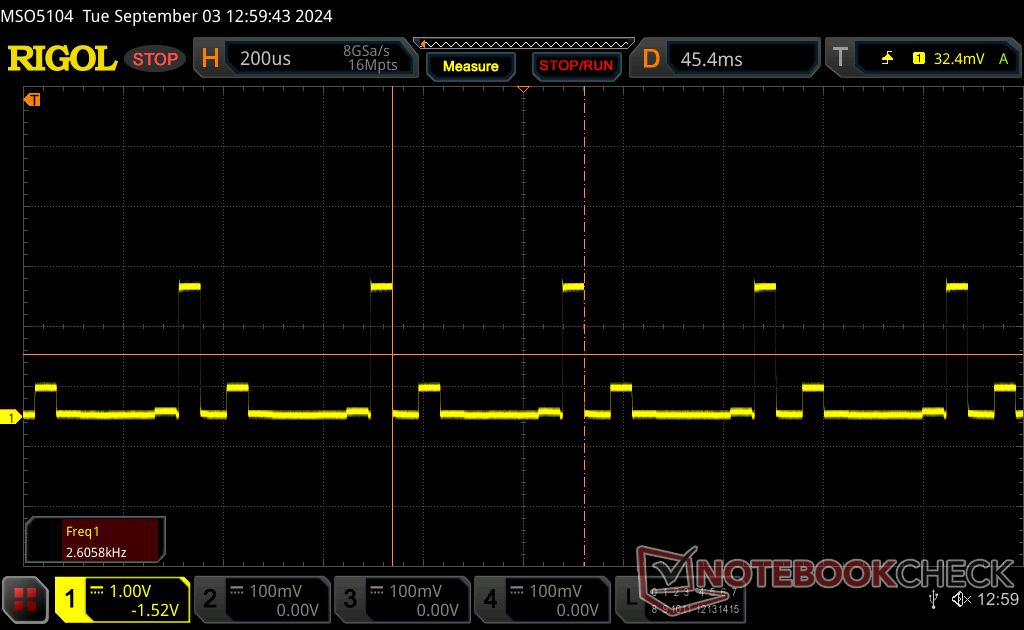
Migotanie ekranu / PWM (modulacja szerokości impulsu)
| Wykryto migotanie ekranu/wykryto PWM | 2606.2 Hz Amplitude: 90 % | ≤ 100 % ustawienia jasności | 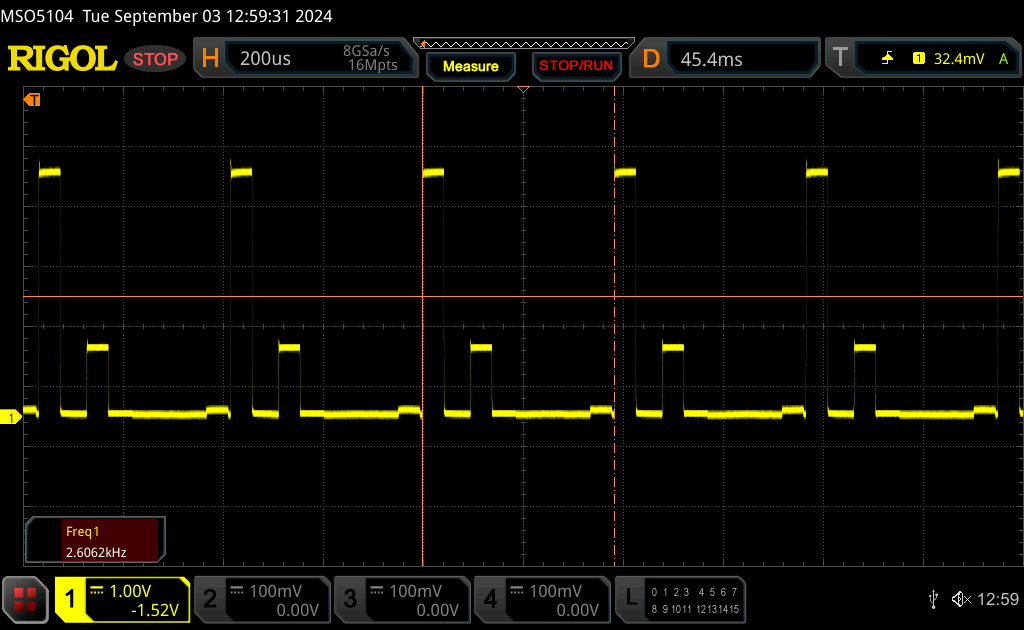 |
Podświetlenie wyświetlacza miga z częstotliwością 2606.2 Hz (najgorszy przypadek, np. przy użyciu PWM) Wykryto migotanie przy ustawieniu jasności 100 % i poniżej. Powyżej tego ustawienia jasności nie powinno być żadnego migotania ani PWM. Częstotliwość 2606.2 Hz jest dość wysoka, więc większość użytkowników wrażliwych na PWM nie powinna zauważyć żadnego migotania. Dla porównania: 53 % wszystkich testowanych urządzeń nie używa PWM do przyciemniania wyświetlacza. Jeśli wykryto PWM, zmierzono średnio 8516 (minimum: 5 - maksimum: 343500) Hz. | |||


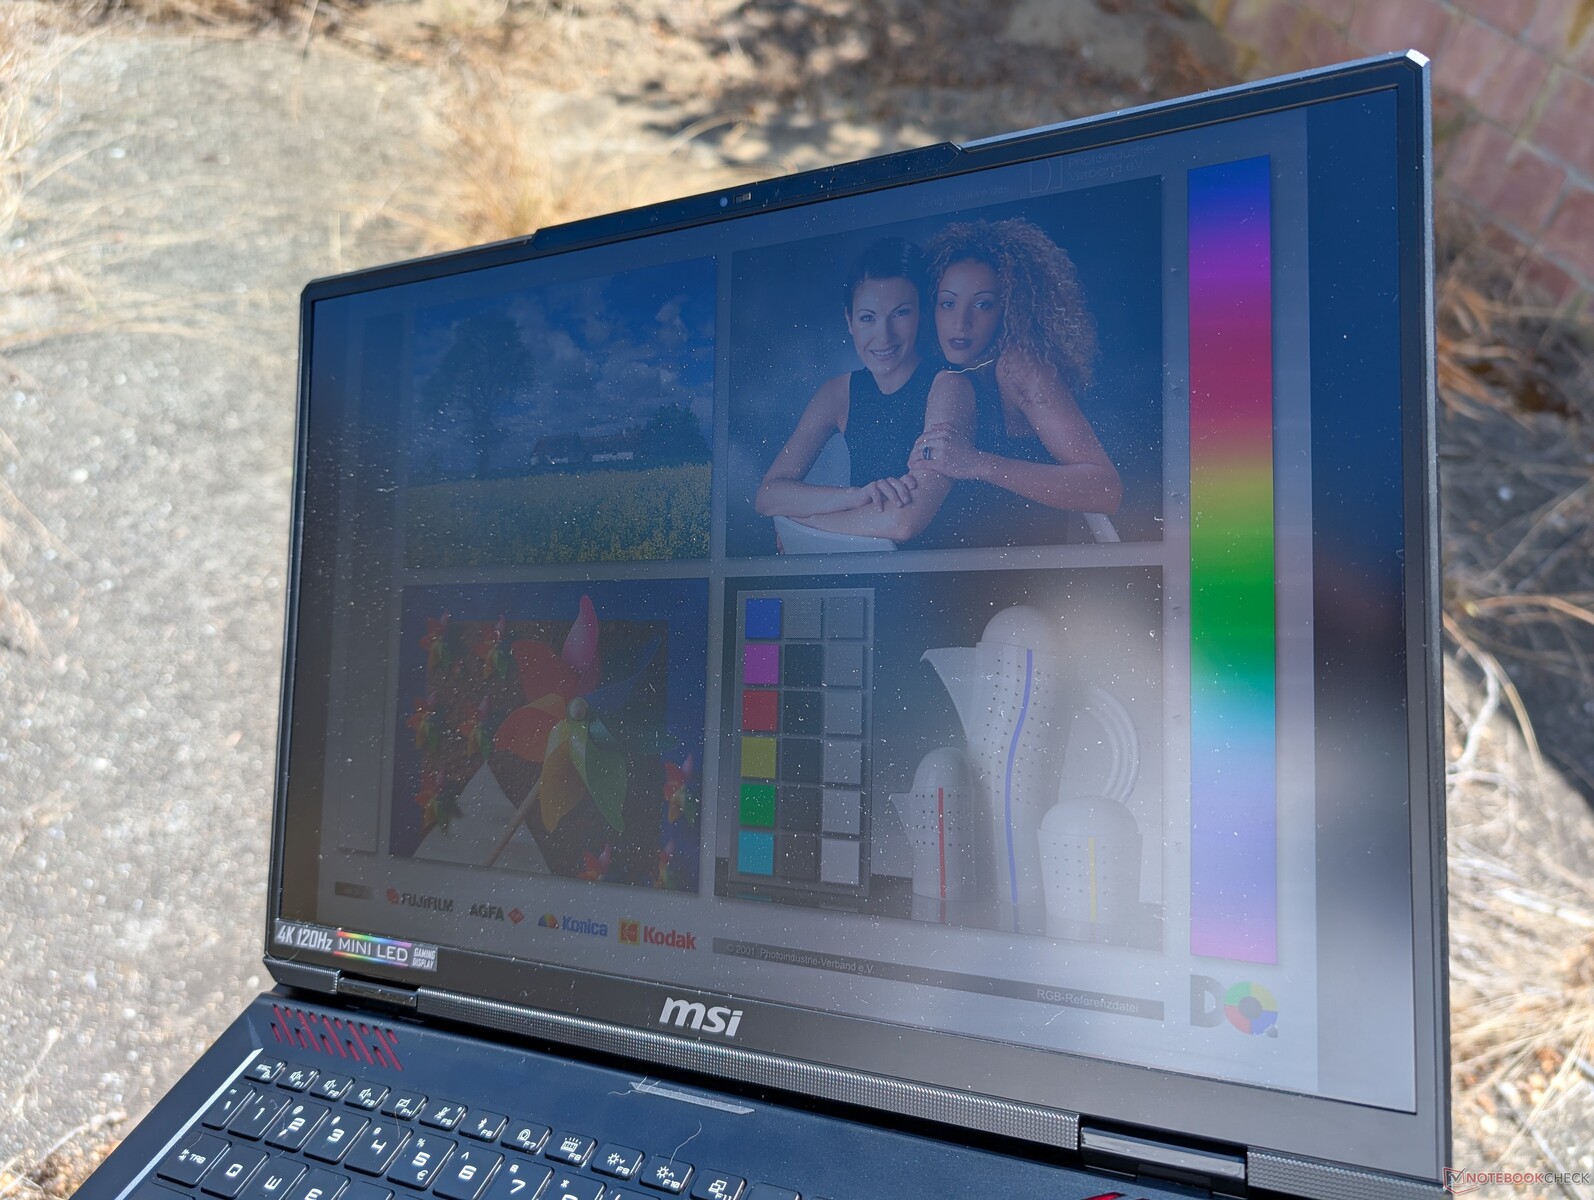
Widoczność na zewnątrz jest tylko przyzwoita w cieniu i niezbyt dobra w świetle słonecznym. Praca na zasilaniu bateryjnym zmniejsza maksymalną jasność do zaledwie 392 nitów, a Windows HDR zostaje automatycznie wyłączony.
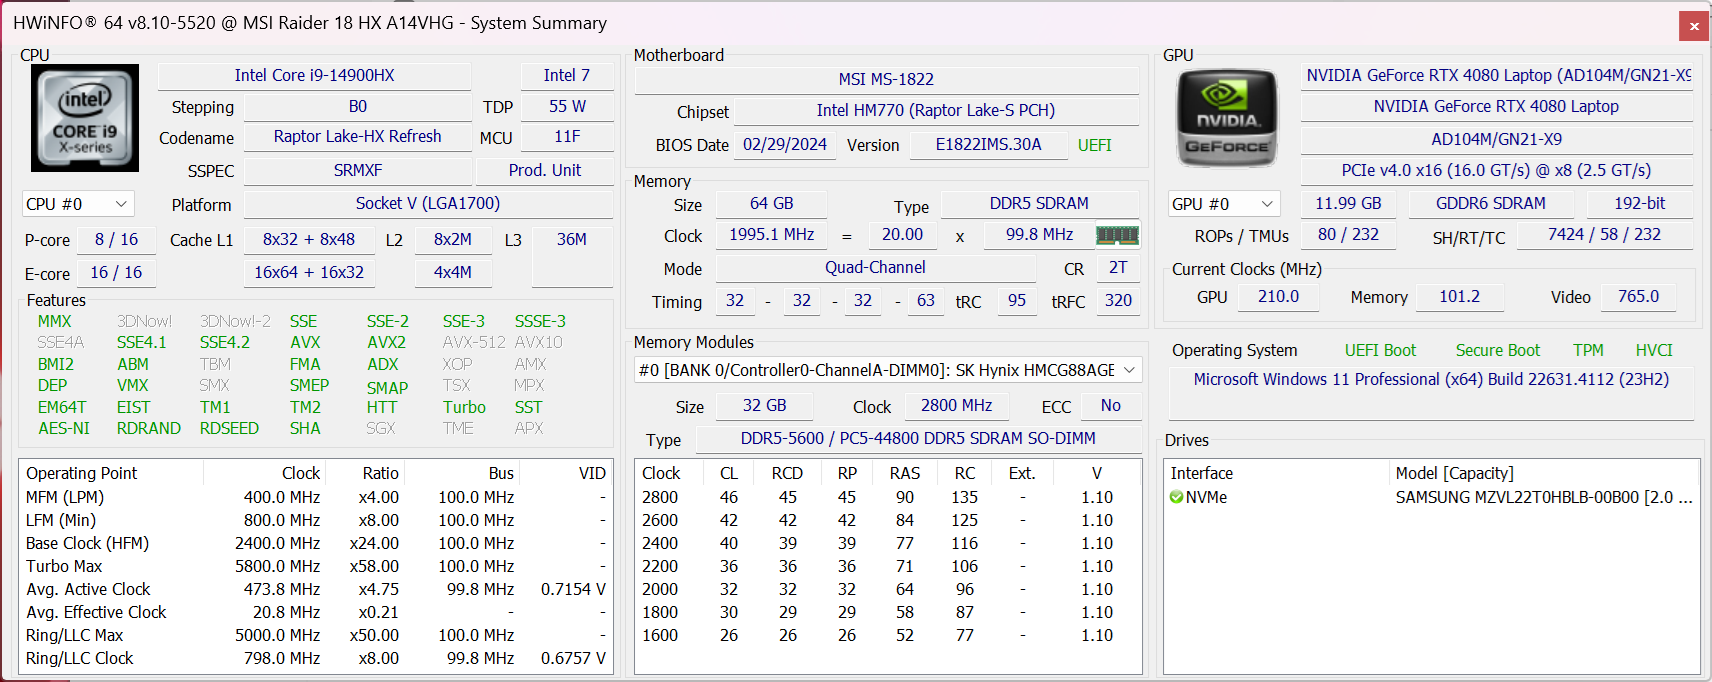
Wydajność - nowa nazwa procesora, ta sama wydajność procesora
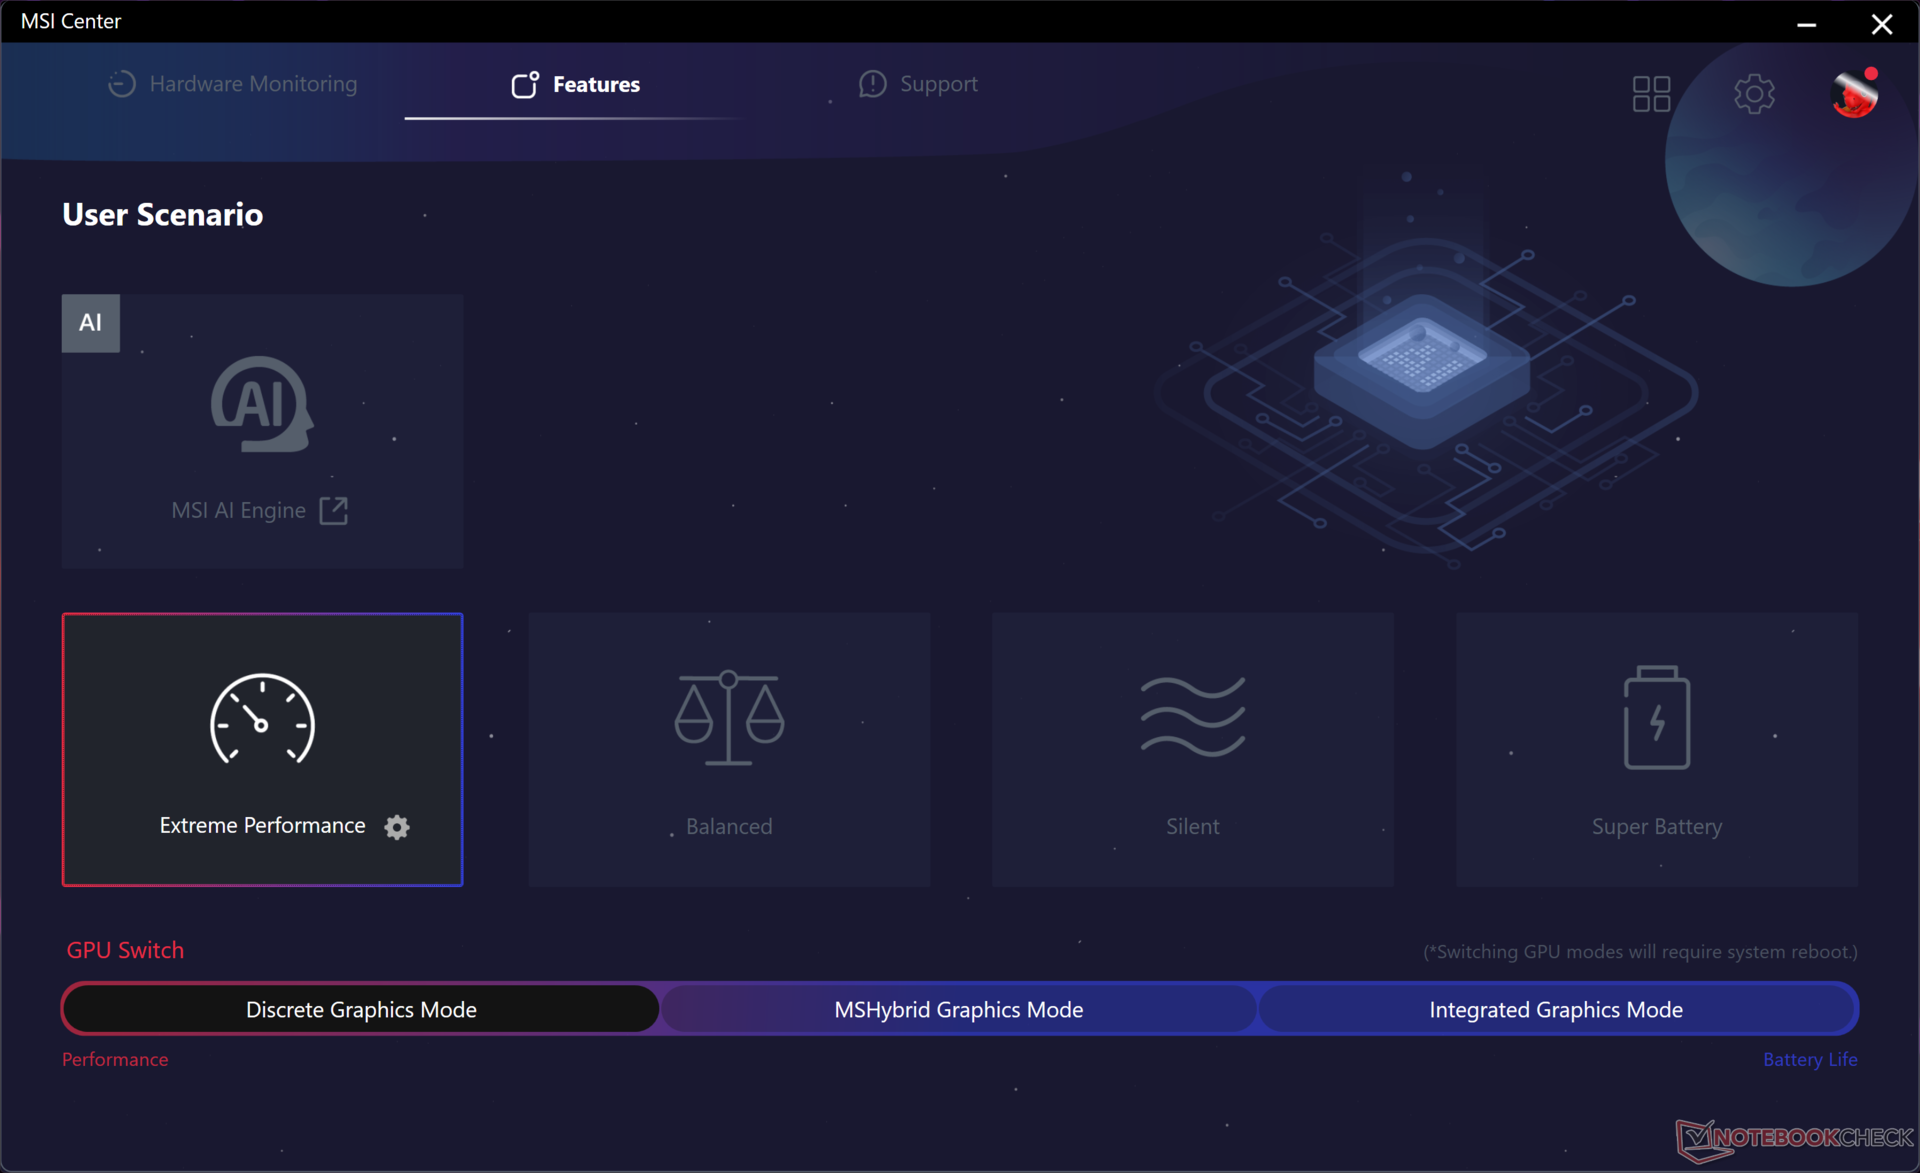
Warunki testowania
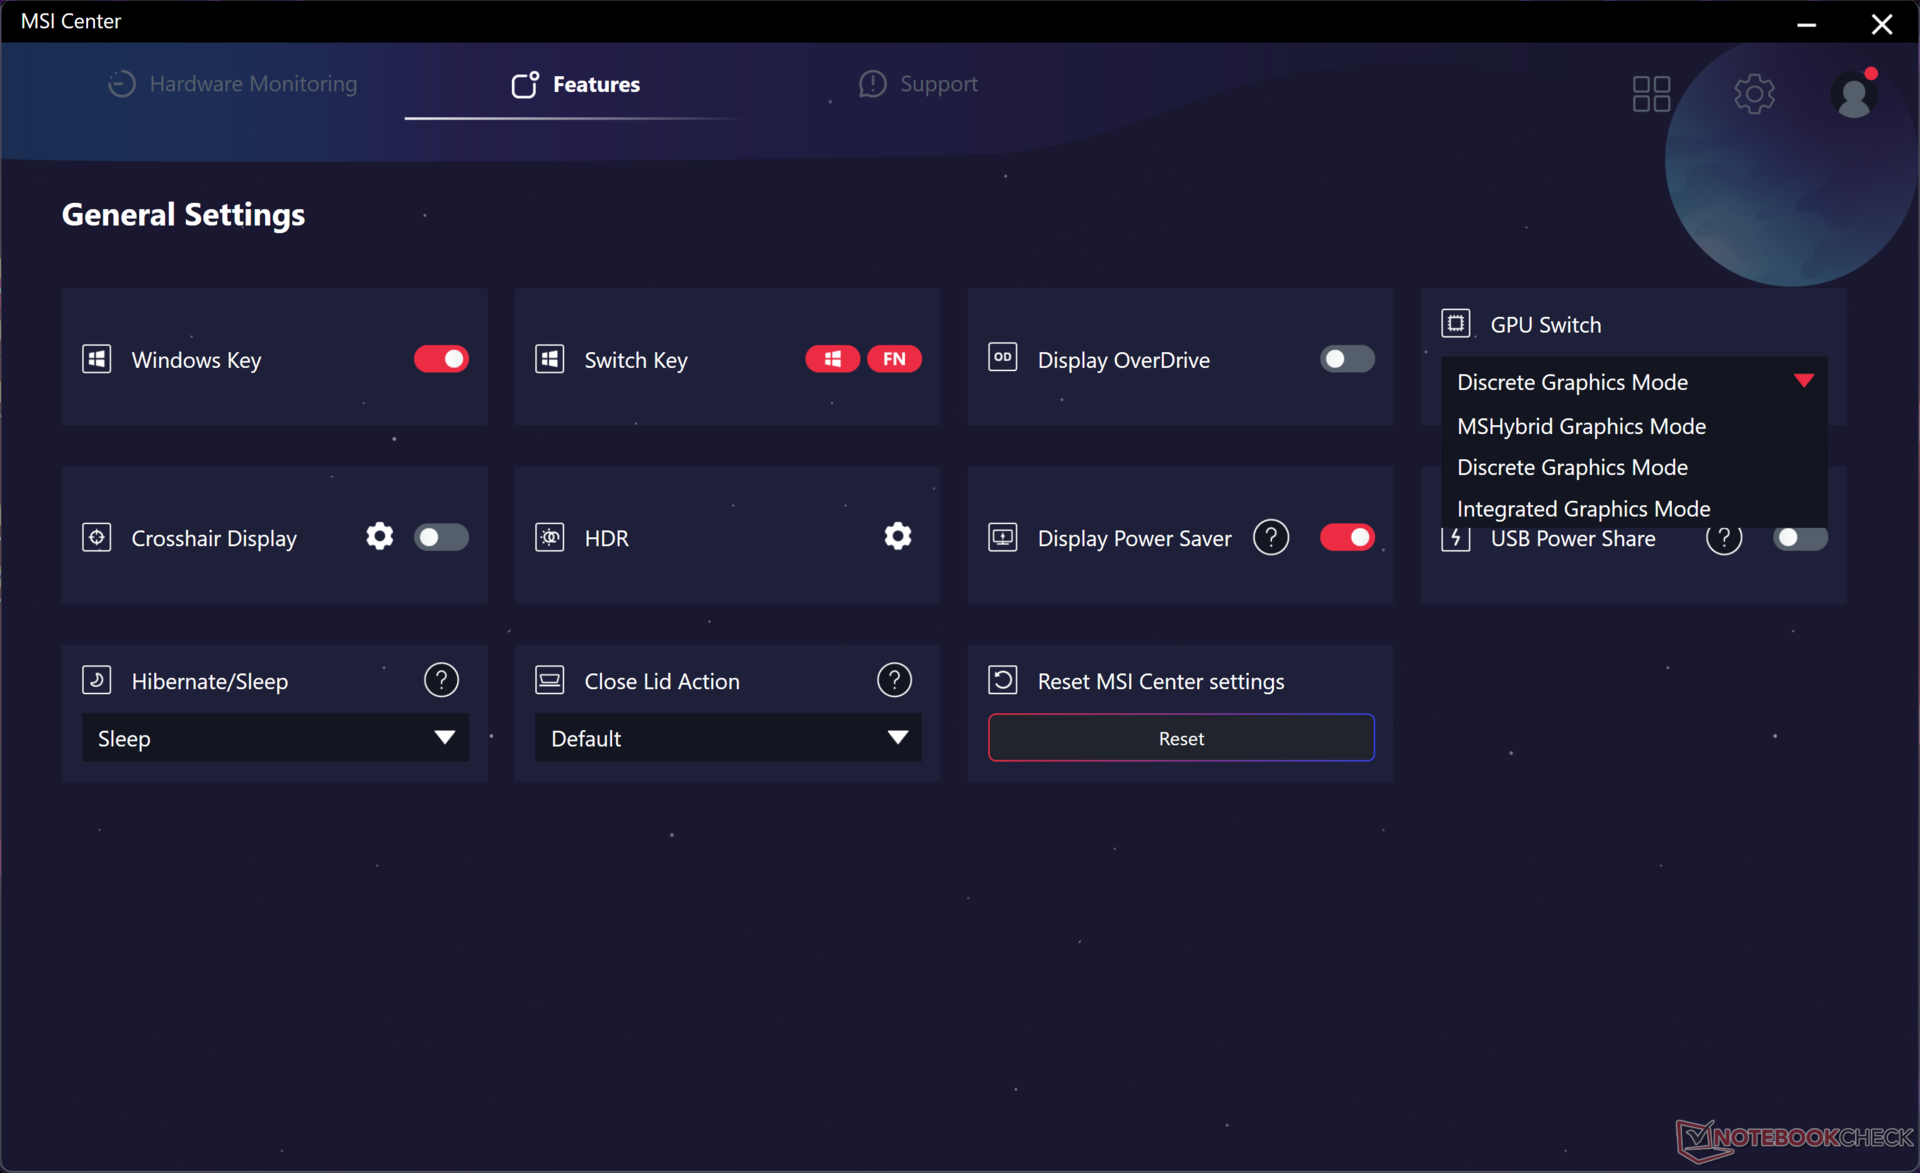
Przed przeprowadzeniem poniższych testów porównawczych ustawiliśmy GPU na tryb dyskretnej grafiki, Windows na tryb wydajności, a MSI Center na tryb ekstremalnej wydajności. Tryb Cooler Boost (tj. tryb maksymalnego wentylatora) jest kolejnym ustawieniem w trybie Ekstremalnej wydajności, ale opcja ta nie jest generalnie potrzebna do uzyskania maksymalnej wydajności, jak pokażą nasze wyniki. Jest to zgodne z naszymi doświadczeniami z innymi laptopami MSI, które posiadają tę samą funkcję Cooler Boost.
MUX jest obsługiwany do przełączania między trybami dGPU, iGPU i MSHybrid, ale Advanced Optimus nie jest tak jak w Titan 18 HX. Rzeczywiście, kluczową wadą panelu mini-LED 4K jest brak obsługi G-Sync.
Procesor
Procesor Core i9-14900HX jest jedynie rebrandowanym Core i9-13900HX więc w najlepszym przypadku zapewnia jedynie marginalne korzyści. Mimo to pozostaje jednym z najszybszych procesorów dostępnych w laptopach, jeśli chodzi o tradycyjne wskaźniki wydajności, takie jak CineBench lub renderowanie w Blenderze. Procesor uzupełnia Meteor Lake Core Ultra 9 185H który wymienia część surowej wydajności na zintegrowaną jednostkę NPU w celu przyspieszenia zadań AI.
Zrównoważona wydajność jest doskonała, bez większych spadków częstotliwości taktowania po obciążeniu, w przeciwieństwie do tego, co zaobserwowaliśmy na Acer Predator Helios 18 wyposażonym w ten sam procesor Core i9-14900HX.
Przełączając się na oparty na AMD Ryzen 9 7945HX zwiększy wydajność wielowątkową o około 10 do 15 procent, jednocześnie obniżając wydajność jednowątkową o 10 do 15 procent.
Cinebench R15 Multi Loop
Cinebench R23: Multi Core | Single Core
Cinebench R20: CPU (Multi Core) | CPU (Single Core)
Cinebench R15: CPU Multi 64Bit | CPU Single 64Bit
Blender: v2.79 BMW27 CPU
7-Zip 18.03: 7z b 4 | 7z b 4 -mmt1
Geekbench 6.4: Multi-Core | Single-Core
Geekbench 5.5: Multi-Core | Single-Core
HWBOT x265 Benchmark v2.2: 4k Preset
LibreOffice : 20 Documents To PDF
R Benchmark 2.5: Overall mean
| CPU Performance Rating | |
| Alienware m18 R1 AMD | |
| Alienware m18 R2 | |
| MSI Raider 18 HX A14V | |
| MSI Raider GE68HX 13VF | |
| Alienware m18 R1 -2! | |
| MSI Titan 18 HX A14VIG | |
| Acer Predator Helios 18 N23Q2 | |
| Przeciętny Intel Core i9-14900HX | |
| Alienware m16 R1 AMD | |
| Asus ROG Zephyrus G16 GA605WV | |
| Lenovo Legion Pro 5 16ARX8 -2! | |
| Asus TUF Gaming A15 FA507UV | |
| Asus ROG Strix G18 G814JI -2! | |
| Lenovo Legion Slim 7 16APH8 | |
| Alienware x16 R2 P120F | |
| Lenovo Legion S7 16ARHA7 -2! | |
| Cinebench R23 / Multi Core | |
| Alienware m18 R1 AMD | |
| Alienware m18 R1 | |
| MSI Titan 18 HX A14VIG | |
| Alienware m18 R2 | |
| MSI Raider GE68HX 13VF | |
| Acer Predator Helios 18 N23Q2 | |
| MSI Raider 18 HX A14V | |
| Przeciętny Intel Core i9-14900HX (17078 - 36249, n=37) | |
| Alienware m16 R1 AMD | |
| Asus ROG Zephyrus G16 GA605WV | |
| Asus ROG Strix G18 G814JI | |
| Alienware x16 R2 P120F | |
| Lenovo Legion Pro 5 16ARX8 | |
| Asus TUF Gaming A15 FA507UV | |
| Lenovo Legion Slim 7 16APH8 | |
| Lenovo Legion S7 16ARHA7 | |
| Cinebench R23 / Single Core | |
| Alienware m18 R2 | |
| MSI Raider 18 HX A14V | |
| Przeciętny Intel Core i9-14900HX (1720 - 2245, n=37) | |
| MSI Titan 18 HX A14VIG | |
| Alienware m18 R1 | |
| MSI Raider GE68HX 13VF | |
| Acer Predator Helios 18 N23Q2 | |
| Asus ROG Zephyrus G16 GA605WV | |
| Alienware m18 R1 AMD | |
| Asus ROG Strix G18 G814JI | |
| Alienware m16 R1 AMD | |
| Lenovo Legion Pro 5 16ARX8 | |
| Asus TUF Gaming A15 FA507UV | |
| Lenovo Legion Slim 7 16APH8 | |
| Alienware x16 R2 P120F | |
| Lenovo Legion S7 16ARHA7 | |
| Cinebench R20 / CPU (Multi Core) | |
| Alienware m18 R1 AMD | |
| Alienware m18 R1 | |
| MSI Titan 18 HX A14VIG | |
| MSI Raider GE68HX 13VF | |
| Alienware m18 R2 | |
| Acer Predator Helios 18 N23Q2 | |
| MSI Raider 18 HX A14V | |
| Przeciętny Intel Core i9-14900HX (6579 - 13832, n=37) | |
| Alienware m16 R1 AMD | |
| Asus ROG Zephyrus G16 GA605WV | |
| Asus ROG Strix G18 G814JI | |
| Alienware x16 R2 P120F | |
| Lenovo Legion Pro 5 16ARX8 | |
| Asus TUF Gaming A15 FA507UV | |
| Lenovo Legion Slim 7 16APH8 | |
| Lenovo Legion S7 16ARHA7 | |
| Cinebench R20 / CPU (Single Core) | |
| MSI Raider 18 HX A14V | |
| Alienware m18 R2 | |
| Przeciętny Intel Core i9-14900HX (657 - 859, n=37) | |
| MSI Titan 18 HX A14VIG | |
| Alienware m18 R1 | |
| Acer Predator Helios 18 N23Q2 | |
| MSI Raider GE68HX 13VF | |
| Asus ROG Zephyrus G16 GA605WV | |
| Alienware m18 R1 AMD | |
| Asus ROG Strix G18 G814JI | |
| Alienware m16 R1 AMD | |
| Lenovo Legion Pro 5 16ARX8 | |
| Lenovo Legion Slim 7 16APH8 | |
| Asus TUF Gaming A15 FA507UV | |
| Lenovo Legion S7 16ARHA7 | |
| Alienware x16 R2 P120F | |
| Cinebench R15 / CPU Multi 64Bit | |
| Alienware m18 R1 AMD | |
| Alienware m18 R1 | |
| Alienware m18 R2 | |
| MSI Titan 18 HX A14VIG | |
| MSI Raider 18 HX A14V | |
| MSI Raider GE68HX 13VF | |
| Acer Predator Helios 18 N23Q2 | |
| Przeciętny Intel Core i9-14900HX (3263 - 5589, n=38) | |
| Alienware m16 R1 AMD | |
| Asus ROG Zephyrus G16 GA605WV | |
| Asus ROG Strix G18 G814JI | |
| Lenovo Legion Pro 5 16ARX8 | |
| Alienware x16 R2 P120F | |
| Asus TUF Gaming A15 FA507UV | |
| Lenovo Legion Slim 7 16APH8 | |
| Lenovo Legion S7 16ARHA7 | |
| Cinebench R15 / CPU Single 64Bit | |
| Alienware m18 R2 | |
| MSI Raider 18 HX A14V | |
| Alienware m18 R1 AMD | |
| Przeciętny Intel Core i9-14900HX (247 - 323, n=37) | |
| Alienware m18 R1 | |
| Asus ROG Zephyrus G16 GA605WV | |
| MSI Titan 18 HX A14VIG | |
| MSI Raider GE68HX 13VF | |
| Alienware m16 R1 AMD | |
| Acer Predator Helios 18 N23Q2 | |
| Lenovo Legion Pro 5 16ARX8 | |
| Asus TUF Gaming A15 FA507UV | |
| Asus ROG Strix G18 G814JI | |
| Lenovo Legion Slim 7 16APH8 | |
| Lenovo Legion S7 16ARHA7 | |
| Alienware x16 R2 P120F | |
| Blender / v2.79 BMW27 CPU | |
| Lenovo Legion S7 16ARHA7 | |
| Lenovo Legion Slim 7 16APH8 | |
| Asus TUF Gaming A15 FA507UV | |
| Alienware x16 R2 P120F | |
| Lenovo Legion Pro 5 16ARX8 | |
| Asus ROG Strix G18 G814JI | |
| Asus ROG Zephyrus G16 GA605WV | |
| Przeciętny Intel Core i9-14900HX (91 - 206, n=37) | |
| Alienware m16 R1 AMD | |
| MSI Raider GE68HX 13VF | |
| Acer Predator Helios 18 N23Q2 | |
| MSI Raider 18 HX A14V | |
| MSI Titan 18 HX A14VIG | |
| Alienware m18 R2 | |
| Alienware m18 R1 | |
| Alienware m18 R1 AMD | |
| 7-Zip 18.03 / 7z b 4 -mmt1 | |
| Alienware m18 R1 AMD | |
| Lenovo Legion Pro 5 16ARX8 | |
| Alienware m18 R2 | |
| Przeciętny Intel Core i9-14900HX (5452 - 7545, n=37) | |
| Alienware m16 R1 AMD | |
| Acer Predator Helios 18 N23Q2 | |
| Alienware m18 R1 | |
| MSI Raider GE68HX 13VF | |
| Asus TUF Gaming A15 FA507UV | |
| Lenovo Legion Slim 7 16APH8 | |
| MSI Raider 18 HX A14V | |
| MSI Titan 18 HX A14VIG | |
| Asus ROG Zephyrus G16 GA605WV | |
| Asus ROG Strix G18 G814JI | |
| Lenovo Legion S7 16ARHA7 | |
| Alienware x16 R2 P120F | |
| Geekbench 5.5 / Multi-Core | |
| Alienware m18 R1 | |
| MSI Raider GE68HX 13VF | |
| Alienware m18 R2 | |
| Acer Predator Helios 18 N23Q2 | |
| MSI Raider 18 HX A14V | |
| Alienware m18 R1 AMD | |
| Przeciętny Intel Core i9-14900HX (8618 - 23194, n=37) | |
| MSI Titan 18 HX A14VIG | |
| Alienware m16 R1 AMD | |
| Asus ROG Zephyrus G16 GA605WV | |
| Asus ROG Strix G18 G814JI | |
| Alienware x16 R2 P120F | |
| Lenovo Legion Pro 5 16ARX8 | |
| Asus TUF Gaming A15 FA507UV | |
| Lenovo Legion Slim 7 16APH8 | |
| Lenovo Legion S7 16ARHA7 | |
| Geekbench 5.5 / Single-Core | |
| Alienware m18 R2 | |
| MSI Raider 18 HX A14V | |
| Alienware m18 R1 AMD | |
| Asus ROG Zephyrus G16 GA605WV | |
| MSI Titan 18 HX A14VIG | |
| Przeciętny Intel Core i9-14900HX (1669 - 2210, n=37) | |
| Alienware m18 R1 | |
| MSI Raider GE68HX 13VF | |
| Acer Predator Helios 18 N23Q2 | |
| Lenovo Legion Pro 5 16ARX8 | |
| Alienware m16 R1 AMD | |
| Asus TUF Gaming A15 FA507UV | |
| Lenovo Legion Slim 7 16APH8 | |
| Asus ROG Strix G18 G814JI | |
| Alienware x16 R2 P120F | |
| Lenovo Legion S7 16ARHA7 | |
| HWBOT x265 Benchmark v2.2 / 4k Preset | |
| Alienware m18 R1 AMD | |
| Alienware m18 R1 | |
| MSI Raider 18 HX A14V | |
| Alienware m18 R2 | |
| MSI Raider GE68HX 13VF | |
| MSI Titan 18 HX A14VIG | |
| Acer Predator Helios 18 N23Q2 | |
| Alienware m16 R1 AMD | |
| Przeciętny Intel Core i9-14900HX (16.8 - 38.9, n=37) | |
| Asus ROG Zephyrus G16 GA605WV | |
| Asus ROG Strix G18 G814JI | |
| Lenovo Legion Pro 5 16ARX8 | |
| Asus TUF Gaming A15 FA507UV | |
| Alienware x16 R2 P120F | |
| Lenovo Legion Slim 7 16APH8 | |
| Lenovo Legion S7 16ARHA7 | |
| LibreOffice / 20 Documents To PDF | |
| Lenovo Legion Slim 7 16APH8 | |
| Asus ROG Strix G18 G814JI | |
| Asus ROG Zephyrus G16 GA605WV | |
| Acer Predator Helios 18 N23Q2 | |
| Lenovo Legion S7 16ARHA7 | |
| Asus TUF Gaming A15 FA507UV | |
| Alienware m18 R1 | |
| MSI Titan 18 HX A14VIG | |
| Alienware x16 R2 P120F | |
| Alienware m18 R2 | |
| Przeciętny Intel Core i9-14900HX (19 - 85.1, n=37) | |
| Alienware m18 R1 AMD | |
| Alienware m16 R1 AMD | |
| Lenovo Legion Pro 5 16ARX8 | |
| MSI Raider 18 HX A14V | |
| MSI Raider GE68HX 13VF | |
| R Benchmark 2.5 / Overall mean | |
| Alienware x16 R2 P120F | |
| Lenovo Legion S7 16ARHA7 | |
| Lenovo Legion Slim 7 16APH8 | |
| Asus ROG Strix G18 G814JI | |
| Asus TUF Gaming A15 FA507UV | |
| Alienware m16 R1 AMD | |
| Lenovo Legion Pro 5 16ARX8 | |
| Alienware m18 R1 AMD | |
| Asus ROG Zephyrus G16 GA605WV | |
| Acer Predator Helios 18 N23Q2 | |
| Alienware m18 R1 | |
| MSI Titan 18 HX A14VIG | |
| MSI Raider GE68HX 13VF | |
| Przeciętny Intel Core i9-14900HX (0.3604 - 0.4859, n=37) | |
| MSI Raider 18 HX A14V | |
| Alienware m18 R2 | |
Cinebench R23: Multi Core | Single Core
Cinebench R20: CPU (Multi Core) | CPU (Single Core)
Cinebench R15: CPU Multi 64Bit | CPU Single 64Bit
Blender: v2.79 BMW27 CPU
7-Zip 18.03: 7z b 4 | 7z b 4 -mmt1
Geekbench 6.4: Multi-Core | Single-Core
Geekbench 5.5: Multi-Core | Single-Core
HWBOT x265 Benchmark v2.2: 4k Preset
LibreOffice : 20 Documents To PDF
R Benchmark 2.5: Overall mean
* ... im mniej tym lepiej
AIDA64: FP32 Ray-Trace | FPU Julia | CPU SHA3 | CPU Queen | FPU SinJulia | FPU Mandel | CPU AES | CPU ZLib | FP64 Ray-Trace | CPU PhotoWorxx
| Performance Rating | |
| Alienware m18 R2 | |
| MSI Titan 18 HX A14VIG | |
| MSI Raider 18 HX A14V | |
| Przeciętny Intel Core i9-14900HX | |
| Razer Blade 18 2024 RZ09-0509 | |
| Acer Predator Helios 18 PH18-72-98MW | |
| Asus ROG Strix G18 G814JI | |
| AIDA64 / FP32 Ray-Trace | |
| MSI Titan 18 HX A14VIG | |
| Alienware m18 R2 | |
| MSI Raider 18 HX A14V | |
| Razer Blade 18 2024 RZ09-0509 | |
| Przeciętny Intel Core i9-14900HX (13098 - 33474, n=36) | |
| Acer Predator Helios 18 PH18-72-98MW | |
| Asus ROG Strix G18 G814JI | |
| AIDA64 / FPU Julia | |
| MSI Titan 18 HX A14VIG | |
| Alienware m18 R2 | |
| MSI Raider 18 HX A14V | |
| Razer Blade 18 2024 RZ09-0509 | |
| Przeciętny Intel Core i9-14900HX (67573 - 166040, n=36) | |
| Acer Predator Helios 18 PH18-72-98MW | |
| Asus ROG Strix G18 G814JI | |
| AIDA64 / CPU SHA3 | |
| MSI Titan 18 HX A14VIG | |
| Alienware m18 R2 | |
| MSI Raider 18 HX A14V | |
| Razer Blade 18 2024 RZ09-0509 | |
| Przeciętny Intel Core i9-14900HX (3589 - 7979, n=36) | |
| Acer Predator Helios 18 PH18-72-98MW | |
| Asus ROG Strix G18 G814JI | |
| AIDA64 / CPU Queen | |
| MSI Titan 18 HX A14VIG | |
| MSI Raider 18 HX A14V | |
| Alienware m18 R2 | |
| Acer Predator Helios 18 PH18-72-98MW | |
| Przeciętny Intel Core i9-14900HX (118405 - 148966, n=36) | |
| Razer Blade 18 2024 RZ09-0509 | |
| Asus ROG Strix G18 G814JI | |
| AIDA64 / FPU SinJulia | |
| MSI Titan 18 HX A14VIG | |
| MSI Raider 18 HX A14V | |
| Alienware m18 R2 | |
| Razer Blade 18 2024 RZ09-0509 | |
| Przeciętny Intel Core i9-14900HX (10475 - 18517, n=36) | |
| Acer Predator Helios 18 PH18-72-98MW | |
| Asus ROG Strix G18 G814JI | |
| AIDA64 / FPU Mandel | |
| Alienware m18 R2 | |
| MSI Titan 18 HX A14VIG | |
| MSI Raider 18 HX A14V | |
| Razer Blade 18 2024 RZ09-0509 | |
| Przeciętny Intel Core i9-14900HX (32543 - 83662, n=36) | |
| Acer Predator Helios 18 PH18-72-98MW | |
| Asus ROG Strix G18 G814JI | |
| AIDA64 / CPU AES | |
| Przeciętny Intel Core i9-14900HX (86964 - 241777, n=36) | |
| MSI Titan 18 HX A14VIG | |
| Alienware m18 R2 | |
| MSI Raider 18 HX A14V | |
| Razer Blade 18 2024 RZ09-0509 | |
| Acer Predator Helios 18 PH18-72-98MW | |
| Asus ROG Strix G18 G814JI | |
| AIDA64 / CPU ZLib | |
| MSI Titan 18 HX A14VIG | |
| Alienware m18 R2 | |
| MSI Raider 18 HX A14V | |
| Razer Blade 18 2024 RZ09-0509 | |
| Przeciętny Intel Core i9-14900HX (1054 - 2292, n=36) | |
| Acer Predator Helios 18 PH18-72-98MW | |
| Asus ROG Strix G18 G814JI | |
| AIDA64 / FP64 Ray-Trace | |
| Alienware m18 R2 | |
| MSI Titan 18 HX A14VIG | |
| MSI Raider 18 HX A14V | |
| Razer Blade 18 2024 RZ09-0509 | |
| Przeciętny Intel Core i9-14900HX (6809 - 18349, n=36) | |
| Acer Predator Helios 18 PH18-72-98MW | |
| Asus ROG Strix G18 G814JI | |
| AIDA64 / CPU PhotoWorxx | |
| Alienware m18 R2 | |
| Razer Blade 18 2024 RZ09-0509 | |
| Acer Predator Helios 18 PH18-72-98MW | |
| Przeciętny Intel Core i9-14900HX (23903 - 54702, n=36) | |
| Asus ROG Strix G18 G814JI | |
| MSI Raider 18 HX A14V | |
| MSI Titan 18 HX A14VIG | |
Test warunków skrajnych
Procesor zwiększał taktowanie do 4 GHz, 86 C i 145 W podczas inicjowania obciążenia Prime95, bez większych spadków częstotliwości taktowania lub wydajności w czasie. Duża obudowa i rozwiązanie chłodzące mogą wydobyć większą wydajność z Core i9-14900HX w porównaniu do mniejszych systemów z tym samym procesorem, takich jak RedMagic Titan 16 Pro który jest dość mocno dławiony.
Praca w trybie ekstremalnej wydajności z włączonym Cooler Boost nie zapewnia żadnych wymiernych korzyści w porównaniu do wyłączonego Cooler Boost podczas grania. Częstotliwość taktowania GPU, częstotliwości taktowania pamięci i pobór mocy płyty podczas uruchamiania Cyberpunk 2077 ustabilizowałyby się odpowiednio na poziomie 2550 MHz, 2250 MHz i 159 W, pomiędzy tymi dwoma ustawieniami. Temperatury rdzenia są nieco niższe o kilka stopni C przy włączonym Cooler Boost, ponieważ hałas wentylatora jest głośniejszy, ale to jedyna zauważalna zaleta.
Zejście do trybu Balanced zmniejsza częstotliwość taktowania GPU i pobór mocy z płyty głównej do odpowiednio 2295 MHz i 150 W, czyli tylko nieznacznie wolniej niż w trybie Extreme Performance. Różnice w wydajności pomiędzy trybami Balanced i Extreme Performance są zatem mniejsze niż można by się spodziewać.
Temperatury GPU są wyższe niż w Razer Blade 18 nawet o 9 C podczas grania, mimo że nasz MSI jest grubszym i cięższym systemem.
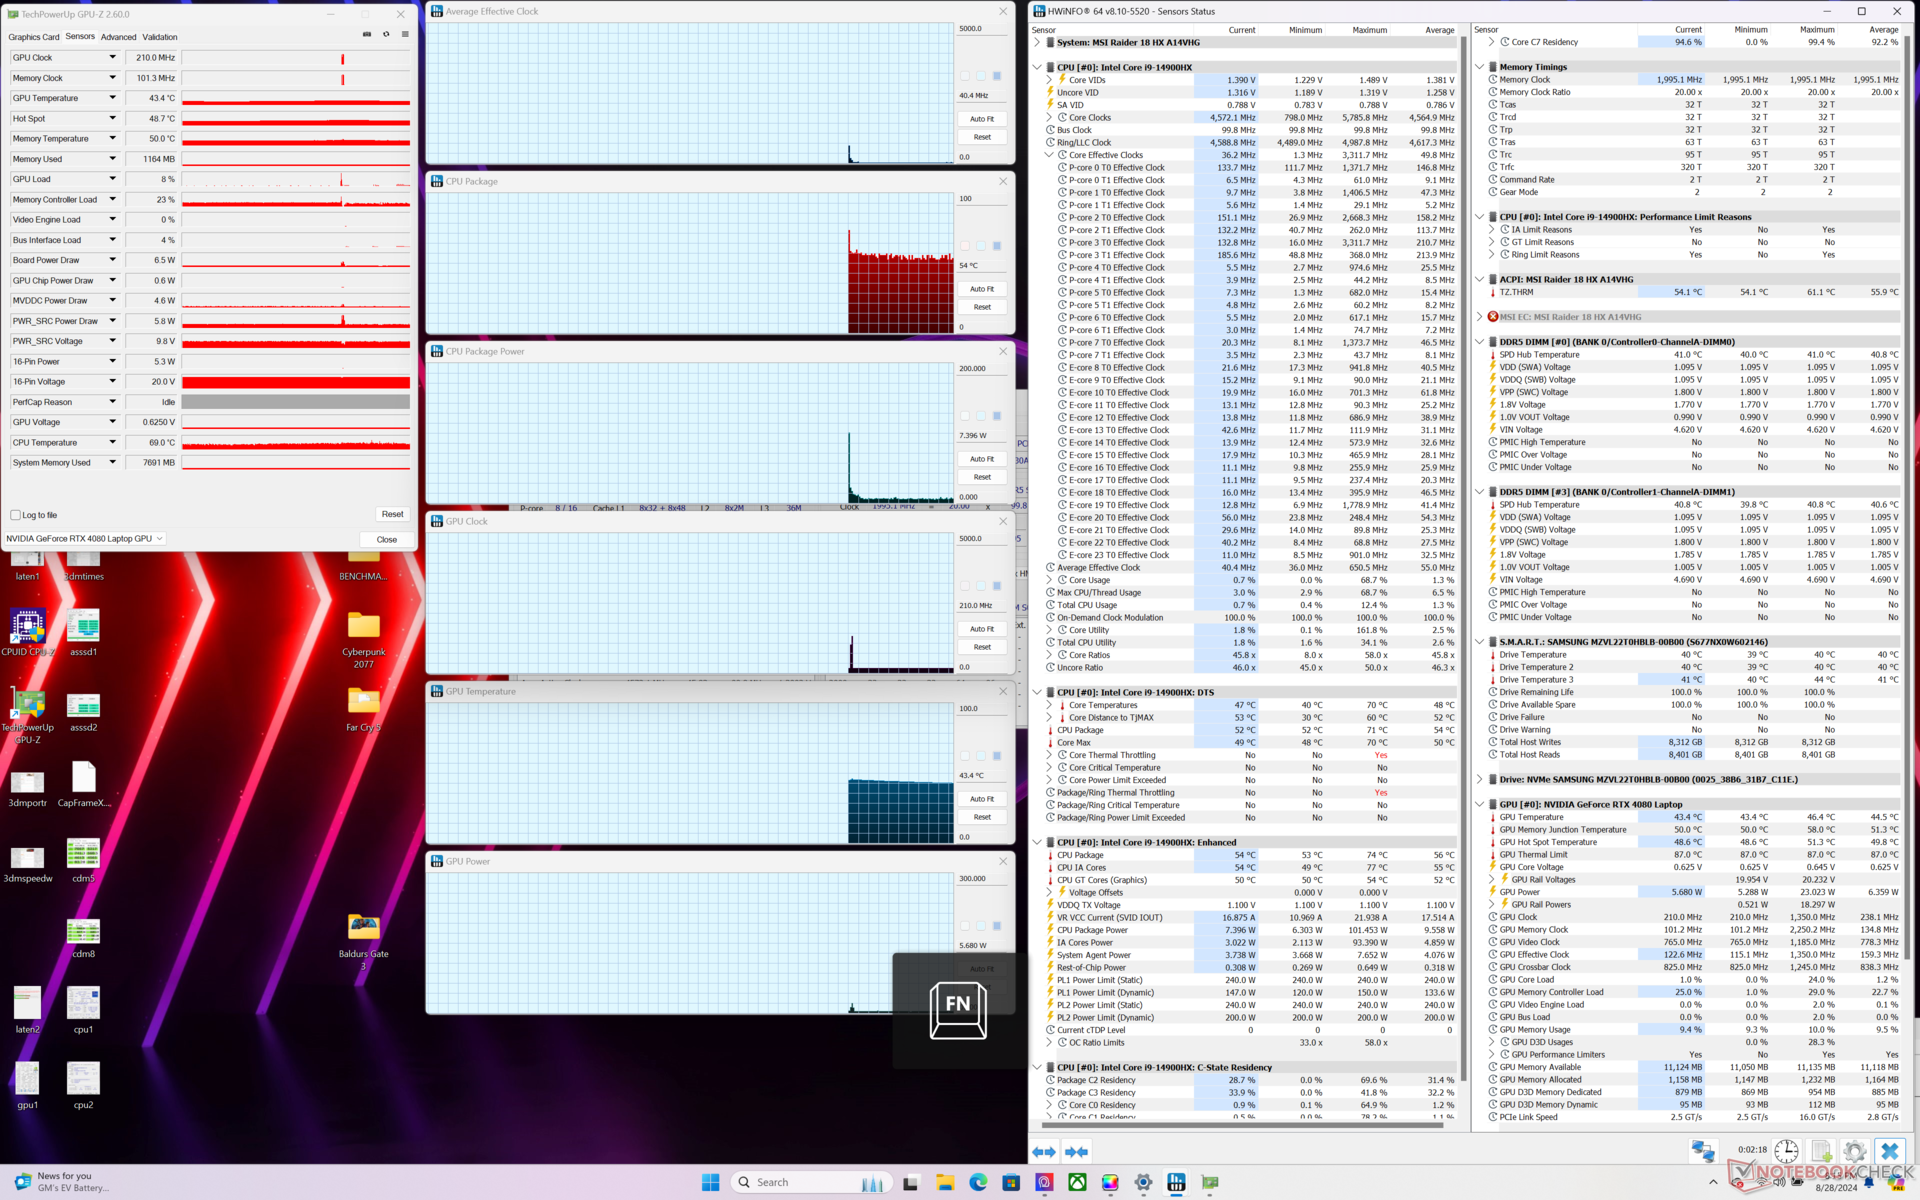

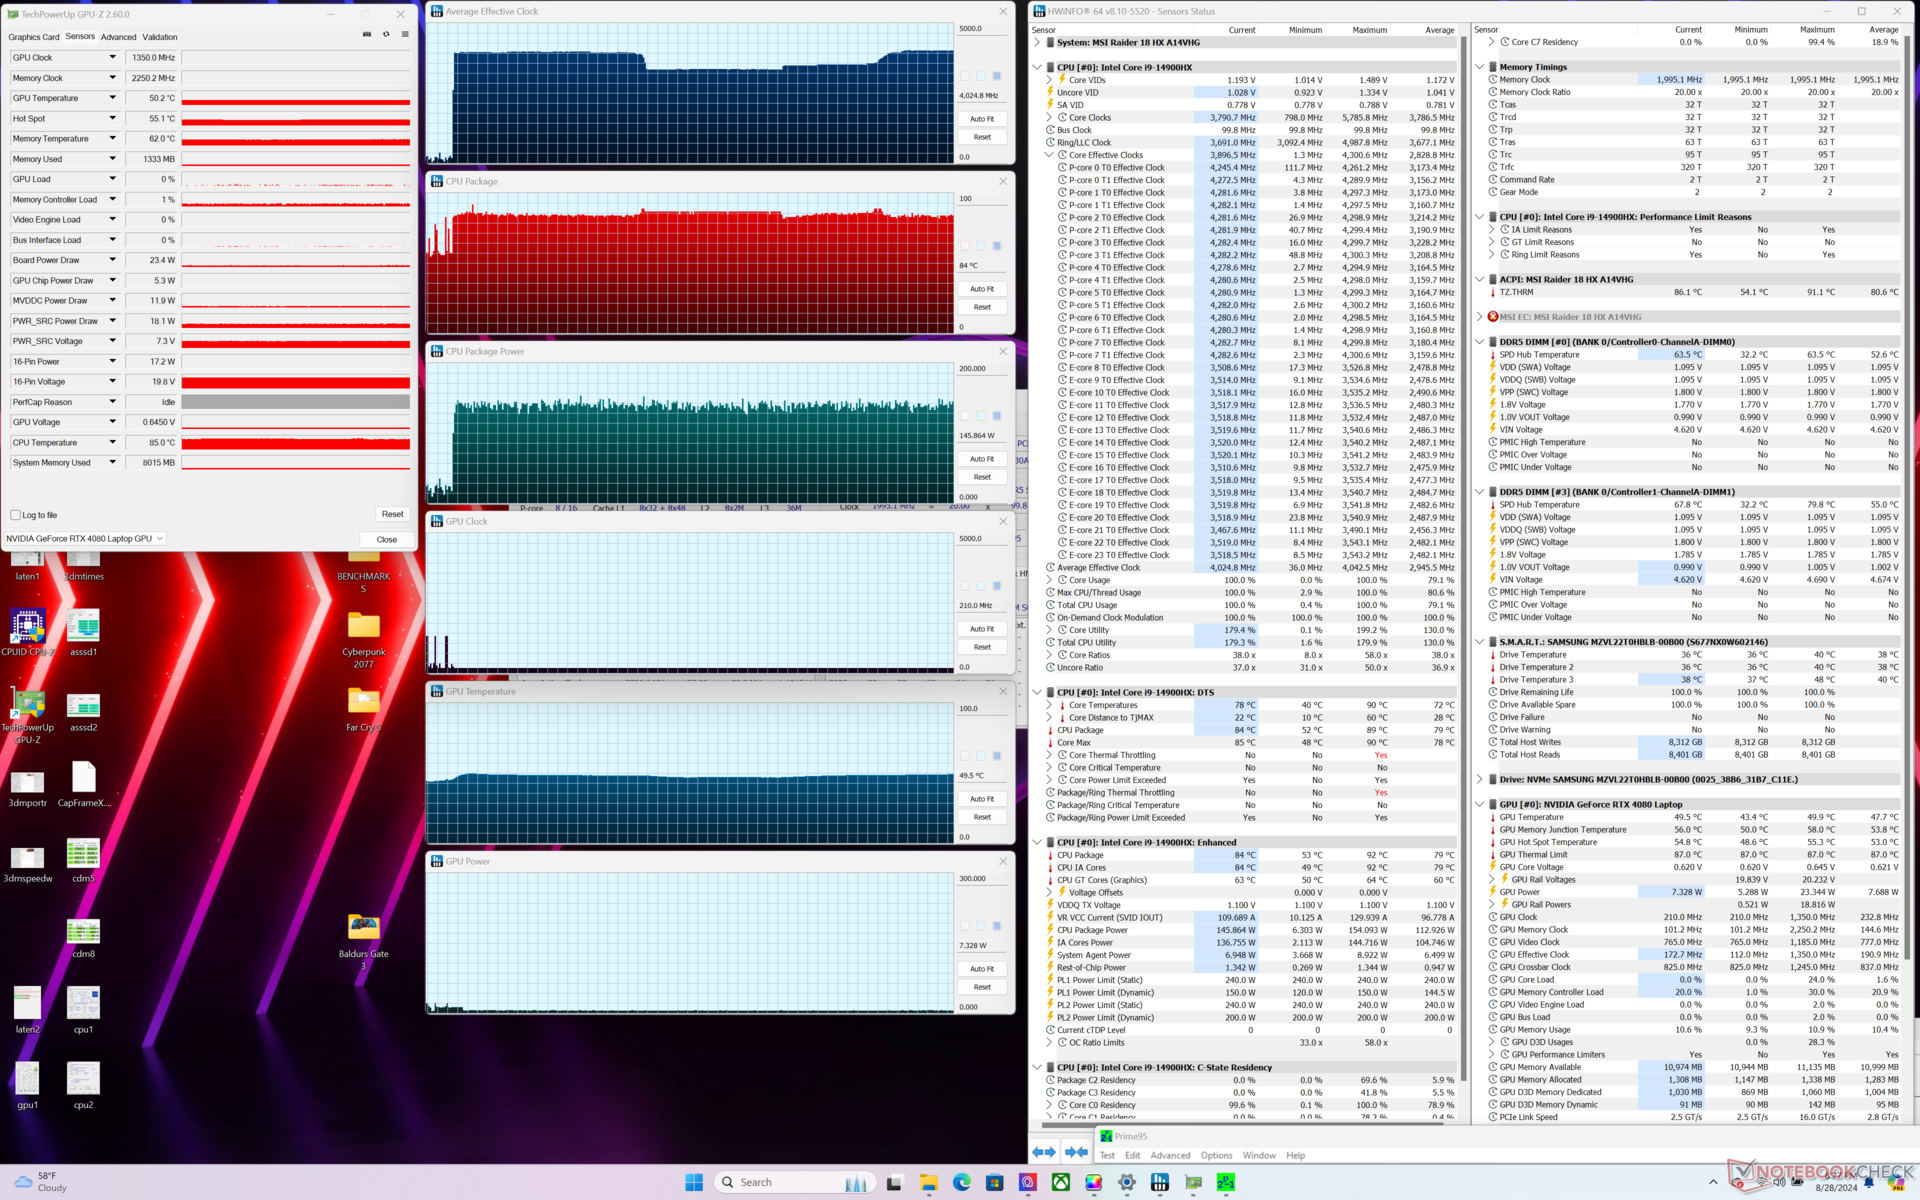
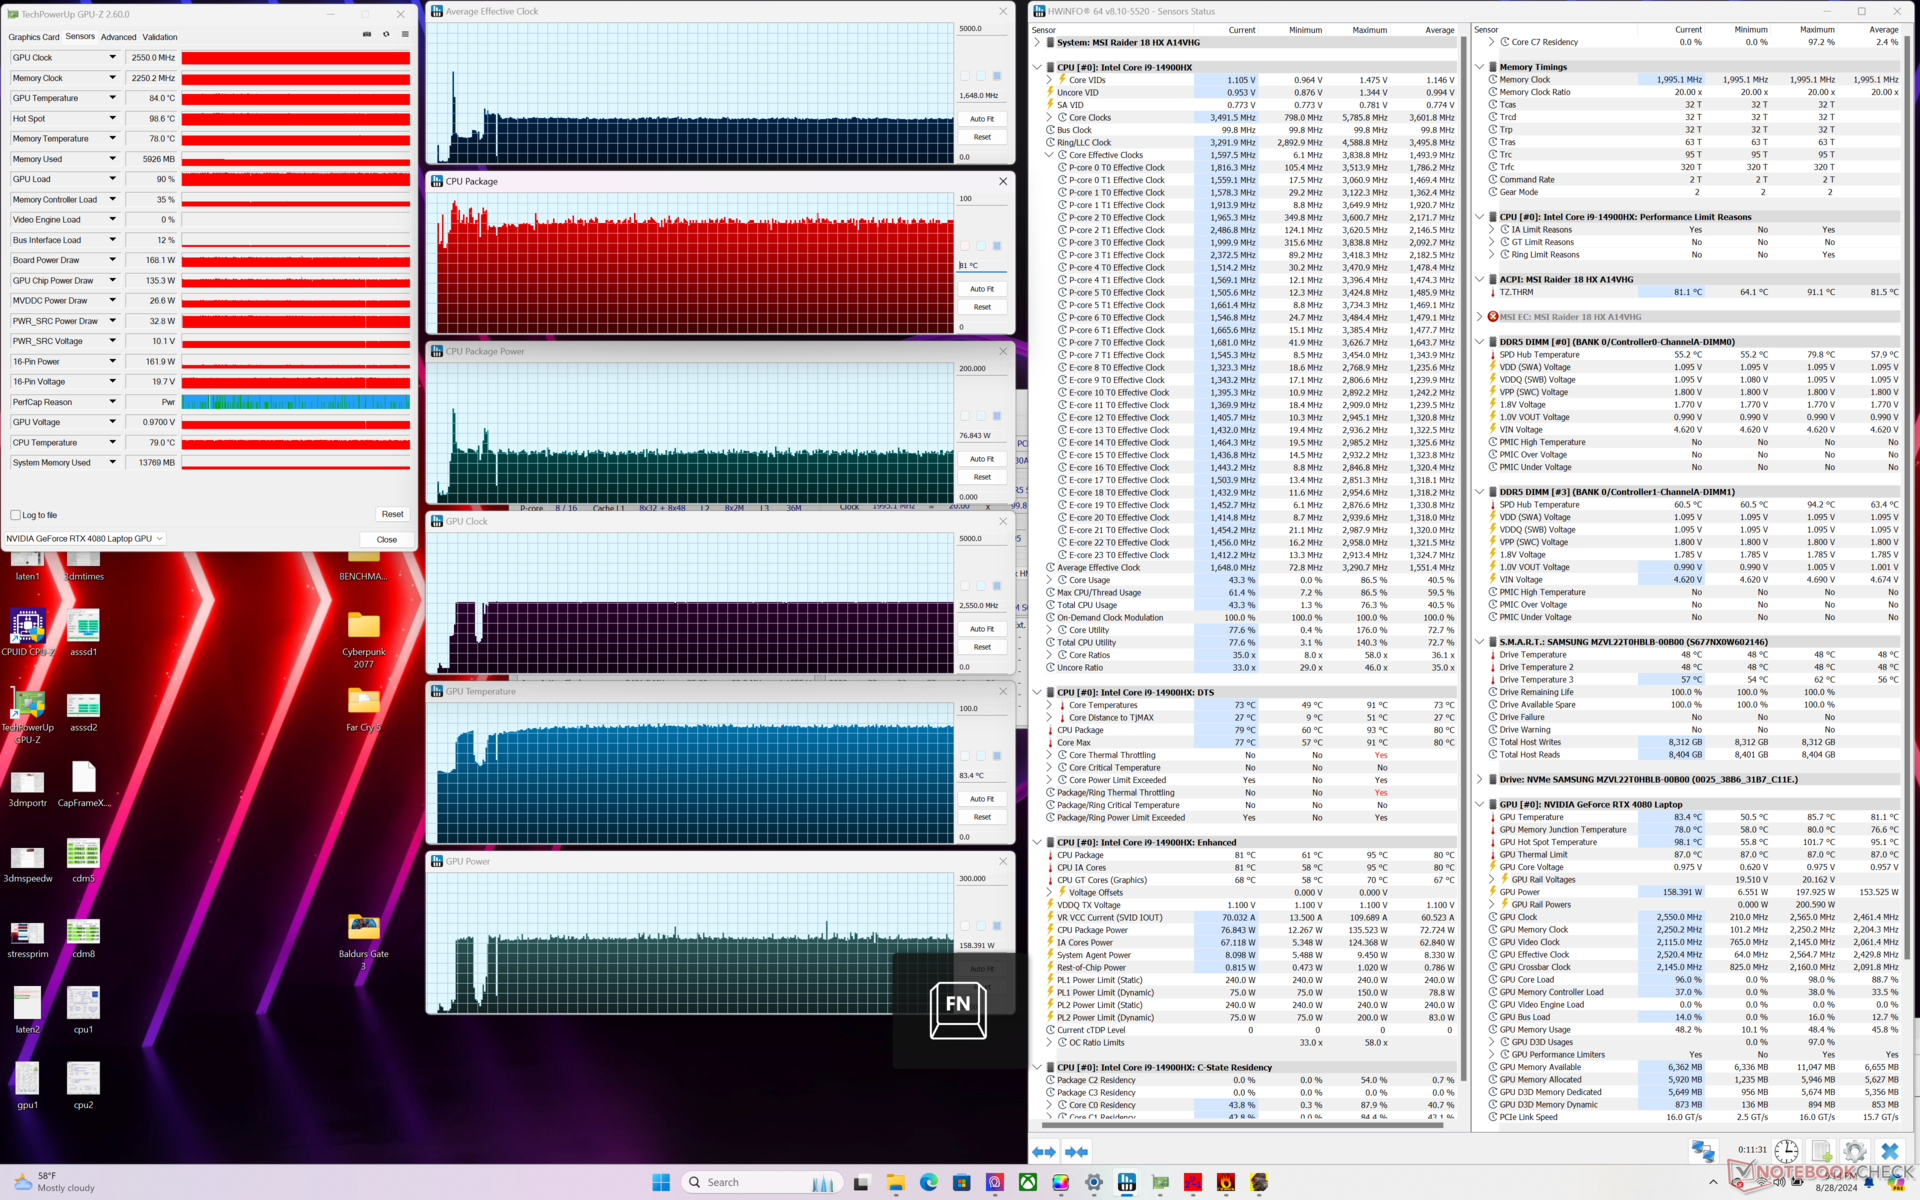
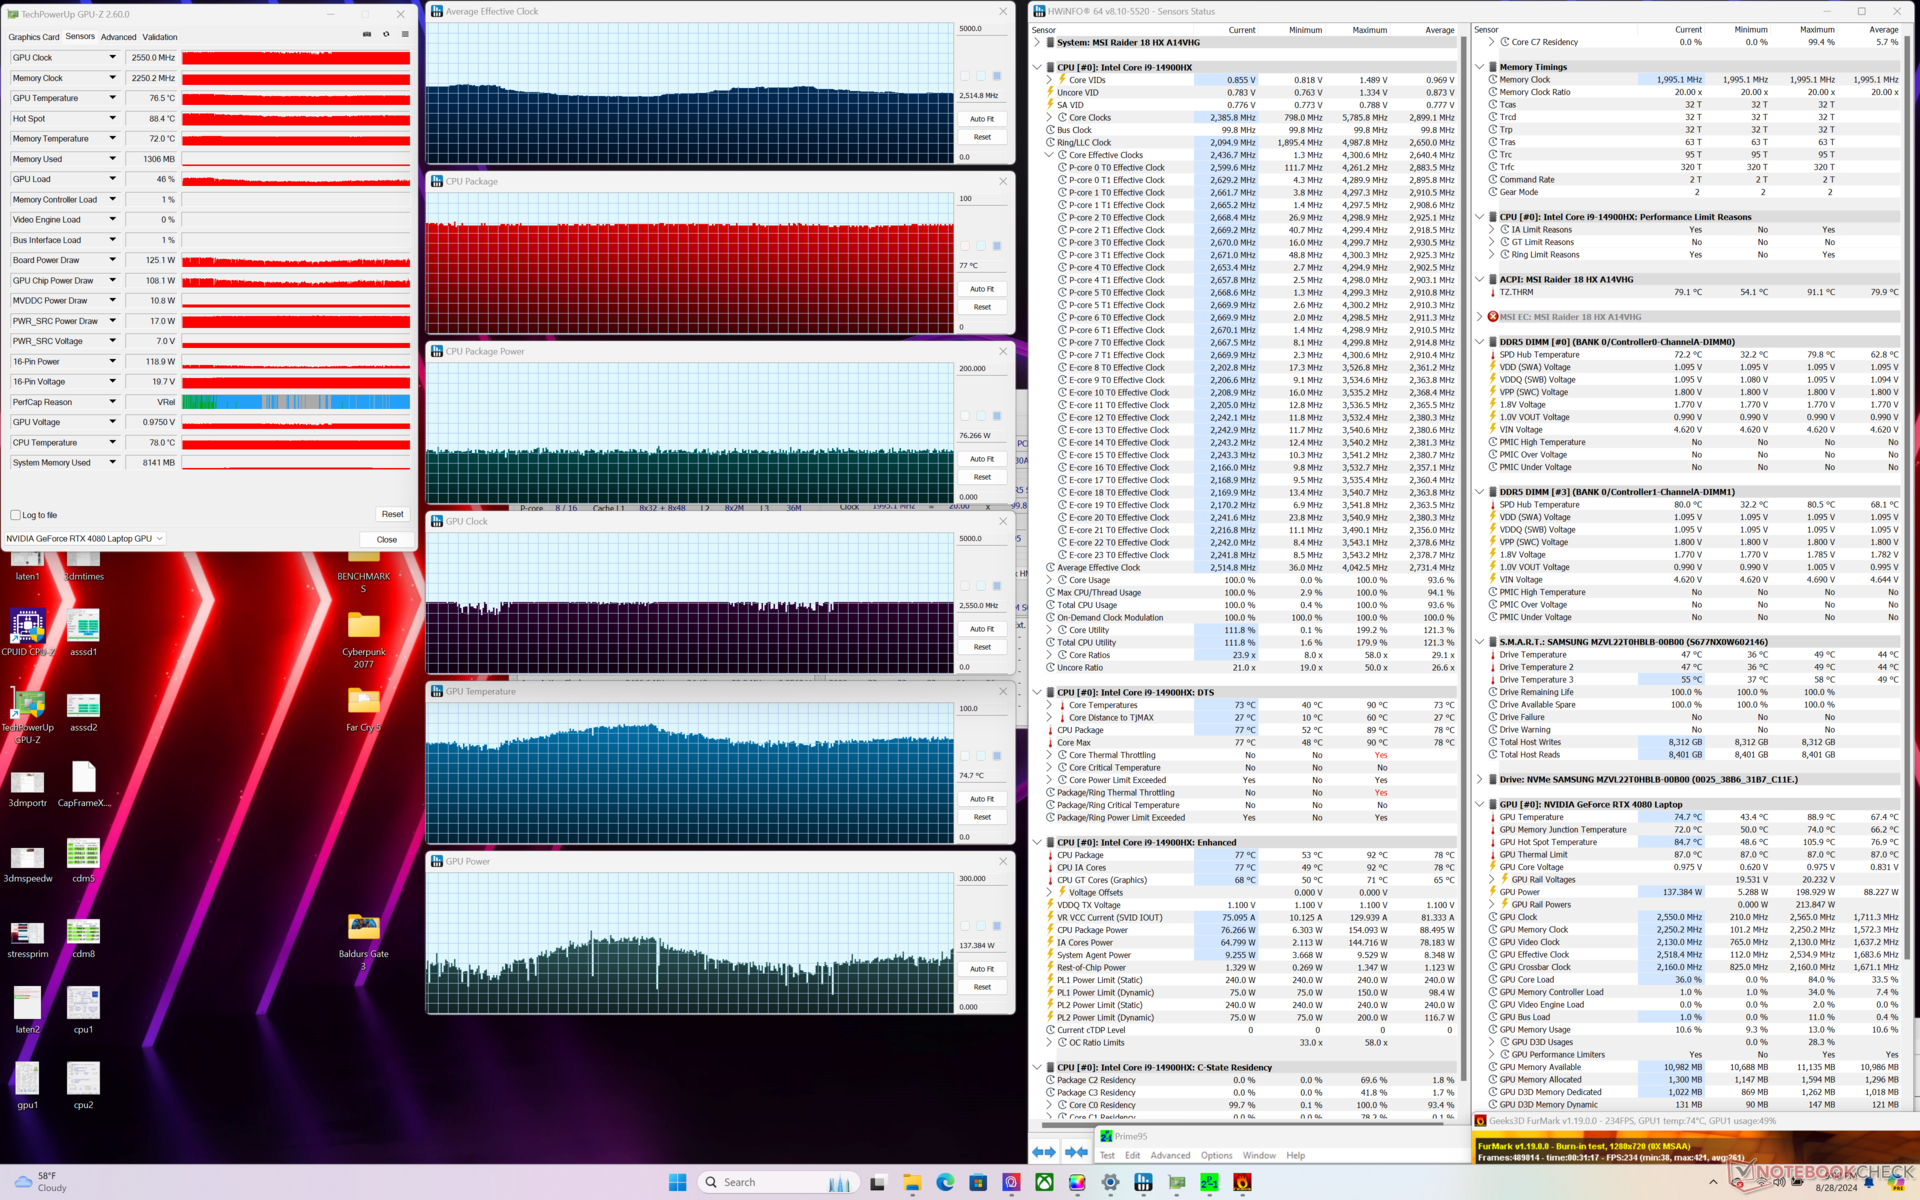
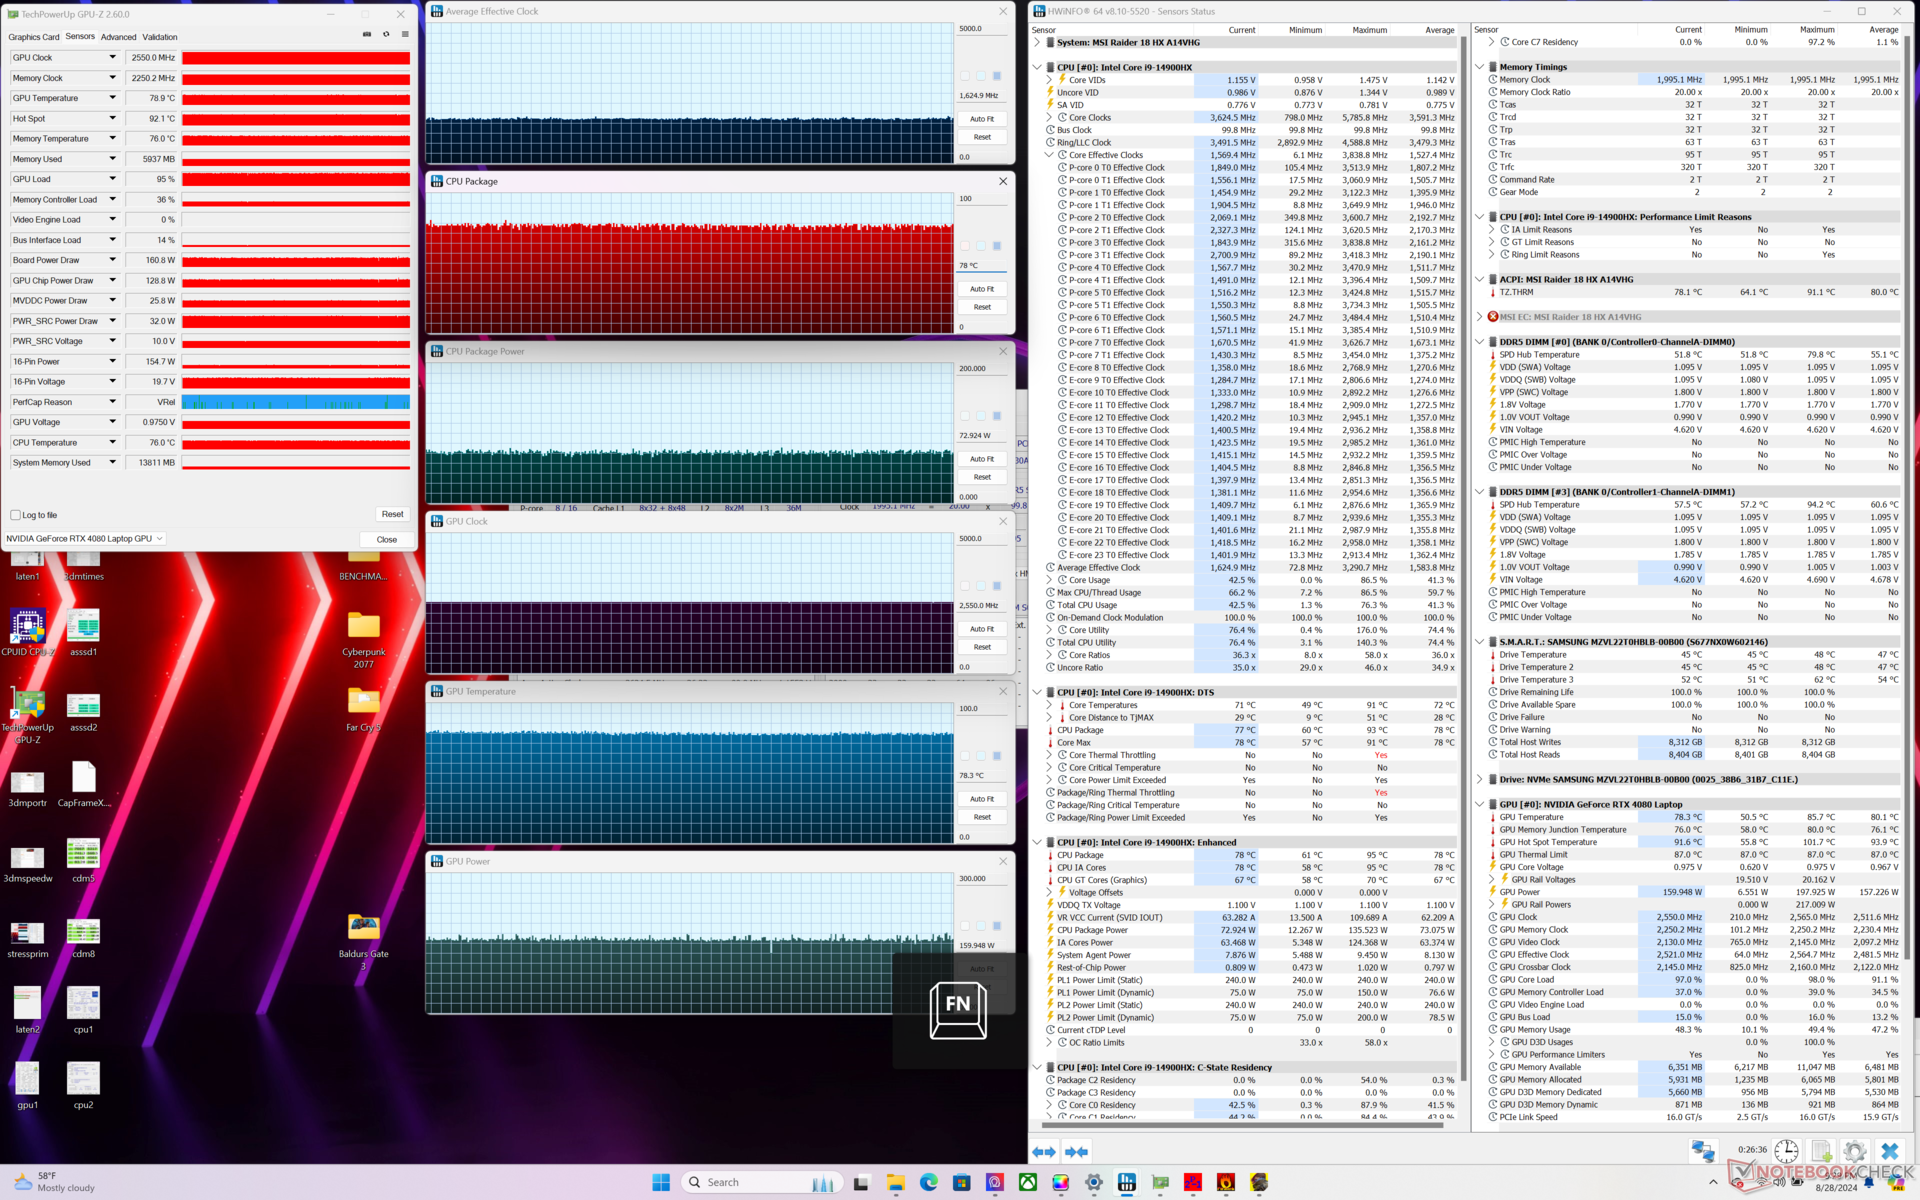
| Średnie taktowanie CPU (GHz) | Taktowanie GPU (MHz) | Średnia temperatura CPU (°C) | Średnia temperatura GPU (°C) | |
| System w stanie spoczynku | -- | -- | 54 | 43 |
| Prime95 Stress | 4.0 | -- | 84 | 50 |
| Prime95 + FurMark Stress | 2.5 | 2550 | 77 | 75 |
| Cyberpunk 2077 Stress (tryb zrównoważony) | 1.5 | 2295 | 78 | 85 |
| Cyberpunk 2077 Stress (Ekstremalna wydajność z wyłączonym Cooler Boost) | 1.7 | 2550 | 81 | 83 |
| Cyberpunk 2077 Stress (Ekstremalna wydajność z włączoną funkcją Cooler Boost) | 1.6 | 2550 | 78 | 78 |
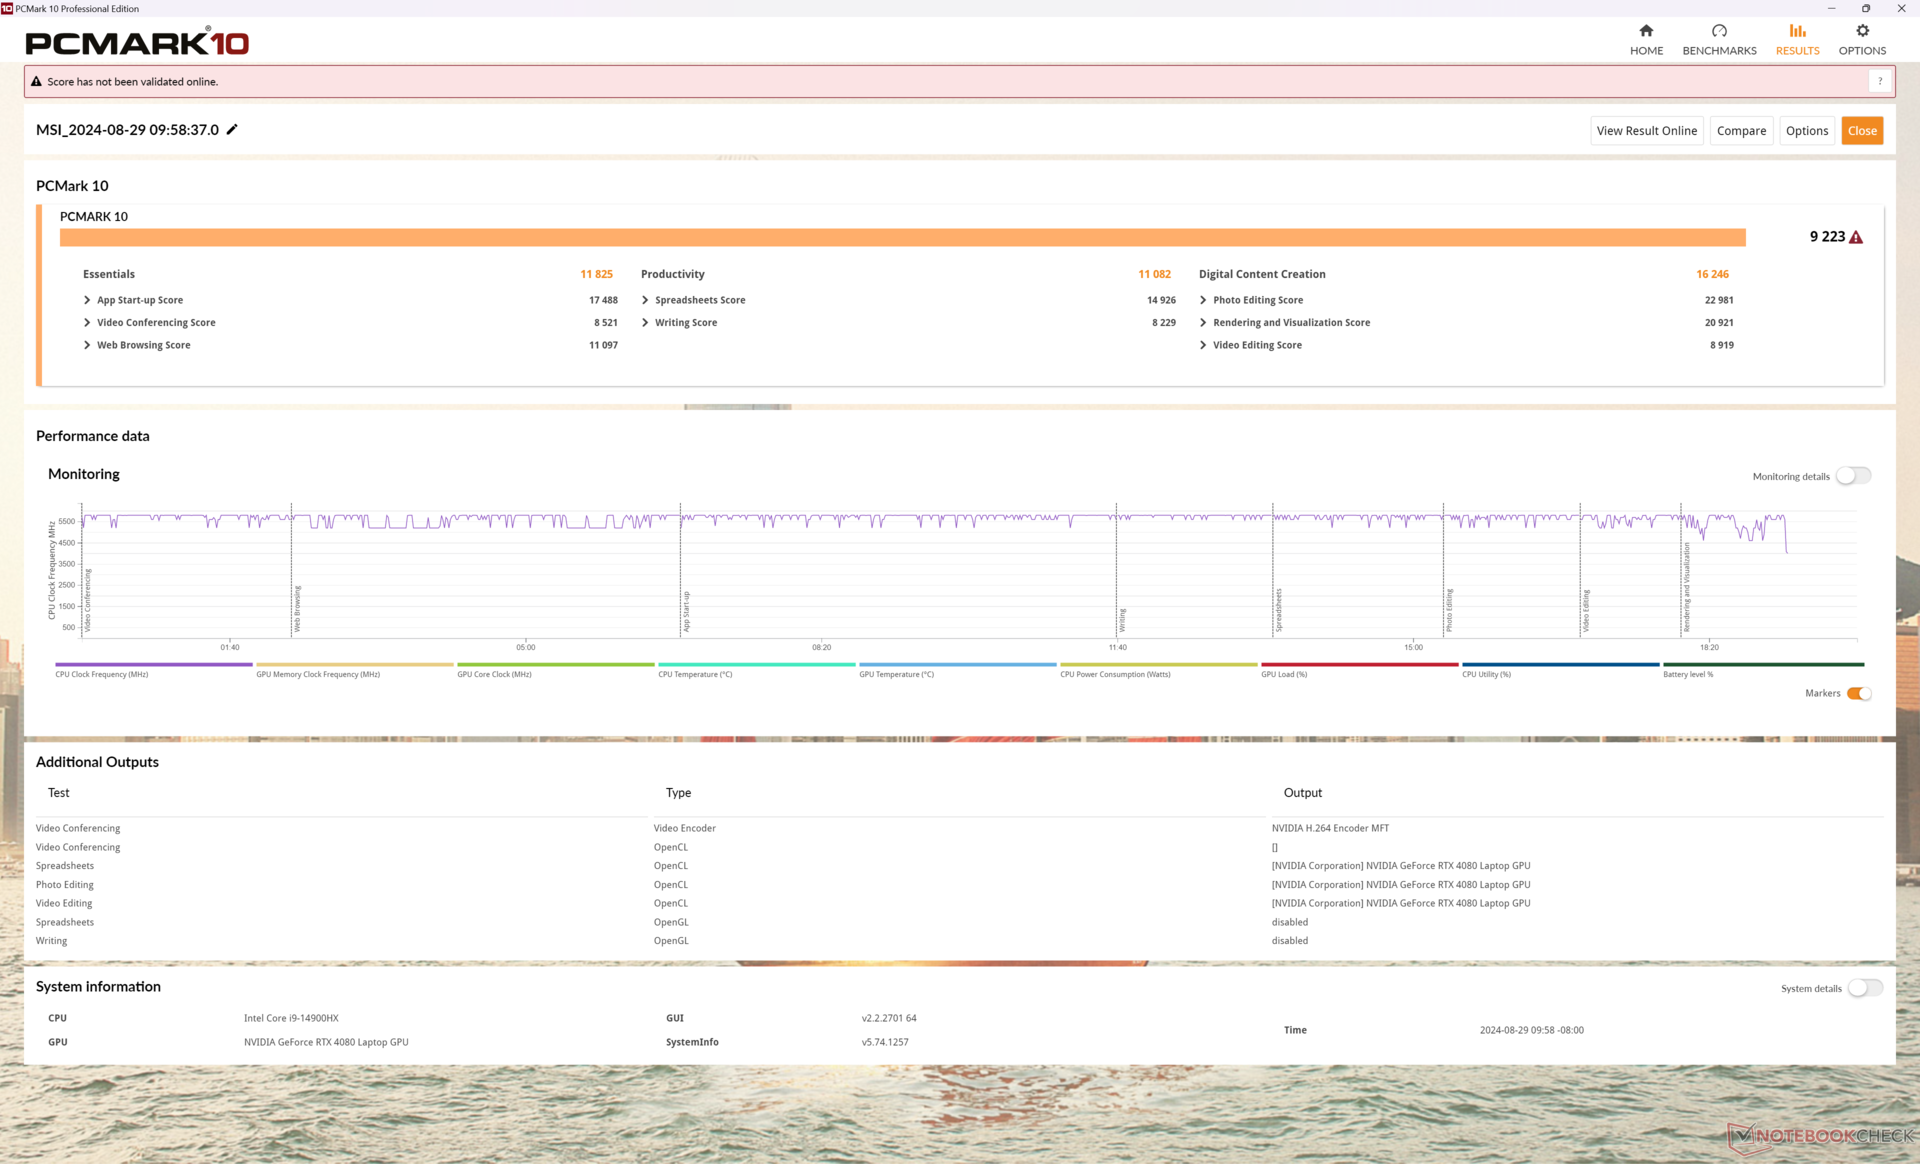
Wydajność systemu
Wyniki PCMark 10 są porównywalne z MSI Titan 18 HX, aby pokazać, że codzienne zadania nie są wolniejsze na Raider 18 HX, mimo że jest to zasadniczo stonowany Titan.
Podczas przełączania się pomiędzy trybami dGPU i iGPU doświadczyliśmy dziwnych problemów z logowaniem, które zmuszały nas do resetowania kodu PIN za każdym razem.
CrossMark: Overall | Productivity | Creativity | Responsiveness
WebXPRT 3: Overall
WebXPRT 4: Overall
Mozilla Kraken 1.1: Total
| PCMark 10 / Score | |
| Alienware m18 R2 | |
| MSI Raider 18 HX A14V | |
| MSI Titan 18 HX A14VIG | |
| Razer Blade 18 2024 RZ09-0509 | |
| Przeciętny Intel Core i9-14900HX, NVIDIA GeForce RTX 4080 Laptop GPU (7703 - 9223, n=7) | |
| Acer Predator Helios 18 PH18-72-98MW | |
| Asus ROG Strix G18 G814JI | |
| PCMark 10 / Essentials | |
| MSI Raider 18 HX A14V | |
| Przeciętny Intel Core i9-14900HX, NVIDIA GeForce RTX 4080 Laptop GPU (11255 - 12600, n=7) | |
| MSI Titan 18 HX A14VIG | |
| Alienware m18 R2 | |
| Razer Blade 18 2024 RZ09-0509 | |
| Acer Predator Helios 18 PH18-72-98MW | |
| Asus ROG Strix G18 G814JI | |
| PCMark 10 / Productivity | |
| Alienware m18 R2 | |
| MSI Raider 18 HX A14V | |
| Przeciętny Intel Core i9-14900HX, NVIDIA GeForce RTX 4080 Laptop GPU (6662 - 11410, n=7) | |
| MSI Titan 18 HX A14VIG | |
| Razer Blade 18 2024 RZ09-0509 | |
| Acer Predator Helios 18 PH18-72-98MW | |
| Asus ROG Strix G18 G814JI | |
| PCMark 10 / Digital Content Creation | |
| MSI Titan 18 HX A14VIG | |
| Alienware m18 R2 | |
| MSI Raider 18 HX A14V | |
| Razer Blade 18 2024 RZ09-0509 | |
| Przeciętny Intel Core i9-14900HX, NVIDIA GeForce RTX 4080 Laptop GPU (14211 - 16246, n=7) | |
| Acer Predator Helios 18 PH18-72-98MW | |
| Asus ROG Strix G18 G814JI | |
| CrossMark / Overall | |
| Przeciętny Intel Core i9-14900HX, NVIDIA GeForce RTX 4080 Laptop GPU (1992 - 2334, n=7) | |
| MSI Raider 18 HX A14V | |
| Alienware m18 R2 | |
| Razer Blade 18 2024 RZ09-0509 | |
| MSI Titan 18 HX A14VIG | |
| CrossMark / Productivity | |
| Przeciętny Intel Core i9-14900HX, NVIDIA GeForce RTX 4080 Laptop GPU (1812 - 2204, n=7) | |
| MSI Raider 18 HX A14V | |
| Razer Blade 18 2024 RZ09-0509 | |
| Alienware m18 R2 | |
| MSI Titan 18 HX A14VIG | |
| CrossMark / Creativity | |
| Przeciętny Intel Core i9-14900HX, NVIDIA GeForce RTX 4080 Laptop GPU (2327 - 2500, n=7) | |
| Alienware m18 R2 | |
| MSI Raider 18 HX A14V | |
| Razer Blade 18 2024 RZ09-0509 | |
| MSI Titan 18 HX A14VIG | |
| CrossMark / Responsiveness | |
| Przeciętny Intel Core i9-14900HX, NVIDIA GeForce RTX 4080 Laptop GPU (1520 - 2254, n=7) | |
| MSI Raider 18 HX A14V | |
| Alienware m18 R2 | |
| Razer Blade 18 2024 RZ09-0509 | |
| MSI Titan 18 HX A14VIG | |
| WebXPRT 3 / Overall | |
| Razer Blade 18 2024 RZ09-0509 | |
| MSI Raider 18 HX A14V | |
| Przeciętny Intel Core i9-14900HX, NVIDIA GeForce RTX 4080 Laptop GPU (310 - 345, n=7) | |
| MSI Titan 18 HX A14VIG | |
| Alienware m18 R2 | |
| Asus ROG Strix G18 G814JI | |
| Asus ROG Strix G18 G814JI | |
| WebXPRT 4 / Overall | |
| MSI Raider 18 HX A14V | |
| Przeciętny Intel Core i9-14900HX, NVIDIA GeForce RTX 4080 Laptop GPU (300 - 321, n=7) | |
| Alienware m18 R2 | |
| MSI Titan 18 HX A14VIG | |
| Asus ROG Strix G18 G814JI | |
| Asus ROG Strix G18 G814JI | |
| Mozilla Kraken 1.1 / Total | |
| Asus ROG Strix G18 G814JI | |
| Asus ROG Strix G18 G814JI | |
| MSI Titan 18 HX A14VIG | |
| Razer Blade 18 2024 RZ09-0509 | |
| MSI Raider 18 HX A14V | |
| Acer Predator Helios 18 PH18-72-98MW | |
| Przeciętny Intel Core i9-14900HX, NVIDIA GeForce RTX 4080 Laptop GPU (437 - 446, n=7) | |
| Alienware m18 R2 | |
* ... im mniej tym lepiej
| PCMark 10 Score | 9223 pkt. | |
Pomoc | ||
| AIDA64 / Memory Copy | |
| Alienware m18 R2 | |
| Acer Predator Helios 18 PH18-72-98MW | |
| Razer Blade 18 2024 RZ09-0509 | |
| Przeciętny Intel Core i9-14900HX (38028 - 83392, n=36) | |
| MSI Raider 18 HX A14V | |
| Asus ROG Strix G18 G814JI | |
| MSI Titan 18 HX A14VIG | |
| AIDA64 / Memory Read | |
| Alienware m18 R2 | |
| Acer Predator Helios 18 PH18-72-98MW | |
| Razer Blade 18 2024 RZ09-0509 | |
| Przeciętny Intel Core i9-14900HX (43306 - 87568, n=36) | |
| Asus ROG Strix G18 G814JI | |
| MSI Raider 18 HX A14V | |
| MSI Titan 18 HX A14VIG | |
| AIDA64 / Memory Write | |
| Alienware m18 R2 | |
| Przeciętny Intel Core i9-14900HX (37146 - 80589, n=36) | |
| Acer Predator Helios 18 PH18-72-98MW | |
| Razer Blade 18 2024 RZ09-0509 | |
| MSI Raider 18 HX A14V | |
| Asus ROG Strix G18 G814JI | |
| MSI Titan 18 HX A14VIG | |
| AIDA64 / Memory Latency | |
| MSI Titan 18 HX A14VIG | |
| MSI Raider 18 HX A14V | |
| Razer Blade 18 2024 RZ09-0509 | |
| Alienware m18 R2 | |
| Przeciętny Intel Core i9-14900HX (76.1 - 105, n=36) | |
| Asus ROG Strix G18 G814JI | |
| Acer Predator Helios 18 PH18-72-98MW | |
* ... im mniej tym lepiej
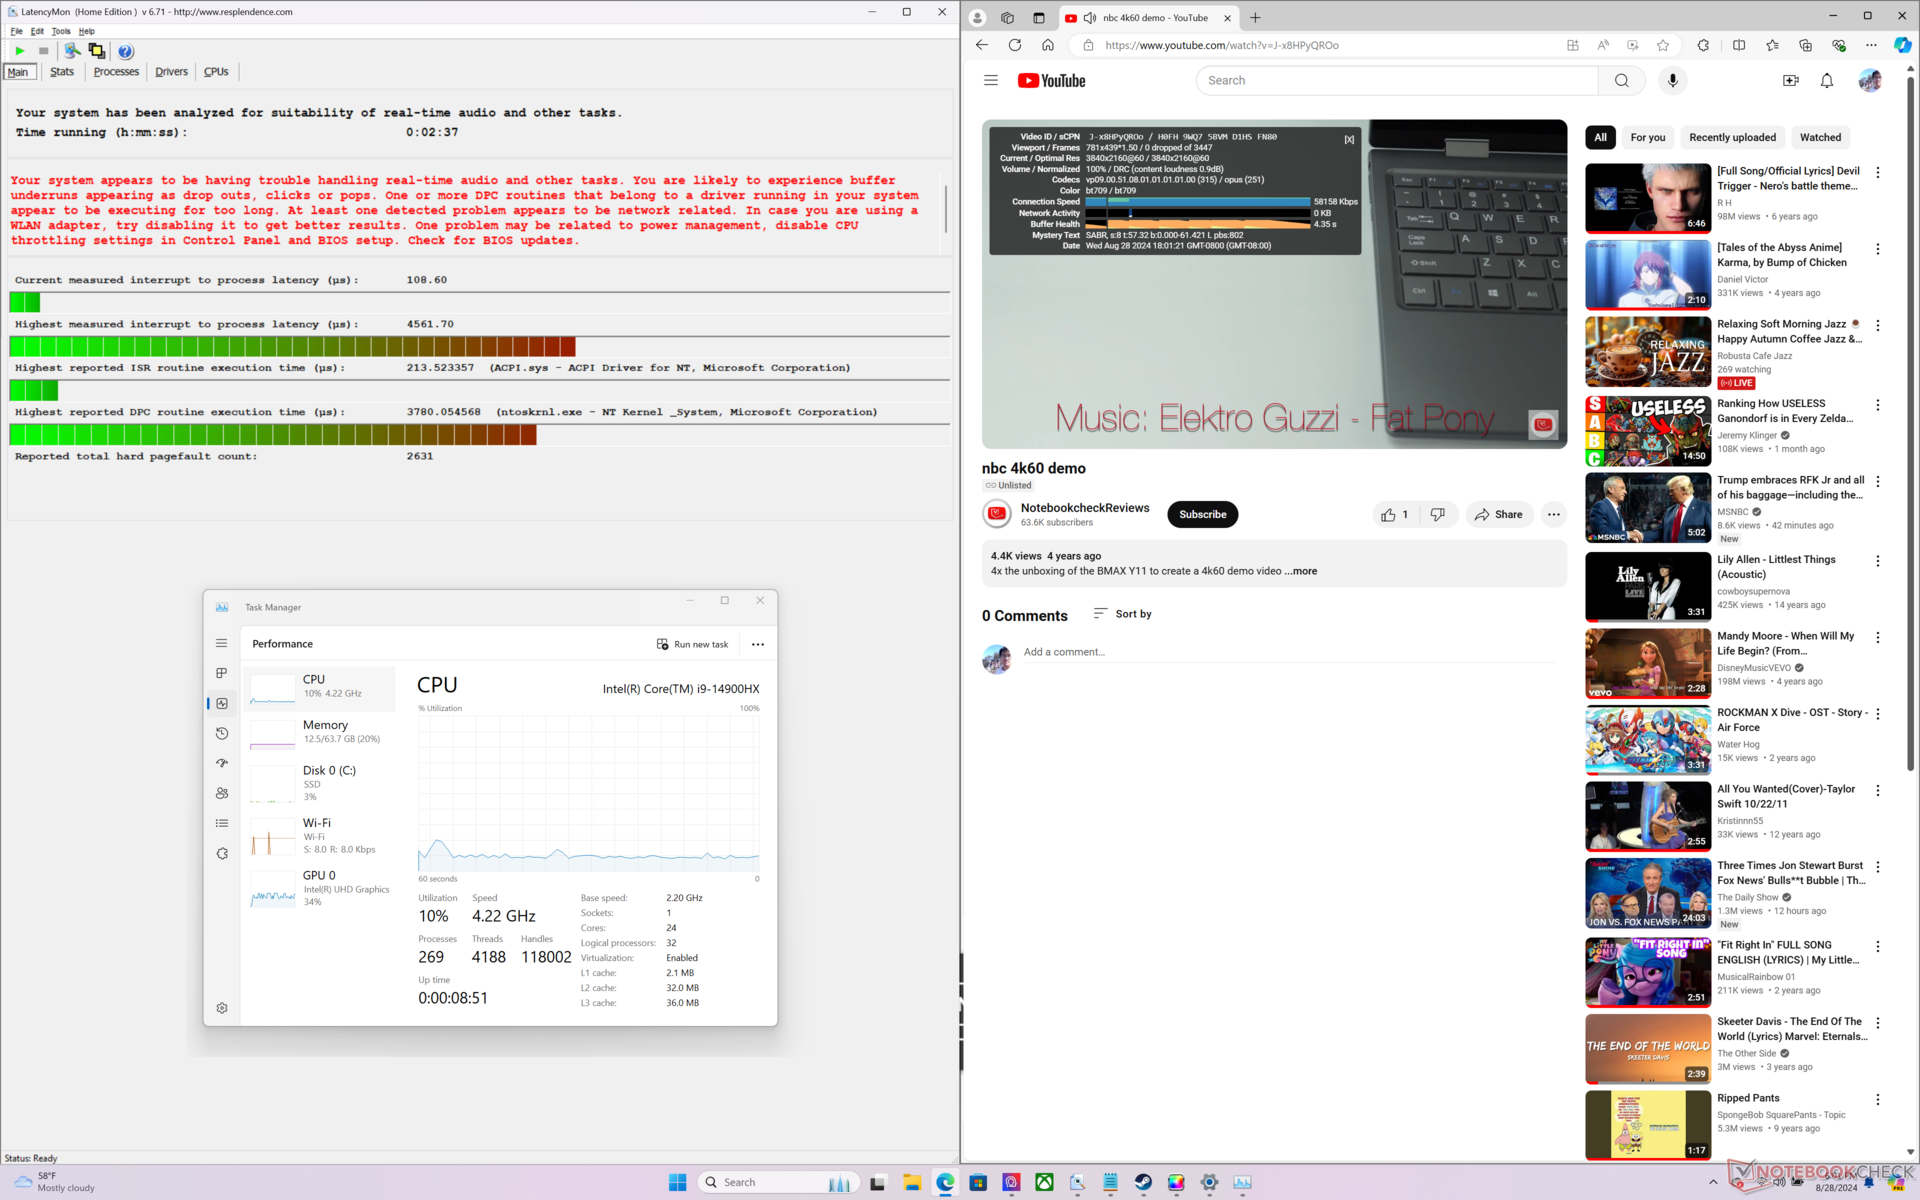
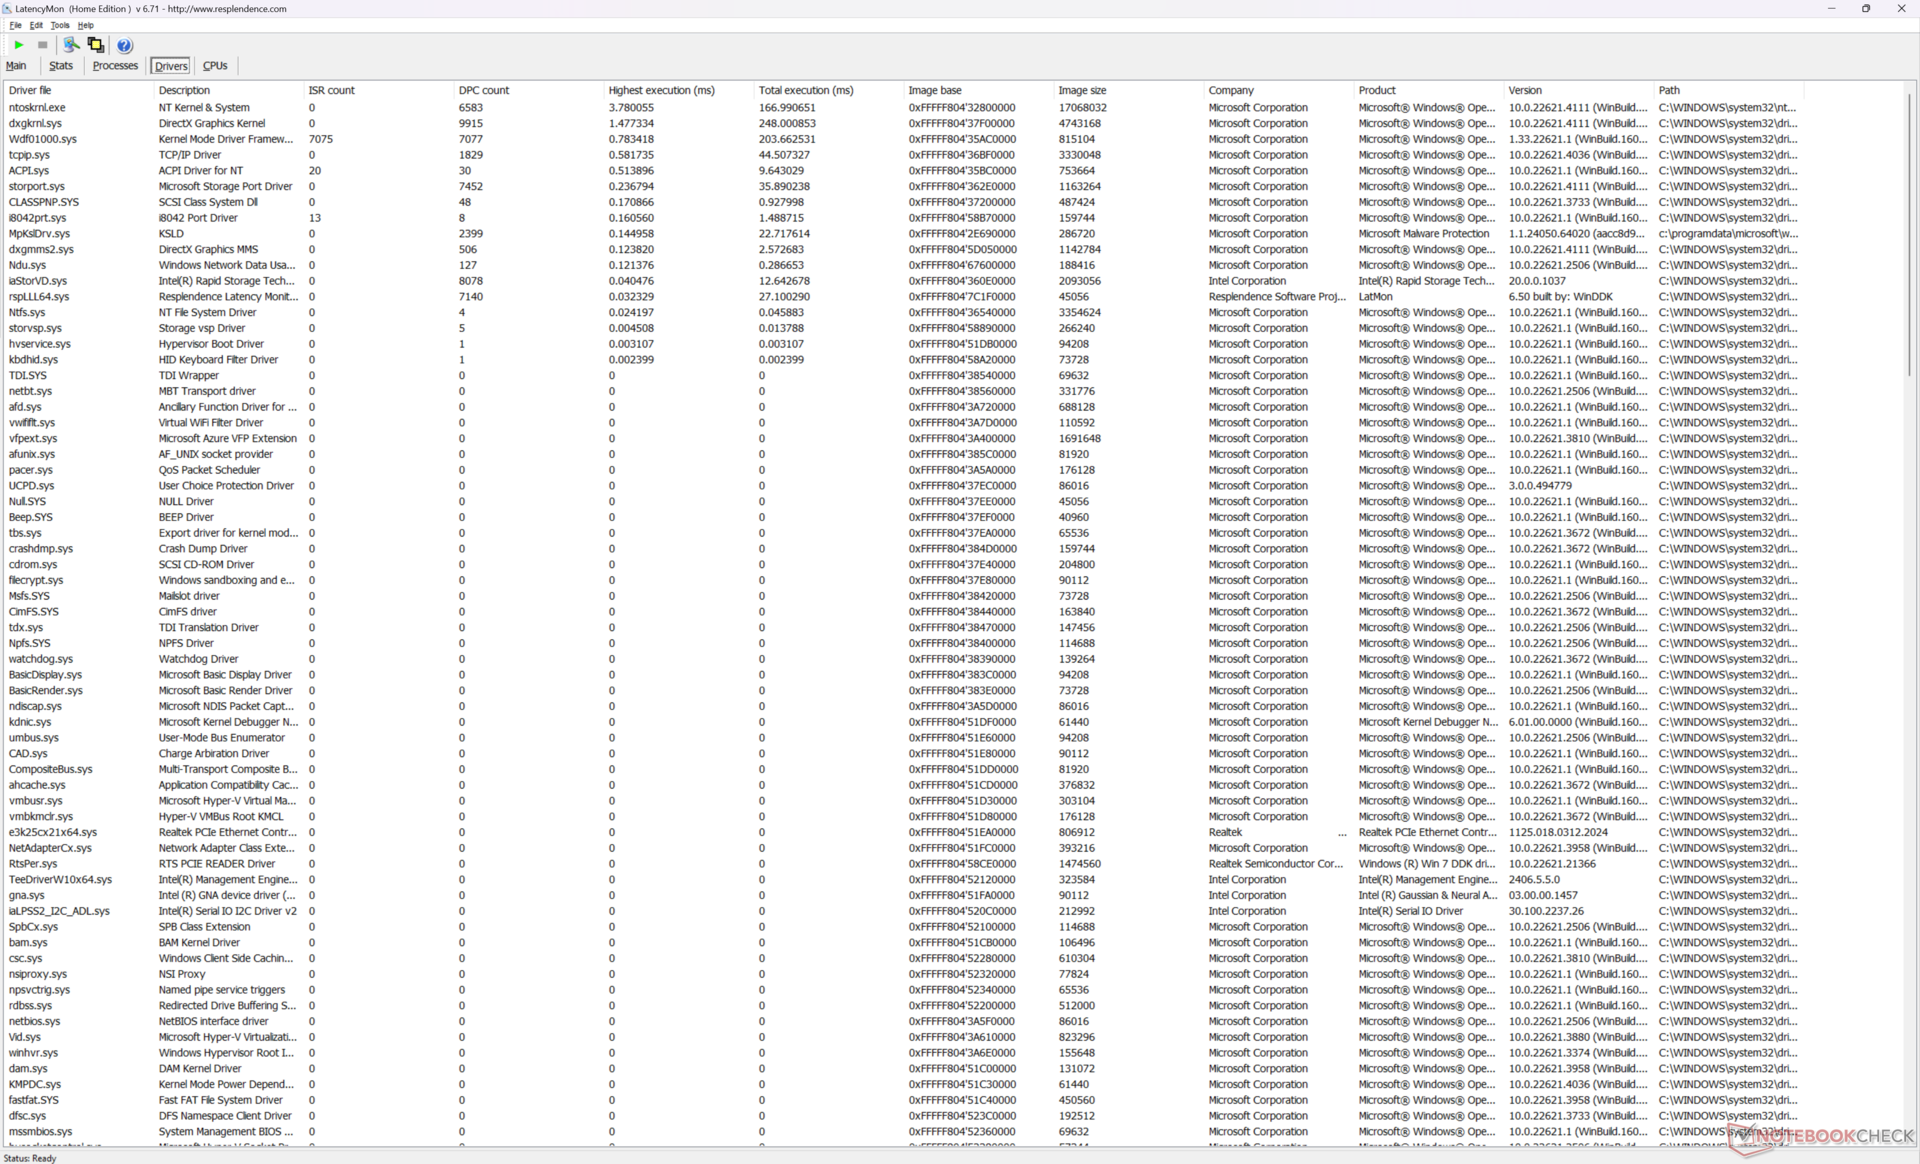
Opóźnienie DPC
LatencyMon ujawnia problemy z DPC podczas otwierania wielu kart na naszej stronie głównej, nawet po ustawieniu trybu iGPU. odtwarzanie wideo 4K przy 60 FPS jest poza tym idealne i nie odnotowano żadnych spadków klatek.
| DPC Latencies / LatencyMon - interrupt to process latency (max), Web, Youtube, Prime95 | |
| MSI Raider 18 HX A14V | |
| Acer Predator Helios 18 PH18-72-98MW | |
| Alienware m18 R2 | |
| MSI Titan 18 HX A14VIG | |
| Razer Blade 18 2024 RZ09-0509 | |
| Asus ROG Strix G18 G814JI | |
* ... im mniej tym lepiej
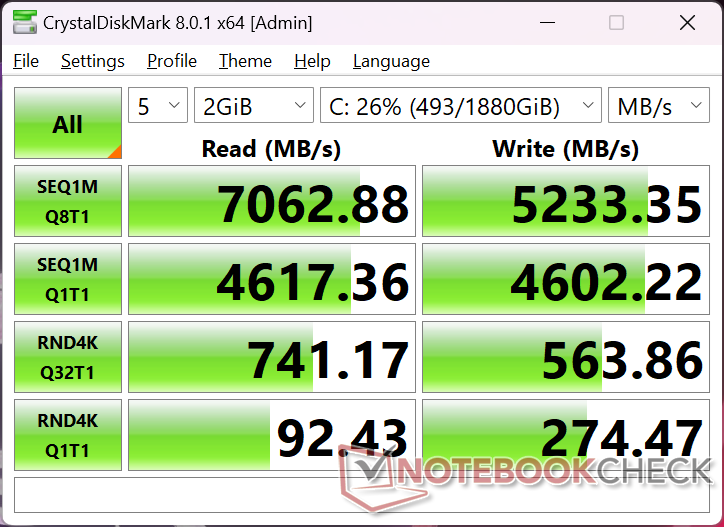
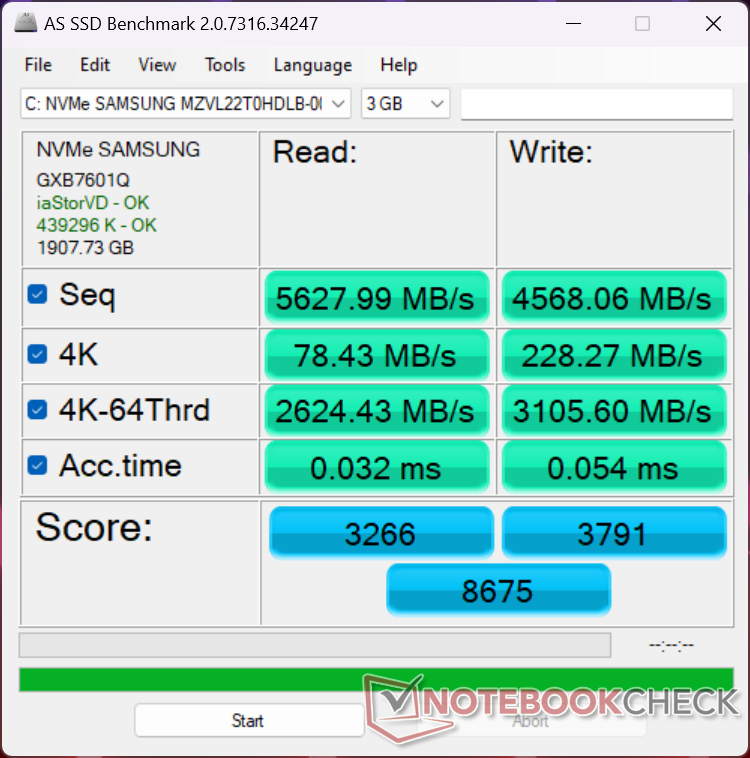
Urządzenia pamięci masowej
Nasze urządzenie jest dostarczane z Samsung PM9A1a MZVL22T0HDLB PCIe4 SSD, powszechnie spotykanym w laptopach z wyższej półki. Prędkości transferu są stabilne na poziomie ~7000 MB/s nawet pod obciążeniem i mogą być jeszcze szybsze, jeśli zostaną skonfigurowane z dyskiem PCIe5. Jednak brak dołączonego rozpraszacza ciepła może oznaczać, że dyski PCIe5 są bardziej podatne na dławienie.

| Drive Performance Rating - Percent | |
| Alienware m18 R2 | |
| MSI Raider 18 HX A14V | |
| Acer Predator Helios 18 PH18-72-98MW | |
| MSI Titan 18 HX A14VIG | |
| Razer Blade 18 2024 RZ09-0509 | |
| Asus ROG Strix G18 G814JI | |
* ... im mniej tym lepiej
Disk Throttling: DiskSpd Read Loop, Queue Depth 8
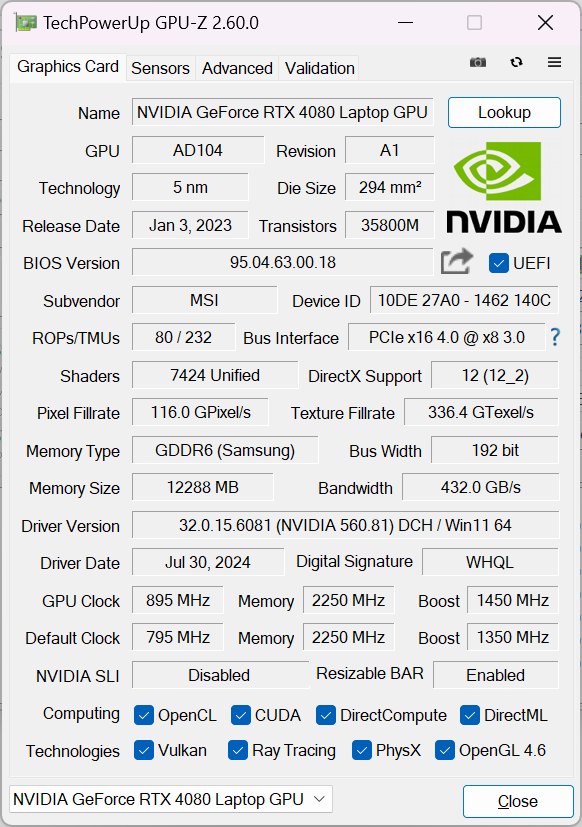
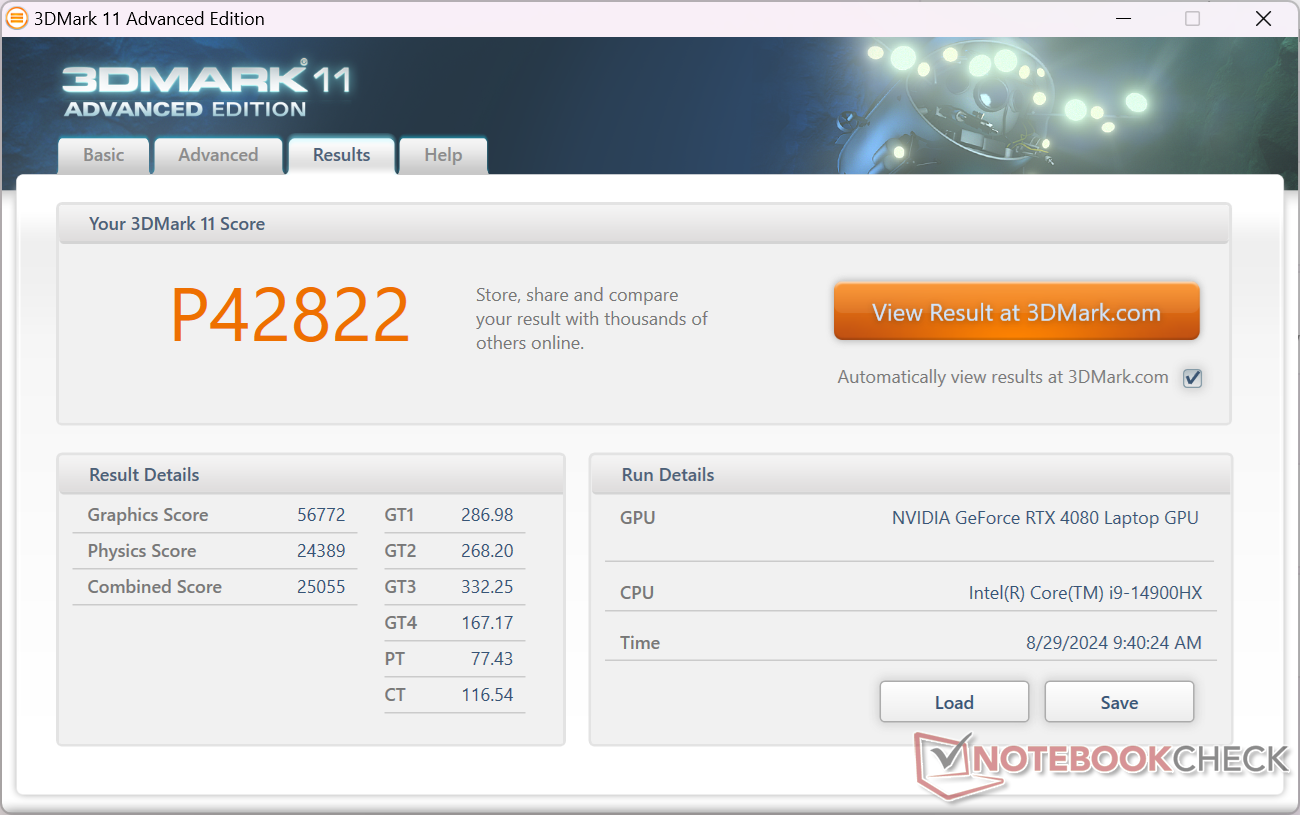
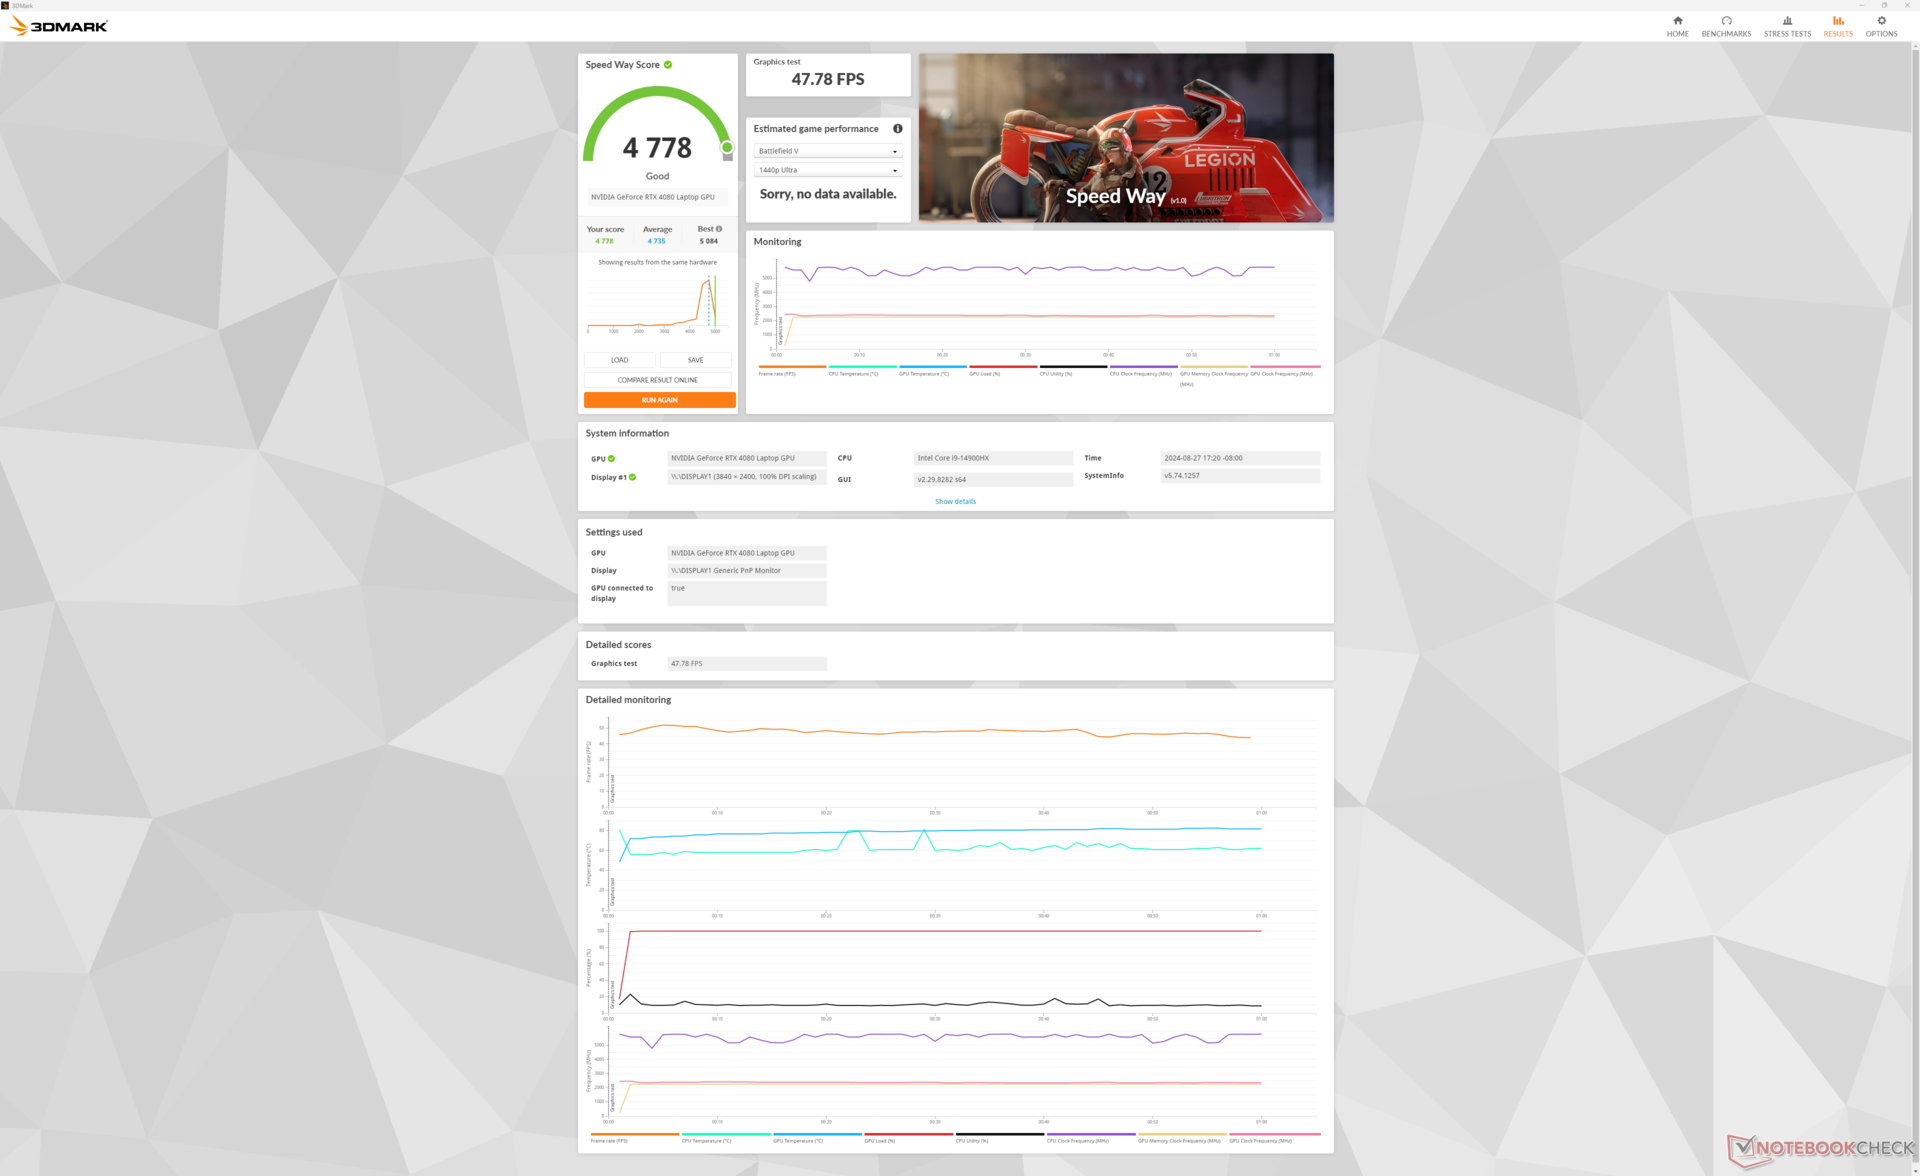
Wydajność GPU - Grafika TGP 175 W
W przeciwieństwie do cieńszych laptopów, które mogą być dostarczane ze słabszą grafiką 80 W GeForce RTX 4080większy Raider 18 HX jest dostarczany z mocniejszą wersją 175 W (150 W + 25 W dynamicznego doładowania). Wydajność jest o około 5 procent wyższa niż w przypadku przeciętnego laptopa w naszej bazie danych z tym samym GPU podczas gdy aktualizacja do RTX 4090 zwiększy wydajność o kolejne 10 procent.
Proszę pamiętać, że ogólna wydajność jest nadal od 30 do 35 procent wolniejsza niż w przypadku desktopowej wersji GeForce RTX 4080 mimo że wersja mobilna nosi tę samą nazwę. Nasz mobilny RTX 4080 jest zatem bliższy wydajności desktopowej RTX 4070.
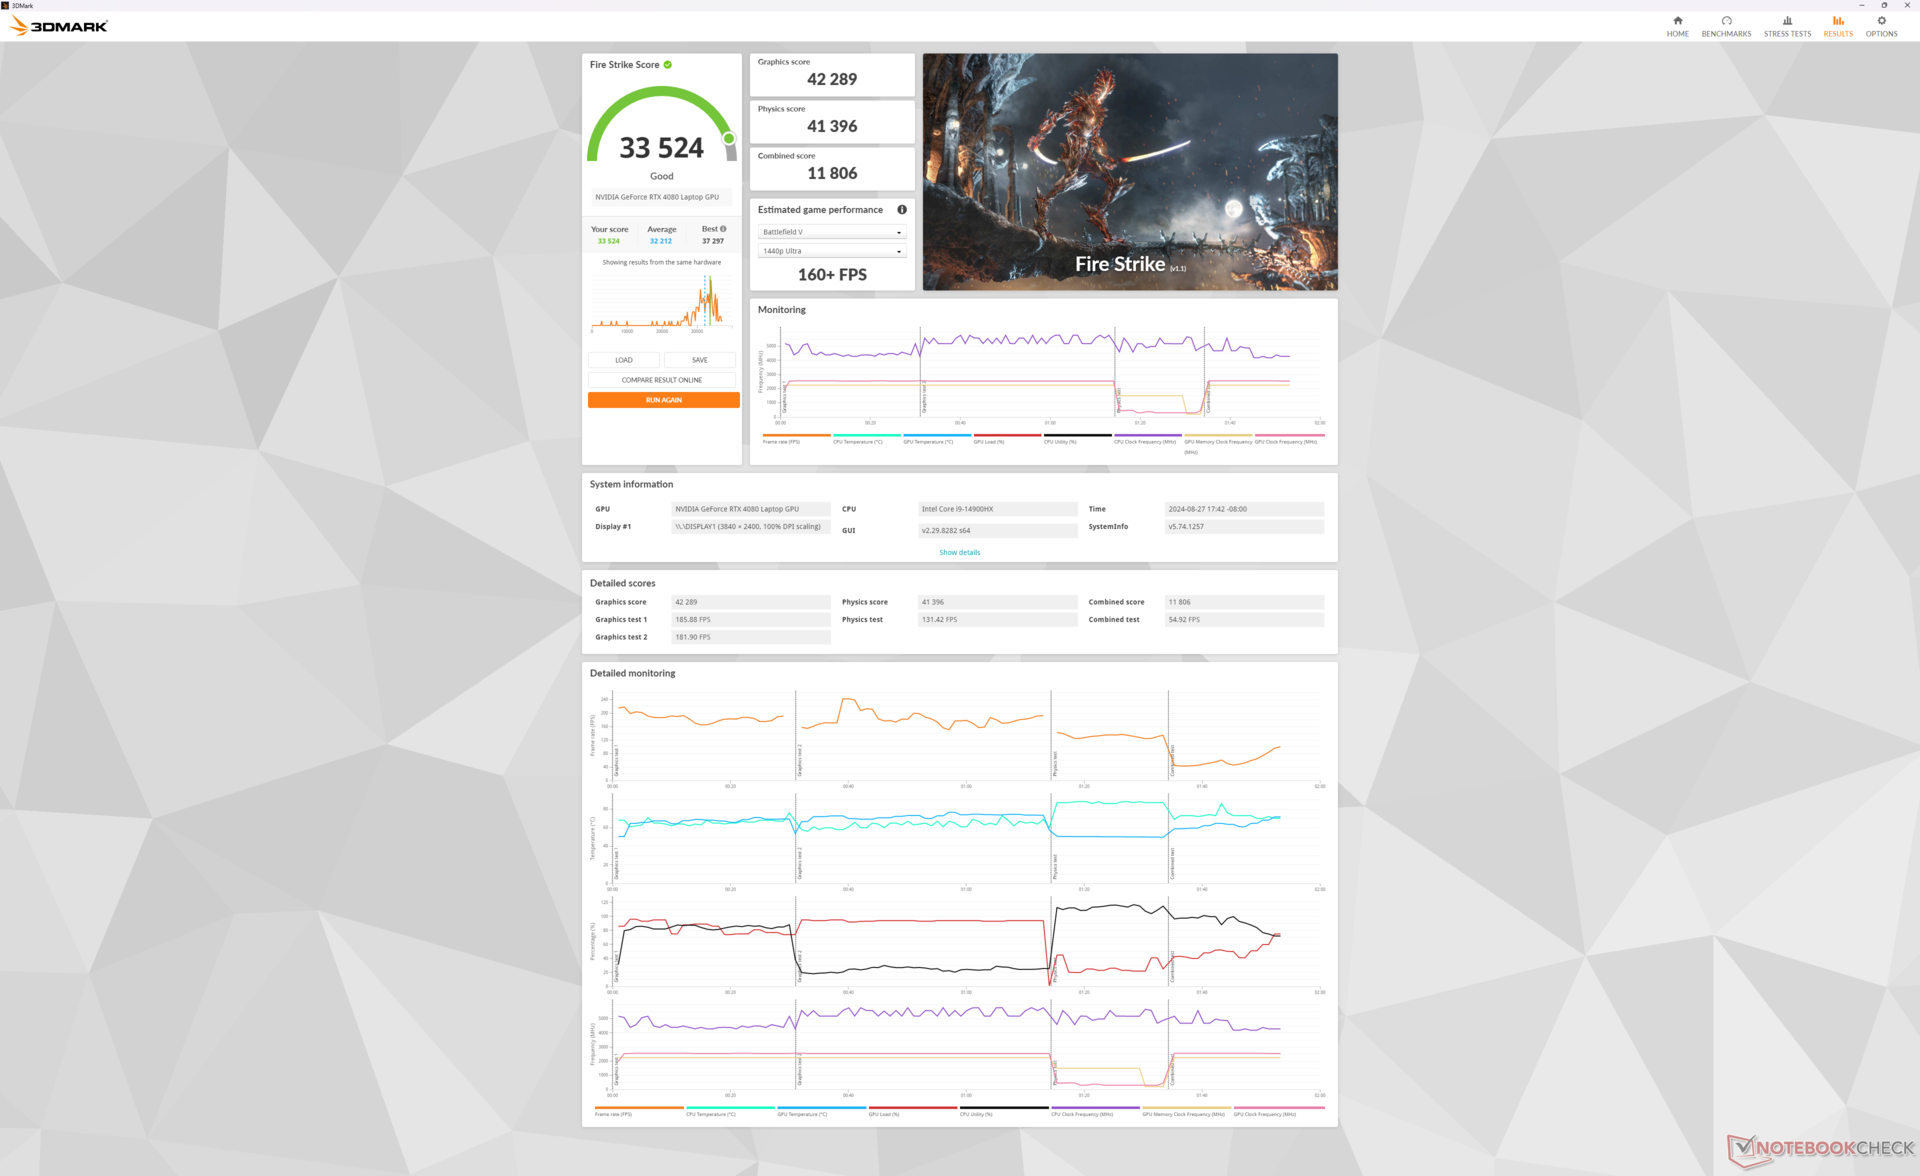
| Profil zasilania | Wynik grafiki | Wynik fizyki | Łączny wynik |
| Ekstremalna wydajność (Cooler Boost włączony) | 42289 | 41396 | 11806 |
| Ekstremalna wydajność (Cooler Boost wyłączony) | 41778 (-1%) | 40723 (-2%) | 11968 (-1%) |
| Tryb zrównoważony | 41673 (-2%) | 41013 (-1%) | 10404 (-12%) |
| Zasilanie bateryjne | 21731 (-49%) | 17988 (-57%) | 5809 (-51%) |
Przejście z trybu Ekstremalnej Wydajności do Trybu Zrównoważonego tylko nieznacznie wpływa na wydajność, co pokrywa się z powyższymi obserwacjami z testu obciążeniowego. Włączenie funkcji Cooler Boost również nie robi dużej różnicy, z wyjątkiem obniżenia temperatury rdzenia poprzez znaczne zwiększenie hałasu wentylatora.

| 3DMark Performance Rating - Percent | |
| NVIDIA GeForce RTX 4080 Founders Edition -1! | |
| Alienware m18 R2 -1! | |
| Razer Blade 18 2024 RZ09-0509 -1! | |
| MSI Raider 18 HX A14V | |
| Alienware m18 R1 AMD -2! | |
| Przeciętny NVIDIA GeForce RTX 4080 Laptop GPU | |
| Zotac Gaming GeForce RTX 4070 AMP Airo -1! | |
| Asus ROG Strix Scar 17 SE G733CX-LL014W -1! | |
| Alienware x17 RTX 3080 P48E -2! | |
| Asus ROG Strix G18 G814JI -2! | |
| SCHENKER XMG Ultra 17 Comet Lake -2! | |
| MSI Pulse GL76 12UGK -1! | |
| 3DMark 11 - 1280x720 Performance GPU | |
| NVIDIA GeForce RTX 4080 Founders Edition | |
| Alienware m18 R2 | |
| Razer Blade 18 2024 RZ09-0509 | |
| Alienware m18 R1 AMD | |
| Zotac Gaming GeForce RTX 4070 AMP Airo | |
| Przeciętny NVIDIA GeForce RTX 4080 Laptop GPU (45199 - 63128, n=24) | |
| MSI Raider 18 HX A14V | |
| Asus ROG Strix Scar 17 SE G733CX-LL014W | |
| Alienware x17 RTX 3080 P48E | |
| Asus ROG Strix G18 G814JI | |
| SCHENKER XMG Ultra 17 Comet Lake | |
| MSI Pulse GL76 12UGK | |
| 3DMark 11 Performance | 42822 pkt. | |
| 3DMark Fire Strike Score | 33524 pkt. | |
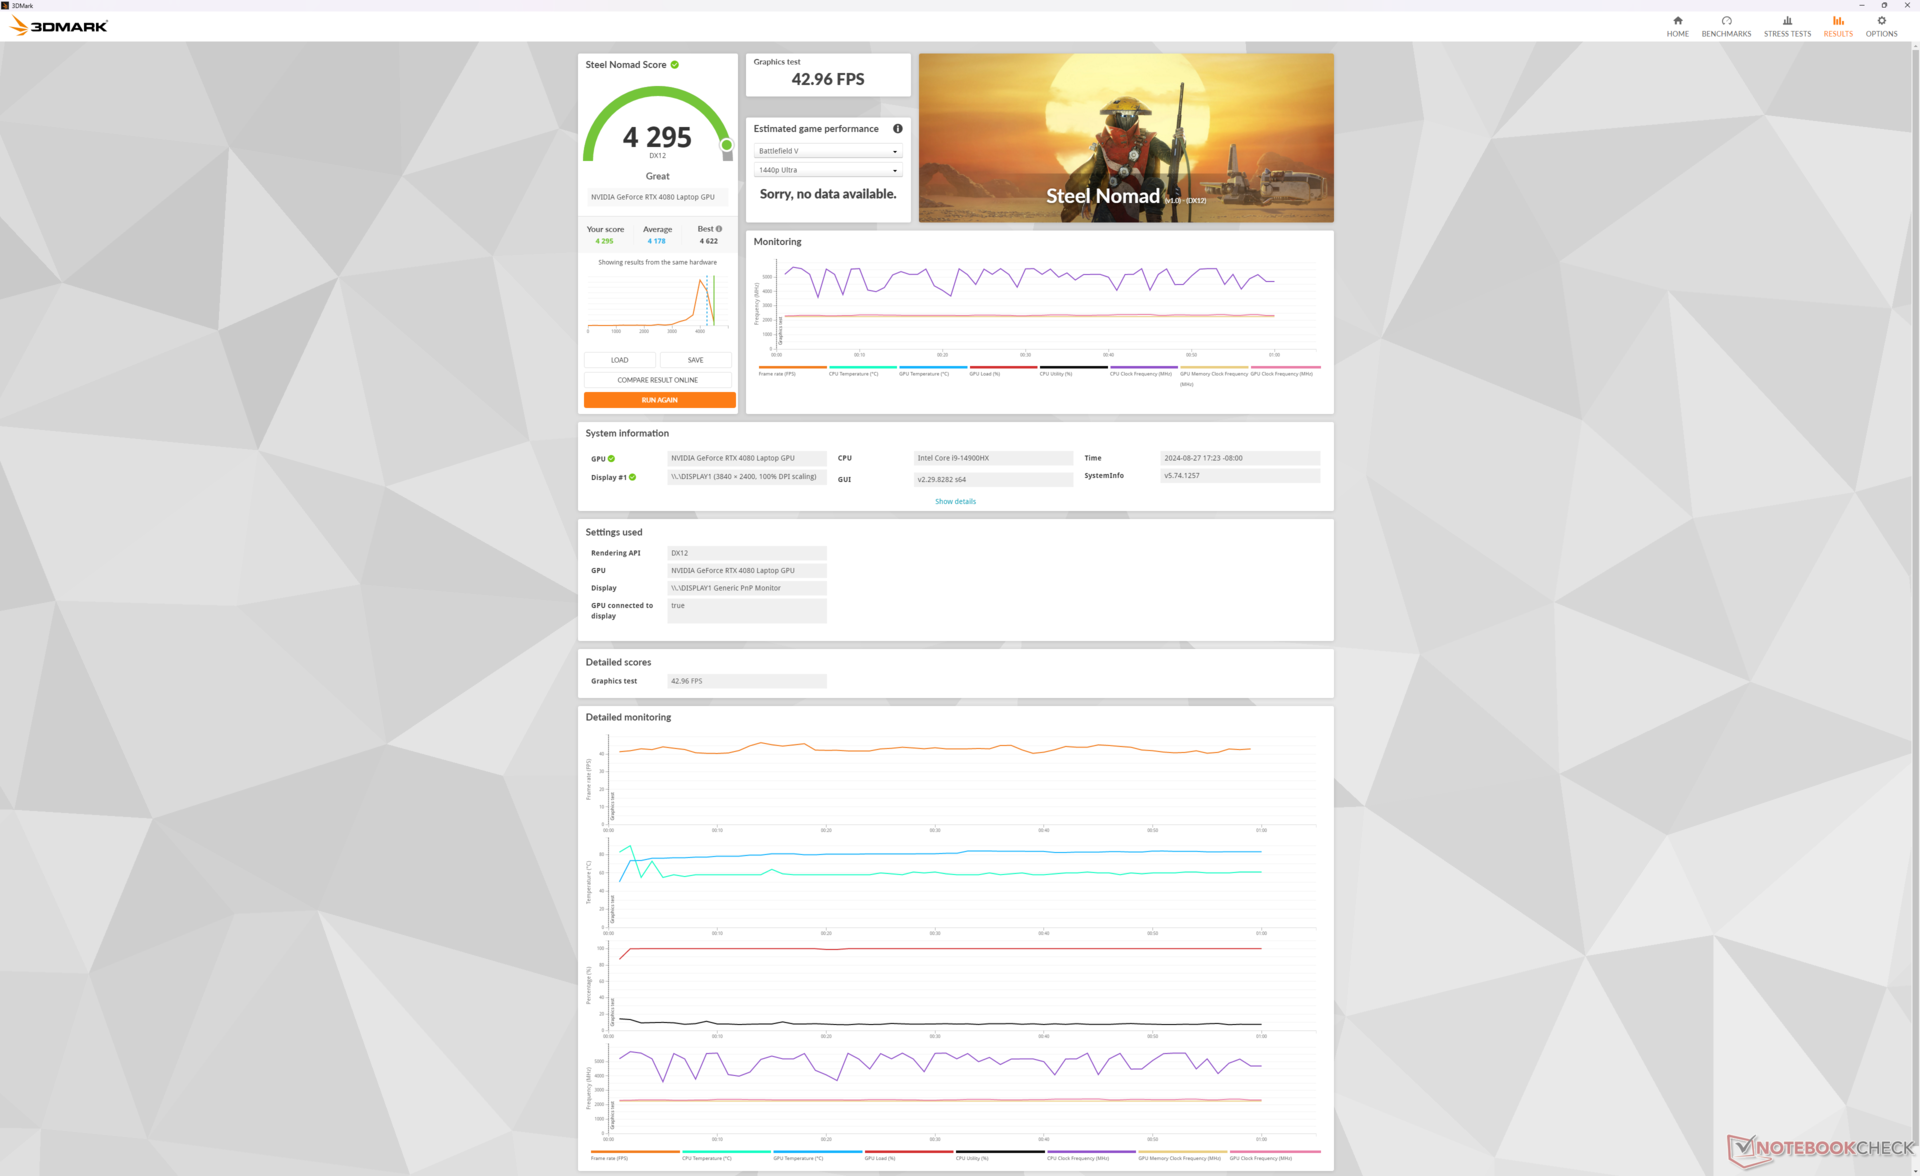
| 3DMark Time Spy Score | 18608 pkt. | |
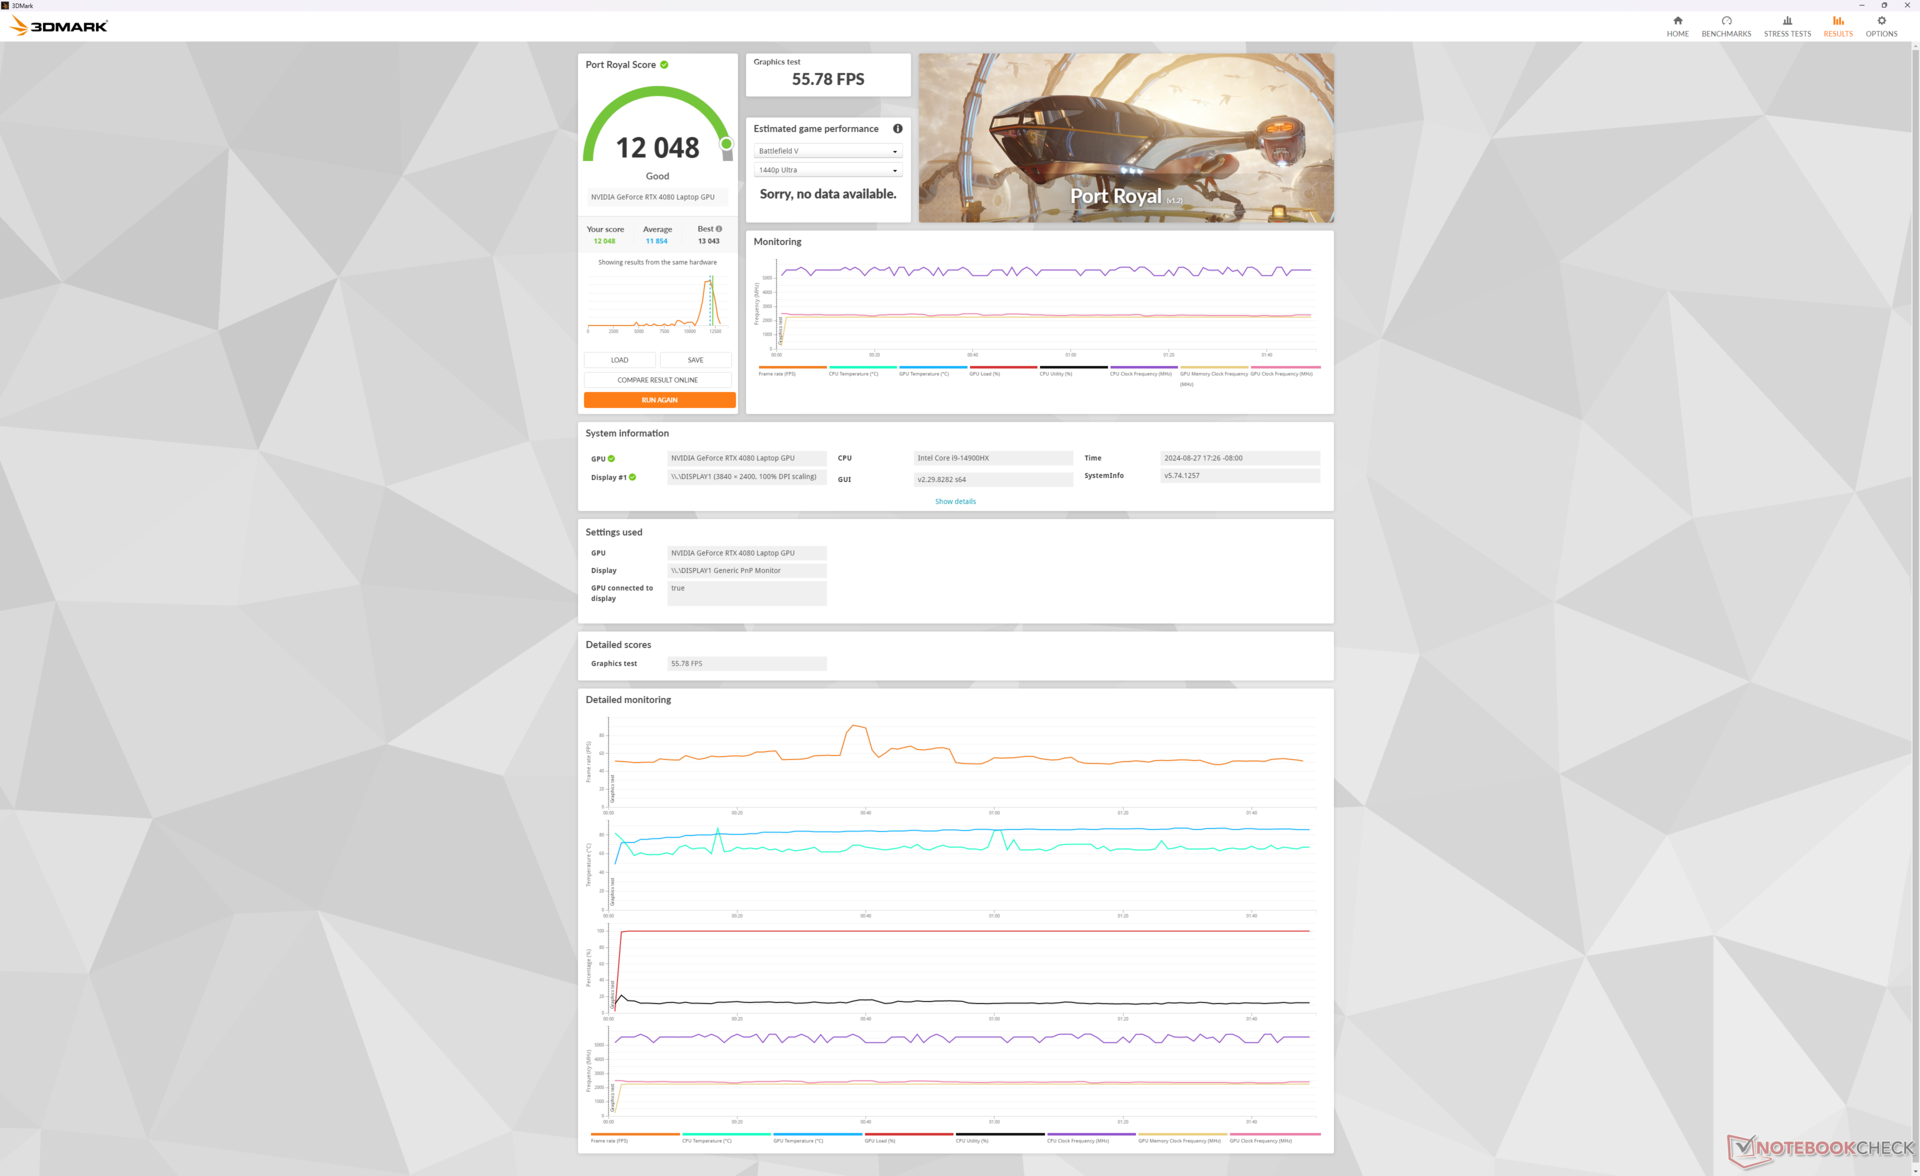
| 3DMark Steel Nomad Score | 4295 pkt. | |
Pomoc | ||
* ... im mniej tym lepiej
Wydajność w grach
Nowoczesne tytuły działają przyzwoicie w natywnej rozdzielczości 4K UHD+. DLSS jest zalecany przy uruchamianiu bardziej wymagających tytułów, takich jak Cyberpunk 2077, aby zwiększyć liczbę klatek na sekundę do 60 FPS.
Co dziwne, gra Baldur's Gate 3 nie uruchamiała się na naszym urządzeniu nawet po wielokrotnym resetowaniu systemu w trybach DX11 lub DX12.
| Performance Rating - Percent | |
| Alienware m18 R2 | |
| MSI Titan 18 HX A14VIG | |
| MSI Raider 18 HX A14V | |
| Razer Blade 18 2024 RZ09-0509 -1! | |
| Acer Predator Helios 18 PH18-72-98MW | |
| Asus ROG Strix G18 G814JI | |
| GTA V - 1920x1080 Highest Settings possible AA:4xMSAA + FX AF:16x | |
| MSI Raider 18 HX A14V | |
| MSI Titan 18 HX A14VIG | |
| Alienware m18 R2 | |
| Acer Predator Helios 18 PH18-72-98MW | |
| Razer Blade 18 2024 RZ09-0509 | |
| Asus ROG Strix G18 G814JI | |
| Final Fantasy XV Benchmark - 1920x1080 High Quality | |
| Alienware m18 R2 | |
| MSI Titan 18 HX A14VIG | |
| MSI Raider 18 HX A14V | |
| Acer Predator Helios 18 PH18-72-98MW | |
| Razer Blade 18 2024 RZ09-0509 | |
| Asus ROG Strix G18 G814JI | |
| Strange Brigade - 1920x1080 ultra AA:ultra AF:16 | |
| MSI Titan 18 HX A14VIG | |
| Alienware m18 R2 | |
| MSI Raider 18 HX A14V | |
| Razer Blade 18 2024 RZ09-0509 | |
| Acer Predator Helios 18 PH18-72-98MW | |
| Asus ROG Strix G18 G814JI | |
| Dota 2 Reborn - 1920x1080 ultra (3/3) best looking | |
| Acer Predator Helios 18 PH18-72-98MW | |
| MSI Titan 18 HX A14VIG | |
| MSI Raider 18 HX A14V | |
| Alienware m18 R2 | |
| Razer Blade 18 2024 RZ09-0509 | |
| Asus ROG Strix G18 G814JI | |
| X-Plane 11.11 - 1920x1080 high (fps_test=3) | |
| MSI Raider 18 HX A14V | |
| Alienware m18 R2 | |
| Razer Blade 18 2024 RZ09-0509 | |
| MSI Titan 18 HX A14VIG | |
| Acer Predator Helios 18 PH18-72-98MW | |
| Asus ROG Strix G18 G814JI | |
| Far Cry 5 - 1920x1080 Ultra Preset AA:T | |
| Alienware m18 R2 | |
| MSI Titan 18 HX A14VIG | |
| MSI Raider 18 HX A14V | |
| Asus ROG Strix G18 G814JI | |
| Acer Predator Helios 18 PH18-72-98MW | |
| Tiny Tina's Wonderlands | |
| 1920x1080 High Preset (DX12) | |
| Alienware m18 R2 | |
| MSI Raider 18 HX A14V | |
| Przeciętny NVIDIA GeForce RTX 4080 Laptop GPU (166.7 - 213, n=6) | |
| 1920x1080 Badass Preset (DX12) | |
| Alienware m18 R2 | |
| MSI Raider 18 HX A14V | |
| Alienware m18 R1 AMD | |
| Przeciętny NVIDIA GeForce RTX 4080 Laptop GPU (112.9 - 167.1, n=9) | |
| 2560x1440 Badass Preset (DX12) | |
| Alienware m18 R2 | |
| MSI Raider 18 HX A14V | |
| Alienware m18 R1 AMD | |
| Przeciętny NVIDIA GeForce RTX 4080 Laptop GPU (85 - 114.8, n=9) | |
| 3840x2160 Badass Preset (DX12) | |
| Alienware m18 R2 | |
| MSI Raider 18 HX A14V | |
| Alienware m18 R1 AMD | |
| Przeciętny NVIDIA GeForce RTX 4080 Laptop GPU (46.4 - 60.9, n=9) | |
| Far Cry 5 | |
| 1920x1080 Ultra Preset AA:T | |
| NVIDIA GeForce RTX 4080 Founders Edition | |
| Alienware m18 R2 | |
| MSI Raider 18 HX A14V | |
| Przeciętny NVIDIA GeForce RTX 4080 Laptop GPU (114 - 162, n=11) | |
| Asus ROG Strix G18 G814JI | |
| Alienware m18 R1 AMD | |
| Alienware x17 RTX 3080 P48E | |
| 2560x1440 Ultra Preset AA:T | |
| NVIDIA GeForce RTX 4080 Founders Edition | |
| Alienware m18 R2 | |
| MSI Raider 18 HX A14V | |
| Przeciętny NVIDIA GeForce RTX 4080 Laptop GPU (114 - 157, n=10) | |
| Alienware m18 R1 AMD | |
| Alienware x17 RTX 3080 P48E | |
| 3840x2160 Ultra Preset AA:T | |
| NVIDIA GeForce RTX 4080 Founders Edition | |
| Alienware m18 R2 | |
| Alienware m18 R1 AMD | |
| MSI Raider 18 HX A14V | |
| Przeciętny NVIDIA GeForce RTX 4080 Laptop GPU (71 - 97, n=6) | |
| Alienware x17 RTX 3080 P48E | |
Cyberpunk 2077 ultra FPS Chart
| low | med. | high | ultra | QHD | 4K | |
|---|---|---|---|---|---|---|
| GTA V (2015) | 185.1 | 183.8 | 181.6 | 143.4 | 134.6 | 158.3 |
| Dota 2 Reborn (2015) | 218 | 193.1 | 184.6 | 172.5 | 166.4 | |
| Final Fantasy XV Benchmark (2018) | 223 | 212 | 177 | 141.8 | 78.6 | |
| X-Plane 11.11 (2018) | 199 | 178.5 | 143.5 | 119.3 | ||
| Far Cry 5 (2018) | 173 | 163 | 151 | 149 | 96 | |
| Strange Brigade (2018) | 504 | 408 | 378 | 349 | 246 | 122.6 |
| Tiny Tina's Wonderlands (2022) | 352.5 | 292.6 | 203.3 | 159.4 | 111.2 | 60.9 |
| F1 22 (2022) | 305 | 299 | 271 | 121.2 | 77.8 | 39.8 |
| Cyberpunk 2077 2.2 Phantom Liberty (2023) | 150.6 | 150 | 140.7 | 125.5 | 82.5 | 35.1 |
Emisje - cicho na biegu jałowym, głośno podczas grania
Hałas systemowy
Hałas i zachowanie wentylatora są podobne do Titan 18 HX pomimo różnic w rozwiązaniach chłodzących. Wentylatory są podatne na pulsowanie nawet podczas przeglądania stron internetowych w trybie zrównoważonym lub cichym, podobnie jak w przypadku Titana, ale na szczęście wzrost hałasu nie jest na tyle ostry, aby rozpraszać uwagę.
MSI Center ma bezpośredni wpływ na wrażenia z rozgrywki, ponieważ hałas wentylatorów jest ściśle powiązany z wybranym profilem zasilania. Uruchomienie Cyberpunk 2077 w trybie zrównoważonym, trybie ekstremalnej wydajności z wyłączonym Cooler Boost i trybie ekstremalnej wydajności z włączonym Cooler Boost skutkowałoby stabilnym hałasem wentylatora wynoszącym odpowiednio 52,8 dB(A), 59,4 dB(A) i 62,7 dB(A). Różnica w hałasie pomiędzy trybami Balanced i Extreme Performance jest znacząca, mimo że różnica w wydajności pomiędzy nimi jest niewielka, co oznacza, że tryb Balanced jest zalecany dla większości scenariuszy gamingowych. Cooler Boost jest zatem przydatny głównie w przypadku ręcznego podkręcania, ponieważ w przeciwnym razie nie zapewnia większych korzyści w grach przy ustawieniach fabrycznych.
Zakres od niskiego do średniego 50 dB(A) podczas grania jest najbardziej podobny do Blade 18 lub Alienware m18 R2. Słuchawki są zalecane szczególnie w przypadku grania w trybie ekstremalnej wydajności.
Hałas
| luz |
| 28.6 / 28.6 / 31.3 dB |
| obciążenie |
| 44.1 / 62.7 dB |
 | ||
30 dB cichy 40 dB(A) słyszalny 50 dB(A) irytujący |
||
min: | ||
| MSI Raider 18 HX A14V NVIDIA GeForce RTX 4080 Laptop GPU, i9-14900HX, Samsung PM9A1 MZVL22T0HBLB | Razer Blade 18 2024 RZ09-0509 NVIDIA GeForce RTX 4090 Laptop GPU, i9-14900HX | Alienware m18 R2 NVIDIA GeForce RTX 4090 Laptop GPU, i9-14900HX, SK Hynix PC811 HFS002TEM9X152N | MSI Titan 18 HX A14VIG NVIDIA GeForce RTX 4090 Laptop GPU, i9-14900HX, 2x Samsung PM9A1a MZVL22T0HDLB (RAID 0) | Asus ROG Strix G18 G814JI NVIDIA GeForce RTX 4070 Laptop GPU, i7-13650HX, Micron 2400 MTFDKBA1T0QFM | Acer Predator Helios 18 PH18-72-98MW NVIDIA GeForce RTX 4090 Laptop GPU, i9-14900HX, 2x SK Hynix HFS001TEJ9X115N (RAID 0) | |
|---|---|---|---|---|---|---|
| Noise | 7% | 11% | 10% | 8% | -12% | |
| wyłączone / środowisko * | 23.3 | 23.4 -0% | 23.6 -1% | 22.8 2% | 25 -7% | 25 -7% |
| Idle Minimum * | 28.6 | 23.9 16% | 23.8 17% | 23.8 17% | 26 9% | 30 -5% |
| Idle Average * | 28.6 | 28.2 1% | 26.1 9% | 23.8 17% | 28 2% | 36 -26% |
| Idle Maximum * | 31.3 | 29 7% | 31.5 -1% | 28 11% | 29 7% | 44 -41% |
| Load Average * | 44.1 | 36.8 17% | 31.5 29% | 38 14% | 41 7% | 48 -9% |
| Cyberpunk 2077 ultra * | 59.4 | |||||
| Load Maximum * | 62.7 | 61.1 3% | 56.6 10% | 62.8 -0% | 46 27% | 51 19% |
| Witcher 3 ultra * | 54.1 | 52.1 | 57.3 | 44 | 49 |
* ... im mniej tym lepiej
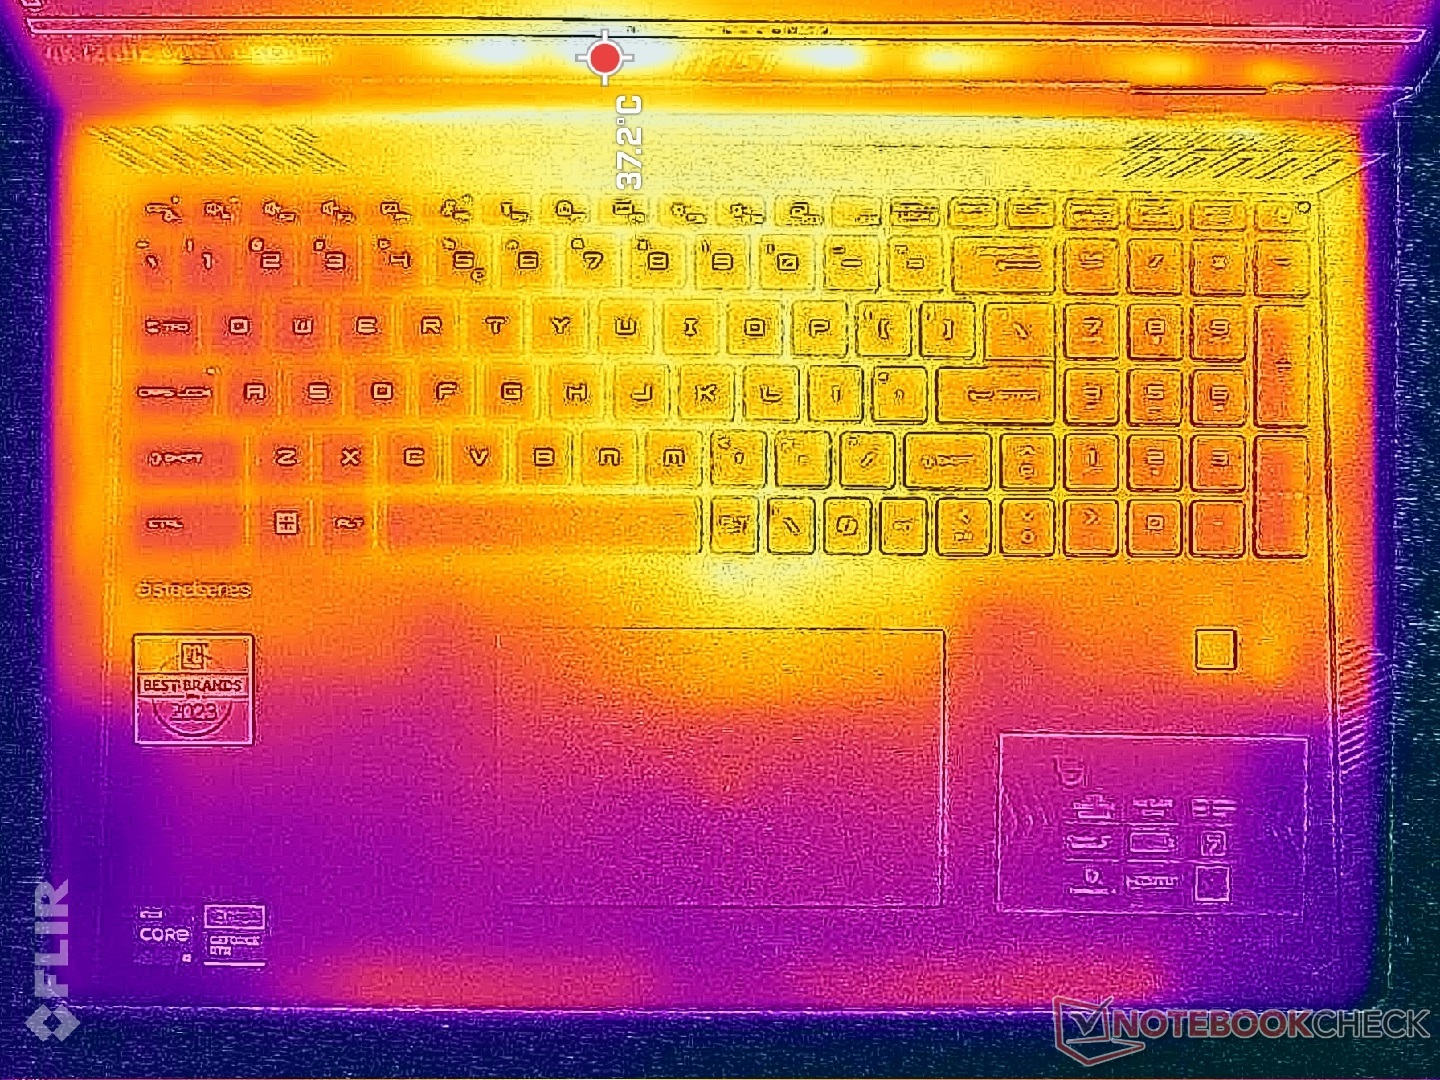
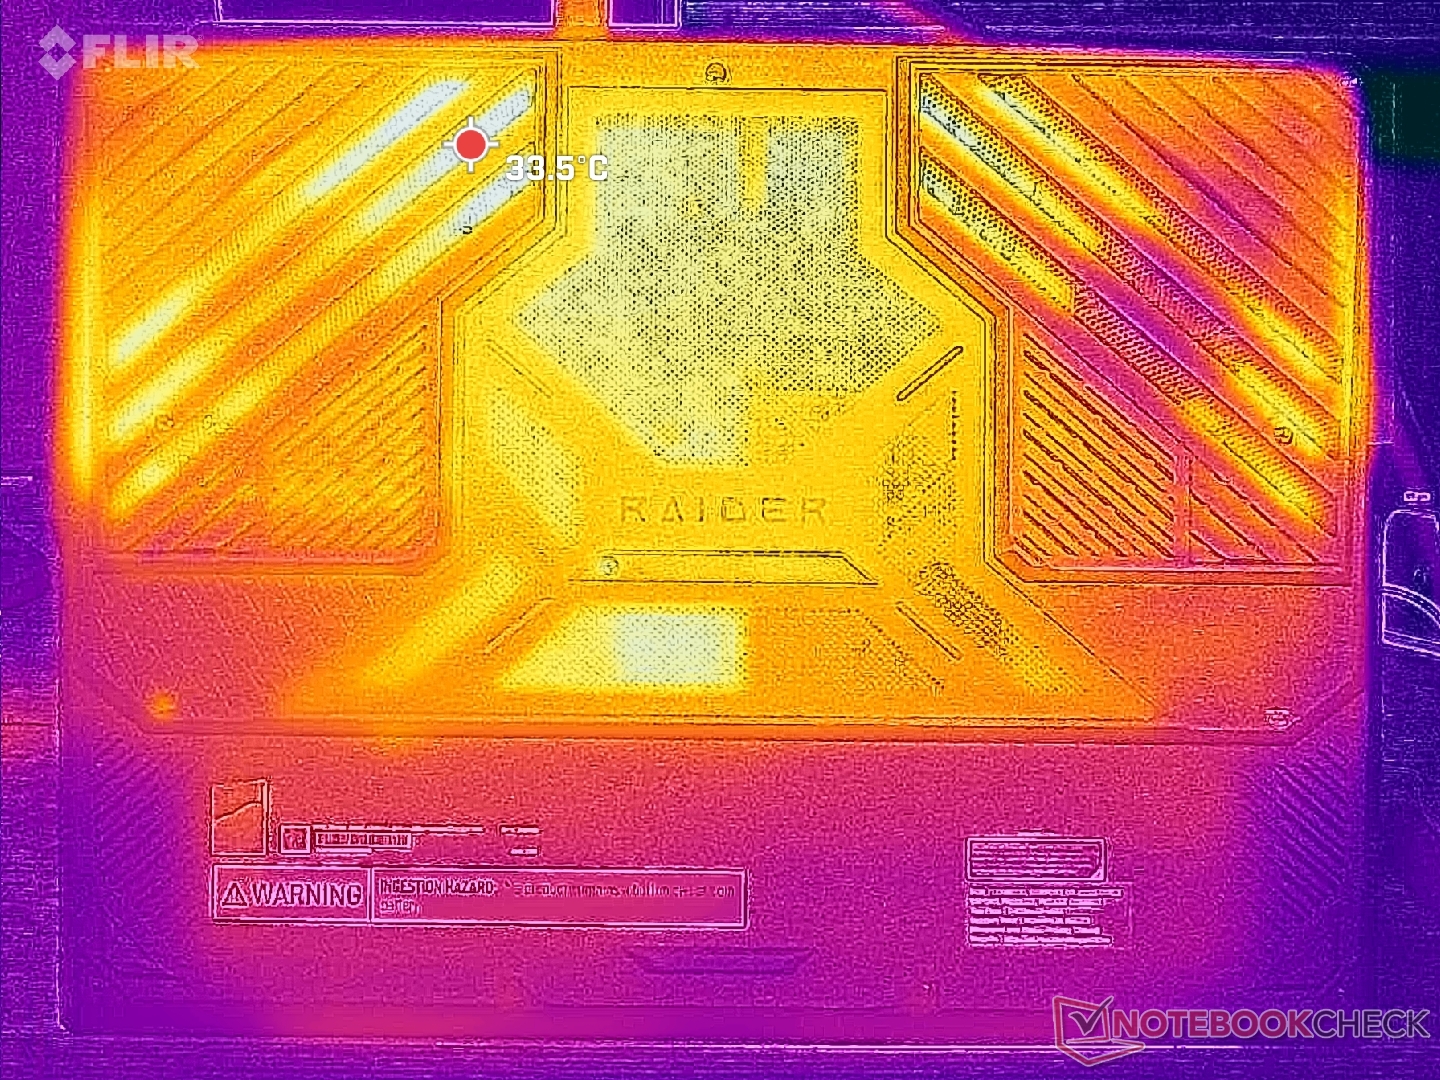
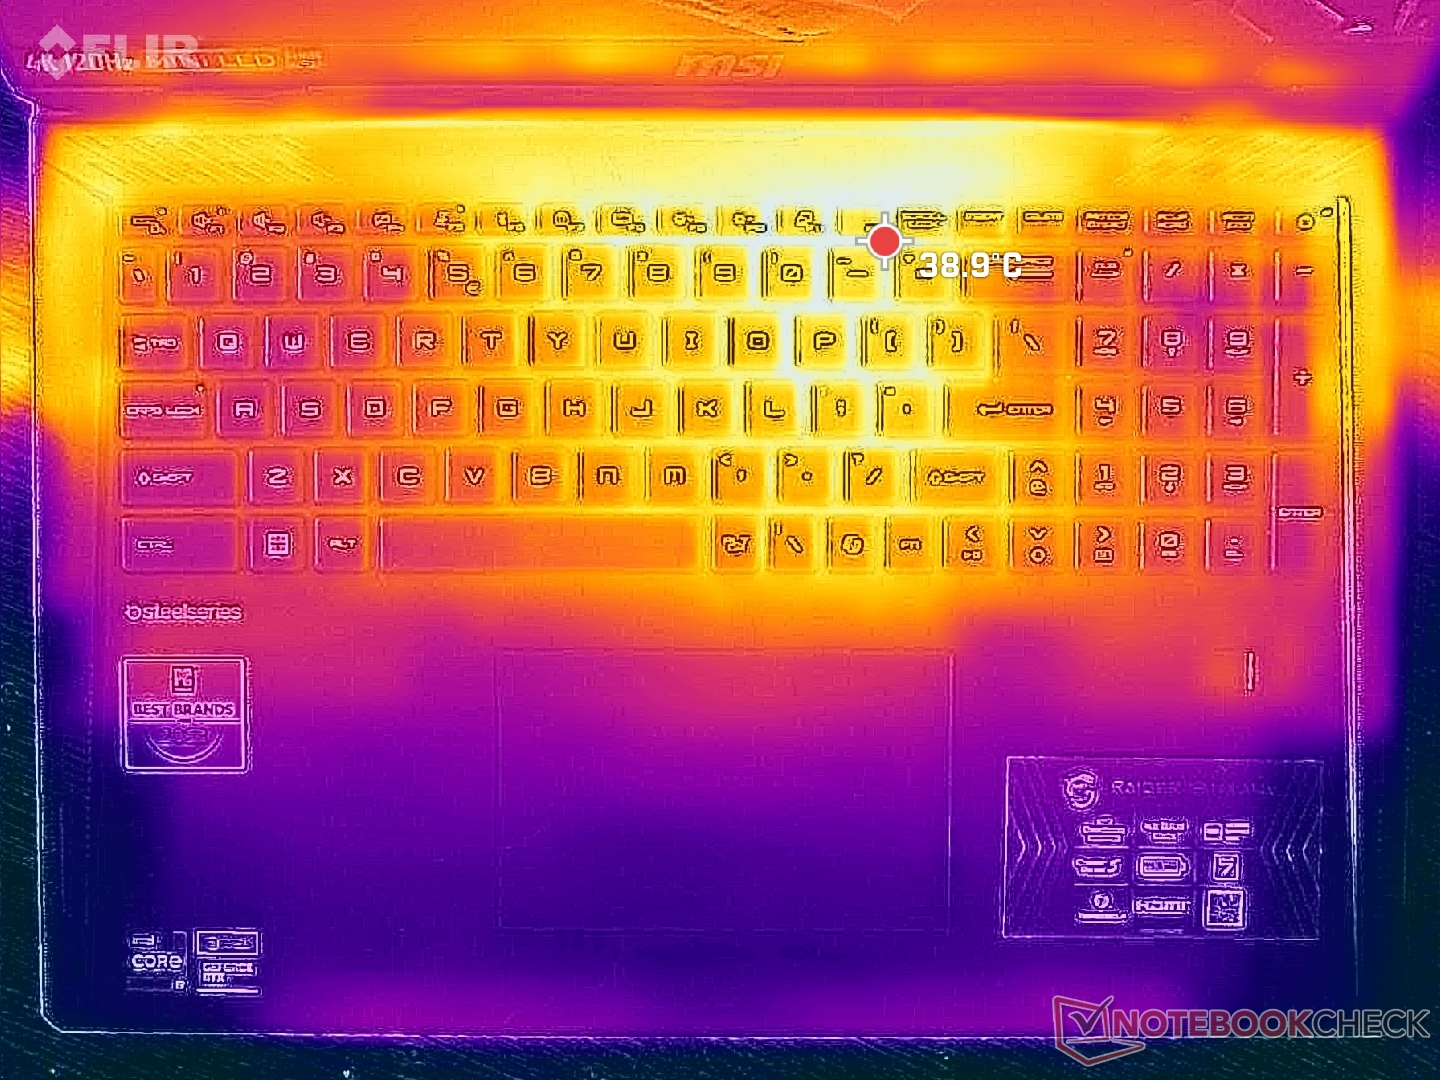
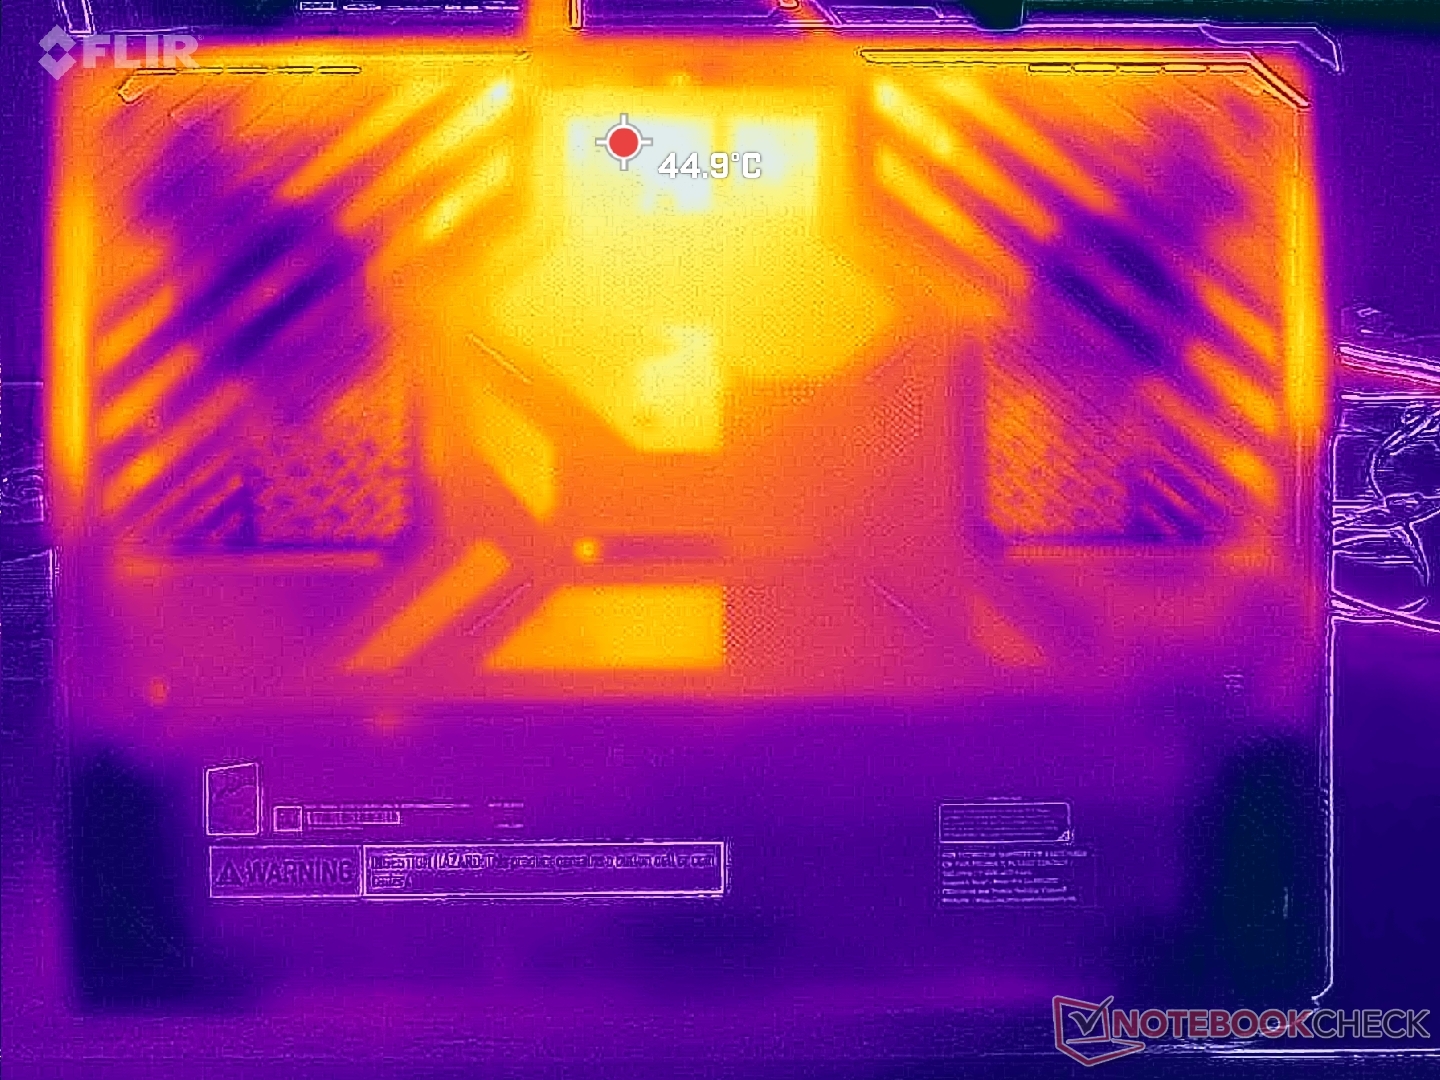
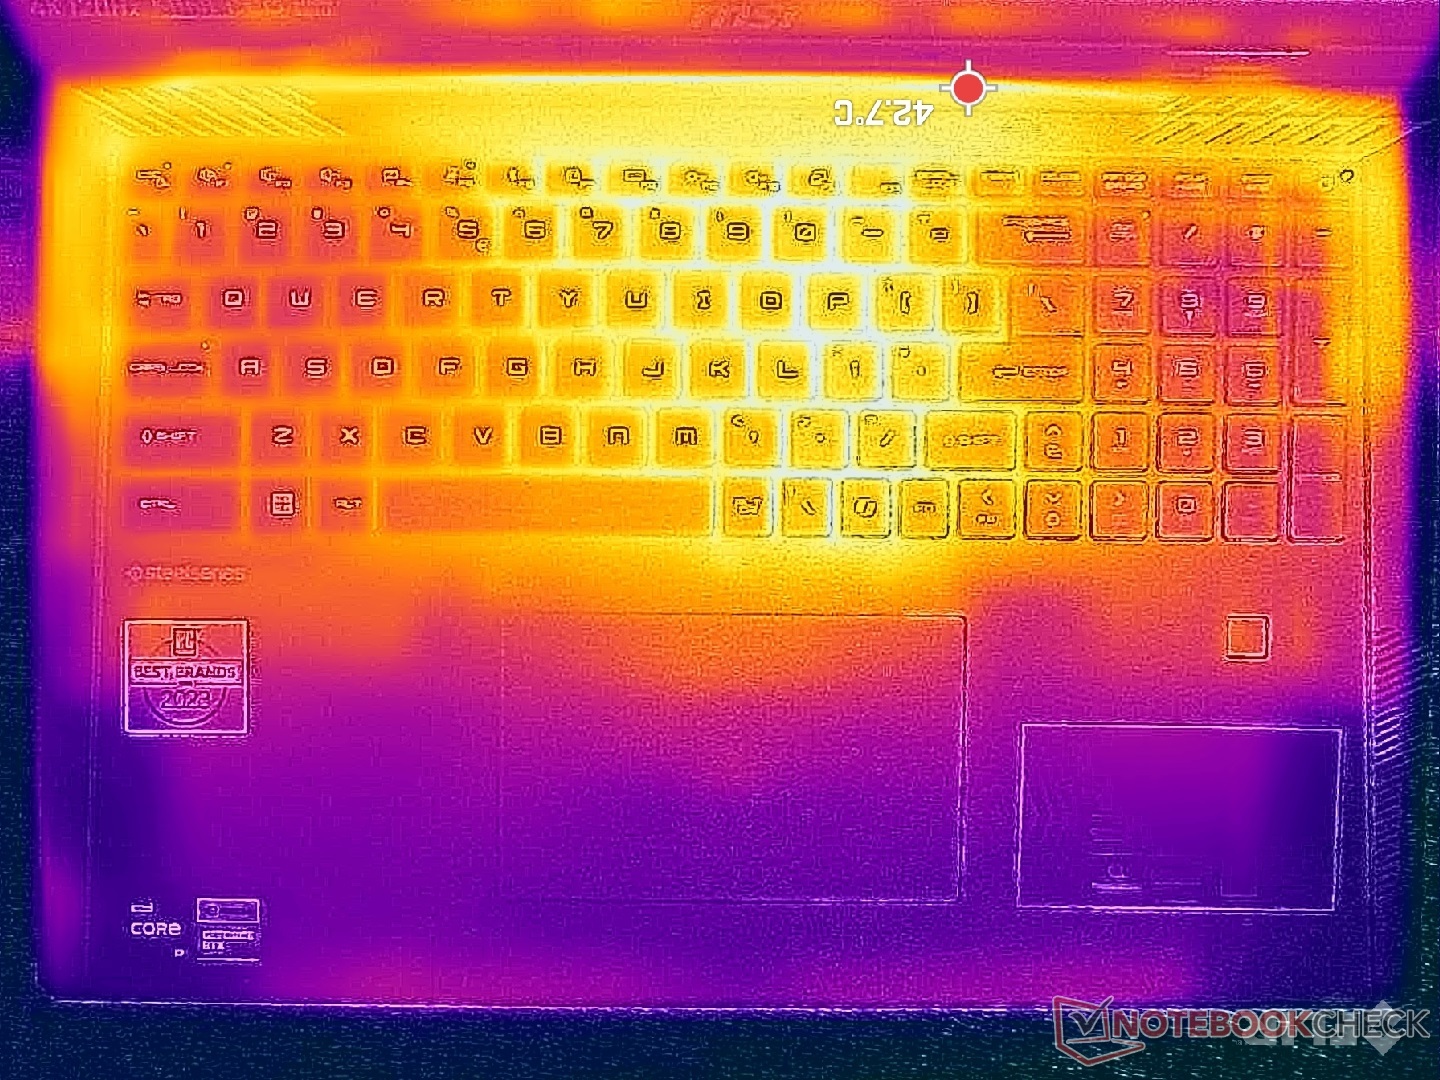
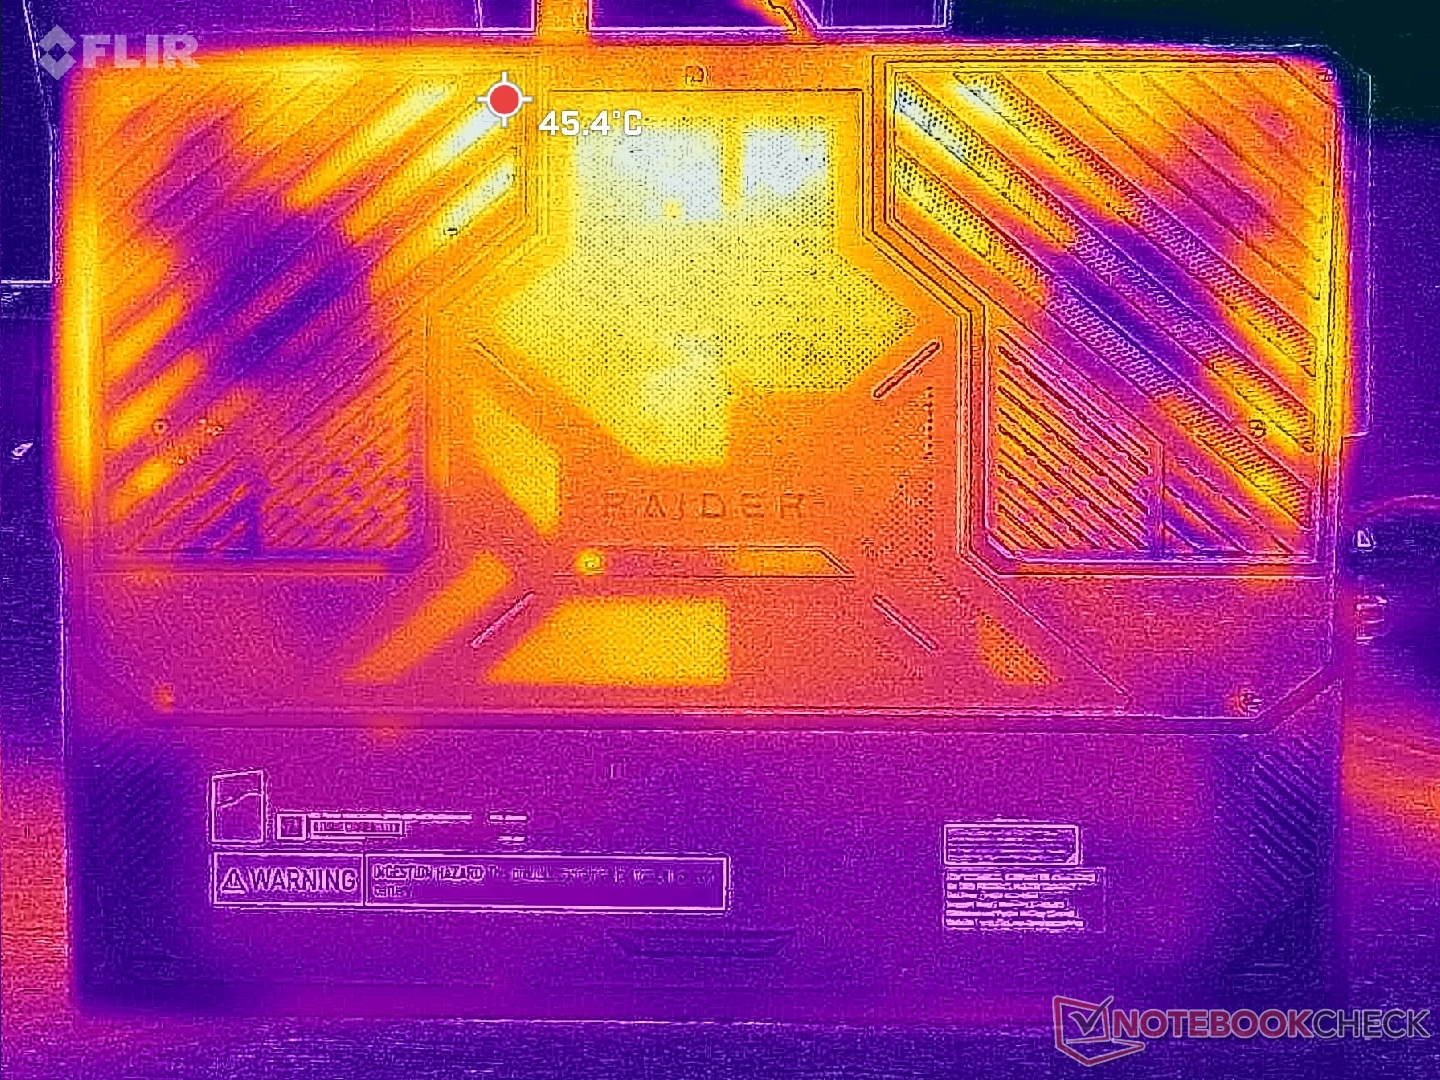
Temperatura
Gorące punkty mogą osiągnąć nieco ponad 40 C podczas grania, podobnie jak na Titan 18 HX. Gorętsze obszary znajdują się w kierunku środka klawiatury, więc klawisze WASD, numpad i podpórki pod nadgarstki pozostaną znacznie chłodniejsze i wygodniejsze dla skóry.
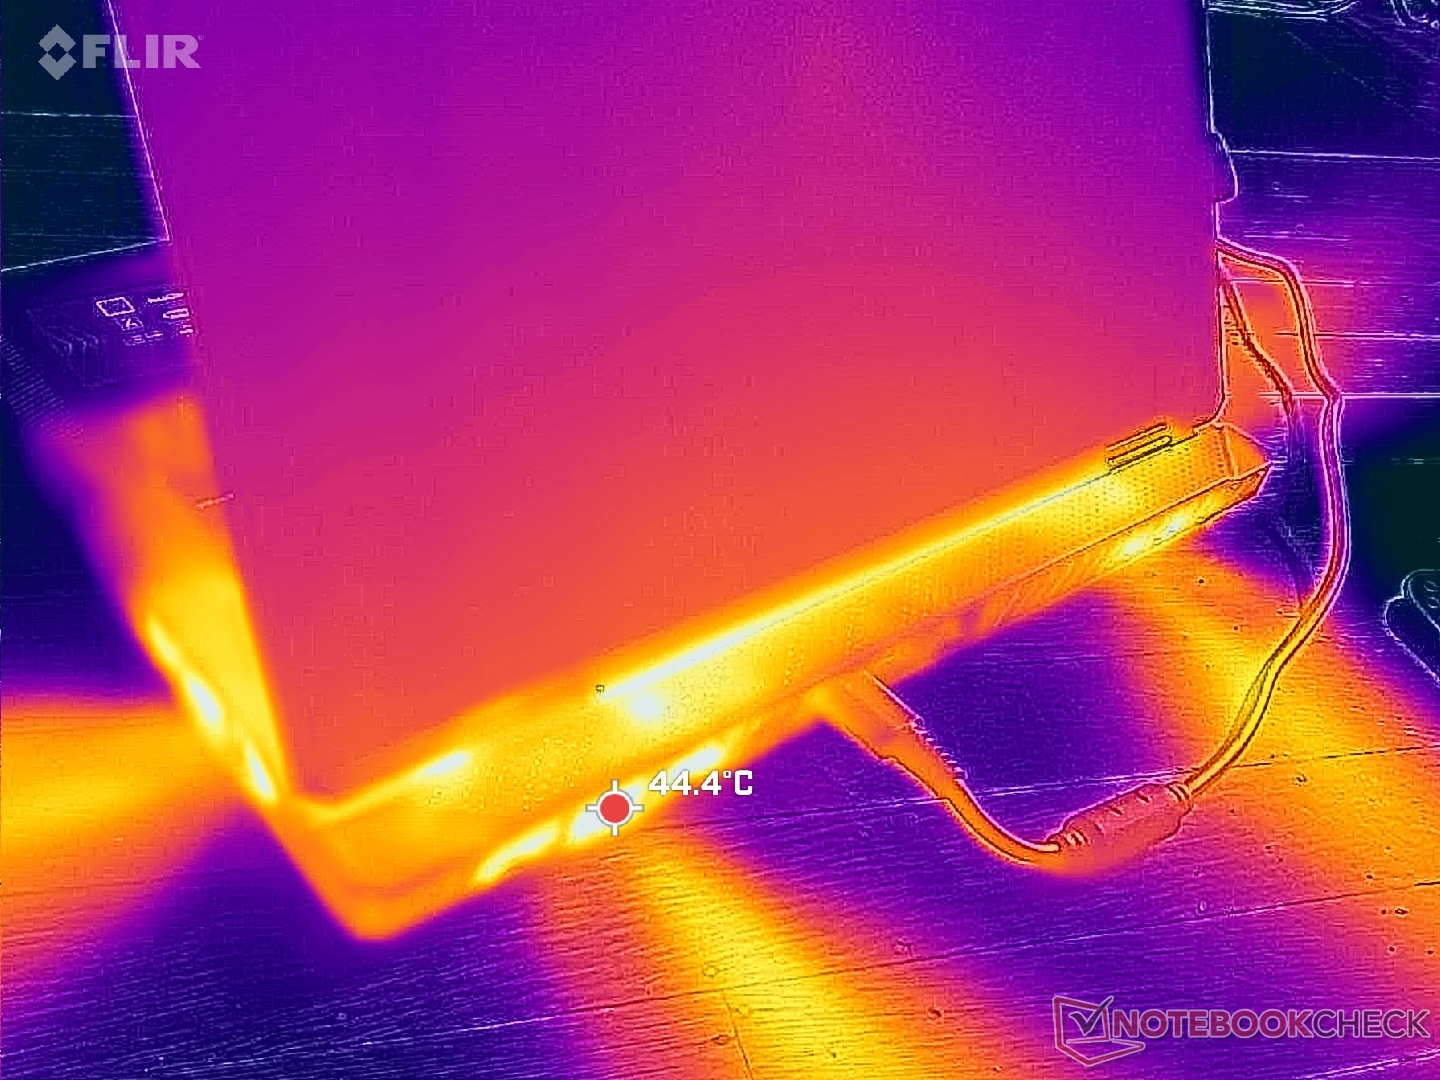
(±) Maksymalna temperatura w górnej części wynosi 40.8 °C / 105 F, w porównaniu do średniej 40.4 °C / 105 F , począwszy od 21.2 do 68.8 °C dla klasy Gaming.
(±) Dno nagrzewa się maksymalnie do 43.4 °C / 110 F, w porównaniu do średniej 43.2 °C / 110 F
(±) W stanie bezczynności średnia temperatura górnej części wynosi 33.7 °C / 93 F, w porównaniu ze średnią temperaturą urządzenia wynoszącą 33.9 °C / ### class_avg_f### F.
(±) 3: The average temperature for the upper side is 34.4 °C / 94 F, compared to the average of 33.9 °C / 93 F for the class Gaming.
(+) Podparcia dłoni i touchpad osiągają maksymalną temperaturę skóry (32.6 °C / 90.7 F) i dlatego nie są gorące.
(-) Średnia temperatura obszaru podparcia dłoni w podobnych urządzeniach wynosiła 28.9 °C / 84 F (-3.7 °C / -6.7 F).
| MSI Raider 18 HX A14V Intel Core i9-14900HX, NVIDIA GeForce RTX 4080 Laptop GPU | Razer Blade 18 2024 RZ09-0509 Intel Core i9-14900HX, NVIDIA GeForce RTX 4090 Laptop GPU | Alienware m18 R2 Intel Core i9-14900HX, NVIDIA GeForce RTX 4090 Laptop GPU | MSI Titan 18 HX A14VIG Intel Core i9-14900HX, NVIDIA GeForce RTX 4090 Laptop GPU | Asus ROG Strix G18 G814JI Intel Core i7-13650HX, NVIDIA GeForce RTX 4070 Laptop GPU | Acer Predator Helios 18 PH18-72-98MW Intel Core i9-14900HX, NVIDIA GeForce RTX 4090 Laptop GPU | |
|---|---|---|---|---|---|---|
| Heat | -1% | -5% | 6% | 5% | -6% | |
| Maximum Upper Side * | 40.8 | 43.2 -6% | 41.2 -1% | 37.8 7% | 45 -10% | 43 -5% |
| Maximum Bottom * | 43.4 | 42.6 2% | 34.6 20% | 37.6 13% | 47 -8% | 59 -36% |
| Idle Upper Side * | 36.4 | 36 1% | 42.8 -18% | 34.8 4% | 28 23% | 32 12% |
| Idle Bottom * | 36.4 | 36.4 -0% | 43.6 -20% | 36 1% | 31 15% | 34 7% |
* ... im mniej tym lepiej
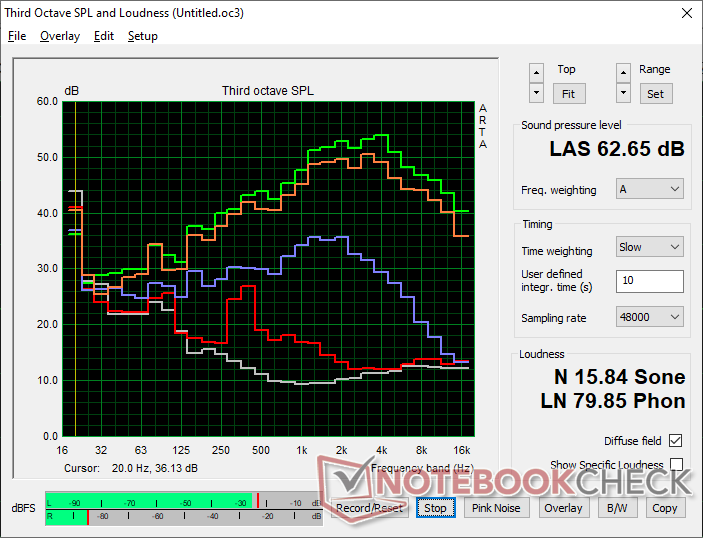
Głośniki
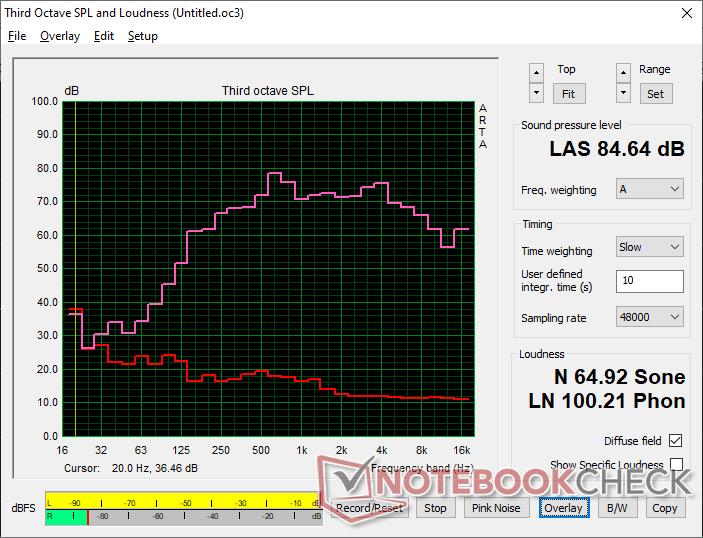
MSI Raider 18 HX A14V analiza dźwięku
(+) | głośniki mogą odtwarzać stosunkowo głośno (84.6 dB)
Bas 100 - 315 Hz
(±) | zredukowany bas - średnio 9.2% niższy od mediany
(±) | liniowość basu jest średnia (9.2% delta do poprzedniej częstotliwości)
Średnie 400 - 2000 Hz
(+) | zbalansowane środki średnie - tylko 4.3% od mediany
(+) | średnie są liniowe (5.1% delta do poprzedniej częstotliwości)
Wysokie 2–16 kHz
(+) | zrównoważone maksima - tylko 3.8% od mediany
(+) | wzloty są liniowe (4.9% delta do poprzedniej częstotliwości)
Ogólnie 100 - 16.000 Hz
(+) | ogólny dźwięk jest liniowy (11.9% różnicy w stosunku do mediany)
W porównaniu do tej samej klasy
» 11% wszystkich testowanych urządzeń w tej klasie było lepszych, 4% podobnych, 85% gorszych
» Najlepszy miał deltę 6%, średnia wynosiła ###średnia###%, najgorsza wynosiła 132%
W porównaniu do wszystkich testowanych urządzeń
» 8% wszystkich testowanych urządzeń było lepszych, 2% podobnych, 90% gorszych
» Najlepszy miał deltę 4%, średnia wynosiła ###średnia###%, najgorsza wynosiła 134%
Apple MacBook Pro 16 2021 M1 Pro analiza dźwięku
(+) | głośniki mogą odtwarzać stosunkowo głośno (84.7 dB)
Bas 100 - 315 Hz
(+) | dobry bas - tylko 3.8% od mediany
(+) | bas jest liniowy (5.2% delta do poprzedniej częstotliwości)
Średnie 400 - 2000 Hz
(+) | zbalansowane środki średnie - tylko 1.3% od mediany
(+) | średnie są liniowe (2.1% delta do poprzedniej częstotliwości)
Wysokie 2–16 kHz
(+) | zrównoważone maksima - tylko 1.9% od mediany
(+) | wzloty są liniowe (2.7% delta do poprzedniej częstotliwości)
Ogólnie 100 - 16.000 Hz
(+) | ogólny dźwięk jest liniowy (4.6% różnicy w stosunku do mediany)
W porównaniu do tej samej klasy
» 0% wszystkich testowanych urządzeń w tej klasie było lepszych, 0% podobnych, 100% gorszych
» Najlepszy miał deltę 5%, średnia wynosiła ###średnia###%, najgorsza wynosiła 45%
W porównaniu do wszystkich testowanych urządzeń
» 0% wszystkich testowanych urządzeń było lepszych, 0% podobnych, 100% gorszych
» Najlepszy miał deltę 4%, średnia wynosiła ###średnia###%, najgorsza wynosiła 134%
Zarządzanie energią
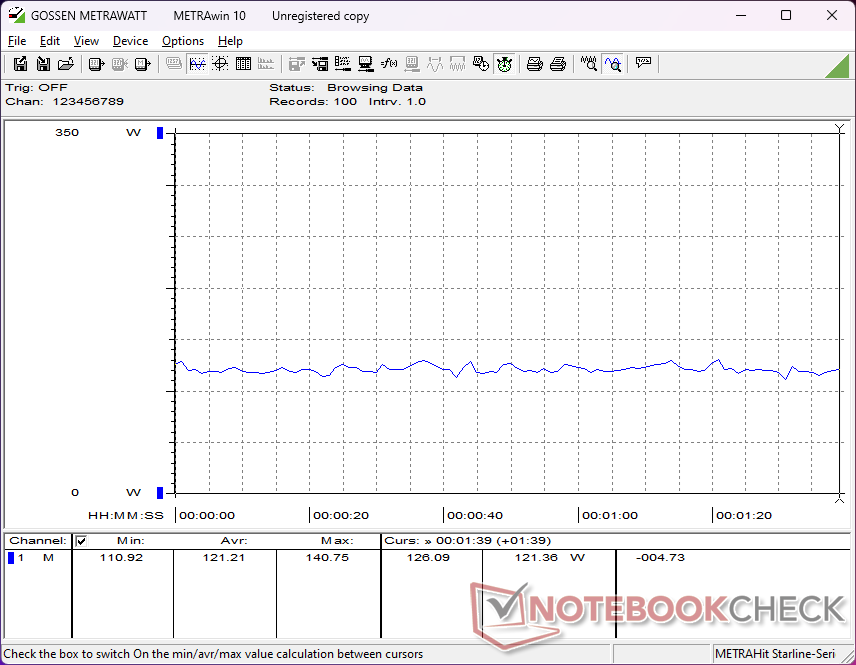
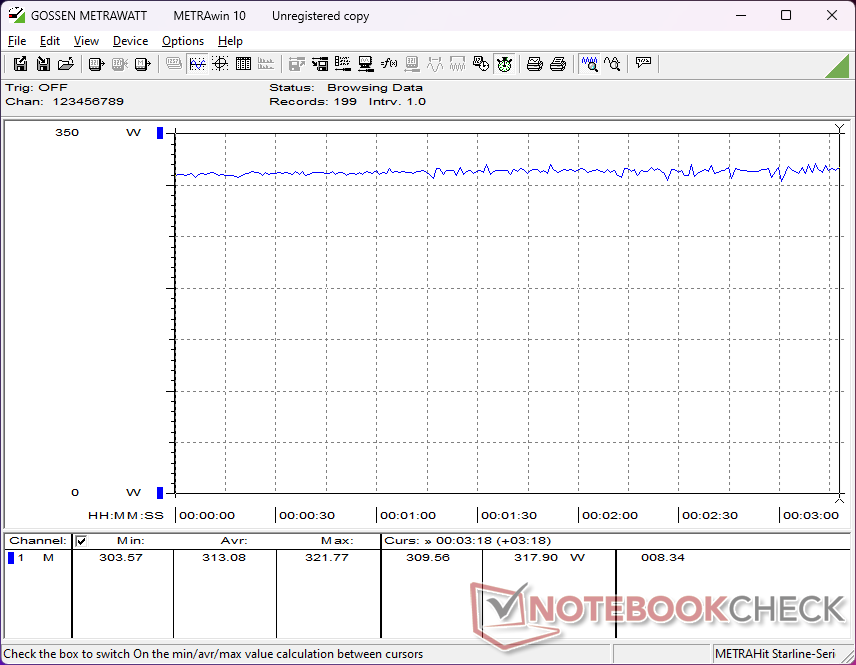
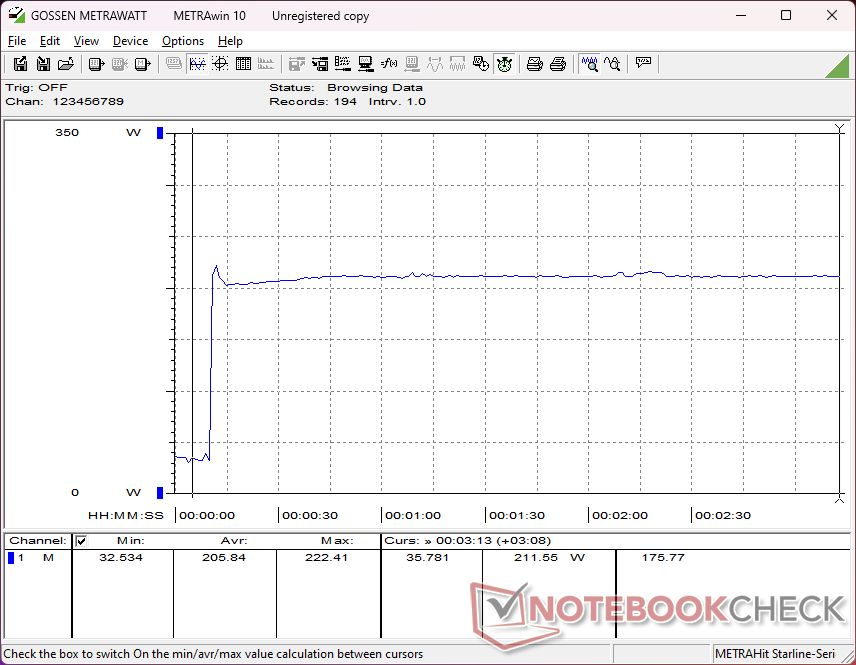
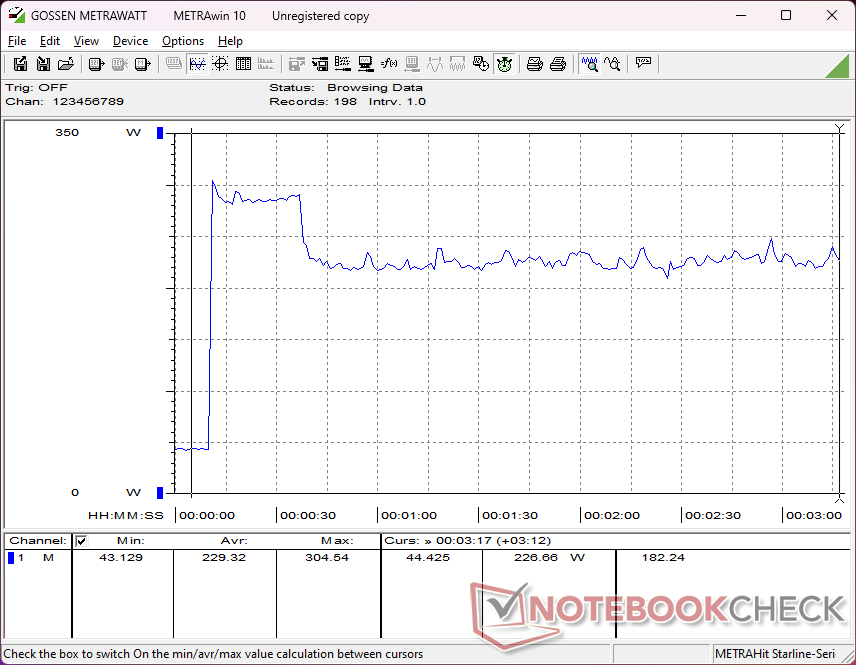
Zużycie energii
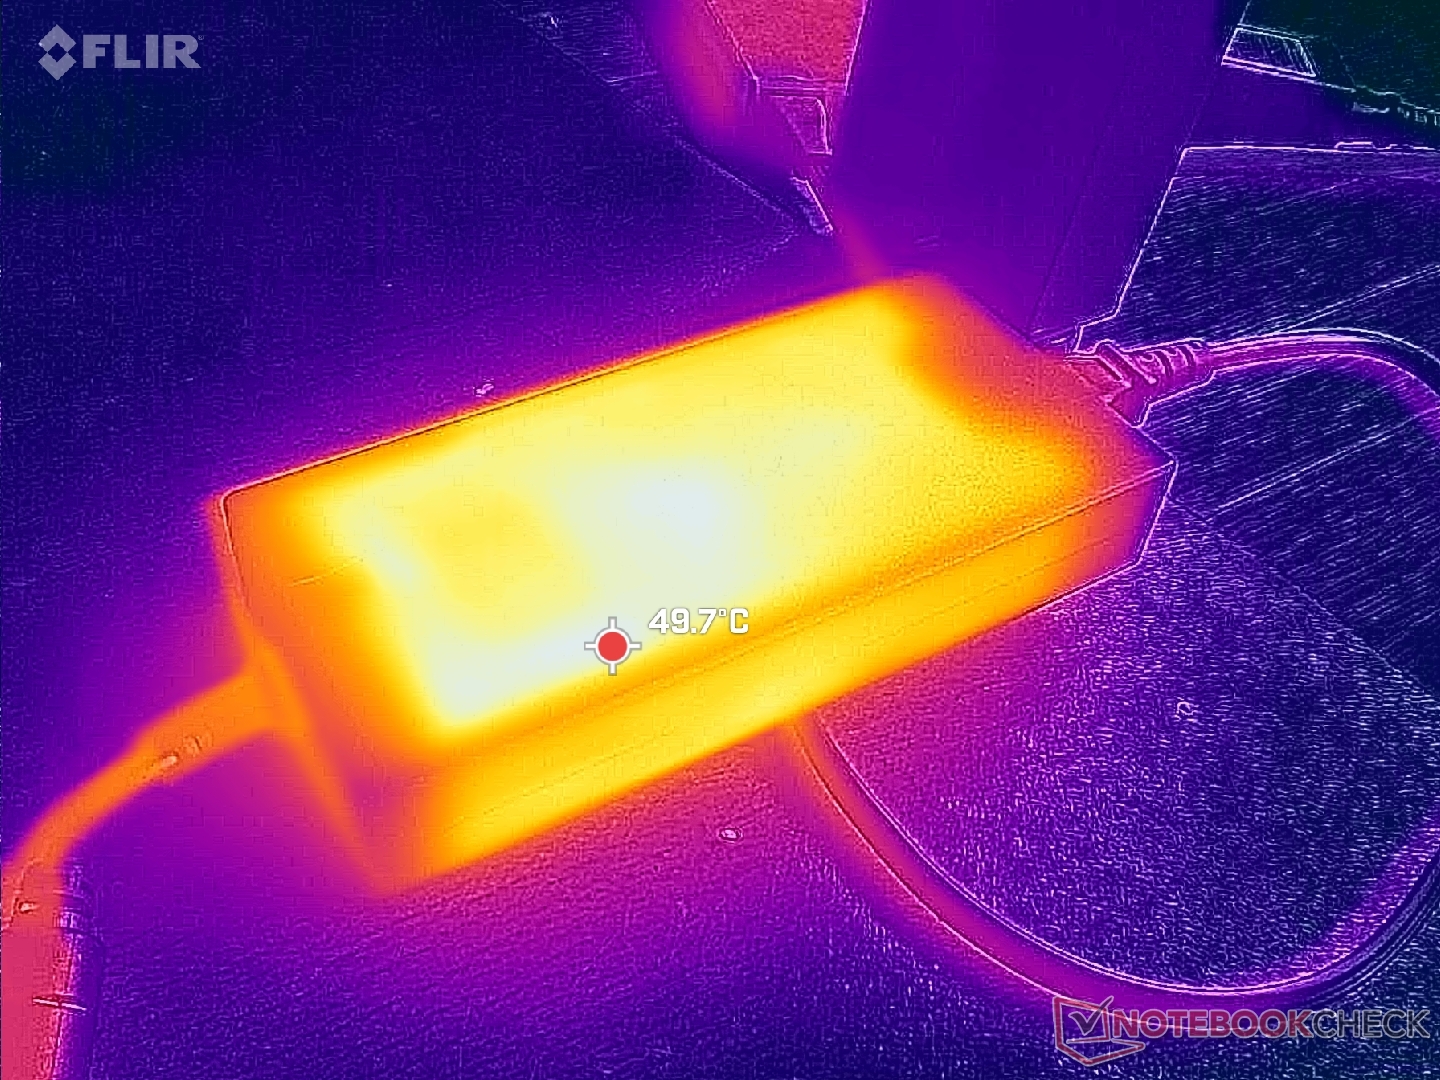
Ogólne zużycie energii jest bardzo wysokie, czego można się spodziewać po 18-calowym monitorze DTR wyposażonym w wymagający panel mini-LED 4K. Praca na biegu jałowym na komputerze stacjonarnym zużywa od 27 W do 48 W w zależności od ustawienia jasności, ustawienia GPU i ustawienia profilu zasilania. Gaming wymagałby nieco ponad 300 W w porównaniu do zaledwie 220 W w przypadku Acer Predator Helios 18.
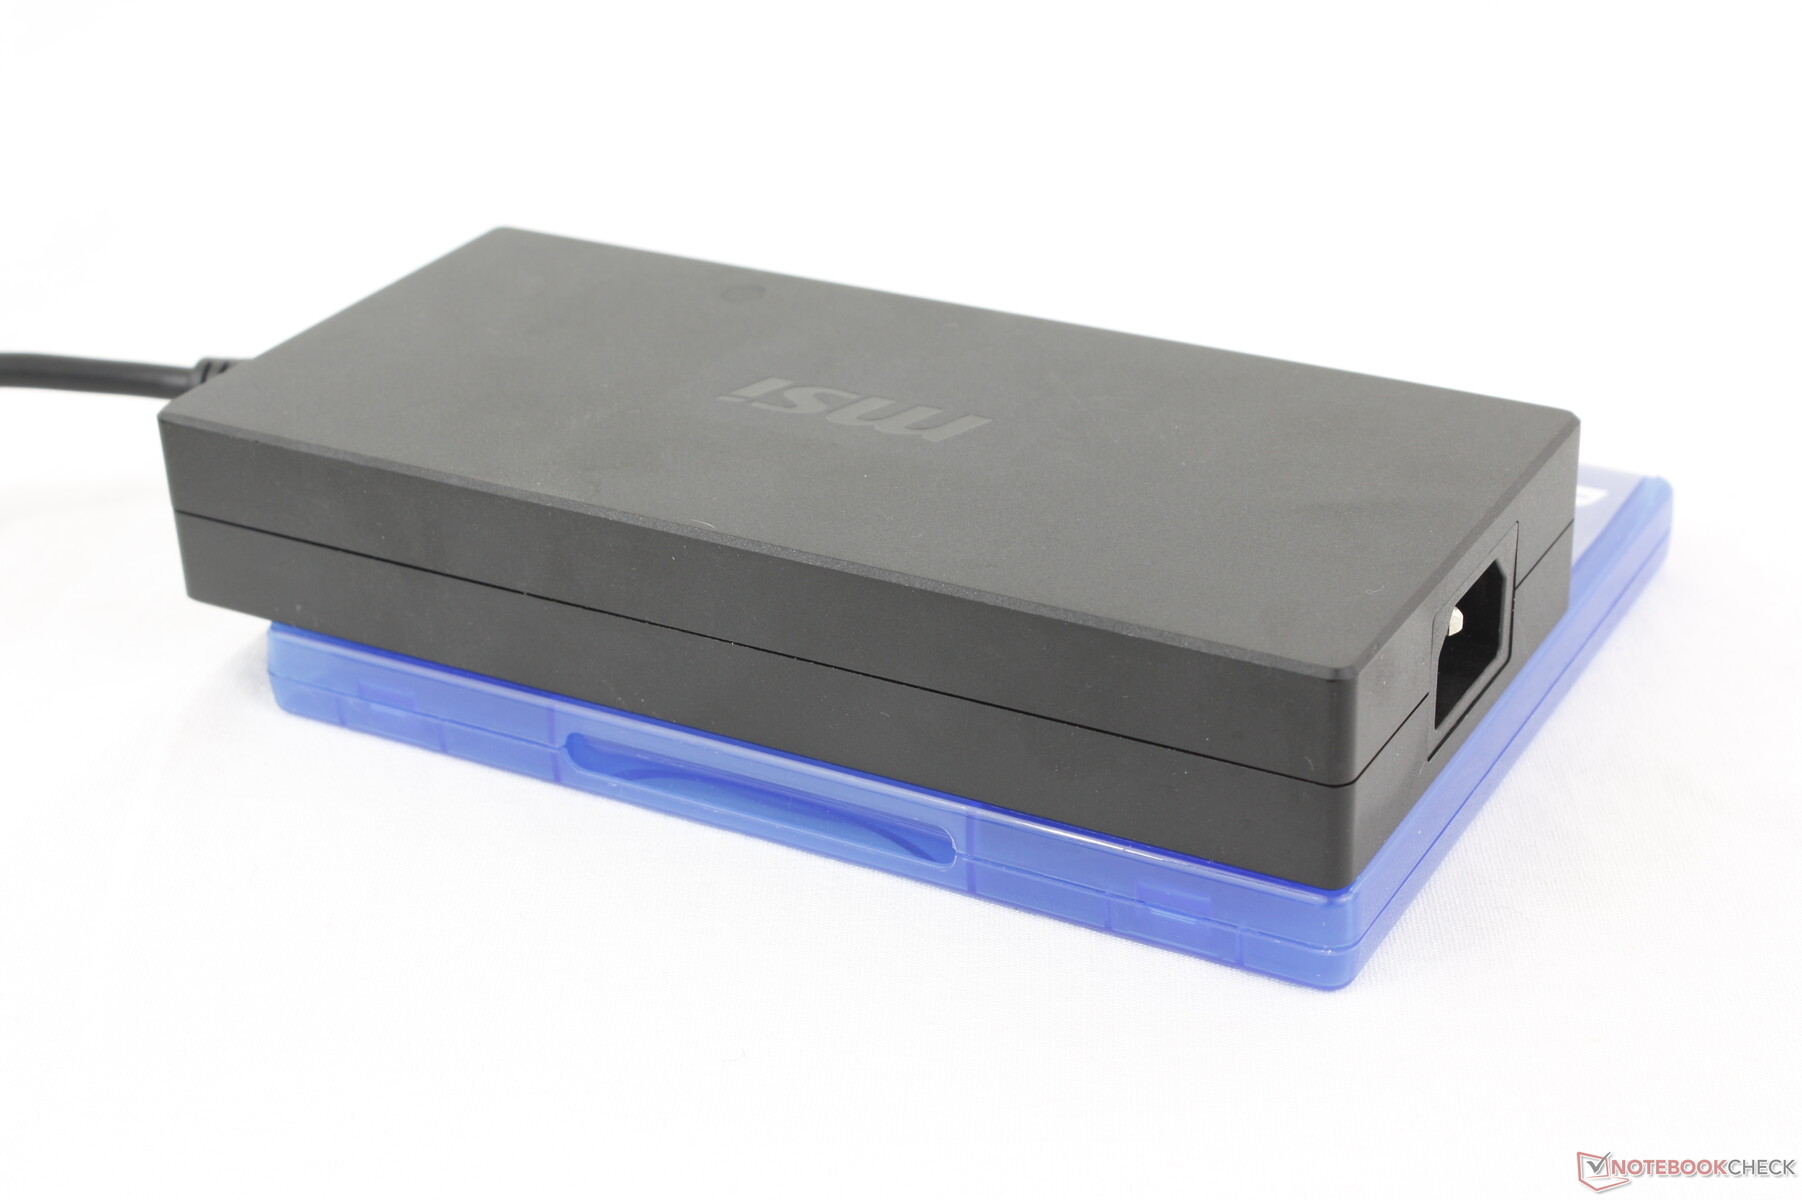
Jesteśmy w stanie zarejestrować zużycie do 322 W z dużego zasilacza sieciowego 330 W. W porównaniu do zasilacza 400 W dla Titan 18 HX, ten o mocy 330 W jest nieco mniejszy (~18,4 x 8,4 x 3,1 cm vs ~18,8 x 8,8 x 3,2 cm). Zużycie energii podczas wykonywania zadań intensywnie wykorzystujących procesor jest generalnie niższe w przypadku Raider 18 HX, mimo że jest on dostarczany z tym samym procesorem co Titan 18 HX, co jest zgodne z nieco wolniejszą wydajnością procesora odnotowaną w naszej sekcji CineBench powyżej.
| wyłączony / stan wstrzymania | |
| luz | |
| obciążenie |
|
Legenda:
min: | |
| MSI Raider 18 HX A14V i9-14900HX, NVIDIA GeForce RTX 4080 Laptop GPU, Samsung PM9A1 MZVL22T0HBLB, Mini-LED, 3840x2400, 18" | Razer Blade 18 2024 RZ09-0509 i9-14900HX, NVIDIA GeForce RTX 4090 Laptop GPU, , Mini-LED, 2560x1600, 18" | Alienware m18 R2 i9-14900HX, NVIDIA GeForce RTX 4090 Laptop GPU, SK Hynix PC811 HFS002TEM9X152N, IPS, 2560x1600, 18" | MSI Titan 18 HX A14VIG i9-14900HX, NVIDIA GeForce RTX 4090 Laptop GPU, 2x Samsung PM9A1a MZVL22T0HDLB (RAID 0), Mini-LED, 3840x2400, 18" | Asus ROG Strix G18 G814JI i7-13650HX, NVIDIA GeForce RTX 4070 Laptop GPU, Micron 2400 MTFDKBA1T0QFM, IPS, 2560x1600, 18" | Acer Predator Helios 18 PH18-72-98MW i9-14900HX, NVIDIA GeForce RTX 4090 Laptop GPU, 2x SK Hynix HFS001TEJ9X115N (RAID 0), Mini-LED, 2560x1600, 18" | |
|---|---|---|---|---|---|---|
| Power Consumption | -2% | 8% | 5% | 42% | -2% | |
| Idle Minimum * | 27.7 | 25.4 8% | 10.6 62% | 13.2 52% | 8 71% | 31 -12% |
| Idle Average * | 38.3 | 37.7 2% | 20.9 45% | 25.4 34% | 15 61% | 35 9% |
| Idle Maximum * | 47.1 | 57.9 -23% | 40 15% | 53.5 -14% | 26 45% | 43 9% |
| Load Average * | 121.2 | 128.4 -6% | 201.1 -66% | 151.4 -25% | 102 16% | 144 -19% |
| Cyberpunk 2077 ultra * | 313 | |||||
| Cyberpunk 2077 ultra external monitor * | 306 | |||||
| Load Maximum * | 321.8 | 297.9 7% | 378.9 -18% | 395.2 -23% | 267 17% | 318 1% |
| Witcher 3 ultra * | 273.1 | 358 | 336 | 178.6 | 228 |
* ... im mniej tym lepiej
Power Consumption Cyberpunk / Stress Test
Power Consumption external Monitor
Żywotność baterii
Czasy pracy są krótkie ze względu na wymagający sprzęt. Udało nam się zarejestrować nieco ponad 3 godziny rzeczywistego korzystania z sieci WLAN, nawet po ustawieniu trybu oszczędzania baterii i trybu iGPU, podczas gdy ROG Strix G18 może wytrzymać ponad dwa razy dłużej dzięki wyświetlaczowi IPS. Pojemność baterii osiągnęła już maksymalny dopuszczalny poziom 99,9 Wh.
Ładowanie od stanu pustego do pełnej pojemności zajmuje prawie 2,5 godziny, czyli nieco dłużej niż w przypadku większości innych laptopów. Ładowanie za pomocą adapterów USB-C AC innych firm będzie jeszcze wolniejsze.
| MSI Raider 18 HX A14V i9-14900HX, NVIDIA GeForce RTX 4080 Laptop GPU, 99.9 Wh | Razer Blade 18 2024 RZ09-0509 i9-14900HX, NVIDIA GeForce RTX 4090 Laptop GPU, 91.7 Wh | Alienware m18 R2 i9-14900HX, NVIDIA GeForce RTX 4090 Laptop GPU, 97 Wh | MSI Titan 18 HX A14VIG i9-14900HX, NVIDIA GeForce RTX 4090 Laptop GPU, 99.9 Wh | Asus ROG Strix G18 G814JI i7-13650HX, NVIDIA GeForce RTX 4070 Laptop GPU, 90 Wh | Acer Predator Helios 18 PH18-72-98MW i9-14900HX, NVIDIA GeForce RTX 4090 Laptop GPU, 90 Wh | |
|---|---|---|---|---|---|---|
| Czasy pracy | 20% | 46% | 19% | 101% | -10% | |
| Reader / Idle | 264 | 395 50% | 353 34% | 702 166% | ||
| WiFi v1.3 | 198 | 263 33% | 290 46% | 252 27% | 484 144% | 192 -3% |
| Load | 76 | 58 -24% | 72 -5% | 71 -7% | 64 -16% |
Za
Przeciw
Werdykt - Tytan w sercu
Kiedy recenzowaliśmy Titan 18 HX na początku tego roku, chwaliliśmy jego wydajność, ale byliśmy zszokowani, gdy dowiedzieliśmy się o jego cenie wywoławczej wynoszącej ponad 5000 USD. Fakt, że procesor i karta graficzna nie były w rzeczywistości niczym nowym, sprawił, że model ten stał się jeszcze mniej atrakcyjny. Raider 18 HX jest odpowiedzią na niebotycznie wysoką cenę Titan 18 HX, przycinając tłuszcz przy zachowaniu tych samych opcji CPU, GPU i wyświetlacza. Właściciele Raidera tracą podświetlany clickpad, chłodzenie komorą parową, mechaniczne klawisze i obsługę trzeciorzędnych dysków SSD M.2, ale z takimi luksusowymi funkcjami łatwo się rozstać, gdy wrażenia z gry między Raiderem a Titanem są poza tym dokładnie takie same. W rzeczywistości można argumentować, że Raider jest wygodniejszy w użyciu, ponieważ jego tradycyjny clickpad i klawiatura membranowa są bardziej znajome niż nietypowe podejście w Titan.
Raider 18 HX wyciska każdą uncję wydajności z procesora Core i9 i 175 W GPU, nawet jeśli musi być większy, cięższy i często głośniejszy niż wielu jego konkurentów.
W porównaniu do innych 18-calowych laptopów do gier, Raider 18 HX oferuje bardziej przestronną klawiaturę i cztery gniazda SODIMM, podczas gdy alternatywy takie jak Blade 18 lub ROG Strix G18 nie mają w ogóle klawiatury numerycznej lub obsługują tylko dwa moduły SODIMM. System MSI jest jednak nadal zauważalnie większy i cięższy niż większość konkurencji i niekoniecznie działa ciszej, aby to nadrobić. Wydajność CPU i GPU może być nieco wyższa, ale w praktyce wielu użytkowników może tego nie zauważyć. W tym przypadku trzeba będzie docenić łatwiejsze serwisowanie i opcje mini-LED 4K Raidera, aby uzasadnić jego wagę.
Cena i dostępność
MSI Raider 18 HX w konfiguracji przedstawionej w naszej recenzji jest już dostępny na Amazon w cenie 3190 USD. Alternatywnie, wersja IPS jest również dostępna za 3290 USD.
Uwaga: Niedawno zaktualizowaliśmy nasz system oceny i wyniki wersji 8 nie są porównywalne z wynikami wersji 7. Więcej informacji znajdą Państwo tutaj .
MSI Raider 18 HX A14V
- 03/09/2024 v8
Allen Ngo
 Total Sustainability Score:
 Przezroczystość
Wyboru urządzeń do recenzji dokonuje nasza redakcja. Próbka testowa została udostępniona autorowi jako pożyczka od producenta lub sprzedawcy detalicznego na potrzeby tej recenzji. Pożyczkodawca nie miał wpływu na tę recenzję, producent nie otrzymał też kopii tej recenzji przed publikacją. Nie było obowiązku publikowania tej recenzji. Nigdy nie przyjmujemy rekompensaty ani płatności w zamian za nasze recenzje. Jako niezależna firma medialna, Notebookcheck nie podlega władzy producentów, sprzedawców detalicznych ani wydawców.
Tak testuje Notebookcheck
Każdego roku Notebookcheck niezależnie sprawdza setki laptopów i smartfonów, stosując standardowe procedury, aby zapewnić porównywalność wszystkich wyników. Od około 20 lat stale rozwijamy nasze metody badawcze, ustanawiając przy tym standardy branżowe. W naszych laboratoriach testowych doświadczeni technicy i redaktorzy korzystają z wysokiej jakości sprzętu pomiarowego. Testy te obejmują wieloetapowy proces walidacji. Nasz kompleksowy system ocen opiera się na setkach uzasadnionych pomiarów i benchmarków, co pozwala zachować obiektywizm.Price comparison

