
Recenzja Lenovo Yoga Pro 7 14 - multimedialny laptop z ekranem OLED 120 Hz i kartą graficzną RTX 4050
Zwiększenie wydajności GPU.
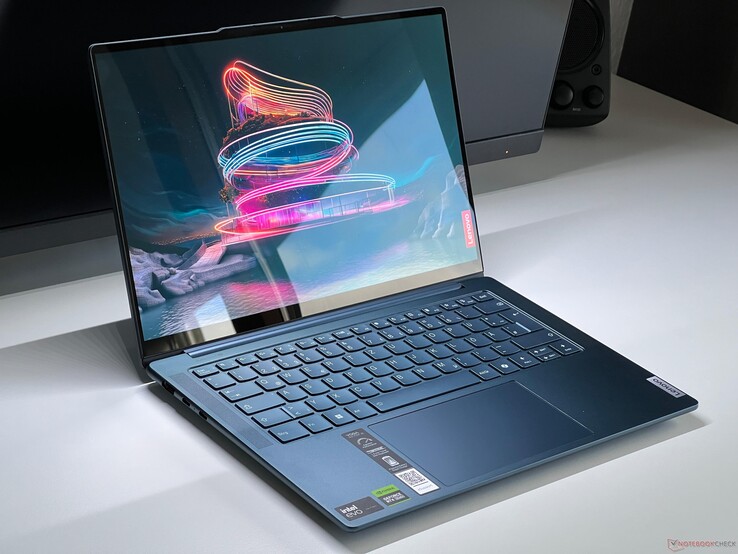
Lenovo Yoga Pro 7 14 to szybki laptop multimedialny, który opcjonalnie można wyposażyć w dedykowane GPU GeForce. Przetestowaliśmy wersję z procesorem Meteor Lake Core Ultra 7 155H, 32 GB RAM, 120-Hz OLED i kartą graficzną Nvidia GeForce RTX 4050 Laptop.Andreas Osthoff, 👁 Andreas Osthoff (tłumaczenie DeepL / Ninh Duy) Opublikowany 🇺🇸 🇩🇪 ...
Werdykt - Yoga Pro 7 14 może pochwalić się lepszą wydajnością GPU dzięki RTX 4050 Laptop
Lenovo Yoga Pro 7 14 to dobry laptop multimedialny, a jego dedykowana GeForce RTX 4050 podwaja wydajność graficzną konfiguracji iGPU. Jego rozwój wydajności przy maksymalnym TGP wynoszącym 60 watów jest przyzwoity, a wydajność procesora laptopa Core Ultra 7 155H jest podobnie dobra (70 watów). Jednak jego wysokie limity mocy prowadzą do głośnych wentylatorów, a porównanie go z wariantem AMD pokazuje, że Ryzen AI 9 365 oferuje nieco wyższą wydajność przy mniejszej mocy. W rezultacie kombinacja AMD/Nvidia byłaby w rzeczywistości lepszym wyborem.
Obudowa Yogi - w tym jej porty - jest imponująca, a klawiatura jest bardzo wygodna. Dodatkowo, posiada dobre głośniki. Opcjonalny ekran OLED 120 Hz zapewnia świetną jakość obrazu, a Lenovo zapewnia dokładne profile dla P3 i sRGB. Jednak panel jest również dość odblaskowy i zauważyliśmy ciągłe migotanie PWM przy 240 Hz.
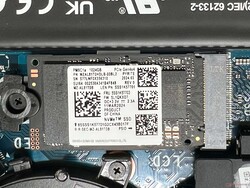
Oprócz głośnych wentylatorów, do słabych stron laptopa należy zaliczyć jego czas pracy, który niestety jest co najwyżej przeciętny. Co więcej, jego zasilacz nie jest wystarczających rozmiarów. Przy bardzo dużym obciążeniu bateria musi być wykorzystywana do pokrycia zużycia energii przez urządzenie. Jest to niepotrzebne i z pewnością nie jest dobre dla baterii. Lenovo powinno było dołączyć 130-watowy zasilacz. Nie wspominając już o tym, że jego pamięci RAM nie można zaktualizować, a ze względu na dedykowany procesor graficzny można zainstalować tylko kompaktowy dysk SSD M.2-2242.
Za
Przeciw
Cena i dostępność
Nasze urządzenie testowe nie jest obecnie dostępne do zakupu online w Stanach Zjednoczonych, jednak mogą Państwo obejrzeć i zakupić inne wersje laptopa na stronie internetowej Lenovo.
Porównanie możliwych alternatyw
Obraz | Model / recenzja | Cena | Waga | Wysokość | Ekran |
|---|---|---|---|---|---|
| Lenovo Yoga Pro 7 14IMH9, RTX 4050 Intel Core Ultra 7 155H ⎘ NVIDIA GeForce RTX 4050 Laptop GPU ⎘ 32 GB Pamięć, 1024 GB SSD | Amazon: 1. $1,149.00 Lenovo Yoga Pro 7 14AHP9 202... 2. $799.98 Lenovo Yoga 7 7i 2-in-1 Lapt... 3. $899.99 Lenovo - Yoga 7 2-in-1 14" 2... Cena katalogowa: 1699€ | 1.6 kg | 16.6 mm | 14.50" 2880x1800 234 PPI OLED | |
| SCHENKER Key 14 (M24) Intel Core Ultra 7 155H ⎘ NVIDIA GeForce RTX 4060 Laptop GPU ⎘ 32 GB Pamięć, 1024 GB SSD | Amazon: 1. $68.99 PowerHOOD 20V AC/DC Adapter ... Cena katalogowa: 1890€ | 1.7 kg | 19.9 mm | 14.00" 2880x1800 243 PPI IPS | |
| Dell XPS 14 2024 OLED Intel Core Ultra 7 155H ⎘ NVIDIA GeForce RTX 4050 Laptop GPU ⎘ 32 GB Pamięć, 1024 GB SSD | Amazon: $1,175.00 Cena katalogowa: 2949€ | 1.8 kg | 19 mm | 14.50" 3200x2000 260 PPI OLED | |
| HP OmniBook Ultra 14 AMD Ryzen AI 9 HX 375 ⎘ AMD Radeon 890M ⎘ 32 GB Pamięć, 2048 GB SSD | Amazon: Cena katalogowa: 1030 USD | 1.5 kg | 16.5 mm | 14.00" 2240x1400 189 PPI IPS | |
| SCHENKER Vision 14 M23 RTX 3050 Intel Core i7-13700H ⎘ NVIDIA GeForce RTX 3050 6GB Laptop GPU ⎘ 32 GB Pamięć, 1024 GB SSD | Amazon: 1. $125.00 14.0" 2880(RGB)*1800 LCD Scr... 2. $132.99 14.0" 2880(RGB)*1800 90Hz ED... 3. $45.99 19V 6.32A 120W Charger for M... Cena katalogowa: 1985€ | 1.3 kg | 16.6 mm | 14.00" 2880x1800 243 PPI IPS | |
| Lenovo Yoga Pro 7 14IMH9 Intel Core Ultra 7 155H ⎘ Intel Arc 8-Core iGPU ⎘ 32 GB Pamięć, 1024 GB SSD | Amazon: 1. $969.99 Lenovo Yoga Pro 7 14AHP9-202... 2. $53.99 RUNMEIJIA Laptop Case Cover ... 3. $52.00 WODBAO for Laptop Lenovo Yog... Cena katalogowa: 1300 EUR | 1.6 kg | 16.6 mm | 14.50" 3072x1920 250 PPI IPS |
Lenovo oferuje swoją Yoga Pro 7 14 w różnych konfiguracjach, a my już przetestowaliśmy AMD Zen5 i Intel (każdy ze zintegrowaną kartą graficzną). Dostępne są jednak również mocniejsze warianty (zwłaszcza w odniesieniu do GPU) z laptopem RTX 4060. Nasze obecne urządzenie testowe w cenie MRSP wynoszącej nieco ponad 1700 USD jest wyposażone w procesor Meteor Lake Core Ultra 7 155H, 32 GB pamięci RAM, ekran OLED 2,8K o częstotliwości odświeżania 120 Hz i dedykowaną kartę graficzną Laptop Nvidia GeForce RTX 4050.
Specyfikacje
Obudowa i łączność
Ogólnie rzecz biorąc, konstrukcja obudowy naszego urządzenia testowego jest praktycznie taka sama jak w przypadku AMD Zen5 lub wersji Intela, którą już testowaliśmy, ale zamiast wariantu kolorystycznego Tidal Grey, ma kolorystykę Tidal Teal, czyli turkusową obudowę. Stabilność i jakość wykonania metalowej obudowy nie dają powodów do krytyki, a jej powierzchnie nie są szczególnie podatne na odciski palców. W porównaniu do niektórych innych laptopów Lenovo, garb kamery jest bardzo dyskretny i jest nawet bardzo pomocny, gdy chcemy otworzyć pokrywę, co można łatwo zrobić jedną ręką.
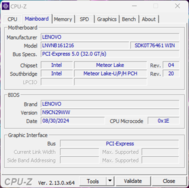
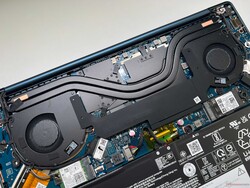
Pamięć RAM jest wlutowana, dlatego opcje konserwacji ograniczają się do modułu WLAN, kompaktowego dysku SSD M.2-2242 (M.2-2280 w wersjach z iGPU) i czyszczenia wentylatorów. W razie potrzeby można również wymienić przykręcaną baterię. Na pokładzie znalazły się wszystkie ważne porty (w tym Thunderbolt 4), a kamera internetowa 1080p (wraz z czujnikiem podczerwieni i elektroniczną migawką) obsługuje Windows Studio Effects. Moduł Wi-Fi jest zgodny ze standardem Wi-Fi 6E i osiągnął wysokie prędkości transferu podczas naszego testu; laptop nie ma jednak czytnika kart.
| Networking | |
| Lenovo Yoga Pro 7 14IMH9, RTX 4050 | |
| iperf3 transmit AXE11000 | |
| iperf3 receive AXE11000 | |
| SCHENKER Key 14 (M24) | |
| iperf3 transmit AXE11000 | |
| iperf3 receive AXE11000 | |
| Dell XPS 14 2024 OLED | |
| iperf3 transmit AXE11000 | |
| iperf3 receive AXE11000 | |
| HP OmniBook Ultra 14 | |
| iperf3 transmit AXE11000 | |
| iperf3 receive AXE11000 | |
| iperf3 transmit AXE11000 6GHz | |
| iperf3 receive AXE11000 6GHz | |
| Lenovo Yoga Pro 7 14IMH9 | |
| iperf3 transmit AXE11000 | |
| iperf3 receive AXE11000 | |

Zrównoważony rozwój
Lenovo nie podało żadnych informacji na temat śladuCO2 produkcji Yoga Pro 7 14, ale urządzenie posiada co najmniej certyfikaty EPEAT Gold i Energy Star. Jego opakowanie jest całkowicie wolne od plastiku, a do produkcji zarówno jednostki bazowej, jak i pokrywy ekranu użyto aluminium pochodzącego w 50% z recyklingu.
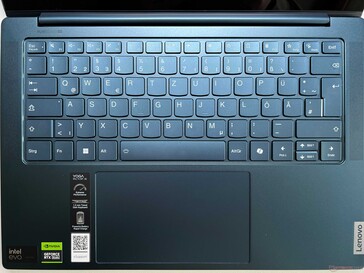
Urządzenia wejściowe - skok klawisza 1,5 mm
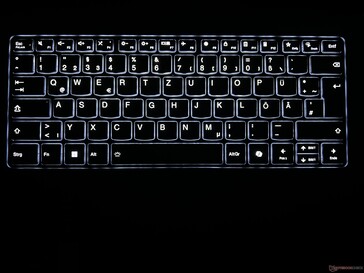
Klawiatura laptopa jest wygodna w pisaniu dzięki skokowi 1,5 mm i precyzyjnemu sprzężeniu zwrotnemu. W szczególności większe klawisze są jednak dość głośne. Pomimo niebieskiej kolorystyki, widoczność klawiszy jest dobra, a dwustopniowe białe podświetlenie - które może być również aktywowane automatycznie za pomocą czujnika - pomaga w ciemnym otoczeniu. ClickPad zasadniczo działa bardzo dobrze, ale mechaniczne kliknięcia w dolnym obszarze są bardzo głośne, co sprawia wrażenie taniego.
Wyświetlacz - 2,8K OLED przy 120 Hz
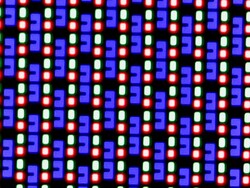
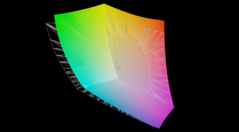
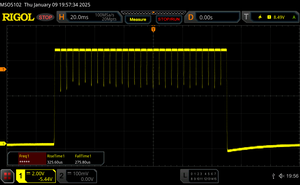
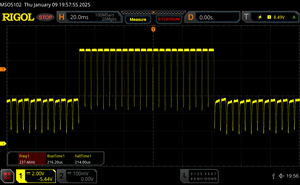
14,5-calowy ekran OLED naszego urządzenia testowego (2880 x 1800 pikseli, 16:10) może pochwalić się bardzo dobrą subiektywną jakością obrazu i nie ma już tych samych problemów z efektem rastrowym, co poprzednie OLED-y Lenovo 2,8K. Częstotliwość odświeżania wynosi 120 Hz, a ruchy wyglądają super płynnie - dodatkowo, czas reakcji jest niezwykle szybki. W panelach OLED nie występuje efekt krwawienia podświetlenia, ale wykorzystuje on stałe migotanie PWM przy 240 Hz. Ani jego jasność, ani temperatura barwowa nie mogą być automatycznie dostosowywane do oświetlenia otoczenia. Nie posiada ekranu dotykowego.
W trybie SDR jego jasność wynosi około 400 cd/m², co w połączeniu z niskim poziomem czerni daje niezwykle wysoki współczynnik kontrastu. W trybie HDR zmierzyliśmy maksymalną jasność 650 cd/m² podczas wyświetlania małego fragmentu obrazu i 520 cd/m² podczas wyświetlania prawie całkowicie białego obrazu. Należy jednak pamiętać, że tryb HDR trzeba aktywować ręcznie, a profile kolorów przestają wtedy działać.
| |||||||||||||||||||||||||
rozświetlenie: 98 %
na akumulatorze: 398 cd/m²
kontrast: ∞:1 (czerń: 0 cd/m²)
ΔE Color 1.4 | 0.5-29.43 Ø4.87
ΔE Greyscale 1.8 | 0.5-98 Ø5.1
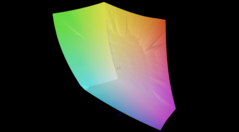
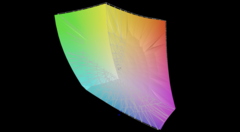
88.8% AdobeRGB 1998 (Argyll 2.2.0 3D)
99.9% sRGB (Argyll 2.2.0 3D)
98% Display P3 (Argyll 2.2.0 3D)
Gamma: 2.27
| Lenovo Yoga Pro 7 14IMH9, RTX 4050 LEN145WQ+, OLED, 2880x1800, 14.5", 120 Hz | SCHENKER Key 14 (M24) TL140ADXP24-0, IPS, 2880x1800, 14", 120 Hz | Dell XPS 14 2024 OLED SDC41A2, OLED, 3200x2000, 14.5", 120 Hz | HP OmniBook Ultra 14 BOE0C9E, IPS, 2240x1400, 14", 60 Hz | Lenovo Yoga Pro 7 14IMH9 Lenovo LEN145-3K (LEN8AAF), IPS, 3072x1920, 14.5", 120 Hz | SCHENKER Vision 14 2023 CSOT T3 MNE007ZA1-3, IPS, 2880x1800, 14", 90 Hz | |
|---|---|---|---|---|---|---|
| Display | -16% | -0% | -18% | -1% | -13% | |
| Display P3 Coverage | 98 | 70.3 -28% | 98.5 1% | 67.1 -32% | 98.4 0% | 74.7 -24% |
| sRGB Coverage | 99.9 | 97.4 -3% | 100 0% | 99 -1% | 100 0% | 99.6 0% |
| AdobeRGB 1998 Coverage | 88.8 | 72.4 -18% | 87.2 -2% | 68.9 -22% | 86.9 -2% | 75.8 -15% |
| Response Times | -6393% | 4% | -6370% | -5046% | -4907% | |
| Response Time Grey 50% / Grey 80% * | 0.43 ? | 38.5 ? -8853% | 0.7 ? -63% | 35.9 ? -8249% | 34.1 ? -7830% | 32.2 ? -7388% |
| Response Time Black / White * | 0.61 ? | 24.6 ? -3933% | 0.77 ? -26% | 28 ? -4490% | 14.4 ? -2261% | 15.4 ? -2425% |
| PWM Frequency | 240 ? | 480 100% | ||||
| Screen | -17% | -13% | -19% | 20% | -8% | |
| Brightness middle | 398 | 325 -18% | 351 -12% | 359.5 -10% | 464 17% | 402 1% |
| Brightness | 402 | 317 -21% | 353 -12% | 361 -10% | 456 13% | 371 -8% |
| Brightness Distribution | 98 | 94 -4% | 97 -1% | 92 -6% | 90 -8% | 86 -12% |
| Black Level * | 0.12 | 0.27 | 0.36 | 0.27 | ||
| Colorchecker dE 2000 * | 1.4 | 1.8 -29% | 1.7 -21% | 1.64 -17% | 0.9 36% | 1.8 -29% |
| Colorchecker dE 2000 max. * | 3.7 | 3.4 8% | 2.2 41% | 4.68 -26% | 2.32 37% | 3.6 3% |
| Greyscale dE 2000 * | 1.8 | 2.5 -39% | 3.1 -72% | 2.6 -44% | 1.4 22% | 1.8 -0% |
| Gamma | 2.27 97% | 2.15 102% | 2.12 104% | 2.22 99% | 2.218 99% | 2.27 97% |
| CCT | 6609 98% | 7017 93% | 6616 98% | 6388 102% | 6669 97% | 6695 97% |
| Contrast | 2708 | 1331 | 1289 | 1489 | ||
| Colorchecker dE 2000 calibrated * | 1.4 | 0.8 | 0.97 | 0.35 | 1.5 | |
| Całkowita średnia (program / ustawienia) | -2142% /
-1176% | -3% /
-6% | -2136% /
-1173% | -1676% /
-907% | -1643% /
-900% |
* ... im mniej tym lepiej
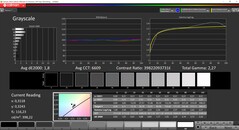
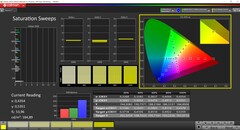
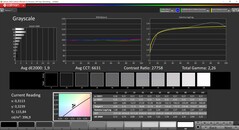
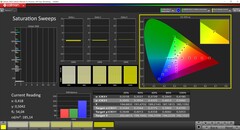
Przeanalizowaliśmy panel przy użyciu profesjonalnego oprogramowania CalMAN. Lenovo oferuje różne profile w aplikacji Vantage, a wyświetlacz jest imponujący już po wybraniu profilu P3. Nie odnotowaliśmy żadnych wartości odstających powyżej istotnego odchylenia 3 zarówno w skali szarości, jak i w kolorach, a także nie znajdą Państwo rzutowania kolorów. Użytkownicy mają również do dyspozycji dokładny profil sRGB. Zarówno przestrzeń kolorów P3, jak i sRGB są w pełni pokryte. Nie byliśmy w stanie ulepszyć wyświetlacza poprzez własną kalibrację.
Wyświetl czasy reakcji
| ↔ Czas reakcji od czerni do bieli | ||
|---|---|---|
| 0.61 ms ... wzrost ↗ i spadek ↘ łącznie | ↗ 0.33 ms wzrost | |
| ↘ 0.28 ms upadek | ||
| W naszych testach ekran wykazuje bardzo szybką reakcję i powinien bardzo dobrze nadawać się do szybkich gier. Dla porównania, wszystkie testowane urządzenia wahają się od 0.1 (minimum) do 240 (maksimum) ms. » 1 % wszystkich urządzeń jest lepszych. Oznacza to, że zmierzony czas reakcji jest lepszy od średniej wszystkich testowanych urządzeń (20.8 ms). | ||
| ↔ Czas reakcji 50% szarości do 80% szarości | ||
| 0.43 ms ... wzrost ↗ i spadek ↘ łącznie | ↗ 0.22 ms wzrost | |
| ↘ 0.21 ms upadek | ||
| W naszych testach ekran wykazuje bardzo szybką reakcję i powinien bardzo dobrze nadawać się do szybkich gier. Dla porównania, wszystkie testowane urządzenia wahają się od 0.165 (minimum) do 636 (maksimum) ms. » 0 % wszystkich urządzeń jest lepszych. Oznacza to, że zmierzony czas reakcji jest lepszy od średniej wszystkich testowanych urządzeń (32.5 ms). | ||
Migotanie ekranu / PWM (modulacja szerokości impulsu)
| Wykryto migotanie ekranu/wykryto PWM | 240 Hz Amplitude: 50 % | ≤ 100 % ustawienia jasności | |
Podświetlenie wyświetlacza miga z częstotliwością 240 Hz (najgorszy przypadek, np. przy użyciu PWM) Wykryto migotanie przy ustawieniu jasności 100 % i poniżej. Powyżej tego ustawienia jasności nie powinno być żadnego migotania ani PWM. Częstotliwość 240 Hz jest stosunkowo niska, więc wrażliwi użytkownicy prawdopodobnie zauważą migotanie i odczują zmęczenie oczu przy podanym ustawieniu jasności i poniżej. Dla porównania: 53 % wszystkich testowanych urządzeń nie używa PWM do przyciemniania wyświetlacza. Jeśli wykryto PWM, zmierzono średnio 8516 (minimum: 5 - maksimum: 343500) Hz. | |||
Wydajność - Meteor Lake-H
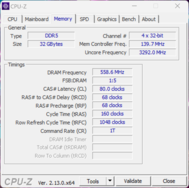
Nasze urządzenie testowe zostało wyposażone w 32 GB pamięci RAM LPDDR5x-7467, co powinno być wystarczające dla większości użytkowników. Nie ma jednak możliwości jej rozszerzenia.
Warunki testowania
Lenovo oferuje różne profile energetyczne, między którymi można przełączać się za pomocą oprogramowania Vantage lub kombinacji klawiszy Fn+Q. Przeprowadziliśmy następujące testy porównawcze i pomiary przy użyciu trybu maksymalnej wydajności, aby wykorzystać pełną wydajność procesora i karty graficznej.
| Tryb energetyczny | TDP CPU | CB R23 Multi | GPU TGP | Time Spy Grafika | maks. emisja hałasu wentylatora |
|---|---|---|---|---|---|
| Tryb oszczędzania baterii | 50/15 watów | 12 648 punktów | 13 watów | 1 251 punktów | 29,8 dB(A) |
| Adaptacyjny tryb oszczędzania baterii (Auto) | 70/65 watów | 17 539 punktów | 50 watów | 6 461 punktów | 45 dB(A) |
| Wydajność | 75/70 watów | 18 184 punktów | 60 watów | 7 342 punktów | 49,1 dB(A) |
Procesor
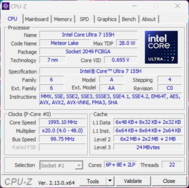
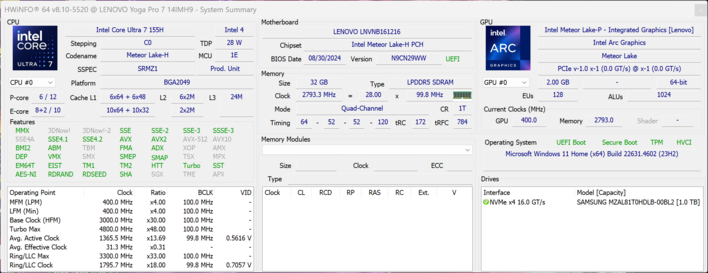
Procesor Intel Core Ultra 7 155H z generacji Meteor Lake jest wykorzystywany jako procesor laptopa. Ma on łącznie 16 rdzeni (22 wątki) i może pracować w zakresie 28-115 watów. Podczas naszego testu Yoga Pro 7 14 zużyła maksymalnie 75 watów, a następnie ustabilizowała się na poziomie 70 watów. W rezultacie jego wielordzeniowa wydajność była ogólnie dobra i stabilna, chociaż Ryzen AI 9 365 osiągnął jeszcze lepsze wyniki przy nieco niższym zużyciu energii (60/54 W). Jego wydajność dodatkowo pozostała stabilna w trybie bateryjnym. Dalsze testy porównawcze procesora są dostępne w naszej sekcji technicznej.
Cinebench R15 Multi continuous test
Cinebench R23: Multi Core | Single Core
Cinebench R20: CPU (Multi Core) | CPU (Single Core)
Cinebench R15: CPU Multi 64Bit | CPU Single 64Bit
Blender: v2.79 BMW27 CPU
7-Zip 18.03: 7z b 4 | 7z b 4 -mmt1
Geekbench 6.4: Multi-Core | Single-Core
Geekbench 5.5: Multi-Core | Single-Core
HWBOT x265 Benchmark v2.2: 4k Preset
LibreOffice : 20 Documents To PDF
R Benchmark 2.5: Overall mean
| CPU Performance Rating | |
| HP OmniBook Ultra 14 | |
| Lenovo Yoga Pro 7 14ASP G9 | |
| Lenovo Yoga Pro 7 14IMH9, RTX 4050 | |
| Średnia w klasie Multimedia | |
| SCHENKER Key 14 (M24) | |
| Lenovo Yoga Pro 7 14IMH9 | |
| Dell XPS 14 2024 OLED | |
| Przeciętny Intel Core Ultra 7 155H | |
| SCHENKER Vision 14 M23 RTX 3050 | |
| Cinebench R23 / Multi Core | |
| HP OmniBook Ultra 14 | |
| Lenovo Yoga Pro 7 14ASP G9 | |
| Lenovo Yoga Pro 7 14IMH9, RTX 4050 | |
| Średnia w klasie Multimedia (4861 - 30789, n=96, ostatnie 2 lata) | |
| SCHENKER Key 14 (M24) | |
| Przeciętny Intel Core Ultra 7 155H (9769 - 19007, n=52) | |
| Lenovo Yoga Pro 7 14IMH9 | |
| Dell XPS 14 2024 OLED | |
| SCHENKER Vision 14 M23 RTX 3050 | |
| Cinebench R23 / Single Core | |
| Lenovo Yoga Pro 7 14ASP G9 | |
| HP OmniBook Ultra 14 | |
| SCHENKER Vision 14 M23 RTX 3050 | |
| Średnia w klasie Multimedia (878 - 2290, n=87, ostatnie 2 lata) | |
| Lenovo Yoga Pro 7 14IMH9, RTX 4050 | |
| Dell XPS 14 2024 OLED | |
| Przeciętny Intel Core Ultra 7 155H (1496 - 1815, n=52) | |
| SCHENKER Key 14 (M24) | |
| Lenovo Yoga Pro 7 14IMH9 | |
| Cinebench R20 / CPU (Multi Core) | |
| HP OmniBook Ultra 14 | |
| Lenovo Yoga Pro 7 14ASP G9 | |
| Lenovo Yoga Pro 7 14IMH9, RTX 4050 | |
| Dell XPS 14 2024 OLED | |
| SCHENKER Key 14 (M24) | |
| Średnia w klasie Multimedia (1887 - 11924, n=80, ostatnie 2 lata) | |
| Przeciętny Intel Core Ultra 7 155H (3798 - 7409, n=50) | |
| Lenovo Yoga Pro 7 14IMH9 | |
| SCHENKER Vision 14 M23 RTX 3050 | |
| Cinebench R20 / CPU (Single Core) | |
| Lenovo Yoga Pro 7 14ASP G9 | |
| HP OmniBook Ultra 14 | |
| SCHENKER Vision 14 M23 RTX 3050 | |
| Lenovo Yoga Pro 7 14IMH9, RTX 4050 | |
| Średnia w klasie Multimedia (341 - 853, n=80, ostatnie 2 lata) | |
| Dell XPS 14 2024 OLED | |
| Lenovo Yoga Pro 7 14IMH9 | |
| Przeciętny Intel Core Ultra 7 155H (601 - 696, n=50) | |
| SCHENKER Key 14 (M24) | |
| Cinebench R15 / CPU Multi 64Bit | |
| HP OmniBook Ultra 14 | |
| Lenovo Yoga Pro 7 14ASP G9 | |
| Lenovo Yoga Pro 7 14IMH9, RTX 4050 | |
| Dell XPS 14 2024 OLED | |
| Lenovo Yoga Pro 7 14IMH9 | |
| Średnia w klasie Multimedia (856 - 5224, n=87, ostatnie 2 lata) | |
| SCHENKER Key 14 (M24) | |
| Przeciętny Intel Core Ultra 7 155H (1932 - 2880, n=56) | |
| SCHENKER Vision 14 M23 RTX 3050 | |
| Cinebench R15 / CPU Single 64Bit | |
| Lenovo Yoga Pro 7 14ASP G9 | |
| HP OmniBook Ultra 14 | |
| SCHENKER Vision 14 M23 RTX 3050 | |
| Lenovo Yoga Pro 7 14IMH9 | |
| Średnia w klasie Multimedia (99.6 - 323, n=82, ostatnie 2 lata) | |
| Lenovo Yoga Pro 7 14IMH9, RTX 4050 | |
| Dell XPS 14 2024 OLED | |
| Przeciętny Intel Core Ultra 7 155H (99.6 - 268, n=52) | |
| SCHENKER Key 14 (M24) | |
| Blender / v2.79 BMW27 CPU | |
| Dell XPS 14 2024 OLED | |
| SCHENKER Vision 14 M23 RTX 3050 | |
| Średnia w klasie Multimedia (100 - 557, n=80, ostatnie 2 lata) | |
| Przeciętny Intel Core Ultra 7 155H (175 - 381, n=47) | |
| SCHENKER Key 14 (M24) | |
| Lenovo Yoga Pro 7 14IMH9 | |
| Lenovo Yoga Pro 7 14ASP G9 | |
| Lenovo Yoga Pro 7 14IMH9, RTX 4050 | |
| HP OmniBook Ultra 14 | |
| 7-Zip 18.03 / 7z b 4 | |
| HP OmniBook Ultra 14 | |
| Lenovo Yoga Pro 7 14IMH9, RTX 4050 | |
| Lenovo Yoga Pro 7 14ASP G9 | |
| Lenovo Yoga Pro 7 14IMH9 | |
| SCHENKER Key 14 (M24) | |
| Średnia w klasie Multimedia (29095 - 130368, n=75, ostatnie 2 lata) | |
| Przeciętny Intel Core Ultra 7 155H (41739 - 70254, n=50) | |
| SCHENKER Vision 14 M23 RTX 3050 | |
| Dell XPS 14 2024 OLED | |
| 7-Zip 18.03 / 7z b 4 -mmt1 | |
| SCHENKER Vision 14 M23 RTX 3050 | |
| Lenovo Yoga Pro 7 14ASP G9 | |
| HP OmniBook Ultra 14 | |
| Średnia w klasie Multimedia (3398 - 7545, n=75, ostatnie 2 lata) | |
| Lenovo Yoga Pro 7 14IMH9, RTX 4050 | |
| Lenovo Yoga Pro 7 14IMH9 | |
| SCHENKER Key 14 (M24) | |
| Dell XPS 14 2024 OLED | |
| Przeciętny Intel Core Ultra 7 155H (4594 - 5621, n=50) | |
| Geekbench 6.4 / Multi-Core | |
| HP OmniBook Ultra 14 | |
| Lenovo Yoga Pro 7 14ASP G9 | |
| Średnia w klasie Multimedia (4983 - 25760, n=77, ostatnie 2 lata) | |
| Lenovo Yoga Pro 7 14IMH9, RTX 4050 | |
| Dell XPS 14 2024 OLED | |
| Lenovo Yoga Pro 7 14IMH9 | |
| SCHENKER Key 14 (M24) | |
| Przeciętny Intel Core Ultra 7 155H (7732 - 13656, n=55) | |
| SCHENKER Vision 14 M23 RTX 3050 | |
| Geekbench 6.4 / Single-Core | |
| HP OmniBook Ultra 14 | |
| Lenovo Yoga Pro 7 14ASP G9 | |
| Średnia w klasie Multimedia (1534 - 3927, n=73, ostatnie 2 lata) | |
| SCHENKER Vision 14 M23 RTX 3050 | |
| Dell XPS 14 2024 OLED | |
| Lenovo Yoga Pro 7 14IMH9, RTX 4050 | |
| Lenovo Yoga Pro 7 14IMH9 | |
| Przeciętny Intel Core Ultra 7 155H (1901 - 2473, n=52) | |
| SCHENKER Key 14 (M24) | |
| Geekbench 5.5 / Multi-Core | |
| HP OmniBook Ultra 14 | |
| Lenovo Yoga Pro 7 14IMH9, RTX 4050 | |
| Lenovo Yoga Pro 7 14ASP G9 | |
| Dell XPS 14 2024 OLED | |
| Lenovo Yoga Pro 7 14IMH9 | |
| SCHENKER Key 14 (M24) | |
| Średnia w klasie Multimedia (4652 - 23059, n=79, ostatnie 2 lata) | |
| Przeciętny Intel Core Ultra 7 155H (10017 - 13556, n=52) | |
| SCHENKER Vision 14 M23 RTX 3050 | |
| Geekbench 5.5 / Single-Core | |
| HP OmniBook Ultra 14 | |
| Lenovo Yoga Pro 7 14ASP G9 | |
| SCHENKER Vision 14 M23 RTX 3050 | |
| Średnia w klasie Multimedia (891 - 2555, n=79, ostatnie 2 lata) | |
| Lenovo Yoga Pro 7 14IMH9 | |
| Lenovo Yoga Pro 7 14IMH9, RTX 4050 | |
| Dell XPS 14 2024 OLED | |
| Przeciętny Intel Core Ultra 7 155H (1462 - 1824, n=52) | |
| SCHENKER Key 14 (M24) | |
| HWBOT x265 Benchmark v2.2 / 4k Preset | |
| HP OmniBook Ultra 14 | |
| Lenovo Yoga Pro 7 14IMH9, RTX 4050 | |
| Lenovo Yoga Pro 7 14ASP G9 | |
| Lenovo Yoga Pro 7 14IMH9 | |
| Średnia w klasie Multimedia (5.26 - 34.3, n=74, ostatnie 2 lata) | |
| Przeciętny Intel Core Ultra 7 155H (9.93 - 21.2, n=50) | |
| Dell XPS 14 2024 OLED | |
| SCHENKER Key 14 (M24) | |
| SCHENKER Vision 14 M23 RTX 3050 | |
| LibreOffice / 20 Documents To PDF | |
| Lenovo Yoga Pro 7 14IMH9 | |
| SCHENKER Vision 14 M23 RTX 3050 | |
| Lenovo Yoga Pro 7 14ASP G9 | |
| Średnia w klasie Multimedia (23.9 - 146.7, n=76, ostatnie 2 lata) | |
| Dell XPS 14 2024 OLED | |
| Przeciętny Intel Core Ultra 7 155H (37.5 - 79.2, n=49) | |
| Lenovo Yoga Pro 7 14IMH9, RTX 4050 | |
| HP OmniBook Ultra 14 | |
| SCHENKER Key 14 (M24) | |
| R Benchmark 2.5 / Overall mean | |
| Lenovo Yoga Pro 7 14IMH9 | |
| SCHENKER Key 14 (M24) | |
| Przeciętny Intel Core Ultra 7 155H (0.4457 - 0.53, n=49) | |
| Średnia w klasie Multimedia (0.3604 - 0.947, n=74, ostatnie 2 lata) | |
| Dell XPS 14 2024 OLED | |
| Lenovo Yoga Pro 7 14IMH9, RTX 4050 | |
| SCHENKER Vision 14 M23 RTX 3050 | |
| HP OmniBook Ultra 14 | |
| Lenovo Yoga Pro 7 14ASP G9 | |
* ... im mniej tym lepiej
AIDA64: FP32 Ray-Trace | FPU Julia | CPU SHA3 | CPU Queen | FPU SinJulia | FPU Mandel | CPU AES | CPU ZLib | FP64 Ray-Trace | CPU PhotoWorxx
| Performance Rating | |
| HP OmniBook Ultra 14 | |
| Lenovo Yoga Pro 7 14IMH9, RTX 4050 | |
| Lenovo Yoga Pro 7 14IMH9 | |
| Średnia w klasie Multimedia | |
| SCHENKER Key 14 (M24) | |
| Przeciętny Intel Core Ultra 7 155H | |
| Dell XPS 14 2024 OLED | |
| SCHENKER Vision 14 M23 RTX 3050 | |
| AIDA64 / FP32 Ray-Trace | |
| HP OmniBook Ultra 14 | |
| Lenovo Yoga Pro 7 14IMH9, RTX 4050 | |
| Lenovo Yoga Pro 7 14IMH9 | |
| Średnia w klasie Multimedia (5121 - 50388, n=73, ostatnie 2 lata) | |
| SCHENKER Key 14 (M24) | |
| Przeciętny Intel Core Ultra 7 155H (6670 - 18470, n=50) | |
| SCHENKER Vision 14 M23 RTX 3050 | |
| Dell XPS 14 2024 OLED | |
| AIDA64 / FPU Julia | |
| HP OmniBook Ultra 14 | |
| Lenovo Yoga Pro 7 14IMH9, RTX 4050 | |
| Lenovo Yoga Pro 7 14IMH9 | |
| Średnia w klasie Multimedia (14528 - 201874, n=74, ostatnie 2 lata) | |
| SCHENKER Key 14 (M24) | |
| Przeciętny Intel Core Ultra 7 155H (40905 - 93181, n=50) | |
| SCHENKER Vision 14 M23 RTX 3050 | |
| Dell XPS 14 2024 OLED | |
| AIDA64 / CPU SHA3 | |
| HP OmniBook Ultra 14 | |
| Lenovo Yoga Pro 7 14IMH9, RTX 4050 | |
| Lenovo Yoga Pro 7 14IMH9 | |
| Średnia w klasie Multimedia (1188 - 8623, n=74, ostatnie 2 lata) | |
| SCHENKER Key 14 (M24) | |
| Przeciętny Intel Core Ultra 7 155H (1940 - 4436, n=50) | |
| Dell XPS 14 2024 OLED | |
| SCHENKER Vision 14 M23 RTX 3050 | |
| AIDA64 / CPU Queen | |
| HP OmniBook Ultra 14 | |
| Średnia w klasie Multimedia (21547 - 181505, n=74, ostatnie 2 lata) | |
| SCHENKER Vision 14 M23 RTX 3050 | |
| SCHENKER Key 14 (M24) | |
| Lenovo Yoga Pro 7 14IMH9 | |
| Lenovo Yoga Pro 7 14IMH9, RTX 4050 | |
| Dell XPS 14 2024 OLED | |
| Przeciętny Intel Core Ultra 7 155H (64698 - 94181, n=50) | |
| AIDA64 / FPU SinJulia | |
| HP OmniBook Ultra 14 | |
| Lenovo Yoga Pro 7 14IMH9, RTX 4050 | |
| Lenovo Yoga Pro 7 14IMH9 | |
| Średnia w klasie Multimedia (1240 - 28794, n=74, ostatnie 2 lata) | |
| SCHENKER Key 14 (M24) | |
| Przeciętny Intel Core Ultra 7 155H (5639 - 10647, n=50) | |
| Dell XPS 14 2024 OLED | |
| SCHENKER Vision 14 M23 RTX 3050 | |
| AIDA64 / FPU Mandel | |
| HP OmniBook Ultra 14 | |
| Lenovo Yoga Pro 7 14IMH9, RTX 4050 | |
| Lenovo Yoga Pro 7 14IMH9 | |
| Średnia w klasie Multimedia (9903 - 105740, n=73, ostatnie 2 lata) | |
| SCHENKER Key 14 (M24) | |
| Przeciętny Intel Core Ultra 7 155H (18236 - 47685, n=50) | |
| SCHENKER Vision 14 M23 RTX 3050 | |
| Dell XPS 14 2024 OLED | |
| AIDA64 / CPU AES | |
| Lenovo Yoga Pro 7 14IMH9, RTX 4050 | |
| Przeciętny Intel Core Ultra 7 155H (45713 - 152179, n=50) | |
| HP OmniBook Ultra 14 | |
| Lenovo Yoga Pro 7 14IMH9 | |
| Średnia w klasie Multimedia (26066 - 169946, n=74, ostatnie 2 lata) | |
| SCHENKER Key 14 (M24) | |
| Dell XPS 14 2024 OLED | |
| SCHENKER Vision 14 M23 RTX 3050 | |
| AIDA64 / CPU ZLib | |
| HP OmniBook Ultra 14 | |
| Lenovo Yoga Pro 7 14IMH9, RTX 4050 | |
| Lenovo Yoga Pro 7 14IMH9 | |
| SCHENKER Key 14 (M24) | |
| Średnia w klasie Multimedia (440 - 2022, n=74, ostatnie 2 lata) | |
| Przeciętny Intel Core Ultra 7 155H (557 - 1250, n=50) | |
| Dell XPS 14 2024 OLED | |
| SCHENKER Vision 14 M23 RTX 3050 | |
| AIDA64 / FP64 Ray-Trace | |
| HP OmniBook Ultra 14 | |
| Lenovo Yoga Pro 7 14IMH9, RTX 4050 | |
| Średnia w klasie Multimedia (2759 - 26875, n=74, ostatnie 2 lata) | |
| Lenovo Yoga Pro 7 14IMH9 | |
| SCHENKER Key 14 (M24) | |
| SCHENKER Vision 14 M23 RTX 3050 | |
| Przeciętny Intel Core Ultra 7 155H (3569 - 9802, n=50) | |
| Dell XPS 14 2024 OLED | |
| AIDA64 / CPU PhotoWorxx | |
| Lenovo Yoga Pro 7 14IMH9, RTX 4050 | |
| Lenovo Yoga Pro 7 14IMH9 | |
| Dell XPS 14 2024 OLED | |
| HP OmniBook Ultra 14 | |
| SCHENKER Key 14 (M24) | |
| Przeciętny Intel Core Ultra 7 155H (32719 - 54223, n=50) | |
| SCHENKER Vision 14 M23 RTX 3050 | |
| Średnia w klasie Multimedia (12860 - 58844, n=74, ostatnie 2 lata) | |
Wydajność systemu
Yoga wypadła bardzo dobrze w testach systemowych i jest responsywnym urządzeniem podczas codziennego użytkowania. Nie było żadnych problemów ze stabilnością systemu na naszym urządzeniu testowym.
CrossMark: Overall | Productivity | Creativity | Responsiveness
WebXPRT 3: Overall
WebXPRT 4: Overall
Mozilla Kraken 1.1: Total
| PCMark 10 / Score | |
| HP OmniBook Ultra 14 | |
| Lenovo Yoga Pro 7 14IMH9, RTX 4050 | |
| Lenovo Yoga Pro 7 14IMH9 | |
| Średnia w klasie Multimedia (4325 - 8670, n=70, ostatnie 2 lata) | |
| Przeciętny Intel Core Ultra 7 155H, NVIDIA GeForce RTX 4050 Laptop GPU (6537 - 6973, n=5) | |
| SCHENKER Key 14 (M24) | |
| Dell XPS 14 2024 OLED | |
| SCHENKER Vision 14 M23 RTX 3050 | |
| PCMark 10 / Essentials | |
| HP OmniBook Ultra 14 | |
| Lenovo Yoga Pro 7 14IMH9 | |
| Średnia w klasie Multimedia (8025 - 12420, n=70, ostatnie 2 lata) | |
| Lenovo Yoga Pro 7 14IMH9, RTX 4050 | |
| Przeciętny Intel Core Ultra 7 155H, NVIDIA GeForce RTX 4050 Laptop GPU (9463 - 10446, n=5) | |
| SCHENKER Key 14 (M24) | |
| Dell XPS 14 2024 OLED | |
| SCHENKER Vision 14 M23 RTX 3050 | |
| PCMark 10 / Productivity | |
| HP OmniBook Ultra 14 | |
| Lenovo Yoga Pro 7 14IMH9, RTX 4050 | |
| Przeciętny Intel Core Ultra 7 155H, NVIDIA GeForce RTX 4050 Laptop GPU (8769 - 9272, n=5) | |
| Średnia w klasie Multimedia (6089 - 10615, n=70, ostatnie 2 lata) | |
| SCHENKER Vision 14 M23 RTX 3050 | |
| Dell XPS 14 2024 OLED | |
| Lenovo Yoga Pro 7 14IMH9 | |
| SCHENKER Key 14 (M24) | |
| PCMark 10 / Digital Content Creation | |
| HP OmniBook Ultra 14 | |
| SCHENKER Key 14 (M24) | |
| Lenovo Yoga Pro 7 14IMH9 | |
| Lenovo Yoga Pro 7 14IMH9, RTX 4050 | |
| Przeciętny Intel Core Ultra 7 155H, NVIDIA GeForce RTX 4050 Laptop GPU (8602 - 10622, n=5) | |
| Średnia w klasie Multimedia (3651 - 13548, n=70, ostatnie 2 lata) | |
| Dell XPS 14 2024 OLED | |
| SCHENKER Vision 14 M23 RTX 3050 | |
| CrossMark / Overall | |
| SCHENKER Key 14 (M24) | |
| Średnia w klasie Multimedia (866 - 2255, n=81, ostatnie 2 lata) | |
| HP OmniBook Ultra 14 | |
| Dell XPS 14 2024 OLED | |
| Przeciętny Intel Core Ultra 7 155H, NVIDIA GeForce RTX 4050 Laptop GPU (1552 - 1740, n=5) | |
| Lenovo Yoga Pro 7 14IMH9, RTX 4050 | |
| SCHENKER Vision 14 M23 RTX 3050 | |
| CrossMark / Productivity | |
| SCHENKER Key 14 (M24) | |
| Średnia w klasie Multimedia (913 - 2050, n=81, ostatnie 2 lata) | |
| HP OmniBook Ultra 14 | |
| Dell XPS 14 2024 OLED | |
| Przeciętny Intel Core Ultra 7 155H, NVIDIA GeForce RTX 4050 Laptop GPU (1459 - 1659, n=5) | |
| Lenovo Yoga Pro 7 14IMH9, RTX 4050 | |
| SCHENKER Vision 14 M23 RTX 3050 | |
| CrossMark / Creativity | |
| Średnia w klasie Multimedia (907 - 2795, n=81, ostatnie 2 lata) | |
| HP OmniBook Ultra 14 | |
| Dell XPS 14 2024 OLED | |
| Przeciętny Intel Core Ultra 7 155H, NVIDIA GeForce RTX 4050 Laptop GPU (1811 - 1943, n=5) | |
| SCHENKER Key 14 (M24) | |
| Lenovo Yoga Pro 7 14IMH9, RTX 4050 | |
| SCHENKER Vision 14 M23 RTX 3050 | |
| CrossMark / Responsiveness | |
| SCHENKER Key 14 (M24) | |
| HP OmniBook Ultra 14 | |
| Średnia w klasie Multimedia (605 - 2094, n=81, ostatnie 2 lata) | |
| Dell XPS 14 2024 OLED | |
| Przeciętny Intel Core Ultra 7 155H, NVIDIA GeForce RTX 4050 Laptop GPU (1167 - 1467, n=5) | |
| SCHENKER Vision 14 M23 RTX 3050 | |
| Lenovo Yoga Pro 7 14IMH9, RTX 4050 | |
| WebXPRT 3 / Overall | |
| HP OmniBook Ultra 14 | |
| Średnia w klasie Multimedia (136.4 - 545, n=81, ostatnie 2 lata) | |
| SCHENKER Vision 14 M23 RTX 3050 | |
| Lenovo Yoga Pro 7 14IMH9, RTX 4050 | |
| Dell XPS 14 2024 OLED | |
| SCHENKER Key 14 (M24) | |
| Lenovo Yoga Pro 7 14IMH9 | |
| Przeciętny Intel Core Ultra 7 155H, NVIDIA GeForce RTX 4050 Laptop GPU (262 - 285, n=5) | |
| WebXPRT 4 / Overall | |
| SCHENKER Vision 14 M23 RTX 3050 | |
| HP OmniBook Ultra 14 | |
| Średnia w klasie Multimedia (133.2 - 353, n=75, ostatnie 2 lata) | |
| Lenovo Yoga Pro 7 14IMH9, RTX 4050 | |
| Dell XPS 14 2024 OLED | |
| Przeciętny Intel Core Ultra 7 155H, NVIDIA GeForce RTX 4050 Laptop GPU (247 - 260, n=5) | |
| SCHENKER Key 14 (M24) | |
| Mozilla Kraken 1.1 / Total | |
| SCHENKER Key 14 (M24) | |
| Lenovo Yoga Pro 7 14IMH9 | |
| Lenovo Yoga Pro 7 14IMH9, RTX 4050 | |
| Dell XPS 14 2024 OLED | |
| Przeciętny Intel Core Ultra 7 155H, NVIDIA GeForce RTX 4050 Laptop GPU (416 - 561, n=5) | |
| SCHENKER Vision 14 M23 RTX 3050 | |
| Średnia w klasie Multimedia (254 - 1016, n=86, ostatnie 2 lata) | |
| HP OmniBook Ultra 14 | |
* ... im mniej tym lepiej
| PCMark 10 Score | 6941 pkt. | |
Pomoc | ||
| AIDA64 / Memory Copy | |
| Lenovo Yoga Pro 7 14IMH9, RTX 4050 | |
| Lenovo Yoga Pro 7 14IMH9 | |
| Dell XPS 14 2024 OLED | |
| HP OmniBook Ultra 14 | |
| Przeciętny Intel Core Ultra 7 155H (62397 - 96791, n=50) | |
| SCHENKER Key 14 (M24) | |
| Średnia w klasie Multimedia (21158 - 104459, n=74, ostatnie 2 lata) | |
| SCHENKER Vision 14 M23 RTX 3050 | |
| AIDA64 / Memory Read | |
| HP OmniBook Ultra 14 | |
| Lenovo Yoga Pro 7 14IMH9, RTX 4050 | |
| Dell XPS 14 2024 OLED | |
| Lenovo Yoga Pro 7 14IMH9 | |
| SCHENKER Key 14 (M24) | |
| Przeciętny Intel Core Ultra 7 155H (60544 - 90647, n=50) | |
| Średnia w klasie Multimedia (24312 - 125604, n=74, ostatnie 2 lata) | |
| SCHENKER Vision 14 M23 RTX 3050 | |
| AIDA64 / Memory Write | |
| HP OmniBook Ultra 14 | |
| SCHENKER Key 14 (M24) | |
| Dell XPS 14 2024 OLED | |
| Lenovo Yoga Pro 7 14IMH9, RTX 4050 | |
| Lenovo Yoga Pro 7 14IMH9 | |
| Przeciętny Intel Core Ultra 7 155H (58692 - 93451, n=50) | |
| Średnia w klasie Multimedia (23679 - 117933, n=74, ostatnie 2 lata) | |
| SCHENKER Vision 14 M23 RTX 3050 | |
| AIDA64 / Memory Latency | |
| Lenovo Yoga Pro 7 14IMH9 | |
| Przeciętny Intel Core Ultra 7 155H (116.2 - 233, n=50) | |
| Dell XPS 14 2024 OLED | |
| Lenovo Yoga Pro 7 14IMH9, RTX 4050 | |
| HP OmniBook Ultra 14 | |
| SCHENKER Key 14 (M24) | |
| Średnia w klasie Multimedia (7 - 346, n=74, ostatnie 2 lata) | |
| SCHENKER Vision 14 M23 RTX 3050 | |
* ... im mniej tym lepiej
Opóźnienia DPC
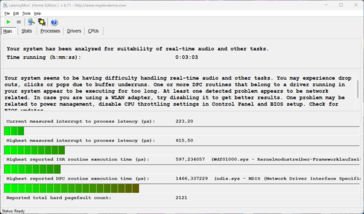
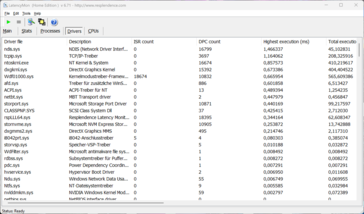
W naszym standardowym teście opóźnień (surfowanie po sieci, odtwarzanie YouTube 4K, obciążenie procesora), nasze urządzenie testowe z aktualną wersją BIOS-u nie wykazało żadnych problemów. Jeden ze sterowników nieco zawiódł, ale ważna wartość "interrupt-to-process-latency" była niska.
| DPC Latencies / LatencyMon - interrupt to process latency (max), Web, Youtube, Prime95 | |
| Dell XPS 14 2024 OLED | |
| SCHENKER Vision 14 M23 RTX 3050 | |
| Lenovo Yoga Pro 7 14IMH9 | |
| Lenovo Yoga Pro 7 14IMH9, RTX 4050 | |
| SCHENKER Key 14 (M24) | |
* ... im mniej tym lepiej
Urządzenie pamięci masowej
Jak opisano powyżej, konfiguracje Yoga Pro 7 14 z dedykowanym GPU są ograniczone do jednego kompaktowego dysku SSD M.2-2242. W naszym urządzeniu testowym zainstalowano wersję Samsung PM9C1a o pojemności 1 TB, a zmierzone przez nas prędkości transferu PCIe 4.0 SSD były przyzwoite. Jego wydajność wahała się nieznacznie przy stałym obciążeniu, ale nie powodowało to żadnych problemów. Więcej testów porównawczych dysków SSD znajdą Państwo tutaj.
* ... im mniej tym lepiej
Reading continuous performance: DiskSpd Read Loop, Queue Depth 8
Karta graficzna
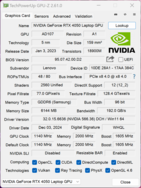
Oprócz zintegrowanej z procesorem grafiki Intel Arc Graphics, nasze urządzenie testowe wykorzystuje dedykowaną kartę graficzną Nvidia GeForce RTX 4050 Laptop z 6 GB pamięci VRAM, z przełączaniem grafiki za pomocą technologii Optimus. Maksymalne TGP laptopa 4050 wynosi 60 W (45 W + 15 W Dynamic Boost), więc nie można w pełni wykorzystać pełnej wydajności laptopa 4050. Podczas syntetycznych benchmarków graficznych wydajność obu modeli iGPU Yoga Pro 7 14 została podwojona. RTX 4050 Laptop wewnątrz Dell XPS 14 (30 watów TGP) był znacznie wolniejszy, podczas gdy RTX 4060 Laptop w Schenker Key 14 (100 watów TGP) był szybszy.
Wyniki te zostały potwierdzone podczas rzeczywistych testów gier, a Yoga Pro 7 14 poradziła sobie z obecnymi grami na wysokich detalach i w rozdzielczości Full HD. W rozdzielczości QHD było jednak nieco ciaśniej. W sumie jednak udało się uzyskać solidne wyniki. Jego GPU i wydajność w grach pozostają niezmienne pod stałym obciążeniem. W trybie bateryjnym zużycie energii przez GPU jest ograniczone do 45 watów, co prowadzi do spadku wydajności o około 12%. Dalsze testy porównawcze GPU są dostępne tutaj.
| 3DMark 11 Performance | 24470 pkt. | |
| 3DMark Fire Strike Score | 17998 pkt. | |
| 3DMark Time Spy Score | 7757 pkt. | |
| 3DMark Steel Nomad Score | 1561 pkt. | |
| 3DMark Steel Nomad Light Score | 7254 pkt. | |
Pomoc | ||
| Blender / v3.3 Classroom OPTIX/RTX | |
| SCHENKER Vision 14 M23 RTX 3050 | |
| Średnia w klasie Multimedia (19 - 105, n=39, ostatnie 2 lata) | |
| Dell XPS 14 2024 OLED | |
| Lenovo Yoga Pro 7 14IMH9, RTX 4050 | |
| Przeciętny NVIDIA GeForce RTX 4050 Laptop GPU (25 - 37, n=39) | |
| SCHENKER Key 14 (M24) | |
| Blender / v3.3 Classroom CUDA | |
| SCHENKER Vision 14 M23 RTX 3050 | |
| Dell XPS 14 2024 OLED | |
| Średnia w klasie Multimedia (32 - 164, n=39, ostatnie 2 lata) | |
| Przeciętny NVIDIA GeForce RTX 4050 Laptop GPU (47 - 175, n=40) | |
| Lenovo Yoga Pro 7 14IMH9, RTX 4050 | |
| SCHENKER Key 14 (M24) | |
| Blender / v3.3 Classroom CPU | |
| Dell XPS 14 2024 OLED | |
| SCHENKER Vision 14 M23 RTX 3050 | |
| Średnia w klasie Multimedia (160 - 1042, n=80, ostatnie 2 lata) | |
| Przeciętny NVIDIA GeForce RTX 4050 Laptop GPU (243 - 907, n=40) | |
| SCHENKER Key 14 (M24) | |
| Lenovo Yoga Pro 7 14IMH9 | |
| Lenovo Yoga Pro 7 14IMH9, RTX 4050 | |
| HP OmniBook Ultra 14 | |
* ... im mniej tym lepiej
| Cyberpunk 2077 2.2 Phantom Liberty - 1920x1080 Ultra Preset (FSR off) | |
| SCHENKER Key 14 (M24) | |
| Lenovo Yoga Pro 7 14IMH9, RTX 4050 | |
| Dell XPS 14 2024 OLED | |
| Średnia w klasie Multimedia (8.26 - 86, n=63, ostatnie 2 lata) | |
| SCHENKER Vision 14 M23 RTX 3050 | |
| HP OmniBook Ultra 14 | |
| Lenovo Yoga Pro 7 14ASP G9 | |
| GTA V - 1920x1080 Highest Settings possible AA:4xMSAA + FX AF:16x | |
| Lenovo Yoga Pro 7 14IMH9, RTX 4050 | |
| SCHENKER Key 14 (M24) | |
| Dell XPS 14 2024 OLED | |
| Średnia w klasie Multimedia (9.38 - 141.6, n=77, ostatnie 2 lata) | |
| SCHENKER Vision 14 M23 RTX 3050 | |
| Lenovo Yoga Pro 7 14ASP G9 | |
| HP OmniBook Ultra 14 | |
| Lenovo Yoga Pro 7 14IMH9 | |
Cyberpunk 2077 ultra FPS diagram
| low | med. | high | ultra | QHD | |
|---|---|---|---|---|---|
| GTA V (2015) | 133.5 | 84.9 | 63.7 | ||
| Dota 2 Reborn (2015) | 163.1 | 148.7 | 143.9 | 133.8 | |
| Final Fantasy XV Benchmark (2018) | 156 | 99 | 71.9 | 52.6 | |
| X-Plane 11.11 (2018) | 127.9 | 113.6 | 89.9 | ||
| Strange Brigade (2018) | 385 | 178 | 146 | 129 | 86 |
| Baldur's Gate 3 (2023) | 95.9 | 74.4 | 53.3 | 49.8 | 35.7 |
| Cyberpunk 2077 2.2 Phantom Liberty (2023) | 88.9 | 70.5 | 59.3 | 50.8 | 31.4 |
Emisje i energia
Emisja hałasu
Dwa wentylatory jednostki chłodzącej generalnie pozostają ciche lub wytwarzają niski hałas (~30 dB(A)) na biegu jałowym i przy niskim obciążeniu. Jednak gdy tylko procesor lub karta graficzna są obciążone, szybko stają się wyraźnie słyszalne ze względu na wysokie limity mocy. Zmierzyliśmy 49,1 dB(A) zarówno podczas grania, jak i podczas naszego testu obciążeniowego, co może stać się irytujące na dłuższą metę. W trybie adaptacyjnym(Auto) odnotowaliśmy 45 dB(A), co nadal jest bardzo słyszalne. Życzylibyśmy sobie nieco szerszego rozrzutu i wyniku w okolicach 40 dB(A). Dopiero w trybie oszczędzania baterii jest znacznie ciszej, gdzie można spodziewać się maksymalnie 29,8 dB(A) - ale wtedy wydajność laptopa również znacznie spada i na przykład granie nie jest już możliwe. Z naszego urządzenia testowego nie dochodziły żadne inne odgłosy elektroniczne.
Hałas
| luz |
| 25.4 / 25.4 / 29.8 dB |
| obciążenie |
| 39.3 / 49.1 dB |
 | ||
30 dB cichy 40 dB(A) słyszalny 50 dB(A) irytujący |
||
min: | ||
| Lenovo Yoga Pro 7 14IMH9, RTX 4050 NVIDIA GeForce RTX 4050 Laptop GPU, Ultra 7 155H, Samsung PM9C1a MZAL81T0HDLB | SCHENKER Key 14 (M24) NVIDIA GeForce RTX 4060 Laptop GPU, Ultra 7 155H, Samsung 990 Pro 1 TB | Dell XPS 14 2024 OLED NVIDIA GeForce RTX 4050 Laptop GPU, Ultra 7 155H, Samsung PM9A1 MZVL21T0HCLR | HP OmniBook Ultra 14 Radeon 890M, Ryzen AI 9 HX 375, SK hynix PC801 HFS002TEJ9X101N | SCHENKER Vision 14 M23 RTX 3050 GeForce RTX 3050 6GB Laptop GPU, i7-13700H, Samsung 990 Pro 1 TB | Lenovo Yoga Pro 7 14IMH9 Arc 8-Core, Ultra 7 155H, SK Hynix HFS001TEJ9X115N | Lenovo Yoga Pro 7 14ASP G9 Radeon 880M, Ryzen AI 9 365, Micron 2550 1TB MTFDKCD1T0TGE | |
|---|---|---|---|---|---|---|---|
| Noise | -10% | 4% | 10% | 4% | 5% | 9% | |
| wyłączone / środowisko * | 25.4 | 25.5 -0% | 24.3 4% | 23.8 6% | 23.5 7% | 24 6% | 23.8 6% |
| Idle Minimum * | 25.4 | 25.5 -0% | 24.3 4% | 24.9 2% | 23.5 7% | 25 2% | 23.8 6% |
| Idle Average * | 25.4 | 26.5 -4% | 26.5 -4% | 24.9 2% | 23.5 7% | 27 -6% | 23.8 6% |
| Idle Maximum * | 29.8 | 30.3 -2% | 28.5 4% | 24.9 16% | 26 13% | 30 -1% | 23.8 20% |
| Load Average * | 39.3 | 49.3 -25% | 37 6% | 32.9 16% | 43.6 -11% | 36 8% | 44.6 -13% |
| Cyberpunk 2077 ultra * | 49.1 | 57.8 -18% | 40.9 17% | 35.9 27% | |||
| Load Maximum * | 49.1 | 57.8 -18% | 43.3 12% | 43 12% | 49.1 -0% | 38 23% | 44.6 9% |
| Witcher 3 ultra * | 39.1 | 48.7 | 38 |
* ... im mniej tym lepiej
Temperatura
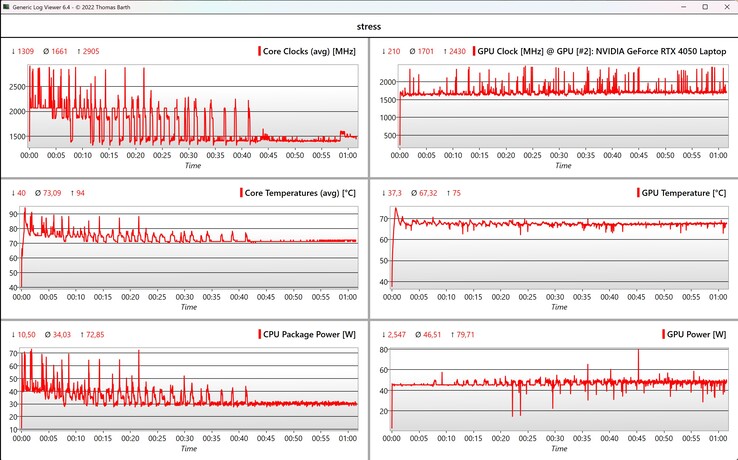
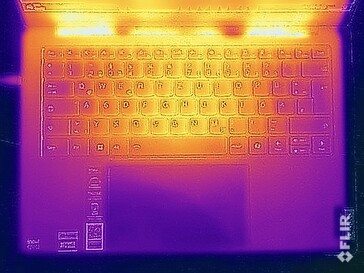
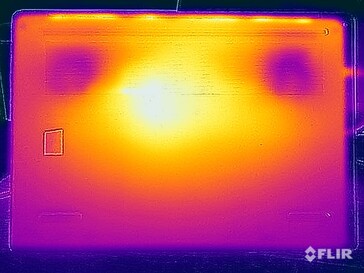
Lenovo dobrze kontroluje temperatury powierzchni laptopa, ponieważ zmierzyliśmy maksymalnie 43 °C nawet przy pełnym obciążeniu. W rezultacie można umieścić Yogę na udach w tych obudowach. Cała obudowa pozostaje przyjemnie chłodna przy niskim obciążeniu. Podczas testu obciążeniowego GPU działało z mocą 45 watów, podczas gdy procesor początkowo nieco się wahał i ostatecznie osiadł na poziomie 30 watów w trakcie testu obciążeniowego.
(±) Maksymalna temperatura w górnej części wynosi 42.4 °C / 108 F, w porównaniu do średniej 36.9 °C / 98 F , począwszy od 21.1 do 71 °C dla klasy Multimedia.
(±) Dno nagrzewa się maksymalnie do 43.3 °C / 110 F, w porównaniu do średniej 39.2 °C / 103 F
(+) W stanie bezczynności średnia temperatura górnej części wynosi 26.9 °C / 80 F, w porównaniu ze średnią temperaturą urządzenia wynoszącą 31.3 °C / ### class_avg_f### F.
(-) 3: The average temperature for the upper side is 38.2 °C / 101 F, compared to the average of 31.3 °C / 88 F for the class Multimedia.
(+) Podpórki pod nadgarstki i touchpad są chłodniejsze niż temperatura skóry i maksymalnie 30.5 °C / 86.9 F i dlatego są chłodne w dotyku.
(±) Średnia temperatura obszaru podparcia dłoni w podobnych urządzeniach wynosiła 28.8 °C / 83.8 F (-1.7 °C / -3.1 F).
| Lenovo Yoga Pro 7 14IMH9, RTX 4050 Intel Core Ultra 7 155H, NVIDIA GeForce RTX 4050 Laptop GPU | SCHENKER Key 14 (M24) Intel Core Ultra 7 155H, NVIDIA GeForce RTX 4060 Laptop GPU | Dell XPS 14 2024 OLED Intel Core Ultra 7 155H, NVIDIA GeForce RTX 4050 Laptop GPU | HP OmniBook Ultra 14 AMD Ryzen AI 9 HX 375, AMD Radeon 890M | SCHENKER Vision 14 M23 RTX 3050 Intel Core i7-13700H, NVIDIA GeForce RTX 3050 6GB Laptop GPU | Lenovo Yoga Pro 7 14IMH9 Intel Core Ultra 7 155H, Intel Arc 8-Core iGPU | |
|---|---|---|---|---|---|---|
| Heat | -20% | 2% | -7% | -9% | 4% | |
| Maximum Upper Side * | 42.4 | 43.1 -2% | 40.5 4% | 40.4 5% | 48.5 -14% | 43 -1% |
| Maximum Bottom * | 43.3 | 51.3 -18% | 42.6 2% | 43.6 -1% | 52.8 -22% | 42 3% |
| Idle Upper Side * | 27.5 | 33.2 -21% | 26.9 2% | 31 -13% | 27.6 -0% | 25 9% |
| Idle Bottom * | 27.6 | 38.3 -39% | 27.8 -1% | 32.2 -17% | 27 2% | 26 6% |
* ... im mniej tym lepiej
Głośniki
Lenovo Yoga Pro 7 14IMH9, RTX 4050 analiza dźwięku
(+) | głośniki mogą odtwarzać stosunkowo głośno (83.1 dB)
Bas 100 - 315 Hz
(±) | zredukowany bas - średnio 12.1% niższy od mediany
(±) | liniowość basu jest średnia (12.1% delta do poprzedniej częstotliwości)
Średnie 400 - 2000 Hz
(+) | zbalansowane środki średnie - tylko 3.2% od mediany
(+) | średnie są liniowe (5.7% delta do poprzedniej częstotliwości)
Wysokie 2–16 kHz
(+) | zrównoważone maksima - tylko 3% od mediany
(+) | wzloty są liniowe (3.8% delta do poprzedniej częstotliwości)
Ogólnie 100 - 16.000 Hz
(+) | ogólny dźwięk jest liniowy (10.8% różnicy w stosunku do mediany)
W porównaniu do tej samej klasy
» 11% wszystkich testowanych urządzeń w tej klasie było lepszych, 2% podobnych, 87% gorszych
» Najlepszy miał deltę 5%, średnia wynosiła ###średnia###%, najgorsza wynosiła 45%
W porównaniu do wszystkich testowanych urządzeń
» 5% wszystkich testowanych urządzeń było lepszych, 1% podobnych, 94% gorszych
» Najlepszy miał deltę 4%, średnia wynosiła ###średnia###%, najgorsza wynosiła 134%
SCHENKER Key 14 (M24) analiza dźwięku
(±) | głośność głośnika jest średnia, ale dobra (81.5 dB)
Bas 100 - 315 Hz
(-) | prawie brak basu - średnio 29.9% niższa od mediany
(±) | liniowość basu jest średnia (7.9% delta do poprzedniej częstotliwości)
Średnie 400 - 2000 Hz
(±) | wyższe średnie - średnio 5.3% wyższe niż mediana
(+) | średnie są liniowe (5.9% delta do poprzedniej częstotliwości)
Wysokie 2–16 kHz
(+) | zrównoważone maksima - tylko 2.1% od mediany
(+) | wzloty są liniowe (2.8% delta do poprzedniej częstotliwości)
Ogólnie 100 - 16.000 Hz
(±) | liniowość ogólnego dźwięku jest średnia (20.9% różnicy w stosunku do mediany)
W porównaniu do tej samej klasy
» 70% wszystkich testowanych urządzeń w tej klasie było lepszych, 8% podobnych, 22% gorszych
» Najlepszy miał deltę 5%, średnia wynosiła ###średnia###%, najgorsza wynosiła 45%
W porównaniu do wszystkich testowanych urządzeń
» 54% wszystkich testowanych urządzeń było lepszych, 8% podobnych, 38% gorszych
» Najlepszy miał deltę 4%, średnia wynosiła ###średnia###%, najgorsza wynosiła 134%
Dell XPS 14 2024 OLED analiza dźwięku
(+) | głośniki mogą odtwarzać stosunkowo głośno (82.8 dB)
Bas 100 - 315 Hz
(±) | zredukowany bas - średnio 9.9% niższy od mediany
(±) | liniowość basu jest średnia (10.1% delta do poprzedniej częstotliwości)
Średnie 400 - 2000 Hz
(+) | zbalansowane środki średnie - tylko 4.4% od mediany
(+) | średnie są liniowe (3.8% delta do poprzedniej częstotliwości)
Wysokie 2–16 kHz
(+) | zrównoważone maksima - tylko 2.3% od mediany
(±) | liniowość wysokich wartości jest średnia (7% delta do poprzedniej częstotliwości)
Ogólnie 100 - 16.000 Hz
(+) | ogólny dźwięk jest liniowy (11% różnicy w stosunku do mediany)
W porównaniu do tej samej klasy
» 12% wszystkich testowanych urządzeń w tej klasie było lepszych, 3% podobnych, 85% gorszych
» Najlepszy miał deltę 5%, średnia wynosiła ###średnia###%, najgorsza wynosiła 45%
W porównaniu do wszystkich testowanych urządzeń
» 5% wszystkich testowanych urządzeń było lepszych, 2% podobnych, 93% gorszych
» Najlepszy miał deltę 4%, średnia wynosiła ###średnia###%, najgorsza wynosiła 134%
HP OmniBook Ultra 14 analiza dźwięku
(+) | głośniki mogą odtwarzać stosunkowo głośno (88.8 dB)
Bas 100 - 315 Hz
(±) | zredukowany bas - średnio 9.9% niższy od mediany
(±) | liniowość basu jest średnia (9.5% delta do poprzedniej częstotliwości)
Średnie 400 - 2000 Hz
(+) | zbalansowane środki średnie - tylko 4% od mediany
(+) | średnie są liniowe (4.3% delta do poprzedniej częstotliwości)
Wysokie 2–16 kHz
(+) | zrównoważone maksima - tylko 2.7% od mediany
(+) | wzloty są liniowe (3.6% delta do poprzedniej częstotliwości)
Ogólnie 100 - 16.000 Hz
(+) | ogólny dźwięk jest liniowy (9.2% różnicy w stosunku do mediany)
W porównaniu do tej samej klasy
» 3% wszystkich testowanych urządzeń w tej klasie było lepszych, 1% podobnych, 96% gorszych
» Najlepszy miał deltę 5%, średnia wynosiła ###średnia###%, najgorsza wynosiła 53%
W porównaniu do wszystkich testowanych urządzeń
» 3% wszystkich testowanych urządzeń było lepszych, 1% podobnych, 97% gorszych
» Najlepszy miał deltę 4%, średnia wynosiła ###średnia###%, najgorsza wynosiła 134%
Zużycie energii
Wartości poboru mocy w stanie spoczynku są dość niskie, ale problem szybko ujawnia się pod obciążeniem. Dostarczony 100-watowy zasilacz nie wystarcza do pokrycia poboru mocy laptopa pod pełnym obciążeniem. Zmierzyliśmy nieco poniżej 111 watów podczas testu obciążeniowego i około 105 watów podczas pozostałej części testu. W rezultacie bateria rozładowywała się podczas testu obciążeniowego; o około 9% na godzinę. Nawet podczas krótkich skoków obciążenia, bateria zawsze musi być na krótko odłączona. Jest to niepotrzebny środek oszczędnościowy i Lenovo powinno było dostarczyć wersję dGPU ze 130-watowym zasilaczem.
| wyłączony / stan wstrzymania | |
| luz | |
| obciążenie |
|
Legenda:
min: | |
| Lenovo Yoga Pro 7 14IMH9, RTX 4050 NVIDIA GeForce RTX 4050 Laptop GPU, Ultra 7 155H, Samsung PM9C1a MZAL81T0HDLB | SCHENKER Key 14 (M24) NVIDIA GeForce RTX 4060 Laptop GPU, Ultra 7 155H, Samsung 990 Pro 1 TB | Dell XPS 14 2024 OLED NVIDIA GeForce RTX 4050 Laptop GPU, Ultra 7 155H, Samsung PM9A1 MZVL21T0HCLR | HP OmniBook Ultra 14 Radeon 890M, Ryzen AI 9 HX 375, SK hynix PC801 HFS002TEJ9X101N | SCHENKER Vision 14 M23 RTX 3050 GeForce RTX 3050 6GB Laptop GPU, i7-13700H, Samsung 990 Pro 1 TB | Lenovo Yoga Pro 7 14IMH9 Arc 8-Core, Ultra 7 155H, SK Hynix HFS001TEJ9X115N | |
|---|---|---|---|---|---|---|
| Power Consumption | -46% | -22% | 31% | -5% | 8% | |
| Idle Minimum * | 4.9 | 5.8 -18% | 8.1 -65% | 2.7 45% | 5.2 -6% | 4 18% |
| Idle Average * | 6.9 | 10.8 -57% | 9.9 -43% | 5.4 22% | 7.8 -13% | 5.5 20% |
| Idle Maximum * | 9.3 | 11.1 -19% | 10.4 -12% | 5.5 41% | 9 3% | 11.8 -27% |
| Load Average * | 79.7 | 87.4 -10% | 75.6 5% | 67.4 15% | 78.6 1% | 66 17% |
| Cyberpunk 2077 ultra * | 97.5 | 175.3 -80% | 67.9 30% | |||
| Cyberpunk 2077 ultra external monitor * | 96.1 | 169.1 -76% | 67.8 29% | |||
| Load Maximum * | 110.9 | 183 -65% | 107.1 3% | 68.3 38% | 121.2 -9% | 100 10% |
| Witcher 3 ultra * | 65.6 | 86.8 | 55 |
* ... im mniej tym lepiej
Power consumption Cyberpunk / stress test
Power consumption with external monitor
Czas trwania
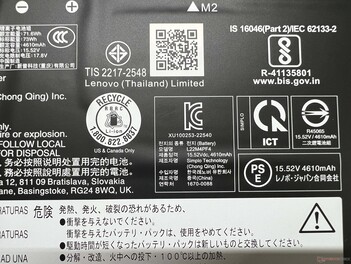
Akumulator o pojemności 73 Wh pozwala jedynie na przeciętny czas pracy na baterii. Podczas testu WLAN przy 150 cd/m² (co odpowiada 69% maksymalnej jasności SDR naszego urządzenia testowego) i 60 Hz, urządzenie działało około 8 godzin (lub 7 godzin przy 120 Hz) i 6:17 godzin przy pełnej jasności SDR (lub 05:40 godzin przy 120 Hz). W teście wideo przy 150 cd/m² wynik był lepszy, a urządzenie wytrzymało ponad 13 godzin.
| Lenovo Yoga Pro 7 14IMH9, RTX 4050 Ultra 7 155H, NVIDIA GeForce RTX 4050 Laptop GPU, 73 Wh | SCHENKER Key 14 (M24) Ultra 7 155H, NVIDIA GeForce RTX 4060 Laptop GPU, 80 Wh | Dell XPS 14 2024 OLED Ultra 7 155H, NVIDIA GeForce RTX 4050 Laptop GPU, 69.5 Wh | HP OmniBook Ultra 14 Ryzen AI 9 HX 375, Radeon 890M, 68 Wh | SCHENKER Vision 14 M23 RTX 3050 i7-13700H, GeForce RTX 3050 6GB Laptop GPU, 99 Wh | Lenovo Yoga Pro 7 14IMH9 Ultra 7 155H, Arc 8-Core, 73 Wh | Lenovo Yoga Pro 7 14ASP G9 Ryzen AI 9 365, Radeon 880M, 73 Wh | Średnia w klasie Multimedia | |
|---|---|---|---|---|---|---|---|---|
| Czasy pracy | -5% | -12% | 18% | 52% | 43% | -2% | 18% | |
| H.264 | 794 | 635 -20% | 649 -18% | 864 ? 9% | ||||
| WiFi v1.3 | 477 | 454 -5% | 465 -3% | 661 39% | 723 52% | 680 43% | 527 10% | 645 ? 35% |
| Load | 91 | 79 -13% | 88 -3% | 93 2% | 99 ? 9% |
Łączna ocena Notebookcheck
Lenovo Yoga Pro 7 14IMH9, RTX 4050
- 10/01/2025 v8
Andreas Osthoff
Przezroczystość
Wyboru urządzeń do recenzji dokonuje nasza redakcja. Próbka testowa została udostępniona autorowi jako pożyczka od producenta lub sprzedawcy detalicznego na potrzeby tej recenzji. Pożyczkodawca nie miał wpływu na tę recenzję, producent nie otrzymał też kopii tej recenzji przed publikacją. Nie było obowiązku publikowania tej recenzji. Nigdy nie przyjmujemy rekompensaty ani płatności w zamian za nasze recenzje. Jako niezależna firma medialna, Notebookcheck nie podlega władzy producentów, sprzedawców detalicznych ani wydawców.
Tak testuje Notebookcheck
Każdego roku Notebookcheck niezależnie sprawdza setki laptopów i smartfonów, stosując standardowe procedury, aby zapewnić porównywalność wszystkich wyników. Od około 20 lat stale rozwijamy nasze metody badawcze, ustanawiając przy tym standardy branżowe. W naszych laboratoriach testowych doświadczeni technicy i redaktorzy korzystają z wysokiej jakości sprzętu pomiarowego. Testy te obejmują wieloetapowy proces walidacji. Nasz kompleksowy system ocen opiera się na setkach uzasadnionych pomiarów i benchmarków, co pozwala zachować obiektywizm.












 Total Sustainability Score:


