

Recenzja Thinkeagle VigoBook G7: Nieźle za jedyne 500 dolarów
Starszy sprzęt AMD Zen 2 za niską cenę.
VigoBook G7 oferuje graniczną minimalną wydajność do podstawowych zadań, strumieniowania wideo i przeglądania stron internetowych, nie będąc przy tym nieznośnie powolnym.Allen Ngo, 👁 Allen Ngo (tłumaczenie DeepL / Ninh Duy) Opublikowany 🇺🇸 🇵🇹 ...
Werdykt - starszy Ryzen 7 działa jak Core i3
Ten laptop został zaprojektowany dla użytkowników, którzy są zadowoleni z wydajności na poziomie Core i3. Procesor Ryzen 7 5700U jest mocno podkręcony w VigoBooku G7, a jego spowolnienie jest nieco zauważalne podczas otwierania popularnych aplikacji, takich jak przeglądarki czy pakiet Office. Inne aspekty, takie jak kamera internetowa i głośniki, są bardzo niskiej jakości, nawet w porównaniu do innych budżetowych modeli, takich jak HP Pavilion.
Bardziej pozytywne aspekty obejmują wyświetlacz IPS i opcje portów, biorąc pod uwagę cenę. Jakość wykonania również wydaje się przyzwoita, ale w chwili pisania tego tekstu nie możemy mówić o jego długowieczności. Inne modele w tej kategorii cenowej, takie jak HP 250 G9 mogą mieć jeszcze mniej pamięci RAM i wolniejszą wydajność graficzną w porównaniu do naszego Thinkeagle.
Za
Przeciw
Potencjalni konkurenci w porównaniu
Obraz | Model / recenzja | Cena | Waga | Wysokość | Ekran |
|---|---|---|---|---|---|
1. 69.9%  | Thinkeagle VigoBook G7 AMD Ryzen 7 5700U ⎘ AMD Radeon RX Vega 8 (Ryzen 4000/5000) ⎘ 16 GB Pamięć | Amazon: $499.00 Cena katalogowa: 500 USD | 1.7 kg | 17.5 mm | 15.60" 1920x1080 141 PPI IPS |
2. 83.6% v7 (old)  | Ninkear A15 Plus (16+512) AMD Ryzen 7 5700U ⎘ AMD Radeon RX Vega 8 (Ryzen 4000/5000) ⎘ 16 GB Pamięć, 512 GB SSD | Amazon: Cena katalogowa: 649.15 Euro | 1.8 kg | 18.2 mm | 15.60" 1920x1080 141 PPI IPS |
3. 87.6% v7 (old) 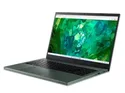 | Acer Aspire Vero AV15-53P Intel Core i7-1355U ⎘ Intel Iris Xe Graphics G7 96EUs ⎘ 16 GB Pamięć, 512 GB SSD | Amazon: $875.70 Cena katalogowa: 949€ | 1.8 kg | 17.78 mm | 15.60" 1920x1080 141 PPI IPS |
4. 75.2% v7 (old)  | HP 250 G9 7N029ES Intel Core i3-1215U ⎘ Intel UHD Graphics 64EUs (Alder Lake 12th Gen) ⎘ 8 GB Pamięć, 512 GB SSD | Amazon: $549.00 Cena katalogowa: 440€ | 1.7 kg | 19.9 mm | 15.60" 1920x1080 141 PPI IPS |
5. 82.1% v7 (old)  | Lenovo IdeaPad 3 15ABA7 AMD Ryzen 5 5625U ⎘ AMD Radeon RX Vega 7 ⎘ 16 GB Pamięć, 512 GB SSD | Amazon: 1. $23.95 mCover Case Compatible ONLY ... 2. $15.89 Charger for Lenovo IdeaPad 3... 3. $79.89 PEHDPVS SD10W73240 Replaceme... Cena katalogowa: 799 Euro | 1.6 kg | 19.9 mm | 15.60" 1920x1080 141 PPI IPS |
6. 84.6% v7 (old)  | Dell Latitude 3520 Intel Core i5-1135G7 ⎘ Intel Iris Xe Graphics G7 80EUs ⎘ 8 GB Pamięć, 512 GB SSD | Amazon: 1. $935.77 Dell Business Laptop Latitud... 2. $699.00 Dell 2021 Latitude 3520 15 1... 3. $49.74 SCREENARAMA New Screen Repla... Cena katalogowa: 899 Euro | 1.8 kg | 18.06 mm | 15.60" 1920x1080 141 PPI IPS |
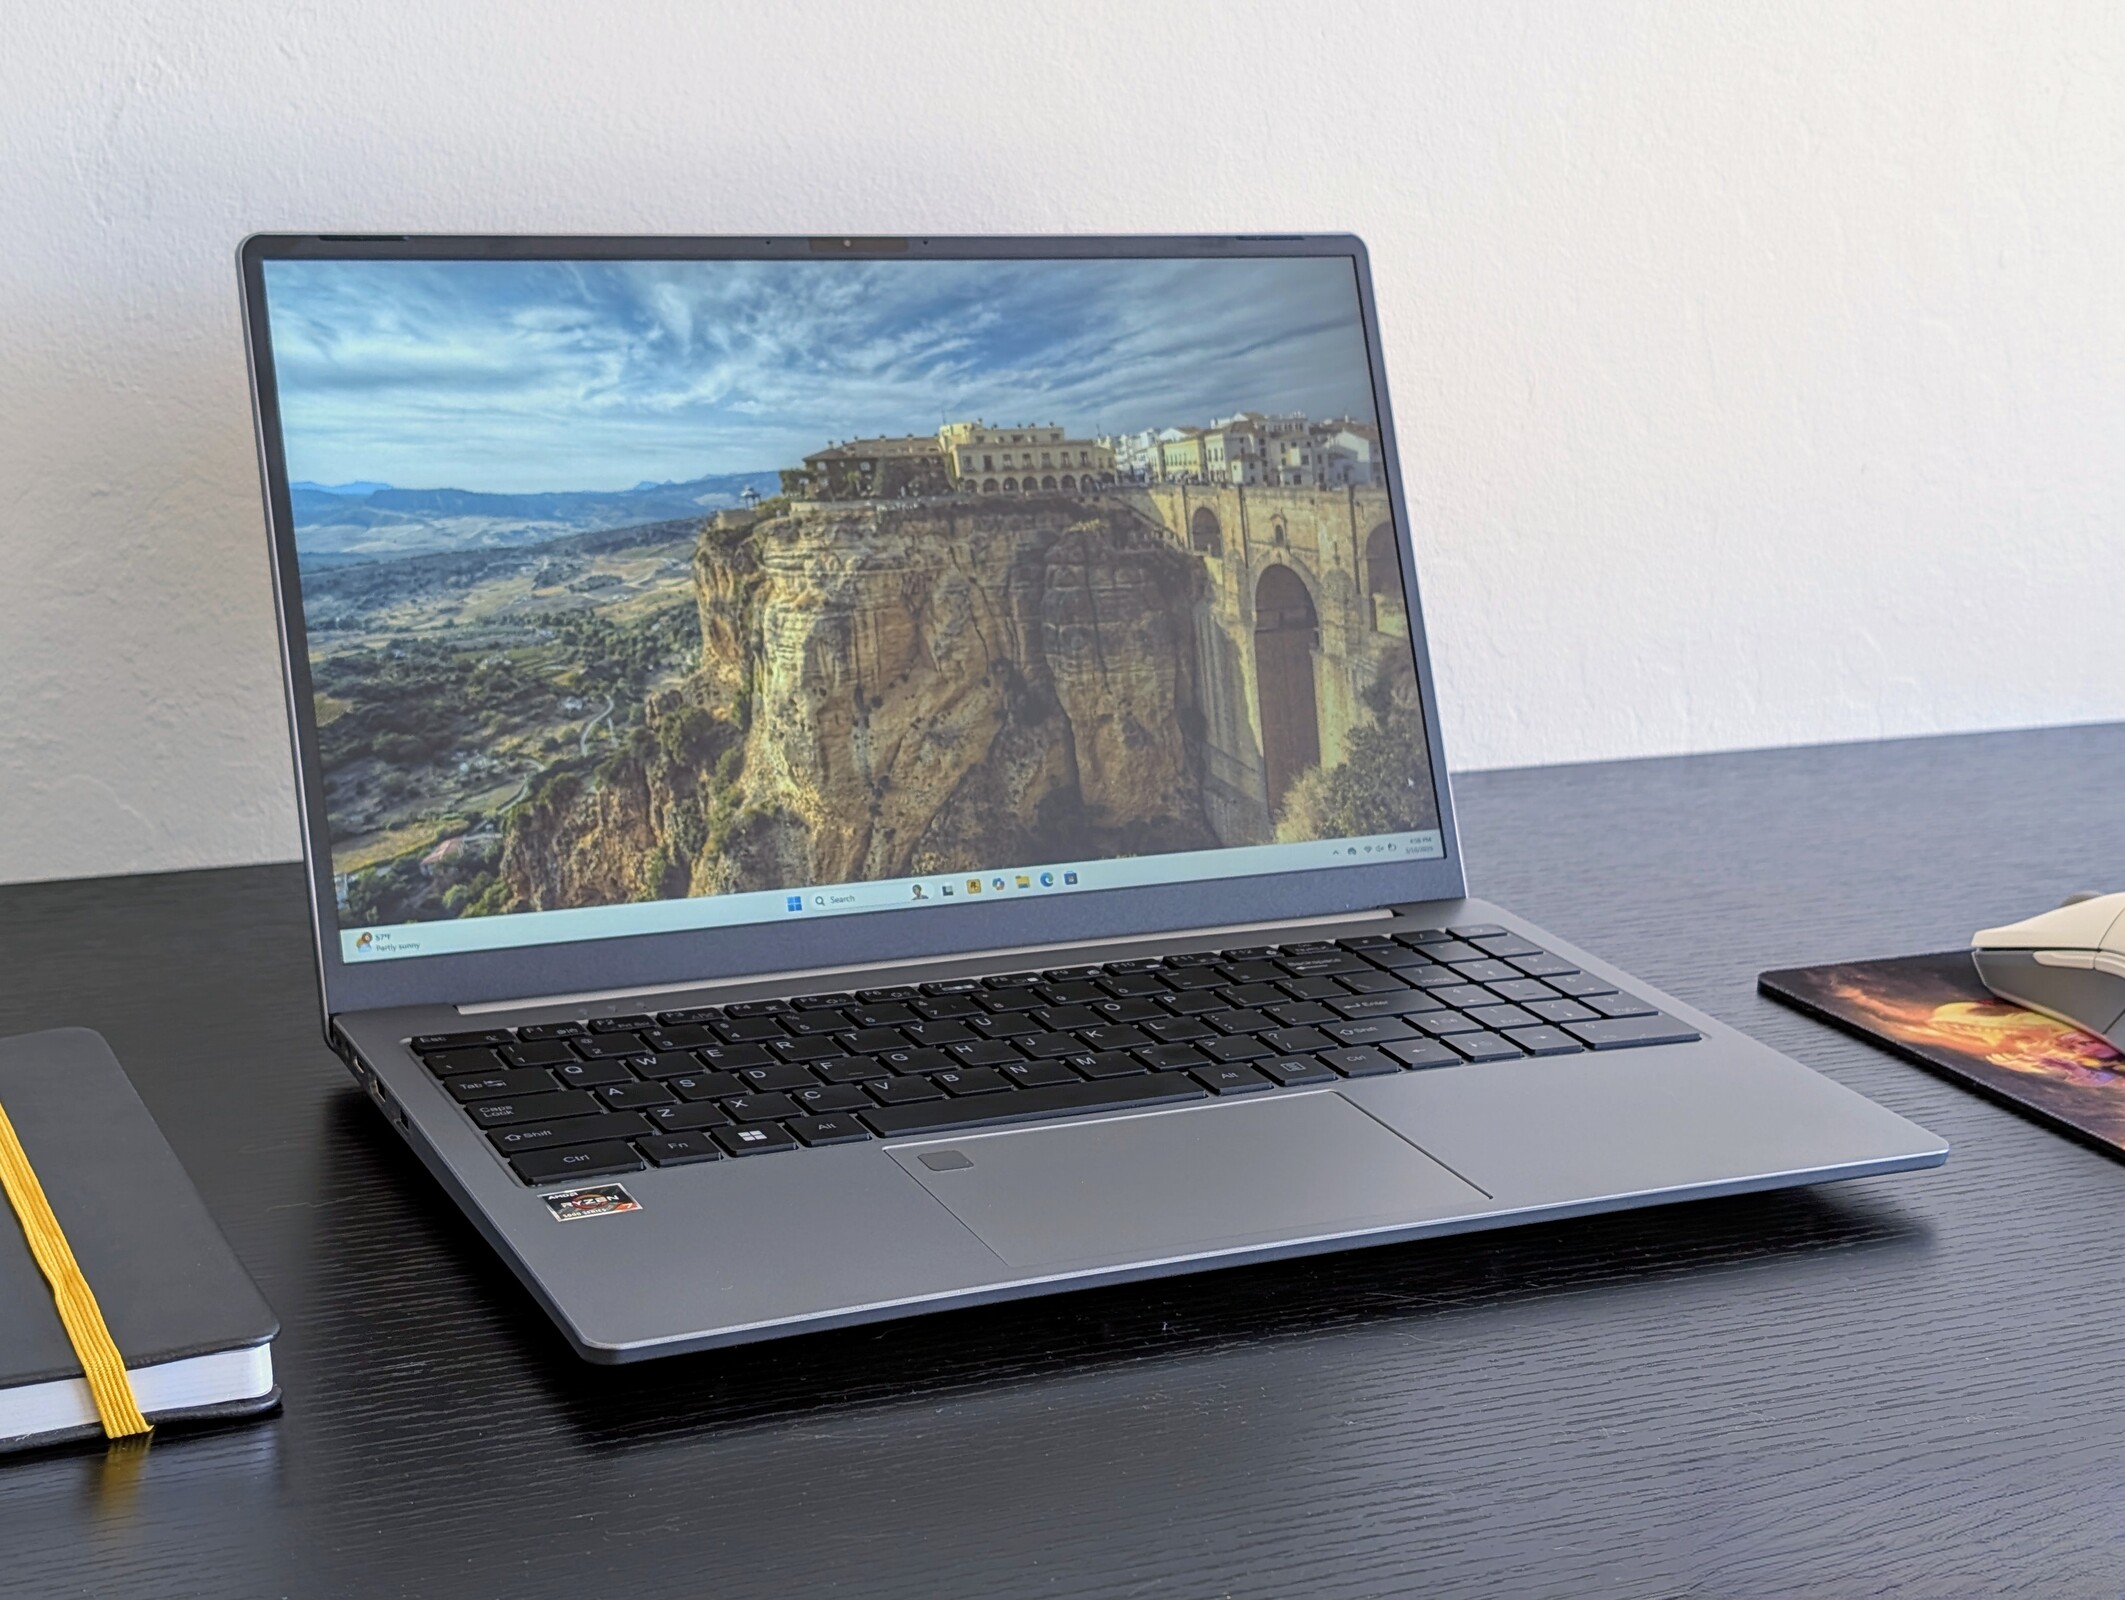
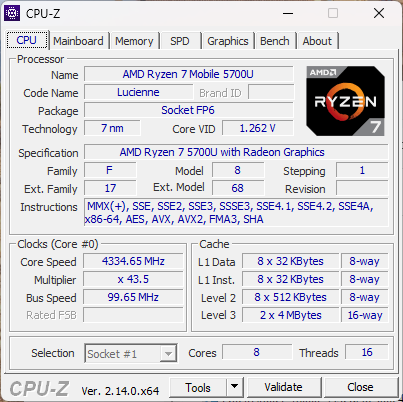
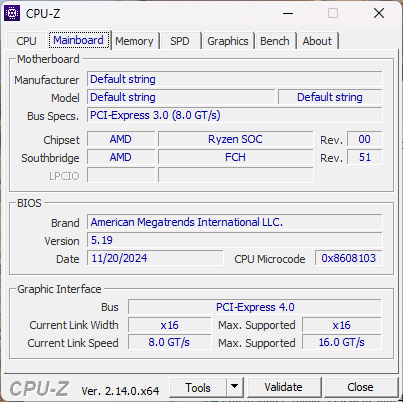
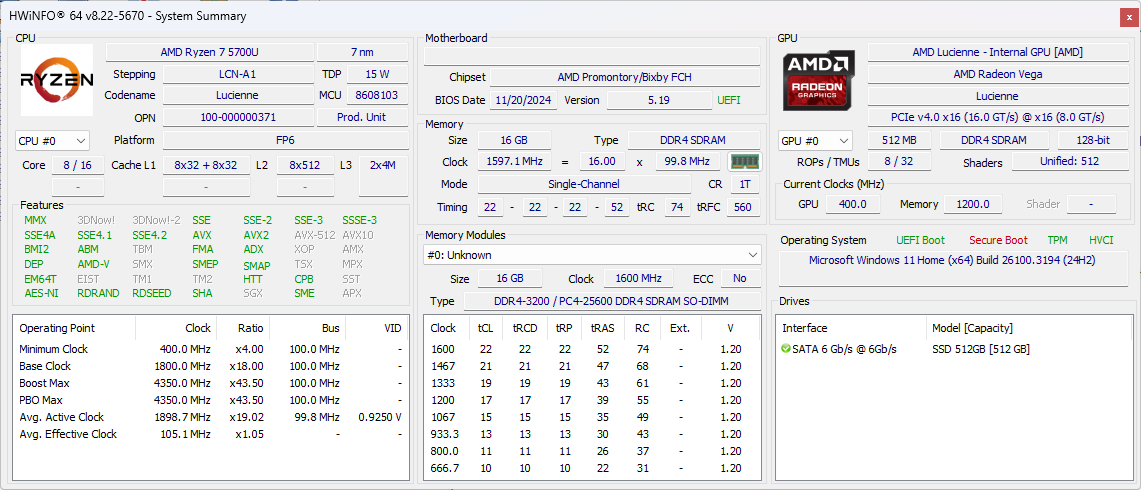
Thinkeagle VigoBook G7 to budżetowy laptop multimedialny wyposażony w starszy sprzęt AMD Zen 2, aby utrzymać ceny niższe niż większość alternatyw. Nasz egzemplarz wyposażony jest w procesor Ryzen 7 5700U, wyświetlacz IPS 1080p, 512 GB SSD i 16 GB pamięci RAM za około 500 USD.
Alternatywy dla VigoBook G7 obejmują inne niedrogie modele, takie jak HP Pavilion series, Lenovo IdeaPad 1 lub IdeaPad 3 lub seria Dell Inspiron.
Specyfikacje
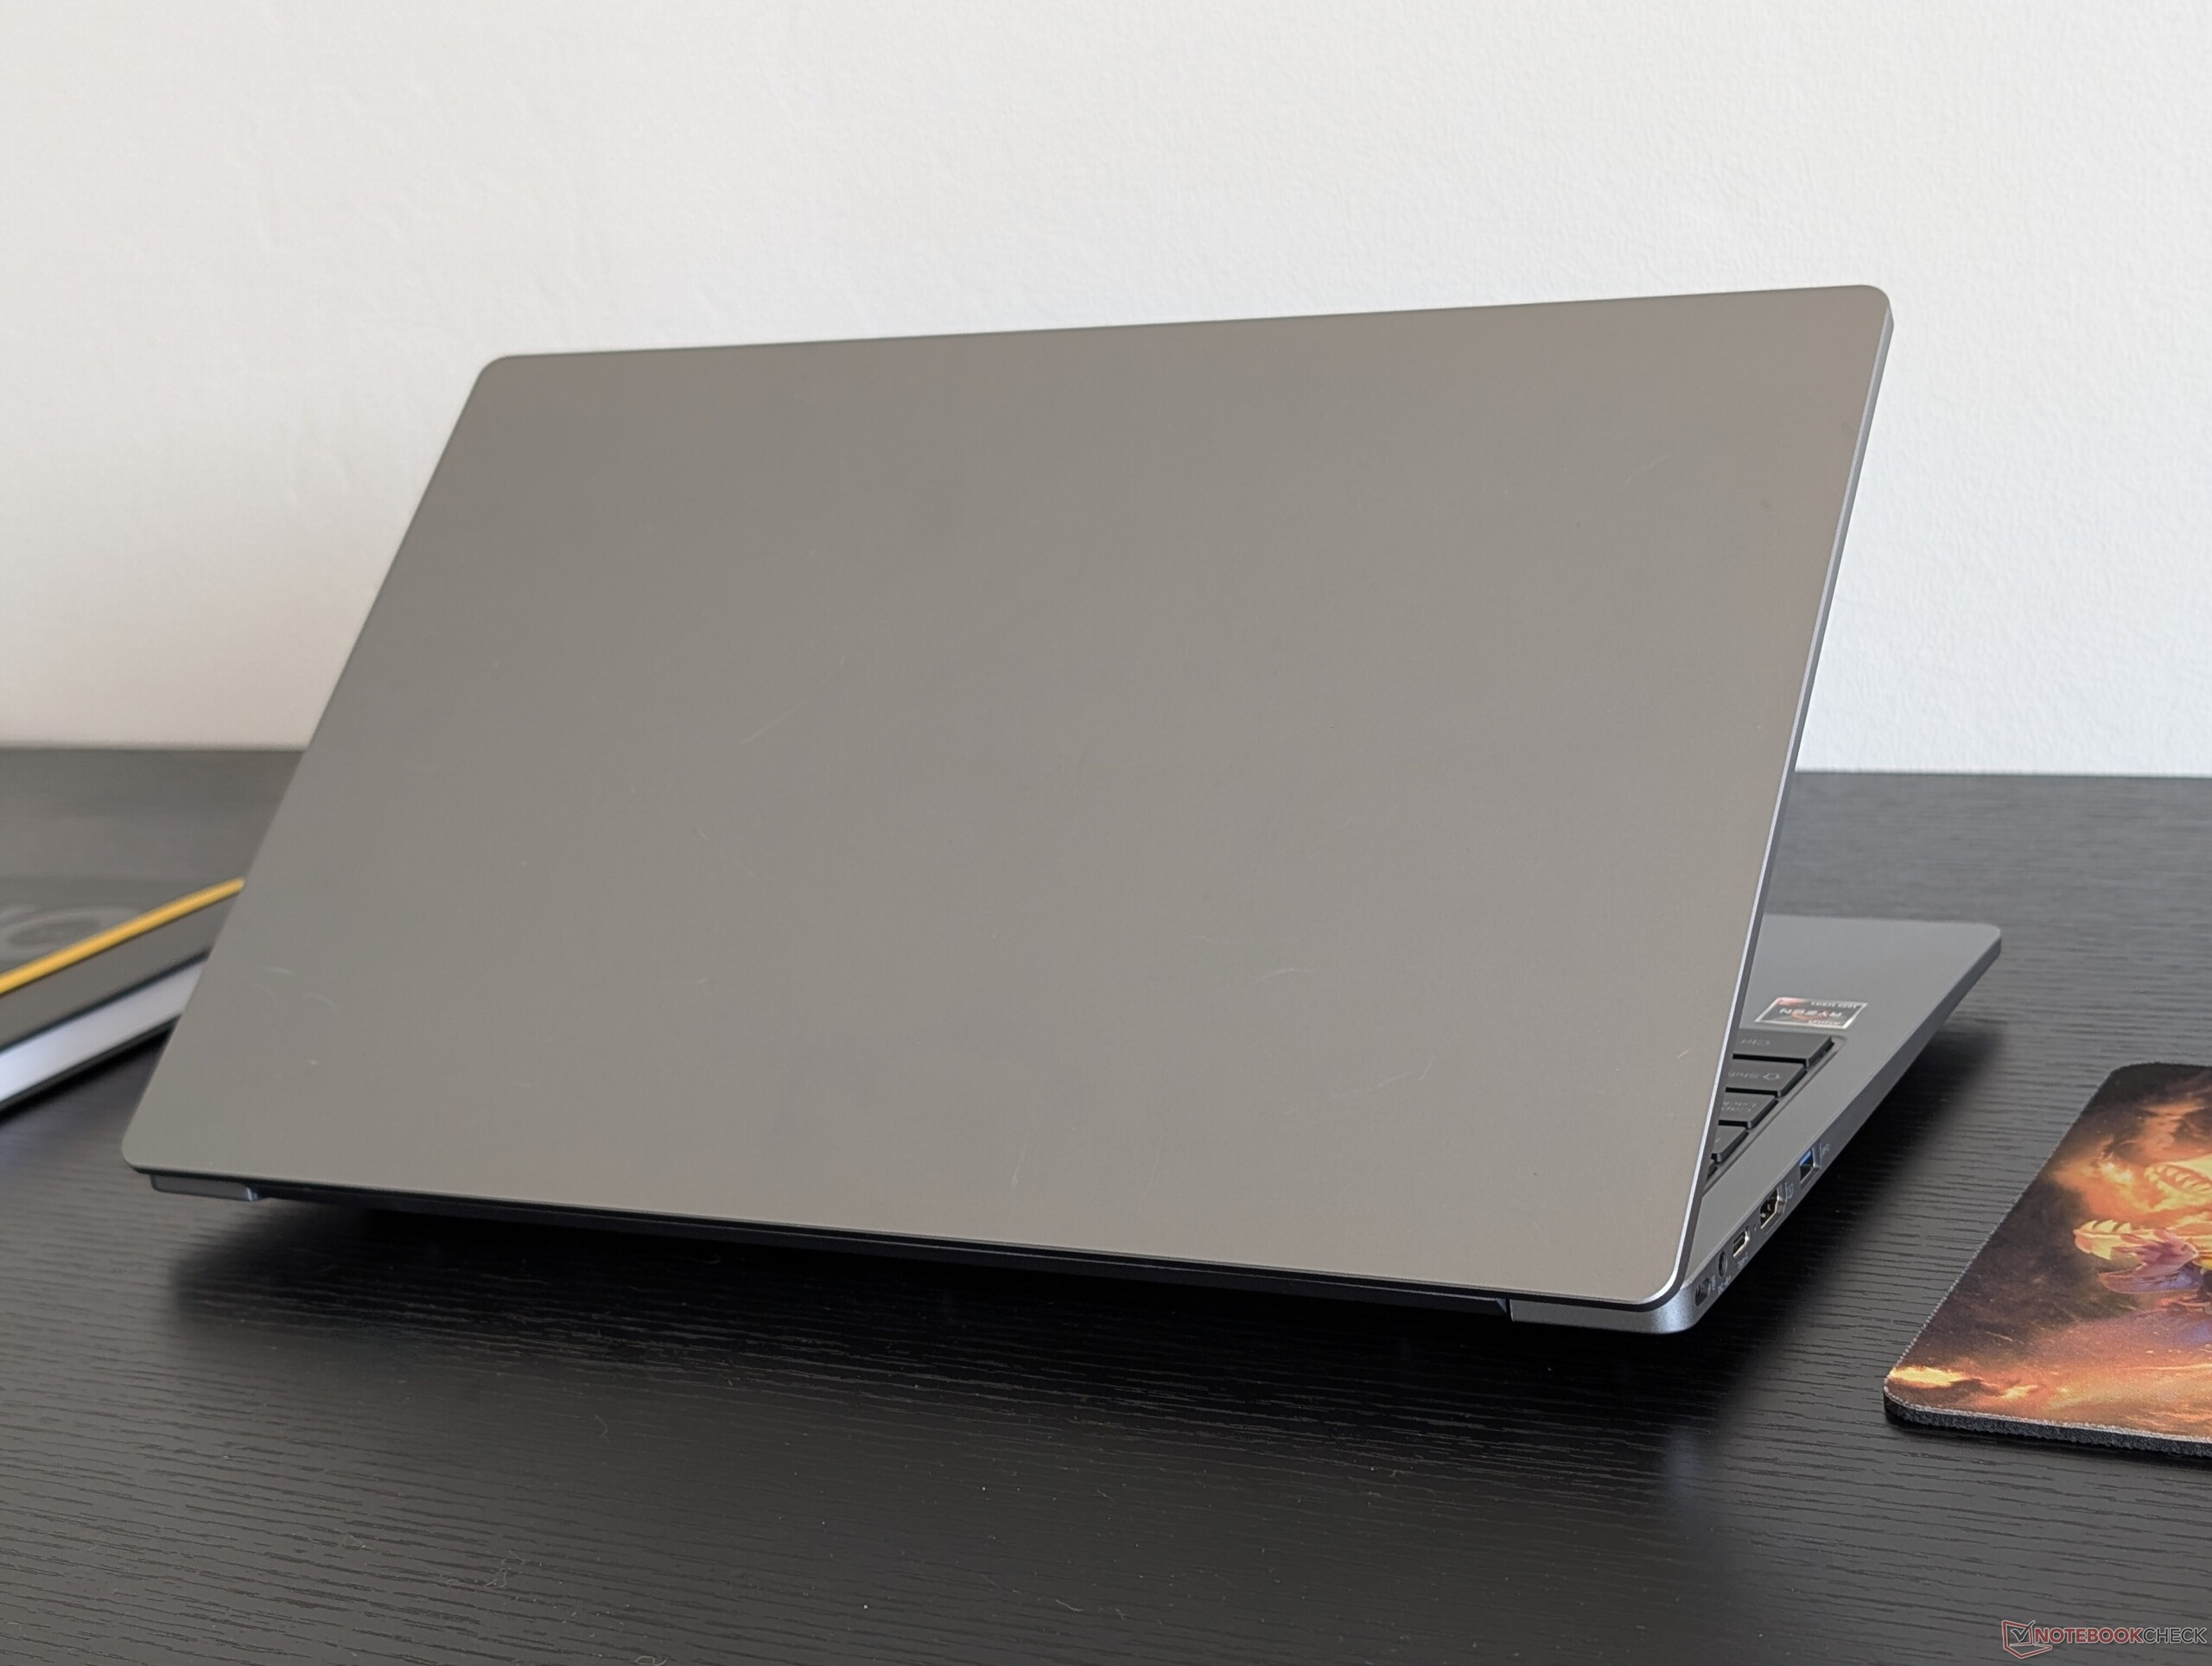
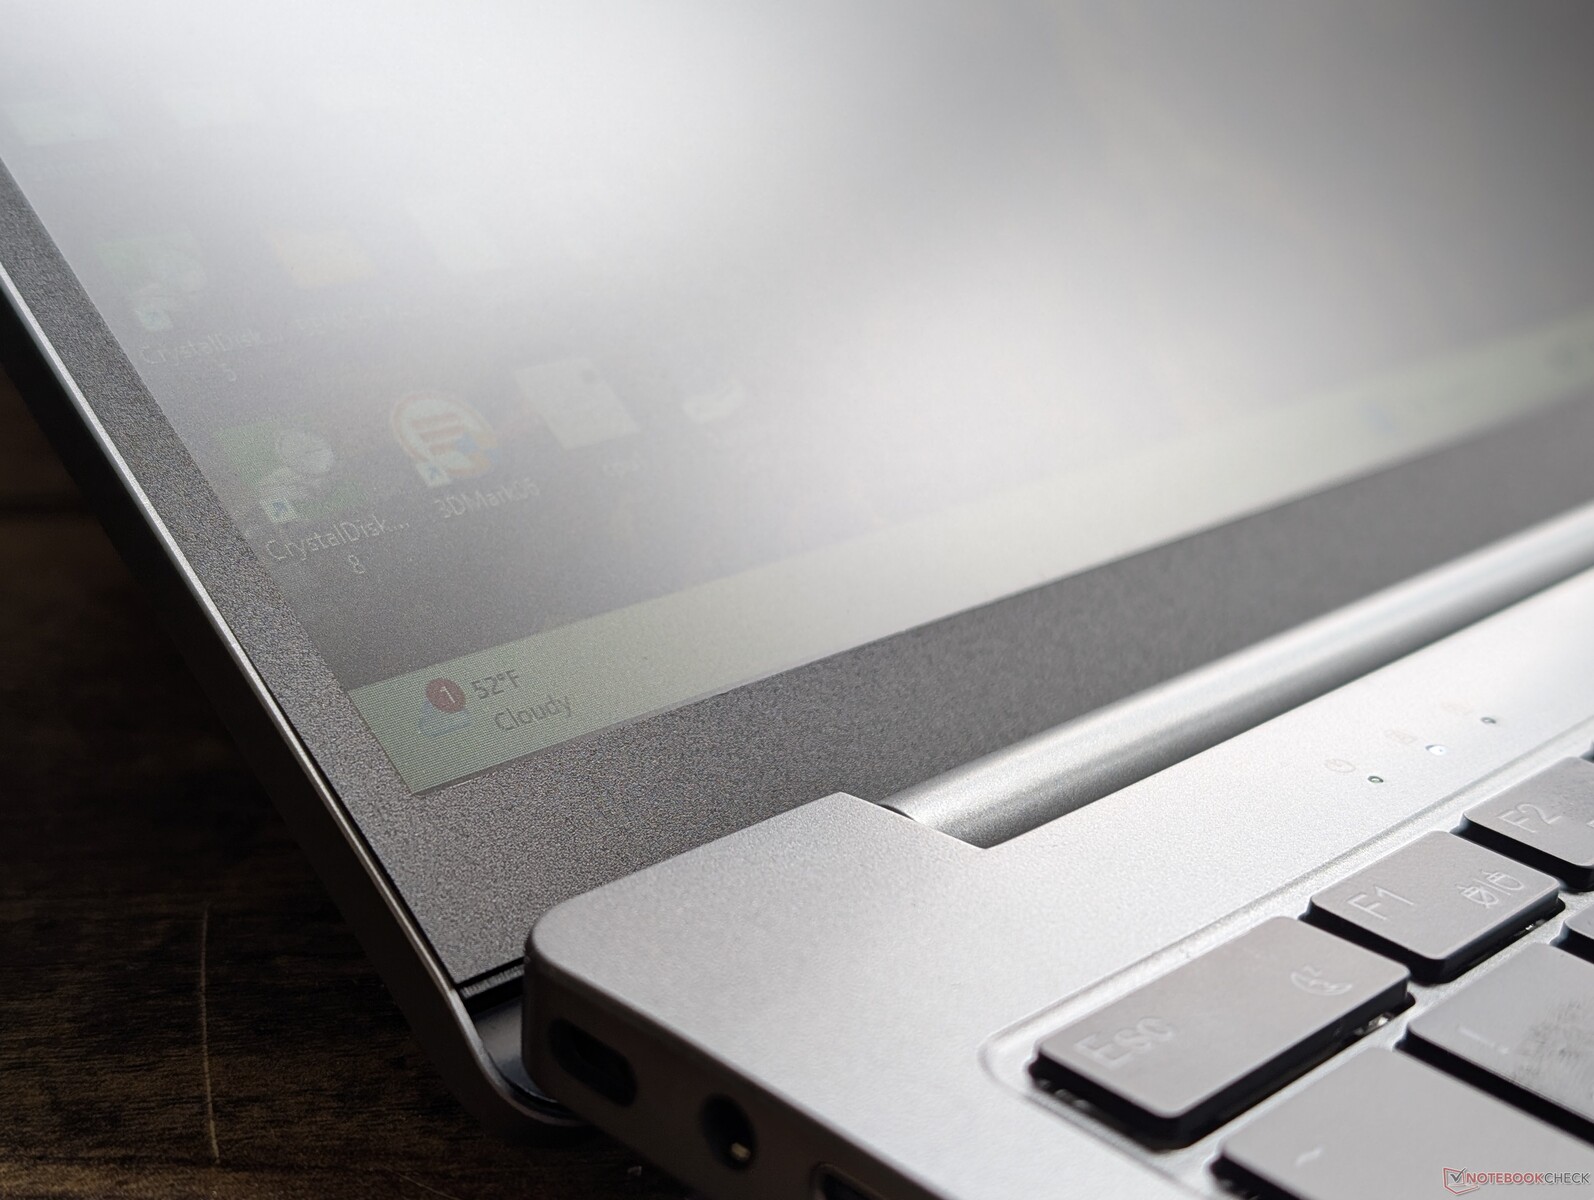
Przypadek
Obudowa ma metalową pokrywę zewnętrzną, ale plastikową podstawę, co jest powszechnym podejściem w przypadku tańszych konstrukcji.
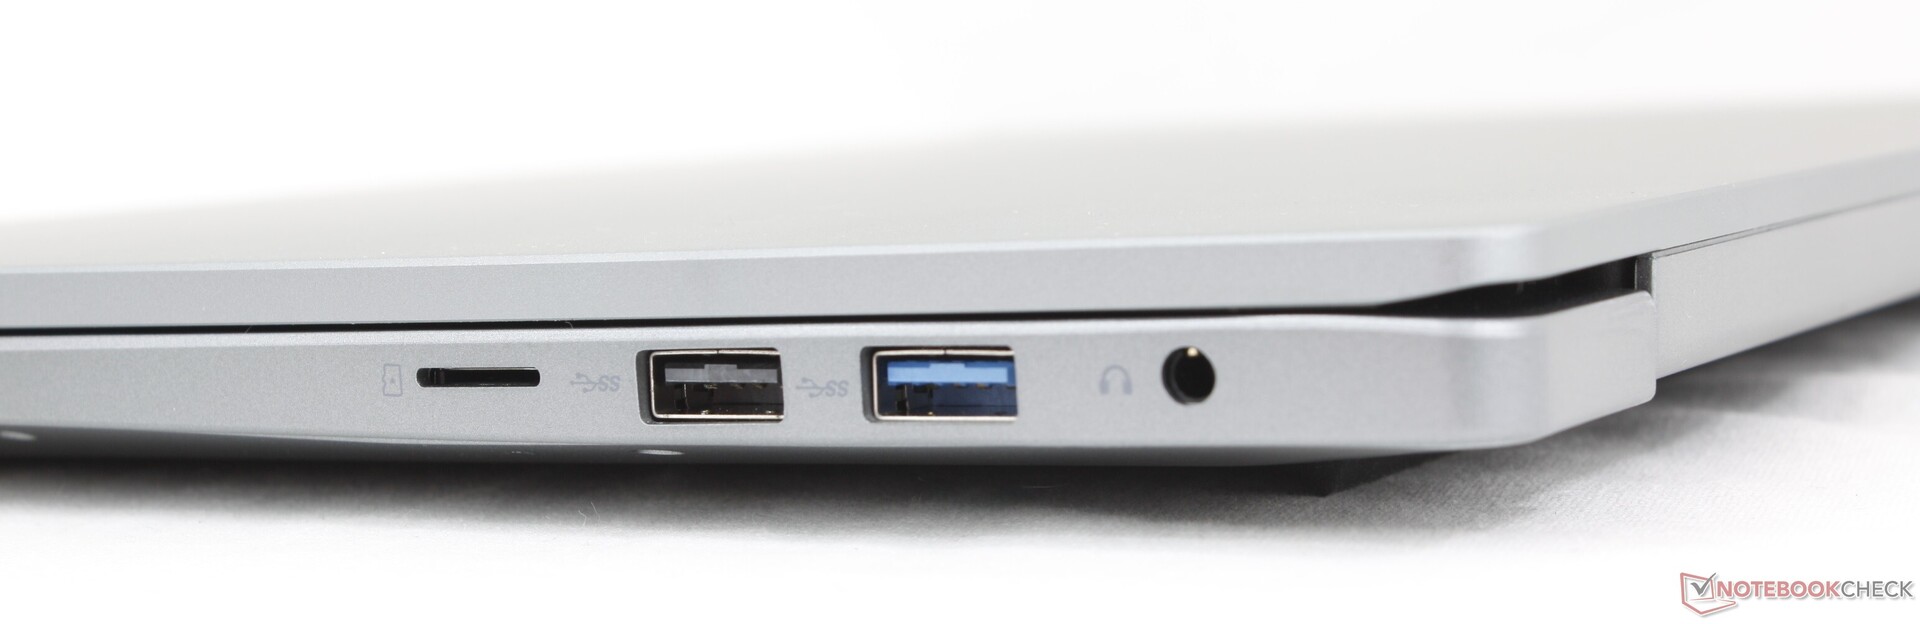
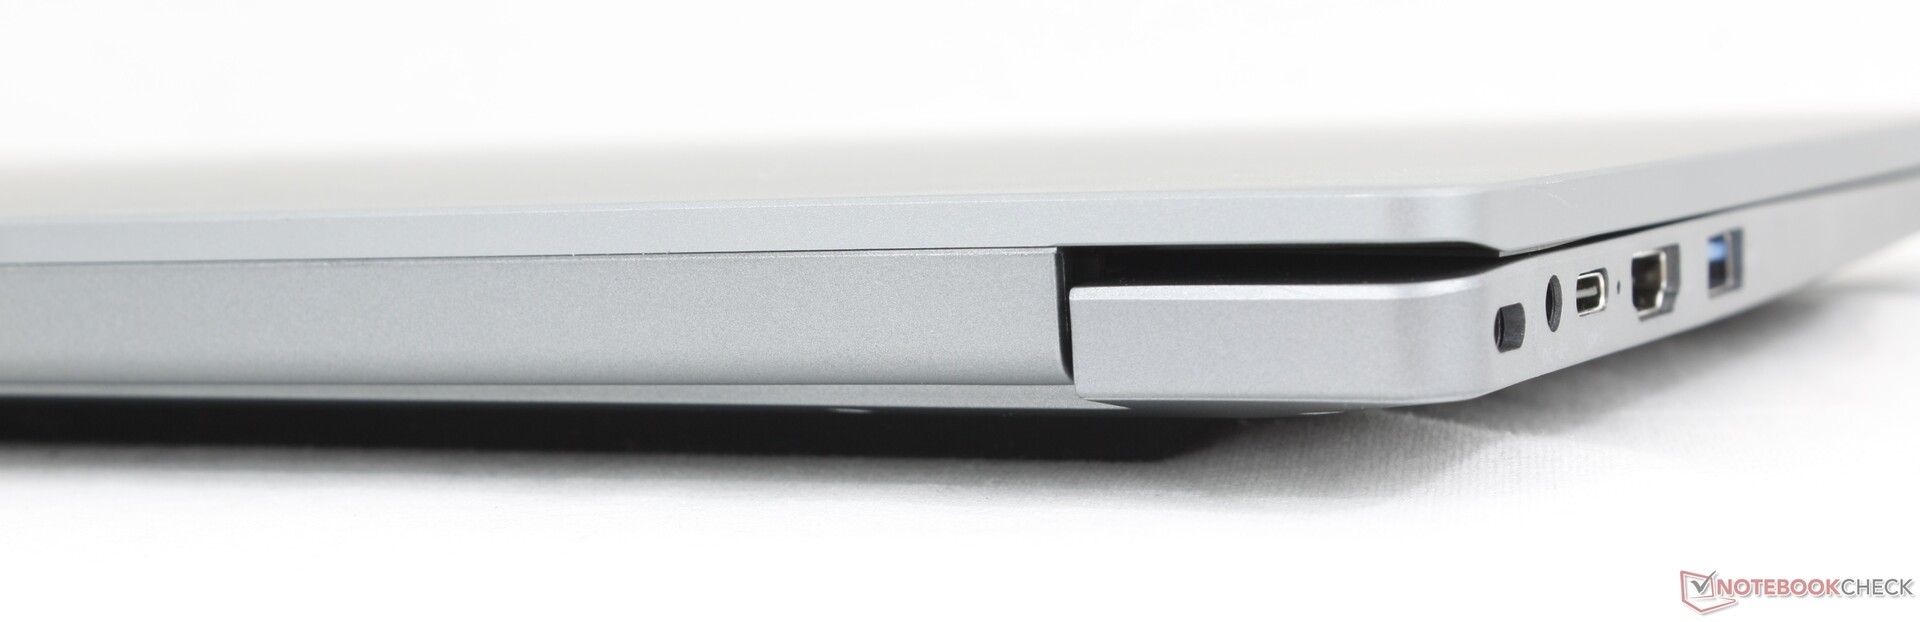
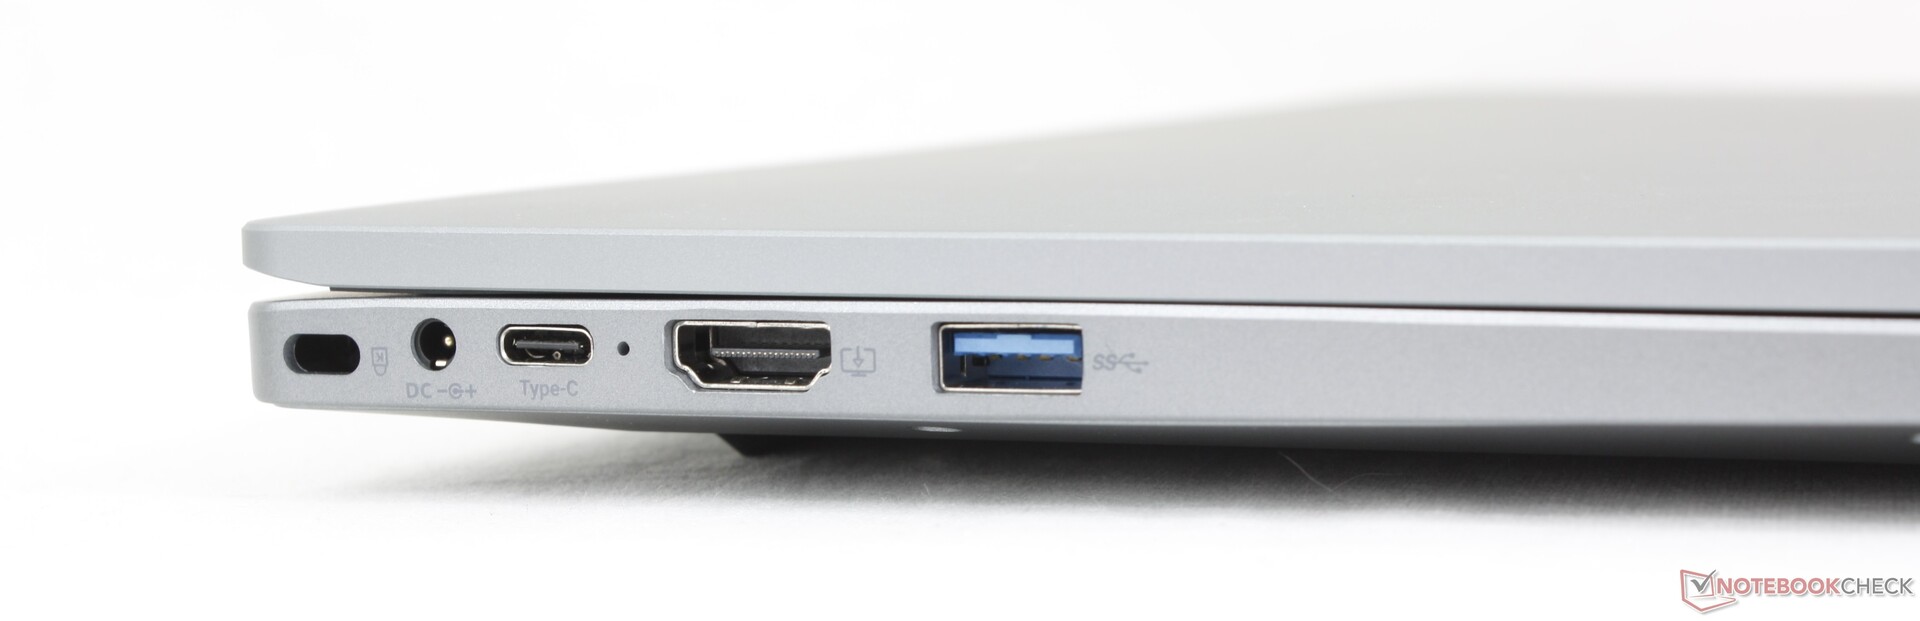
Łączność
Opcje portów są przyzwoite jak na budżetową 15,6-calową obudowę. Proszę zauważyć, że system może być ładowany przez USB-C, jeśli kiedykolwiek zgubią Państwo zasilacz sieciowy dostarczany wraz z urządzeniem.
Czytnik kart SD
| SD Card Reader | |
| average JPG Copy Test (av. of 3 runs) | |
| Lenovo IdeaPad 3 15ABA7 (AV Pro SD microSD 128 GB V60) | |
| Ninkear A15 Plus (16+512) | |
| HP 250 G9 7N029ES (Angelbird AV Pro V60) | |
| Dell Latitude 3520 (AV Pro SD microSD 128 GB V60) | |
| Thinkeagle VigoBook G7 (AV Pro SD microSD 128 GB V60) | |
| maximum AS SSD Seq Read Test (1GB) | |
| Lenovo IdeaPad 3 15ABA7 (AV Pro SD microSD 128 GB V60) | |
| Ninkear A15 Plus (16+512) | |
| Thinkeagle VigoBook G7 (AV Pro SD microSD 128 GB V60) | |
| HP 250 G9 7N029ES (Angelbird AV Pro V60) | |
| Dell Latitude 3520 (AV Pro SD microSD 128 GB V60) | |
Komunikacja
| Networking | |
| iperf3 transmit AXE11000 | |
| Dell Latitude 3520 | |
| Acer Aspire Vero AV15-53P | |
| Lenovo IdeaPad 3 15ABA7 | |
| Thinkeagle VigoBook G7 | |
| HP 250 G9 7N029ES | |
| Ninkear A15 Plus (16+512) | |
| iperf3 receive AXE11000 | |
| Dell Latitude 3520 | |
| Acer Aspire Vero AV15-53P | |
| Lenovo IdeaPad 3 15ABA7 | |
| Thinkeagle VigoBook G7 | |
| HP 250 G9 7N029ES | |
| Ninkear A15 Plus (16+512) | |
| iperf3 transmit AXE11000 6GHz | |
| Acer Aspire Vero AV15-53P | |
| iperf3 receive AXE11000 6GHz | |
| Acer Aspire Vero AV15-53P | |
Kamera internetowa


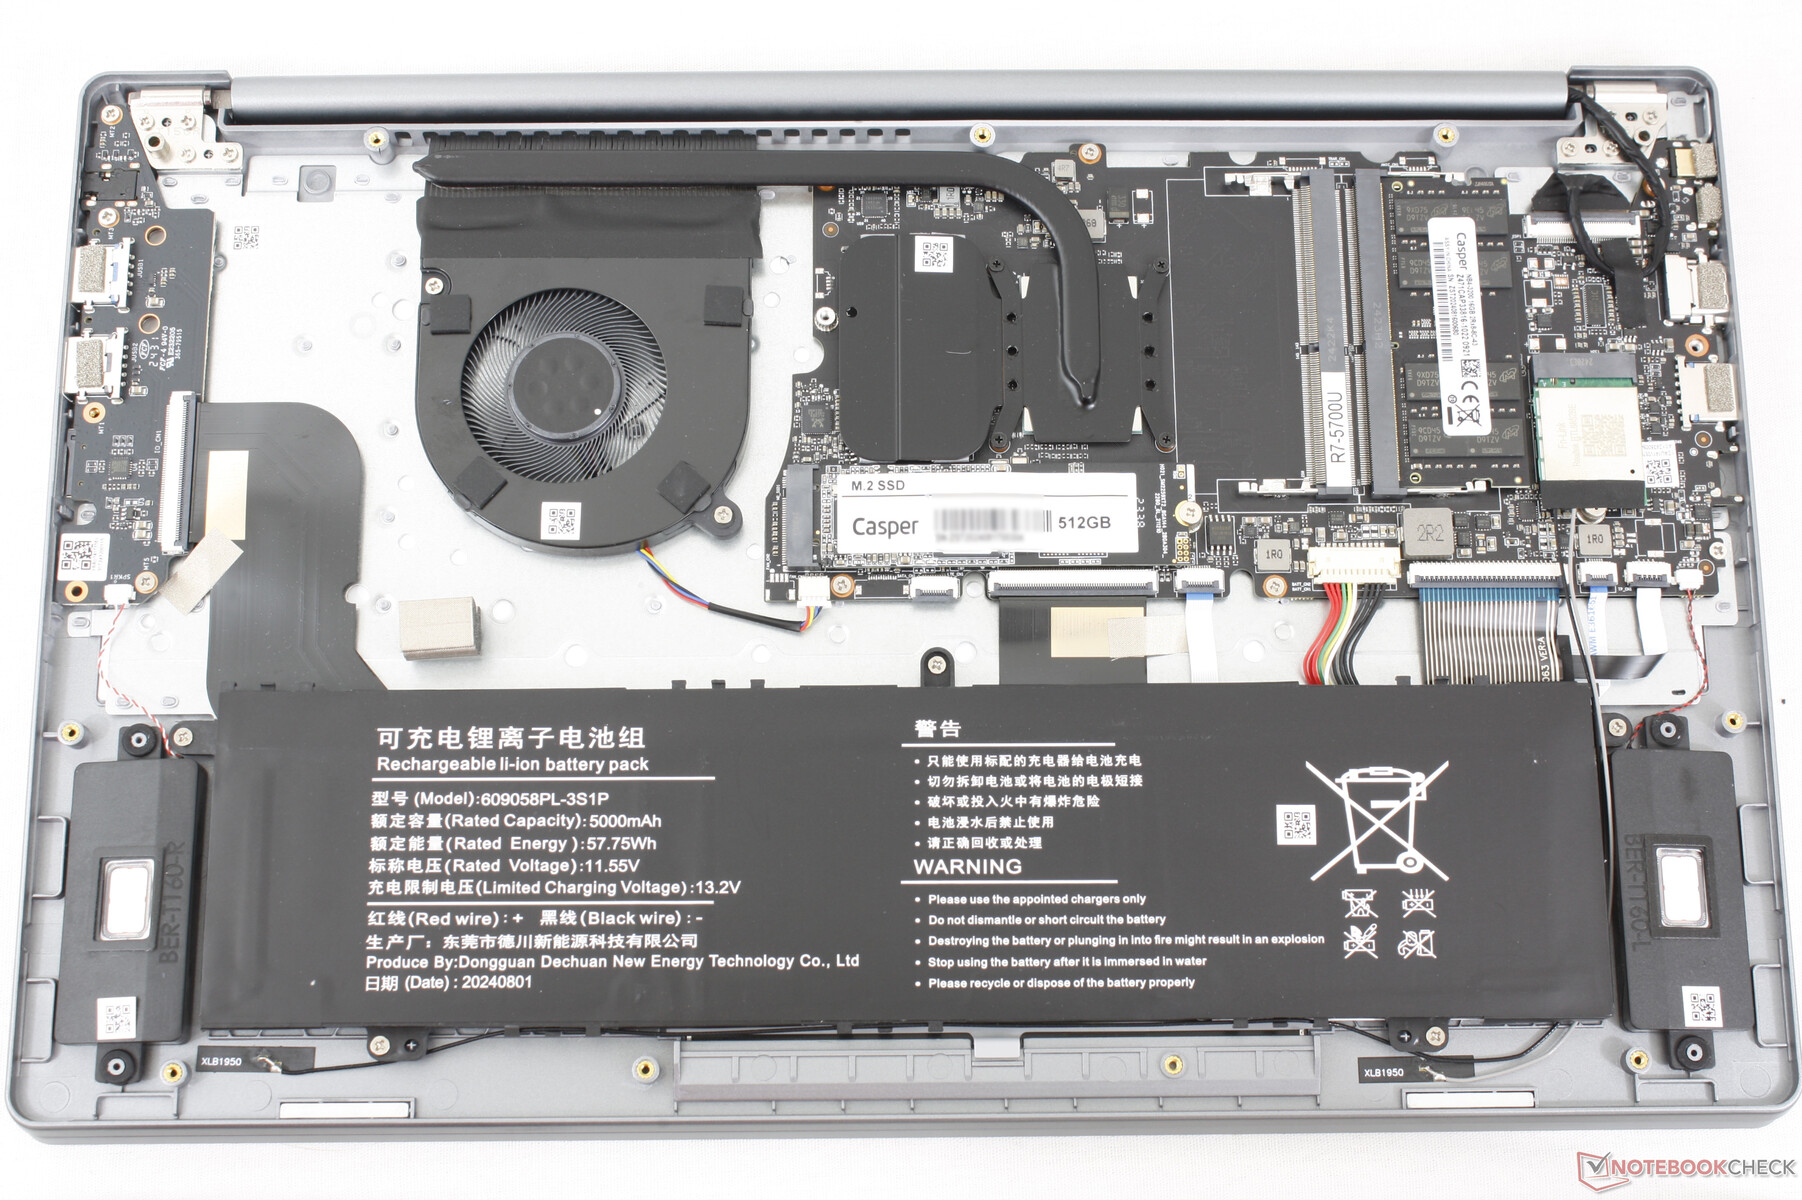
Konserwacja
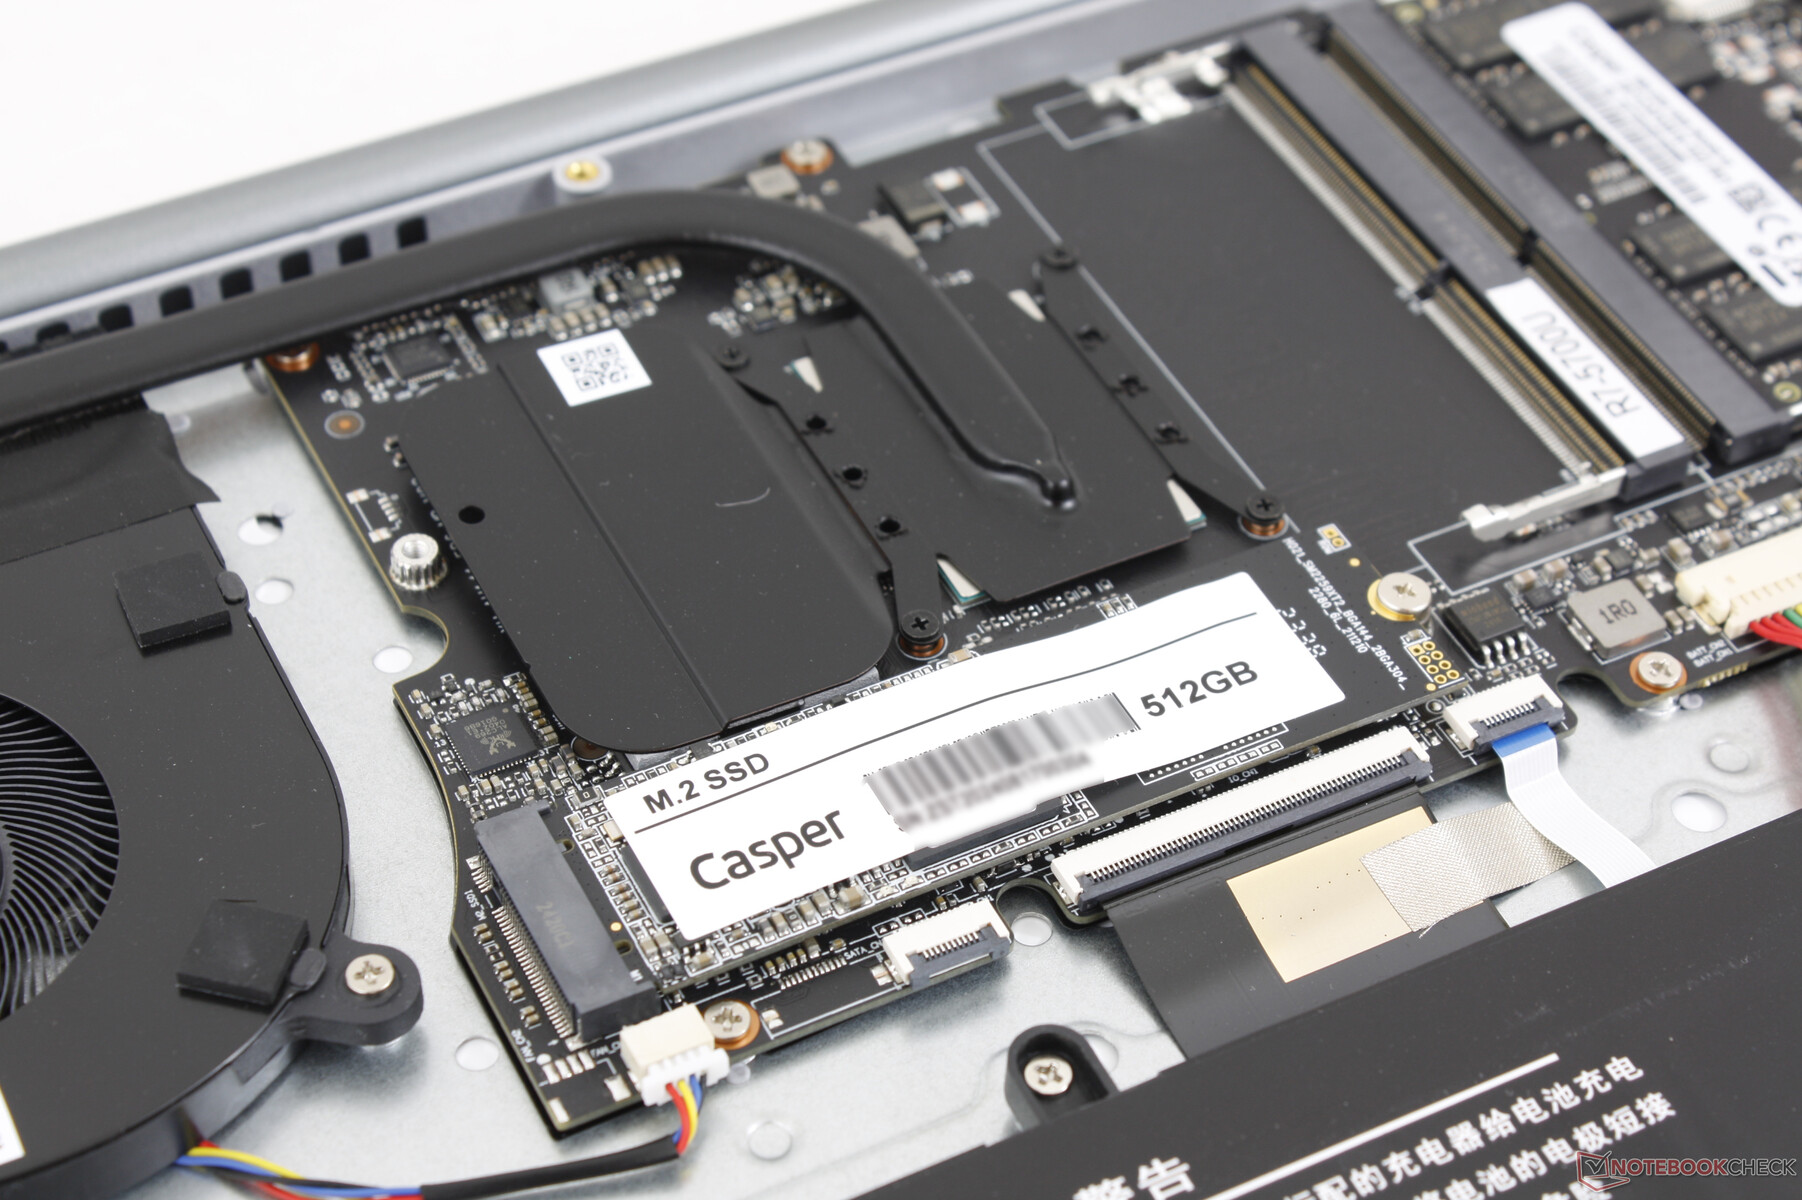
Do zdjęcia dolnego panelu wystarczy śrubokręt krzyżakowy. Użytkownicy mają dostęp do jednego gniazda M.2 2280 SSD i dwóch gniazd DDR4 SODIMM.
Zrównoważony rozwój
Producent nie reklamuje żadnych środków zrównoważonego rozwoju podjętych podczas produkcji. Opakowanie składa się głównie z papieru i tektury z plastikowym opakowaniem i piankowym zabezpieczeniem.
Urządzenia wejściowe
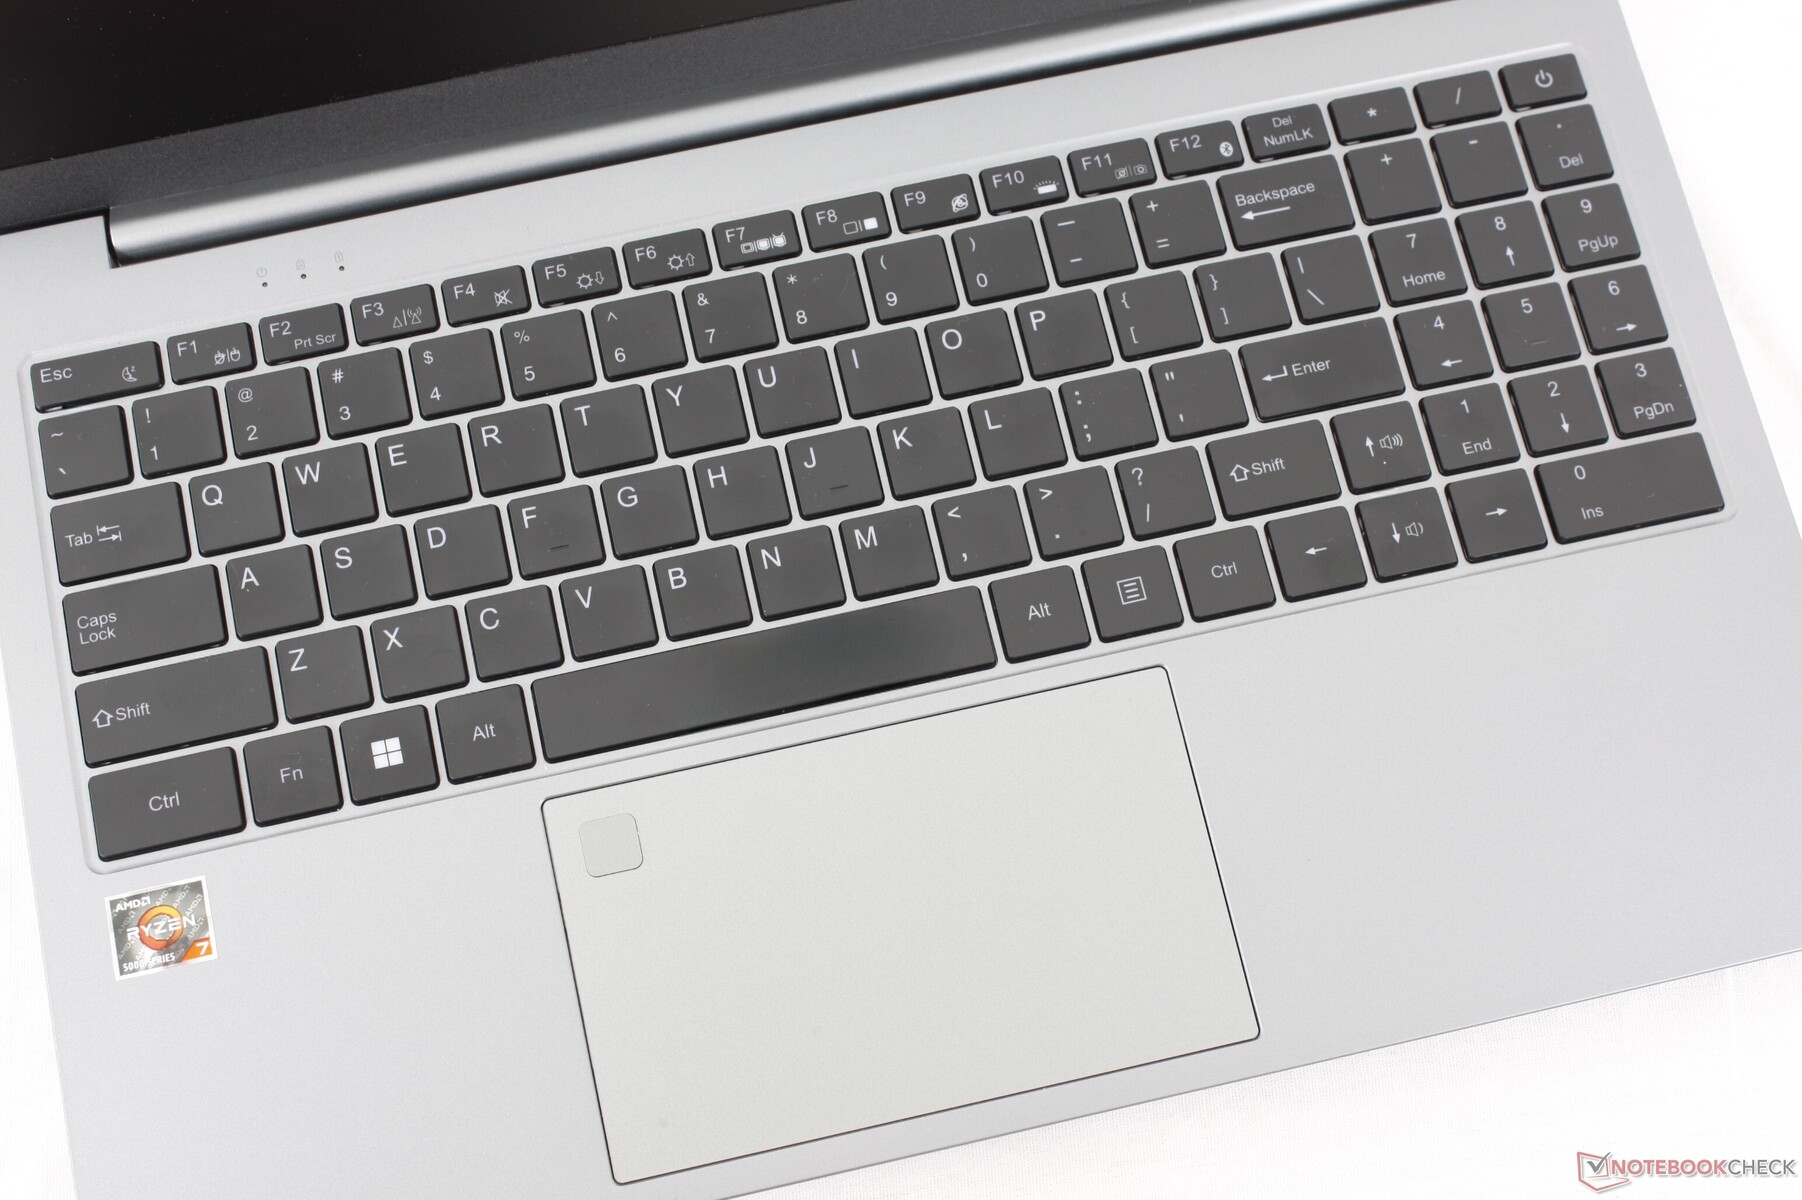
Klawiatura i panel dotykowy
Klawiatura jest jednym z lepszych aspektów VigoBook G7. Skok jest głęboki i doceniamy, że numpad i klawisze strzałek są tego samego rozmiaru co główne klawisze QWERTY, w przeciwieństwie do większości innych laptopów. Niestety, klawisz Enter jest stosunkowo miękki i nie zapewnia satysfakcjonującej informacji zwrotnej po naciśnięciu.
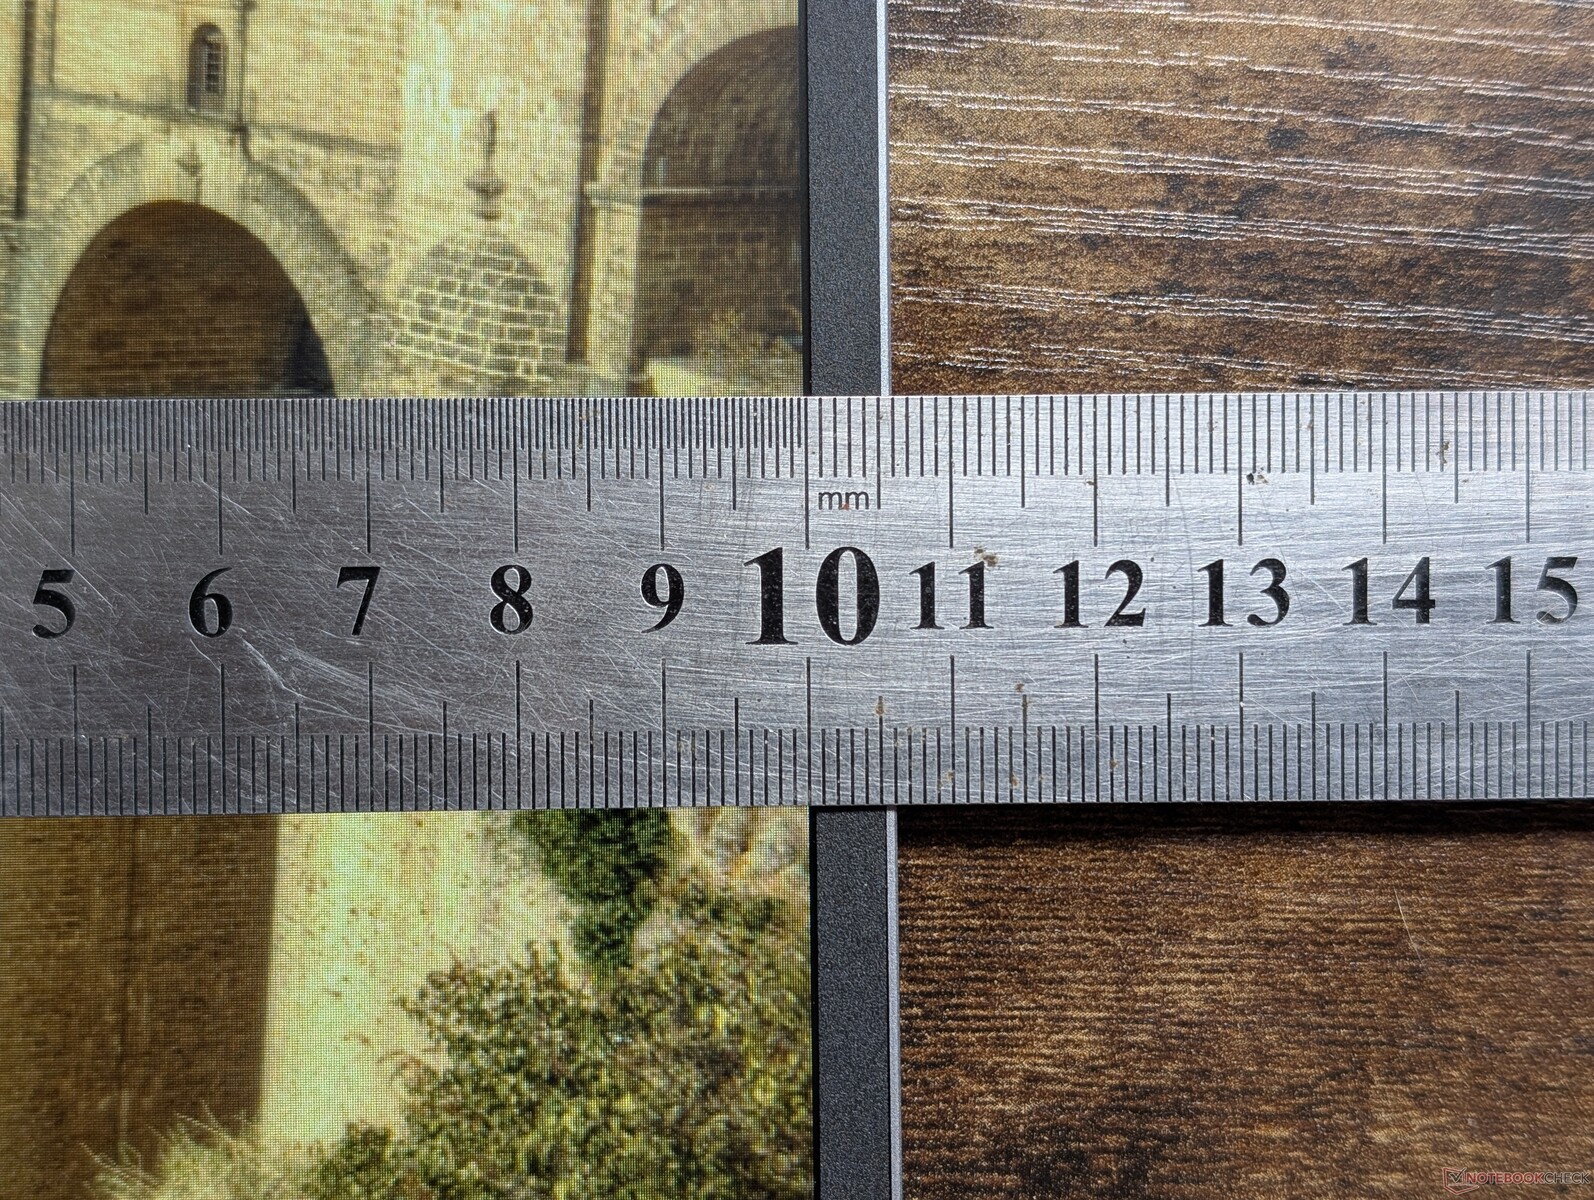
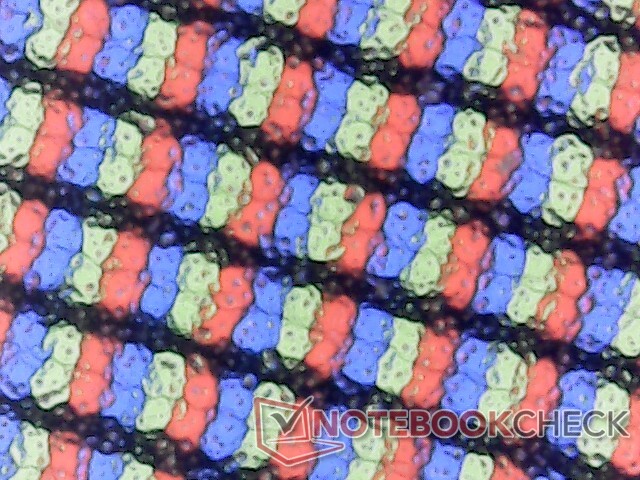
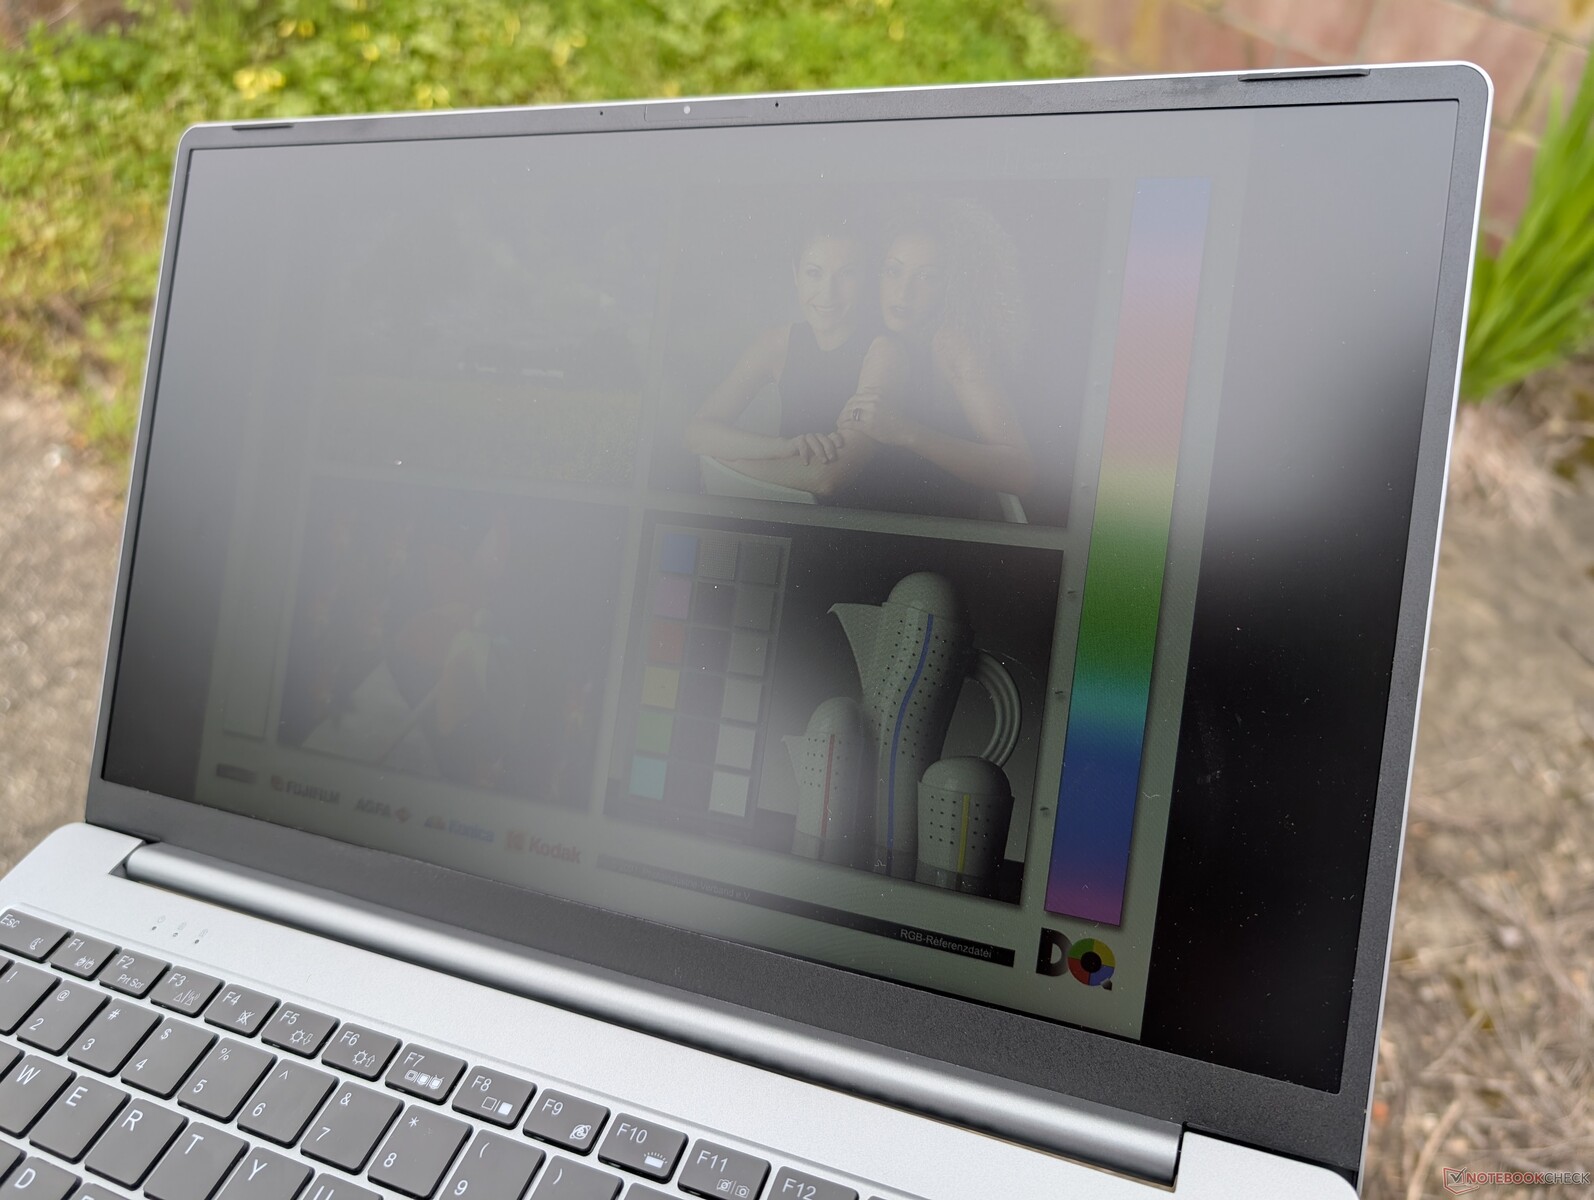
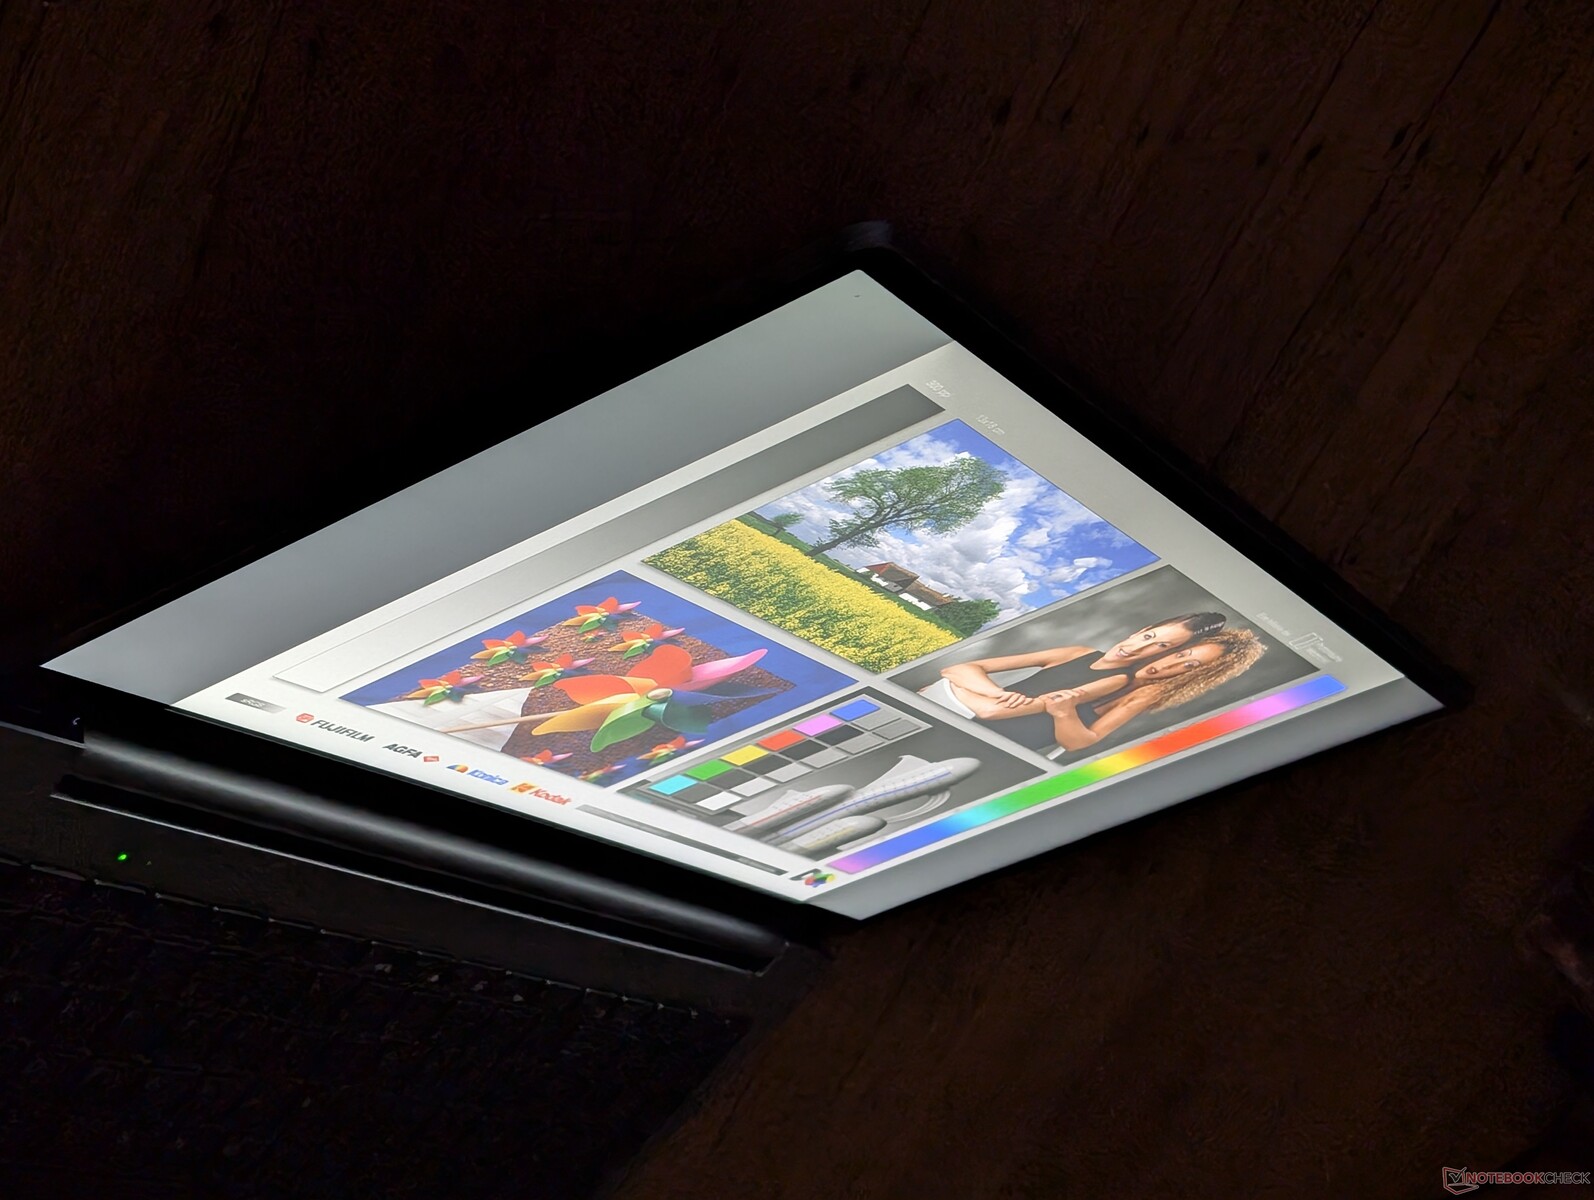
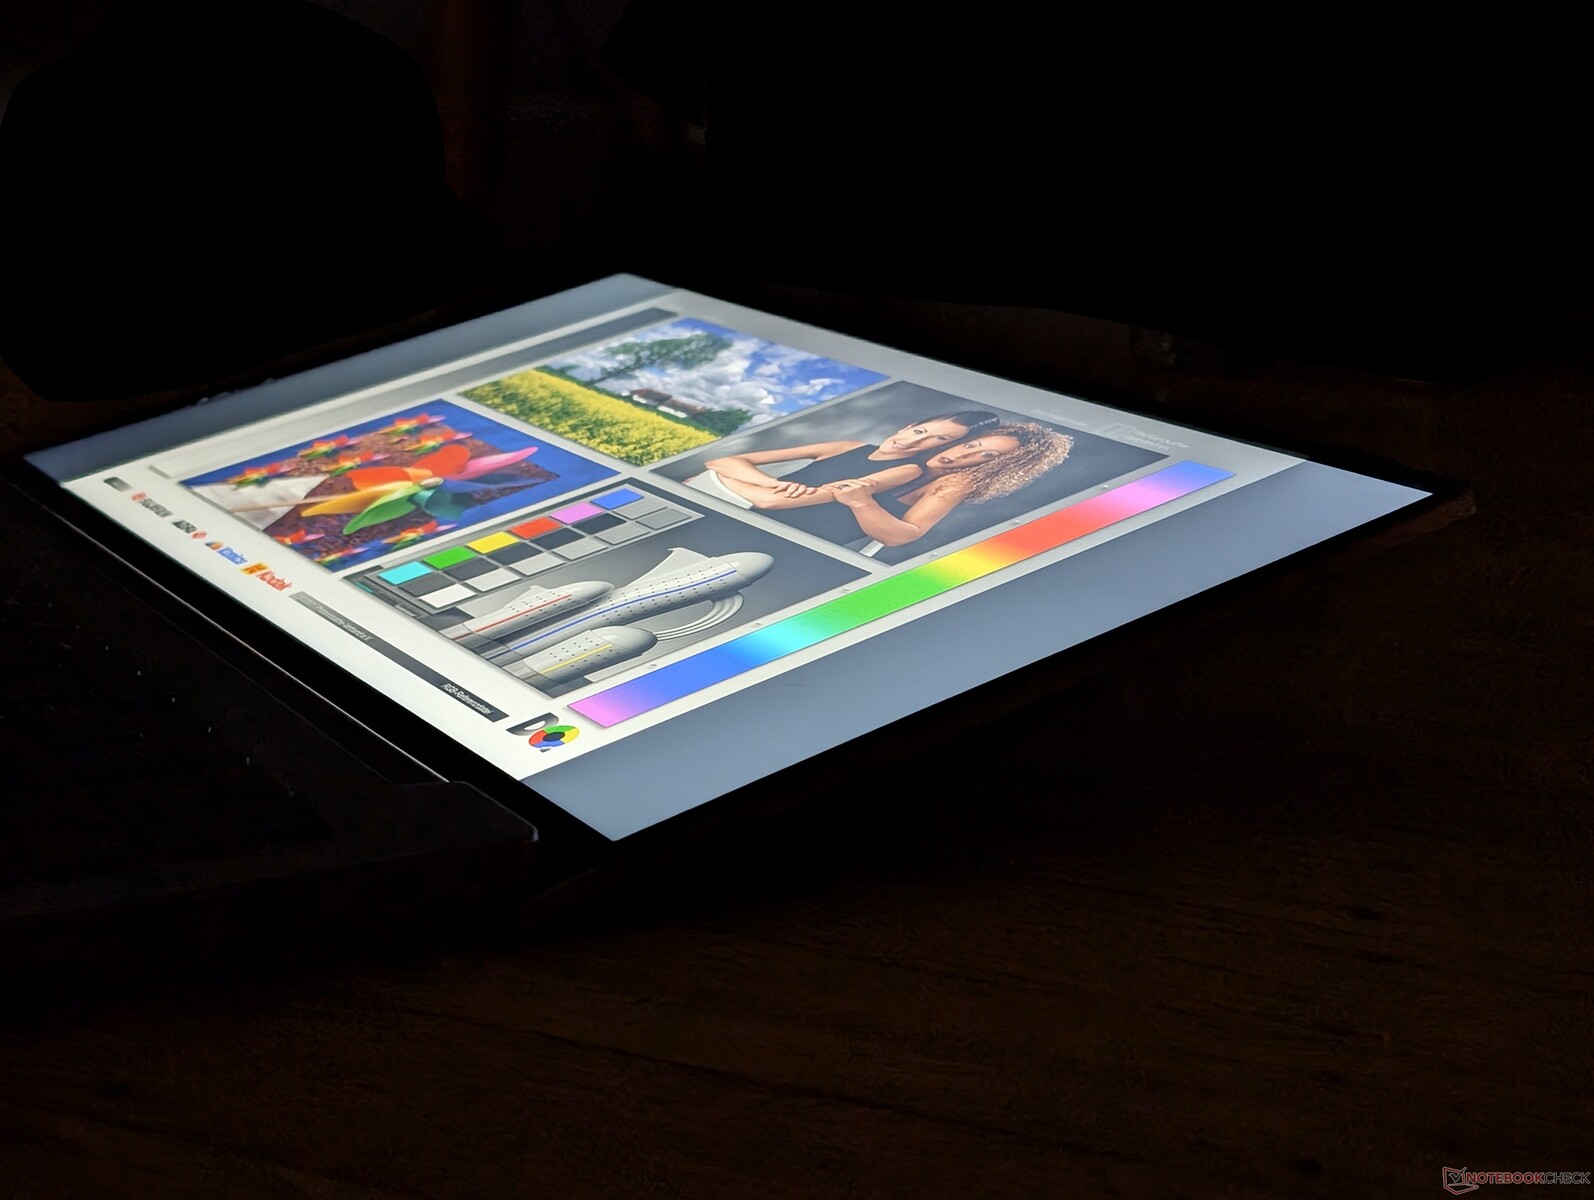
Wyświetlacz
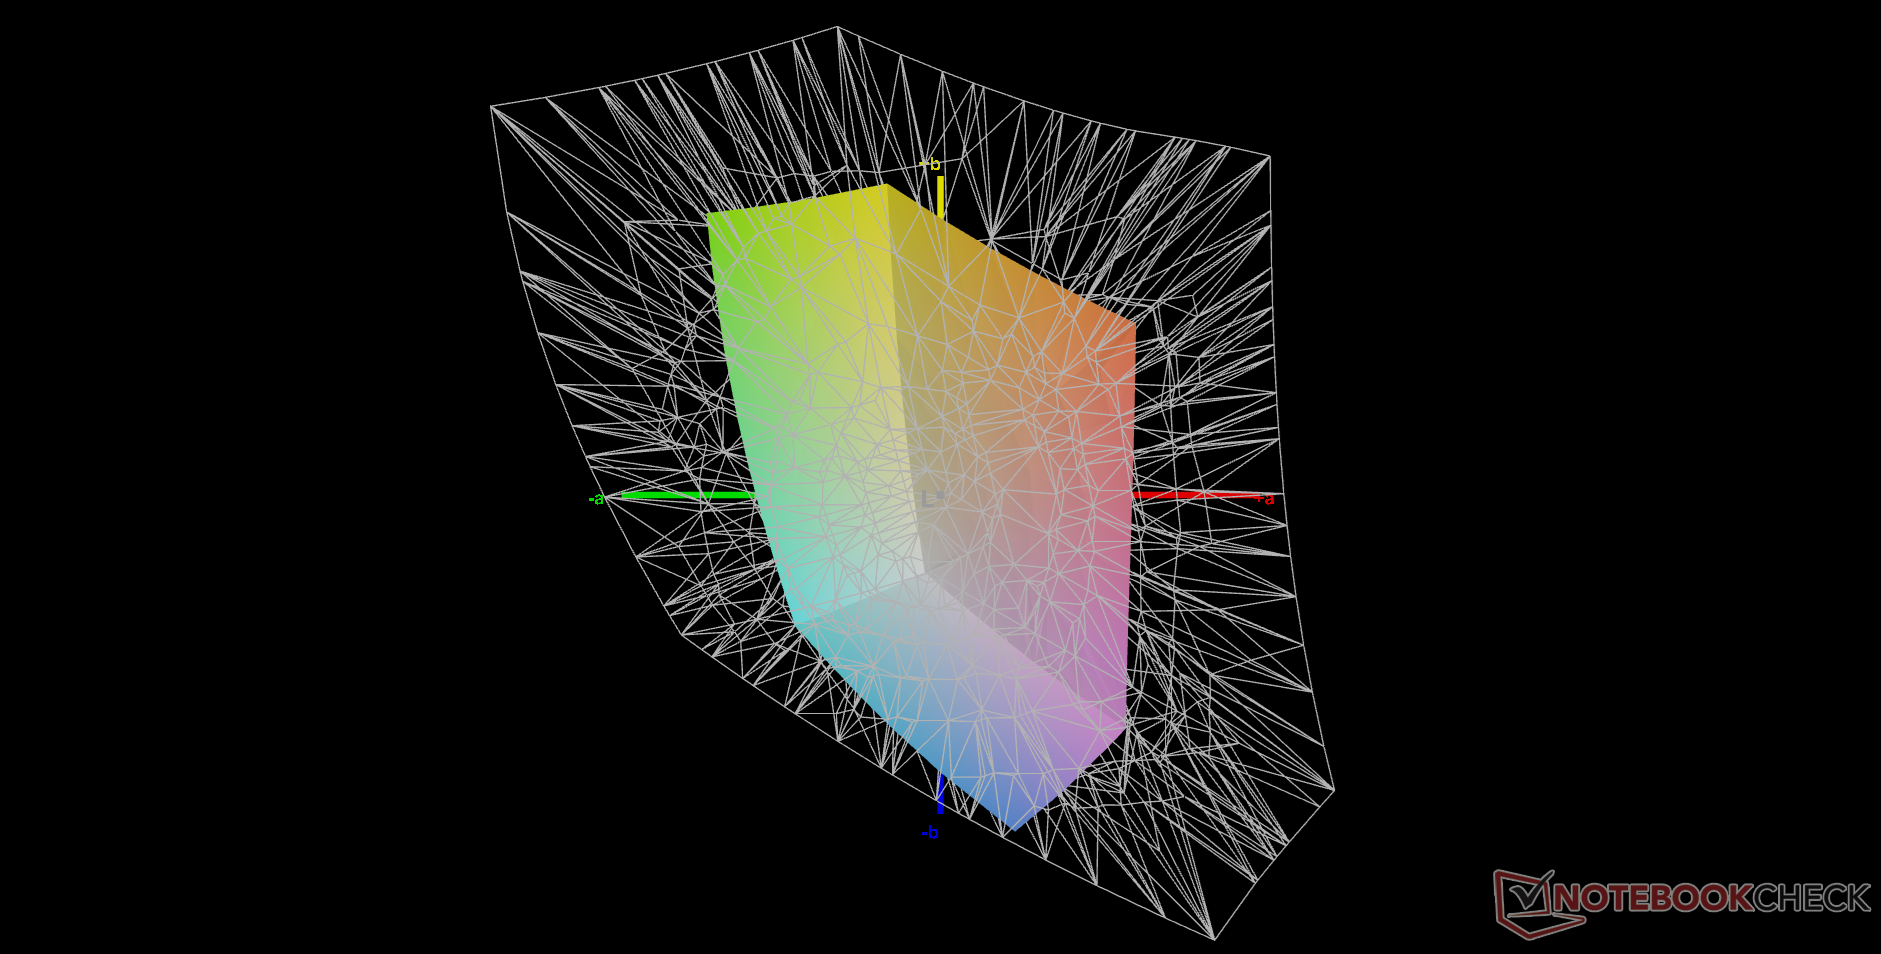
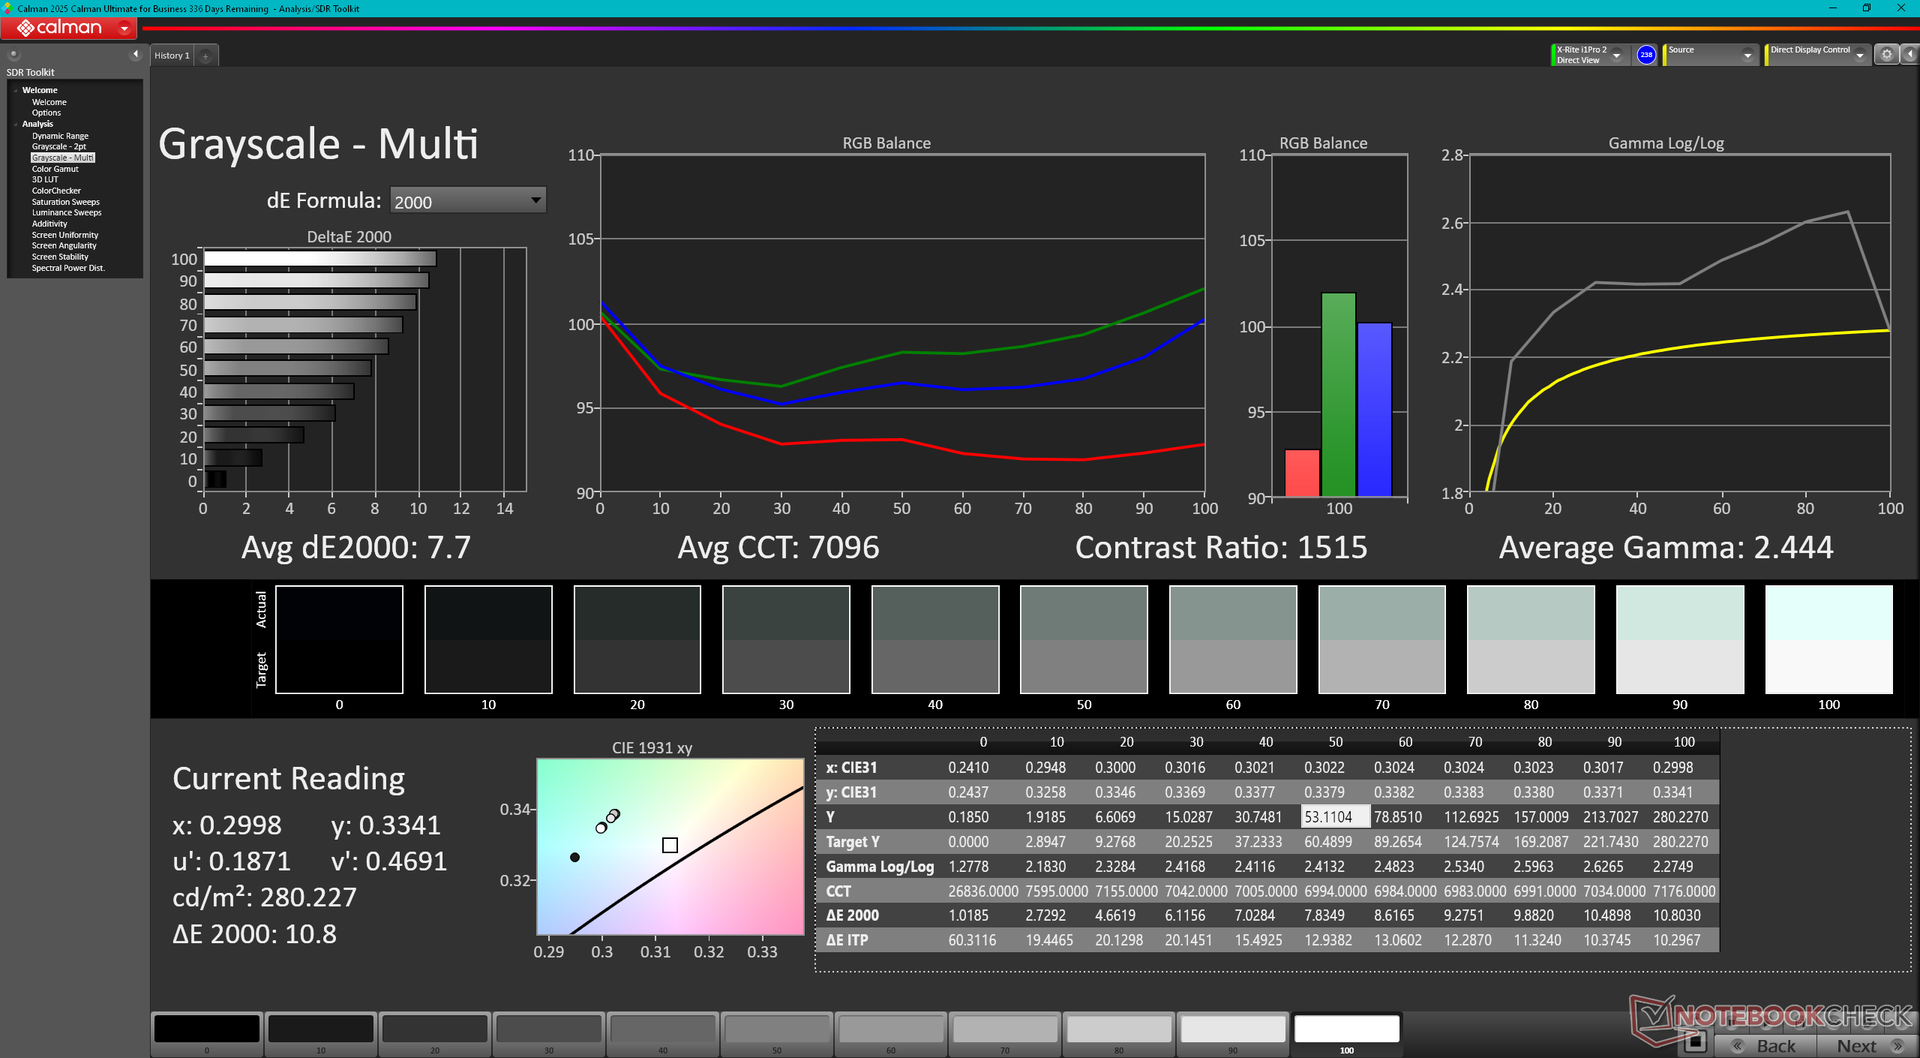
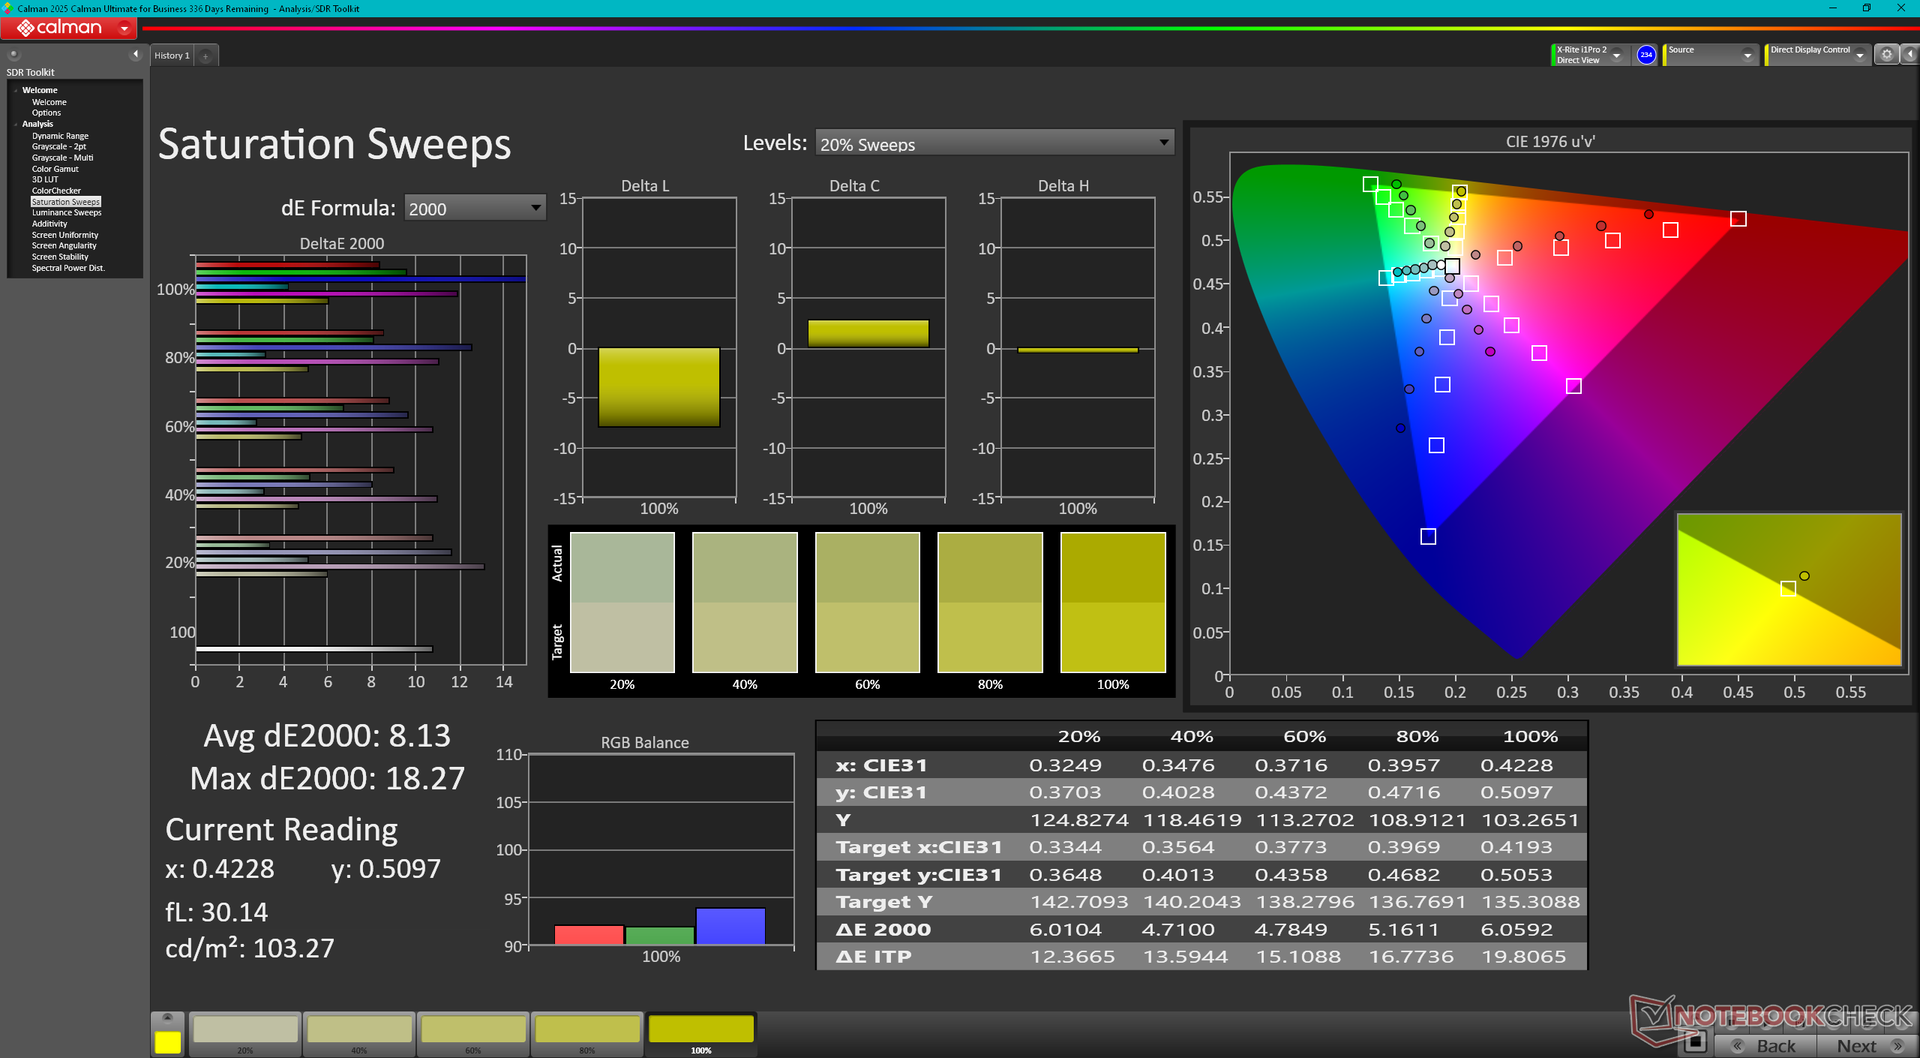
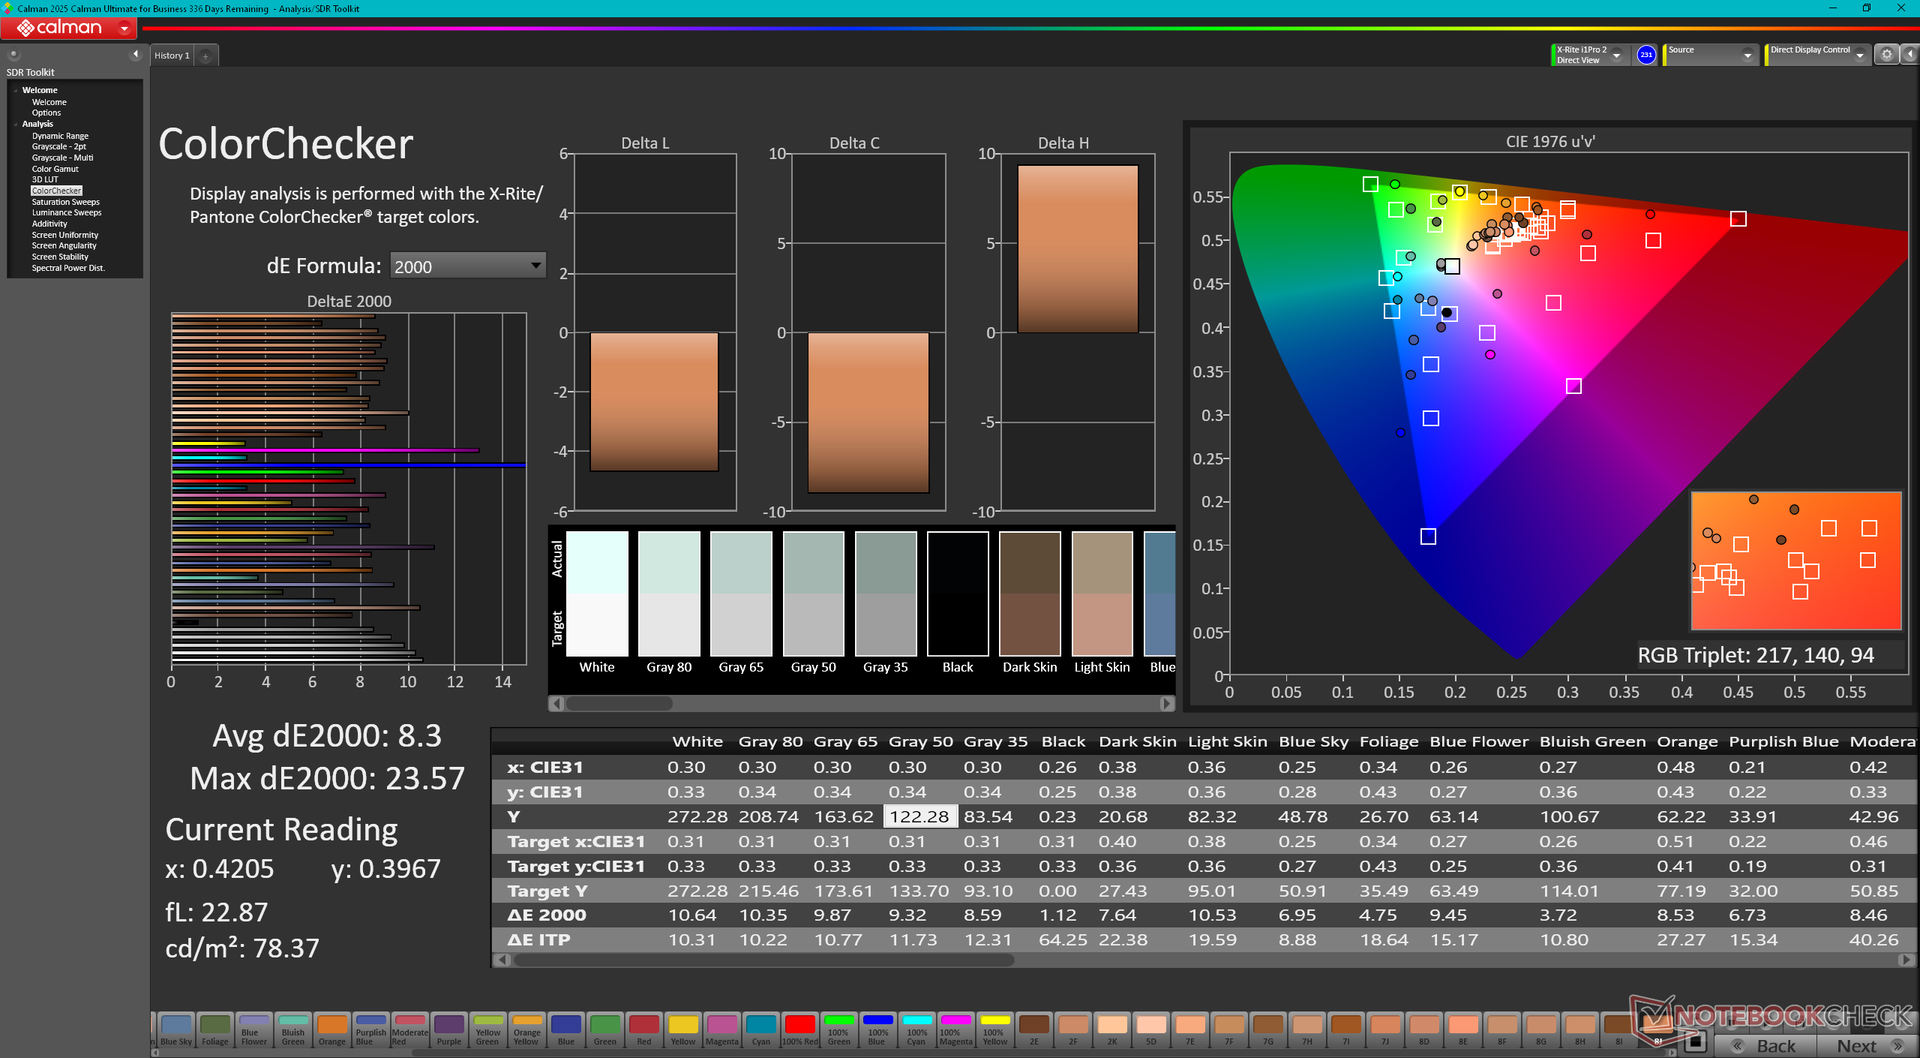
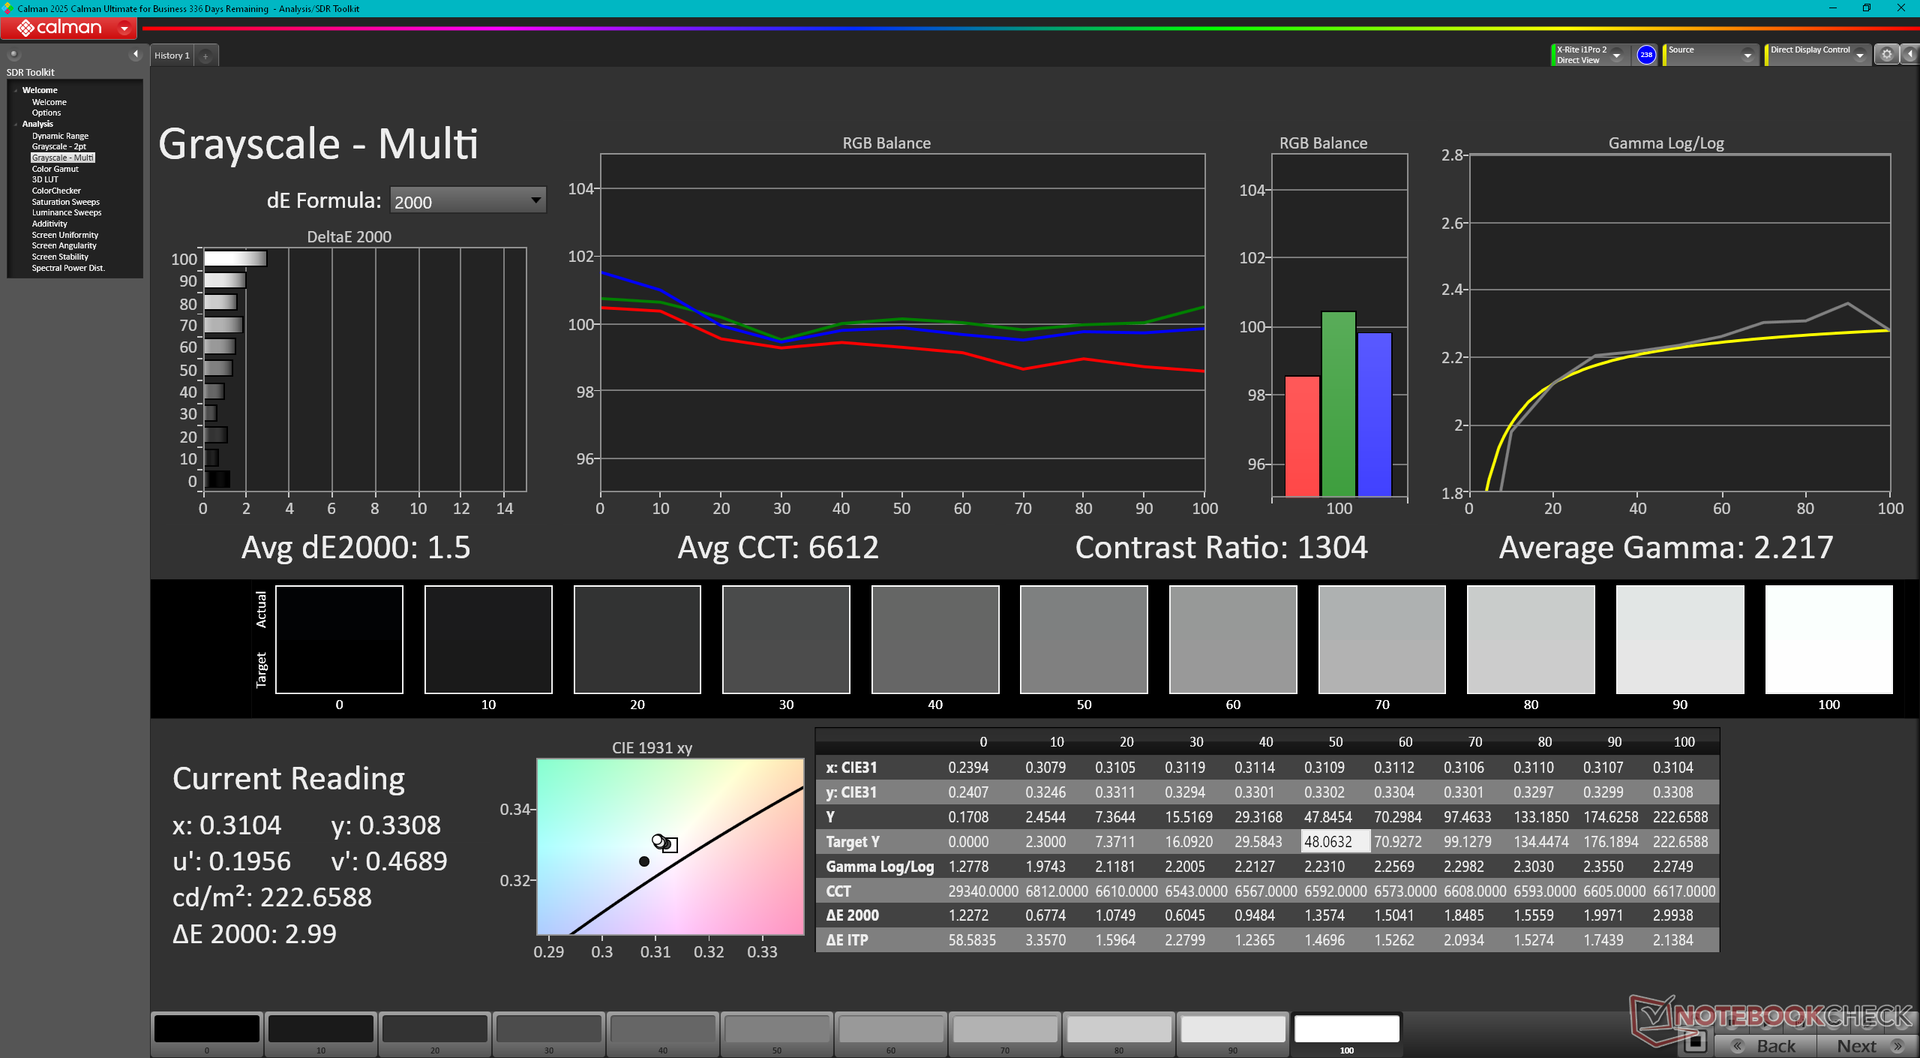
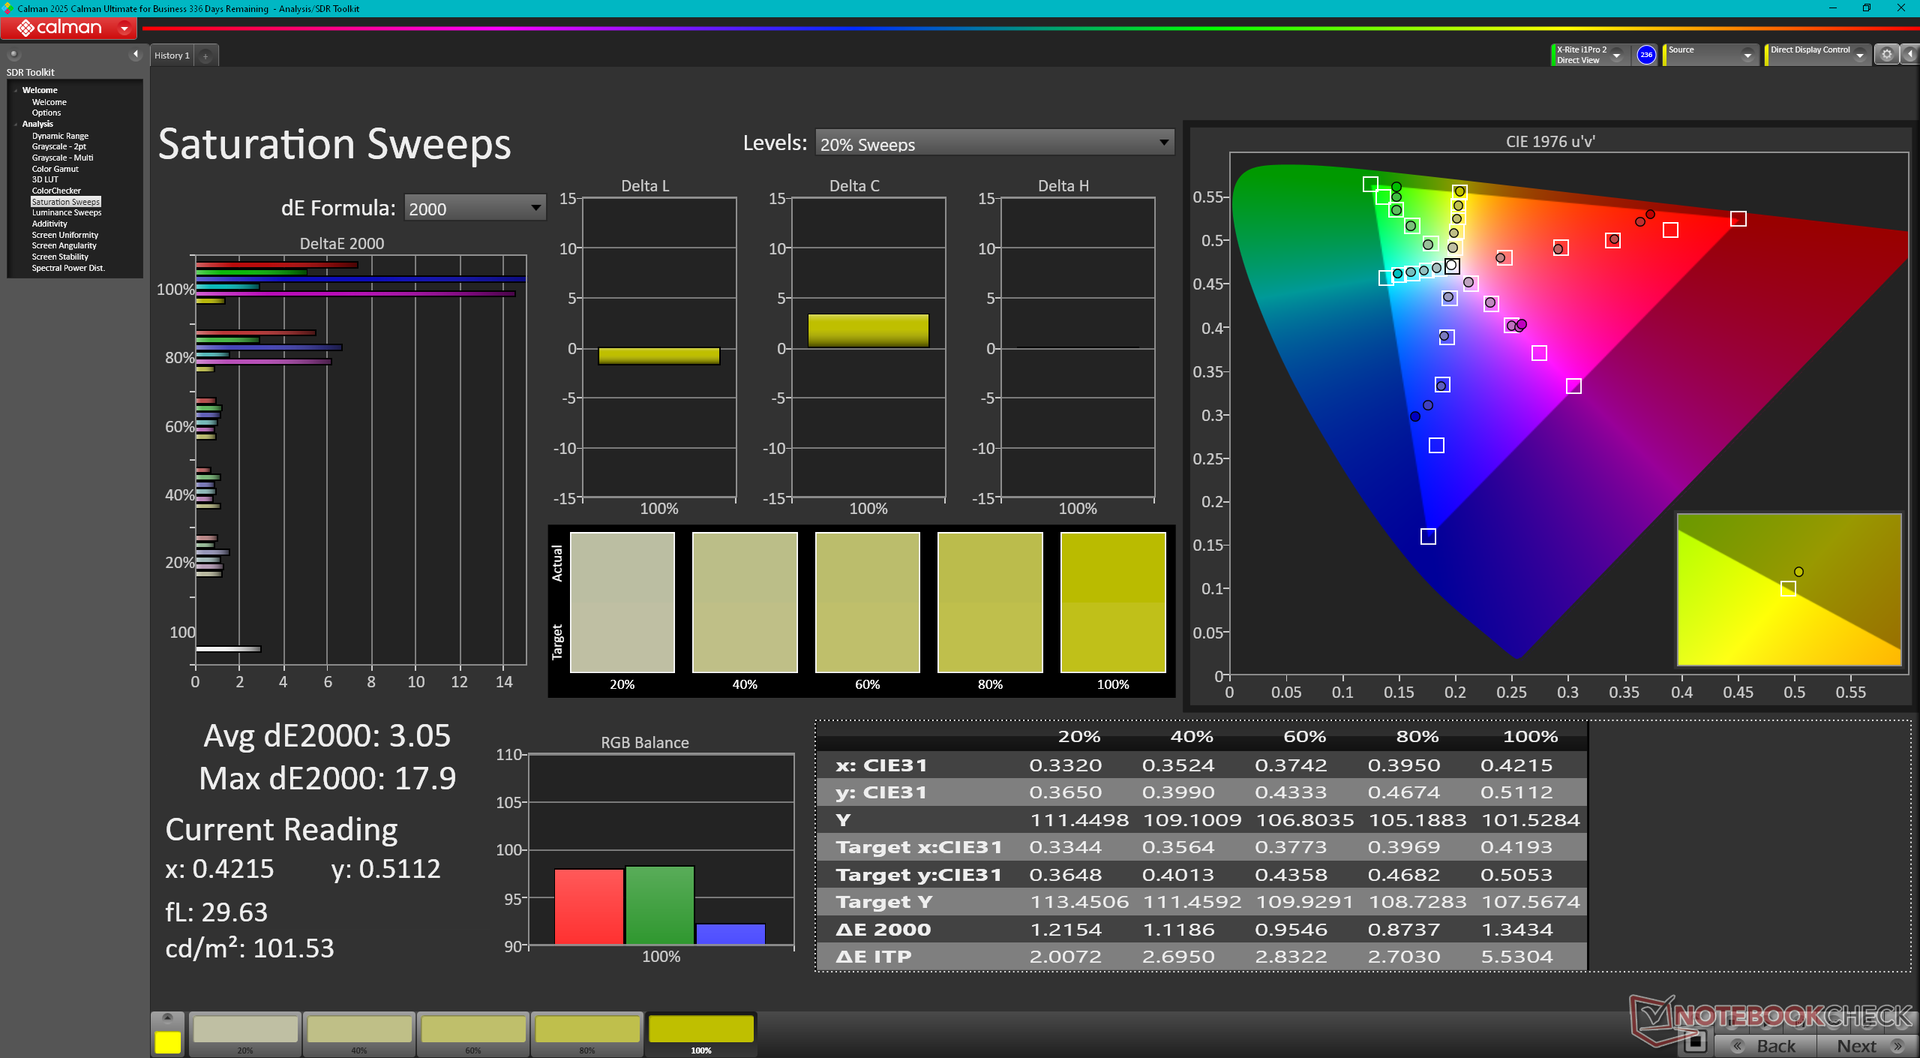
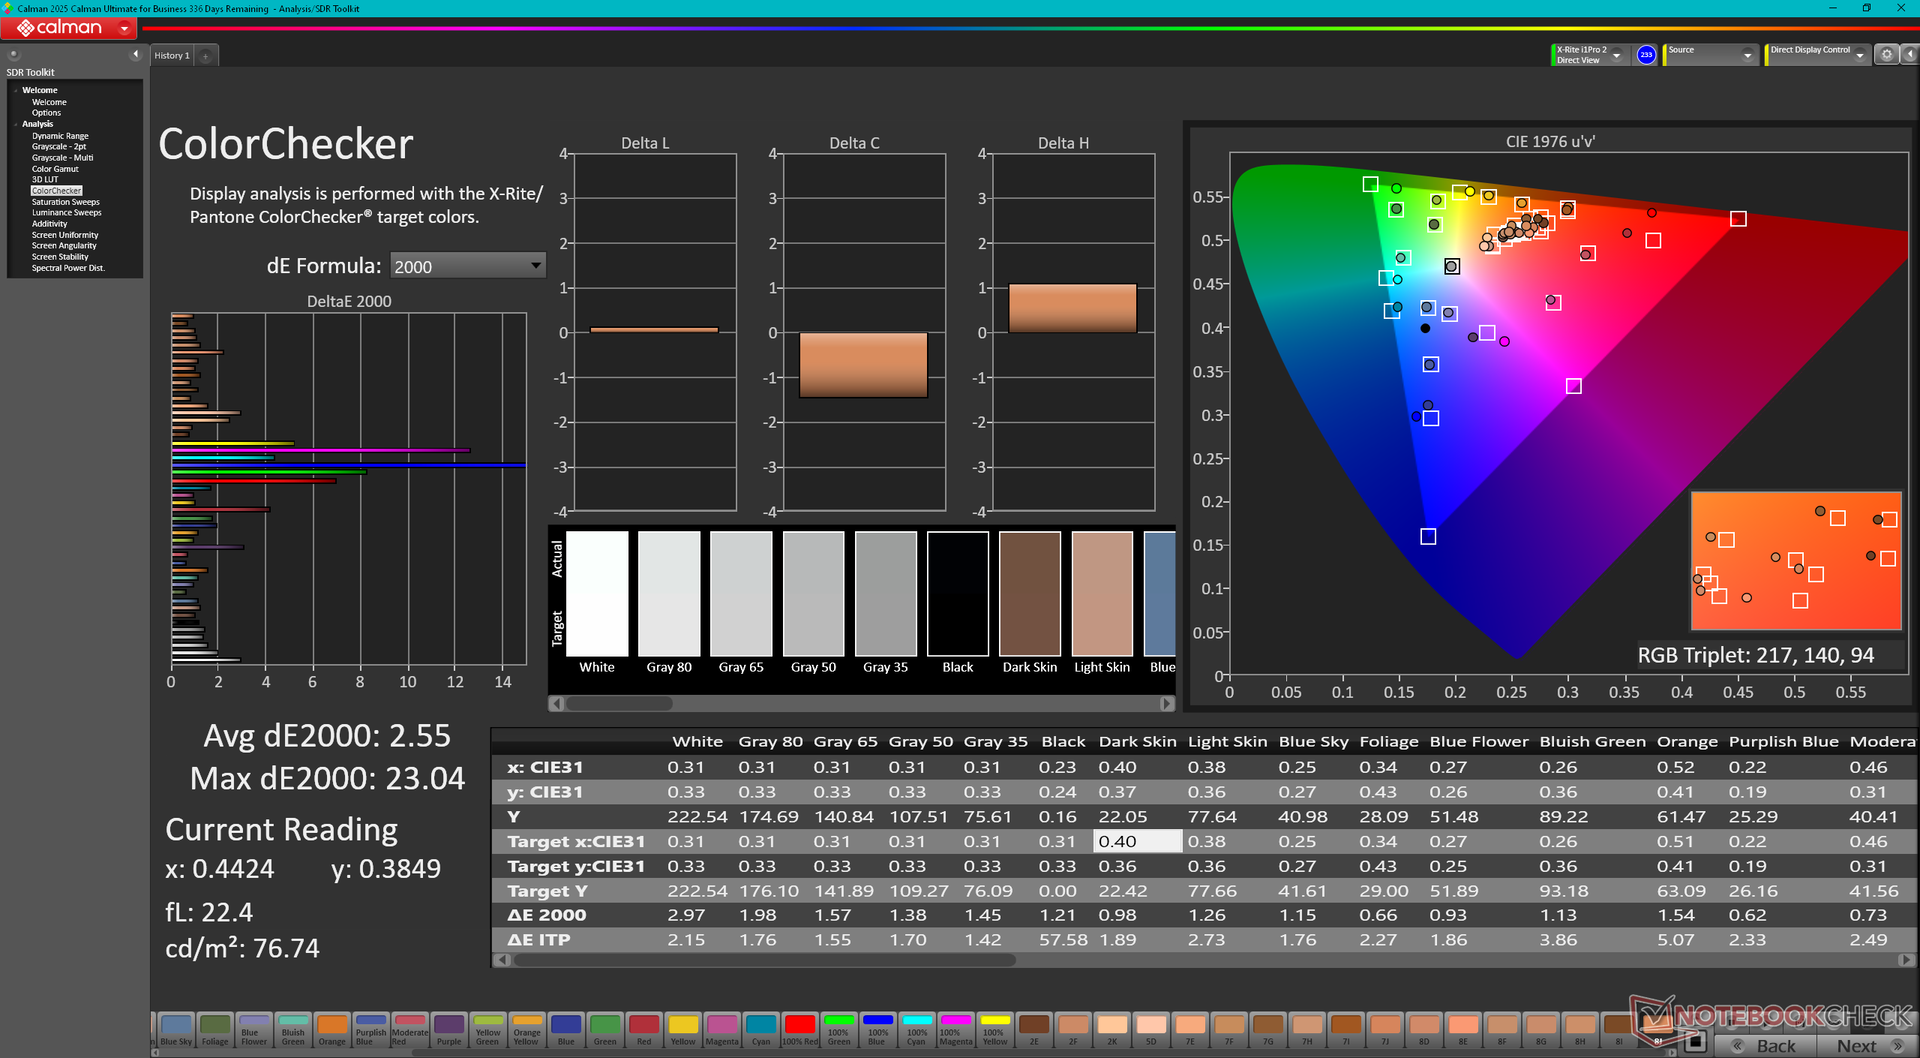
Kolory są <60% standardu sRGB, aby być panelem IPS z niższej półki, odpowiednim dla budżetowego laptopa, takiego jak VigoBook G7. Temperatura barwowa jest również zbyt chłodna po wyjęciu z pudełka, ale kalibracja użytkownika końcowego za pomocą kolorymetru X-Rite jest w stanie rozwiązać ten problem, jak pokazują nasze wyniki CalMan poniżej.

| |||||||||||||||||||||||||
rozświetlenie: 74 %
na akumulatorze: 270.4 cd/m²
kontrast: 1176:1 (czerń: 0.23 cd/m²)
ΔE Color 8.3 | 0.5-29.43 Ø4.87, calibrated: 2.55
ΔE Greyscale 7.7 | 0.5-98 Ø5.1
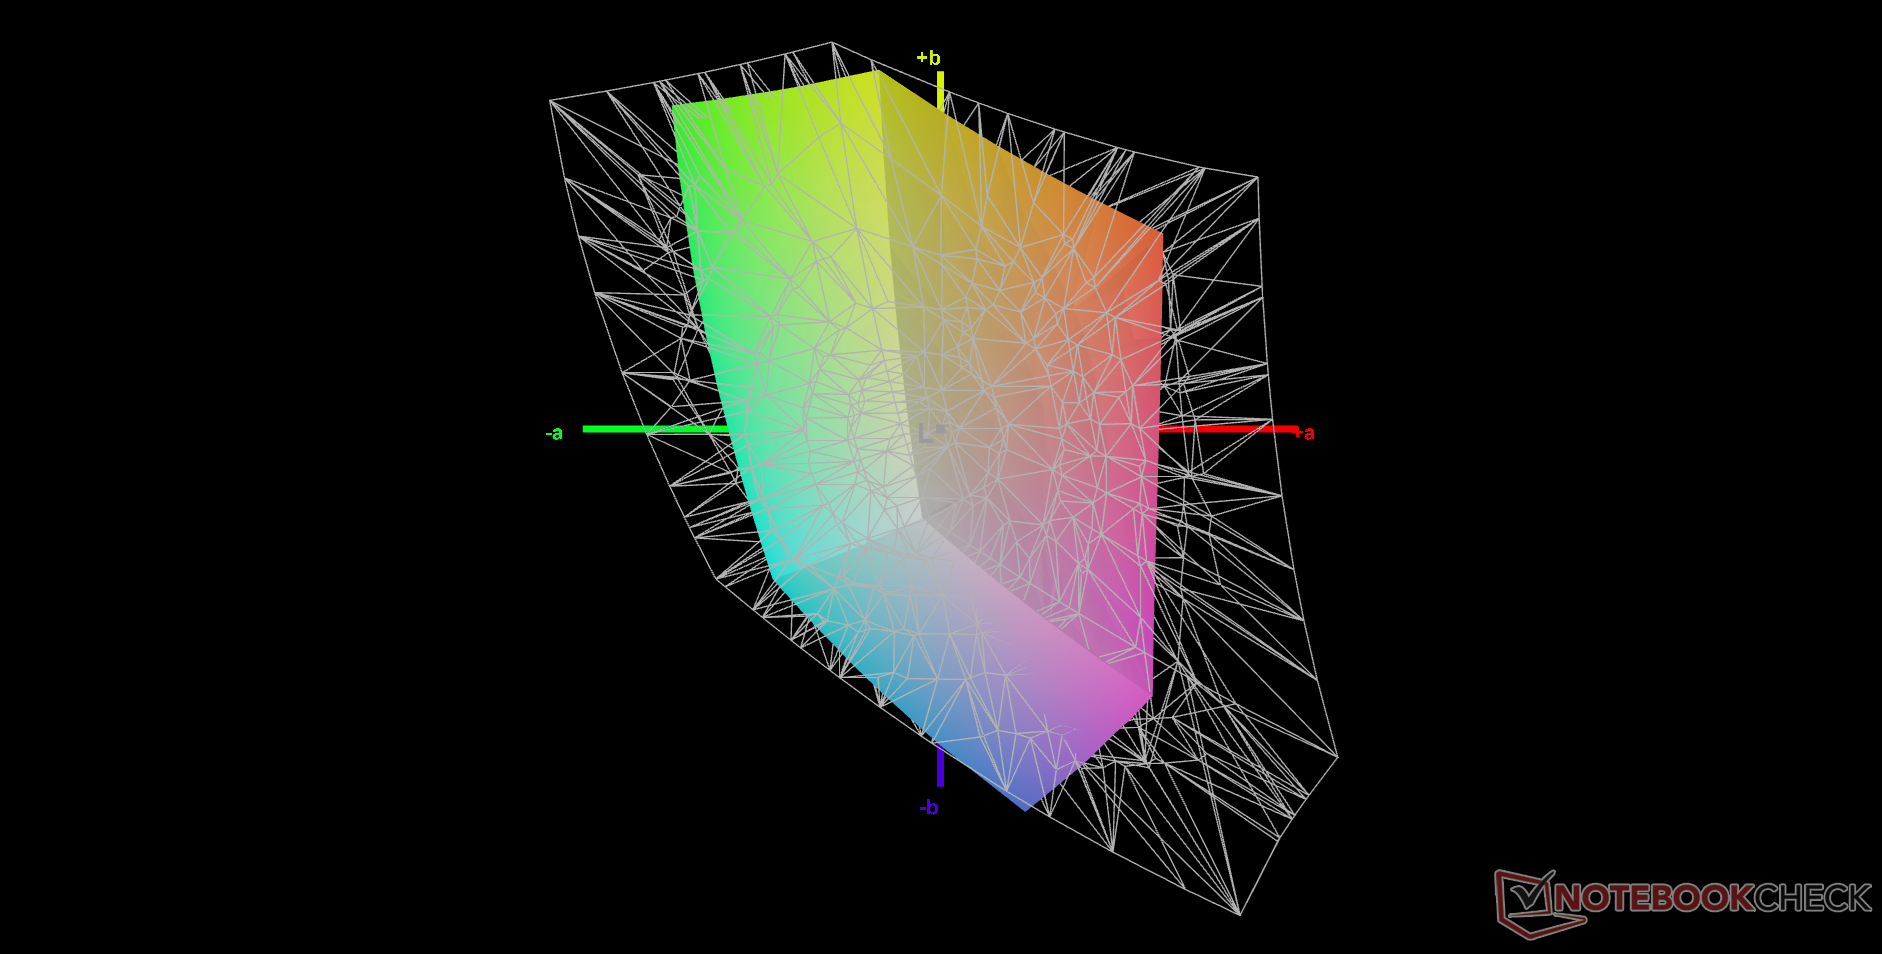
39.6% AdobeRGB 1998 (Argyll 2.2.0 3D)
57.1% sRGB (Argyll 2.2.0 3D)
38.3% Display P3 (Argyll 2.2.0 3D)
Gamma: 2.44
| Thinkeagle VigoBook G7 G156EB06, IPS, 1920x1080, 15.6", 60 Hz | Ninkear A15 Plus (16+512) HKC023D, IPS, 1920x1080, 15.6", 60 Hz | Acer Aspire Vero AV15-53P AUO B156HAN09.0, IPS, 1920x1080, 15.6", 60 Hz | HP 250 G9 7N029ES CMN1538, IPS, 1920x1080, 15.6", 60 Hz | Lenovo IdeaPad 3 15ABA7 Lenovo LEN156FHD, IPS, 1920x1080, 15.6", 60 Hz | Dell Latitude 3520 BOE NE156FH, IPS, 1920x1080, 15.6", 60 Hz | |
|---|---|---|---|---|---|---|
| Display | 2% | 72% | 13% | 0% | 5% | |
| Display P3 Coverage | 38.3 | 39.04 2% | 66.67 74% | 43.3 13% | 38.2 0% | 40 4% |
| sRGB Coverage | 57.1 | 58.06 2% | 97.48 71% | 64.8 13% | 57.3 0% | 60.2 5% |
| AdobeRGB 1998 Coverage | 39.6 | 40.34 2% | 68.14 72% | 44.7 13% | 39.5 0% | 41.4 5% |
| Response Times | 14% | -19% | -19% | 13% | 19% | |
| Response Time Grey 50% / Grey 80% * | 24.7 ? | 25 ? -1% | 25 ? -1% | 31.9 ? -29% | 27 ? -9% | 24 ? 3% |
| Response Time Black / White * | 19.8 ? | 14 ? 29% | 27 ? -36% | 21.6 ? -9% | 13 ? 34% | 13 ? 34% |
| PWM Frequency | 200 ? | |||||
| Screen | 2% | 26% | 19% | 4% | 0% | |
| Brightness middle | 270.4 | 254 -6% | 411.5 52% | 281 4% | 333 23% | 322 19% |
| Brightness | 253 | 244 -4% | 372 47% | 257 2% | 312 23% | 294 16% |
| Brightness Distribution | 74 | 89 20% | 84 14% | 82 11% | 82 11% | 87 18% |
| Black Level * | 0.23 | 0.1587 31% | 0.52 -126% | 0.16 30% | 0.31 -35% | 0.445 -93% |
| Contrast | 1176 | 1601 36% | 791 -33% | 1756 49% | 1074 -9% | 724 -38% |
| Colorchecker dE 2000 * | 8.3 | 7.42 11% | 3.07 63% | 4.7 43% | 5.39 35% | 4.54 45% |
| Colorchecker dE 2000 max. * | 23.57 | 19.74 16% | 4.95 79% | 18 24% | 19.18 19% | 17.27 27% |
| Colorchecker dE 2000 calibrated * | 2.55 | 5.72 -124% | 1.03 60% | 3.7 -45% | 4.77 -87% | 4.43 -74% |
| Greyscale dE 2000 * | 7.7 | 5 35% | 1.74 77% | 3.6 53% | 3.56 54% | 1.25 84% |
| Gamma | 2.44 90% | 1.855 119% | 2.238 98% | 2.2 100% | 2.47 89% | 2.46 89% |
| CCT | 7096 92% | 6421 101% | 6611 98% | 7267 89% | 6290 103% | 6677 97% |
| Całkowita średnia (program / ustawienia) | 6% /
4% | 26% /
30% | 4% /
12% | 6% /
4% | 8% /
4% |
* ... im mniej tym lepiej
Wyświetl czasy reakcji
| ↔ Czas reakcji od czerni do bieli | ||
|---|---|---|
| 19.8 ms ... wzrost ↗ i spadek ↘ łącznie | ↗ 11.1 ms wzrost | 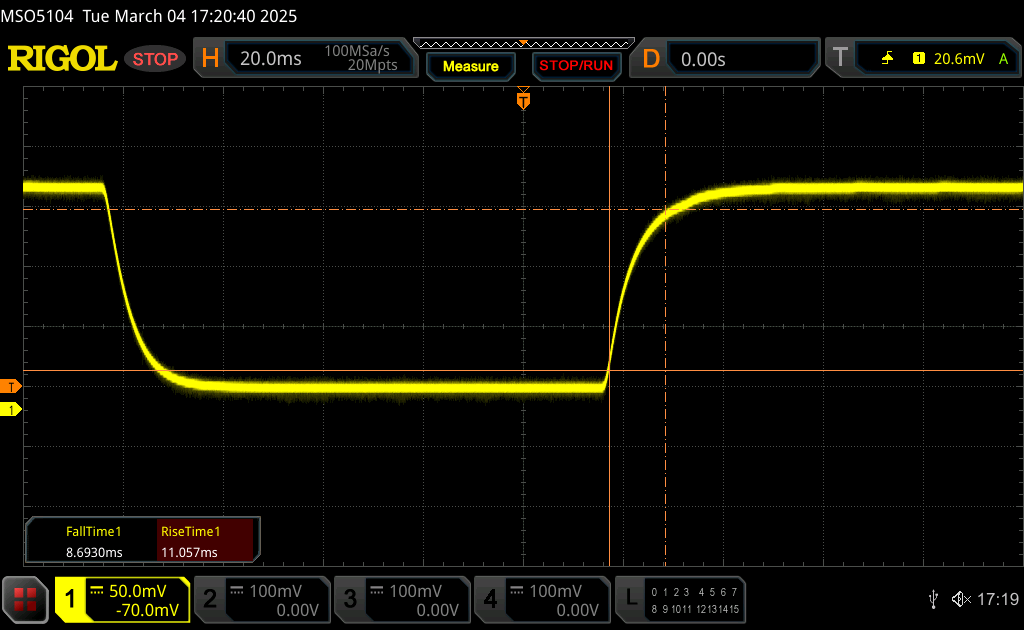 |
| ↘ 8.7 ms upadek | ||
| W naszych testach ekran wykazuje dobry współczynnik reakcji, ale może być zbyt wolny dla graczy rywalizujących ze sobą. Dla porównania, wszystkie testowane urządzenia wahają się od 0.1 (minimum) do 240 (maksimum) ms. » 40 % wszystkich urządzeń jest lepszych. Oznacza to, że zmierzony czas reakcji jest zbliżony do średniej wszystkich testowanych urządzeń (20.8 ms). | ||
| ↔ Czas reakcji 50% szarości do 80% szarości | ||
| 24.7 ms ... wzrost ↗ i spadek ↘ łącznie | ↗ 13 ms wzrost | 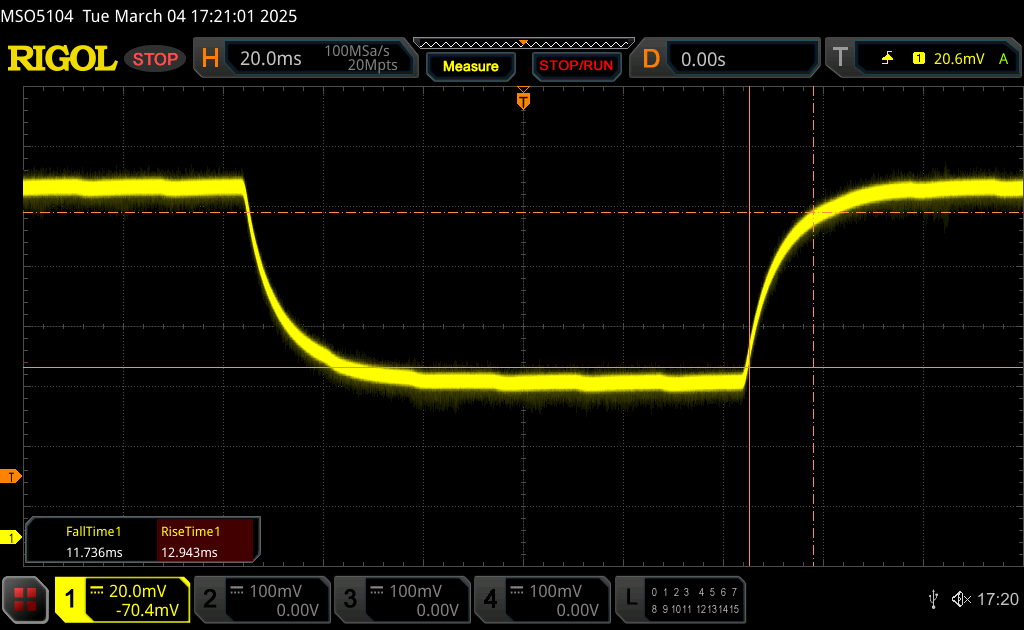 |
| ↘ 11.7 ms upadek | ||
| W naszych testach ekran wykazuje dobry współczynnik reakcji, ale może być zbyt wolny dla graczy rywalizujących ze sobą. Dla porównania, wszystkie testowane urządzenia wahają się od 0.165 (minimum) do 636 (maksimum) ms. » 32 % wszystkich urządzeń jest lepszych. Oznacza to, że zmierzony czas reakcji jest lepszy od średniej wszystkich testowanych urządzeń (32.5 ms). | ||
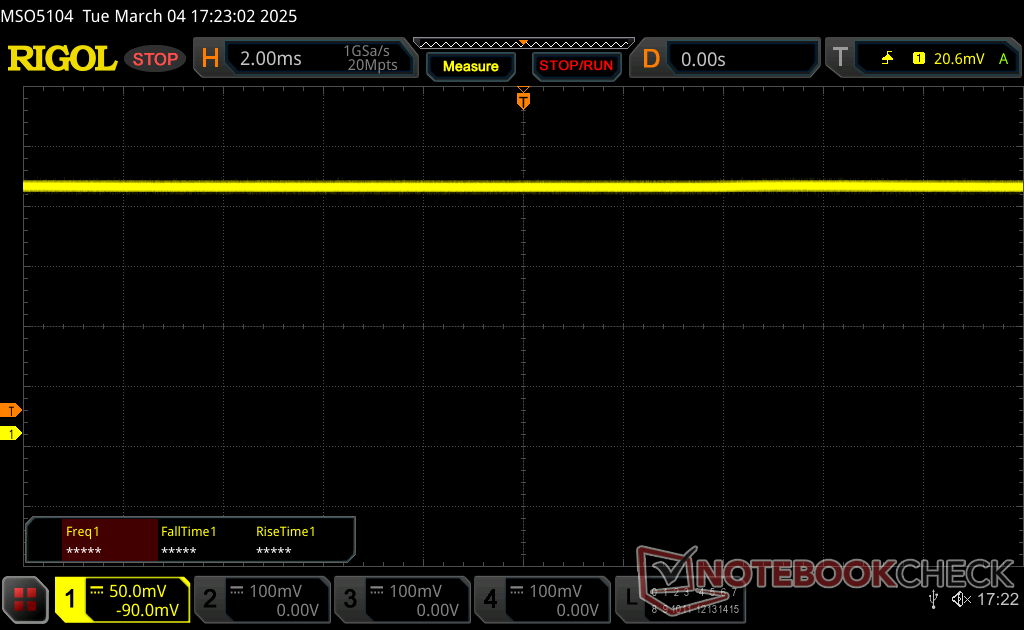
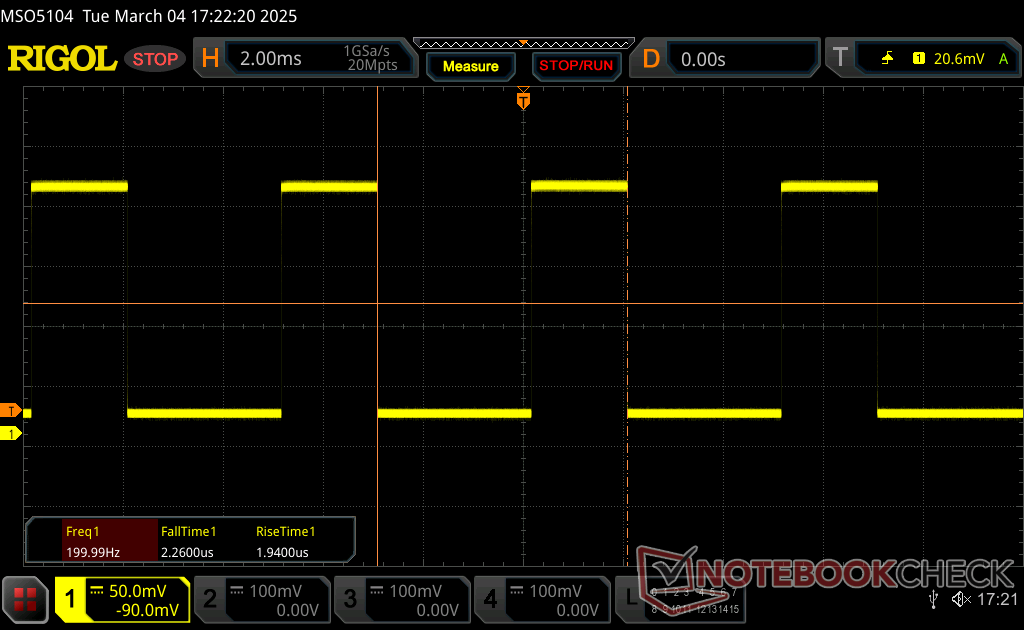
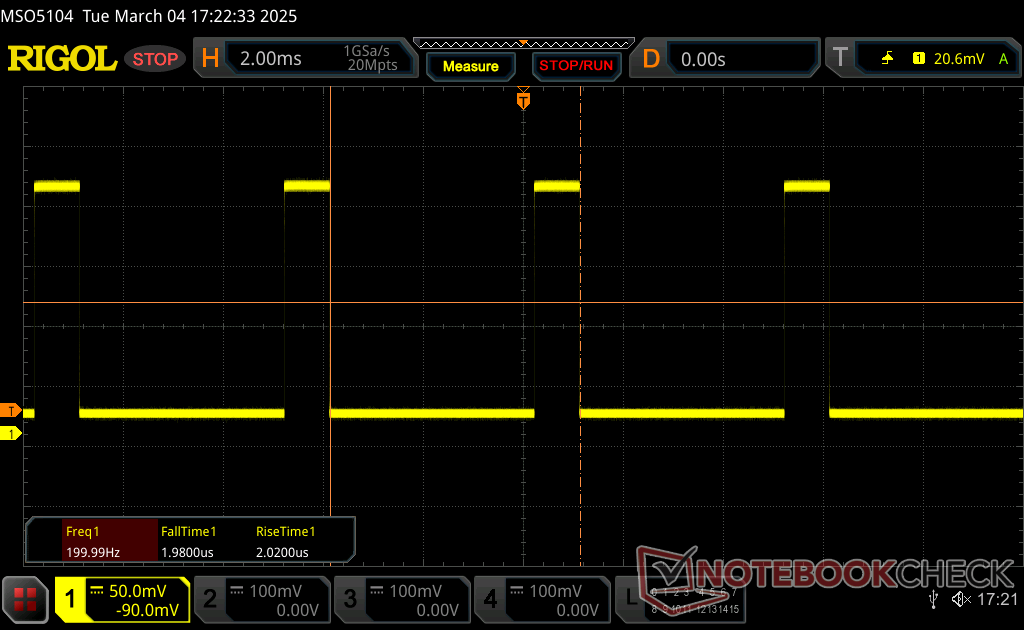
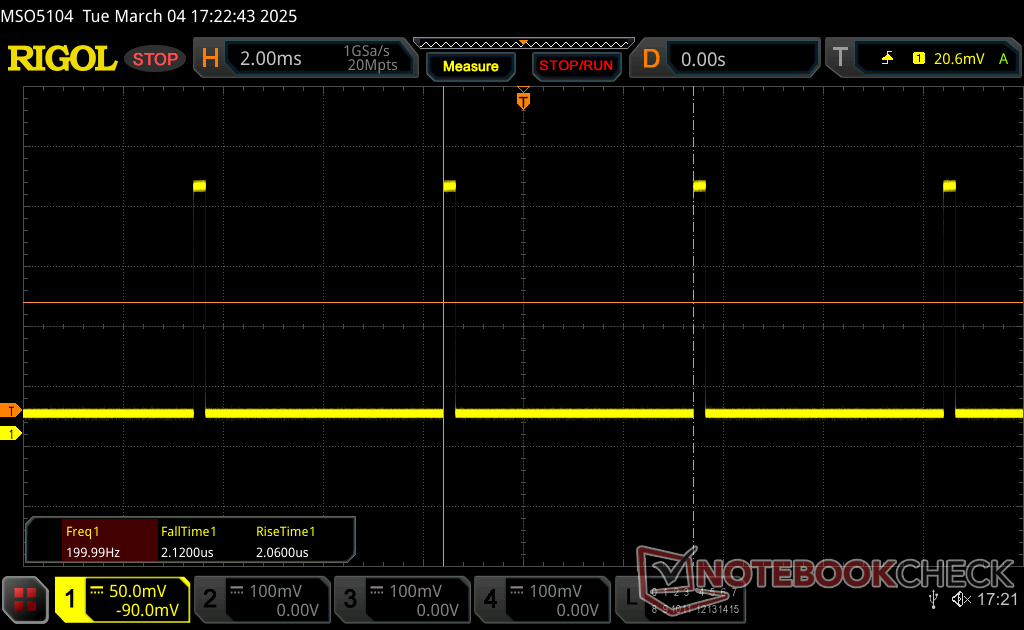
Migotanie ekranu / PWM (modulacja szerokości impulsu)
| Wykryto migotanie ekranu/wykryto PWM | 200 Hz Amplitude: 50 % | ≤ 99 % ustawienia jasności | 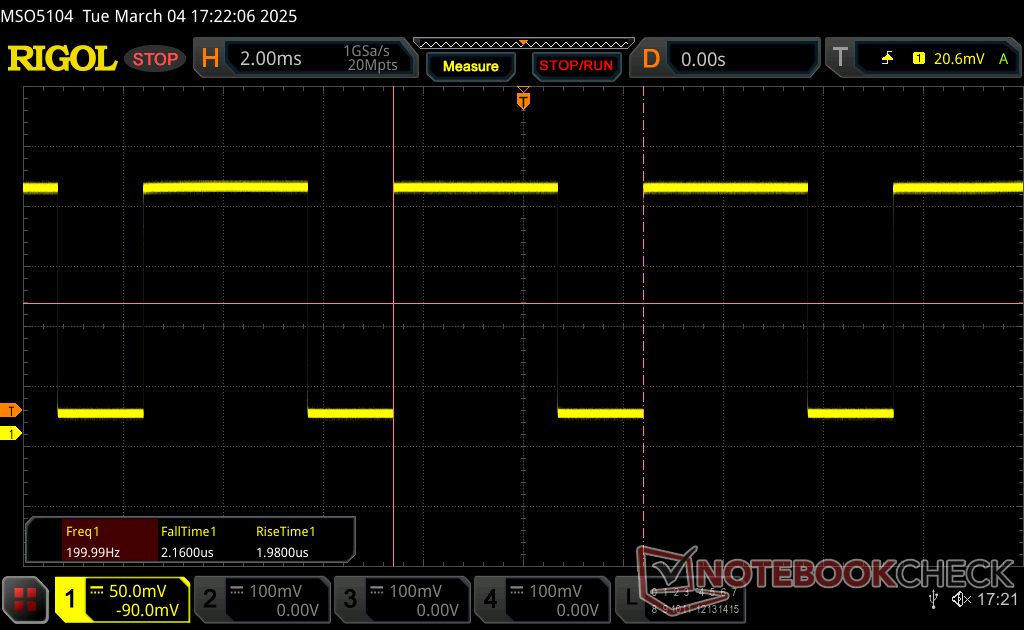 |
Podświetlenie wyświetlacza miga z częstotliwością 200 Hz (najgorszy przypadek, np. przy użyciu PWM) Wykryto migotanie przy ustawieniu jasności 99 % i poniżej. Powyżej tego ustawienia jasności nie powinno być żadnego migotania ani PWM. Częstotliwość 200 Hz jest stosunkowo niska, więc wrażliwi użytkownicy prawdopodobnie zauważą migotanie i odczują zmęczenie oczu przy podanym ustawieniu jasności i poniżej. Dla porównania: 53 % wszystkich testowanych urządzeń nie używa PWM do przyciemniania wyświetlacza. Jeśli wykryto PWM, zmierzono średnio 8516 (minimum: 5 - maksimum: 343500) Hz. | |||
PWM jest obecny na wszystkich poziomach jasności z wyjątkiem maksymalnego.

Wydajność
Warunki testowania
Przed uruchomieniem poniższych testów porównawczych ustawiliśmy system Windows w tryb wydajności.
Procesor
Wydajność jest słaba nawet w porównaniu do innych laptopów z tym samym Ryzen 7 5700U CPU. Na przykład Ninkear A15 Plus działa o 60 procent szybciej niż nasz Thinkeagle z dokładnie tym samym procesorem AMD.
Cinebench R15 Multi Loop
Cinebench R23: Multi Core | Single Core
Cinebench R20: CPU (Multi Core) | CPU (Single Core)
Cinebench R15: CPU Multi 64Bit | CPU Single 64Bit
Blender: v2.79 BMW27 CPU
7-Zip 18.03: 7z b 4 | 7z b 4 -mmt1
Geekbench 6.4: Multi-Core | Single-Core
Geekbench 5.5: Multi-Core | Single-Core
HWBOT x265 Benchmark v2.2: 4k Preset
LibreOffice : 20 Documents To PDF
R Benchmark 2.5: Overall mean
| CPU Performance Rating | |
| Lenovo IdeaPad Gaming 3 15ARH7 -2! | |
| Acer Aspire Vero AV15-53P | |
| Lenovo IdeaPad 3 15ABA7 -2! | |
| Eurocom C315 Blitz | |
| Ninkear A15 Plus (16+512) | |
| Przeciętny AMD Ryzen 7 5700U | |
| Lenovo V15 G2 ALC-82KD003XGE -3! | |
| HP 250 G9 7N029ES | |
| Thinkeagle VigoBook G7 | |
| Dell Latitude 3520 -2! | |
| Lenovo ThinkPad L15 G2-20X4S0KU00 -2! | |
| ACEMagician Ace AX15, N95 | |
| Cinebench R23 / Multi Core | |
| Lenovo IdeaPad Gaming 3 15ARH7 | |
| Ninkear A15 Plus (16+512) | |
| Lenovo IdeaPad 3 15ABA7 | |
| Przeciętny AMD Ryzen 7 5700U (4861 - 10139, n=19) | |
| Acer Aspire Vero AV15-53P | |
| Lenovo V15 G2 ALC-82KD003XGE | |
| Eurocom C315 Blitz | |
| Dell Latitude 3520 | |
| Thinkeagle VigoBook G7 | |
| HP 250 G9 7N029ES | |
| Lenovo ThinkPad L15 G2-20X4S0KU00 | |
| ACEMagician Ace AX15, N95 | |
| Cinebench R23 / Single Core | |
| Acer Aspire Vero AV15-53P | |
| Eurocom C315 Blitz | |
| Lenovo IdeaPad Gaming 3 15ARH7 | |
| HP 250 G9 7N029ES | |
| Lenovo IdeaPad 3 15ABA7 | |
| Dell Latitude 3520 | |
| Lenovo ThinkPad L15 G2-20X4S0KU00 | |
| Ninkear A15 Plus (16+512) | |
| Przeciętny AMD Ryzen 7 5700U (1177 - 1268, n=19) | |
| Thinkeagle VigoBook G7 | |
| Lenovo V15 G2 ALC-82KD003XGE | |
| ACEMagician Ace AX15, N95 | |
| Cinebench R20 / CPU (Multi Core) | |
| Lenovo IdeaPad Gaming 3 15ARH7 | |
| Ninkear A15 Plus (16+512) | |
| Lenovo IdeaPad 3 15ABA7 | |
| Przeciętny AMD Ryzen 7 5700U (1887 - 3877, n=20) | |
| Acer Aspire Vero AV15-53P | |
| Lenovo V15 G2 ALC-82KD003XGE | |
| Eurocom C315 Blitz | |
| Thinkeagle VigoBook G7 | |
| Dell Latitude 3520 | |
| HP 250 G9 7N029ES | |
| Lenovo ThinkPad L15 G2-20X4S0KU00 | |
| ACEMagician Ace AX15, N95 | |
| Cinebench R20 / CPU (Single Core) | |
| Acer Aspire Vero AV15-53P | |
| Eurocom C315 Blitz | |
| Lenovo IdeaPad Gaming 3 15ARH7 | |
| HP 250 G9 7N029ES | |
| Lenovo IdeaPad 3 15ABA7 | |
| Dell Latitude 3520 | |
| Lenovo ThinkPad L15 G2-20X4S0KU00 | |
| Ninkear A15 Plus (16+512) | |
| Przeciętny AMD Ryzen 7 5700U (478 - 495, n=20) | |
| Thinkeagle VigoBook G7 | |
| Lenovo V15 G2 ALC-82KD003XGE | |
| ACEMagician Ace AX15, N95 | |
| Cinebench R15 / CPU Multi 64Bit | |
| Ninkear A15 Plus (16+512) | |
| Lenovo IdeaPad Gaming 3 15ARH7 | |
| Lenovo IdeaPad 3 15ABA7 | |
| Przeciętny AMD Ryzen 7 5700U (856 - 1691, n=19) | |
| Acer Aspire Vero AV15-53P | |
| Lenovo V15 G2 ALC-82KD003XGE | |
| Eurocom C315 Blitz | |
| Thinkeagle VigoBook G7 | |
| HP 250 G9 7N029ES | |
| Dell Latitude 3520 | |
| Lenovo ThinkPad L15 G2-20X4S0KU00 | |
| ACEMagician Ace AX15, N95 | |
| Cinebench R15 / CPU Single 64Bit | |
| Acer Aspire Vero AV15-53P | |
| Lenovo IdeaPad Gaming 3 15ARH7 | |
| Eurocom C315 Blitz | |
| Lenovo IdeaPad 3 15ABA7 | |
| HP 250 G9 7N029ES | |
| Lenovo ThinkPad L15 G2-20X4S0KU00 | |
| Dell Latitude 3520 | |
| Ninkear A15 Plus (16+512) | |
| Przeciętny AMD Ryzen 7 5700U (184 - 190, n=18) | |
| Thinkeagle VigoBook G7 | |
| Lenovo V15 G2 ALC-82KD003XGE | |
| ACEMagician Ace AX15, N95 | |
| Blender / v2.79 BMW27 CPU | |
| ACEMagician Ace AX15, N95 | |
| Lenovo ThinkPad L15 G2-20X4S0KU00 | |
| HP 250 G9 7N029ES | |
| Dell Latitude 3520 | |
| Thinkeagle VigoBook G7 | |
| Eurocom C315 Blitz | |
| Lenovo V15 G2 ALC-82KD003XGE | |
| Acer Aspire Vero AV15-53P | |
| Ninkear A15 Plus (16+512) | |
| Lenovo IdeaPad 3 15ABA7 | |
| Przeciętny AMD Ryzen 7 5700U (292 - 557, n=19) | |
| Lenovo IdeaPad Gaming 3 15ARH7 | |
| 7-Zip 18.03 / 7z b 4 | |
| Lenovo IdeaPad Gaming 3 15ARH7 | |
| Przeciętny AMD Ryzen 7 5700U (29095 - 47501, n=19) | |
| Ninkear A15 Plus (16+512) | |
| Lenovo IdeaPad 3 15ABA7 | |
| Acer Aspire Vero AV15-53P | |
| Thinkeagle VigoBook G7 | |
| Eurocom C315 Blitz | |
| HP 250 G9 7N029ES | |
| Dell Latitude 3520 | |
| Lenovo ThinkPad L15 G2-20X4S0KU00 | |
| ACEMagician Ace AX15, N95 | |
| 7-Zip 18.03 / 7z b 4 -mmt1 | |
| Eurocom C315 Blitz | |
| Lenovo IdeaPad Gaming 3 15ARH7 | |
| Acer Aspire Vero AV15-53P | |
| Lenovo IdeaPad 3 15ABA7 | |
| HP 250 G9 7N029ES | |
| Dell Latitude 3520 | |
| Ninkear A15 Plus (16+512) | |
| Przeciętny AMD Ryzen 7 5700U (4476 - 4620, n=19) | |
| Thinkeagle VigoBook G7 | |
| Lenovo ThinkPad L15 G2-20X4S0KU00 | |
| Lenovo V15 G2 ALC-82KD003XGE | |
| ACEMagician Ace AX15, N95 | |
| Geekbench 6.4 / Multi-Core | |
| Eurocom C315 Blitz | |
| Acer Aspire Vero AV15-53P | |
| Ninkear A15 Plus (16+512) | |
| Ninkear A15 Plus (16+512) | |
| Przeciętny AMD Ryzen 7 5700U (4983 - 6260, n=4) | |
| HP 250 G9 7N029ES | |
| Thinkeagle VigoBook G7 | |
| ACEMagician Ace AX15, N95 | |
| Geekbench 6.4 / Single-Core | |
| Eurocom C315 Blitz | |
| Acer Aspire Vero AV15-53P | |
| HP 250 G9 7N029ES | |
| Ninkear A15 Plus (16+512) | |
| Ninkear A15 Plus (16+512) | |
| Przeciętny AMD Ryzen 7 5700U (1573 - 1625, n=4) | |
| Thinkeagle VigoBook G7 | |
| ACEMagician Ace AX15, N95 | |
| Geekbench 5.5 / Multi-Core | |
| Acer Aspire Vero AV15-53P | |
| Eurocom C315 Blitz | |
| Lenovo IdeaPad Gaming 3 15ARH7 | |
| Lenovo IdeaPad 3 15ABA7 | |
| Przeciętny AMD Ryzen 7 5700U (4254 - 7635, n=18) | |
| Ninkear A15 Plus (16+512) | |
| Thinkeagle VigoBook G7 | |
| Lenovo V15 G2 ALC-82KD003XGE | |
| HP 250 G9 7N029ES | |
| Dell Latitude 3520 | |
| ACEMagician Ace AX15, N95 | |
| Lenovo ThinkPad L15 G2-20X4S0KU00 | |
| Geekbench 5.5 / Single-Core | |
| Eurocom C315 Blitz | |
| Acer Aspire Vero AV15-53P | |
| HP 250 G9 7N029ES | |
| Lenovo IdeaPad Gaming 3 15ARH7 | |
| Lenovo IdeaPad 3 15ABA7 | |
| Dell Latitude 3520 | |
| Lenovo ThinkPad L15 G2-20X4S0KU00 | |
| Ninkear A15 Plus (16+512) | |
| Przeciętny AMD Ryzen 7 5700U (1105 - 1205, n=18) | |
| Thinkeagle VigoBook G7 | |
| Lenovo V15 G2 ALC-82KD003XGE | |
| ACEMagician Ace AX15, N95 | |
| HWBOT x265 Benchmark v2.2 / 4k Preset | |
| Lenovo IdeaPad Gaming 3 15ARH7 | |
| Lenovo IdeaPad 3 15ABA7 | |
| Przeciętny AMD Ryzen 7 5700U (6.08 - 12.1, n=19) | |
| Acer Aspire Vero AV15-53P | |
| Ninkear A15 Plus (16+512) | |
| Lenovo V15 G2 ALC-82KD003XGE | |
| Eurocom C315 Blitz | |
| Thinkeagle VigoBook G7 | |
| Dell Latitude 3520 | |
| HP 250 G9 7N029ES | |
| Lenovo ThinkPad L15 G2-20X4S0KU00 | |
| ACEMagician Ace AX15, N95 | |
| LibreOffice / 20 Documents To PDF | |
| ACEMagician Ace AX15, N95 | |
| Thinkeagle VigoBook G7 | |
| Ninkear A15 Plus (16+512) | |
| Lenovo V15 G2 ALC-82KD003XGE | |
| Przeciętny AMD Ryzen 7 5700U (52.4 - 72.5, n=19) | |
| Lenovo IdeaPad Gaming 3 15ARH7 | |
| HP 250 G9 7N029ES | |
| Dell Latitude 3520 | |
| Lenovo ThinkPad L15 G2-20X4S0KU00 | |
| Lenovo IdeaPad 3 15ABA7 | |
| Acer Aspire Vero AV15-53P | |
| Eurocom C315 Blitz | |
| R Benchmark 2.5 / Overall mean | |
| ACEMagician Ace AX15, N95 | |
| Dell Latitude 3520 | |
| Lenovo ThinkPad L15 G2-20X4S0KU00 | |
| Lenovo V15 G2 ALC-82KD003XGE | |
| Thinkeagle VigoBook G7 | |
| Ninkear A15 Plus (16+512) | |
| Przeciętny AMD Ryzen 7 5700U (0.567 - 0.641, n=19) | |
| HP 250 G9 7N029ES | |
| Lenovo IdeaPad 3 15ABA7 | |
| Lenovo IdeaPad Gaming 3 15ARH7 | |
| Acer Aspire Vero AV15-53P | |
| Eurocom C315 Blitz | |
* ... im mniej tym lepiej
AIDA64: FP32 Ray-Trace | FPU Julia | CPU SHA3 | CPU Queen | FPU SinJulia | FPU Mandel | CPU AES | CPU ZLib | FP64 Ray-Trace | CPU PhotoWorxx
| Performance Rating | |
| Ninkear A15 Plus (16+512) | |
| Przeciętny AMD Ryzen 7 5700U | |
| Lenovo IdeaPad 3 15ABA7 | |
| Acer Aspire Vero AV15-53P | |
| Thinkeagle VigoBook G7 | |
| Dell Latitude 3520 | |
| HP 250 G9 7N029ES | |
| AIDA64 / FP32 Ray-Trace | |
| Ninkear A15 Plus (16+512) | |
| Przeciętny AMD Ryzen 7 5700U (5679 - 12346, n=19) | |
| Lenovo IdeaPad 3 15ABA7 | |
| Acer Aspire Vero AV15-53P | |
| Dell Latitude 3520 | |
| Thinkeagle VigoBook G7 | |
| HP 250 G9 7N029ES | |
| AIDA64 / FPU Julia | |
| Lenovo IdeaPad 3 15ABA7 | |
| Przeciętny AMD Ryzen 7 5700U (39042 - 69580, n=19) | |
| Ninkear A15 Plus (16+512) | |
| Thinkeagle VigoBook G7 | |
| Acer Aspire Vero AV15-53P | |
| Dell Latitude 3520 | |
| HP 250 G9 7N029ES | |
| AIDA64 / CPU SHA3 | |
| Lenovo IdeaPad 3 15ABA7 | |
| Ninkear A15 Plus (16+512) | |
| Przeciętny AMD Ryzen 7 5700U (1103 - 2231, n=19) | |
| Acer Aspire Vero AV15-53P | |
| Dell Latitude 3520 | |
| Thinkeagle VigoBook G7 | |
| HP 250 G9 7N029ES | |
| AIDA64 / CPU Queen | |
| Ninkear A15 Plus (16+512) | |
| Przeciętny AMD Ryzen 7 5700U (57016 - 99178, n=19) | |
| Lenovo IdeaPad 3 15ABA7 | |
| Thinkeagle VigoBook G7 | |
| Acer Aspire Vero AV15-53P | |
| Dell Latitude 3520 | |
| HP 250 G9 7N029ES | |
| AIDA64 / FPU SinJulia | |
| Ninkear A15 Plus (16+512) | |
| Przeciętny AMD Ryzen 7 5700U (6837 - 14169, n=19) | |
| Thinkeagle VigoBook G7 | |
| Lenovo IdeaPad 3 15ABA7 | |
| Acer Aspire Vero AV15-53P | |
| Dell Latitude 3520 | |
| HP 250 G9 7N029ES | |
| AIDA64 / FPU Mandel | |
| Lenovo IdeaPad 3 15ABA7 | |
| Przeciętny AMD Ryzen 7 5700U (20179 - 36523, n=19) | |
| Ninkear A15 Plus (16+512) | |
| Acer Aspire Vero AV15-53P | |
| Thinkeagle VigoBook G7 | |
| Dell Latitude 3520 | |
| HP 250 G9 7N029ES | |
| AIDA64 / CPU AES | |
| Lenovo IdeaPad 3 15ABA7 | |
| Dell Latitude 3520 | |
| Ninkear A15 Plus (16+512) | |
| Przeciętny AMD Ryzen 7 5700U (26066 - 64646, n=19) | |
| Acer Aspire Vero AV15-53P | |
| Thinkeagle VigoBook G7 | |
| HP 250 G9 7N029ES | |
| AIDA64 / CPU ZLib | |
| Przeciętny AMD Ryzen 7 5700U (440 - 776, n=19) | |
| Ninkear A15 Plus (16+512) | |
| Lenovo IdeaPad 3 15ABA7 | |
| Acer Aspire Vero AV15-53P | |
| Thinkeagle VigoBook G7 | |
| Dell Latitude 3520 | |
| HP 250 G9 7N029ES | |
| AIDA64 / FP64 Ray-Trace | |
| Ninkear A15 Plus (16+512) | |
| Przeciętny AMD Ryzen 7 5700U (2985 - 6784, n=19) | |
| Lenovo IdeaPad 3 15ABA7 | |
| Acer Aspire Vero AV15-53P | |
| Dell Latitude 3520 | |
| Thinkeagle VigoBook G7 | |
| HP 250 G9 7N029ES | |
| AIDA64 / CPU PhotoWorxx | |
| Acer Aspire Vero AV15-53P | |
| Przeciętny AMD Ryzen 7 5700U (6903 - 25066, n=19) | |
| Lenovo IdeaPad 3 15ABA7 | |
| HP 250 G9 7N029ES | |
| Ninkear A15 Plus (16+512) | |
| Thinkeagle VigoBook G7 | |
| Dell Latitude 3520 | |
Wydajność systemu
CrossMark: Overall | Productivity | Creativity | Responsiveness
WebXPRT 3: Overall
WebXPRT 4: Overall
Mozilla Kraken 1.1: Total
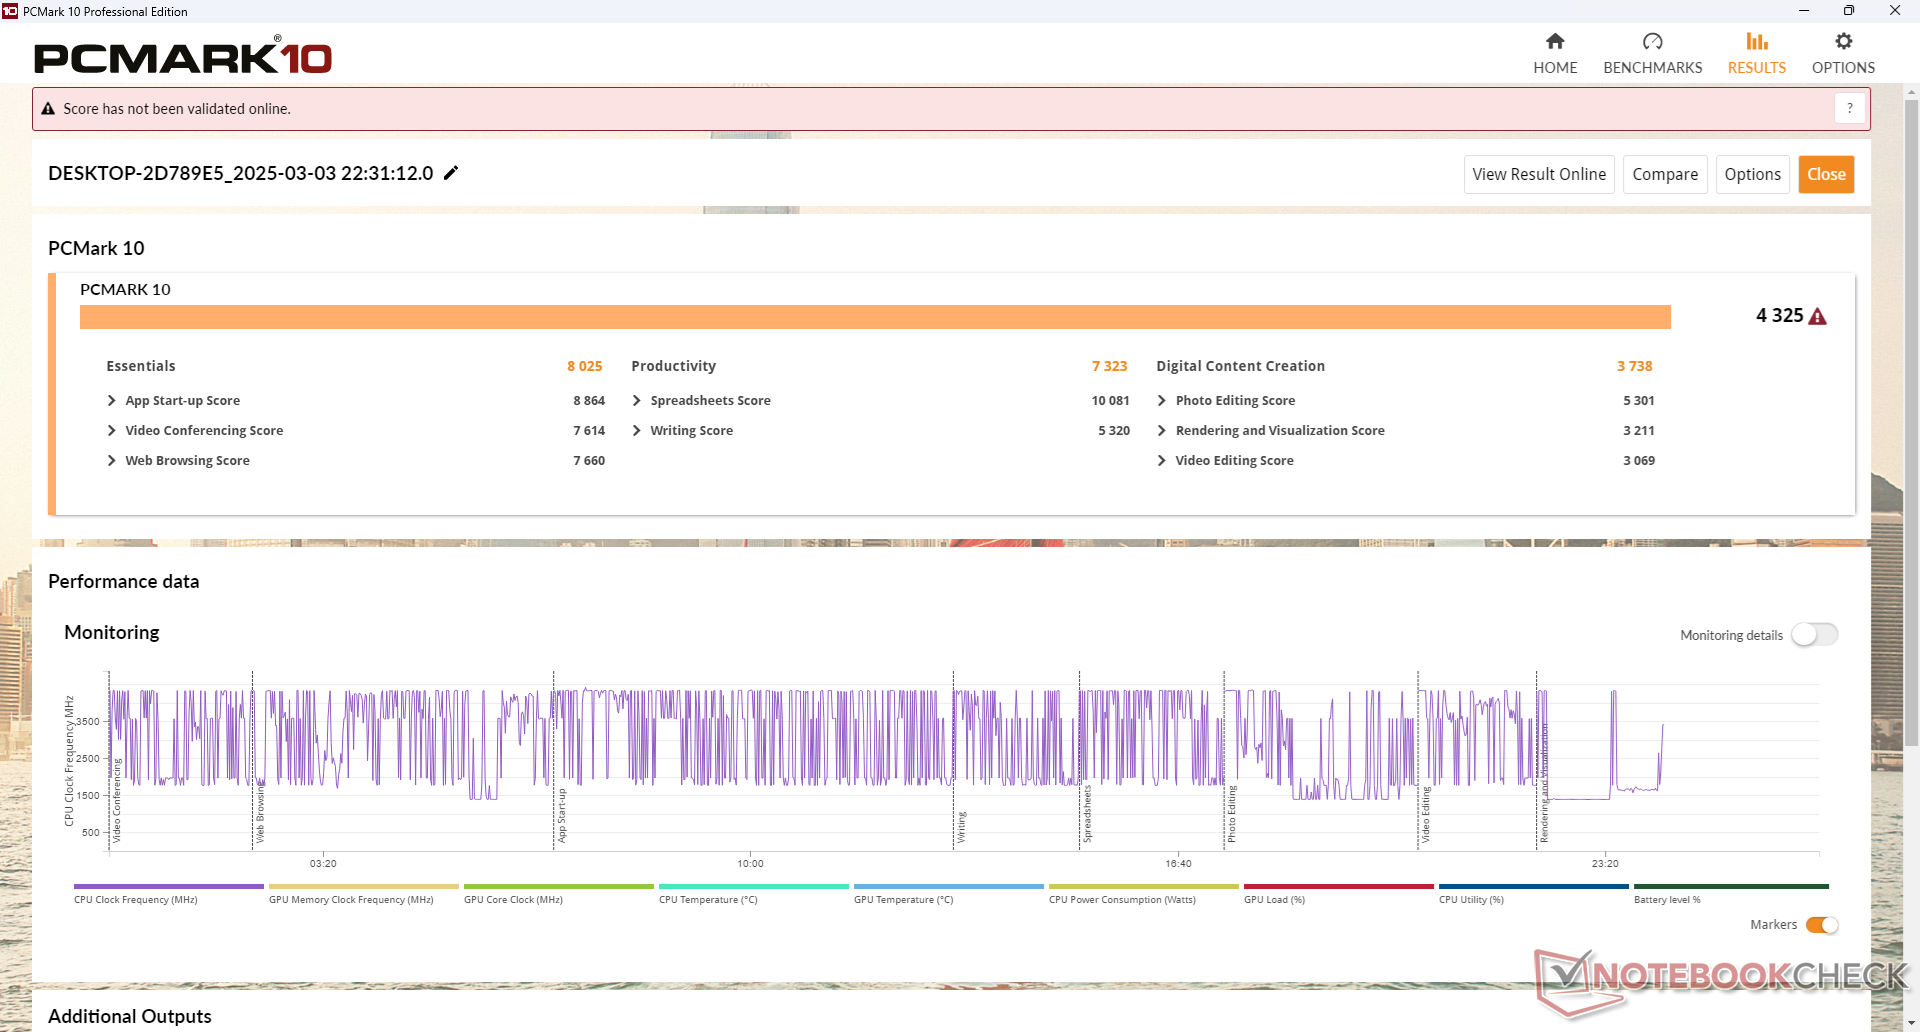
| PCMark 10 / Score | |
| Lenovo IdeaPad 3 15ABA7 | |
| Acer Aspire Vero AV15-53P | |
| Przeciętny AMD Ryzen 7 5700U, AMD Radeon RX Vega 8 (Ryzen 4000/5000) (4325 - 5518, n=14) | |
| Ninkear A15 Plus (16+512) | |
| HP 250 G9 7N029ES | |
| Dell Latitude 3520 | |
| Thinkeagle VigoBook G7 | |
| PCMark 10 / Essentials | |
| Acer Aspire Vero AV15-53P | |
| Lenovo IdeaPad 3 15ABA7 | |
| HP 250 G9 7N029ES | |
| Przeciętny AMD Ryzen 7 5700U, AMD Radeon RX Vega 8 (Ryzen 4000/5000) (8025 - 10091, n=14) | |
| Dell Latitude 3520 | |
| Ninkear A15 Plus (16+512) | |
| Thinkeagle VigoBook G7 | |
| PCMark 10 / Productivity | |
| Lenovo IdeaPad 3 15ABA7 | |
| Przeciętny AMD Ryzen 7 5700U, AMD Radeon RX Vega 8 (Ryzen 4000/5000) (7001 - 8457, n=14) | |
| Acer Aspire Vero AV15-53P | |
| Ninkear A15 Plus (16+512) | |
| Thinkeagle VigoBook G7 | |
| HP 250 G9 7N029ES | |
| Dell Latitude 3520 | |
| PCMark 10 / Digital Content Creation | |
| Acer Aspire Vero AV15-53P | |
| Lenovo IdeaPad 3 15ABA7 | |
| Przeciętny AMD Ryzen 7 5700U, AMD Radeon RX Vega 8 (Ryzen 4000/5000) (3738 - 5964, n=14) | |
| Ninkear A15 Plus (16+512) | |
| Dell Latitude 3520 | |
| HP 250 G9 7N029ES | |
| Thinkeagle VigoBook G7 | |
| CrossMark / Overall | |
| Acer Aspire Vero AV15-53P | |
| Lenovo IdeaPad 3 15ABA7 | |
| HP 250 G9 7N029ES | |
| Dell Latitude 3520 | |
| Ninkear A15 Plus (16+512) | |
| Przeciętny AMD Ryzen 7 5700U, AMD Radeon RX Vega 8 (Ryzen 4000/5000) (866 - 1183, n=7) | |
| Thinkeagle VigoBook G7 | |
| CrossMark / Productivity | |
| Acer Aspire Vero AV15-53P | |
| Lenovo IdeaPad 3 15ABA7 | |
| HP 250 G9 7N029ES | |
| Dell Latitude 3520 | |
| Ninkear A15 Plus (16+512) | |
| Przeciętny AMD Ryzen 7 5700U, AMD Radeon RX Vega 8 (Ryzen 4000/5000) (931 - 1191, n=7) | |
| Thinkeagle VigoBook G7 | |
| CrossMark / Creativity | |
| Acer Aspire Vero AV15-53P | |
| Lenovo IdeaPad 3 15ABA7 | |
| HP 250 G9 7N029ES | |
| Ninkear A15 Plus (16+512) | |
| Przeciętny AMD Ryzen 7 5700U, AMD Radeon RX Vega 8 (Ryzen 4000/5000) (907 - 1197, n=7) | |
| Dell Latitude 3520 | |
| Thinkeagle VigoBook G7 | |
| CrossMark / Responsiveness | |
| Acer Aspire Vero AV15-53P | |
| Dell Latitude 3520 | |
| Lenovo IdeaPad 3 15ABA7 | |
| HP 250 G9 7N029ES | |
| Ninkear A15 Plus (16+512) | |
| Przeciętny AMD Ryzen 7 5700U, AMD Radeon RX Vega 8 (Ryzen 4000/5000) (605 - 1159, n=7) | |
| Thinkeagle VigoBook G7 | |
| WebXPRT 3 / Overall | |
| HP 250 G9 7N029ES | |
| Acer Aspire Vero AV15-53P | |
| Lenovo IdeaPad 3 15ABA7 | |
| Dell Latitude 3520 | |
| Przeciętny AMD Ryzen 7 5700U, AMD Radeon RX Vega 8 (Ryzen 4000/5000) (197.4 - 222, n=13) | |
| Thinkeagle VigoBook G7 | |
| WebXPRT 4 / Overall | |
| HP 250 G9 7N029ES | |
| Acer Aspire Vero AV15-53P | |
| Ninkear A15 Plus (16+512) | |
| Lenovo IdeaPad 3 15ABA7 | |
| Przeciętny AMD Ryzen 7 5700U, AMD Radeon RX Vega 8 (Ryzen 4000/5000) (158.5 - 225, n=4) | |
| Dell Latitude 3520 | |
| Thinkeagle VigoBook G7 | |
| Mozilla Kraken 1.1 / Total | |
| Thinkeagle VigoBook G7 | |
| Przeciętny AMD Ryzen 7 5700U, AMD Radeon RX Vega 8 (Ryzen 4000/5000) (791 - 835, n=14) | |
| Dell Latitude 3520 | |
| Lenovo IdeaPad 3 15ABA7 | |
| HP 250 G9 7N029ES | |
| Acer Aspire Vero AV15-53P | |
* ... im mniej tym lepiej
| PCMark 10 Score | 4325 pkt. | |
Pomoc | ||
| AIDA64 / Memory Copy | |
| Acer Aspire Vero AV15-53P | |
| Lenovo IdeaPad 3 15ABA7 | |
| Przeciętny AMD Ryzen 7 5700U (15867 - 39326, n=19) | |
| HP 250 G9 7N029ES | |
| Ninkear A15 Plus (16+512) | |
| Thinkeagle VigoBook G7 | |
| Dell Latitude 3520 | |
| AIDA64 / Memory Read | |
| Acer Aspire Vero AV15-53P | |
| Przeciętny AMD Ryzen 7 5700U (17632 - 47190, n=19) | |
| Lenovo IdeaPad 3 15ABA7 | |
| Ninkear A15 Plus (16+512) | |
| Thinkeagle VigoBook G7 | |
| HP 250 G9 7N029ES | |
| Dell Latitude 3520 | |
| AIDA64 / Memory Write | |
| Acer Aspire Vero AV15-53P | |
| Przeciętny AMD Ryzen 7 5700U (11554 - 47048, n=19) | |
| Lenovo IdeaPad 3 15ABA7 | |
| Ninkear A15 Plus (16+512) | |
| Thinkeagle VigoBook G7 | |
| HP 250 G9 7N029ES | |
| Dell Latitude 3520 | |
| AIDA64 / Memory Latency | |
| Acer Aspire Vero AV15-53P | |
| Lenovo IdeaPad 3 15ABA7 | |
| Przeciętny AMD Ryzen 7 5700U (84.9 - 113, n=19) | |
| Thinkeagle VigoBook G7 | |
| Ninkear A15 Plus (16+512) | |
| Dell Latitude 3520 | |
| HP 250 G9 7N029ES | |
* ... im mniej tym lepiej
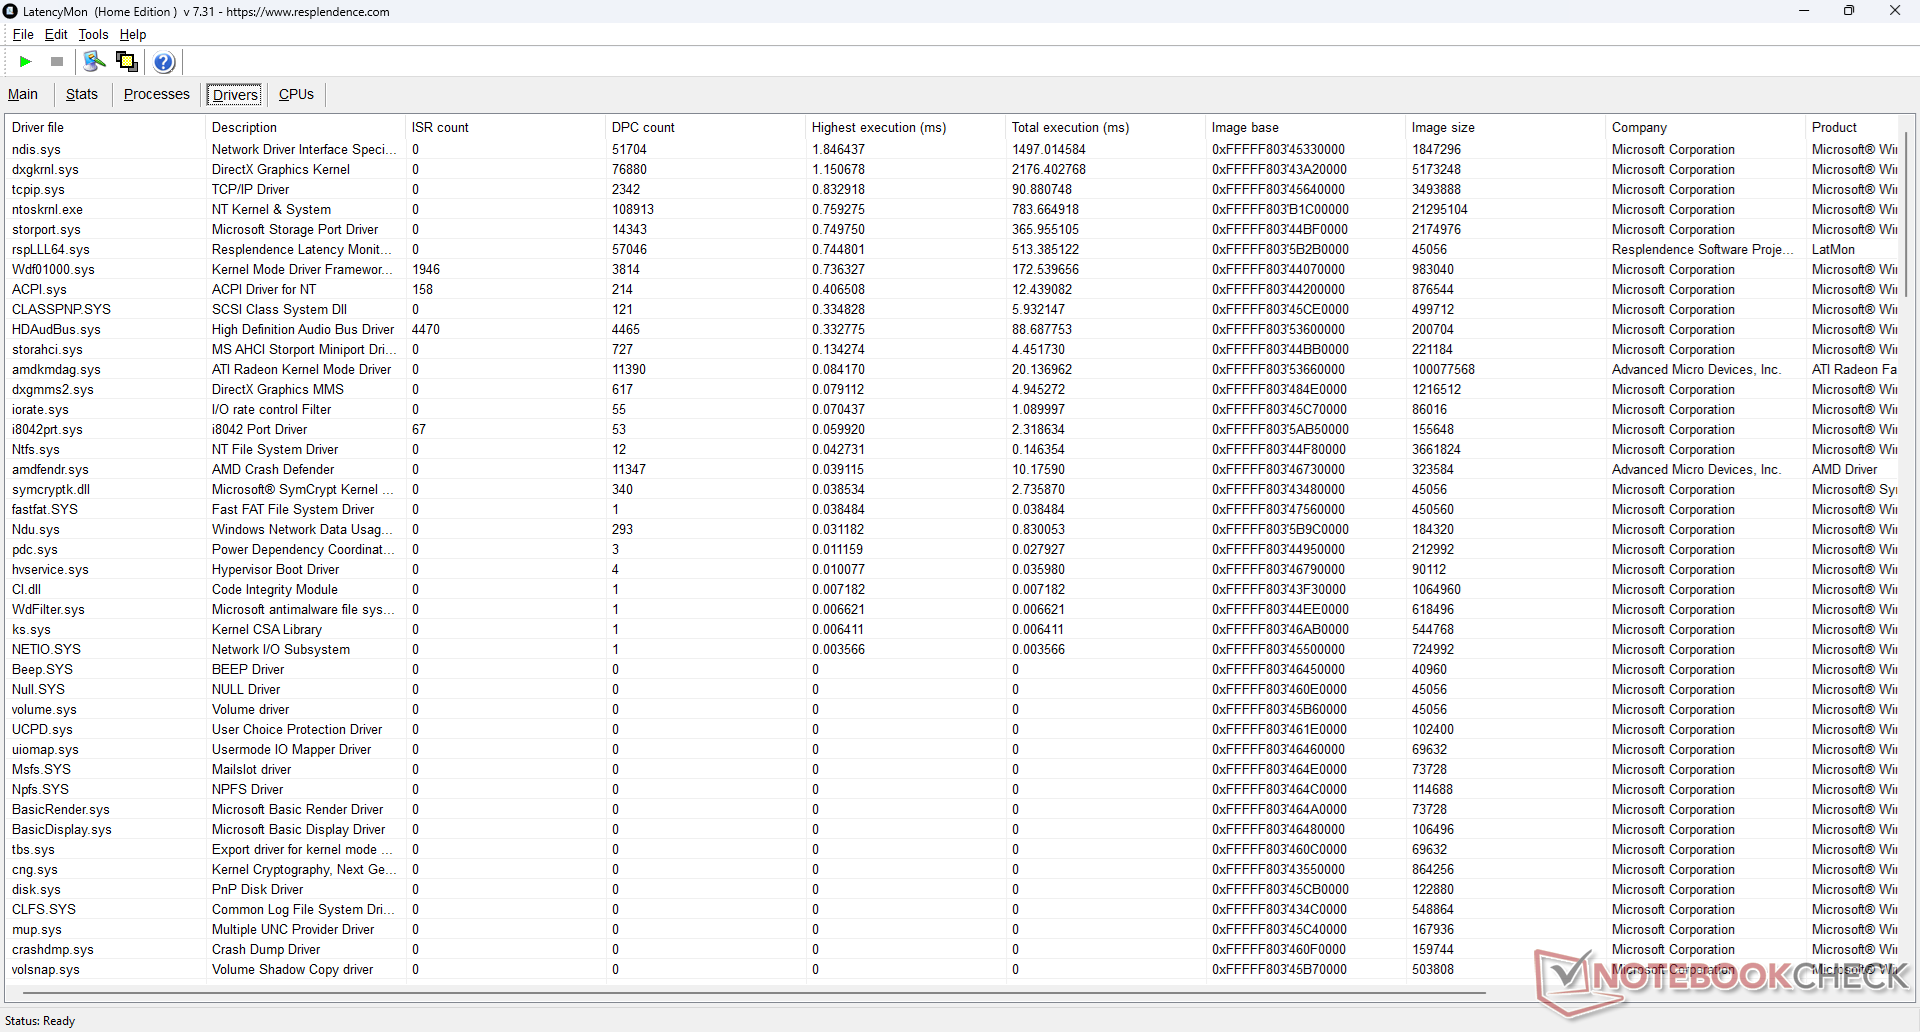
Opóźnienie DPC
LatencyMon ujawnia zarówno problemy z DPC, jak i spadki klatek podczas odtwarzania wideo 4K60, nawet po wielokrotnych testach.
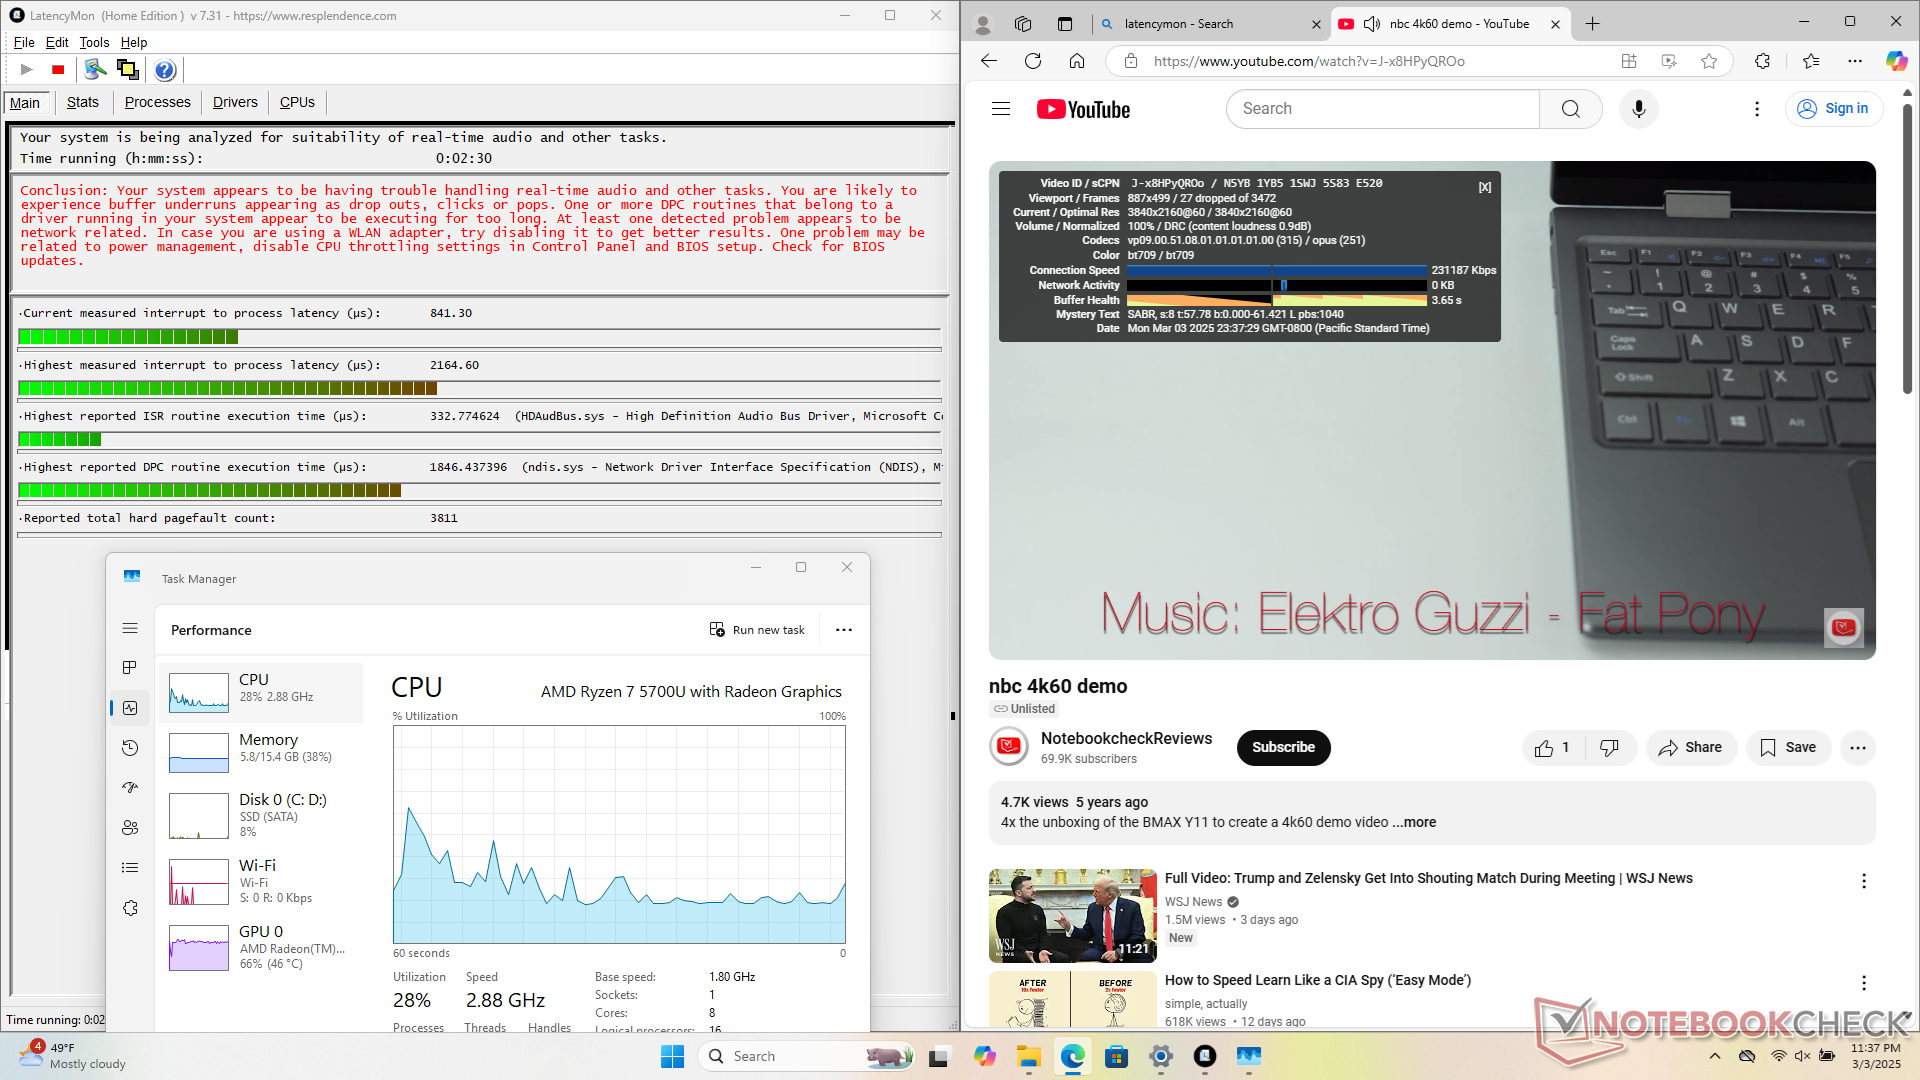
| DPC Latencies / LatencyMon - interrupt to process latency (max), Web, Youtube, Prime95 | |
| Ninkear A15 Plus (16+512) | |
| Thinkeagle VigoBook G7 | |
| HP 250 G9 7N029ES | |
| Dell Latitude 3520 | |
| Lenovo IdeaPad 3 15ABA7 | |
| Acer Aspire Vero AV15-53P | |
* ... im mniej tym lepiej
Urządzenia pamięci masowej
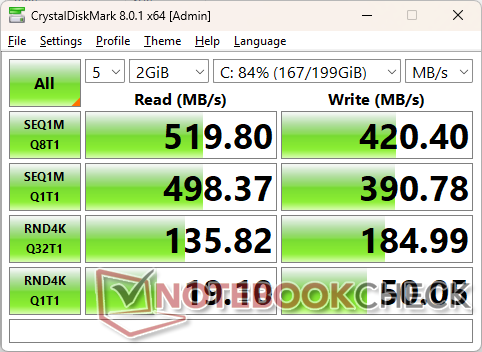
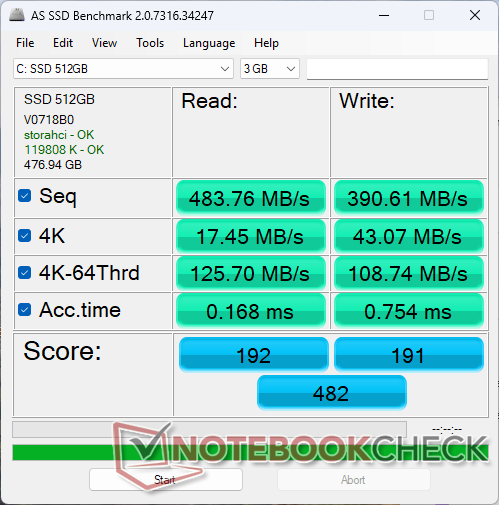
System jest dostarczany z dyskiem SSD SATA III M.2 zamiast zwykłego dysku PCIe4, aby obniżyć koszty.

| Drive Performance Rating - Percent | |
| Acer Aspire Vero AV15-53P | |
| Ninkear A15 Plus (16+512) | |
| Lenovo IdeaPad 3 15ABA7 | |
| Dell Latitude 3520 | |
| HP 250 G9 7N029ES | |
| Thinkeagle VigoBook G7 | |
* ... im mniej tym lepiej
Disk Throttling: DiskSpd Read Loop, Queue Depth 8
Wydajność GPU
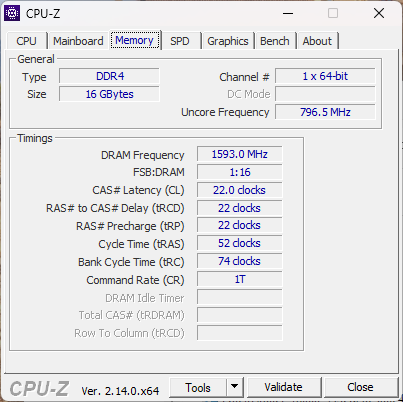
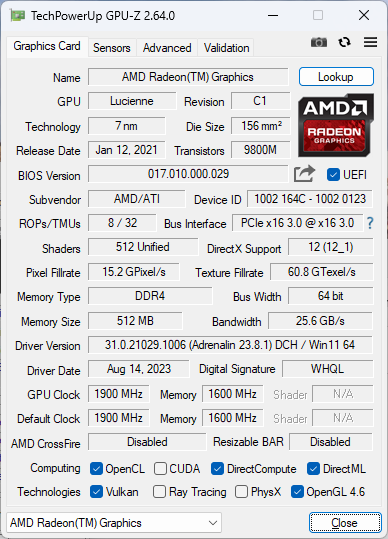
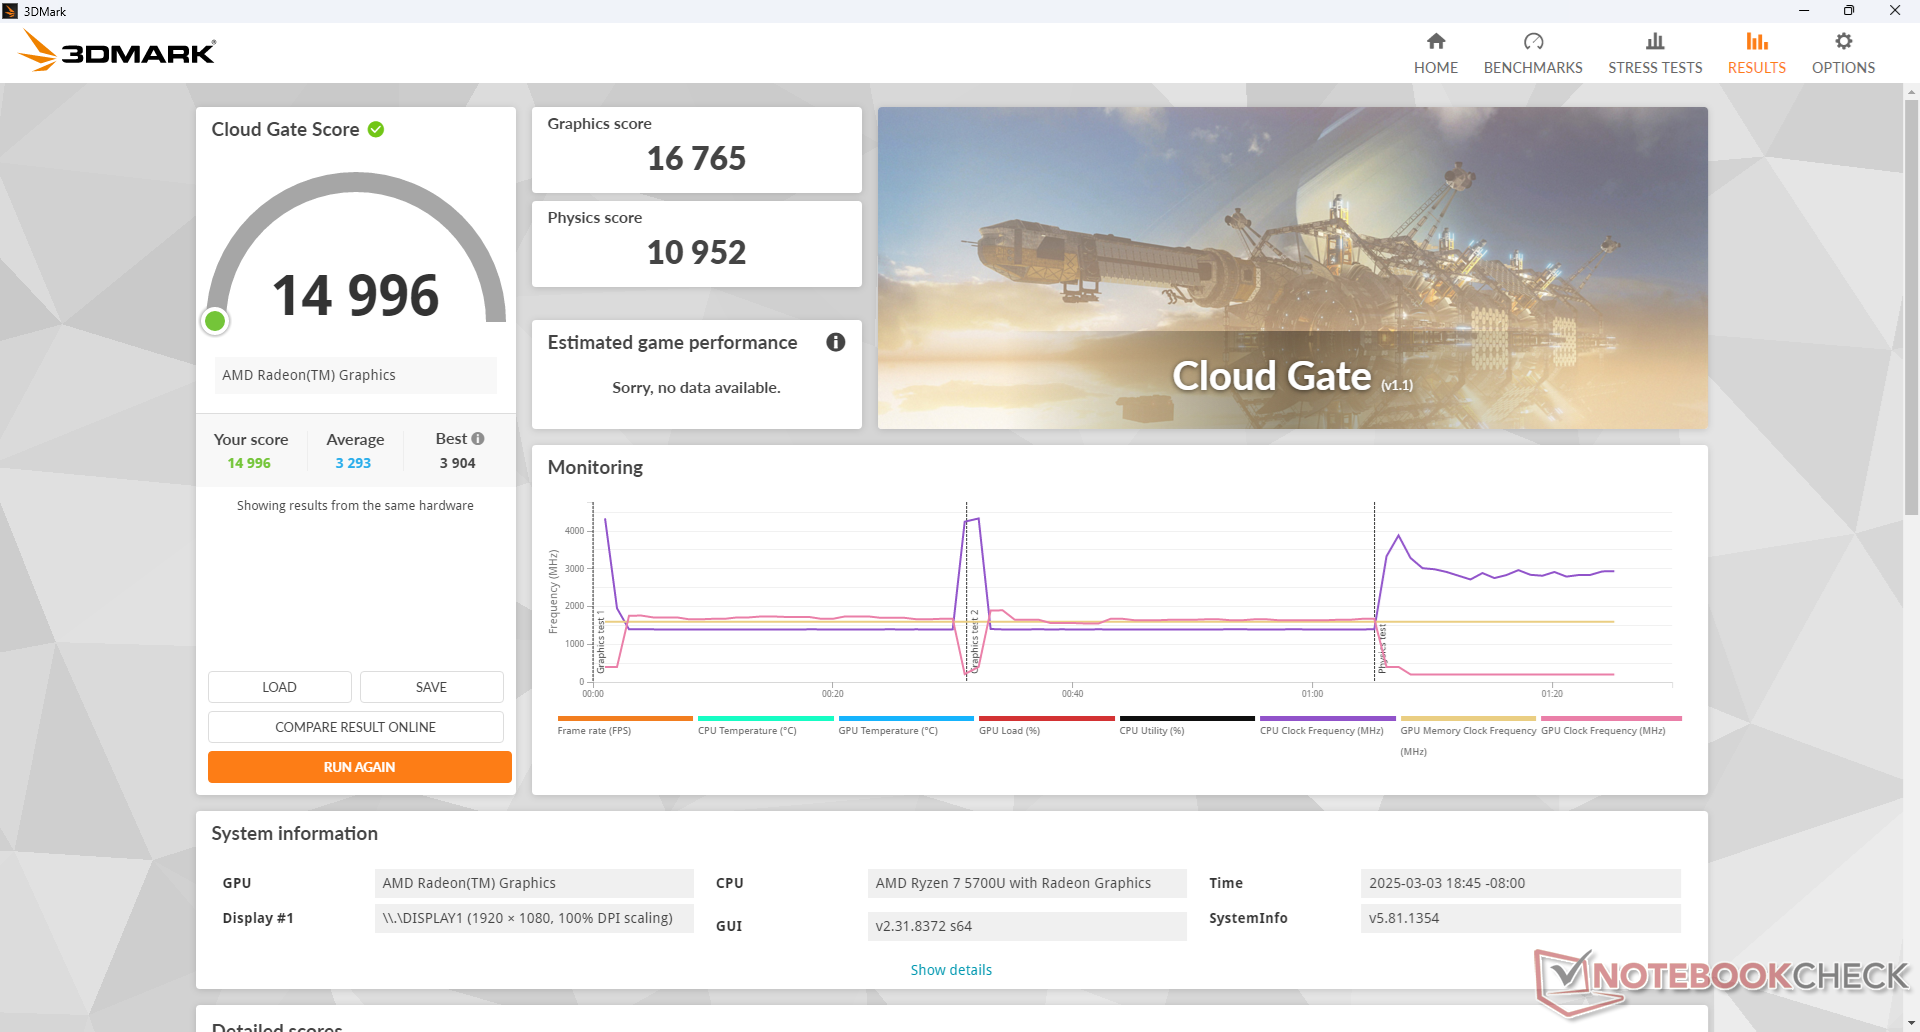
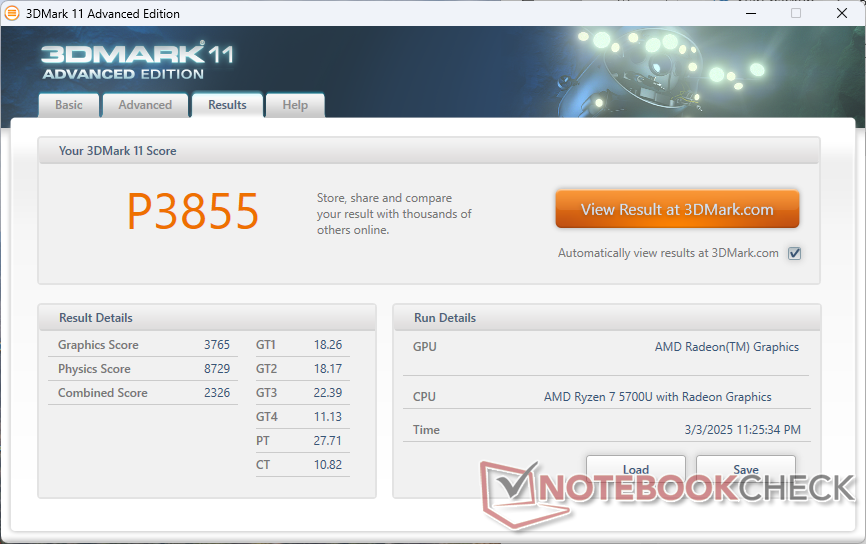
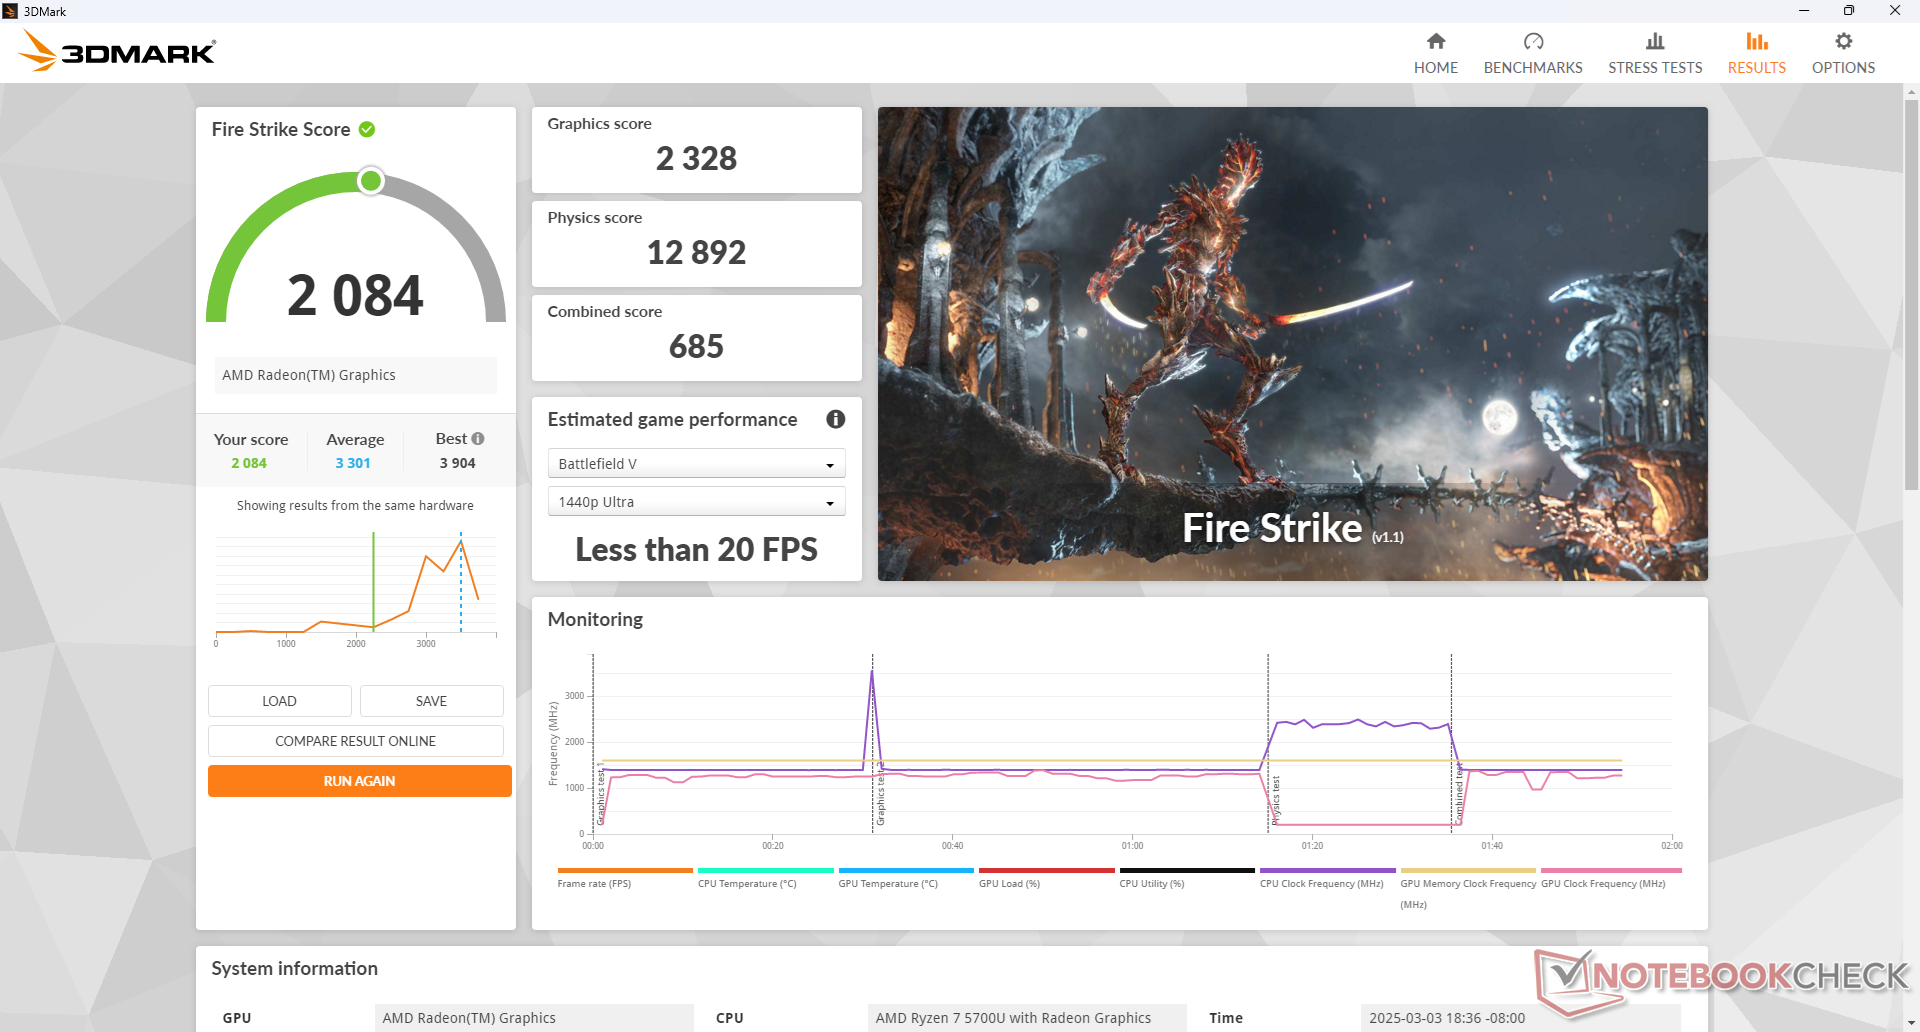
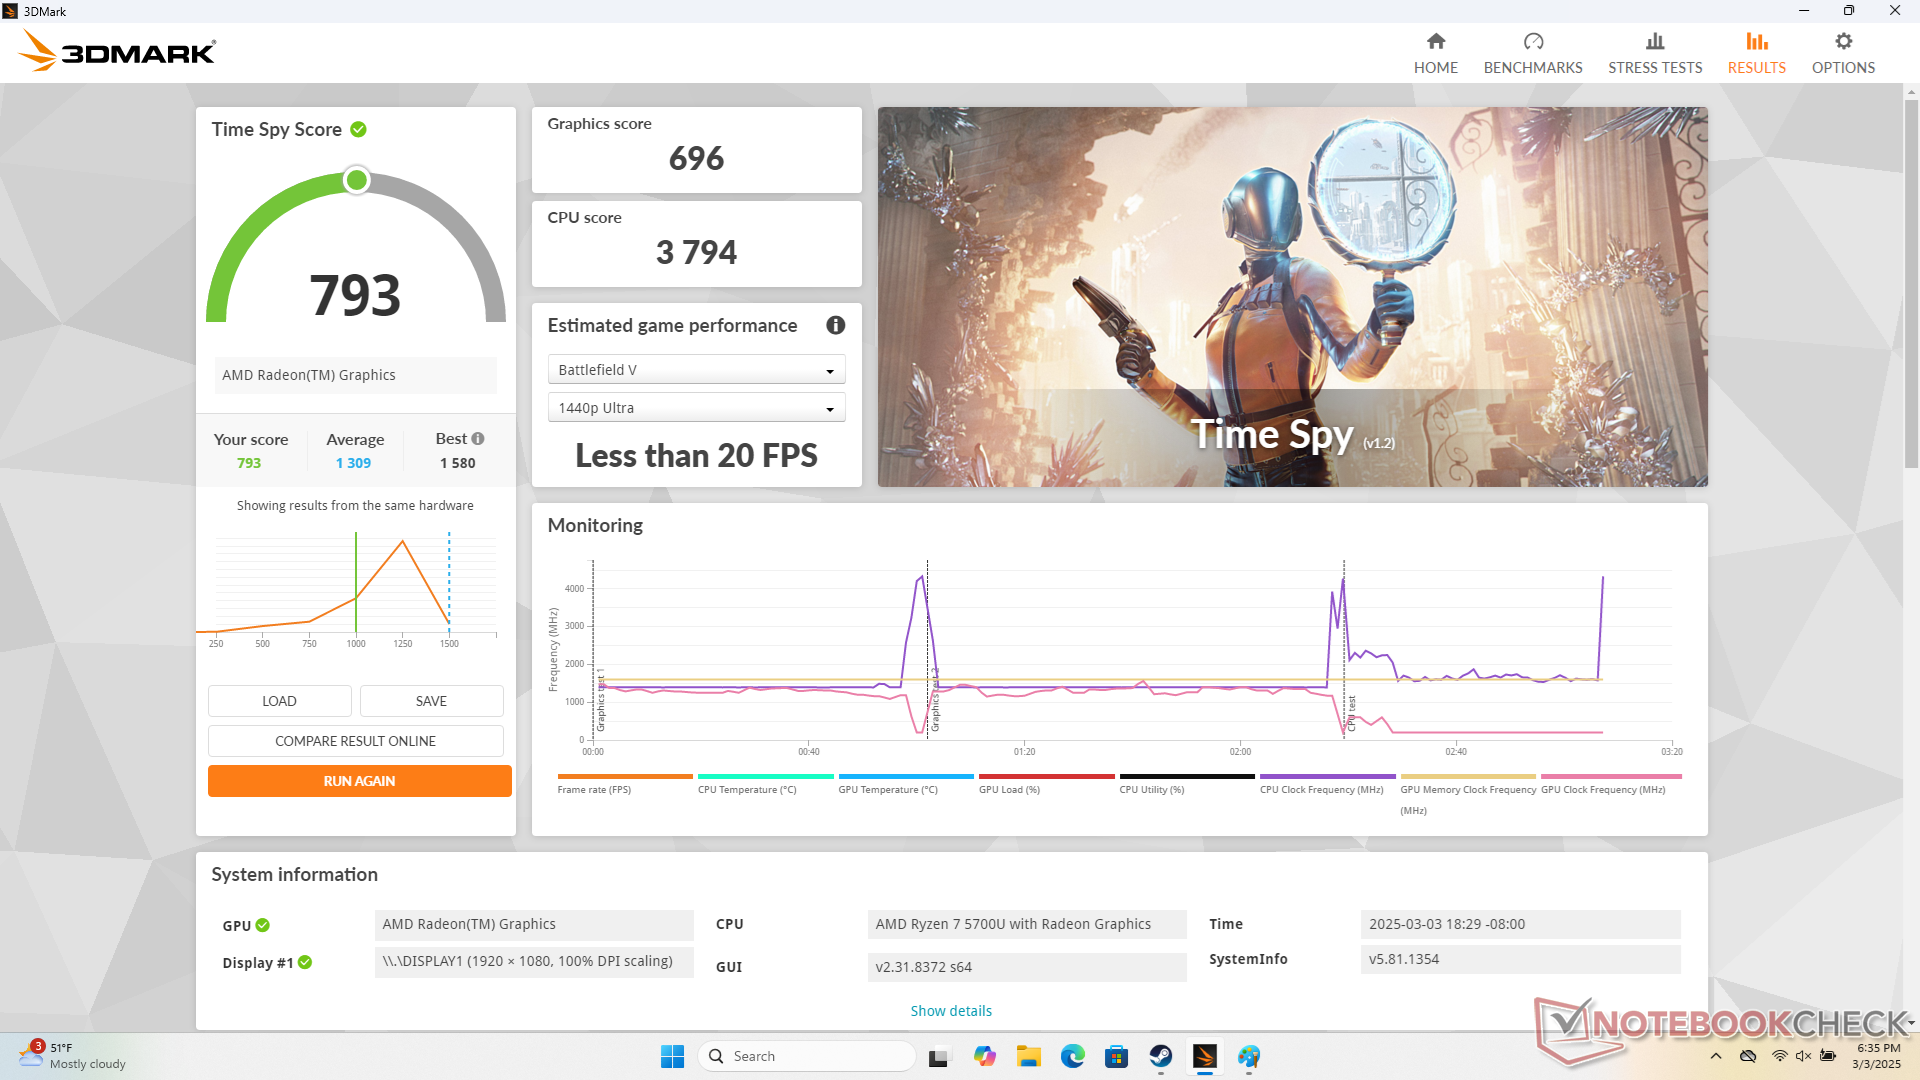
Wydajność graficzna jest o około 35 procent wolniejsza niż w przypadku przeciętnego laptopa w naszej bazie danych z tym samym zintegrowanym GPU Radeon RX Vega 8. Wynika to z wolniejszej niż przeciętna wydajności procesora wspomnianej powyżej oraz jednokanałowej konfiguracji pamięci RAM naszej jednostki testowej.
| 3DMark Performance Rating - Percent | |
| Lenovo IdeaPad Gaming 3 15ARH7 | |
| Acer Aspire Vero AV15-53P | |
| Przeciętny AMD Radeon RX Vega 8 (Ryzen 4000/5000) | |
| Eurocom C315 Blitz | |
| Lenovo IdeaPad 3 15ABA7 | |
| Lenovo V15 G2 ALC-82KD003XGE | |
| Ninkear A15 Plus (16+512) | |
| HP 250 G9 7N029ES -1! | |
| Thinkeagle VigoBook G7 | |
| Dell Latitude 3520 | |
| Lenovo ThinkPad L15 G2-20X4S0KU00 | |
| ACEMagician Ace AX15, N95 | |
| 3DMark 11 - 1280x720 Performance GPU | |
| Lenovo IdeaPad Gaming 3 15ARH7 | |
| Acer Aspire Vero AV15-53P | |
| Przeciętny AMD Radeon RX Vega 8 (Ryzen 4000/5000) (3459 - 7591, n=56) | |
| Lenovo IdeaPad 3 15ABA7 | |
| Eurocom C315 Blitz | |
| Lenovo V15 G2 ALC-82KD003XGE | |
| Ninkear A15 Plus (16+512) | |
| HP 250 G9 7N029ES | |
| Dell Latitude 3520 | |
| Thinkeagle VigoBook G7 | |
| Lenovo ThinkPad L15 G2-20X4S0KU00 | |
| ACEMagician Ace AX15, N95 | |
| 3DMark 11 Performance | 3855 pkt. | |
| 3DMark Cloud Gate Standard Score | 14996 pkt. | |
| 3DMark Fire Strike Score | 2084 pkt. | |
| 3DMark Time Spy Score | 793 pkt. | |
Pomoc | ||
* ... im mniej tym lepiej
| Tiny Tina's Wonderlands | |
| 1280x720 Lowest Preset (DX12) | |
| Przeciętny AMD Radeon RX Vega 8 (Ryzen 4000/5000) (30.7 - 82.2, n=8) | |
| Eurocom C315 Blitz | |
| Thinkeagle VigoBook G7 | |
| 1920x1080 Low Preset (DX12) | |
| Przeciętny AMD Radeon RX Vega 8 (Ryzen 4000/5000) (16 - 38.4, n=8) | |
| Thinkeagle VigoBook G7 | |
| 1920x1080 Medium Preset (DX12) | |
| Przeciętny AMD Radeon RX Vega 8 (Ryzen 4000/5000) (12.1 - 29.1, n=8) | |
| Thinkeagle VigoBook G7 | |
| 1920x1080 High Preset (DX12) | |
| Przeciętny AMD Radeon RX Vega 8 (Ryzen 4000/5000) (7.7 - 18.6, n=8) | |
| Thinkeagle VigoBook G7 | |
| 1920x1080 Badass Preset (DX12) | |
| Przeciętny AMD Radeon RX Vega 8 (Ryzen 4000/5000) (5.5 - 15, n=8) | |
| Thinkeagle VigoBook G7 | |
| F1 22 | |
| 1280x720 Ultra Low Preset AA:T AF:16x | |
| Eurocom C315 Blitz | |
| Lenovo IdeaPad 3 15ABA7 | |
| Przeciętny AMD Radeon RX Vega 8 (Ryzen 4000/5000) (40.8 - 89.3, n=8) | |
| Thinkeagle VigoBook G7 | |
| 1920x1080 Low Preset AA:T AF:16x | |
| Eurocom C315 Blitz | |
| Przeciętny AMD Radeon RX Vega 8 (Ryzen 4000/5000) (22.1 - 48.8, n=12) | |
| Lenovo IdeaPad 3 15ABA7 | |
| Thinkeagle VigoBook G7 | |
| 1920x1080 Medium Preset AA:T AF:16x | |
| Eurocom C315 Blitz | |
| Przeciętny AMD Radeon RX Vega 8 (Ryzen 4000/5000) (19.7 - 42.4, n=13) | |
| Lenovo IdeaPad 3 15ABA7 | |
| Thinkeagle VigoBook G7 | |
| 1920x1080 High Preset AA:T AF:16x | |
| Eurocom C315 Blitz | |
| Lenovo IdeaPad 3 15ABA7 | |
| Przeciętny AMD Radeon RX Vega 8 (Ryzen 4000/5000) (15.1 - 31.2, n=11) | |
| Thinkeagle VigoBook G7 | |
| 1920x1080 Ultra High Preset AA:T AF:16x | |
| Eurocom C315 Blitz | |
| Przeciętny AMD Radeon RX Vega 8 (Ryzen 4000/5000) (11 - 22.5, n=8) | |
| Lenovo IdeaPad 3 15ABA7 | |
| Thinkeagle VigoBook G7 | |
Cyberpunk 2077 ultra FPS Chart
| low | med. | high | ultra | |
|---|---|---|---|---|
| Dota 2 Reborn (2015) | 77.2 | 56.8 | 32.2 | 30.3 |
| Final Fantasy XV Benchmark (2018) | 21.4 | 11.4 | 7.61 | |
| X-Plane 11.11 (2018) | 25.3 | 18.7 | 16.9 | |
| Strange Brigade (2018) | 45 | 18.5 | 15.7 | 13.3 |
| Tiny Tina's Wonderlands (2022) | 16 | 12.1 | 7.7 | 5.5 |
| F1 22 (2022) | 22.1 | 19.7 | 15.1 | 11 |
| Cyberpunk 2077 2.2 Phantom Liberty (2023) |
Emisje
Hałas systemowy
Hałas wentylatora jest bardzo cichy i wynosi nieco poniżej 30 dB(A) nawet przy bardzo wymagających obciążeniach, w porównaniu do 40 dB(A) lub więcej w przypadku większości innych laptopów.
Hałas
| luz |
| 22.9 / 22.9 / 26 dB |
| obciążenie |
| 27.3 / 29.4 dB |
 | ||
30 dB cichy 40 dB(A) słyszalny 50 dB(A) irytujący |
||
min: | ||
| Thinkeagle VigoBook G7 Vega 8, R7 5700U | Ninkear A15 Plus (16+512) Vega 8, R7 5700U, GOFATOO P110E-512GB | Acer Aspire Vero AV15-53P Iris Xe G7 96EUs, i7-1355U, Kingston OM8SEP4512Q-AA | HP 250 G9 7N029ES UHD Graphics 64EUs, i3-1215U, SK hynix HFS512GEJ9X125N | Lenovo IdeaPad 3 15ABA7 Vega 7, R5 5625U, Micron 2450 512GB MTFDKCD512TFK | Dell Latitude 3520 Iris Xe G7 80EUs, i5-1135G7, Kioxia BG5 KBG50ZNS256G | |
|---|---|---|---|---|---|---|
| Noise | -14% | -21% | -25% | -29% | -16% | |
| wyłączone / środowisko * | 22.7 | 24.78 -9% | 25.89 -14% | 24.3 -7% | 26 -15% | 26 -15% |
| Idle Minimum * | 22.9 | 24.78 -8% | 26.68 -17% | 24.3 -6% | 26 -14% | 26 -14% |
| Idle Average * | 22.9 | 27.6 -21% | 26.04 -14% | 24.3 -6% | 26 -14% | 26 -14% |
| Idle Maximum * | 26 | 26.5 -2% | 26.05 -0% | 28.2 -8% | 26 -0% | 26 -0% |
| Load Average * | 27.3 | 34.38 -26% | 39.23 -44% | 45.2 -66% | 46 -68% | 31.1 -14% |
| Cyberpunk 2077 ultra * | 26.6 | |||||
| Load Maximum * | 29.4 | 34.58 -18% | 40.25 -37% | 45.2 -54% | 47.9 -63% | 41.5 -41% |
| Witcher 3 ultra * | 45.2 |
* ... im mniej tym lepiej
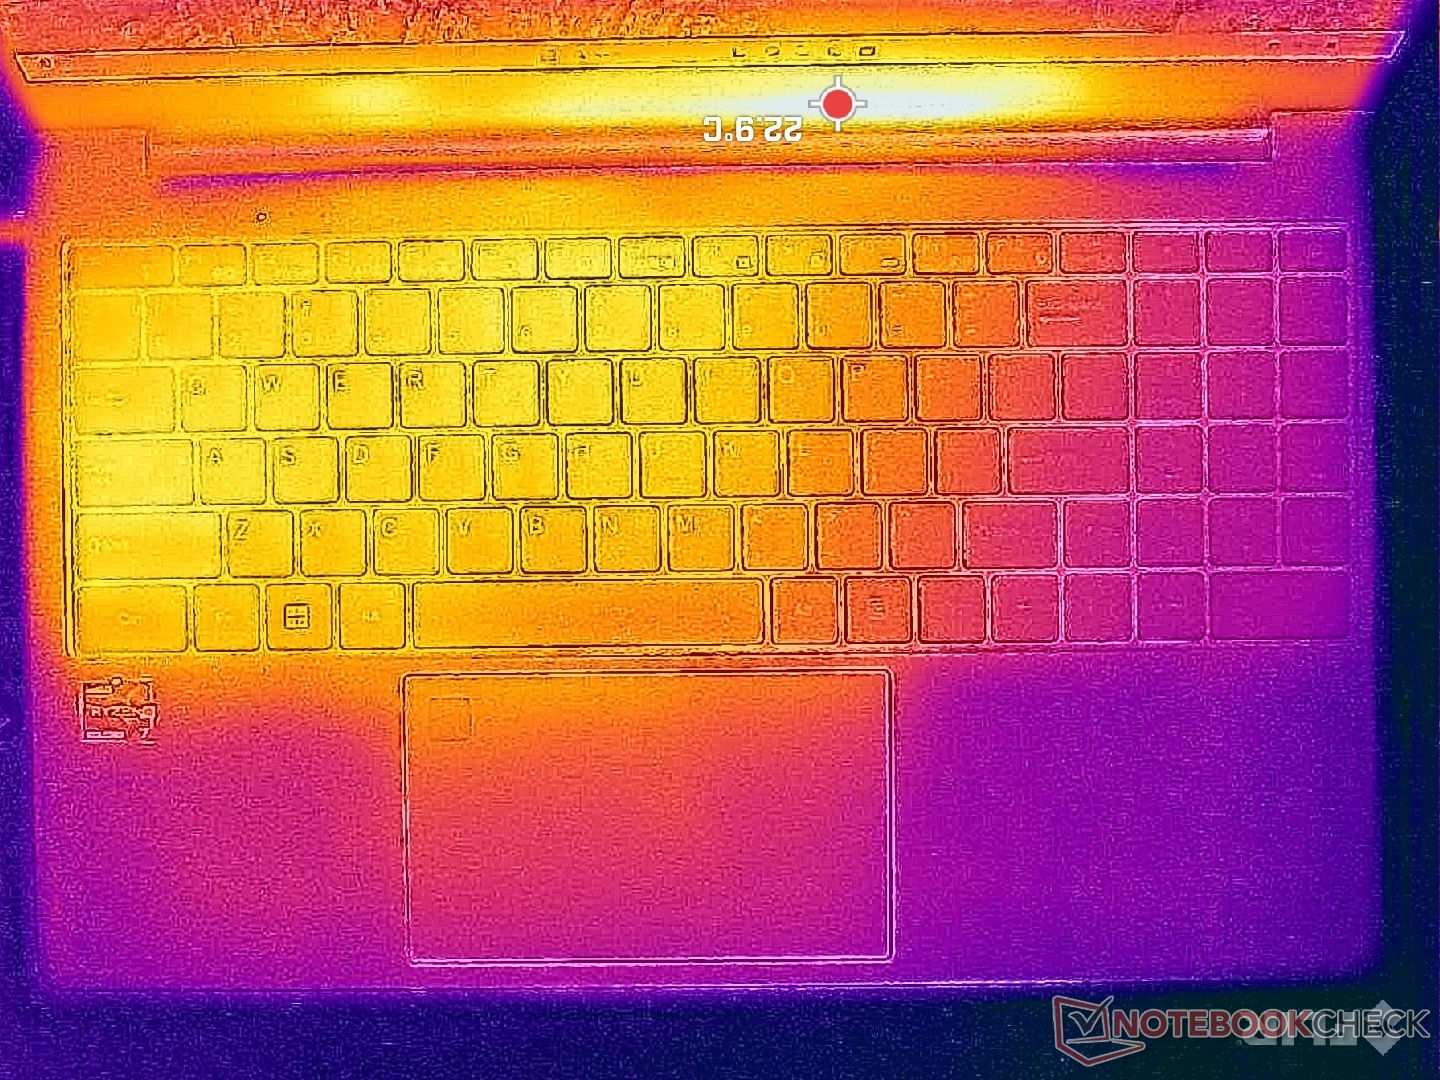
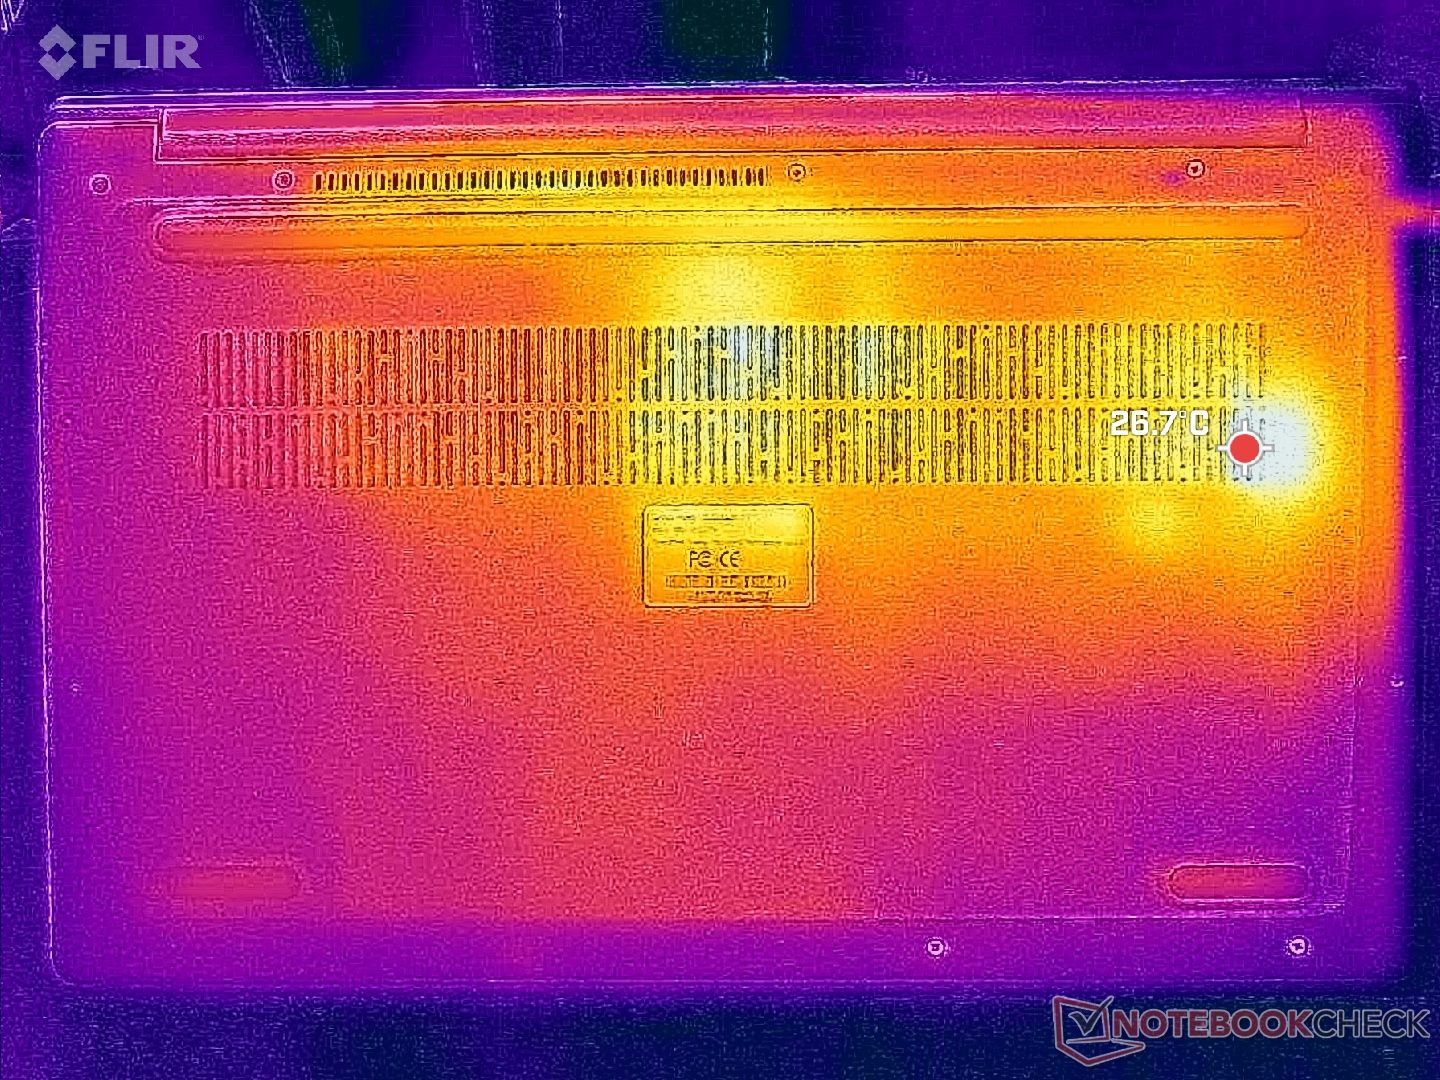
Temperatura
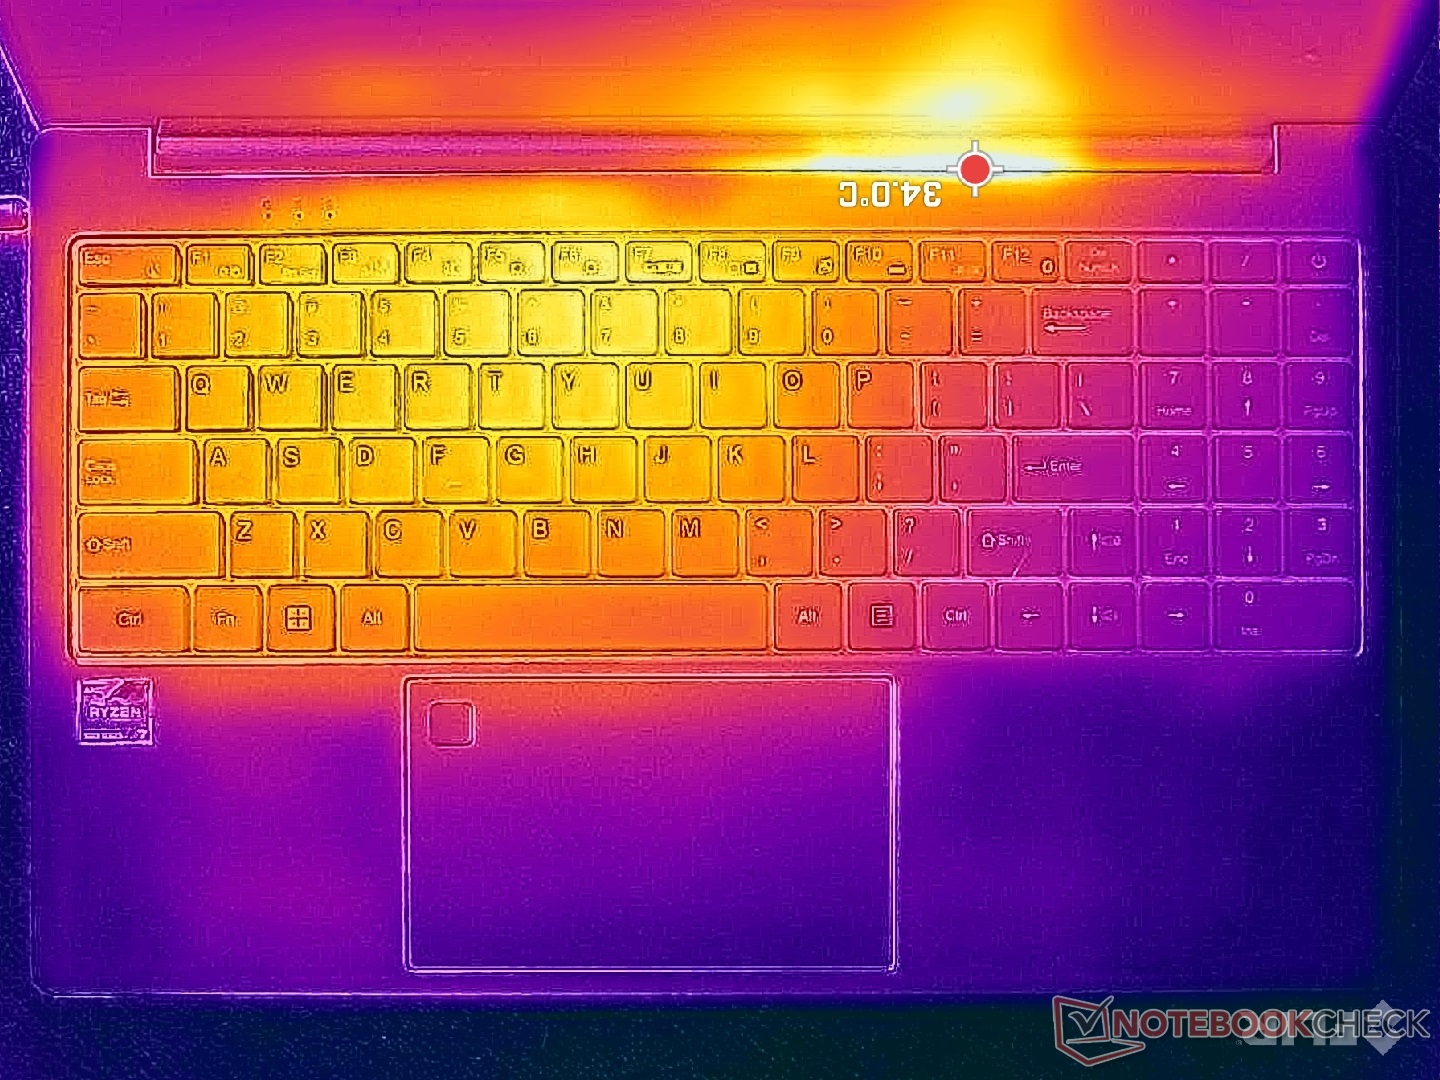
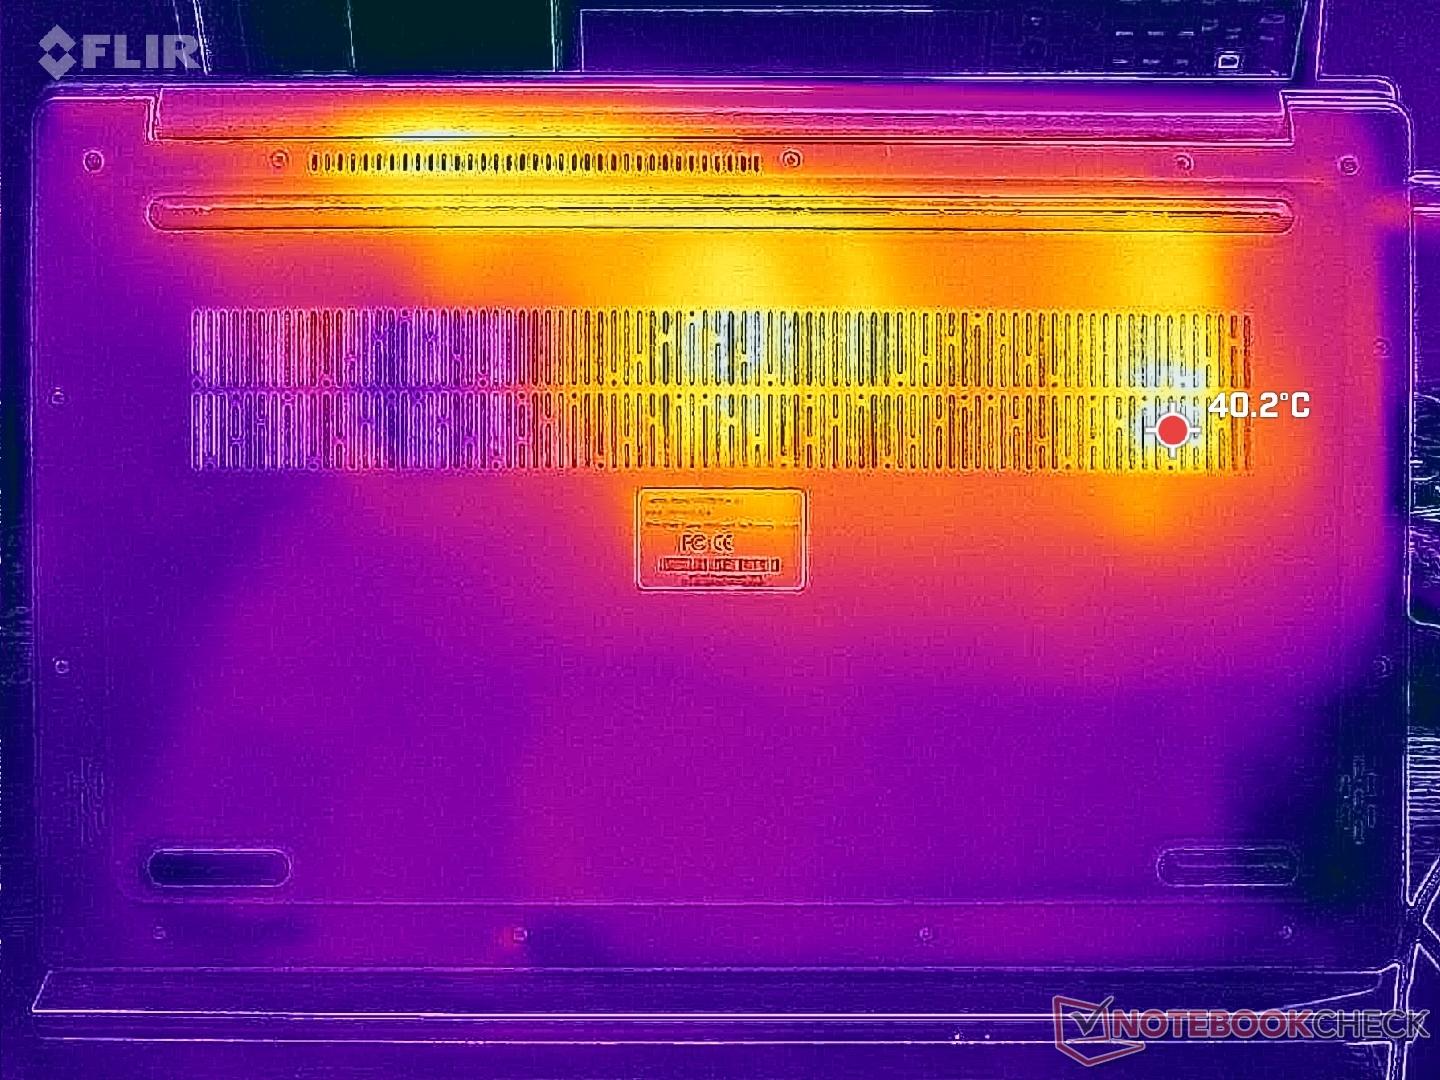
Temperatury powierzchni są wyższe na lewej połowie obudowy niż na prawej. Gorące punkty są poza tym tolerowane na poziomie od 32 C do 37 C podczas uruchamiania wymagających obciążeń, takich jak gry.
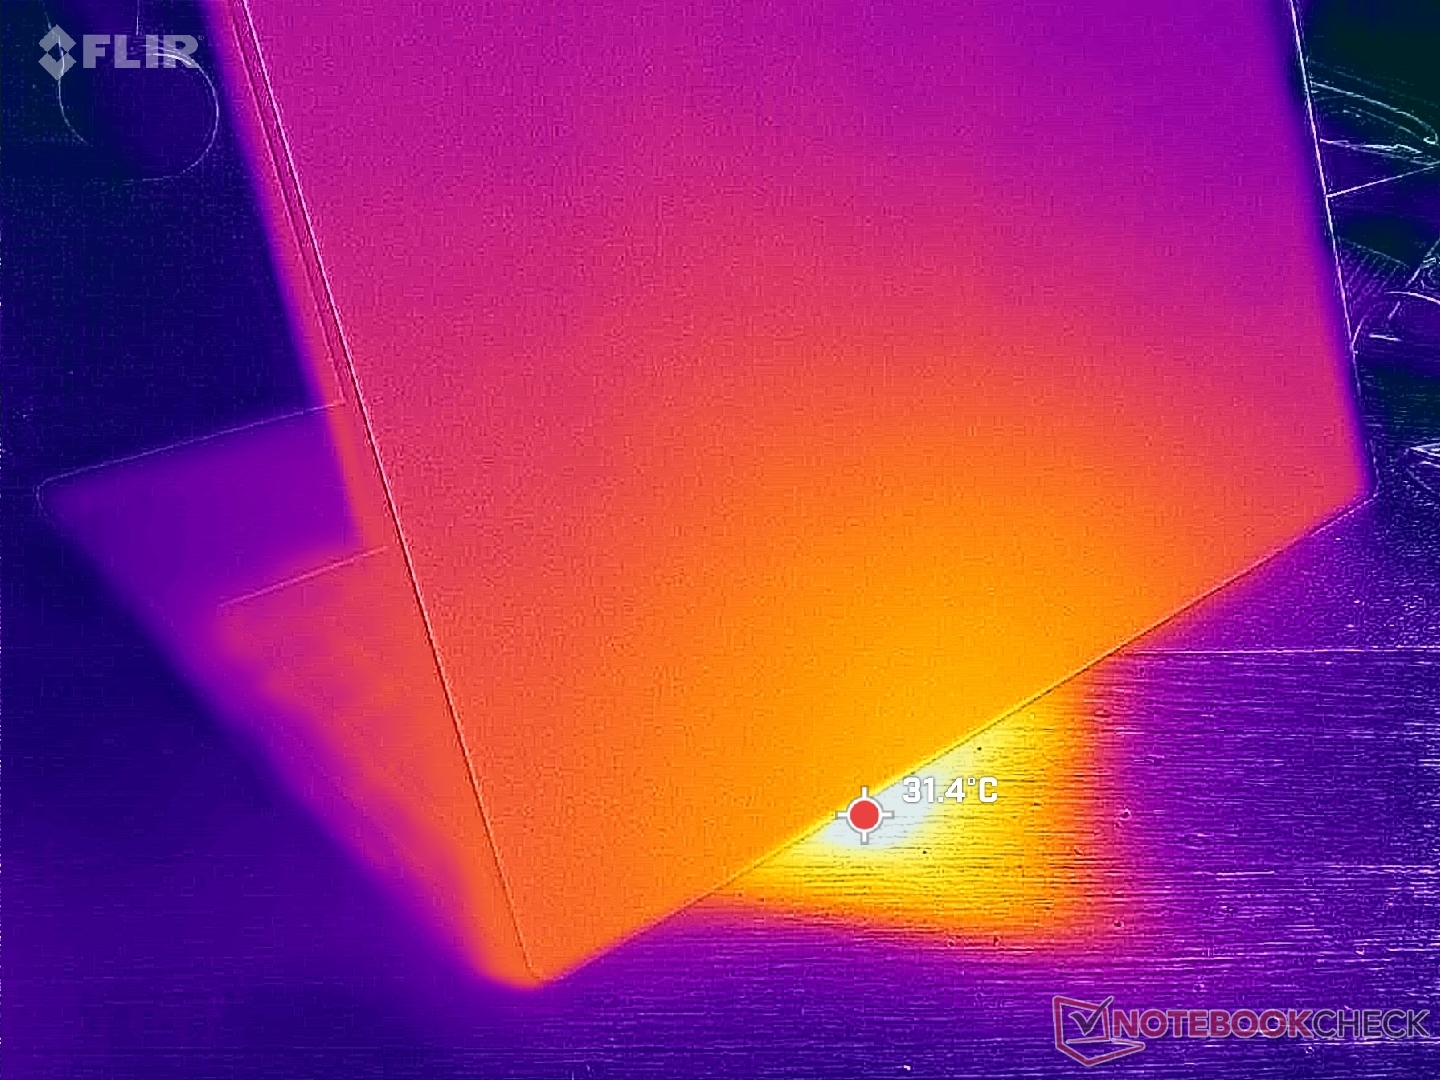
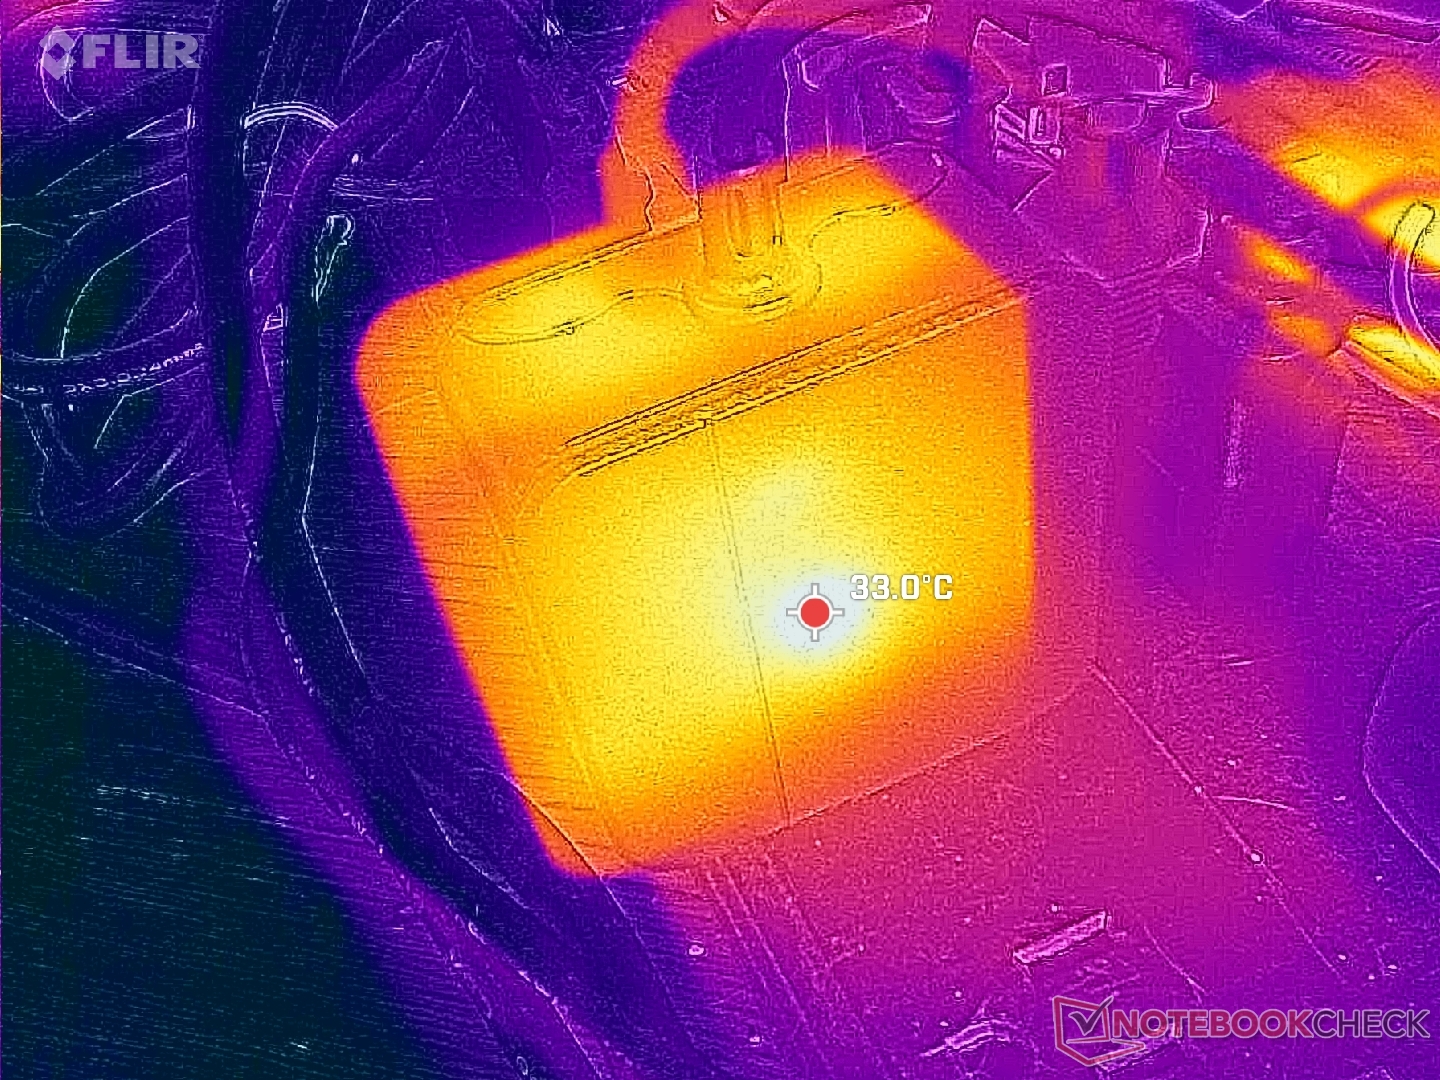
(+) Maksymalna temperatura w górnej części wynosi 31.8 °C / 89 F, w porównaniu do średniej 36.9 °C / 98 F , począwszy od 21.1 do 71 °C dla klasy Multimedia.
(+) Dno nagrzewa się maksymalnie do 36.6 °C / 98 F, w porównaniu do średniej 39.2 °C / 103 F
(+) W stanie bezczynności średnia temperatura górnej części wynosi 23.5 °C / 74 F, w porównaniu ze średnią temperaturą urządzenia wynoszącą 31.3 °C / ### class_avg_f### F.
(+) Podpórki pod nadgarstki i touchpad są chłodniejsze niż temperatura skóry i maksymalnie 22.8 °C / 73 F i dlatego są chłodne w dotyku.
(+) Średnia temperatura obszaru podparcia dłoni w podobnych urządzeniach wynosiła 28.8 °C / 83.8 F (+6 °C / 10.8 F).
| Thinkeagle VigoBook G7 AMD Ryzen 7 5700U, AMD Radeon RX Vega 8 (Ryzen 4000/5000) | Ninkear A15 Plus (16+512) AMD Ryzen 7 5700U, AMD Radeon RX Vega 8 (Ryzen 4000/5000) | Acer Aspire Vero AV15-53P Intel Core i7-1355U, Intel Iris Xe Graphics G7 96EUs | HP 250 G9 7N029ES Intel Core i3-1215U, Intel UHD Graphics 64EUs (Alder Lake 12th Gen) | Lenovo IdeaPad 3 15ABA7 AMD Ryzen 5 5625U, AMD Radeon RX Vega 7 | Dell Latitude 3520 Intel Core i5-1135G7, Intel Iris Xe Graphics G7 80EUs | |
|---|---|---|---|---|---|---|
| Heat | -1% | -22% | -9% | -15% | -21% | |
| Maximum Upper Side * | 31.8 | 37 -16% | 43 -35% | 35.1 -10% | 41.1 -29% | 37.5 -18% |
| Maximum Bottom * | 36.6 | 33 10% | 42.6 -16% | 44.8 -22% | 42.3 -16% | 49.7 -36% |
| Idle Upper Side * | 25.8 | 23.5 9% | 30 -16% | 25.7 -0% | 26.8 -4% | 29 -12% |
| Idle Bottom * | 26 | 28.1 -8% | 31.1 -20% | 26.5 -2% | 28.6 -10% | 30.1 -16% |
* ... im mniej tym lepiej
Test warunków skrajnych
Średnia częstotliwość taktowania procesora i jego temperatura ustabilizowały się odpowiednio na poziomie zaledwie 1,4 GHz i 52 W w stresie Prime95, co jest wartością znacznie niższą niż oczekiwano od Ryzena 7 5700U. Pobór mocy pakietu jest również bardzo niski i wynosi niecałe 10 W, nawet w trybie wydajności, podczas gdy procesor jest w stanie pobierać 15 W i więcej.
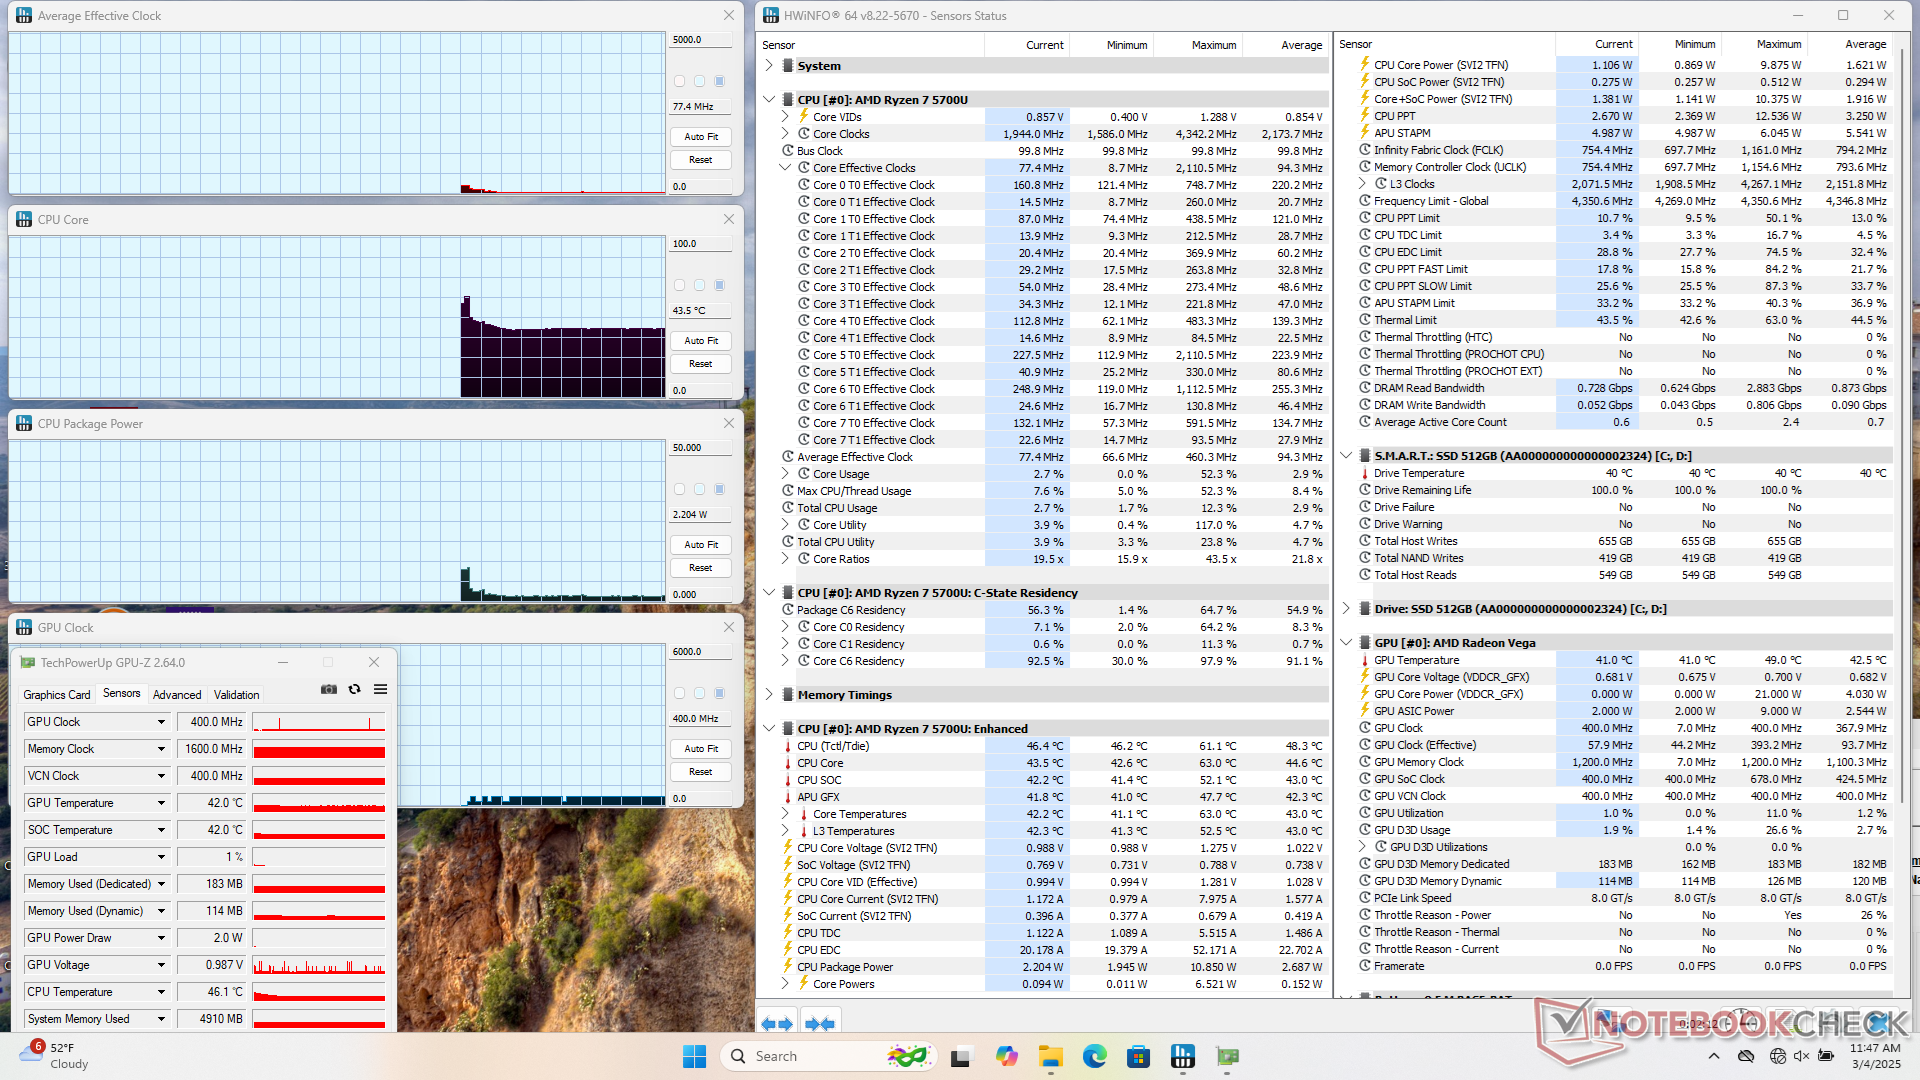
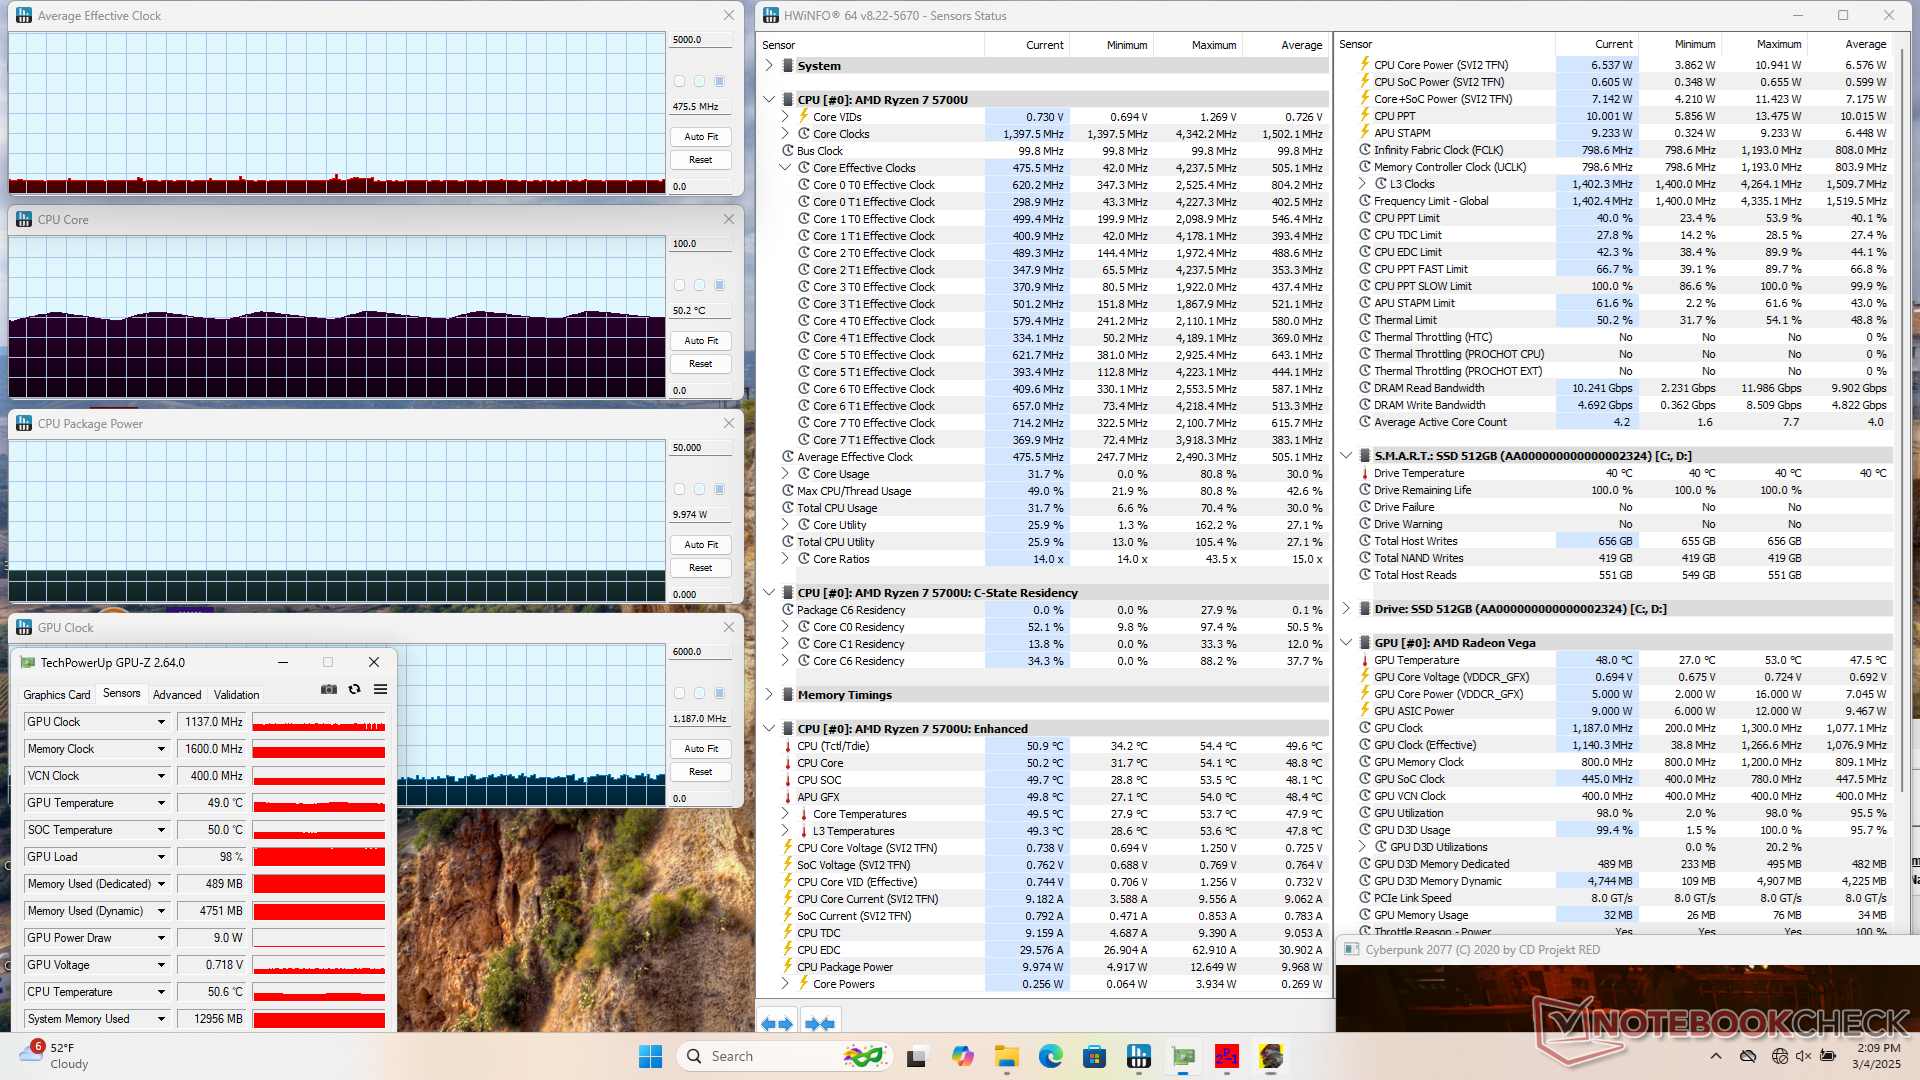
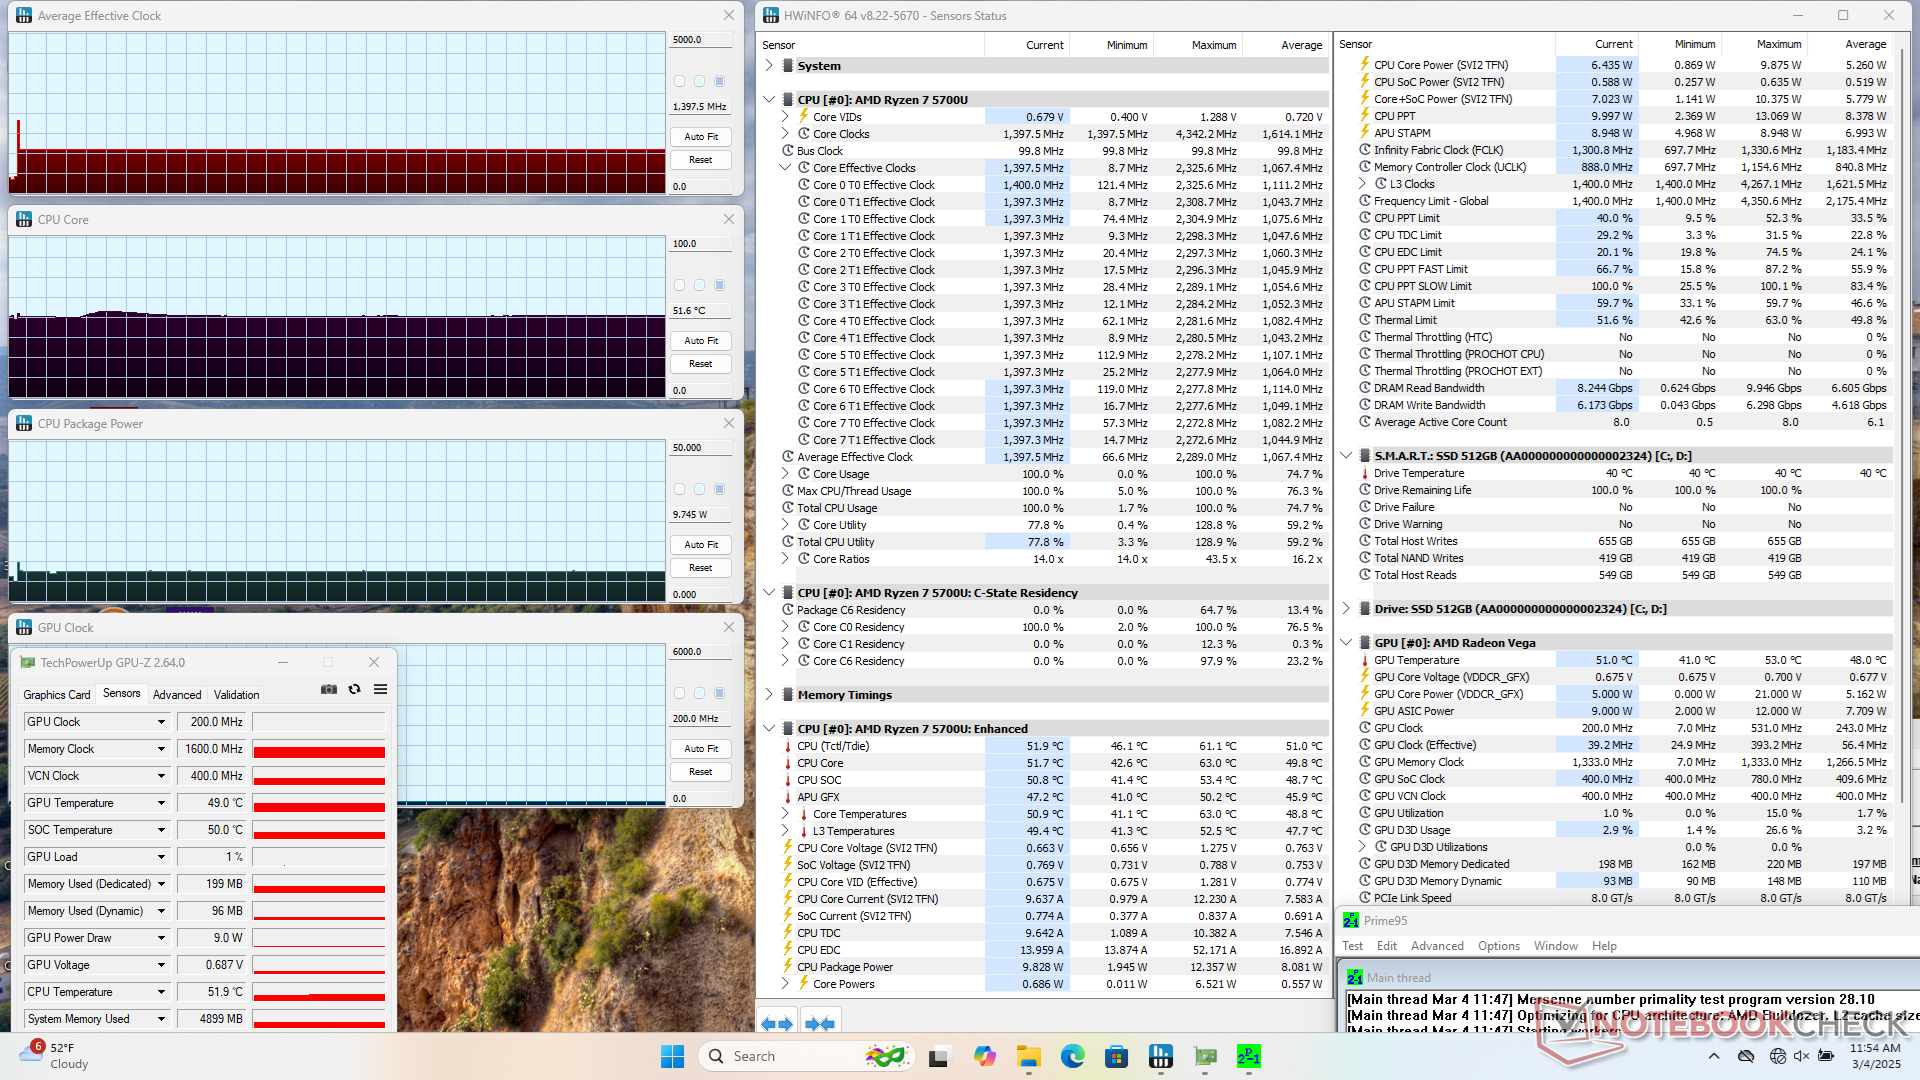
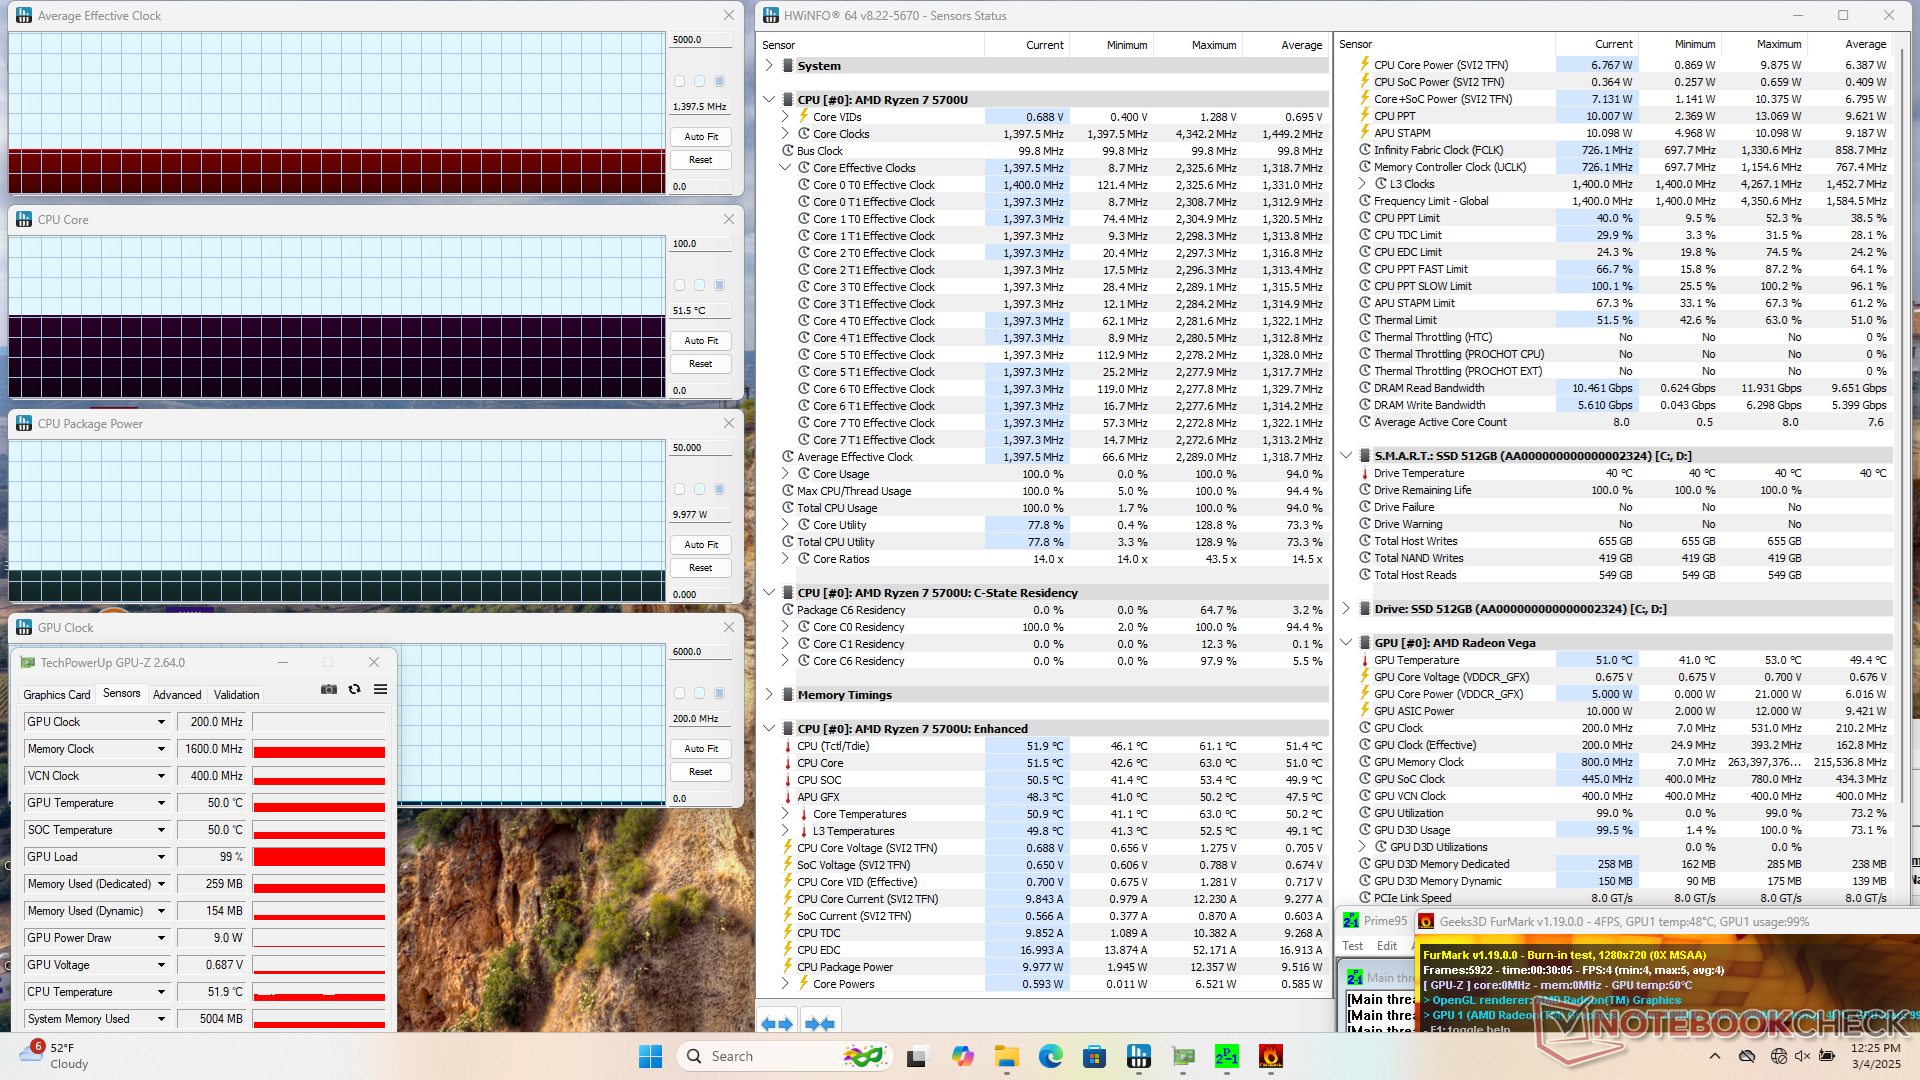
| Średnie taktowanie CPU (GHz) | Taktowanie GPU (MHz) | Średnia temperatura CPU (°C) | |
| System bezczynności | -- | -- | 44 |
| Prime95 Stress | 1.4 | -- | 52 |
| Prime95 + FurMark Stress | 1.4 | 200 | 52 |
| Cyberpunk 2077 Stress | 0.5 | 1187 | 50 |
Głośniki
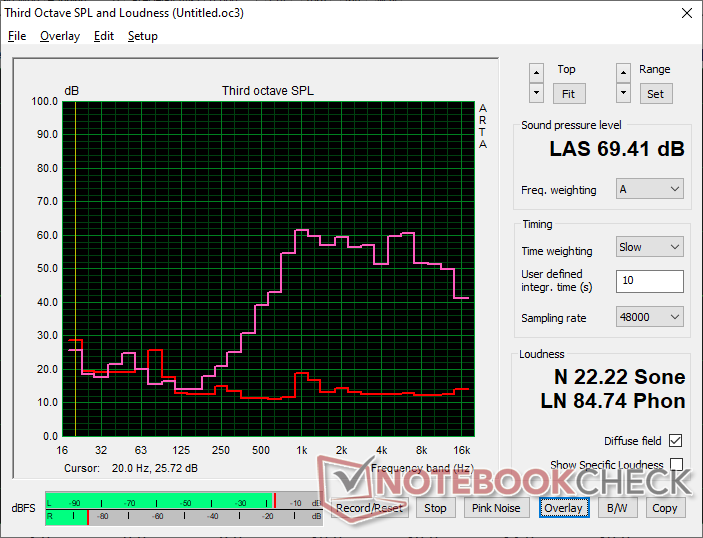
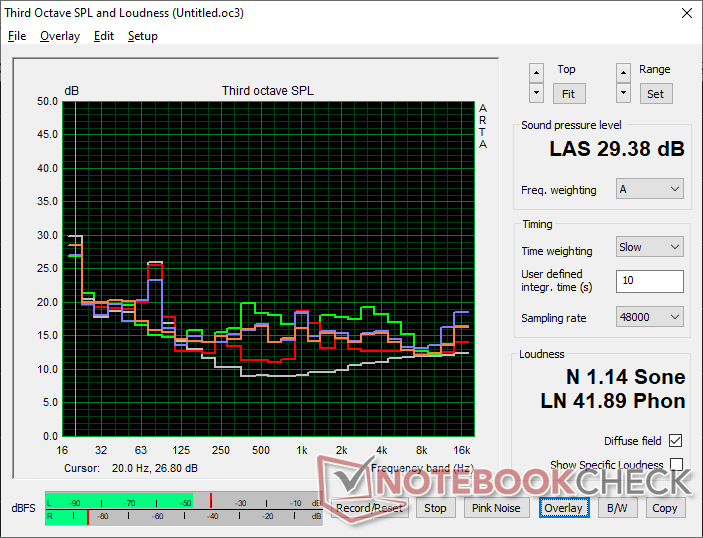
Thinkeagle VigoBook G7 analiza dźwięku
(-) | niezbyt głośne głośniki (###wartość### dB)
Bas 100 - 315 Hz
(-) | prawie brak basu - średnio 33.2% niższa od mediany
(+) | bas jest liniowy (6% delta do poprzedniej częstotliwości)
Średnie 400 - 2000 Hz
(±) | zmniejszone średnie - średnio 9.6% niższe niż mediana
(±) | liniowość środka jest średnia (14% delta do poprzedniej częstotliwości)
Wysokie 2–16 kHz
(+) | zrównoważone maksima - tylko 4.2% od mediany
(±) | liniowość wysokich wartości jest średnia (10.4% delta do poprzedniej częstotliwości)
Ogólnie 100 - 16.000 Hz
(-) | ogólny dźwięk nie jest liniowy (37.8% różnicy w stosunku do mediany)
W porównaniu do tej samej klasy
» 99% wszystkich testowanych urządzeń w tej klasie było lepszych, 1% podobnych, 1% gorszych
» Najlepszy miał deltę 5%, średnia wynosiła ###średnia###%, najgorsza wynosiła 45%
W porównaniu do wszystkich testowanych urządzeń
» 94% wszystkich testowanych urządzeń było lepszych, 1% podobnych, 5% gorszych
» Najlepszy miał deltę 4%, średnia wynosiła ###średnia###%, najgorsza wynosiła 134%
Apple MacBook Pro 16 2021 M1 Pro analiza dźwięku
(+) | głośniki mogą odtwarzać stosunkowo głośno (84.7 dB)
Bas 100 - 315 Hz
(+) | dobry bas - tylko 3.8% od mediany
(+) | bas jest liniowy (5.2% delta do poprzedniej częstotliwości)
Średnie 400 - 2000 Hz
(+) | zbalansowane środki średnie - tylko 1.3% od mediany
(+) | średnie są liniowe (2.1% delta do poprzedniej częstotliwości)
Wysokie 2–16 kHz
(+) | zrównoważone maksima - tylko 1.9% od mediany
(+) | wzloty są liniowe (2.7% delta do poprzedniej częstotliwości)
Ogólnie 100 - 16.000 Hz
(+) | ogólny dźwięk jest liniowy (4.6% różnicy w stosunku do mediany)
W porównaniu do tej samej klasy
» 0% wszystkich testowanych urządzeń w tej klasie było lepszych, 0% podobnych, 100% gorszych
» Najlepszy miał deltę 5%, średnia wynosiła ###średnia###%, najgorsza wynosiła 45%
W porównaniu do wszystkich testowanych urządzeń
» 0% wszystkich testowanych urządzeń było lepszych, 0% podobnych, 100% gorszych
» Najlepszy miał deltę 4%, średnia wynosiła ###średnia###%, najgorsza wynosiła 134%
Zarządzanie energią
Zużycie energii
Całkowite zużycie energii jest nieco niższe niż w przypadku napędzanego przez Core i3 HP 250 zapewniając jednocześnie nieco wyższą wydajność procesora, co przekłada się na lepszą wydajność w przeliczeniu na wat.
| wyłączony / stan wstrzymania | |
| luz | |
| obciążenie |
|
Legenda:
min: | |
| Thinkeagle VigoBook G7 R7 5700U, Vega 8, , IPS, 1920x1080, 15.6" | Ninkear A15 Plus (16+512) R7 5700U, Vega 8, GOFATOO P110E-512GB, IPS, 1920x1080, 15.6" | Acer Aspire Vero AV15-53P i7-1355U, Iris Xe G7 96EUs, Kingston OM8SEP4512Q-AA, IPS, 1920x1080, 15.6" | HP 250 G9 7N029ES i3-1215U, UHD Graphics 64EUs, SK hynix HFS512GEJ9X125N, IPS, 1920x1080, 15.6" | Lenovo IdeaPad 3 15ABA7 R5 5625U, Vega 7, Micron 2450 512GB MTFDKCD512TFK, IPS, 1920x1080, 15.6" | Dell Latitude 3520 i5-1135G7, Iris Xe G7 80EUs, Kioxia BG5 KBG50ZNS256G, IPS, 1920x1080, 15.6" | |
|---|---|---|---|---|---|---|
| Power Consumption | -14% | -28% | -6% | -28% | -11% | |
| Idle Minimum * | 4.1 | 4.8 -17% | 5.05 -23% | 3.6 12% | 5 -22% | 3.2 22% |
| Idle Average * | 7.8 | 5.4 31% | 6.28 19% | 7.8 -0% | 8.7 -12% | 7.2 8% |
| Idle Maximum * | 7.9 | 7.7 3% | 8.5 -8% | 8.1 -3% | 9.1 -15% | 7.8 1% |
| Load Average * | 27.1 | 36.05 -33% | 42.184 -56% | 34.7 -28% | 41 -51% | 34 -25% |
| Cyberpunk 2077 ultra external monitor * | 23.8 | |||||
| Cyberpunk 2077 ultra * | 27.7 | |||||
| Load Maximum * | 40 | 62 -55% | 69.5 -74% | 44.6 -12% | 55.7 -39% | 65 -63% |
| Witcher 3 ultra * | 45.4 | 34.9 | 41.9 | 29.2 |
* ... im mniej tym lepiej
Power Consumption Cyberpunk / Stress Test
Power Consumption external Monitor
Żywotność baterii
Czas pracy jest przyzwoity jak na tę kategorię cenową i rozmiarową, wynosząc 8,5 godziny przeglądania w świecie rzeczywistym.
| Thinkeagle VigoBook G7 R7 5700U, Vega 8, 57 Wh | Ninkear A15 Plus (16+512) R7 5700U, Vega 8, 64.9 Wh | Acer Aspire Vero AV15-53P i7-1355U, Iris Xe G7 96EUs, 54.4 Wh | HP 250 G9 7N029ES i3-1215U, UHD Graphics 64EUs, 41 Wh | Lenovo IdeaPad 3 15ABA7 R5 5625U, Vega 7, 45 Wh | Dell Latitude 3520 i5-1135G7, Iris Xe G7 80EUs, 54 Wh | |
|---|---|---|---|---|---|---|
| Czasy pracy | 24% | 40% | -29% | 15% | 7% | |
| WiFi v1.3 | 510 | 634 24% | 714 40% | 361 -29% | 584 15% | 547 7% |
| Load | 148 | 56 | ||||
| Reader / Idle | 1302 | |||||
| H.264 | 664 |
Ocena Notebookcheck
Thinkeagle VigoBook G7
- 11/03/2025 v8
Allen Ngo
 Total Sustainability Score:
 Przezroczystość
Wyboru urządzeń do recenzji dokonuje nasza redakcja. Próbka testowa została udostępniona autorowi jako pożyczka od producenta lub sprzedawcy detalicznego na potrzeby tej recenzji. Pożyczkodawca nie miał wpływu na tę recenzję, producent nie otrzymał też kopii tej recenzji przed publikacją. Nie było obowiązku publikowania tej recenzji. Nigdy nie przyjmujemy rekompensaty ani płatności w zamian za nasze recenzje. Jako niezależna firma medialna, Notebookcheck nie podlega władzy producentów, sprzedawców detalicznych ani wydawców.
Tak testuje Notebookcheck
Każdego roku Notebookcheck niezależnie sprawdza setki laptopów i smartfonów, stosując standardowe procedury, aby zapewnić porównywalność wszystkich wyników. Od około 20 lat stale rozwijamy nasze metody badawcze, ustanawiając przy tym standardy branżowe. W naszych laboratoriach testowych doświadczeni technicy i redaktorzy korzystają z wysokiej jakości sprzętu pomiarowego. Testy te obejmują wieloetapowy proces walidacji. Nasz kompleksowy system ocen opiera się na setkach uzasadnionych pomiarów i benchmarków, co pozwala zachować obiektywizm.
