Notebookcheck Logo

Recenzja XMG Fusion 15 (Early 24): Kompaktowy laptop RTX 4070 dla graczy i twórców

Powerhouse.

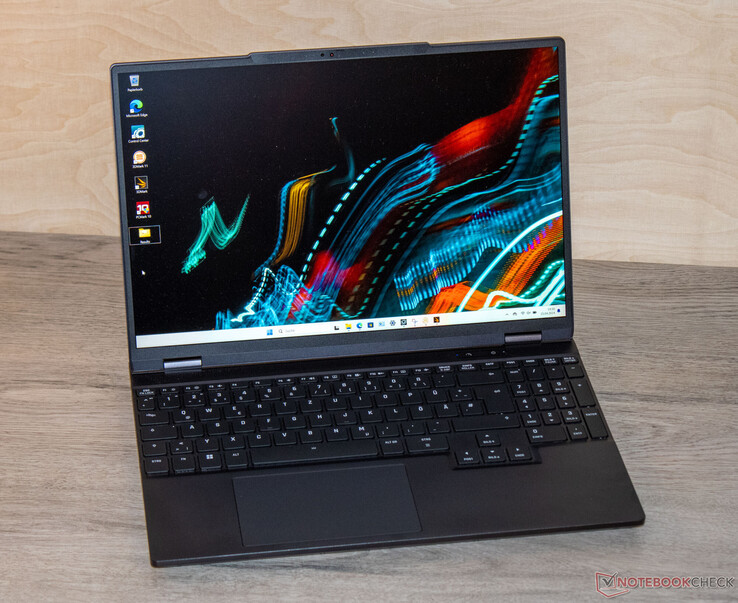
Lekki i kompaktowy XMG Fusion 15 nie posiada konwencjonalnego rozmiaru ekranu: Zamiast 16-calowego lub 15,6-calowego wyświetlacza, jest on wyposażony w 15,3-calowy panel (2560 x 1600 pikseli, 240 Hz) o proporcjach 16:10. Procesor Core i9, RTX 4070, Thunderbolt 4 i bardzo dobre czasy pracy dopełniają całości.
Gaming Geforce Intel Laptop / Notebook Nvidia Raptor Lake Thunderbolt Windows

XMG Fusion 15 (Early 24) - 15,3-calowy laptop dla graczy i twórców - bazuje na płycie głównej (GM5IX7A) od producenta Tongfang. Raptor Lake, Ada Lovelace i 32 GB pamięci RAM wyposażają laptopa do streamowania, renderowania i grania. Obecny wariant można nabyć za około 2500 USD. Wśród konkurentów znajdują się takie urządzenia jak Aorus 16X (2024), Alienware m16 R2, HP Omen Transcend 16 i Lenovo Legion Pro 5 16IRX9.

SCHENKER XMG Fusion 15 (Early 24) (XMG Fusion 15 Rodzina)
Procesor
Intel Core i9-14900HX 24 x 1.6 - 5.8 GHz, 170 W PL2 / Short Burst, 160 W PL1 / Sustained, Raptor Lake-HX Refresh
Karta grafiki
NVIDIA GeForce RTX 4070 Laptop GPU - 8 GB VRAM, rdzeń: 2175 MHz, pamięć: 2000 MHz, 140 W TDP ( including 25 W Dynamic Boost), GDDR6, 31.0.15.5222, Optimus + MUX-Switch
Pamięć
32 GB 
, DDR5-5600, dual-channel mode, two memory slots (both in use)
Matryca
15.30 cali 16:10, 2560 x 1600 pikseli 197 PPI, BOE NJ NE153QDM-NZ1, IPS, sRGB, refleksująca: nie, 240 Hz, Adaptive Sync
Chipset
Intel HM770 (Raptor Lake-S PCH)
Dysk twardy
Samsung 990 Pro 1 TB, 1024 GB 
, PCIe 4, M.2-2280, 894 GB wolne miejsce
Karta dźwiękowa
Conexant SN6140
Złącza
4 USB 3.0, 1 USB 3.1 Gen2, 1 USB 4.0 40 Gbps, 1 Thunderbolt, USB-C Power Delivery (PD), 1 HDMI, 1 DisplayPort, 1 blokada Kensingtona, gniazda audio: Audiokombo, czytnik kart: SD, SDXC, SDHC, TPM 2.0
Łączność
Motorcomm YT6801 (10/100/1000MBit/s), Intel Wi-Fi 6E AX211 (a/b/g/h/n = Wi-Fi 4/ac = Wi-Fi 5/ax = Wi-Fi 6/ Wi-Fi 6E 6 GHz), Bluetooth 5.3
Gabaryty
wysokość x szerokość x głębokość (mm): 21.9 x 342.5 x 245
Akumulator
99.8 Wh, 6450 mAh litowo-polimerowy
System operacyjny
Microsoft Windows 11 Pro
Camera
kamerka: FHD
Primary Camera: 2.1 MPix
Inne
głośniki: Stereo, klawiatura: Chiclet, podświetlanie klawiatury: tak, USB Thundrive (drivers, manuals), stickers, mousepad, 24 miesiące(y) gwarancji
Waga
2.13 kg, zasilacz: 864 g
Cena
2293 Euro
Note: The manufacturer may use components from different suppliers including display panels, drives or memory sticks with similar specifications.


Potencjalni konkurenci w porównaniu

Rating
Date
Model
Weight
Height
Size
Resolution
Price
88.9 %
v7 (old)
05/2024
SCHENKER XMG Fusion 15 (Early 24)
i9-14900HX, NVIDIA GeForce RTX 4070 Laptop GPU
2.1 kg21.9 mm15.30"2560x1600
87.4 %
v7 (old)
04/2024
Aorus 16X 2024
i9-14900HX, NVIDIA GeForce RTX 4070 Laptop GPU
2.3 kg20 mm16.00"2560x1600
90.2 %
v7 (old)
03/2024
Alienware m16 R2
Ultra 7 155H, NVIDIA GeForce RTX 4070 Laptop GPU
2.5 kg23.5 mm16.00"2560x1600
88.4 %
v7 (old)
02/2024
HP Omen Transcend 16-u1095ng
i9-14900HX, NVIDIA GeForce RTX 4070 Laptop GPU
2.3 kg20 mm16.00"2560x1600
89.3 %
v7 (old)
04/2024
Lenovo Legion Pro 5 16IRX9
i9-14900HX, NVIDIA GeForce RTX 4070 Laptop GPU
2.5 kg26.95 mm16.00"2560x1600

Obudowa - laptop XMG z aluminiową obudową

Schenker postawił na elegancką, matową obudowę z czarnego aluminium o gładkich powierzchniach. Laptop nie posiada żadnych przyciągających wzrok elementów konstrukcyjnych ani pasków LED - jedynie podświetlenie klawiatury (RGB) nadaje urządzeniu nieco koloru. Laptop ledwo wyróżniałby się w profesjonalnych środowiskach.

Nie zauważyliśmy żadnych wystających elementów, a wszystkie szczeliny idealnie do siebie pasują. Podstawę i pokrywę można lekko przekręcić, ale nie jest to nic nadzwyczajnego. Naciśnięcie tylnej części pokrywy nie powoduje żadnych zmian w obrazie. Sztywne zawiasy pozwalają na maksymalny kąt otwarcia 180 stopni. Można go otworzyć jedną ręką.

XMG Fusion 15 (Early 24)

Nie ma w tym nic dziwnego: W polu porównawczym Fusion jest najbardziej kompaktowym urządzeniem - ma najmniejszy wyświetlacz. Jednocześnie jest również najlżejszy ze wszystkich.

Porównanie rozmiarów

363.4 mm 261.75 mm 26.95 mm 2.5 kg363.9 mm 249.4 mm 23.5 mm 2.5 kg356 mm 254 mm 20 mm 2.3 kg356 mm 269 mm 20 mm 2.3 kg342.5 mm 245 mm 21.9 mm 2.1 kg297 mm 210 mm 1 mm 5.7 g

Łączność - Fusion 15 z Thunderbolt 4

Fusion posiada trzy porty USB-A (USB 3.2 Gen 1) i dwa porty USB-C (1x USB 3.2 Gen 1, 1x Thunderbolt 4). Port TB4 obsługuje funkcję Power Delivery i może wysyłać sygnał DisplayPort. W sumie laptop ma dwa wyjścia wideo (1x HDMI, 1x DP). Opcje łączności uzupełniają gniazdo audio i port Gigabit Ethernet. Wyjścia wideo i złącze zasilania znajdują się z tyłu urządzenia. Odpowiednie kable biegną z tyłu, więc nie będą przeszkadzać.

Lewa strona: Gniazdo na blokadę kabla, USB 3.2 Gen 1 (USB-A), USB 3.2 Gen 1 (USB-C), combo audio
Prawa strona: Czytnik kart SD, 2x USB 3.2 Gen 1 (USB-A)
Tył: Thunderbolt 4 (USB-C; DisplayPort, Power Delivery), HDMI, Gigabit Ethernet, złącze zasilania

Czytnik kart SD

Przy transferach na poziomie 81 MB/s (przesyłanie 250 obrazów jpg, każdy o rozmiarze 5 MB) i 82 MB/s (kopiowanie dużych bloków danych), czytnik kart SD (karta referencyjna: AV PRO microSD 128 GB V60) jest przeciętnie szybki. Konkurencja w większości oferuje szybsze czytniki.

SD Card Reader
average JPG Copy Test (av. of 3 runs)
Aorus 16X 2024
Intel Core i9-14900HX (AV PRO microSD 128 GB V60)
186 MB/s +130%
Average of class Gaming
  (19 - 202, n=89, last 2 years)
95.5 MB/s +18%
SCHENKER XMG Fusion 15 (Early 24)
Intel Core i9-14900HX (AV PRO microSD 128 GB V60)
81 MB/s
Alienware m16 R2
Intel Core Ultra 7 155H (AV PRO microSD 128 GB V60)
75.3 MB/s -7%
maximum AS SSD Seq Read Test (1GB)
Alienware m16 R2
Intel Core Ultra 7 155H (AV PRO microSD 128 GB V60)
205.32 MB/s +150%
Aorus 16X 2024
Intel Core i9-14900HX (AV PRO microSD 128 GB V60)
188 MB/s +129%
Average of class Gaming
  (25.8 - 269, n=90, last 2 years)
119.3 MB/s +45%
SCHENKER XMG Fusion 15 (Early 24)
Intel Core i9-14900HX (AV PRO microSD 128 GB V60)
82 MB/s

Komunikacja

Fusion wykorzystuje układ WiFi 6E (Intel AX211), który w najlepszym scenariuszu (brak urządzeń WiFi w bliskim sąsiedztwie, niewielka odległość między laptopem a serwerem) osiąga bardzo dobre prędkości transmisji danych. Za połączenia przewodowe odpowiada kontroler Gigabit Ethernet (YT6801) od Motorcomm - producenta, z którym wcześniej nie mieliśmy do czynienia.

Networking
iperf3 transmit AXE11000
SCHENKER XMG Fusion 15 (Early 24)
Intel Wi-Fi 6E AX211
1444 (1378min - 1489max) MBit/s
HP Omen Transcend 16-u1095ng
Intel Wi-Fi 6E AX211
1411 (1327min - 1472max) MBit/s -2%
Average of class Gaming
  (469 - 1843, n=151, last 2 years)
1235 MBit/s -14%
Average Intel Wi-Fi 6E AX211
  (464 - 1921, n=238)
1233 MBit/s -15%
Alienware m16 R2
Intel Wi-Fi 7 BE202
1205 (875min - 1438max) MBit/s -17%
Lenovo Legion Pro 5 16IRX9
Intel Wi-Fi 6E AX211
636 (485min - 769max) MBit/s -56%
Aorus 16X 2024
Intel Wi-Fi 7 BE200 320MHz
469 (304min - 548max) MBit/s -68%
iperf3 receive AXE11000
HP Omen Transcend 16-u1095ng
Intel Wi-Fi 6E AX211
1697 (849min - 1712max) MBit/s +4%
SCHENKER XMG Fusion 15 (Early 24)
Intel Wi-Fi 6E AX211
1632 (1454min - 1700max) MBit/s
Aorus 16X 2024
Intel Wi-Fi 7 BE200 320MHz
1577 (1237min - 1665max) MBit/s -3%
Average of class Gaming
  (680 - 1890, n=151, last 2 years)
1383 MBit/s -15%
Average Intel Wi-Fi 6E AX211
  (582 - 1890, n=238)
1379 MBit/s -16%
Alienware m16 R2
Intel Wi-Fi 7 BE202
1227 (1074min - 1317max) MBit/s -25%
Lenovo Legion Pro 5 16IRX9
Intel Wi-Fi 6E AX211
1040 (739min - 1218max) MBit/s -36%
050100150200250300350400450500550600650700750800850900950100010501100115012001250130013501400145015001550160016501700Tooltip
SCHENKER XMG Fusion 15 (Early 24) Intel Wi-Fi 6E AX211; iperf3 receive AXE11000; iperf 3.1.3: Ø1631 (1454-1700)
Aorus 16X 2024 Intel Wi-Fi 7 BE200 320MHz; iperf3 receive AXE11000; iperf 3.1.3: Ø1576 (1237-1665)
Alienware m16 R2 Intel Wi-Fi 7 BE202; iperf3 receive AXE11000; iperf 3.1.3: Ø1227 (1074-1317)
HP Omen Transcend 16-u1095ng Intel Wi-Fi 6E AX211; iperf3 receive AXE11000; iperf 3.1.3: Ø1668 (849-1712)
Lenovo Legion Pro 5 16IRX9 Intel Wi-Fi 6E AX211; iperf3 receive AXE11000; iperf 3.1.3: Ø1039 (739-1218)
SCHENKER XMG Fusion 15 (Early 24) Intel Wi-Fi 6E AX211; iperf3 transmit AXE11000; iperf 3.1.3: Ø1444 (1378-1489)
Aorus 16X 2024 Intel Wi-Fi 7 BE200 320MHz; iperf3 transmit AXE11000; iperf 3.1.3: Ø469 (304-548)
Alienware m16 R2 Intel Wi-Fi 7 BE202; iperf3 transmit AXE11000; iperf 3.1.3: Ø1205 (875-1438)
HP Omen Transcend 16-u1095ng Intel Wi-Fi 6E AX211; iperf3 transmit AXE11000; iperf 3.1.3: Ø1411 (1327-1472)
Lenovo Legion Pro 5 16IRX9 Intel Wi-Fi 6E AX211; iperf3 transmit AXE11000; iperf 3.1.3: Ø636 (485-769)

Kamera internetowa

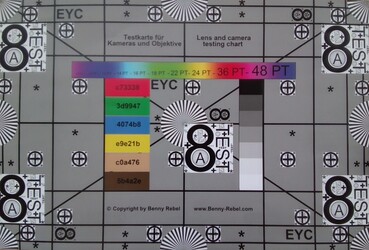
Jego kamera internetowa (2,1 MP) jest przeciętnej jakości. Zawodzi, jeśli chodzi o dokładność odwzorowania kolorów: Z odchyleniem około 9, wartość docelowa (DeltaE<3) nie została osiągnięta. Obsługuje jednak funkcję Windows Hello. Ponadto jest wyposażony w mechaniczną osłonę.

ColorChecker
8.6 ∆E
6.2 ∆E
2.4 ∆E
4.9 ∆E
4.8 ∆E
5.5 ∆E
11 ∆E
7.5 ∆E
11.9 ∆E
9.1 ∆E
4.8 ∆E
10.1 ∆E
9.6 ∆E
5.5 ∆E
9.4 ∆E
12.7 ∆E
12.2 ∆E
5.7 ∆E
10.1 ∆E
10.6 ∆E
11.5 ∆E
15.2 ∆E
14.7 ∆E
11.4 ∆E
ColorChecker SCHENKER XMG Fusion 15 (Early 24): 8.97 ∆E min: 2.36 - max: 15.16 ∆E

Akcesoria

Laptop jest dostarczany z pamięcią USB (sterowniki, instrukcje), naklejkami i podkładką pod mysz.

Konserwacja

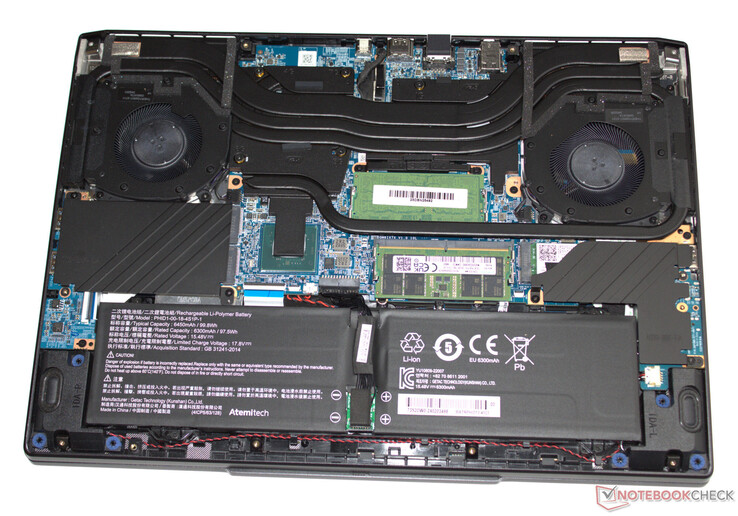
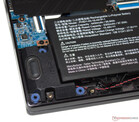
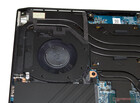
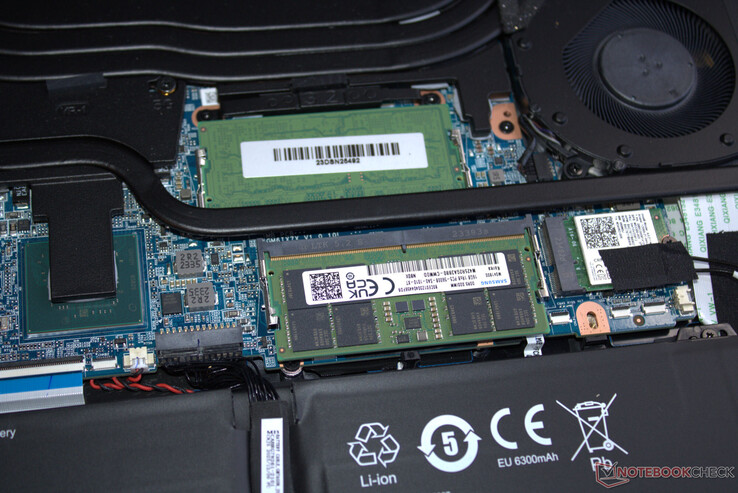
Po odkręceniu wszystkich śrubek na spodzie urządzenia, dolną część obudowy można zdjąć dość łatwo - może być potrzebny tylko plektrum lub płaska szpatułka, aby pomóc w tym. Następnie można uzyskać dostęp do banków pamięci RAM (oba zajęte), dysku SSD (PCIe 4, M.2-2280), drugiego gniazda SSD (PCIe 4, M.2-2280), modułu WLAN, wentylatorów, baterii BIOS i baterii laptopa.
Sprzęt XMG Fusion 15 (początek 2024 r.)

Gwarancja

Urządzenie jest objęte podstawową gwarancją trwającą dwa lata - obejmuje ona usługę odbioru i 6-miesięczną usługę szybkiej naprawy (naprawa w ciągu 48 godzin). Za opłatą mogą Państwo przedłużyć gwarancję do 36 miesięcy.

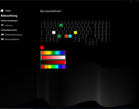
Urządzenia wejściowe - Podświetlenie RGB pojedynczego klawisza

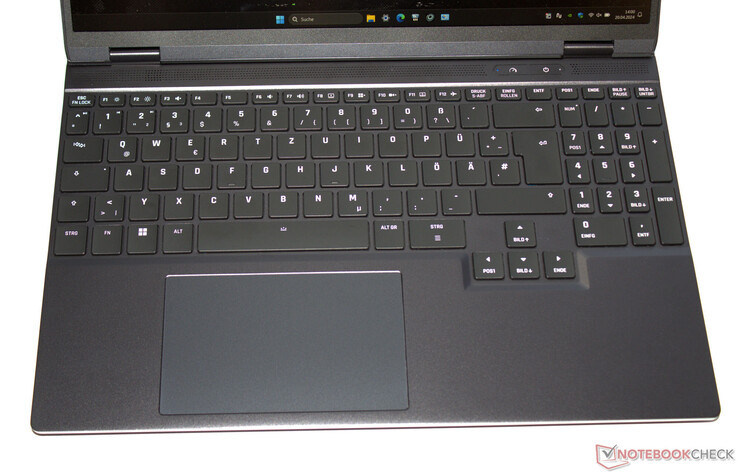
Klawiatura

Klawisze klawiatury typu chiclet (czteropoziomowe podświetlenie RGB) cechują się średnim skokiem i wyraźnym punktem nacisku. Ich opór mógłby być nieco bardziej wyraźny - ale to kwestia gustu. Klawiatura minimalnie ugina się podczas pisania, ale nie okazało się to irytujące podczas naszych testów. Pozytywne: Cztery klawisze strzałek są nie tylko pełnowymiarowe, ale także oddzielone od innych klawiszy.

Panel dotykowy

Wielodotykowy clickpad (ok. 12,3 x 7,8 cm) zastępuje mysz, a jego gładka powierzchnia ułatwia przesuwanie po nim palców. Charakteryzuje się krótkim skokiem i wyraźnym punktem nacisku.

Klawiatura XMG Fusion 15 (Early 24)

Wyświetlacz - jasny panel z pokryciem sRGB

Schenker wyposażył Fusion w 15,3-calowy ekran (2560 x 1600 pikseli) o proporcjach 16:10. Matowy panel o częstotliwości odświeżania 240 Hz oferuje funkcję Adaptive Sync, brak migotania PWM, krótki czas reakcji i dużą jasność. Alternatywne wyświetlacze nie są dostępne.

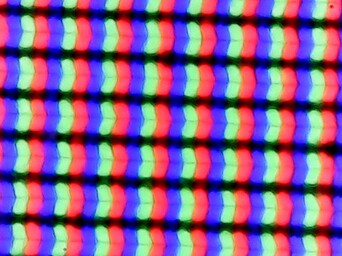
Tablica subpikseli
Tablica subpikseli
Brak widocznego krwawienia podświetlenia
467
cd/m²
458
cd/m²
449
cd/m²
467
cd/m²
491
cd/m²
458
cd/m²
456
cd/m²
457
cd/m²
437
cd/m²
podświetlenie ekranu
BOE NJ NE153QDM-NZ1 tested with X-Rite i1Pro 2
maksimum: 491 cd/m² (Nits) średnia: 460 cd/m² Minimum: 1 cd/m²
rozświetlenie: 89 %
na akumulatorze: 491 cd/m²
kontrast: 1045:1 (czerń: 0.47 cd/m²)
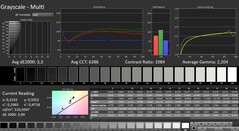
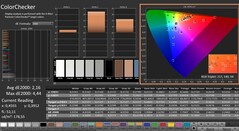
ΔE Color 2.16 | 0.5-29.43 Ø4.92, calibrated: 1.14
ΔE Greyscale 3.3 | 0.5-98 Ø5.2
75% AdobeRGB 1998 (Argyll 2.2.0 3D)
100% sRGB (Argyll 2.2.0 3D)
73.5% Display P3 (Argyll 2.2.0 3D)
Gamma: 2.204
SCHENKER XMG Fusion 15 (Early 24)
BOE NJ NE153QDM-NZ1, IPS, 2560x1600, 15.3"
Aorus 16X 2024
BOE CQ NE160QDM-NY1, IPS, 2560x1600, 16"
Alienware m16 R2
BOE NE16NYH, IPS, 2560x1600, 16"
HP Omen Transcend 16-u1095ng
ATNA60DL02-0 (SDC41A4), OLED, 2560x1600, 16"
Lenovo Legion Pro 5 16IRX9
BOE NE160QDM-NYC, IPS, 2560x1600, 16"
Display
-7%
-3%
22%
-5%
Display P3 Coverage
73.5
67.2
-9%
71
-3%
99.8
36%
69.3
-6%
sRGB Coverage
100
96.7
-3%
100
0%
100
0%
99.4
-1%
AdobeRGB 1998 Coverage
75
69.3
-8%
71.4
-5%
97
29%
70.1
-7%
Response Times
-27%
-41%
96%
-105%
Response Time Grey 50% / Grey 80% *
5 ?(2.3, 2.7)
7.5 ?(3.3, 4.2)
-50%
5.7 ?(2.6, 3.1)
-14%
0.2 ?(0.1, 0.1)
96%
11.9 ?(5.5, 6.4)
-138%
Response Time Black / White *
5.2 ?(1.5, 3.7)
5.4 ?(1.5, 3.9)
-4%
8.7 ?(4.6, 4.1)
-67%
0.2 ?(0.1, 0.1)
96%
8.9 ?(4.8, 4.1)
-71%
PWM Frequency
120 ?(100)
Screen
-1%
11%
182%
17%
Brightness middle
491
542
10%
345.8
-30%
390
-21%
384
-22%
Brightness
460
504
10%
337
-27%
392
-15%
366
-20%
Brightness Distribution
89
86
-3%
87
-2%
98
10%
91
2%
Black Level *
0.47
0.45
4%
0.3
36%
0.02
96%
0.35
26%
Contrast
1045
1204
15%
1153
10%
19500
1766%
1097
5%
Colorchecker dE 2000 *
2.16
2.73
-26%
1.99
8%
1.94
10%
0.97
55%
Colorchecker dE 2000 max. *
4.44
5.29
-19%
3.52
21%
4.26
4%
3.57
20%
Colorchecker dE 2000 calibrated *
1.14
1.32
-16%
0.62
46%
4.21
-269%
0.77
32%
Greyscale dE 2000 *
3.3
2.9
12%
2.1
36%
1.5
55%
1.5
55%
Gamma
2.204 100%
2.192 100%
2.32 95%
2.221 99%
2.24 98%
CCT
6286 103%
6173 105%
6369 102%
6395 102%
6709 97%
Total Average (Program / Settings)
-12% / -6%
-11% / 1%
100% / 135%
-31% / -5%

* ... im mniej tym lepiej

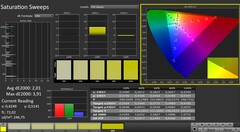
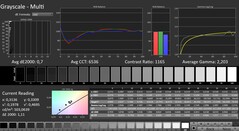
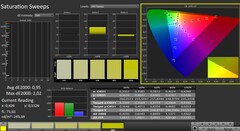
Wyświetlacz pokazał dobre odwzorowanie kolorów już po wyjęciu z pudełka: Przy odchyleniu około 2,2, wartość docelowa (DeltaE < 3) została osiągnięta. Kalibracja wyświetlacza obniża jego odchylenie do 1,14 i skutkuje bardziej zrównoważonymi odcieniami szarości. Panel jest w stanie całkowicie pokryć przestrzeń kolorów sRGB, ale nie przestrzenie kolorów AdobeRGB lub DCI P3. Nie inaczej jest w przypadku większości ekranów konkurencji.

CalMAN: Skala szarości
CalMAN: Nasycenie kolorów
CalMAN: ColorChecker
CalMAN: Skala szarości (skalibrowana)
CalMAN: Nasycenie kolorów (skalibrowane)
CalMAN: ColorChecker (skalibrowany)
XMG Fusion 15 E24 vs sRGB
XMG Fusion 15 E24 vs AdobeRGB
XMG Fusion 15 E24 vs DCI-P3

Display Response Times

Display response times show how fast the screen is able to change from one color to the next. Slow response times can lead to afterimages and can cause moving objects to appear blurry (ghosting). Gamers of fast-paced 3D titles should pay special attention to fast response times.
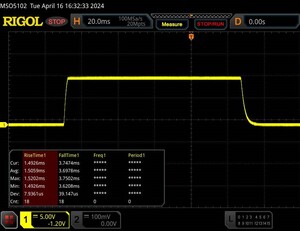
       Response Time Black to White
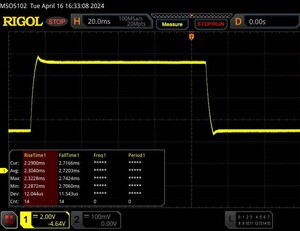
5.2 ms ... rise ↗ and fall ↘ combined↗ 1.5 ms rise
↘ 3.7 ms fall
The screen shows very fast response rates in our tests and should be very well suited for fast-paced gaming.
In comparison, all tested devices range from 0.1 (minimum) to 240 (maximum) ms. » 14 % of all devices are better.
This means that the measured response time is better than the average of all tested devices (21 ms).
       Response Time 50% Grey to 80% Grey
5 ms ... rise ↗ and fall ↘ combined↗ 2.3 ms rise
↘ 2.7 ms fall
The screen shows very fast response rates in our tests and should be very well suited for fast-paced gaming.
In comparison, all tested devices range from 0.165 (minimum) to 636 (maximum) ms. » 13 % of all devices are better.
This means that the measured response time is better than the average of all tested devices (32.9 ms).

Screen Flickering / PWM (Pulse-Width Modulation)

To dim the screen, some notebooks will simply cycle the backlight on and off in rapid succession - a method called Pulse Width Modulation (PWM) . This cycling frequency should ideally be undetectable to the human eye. If said frequency is too low, users with sensitive eyes may experience strain or headaches or even notice the flickering altogether.
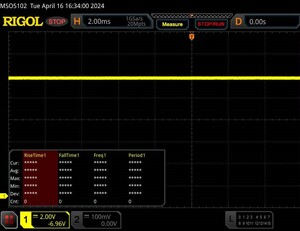
Screen flickering / PWM not detected

In comparison: 53 % of all tested devices do not use PWM to dim the display. If PWM was detected, an average of 8746 (minimum: 5 - maximum: 343500) Hz was measured.

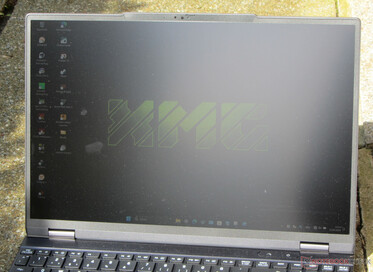
Stabilny pod kątem widzenia panel IPS urządzenia pozostaje czytelny pod każdym kątem. Na zewnątrz można czytać z wyświetlacza, o ile słońce nie świeci zbyt mocno.

Fusion na zewnątrz.
Fusion na zewnątrz.
Kąty widzenia Fusion 15 (Early 24)

Wydajność - Raptor Lake i Ada Lovelace zasilają laptopa

Potężny, kompaktowy XMG Fusion 15 (Early 24) jest skierowany do graczy i twórców. Raptor Lake i Ada Lovelace zapewniają niezbędną wydajność. Laptop można indywidualnie skonfigurować za pośrednictwem sklepu internetowego Schenker. Obecny wariant kosztuje około 2500 USD. Tańsze modele zaczynają się od ok. 1700 USD.

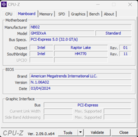
CPU-Z
CPU-Z
CPU-Z
CPU-Z
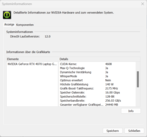
Informacje o systemie Nvidia
GPU-Z
GPU-Z
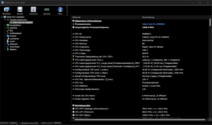
HWInfo
HWInfo
 

Warunki testowania

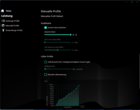
Laptop oferuje trzy specyficzne dla producenta tryby wydajności (patrz tabela), między którymi można szybko przełączać się za pomocą osobnego przycisku (obok przycisku zasilania). Indywidualne profile można tworzyć za pomocą preinstalowanego oprogramowania Control Center. Przykładowo, można dostosować limity mocy CPU, TGP GPU i/lub górne limity temperatury urządzenia.

Podczas naszych testów wykorzystano tryby Enthusiast (benchmarki) i Balanced (testy baterii). Tryb GPU był ustawiony na Hybrid (= Optimus).

Enthusiast Overboost Balanced
Limit mocy 1 (HWInfo) 160 watów 160 watów 160 watów
Limit mocy 2 (HWInfo) 170 watów 170 watów 170 watów
Hałas (Witcher 3) 51 dB(A) 53 dB(A) 39 dB(A)
Wydajność (Witcher 3) 128 fps 130 fps 14-128 fps
Centrum Kontroli
Centrum Kontroli
Centrum Kontroli
Centrum Kontroli
Centrum Kontroli
Centrum Kontroli
Centrum Kontroli
Centrum Kontroli
Centrum Kontroli
Centrum Kontroli
Centrum Kontroli
Centrum Kontroli
Centrum Kontroli
Centrum Kontroli
Centrum Kontroli

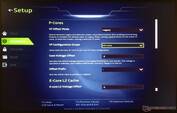
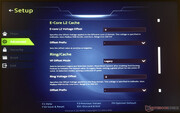
Undervolting

Procesor może pracować z niższym napięciem niż przewidziane przez producenta (undervolting). W rezultacie zmniejsza się zużycie energii przez urządzenie i emisja ciepła. Proszę jednak zachować ostrożność: Zbytnie obniżenie napięcia może prowadzić do niestabilnego lub wadliwego systemu. W takim przypadku zmiany muszą zostać odwrócone - undervolting należy przeprowadzać na własne ryzyko.

BIOS XMG Fusion 15
BIOS XMG Fusion 15
BIOS XMG Fusion 15
BIOS XMG Fusion 15

Procesor

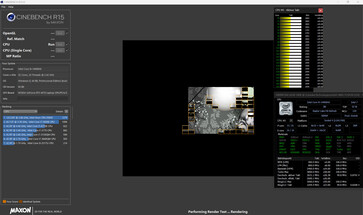
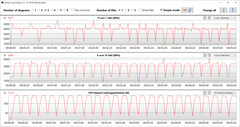
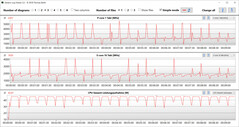
Procesor Core i9-14900HX (Raptor Lake) z 24 rdzeniami CPU (8P + 16E = 32 wątki) osiąga maksymalne częstotliwości taktowania na poziomie 5,8 GHz (P) i 4,1 GHz (E). Stałe obciążenie wielowątkowe (CB15 Loop) skutkuje stabilnymi częstotliwościami taktowania - ich poziom zależy od wybranego trybu zasilania.

Enthusiast zapewnia wartości benchmarków poniżej średniej CPU, podczas gdy Overboost podnosi je znacznie powyżej średniej - dotyczy to przede wszystkim wielowątkowej wydajności laptopa. Wydajność jednowątkowa oscyluje na wysokim i bardzo zbliżonym poziomie przy wykorzystaniu wszystkich trzech profili.

Więcej informacji na temat Core i9 znajdą Państwo w naszym artykule analitycznymAnaliza Intel Raptor Lake-HX Refresh - Core i9-14900HX z większą wydajnością pojedynczego rdzenia .

Wielowątkowy (podłączony do sieci)
Jednowątkowy (podłączony do sieci)

Cinebench R15 Multi continuous test

0230460690920115013801610184020702300253027602990322034503680391041404370Tooltip
SCHENKER XMG Fusion 15 (Early 24) Intel Core i9-14900HX: Ø3246 (3155.57-3458.12)
Aorus 16X 2024 Intel Core i9-14900HX: Ø3877 (3701.99-4280.82)
Alienware m16 R2 Intel Core Ultra 7 155H: Ø2777 (2743.86-2839.9)
HP Omen Transcend 16-u1095ng Intel Core i9-14900HX: Ø2840 (2582.31-3904.72)
Lenovo Legion Pro 5 16IRX9 Intel Core i9-14900HX: Ø4230 (4151.1-4590.84)
SCHENKER XMG Fusion 15 (Early 24) Intel Core i9-14900HX; Overboost: Ø4247 (4169.27-4354.93)
CB15 Loop (Entuzjasta)
Pętla CB15 (Overboost)
Pętla CB15 (zbalansowana)
CPU Performance Rating - Percent
SCHENKER XMG Fusion 15 (Early 24)
Intel Core i9-14900HX
86.6 pt
Lenovo Legion Pro 5 16IRX9
Intel Core i9-14900HX
82.8 pt
Average Intel Core i9-14900HX
 
81.7 pt
Aorus 16X 2024
Intel Core i9-14900HX
81.6 pt
SCHENKER XMG Fusion 15 (Early 24)
Intel Core i9-14900HX
74.5 pt
HP Omen Transcend 16-u1095ng
Intel Core i9-14900HX
70.9 pt
Average of class Gaming
 
64.9 pt
Alienware m16 R2 -1!
Intel Core Ultra 7 155H
60.2 pt
Cinebench R23
Multi Core
SCHENKER XMG Fusion 15 (Early 24)
Intel Core i9-14900HX (Overboost)
30709 Points +33%
Lenovo Legion Pro 5 16IRX9
Intel Core i9-14900HX
29686 (26317.7min - 29686max) Points +28%
Average Intel Core i9-14900HX
  (17078 - 36249, n=34)
29130 Points +26%
Aorus 16X 2024
Intel Core i9-14900HX
27818 Points +20%
SCHENKER XMG Fusion 15 (Early 24)
Intel Core i9-14900HX
23124 Points
Average of class Gaming
  (5668 - 36249, n=193, last 2 years)
21651 Points -6%
HP Omen Transcend 16-u1095ng
Intel Core i9-14900HX
20702 Points -10%
Alienware m16 R2
Intel Core Ultra 7 155H
18419 (18019.3min - 18419.5max) Points -20%
Single Core
SCHENKER XMG Fusion 15 (Early 24)
Intel Core i9-14900HX (Overboost)
2211 Points +8%
Aorus 16X 2024
Intel Core i9-14900HX
2188 Points +7%
HP Omen Transcend 16-u1095ng
Intel Core i9-14900HX
2182 Points +7%
Average Intel Core i9-14900HX
  (1720 - 2245, n=34)
2157 Points +6%
Lenovo Legion Pro 5 16IRX9
Intel Core i9-14900HX
2122 Points +4%
SCHENKER XMG Fusion 15 (Early 24)
Intel Core i9-14900HX
2043 Points
Average of class Gaming
  (1088 - 2235, n=191, last 2 years)
1877 Points -8%
Alienware m16 R2
Intel Core Ultra 7 155H
1749 Points -14%
Cinebench R20
CPU (Multi Core)
SCHENKER XMG Fusion 15 (Early 24)
Intel Core i9-14900HX (Overboost)
11673 Points +38%
Lenovo Legion Pro 5 16IRX9
Intel Core i9-14900HX
11319 Points +34%
Average Intel Core i9-14900HX
  (6579 - 13832, n=34)
11084 Points +31%
Aorus 16X 2024
Intel Core i9-14900HX
10655 Points +26%
SCHENKER XMG Fusion 15 (Early 24)
Intel Core i9-14900HX
8465 Points
HP Omen Transcend 16-u1095ng
Intel Core i9-14900HX
8427 Points 0%
Average of class Gaming
  (2179 - 13832, n=191, last 2 years)
8240 Points -3%
Alienware m16 R2
Intel Core Ultra 7 155H
7050 Points -17%
CPU (Single Core)
SCHENKER XMG Fusion 15 (Early 24)
Intel Core i9-14900HX (Overboost)
844 Points +8%
Aorus 16X 2024
Intel Core i9-14900HX
841 Points +8%
HP Omen Transcend 16-u1095ng
Intel Core i9-14900HX
836 Points +7%
Average Intel Core i9-14900HX
  (657 - 859, n=34)
826 Points +6%
Lenovo Legion Pro 5 16IRX9
Intel Core i9-14900HX
812 Points +4%
SCHENKER XMG Fusion 15 (Early 24)
Intel Core i9-14900HX
779 Points
Average of class Gaming
  (427 - 856, n=191, last 2 years)
722 Points -7%
Alienware m16 R2
Intel Core Ultra 7 155H
674 Points -13%
Cinebench R15
CPU Multi 64Bit
Lenovo Legion Pro 5 16IRX9
Intel Core i9-14900HX
4591 (4151.1min - 4590.84max) Points +33%
SCHENKER XMG Fusion 15 (Early 24)
Intel Core i9-14900HX (Overboost)
4557 Points +32%
Average Intel Core i9-14900HX
  (3263 - 5589, n=35)
4462 Points +29%
Aorus 16X 2024
Intel Core i9-14900HX
4280 Points +24%
HP Omen Transcend 16-u1095ng
Intel Core i9-14900HX
3905 (2582.31min - 3904.72max) Points +13%
SCHENKER XMG Fusion 15 (Early 24)
Intel Core i9-14900HX
3458 Points
Average of class Gaming
  (905 - 5663, n=198, last 2 years)
3394 Points -2%
Alienware m16 R2
Intel Core Ultra 7 155H
2840 (2743.86min - 2839.9max) Points -18%
CPU Single 64Bit
Aorus 16X 2024
Intel Core i9-14900HX
312 Points +9%
SCHENKER XMG Fusion 15 (Early 24)
Intel Core i9-14900HX (Overboost)
312 Points +9%
Average Intel Core i9-14900HX
  (247 - 323, n=34)
306 Points +7%
Lenovo Legion Pro 5 16IRX9
Intel Core i9-14900HX
299 Points +4%
HP Omen Transcend 16-u1095ng
Intel Core i9-14900HX
298 Points +4%
SCHENKER XMG Fusion 15 (Early 24)
Intel Core i9-14900HX
287 Points
Average of class Gaming
  (176.6 - 318, n=195, last 2 years)
276 Points -4%
Alienware m16 R2
Intel Core Ultra 7 155H
256 Points -11%
Blender - v2.79 BMW27 CPU
Average of class Gaming
  (87 - 555, n=186, last 2 years)
172.1 Seconds * -25%
HP Omen Transcend 16-u1095ng
Intel Core i9-14900HX
164 Seconds * -19%
SCHENKER XMG Fusion 15 (Early 24)
Intel Core i9-14900HX
138 Seconds *
Aorus 16X 2024
Intel Core i9-14900HX
126 Seconds * +9%
Average Intel Core i9-14900HX
  (91 - 206, n=34)
119.5 Seconds * +13%
Lenovo Legion Pro 5 16IRX9
Intel Core i9-14900HX
113 Seconds * +18%
SCHENKER XMG Fusion 15 (Early 24)
Intel Core i9-14900HX (Overboost)
110 Seconds * +20%
7-Zip 18.03
7z b 4
SCHENKER XMG Fusion 15 (Early 24)
Intel Core i9-14900HX (Overboost)
121665 MIPS +24%
Lenovo Legion Pro 5 16IRX9
Intel Core i9-14900HX
115585 MIPS +18%
Average Intel Core i9-14900HX
  (66769 - 136645, n=34)
112494 MIPS +15%
Aorus 16X 2024
Intel Core i9-14900HX
106866 MIPS +9%
SCHENKER XMG Fusion 15 (Early 24)
Intel Core i9-14900HX
97929 MIPS
HP Omen Transcend 16-u1095ng
Intel Core i9-14900HX
88012 MIPS -10%
Average of class Gaming
  (23795 - 140932, n=190, last 2 years)
84653 MIPS -14%
Alienware m16 R2
Intel Core Ultra 7 155H
67581 MIPS -31%
7z b 4 -mmt1
SCHENKER XMG Fusion 15 (Early 24)
Intel Core i9-14900HX
7508 MIPS
SCHENKER XMG Fusion 15 (Early 24)
Intel Core i9-14900HX (Overboost)
7409 MIPS -1%
Aorus 16X 2024
Intel Core i9-14900HX
7297 MIPS -3%
HP Omen Transcend 16-u1095ng
Intel Core i9-14900HX
7142 MIPS -5%
Average Intel Core i9-14900HX
  (5452 - 7545, n=34)
7017 MIPS -7%
Lenovo Legion Pro 5 16IRX9
Intel Core i9-14900HX
6776 MIPS -10%
Average of class Gaming
  (4168 - 7581, n=190, last 2 years)
6281 MIPS -16%
Alienware m16 R2
Intel Core Ultra 7 155H
5037 MIPS -33%
Geekbench 6.3
Multi-Core
Lenovo Legion Pro 5 16IRX9
Intel Core i9-14900HX (6.2.1)
18126 Points +12%
SCHENKER XMG Fusion 15 (Early 24)
Intel Core i9-14900HX (6.2.1, Overboost)
18056 Points +11%
Aorus 16X 2024
Intel Core i9-14900HX (6.2.1)
17408 Points +7%
Average Intel Core i9-14900HX
  (13158 - 19665, n=34)
17369 Points +7%
SCHENKER XMG Fusion 15 (Early 24)
Intel Core i9-14900HX (6.2.1)
16196 Points
HP Omen Transcend 16-u1095ng
Intel Core i9-14900HX (6.2.1)
16011 Points -1%
Average of class Gaming
  (5340 - 19665, n=110, last 2 years)
14171 Points -13%
Alienware m16 R2
Intel Core Ultra 7 155H (6.2.1)
12670 Points -22%
Single-Core
SCHENKER XMG Fusion 15 (Early 24)
Intel Core i9-14900HX (6.2.1)
3081 Points
Aorus 16X 2024
Intel Core i9-14900HX (6.2.1)
3054 Points -1%
SCHENKER XMG Fusion 15 (Early 24)
Intel Core i9-14900HX (6.2.1, Overboost)
3032 Points -2%
Average Intel Core i9-14900HX
  (2419 - 3129, n=34)
2973 Points -4%
Lenovo Legion Pro 5 16IRX9
Intel Core i9-14900HX (6.2.1)
2889 Points -6%
HP Omen Transcend 16-u1095ng
Intel Core i9-14900HX (6.2.1)
2800 Points -9%
Average of class Gaming
  (1490 - 3129, n=110, last 2 years)
2641 Points -14%
Alienware m16 R2
Intel Core Ultra 7 155H (6.2.1)
2383 Points -23%
Geekbench 5.5
Multi-Core
Lenovo Legion Pro 5 16IRX9
Intel Core i9-14900HX
21299 Points +24%
SCHENKER XMG Fusion 15 (Early 24)
Intel Core i9-14900HX (Overboost)
20994 Points +22%
Aorus 16X 2024
Intel Core i9-14900HX
19607 Points +14%
Average Intel Core i9-14900HX
  (8618 - 23194, n=34)
19540 Points +14%
HP Omen Transcend 16-u1095ng
Intel Core i9-14900HX
17612 Points +2%
SCHENKER XMG Fusion 15 (Early 24)
Intel Core i9-14900HX
17214 Points
Average of class Gaming
  (4557 - 23194, n=191, last 2 years)
14891 Points -13%
Alienware m16 R2
Intel Core Ultra 7 155H
12328 Points -28%
Single-Core
Aorus 16X 2024
Intel Core i9-14900HX
2183 Points +4%
SCHENKER XMG Fusion 15 (Early 24)
Intel Core i9-14900HX (Overboost)
2152 Points +2%
SCHENKER XMG Fusion 15 (Early 24)
Intel Core i9-14900HX
2107 Points
Average Intel Core i9-14900HX
  (1669 - 2210, n=34)
2092 Points -1%
HP Omen Transcend 16-u1095ng
Intel Core i9-14900HX
2053 Points -3%
Lenovo Legion Pro 5 16IRX9
Intel Core i9-14900HX
2046 Points -3%
Average of class Gaming
  (986 - 2210, n=191, last 2 years)
1882 Points -11%
Alienware m16 R2
Intel Core Ultra 7 155H
1741 Points -17%
HWBOT x265 Benchmark v2.2 - 4k Preset
SCHENKER XMG Fusion 15 (Early 24)
Intel Core i9-14900HX (Overboost)
32.4 fps +35%
Lenovo Legion Pro 5 16IRX9
Intel Core i9-14900HX
30.1 fps +25%
Average Intel Core i9-14900HX
  (16.8 - 38.9, n=34)
29.7 fps +24%
Aorus 16X 2024
Intel Core i9-14900HX
27 fps +13%
SCHENKER XMG Fusion 15 (Early 24)
Intel Core i9-14900HX
24 fps
Average of class Gaming
  (6.72 - 38.9, n=190, last 2 years)
23.3 fps -3%
HP Omen Transcend 16-u1095ng
Intel Core i9-14900HX
22.7 fps -5%
Alienware m16 R2
Intel Core Ultra 7 155H
21.2 fps -12%
LibreOffice - 20 Documents To PDF
HP Omen Transcend 16-u1095ng
Intel Core i9-14900HX (6.3.4.2)
53.1 s * -37%
Alienware m16 R2
Intel Core Ultra 7 155H (6.3.4.2)
49.8 s * -28%
Average of class Gaming
  (31.4 - 96.6, n=187, last 2 years)
47.6 s * -22%
Average Intel Core i9-14900HX
  (31.4 - 85.1, n=34)
43.4 s * -12%
Lenovo Legion Pro 5 16IRX9
Intel Core i9-14900HX (6.3.4.2)
40.7 s * -5%
SCHENKER XMG Fusion 15 (Early 24)
Intel Core i9-14900HX (6.3.4.2)
38.9 s *
Aorus 16X 2024
Intel Core i9-14900HX (6.3.4.2)
38.5 s * +1%
SCHENKER XMG Fusion 15 (Early 24)
Intel Core i9-14900HX (6.3.4.2, Overboost)
36.1 s * +7%
R Benchmark 2.5 - Overall mean
Alienware m16 R2
Intel Core Ultra 7 155H
0.487 sec * -33%
Average of class Gaming
  (0.3609 - 0.759, n=191, last 2 years)
0.4402 sec * -21%
HP Omen Transcend 16-u1095ng
Intel Core i9-14900HX
0.3955 sec * -8%
Lenovo Legion Pro 5 16IRX9
Intel Core i9-14900HX
0.3917 sec * -7%
Average Intel Core i9-14900HX
  (0.3604 - 0.4859, n=34)
0.3845 sec * -5%
Aorus 16X 2024
Intel Core i9-14900HX
0.3782 sec * -4%
SCHENKER XMG Fusion 15 (Early 24)
Intel Core i9-14900HX (Overboost)
0.3684 sec * -1%
SCHENKER XMG Fusion 15 (Early 24)
Intel Core i9-14900HX
0.365 sec *

* ... im mniej tym lepiej

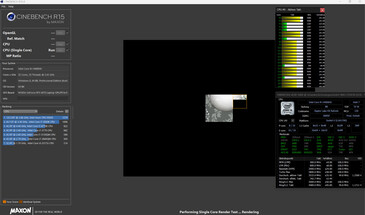
Cinebench R15 CPU Multi 64Bit
3458 Points
Cinebench R15 OpenGL 64Bit
276 fps
Cinebench R15 Ref. Match 64Bit
99.6 %
Cinebench R15 CPU Single 64Bit
287 Points
Cinebench R20 CPU (Multi Core)
8465 Points
Cinebench R20 CPU (Single Core)
779 Points
Cinebench R23 Multi Core
23124 Points
Cinebench R23 Single Core
2043 Points
Cinebench 2024 CPU Multi Core
1342 Points
Cinebench 2024 CPU Single Core
120.1 Points
Pomoc
Performance Rating
SCHENKER XMG Fusion 15 (Early 24)
Intel Core i9-14900HX, NVIDIA GeForce RTX 4070 Laptop GPU
99.4 pt
Lenovo Legion Pro 5 16IRX9
Intel Core i9-14900HX, NVIDIA GeForce RTX 4070 Laptop GPU
90.5 pt
Average Intel Core i9-14900HX
 
89.4 pt
Aorus 16X 2024
Intel Core i9-14900HX, NVIDIA GeForce RTX 4070 Laptop GPU
84.3 pt
SCHENKER XMG Fusion 15 (Early 24)
Intel Core i9-14900HX, NVIDIA GeForce RTX 4070 Laptop GPU
80.8 pt
Average of class Gaming
 
74.4 pt
HP Omen Transcend 16-u1095ng
Intel Core i9-14900HX, NVIDIA GeForce RTX 4070 Laptop GPU
67.6 pt
Alienware m16 R2
Intel Core Ultra 7 155H, NVIDIA GeForce RTX 4070 Laptop GPU
63.6 pt
AIDA64 / FP32 Ray-Trace
SCHENKER XMG Fusion 15 (Early 24)
Intel Core i9-14900HX, NVIDIA GeForce RTX 4070 Laptop GPU (v6.92.6600, Overboost)
27412 KRay/s +36%
Average Intel Core i9-14900HX
  (13098 - 33474, n=33)
25096 KRay/s +24%
Lenovo Legion Pro 5 16IRX9
Intel Core i9-14900HX, NVIDIA GeForce RTX 4070 Laptop GPU (v6.92.6600)
25072 KRay/s +24%
Aorus 16X 2024
Intel Core i9-14900HX, NVIDIA GeForce RTX 4070 Laptop GPU (v6.92.6600)
23082 KRay/s +14%
Average of class Gaming
  (4986 - 60169, n=187, last 2 years)
21640 KRay/s +7%
SCHENKER XMG Fusion 15 (Early 24)
Intel Core i9-14900HX, NVIDIA GeForce RTX 4070 Laptop GPU (v6.92.6600)
20224 KRay/s
Alienware m16 R2
Intel Core Ultra 7 155H, NVIDIA GeForce RTX 4070 Laptop GPU (v6.92.6600)
18470 KRay/s -9%
HP Omen Transcend 16-u1095ng
Intel Core i9-14900HX, NVIDIA GeForce RTX 4070 Laptop GPU (v6.92.6600)
17244 KRay/s -15%
AIDA64 / FPU Julia
SCHENKER XMG Fusion 15 (Early 24)
Intel Core i9-14900HX, NVIDIA GeForce RTX 4070 Laptop GPU (v6.92.6600, Overboost)
137215 Points +31%
Lenovo Legion Pro 5 16IRX9
Intel Core i9-14900HX, NVIDIA GeForce RTX 4070 Laptop GPU (v6.92.6600)
129169 Points +24%
Average Intel Core i9-14900HX
  (67573 - 166040, n=33)
125765 Points +20%
Aorus 16X 2024
Intel Core i9-14900HX, NVIDIA GeForce RTX 4070 Laptop GPU (v6.92.6600)
116836 Points +12%
Average of class Gaming
  (25360 - 252486, n=187, last 2 years)
106090 Points +1%
SCHENKER XMG Fusion 15 (Early 24)
Intel Core i9-14900HX, NVIDIA GeForce RTX 4070 Laptop GPU (v6.92.6600)
104545 Points
Alienware m16 R2
Intel Core Ultra 7 155H, NVIDIA GeForce RTX 4070 Laptop GPU (v6.92.6600)
92996 Points -11%
HP Omen Transcend 16-u1095ng
Intel Core i9-14900HX, NVIDIA GeForce RTX 4070 Laptop GPU (v6.92.6600)
88537 Points -15%
AIDA64 / CPU SHA3
SCHENKER XMG Fusion 15 (Early 24)
Intel Core i9-14900HX, NVIDIA GeForce RTX 4070 Laptop GPU (v6.92.6600, Overboost)
6905 MB/s +30%
Lenovo Legion Pro 5 16IRX9
Intel Core i9-14900HX, NVIDIA GeForce RTX 4070 Laptop GPU (v6.92.6600)
6285 MB/s +19%
Average Intel Core i9-14900HX
  (3589 - 7979, n=33)
6212 MB/s +17%
Aorus 16X 2024
Intel Core i9-14900HX, NVIDIA GeForce RTX 4070 Laptop GPU (v6.92.6600)
5723 MB/s +8%
SCHENKER XMG Fusion 15 (Early 24)
Intel Core i9-14900HX, NVIDIA GeForce RTX 4070 Laptop GPU (v6.92.6600)
5293 MB/s
Average of class Gaming
  (1339 - 10389, n=187, last 2 years)
4852 MB/s -8%
HP Omen Transcend 16-u1095ng
Intel Core i9-14900HX, NVIDIA GeForce RTX 4070 Laptop GPU (v6.92.6600)
4267 MB/s -19%
Alienware m16 R2
Intel Core Ultra 7 155H, NVIDIA GeForce RTX 4070 Laptop GPU (v6.92.6600)
4242 MB/s -20%
AIDA64 / CPU Queen
Lenovo Legion Pro 5 16IRX9
Intel Core i9-14900HX, NVIDIA GeForce RTX 4070 Laptop GPU (v6.92.6600)
142503 Points +9%
SCHENKER XMG Fusion 15 (Early 24)
Intel Core i9-14900HX, NVIDIA GeForce RTX 4070 Laptop GPU (v6.92.6600, Overboost)
139673 Points +7%
Aorus 16X 2024
Intel Core i9-14900HX, NVIDIA GeForce RTX 4070 Laptop GPU (v6.92.6600)
139355 Points +6%
Average Intel Core i9-14900HX
  (118405 - 148966, n=33)
138709 Points +6%
SCHENKER XMG Fusion 15 (Early 24)
Intel Core i9-14900HX, NVIDIA GeForce RTX 4070 Laptop GPU (v6.92.6600)
131076 Points
HP Omen Transcend 16-u1095ng
Intel Core i9-14900HX, NVIDIA GeForce RTX 4070 Laptop GPU (v6.92.6600)
118405 Points -10%
Average of class Gaming
  (50699 - 200651, n=187, last 2 years)
116237 Points -11%
Alienware m16 R2
Intel Core Ultra 7 155H, NVIDIA GeForce RTX 4070 Laptop GPU (v6.92.6600)
84180 Points -36%
AIDA64 / FPU SinJulia
SCHENKER XMG Fusion 15 (Early 24)
Intel Core i9-14900HX, NVIDIA GeForce RTX 4070 Laptop GPU (v6.92.6600, Overboost)
15756 Points +13%
Lenovo Legion Pro 5 16IRX9
Intel Core i9-14900HX, NVIDIA GeForce RTX 4070 Laptop GPU (v6.92.6600)
15401 Points +11%
Average Intel Core i9-14900HX
  (10475 - 18517, n=33)
15369 Points +10%
Aorus 16X 2024
Intel Core i9-14900HX, NVIDIA GeForce RTX 4070 Laptop GPU (v6.92.6600)
14830 Points +7%
SCHENKER XMG Fusion 15 (Early 24)
Intel Core i9-14900HX, NVIDIA GeForce RTX 4070 Laptop GPU (v6.92.6600)
13913 Points
Average of class Gaming
  (4800 - 32988, n=187, last 2 years)
13175 Points -5%
HP Omen Transcend 16-u1095ng
Intel Core i9-14900HX, NVIDIA GeForce RTX 4070 Laptop GPU (v6.92.6600)
12217 Points -12%
Alienware m16 R2
Intel Core Ultra 7 155H, NVIDIA GeForce RTX 4070 Laptop GPU (v6.92.6600)
10617 Points -24%
AIDA64 / FPU Mandel
SCHENKER XMG Fusion 15 (Early 24)
Intel Core i9-14900HX, NVIDIA GeForce RTX 4070 Laptop GPU (v6.92.6600, Overboost)
68400 Points +34%
Lenovo Legion Pro 5 16IRX9
Intel Core i9-14900HX, NVIDIA GeForce RTX 4070 Laptop GPU (v6.92.6600)
62567 Points +22%
Average Intel Core i9-14900HX
  (32543 - 83662, n=33)
61872 Points +21%
Aorus 16X 2024
Intel Core i9-14900HX, NVIDIA GeForce RTX 4070 Laptop GPU (v6.92.6600)
57633 Points +13%
Average of class Gaming
  (12321 - 134044, n=187, last 2 years)
53471 Points +5%
SCHENKER XMG Fusion 15 (Early 24)
Intel Core i9-14900HX, NVIDIA GeForce RTX 4070 Laptop GPU (v6.92.6600)
51088 Points
Alienware m16 R2
Intel Core Ultra 7 155H, NVIDIA GeForce RTX 4070 Laptop GPU (v6.92.6600)
47685 Points -7%
HP Omen Transcend 16-u1095ng
Intel Core i9-14900HX, NVIDIA GeForce RTX 4070 Laptop GPU (v6.92.6600)
43302 Points -15%
AIDA64 / CPU AES
SCHENKER XMG Fusion 15 (Early 24)
Intel Core i9-14900HX, NVIDIA GeForce RTX 4070 Laptop GPU (v6.92.6600, Overboost)
236096 MB/s +24%
SCHENKER XMG Fusion 15 (Early 24)
Intel Core i9-14900HX, NVIDIA GeForce RTX 4070 Laptop GPU (v6.92.6600)
190740 MB/s
Average Intel Core i9-14900HX
  (86964 - 241777, n=33)
137399 MB/s -28%
Lenovo Legion Pro 5 16IRX9
Intel Core i9-14900HX, NVIDIA GeForce RTX 4070 Laptop GPU (v6.92.6600)
120213 MB/s -37%
Aorus 16X 2024
Intel Core i9-14900HX, NVIDIA GeForce RTX 4070 Laptop GPU (v6.92.6600)
112833 MB/s -41%
Average of class Gaming
  (19065 - 328679, n=187, last 2 years)
109176 MB/s -43%
HP Omen Transcend 16-u1095ng
Intel Core i9-14900HX, NVIDIA GeForce RTX 4070 Laptop GPU (v6.92.6600)
86964 MB/s -54%
Alienware m16 R2
Intel Core Ultra 7 155H, NVIDIA GeForce RTX 4070 Laptop GPU (v6.92.6600)
82757 MB/s -57%
AIDA64 / CPU ZLib
SCHENKER XMG Fusion 15 (Early 24)
Intel Core i9-14900HX, NVIDIA GeForce RTX 4070 Laptop GPU (v6.92.6600, Overboost)
1957 MB/s +32%
Lenovo Legion Pro 5 16IRX9
Intel Core i9-14900HX, NVIDIA GeForce RTX 4070 Laptop GPU (v6.92.6600)
1866 MB/s +26%
Average Intel Core i9-14900HX
  (1054 - 2292, n=33)
1815 MB/s +22%
Aorus 16X 2024
Intel Core i9-14900HX, NVIDIA GeForce RTX 4070 Laptop GPU (v6.92.6600)
1662 MB/s +12%
SCHENKER XMG Fusion 15 (Early 24)
Intel Core i9-14900HX, NVIDIA GeForce RTX 4070 Laptop GPU (v6.92.6600)
1485 MB/s
Average of class Gaming
  (373 - 2409, n=187, last 2 years)
1349 MB/s -9%
HP Omen Transcend 16-u1095ng
Intel Core i9-14900HX, NVIDIA GeForce RTX 4070 Laptop GPU (v6.92.6600)
1265 MB/s -15%
Alienware m16 R2
Intel Core Ultra 7 155H, NVIDIA GeForce RTX 4070 Laptop GPU (v6.92.6600)
1219 MB/s -18%
AIDA64 / FP64 Ray-Trace
SCHENKER XMG Fusion 15 (Early 24)
Intel Core i9-14900HX, NVIDIA GeForce RTX 4070 Laptop GPU (v6.92.6600, Overboost)
14882 KRay/s +35%
Lenovo Legion Pro 5 16IRX9
Intel Core i9-14900HX, NVIDIA GeForce RTX 4070 Laptop GPU (v6.92.6600)
13776 KRay/s +25%
Average Intel Core i9-14900HX
  (6809 - 18349, n=33)
13525 KRay/s +23%
Aorus 16X 2024
Intel Core i9-14900HX, NVIDIA GeForce RTX 4070 Laptop GPU (v6.92.6600)
12355 KRay/s +12%
Average of class Gaming
  (2540 - 31796, n=187, last 2 years)
11654 KRay/s +6%
SCHENKER XMG Fusion 15 (Early 24)
Intel Core i9-14900HX, NVIDIA GeForce RTX 4070 Laptop GPU (v6.92.6600)
11009 KRay/s
Alienware m16 R2
Intel Core Ultra 7 155H, NVIDIA GeForce RTX 4070 Laptop GPU (v6.92.6600)
9802 KRay/s -11%
HP Omen Transcend 16-u1095ng
Intel Core i9-14900HX, NVIDIA GeForce RTX 4070 Laptop GPU (v6.92.6600)
9170 KRay/s -17%
AIDA64 / CPU PhotoWorxx
Lenovo Legion Pro 5 16IRX9
Intel Core i9-14900HX, NVIDIA GeForce RTX 4070 Laptop GPU (v6.92.6600)
49676 MPixel/s +5%
HP Omen Transcend 16-u1095ng
Intel Core i9-14900HX, NVIDIA GeForce RTX 4070 Laptop GPU (v6.92.6600)
49507 MPixel/s +4%
Aorus 16X 2024
Intel Core i9-14900HX, NVIDIA GeForce RTX 4070 Laptop GPU (v6.92.6600)
49217 MPixel/s +4%
SCHENKER XMG Fusion 15 (Early 24)
Intel Core i9-14900HX, NVIDIA GeForce RTX 4070 Laptop GPU (v6.92.6600, Overboost)
47721 MPixel/s +1%
SCHENKER XMG Fusion 15 (Early 24)
Intel Core i9-14900HX, NVIDIA GeForce RTX 4070 Laptop GPU (v6.92.6600)
47411 MPixel/s
Average Intel Core i9-14900HX
  (23903 - 54702, n=33)
46637 MPixel/s -2%
Average of class Gaming
  (10805 - 60161, n=188, last 2 years)
39919 MPixel/s -16%
Alienware m16 R2
Intel Core Ultra 7 155H, NVIDIA GeForce RTX 4070 Laptop GPU (v6.92.6600)
39532 MPixel/s -17%

Wydajność systemu

Płynnie działającemu systemowi nie brakuje mocy obliczeniowej. Gry, streaming i rendering nie stanowią dla laptopa większego wyzwania. Prędkości transferu pamięci RAM mieszczą się w normie dla pamięci DDR5-5600. Wyniki w PCMark również były dobre.

Pamięć RAM działa w trybie dwukanałowym.
PCMark 10 / Score
Lenovo Legion Pro 5 16IRX9
NVIDIA GeForce RTX 4070 Laptop GPU, i9-14900HX, Samsung PM9A1 MZVL21T0HCLR
8550 Points 0%
SCHENKER XMG Fusion 15 (Early 24)
NVIDIA GeForce RTX 4070 Laptop GPU, i9-14900HX, Samsung 990 Pro 1 TB
8522 Points
Aorus 16X 2024
NVIDIA GeForce RTX 4070 Laptop GPU, i9-14900HX, Gigabyte AG450E1024-SI
8389 Points -2%
Average Intel Core i9-14900HX, NVIDIA GeForce RTX 4070 Laptop GPU
  (7866 - 8550, n=6)
8253 Points -3%
HP Omen Transcend 16-u1095ng
NVIDIA GeForce RTX 4070 Laptop GPU, i9-14900HX, Kioxia XG8 KXG80ZNV1T02
7866 Points -8%
Average of class Gaming
  (5776 - 9852, n=168, last 2 years)
7774 Points -9%
Alienware m16 R2
NVIDIA GeForce RTX 4070 Laptop GPU, Ultra 7 155H, Samsung PM9A1 MZVL21T0HCLR
7761 Points -9%
PCMark 10 / Essentials
SCHENKER XMG Fusion 15 (Early 24)
NVIDIA GeForce RTX 4070 Laptop GPU, i9-14900HX, Samsung 990 Pro 1 TB
11815 Points
Lenovo Legion Pro 5 16IRX9
NVIDIA GeForce RTX 4070 Laptop GPU, i9-14900HX, Samsung PM9A1 MZVL21T0HCLR
11286 Points -4%
Average Intel Core i9-14900HX, NVIDIA GeForce RTX 4070 Laptop GPU
  (10621 - 11815, n=6)
11079 Points -6%
Aorus 16X 2024
NVIDIA GeForce RTX 4070 Laptop GPU, i9-14900HX, Gigabyte AG450E1024-SI
11071 Points -6%
Average of class Gaming
  (9057 - 12334, n=167, last 2 years)
10836 Points -8%
HP Omen Transcend 16-u1095ng
NVIDIA GeForce RTX 4070 Laptop GPU, i9-14900HX, Kioxia XG8 KXG80ZNV1T02
10621 Points -10%
Alienware m16 R2
NVIDIA GeForce RTX 4070 Laptop GPU, Ultra 7 155H, Samsung PM9A1 MZVL21T0HCLR
10330 Points -13%
PCMark 10 / Productivity
Aorus 16X 2024
NVIDIA GeForce RTX 4070 Laptop GPU, i9-14900HX, Gigabyte AG450E1024-SI
11103 Points +3%
SCHENKER XMG Fusion 15 (Early 24)
NVIDIA GeForce RTX 4070 Laptop GPU, i9-14900HX, Samsung 990 Pro 1 TB
10731 Points
Average Intel Core i9-14900HX, NVIDIA GeForce RTX 4070 Laptop GPU
  (9701 - 11103, n=6)
10493 Points -2%
HP Omen Transcend 16-u1095ng
NVIDIA GeForce RTX 4070 Laptop GPU, i9-14900HX, Kioxia XG8 KXG80ZNV1T02
10268 Points -4%
Lenovo Legion Pro 5 16IRX9
NVIDIA GeForce RTX 4070 Laptop GPU, i9-14900HX, Samsung PM9A1 MZVL21T0HCLR
10139 Points -6%
Average of class Gaming
  (6662 - 14612, n=167, last 2 years)
9878 Points -8%
Alienware m16 R2
NVIDIA GeForce RTX 4070 Laptop GPU, Ultra 7 155H, Samsung PM9A1 MZVL21T0HCLR
9422 Points -12%
PCMark 10 / Digital Content Creation
Lenovo Legion Pro 5 16IRX9
NVIDIA GeForce RTX 4070 Laptop GPU, i9-14900HX, Samsung PM9A1 MZVL21T0HCLR
14827 Points +12%
SCHENKER XMG Fusion 15 (Early 24)
NVIDIA GeForce RTX 4070 Laptop GPU, i9-14900HX, Samsung 990 Pro 1 TB
13247 Points
Average Intel Core i9-14900HX, NVIDIA GeForce RTX 4070 Laptop GPU
  (12114 - 14827, n=6)
13153 Points -1%
Aorus 16X 2024
NVIDIA GeForce RTX 4070 Laptop GPU, i9-14900HX, Gigabyte AG450E1024-SI
13036 Points -2%
Alienware m16 R2
NVIDIA GeForce RTX 4070 Laptop GPU, Ultra 7 155H, Samsung PM9A1 MZVL21T0HCLR
13035 Points -2%
HP Omen Transcend 16-u1095ng
NVIDIA GeForce RTX 4070 Laptop GPU, i9-14900HX, Kioxia XG8 KXG80ZNV1T02
12114 Points -9%
Average of class Gaming
  (6703 - 18475, n=167, last 2 years)
12030 Points -9%
CrossMark / Overall
Aorus 16X 2024
NVIDIA GeForce RTX 4070 Laptop GPU, i9-14900HX, Gigabyte AG450E1024-SI
2312 Points +5%
SCHENKER XMG Fusion 15 (Early 24)
NVIDIA GeForce RTX 4070 Laptop GPU, i9-14900HX, Samsung 990 Pro 1 TB
2203 Points
Average Intel Core i9-14900HX, NVIDIA GeForce RTX 4070 Laptop GPU
  (2002 - 2312, n=5)
2179 Points -1%
Lenovo Legion Pro 5 16IRX9
NVIDIA GeForce RTX 4070 Laptop GPU, i9-14900HX, Samsung PM9A1 MZVL21T0HCLR
2002 Points -9%
Average of class Gaming
  (1247 - 2344, n=151, last 2 years)
1899 Points -14%
Alienware m16 R2
NVIDIA GeForce RTX 4070 Laptop GPU, Ultra 7 155H, Samsung PM9A1 MZVL21T0HCLR
1762 Points -20%
CrossMark / Productivity
Aorus 16X 2024
NVIDIA GeForce RTX 4070 Laptop GPU, i9-14900HX, Gigabyte AG450E1024-SI
2191 Points +4%
SCHENKER XMG Fusion 15 (Early 24)
NVIDIA GeForce RTX 4070 Laptop GPU, i9-14900HX, Samsung 990 Pro 1 TB
2109 Points
Average Intel Core i9-14900HX, NVIDIA GeForce RTX 4070 Laptop GPU
  (1827 - 2191, n=5)
2042 Points -3%
Lenovo Legion Pro 5 16IRX9
NVIDIA GeForce RTX 4070 Laptop GPU, i9-14900HX, Samsung PM9A1 MZVL21T0HCLR
1827 Points -13%
Average of class Gaming
  (1299 - 2204, n=151, last 2 years)
1801 Points -15%
Alienware m16 R2
NVIDIA GeForce RTX 4070 Laptop GPU, Ultra 7 155H, Samsung PM9A1 MZVL21T0HCLR
1684 Points -20%
CrossMark / Creativity
Aorus 16X 2024
NVIDIA GeForce RTX 4070 Laptop GPU, i9-14900HX, Gigabyte AG450E1024-SI
2458 Points +4%
Average Intel Core i9-14900HX, NVIDIA GeForce RTX 4070 Laptop GPU
  (2287 - 2458, n=5)
2385 Points +1%
SCHENKER XMG Fusion 15 (Early 24)
NVIDIA GeForce RTX 4070 Laptop GPU, i9-14900HX, Samsung 990 Pro 1 TB
2358 Points
Lenovo Legion Pro 5 16IRX9
NVIDIA GeForce RTX 4070 Laptop GPU, i9-14900HX, Samsung PM9A1 MZVL21T0HCLR
2287 Points -3%
Average of class Gaming
  (1275 - 2660, n=151, last 2 years)
2083 Points -12%
Alienware m16 R2
NVIDIA GeForce RTX 4070 Laptop GPU, Ultra 7 155H, Samsung PM9A1 MZVL21T0HCLR
1913 Points -19%
CrossMark / Responsiveness
Aorus 16X 2024
NVIDIA GeForce RTX 4070 Laptop GPU, i9-14900HX, Gigabyte AG450E1024-SI
2259 Points +10%
SCHENKER XMG Fusion 15 (Early 24)
NVIDIA GeForce RTX 4070 Laptop GPU, i9-14900HX, Samsung 990 Pro 1 TB
2049 Points
Average Intel Core i9-14900HX, NVIDIA GeForce RTX 4070 Laptop GPU
  (1734 - 2330, n=5)
2028 Points -1%
Lenovo Legion Pro 5 16IRX9
NVIDIA GeForce RTX 4070 Laptop GPU, i9-14900HX, Samsung PM9A1 MZVL21T0HCLR
1769 Points -14%
Average of class Gaming
  (1030 - 2330, n=151, last 2 years)
1699 Points -17%
Alienware m16 R2
NVIDIA GeForce RTX 4070 Laptop GPU, Ultra 7 155H, Samsung PM9A1 MZVL21T0HCLR
1576 Points -23%
WebXPRT 3 / Overall
HP Omen Transcend 16-u1095ng
NVIDIA GeForce RTX 4070 Laptop GPU, i9-14900HX, Kioxia XG8 KXG80ZNV1T02
342 Points 0%
SCHENKER XMG Fusion 15 (Early 24)
NVIDIA GeForce RTX 4070 Laptop GPU, i9-14900HX, Samsung 990 Pro 1 TB
342 Points
Average Intel Core i9-14900HX, NVIDIA GeForce RTX 4070 Laptop GPU
  (319 - 342, n=6)
333 Points -3%
Aorus 16X 2024
NVIDIA GeForce RTX 4070 Laptop GPU, i9-14900HX, Gigabyte AG450E1024-SI
330 Points -4%
Lenovo Legion Pro 5 16IRX9
NVIDIA GeForce RTX 4070 Laptop GPU, i9-14900HX, Samsung PM9A1 MZVL21T0HCLR
322 Points -6%
Average of class Gaming
  (215 - 480, n=165, last 2 years)
303 Points -11%
Alienware m16 R2
NVIDIA GeForce RTX 4070 Laptop GPU, Ultra 7 155H, Samsung PM9A1 MZVL21T0HCLR
294 Points -14%
WebXPRT 4 / Overall
SCHENKER XMG Fusion 15 (Early 24)
NVIDIA GeForce RTX 4070 Laptop GPU, i9-14900HX, Samsung 990 Pro 1 TB
301 Points
Average Intel Core i9-14900HX, NVIDIA GeForce RTX 4070 Laptop GPU
  (291 - 301, n=4)
298 Points -1%
Lenovo Legion Pro 5 16IRX9
NVIDIA GeForce RTX 4070 Laptop GPU, i9-14900HX, Samsung PM9A1 MZVL21T0HCLR
291 Points -3%
Average of class Gaming
  (157.9 - 328, n=153, last 2 years)
266 Points -12%
Alienware m16 R2
NVIDIA GeForce RTX 4070 Laptop GPU, Ultra 7 155H, Samsung PM9A1 MZVL21T0HCLR
257 Points -15%
Mozilla Kraken 1.1 / Total
Alienware m16 R2
NVIDIA GeForce RTX 4070 Laptop GPU, Ultra 7 155H, Samsung PM9A1 MZVL21T0HCLR
546 ms * -27%
Average of class Gaming
  (421 - 779, n=179, last 2 years)
506 ms * -17%
Lenovo Legion Pro 5 16IRX9
NVIDIA GeForce RTX 4070 Laptop GPU, i9-14900HX, Samsung PM9A1 MZVL21T0HCLR
449 ms * -4%
Average Intel Core i9-14900HX, NVIDIA GeForce RTX 4070 Laptop GPU
  (431 - 461, n=6)
443 ms * -3%
HP Omen Transcend 16-u1095ng
NVIDIA GeForce RTX 4070 Laptop GPU, i9-14900HX, Kioxia XG8 KXG80ZNV1T02
438 ms * -2%
Aorus 16X 2024
NVIDIA GeForce RTX 4070 Laptop GPU, i9-14900HX, Gigabyte AG450E1024-SI
436 ms * -1%
SCHENKER XMG Fusion 15 (Early 24)
NVIDIA GeForce RTX 4070 Laptop GPU, i9-14900HX, Samsung 990 Pro 1 TB
431 ms *

* ... im mniej tym lepiej

PCMark 10 Score
8522 pkt.
Pomoc
AIDA64 / Memory Copy
Lenovo Legion Pro 5 16IRX9
Intel Core i9-14900HX, NVIDIA GeForce RTX 4070 Laptop GPU
78979 MB/s +2%
Aorus 16X 2024
Intel Core i9-14900HX, NVIDIA GeForce RTX 4070 Laptop GPU
78854 MB/s +2%
HP Omen Transcend 16-u1095ng
Intel Core i9-14900HX, NVIDIA GeForce RTX 4070 Laptop GPU
78330 MB/s +1%
SCHENKER XMG Fusion 15 (Early 24)
Intel Core i9-14900HX, NVIDIA GeForce RTX 4070 Laptop GPU
77669 MB/s
Average Intel Core i9-14900HX
  (38028 - 83392, n=33)
74739 MB/s -4%
Average of class Gaming
  (21842 - 94222, n=187, last 2 years)
64907 MB/s -16%
Alienware m16 R2
Intel Core Ultra 7 155H, NVIDIA GeForce RTX 4070 Laptop GPU
63008 MB/s -19%
AIDA64 / Memory Read
Aorus 16X 2024
Intel Core i9-14900HX, NVIDIA GeForce RTX 4070 Laptop GPU
86538 MB/s +1%
Lenovo Legion Pro 5 16IRX9
Intel Core i9-14900HX, NVIDIA GeForce RTX 4070 Laptop GPU
86376 MB/s +1%
SCHENKER XMG Fusion 15 (Early 24)
Intel Core i9-14900HX, NVIDIA GeForce RTX 4070 Laptop GPU
85867 MB/s
HP Omen Transcend 16-u1095ng
Intel Core i9-14900HX, NVIDIA GeForce RTX 4070 Laptop GPU
85070 MB/s -1%
Average Intel Core i9-14900HX
  (43306 - 87568, n=33)
80919 MB/s -6%
Alienware m16 R2
Intel Core Ultra 7 155H, NVIDIA GeForce RTX 4070 Laptop GPU
76370 MB/s -11%
Average of class Gaming
  (23681 - 99713, n=187, last 2 years)
68658 MB/s -20%
AIDA64 / Memory Write
HP Omen Transcend 16-u1095ng
Intel Core i9-14900HX, NVIDIA GeForce RTX 4070 Laptop GPU
77579 MB/s +7%
Aorus 16X 2024
Intel Core i9-14900HX, NVIDIA GeForce RTX 4070 Laptop GPU
77406 MB/s +7%
Lenovo Legion Pro 5 16IRX9
Intel Core i9-14900HX, NVIDIA GeForce RTX 4070 Laptop GPU
77346 MB/s +7%
SCHENKER XMG Fusion 15 (Early 24)
Intel Core i9-14900HX, NVIDIA GeForce RTX 4070 Laptop GPU
72287 MB/s
Average Intel Core i9-14900HX
  (37146 - 80589, n=33)
71949 MB/s 0%
Average of class Gaming
  (22986 - 108954, n=187, last 2 years)
66727 MB/s -8%
Alienware m16 R2
Intel Core Ultra 7 155H, NVIDIA GeForce RTX 4070 Laptop GPU
66009 MB/s -9%
AIDA64 / Memory Latency
Alienware m16 R2
Intel Core Ultra 7 155H, NVIDIA GeForce RTX 4070 Laptop GPU
126.2 ns * -52%
Average of class Gaming
  (59.5 - 259, n=187, last 2 years)
94.1 ns * -13%
HP Omen Transcend 16-u1095ng
Intel Core i9-14900HX, NVIDIA GeForce RTX 4070 Laptop GPU
86.5 ns * -4%
Average Intel Core i9-14900HX
  (76.1 - 105, n=33)
84.8 ns * -2%
Lenovo Legion Pro 5 16IRX9
Intel Core i9-14900HX, NVIDIA GeForce RTX 4070 Laptop GPU
83.4 ns * -0%
SCHENKER XMG Fusion 15 (Early 24)
Intel Core i9-14900HX, NVIDIA GeForce RTX 4070 Laptop GPU
83.1 ns *
Aorus 16X 2024
Intel Core i9-14900HX, NVIDIA GeForce RTX 4070 Laptop GPU
82.5 ns * +1%

* ... im mniej tym lepiej

Opóźnienia DPC

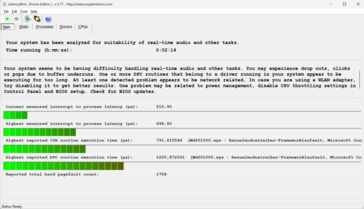
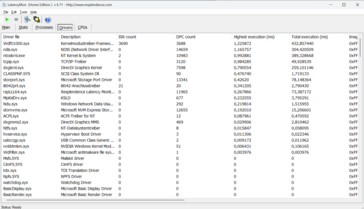
Standardowy test monitora opóźnień (surfowanie po Internecie, odtwarzanie wideo 4k, wysokie obciążenie Prime95) ujawnił pewne anomalie. System nie wydaje się być odpowiedni do edycji wideo i audio w czasie rzeczywistym. Przyszłe aktualizacje oprogramowania mogą przynieść poprawę lub nawet pogorszenie.

Monitor opóźnienia
Monitor opóźnienia
Monitor opóźnienia
Monitor opóźnienia
DPC Latencies / LatencyMon - interrupt to process latency (max), Web, Youtube, Prime95
Alienware m16 R2
NVIDIA GeForce RTX 4070 Laptop GPU, Ultra 7 155H, Samsung PM9A1 MZVL21T0HCLR
2037.7 μs * -192%
HP Omen Transcend 16-u1095ng
NVIDIA GeForce RTX 4070 Laptop GPU, i9-14900HX, Kioxia XG8 KXG80ZNV1T02
1566 μs * -124%
Aorus 16X 2024
NVIDIA GeForce RTX 4070 Laptop GPU, i9-14900HX, Gigabyte AG450E1024-SI
1162.9 μs * -66%
Lenovo Legion Pro 5 16IRX9
NVIDIA GeForce RTX 4070 Laptop GPU, i9-14900HX, Samsung PM9A1 MZVL21T0HCLR
989.1 μs * -42%
SCHENKER XMG Fusion 15 (Early 24)
NVIDIA GeForce RTX 4070 Laptop GPU, i9-14900HX, Samsung 990 Pro 1 TB
698.6 μs *

* ... im mniej tym lepiej

Urządzenia pamięci masowej

Fusion może pomieścić łącznie dwa dyski SSD PCIe-4 w formacie M.2-2280. Obsługiwany jest RAID-0/1. Dysk Samsung SSD (1 TB) zastosowany w naszym urządzeniu testowym zapewnił doskonałą szybkość transmisji danych. Pozytywne: Nie odnotowaliśmy żadnego dławienia termicznego.

Laptop może pomieścić dwa dyski SSD PCIe-4.
Samsung 990 Pro 1 TB
CDM 5/6 Read Seq Q32T1: 7119 MB/s
CDM 5/6 Write Seq Q32T1: 6895 MB/s
CDM 5/6 Read 4K Q32T1: 790 MB/s
CDM 5/6 Write 4K Q32T1: 550.9 MB/s
CDM 5 Read Seq: 2954 MB/s
CDM 5 Write Seq: 4529 MB/s
CDM 5/6 Read 4K: 65.05 MB/s
CDM 5/6 Write 4K: 281.6 MB/s
Drive Performance Rating - Percent
SCHENKER XMG Fusion 15 (Early 24)
Samsung 990 Pro 1 TB
89.9 pt
Average Samsung 990 Pro 1 TB
 
83.3 pt
Lenovo Legion Pro 5 16IRX9
Samsung PM9A1 MZVL21T0HCLR
81.5 pt
Aorus 16X 2024
Gigabyte AG450E1024-SI
78.5 pt
Alienware m16 R2
Samsung PM9A1 MZVL21T0HCLR
77.6 pt
Average of class Gaming
 
68.1 pt
HP Omen Transcend 16-u1095ng
Kioxia XG8 KXG80ZNV1T02
57.7 pt
DiskSpd
seq read
Alienware m16 R2
Samsung PM9A1 MZVL21T0HCLR
4480 (4426.62min - 4479.73max) MB/s +23%
Lenovo Legion Pro 5 16IRX9
Samsung PM9A1 MZVL21T0HCLR
4037 (3964.04min - 4036.7max) MB/s +11%
SCHENKER XMG Fusion 15 (Early 24)
Samsung 990 Pro 1 TB
3645 (3579.03min - 3644.85max) MB/s
Average of class Gaming
  (1319 - 7045, n=168, last 2 years)
3487 MB/s -4%
Average Samsung 990 Pro 1 TB
  (2556 - 4234, n=18)
3249 MB/s -11%
HP Omen Transcend 16-u1095ng
Kioxia XG8 KXG80ZNV1T02
3102 (3080.64min - 3101.78max) MB/s -15%
Aorus 16X 2024
Gigabyte AG450E1024-SI
2620 (2556.56min - 2619.76max) MB/s -28%
seq write
Average Samsung 990 Pro 1 TB
  (3598 - 5842, n=18)
4777 MB/s +10%
Aorus 16X 2024
Gigabyte AG450E1024-SI
4757 (4720.06min - 4757.31max) MB/s +10%
Alienware m16 R2
Samsung PM9A1 MZVL21T0HCLR
4371 (4342.15min - 4371.09max) MB/s +1%
SCHENKER XMG Fusion 15 (Early 24)
Samsung 990 Pro 1 TB
4342 (4320.81min - 4342.28max) MB/s
Lenovo Legion Pro 5 16IRX9
Samsung PM9A1 MZVL21T0HCLR
4093 (4016.82min - 4092.8max) MB/s -6%
Average of class Gaming
  (535 - 9307, n=168, last 2 years)
3797 MB/s -13%
HP Omen Transcend 16-u1095ng
Kioxia XG8 KXG80ZNV1T02
3038 (2862.26min - 3038.15max) MB/s -30%
seq q8 t1 read
Average Samsung 990 Pro 1 TB
  (7011 - 7148, n=18)
7091 MB/s +1%
Alienware m16 R2
Samsung PM9A1 MZVL21T0HCLR
7079 (6575.14min - 7078.73max) MB/s +1%
SCHENKER XMG Fusion 15 (Early 24)
Samsung 990 Pro 1 TB
7011 (6063.46min - 7010.81max) MB/s
Lenovo Legion Pro 5 16IRX9
Samsung PM9A1 MZVL21T0HCLR
6636 (6205.02min - 6635.75max) MB/s -5%
HP Omen Transcend 16-u1095ng
Kioxia XG8 KXG80ZNV1T02
6388 (5544.27min - 6387.72max) MB/s -9%
Average of class Gaming
  (2594 - 16089, n=168, last 2 years)
6328 MB/s -10%
Aorus 16X 2024
Gigabyte AG450E1024-SI
5181 (4323.23min - 5181.35max) MB/s -26%
seq q8 t1 write
SCHENKER XMG Fusion 15 (Early 24)
Samsung 990 Pro 1 TB
6897 MB/s
Average Samsung 990 Pro 1 TB
  (6531 - 6898, n=18)
6802 MB/s -1%
Alienware m16 R2
Samsung PM9A1 MZVL21T0HCLR
5250 (5191.5min - 5250.22max) MB/s -24%
HP Omen Transcend 16-u1095ng
Kioxia XG8 KXG80ZNV1T02
5234 (5167.11min - 5234.47max) MB/s -24%
Lenovo Legion Pro 5 16IRX9
Samsung PM9A1 MZVL21T0HCLR
4949 (4932.28min - 4948.61max) MB/s -28%
Average of class Gaming
  (539 - 14571, n=168, last 2 years)
4823 MB/s -30%
Aorus 16X 2024
Gigabyte AG450E1024-SI
4821 (4606.6min - 4820.72max) MB/s -30%
4k q1 t1 read
Lenovo Legion Pro 5 16IRX9
Samsung PM9A1 MZVL21T0HCLR
92.7 (91.49min - 92.68max) MB/s +29%
Alienware m16 R2
Samsung PM9A1 MZVL21T0HCLR
83.5 (82.8min - 83.52max) MB/s +16%
Average Samsung 990 Pro 1 TB
  (55.3 - 99, n=18)
76.4 MB/s +6%
SCHENKER XMG Fusion 15 (Early 24)
Samsung 990 Pro 1 TB
71.8 MB/s
Average of class Gaming
  (30.6 - 95.9, n=168, last 2 years)
65.8 MB/s -8%
HP Omen Transcend 16-u1095ng
Kioxia XG8 KXG80ZNV1T02
51.3 (50.48min - 51.25max) MB/s -29%
Aorus 16X 2024
Gigabyte AG450E1024-SI
47.2 (45.9min - 47.16max) MB/s -34%
4k q1 t1 write
Aorus 16X 2024
Gigabyte AG450E1024-SI
340 (329.38min - 339.78max) MB/s +17%
SCHENKER XMG Fusion 15 (Early 24)
Samsung 990 Pro 1 TB
290 (278.05min - 290.22max) MB/s
Lenovo Legion Pro 5 16IRX9
Samsung PM9A1 MZVL21T0HCLR
251 (249.74min - 251.16max) MB/s -13%
Average Samsung 990 Pro 1 TB
  (133.9 - 343, n=18)
235 MB/s -19%
Average of class Gaming
  (66.6 - 397, n=168, last 2 years)
222 MB/s -23%
Alienware m16 R2
Samsung PM9A1 MZVL21T0HCLR
198.1 (195.9min - 198.06max) MB/s -32%
HP Omen Transcend 16-u1095ng
Kioxia XG8 KXG80ZNV1T02
128.1 (123.78min - 128.05max) MB/s -56%
4k q32 t16 read
SCHENKER XMG Fusion 15 (Early 24)
Samsung 990 Pro 1 TB
4915 (4860.82min - 4914.87max) MB/s
Lenovo Legion Pro 5 16IRX9
Samsung PM9A1 MZVL21T0HCLR
4055 (4044.11min - 4055.48max) MB/s -17%
Alienware m16 R2
Samsung PM9A1 MZVL21T0HCLR
3630 (3471.35min - 3629.9max) MB/s -26%
Average Samsung 990 Pro 1 TB
  (818 - 4926, n=18)
3327 MB/s -32%
Aorus 16X 2024
Gigabyte AG450E1024-SI
3302 (3194.22min - 3302.44max) MB/s -33%
Average of class Gaming
  (417 - 6172, n=168, last 2 years)
2555 MB/s -48%
HP Omen Transcend 16-u1095ng
Kioxia XG8 KXG80ZNV1T02
900 (832.36min - 900.34max) MB/s -82%
4k q32 t16 write
Lenovo Legion Pro 5 16IRX9
Samsung PM9A1 MZVL21T0HCLR
3542 (3491.17min - 3541.69max) MB/s +4%
Aorus 16X 2024
Gigabyte AG450E1024-SI
3443 (3007.99min - 3443.05max) MB/s +1%
SCHENKER XMG Fusion 15 (Early 24)
Samsung 990 Pro 1 TB
3406 (3365.94min - 3405.88max) MB/s
Alienware m16 R2
Samsung PM9A1 MZVL21T0HCLR
3003 (2991.33min - 3002.71max) MB/s -12%
Average Samsung 990 Pro 1 TB
  (413 - 4683, n=18)
2563 MB/s -25%
Average of class Gaming
  (162.3 - 4869, n=168, last 2 years)
2101 MB/s -38%
HP Omen Transcend 16-u1095ng
Kioxia XG8 KXG80ZNV1T02
438 (405.08min - 437.5max) MB/s -87%
AS SSD
Score Total
SCHENKER XMG Fusion 15 (Early 24)
Samsung 990 Pro 1 TB
9475 Points
Aorus 16X 2024
Gigabyte AG450E1024-SI
8778 Points -7%
Lenovo Legion Pro 5 16IRX9
Samsung PM9A1 MZVL21T0HCLR
8364 Points -12%
Average Samsung 990 Pro 1 TB
  (5405 - 10591, n=18)
8308 Points -12%
Alienware m16 R2
Samsung PM9A1 MZVL21T0HCLR
8059 Points -15%
Average of class Gaming
  (2271 - 13854, n=159, last 2 years)
6737 Points -29%
HP Omen Transcend 16-u1095ng
Kioxia XG8 KXG80ZNV1T02
5138 Points -46%
Score Read
SCHENKER XMG Fusion 15 (Early 24)
Samsung 990 Pro 1 TB
3530 Points
Lenovo Legion Pro 5 16IRX9
Samsung PM9A1 MZVL21T0HCLR
3233 Points -8%
Aorus 16X 2024
Gigabyte AG450E1024-SI
3152 Points -11%
Alienware m16 R2
Samsung PM9A1 MZVL21T0HCLR
3005 Points -15%
Average Samsung 990 Pro 1 TB
  (1349 - 4721, n=18)
2891 Points -18%
Average of class Gaming
  (776 - 4721, n=159, last 2 years)
2441 Points -31%
HP Omen Transcend 16-u1095ng
Kioxia XG8 KXG80ZNV1T02
1458 Points -59%
Score Write
SCHENKER XMG Fusion 15 (Early 24)
Samsung 990 Pro 1 TB
4145 Points
Average Samsung 990 Pro 1 TB
  (2308 - 4852, n=18)
4043 Points -2%
Aorus 16X 2024
Gigabyte AG450E1024-SI
4006 Points -3%
Alienware m16 R2
Samsung PM9A1 MZVL21T0HCLR
3573 Points -14%
Lenovo Legion Pro 5 16IRX9
Samsung PM9A1 MZVL21T0HCLR
3543 Points -15%
Average of class Gaming
  (515 - 7208, n=159, last 2 years)
3113 Points -25%
HP Omen Transcend 16-u1095ng
Kioxia XG8 KXG80ZNV1T02
3029 Points -27%
Seq Read
SCHENKER XMG Fusion 15 (Early 24)
Samsung 990 Pro 1 TB
5760.15 MB/s
HP Omen Transcend 16-u1095ng
Kioxia XG8 KXG80ZNV1T02
5625.54 MB/s -2%
Alienware m16 R2
Samsung PM9A1 MZVL21T0HCLR
5592.15 MB/s -3%
Lenovo Legion Pro 5 16IRX9
Samsung PM9A1 MZVL21T0HCLR
5355.36 MB/s -7%
Average Samsung 990 Pro 1 TB
  (4362 - 5760, n=18)
5211 MB/s -10%
Average of class Gaming
  (2260 - 12763, n=159, last 2 years)
4944 MB/s -14%
Aorus 16X 2024
Gigabyte AG450E1024-SI
4161.31 MB/s -28%
Seq Write
SCHENKER XMG Fusion 15 (Early 24)
Samsung 990 Pro 1 TB
5243.63 MB/s
Average Samsung 990 Pro 1 TB
  (3376 - 5651, n=18)
4712 MB/s -10%
Aorus 16X 2024
Gigabyte AG450E1024-SI
4431.76 MB/s -15%
Alienware m16 R2
Samsung PM9A1 MZVL21T0HCLR
4431.18 MB/s -15%
Lenovo Legion Pro 5 16IRX9
Samsung PM9A1 MZVL21T0HCLR
3950.35 MB/s -25%
Average of class Gaming
  (495 - 11316, n=159, last 2 years)
3720 MB/s -29%
HP Omen Transcend 16-u1095ng
Kioxia XG8 KXG80ZNV1T02
3587.95 MB/s -32%
4K Read
Lenovo Legion Pro 5 16IRX9
Samsung PM9A1 MZVL21T0HCLR
82.62 MB/s +29%
Average Samsung 990 Pro 1 TB
  (52.7 - 90.9, n=18)
71.6 MB/s +12%
Alienware m16 R2
Samsung PM9A1 MZVL21T0HCLR
71.52 MB/s +12%
Average of class Gaming
  (27.8 - 112.1, n=159, last 2 years)
65.1 MB/s +2%
SCHENKER XMG Fusion 15 (Early 24)
Samsung 990 Pro 1 TB
63.85 MB/s
Aorus 16X 2024
Gigabyte AG450E1024-SI
61.86 MB/s -3%
HP Omen Transcend 16-u1095ng
Kioxia XG8 KXG80ZNV1T02
49.79 MB/s -22%
4K Write
Aorus 16X 2024
Gigabyte AG450E1024-SI
283.44 MB/s +17%
SCHENKER XMG Fusion 15 (Early 24)
Samsung 990 Pro 1 TB
242.28 MB/s
Average Samsung 990 Pro 1 TB
  (172.3 - 306, n=18)
223 MB/s -8%
Lenovo Legion Pro 5 16IRX9
Samsung PM9A1 MZVL21T0HCLR
213.76 MB/s -12%
Average of class Gaming
  (108.8 - 512, n=159, last 2 years)
211 MB/s -13%
HP Omen Transcend 16-u1095ng
Kioxia XG8 KXG80ZNV1T02
191.79 MB/s -21%
Alienware m16 R2
Samsung PM9A1 MZVL21T0HCLR
179.15 MB/s -26%
4K-64 Read
SCHENKER XMG Fusion 15 (Early 24)
Samsung 990 Pro 1 TB
2982.47 MB/s
Aorus 16X 2024
Gigabyte AG450E1024-SI
2673.76 MB/s -10%
Lenovo Legion Pro 5 16IRX9
Samsung PM9A1 MZVL21T0HCLR
2615.17 MB/s -12%
Alienware m16 R2
Samsung PM9A1 MZVL21T0HCLR
2374.63 MB/s -20%
Average Samsung 990 Pro 1 TB
  (787 - 3182, n=18)
2252 MB/s -24%
Average of class Gaming
  (451 - 3475, n=159, last 2 years)
1876 MB/s -37%
HP Omen Transcend 16-u1095ng
Kioxia XG8 KXG80ZNV1T02
845.48 MB/s -72%
4K-64 Write
SCHENKER XMG Fusion 15 (Early 24)
Samsung 990 Pro 1 TB
3413.79 MB/s
Average Samsung 990 Pro 1 TB
  (1592 - 4090, n=18)
3356 MB/s -2%
Aorus 16X 2024
Gigabyte AG450E1024-SI
3279.44 MB/s -4%
Alienware m16 R2
Samsung PM9A1 MZVL21T0HCLR
2951.09 MB/s -14%
Lenovo Legion Pro 5 16IRX9
Samsung PM9A1 MZVL21T0HCLR
2933.74 MB/s -14%
Average of class Gaming
  (277 - 5909, n=159, last 2 years)
2533 MB/s -26%
HP Omen Transcend 16-u1095ng
Kioxia XG8 KXG80ZNV1T02
2478.06 MB/s -27%
Access Time Read
Aorus 16X 2024
Gigabyte AG450E1024-SI
0.088 ms * -76%
Average of class Gaming
  (0.016 - 0.379, n=158, last 2 years)
0.05509 ms * -10%
HP Omen Transcend 16-u1095ng
Kioxia XG8 KXG80ZNV1T02
0.054 ms * -8%
SCHENKER XMG Fusion 15 (Early 24)
Samsung 990 Pro 1 TB
0.05 ms *
Alienware m16 R2
Samsung PM9A1 MZVL21T0HCLR
0.047 ms * +6%
Lenovo Legion Pro 5 16IRX9
Samsung PM9A1 MZVL21T0HCLR
0.042 ms * +16%
Average Samsung 990 Pro 1 TB
  (0.018 - 0.074, n=18)
0.0345 ms * +31%
Access Time Write
Alienware m16 R2
Samsung PM9A1 MZVL21T0HCLR
0.07 ms * -268%
Lenovo Legion Pro 5 16IRX9
Samsung PM9A1 MZVL21T0HCLR
0.059 ms * -211%
Average of class Gaming
  (0.011 - 1.028, n=159, last 2 years)
0.04843 ms * -155%
HP Omen Transcend 16-u1095ng
Kioxia XG8 KXG80ZNV1T02
0.02 ms * -5%
Average Samsung 990 Pro 1 TB
  (0.012 - 0.053, n=18)
0.01978 ms * -4%
SCHENKER XMG Fusion 15 (Early 24)
Samsung 990 Pro 1 TB
0.019 ms *
Aorus 16X 2024
Gigabyte AG450E1024-SI
0.015 ms * +21%

* ... im mniej tym lepiej

Reading continuous performance: DiskSpd Read Loop, Queue Depth 8

036072010801440180021602520288032403600396043204680504054005760612064806840Tooltip
SCHENKER XMG Fusion 15 (Early 24) Samsung 990 Pro 1 TB; diskspd 2.0.17 f: Ø6988 (6262.46-7033.01)
Aorus 16X 2024 Gigabyte AG450E1024-SI; diskspd 2.0.17 f: Ø5164 (4823.45-5192.86)
Alienware m16 R2 Samsung PM9A1 MZVL21T0HCLR; diskspd 2.0.17 f: Ø7063 (6446.85-7107.46)
HP Omen Transcend 16-u1095ng Kioxia XG8 KXG80ZNV1T02; diskspd 2.0.17 f: Ø6318 (5640.08-6341.89)
Lenovo Legion Pro 5 16IRX9 Samsung PM9A1 MZVL21T0HCLR; diskspd 2.0.17 f: Ø5723 (3286.38-6614.84)

Karta graficzna

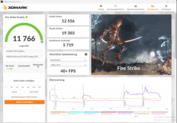
Schenker umożliwił laptopowi GeForce RTX 4070 na maksymalne TGP wynoszące 140 W (115 W + 25 W Dynamic Boost) - więcej nie jest zalecane przez Nvidię. GPU ma dostęp do 8 GB pamięci VRAM (GDDR6) - trochę za mało jak na dzisiejsze wymagania. Testy porównawcze przyniosły wyniki powyżej średniej RTX-4070(Enthusiast), a Overboost zaowocował jedynie niewielką przewagą. Przełączanie pomiędzy dGPU a Optimusem wymaga restartu.

Fire Strike (Entuzjasta, podłączony do sieci)
Fire Strike (Entuzjasta, tryb baterii)
Fire Strike (Overboost, podłączony do sieci)
Fire Strike (Zrównoważony, podłączony do sieci)
3DMark Performance Rating - Percent
SCHENKER XMG Fusion 15 (Early 24)
NVIDIA GeForce RTX 4070 Laptop GPU, Intel Core i9-14900HX
100 pt
Lenovo Legion Pro 5 16IRX9
NVIDIA GeForce RTX 4070 Laptop GPU, Intel Core i9-14900HX
96.4 pt
SCHENKER XMG Fusion 15 (Early 24)
NVIDIA GeForce RTX 4070 Laptop GPU, Intel Core i9-14900HX
95.8 pt
Average of class Gaming
 
95.7 pt
Alienware m16 R2
NVIDIA GeForce RTX 4070 Laptop GPU, Intel Core Ultra 7 155H
94.4 pt
Aorus 16X 2024
NVIDIA GeForce RTX 4070 Laptop GPU, Intel Core i9-14900HX
89.6 pt
Average NVIDIA GeForce RTX 4070 Laptop GPU
 
87.6 pt
HP Omen Transcend 16-u1095ng
NVIDIA GeForce RTX 4070 Laptop GPU, Intel Core i9-14900HX
85.3 pt
3DMark 11 - 1280x720 Performance GPU
SCHENKER XMG Fusion 15 (Early 24)
NVIDIA GeForce RTX 4070 Laptop GPU, Intel Core i9-14900HX (Overboost)
46434 Points +3%
SCHENKER XMG Fusion 15 (Early 24)
NVIDIA GeForce RTX 4070 Laptop GPU, Intel Core i9-14900HX
44902 Points
Lenovo Legion Pro 5 16IRX9
NVIDIA GeForce RTX 4070 Laptop GPU, Intel Core i9-14900HX
43689 Points -3%
Average of class Gaming
  (1029 - 72178, n=186, last 2 years)
43521 Points -3%
Alienware m16 R2
NVIDIA GeForce RTX 4070 Laptop GPU, Intel Core Ultra 7 155H
42296 Points -6%
Aorus 16X 2024
NVIDIA GeForce RTX 4070 Laptop GPU, Intel Core i9-14900HX
41457 Points -8%
Average NVIDIA GeForce RTX 4070 Laptop GPU
  (24229 - 46434, n=59)
40410 Points -10%
HP Omen Transcend 16-u1095ng
NVIDIA GeForce RTX 4070 Laptop GPU, Intel Core i9-14900HX
39424 Points -12%
3DMark
1920x1080 Fire Strike Graphics
SCHENKER XMG Fusion 15 (Early 24)
NVIDIA GeForce RTX 4070 Laptop GPU, Intel Core i9-14900HX (Overboost)
32533 Points +4%
SCHENKER XMG Fusion 15 (Early 24)
NVIDIA GeForce RTX 4070 Laptop GPU, Intel Core i9-14900HX
31274 Points
Average of class Gaming
  (781 - 53059, n=196, last 2 years)
31245 Points 0%
Lenovo Legion Pro 5 16IRX9
NVIDIA GeForce RTX 4070 Laptop GPU, Intel Core i9-14900HX
31105 Points -1%
Alienware m16 R2
NVIDIA GeForce RTX 4070 Laptop GPU, Intel Core Ultra 7 155H
30932 Points -1%
Aorus 16X 2024
NVIDIA GeForce RTX 4070 Laptop GPU, Intel Core i9-14900HX
29156 Points -7%
Average NVIDIA GeForce RTX 4070 Laptop GPU
  (12242 - 33451, n=62)
29041 Points -7%
HP Omen Transcend 16-u1095ng
NVIDIA GeForce RTX 4070 Laptop GPU, Intel Core i9-14900HX
28461 Points -9%
2560x1440 Time Spy Graphics
SCHENKER XMG Fusion 15 (Early 24)
NVIDIA GeForce RTX 4070 Laptop GPU, Intel Core i9-14900HX (Overboost)
13391 Points +6%
Lenovo Legion Pro 5 16IRX9
NVIDIA GeForce RTX 4070 Laptop GPU, Intel Core i9-14900HX
13336 Points +5%
Average of class Gaming
  (224 - 22717, n=191, last 2 years)
13034 Points +3%
Alienware m16 R2
NVIDIA GeForce RTX 4070 Laptop GPU, Intel Core Ultra 7 155H
12997 Points +2%
SCHENKER XMG Fusion 15 (Early 24)
NVIDIA GeForce RTX 4070 Laptop GPU, Intel Core i9-14900HX
12682 Points
Aorus 16X 2024
NVIDIA GeForce RTX 4070 Laptop GPU, Intel Core i9-14900HX
12048 Points -5%
Average NVIDIA GeForce RTX 4070 Laptop GPU
  (5012 - 13391, n=60)
11603 Points -9%
HP Omen Transcend 16-u1095ng
NVIDIA GeForce RTX 4070 Laptop GPU, Intel Core i9-14900HX
11181 Points -12%
3DMark 06 Standard Score
63892 pkt.
3DMark 11 Performance
36008 pkt.
3DMark Fire Strike Score
26661 pkt.
3DMark Time Spy Score
13067 pkt.
Pomoc
Blender
v3.3 Classroom OPTIX/RTX
HP Omen Transcend 16-u1095ng
NVIDIA GeForce RTX 4070 Laptop GPU, Intel Core i9-14900HX (3.3.3)
23 Seconds * -10%
Average NVIDIA GeForce RTX 4070 Laptop GPU
  (18 - 30, n=60)
21.5 Seconds * -2%
SCHENKER XMG Fusion 15 (Early 24)
NVIDIA GeForce RTX 4070 Laptop GPU, Intel Core i9-14900HX (3.3.3)
21 Seconds *
Average of class Gaming
  (9 - 95, n=177, last 2 years)
21 Seconds * -0%
Alienware m16 R2
NVIDIA GeForce RTX 4070 Laptop GPU, Intel Core Ultra 7 155H (3.3.3)
20 Seconds * +5%
Aorus 16X 2024
NVIDIA GeForce RTX 4070 Laptop GPU, Intel Core i9-14900HX (3.3.3)
20 Seconds * +5%
SCHENKER XMG Fusion 15 (Early 24)
NVIDIA GeForce RTX 4070 Laptop GPU, Intel Core i9-14900HX (3.3.3, Overboost)
20 Seconds * +5%
Lenovo Legion Pro 5 16IRX9
NVIDIA GeForce RTX 4070 Laptop GPU, Intel Core i9-14900HX (3.3.3)
19 Seconds * +10%
v3.3 Classroom CUDA
Average NVIDIA GeForce RTX 4070 Laptop GPU
  (32 - 181, n=63)
40.6 Seconds * -27%
Average of class Gaming
  (16 - 175, n=183, last 2 years)
36.7 Seconds * -15%
HP Omen Transcend 16-u1095ng
NVIDIA GeForce RTX 4070 Laptop GPU, Intel Core i9-14900HX (3.3.3)
36 Seconds * -13%
Alienware m16 R2
NVIDIA GeForce RTX 4070 Laptop GPU, Intel Core Ultra 7 155H (3.3.3)
33 Seconds * -3%
Lenovo Legion Pro 5 16IRX9
NVIDIA GeForce RTX 4070 Laptop GPU, Intel Core i9-14900HX (3.3.3)
32 Seconds * -0%
Aorus 16X 2024
NVIDIA GeForce RTX 4070 Laptop GPU, Intel Core i9-14900HX (3.3.3)
32 Seconds * -0%
SCHENKER XMG Fusion 15 (Early 24)
NVIDIA GeForce RTX 4070 Laptop GPU, Intel Core i9-14900HX (3.3.3)
32 Seconds *
SCHENKER XMG Fusion 15 (Early 24)
NVIDIA GeForce RTX 4070 Laptop GPU, Intel Core i9-14900HX (3.3.3, Overboost)
32 Seconds * -0%
v3.3 Classroom CPU
HP Omen Transcend 16-u1095ng
NVIDIA GeForce RTX 4070 Laptop GPU, Intel Core i9-14900HX (3.3.3)
298 Seconds * -23%
Average of class Gaming
  (138 - 962, n=191, last 2 years)
297 Seconds * -22%
Alienware m16 R2
NVIDIA GeForce RTX 4070 Laptop GPU, Intel Core Ultra 7 155H (3.3.3)
296 Seconds * -22%
Average NVIDIA GeForce RTX 4070 Laptop GPU
  (158 - 440, n=59)
290 Seconds * -19%
SCHENKER XMG Fusion 15 (Early 24)
NVIDIA GeForce RTX 4070 Laptop GPU, Intel Core i9-14900HX (3.3.3)
243 Seconds *
Aorus 16X 2024
NVIDIA GeForce RTX 4070 Laptop GPU, Intel Core i9-14900HX (3.3.3)
227 Seconds * +7%
Lenovo Legion Pro 5 16IRX9
NVIDIA GeForce RTX 4070 Laptop GPU, Intel Core i9-14900HX (3.3.3)
205 Seconds * +16%
SCHENKER XMG Fusion 15 (Early 24)
NVIDIA GeForce RTX 4070 Laptop GPU, Intel Core i9-14900HX (3.3.3, Overboost)
185 Seconds * +24%
Geekbench 5.5
OpenCL Score
SCHENKER XMG Fusion 15 (Early 24)
NVIDIA GeForce RTX 4070 Laptop GPU, Intel Core i9-14900HX
129366 Points
SCHENKER XMG Fusion 15 (Early 24)
NVIDIA GeForce RTX 4070 Laptop GPU, Intel Core i9-14900HX (Overboost)
128643 Points -1%
Aorus 16X 2024
NVIDIA GeForce RTX 4070 Laptop GPU, Intel Core i9-14900HX
126537 Points -2%
Average of class Gaming
  (5039 - 237138, n=193, last 2 years)
125975 Points -3%
HP Omen Transcend 16-u1095ng
NVIDIA GeForce RTX 4070 Laptop GPU, Intel Core i9-14900HX
118601 Points -8%
Average NVIDIA GeForce RTX 4070 Laptop GPU
  (17391 - 129366, n=61)
113893 Points -12%
Lenovo Legion Pro 5 16IRX9
NVIDIA GeForce RTX 4070 Laptop GPU, Intel Core i9-14900HX
112841 Points -13%
Alienware m16 R2
NVIDIA GeForce RTX 4070 Laptop GPU, Intel Core Ultra 7 155H
111153 Points -14%
Vulkan Score 5.5
SCHENKER XMG Fusion 15 (Early 24)
NVIDIA GeForce RTX 4070 Laptop GPU, Intel Core i9-14900HX (Overboost)
93143 Points +32%
Aorus 16X 2024
NVIDIA GeForce RTX 4070 Laptop GPU, Intel Core i9-14900HX
75575 Points +7%
Average of class Gaming
  (7995 - 163089, n=123, last 2 years)
71890 Points +2%
Average NVIDIA GeForce RTX 4070 Laptop GPU
  (42883 - 102618, n=32)
70985 Points +1%
SCHENKER XMG Fusion 15 (Early 24)
NVIDIA GeForce RTX 4070 Laptop GPU, Intel Core i9-14900HX
70440 Points
Alienware m16 R2
NVIDIA GeForce RTX 4070 Laptop GPU, Intel Core Ultra 7 155H
65414 Points -7%
Lenovo Legion Pro 5 16IRX9
NVIDIA GeForce RTX 4070 Laptop GPU, Intel Core i9-14900HX
58476 Points -17%
Geekbench 6.3
GPU OpenCL
SCHENKER XMG Fusion 15 (Early 24)
NVIDIA GeForce RTX 4070 Laptop GPU, Intel Core i9-14900HX (6.2.1)
129836 Points
SCHENKER XMG Fusion 15 (Early 24)
NVIDIA GeForce RTX 4070 Laptop GPU, Intel Core i9-14900HX (6.2.1, Overboost)
129433 Points 0%
HP Omen Transcend 16-u1095ng
NVIDIA GeForce RTX 4070 Laptop GPU, Intel Core i9-14900HX (6.2.1)
120468 Points -7%
Aorus 16X 2024
NVIDIA GeForce RTX 4070 Laptop GPU, Intel Core i9-14900HX (6.2.1)
120176 Points -7%
Lenovo Legion Pro 5 16IRX9
NVIDIA GeForce RTX 4070 Laptop GPU, Intel Core i9-14900HX (6.2.1)
115718 Points -11%
Average of class Gaming
  (4321 - 207373, n=109, last 2 years)
115663 Points -11%
Average NVIDIA GeForce RTX 4070 Laptop GPU
  (85488 - 129836, n=37)
113812 Points -12%
Alienware m16 R2
NVIDIA GeForce RTX 4070 Laptop GPU, Intel Core Ultra 7 155H (6.2.1)
112875 Points -13%
GPU Vulkan
SCHENKER XMG Fusion 15 (Early 24)
NVIDIA GeForce RTX 4070 Laptop GPU, Intel Core i9-14900HX (6.2.1, Overboost)
120033 Points +14%
Alienware m16 R2
NVIDIA GeForce RTX 4070 Laptop GPU, Intel Core Ultra 7 155H (6.2.1)
110951 Points +6%
Lenovo Legion Pro 5 16IRX9
NVIDIA GeForce RTX 4070 Laptop GPU, Intel Core i9-14900HX (6.2.1)
105334 Points 0%
SCHENKER XMG Fusion 15 (Early 24)
NVIDIA GeForce RTX 4070 Laptop GPU, Intel Core i9-14900HX (6.2.1)
104883 Points
Aorus 16X 2024
NVIDIA GeForce RTX 4070 Laptop GPU, Intel Core i9-14900HX (6.2.1)
90584 Points -14%
Average of class Gaming
  (4286 - 196201, n=106, last 2 years)
82317 Points -22%
Average NVIDIA GeForce RTX 4070 Laptop GPU
  (18099 - 120033, n=34)
71564 Points -32%
V-Ray 5 Benchmark
GPU RTX
Average of class Gaming
  (171 - 3824, n=114, last 2 years)
2181 mpaths +24%
Lenovo Legion Pro 5 16IRX9
NVIDIA GeForce RTX 4070 Laptop GPU, Intel Core i9-14900HX (5.0.1)
1868 mpaths +6%
SCHENKER XMG Fusion 15 (Early 24)
NVIDIA GeForce RTX 4070 Laptop GPU, Intel Core i9-14900HX (5.0.1, Overboost)
1854 mpaths +5%
SCHENKER XMG Fusion 15 (Early 24)
NVIDIA GeForce RTX 4070 Laptop GPU, Intel Core i9-14900HX (5.0.1)
1758 mpaths
Alienware m16 R2
NVIDIA GeForce RTX 4070 Laptop GPU, Intel Core Ultra 7 155H (5.0.1)
1738 mpaths -1%
Aorus 16X 2024
NVIDIA GeForce RTX 4070 Laptop GPU, Intel Core i9-14900HX (5.0.1)
1737 mpaths -1%
Average NVIDIA GeForce RTX 4070 Laptop GPU
  (171 - 1872, n=36)
1648 mpaths -6%
GPU CUDA
Average of class Gaming
  (120 - 2797, n=116, last 2 years)
1568 mpaths +24%
Lenovo Legion Pro 5 16IRX9
NVIDIA GeForce RTX 4070 Laptop GPU, Intel Core i9-14900HX (5.0.1)
1333 mpaths +5%
SCHENKER XMG Fusion 15 (Early 24)
NVIDIA GeForce RTX 4070 Laptop GPU, Intel Core i9-14900HX (5.0.1, Overboost)
1325 mpaths +5%
SCHENKER XMG Fusion 15 (Early 24)
NVIDIA GeForce RTX 4070 Laptop GPU, Intel Core i9-14900HX (5.0.1)
1266 mpaths
Alienware m16 R2
NVIDIA GeForce RTX 4070 Laptop GPU, Intel Core Ultra 7 155H (5.0.1)
1259 mpaths -1%
Aorus 16X 2024
NVIDIA GeForce RTX 4070 Laptop GPU, Intel Core i9-14900HX (5.0.1)
1256 mpaths -1%
Average NVIDIA GeForce RTX 4070 Laptop GPU
  (120 - 1356, n=36)
1192 mpaths -6%
CPU
SCHENKER XMG Fusion 15 (Early 24)
NVIDIA GeForce RTX 4070 Laptop GPU, Intel Core i9-14900HX (5.0.1, Overboost)
20388 mpaths +31%
Lenovo Legion Pro 5 16IRX9
NVIDIA GeForce RTX 4070 Laptop GPU, Intel Core i9-14900HX (5.0.1)
19077 mpaths +23%
Aorus 16X 2024
NVIDIA GeForce RTX 4070 Laptop GPU, Intel Core i9-14900HX (5.0.1)
17465 mpaths +12%
SCHENKER XMG Fusion 15 (Early 24)
NVIDIA GeForce RTX 4070 Laptop GPU, Intel Core i9-14900HX (5.0.1)
15556 mpaths
Average of class Gaming
  (3562 - 26944, n=119, last 2 years)
15070 mpaths -3%
Average NVIDIA GeForce RTX 4070 Laptop GPU
  (9339 - 20388, n=35)
14381 mpaths -8%
Alienware m16 R2
NVIDIA GeForce RTX 4070 Laptop GPU, Intel Core Ultra 7 155H (5.0.1)
12776 mpaths -18%
V-Ray Benchmark Next 4.10
GPU
Average of class Gaming
  (54 - 1334, n=152, last 2 years)
701 mpaths +16%
Lenovo Legion Pro 5 16IRX9
NVIDIA GeForce RTX 4070 Laptop GPU, Intel Core i9-14900HX (v4.10.07 )
675 mpaths +12%
SCHENKER XMG Fusion 15 (Early 24)
NVIDIA GeForce RTX 4070 Laptop GPU, Intel Core i9-14900HX (v4.10.07, Overboost)
635 mpaths +5%
Average NVIDIA GeForce RTX 4070 Laptop GPU
  (434 - 686, n=46)
606 mpaths +1%
SCHENKER XMG Fusion 15 (Early 24)
NVIDIA GeForce RTX 4070 Laptop GPU, Intel Core i9-14900HX (v4.10.07 )
602 mpaths
HP Omen Transcend 16-u1095ng
NVIDIA GeForce RTX 4070 Laptop GPU, Intel Core i9-14900HX (v4.10.07 )
596 mpaths -1%
Aorus 16X 2024
NVIDIA GeForce RTX 4070 Laptop GPU, Intel Core i9-14900HX (v4.10.07 )
587 mpaths -2%
CPU
SCHENKER XMG Fusion 15 (Early 24)
NVIDIA GeForce RTX 4070 Laptop GPU, Intel Core i9-14900HX (v4.10.07, Overboost)
30730 ksamples +31%
Lenovo Legion Pro 5 16IRX9
NVIDIA GeForce RTX 4070 Laptop GPU, Intel Core i9-14900HX (v4.10.07 )
28791 ksamples +23%
Aorus 16X 2024
NVIDIA GeForce RTX 4070 Laptop GPU, Intel Core i9-14900HX (v4.10.07 )
26677 ksamples +14%
SCHENKER XMG Fusion 15 (Early 24)
NVIDIA GeForce RTX 4070 Laptop GPU, Intel Core i9-14900HX (v4.10.07 )
23407 ksamples
HP Omen Transcend 16-u1095ng
NVIDIA GeForce RTX 4070 Laptop GPU, Intel Core i9-14900HX (v4.10.07 )
21634 ksamples -8%
Average of class Gaming
  (5413 - 37629, n=152, last 2 years)
21367 ksamples -9%
Average NVIDIA GeForce RTX 4070 Laptop GPU
  (12638 - 35173, n=46)
20879 ksamples -11%

* ... im mniej tym lepiej

Wydajność w grach

Sprzęt jest przeznaczony do grania w rozdzielczości QHD przy wysokich i maksymalnych ustawieniach. Korzystając z DLSS 3 i Frame Generation, można było grać w gry w wyższych rozdzielczościach i maksymalnych ustawieniach, w tym w ray tracing - ale tylko w przypadku gier obsługujących te funkcje. Odnotowaliśmy liczbę klatek na sekundę powyżej średniej RTX-4070(Enthusiast), a Overboost zaowocował niewielką przewagą.

Performance Rating - Percent
SCHENKER XMG Fusion 15 (Early 24)
Intel Core i9-14900HX, NVIDIA GeForce RTX 4070 Laptop GPU
99.1 pt
Lenovo Legion Pro 5 16IRX9
Intel Core i9-14900HX, NVIDIA GeForce RTX 4070 Laptop GPU
98 pt
SCHENKER XMG Fusion 15 (Early 24)
Intel Core i9-14900HX, NVIDIA GeForce RTX 4070 Laptop GPU
95.9 pt
Aorus 16X 2024
Intel Core i9-14900HX, NVIDIA GeForce RTX 4070 Laptop GPU
87.8 pt
Average of class Gaming
 
86.6 pt
Alienware m16 R2 -1!
Intel Core Ultra 7 155H, NVIDIA GeForce RTX 4070 Laptop GPU
83 pt
HP Omen Transcend 16-u1095ng
Intel Core i9-14900HX, NVIDIA GeForce RTX 4070 Laptop GPU
83 pt
Average NVIDIA GeForce RTX 4070 Laptop GPU
 
80.9 pt
The Witcher 3 - 1920x1080 Ultra Graphics & Postprocessing (HBAO+)
Lenovo Legion Pro 5 16IRX9
Intel Core i9-14900HX, NVIDIA GeForce RTX 4070 Laptop GPU
133.7 (126min) fps +4%
SCHENKER XMG Fusion 15 (Early 24)
Intel Core i9-14900HX, NVIDIA GeForce RTX 4070 Laptop GPU (Overboost)
133 fps +4%
SCHENKER XMG Fusion 15 (Early 24)
Intel Core i9-14900HX, NVIDIA GeForce RTX 4070 Laptop GPU
128 (110min) fps
Average of class Gaming
  (18.4 - 216, n=168, last 2 years)
126.9 fps -1%
Aorus 16X 2024
Intel Core i9-14900HX, NVIDIA GeForce RTX 4070 Laptop GPU
122 fps -5%
Alienware m16 R2
Intel Core Ultra 7 155H, NVIDIA GeForce RTX 4070 Laptop GPU
121.3 (115min) fps -5%
HP Omen Transcend 16-u1095ng
Intel Core i9-14900HX, NVIDIA GeForce RTX 4070 Laptop GPU
114 fps -11%
Average NVIDIA GeForce RTX 4070 Laptop GPU
  (69.8 - 133.7, n=55)
112.2 fps -12%
GTA V - 1920x1080 Highest Settings possible AA:4xMSAA + FX AF:16x
SCHENKER XMG Fusion 15 (Early 24)
Intel Core i9-14900HX, NVIDIA GeForce RTX 4070 Laptop GPU (Overboost)
140.5 (9.33min, 90.9P1) fps +2%
SCHENKER XMG Fusion 15 (Early 24)
Intel Core i9-14900HX, NVIDIA GeForce RTX 4070 Laptop GPU
137.6 (8.45min, 90.9P1) fps
Lenovo Legion Pro 5 16IRX9
Intel Core i9-14900HX, NVIDIA GeForce RTX 4070 Laptop GPU
127.2 (5.17min, 83.3P1) fps -8%
HP Omen Transcend 16-u1095ng
Intel Core i9-14900HX, NVIDIA GeForce RTX 4070 Laptop GPU
115.8 (21.8min, 83.3P1) fps -16%
Average of class Gaming
  (12.1 - 167.7, n=171, last 2 years)
113 fps -18%
Average NVIDIA GeForce RTX 4070 Laptop GPU
  (48.3 - 140.5, n=55)
110.9 fps -19%
Aorus 16X 2024
Intel Core i9-14900HX, NVIDIA GeForce RTX 4070 Laptop GPU
107.2 (4.31min, 71.4P1) fps -22%
Final Fantasy XV Benchmark - 1920x1080 High Quality
SCHENKER XMG Fusion 15 (Early 24)
Intel Core i9-14900HX, NVIDIA GeForce RTX 4070 Laptop GPU (1.3, Overboost)
131.9 fps +6%
Lenovo Legion Pro 5 16IRX9
Intel Core i9-14900HX, NVIDIA GeForce RTX 4070 Laptop GPU (1.3)
131 fps +5%
SCHENKER XMG Fusion 15 (Early 24)
Intel Core i9-14900HX, NVIDIA GeForce RTX 4070 Laptop GPU (1.3)
124.6 fps
Alienware m16 R2
Intel Core Ultra 7 155H, NVIDIA GeForce RTX 4070 Laptop GPU (1.3)
119.3 fps -4%
Average of class Gaming
  (19.2 - 201, n=184, last 2 years)
119 fps -4%
Aorus 16X 2024
Intel Core i9-14900HX, NVIDIA GeForce RTX 4070 Laptop GPU (1.3)
111.5 fps -11%
Average NVIDIA GeForce RTX 4070 Laptop GPU
  (41 - 131.9, n=57)
111 fps -11%
HP Omen Transcend 16-u1095ng
Intel Core i9-14900HX, NVIDIA GeForce RTX 4070 Laptop GPU (1.3)
108.3 fps -13%
Strange Brigade - 1920x1080 ultra AA:ultra AF:16
Lenovo Legion Pro 5 16IRX9
Intel Core i9-14900HX, NVIDIA GeForce RTX 4070 Laptop GPU (1.47.22.14 D3D12)
234 (27.8min, 175.8P1) fps +9%
Average of class Gaming
  (38.9 - 421, n=182, last 2 years)
227 fps +6%
SCHENKER XMG Fusion 15 (Early 24)
Intel Core i9-14900HX, NVIDIA GeForce RTX 4070 Laptop GPU (1.47.22.14 D3D12, Overboost)
222 (29.4min, 167.7P1) fps +4%
Alienware m16 R2
Intel Core Ultra 7 155H, NVIDIA GeForce RTX 4070 Laptop GPU (1.47.22.14 D3D12)
219 (38.5min, 163.7P1) fps +2%
SCHENKER XMG Fusion 15 (Early 24)
Intel Core i9-14900HX, NVIDIA GeForce RTX 4070 Laptop GPU (1.47.22.14 D3D12)
214 (38.2min, 161.4P1) fps
Aorus 16X 2024
Intel Core i9-14900HX, NVIDIA GeForce RTX 4070 Laptop GPU (1.47.22.14 D3D12)
204 (69.2min, 153P1) fps -5%
Average NVIDIA GeForce RTX 4070 Laptop GPU
  (76.3 - 234, n=58)
196.1 fps -8%
HP Omen Transcend 16-u1095ng
Intel Core i9-14900HX, NVIDIA GeForce RTX 4070 Laptop GPU (1.47.22.14 D3D12)
194.2 (59.2min, 144.5P1) fps -9%
Dota 2 Reborn - 1920x1080 ultra (3/3) best looking
SCHENKER XMG Fusion 15 (Early 24)
Intel Core i9-14900HX, NVIDIA GeForce RTX 4070 Laptop GPU (Overboost)
187.5 (160.5min) fps +3%
Lenovo Legion Pro 5 16IRX9
Intel Core i9-14900HX, NVIDIA GeForce RTX 4070 Laptop GPU
185.3 (161min) fps +2%
SCHENKER XMG Fusion 15 (Early 24)
Intel Core i9-14900HX, NVIDIA GeForce RTX 4070 Laptop GPU
182.1 (158.8min) fps
Aorus 16X 2024
Intel Core i9-14900HX, NVIDIA GeForce RTX 4070 Laptop GPU
180.9 (156.5min) fps -1%
HP Omen Transcend 16-u1095ng
Intel Core i9-14900HX, NVIDIA GeForce RTX 4070 Laptop GPU
154.1 (133.3min) fps -15%
Average of class Gaming
  (30.8 - 220, n=190, last 2 years)
149.3 fps -18%
Average NVIDIA GeForce RTX 4070 Laptop GPU
  (89.7 - 187.5, n=59)
147.6 fps -19%
Alienware m16 R2
Intel Core Ultra 7 155H, NVIDIA GeForce RTX 4070 Laptop GPU
139.7 (120.9min) fps -23%
X-Plane 11.11 - 1920x1080 high (fps_test=3)
SCHENKER XMG Fusion 15 (Early 24)
Intel Core i9-14900HX, NVIDIA GeForce RTX 4070 Laptop GPU (Overboost)
138.4 fps +1%
Lenovo Legion Pro 5 16IRX9
Intel Core i9-14900HX, NVIDIA GeForce RTX 4070 Laptop GPU
137.6 fps +1%
SCHENKER XMG Fusion 15 (Early 24)
Intel Core i9-14900HX, NVIDIA GeForce RTX 4070 Laptop GPU
136.9 fps
Aorus 16X 2024
Intel Core i9-14900HX, NVIDIA GeForce RTX 4070 Laptop GPU
126.4 fps -8%
HP Omen Transcend 16-u1095ng
Intel Core i9-14900HX, NVIDIA GeForce RTX 4070 Laptop GPU
114.9 fps -16%
Average of class Gaming
  (31.5 - 166.2, n=196, last 2 years)
107.2 fps -22%
Average NVIDIA GeForce RTX 4070 Laptop GPU
  (58.9 - 144.4, n=61)
104.6 fps -24%
Alienware m16 R2
Intel Core Ultra 7 155H, NVIDIA GeForce RTX 4070 Laptop GPU
90.8 fps -34%
Cyberpunk 2077 2.1 Phantom Liberty
1920x1080 Ultra Preset (FSR off)
SCHENKER XMG Fusion 15 (Early 24)
Intel Core i9-14900HX, NVIDIA GeForce RTX 4070 Laptop GPU (2.02, Overboost)
90.7 (67.4min) fps +4%
Lenovo Legion Pro 5 16IRX9
Intel Core i9-14900HX, NVIDIA GeForce RTX 4070 Laptop GPU (2.02)
87.1 (52.5min) fps 0%
SCHENKER XMG Fusion 15 (Early 24)
Intel Core i9-14900HX, NVIDIA GeForce RTX 4070 Laptop GPU (2.02)
87 (55.2min) fps
Average of class Gaming
  (6.76 - 144.7, n=79, last 2 years)
85.9 fps -1%
Alienware m16 R2
Intel Core Ultra 7 155H, NVIDIA GeForce RTX 4070 Laptop GPU (2.02)
83.1 (28.4min) fps -4%
Average NVIDIA GeForce RTX 4070 Laptop GPU
  (30.7 - 90.7, n=29)
79.6 fps -9%
Aorus 16X 2024
Intel Core i9-14900HX, NVIDIA GeForce RTX 4070 Laptop GPU (2.02)
75.8 (32.9min) fps -13%
2560x1440 Ultra Preset (FSR off)
Average of class Gaming
  (24.8 - 110, n=69, last 2 years)
64.9 fps +23%
SCHENKER XMG Fusion 15 (Early 24)
Intel Core i9-14900HX, NVIDIA GeForce RTX 4070 Laptop GPU (2.02, Overboost)
55.6 (42.5min) fps +6%
Lenovo Legion Pro 5 16IRX9
Intel Core i9-14900HX, NVIDIA GeForce RTX 4070 Laptop GPU (2.02)
52.8 (33.2min) fps 0%
Alienware m16 R2
Intel Core Ultra 7 155H, NVIDIA GeForce RTX 4070 Laptop GPU (2.02)
52.7 (40.5min) fps 0%
SCHENKER XMG Fusion 15 (Early 24)
Intel Core i9-14900HX, NVIDIA GeForce RTX 4070 Laptop GPU (2.02)
52.6 (39.5min) fps
Aorus 16X 2024
Intel Core i9-14900HX, NVIDIA GeForce RTX 4070 Laptop GPU (2.02)
49.4 (29.5min) fps -6%
Average NVIDIA GeForce RTX 4070 Laptop GPU
  (24.8 - 57.1, n=28)
49.1 fps -7%
1920x1080 Ray Tracing Ultra Preset (DLSS off)
SCHENKER XMG Fusion 15 (Early 24)
Intel Core i9-14900HX, NVIDIA GeForce RTX 4070 Laptop GPU (2.02, Overboost)
46.8 (23.6min) fps +7%
Average of class Gaming
  (11.9 - 77.7, n=54, last 2 years)
45.3 fps +3%
Lenovo Legion Pro 5 16IRX9
Intel Core i9-14900HX, NVIDIA GeForce RTX 4070 Laptop GPU (2.02)
44.8 (15.7min) fps +2%
SCHENKER XMG Fusion 15 (Early 24)
Intel Core i9-14900HX, NVIDIA GeForce RTX 4070 Laptop GPU (2.02)
43.8 (34.3min) fps
Alienware m16 R2
Intel Core Ultra 7 155H, NVIDIA GeForce RTX 4070 Laptop GPU (2.02)
42.4 (28.4min) fps -3%
Aorus 16X 2024
Intel Core i9-14900HX, NVIDIA GeForce RTX 4070 Laptop GPU (2.02)
40.9 (21.5min) fps -7%
Average NVIDIA GeForce RTX 4070 Laptop GPU
  (19.1 - 46.8, n=19)
40.4 fps -8%
Dragon's Dogma 2
1920x1080 High Preset
SCHENKER XMG Fusion 15 (Early 24)
Intel Core i9-14900HX, NVIDIA GeForce RTX 4070 Laptop GPU
80 (32.5min, 42.2P0.1, 60.3P1) fps
Average NVIDIA GeForce RTX 4070 Laptop GPU
  (61.3 - 80, n=5)
67.8 fps -15%
Average of class Gaming
  (49.5 - 80, n=8, last 2 years)
64.5 fps -19%
2560x1440 High Preset
SCHENKER XMG Fusion 15 (Early 24)
Intel Core i9-14900HX, NVIDIA GeForce RTX 4070 Laptop GPU
61.3 (37.3min, 38.9P0.1, 48.6P1) fps
Average NVIDIA GeForce RTX 4070 Laptop GPU
  (47.7 - 61.3, n=5)
55.3 fps -10%
Average of class Gaming
  (34.6 - 61.3, n=5, last 2 years)
51.8 fps -15%
Baldur's Gate 3
1920x1080 Ultra Preset
Alienware m16 R2
Intel Core Ultra 7 155H, NVIDIA GeForce RTX 4070 Laptop GPU
128.5 fps +22%
Lenovo Legion Pro 5 16IRX9
Intel Core i9-14900HX, NVIDIA GeForce RTX 4070 Laptop GPU
125.6 fps +20%
SCHENKER XMG Fusion 15 (Early 24)
Intel Core i9-14900HX, NVIDIA GeForce RTX 4070 Laptop GPU
105 (60.3min, 63.9P0.1, 89.7P1) fps
Average NVIDIA GeForce RTX 4070 Laptop GPU
  (66.7 - 128.5, n=20)
103 fps -2%
Average of class Gaming
  (21.2 - 208, n=44, last 2 years)
102.1 fps -3%
2560x1440 Ultra Preset
Lenovo Legion Pro 5 16IRX9
Intel Core i9-14900HX, NVIDIA GeForce RTX 4070 Laptop GPU
89.6 fps +9%
Alienware m16 R2
Intel Core Ultra 7 155H, NVIDIA GeForce RTX 4070 Laptop GPU
88.3 fps +8%
Average of class Gaming
  (44 - 155.2, n=34, last 2 years)
82.2 fps 0%
SCHENKER XMG Fusion 15 (Early 24)
Intel Core i9-14900HX, NVIDIA GeForce RTX 4070 Laptop GPU
82.1 (30.4min, 49.4P0.1, 68.2P1) fps
Average NVIDIA GeForce RTX 4070 Laptop GPU
  (54.4 - 89.6, n=18)
73.9 fps -10%
Alone in the Dark
1920x1080 Cinematic Preset
Average of class Gaming
  (13.6 - 189.9, n=6, last 2 years)
126.3 fps 0%
SCHENKER XMG Fusion 15 (Early 24)
Intel Core i9-14900HX, NVIDIA GeForce RTX 4070 Laptop GPU
126 (31.5min, 37.7P0.1, 88.8P1) fps
Aorus 16X 2024
Intel Core i9-14900HX, NVIDIA GeForce RTX 4070 Laptop GPU
124.7 (21.3min, 36.4P0.1, 57.1P1) fps -1%
Average NVIDIA GeForce RTX 4070 Laptop GPU
  (105.5 - 126, n=4)
117.6 fps -7%
2560x1440 Cinematic Preset
Average of class Gaming
  (64.7 - 133.6, n=4, last 2 years)
91.6 fps +20%
SCHENKER XMG Fusion 15 (Early 24)
Intel Core i9-14900HX, NVIDIA GeForce RTX 4070 Laptop GPU
76.6 (24.8min, 34.2P0.1, 53.6P1) fps
Aorus 16X 2024
Intel Core i9-14900HX, NVIDIA GeForce RTX 4070 Laptop GPU
64.7 (22.8min, 23.8P0.1, 30.9P1) fps -16%
Average NVIDIA GeForce RTX 4070 Laptop GPU
  (37.4 - 76.6, n=4)
62.7 fps -18%
Alan Wake 2
1920x1080 High Preset
Average of class Gaming
  (17.1 - 123.3, n=18, last 2 years)
70.8 fps +1%
SCHENKER XMG Fusion 15 (Early 24)
Intel Core i9-14900HX, NVIDIA GeForce RTX 4070 Laptop GPU
70.1 (30.2min, 35.2P0.1, 41.2P1) fps
Average NVIDIA GeForce RTX 4070 Laptop GPU
  (65.1 - 70.1, n=5)
68.2 fps -3%
2560x1440 High Preset
Average of class Gaming
  (22.5 - 87.1, n=13, last 2 years)
62 fps +45%
SCHENKER XMG Fusion 15 (Early 24)
Intel Core i9-14900HX, NVIDIA GeForce RTX 4070 Laptop GPU
42.8 (10.4min, 22.7P0.1, 29.2P1) fps
Average NVIDIA GeForce RTX 4070 Laptop GPU
  (40.2 - 44.5, n=5)
42.7 fps 0%
The Witcher 3 v4.00
1920x1080 Ultra Preset / On AA:FX
Average of class Gaming
  (25.7 - 150, n=17, last 2 years)
87.3 fps +1%
SCHENKER XMG Fusion 15 (Early 24)
Intel Core i9-14900HX, NVIDIA GeForce RTX 4070 Laptop GPU
86.5 (7.86min, 52.7P0.1, 64.6P1) fps
Average NVIDIA GeForce RTX 4070 Laptop GPU
  (85 - 86.5, n=2)
85.8 fps -1%
1920x1080 RT Ultra Preset / On AA:FX
Average of class Gaming
  (12.9 - 66, n=11, last 2 years)
42.3 fps +5%
SCHENKER XMG Fusion 15 (Early 24)
Intel Core i9-14900HX, NVIDIA GeForce RTX 4070 Laptop GPU
40.4 (8.77min, 13.8P0.1, 30.3P1) fps
Average NVIDIA GeForce RTX 4070 Laptop GPU
  (36 - 40.4, n=2)
38.2 fps -5%

Aby sprawdzić, czy liczba klatek na sekundę pozostaje stabilna przez dłuższy czas, pozwoliliśmy grze The Witcher 3 działać przez około 60 minut w rozdzielczości Full HD i z ustawieniami ustawionymi na maksimum. Nie poruszaliśmy postacią w grze. Nie odnotowaliśmy spadku liczby klatek na sekundę, jednak spadły one o kilka procent po około 50 minutach(Enthusiast). Przy aktywowanym profilu Overboost takie zachowanie nie miało miejsca.

Witcher 3 FPS diagram

0102030405060708090100110120130Tooltip
SCHENKER XMG Fusion 15 (Early 24) i9-14900HX, NVIDIA GeForce RTX 4070 Laptop GPU; FPS: Ø123.4 (111-129)
Aorus 16X 2024 i9-14900HX, NVIDIA GeForce RTX 4070 Laptop GPU; FPS: Ø118.6 (114-123)
Alienware m16 R2 Ultra 7 155H, NVIDIA GeForce RTX 4070 Laptop GPU: Ø110 (97-116)
HP Omen Transcend 16-u1095ng i9-14900HX, NVIDIA GeForce RTX 4070 Laptop GPU: Ø113.2 (109-118)
Lenovo Legion Pro 5 16IRX9 i9-14900HX, NVIDIA GeForce RTX 4070 Laptop GPU: Ø118.3 (114-125)
SCHENKER XMG Fusion 15 (Early 24) i9-14900HX, NVIDIA GeForce RTX 4070 Laptop GPU; Overboost: Ø130.2 (125-135)
Witcher 3 (Entuzjasta)
Witcher 3 (Overboost)
lowmed.highultraQHD
GTA V (2015) 187.8 187 186.4 137.6 98.2
The Witcher 3 (2015) 603.3 418.4 246.2 128 92.2
Dota 2 Reborn (2015) 234 207 196.5 182.1
Final Fantasy XV Benchmark (2018) 226 175.5 124.6 90.5
X-Plane 11.11 (2018) 205 173.3 136.9
Far Cry 5 (2018) 204 176 166 157 124
Strange Brigade (2018) 558 313 245 214 139.2
The Witcher 3 v4.00 (2023) 271 215 176.2 86.5
Baldur's Gate 3 (2023) 157.2 121.2 106.1 105 82.1
Cyberpunk 2077 2.1 Phantom Liberty (2023) 156.6 124.5 103.6 87 52.6
Alan Wake 2 (2023) 74.3 71.4 70.1 42.8
Alone in the Dark (2024) 222 209 196.5 126 76.6
Dragon's Dogma 2 (2024) 83.9 80 61.3

Emisje - laptop Schenker dość mocno się nagrzewa

Emisja hałasu

W codziennym użytkowaniu i na biegu jałowym laptop pracuje bardzo cicho. Choć wentylatory są stale włączone (można je dezaktywować poprzez BIOS), to słychać je tylko w bardzo cichym otoczeniu. Pod obciążeniem sytuacja szybko się zmienia: Odnotowaliśmy emisję hałasu do 53 dB(A)(Enthusiast). Tryb Overboost zaowocował jeszcze wyższymi wartościami. Urządzenie działa znacznie ciszej w trybie Zrównoważonym -kosztem wydajności.

Hałas

luz
27 / 28 / 33 dB
obciążenie
52 / 53 dB
  red to green bar
 
 
30 dB
cichy
40 dB(A)
słyszalny
50 dB(A)
irytujący
 
min: dark, med: mid, max: light   Earthworks M23R, Arta (odległość 15 cm)   environment noise: 25 dB(A)
dB(A) 0102030405060708090Deep BassMiddle BassHigh BassLower RangeMidsHigher MidsLower HighsMid HighsUpper HighsSuper Highs2041.640.242.642.940.92534.736.639.140.936.73141.545.949.24645.5402729.331.532.932.15028.427.32825.227.96337.128.428.924.435.38044.725.218.817.543.810025.319.91916.826.112524.319.719.717.327.516027.622.419.918.429.620029.326.525.324.531.225030.325.521.419.431.231531.520.818.416.233.240034.921.217.613.135.850036.924.716.911.638.263038.923.516.711.339.480040.523.215.311.540.5100041.322.115.311.341.5125041.922.315.411.142.7160043.122.415.111.643.3200043.321.314.611.843.4250042.919.914.312.243.2315042.319.713.512.742.1400040.817.513.512.740.8500039.615.713.612.839.2630038.716.513.912.738.7800036.11613.813.236.11000033.416.91412.833.11250030.117.514.113.229.81600027.226.118.920.827.4SPL52.932.927.425.153.1N8.71.80.90.68.8median 36.9median 21.2median 15.3median 12.8median 38.2Delta5.82.52.22.45.5hearing rangehide median Fan NoiseSCHENKER XMG Fusion 15 (Early 24)
SCHENKER XMG Fusion 15 (Early 24)
i9-14900HX, NVIDIA GeForce RTX 4070 Laptop GPU
Aorus 16X 2024
i9-14900HX, NVIDIA GeForce RTX 4070 Laptop GPU
Alienware m16 R2
Ultra 7 155H, NVIDIA GeForce RTX 4070 Laptop GPU
HP Omen Transcend 16-u1095ng
i9-14900HX, NVIDIA GeForce RTX 4070 Laptop GPU
Lenovo Legion Pro 5 16IRX9
i9-14900HX, NVIDIA GeForce RTX 4070 Laptop GPU
Noise
-5%
8%
5%
6%
off / environment *
25
26
-4%
24.7
1%
24
4%
23.9
4%
Idle Minimum *
27
26
4%
25.3
6%
29
-7%
24.3
10%
Idle Average *
28
32
-14%
25.3
10%
30
-7%
24.3
13%
Idle Maximum *
33
38
-15%
25.3
23%
31
6%
28.9
12%
Load Average *
52
54
-4%
31.7
39%
45
13%
45.8
12%
Witcher 3 ultra *
51
50
2%
53.8
-5%
44
14%
51
-0%
Load Maximum *
53
55
-4%
62
-17%
47
11%
56.6
-7%

* ... im mniej tym lepiej

Temperatura

Test warunków skrajnych i Witcher 3 test doprowadziły do znacznego nagrzewania się laptopa. Momentami osiągał on wartości w górnym zakresie 50 stopni Celsjusza. W codziennym użytkowaniu (biuro, internet), wartości generalnie utrzymują się w zielonej strefie.

 48 °C48 °C47 °C 
 43 °C44 °C42 °C 
 33 °C34 °C33 °C 
maks. w ogóle: 48 °C
średnia: 41.3 °C
54 °C56 °C49 °C
50 °C51 °C41 °C
33 °C33 °C32 °C
maks. w ogóle: 56 °C
średnia: 44.3 °C
zasilacz  44 °C | temperatura otoczenia 21 °C | Fluke t3000FC (calibrated), Voltcraft IR-900
(-) The average temperature for the upper side under maximal load is 41.3 °C / 106 F, compared to the average of 33.9 °C / 93 F for the devices in the class Gaming.
(-) The maximum temperature on the upper side is 48 °C / 118 F, compared to the average of 40.5 °C / 105 F, ranging from 21.2 to 68.8 °C for the class Gaming.
(-) The bottom heats up to a maximum of 56 °C / 133 F, compared to the average of 43.2 °C / 110 F
(+) In idle usage, the average temperature for the upper side is 26.6 °C / 80 F, compared to the device average of 33.9 °C / 93 F.
(-) Playing The Witcher 3, the average temperature for the upper side is 40.4 °C / 105 F, compared to the device average of 33.9 °C / 93 F.
(+) The palmrests and touchpad are reaching skin temperature as a maximum (34 °C / 93.2 F) and are therefore not hot.
(-) The average temperature of the palmrest area of similar devices was 28.9 °C / 84 F (-5.1 °C / -9.2 F).
SCHENKER XMG Fusion 15 (Early 24)
Intel Core i9-14900HX, NVIDIA GeForce RTX 4070 Laptop GPU
Aorus 16X 2024
Intel Core i9-14900HX, NVIDIA GeForce RTX 4070 Laptop GPU
Alienware m16 R2
Intel Core Ultra 7 155H, NVIDIA GeForce RTX 4070 Laptop GPU
HP Omen Transcend 16-u1095ng
Intel Core i9-14900HX, NVIDIA GeForce RTX 4070 Laptop GPU
Lenovo Legion Pro 5 16IRX9
Intel Core i9-14900HX, NVIDIA GeForce RTX 4070 Laptop GPU
Heat
-5%
-14%
-6%
-8%
Maximum Upper Side *
48
41
15%
44.8
7%
49
-2%
43.8
9%
Maximum Bottom *
56
41
27%
48
14%
63
-13%
55.4
1%
Idle Upper Side *
28
37
-32%
37.2
-33%
30
-7%
32.8
-17%
Idle Bottom *
29
38
-31%
42
-45%
29
-0%
36
-24%

* ... im mniej tym lepiej

Test warunków skrajnych

Ekstremalny scenariusz symulowany przez test warunków skrajnych (Prime95 i Furmark w trybie ciągłym) sprawdza stabilność systemu pod pełnym obciążeniem. Taktowanie procesora powoli i nieprzerwanie spadało z wartości nieznacznie przekraczających bazową częstotliwość taktowania do wartości poniżej niej. Rdzeń graficzny działał z wysoką prędkością przez cały czas.

Furmark &amp; Prime95
Witcher 3
Witcher 3
Witcher 3
Witcher 3
Witcher 3
Witcher 3

Głośniki

Głośniki stereo laptopa generują przyzwoity dźwięk, ale brakuje im basów. Lepsze wrażenia dźwiękowe można uzyskać podłączając słuchawki lub głośniki zewnętrzne.

dB(A) 0102030405060708090Deep BassMiddle BassHigh BassLower RangeMidsHigher MidsLower HighsMid HighsUpper HighsSuper Highs2042.9452540.939.5314650.94032.933.45025.232.86324.433.88017.527.410016.826.912517.339.916018.453.620024.564.525019.468.731516.268.440013.171.950011.68163011.380.480011.574100011.369.9125011.170.6160011.670.6200011.872.8250012.270315012.769.3400012.768.3500012.865.9630012.773.8800013.273.31000012.869.31250013.268.91600020.869.5SPL25.185.1N0.667median 12.8median 69.5Delta2.42.640.238.141.53751.448.536.534.544.244.429.432.924.739.221.449.129.258.225.563.323.564.621.26716.267.21470.614.377.615.777.812.574.711.770.211.666.911.970.512.369.312.872.913.370.814.176.813.770.91465.513.868.213.270.112.971.612.465.826.584.50.865.9median 13.8median 70.13.53.1hearing rangehide median Pink NoiseSCHENKER XMG Fusion 15 (Early 24)Aorus 16X 2024
Frequency diagram (checkboxes can be checked and unchecked to compare devices)
SCHENKER XMG Fusion 15 (Early 24) audio analysis

(+) | speakers can play relatively loud (85 dB)
Bass 100 - 315 Hz
(-) | nearly no bass - on average 15.8% lower than median
(±) | linearity of bass is average (12.5% delta to prev. frequency)
Mids 400 - 2000 Hz
(+) | balanced mids - only 4.4% away from median
(+) | mids are linear (5.9% delta to prev. frequency)
Highs 2 - 16 kHz
(+) | balanced highs - only 2% away from median
(+) | highs are linear (4.8% delta to prev. frequency)
Overall 100 - 16.000 Hz
(+) | overall sound is linear (11.5% difference to median)
Compared to same class
» 9% of all tested devices in this class were better, 3% similar, 88% worse
» The best had a delta of 6%, average was 18%, worst was 132%
Compared to all devices tested
» 6% of all tested devices were better, 2% similar, 92% worse
» The best had a delta of 4%, average was 25%, worst was 134%

Aorus 16X 2024 audio analysis

(+) | speakers can play relatively loud (85 dB)
Bass 100 - 315 Hz
(±) | reduced bass - on average 8.5% lower than median
(±) | linearity of bass is average (8.3% delta to prev. frequency)
Mids 400 - 2000 Hz
(+) | balanced mids - only 3.1% away from median
(+) | mids are linear (5.8% delta to prev. frequency)
Highs 2 - 16 kHz
(+) | balanced highs - only 2.5% away from median
(±) | linearity of highs is average (7% delta to prev. frequency)
Overall 100 - 16.000 Hz
(+) | overall sound is linear (8.4% difference to median)
Compared to same class
» 1% of all tested devices in this class were better, 1% similar, 98% worse
» The best had a delta of 6%, average was 18%, worst was 132%
Compared to all devices tested
» 2% of all tested devices were better, 1% similar, 98% worse
» The best had a delta of 4%, average was 25%, worst was 134%

Zarządzanie energią - Fusion 15 zapewnia bardzo dobre czasy pracy

Zużycie energii

Jego zapotrzebowanie na energię jest w dużej mierze normalne dla zainstalowanego sprzętu. Wyjątek: Pomimo w pełni naładowanej baterii, zmierzyliśmy wartość poboru mocy około 20 watów przy wyłączonym laptopie. Jest to prawdopodobnie błąd. Test Witcher 3 test i test warunków skrajnych przebiegły z nieznacznie spadającymi wartościami poboru mocy. Moc zasilacza (280 W) jest wystarczająca.

Pobór mocy
luzdarkmidlight 8 / 14 / 26 W
obciążenie midlight 118 / 244 W
 color bar
Legenda: min: dark, med: mid, max: light        Metrahit Energy
SCHENKER XMG Fusion 15 (Early 24)
i9-14900HX, NVIDIA GeForce RTX 4070 Laptop GPU
Aorus 16X 2024
i9-14900HX, NVIDIA GeForce RTX 4070 Laptop GPU
Alienware m16 R2
Ultra 7 155H, NVIDIA GeForce RTX 4070 Laptop GPU
HP Omen Transcend 16-u1095ng
i9-14900HX, NVIDIA GeForce RTX 4070 Laptop GPU
Average of class Gaming
 
Power Consumption
-21%
-3%
-10%
-20%
Idle Minimum *
8
13
-63%
8.1
-1%
10
-25%
Idle Average *
14
18
-29%
13
7%
18
-29%
Idle Maximum *
26
35
-35%
40.3
-55%
32
-23%
Load Average *
118
138
-17%
79
33%
128
-8%
Witcher 3 ultra *
192.7
172.6
10%
188.1
2%
148.4
23%
Load Maximum *
244
222
9%
254.9
-4%
242
1%

* ... im mniej tym lepiej

Power consumption Witcher 3 / stress test

0153045607590105120135150165180195210225Tooltip
SCHENKER XMG Fusion 15 (Early 24); Witcher 3 ultra: Ø192.7 (182.8-220)
SCHENKER XMG Fusion 15 (Early 24); 1280x720 Prime95 28.10 and Furmark 1.25: Ø195.5 (184.9-229)
SCHENKER XMG Fusion 15 (Early 24); Idle 150cd/m2: Ø13.5 (8.11-25.8)

Power consumption with external monitor

0153045607590105120135150165180195Tooltip
SCHENKER XMG Fusion 15 (Early 24); Prime95 V2810 Stress (external Monitor): Ø111.6 (110.9-114.8)
SCHENKER XMG Fusion 15 (Early 24); Cinebench R23 Multi (external Monitor): Ø109.5 (108.4-112.6)
SCHENKER XMG Fusion 15 (Early 24); 1280x720 FurMark 1.19 GPU Stress Test (external Monitor): Ø167.2 (164.2-172.9)
SCHENKER XMG Fusion 15 (Early 24); 1920x1080 The Witcher 3 ultra (external Monitor): Ø187.8 (163.3-206)
SCHENKER XMG Fusion 15 (Early 24); Idle 1min (external Monitor): Ø20.1 (16.6-24.4)

Czas trwania

Podczas naszego testu WiFi (ładowanie stron internetowych za pomocą skryptu) i testu wideo (krótki film Big Buck Bunny (kodowanie H.264, FHD) w pętli) zmierzyliśmy czasy działania odpowiednio 8:00 godzin i 10:02 godzin. Są to bardzo dobre wartości.

Bateria ma pojemność 99,8 Wh.
Wydajność akumulatora
luz
15h 11min
WiFi Websurfing (Edge 124)
8h 00min
Big Buck Bunny H.264 1080p
10h 02min
obciążenie
2h 44min
SCHENKER XMG Fusion 15 (Early 24)
i9-14900HX, NVIDIA GeForce RTX 4070 Laptop GPU, 99.8 Wh
Aorus 16X 2024
i9-14900HX, NVIDIA GeForce RTX 4070 Laptop GPU, 99 Wh
Alienware m16 R2
Ultra 7 155H, NVIDIA GeForce RTX 4070 Laptop GPU, 90 Wh
HP Omen Transcend 16-u1095ng
i9-14900HX, NVIDIA GeForce RTX 4070 Laptop GPU, 97 Wh
Lenovo Legion Pro 5 16IRX9
i9-14900HX, NVIDIA GeForce RTX 4070 Laptop GPU, 80 Wh
Average of class Gaming
 
Czasy pracy
-17%
-26%
-39%
-52%
-35%
Reader / Idle
911
753
-17%
758
-17%
403
-56%
H.264
602
541
-10%
WiFi v1.3
480
481
0%
483
1%
292
-39%
290
-40%
Load
164
100
-39%
60
-63%
65
-60%

Za

+ jasny ekran QHD+ o proporcjach 16:10 (240 Hz, Adaptive Sync, sRGB)
+ wysoka wydajność systemu
+ dwa gniazda SSD (PCIe 4, M.2-2280)
+ Możliwość wymiany/rozbudowy pamięci RAM
+ podświetlenie RGB z jednym przyciskiem
+ Thunderbolt 4
+ Power Delivery
+ bardzo dobre czasy pracy

Przeciw

- głośny i gorący pod pełnym obciążeniem
- 8 GB pamięci VRAM niezbyt przyszłościowe
- brak Advanced Optimus

Werdykt - Przenośny, potężny, wytrwały

XMG Fusion 15 (Early 24), próbka testowa dostarczona przez Schenker.

Kompaktowe wymiary i niewielka waga (ok. 2,1 kg) nie wpływają na obniżenie wydajności sprzętu. Procesor Core i9 i GeForce RTX 4070 są w stanie pracować z niezmiennie wysokimi częstotliwościami taktowania. Połączenie wydajności i przenośności laptopa można uznać za sukces.

XMG Fusion 15 (Early 24) - wydajny, przenośny laptop dla graczy i twórców.

Laptop dość mocno nagrzewa się pod obciążeniem, a przy tym wytwarza sporo hałasu. Bardziej umiarkowana emisja wymaga poświęcenia pewnej mocy obliczeniowej. Jego 15,3-calowy ekran (2560 x 1600 pikseli, IPS, 240 Hz, Adaptive Sync) o proporcjach 16:10 robi ogólne wrażenie. Na uwagę zasługuje jego wysoka jasność.

Jedno pełne ładowanie (99,8 Wh) wystarcza na praktyczny czas pracy wynoszący około 8 - 10 godzin - bardzo dobre wartości. Pozytywne: Akumulator można ładować za pomocą zasilacza USB-C (min. 100 W, 20 V) - port TB4 laptopa obsługuje Power Delivery. Dzięki temu nie muszą Państwo cały czas nosić ze sobą firmowego zasilacza (280 W).

Alternatywą może być Aorus 16X (2024). Laptop ten oferuje porównywalną moc obliczeniową, a także podobnie dobre czasy pracy.

Cena i dostępność

XMG Fusion 15 (Early 24) można skonfigurować i zamówić bezpośrednio w sklepie internetowym Schenker. Obecne urządzenie testowe kosztuje około 2 500 USD. Ceny zaczynają się od około 1700 USD.

SCHENKER XMG Fusion 15 (Early 24) - 01/05/2024 v7 (old)
Sascha Mölck

Wykonanie
83 / 98 → 84%
Klawiatura
81%
Myszka
86%
Komunikacja
72 / 80 → 90%
Waga
62 / 10-66 → 93%
Akumulator
82 / 95 → 86%
Wyświetlacz
92%
Wydajność w grach
99%
Wydajność w programach użytkowych
97%
Temperatura
81 / 95 → 85%
Hałas
68 / 90 → 76%
Głośniki
82%
Kamerka
46 / 85 → 54%
Średnio
79%
89%
Gaming - Ważona średnia

Transparency

The selection of devices to be reviewed is made by our editorial team. The test sample was provided to the author as a loan by the manufacturer or retailer for the purpose of this review. The lender had no influence on this review, nor did the manufacturer receive a copy of this review before publication. There was no obligation to publish this review. We never accept compensation or payment in return for our reviews. As an independent media company, Notebookcheck is not subjected to the authority of manufacturers, retailers or publishers.

This is how Notebookcheck is testing

Every year, Notebookcheck independently reviews hundreds of laptops and smartphones using standardized procedures to ensure that all results are comparable. We have continuously developed our test methods for around 20 years and set industry standards in the process. In our test labs, high-quality measuring equipment is utilized by experienced technicians and editors. These tests involve a multi-stage validation process. Our complex rating system is based on hundreds of well-founded measurements and benchmarks, which maintains objectivity. Further information on our test methods can be found here.

Price comparison

Please share our article, every link counts!
Mail Logo
> laptopy testy i recenzje notebooki > Laptopy > Recenzja XMG Fusion 15 (Early 24): Kompaktowy laptop RTX 4070 dla graczy i twórców
Sascha Mölck, 2024-05- 4 (Update: 2024-05- 4)