

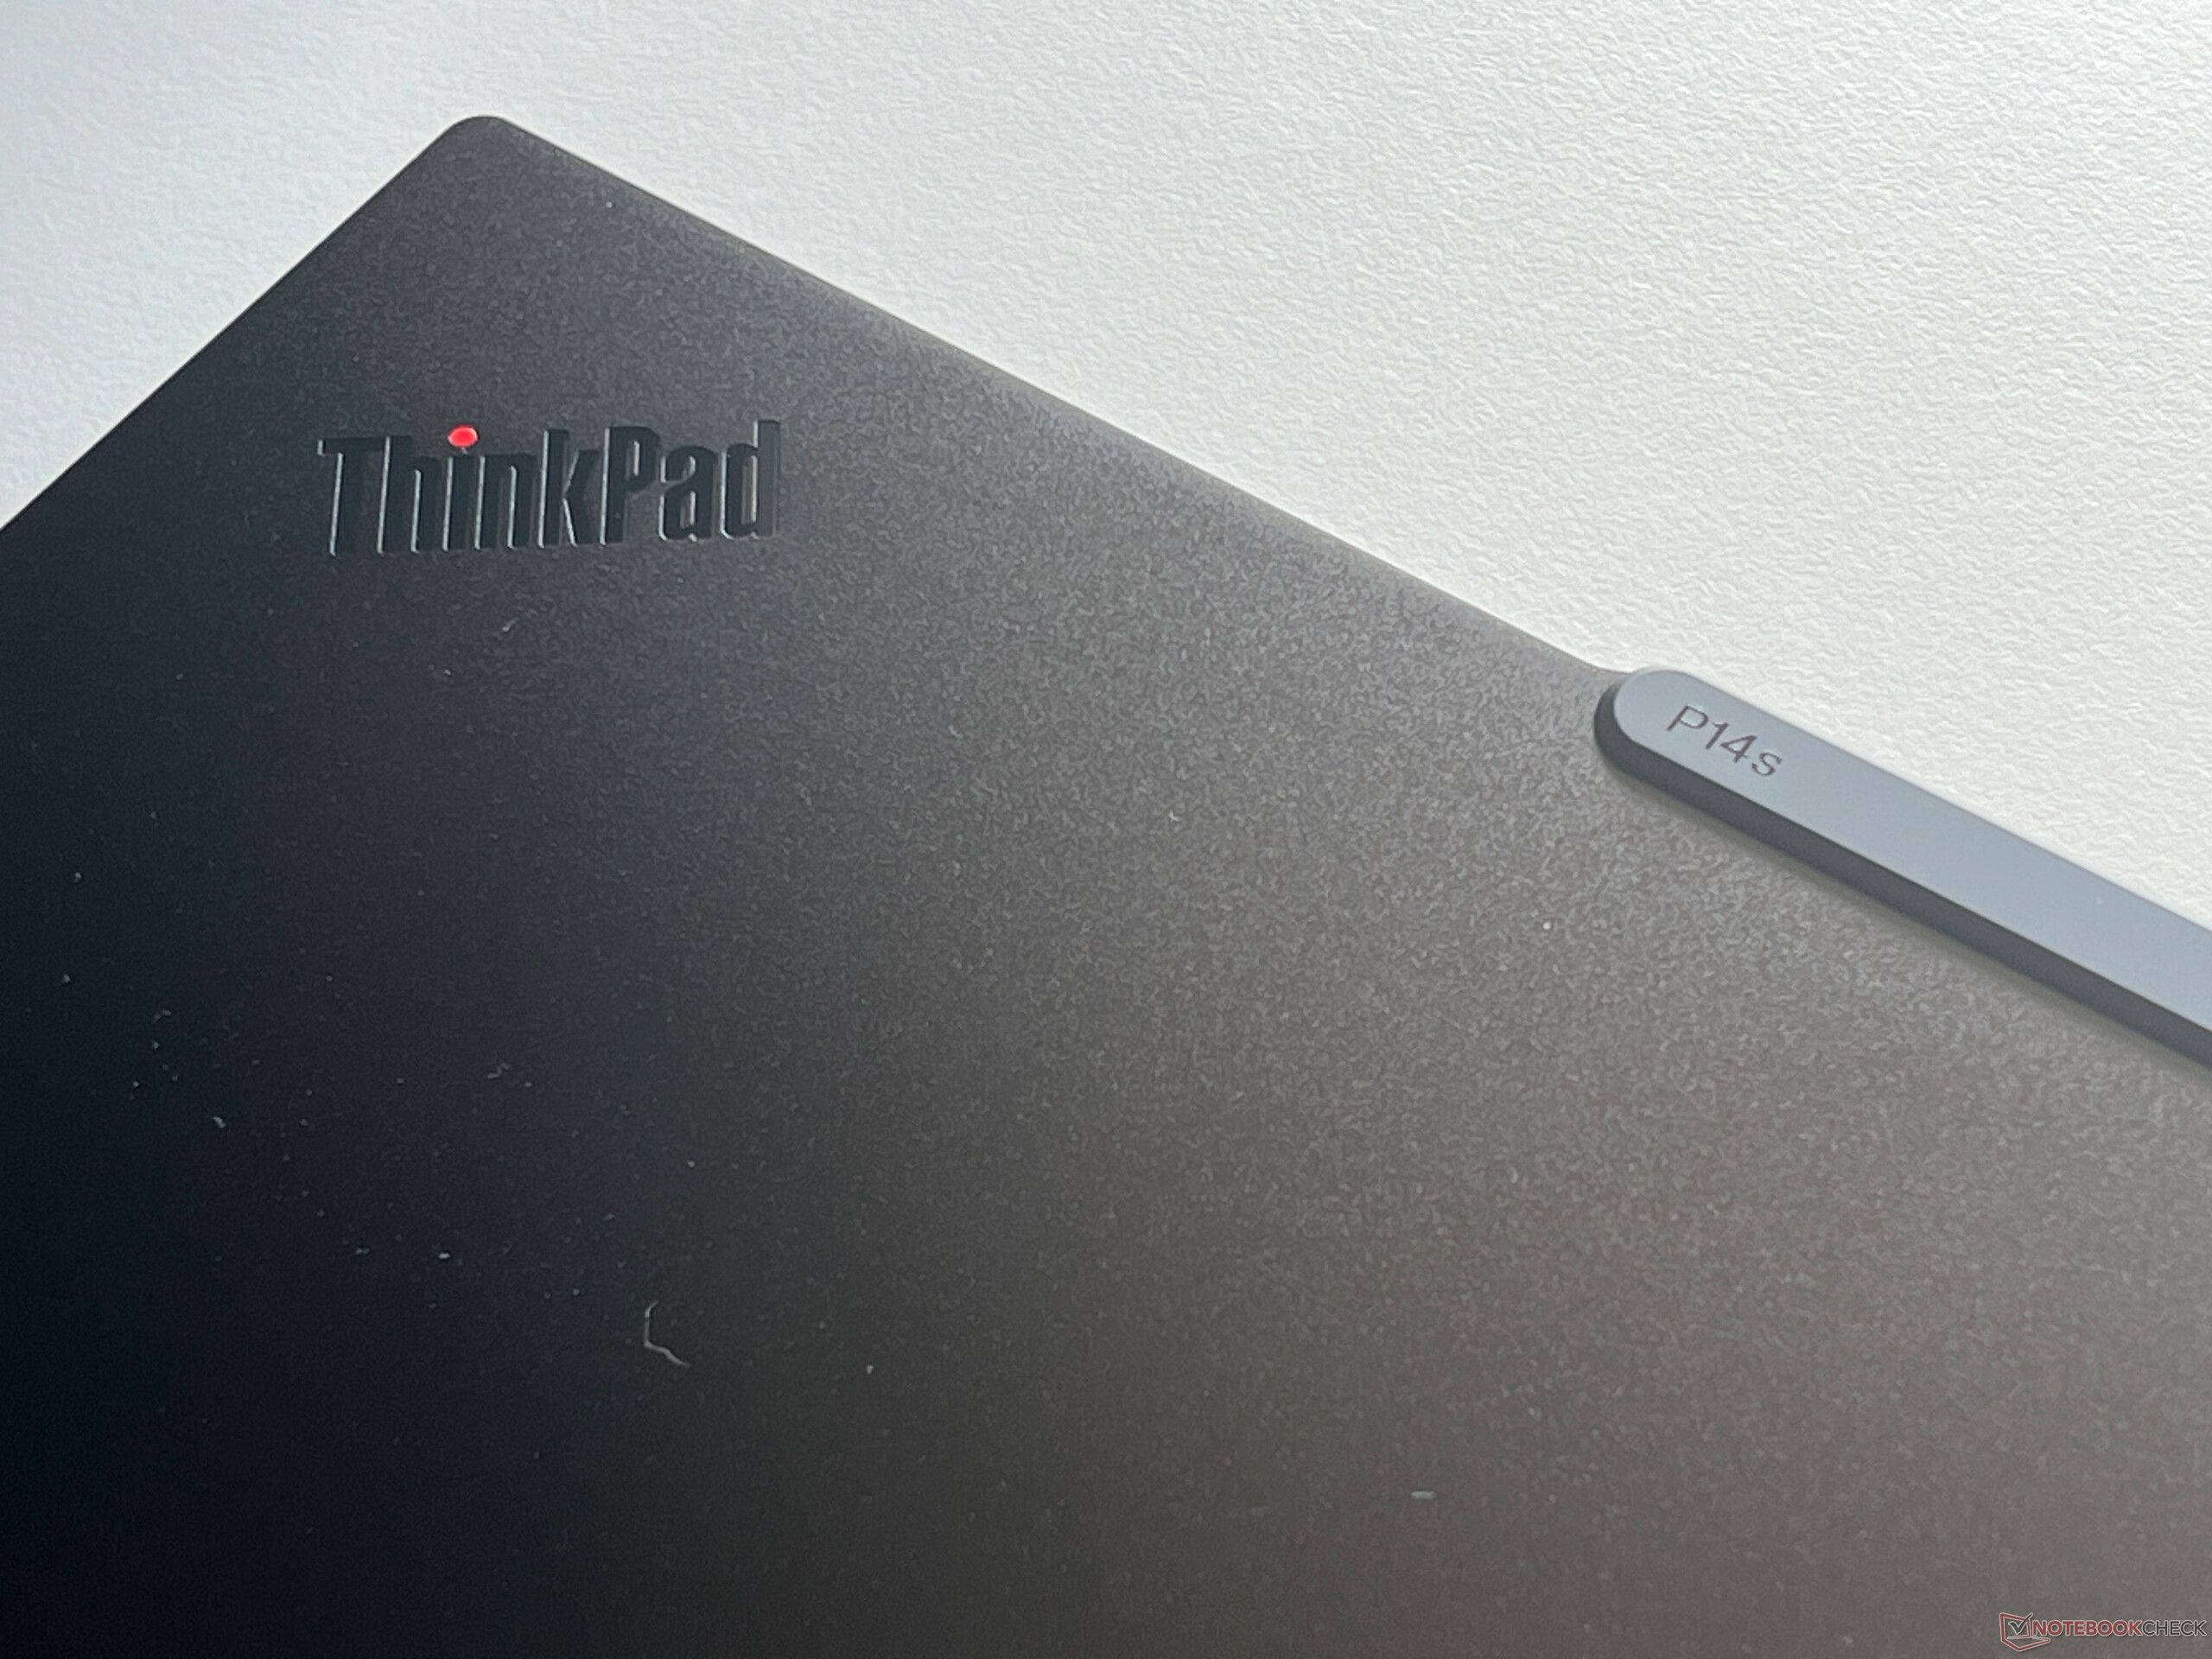
Recenzja laptopa Lenovo ThinkPad P14s G5 - Mobilna stacja robocza teraz z RTX 500 Ada i panelem IPS 3K
Lenovo obrało nową drogę ze swoją mobilną stacją roboczą ThinkPad P14s G5, ponieważ podczas gdy poprzednie modele zawsze bazowały na odpowiednich modelach z serii T, nowy P14s G5 z procesorami Intela otrzymał swój własny design, w tym nowy 14,5-calowy wyświetlacz (poprzednio 14 cali). Z drugiej strony, P14s G5 z procesorami AMD nadal wykorzystuje starą obudowę wraz z 14-calowym panelem.
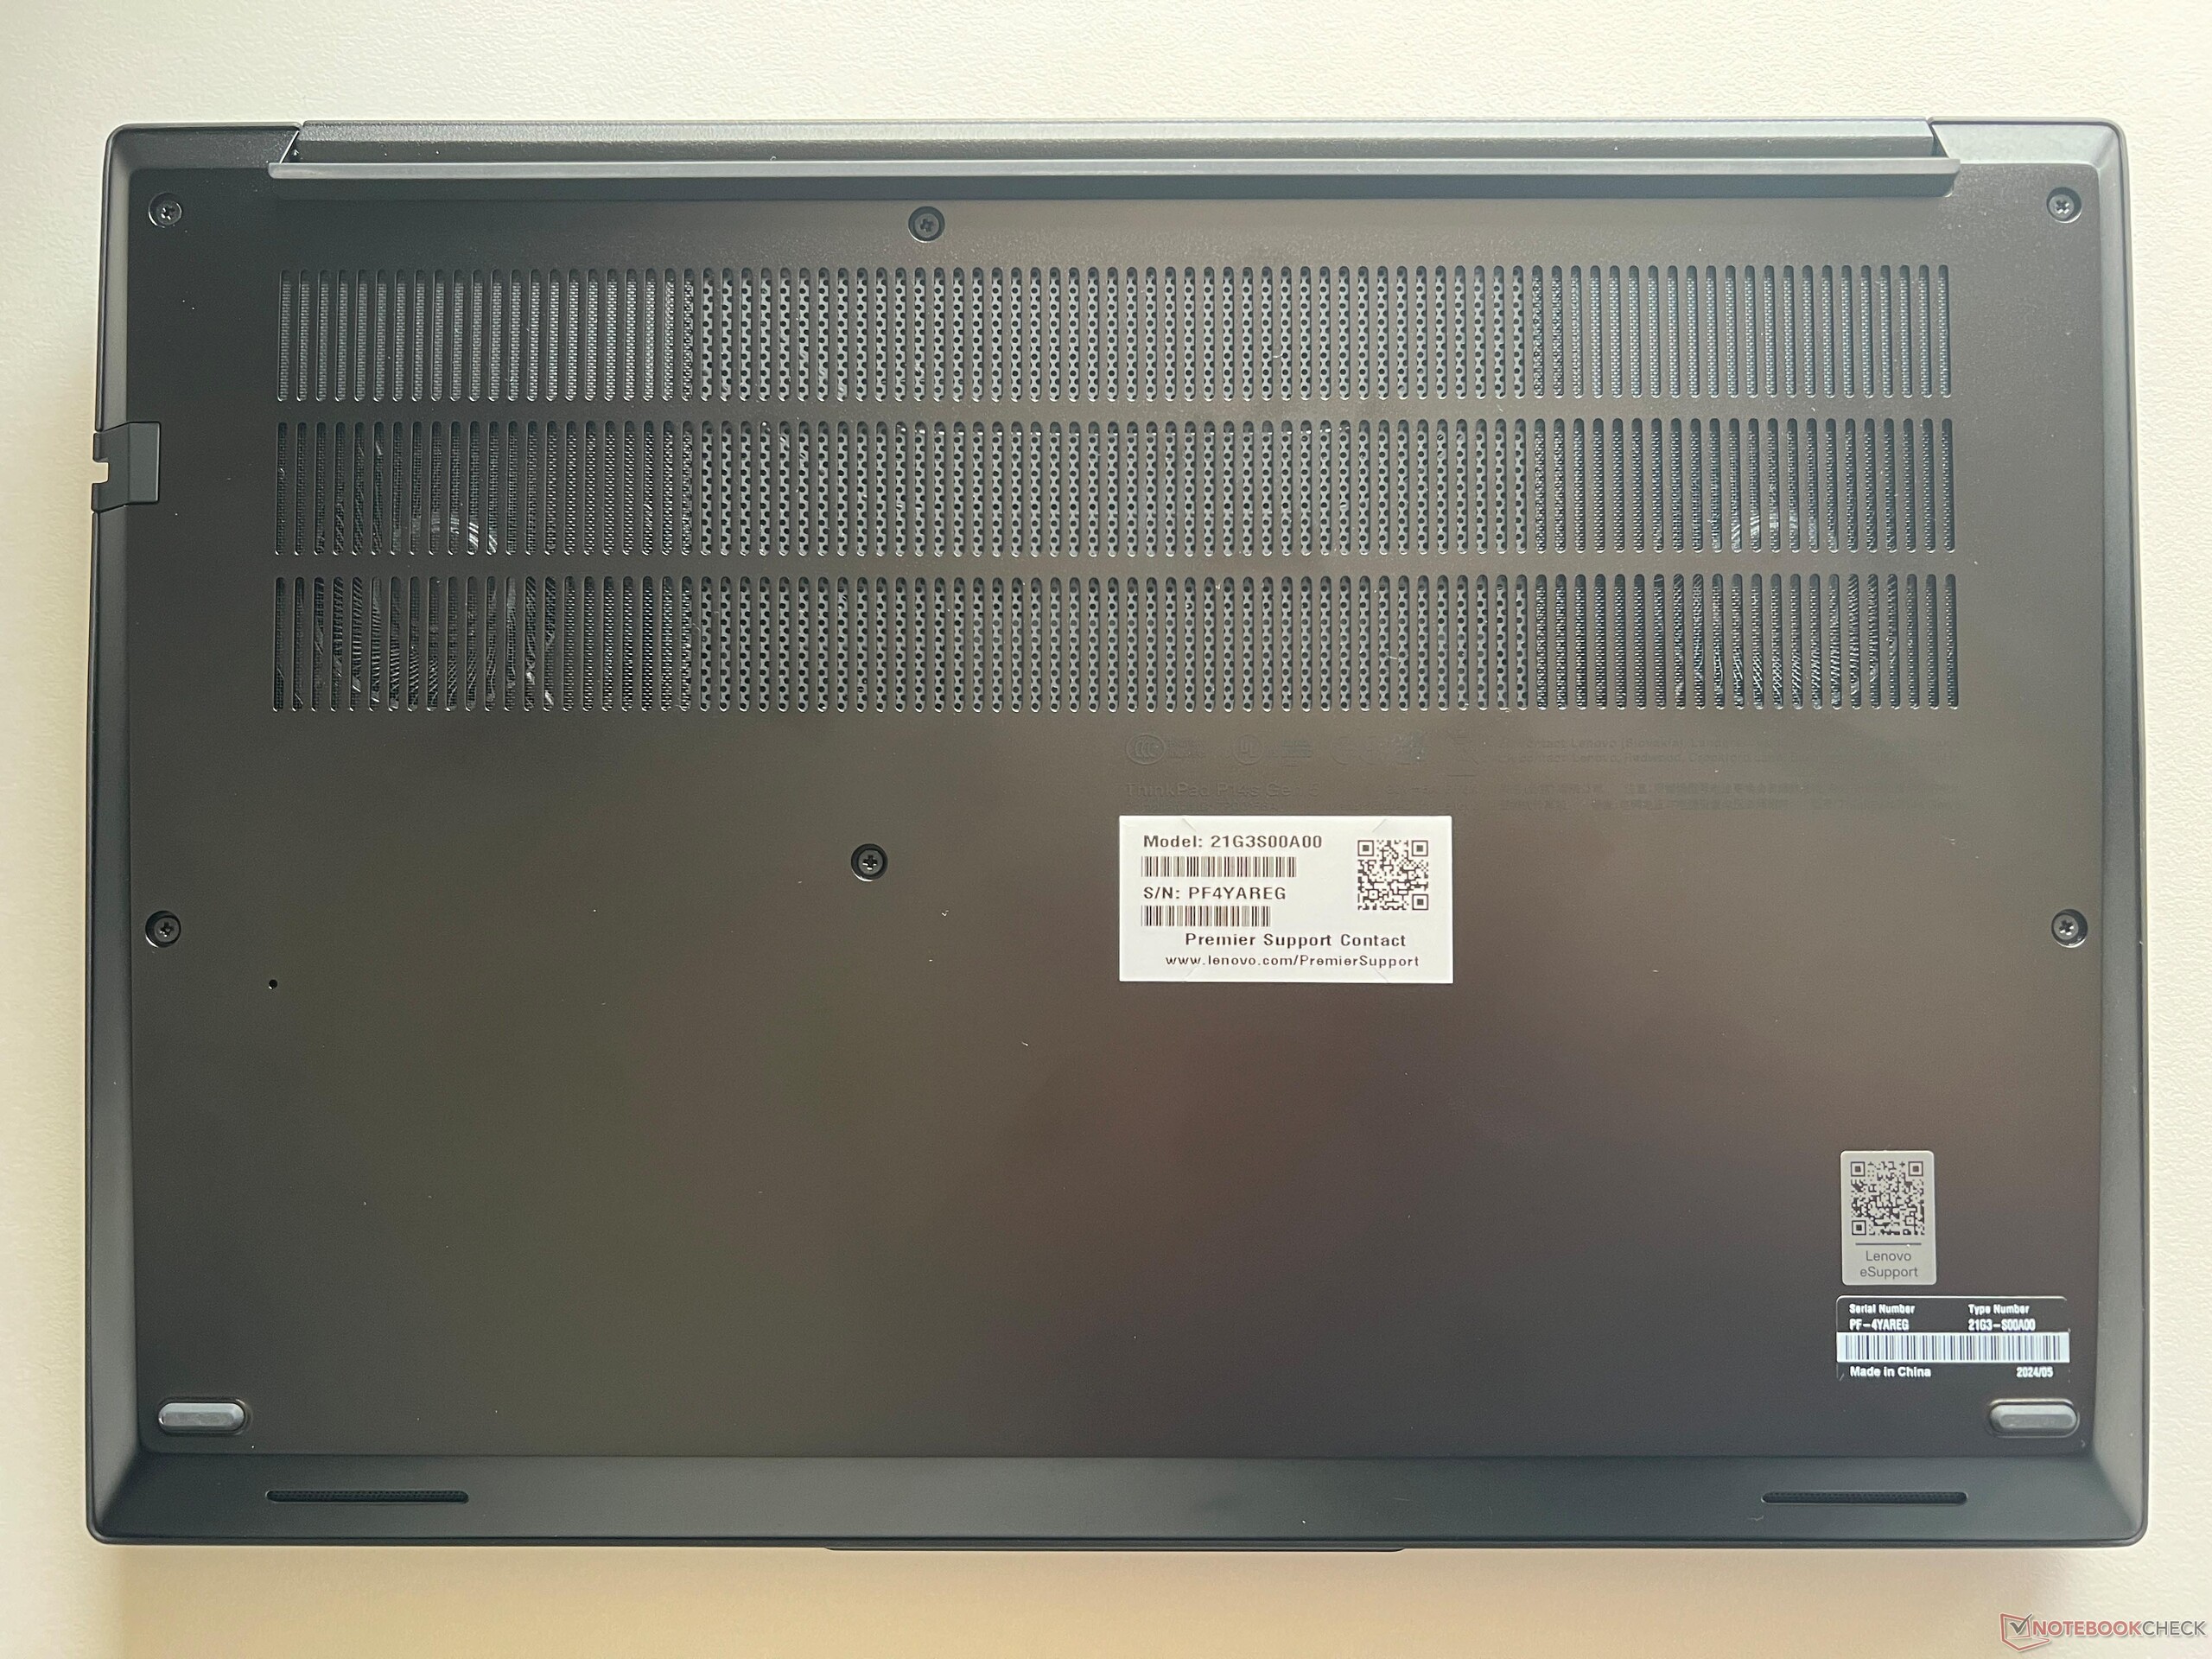
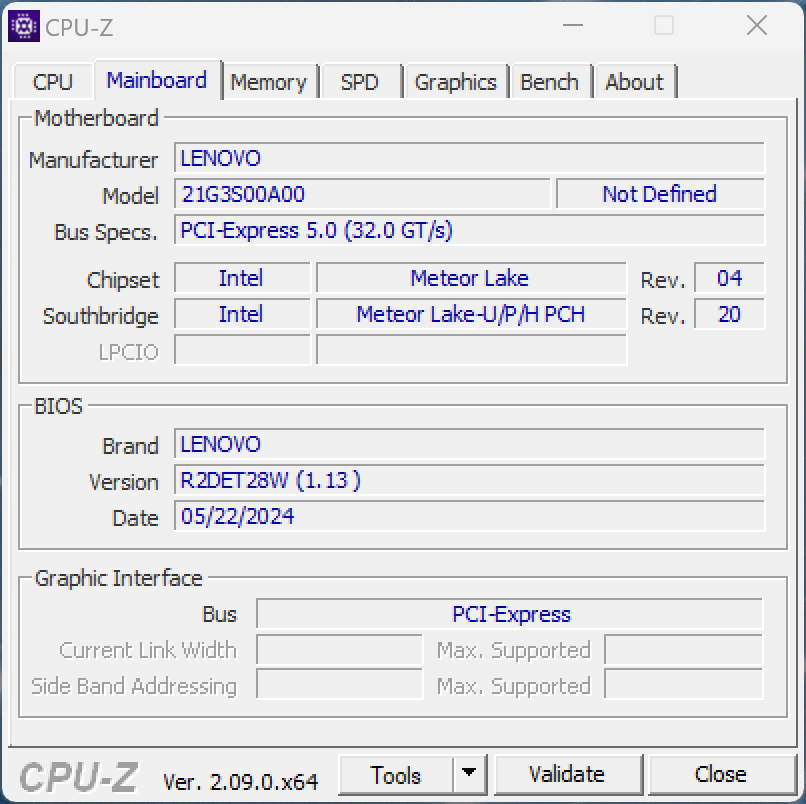
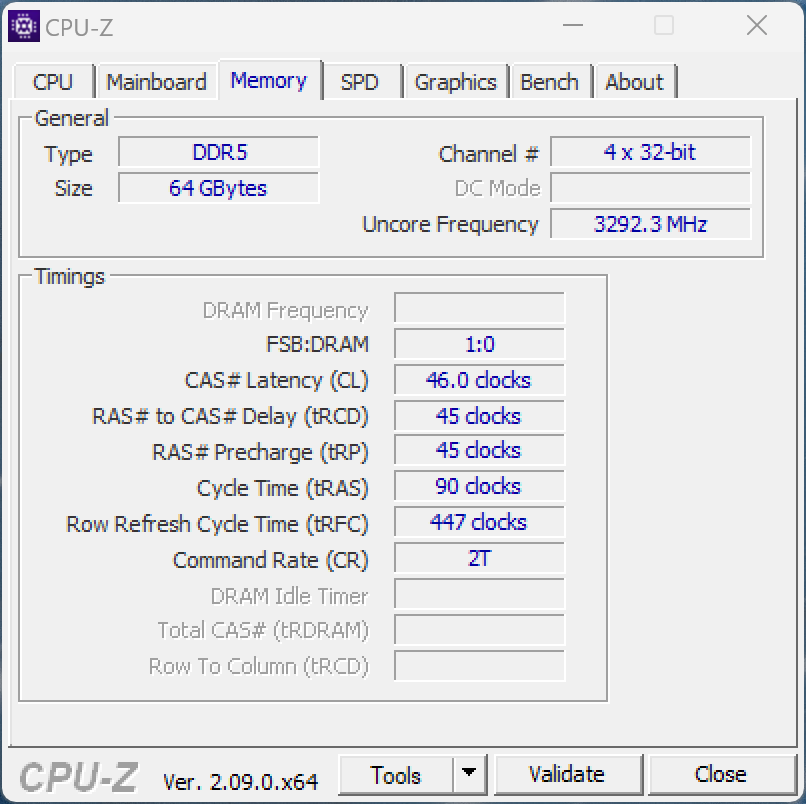
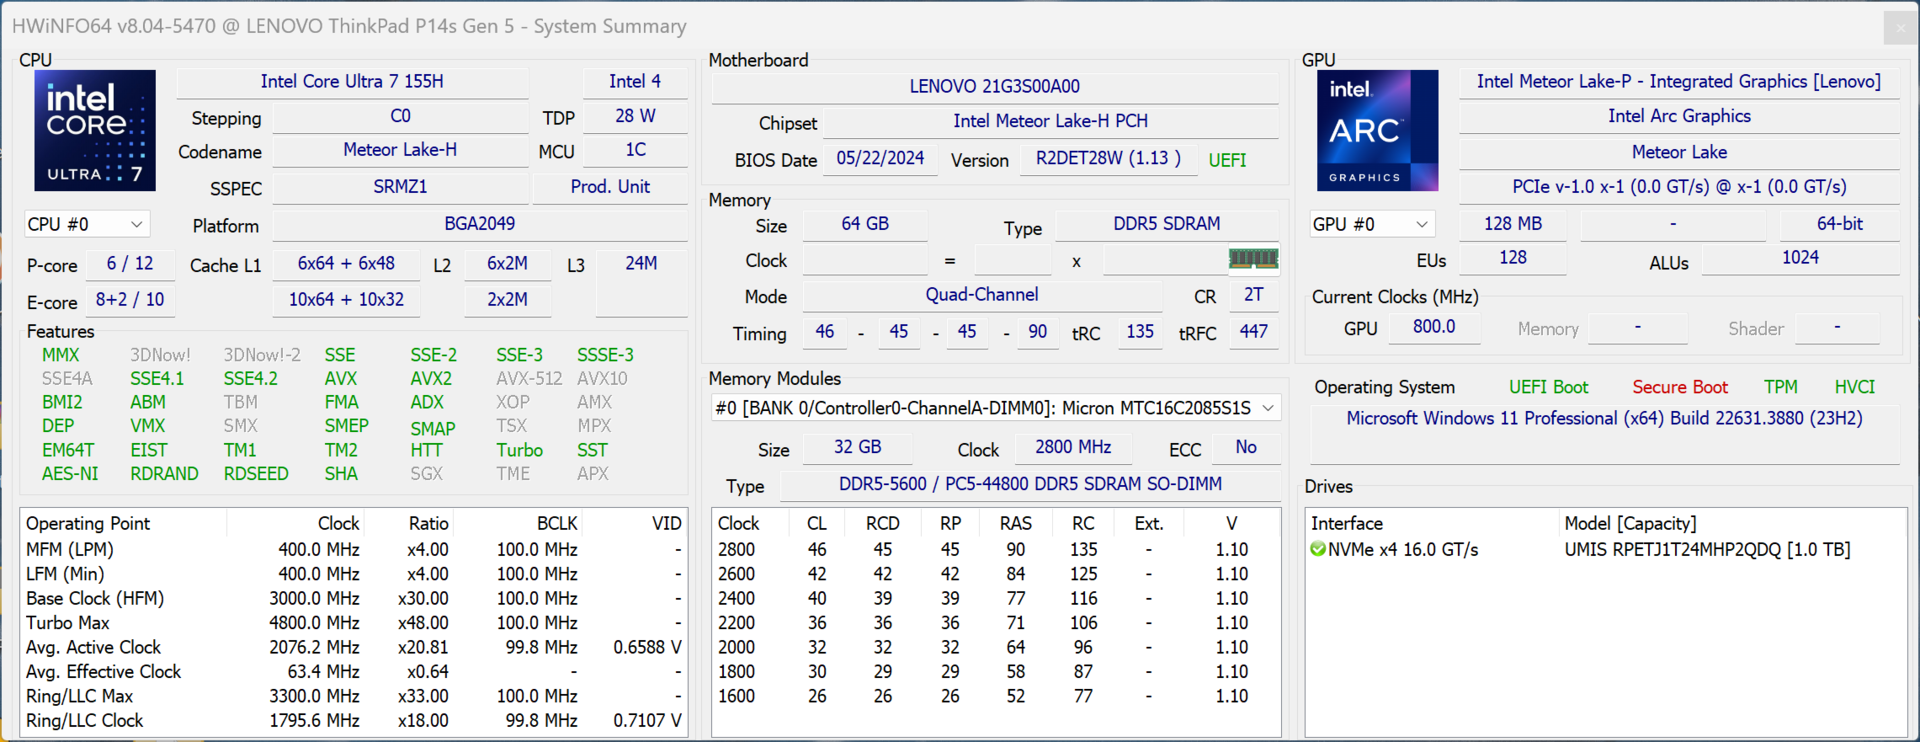
Nasze urządzenie testowe to wersja Campus 21G3S00A00 za około 2100 USD bez systemu operacyjnego, ale z bardzo dobrą konfiguracją. Oprócz nowego wyświetlacza 3K, został on wyposażony w procesor Core Ultra 7 155H w połączeniu z 64 GB pamięci RAM, dyskiem SSD o pojemności 1 TB, a także dedykowaną kartą graficzną Nvidia RTX 500 Ada. Obecnie nie ma odpowiadającego mu najlepiej sprzedającego się modelu dla klientów prywatnych; jeśli skonfigurują Państwo urządzenie za pośrednictwem strony internetowej Lenovo, cena wyniesie obecnie nieco ponad 2700 USD, w tym Windows 11 Home.
Potencjalni konkurenci w porównaniu
Ocena | Wersja | Data | Model | Waga | Wysokość | Rozmiar | Rezolucja | Cena |
|---|---|---|---|---|---|---|---|---|
| 82.5 % | v8 | 07/2024 | Lenovo ThinkPad P14s G5 21G3S00A00 Ultra 7 155H, Nvidia RTX 500 Ada Generation Laptop GPU | 1.7 kg | 22 mm | 14.50" | 3072x1920 | |
| 80.3 % | v8 | 07/2024 | HP ZBook Firefly 14 G11 Ultra 7 165H, RTX A500 Laptop GPU | 1.5 kg | 19.2 mm | 14.00" | 2560x1600 | |
| 81 % | v8 | 07/2024 | Lenovo ThinkPad P14s G4 21HF0017GE i7-1370P, RTX A500 Laptop GPU | 1.5 kg | 22.7 mm | 14.00" | 2880x1800 | |
| 89.3 % v7 (old) | v7 (old) | 04/2024 | Dell Precision 5000 5490 Ultra 9 185H, NVIDIA RTX 3000 Ada Generation Laptop GPU | 1.6 kg | 18.95 mm | 14.00" | 2560x1600 | |
| 85.5 % v7 (old) | v7 (old) | 10/2023 | Microsoft Surface Laptop Studio 2 RTX 4060 i7-13700H, NVIDIA GeForce RTX 4060 Laptop GPU | 2 kg | 22 mm | 14.40" | 2400x1600 | |
| 89.8 % v7 (old) | v7 (old) | 07/2023 | Lenovo Yoga Pro 9-14IRP G8 i7-13705H, NVIDIA GeForce RTX 4050 Laptop GPU | 1.7 kg | 17.6 mm | 14.50" | 3072x1920 |
Prosimy pamiętać: Niedawno zaktualizowaliśmy nasz system oceny i wyniki wersji 8 nie są porównywalne z wynikami wersji 7. Więcej informacji znajdą Państwo tutaj .
Obudowa - Lenovo oszukało z wymiarami
ThinkPad P14s to mobilna stacja robocza i kiedy weźmiemy ją do ręki po raz pierwszy, od razu zauważymy, że zdecydowanie nie jest to szczególnie cienkie ani lekkie urządzenie. Kiedy jednak spojrzeliśmy na jego arkusz danych, byliśmy zaskoczeni, ponieważ Lenovo podaje wysokość 18,5 mm, co jest po prostu nieprawidłowe. Zmierzyliśmy około 22 mm bez nóżek, co stanowi kolejną znaczącą różnicę.
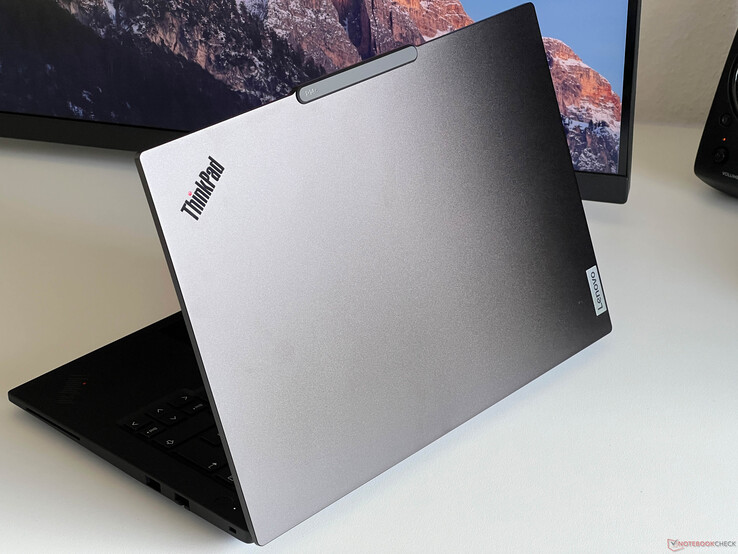
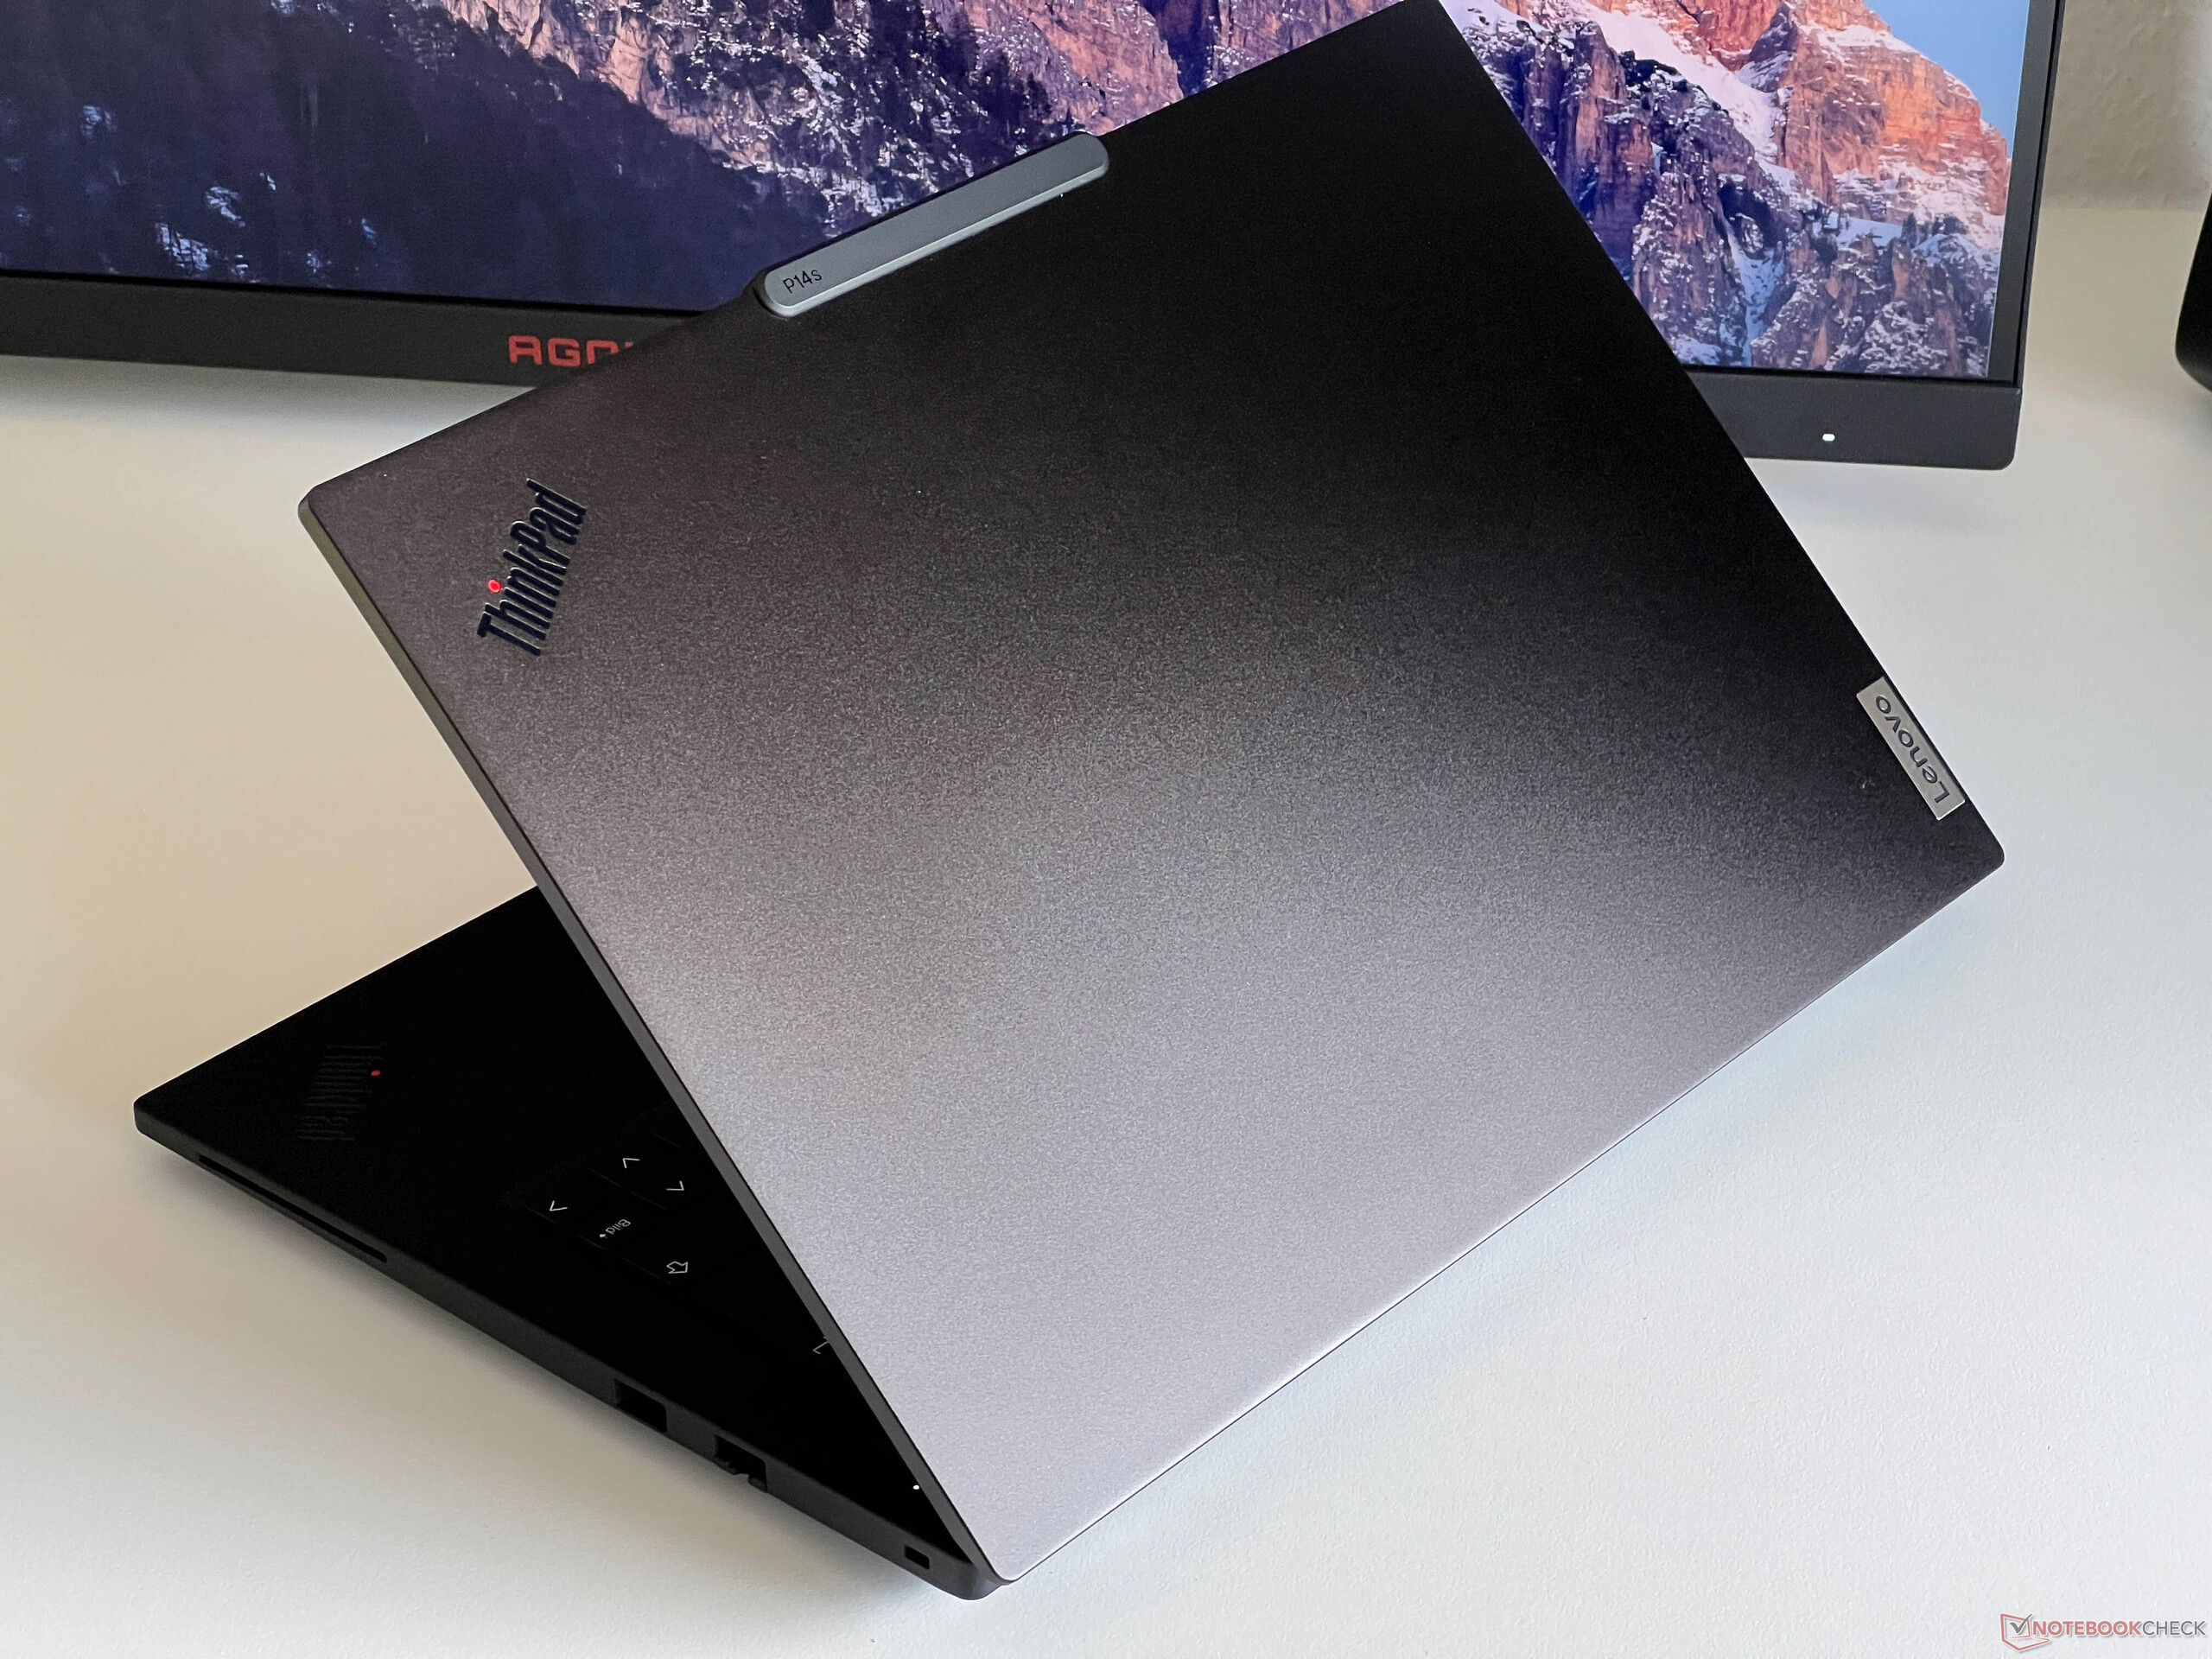
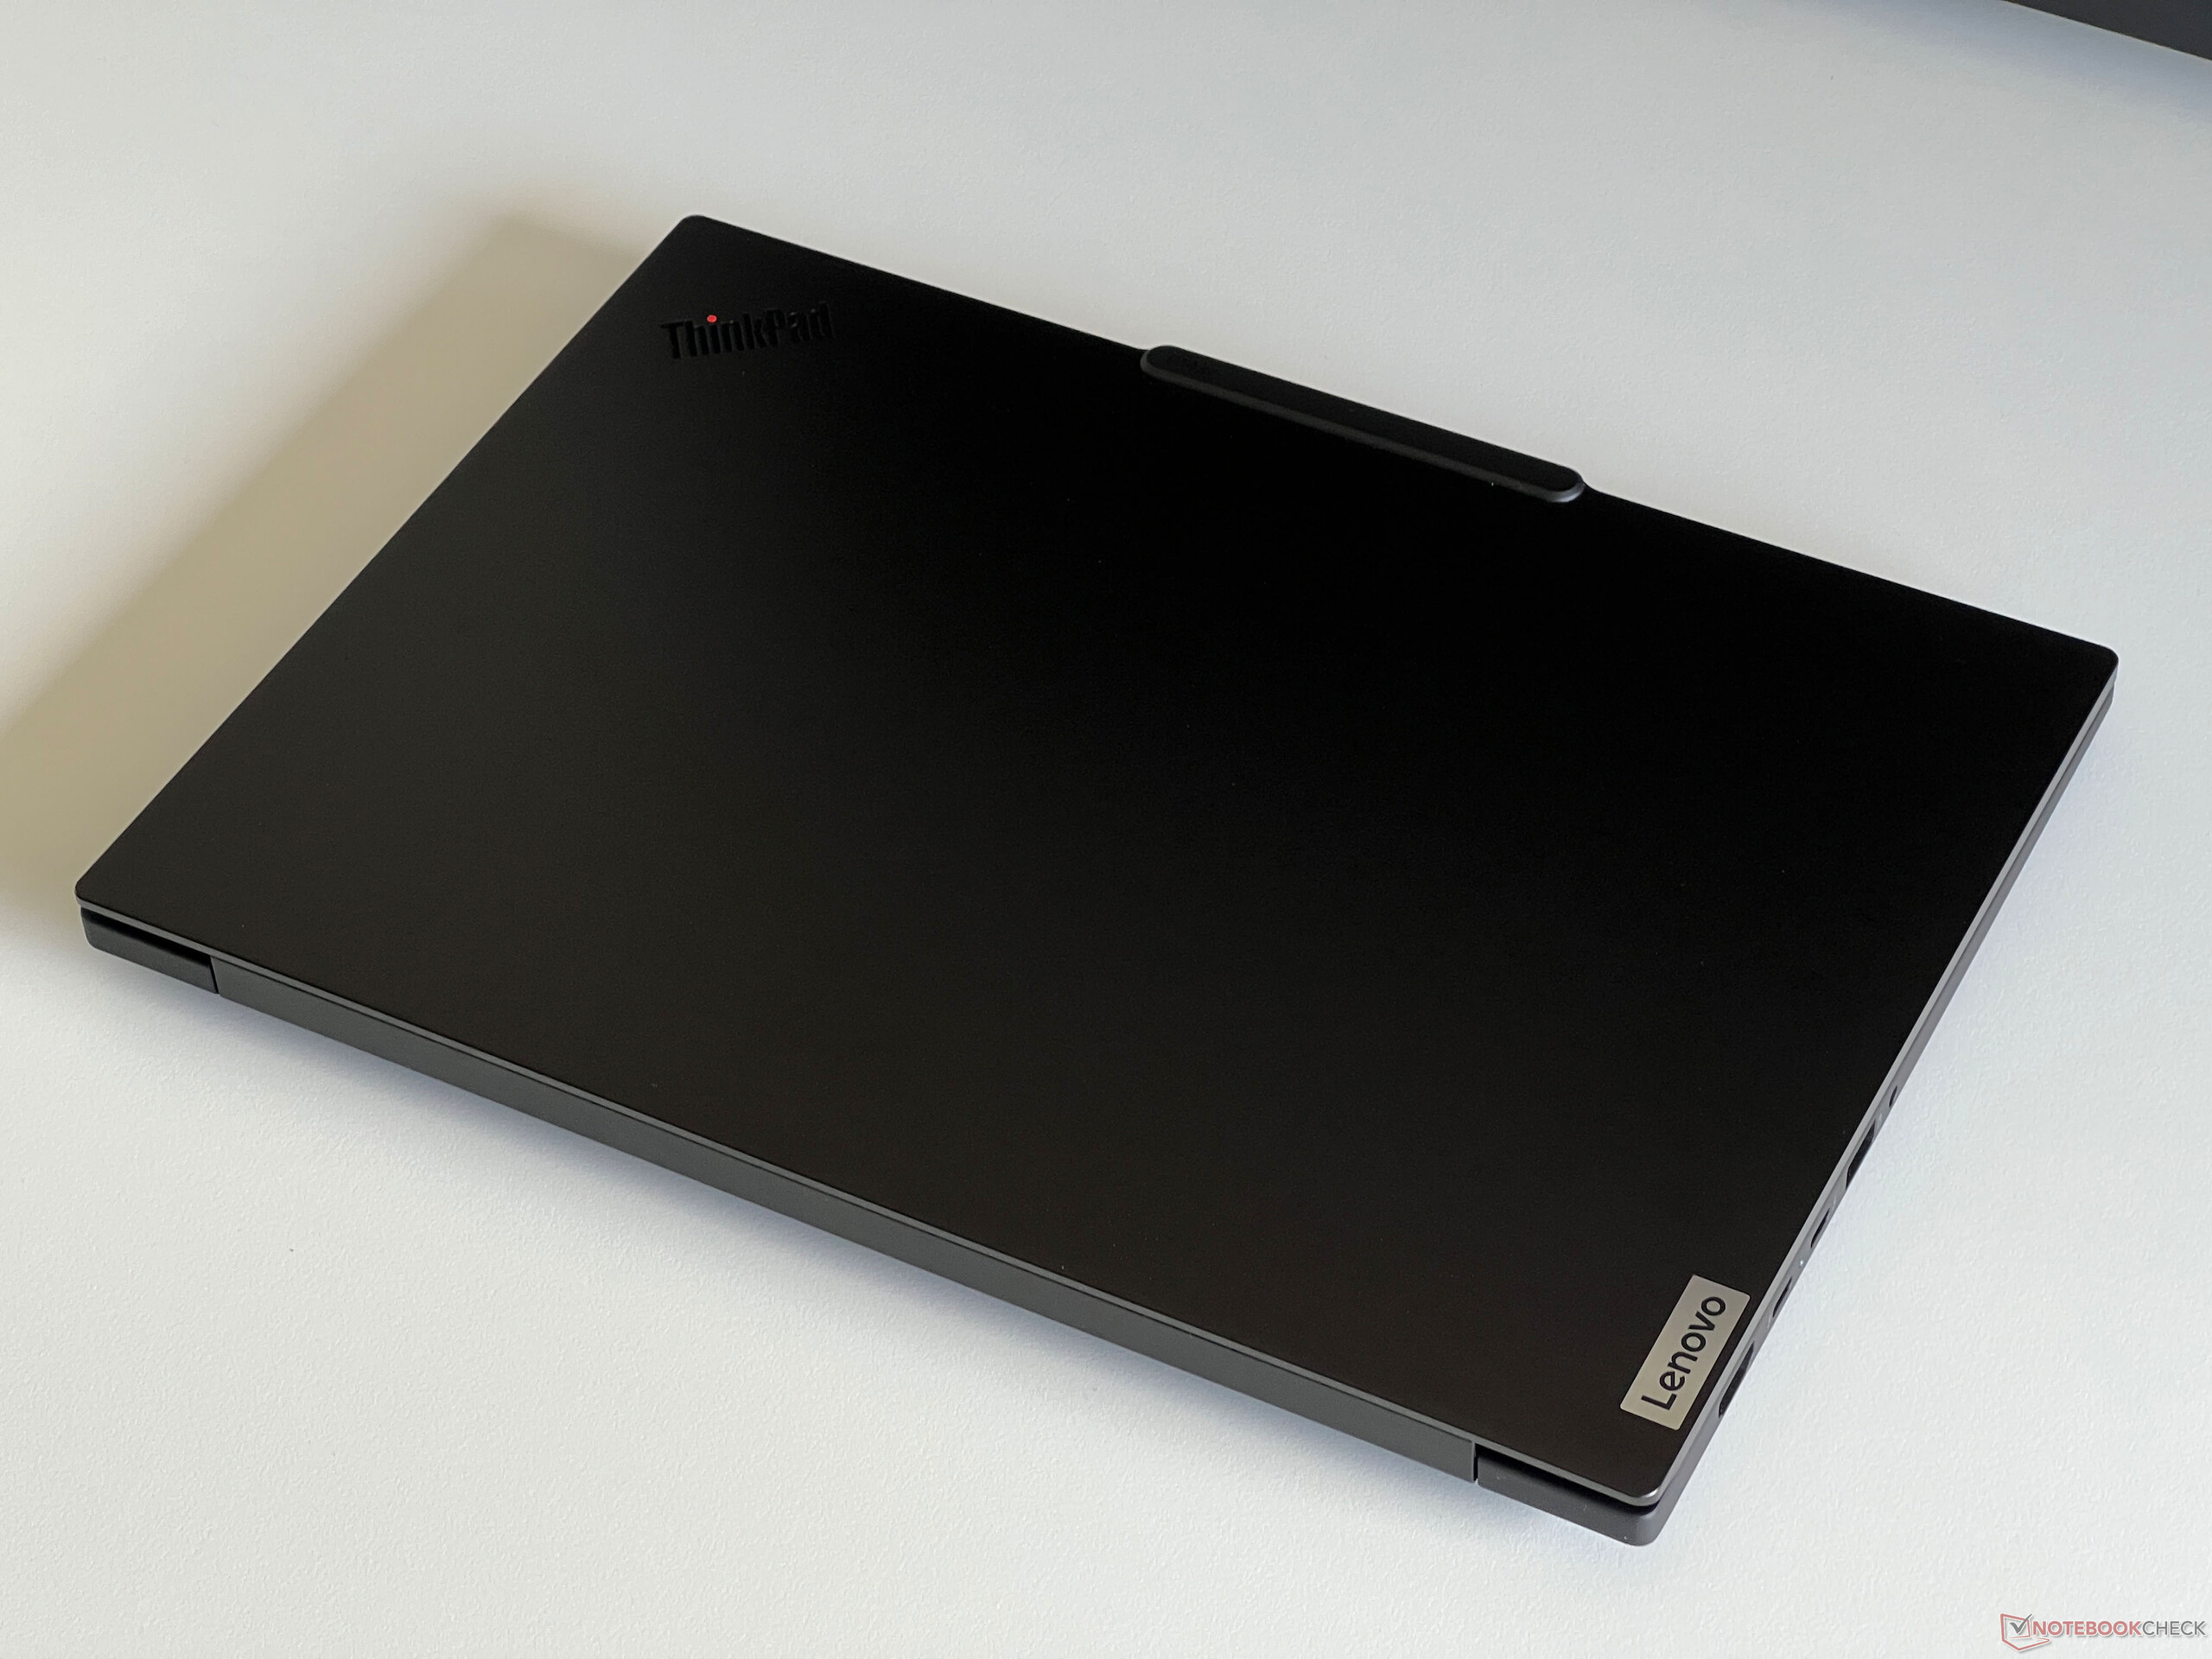
Z zewnątrz ThinkPad P14s G5 charakteryzuje się tym samym designem, co obecne modele producenta, co niestety obejmuje nieatrakcyjną i wystającą wypukłość kamery. Poza tym jego design został utrzymany w prostym i dla niektórych być może nieco nudnym stylu. Gładkie powierzchnie pokrywy i spodu (obie aluminiowe) są bardzo podatne na zbieranie odcisków palców, podczas gdy górna część jednostki bazowej (stop magnezu i aluminium) jest lekko gumowana i nie ma z tym tak dużego problemu. Ramki ekranu są nieco węższe niż w poprzednim modelu, dzięki czemu znalazło się miejsce dla większego 14,5-calowego panelu.
Stabilność jednostki zasadniczej jest znakomita i nic nie może być wciśnięte lub przekręcone - ale wywieranie nacisku na obszar po prawej stronie klawiatury powoduje lekkie skrzypienie w naszym urządzeniu testowym. Pokrywa ekranu jest również bardzo stabilna i nie udało nam się sprowokować żadnych błędów obrazu podczas naszego testu. Zawiasy są ogólnie dość ciasne, ale nadal można otworzyć urządzenie jedną ręką. Nie da się jednak całkowicie zapobiec kołysaniu podczas zmiany kąta otwarcia (maks. 180 stopni).
Mówiliśmy już o jego wysokości, ale nowy P14s G5 jest również jednym z największych modeli w naszej grupie porównawczej, jeśli chodzi o zajmowaną powierzchnię. Jego waga wynosi 1,72 kg, a 135-watowy zasilacz waży kolejne 527 gramów.
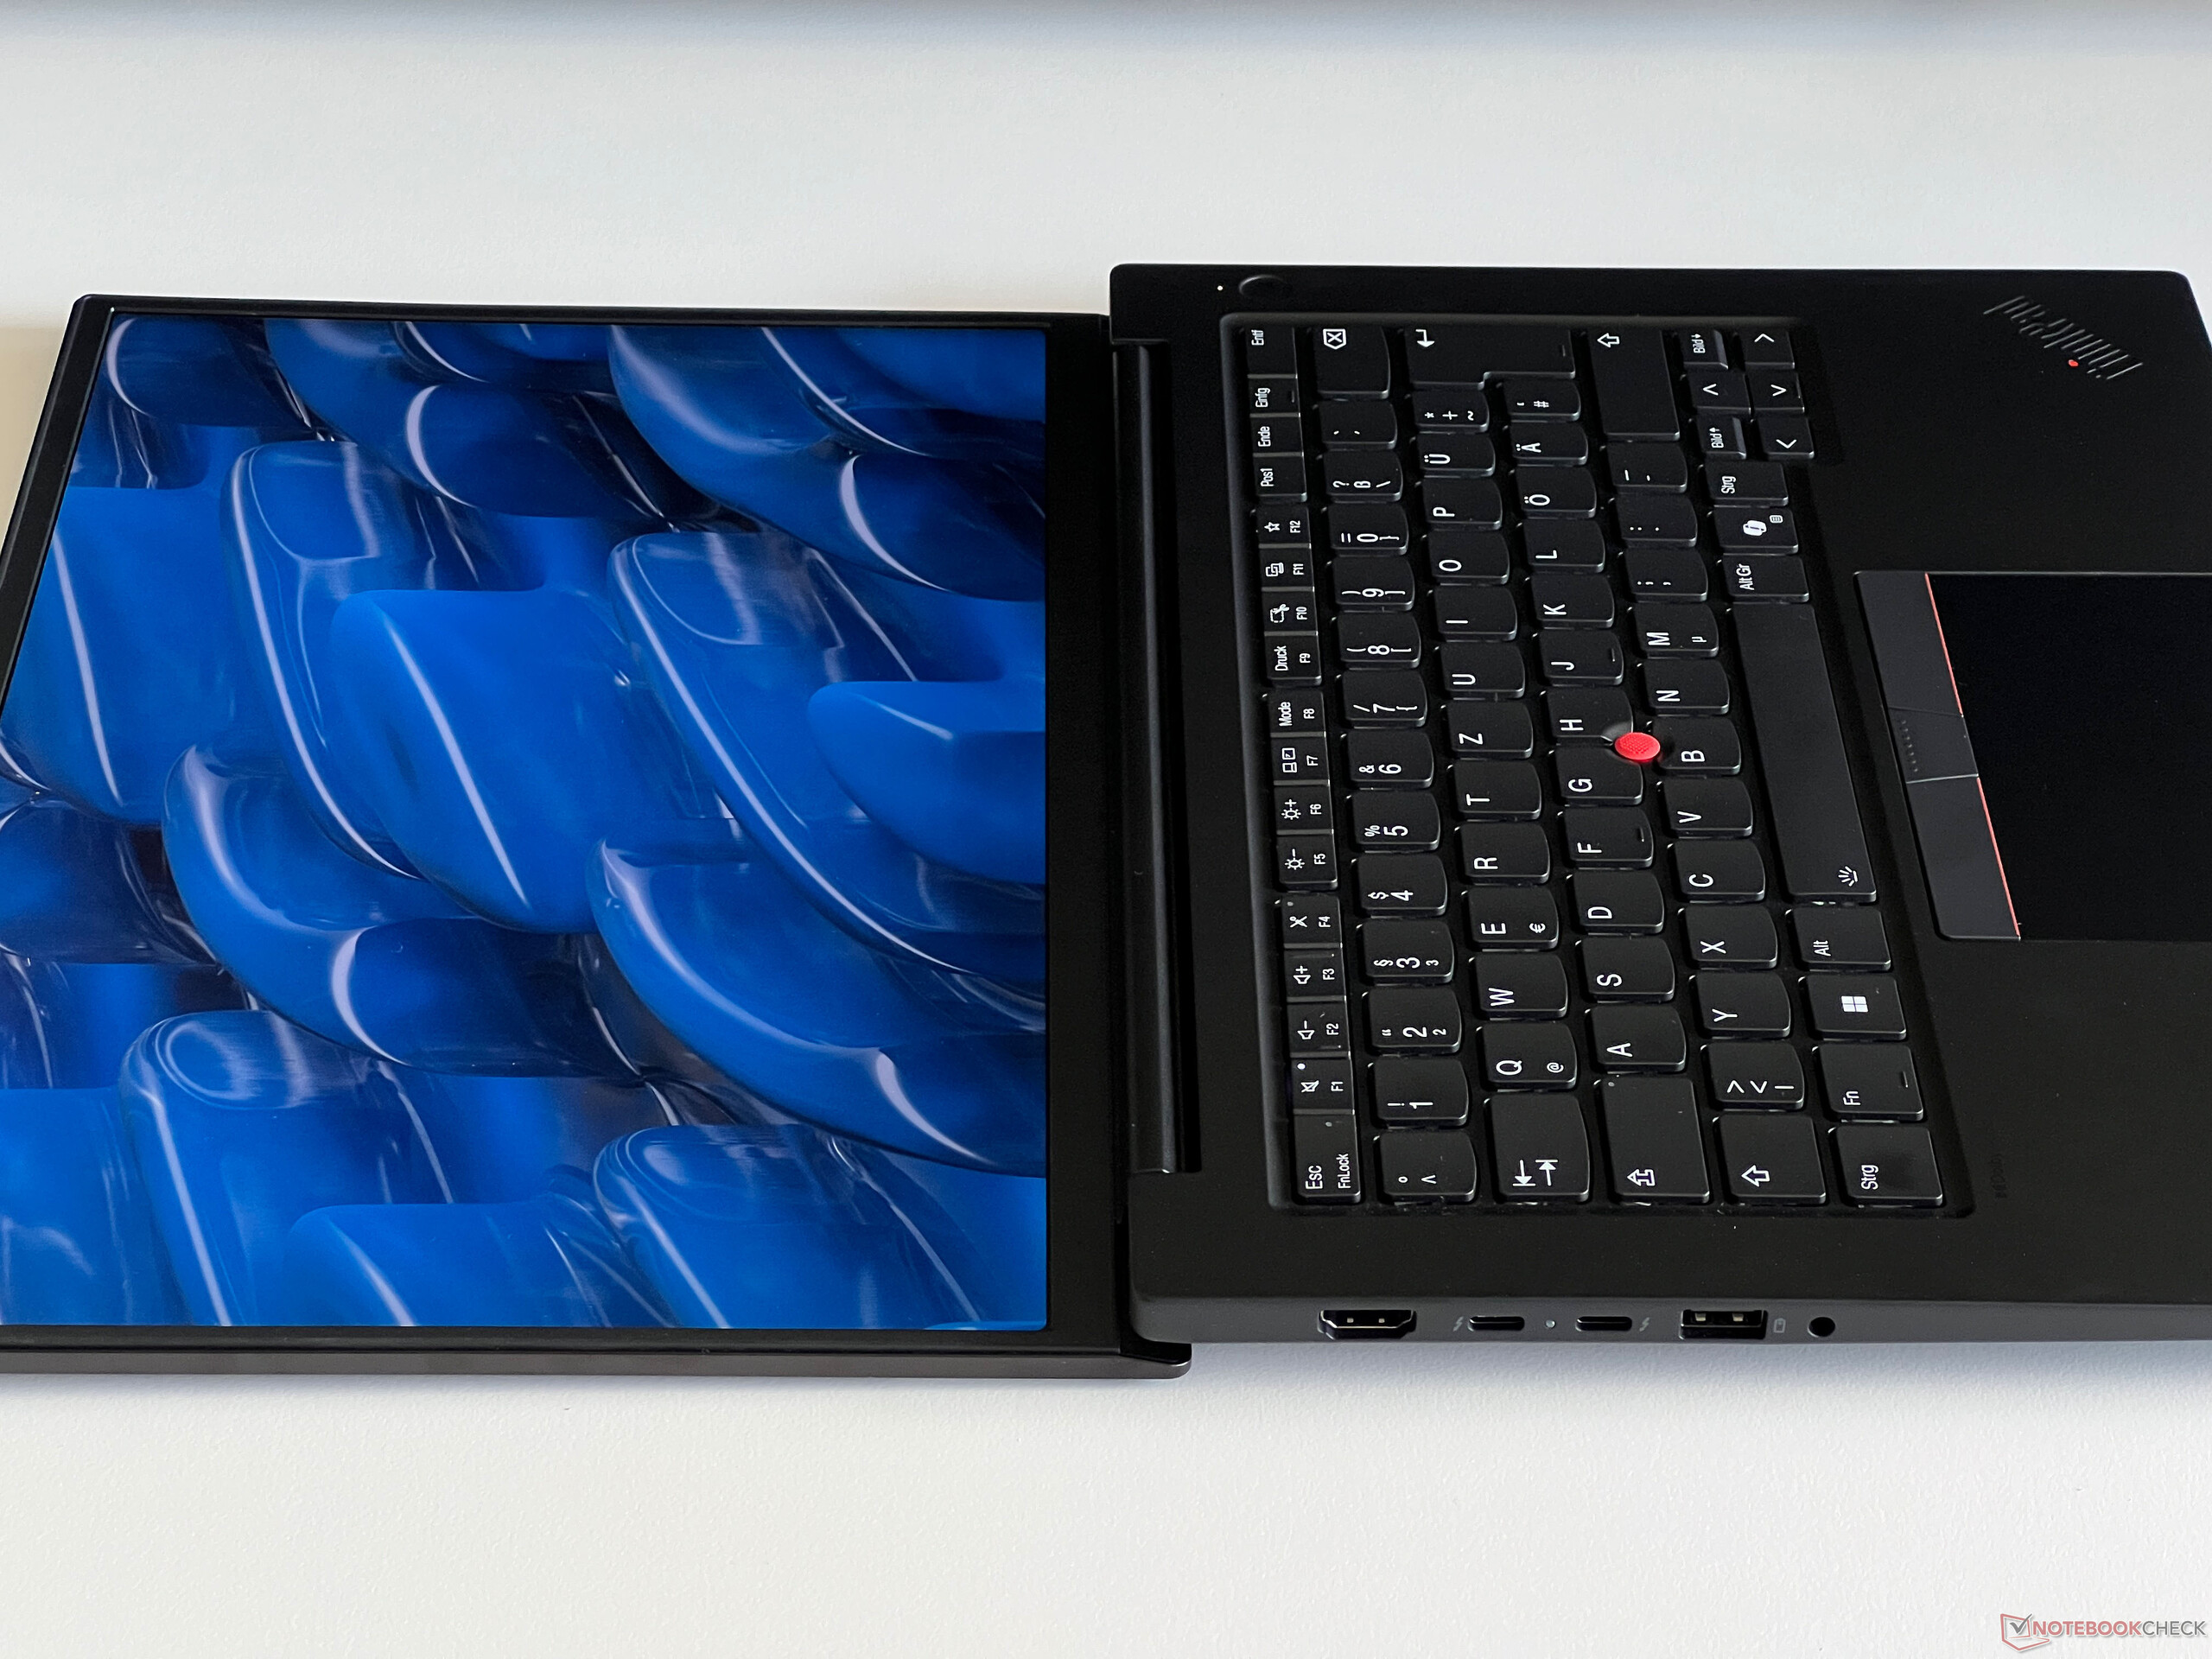
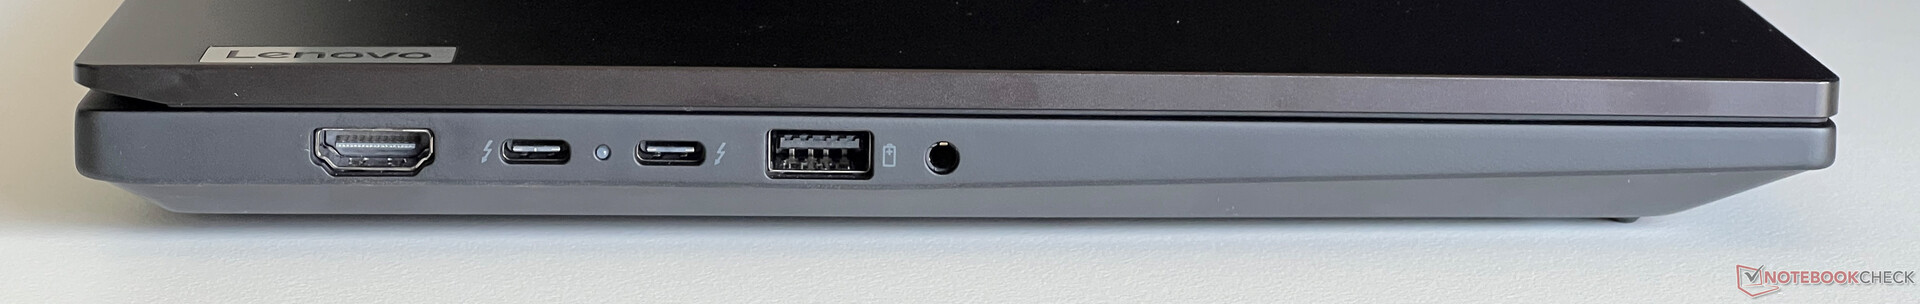
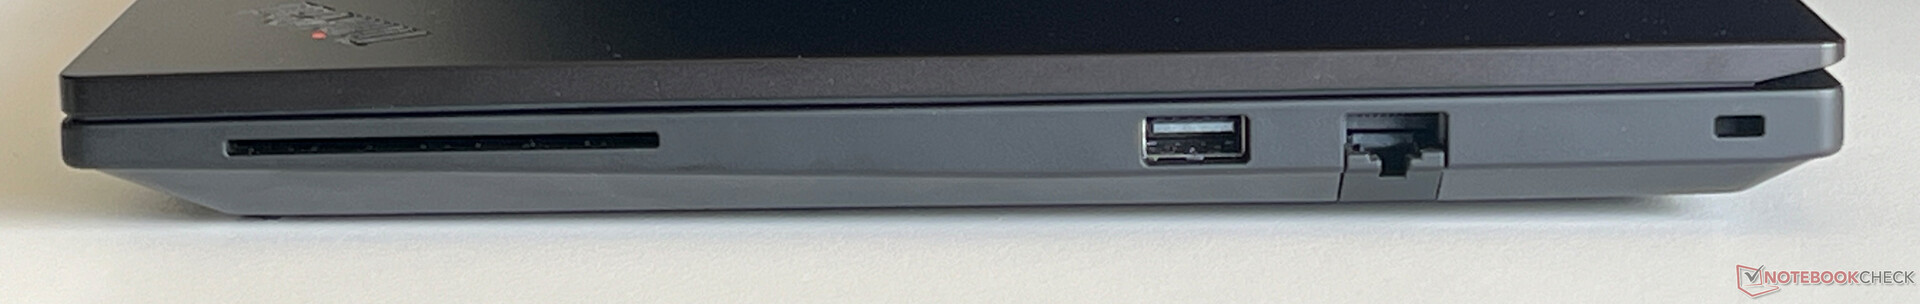
Łączność - Thunderbolt 4 i czytnik SmartCard
Jeśli chodzi o złącza, nie ma tu żadnych niespodzianek, a oprócz nowoczesnych portów Thunderbolt 4, zainstalowano także dwa zwykłe porty USB-A. Oznacza to, że nie będą Państwo musieli sięgać po przejściówki podczas codziennego użytkowania. Nasze urządzenie testowe jest również wyposażone w opcjonalny czytnik SmartCard, ale nie posiada czytnika kart SD.
Komunikacja
Lenovo zainstalowało moduł WLAN Intel AX211, który obsługuje również nowoczesne sieci 6 GHz i Bluetooth 5.3. Na pokładzie nie ma jednak modułu Wi-Fi 7. W naszym teście z wykorzystaniem naszego referencyjnego routera od Asusa, jego prędkości transferu były doskonałe, a także bardzo stabilne, więc nie powinno być żadnych problemów podczas użytkowania w tym zakresie. Dla sieci przewodowych dostępny jest również port Gigabit Ethernet (Intel i219-V).
P14s G5 posiada dodatkowo gniazdo M.2-2242 dla modułu WWAN, ale w Niemczech (gdzie przeprowadzono ten test) nie są obecnie dostępne odpowiednie konfiguracje ze względu na spór prawny. Brakuje również niezbędnych anten (nie są przystosowane do WWAN), więc moduł nie może być doposażony przez użytkowników bez podejmowania dodatkowych kroków.
| Networking | |
| Lenovo ThinkPad P14s G5 21G3S00A00 | |
| iperf3 transmit AXE11000 | |
| iperf3 receive AXE11000 | |
| HP ZBook Firefly 14 G11 | |
| iperf3 transmit AXE11000 | |
| iperf3 receive AXE11000 | |
| iperf3 transmit AXE11000 6GHz | |
| iperf3 receive AXE11000 6GHz | |
| Dell Precision 5000 5490 | |
| iperf3 transmit AXE11000 | |
| iperf3 receive AXE11000 | |
| iperf3 transmit AXE11000 6GHz | |
| iperf3 receive AXE11000 6GHz | |
| Lenovo ThinkPad P14s G4 21HF0017GE | |
| iperf3 transmit AXE11000 | |
| iperf3 receive AXE11000 | |
| iperf3 transmit AXE11000 6GHz | |
| iperf3 receive AXE11000 6GHz | |
| Microsoft Surface Laptop Studio 2 RTX 4060 | |
| iperf3 transmit AXE11000 | |
| iperf3 receive AXE11000 | |
| Lenovo Yoga Pro 9-14IRP G8 | |
| iperf3 transmit AXE11000 | |
| iperf3 receive AXE11000 | |
Kamera internetowa
Kamera internetowa może przechwytywać obrazy w rozdzielczości do 5 MP w formacie 4:3 (2592 x 1944 pikseli) lub 3,7 MP w formacie 16:9 (2560 x 1440 pikseli). Ostrość obrazu jest lepsza niż w przypadku zwykłych czujników 2 MP, a dodatkowe efekty Windows Studio są również obsługiwane.


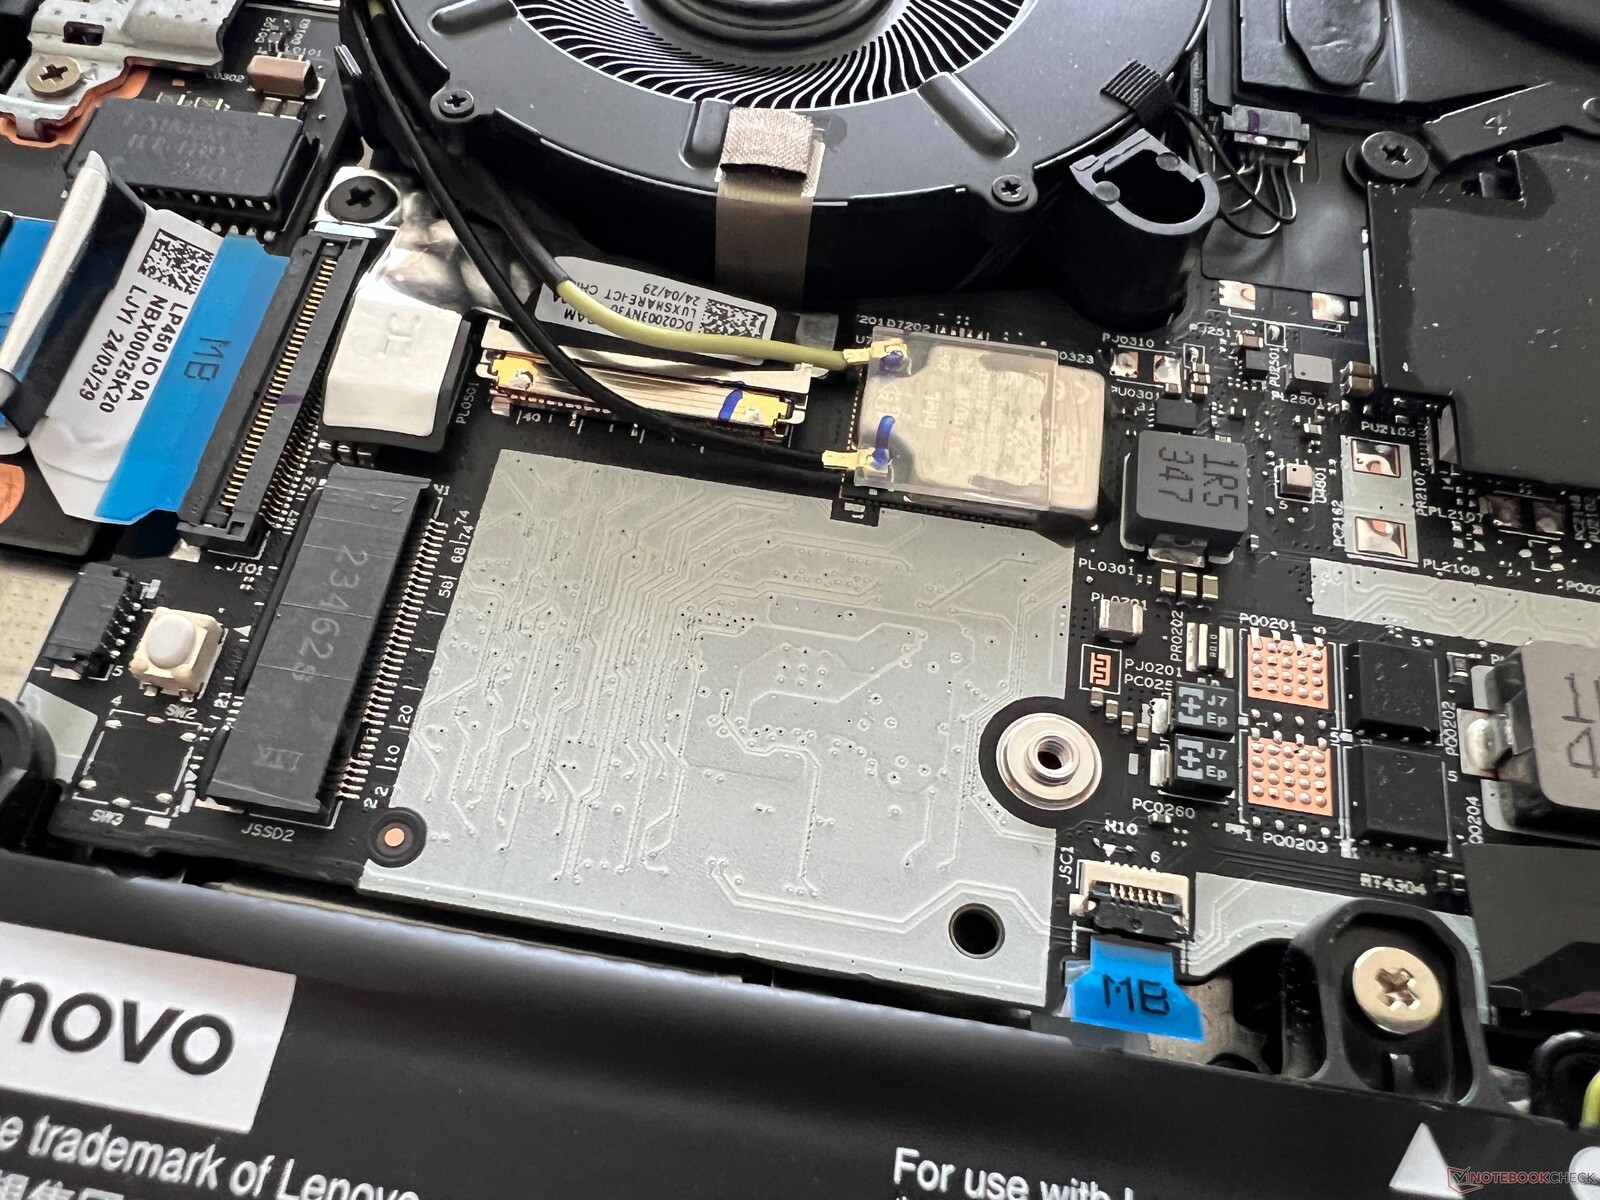
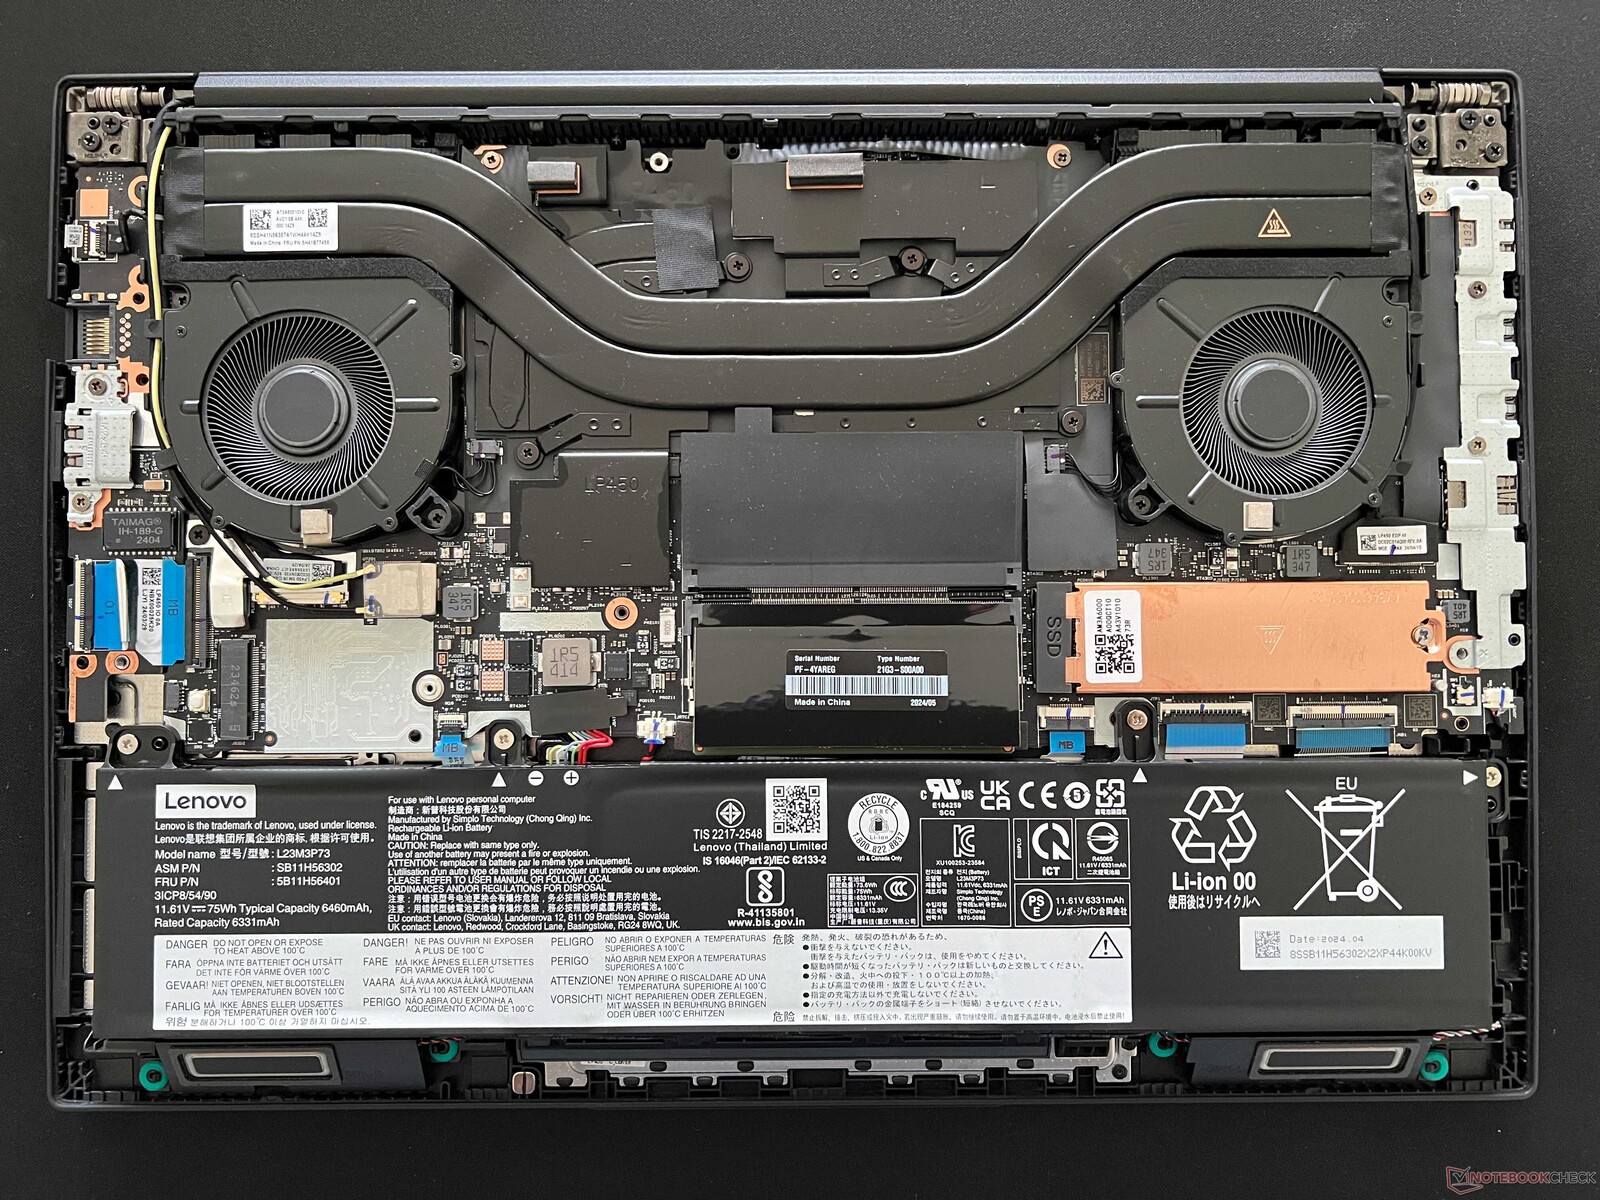
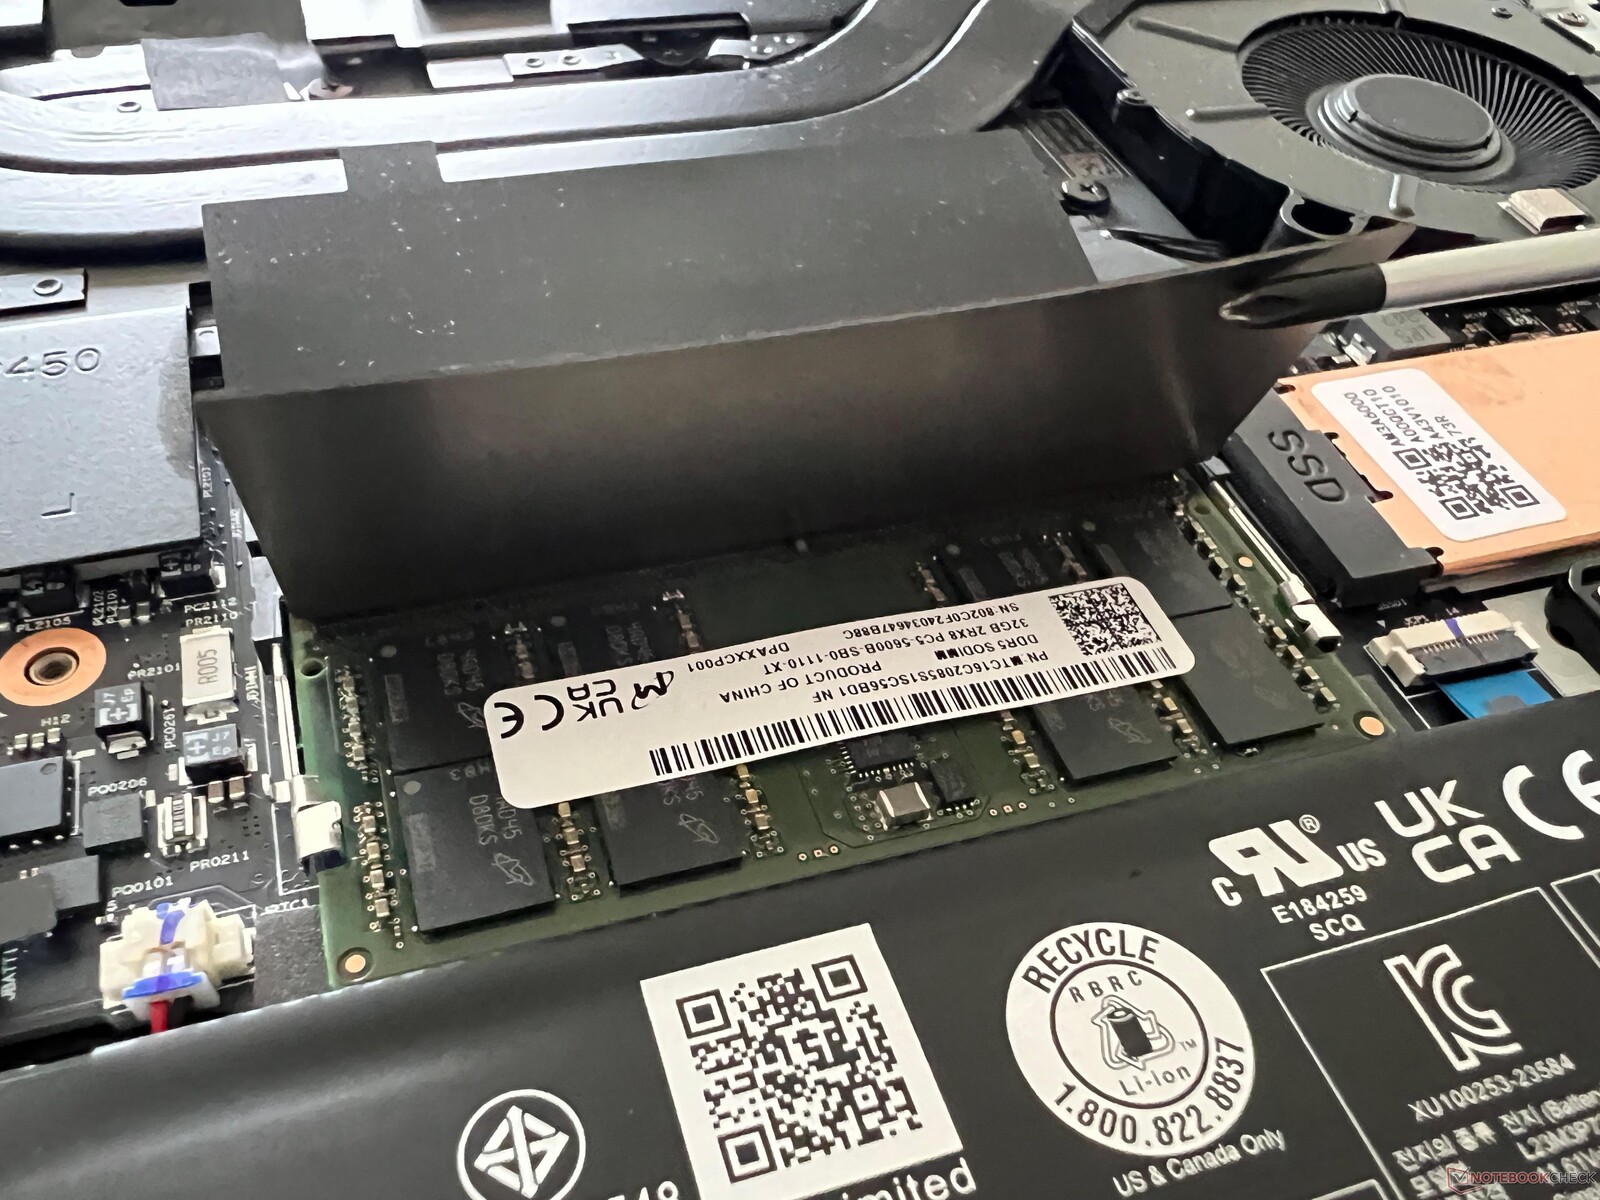
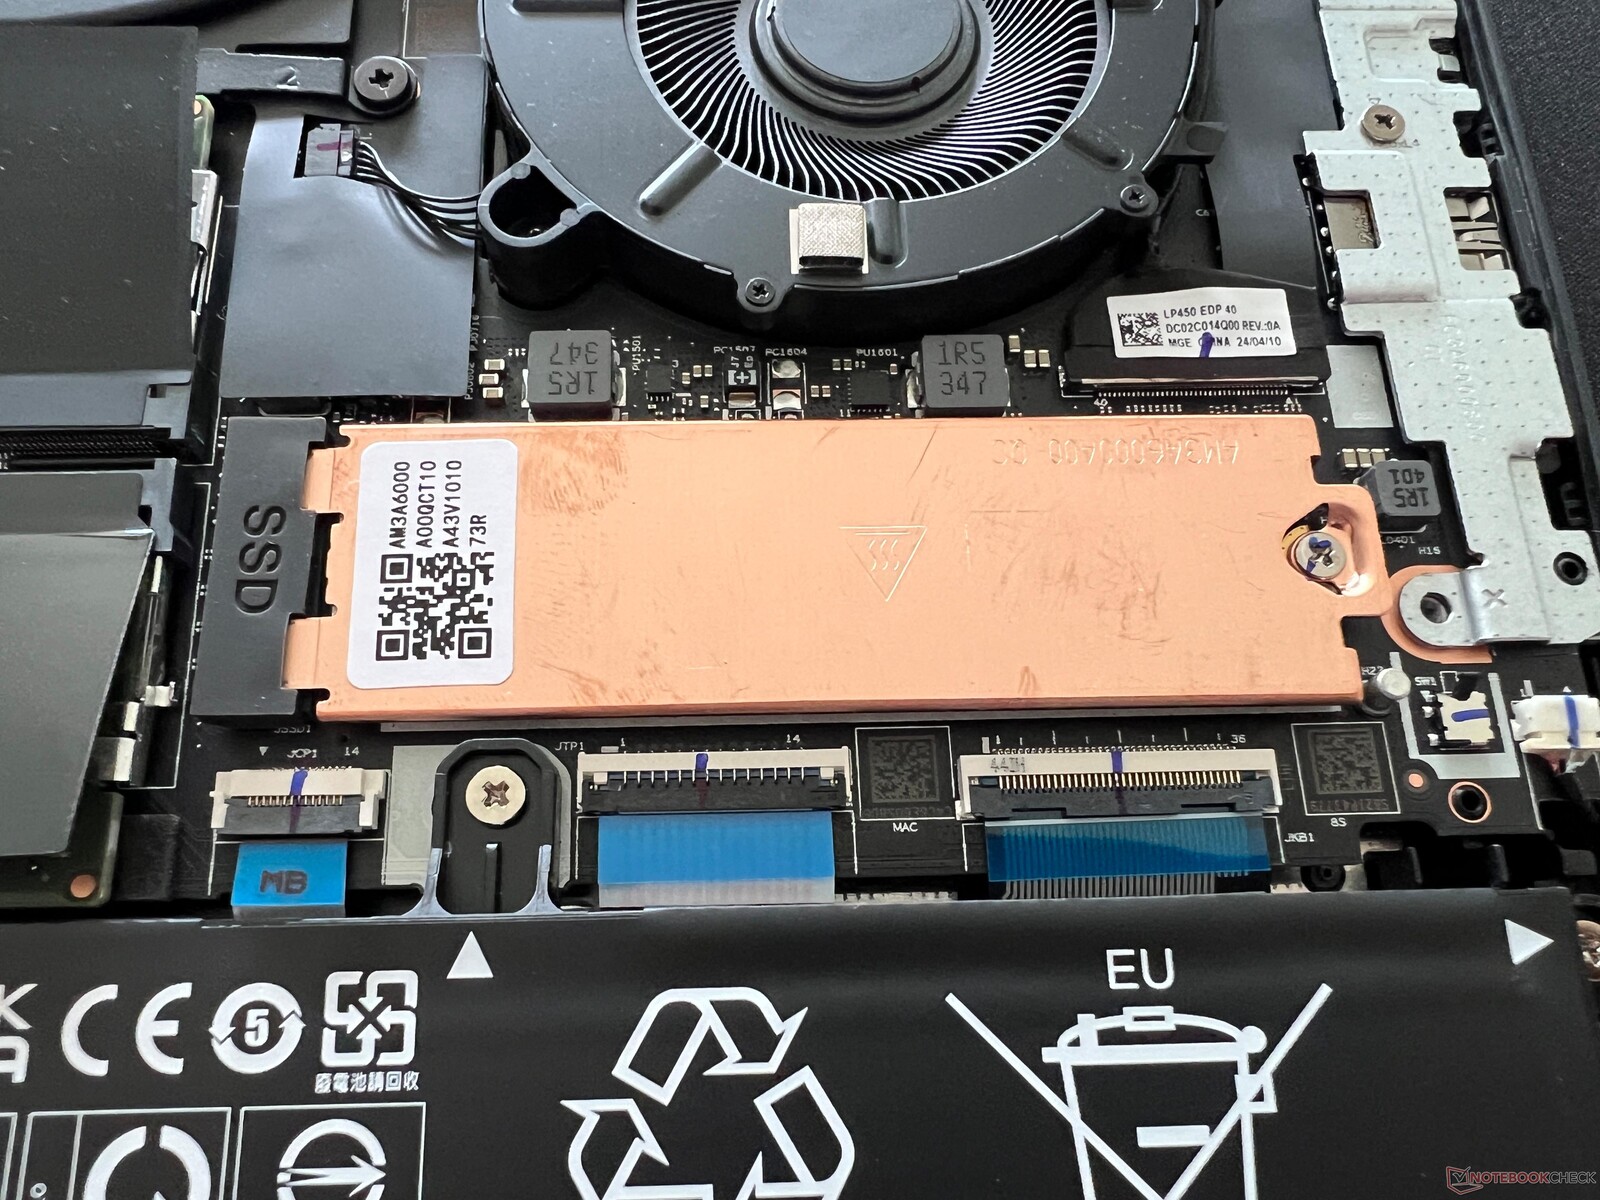
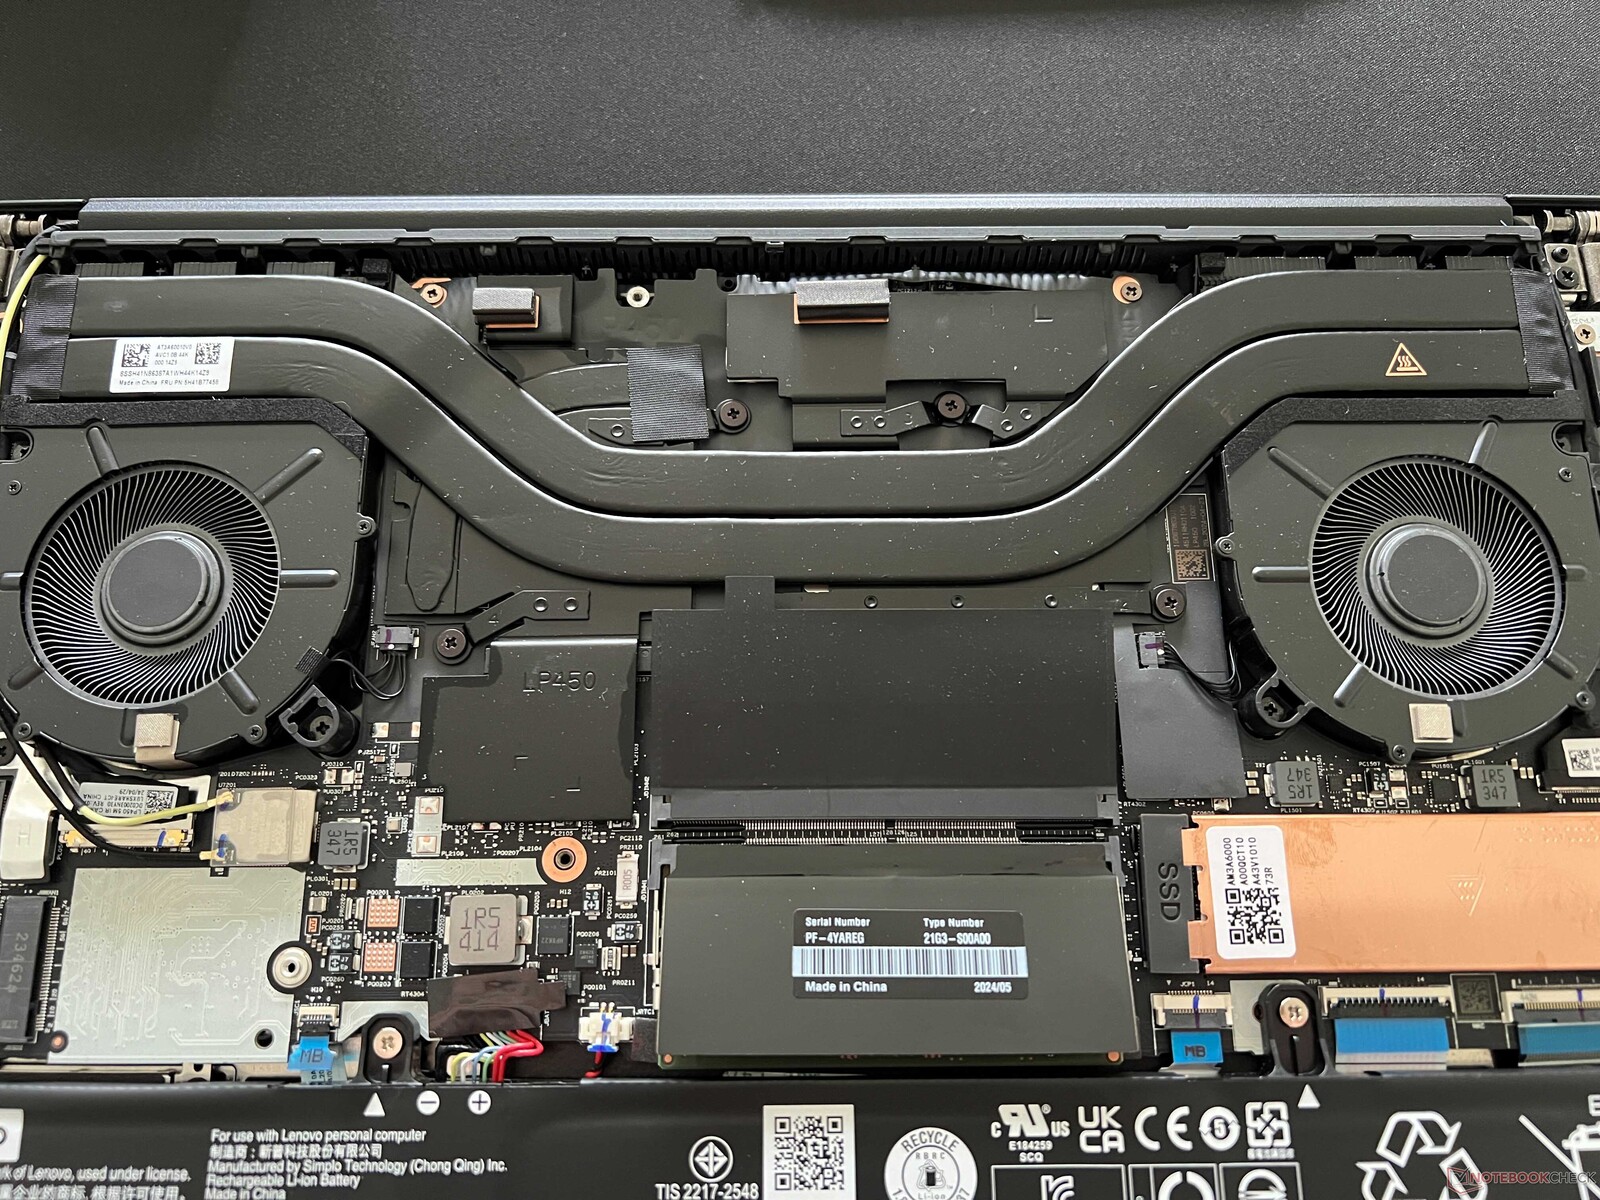
Konserwacja
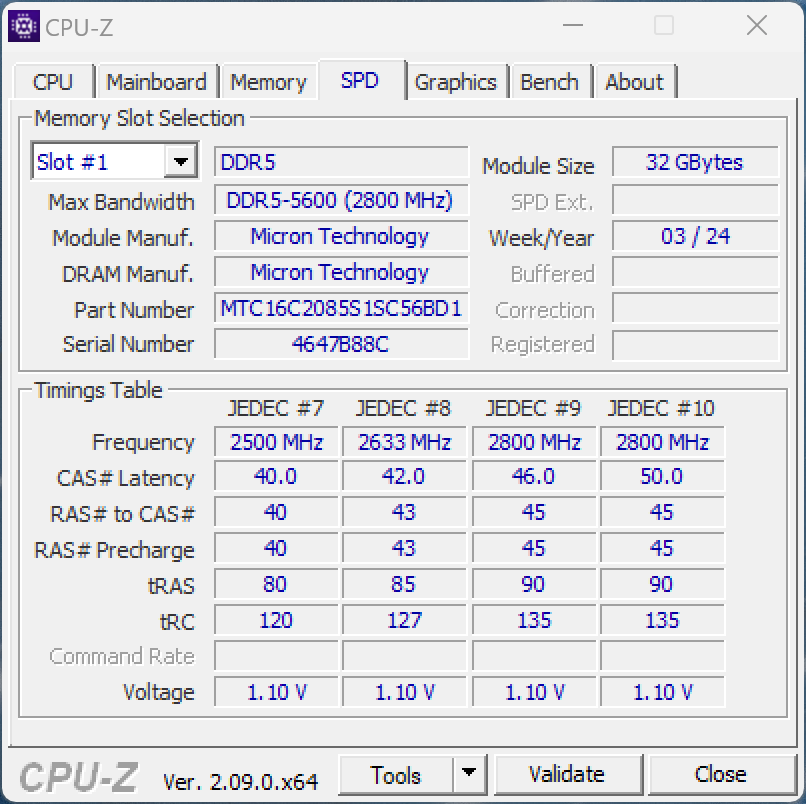
Dolna pokrywa obudowy jest zabezpieczona sześcioma śrubami krzyżakowymi i można ją łatwo zdjąć. Procesor, karta graficzna i moduł WLAN są wlutowane, ale zarówno dysk SSD M.2 2280, jak i pamięć RAM można rozbudować. Dwa gniazda DIMM mogą pomieścić moduły o maksymalnej pojemności 48 GB, co oznacza, że w laptopie można zainstalować łącznie 96 GB pamięci RAM.
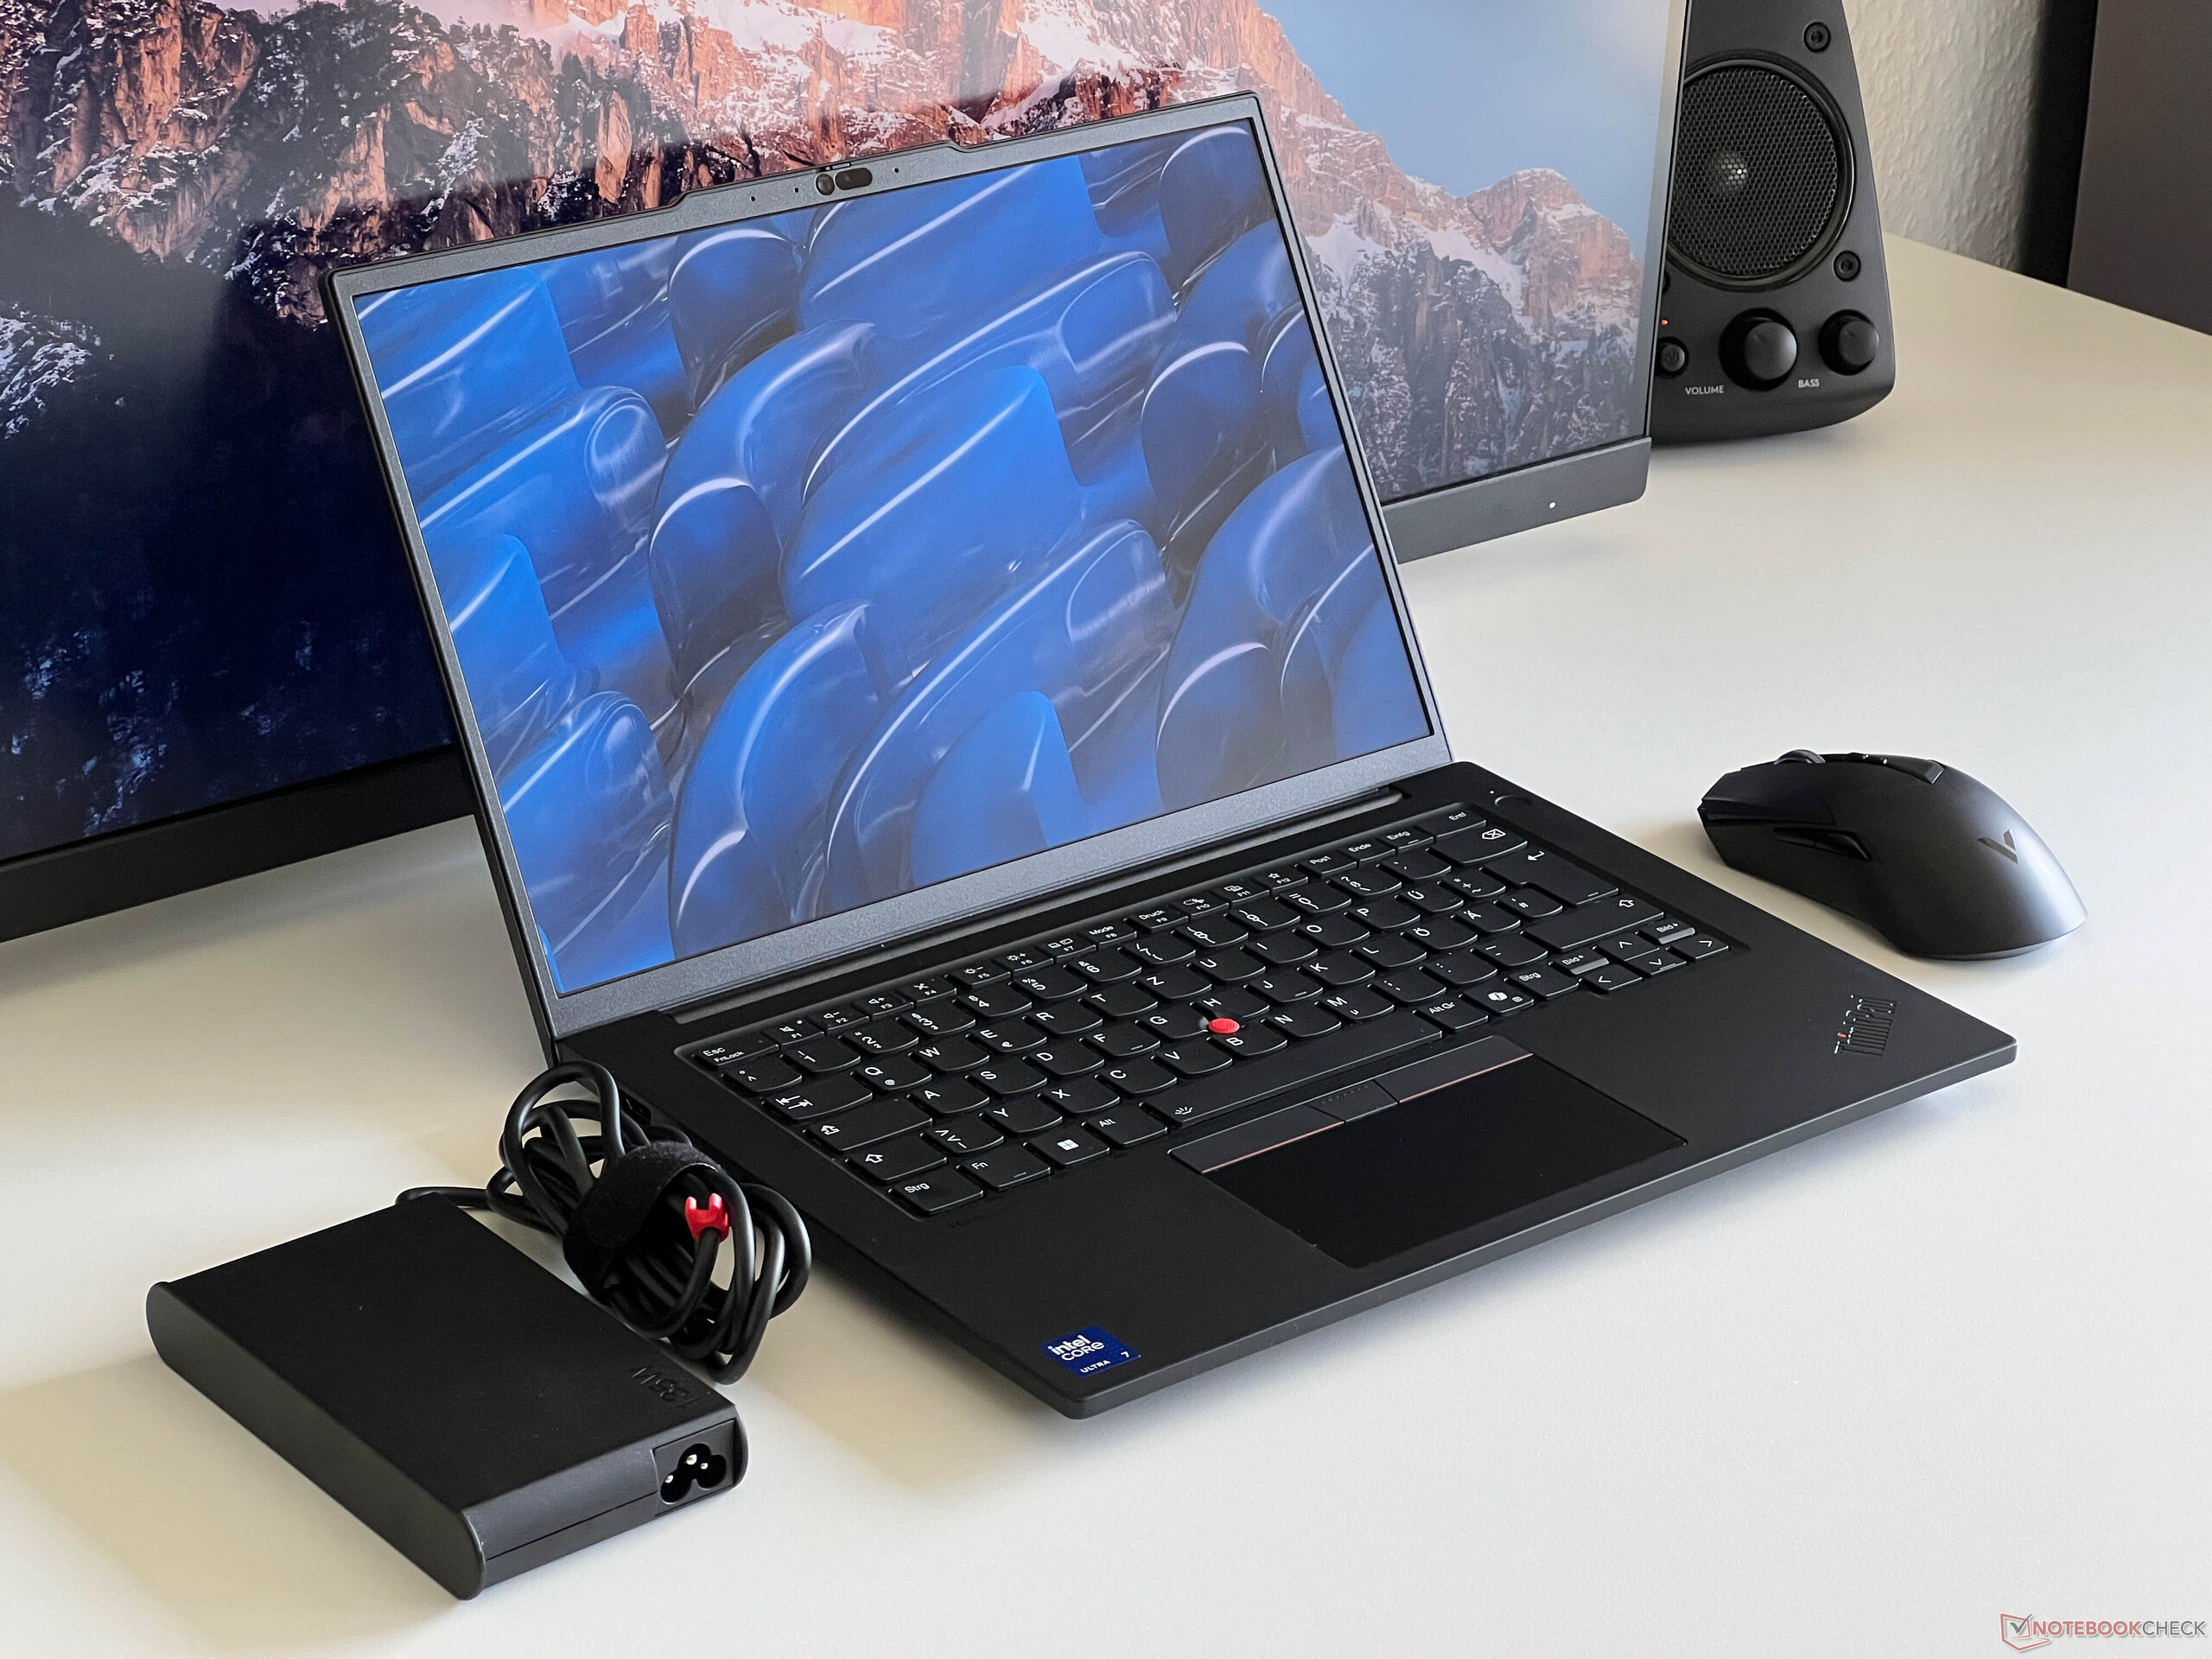
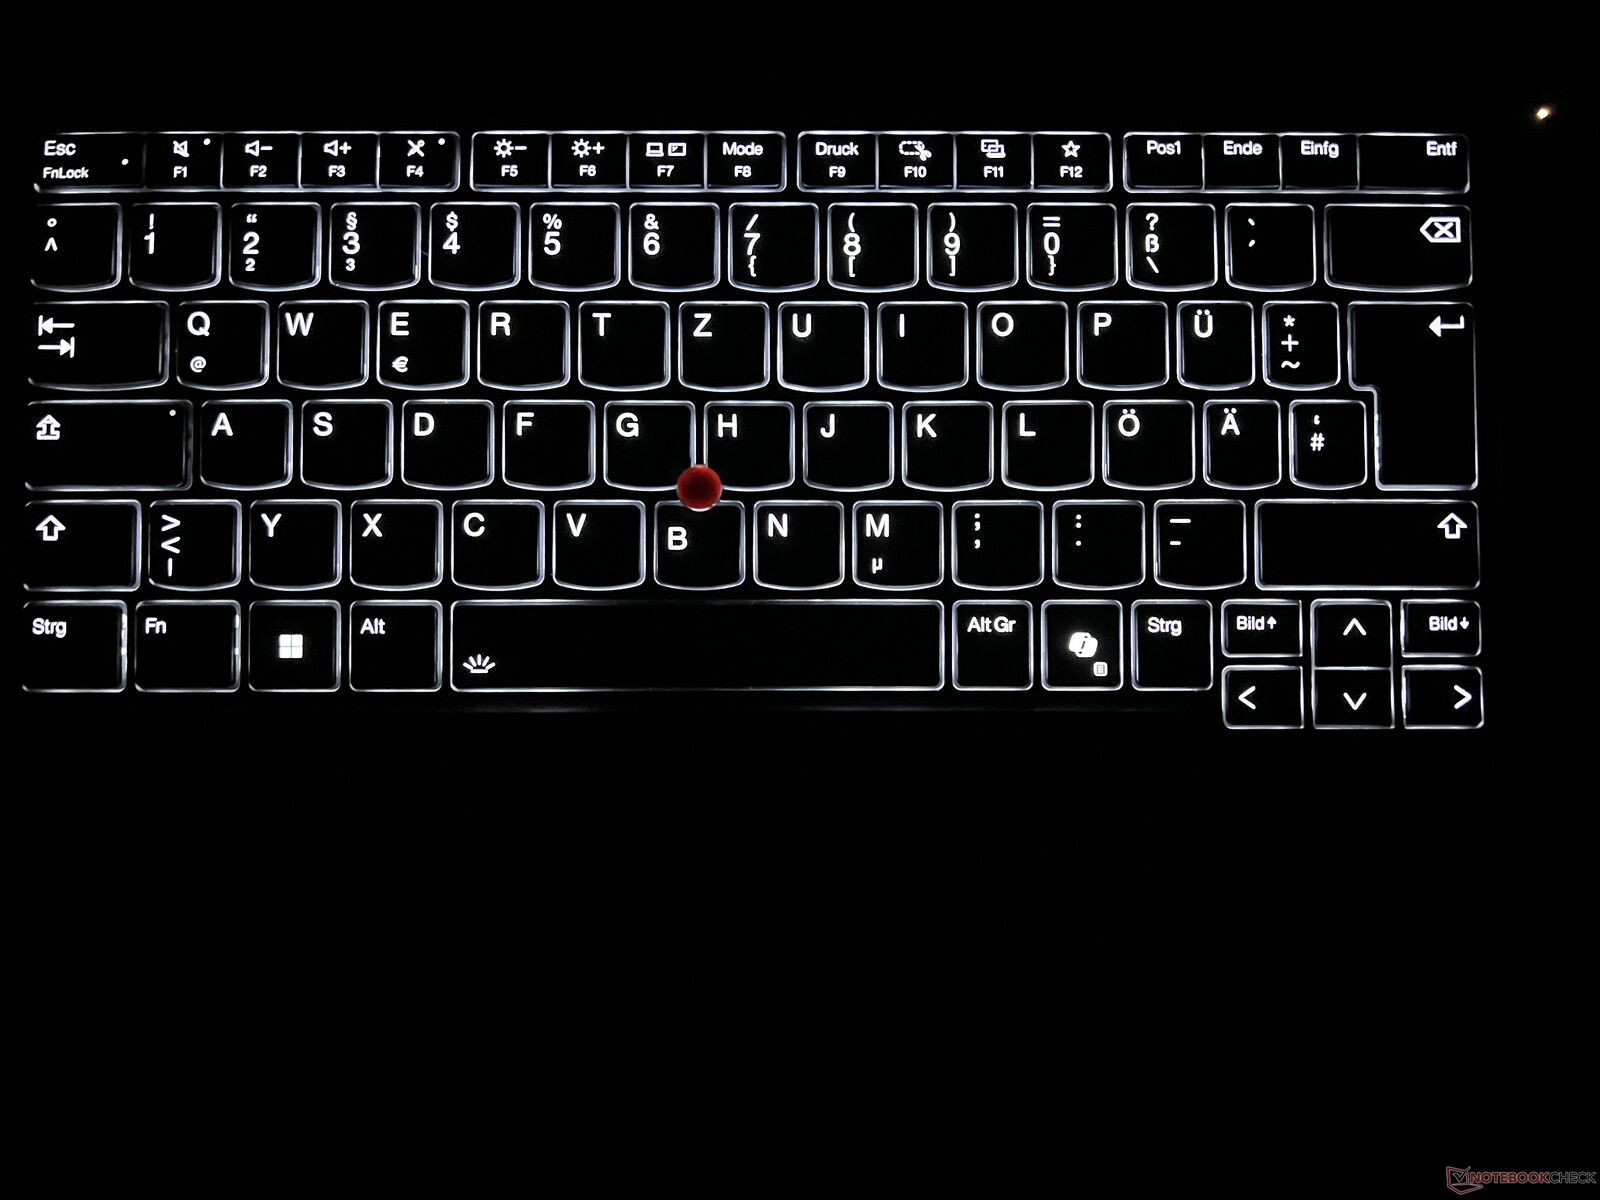
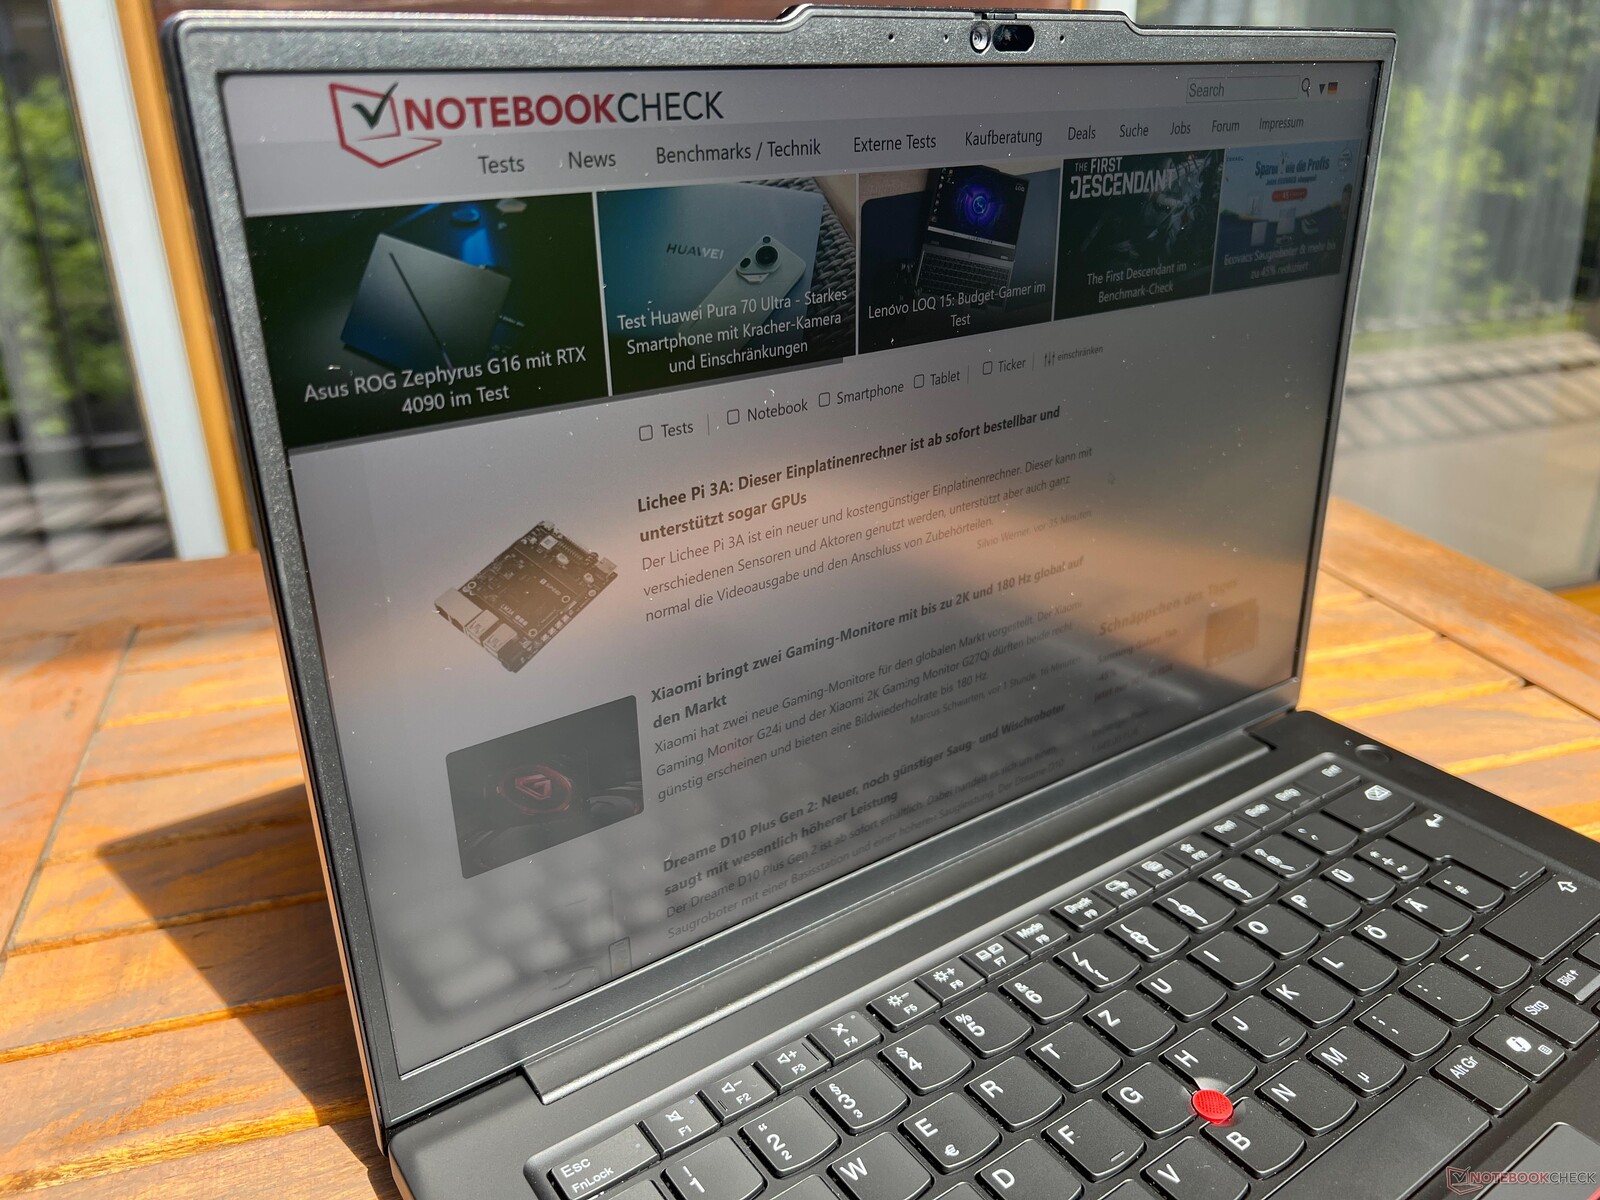
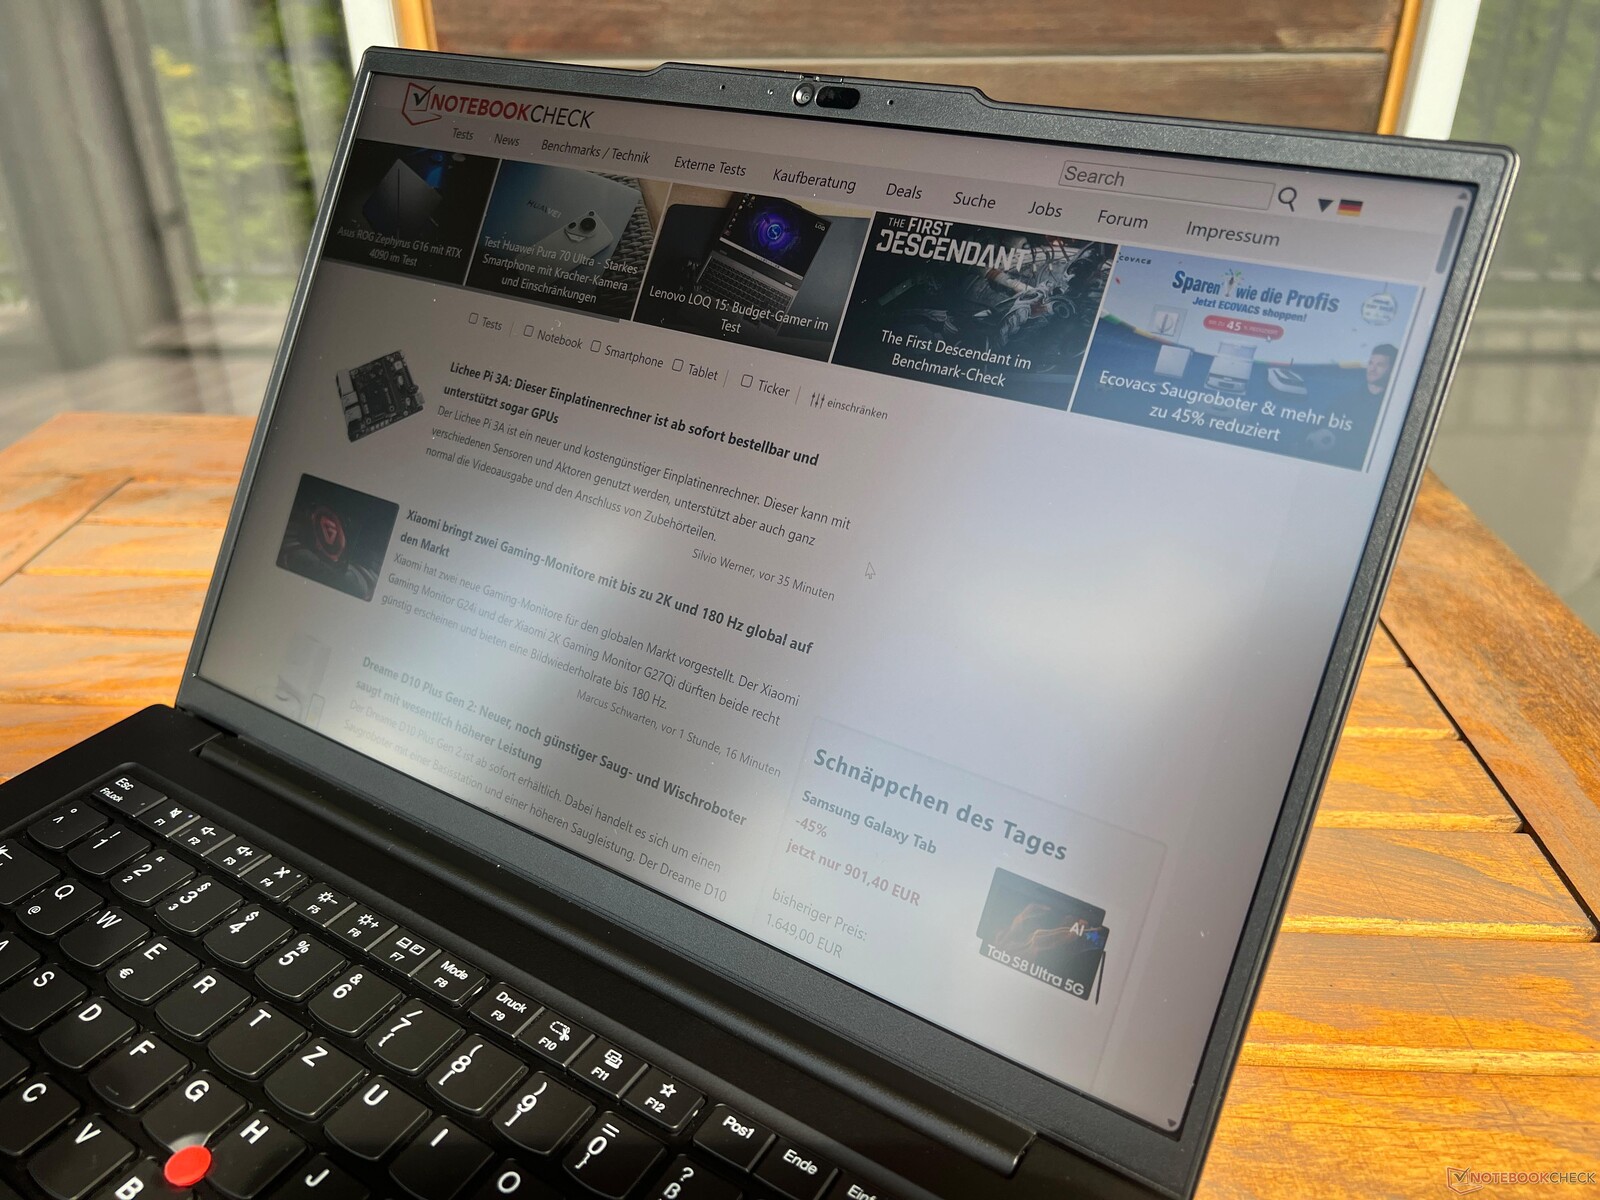
Urządzenia wejściowe - podniesienie o 1,5 mm i nowe umiejscowienie klawisza Fn
Klawiatura to dobrze znany model o skoku 1,5 mm. Pisze się na niej przyjemnie, ale ten ThinkPad nie wyróżnia się już pod tym względem na tle innych konkurentów. Wciąż mamy też w użyciu ThinkPada X1 Carbon z klawiszami o skoku 1,8 mm i zdecydowanie czuć różnicę. Nowością od 2024 roku jest zastąpienie klawiszy Fn i Ctrl, co z pewnością na początku sprawi pewne problemy weteranom ThinkPadów. Zainstalowano również klawisz Co-Pilot. Dwupoziomowe białe podświetlenie klawiatury nie może być aktywowane za pomocą czujnika. Przycisk zasilania znajduje się w prawym górnym rogu obok klawiatury i służy również jako skaner linii papilarnych.
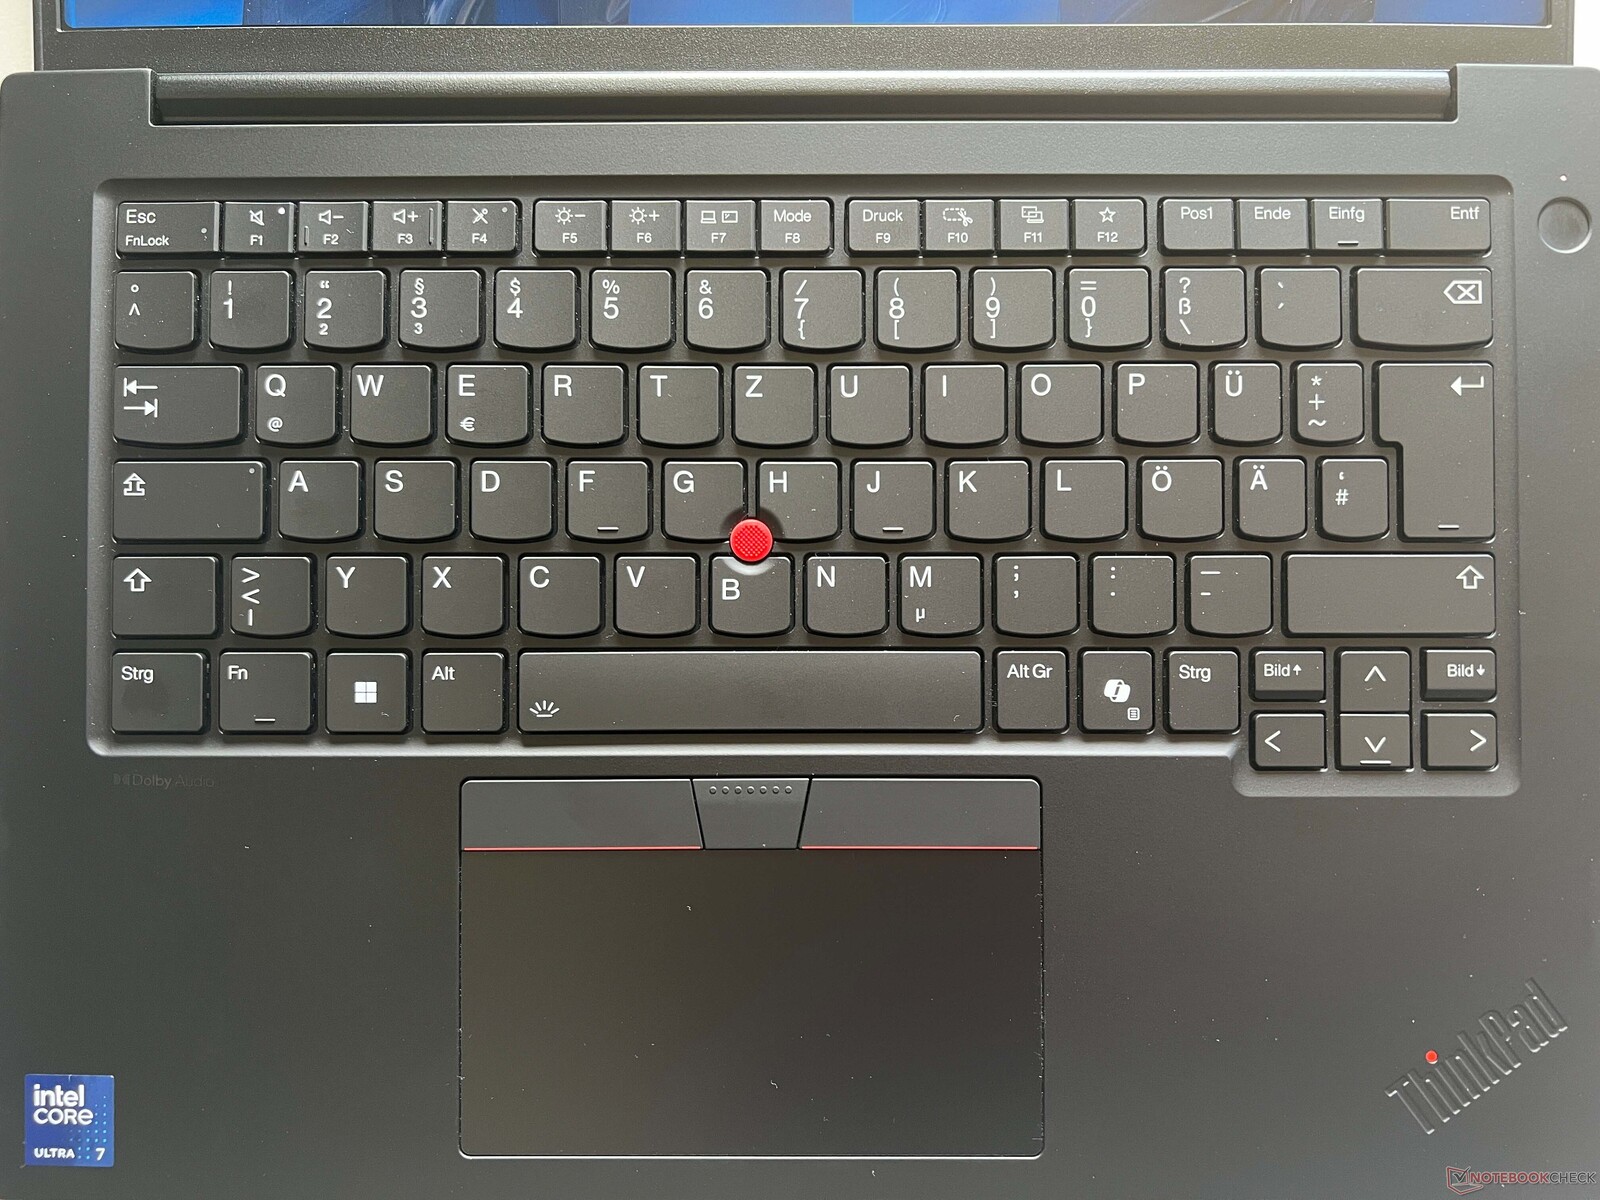
Jak na dzisiejsze standardy, panel dotykowy laptopa o wymiarach 11,5 x 6 cm nie jest szczególnie duży, ponieważ musi również zrobić miejsce na dodatkowe przyciski TrackPoint. Jest jednak przyjemny i gładki - tylko sam odgłos kliknięcia jest nieco zbyt głośny. Oczywiście TrackPoint jest również dostępny jako alternatywa, która działa bardzo dobrze (gdy się do niej przyzwyczaisz). Dedykowane klawisze zrobiły bardzo dobre wrażenie na naszym urządzeniu testowym dzięki wysokiej jakości, stłumionym kliknięciom i nie zauważyliśmy żadnych luzów.
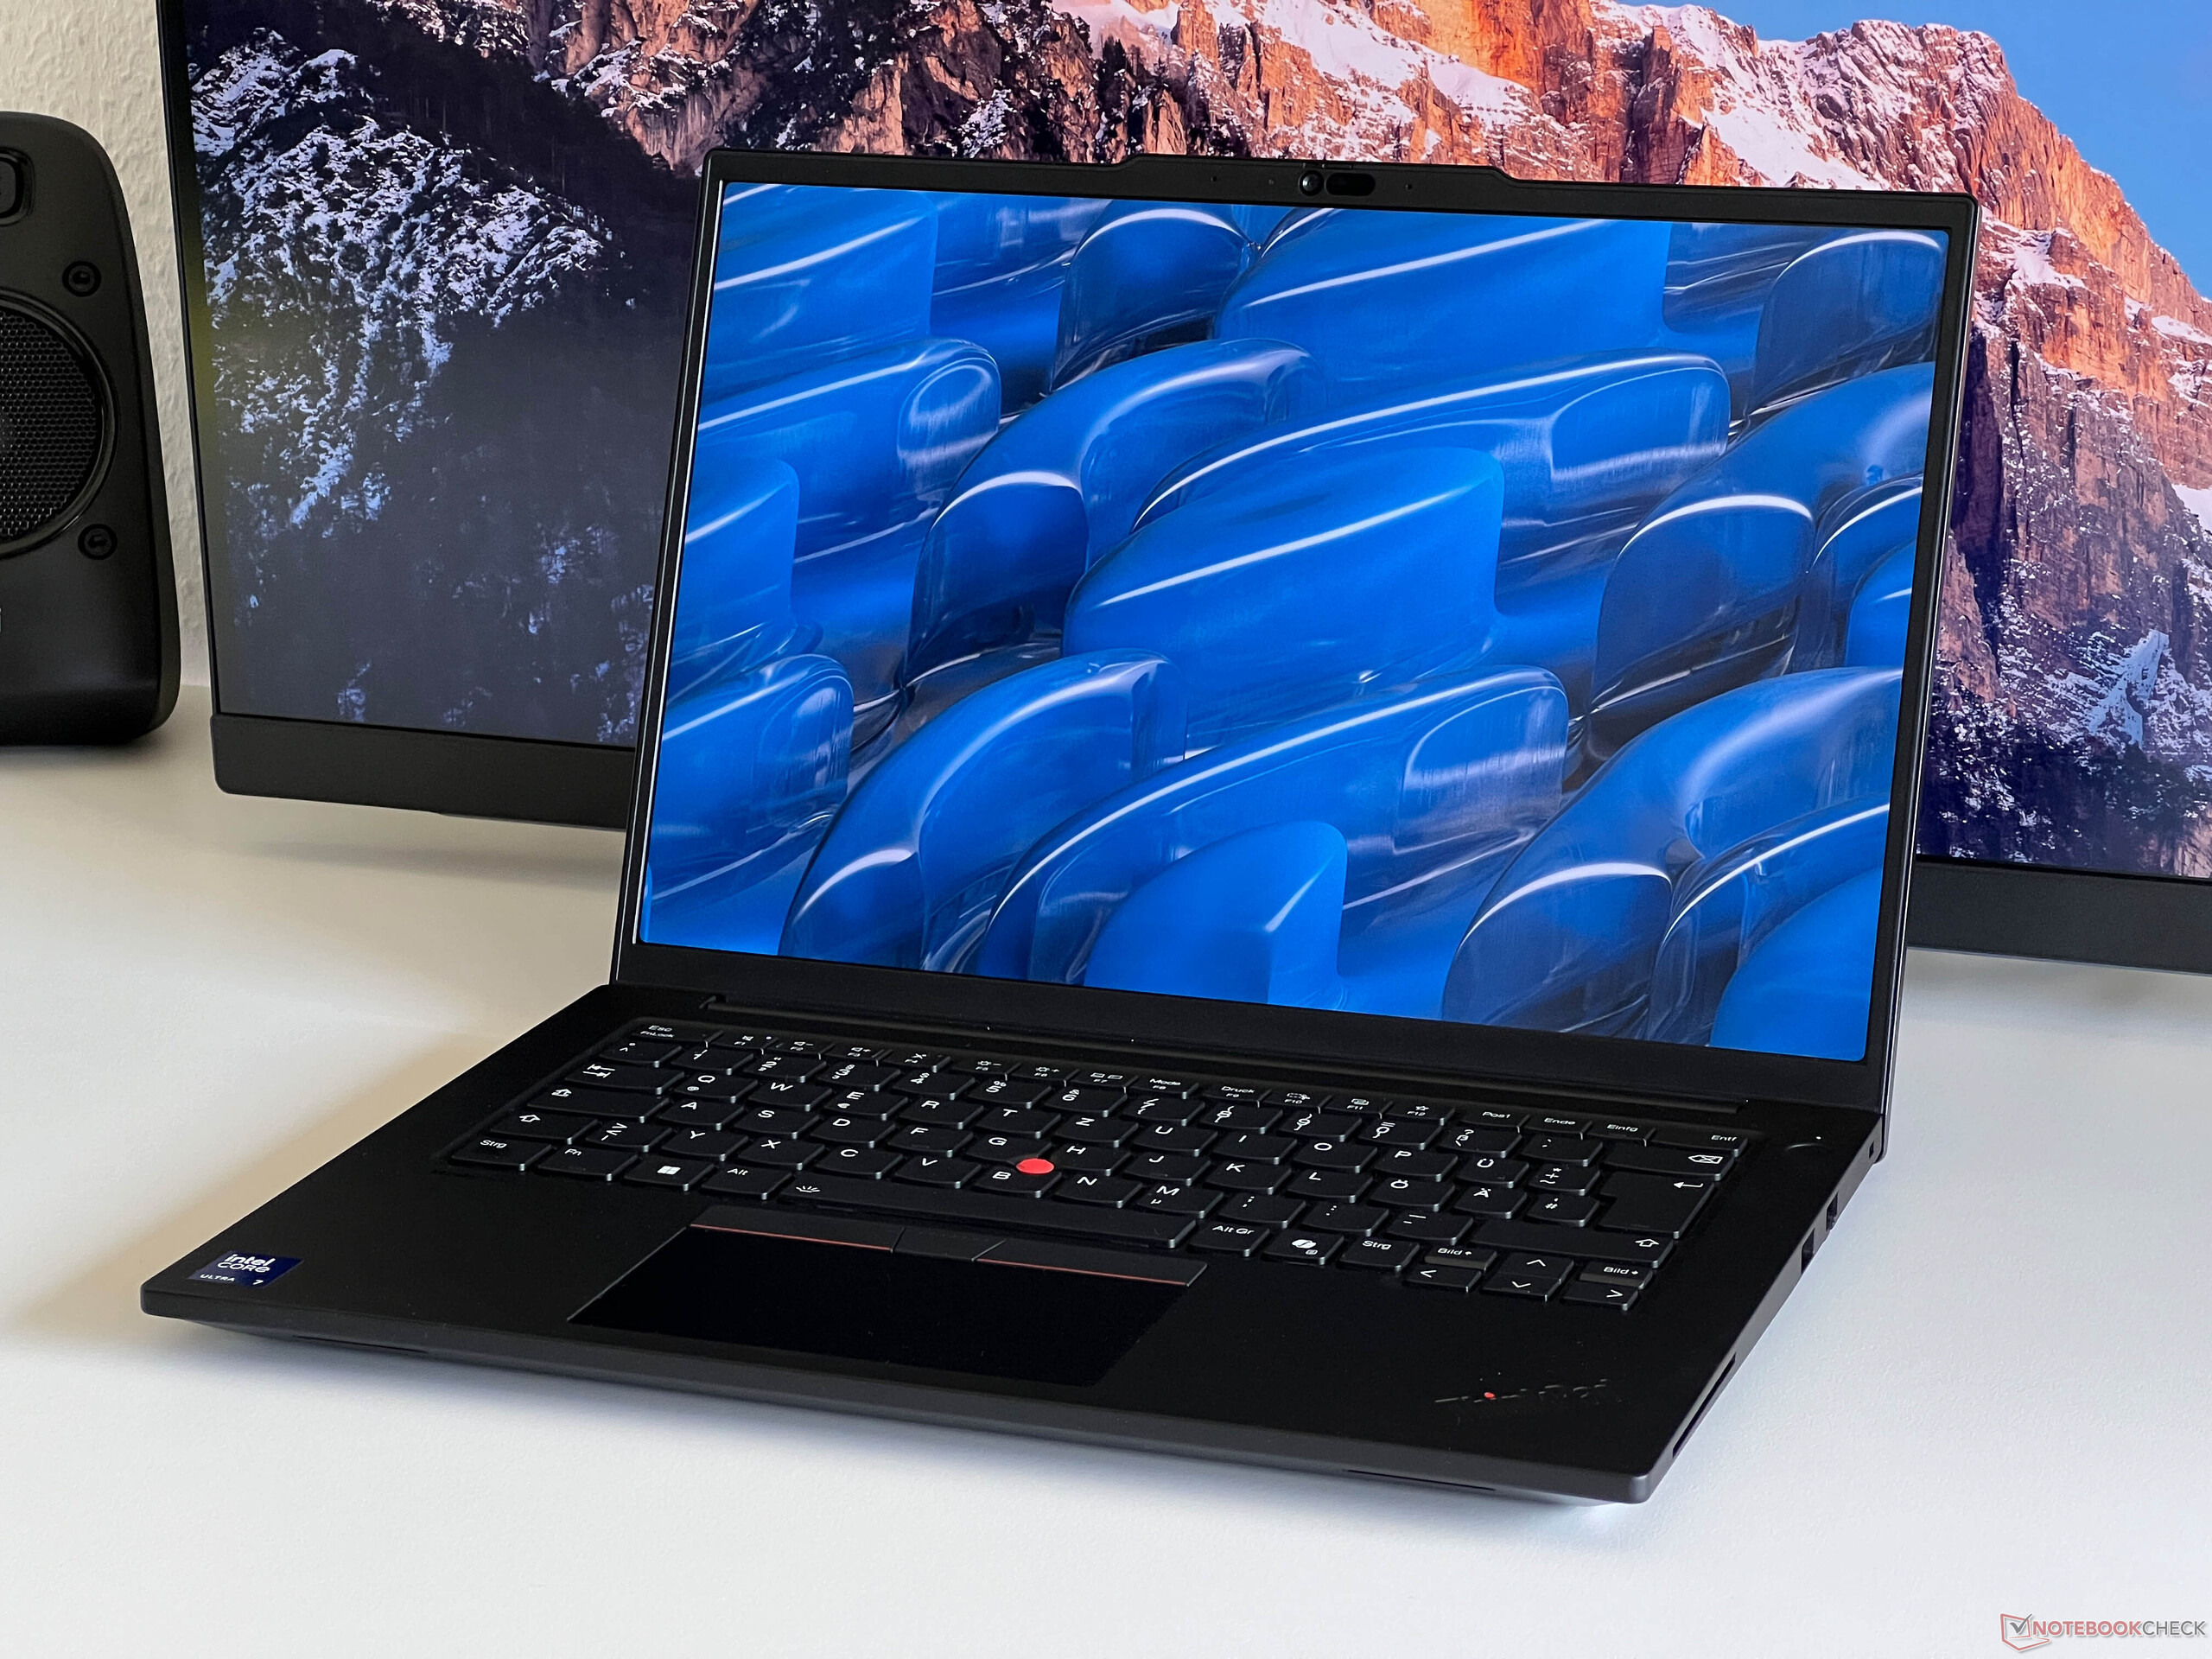
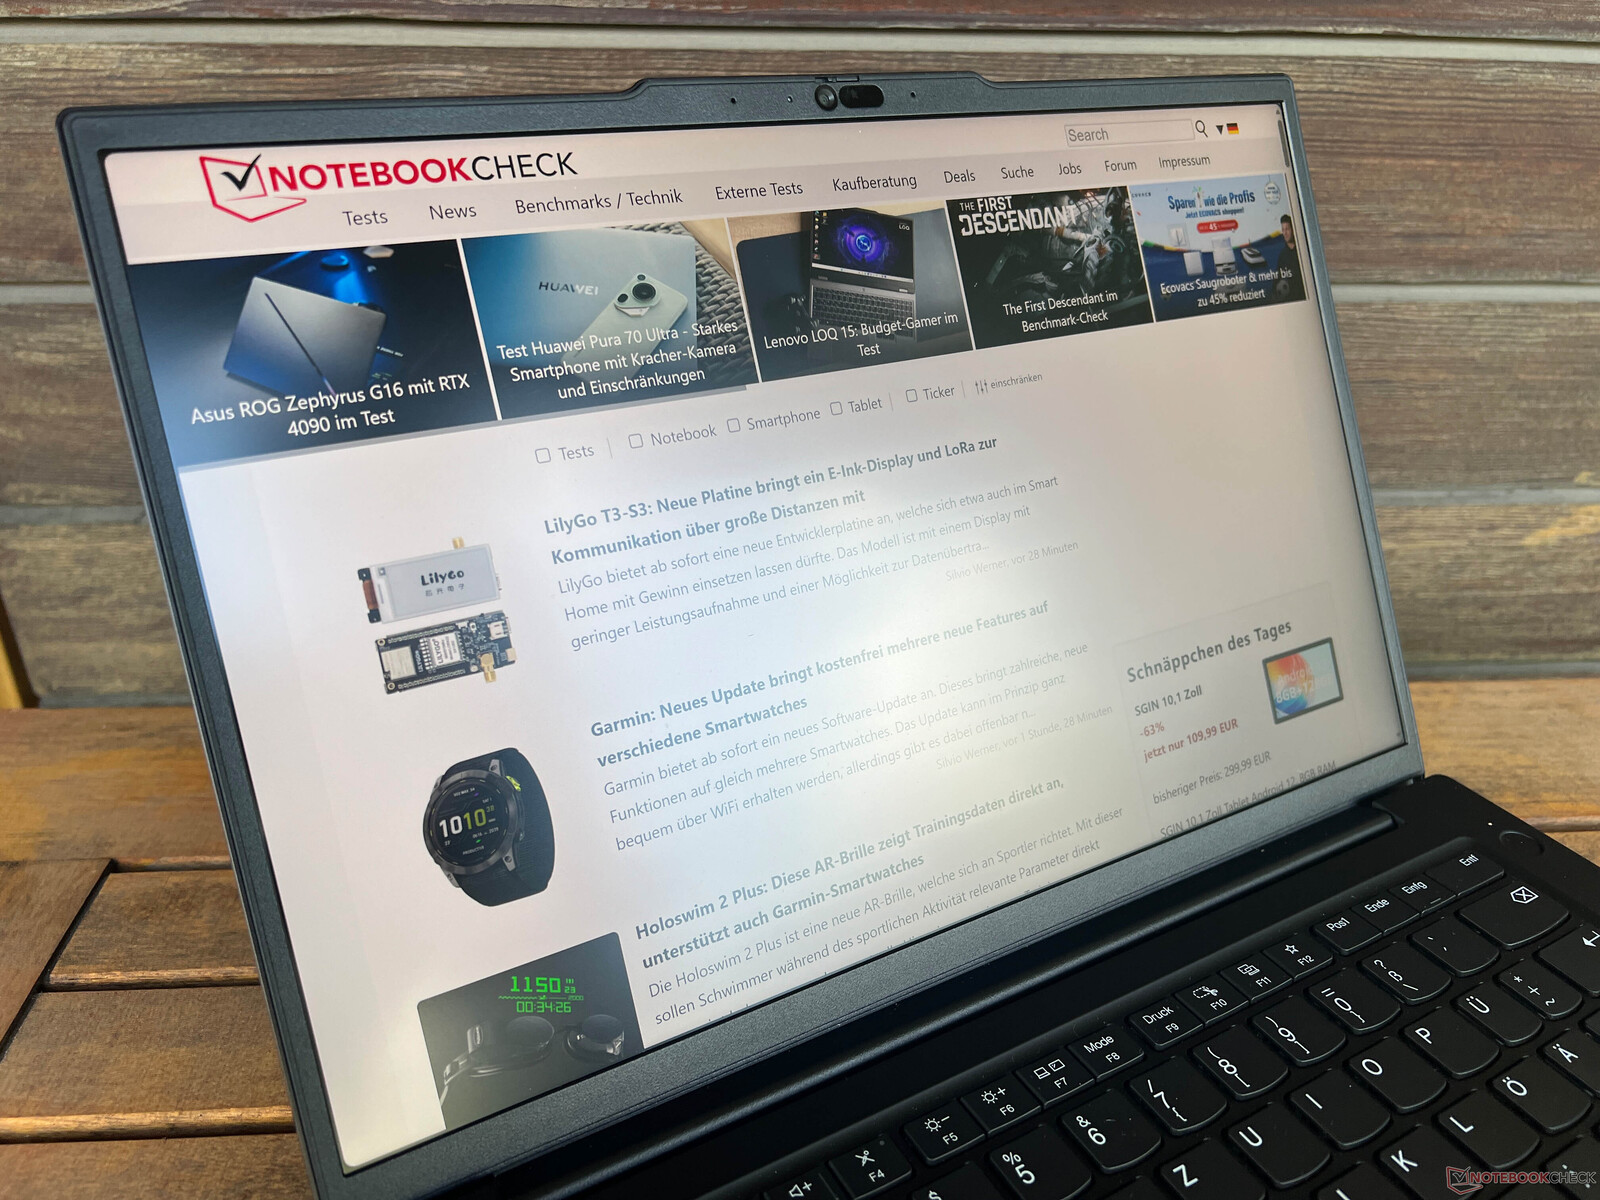
Wyświetlacz - 3K IPS przy 120 Hz
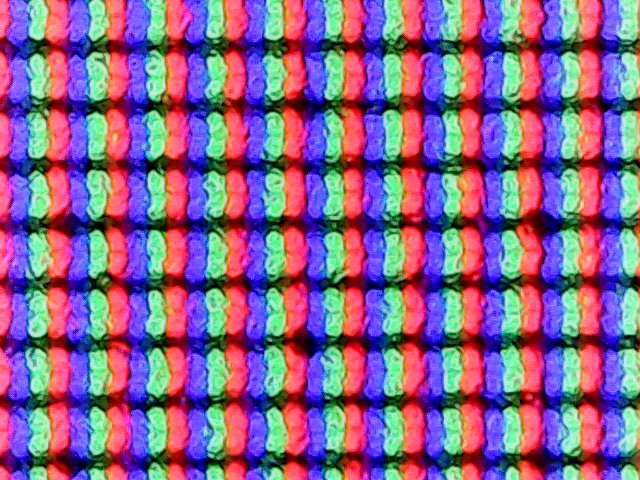
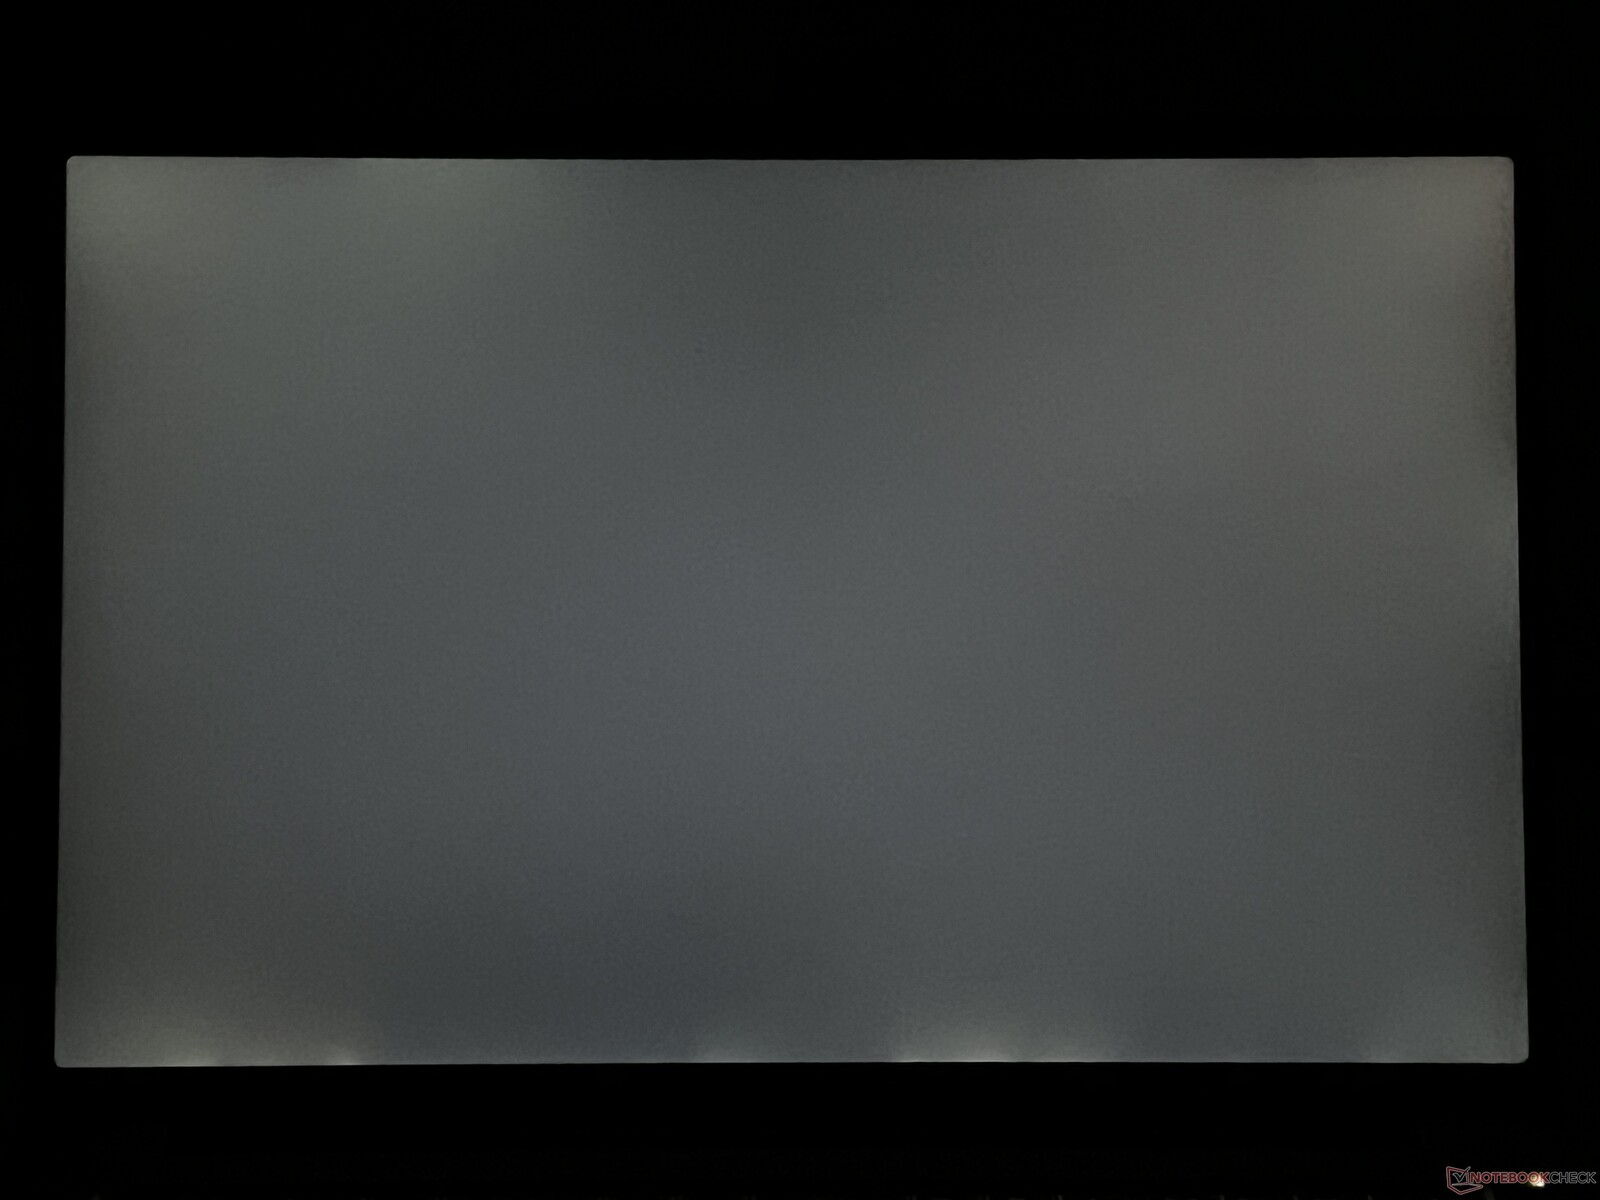
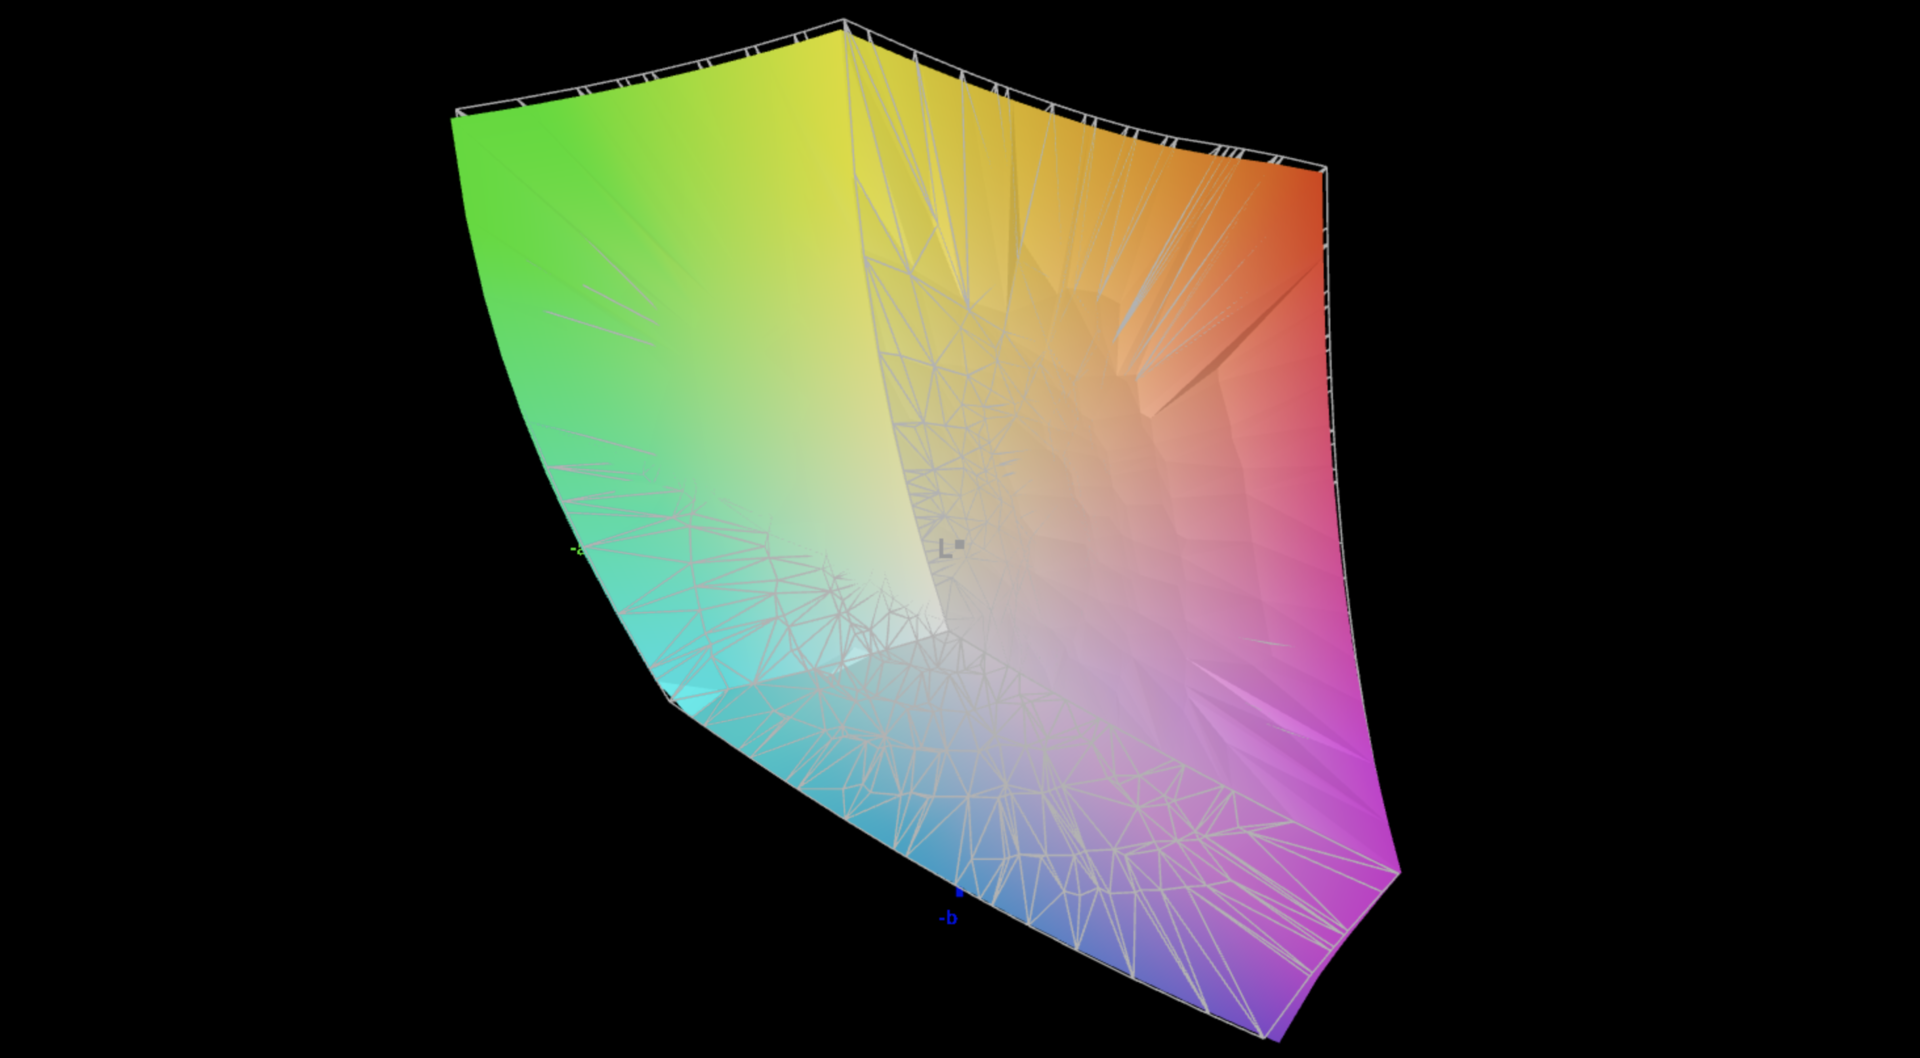
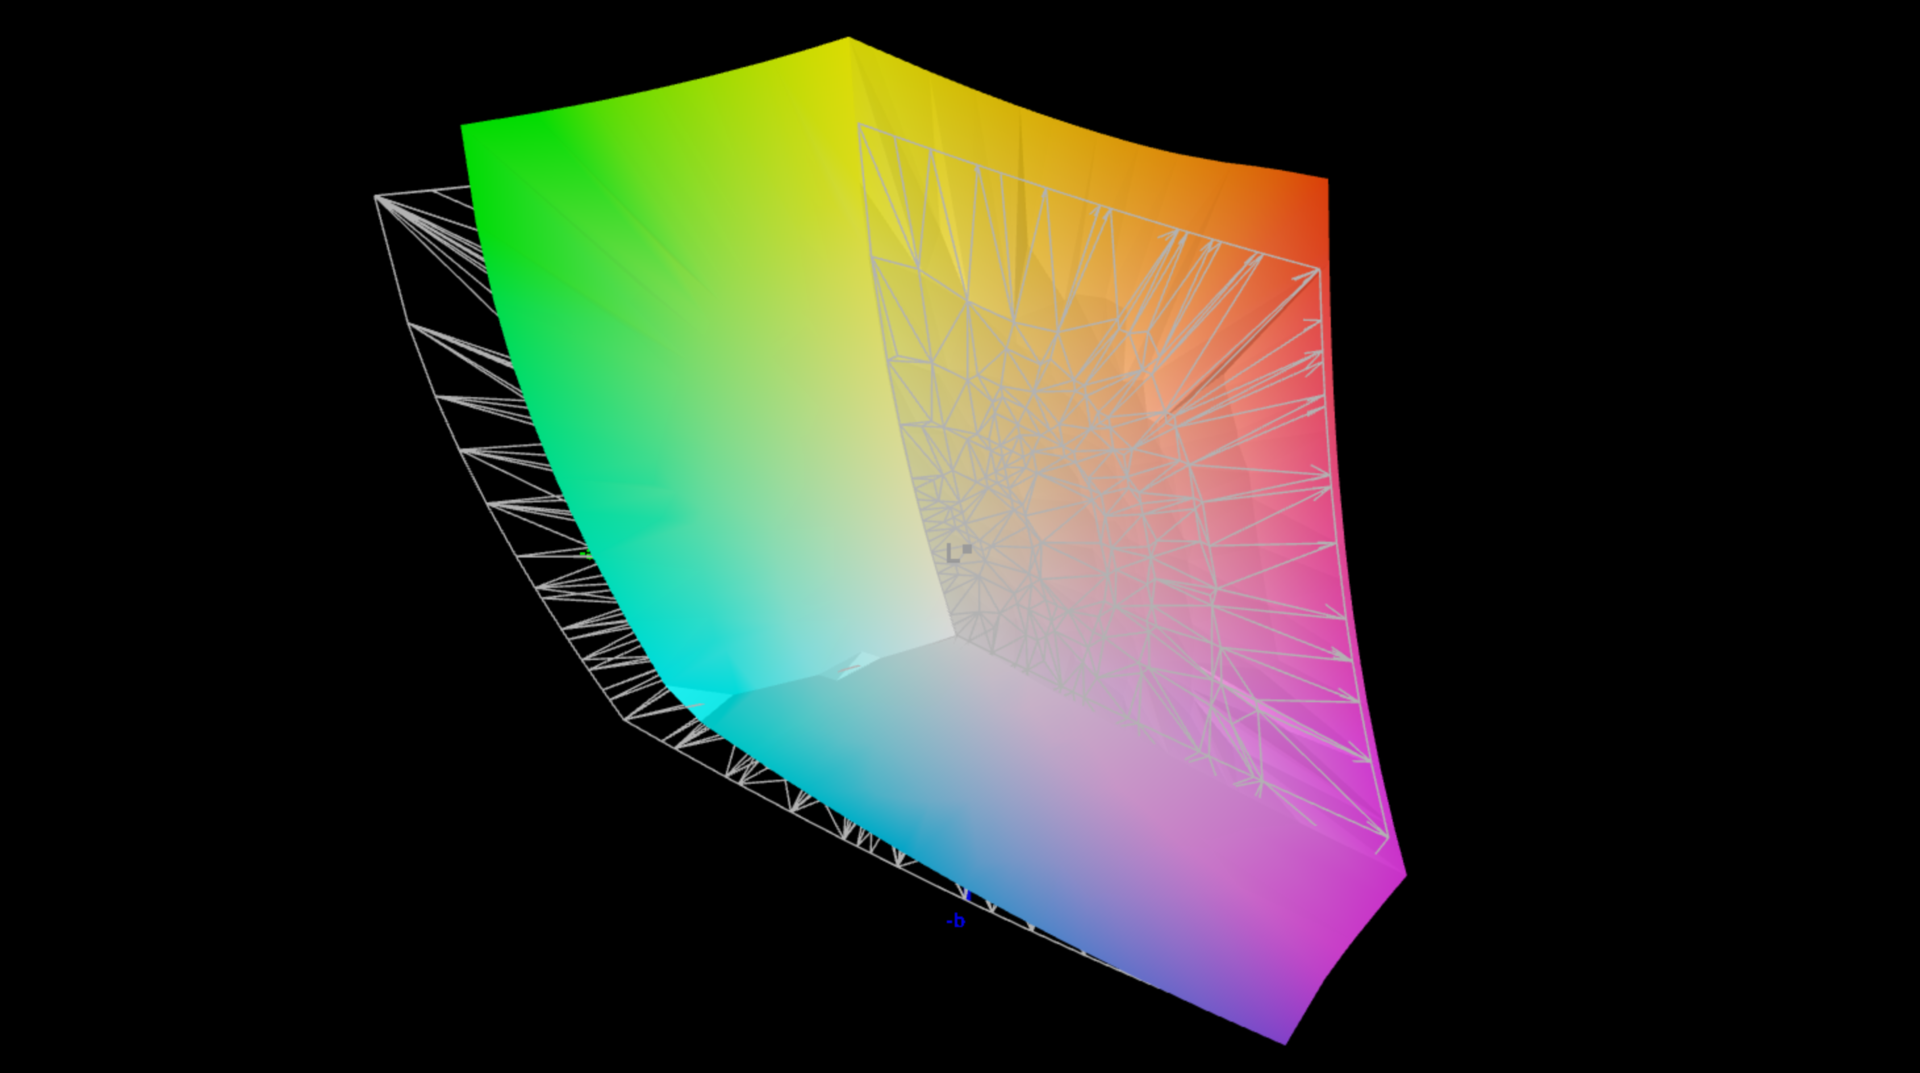
Lenovo nie oferuje już opcjonalnego ekranu OLED widocznego w P14s G4 w tym zaktualizowanym modelu Intela; zamiast tego można wybrać tylko matowe, 14,5-calowe panele IPS. W naszym urządzeniu testowym zainstalowano nowy model 3K o rozdzielczości 3 072 x 1 920 pikseli, częstotliwości odświeżania 120 Hz i pokryciu przestrzeni kolorów P3. Subiektywnie, jakość obrazu jest świetna, ponieważ nawet przy bliższym przyjrzeniu się, można dostrzec jedynie minimalną ziarnistość podczas wyświetlania jasnych treści. Na szczęście nie jest to zauważalne podczas oglądania ekranu z normalnej odległości. Wszystkie treści są bardzo ostre, a kolory wyglądają na bardzo żywe. Oczywiście kolory na tym wyświetlaczu nie są tak żywe jak na panelach OLED, ale ekran jest przynajmniej matowy i nie wykorzystuje PWM. Ruchy wyglądają płynnie dzięki zwiększonej częstotliwości odświeżania, a czasy reakcji są w porządku (brak smużenia). Przy jasności ustawionej na wysokie poziomy i podczas oglądania ciemnego obrazu, wzdłuż krawędzi ekranu można zaobserwować lekkie krwawienie podświetlenia. Ani jasność, ani temperatura barwowa nie mogą być regulowane automatycznie, a treści HDR nie są obsługiwane.
Lenovo reklamuje jasność 430 cd/m², ale mogliśmy to potwierdzić tylko na środku ekranu. Średnio jego jasność wynosi tylko nieco ponad 400 cd/m². Wartość czerni wyświetlacza wynosi 0,32 cd/m², co daje maksymalny współczynnik kontrastu nieco poniżej 1400,1. Są to ogólnie rozsądne wartości, ale nie można ich też nazwać dobrymi. Widać to również w porównaniu z konkurencją, ponieważ nowy HP ZBook Firefly G11na przykład, osiąga jasność około 550 cd/m² z wyświetlaczem 120 Hz (nawet jeśli jego rozdzielczość jest nieco niższa). Lenovo oferuje również inne panele, takie jak doskonały mini panel LED przy 165 Hz wewnątrz Yoga Pro 9i 14 (również 14,5 cala, 3 072 x 1 920 pikseli).
| |||||||||||||||||||||||||
rozświetlenie: 87 %
na akumulatorze: 439 cd/m²
kontrast: 1372:1 (czerń: 0.32 cd/m²)
ΔE Color 2.1 | 0.5-29.43 Ø4.87, calibrated: 0.8
ΔE Greyscale 3.9 | 0.5-98 Ø5.1
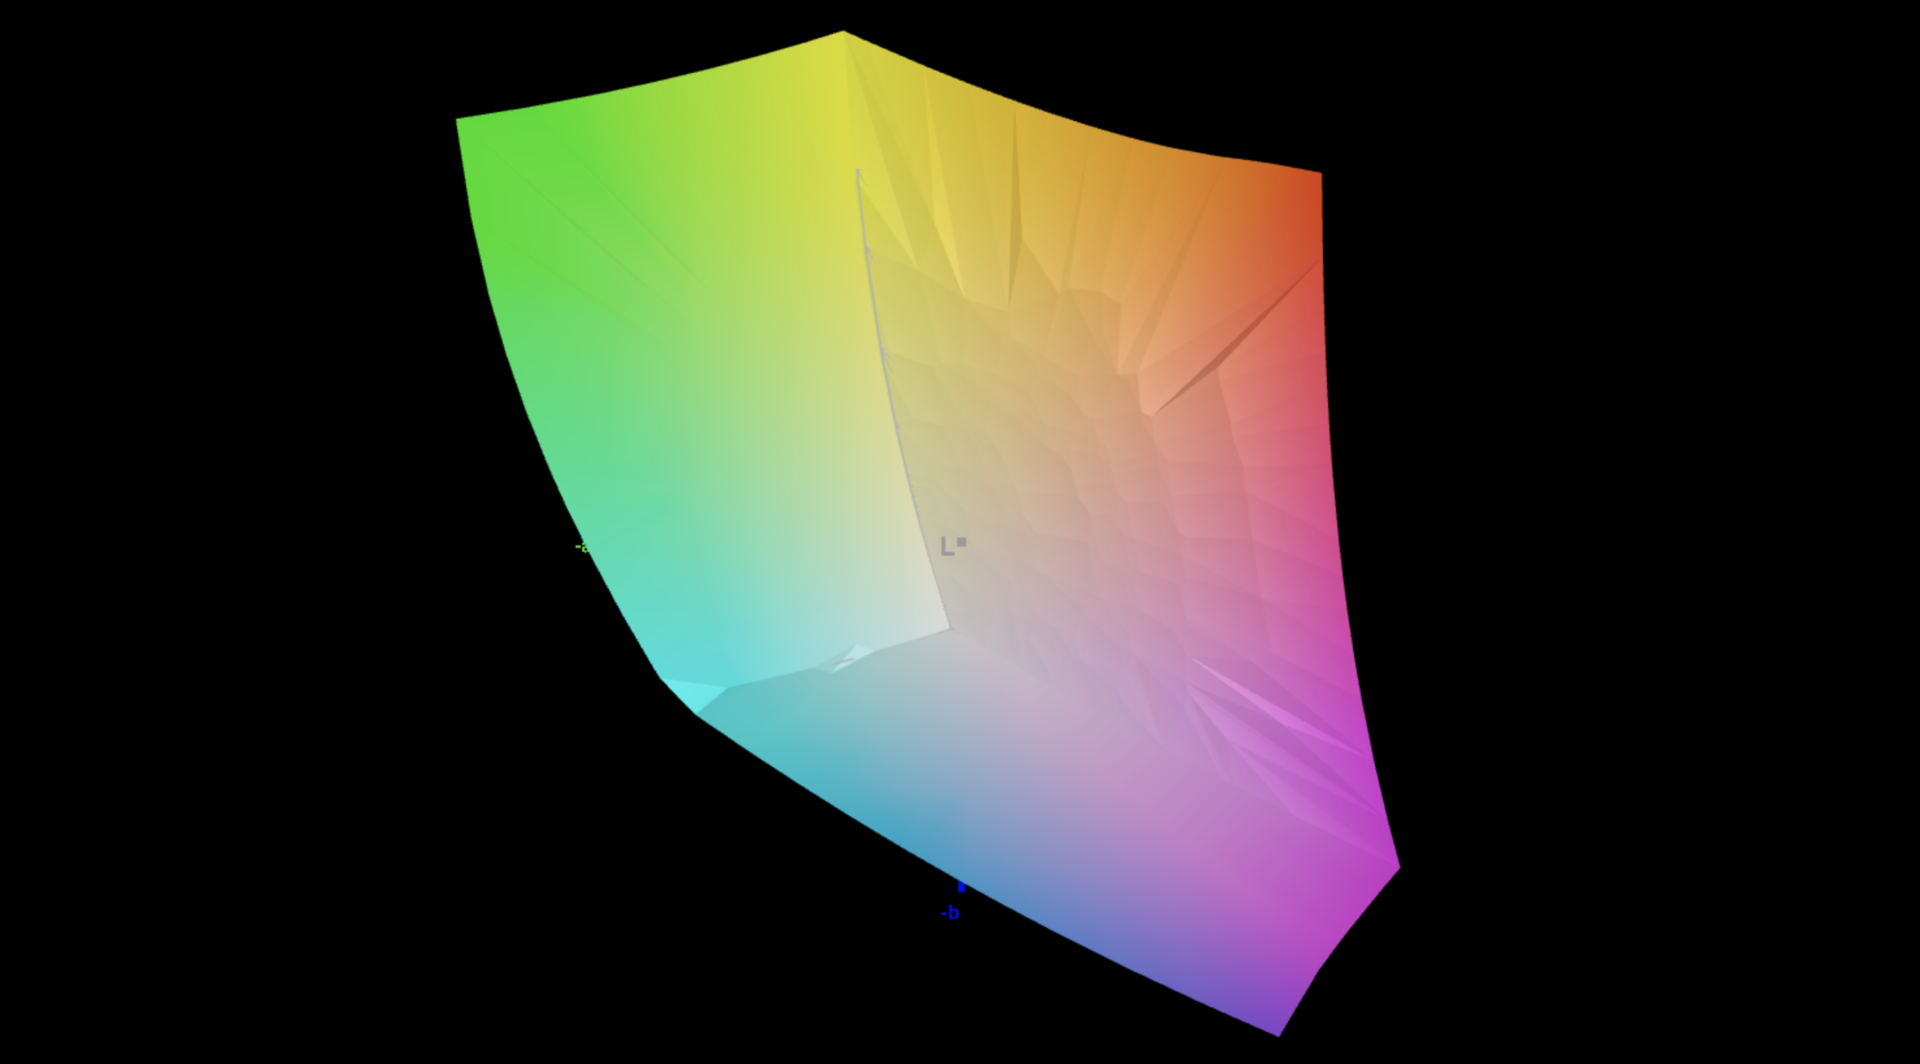
87.4% AdobeRGB 1998 (Argyll 2.2.0 3D)
100% sRGB (Argyll 2.2.0 3D)
98.4% Display P3 (Argyll 2.2.0 3D)
Gamma: 2.2
| Lenovo ThinkPad P14s G5 21G3S00A00 LEN145-3K, IPS, 3072x1920, 14.5", 120 Hz | HP ZBook Firefly 14 G11 AUO6DA8, IPS, 2560x1600, 14", 120 Hz | Dell Precision 5000 5490 AU Optronics B140QAN, IPS, 2560x1600, 14", 60 Hz | Lenovo ThinkPad P14s G4 21HF0017GE ATNA40YK15-0, OLED, 2880x1800, 14", 60 Hz | Microsoft Surface Laptop Studio 2 RTX 4060 LQ144P1JX01, IPS, 2400x1600, 14.4", 120 Hz | Lenovo Yoga Pro 9-14IRP G8 CSOT T3 MNE507HZ2-1, Mini-LED, 3072x1920, 14.5", 165 Hz | |
|---|---|---|---|---|---|---|
| Display | 0% | -9% | 4% | -18% | 1% | |
| Display P3 Coverage | 98.4 | 98.9 1% | 79.7 -19% | 99.9 2% | 66.7 -32% | 92 -7% |
| sRGB Coverage | 100 | 99.9 0% | 100 0% | 100 0% | 99 -1% | 99.7 0% |
| AdobeRGB 1998 Coverage | 87.4 | 86.6 -1% | 79.5 -9% | 97 11% | 68.9 -21% | 96.9 11% |
| Response Times | 52% | -98% | 88% | -143% | 41% | |
| Response Time Grey 50% / Grey 80% * | 30.2 ? | 12.3 ? 59% | 52.3 ? -73% | 3 ? 90% | 77.6 ? -157% | 12.7 ? 58% |
| Response Time Black / White * | 15 ? | 8.3 ? 45% | 33.3 ? -122% | 2.2 ? 85% | 34.3 ? -129% | 11.4 ? 24% |
| PWM Frequency | 360 ? | 17600 ? | 6000 ? | |||
| Screen | 6% | 9% | -90% | 43% | 19% | |
| Brightness middle | 439 | 554.1 26% | 485.1 11% | 432 -2% | 511 16% | 670 53% |
| Brightness | 406 | 540 33% | 471 16% | 432 6% | 503 24% | 680 67% |
| Brightness Distribution | 87 | 93 7% | 90 3% | 98 13% | 89 2% | 89 2% |
| Black Level * | 0.32 | 0.58 -81% | 0.38 -19% | 0.26 19% | 0.19 41% | |
| Contrast | 1372 | 955 -30% | 1277 -7% | 1965 43% | 3526 157% | |
| Colorchecker dE 2000 * | 2.1 | 2.54 -21% | 2.15 -2% | 4.8 -129% | 0.5 76% | 4 -90% |
| Colorchecker dE 2000 max. * | 6.2 | 4.99 20% | 5.39 13% | 9.2 -48% | 1.1 82% | 4.5 27% |
| Colorchecker dE 2000 calibrated * | 0.8 | 0.56 30% | 0.67 16% | 4.9 -513% | 1.3 -63% | |
| Greyscale dE 2000 * | 3.9 | 1 74% | 2 49% | 2.3 41% | 0.8 79% | 4.9 -26% |
| Gamma | 2.2 100% | 2.3 96% | 2.3 96% | 2.23 99% | 2.19 100% | 2.22 99% |
| CCT | 7013 93% | 6556 99% | 6826 95% | 6391 102% | 6650 98% | 5735 113% |
| Całkowita średnia (program / ustawienia) | 19% /
12% | -33% /
-10% | 1% /
-37% | -39% /
0% | 20% /
18% |
* ... im mniej tym lepiej
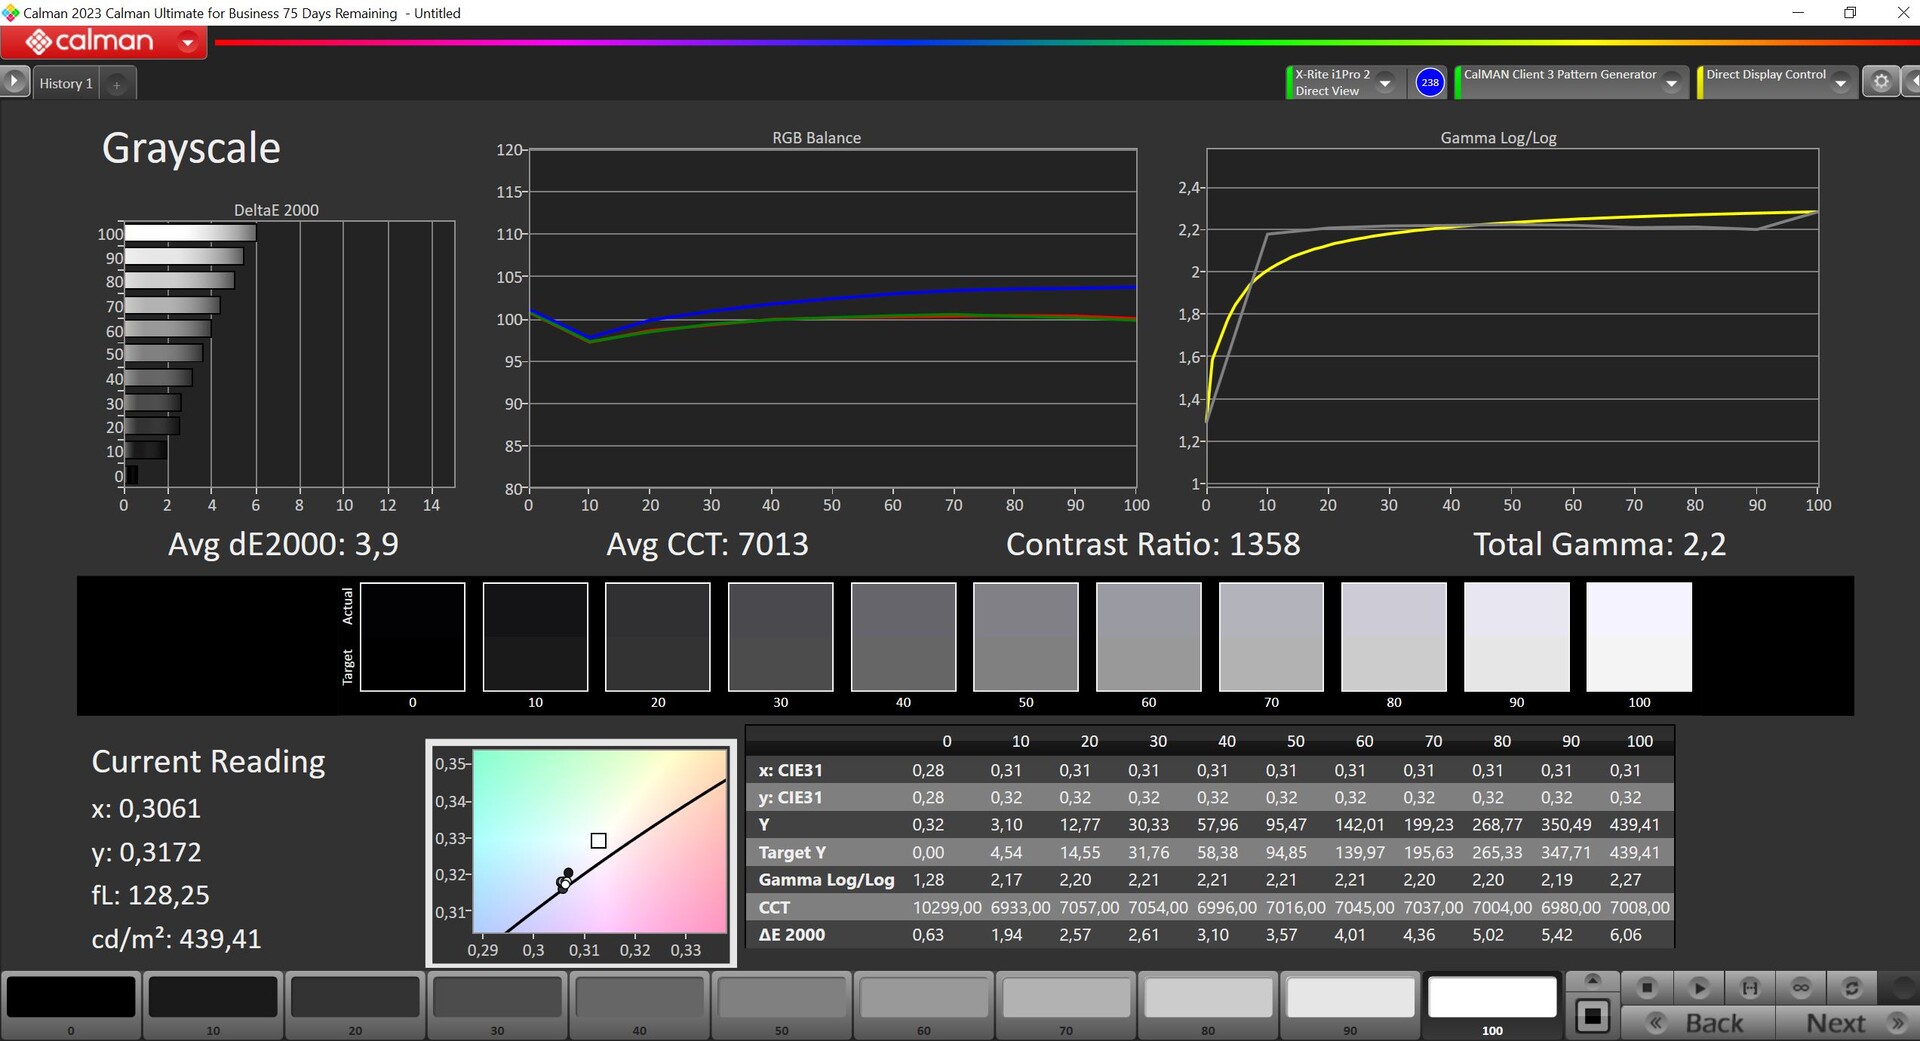
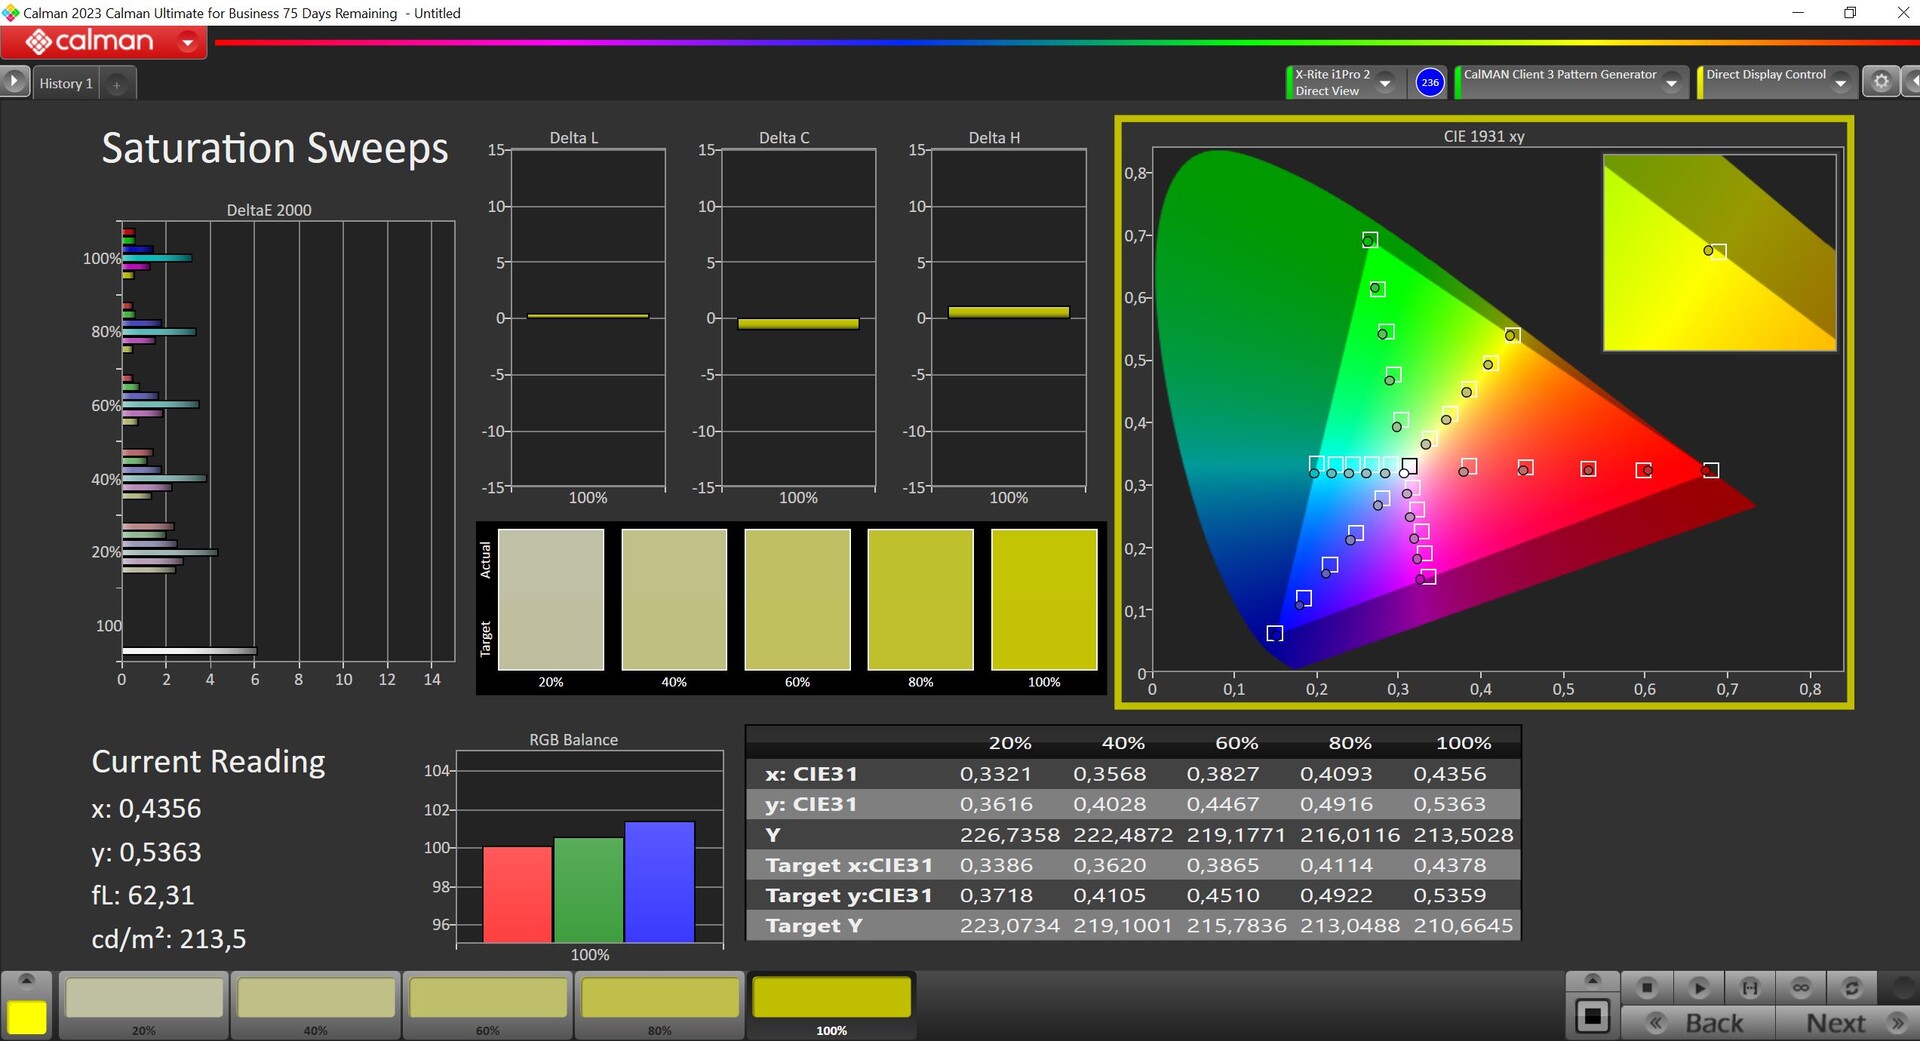
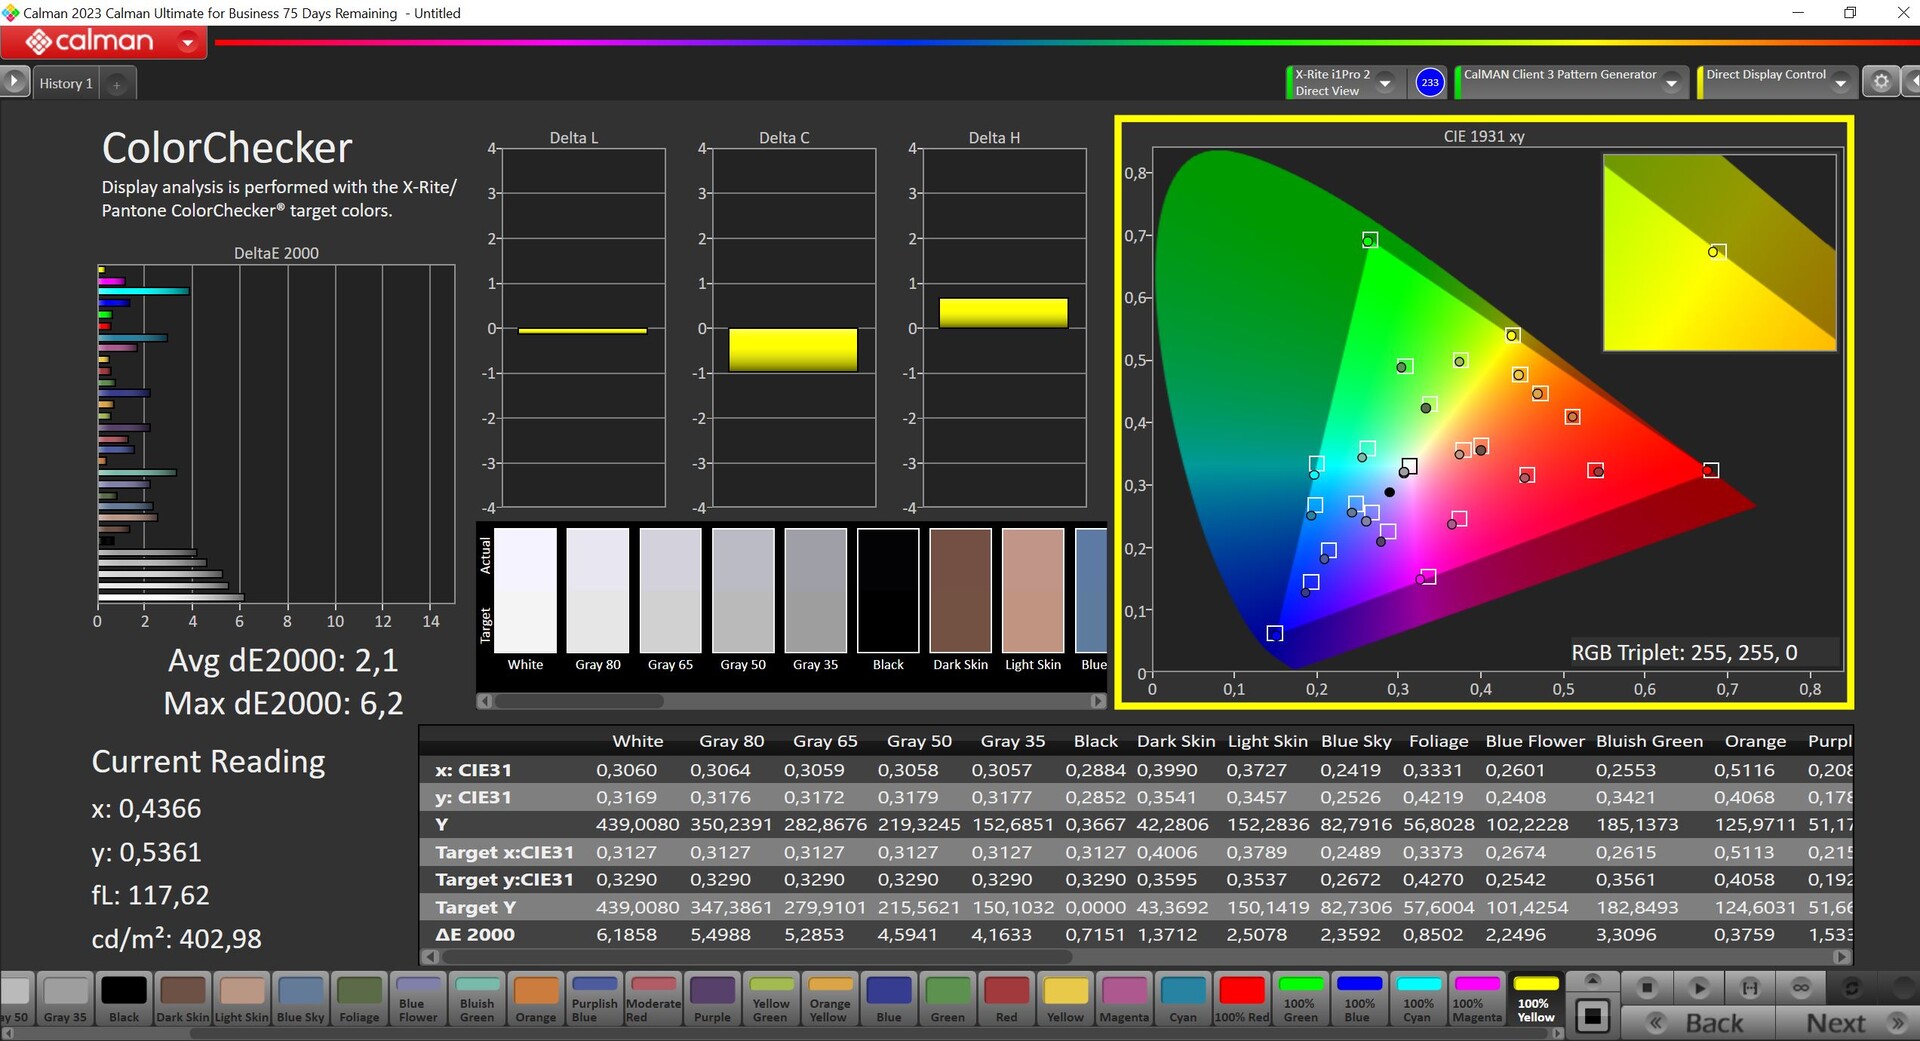
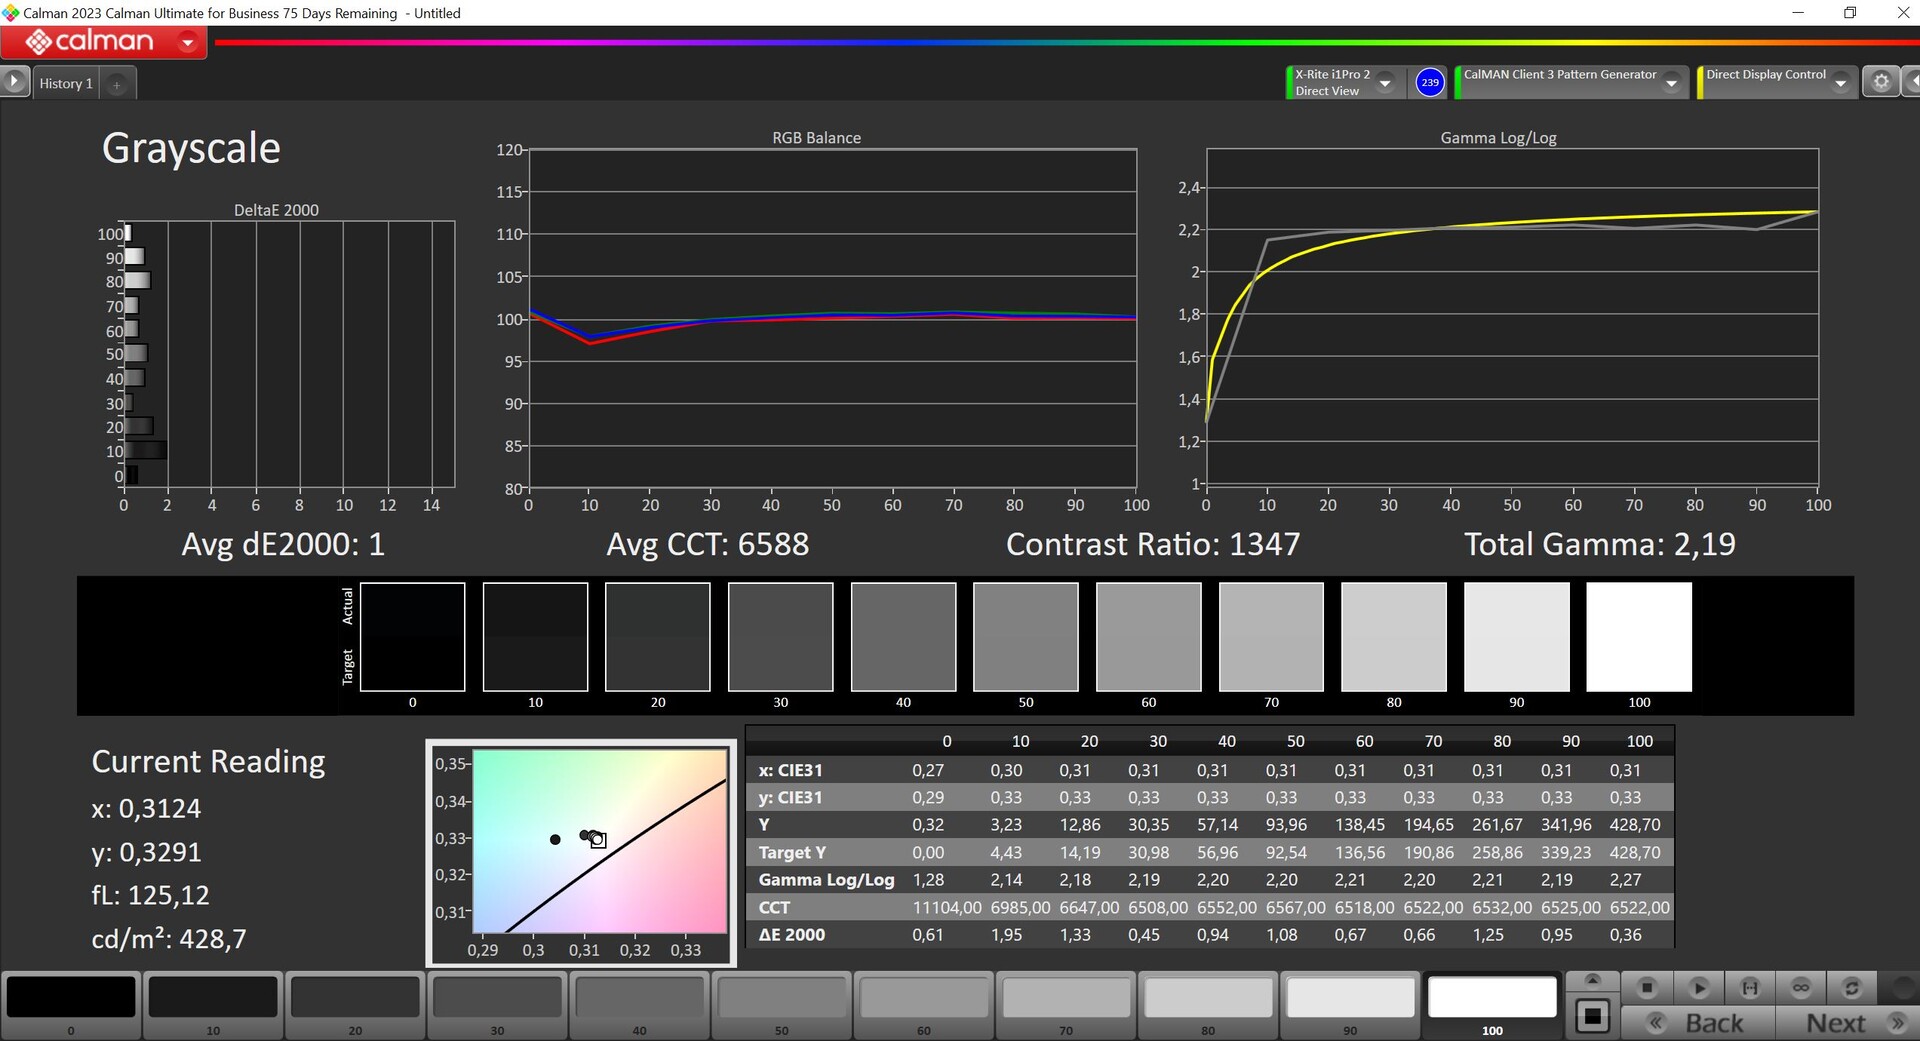
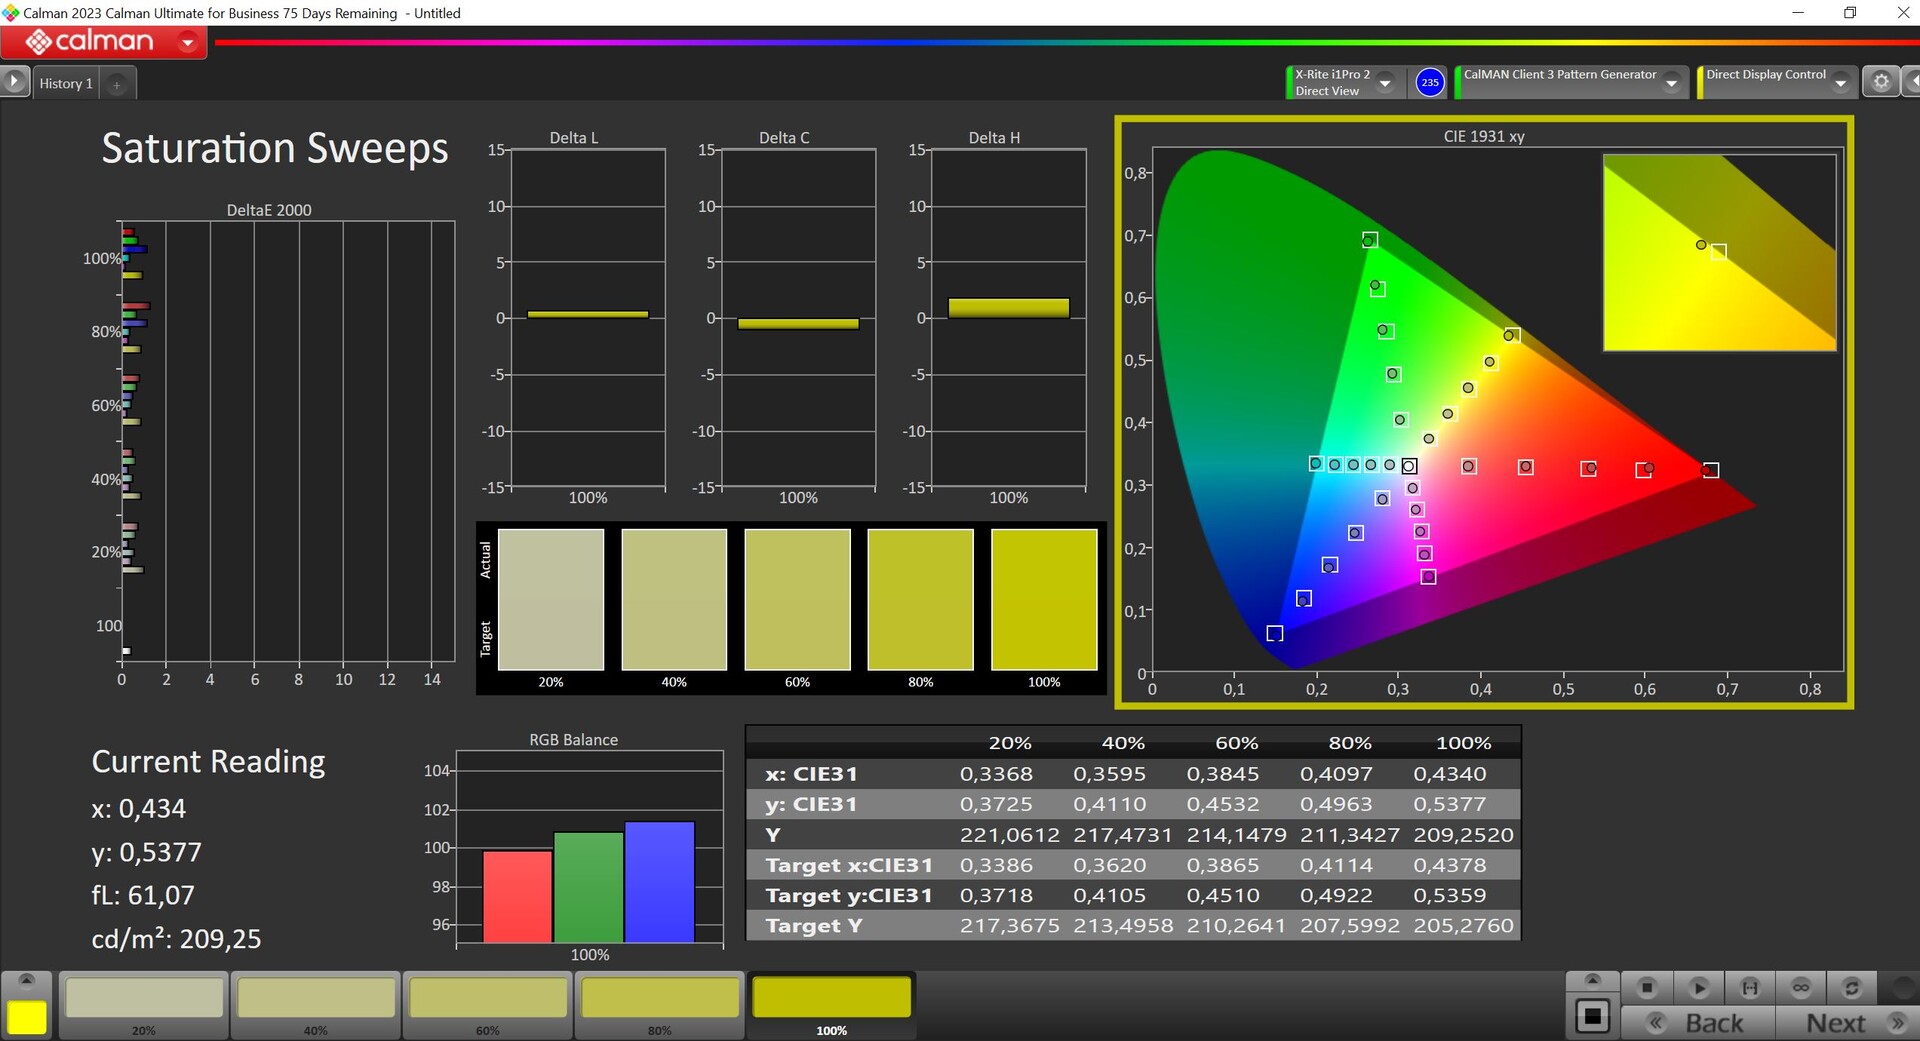
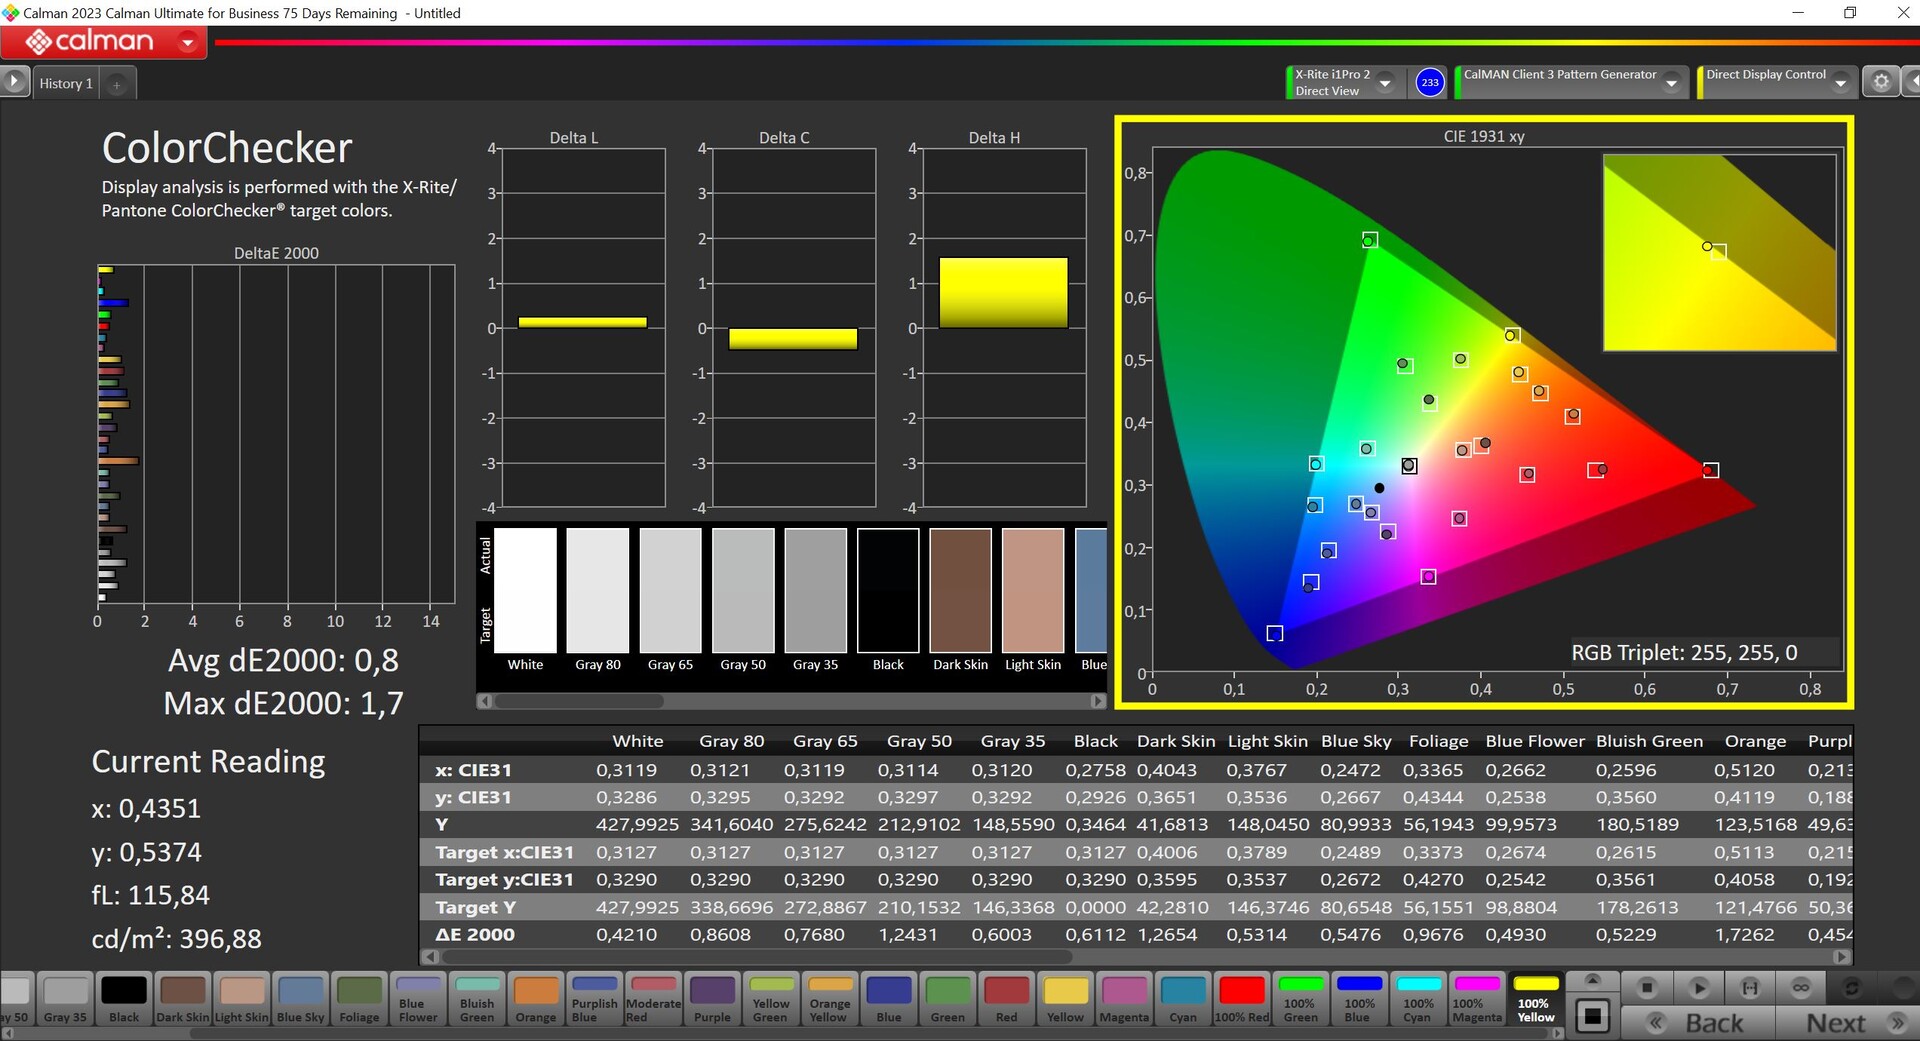
Przeanalizowaliśmy panel za pomocą profesjonalnego oprogramowania CalMAN (X-Rite i1 Pro 2), ale Lenovo nie zapewnia profilu sRGB. Prosto po wyjęciu z pudełka wyświetlacz ma niebieski odcień w połączeniu ze zbyt niską temperaturą barwową, a niektóre odchylenia kolorów przekraczają docelową wartość 3. Wykonując własną kalibrację, znacznie poprawiliśmy obraz i skorygowaliśmy odchylenia skali szarości i kolorów. Odpowiedni profil jest dostępny do pobrania za darmo powyżej. Panel w pełni pokrywa przestrzenie barw P3 i sRGB.
Wyświetl czasy reakcji
| ↔ Czas reakcji od czerni do bieli | ||
|---|---|---|
| 15 ms ... wzrost ↗ i spadek ↘ łącznie | ↗ 5.8 ms wzrost | 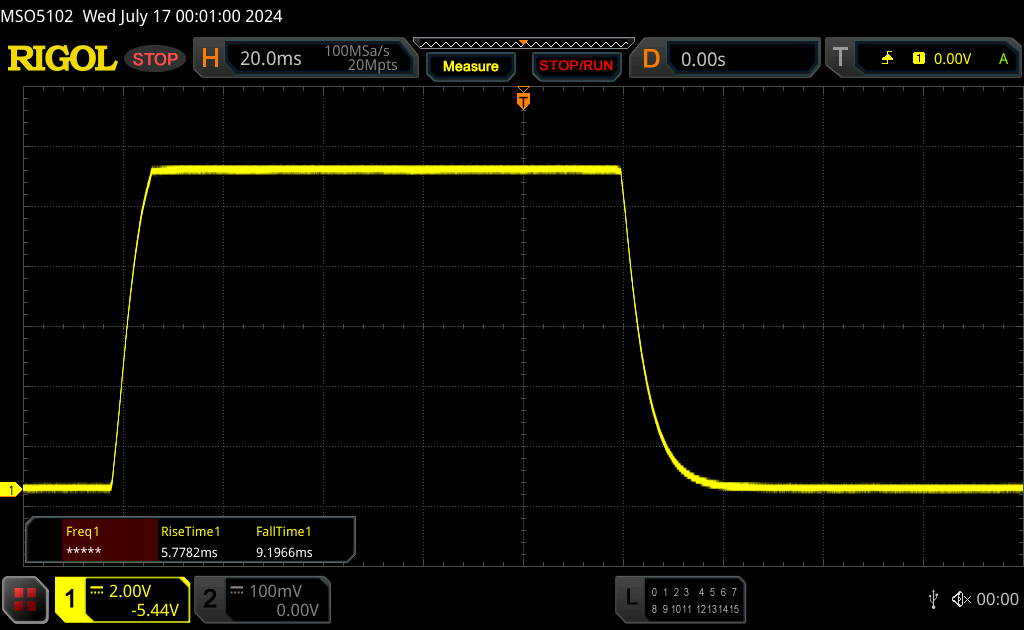 |
| ↘ 9.2 ms upadek | ||
| W naszych testach ekran wykazuje dobry współczynnik reakcji, ale może być zbyt wolny dla graczy rywalizujących ze sobą. Dla porównania, wszystkie testowane urządzenia wahają się od 0.1 (minimum) do 240 (maksimum) ms. » 33 % wszystkich urządzeń jest lepszych. Oznacza to, że zmierzony czas reakcji jest lepszy od średniej wszystkich testowanych urządzeń (20.8 ms). | ||
| ↔ Czas reakcji 50% szarości do 80% szarości | ||
| 30.2 ms ... wzrost ↗ i spadek ↘ łącznie | ↗ 14 ms wzrost | 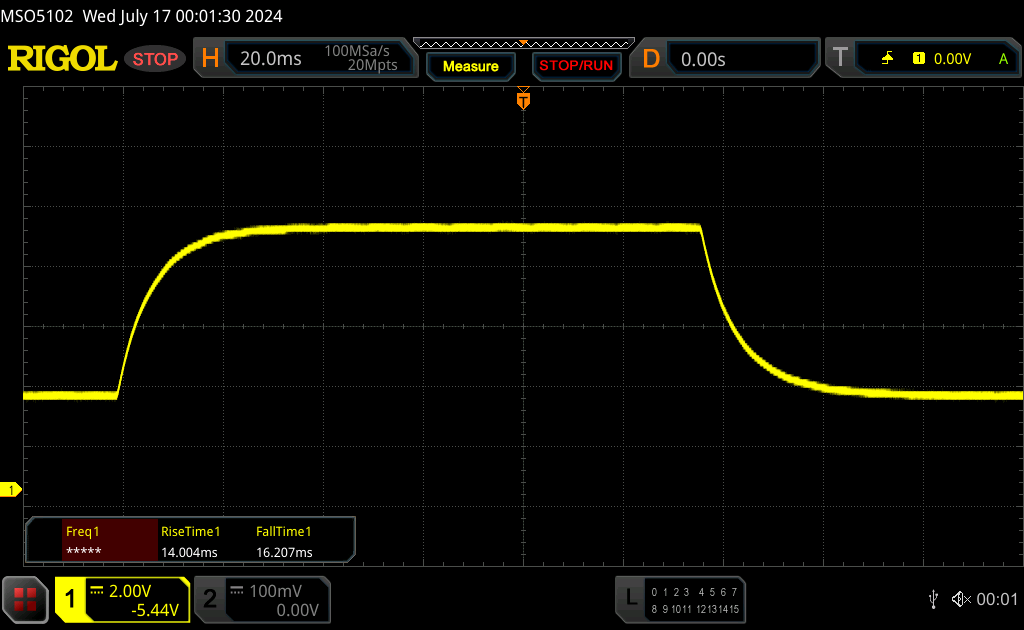 |
| ↘ 16.2 ms upadek | ||
| W naszych testach ekran wykazuje powolne tempo reakcji, co będzie niezadowalające dla graczy. Dla porównania, wszystkie testowane urządzenia wahają się od 0.165 (minimum) do 636 (maksimum) ms. » 37 % wszystkich urządzeń jest lepszych. Oznacza to, że zmierzony czas reakcji jest zbliżony do średniej wszystkich testowanych urządzeń (32.5 ms). | ||
Migotanie ekranu / PWM (modulacja szerokości impulsu)
| Migotanie ekranu/nie wykryto PWM | 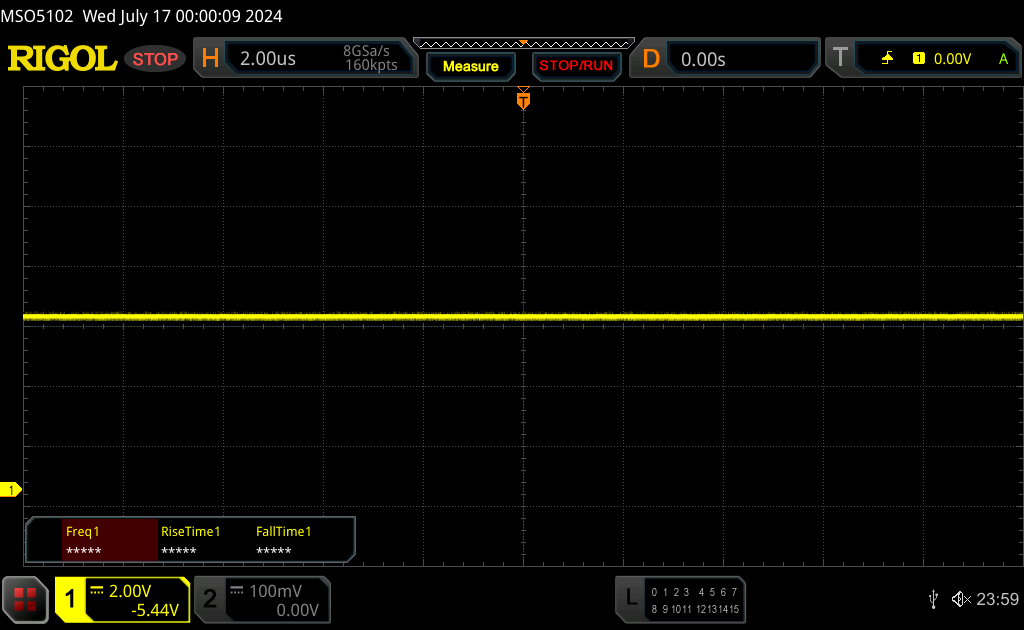 | ||
Dla porównania: 53 % wszystkich testowanych urządzeń nie używa PWM do przyciemniania wyświetlacza. Jeśli wykryto PWM, zmierzono średnio 8516 (minimum: 5 - maksimum: 343500) Hz. | |||
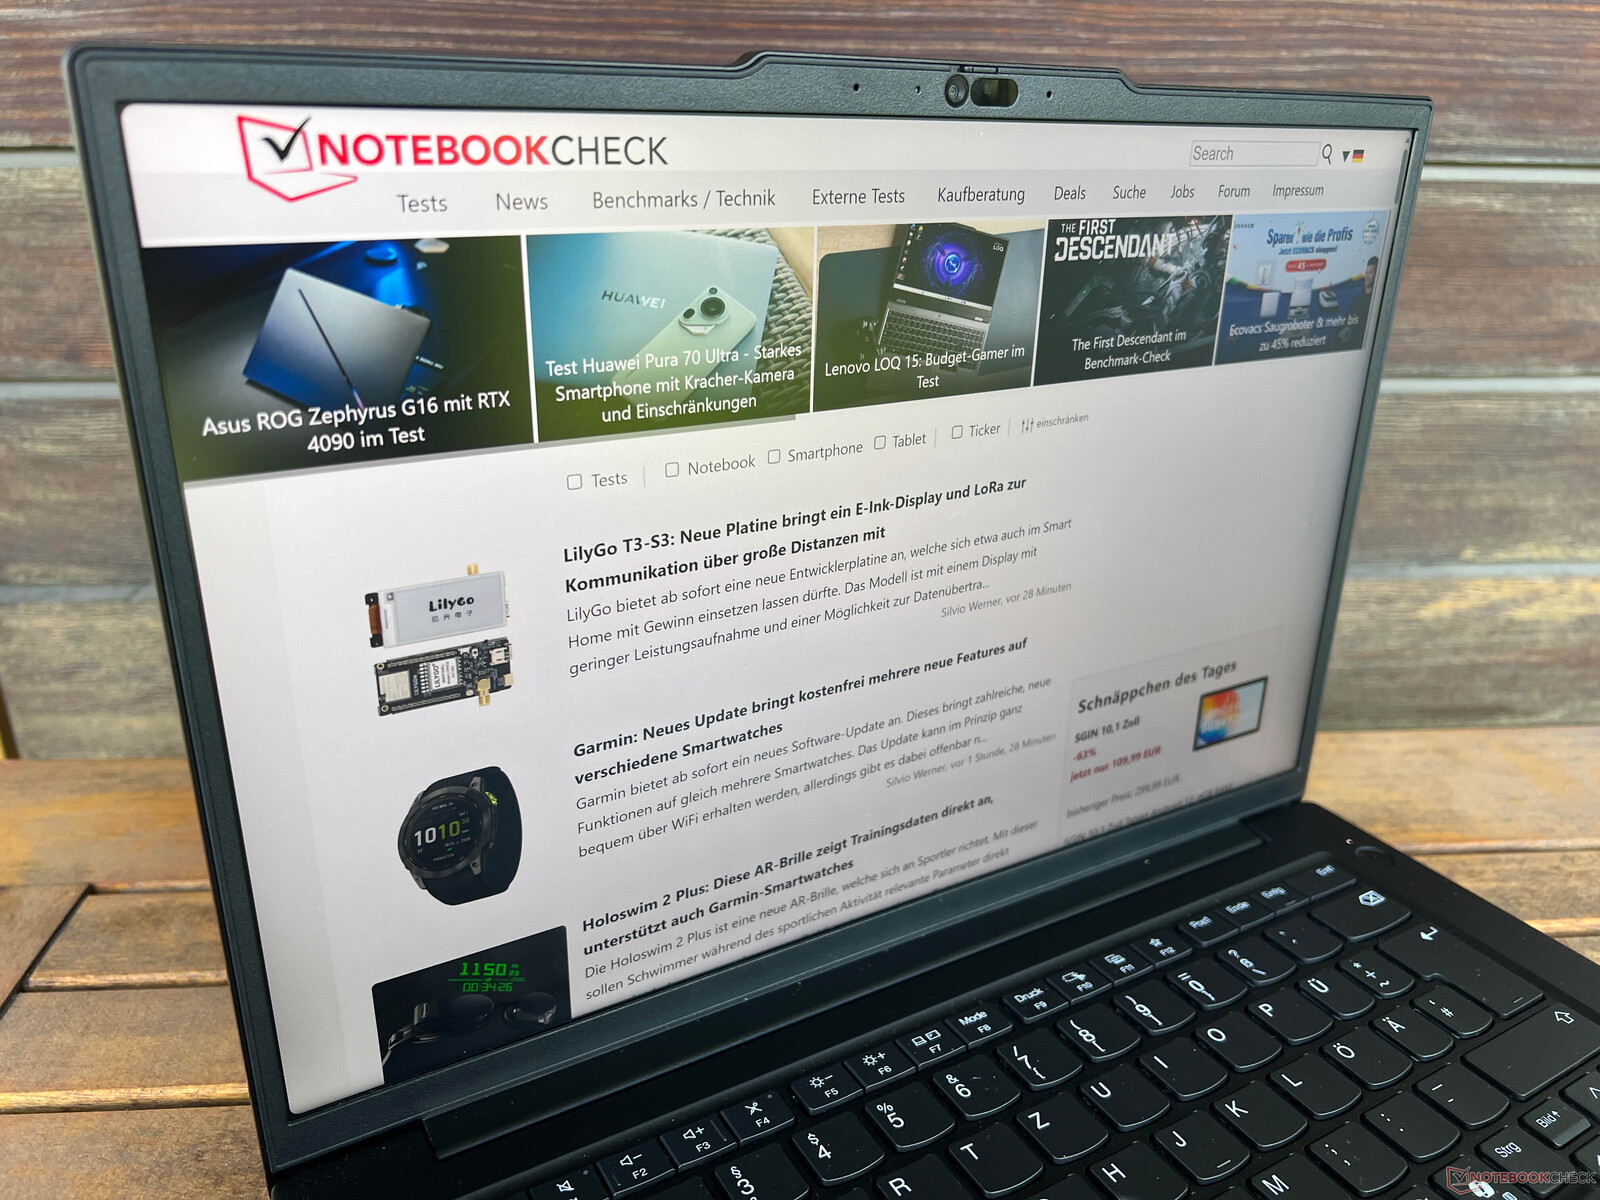
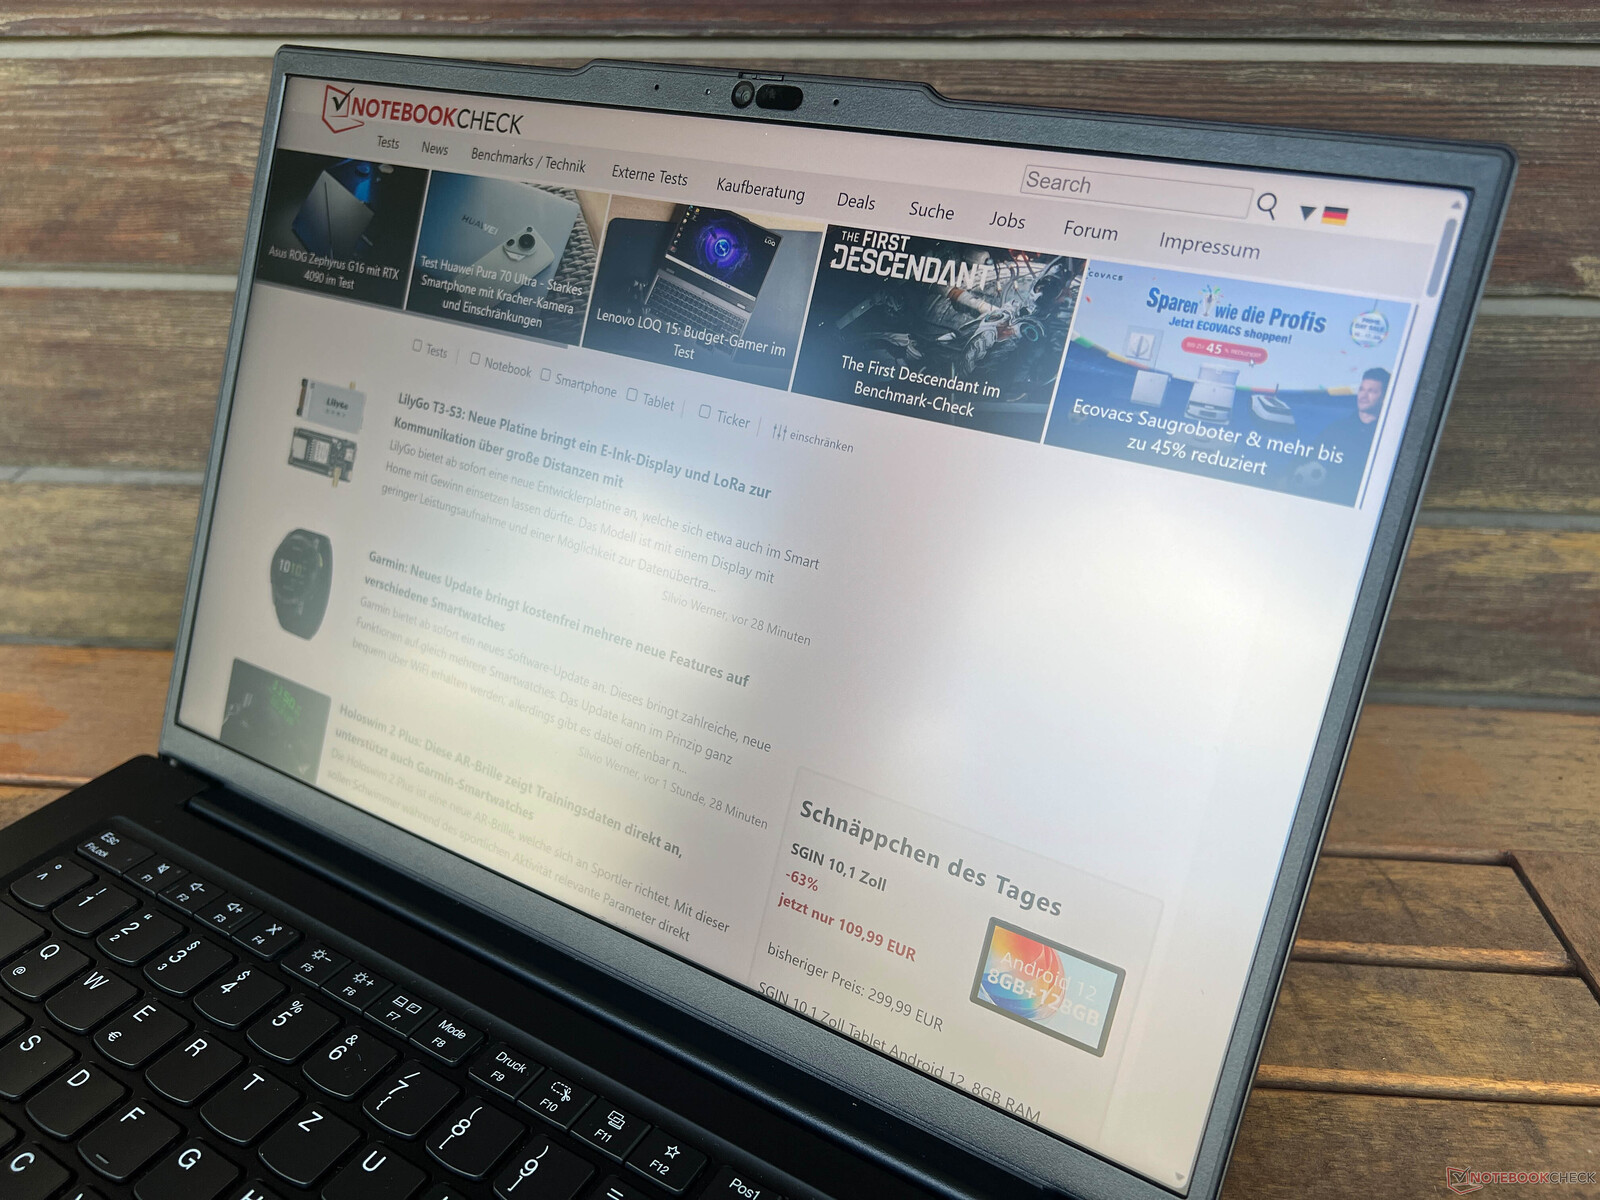
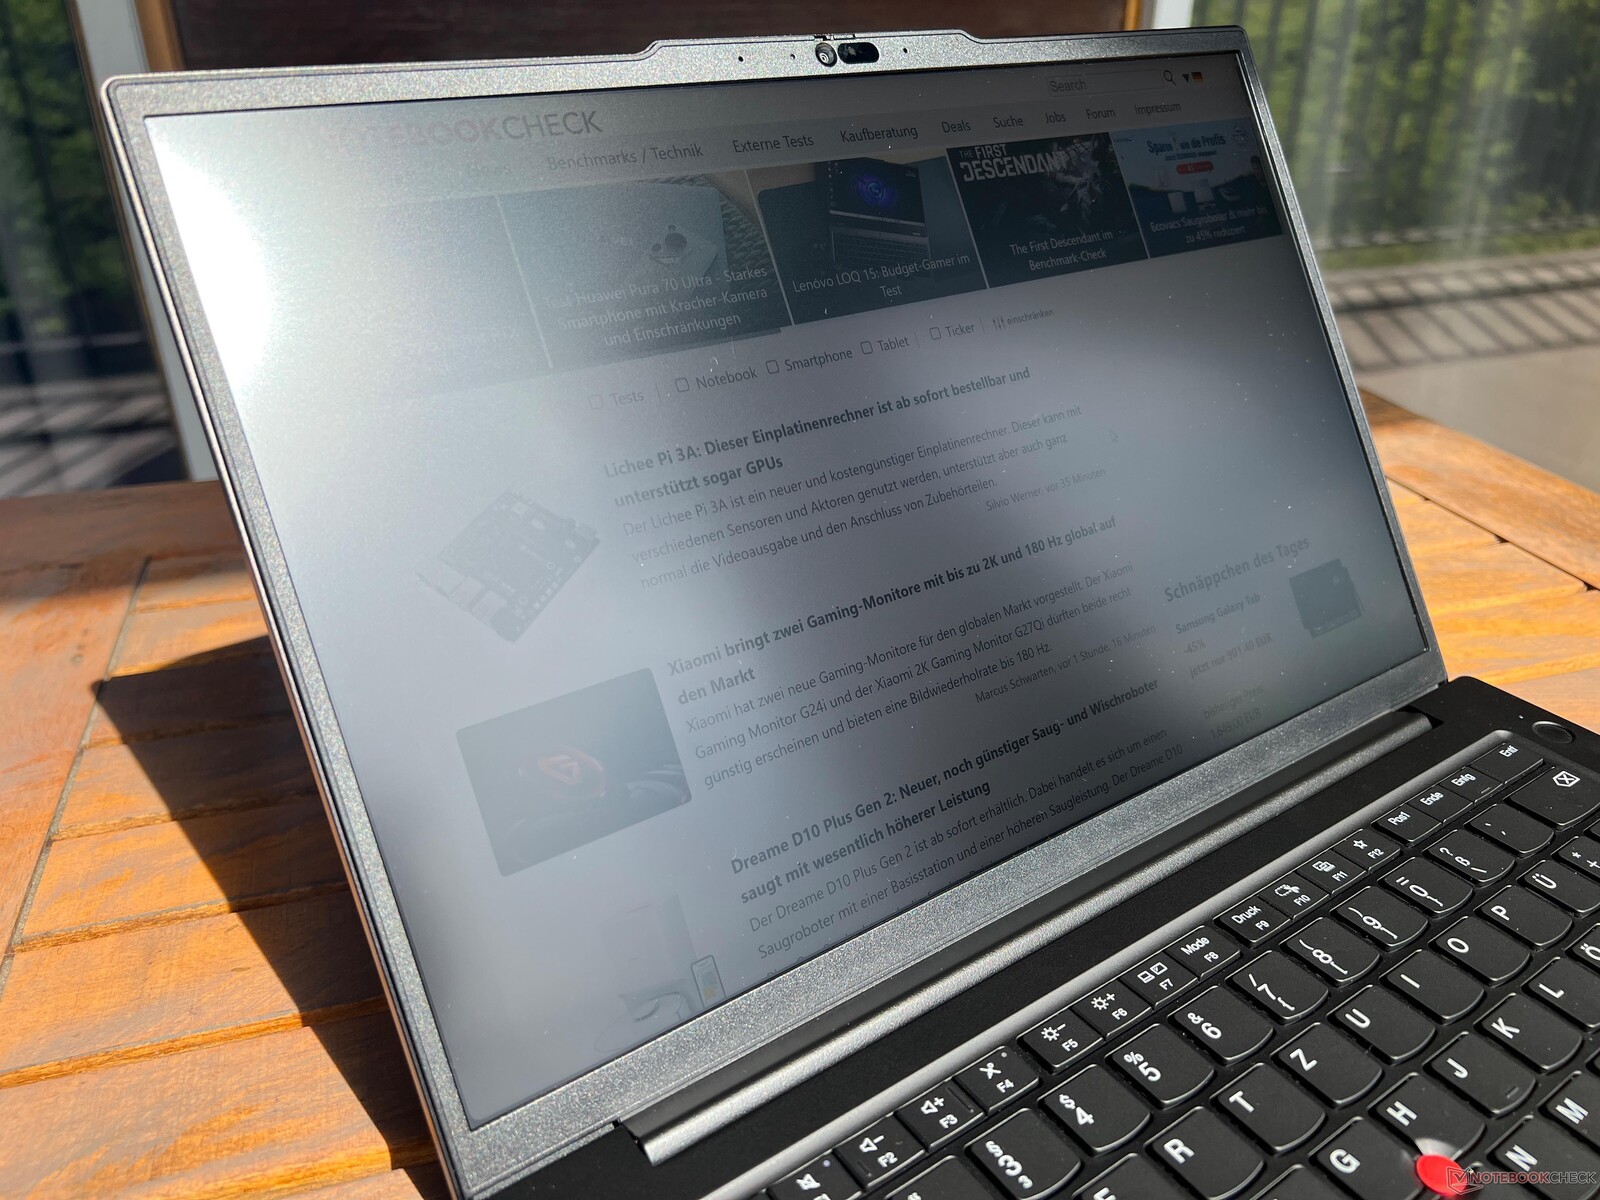
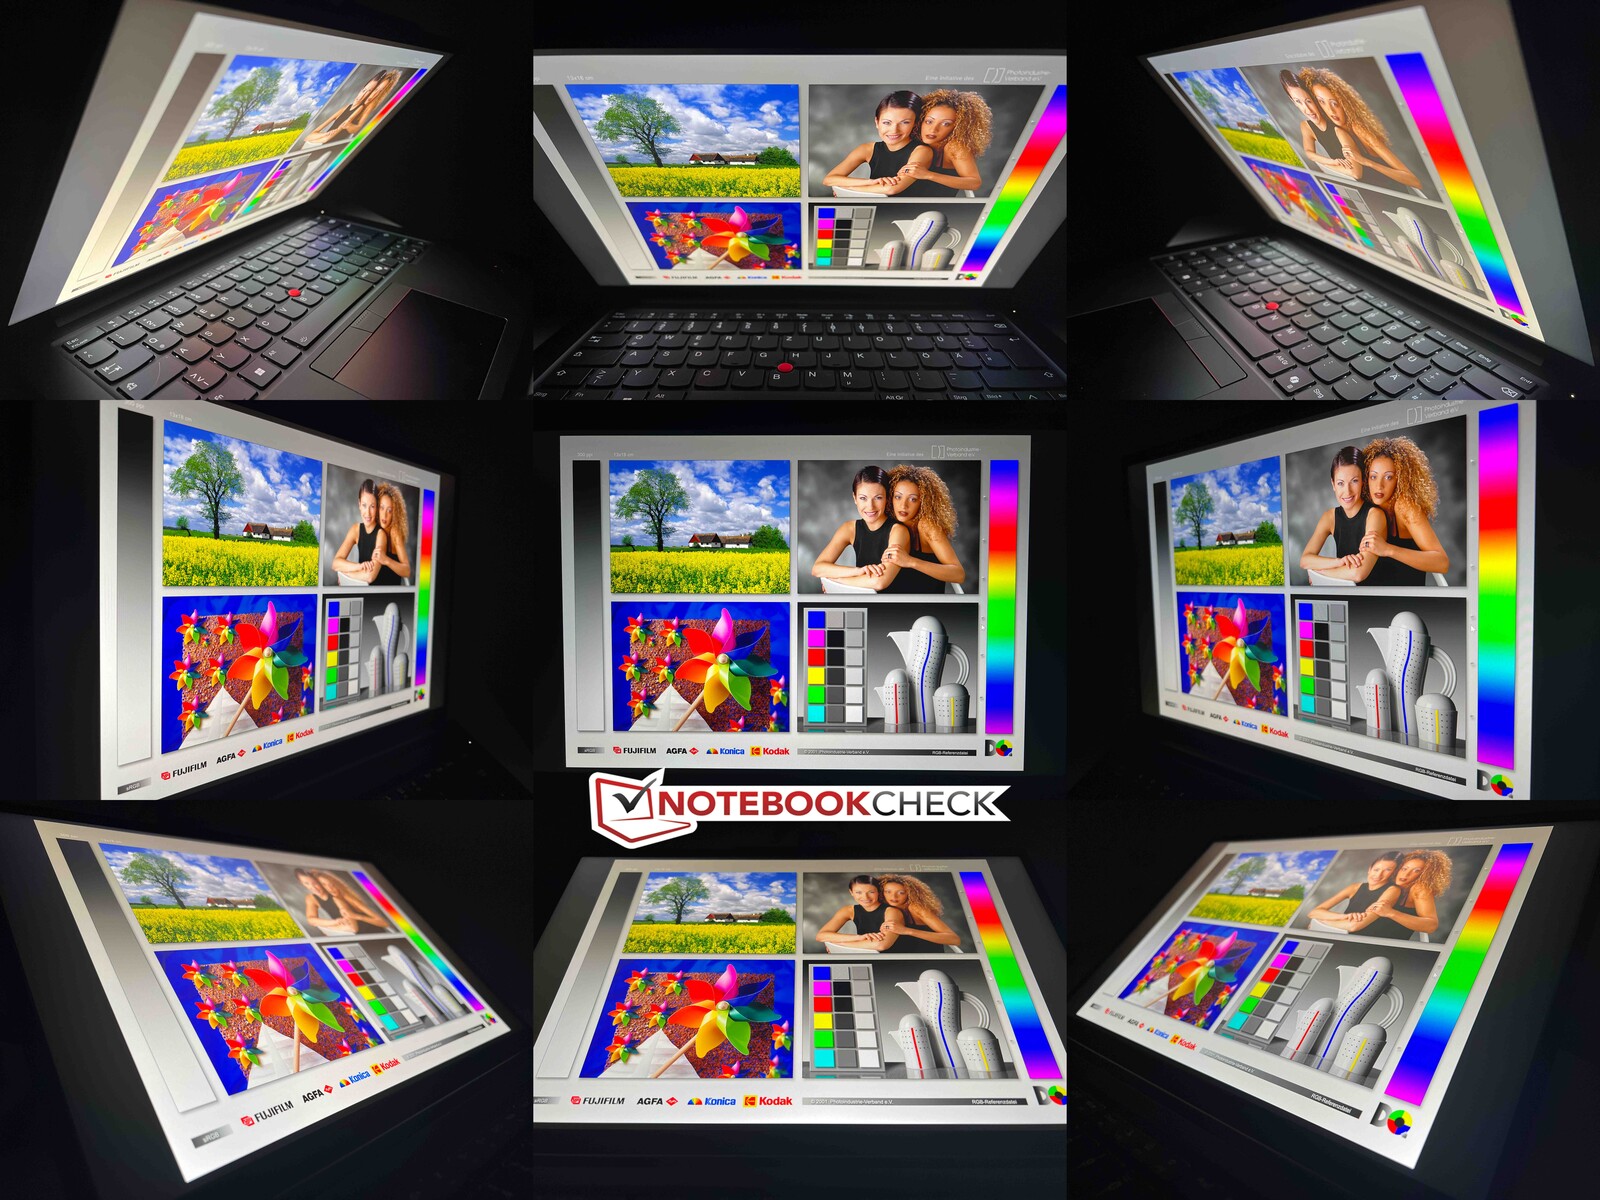
Matowy panel dobrze radzi sobie na zewnątrz, ale jego jasność mogłaby być nieco lepsza w bardzo jasne dni. Stabilność kąta widzenia panelu IPS jest dobra.
Wydajność - Meteor Lake i RTX 500 Ada
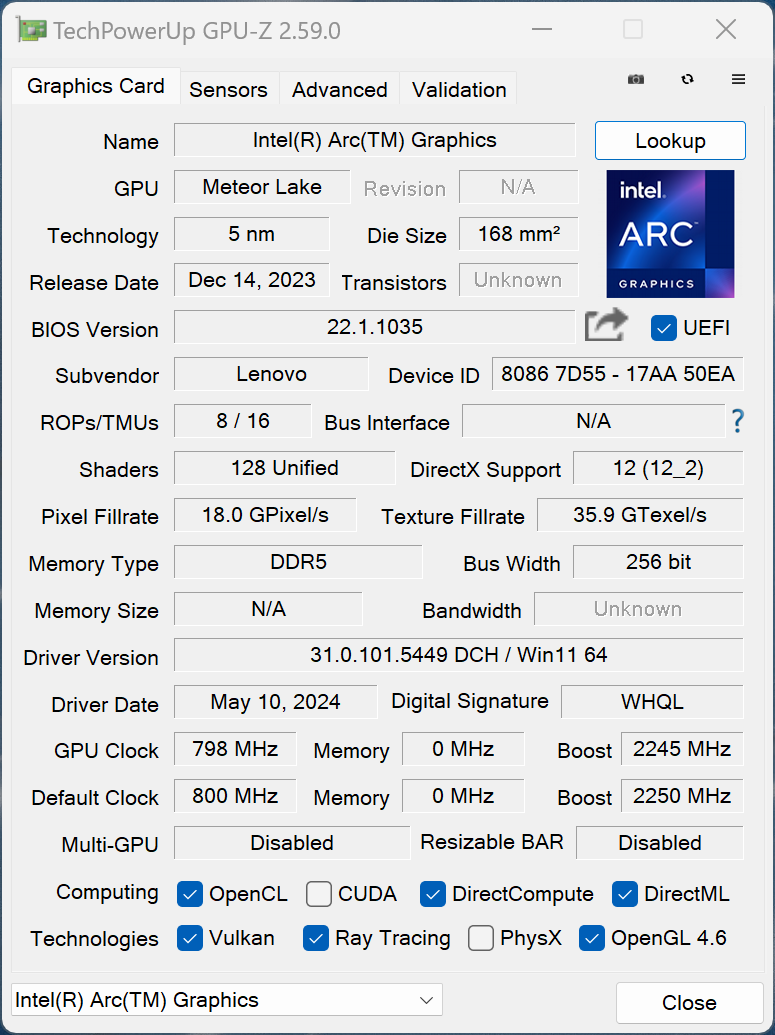
Wersja ThinkPad P14s G5 od Intela jest dostępna tylko z procesorami Meteor Lake. Jeśli chodzi o GPU, mogą Państwo wybrać pomiędzy zintegrowanym Intel Arc Graphics a dedykowaną kartą graficzną Nvidia RTX 500 Ada. Z drugiej strony, wersja AMD P14s G5 ze starą konstrukcją jest dostępna tylko z iGPU.
Warunki testowania
Lenovo od dawna łączy własne profile energetyczne ThinkPad bezpośrednio z ustawieniami zasilania systemu Windows. Poniższa tabela podsumowuje odpowiednie ustawienia TDP/TGP. Przeprowadziliśmy testy porównawcze i pomiary przy użyciu najlepszej wydajności, która jest ustawiona domyślnie.
| Tryb wydajności | TDP CPU | CB R23 Multi | GPU TGP | Time Spy grafika | Test obciążeniowy | maks. emisja hałasu wentylatora |
|---|---|---|---|---|---|---|
| Najlepsza oszczędność energii | 80/30 watów | 12,089 punktów | 35 watów | 4,848 punktów | CPU: 15 watów GPU: 35 watów |
38,3 dB(A) |
| Zrównoważony | 80/40 watów | 17 620 punktów | 40 watów | 4 981 punktów | CPU: 17 watów GPU: 35 W |
44,8 dB(A) |
| Najlepsza wydajność | 80/50 watów | 17,612 punktów | 50 watów | 5,278 punktów | CPU: 25 watów GPU: 35 W |
46,8 dB(A) |
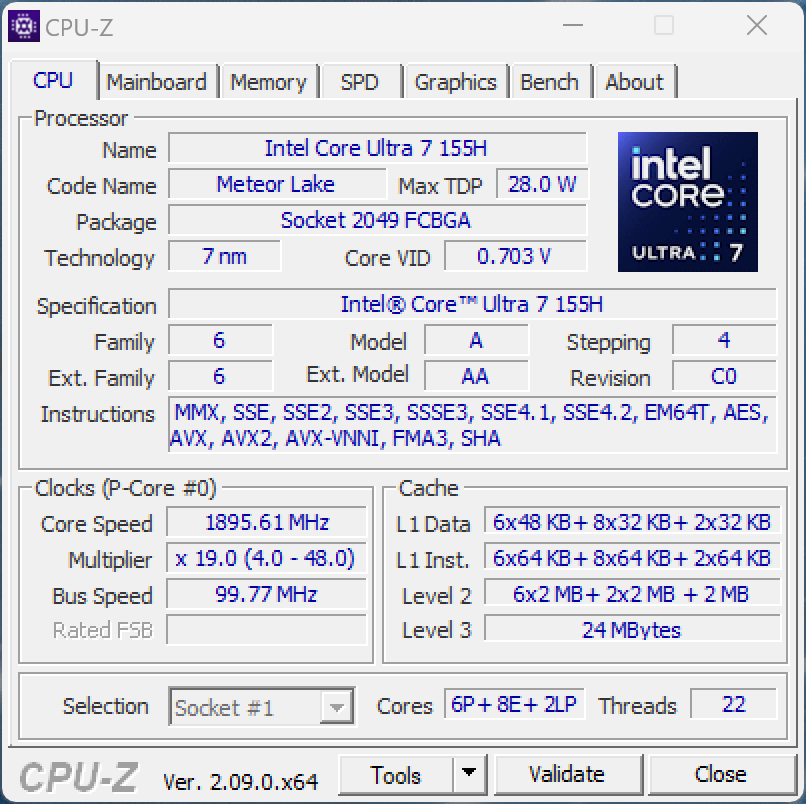
Procesor - Intel Core Ultra 7 155H
Procesor Core Ultra 7 155H jest częścią obecnej generacji Meteor Lake Intela i jest używany w wielu laptopach. Dzięki wysokim limitom mocy, wyniki benchmarków procesora były bardzo dobre i przewyższały zarówno Core i7-1370P, jak i AMD Ryzen 7 PRO 7840U AMD Ryzen 7 PRO 7840U w modelach P14s-G4. Nawet nominalnie szybszy Core Ultra 7 165H wewnątrz ZBook Firefly 14 G11 był wyraźnie wolniejszy. Należy jednak również wspomnieć, że stare układy Raptor Lake od Intela (np Core i7-13700H) oferowały wyższą wydajność jednordzeniową. W trybie bateryjnym procesor może zużywać maksymalnie 55 watów, dlatego też jego wydajność wielordzeniowa jest o 8% niższa. Więcej testów porównawczych procesorów można znaleźć w naszej sekcji technicznej.
Cinebench R15 Multi continuous test
Cinebench R23: Multi Core | Single Core
Cinebench R20: CPU (Multi Core) | CPU (Single Core)
Cinebench R15: CPU Multi 64Bit | CPU Single 64Bit
Blender: v2.79 BMW27 CPU
7-Zip 18.03: 7z b 4 | 7z b 4 -mmt1
Geekbench 6.4: Multi-Core | Single-Core
Geekbench 5.5: Multi-Core | Single-Core
HWBOT x265 Benchmark v2.2: 4k Preset
LibreOffice : 20 Documents To PDF
R Benchmark 2.5: Overall mean
| CPU Performance Rating | |
| Średnia w klasie Workstation | |
| Lenovo Yoga Pro 9-14IRP G8 | |
| Microsoft Surface Laptop Studio 2 RTX 4060 | |
| Lenovo ThinkPad P14s G5 21G3S00A00 | |
| Dell Precision 5000 5490 | |
| Lenovo ThinkPad P14s G4 21HF0017GE | |
| Przeciętny Intel Core Ultra 7 155H | |
| HP ZBook Firefly 14 G11 | |
| Lenovo ThinkPad P14s G4 21K5000LGE | |
| Cinebench R23 / Multi Core | |
| Średnia w klasie Workstation (11507 - 30706, n=25, ostatnie 2 lata) | |
| Lenovo Yoga Pro 9-14IRP G8 | |
| Lenovo ThinkPad P14s G5 21G3S00A00 | |
| Dell Precision 5000 5490 | |
| Microsoft Surface Laptop Studio 2 RTX 4060 | |
| Przeciętny Intel Core Ultra 7 155H (9769 - 19007, n=52) | |
| Lenovo ThinkPad P14s G4 21HF0017GE | |
| HP ZBook Firefly 14 G11 | |
| Lenovo ThinkPad P14s G4 21K5000LGE | |
| Cinebench R23 / Single Core | |
| Lenovo ThinkPad P14s G4 21HF0017GE | |
| Microsoft Surface Laptop Studio 2 RTX 4060 | |
| Średnia w klasie Workstation (1581 - 2178, n=25, ostatnie 2 lata) | |
| Lenovo Yoga Pro 9-14IRP G8 | |
| Lenovo ThinkPad P14s G5 21G3S00A00 | |
| Dell Precision 5000 5490 | |
| HP ZBook Firefly 14 G11 | |
| Przeciętny Intel Core Ultra 7 155H (1496 - 1815, n=52) | |
| Lenovo ThinkPad P14s G4 21K5000LGE | |
| Cinebench R20 / CPU (Multi Core) | |
| Średnia w klasie Workstation (4530 - 11816, n=25, ostatnie 2 lata) | |
| Lenovo Yoga Pro 9-14IRP G8 | |
| Lenovo ThinkPad P14s G5 21G3S00A00 | |
| Dell Precision 5000 5490 | |
| Microsoft Surface Laptop Studio 2 RTX 4060 | |
| Przeciętny Intel Core Ultra 7 155H (3798 - 7409, n=50) | |
| Lenovo ThinkPad P14s G4 21HF0017GE | |
| Lenovo ThinkPad P14s G4 21K5000LGE | |
| HP ZBook Firefly 14 G11 | |
| Cinebench R20 / CPU (Single Core) | |
| Microsoft Surface Laptop Studio 2 RTX 4060 | |
| Lenovo ThinkPad P14s G4 21HF0017GE | |
| Lenovo Yoga Pro 9-14IRP G8 | |
| Średnia w klasie Workstation (612 - 827, n=25, ostatnie 2 lata) | |
| Lenovo ThinkPad P14s G5 21G3S00A00 | |
| Dell Precision 5000 5490 | |
| HP ZBook Firefly 14 G11 | |
| Przeciętny Intel Core Ultra 7 155H (601 - 696, n=50) | |
| Lenovo ThinkPad P14s G4 21K5000LGE | |
| Cinebench R15 / CPU Multi 64Bit | |
| Średnia w klasie Workstation (1863 - 4784, n=25, ostatnie 2 lata) | |
| Dell Precision 5000 5490 | |
| Lenovo Yoga Pro 9-14IRP G8 | |
| Lenovo ThinkPad P14s G5 21G3S00A00 | |
| Microsoft Surface Laptop Studio 2 RTX 4060 | |
| HP ZBook Firefly 14 G11 | |
| Przeciętny Intel Core Ultra 7 155H (1932 - 2880, n=56) | |
| Lenovo ThinkPad P14s G4 21HF0017GE | |
| Lenovo ThinkPad P14s G4 21K5000LGE | |
| Cinebench R15 / CPU Single 64Bit | |
| Microsoft Surface Laptop Studio 2 RTX 4060 | |
| Lenovo Yoga Pro 9-14IRP G8 | |
| Średnia w klasie Workstation (167 - 307, n=25, ostatnie 2 lata) | |
| Lenovo ThinkPad P14s G4 21K5000LGE | |
| Lenovo ThinkPad P14s G5 21G3S00A00 | |
| Lenovo ThinkPad P14s G4 21HF0017GE | |
| HP ZBook Firefly 14 G11 | |
| Dell Precision 5000 5490 | |
| Przeciętny Intel Core Ultra 7 155H (99.6 - 268, n=52) | |
| Blender / v2.79 BMW27 CPU | |
| HP ZBook Firefly 14 G11 | |
| Lenovo ThinkPad P14s G4 21HF0017GE | |
| Microsoft Surface Laptop Studio 2 RTX 4060 | |
| Lenovo ThinkPad P14s G4 21K5000LGE | |
| Przeciętny Intel Core Ultra 7 155H (175 - 381, n=47) | |
| Dell Precision 5000 5490 | |
| Lenovo ThinkPad P14s G5 21G3S00A00 | |
| Średnia w klasie Workstation (102 - 270, n=25, ostatnie 2 lata) | |
| Lenovo Yoga Pro 9-14IRP G8 | |
| 7-Zip 18.03 / 7z b 4 | |
| Średnia w klasie Workstation (51096 - 109760, n=25, ostatnie 2 lata) | |
| Lenovo Yoga Pro 9-14IRP G8 | |
| Lenovo ThinkPad P14s G5 21G3S00A00 | |
| Dell Precision 5000 5490 | |
| Microsoft Surface Laptop Studio 2 RTX 4060 | |
| Przeciętny Intel Core Ultra 7 155H (41739 - 70254, n=50) | |
| Lenovo ThinkPad P14s G4 21K5000LGE | |
| HP ZBook Firefly 14 G11 | |
| Lenovo ThinkPad P14s G4 21HF0017GE | |
| 7-Zip 18.03 / 7z b 4 -mmt1 | |
| Microsoft Surface Laptop Studio 2 RTX 4060 | |
| Lenovo ThinkPad P14s G4 21HF0017GE | |
| Średnia w klasie Workstation (4981 - 6960, n=25, ostatnie 2 lata) | |
| Lenovo Yoga Pro 9-14IRP G8 | |
| Lenovo ThinkPad P14s G4 21K5000LGE | |
| Lenovo ThinkPad P14s G5 21G3S00A00 | |
| Dell Precision 5000 5490 | |
| HP ZBook Firefly 14 G11 | |
| Przeciętny Intel Core Ultra 7 155H (4594 - 5621, n=50) | |
| Geekbench 6.4 / Multi-Core | |
| Lenovo Yoga Pro 9-14IRP G8 | |
| Lenovo Yoga Pro 9-14IRP G8 | |
| Dell Precision 5000 5490 | |
| Microsoft Surface Laptop Studio 2 RTX 4060 | |
| Średnia w klasie Workstation (10200 - 16855, n=23, ostatnie 2 lata) | |
| Lenovo ThinkPad P14s G5 21G3S00A00 | |
| Lenovo ThinkPad P14s G4 21HF0017GE | |
| Przeciętny Intel Core Ultra 7 155H (7732 - 13656, n=55) | |
| HP ZBook Firefly 14 G11 | |
| Lenovo ThinkPad P14s G4 21K5000LGE | |
| Geekbench 6.4 / Single-Core | |
| Lenovo ThinkPad P14s G4 21HF0017GE | |
| Microsoft Surface Laptop Studio 2 RTX 4060 | |
| Lenovo Yoga Pro 9-14IRP G8 | |
| Lenovo Yoga Pro 9-14IRP G8 | |
| Średnia w klasie Workstation (2352 - 2949, n=23, ostatnie 2 lata) | |
| Lenovo ThinkPad P14s G4 21K5000LGE | |
| Lenovo ThinkPad P14s G5 21G3S00A00 | |
| HP ZBook Firefly 14 G11 | |
| Dell Precision 5000 5490 | |
| Przeciętny Intel Core Ultra 7 155H (1901 - 2473, n=52) | |
| Geekbench 5.5 / Multi-Core | |
| Lenovo Yoga Pro 9-14IRP G8 | |
| Średnia w klasie Workstation (8863 - 19316, n=25, ostatnie 2 lata) | |
| Lenovo ThinkPad P14s G5 21G3S00A00 | |
| Microsoft Surface Laptop Studio 2 RTX 4060 | |
| Dell Precision 5000 5490 | |
| HP ZBook Firefly 14 G11 | |
| Przeciętny Intel Core Ultra 7 155H (10017 - 13556, n=52) | |
| Lenovo ThinkPad P14s G4 21HF0017GE | |
| Lenovo ThinkPad P14s G4 21K5000LGE | |
| Geekbench 5.5 / Single-Core | |
| Średnia w klasie Workstation (1740 - 2095, n=25, ostatnie 2 lata) | |
| Lenovo Yoga Pro 9-14IRP G8 | |
| Microsoft Surface Laptop Studio 2 RTX 4060 | |
| Lenovo ThinkPad P14s G4 21HF0017GE | |
| Lenovo ThinkPad P14s G5 21G3S00A00 | |
| HP ZBook Firefly 14 G11 | |
| Dell Precision 5000 5490 | |
| Przeciętny Intel Core Ultra 7 155H (1462 - 1824, n=52) | |
| Lenovo ThinkPad P14s G4 21K5000LGE | |
| HWBOT x265 Benchmark v2.2 / 4k Preset | |
| Średnia w klasie Workstation (14.4 - 33, n=25, ostatnie 2 lata) | |
| Lenovo ThinkPad P14s G5 21G3S00A00 | |
| Lenovo Yoga Pro 9-14IRP G8 | |
| Microsoft Surface Laptop Studio 2 RTX 4060 | |
| Dell Precision 5000 5490 | |
| Lenovo ThinkPad P14s G4 21K5000LGE | |
| Przeciętny Intel Core Ultra 7 155H (9.93 - 21.2, n=50) | |
| Lenovo ThinkPad P14s G4 21HF0017GE | |
| HP ZBook Firefly 14 G11 | |
| LibreOffice / 20 Documents To PDF | |
| Lenovo ThinkPad P14s G4 21K5000LGE | |
| HP ZBook Firefly 14 G11 | |
| Lenovo ThinkPad P14s G5 21G3S00A00 | |
| Przeciętny Intel Core Ultra 7 155H (37.5 - 79.2, n=49) | |
| Lenovo Yoga Pro 9-14IRP G8 | |
| Średnia w klasie Workstation (36.5 - 56.9, n=25, ostatnie 2 lata) | |
| Microsoft Surface Laptop Studio 2 RTX 4060 | |
| Lenovo ThinkPad P14s G4 21HF0017GE | |
| Dell Precision 5000 5490 | |
| R Benchmark 2.5 / Overall mean | |
| Przeciętny Intel Core Ultra 7 155H (0.4457 - 0.53, n=49) | |
| Lenovo ThinkPad P14s G4 21K5000LGE | |
| Dell Precision 5000 5490 | |
| Lenovo ThinkPad P14s G5 21G3S00A00 | |
| HP ZBook Firefly 14 G11 | |
| Średnia w klasie Workstation (0.3825 - 0.4888, n=25, ostatnie 2 lata) | |
| Microsoft Surface Laptop Studio 2 RTX 4060 | |
| Lenovo ThinkPad P14s G4 21HF0017GE | |
| Lenovo Yoga Pro 9-14IRP G8 | |
* ... im mniej tym lepiej
AIDA64: FP32 Ray-Trace | FPU Julia | CPU SHA3 | CPU Queen | FPU SinJulia | FPU Mandel | CPU AES | CPU ZLib | FP64 Ray-Trace | CPU PhotoWorxx
| Performance Rating | |
| Średnia w klasie Workstation | |
| Lenovo Yoga Pro 9-14IRP G8 | |
| Lenovo ThinkPad P14s G5 21G3S00A00 | |
| Dell Precision 5000 5490 | |
| Przeciętny Intel Core Ultra 7 155H | |
| Microsoft Surface Laptop Studio 2 RTX 4060 | |
| Lenovo ThinkPad P14s G4 21HF0017GE | |
| HP ZBook Firefly 14 G11 | |
| AIDA64 / FP32 Ray-Trace | |
| Średnia w klasie Workstation (10658 - 61611, n=25, ostatnie 2 lata) | |
| Lenovo Yoga Pro 9-14IRP G8 | |
| Lenovo ThinkPad P14s G5 21G3S00A00 | |
| Dell Precision 5000 5490 | |
| Przeciętny Intel Core Ultra 7 155H (6670 - 18470, n=50) | |
| Microsoft Surface Laptop Studio 2 RTX 4060 | |
| Lenovo ThinkPad P14s G4 21HF0017GE | |
| HP ZBook Firefly 14 G11 | |
| AIDA64 / FPU Julia | |
| Średnia w klasie Workstation (56664 - 183843, n=25, ostatnie 2 lata) | |
| Lenovo ThinkPad P14s G5 21G3S00A00 | |
| Lenovo Yoga Pro 9-14IRP G8 | |
| Dell Precision 5000 5490 | |
| Microsoft Surface Laptop Studio 2 RTX 4060 | |
| Przeciętny Intel Core Ultra 7 155H (40905 - 93181, n=50) | |
| Lenovo ThinkPad P14s G4 21HF0017GE | |
| HP ZBook Firefly 14 G11 | |
| AIDA64 / CPU SHA3 | |
| Średnia w klasie Workstation (2608 - 8341, n=25, ostatnie 2 lata) | |
| Dell Precision 5000 5490 | |
| Lenovo ThinkPad P14s G5 21G3S00A00 | |
| Lenovo Yoga Pro 9-14IRP G8 | |
| Przeciętny Intel Core Ultra 7 155H (1940 - 4436, n=50) | |
| Microsoft Surface Laptop Studio 2 RTX 4060 | |
| Lenovo ThinkPad P14s G4 21HF0017GE | |
| HP ZBook Firefly 14 G11 | |
| AIDA64 / CPU Queen | |
| Średnia w klasie Workstation (84022 - 144411, n=25, ostatnie 2 lata) | |
| Lenovo Yoga Pro 9-14IRP G8 | |
| Microsoft Surface Laptop Studio 2 RTX 4060 | |
| Lenovo ThinkPad P14s G4 21HF0017GE | |
| Dell Precision 5000 5490 | |
| HP ZBook Firefly 14 G11 | |
| Lenovo ThinkPad P14s G5 21G3S00A00 | |
| Przeciętny Intel Core Ultra 7 155H (64698 - 94181, n=50) | |
| AIDA64 / FPU SinJulia | |
| Średnia w klasie Workstation (7906 - 29343, n=25, ostatnie 2 lata) | |
| Lenovo Yoga Pro 9-14IRP G8 | |
| Lenovo ThinkPad P14s G5 21G3S00A00 | |
| Dell Precision 5000 5490 | |
| Przeciętny Intel Core Ultra 7 155H (5639 - 10647, n=50) | |
| Microsoft Surface Laptop Studio 2 RTX 4060 | |
| HP ZBook Firefly 14 G11 | |
| Lenovo ThinkPad P14s G4 21HF0017GE | |
| AIDA64 / FPU Mandel | |
| Średnia w klasie Workstation (27301 - 97385, n=25, ostatnie 2 lata) | |
| Lenovo Yoga Pro 9-14IRP G8 | |
| Lenovo ThinkPad P14s G5 21G3S00A00 | |
| Dell Precision 5000 5490 | |
| Przeciętny Intel Core Ultra 7 155H (18236 - 47685, n=50) | |
| Microsoft Surface Laptop Studio 2 RTX 4060 | |
| Lenovo ThinkPad P14s G4 21HF0017GE | |
| HP ZBook Firefly 14 G11 | |
| AIDA64 / CPU AES | |
| Średnia w klasie Workstation (56077 - 187841, n=25, ostatnie 2 lata) | |
| Lenovo ThinkPad P14s G5 21G3S00A00 | |
| Przeciętny Intel Core Ultra 7 155H (45713 - 152179, n=50) | |
| Dell Precision 5000 5490 | |
| Lenovo Yoga Pro 9-14IRP G8 | |
| Microsoft Surface Laptop Studio 2 RTX 4060 | |
| Lenovo ThinkPad P14s G4 21HF0017GE | |
| HP ZBook Firefly 14 G11 | |
| AIDA64 / CPU ZLib | |
| Średnia w klasie Workstation (742 - 2057, n=25, ostatnie 2 lata) | |
| Lenovo ThinkPad P14s G5 21G3S00A00 | |
| Lenovo Yoga Pro 9-14IRP G8 | |
| Dell Precision 5000 5490 | |
| Przeciętny Intel Core Ultra 7 155H (557 - 1250, n=50) | |
| Microsoft Surface Laptop Studio 2 RTX 4060 | |
| Lenovo ThinkPad P14s G4 21HF0017GE | |
| HP ZBook Firefly 14 G11 | |
| AIDA64 / FP64 Ray-Trace | |
| Średnia w klasie Workstation (5580 - 32891, n=25, ostatnie 2 lata) | |
| Lenovo Yoga Pro 9-14IRP G8 | |
| Lenovo ThinkPad P14s G5 21G3S00A00 | |
| Dell Precision 5000 5490 | |
| Microsoft Surface Laptop Studio 2 RTX 4060 | |
| Przeciętny Intel Core Ultra 7 155H (3569 - 9802, n=50) | |
| Lenovo ThinkPad P14s G4 21HF0017GE | |
| HP ZBook Firefly 14 G11 | |
| AIDA64 / CPU PhotoWorxx | |
| Lenovo Yoga Pro 9-14IRP G8 | |
| Dell Precision 5000 5490 | |
| Lenovo ThinkPad P14s G5 21G3S00A00 | |
| Przeciętny Intel Core Ultra 7 155H (32719 - 54223, n=50) | |
| HP ZBook Firefly 14 G11 | |
| Średnia w klasie Workstation (24325 - 93684, n=25, ostatnie 2 lata) | |
| Microsoft Surface Laptop Studio 2 RTX 4060 | |
| Lenovo ThinkPad P14s G4 21HF0017GE | |
Wydajność systemu
ThinkPad P14s G5 to superszybki laptop, co potwierdziły również syntetyczne benchmarki. Chociaż inne urządzenia były czasami nawet szybsze podczas tego testu, ogólne różnice są niewielkie, a wszystkie dane wejściowe są szybko przetwarzane przez system. Ponadto nie mieliśmy żadnych problemów ze stabilnością systemu podczas testu.
CrossMark: Overall | Productivity | Creativity | Responsiveness
WebXPRT 3: Overall
WebXPRT 4: Overall
Mozilla Kraken 1.1: Total
| PCMark 10 / Score | |
| Średnia w klasie Workstation (6336 - 8587, n=25, ostatnie 2 lata) | |
| Lenovo Yoga Pro 9-14IRP G8 | |
| Dell Precision 5000 5490 | |
| Microsoft Surface Laptop Studio 2 RTX 4060 | |
| Lenovo ThinkPad P14s G4 21HF0017GE | |
| Lenovo ThinkPad P14s G5 21G3S00A00 | |
| Przeciętny Intel Core Ultra 7 155H, Nvidia RTX 500 Ada Generation Laptop GPU (n=1) | |
| HP ZBook Firefly 14 G11 | |
| PCMark 10 / Essentials | |
| Lenovo Yoga Pro 9-14IRP G8 | |
| Dell Precision 5000 5490 | |
| Lenovo ThinkPad P14s G5 21G3S00A00 | |
| Przeciętny Intel Core Ultra 7 155H, Nvidia RTX 500 Ada Generation Laptop GPU (n=1) | |
| Średnia w klasie Workstation (9647 - 12197, n=25, ostatnie 2 lata) | |
| Microsoft Surface Laptop Studio 2 RTX 4060 | |
| Lenovo ThinkPad P14s G4 21HF0017GE | |
| HP ZBook Firefly 14 G11 | |
| PCMark 10 / Productivity | |
| Lenovo ThinkPad P14s G4 21HF0017GE | |
| Średnia w klasie Workstation (8829 - 10820, n=25, ostatnie 2 lata) | |
| HP ZBook Firefly 14 G11 | |
| Lenovo ThinkPad P14s G5 21G3S00A00 | |
| Przeciętny Intel Core Ultra 7 155H, Nvidia RTX 500 Ada Generation Laptop GPU (n=1) | |
| Microsoft Surface Laptop Studio 2 RTX 4060 | |
| Dell Precision 5000 5490 | |
| Lenovo Yoga Pro 9-14IRP G8 | |
| PCMark 10 / Digital Content Creation | |
| Średnia w klasie Workstation (7589 - 15093, n=25, ostatnie 2 lata) | |
| Lenovo Yoga Pro 9-14IRP G8 | |
| Microsoft Surface Laptop Studio 2 RTX 4060 | |
| Dell Precision 5000 5490 | |
| Lenovo ThinkPad P14s G5 21G3S00A00 | |
| Przeciętny Intel Core Ultra 7 155H, Nvidia RTX 500 Ada Generation Laptop GPU (n=1) | |
| Lenovo ThinkPad P14s G4 21HF0017GE | |
| HP ZBook Firefly 14 G11 | |
| CrossMark / Overall | |
| Lenovo Yoga Pro 9-14IRP G8 | |
| Lenovo ThinkPad P14s G4 21HF0017GE | |
| Średnia w klasie Workstation (1574 - 2037, n=23, ostatnie 2 lata) | |
| Dell Precision 5000 5490 | |
| Microsoft Surface Laptop Studio 2 RTX 4060 | |
| Lenovo ThinkPad P14s G5 21G3S00A00 | |
| Przeciętny Intel Core Ultra 7 155H, Nvidia RTX 500 Ada Generation Laptop GPU (n=1) | |
| HP ZBook Firefly 14 G11 | |
| CrossMark / Productivity | |
| Lenovo Yoga Pro 9-14IRP G8 | |
| Lenovo ThinkPad P14s G4 21HF0017GE | |
| Średnia w klasie Workstation (1546 - 1902, n=23, ostatnie 2 lata) | |
| Dell Precision 5000 5490 | |
| Microsoft Surface Laptop Studio 2 RTX 4060 | |
| HP ZBook Firefly 14 G11 | |
| Lenovo ThinkPad P14s G5 21G3S00A00 | |
| Przeciętny Intel Core Ultra 7 155H, Nvidia RTX 500 Ada Generation Laptop GPU (n=1) | |
| CrossMark / Creativity | |
| Lenovo Yoga Pro 9-14IRP G8 | |
| Lenovo ThinkPad P14s G4 21HF0017GE | |
| Średnia w klasie Workstation (1655 - 2412, n=23, ostatnie 2 lata) | |
| Microsoft Surface Laptop Studio 2 RTX 4060 | |
| Dell Precision 5000 5490 | |
| HP ZBook Firefly 14 G11 | |
| Lenovo ThinkPad P14s G5 21G3S00A00 | |
| Przeciętny Intel Core Ultra 7 155H, Nvidia RTX 500 Ada Generation Laptop GPU (n=1) | |
| CrossMark / Responsiveness | |
| Lenovo ThinkPad P14s G4 21HF0017GE | |
| Lenovo Yoga Pro 9-14IRP G8 | |
| Średnia w klasie Workstation (1304 - 1730, n=23, ostatnie 2 lata) | |
| Lenovo ThinkPad P14s G5 21G3S00A00 | |
| Przeciętny Intel Core Ultra 7 155H, Nvidia RTX 500 Ada Generation Laptop GPU (n=1) | |
| Dell Precision 5000 5490 | |
| Microsoft Surface Laptop Studio 2 RTX 4060 | |
| HP ZBook Firefly 14 G11 | |
| WebXPRT 3 / Overall | |
| Lenovo Yoga Pro 9-14IRP G8 | |
| Średnia w klasie Workstation (259 - 415, n=26, ostatnie 2 lata) | |
| Microsoft Surface Laptop Studio 2 RTX 4060 | |
| Lenovo ThinkPad P14s G4 21HF0017GE | |
| HP ZBook Firefly 14 G11 | |
| Dell Precision 5000 5490 | |
| Lenovo ThinkPad P14s G5 21G3S00A00 | |
| Przeciętny Intel Core Ultra 7 155H, Nvidia RTX 500 Ada Generation Laptop GPU (n=1) | |
| WebXPRT 4 / Overall | |
| Microsoft Surface Laptop Studio 2 RTX 4060 | |
| Lenovo Yoga Pro 9-14IRP G8 | |
| Lenovo ThinkPad P14s G4 21HF0017GE | |
| Lenovo ThinkPad P14s G4 21HF0017GE | |
| Dell Precision 5000 5490 | |
| Średnia w klasie Workstation (199.4 - 338, n=22, ostatnie 2 lata) | |
| HP ZBook Firefly 14 G11 | |
| Lenovo ThinkPad P14s G5 21G3S00A00 | |
| Przeciętny Intel Core Ultra 7 155H, Nvidia RTX 500 Ada Generation Laptop GPU (n=1) | |
| Mozilla Kraken 1.1 / Total | |
| Lenovo ThinkPad P14s G5 21G3S00A00 | |
| Przeciętny Intel Core Ultra 7 155H, Nvidia RTX 500 Ada Generation Laptop GPU (n=1) | |
| Dell Precision 5000 5490 | |
| HP ZBook Firefly 14 G11 | |
| Średnia w klasie Workstation (433 - 591, n=26, ostatnie 2 lata) | |
| Lenovo Yoga Pro 9-14IRP G8 | |
| Microsoft Surface Laptop Studio 2 RTX 4060 | |
| Lenovo ThinkPad P14s G4 21HF0017GE | |
* ... im mniej tym lepiej
| PCMark 10 Score | 6974 pkt. | |
Pomoc | ||
| AIDA64 / Memory Copy | |
| Dell Precision 5000 5490 | |
| Przeciętny Intel Core Ultra 7 155H (62397 - 96791, n=50) | |
| Lenovo Yoga Pro 9-14IRP G8 | |
| Lenovo ThinkPad P14s G5 21G3S00A00 | |
| HP ZBook Firefly 14 G11 | |
| Średnia w klasie Workstation (34323 - 158632, n=25, ostatnie 2 lata) | |
| Microsoft Surface Laptop Studio 2 RTX 4060 | |
| Lenovo ThinkPad P14s G4 21HF0017GE | |
| AIDA64 / Memory Read | |
| Dell Precision 5000 5490 | |
| Przeciętny Intel Core Ultra 7 155H (60544 - 90647, n=50) | |
| Lenovo ThinkPad P14s G5 21G3S00A00 | |
| HP ZBook Firefly 14 G11 | |
| Lenovo Yoga Pro 9-14IRP G8 | |
| Średnia w klasie Workstation (30787 - 121177, n=25, ostatnie 2 lata) | |
| Microsoft Surface Laptop Studio 2 RTX 4060 | |
| Lenovo ThinkPad P14s G4 21HF0017GE | |
| AIDA64 / Memory Write | |
| Dell Precision 5000 5490 | |
| Lenovo Yoga Pro 9-14IRP G8 | |
| Średnia w klasie Workstation (39166 - 212172, n=25, ostatnie 2 lata) | |
| Microsoft Surface Laptop Studio 2 RTX 4060 | |
| Lenovo ThinkPad P14s G5 21G3S00A00 | |
| Przeciętny Intel Core Ultra 7 155H (58692 - 93451, n=50) | |
| HP ZBook Firefly 14 G11 | |
| Lenovo ThinkPad P14s G4 21HF0017GE | |
| AIDA64 / Memory Latency | |
| Przeciętny Intel Core Ultra 7 155H (116.2 - 233, n=50) | |
| Dell Precision 5000 5490 | |
| HP ZBook Firefly 14 G11 | |
| Lenovo ThinkPad P14s G5 21G3S00A00 | |
| Średnia w klasie Workstation (83.4 - 165.2, n=25, ostatnie 2 lata) | |
| Lenovo ThinkPad P14s G4 21HF0017GE | |
| Lenovo Yoga Pro 9-14IRP G8 | |
| Microsoft Surface Laptop Studio 2 RTX 4060 | |
* ... im mniej tym lepiej
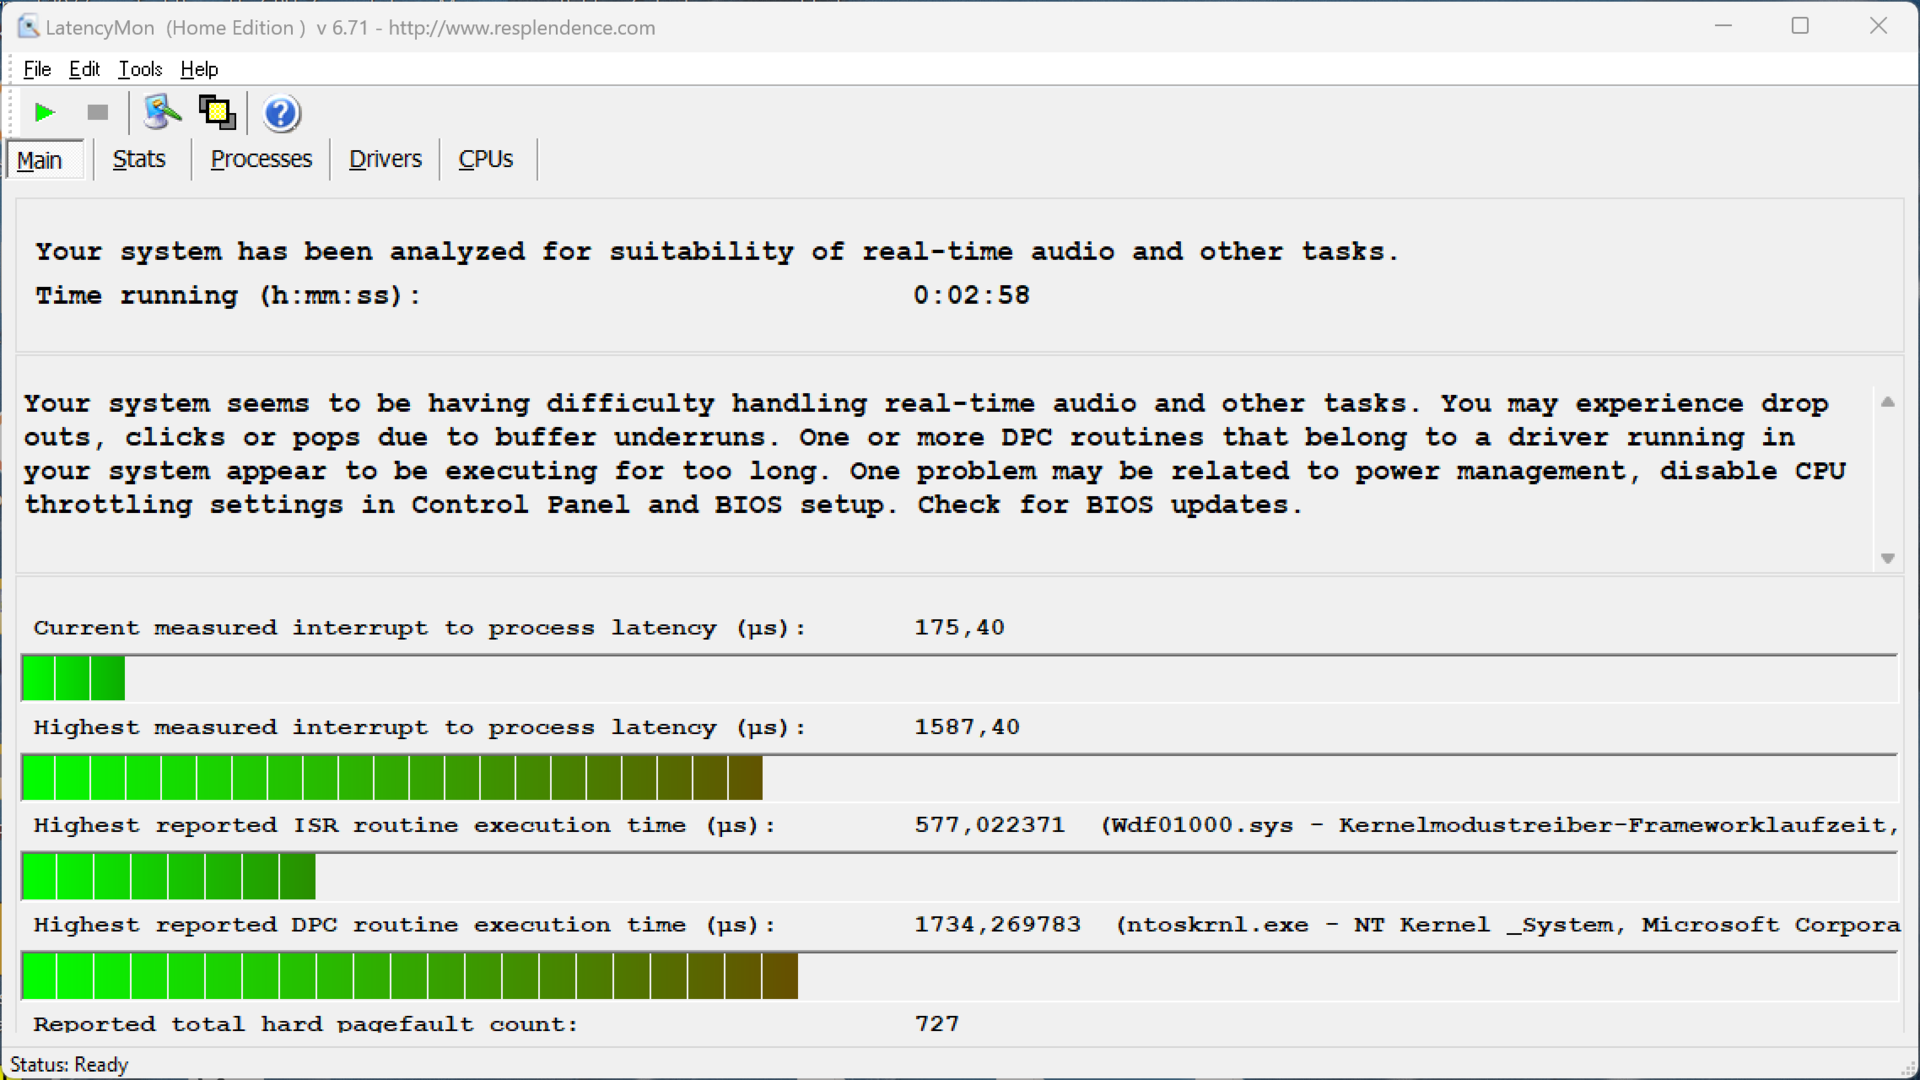
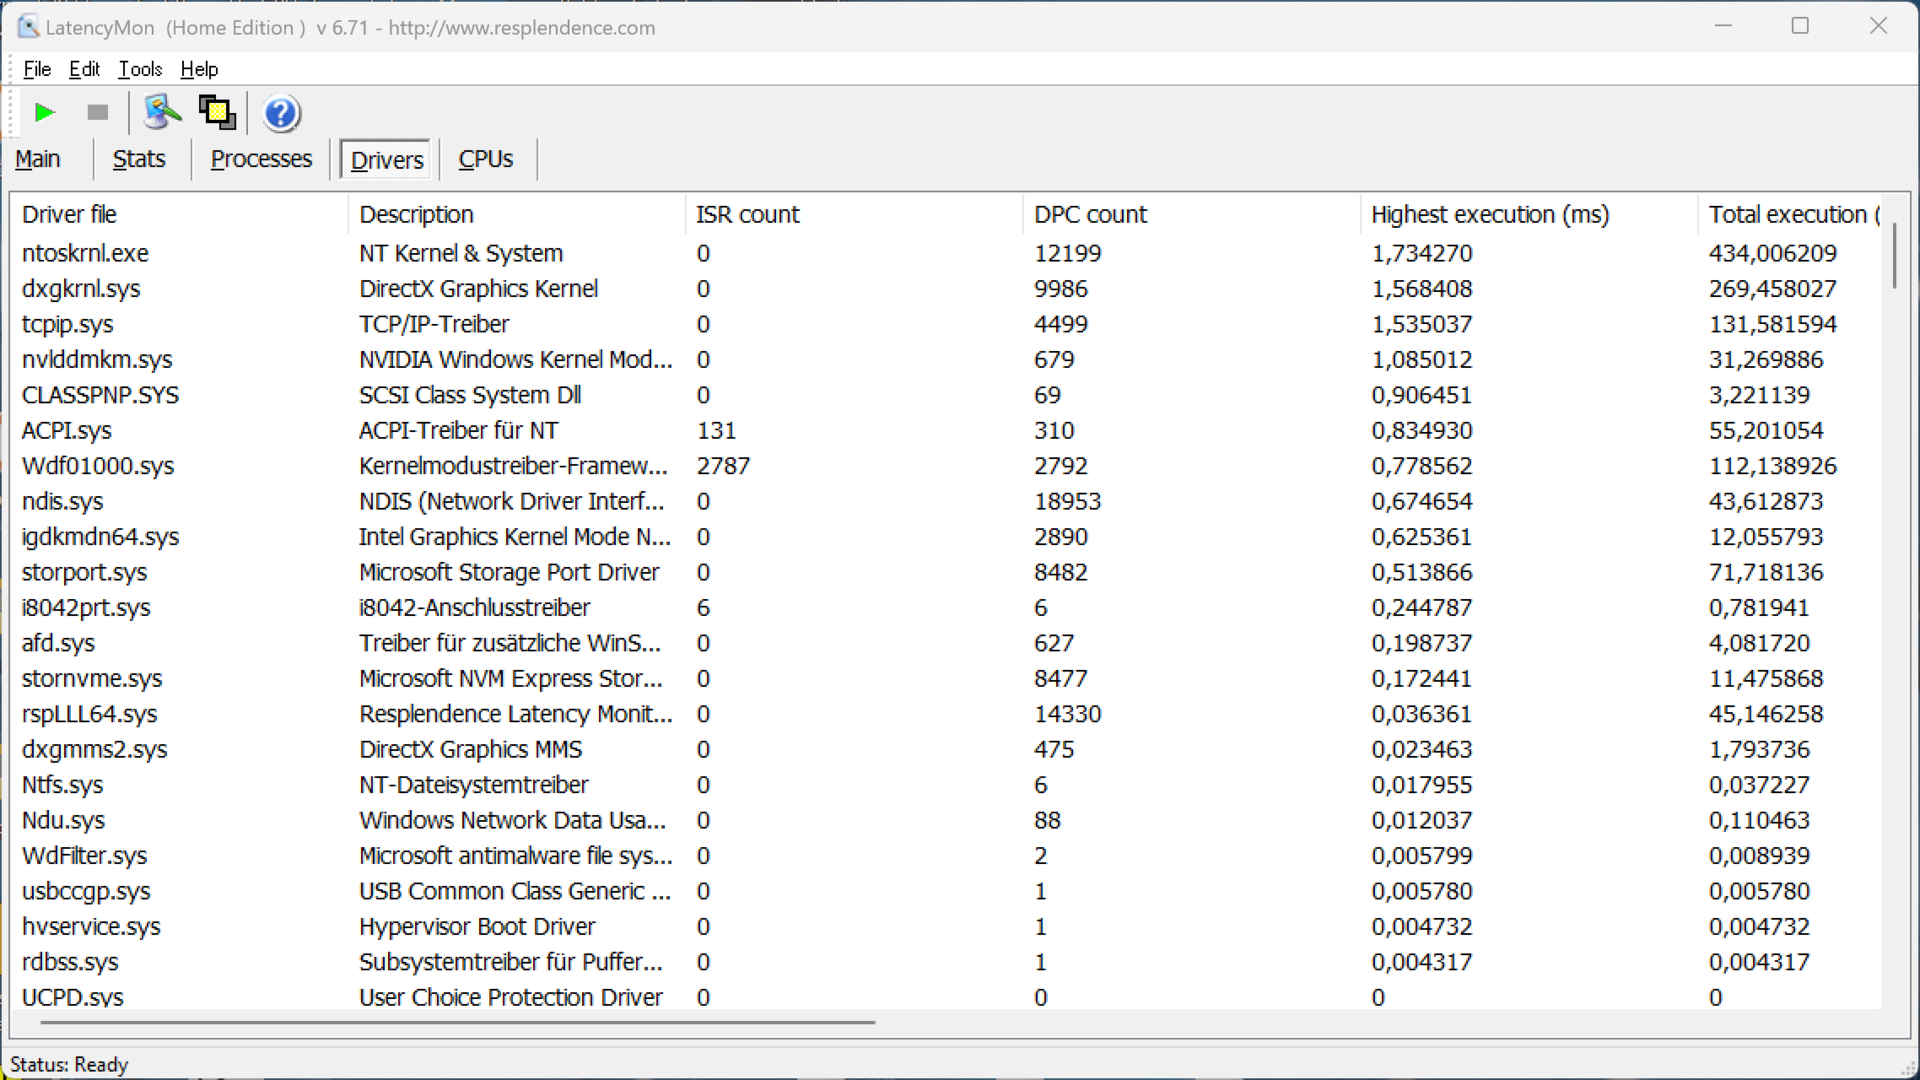
Opóźnienia DPC
W naszym standardowym teście opóźnień (surfowanie po sieci, wideo 4K na YouTube, obciążenie procesora), urządzenie testowe z aktualną wersją BIOS-u wykazało niewielkie ograniczenia podczas korzystania z aplikacji audio w czasie rzeczywistym.
| DPC Latencies / LatencyMon - interrupt to process latency (max), Web, Youtube, Prime95 | |
| Microsoft Surface Laptop Studio 2 RTX 4060 | |
| HP ZBook Firefly 14 G11 | |
| Dell Precision 5000 5490 | |
| Lenovo ThinkPad P14s G4 21HF0017GE | |
| Lenovo ThinkPad P14s G5 21G3S00A00 | |
| Lenovo Yoga Pro 9-14IRP G8 | |
* ... im mniej tym lepiej
Urządzenie pamięci masowej
P14s G5 posiada jeden slot M.2 2280, który jest podłączony przez PCIe 4.0. W naszym urządzeniu testowym zainstalowano wersję UMIS AM630 o pojemności 1 TB. Po pierwszym uruchomieniu urządzenia użytkownicy mają do dyspozycji 871 GB. Przy transferach sięgających 7 GB/s jego wydajność jest bardzo dobra - choć nie jest w stanie utrzymać tych wartości na stałym poziomie przy ciągłym obciążeniu. Ponieważ jednak wartości te nadal przekraczają 4 GB/s, użytkownicy nie powinni napotkać żadnych ograniczeń. Więcej testów porównawczych dysków SSD można znaleźć tutaj.

* ... im mniej tym lepiej
Reading continuous performance: DiskSpd Read Loop, Queue Depth 8
Karta graficzna - Nvidia RTX 500 Ada
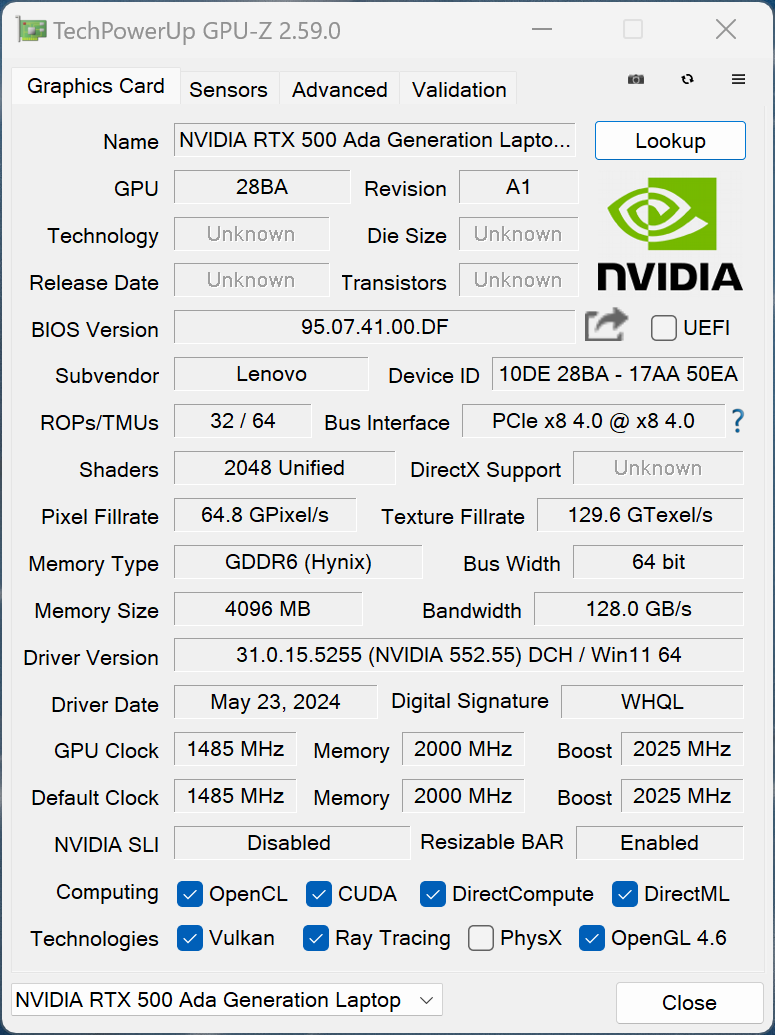
Opcjonalnie mogą Państwo nabyć P14s G5 z Nvidia RTX 500 Adaktóry jest obecnie najmniejszym profesjonalnym mobilnym procesorem graficznym firmy Nvidia. RTX 500 Ada bazuje na układzie AD107GLM z 2048 rdzeniami CUDA i 4 GB pamięci GDDR6 VRAM. Jest to zatem odchudzona wersja modelu RTX 1000 Ada a co za tym idzie, również GeForce RTX 4050 Laptop-z których oba są wyposażone w 2560 rdzeni CUDA i 6 GB pamięci VRAM. Wewnątrz ThinkPada P14s G5, RTX 500 Ada może zużywać maksymalnie 50 watów, a system obsługuje przełączanie grafiki za pomocą technologii Optimus firmy Nvidia. W porównaniu do modeli GeForce, profesjonalne GPU oferują certyfikaty ISV, które gwarantują maksymalną kompatybilność z profesjonalnymi aplikacjami.
W porównaniu do starego RTX A500 Laptop (który jest oparty na GeForce RTX 3050 i jest używany w obecnym ZBook Firefly 14 G11), jego wydajność zarówno w 3DMark, jak i profesjonalnych testach SPECviewperf była znacznie lepsza (50-80%), ale konsumencki GeForce RTX 4050 Laptop oferuje jeszcze większą wydajność 3D. Szkoda, że Lenovo nie oferuje również RTX 1000 Ada wewnątrz P14s G5.
Wydajność GPU pozostaje stabilna przy stałym obciążeniu i w trybie bateryjnym. Dalsze testy porównawcze GPU są dostępne tutaj.
| 3DMark 06 Standard Score | 50935 pkt. | |
| 3DMark Vantage P Result | 66297 pkt. | |
| 3DMark 11 Performance | 20426 pkt. | |
| 3DMark Fire Strike Score | 12761 pkt. | |
| 3DMark Time Spy Score | 5745 pkt. | |
| 3DMark Steel Nomad Score | 981 pkt. | |
| 3DMark Steel Nomad Light Score | 5441 pkt. | |
Pomoc | ||
| Performance Rating - Percent | |
| Dell Precision 5000 5490 -1! | |
| Lenovo ThinkPad P14s G5 21G3S00A00 | |
| Lenovo ThinkPad P14s G4 21HF0017GE -1! | |
| HP ZBook Firefly 14 G11 -1! | |
| Blender / v3.3 Classroom OPTIX/RTX | |
| HP ZBook Firefly 14 G11 | |
| Lenovo ThinkPad P14s G4 21HF0017GE | |
| Lenovo ThinkPad P14s G5 21G3S00A00 | |
| Przeciętny Nvidia RTX 500 Ada Generation Laptop GPU (n=1) | |
| Średnia w klasie Workstation (13 - 95, n=20, ostatnie 2 lata) | |
| Lenovo Yoga Pro 9-14IRP G8 | |
| Dell Precision 5000 5490 | |
| Microsoft Surface Laptop Studio 2 RTX 4060 | |
| Blender / v3.3 Classroom CUDA | |
| Lenovo ThinkPad P14s G4 21HF0017GE | |
| HP ZBook Firefly 14 G11 | |
| Lenovo ThinkPad P14s G5 21G3S00A00 | |
| Przeciętny Nvidia RTX 500 Ada Generation Laptop GPU (n=1) | |
| Średnia w klasie Workstation (18 - 155, n=20, ostatnie 2 lata) | |
| Lenovo Yoga Pro 9-14IRP G8 | |
| Dell Precision 5000 5490 | |
| Microsoft Surface Laptop Studio 2 RTX 4060 | |
| Blender / v3.3 Classroom CPU | |
| Lenovo ThinkPad P14s G4 21HF0017GE | |
| HP ZBook Firefly 14 G11 | |
| Microsoft Surface Laptop Studio 2 RTX 4060 | |
| Dell Precision 5000 5490 | |
| Lenovo ThinkPad P14s G5 21G3S00A00 | |
| Przeciętny Nvidia RTX 500 Ada Generation Laptop GPU (n=1) | |
| Lenovo Yoga Pro 9-14IRP G8 | |
| Średnia w klasie Workstation (159 - 472, n=25, ostatnie 2 lata) | |
* ... im mniej tym lepiej
Wydajność w grach
Na ThinkPad P14s G5 można również grać w gry, jeśli chcą Państwo zrelaksować się po pracy, chociaż jego wydajność jest ponownie znacznie niższa niż w przypadku laptopów konsumenckich GeForce Laptop RTX 4050. Oznacza to, że generalnie są Państwo ograniczeni do rozdzielczości 1080p, a wysokie lub maksymalne detale są możliwe tylko podczas grania w starsze lub mniej wymagające gry. Z kolei obecne gry, takie jak F1 24 lub Cyberpunk 2077 wymagają dalszej redukcji szczegółów. Upsampling DLSS może być również stosowany w obsługiwanych grach; na przykład, byliśmy w stanie zwiększyć wydajność laptopa podczas uruchamiania Cyberpunk 2077 (1080p, Ultra) z 25 klatek na sekundę do 45 klatek na sekundę (DLSS Balanced). Jego wydajność w grach pozostaje całkowicie stabilna nawet podczas dłuższych sesji.
| Cyberpunk 2077 2.2 Phantom Liberty - 1920x1080 Ultra Preset (FSR off) | |
| Średnia w klasie Workstation (19.6 - 113.5, n=16, ostatnie 2 lata) | |
| Microsoft Surface Laptop Studio 2 RTX 4060 | |
| Dell Precision 5000 5490 | |
| Lenovo ThinkPad P14s G5 21G3S00A00 | |
| Lenovo ThinkPad P14s G4 21HF0017GE | |
| HP ZBook Firefly 14 G11 | |
| GTA V - 1920x1080 Highest Settings possible AA:4xMSAA + FX AF:16x | |
| Microsoft Surface Laptop Studio 2 RTX 4060 | |
| Lenovo Yoga Pro 9-14IRP G8 | |
| Średnia w klasie Workstation (18.3 - 126.7, n=21, ostatnie 2 lata) | |
| Lenovo ThinkPad P14s G5 21G3S00A00 | |
| Lenovo ThinkPad P14s G4 21HF0017GE | |
| F1 24 - 1920x1080 Ultra High Preset AA:T AF:16x | |
| Średnia w klasie Workstation (11.7 - 47.5, n=4, ostatnie 2 lata) | |
| Lenovo ThinkPad P14s G5 21G3S00A00 | |
| Przeciętny Nvidia RTX 500 Ada Generation Laptop GPU (n=1) | |
| Lenovo ThinkPad P14s G4 21HF0017GE | |
Cyberpunk 2077 ultra FPS diagram
| low | med. | high | ultra | QHD | |
|---|---|---|---|---|---|
| GTA V (2015) | 182.7 | 177.4 | 138.2 | 64.6 | 45.1 |
| The Witcher 3 (2015) | 278 | 175 | 91 | 51 | 36 |
| Dota 2 Reborn (2015) | 176.2 | 156.1 | 148.1 | 137.4 | |
| Final Fantasy XV Benchmark (2018) | 130.5 | 71 | 50 | 36.1 | |
| X-Plane 11.11 (2018) | 128.3 | 103.5 | 81.5 | ||
| Far Cry 5 (2018) | 135 | 86 | 78 | 74 | 50 |
| Strange Brigade (2018) | 316 | 126 | 104 | 91 | 63 |
| Far Cry 6 (2021) | 126 | 80 | 68 | ||
| F1 22 (2022) | 150.4 | 134.4 | 99.6 | 32.9 | |
| F1 23 (2023) | 136.5 | 119.8 | 84.1 | 25 | 16 |
| Baldur's Gate 3 (2023) | 69.4 | 53.6 | 39 | 38.9 | 26.8 |
| Cyberpunk 2077 2.2 Phantom Liberty (2023) | 52.9 | 37.7 | 25.4 | 25 | 19.8 |
| Assassin's Creed Mirage (2023) | 78 | 69 | 55 | 40 | 32 |
| Total War Pharaoh (2023) | 199 | 129 | 73 | 56 | 39 |
| Call of Duty Modern Warfare 3 2023 (2023) | 88 | 78 | 58 | 49 | 33 |
| Avatar Frontiers of Pandora (2023) | 42 | 38 | 32 | 20 | |
| Ghost of Tsushima (2024) | 56.4 | 47.1 | 40.2 | 30.9 | 22 |
| F1 24 (2024) | 112.9 | 80.8 | 26.5 | 16 | 22 |
Emisje - głośne wentylatory
Emisja hałasu
System chłodzenia laptopa składa się z dwóch wentylatorów i uruchamia się bardzo szybko nawet podczas krótkich skoków obciążenia. Nawet podczas wykonywania bardzo prostych czynności, takich jak odtwarzanie filmów z YouTube, wentylatory były w rzeczywistości zawsze aktywne przy niskich prędkościach podczas naszego testu - można to było nieco zmniejszyć, używając słabszego profilu energetycznego. Urządzenie szybko stawało się głośniejsze pod obciążeniem i zmierzyliśmy 46,8 dB(A) zarówno podczas grania, jak i w teście obciążeniowym. Tryb zrównoważony nie był dużo cichszy i wynosił 44,8 dB(A), a nawet podczas korzystania z najlepszego trybu oszczędzania energii, wentylatory były nadal wyraźnie słyszalne na poziomie 38,3 dB(A). Żadne inne elektroniczne dźwięki nie dochodziły z naszego urządzenia testowego podczas fazy testowej.
Hałas
| luz |
| 24.6 / 24.6 / 27.5 dB |
| obciążenie |
| 41.2 / 46.8 dB |
 | ||
30 dB cichy 40 dB(A) słyszalny 50 dB(A) irytujący |
||
min: | ||
| Lenovo ThinkPad P14s G5 21G3S00A00 Nvidia RTX 500 Ada Generation Laptop GPU, Ultra 7 155H, Lenovo UMIS AM630 RPETJ1T24MGE2QDQ | HP ZBook Firefly 14 G11 RTX A500 Laptop GPU, Ultra 7 165H, Kioxia XG8 KXG80ZNV512G | Dell Precision 5000 5490 NVIDIA RTX 3000 Ada Generation Laptop GPU, Ultra 9 185H, Kioxia XG8 KXG80ZNV1T02 | Lenovo ThinkPad P14s G4 21HF0017GE RTX A500 Laptop GPU, i7-1370P, SK Hynix HFS002TEJ9X162N | Microsoft Surface Laptop Studio 2 RTX 4060 NVIDIA GeForce RTX 4060 Laptop GPU, i7-13700H, Kioxia XG8 KXG80ZNV1T02 | Lenovo Yoga Pro 9-14IRP G8 NVIDIA GeForce RTX 4050 Laptop GPU, i7-13705H, Samsung PM9A1 MZVL21T0HCLR | |
|---|---|---|---|---|---|---|
| Noise | 3% | 3% | 2% | -3% | -4% | |
| wyłączone / środowisko * | 24.6 | 24.3 1% | 22.8 7% | 24.6 -0% | 23.9 3% | 24.8 -1% |
| Idle Minimum * | 24.6 | 24.6 -0% | 23.8 3% | 24.6 -0% | 23.9 3% | 24.8 -1% |
| Idle Average * | 24.6 | 25.2 -2% | 23.8 3% | 24.6 -0% | 24.4 1% | 24.8 -1% |
| Idle Maximum * | 27.5 | 26.8 3% | 24.7 10% | 25.9 6% | 26.9 2% | 24.8 10% |
| Load Average * | 41.2 | 38.9 6% | 38.9 6% | 41.3 -0% | 48.5 -18% | 47.4 -15% |
| Cyberpunk 2077 ultra * | 46.8 | 41.8 11% | 44.2 6% | |||
| Load Maximum * | 46.8 | 45.8 2% | 51.4 -10% | 46.2 1% | 51.8 -11% | 52.9 -13% |
| Witcher 3 ultra * | 49.9 | 46 | 51.8 | 52.9 |
* ... im mniej tym lepiej
Temperatura
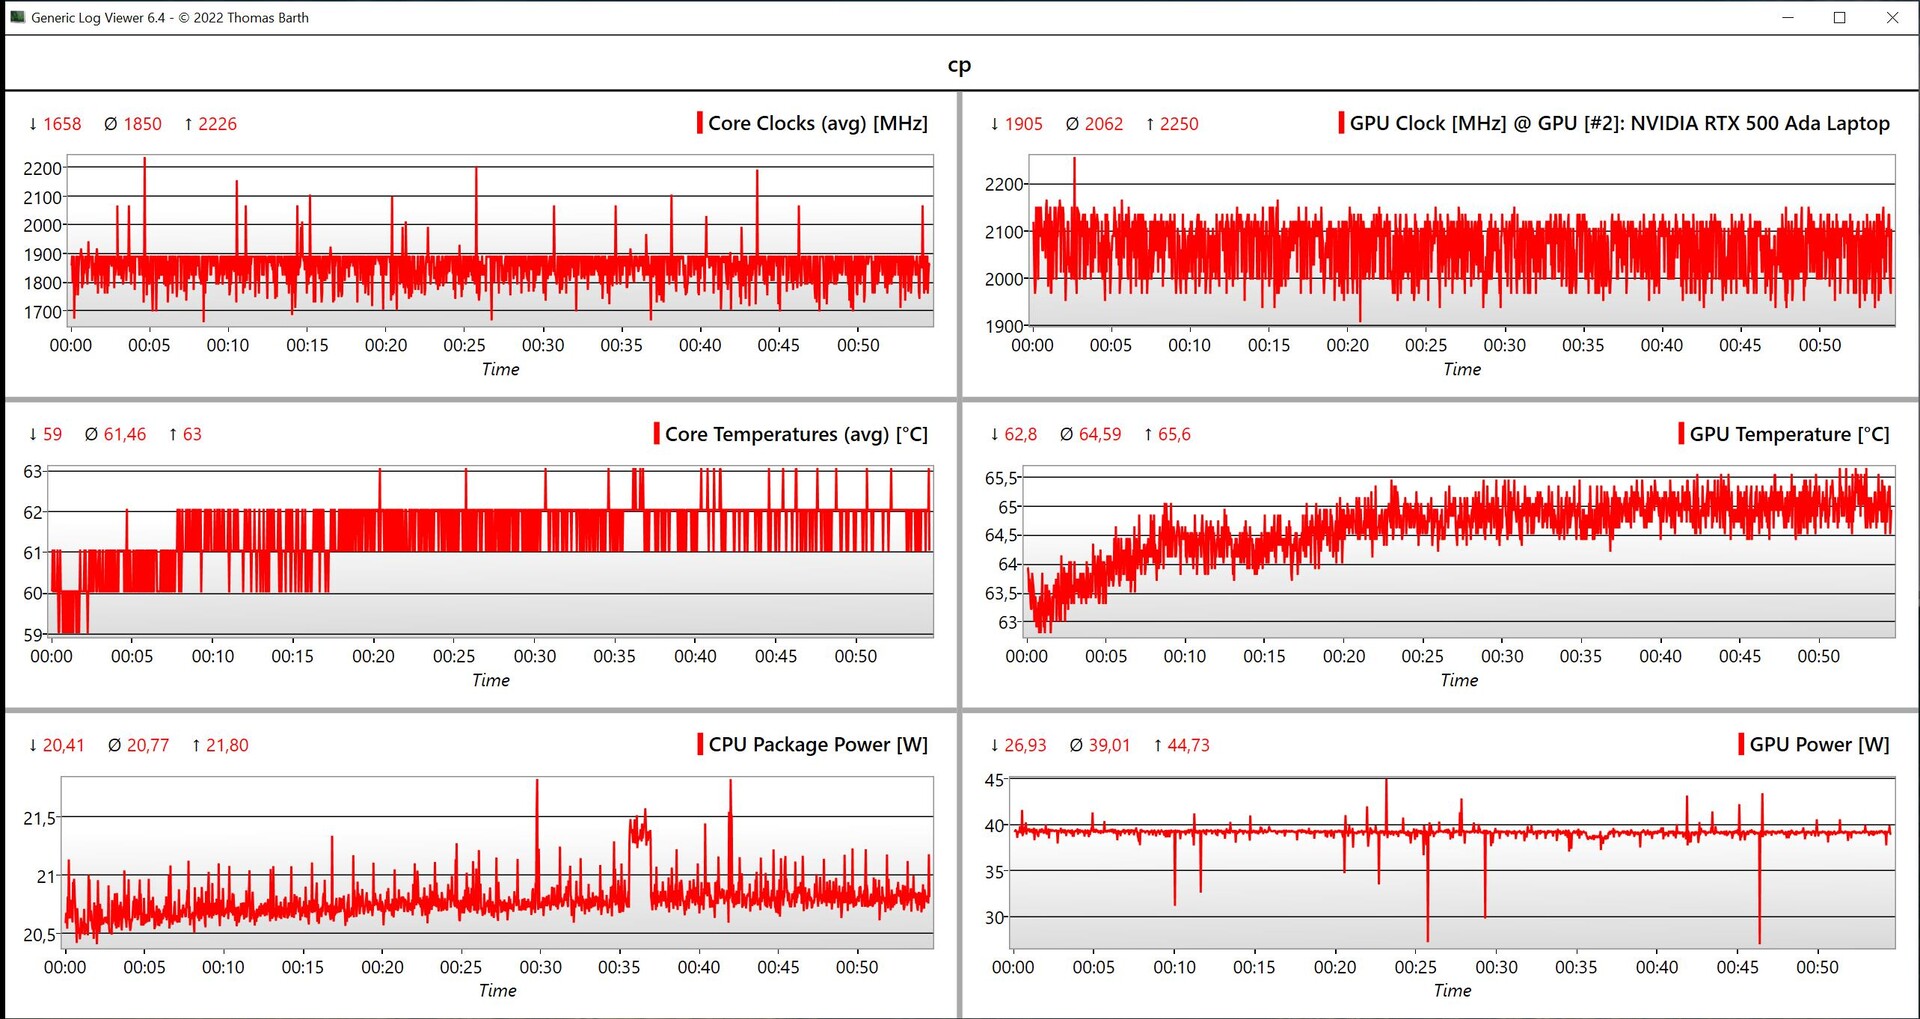
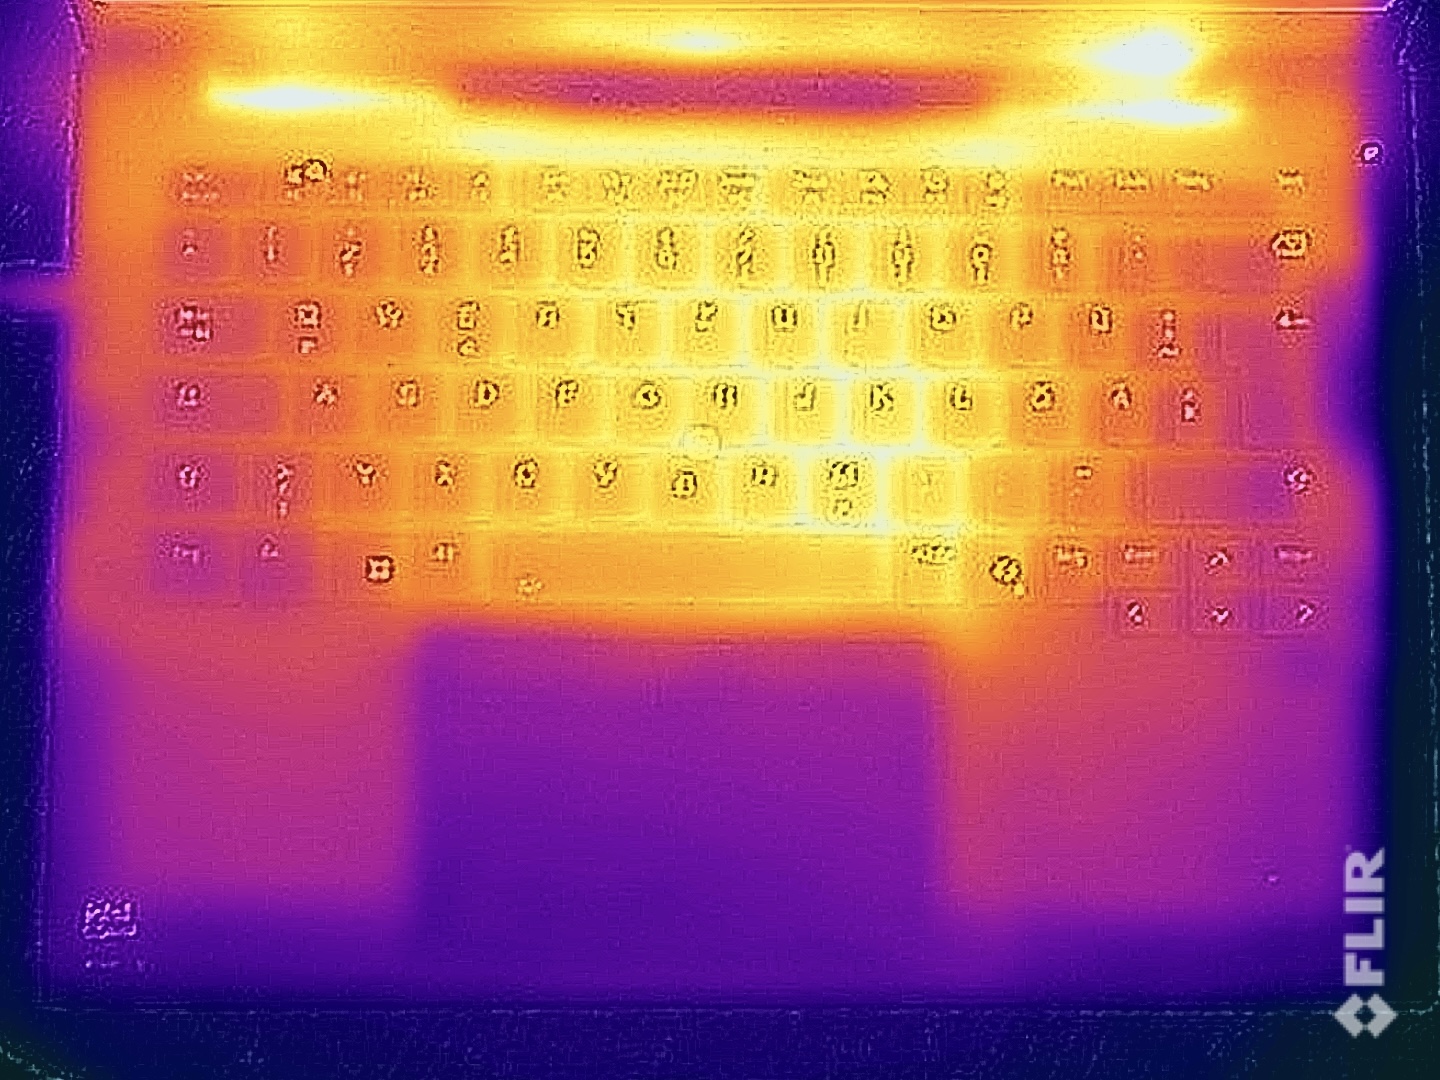
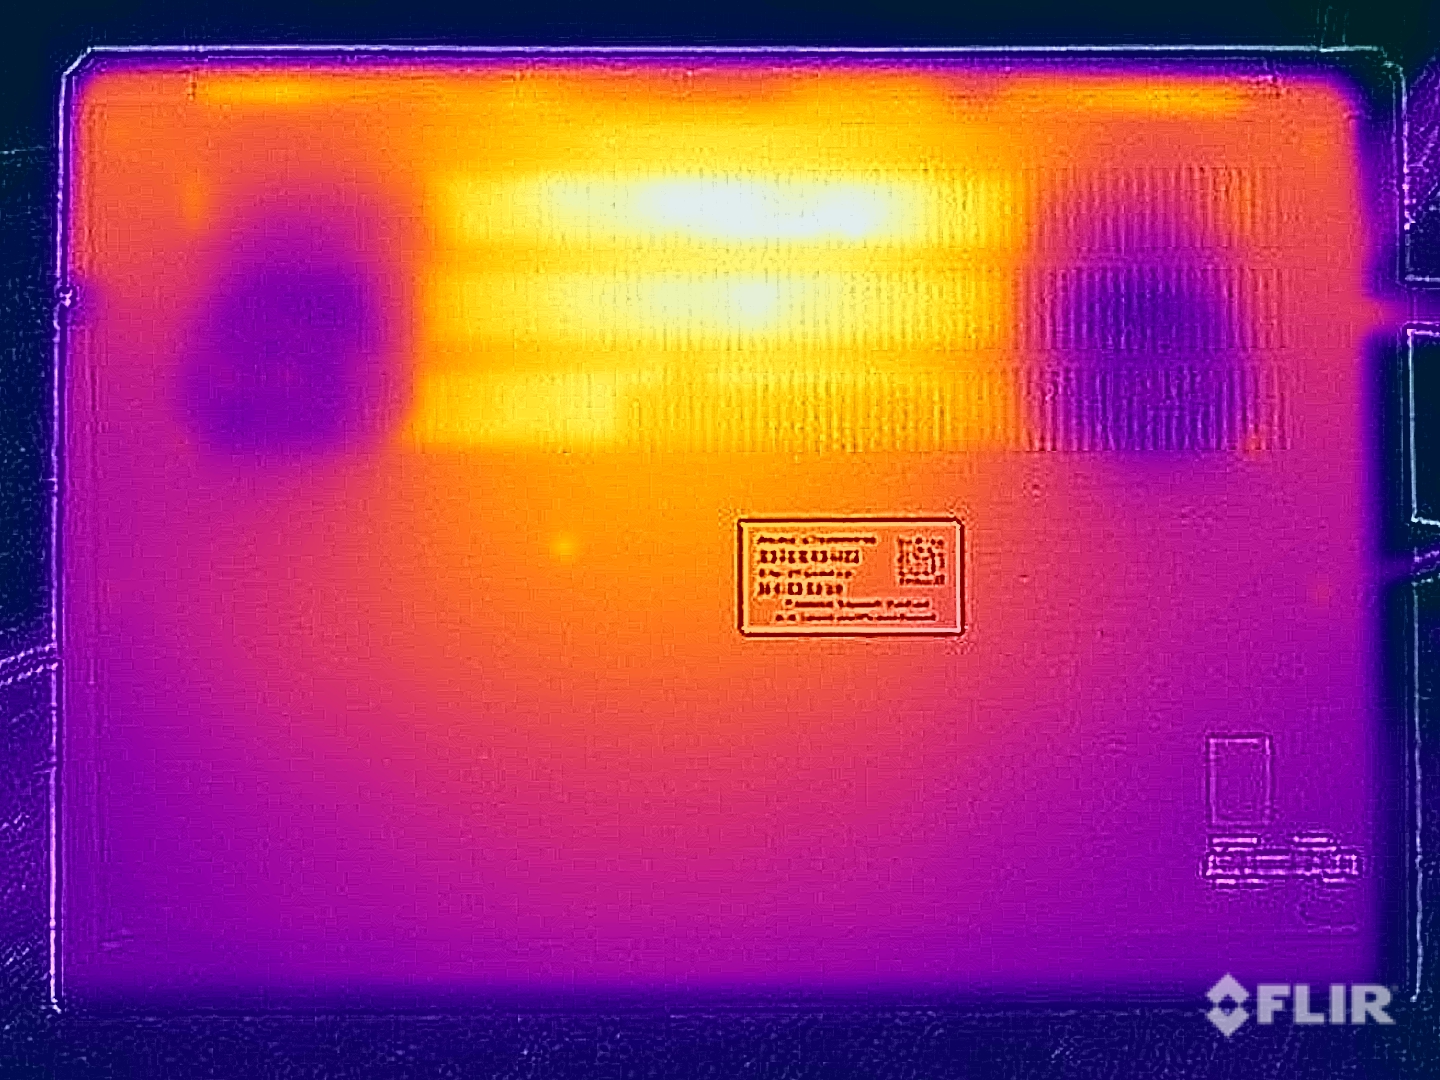
Niektóre części powierzchni ThinkPada P14s G5 już na biegu jałowym osiągały temperaturę 30 °C, więc możliwości pasywnego chłodzenia urządzenia nie wydają się być najlepsze. Pod obciążeniem odnotowaliśmy punkt o temperaturze około 47 °C w tylnej środkowej części spodu, ale wartość ta nie jest krytyczna. Mimo to, prawdopodobnie nie należy kłaść laptopa na udach. Obszar klawiatury również staje się zauważalnie ciepły - zmierzyliśmy szczyt 41 °C, ale nie powinno to stanowić żadnych ograniczeń podczas użytkowania.
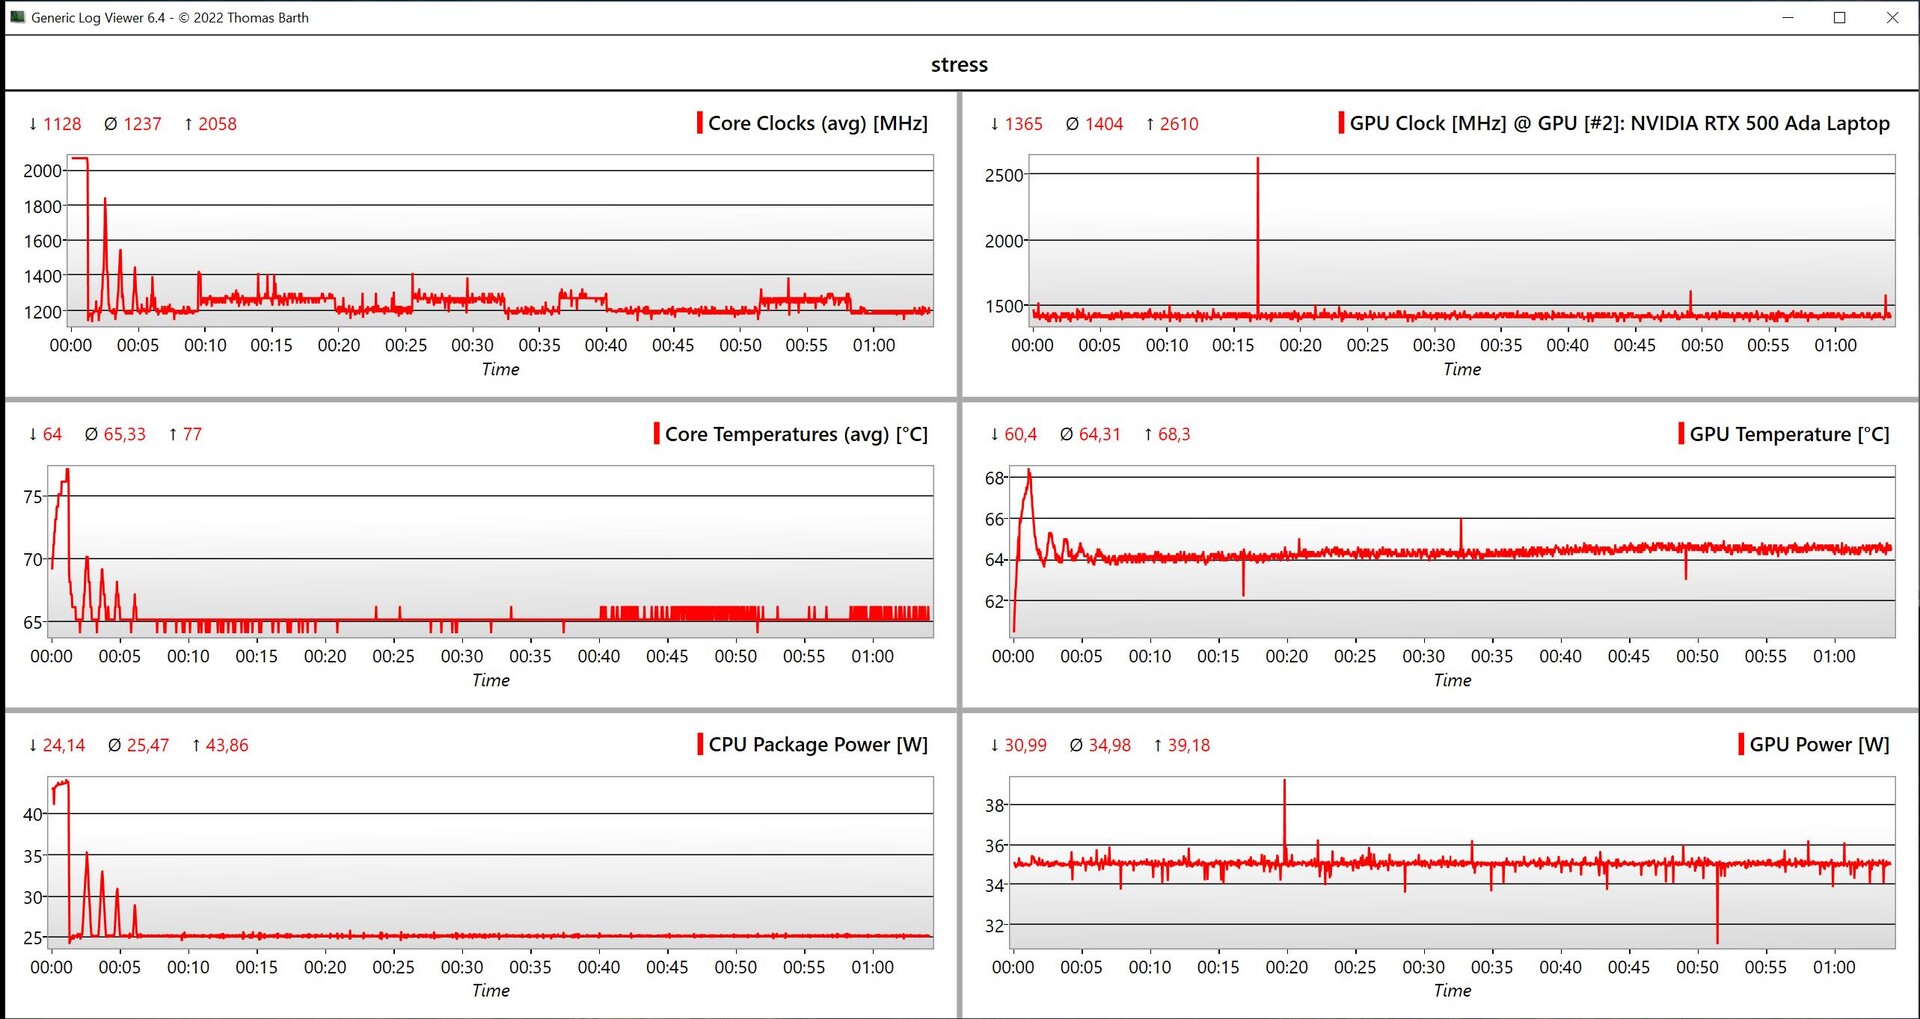
Podczas testu obciążeniowego z połączonym obciążeniem CPU/GPU, karta graficzna była preferowana przez system i działała stale z mocą 35 watów, podczas gdy procesor szybko ustabilizował się na poziomie zaledwie 25 watów. W sumie system może stale chłodzić 60 watów.
(±) Maksymalna temperatura w górnej części wynosi 41.3 °C / 106 F, w porównaniu do średniej 38.2 °C / 101 F , począwszy od 22.2 do 69.8 °C dla klasy Workstation.
(-) Dno nagrzewa się maksymalnie do 47 °C / 117 F, w porównaniu do średniej 41.2 °C / 106 F
(+) W stanie bezczynności średnia temperatura górnej części wynosi 29.1 °C / 84 F, w porównaniu ze średnią temperaturą urządzenia wynoszącą 32 °C / ### class_avg_f### F.
(±) 3: The average temperature for the upper side is 36.3 °C / 97 F, compared to the average of 32 °C / 90 F for the class Workstation.
(+) Podpórki pod nadgarstki i touchpad są chłodniejsze niż temperatura skóry i maksymalnie 30.2 °C / 86.4 F i dlatego są chłodne w dotyku.
(-) Średnia temperatura obszaru podparcia dłoni w podobnych urządzeniach wynosiła 27.8 °C / 82 F (-2.4 °C / -4.4 F).
| Lenovo ThinkPad P14s G5 21G3S00A00 Intel Core Ultra 7 155H, Nvidia RTX 500 Ada Generation Laptop GPU | HP ZBook Firefly 14 G11 Intel Core Ultra 7 165H, NVIDIA RTX A500 Laptop GPU | Dell Precision 5000 5490 Intel Core Ultra 9 185H, NVIDIA RTX 3000 Ada Generation Laptop GPU | Lenovo ThinkPad P14s G4 21HF0017GE Intel Core i7-1370P, NVIDIA RTX A500 Laptop GPU | Microsoft Surface Laptop Studio 2 RTX 4060 Intel Core i7-13700H, NVIDIA GeForce RTX 4060 Laptop GPU | Lenovo Yoga Pro 9-14IRP G8 Intel Core i7-13705H, NVIDIA GeForce RTX 4050 Laptop GPU | |
|---|---|---|---|---|---|---|
| Heat | 2% | 4% | -8% | 11% | 0% | |
| Maximum Upper Side * | 41.3 | 42.8 -4% | 43.2 -5% | 55.3 -34% | 40.4 2% | 41 1% |
| Maximum Bottom * | 47 | 44 6% | 38.4 18% | 48.7 -4% | 42.2 10% | 56.7 -21% |
| Idle Upper Side * | 30.2 | 30.6 -1% | 31.6 -5% | 31 -3% | 26.6 12% | 27.4 9% |
| Idle Bottom * | 33.2 | 31.4 5% | 30.6 8% | 29.9 10% | 27 19% | 29.1 12% |
* ... im mniej tym lepiej
Głośniki
Dwa głośniki stereo znajdują się pod przednią krawędzią jednostki bazowej i emitują dźwięk w dół, gdzie jest on idealnie odbijany z powrotem do użytkownika od twardej powierzchni. Podczas naszej analizy moduły wypadły dobrze, nie tylko dlatego, że były głośne, ale także ze względu na zrównoważone brzmienie wysokich i średnich tonów. Jest to również korzystne dla wokali. Jedynie basy brzmiały nieco słabo, przez co muzyka lub filmy nie brzmią tak potężnie, jak mogłyby.
Lenovo ThinkPad P14s G5 21G3S00A00 analiza dźwięku
(+) | głośniki mogą odtwarzać stosunkowo głośno (87 dB)
Bas 100 - 315 Hz
(-) | prawie brak basu - średnio 18.8% niższa od mediany
(±) | liniowość basu jest średnia (8.3% delta do poprzedniej częstotliwości)
Średnie 400 - 2000 Hz
(+) | zbalansowane środki średnie - tylko 2.7% od mediany
(+) | średnie są liniowe (2.8% delta do poprzedniej częstotliwości)
Wysokie 2–16 kHz
(+) | zrównoważone maksima - tylko 2.4% od mediany
(+) | wzloty są liniowe (3.5% delta do poprzedniej częstotliwości)
Ogólnie 100 - 16.000 Hz
(+) | ogólny dźwięk jest liniowy (12.2% różnicy w stosunku do mediany)
W porównaniu do tej samej klasy
» 14% wszystkich testowanych urządzeń w tej klasie było lepszych, 3% podobnych, 83% gorszych
» Najlepszy miał deltę 7%, średnia wynosiła ###średnia###%, najgorsza wynosiła 35%
W porównaniu do wszystkich testowanych urządzeń
» 8% wszystkich testowanych urządzeń było lepszych, 2% podobnych, 89% gorszych
» Najlepszy miał deltę 4%, średnia wynosiła ###średnia###%, najgorsza wynosiła 134%
HP ZBook Firefly 14 G11 analiza dźwięku
(+) | głośniki mogą odtwarzać stosunkowo głośno (83.7 dB)
Bas 100 - 315 Hz
(-) | prawie brak basu - średnio 21.6% niższa od mediany
(±) | liniowość basu jest średnia (10% delta do poprzedniej częstotliwości)
Średnie 400 - 2000 Hz
(+) | zbalansowane środki średnie - tylko 4.5% od mediany
(+) | średnie są liniowe (4.3% delta do poprzedniej częstotliwości)
Wysokie 2–16 kHz
(+) | zrównoważone maksima - tylko 3.4% od mediany
(+) | wzloty są liniowe (3.2% delta do poprzedniej częstotliwości)
Ogólnie 100 - 16.000 Hz
(±) | liniowość ogólnego dźwięku jest średnia (16.2% różnicy w stosunku do mediany)
W porównaniu do tej samej klasy
» 38% wszystkich testowanych urządzeń w tej klasie było lepszych, 7% podobnych, 55% gorszych
» Najlepszy miał deltę 7%, średnia wynosiła ###średnia###%, najgorsza wynosiła 35%
W porównaniu do wszystkich testowanych urządzeń
» 24% wszystkich testowanych urządzeń było lepszych, 5% podobnych, 71% gorszych
» Najlepszy miał deltę 4%, średnia wynosiła ###średnia###%, najgorsza wynosiła 134%
Lenovo Yoga Pro 9-14IRP G8 analiza dźwięku
(±) | głośność głośnika jest średnia, ale dobra (81.8 dB)
Bas 100 - 315 Hz
(±) | zredukowany bas - średnio 5.9% niższy od mediany
(±) | liniowość basu jest średnia (7.8% delta do poprzedniej częstotliwości)
Średnie 400 - 2000 Hz
(+) | zbalansowane środki średnie - tylko 2.3% od mediany
(+) | średnie są liniowe (3.2% delta do poprzedniej częstotliwości)
Wysokie 2–16 kHz
(+) | zrównoważone maksima - tylko 2.5% od mediany
(+) | wzloty są liniowe (3.4% delta do poprzedniej częstotliwości)
Ogólnie 100 - 16.000 Hz
(+) | ogólny dźwięk jest liniowy (7.3% różnicy w stosunku do mediany)
W porównaniu do tej samej klasy
» 4% wszystkich testowanych urządzeń w tej klasie było lepszych, 1% podobnych, 95% gorszych
» Najlepszy miał deltę 5%, średnia wynosiła ###średnia###%, najgorsza wynosiła 45%
W porównaniu do wszystkich testowanych urządzeń
» 1% wszystkich testowanych urządzeń było lepszych, 0% podobnych, 99% gorszych
» Najlepszy miał deltę 4%, średnia wynosiła ###średnia###%, najgorsza wynosiła 134%
Zarządzanie energią - panel 3K potrzebuje dużo energii
Zużycie energii
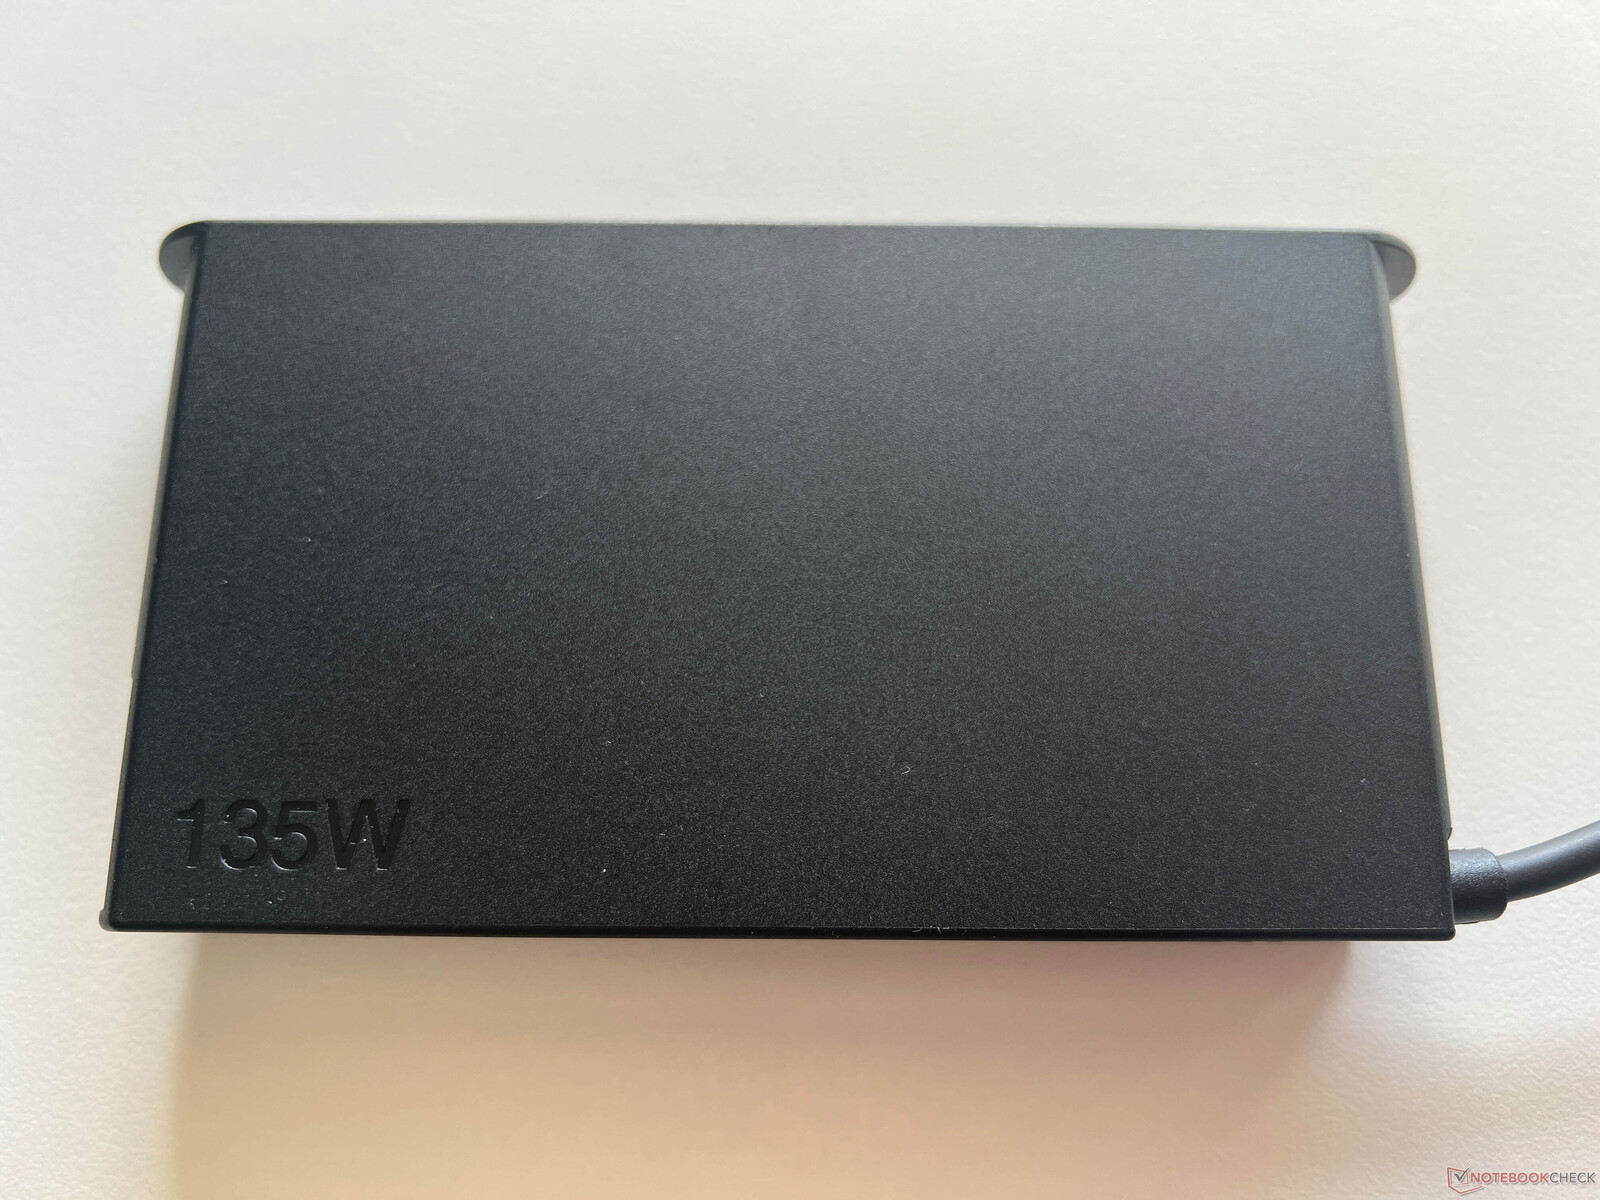
Nasze pomiary zużycia energii wyraźnie pokazały, że nowy panel 3K wymaga dużo energii. Pomimo niższej maksymalnej jasności, maksymalne zużycie energii w trybie bezczynności laptopa jest wyższe niż w przypadku ZBook Firefly 14 G11na przykład. Podczas grania urządzenie wymaga 80-90 watów, podczas gdy podczas testu warunków skrajnych widzieliśmy 137 watów przez kilka sekund. Jednak wartość ta szybko ustabilizowała się na poziomie 90 watów i pozostała na tym poziomie. 135-watowy zasilacz jest zatem wystarczający. Konfiguracje bez RTX 500 Ada dostarczane są ze słabszym, 100-watowym zasilaczem.
| wyłączony / stan wstrzymania | |
| luz | |
| obciążenie |
|
Legenda:
min: | |
| Lenovo ThinkPad P14s G5 21G3S00A00 Ultra 7 155H, Nvidia RTX 500 Ada Generation Laptop GPU, Lenovo UMIS AM630 RPETJ1T24MGE2QDQ, IPS, 3072x1920, 14.5" | HP ZBook Firefly 14 G11 Ultra 7 165H, RTX A500 Laptop GPU, Kioxia XG8 KXG80ZNV512G, IPS, 2560x1600, 14" | Dell Precision 5000 5490 Ultra 9 185H, NVIDIA RTX 3000 Ada Generation Laptop GPU, Kioxia XG8 KXG80ZNV1T02, IPS, 2560x1600, 14" | Lenovo ThinkPad P14s G4 21HF0017GE i7-1370P, RTX A500 Laptop GPU, SK Hynix HFS002TEJ9X162N, OLED, 2880x1800, 14" | Microsoft Surface Laptop Studio 2 RTX 4060 i7-13700H, NVIDIA GeForce RTX 4060 Laptop GPU, Kioxia XG8 KXG80ZNV1T02, IPS, 2400x1600, 14.4" | Lenovo Yoga Pro 9-14IRP G8 i7-13705H, NVIDIA GeForce RTX 4050 Laptop GPU, Samsung PM9A1 MZVL21T0HCLR, Mini-LED, 3072x1920, 14.5" | Przeciętny Nvidia RTX 500 Ada Generation Laptop GPU | Średnia w klasie Workstation | |
|---|---|---|---|---|---|---|---|---|
| Power Consumption | 21% | -9% | 30% | 37% | -23% | 0% | -6% | |
| Idle Minimum * | 7.5 | 6.6 12% | 11.1 -48% | 6.3 16% | 3 60% | 10.9 -45% | 7.5 ? -0% | 8.43 ? -12% |
| Idle Average * | 13.5 | 12.7 6% | 14.8 -10% | 7 48% | 7.1 47% | 17.7 -31% | 13.5 ? -0% | 12.4 ? 8% |
| Idle Maximum * | 14.2 | 13.3 6% | 16.5 -16% | 8.1 43% | 7.6 46% | 19.3 -36% | 14.2 ? -0% | 17.8 ? -25% |
| Load Average * | 100.2 | 67 33% | 70.1 30% | 84.6 16% | 73.1 27% | 93.3 7% | 100.2 ? -0% | 88.4 ? 12% |
| Cyberpunk 2077 ultra * | 86.7 | 63.4 27% | ||||||
| Cyberpunk 2077 ultra external monitor * | 84.6 | 58.1 31% | ||||||
| Load Maximum * | 137.4 | 94.9 31% | 137.5 -0% | 98.3 28% | 128.5 6% | 150.2 -9% | 137.4 ? -0% | 154.1 ? -12% |
| Witcher 3 ultra * | 93.1 | 56.5 | 113.9 | 129.5 |
* ... im mniej tym lepiej
Power consumption Cyberpunk / stress test
Power consumption with external monitor
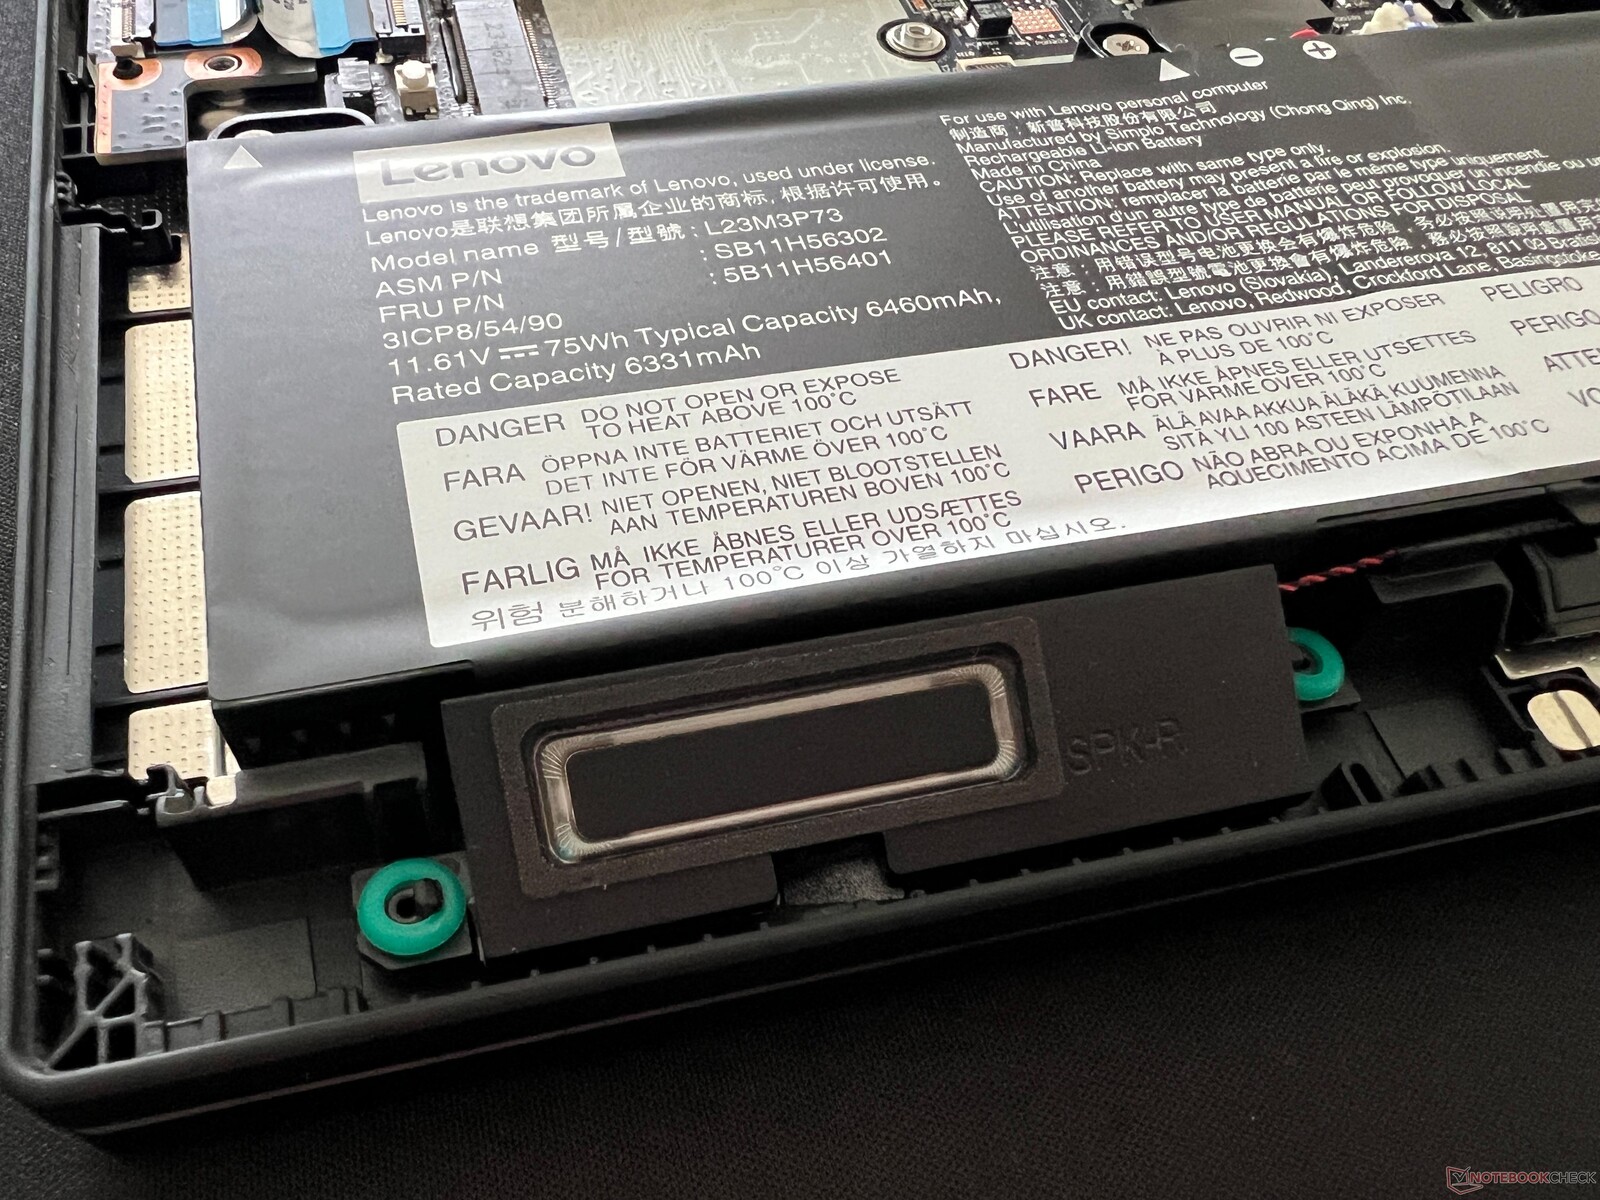
Czas trwania
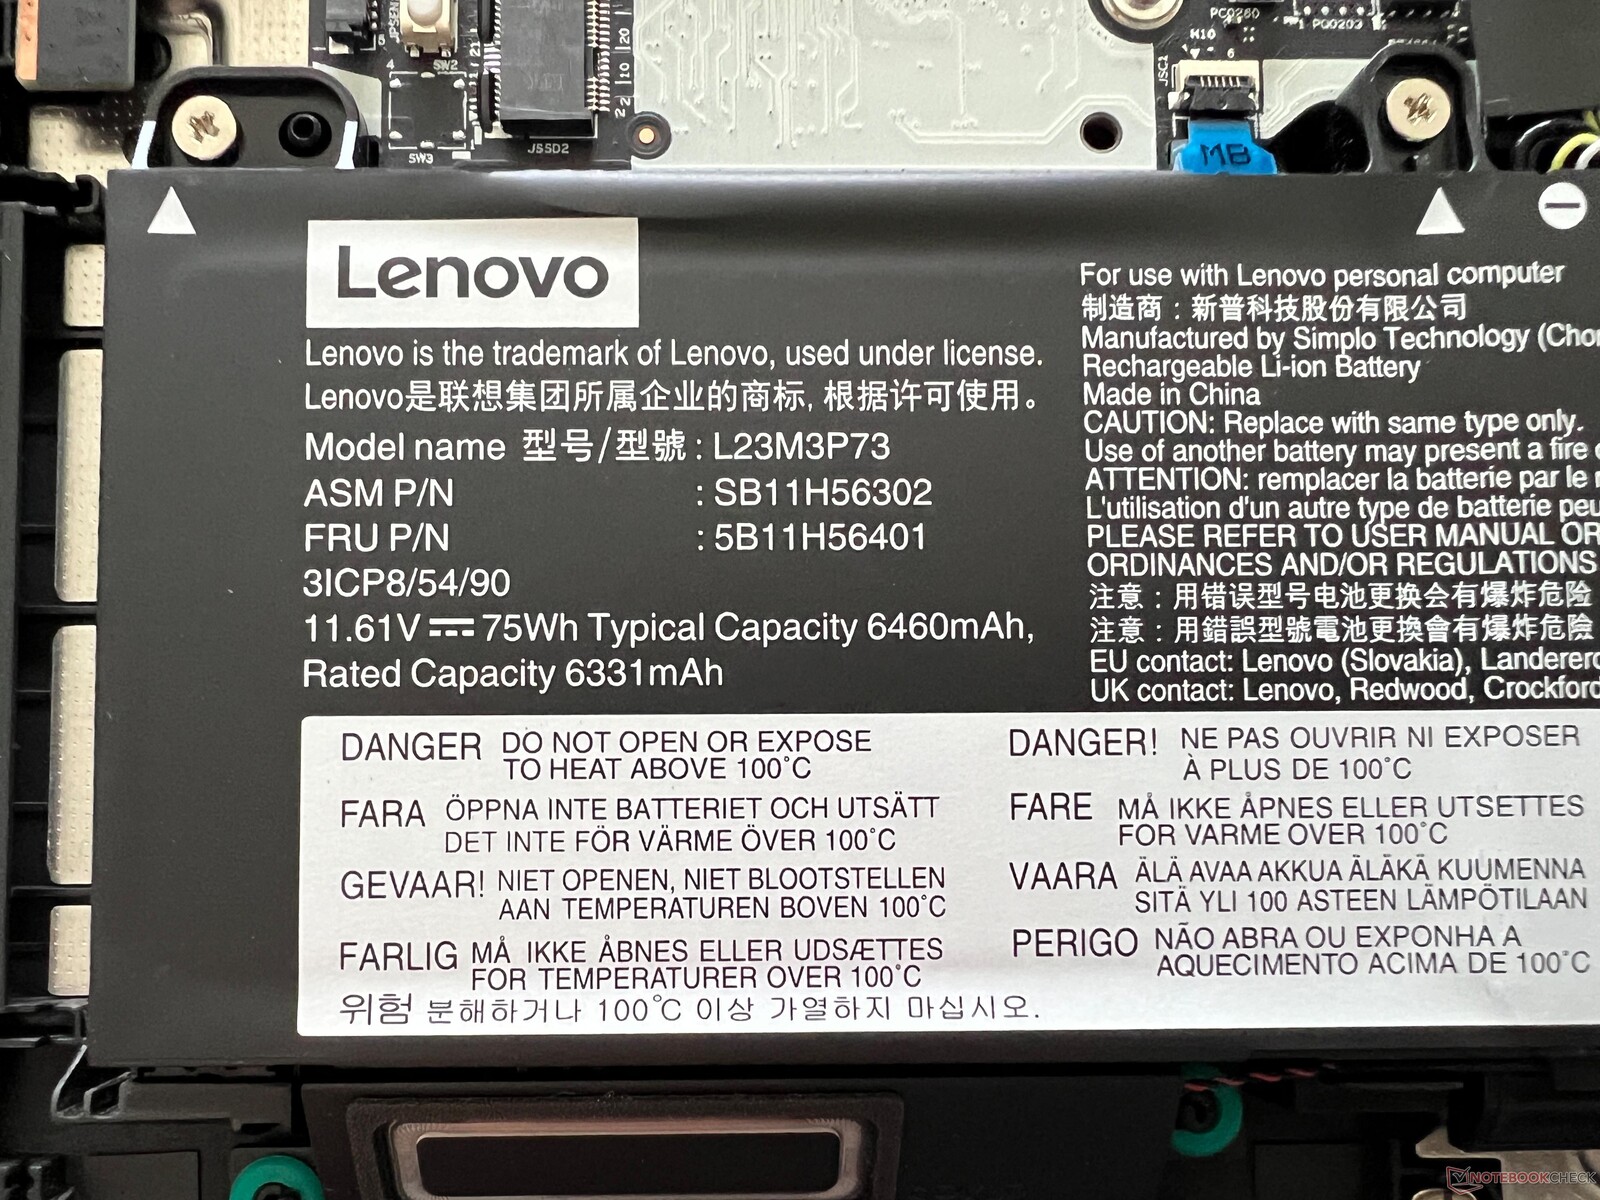
Nowy ThinkPad P14s G5 Intel jest dostępny z dwoma różnymi rozmiarami baterii (57 lub 75 Wh). Nasze urządzenie testowe jest wyposażone w większą baterię 75 Wh, która jest niezbędna do osiągnięcia przyzwoitych czasów pracy, ponieważ jest wyposażona w panel 3K. Nawiasem mówiąc, jego częstotliwości odświeżania nie można obecnie zmienić, ponieważ aktywny tryb sygnału zawsze pozostaje na poziomie 120 Hz; Lenovo mogłoby to poprawić w aktualizacji. Przy 120 Hz jego wyniki są tylko przeciętne. Podczas testu WLAN przy 150 cd/m² (odpowiada 66% maksymalnej jasności naszego urządzenia testowego) odnotowaliśmy nieco poniżej 8 godzin, co zostało podcięte tylko przez stare P14s G4 z baterią 52,5 Wh. Przy pełnej jasności test WLAN trwał tylko 5:43 godziny. W teście wideo wytrzymał nieco poniżej 9 godzin, a pod obciążeniem bateria rozładowała się w około 80 minut.
Pełne naładowanie urządzenia przy użyciu 135-watowego zasilacza po włączeniu zajmuje 128 minut, przy czym 80% jego pojemności jest ponownie dostępne po 75 minutach.
| Lenovo ThinkPad P14s G5 21G3S00A00 Ultra 7 155H, Nvidia RTX 500 Ada Generation Laptop GPU, 75 Wh | HP ZBook Firefly 14 G11 Ultra 7 165H, RTX A500 Laptop GPU, 56 Wh | Dell Precision 5000 5490 Ultra 9 185H, NVIDIA RTX 3000 Ada Generation Laptop GPU, 72 Wh | Lenovo ThinkPad P14s G4 21HF0017GE i7-1370P, RTX A500 Laptop GPU, 52.5 Wh | Microsoft Surface Laptop Studio 2 RTX 4060 i7-13700H, NVIDIA GeForce RTX 4060 Laptop GPU, 58 Wh | Lenovo Yoga Pro 9-14IRP G8 i7-13705H, NVIDIA GeForce RTX 4050 Laptop GPU, 75 Wh | Średnia w klasie Workstation | |
|---|---|---|---|---|---|---|---|
| Czasy pracy | 9% | 39% | -23% | 33% | -2% | 14% | |
| H.264 | 534 | 675 26% | 547 2% | 733 ? 37% | |||
| WiFi v1.3 | 473 | 517 9% | 658 39% | 367 -22% | 498 5% | 477 1% | 502 ? 6% |
| Load | 78 | 59 -24% | 132 69% | 72 -8% | 77.4 ? -1% |
Za
Przeciw
Werdykt - ThinkPad P14s G5 teraz z szybszym GPU


Na początku tego testu zadaliśmy pytanie, czy rozwój tego laptopa ponownie zmierza w dobrym kierunku. Nowy ThinkPad P14s G5 (Intel) pokazuje spory potencjał - decyzja o niestosowaniu najcieńszej możliwej obudowy, przejście z opcjonalnego panelu OLED na matowy ekran IPS bez PWM, a także możliwość rozbudowy pamięci RAM - wszystko to bardzo korzystnie wpływa na mobilną stację roboczą. Jednak w naszych oczach te kroki nie są wystarczające. Pomimo tego, że wydajność komponentów jest ogólnie w porządku, po prostu trzeba zadać sobie pytanie, dlaczego producent nie oferuje szybszego RTX 1000 Ada, na przykład, biorąc pod uwagę grubą obudowę laptopa - lub dlaczego nawet opcjonalny panel IPS o rozdzielczości 3K wciąż pozostaje w tyle za konkurencją pod względem jasności. Koniec końców, Lenovo zdołało wykorzystać mocniejsze podzespoły i znacznie jaśniejszy panel mini LED w laptopie Yoga Pro 9 14-a wszystko to w cieńszej obudowie.
Sam nowy wyświetlacz IPS, z rozdzielczością 3K i pokryciem P3, jest całkiem przyzwoitym panelem, ale Lenovo powinno dać użytkownikom dostęp do profilu sRGB-plus, obecnie nie można zmniejszyć jego częstotliwości odświeżania do 60 Hz, co poprawiłoby nieco żywotność baterii urządzenia. Monitor RTX 500 Adawydajność graficzna jest znacznie lepsza niż w starym laptopie RTX A500, a jego procesor Meteor Lake również nie zawodzi, podczas gdy chłodzenie laptopa osiągnęło swój limit podczas testu obciążeniowego. Biorąc pod uwagę jego grubą podstawę, maksymalna wydajność chłodzenia wynosząca 60 watów (CPU/GPU łącznie) nie jest zbyt imponująca, zwłaszcza w porównaniu z potężnymi 14-calowymi laptopami multimedialnymi. Jeśli chodzi o klawiaturę, nowa pozycja klawisza Fn z pewnością będzie wymagała przyzwyczajenia od weteranów ThinkPadów, ale jakość samej klawiatury nie uległa zmianie. Tak więc klawiatura jest dobra, ale nic specjalnego. Ponownie musimy zadać sobie pytanie, dlaczego klawiatura o grubości 1,8 mm nie mogła zostać zainstalowana w tak grubej jednostce bazowej.
Wersja Intel ThinkPad P14s G5 oferuje dobre opcje konserwacji, a także nowy 14,5-calowy wyświetlacz. Jego wydajność jest również nieco lepsza niż poprzednika, ale pomimo grubej jednostki bazowej, mobilną stację roboczą można kupić tylko z podstawowym GPU od Nvidii, a mianowicie RTX 500 Ada.
ThinkPad P14s oferuje dalsze zalety, takie jak dobre opcje konserwacji - w tym dwa gniazda pamięci RAM dla maksymalnie 96 GB pamięci RAM. Jest wystarczająco dużo portów, a kamera internetowa 5 MP wykonuje przyzwoitą robotę. Pod względem wydajności jest również wyraźnie lepszy od swojego bezpośredniego konkurenta, HP ZBook Firefly 14 G11 HP ZBook Firefly 14 G11. Jeśli jednak nie są Państwo zależni od certyfikatów ISV, to w dzisiejszych czasach można uzyskać znacznie wyższą wydajność urządzeń multimedialnych, zwłaszcza pod względem kart graficznych. Duża różnica między modelami Intel i AMD również nie jest dobrą sytuacją dla klientów.
Cena i dostępność
ThinkPad P14s G5 można skonfigurować za pośrednictwem sklepu internetowego Lenovo, a jego ceny zaczynają się od 2 439 USD.
Prosimy pamiętać: Niedawno zaktualizowaliśmy nasz system oceny i wyniki wersji 8 nie są porównywalne z wynikami wersji 7. Więcej informacji znajdą Państwo tutaj.
Lenovo ThinkPad P14s G5 21G3S00A00
- 18/07/2024 v8
Andreas Osthoff
 Total Sustainability Score:
 Przezroczystość
Wyboru urządzeń do recenzji dokonuje nasza redakcja. Próbka testowa została udostępniona autorowi jako pożyczka od producenta lub sprzedawcy detalicznego na potrzeby tej recenzji. Pożyczkodawca nie miał wpływu na tę recenzję, producent nie otrzymał też kopii tej recenzji przed publikacją. Nie było obowiązku publikowania tej recenzji. Nigdy nie przyjmujemy rekompensaty ani płatności w zamian za nasze recenzje. Jako niezależna firma medialna, Notebookcheck nie podlega władzy producentów, sprzedawców detalicznych ani wydawców.
Tak testuje Notebookcheck
Każdego roku Notebookcheck niezależnie sprawdza setki laptopów i smartfonów, stosując standardowe procedury, aby zapewnić porównywalność wszystkich wyników. Od około 20 lat stale rozwijamy nasze metody badawcze, ustanawiając przy tym standardy branżowe. W naszych laboratoriach testowych doświadczeni technicy i redaktorzy korzystają z wysokiej jakości sprzętu pomiarowego. Testy te obejmują wieloetapowy proces walidacji. Nasz kompleksowy system ocen opiera się na setkach uzasadnionych pomiarów i benchmarków, co pozwala zachować obiektywizm.Price comparison

