

Recenzja stacji roboczej Dell Precision 5690: Gotowy na rewolucję AI

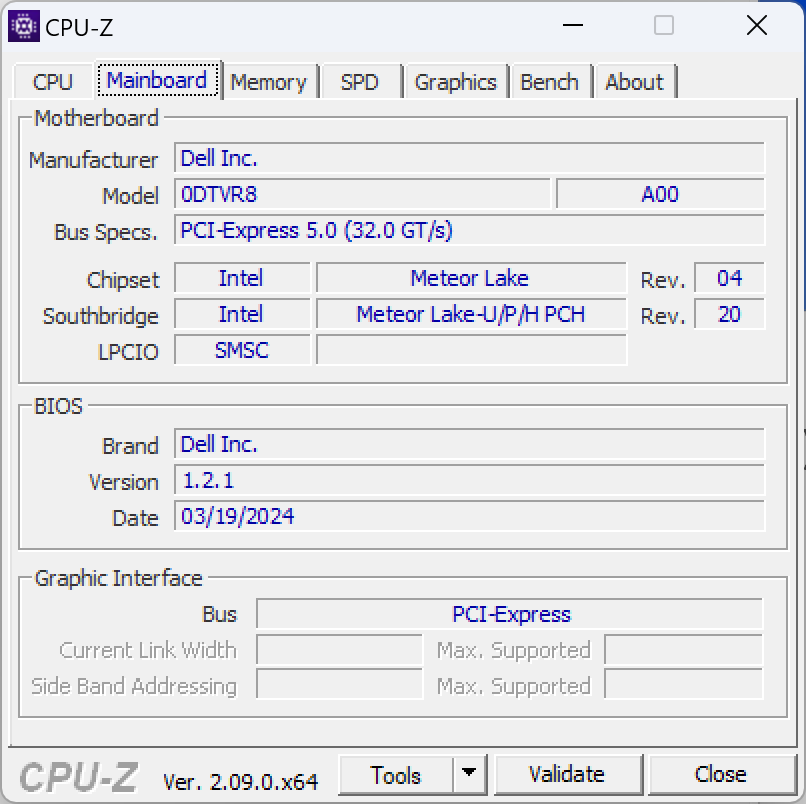
Precision 5690 jest następcą zeszłorocznego Precision 5680, zastępując starsze procesory Raptor Lake-H nowszymi Meteor Lake-H ze zintegrowanymi jednostkami NPU. Poza tym oba modele są identyczne, z tymi samymi opcjami wyświetlacza i GPU. Zalecamy sprawdzenie naszej recenzję na Precision 5680 aby dowiedzieć się więcej o fizycznych cechach tej serii inspirowanych XPS 16.
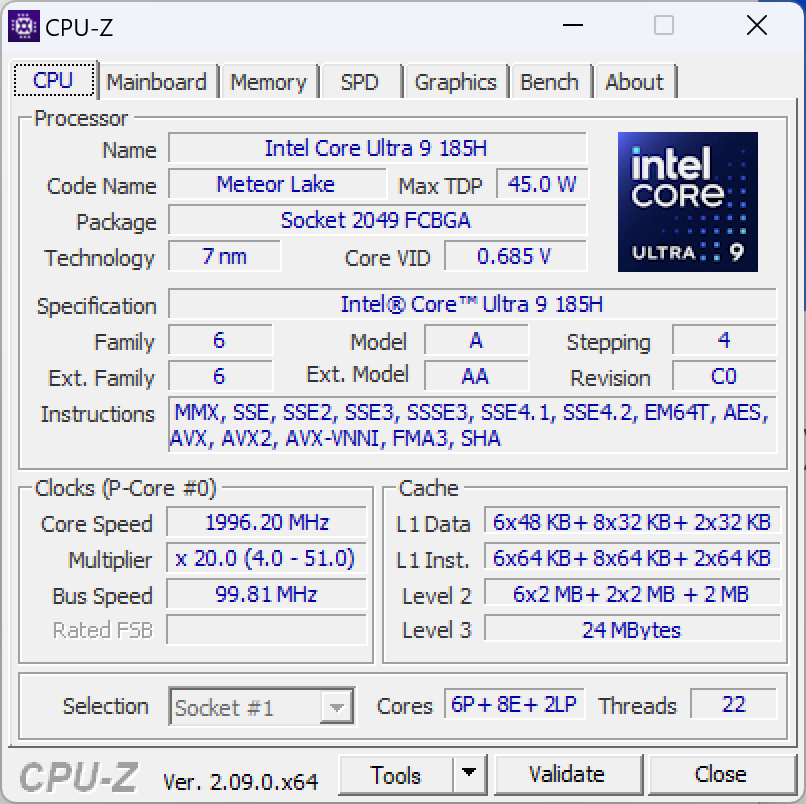
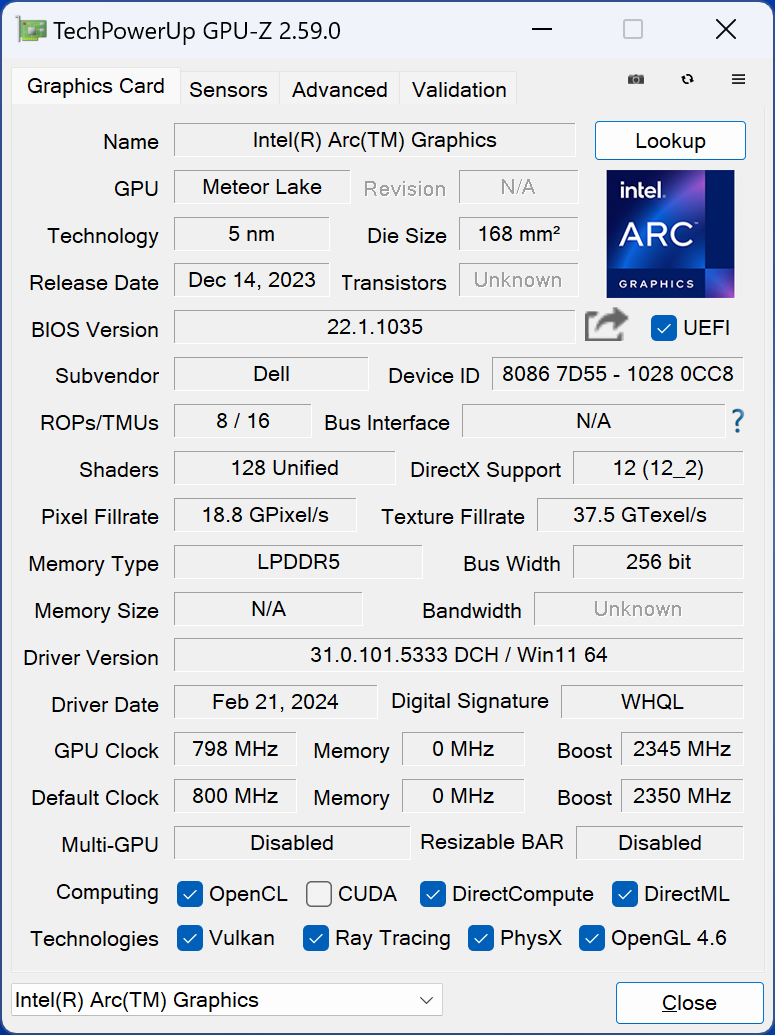
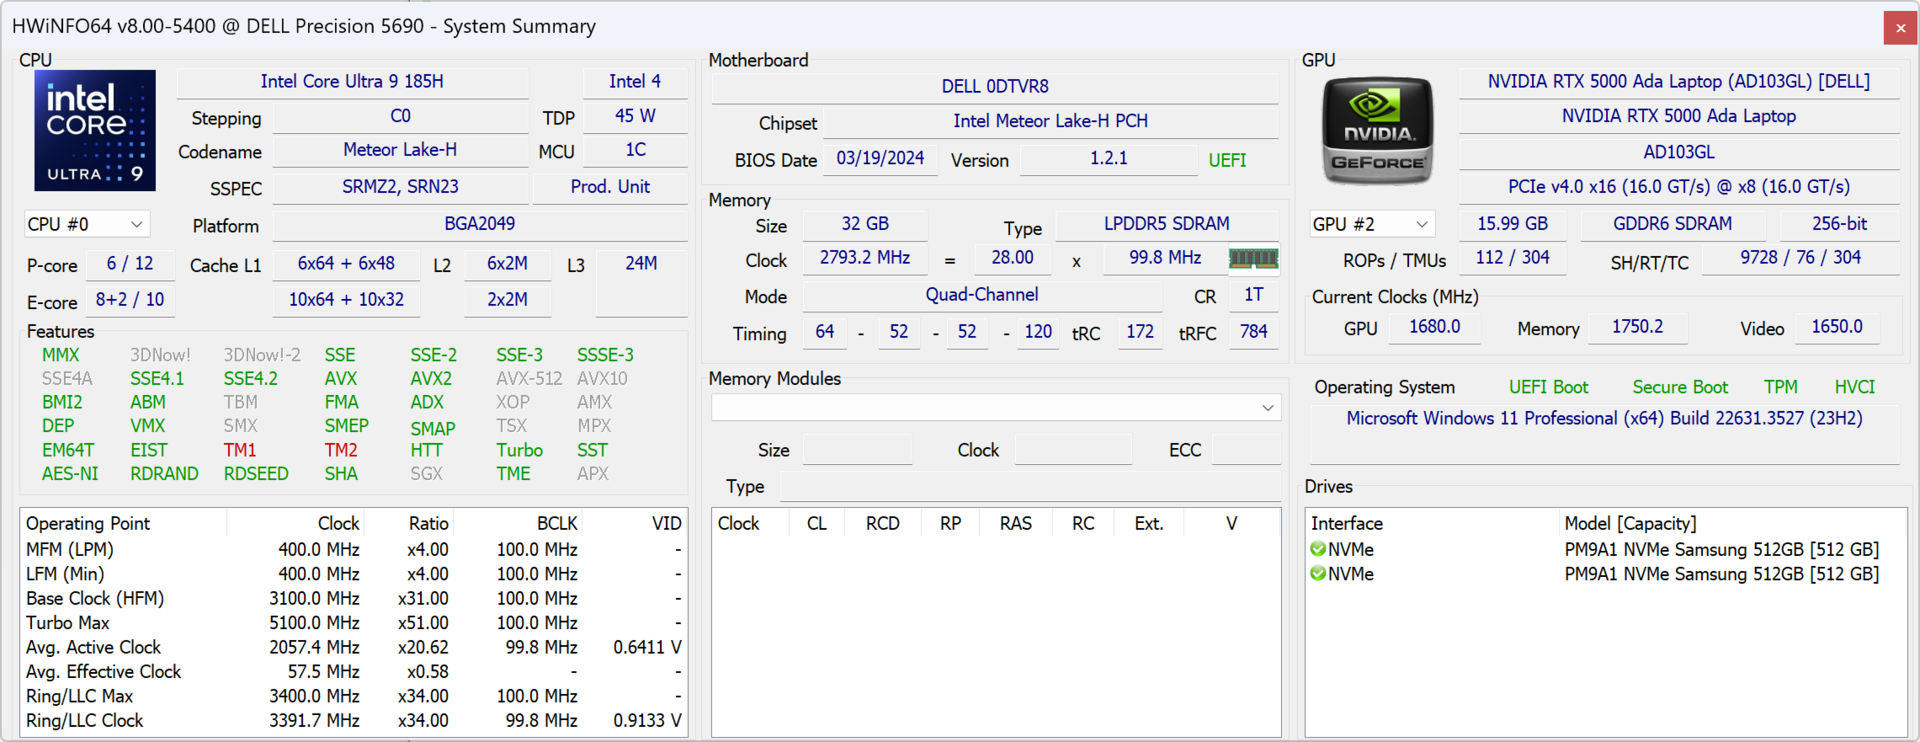
Nasza recenzowana jednostka to najwyższej klasy konfiguracja z procesorem Core Ultra 9 185H vPro, GPU Nvidia 5000 Ada i 16-calowym ekranem dotykowym OLED 2400p za około 5900 USD. Mniejsze SKU zaczynają się od Core Ultra 5 135H vPro, tylko zintegrowanej grafiki Arc i wyświetlacza IPS 1200p za jedyne 2300 USD.
Alternatywy dla Precision 5690 obejmują inne 16-calowe stacje robocze, takie jak Lenovo ThinkPad P16 G2, HP ZBook Fury 16 G10lub MSI CreatorPro Z16P.
Więcej recenzji Dell:
Potencjalni konkurenci w porównaniu
Ocena | Data | Model | Waga | Wysokość | Rozmiar | Rezolucja | Cena |
|---|---|---|---|---|---|---|---|
| 88.3 % v7 (old) | 05/2024 | Dell Precision 5690 Ultra 9 185H, NVIDIA RTX 5000 Ada Generation Laptop GPU | 2.3 kg | 22.17 mm | 16.00" | 3840x2400 | |
| 89 % v7 (old) | 08/2023 | Dell Precision 5000 5680 i9-13900H, NVIDIA RTX 5000 Ada Generation Laptop GPU | 2.3 kg | 22.17 mm | 16.00" | 3840x2400 | |
| 90.2 % v7 (old) | 03/2024 | Lenovo ThinkPad P16 G2 21FA000FGE i7-13700HX, NVIDIA RTX 2000 Ada Generation Laptop GPU | 3 kg | 30.23 mm | 16.00" | 2560x1600 | |
| 91.7 % v7 (old) | 10/2023 | Lenovo ThinkPad P1 G6-21FV000DGE i9-13900H, NVIDIA RTX 2000 Ada Generation Laptop GPU | 1.9 kg | 17.5 mm | 16.00" | 2560x1600 | |
| 92.3 % v7 (old) | 09/2023 | HP ZBook Fury 16 G10 i9-13950HX, NVIDIA RTX 5000 Ada Generation Laptop GPU | 2.6 kg | 28.5 mm | 16.00" | 3840x2400 | |
| 84.3 % v7 (old) | 11/2022 | MSI CreatorPro Z16P B12UKST i7-12700H, RTX A3000 Laptop GPU | 2.4 kg | 19 mm | 16.00" | 2560x1600 |
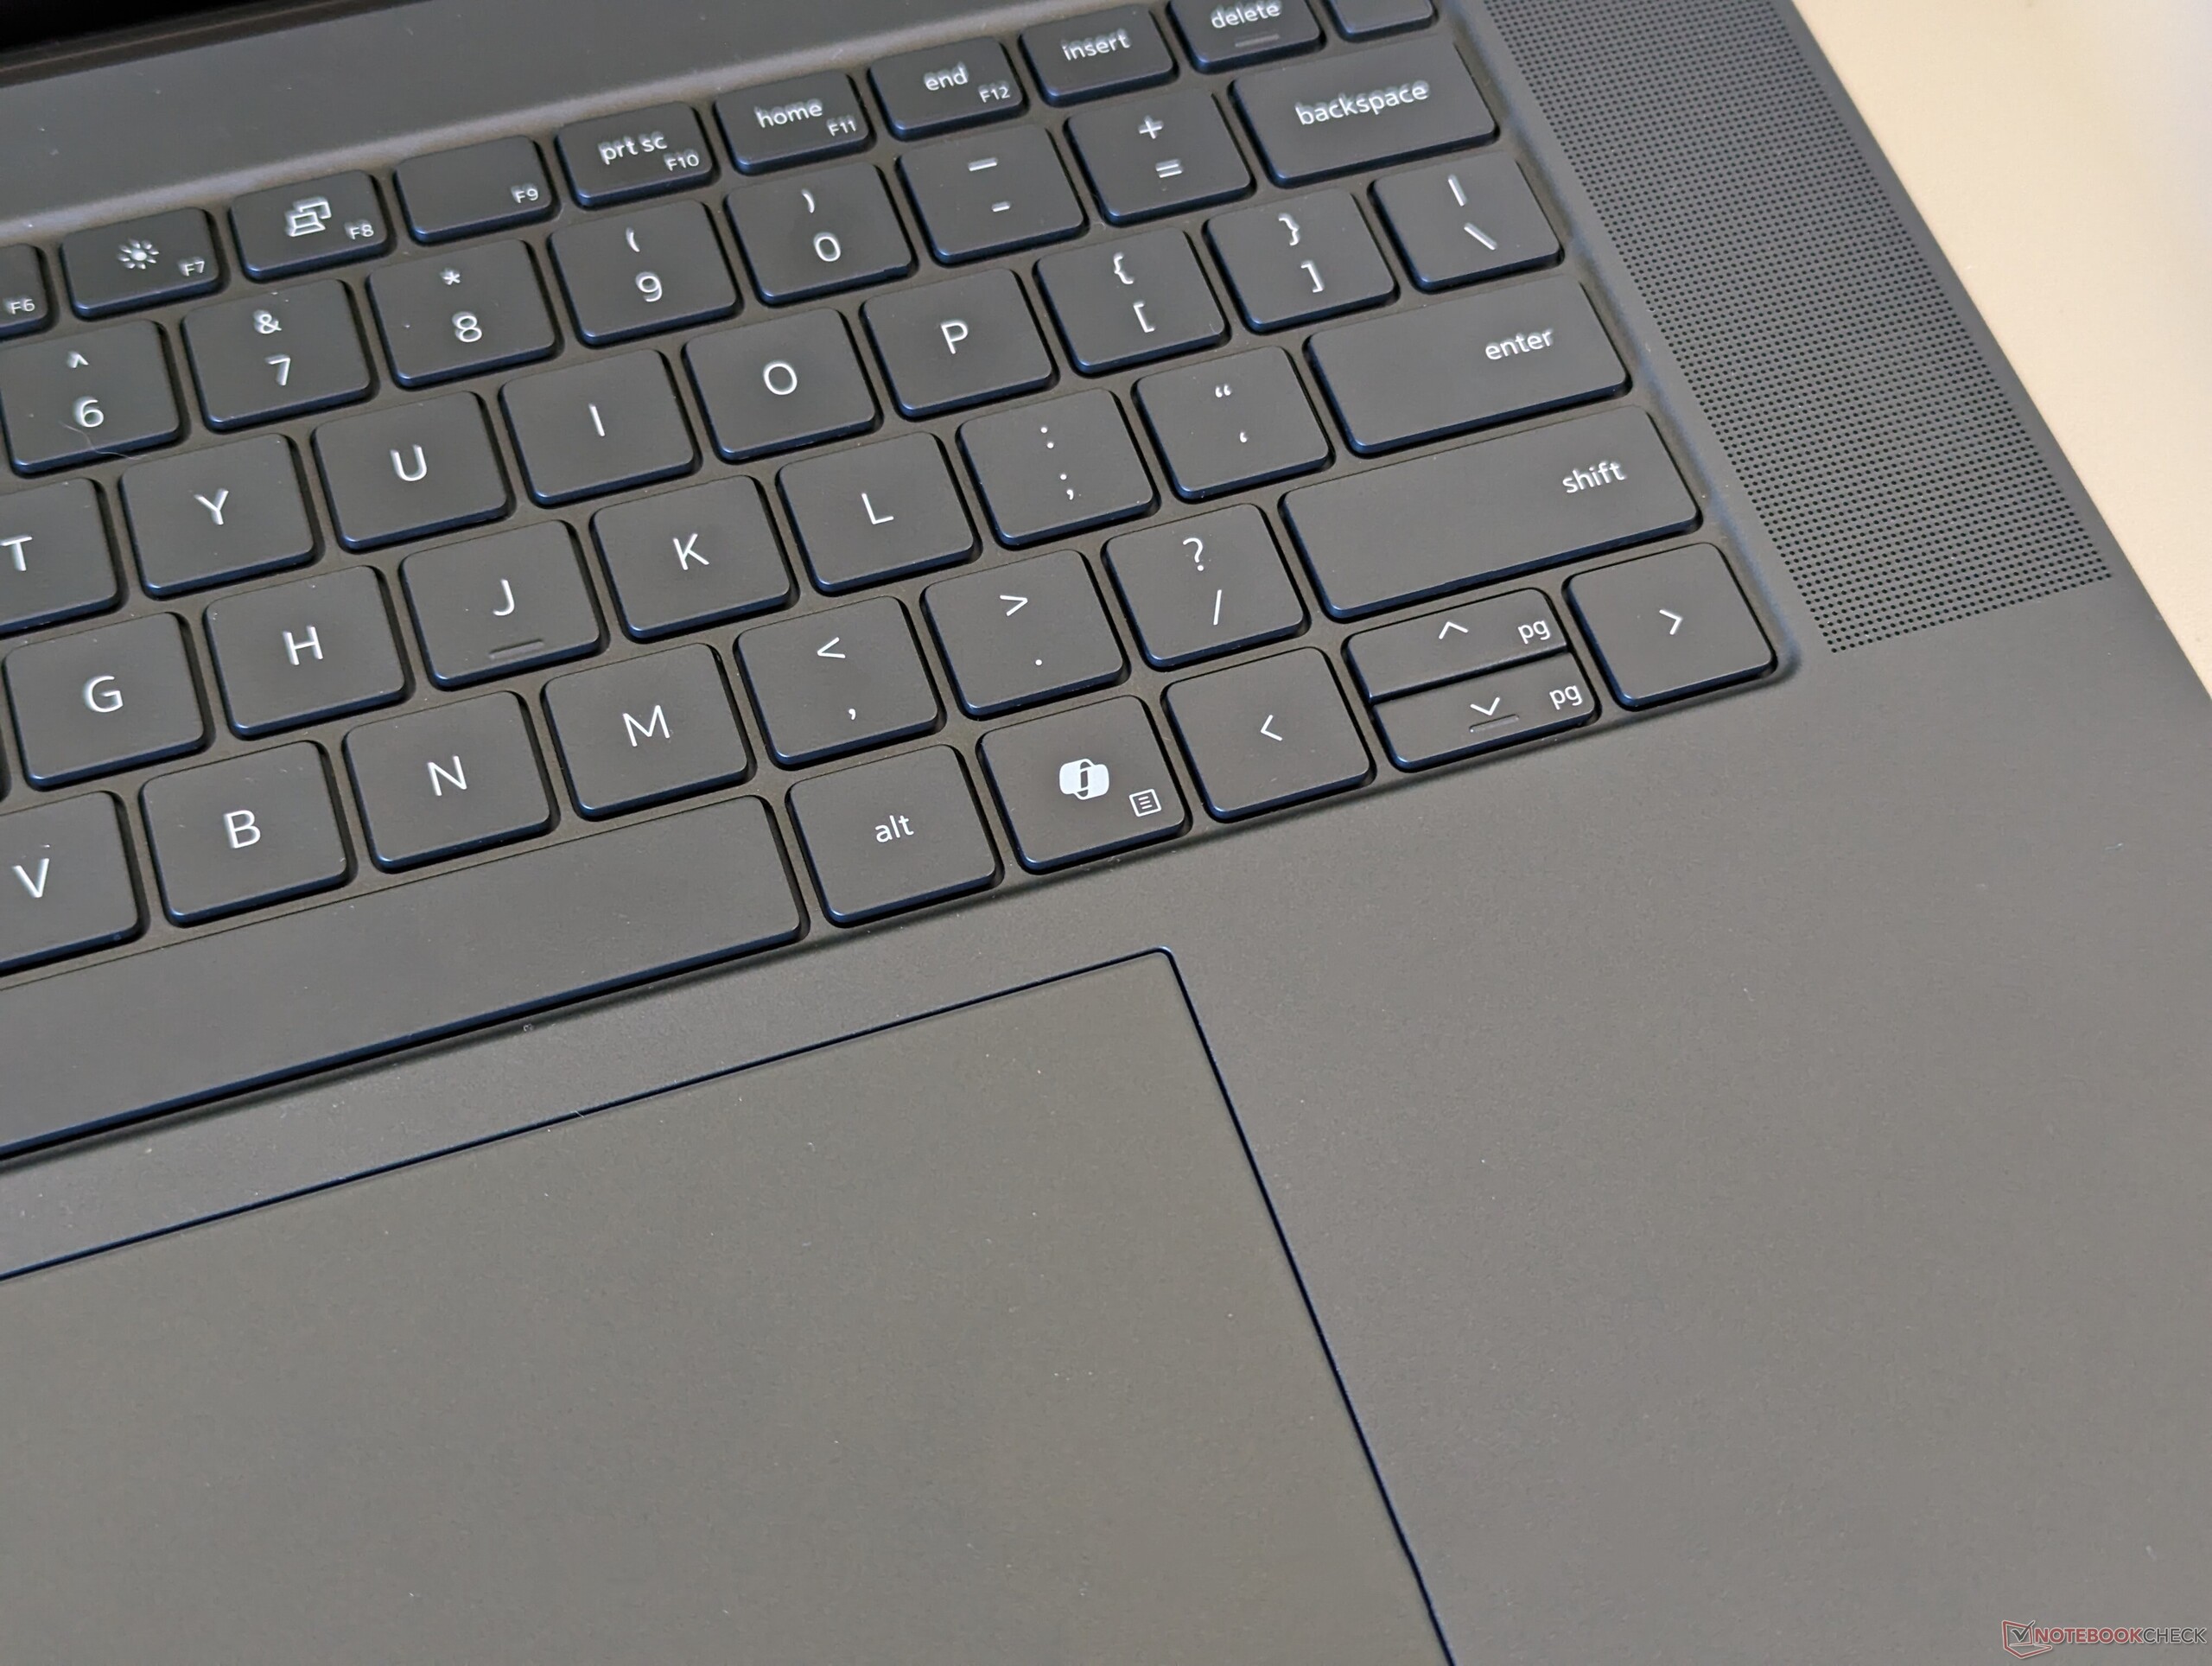
Obudowa - Inspired By XPS 16
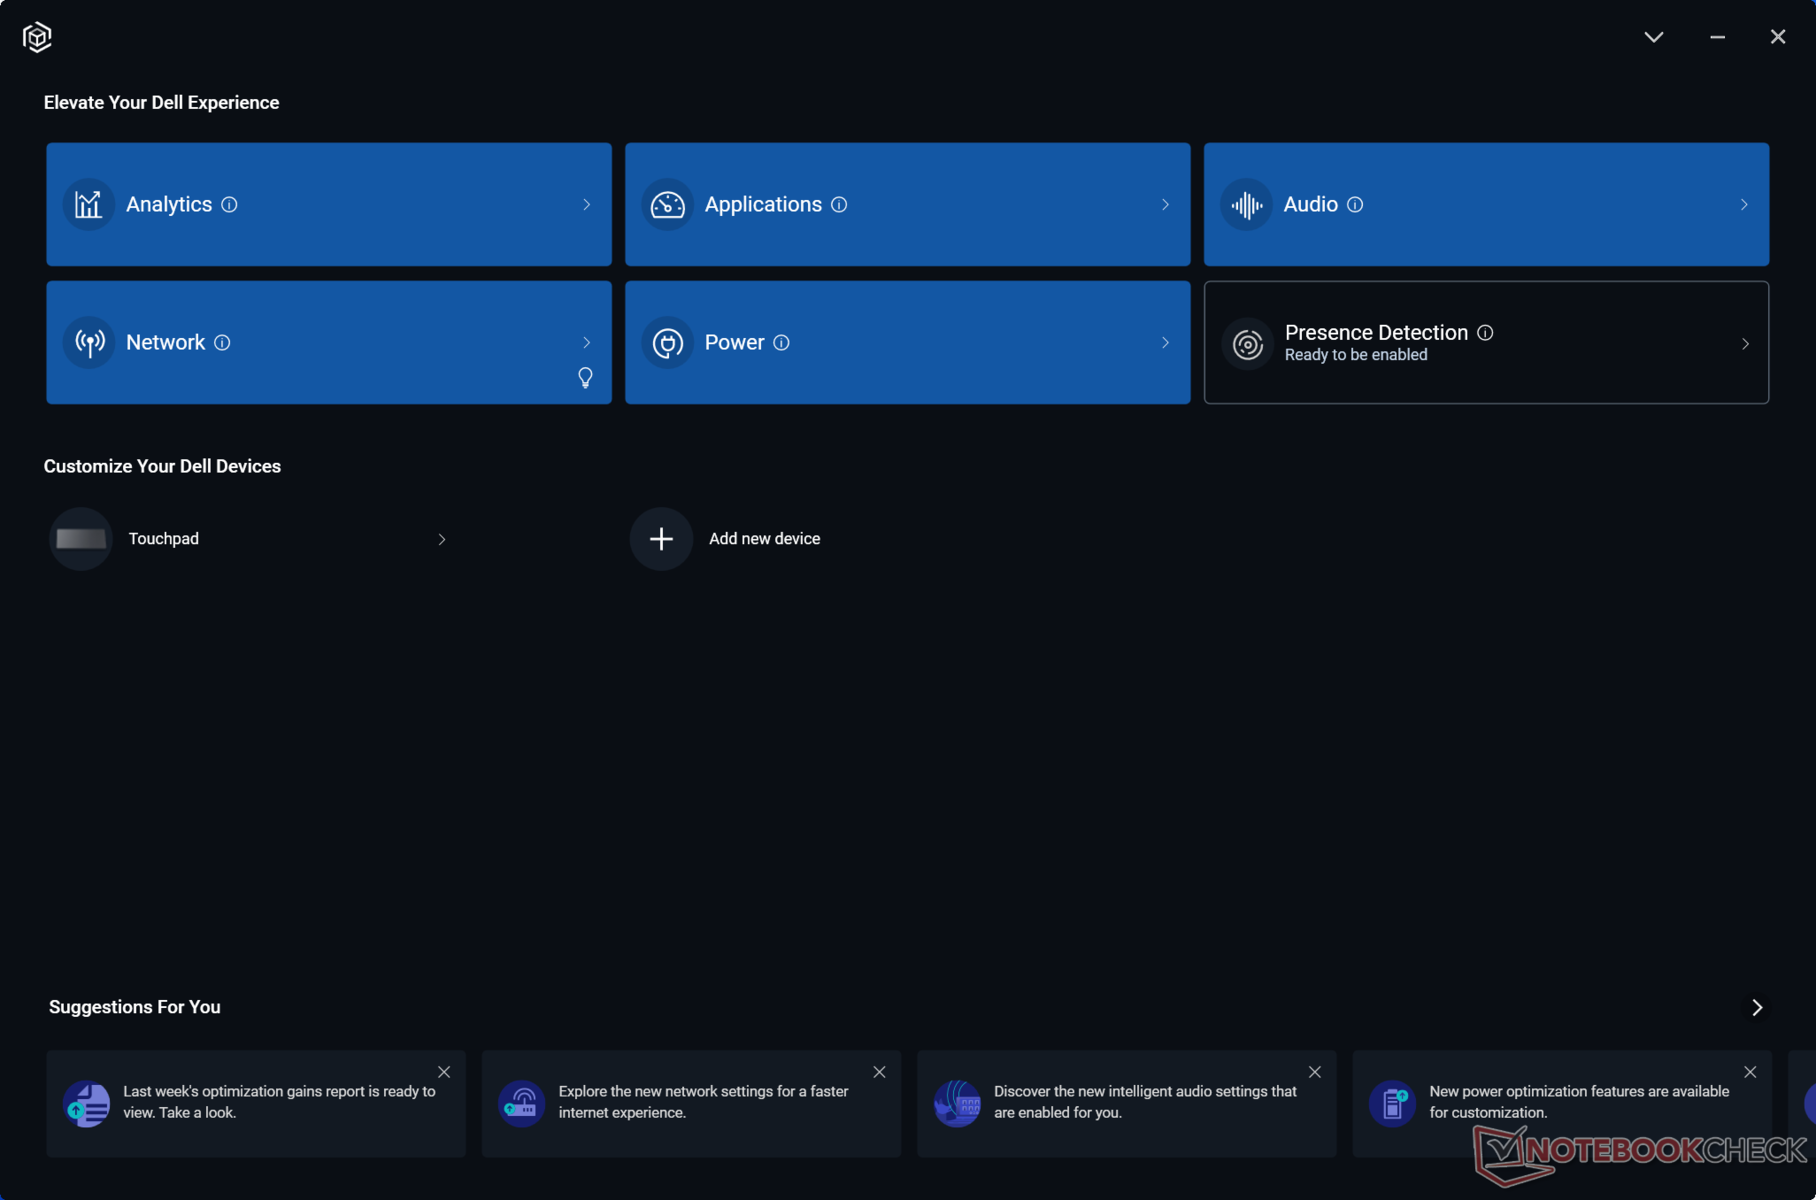
Klawiatura zawiera teraz dedykowany klawisz Microsoft Co-Pilot w miejscu prawego klawisza Ctrl, aby wizualnie oddzielić Precision 5690 od 5680.
Łączność


Komunikacja
WLAN został zaktualizowany z Intel AX211 do Intel BE200, aby obsługiwać łączność Wi-Fi 7. Jednak zdecydowana większość użytkowników nadal jest ograniczona do Wi-Fi 6E lub starszych sieci, więc większość z nich na razie nie zauważy żadnych korzyści w zakresie wydajności.
Kamera internetowa

")
")
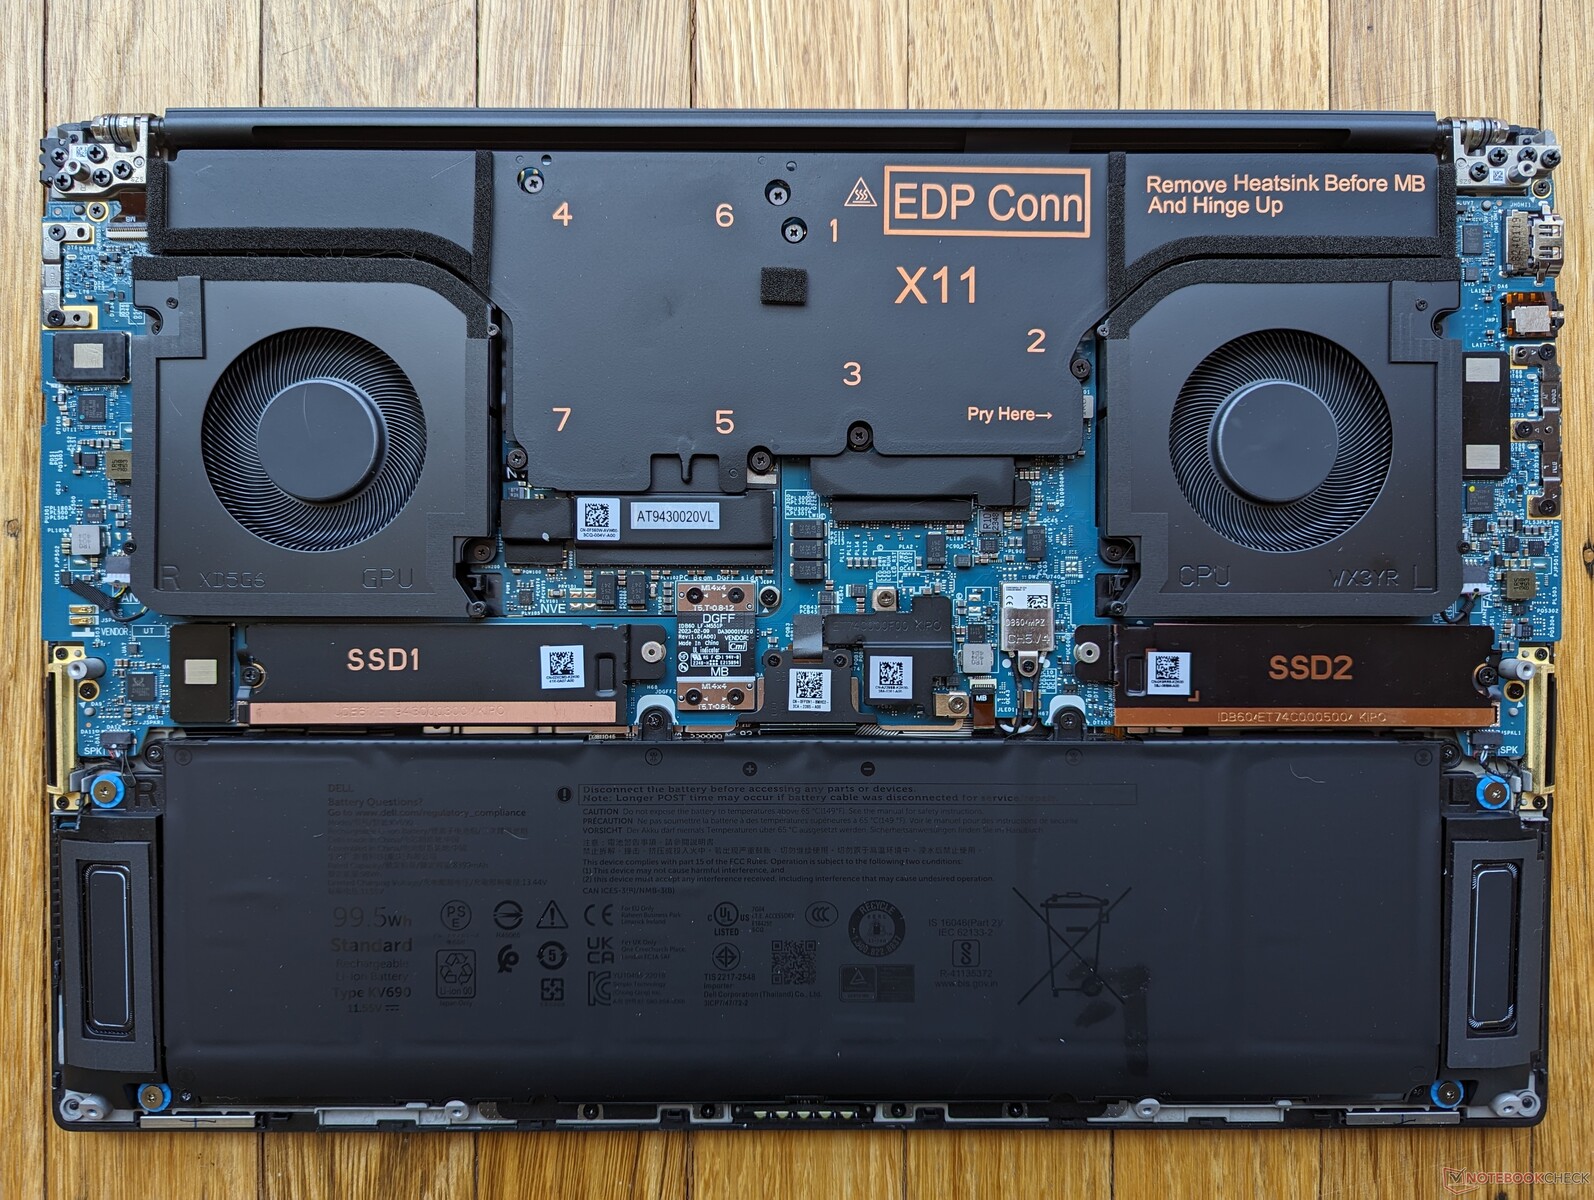
Konserwacja
Nie ma znaczących wewnętrznych różnic między Precision 5690 i starszym 5680.

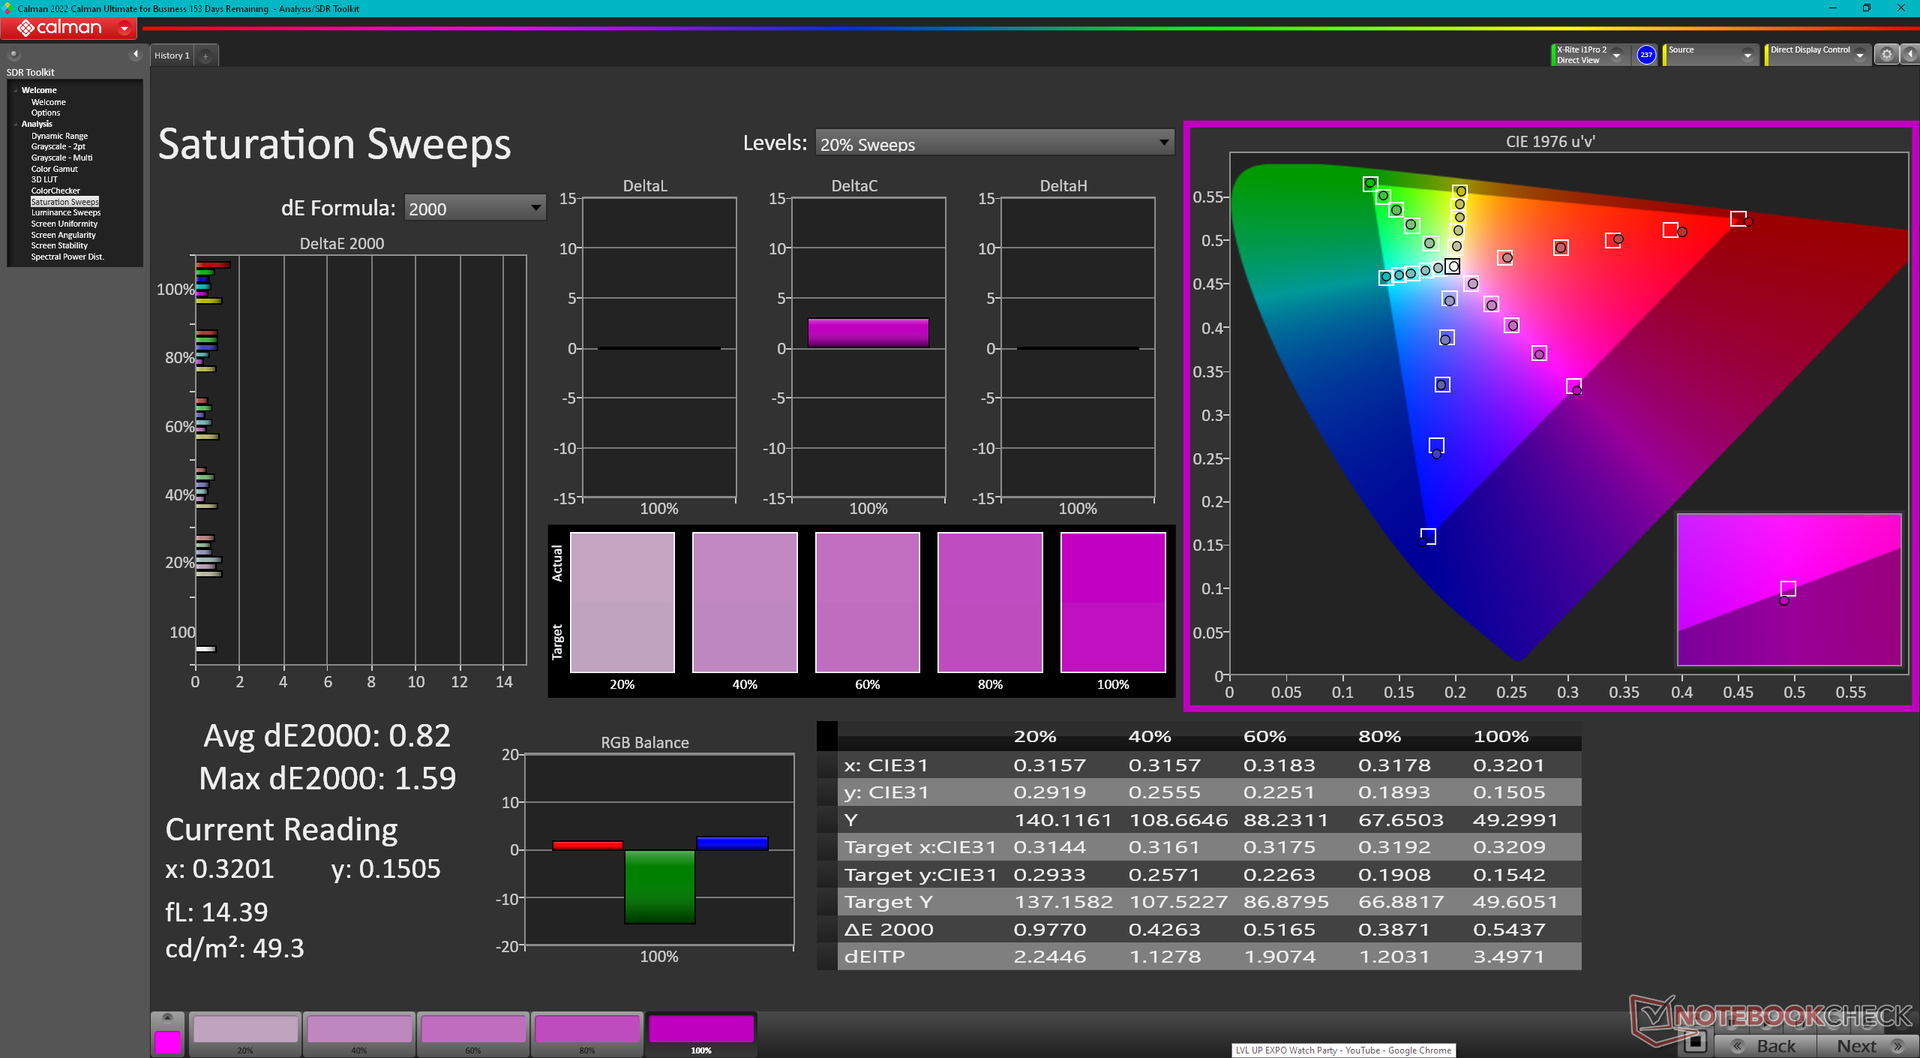
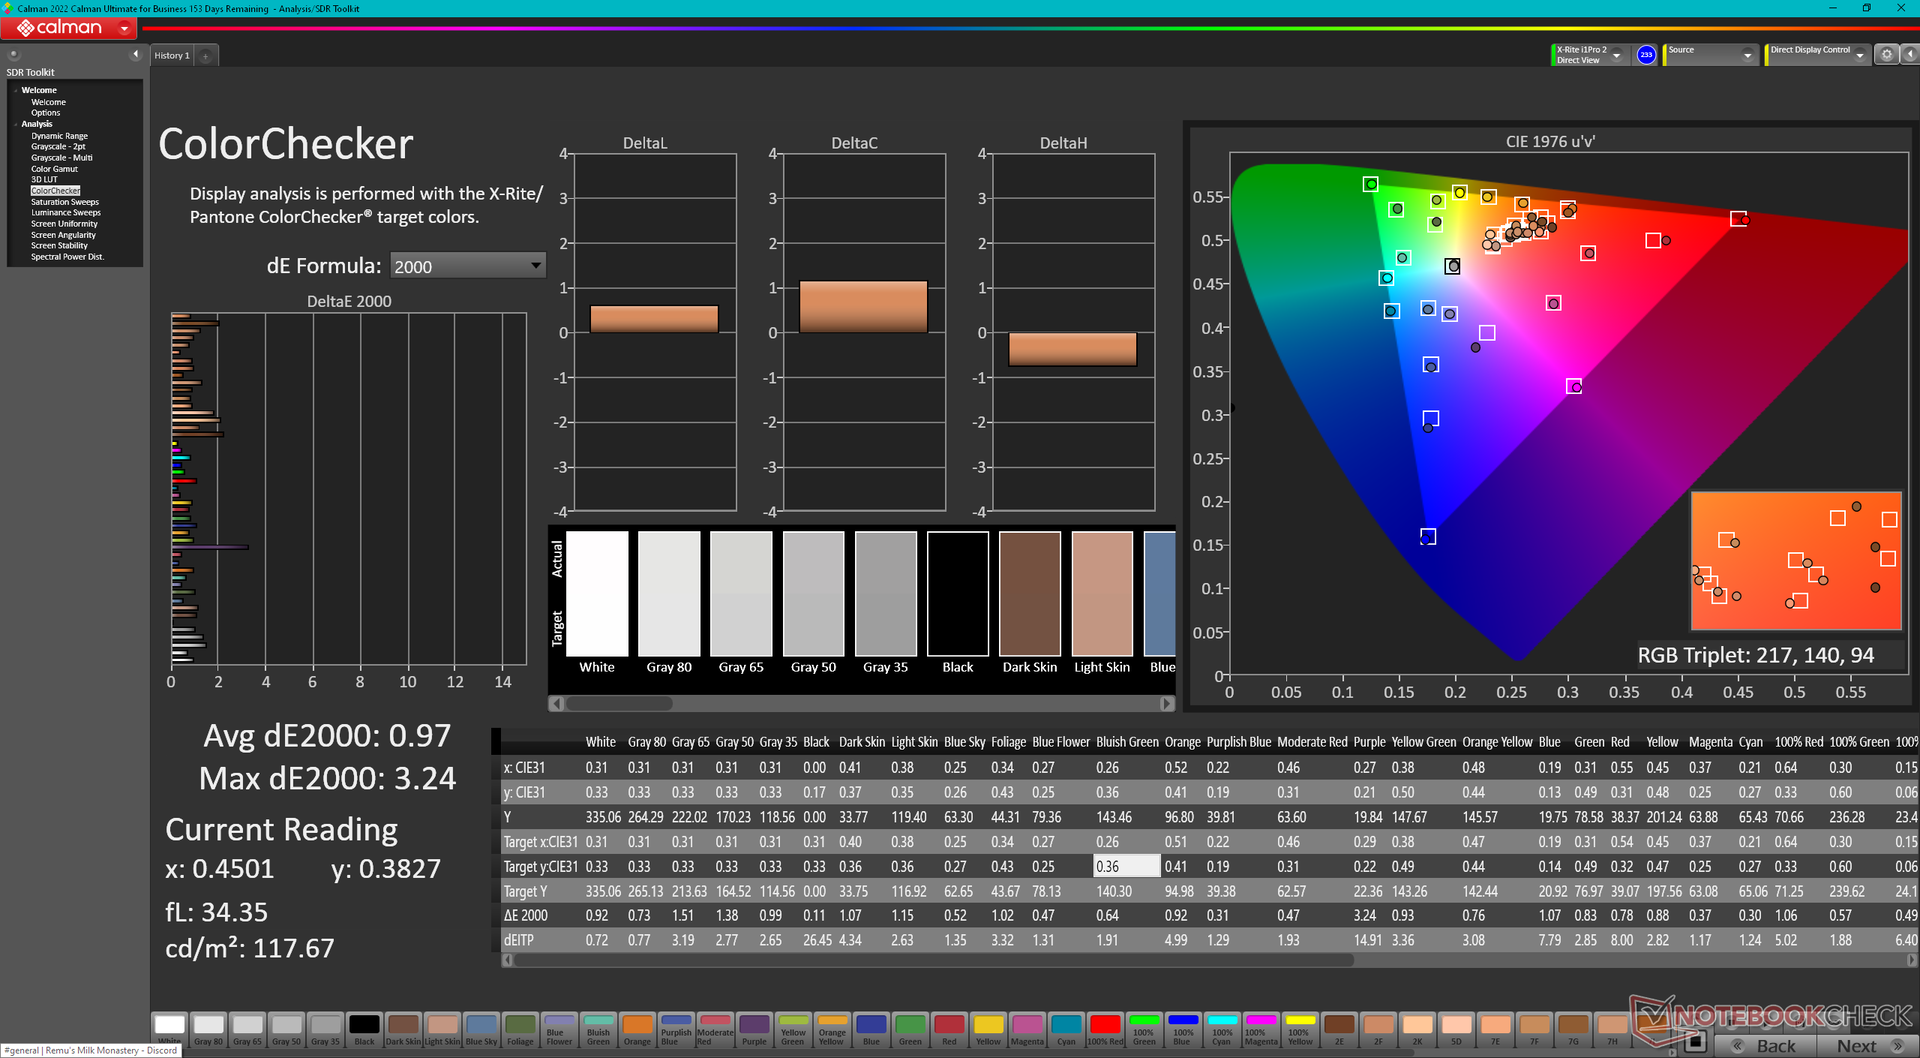
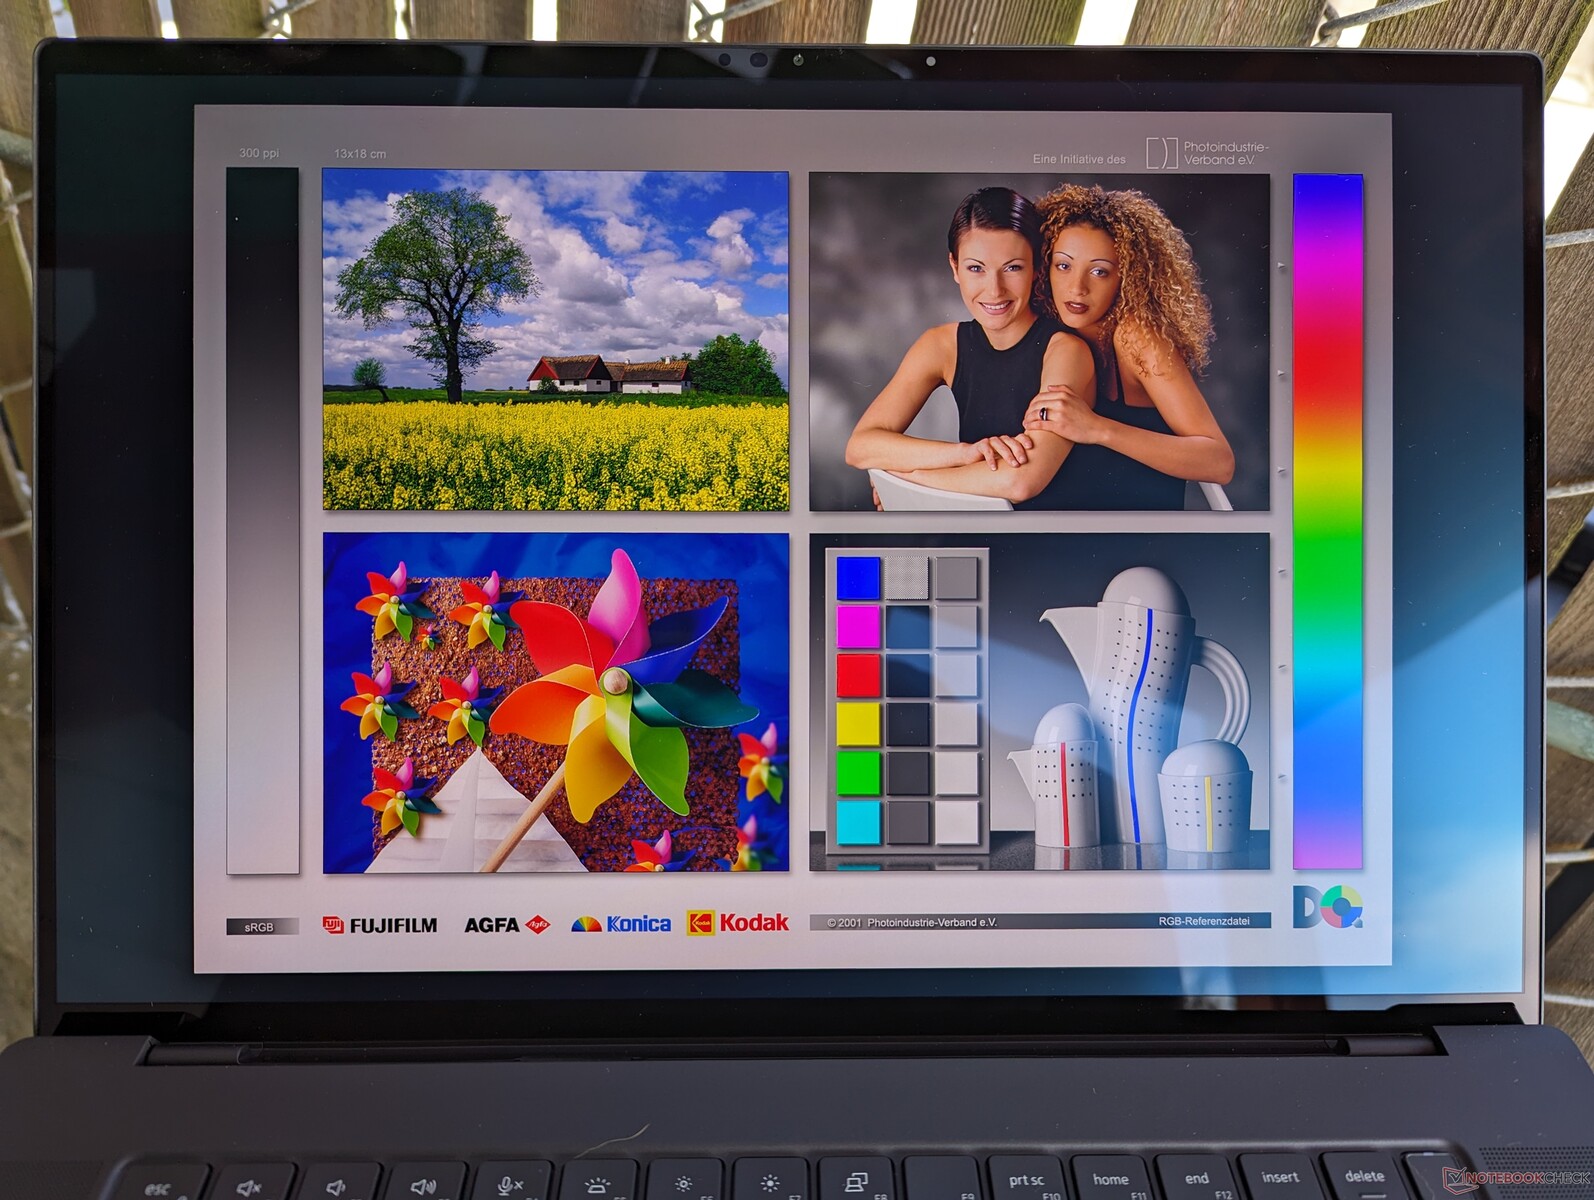
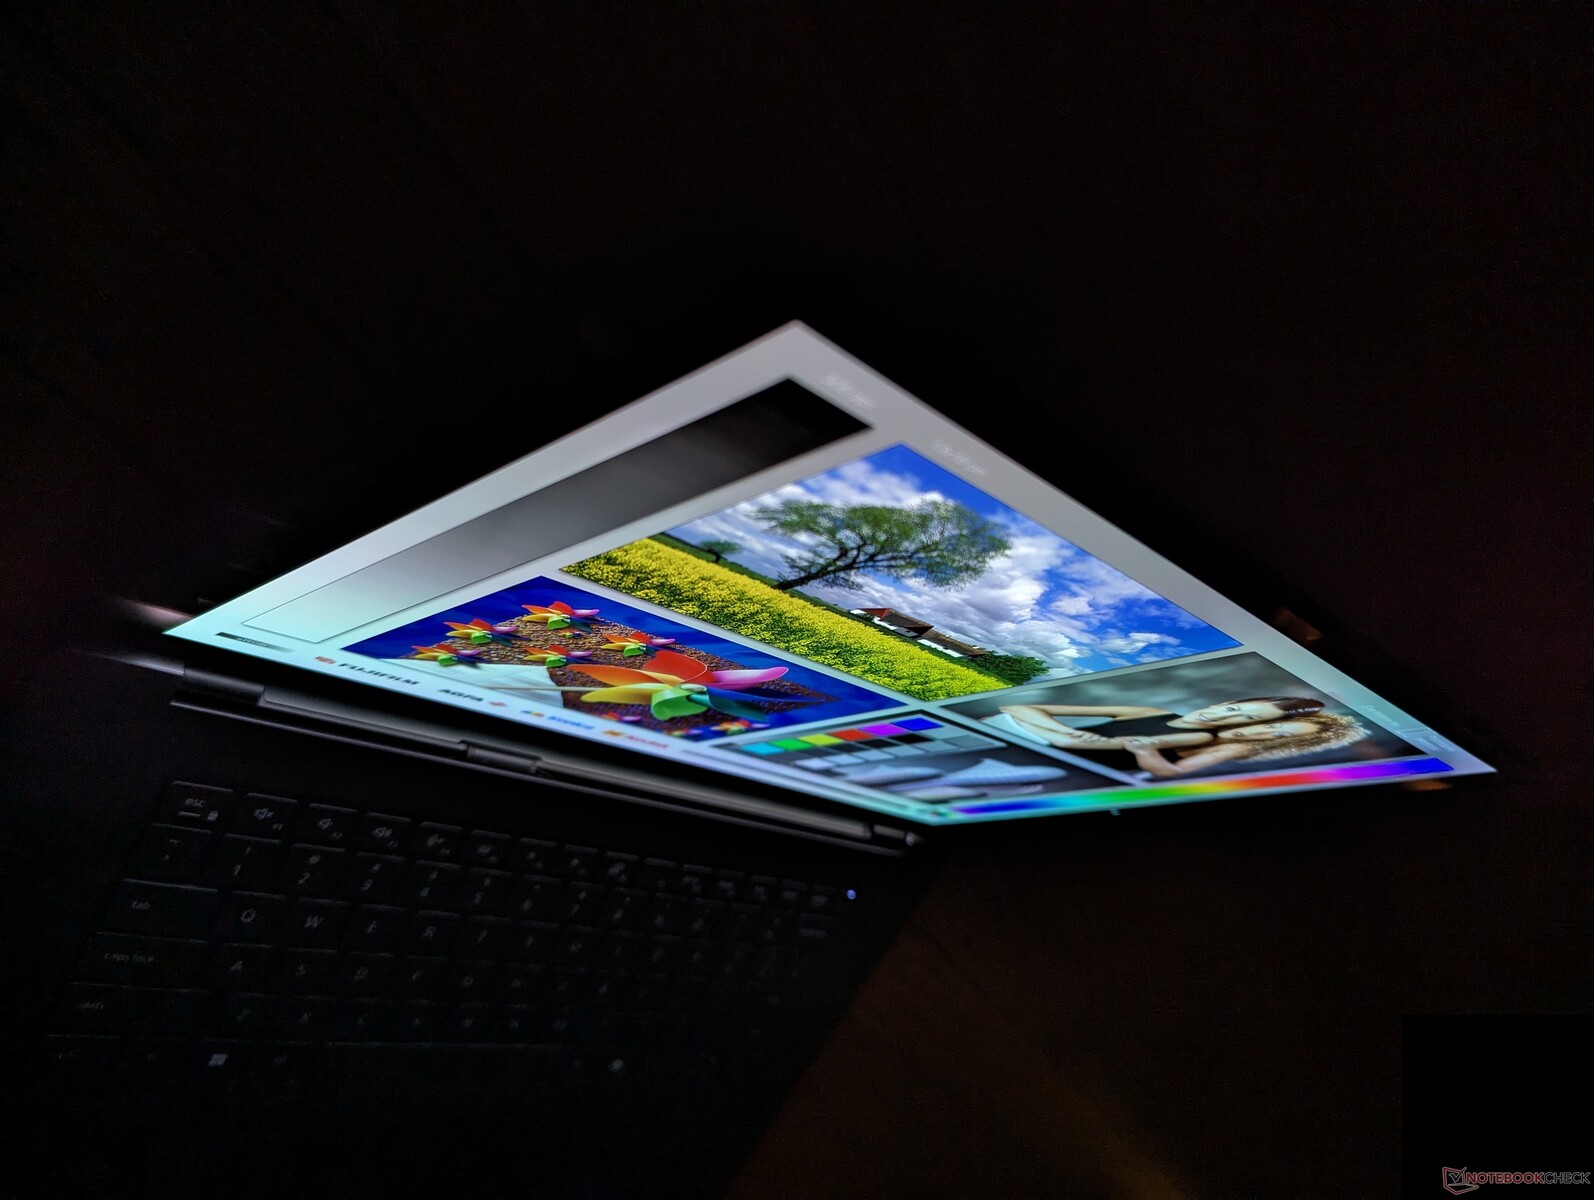
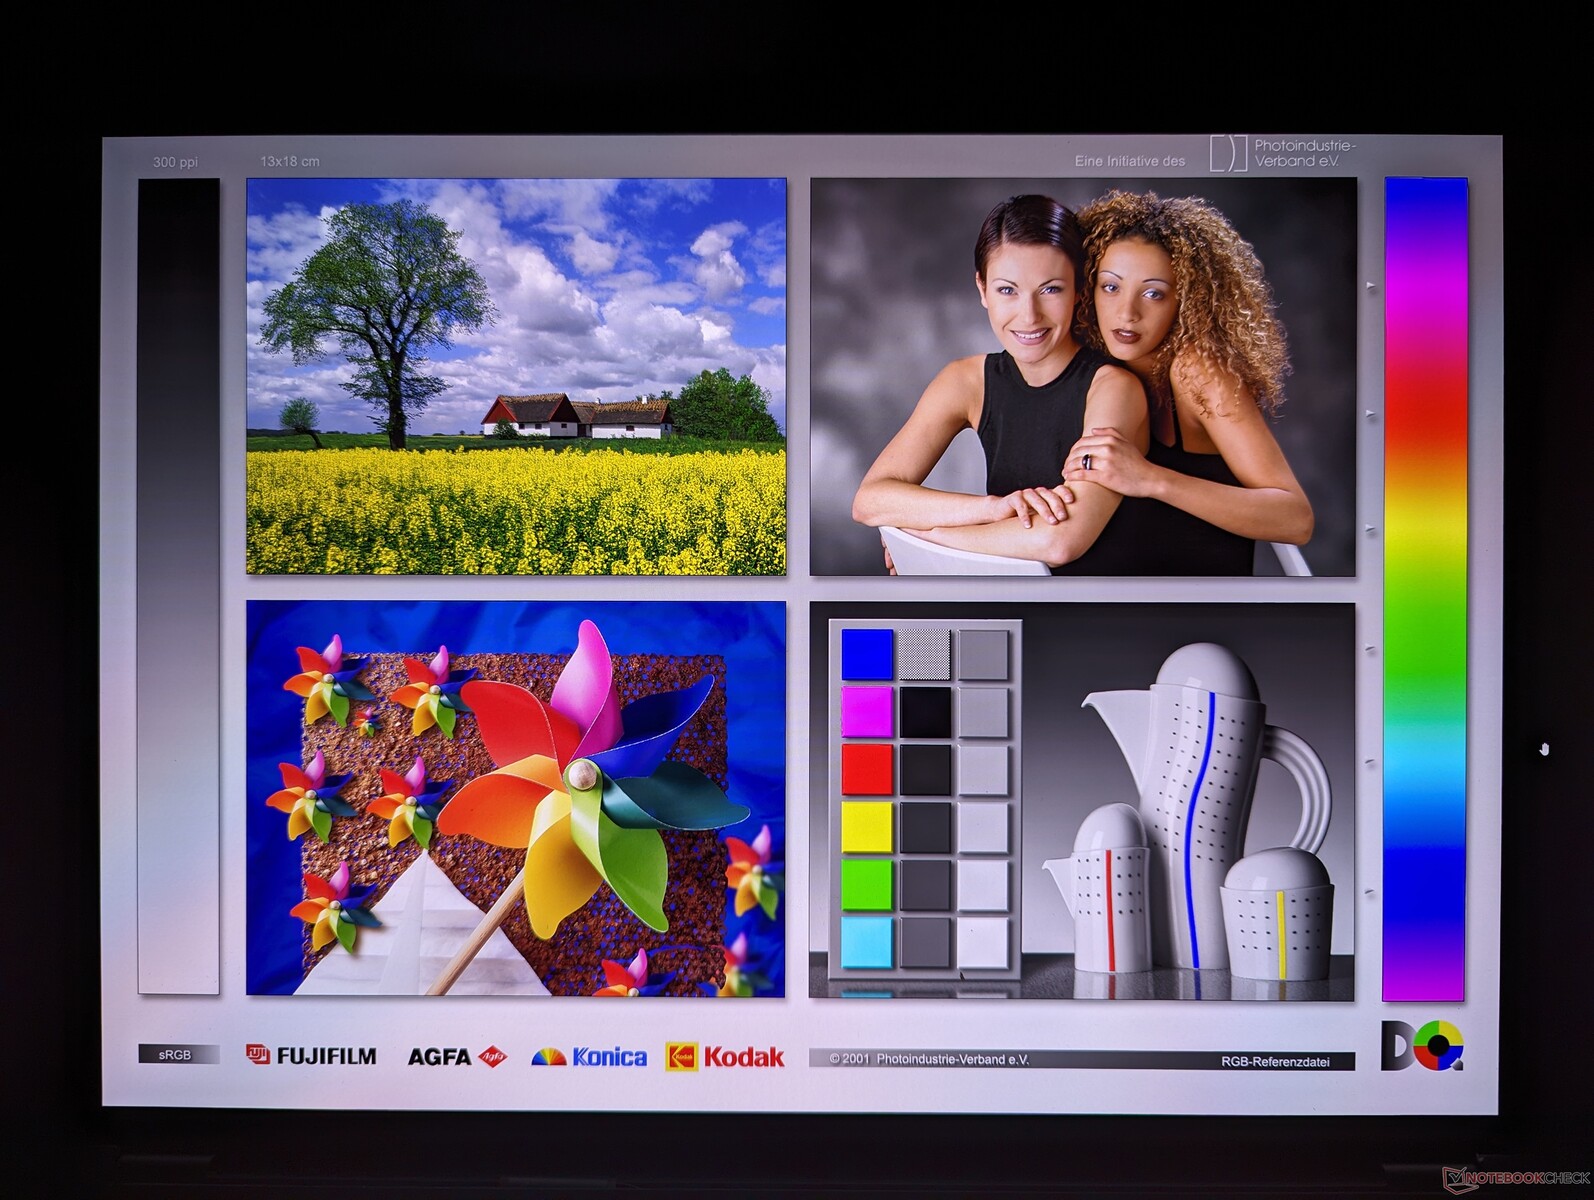
Wyświetlacz - HDR OLED przy 60 Hz

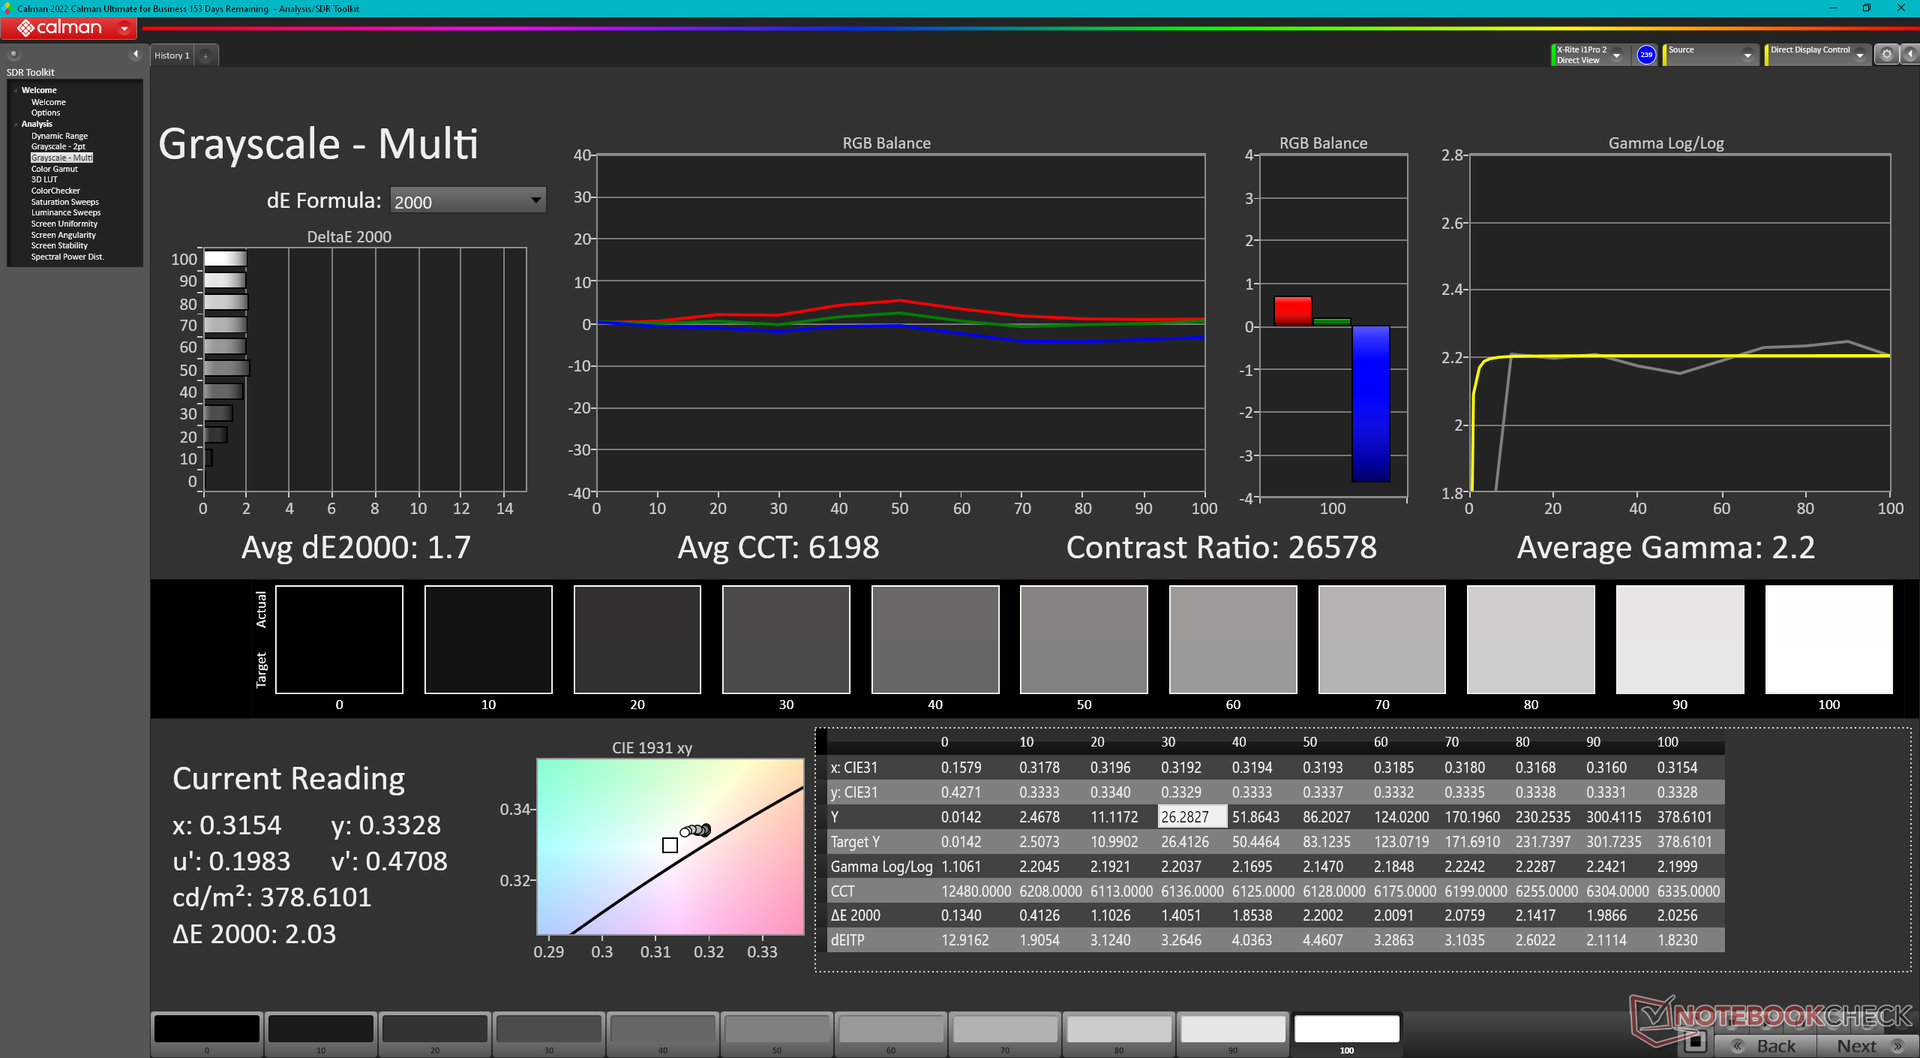
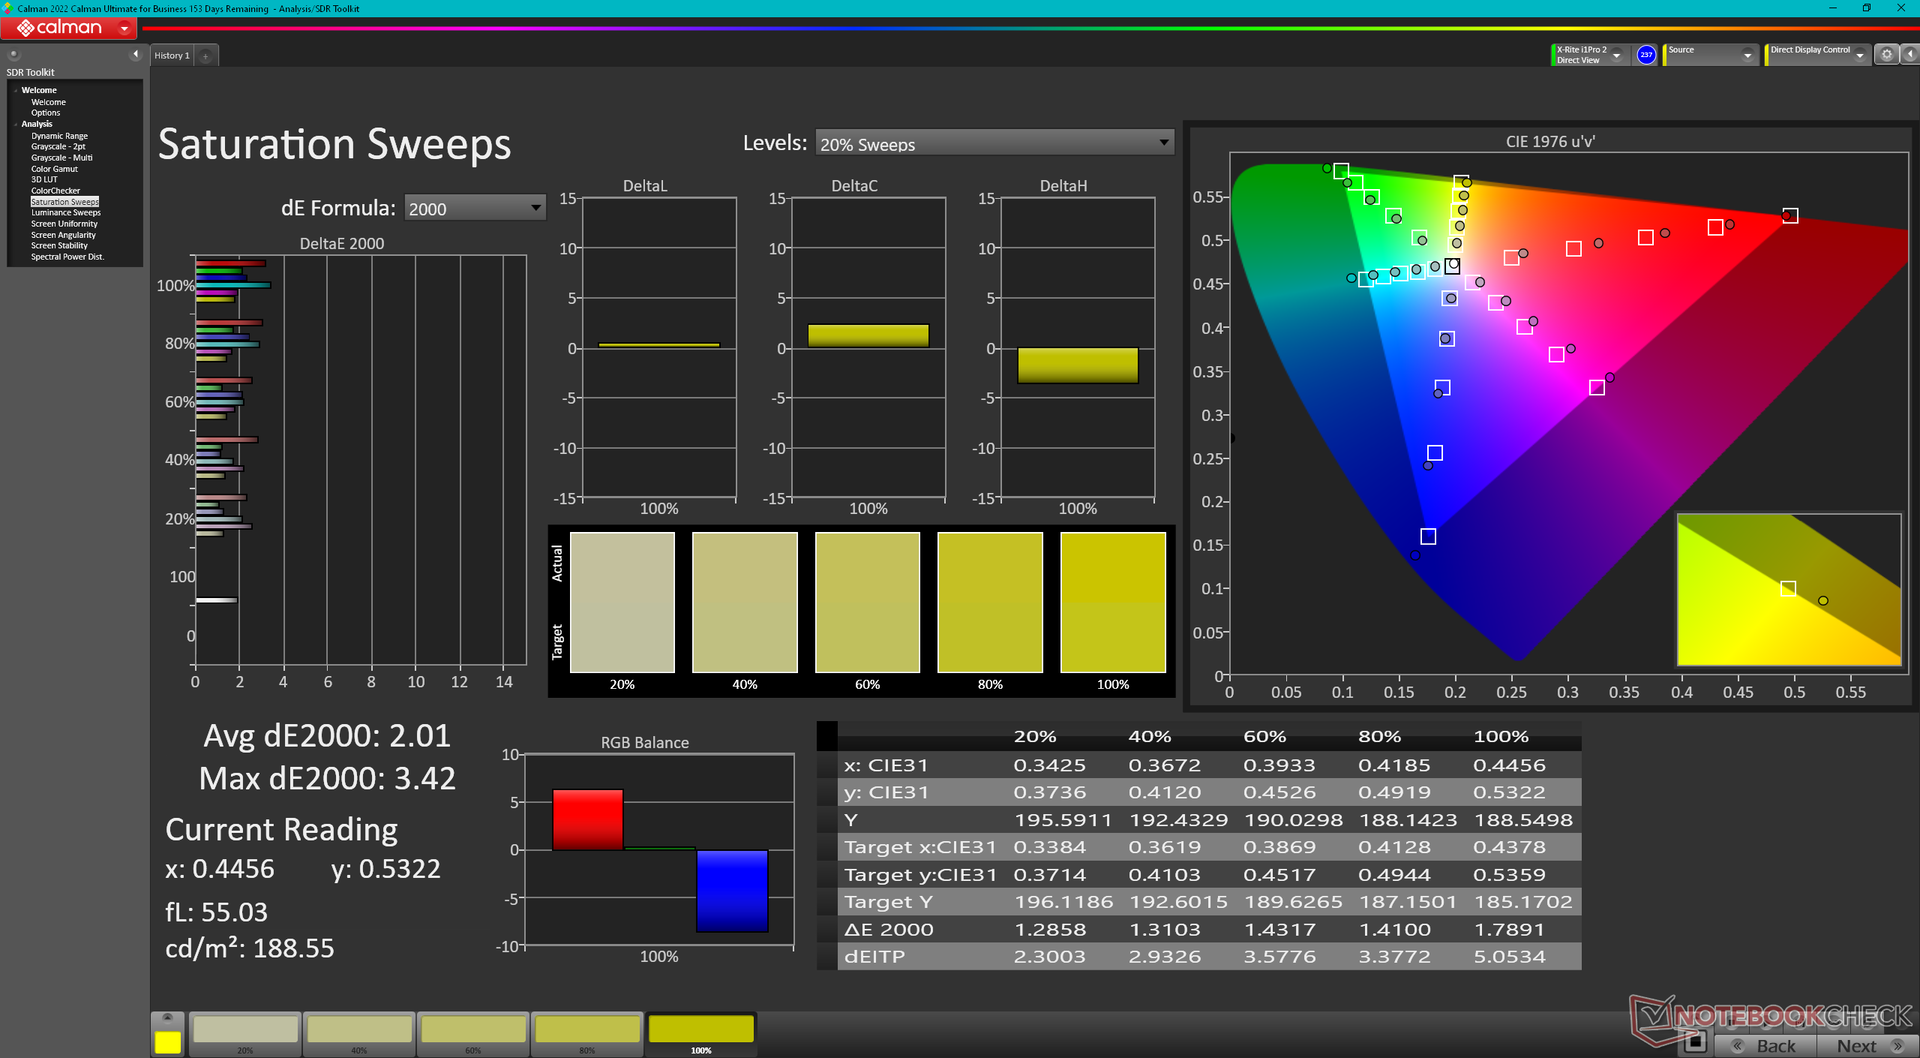
Model 2024 wykorzystuje ten sam panel 4K Samsung 160YV03 OLED i numer części D3KJF, co w poprzednim roku, bez żadnych zmian w zakresie wrażeń wizualnych. Z jednej strony jest to doskonałe rozwiązanie, ponieważ panel OLED jest wstępnie skalibrowany z pełnymi kolorami DCI-P3 i obsługą dotykową. Z drugiej strony, byłoby wspaniale zobaczyć wyższe częstotliwości odświeżania z opcjami adaptacyjnymi, ponieważ standardowa częstotliwość odświeżania 60 Hz zaczyna się starzeć.
Maksymalna jasność w trybach SDR i HDR może osiągnąć odpowiednio 350 nitów i 600 nitów.
| |||||||||||||||||||||||||
rozświetlenie: 97 %
na akumulatorze: 348.1 cd/m²
kontrast: ∞:1 (czerń: 0 cd/m²)
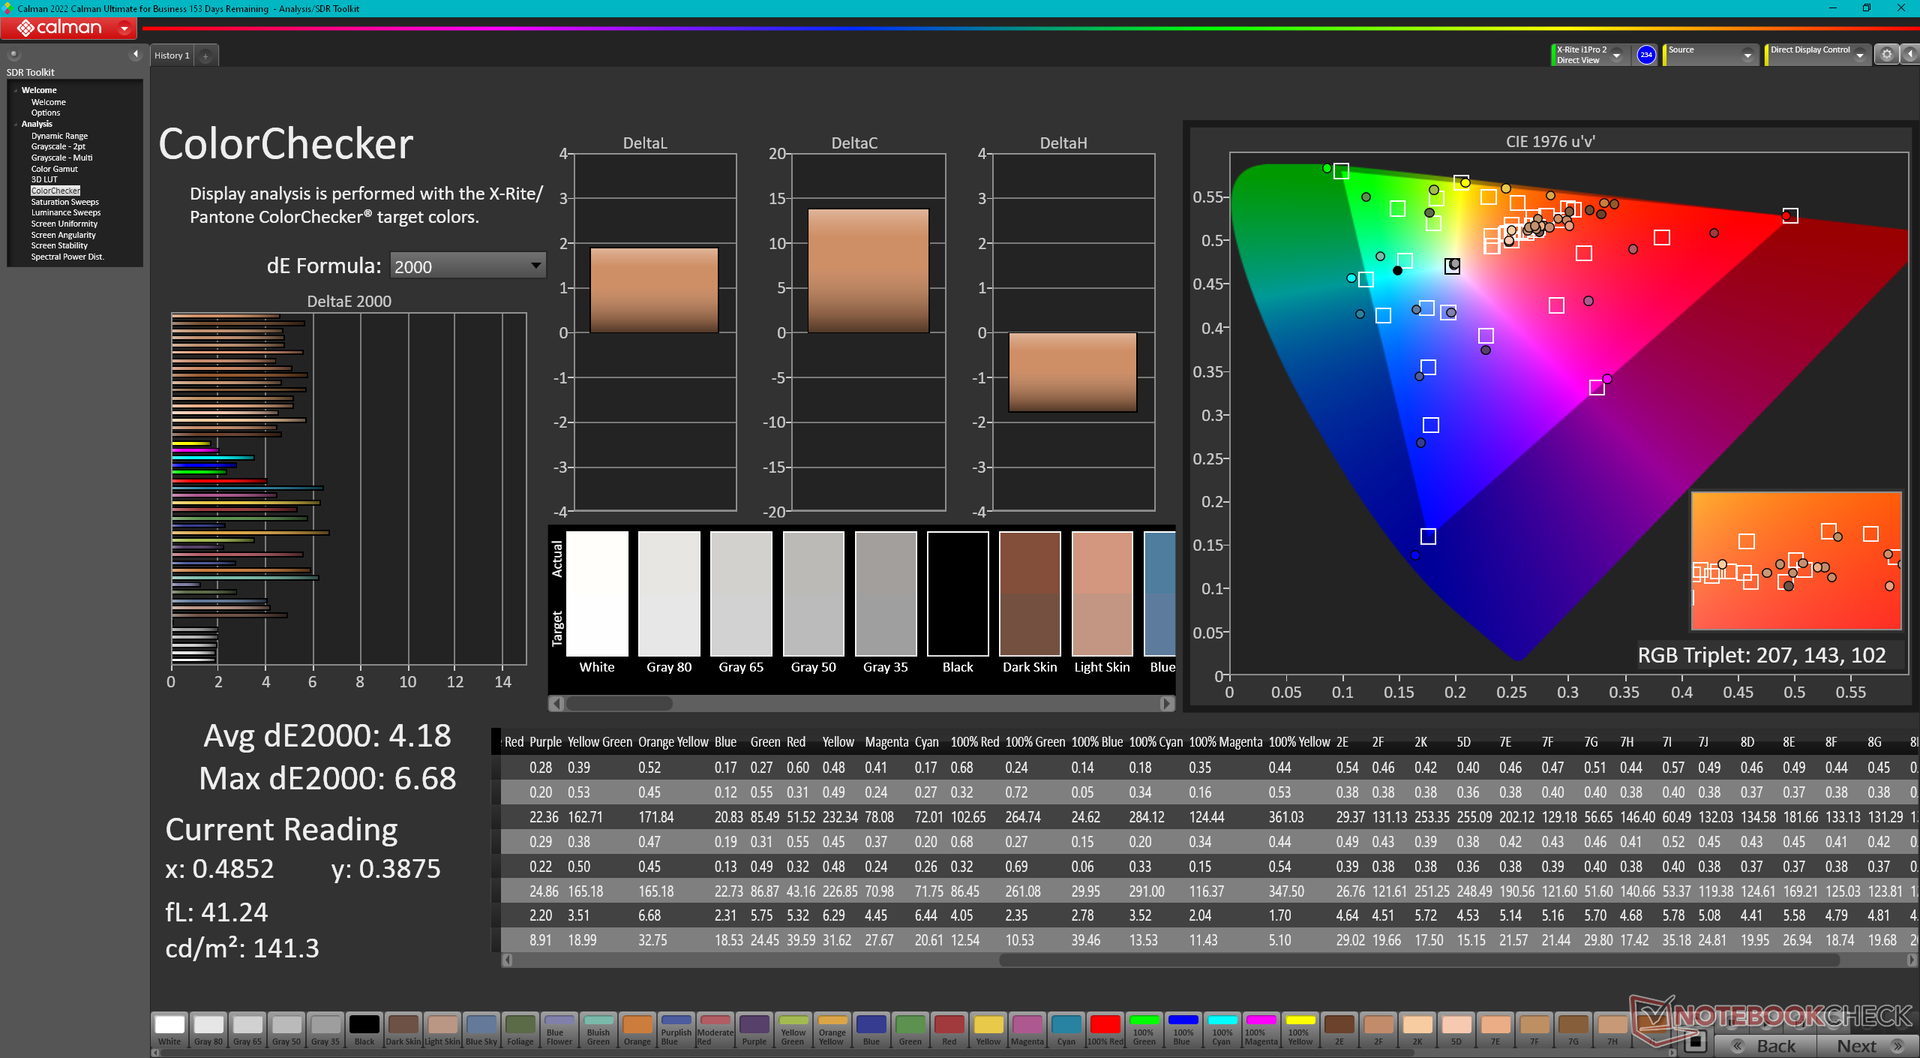
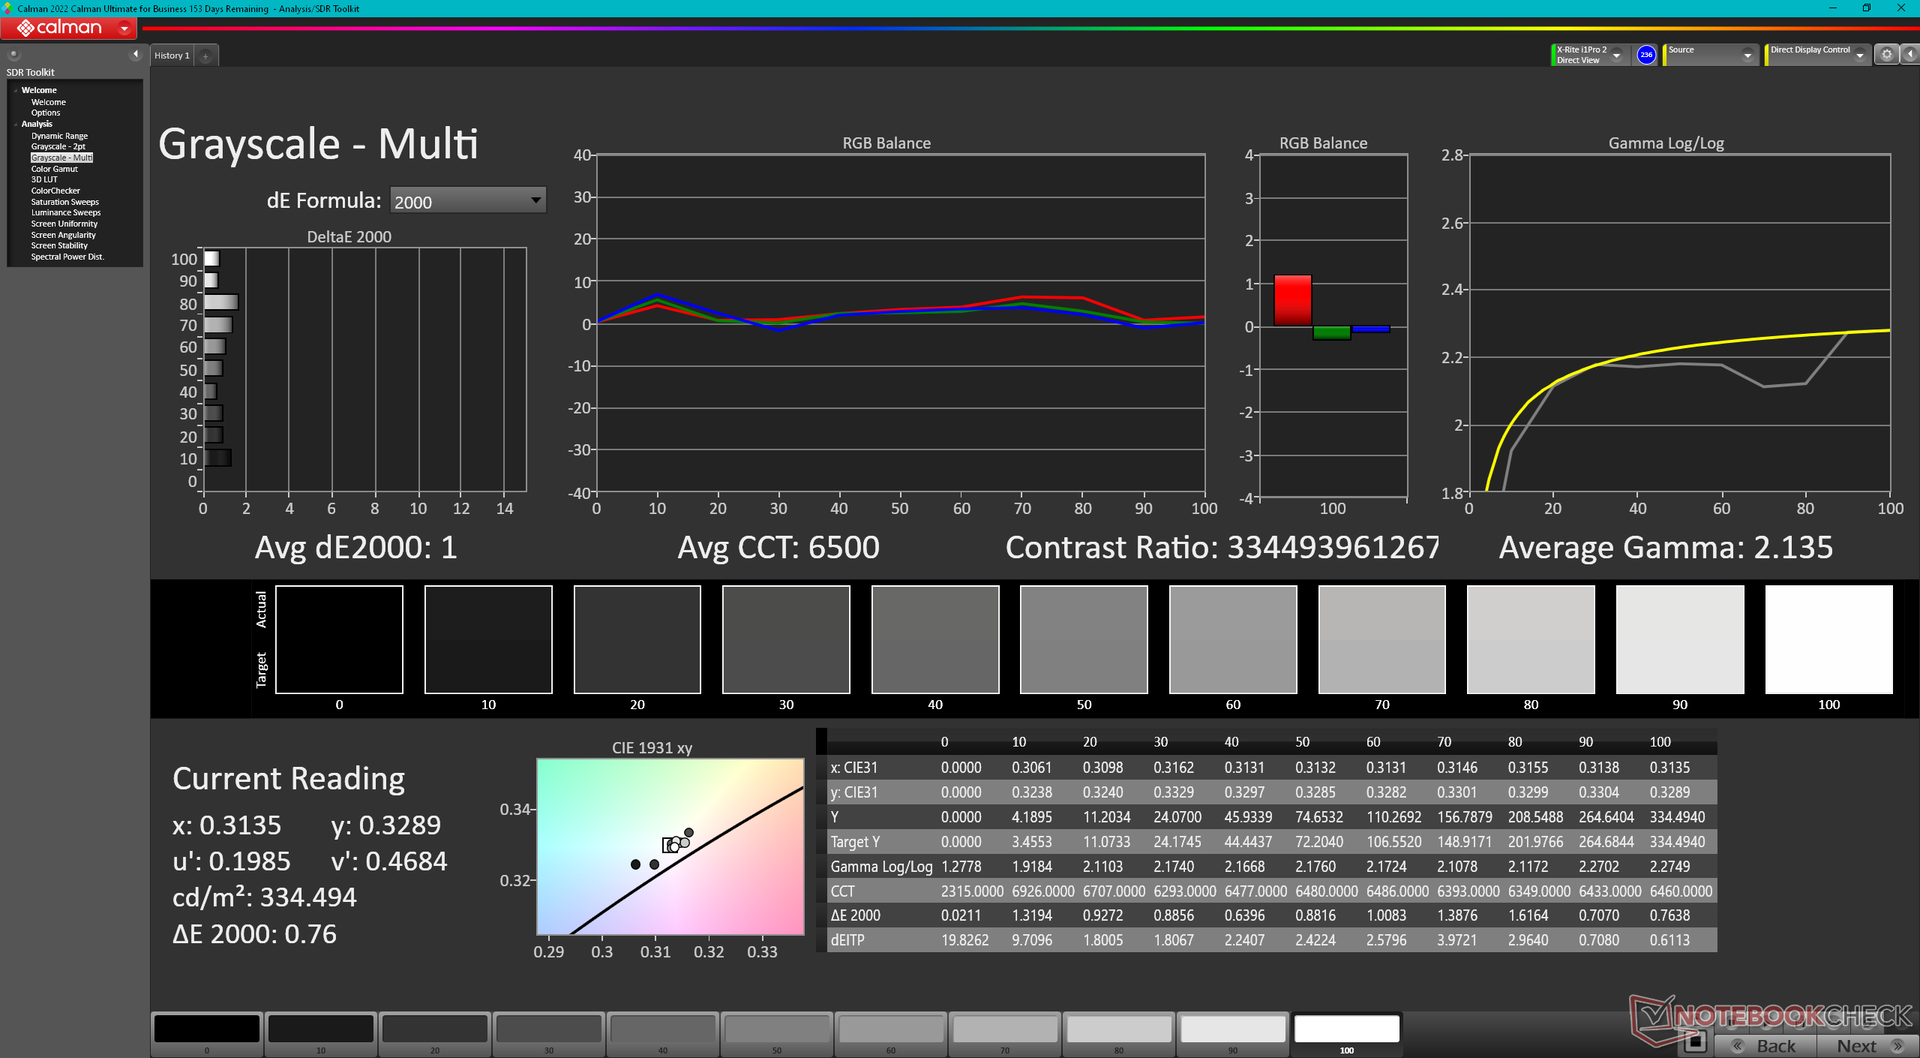
ΔE Color 4.18 | 0.5-29.43 Ø4.87, calibrated: 0.97
ΔE Greyscale 1.7 | 0.5-98 Ø5.1
96.6% AdobeRGB 1998 (Argyll 2.2.0 3D)
100% sRGB (Argyll 2.2.0 3D)
99.8% Display P3 (Argyll 2.2.0 3D)
Gamma: 2.2
| Dell Precision 5690 Samsung 160YV03, OLED, 3840x2400, 16" | Dell Precision 5000 5680 Samsung 160YV03, OLED, 3840x2400, 16" | Lenovo ThinkPad P16 G2 21FA000FGE MNG007DA1-9, IPS LED, 2560x1600, 16" | Lenovo ThinkPad P1 G6-21FV000DGE NE160QDM-NY1, IPS, 2560x1600, 16" | HP ZBook Fury 16 G10 AUO87A8, IPS, 3840x2400, 16" | MSI CreatorPro Z16P B12UKST B160QAN02.N, IPS, 2560x1600, 16" | |
|---|---|---|---|---|---|---|
| Display | 0% | -18% | -20% | -4% | -4% | |
| Display P3 Coverage | 99.8 | 99.9 0% | 71 -29% | 68.1 -32% | 98 -2% | 97.6 -2% |
| sRGB Coverage | 100 | 100 0% | 99.2 -1% | 97.5 -2% | 99.9 0% | 99.9 0% |
| AdobeRGB 1998 Coverage | 96.6 | 97.5 1% | 73.2 -24% | 70.2 -27% | 86.2 -11% | 87.4 -10% |
| Response Times | -1% | -574% | -586% | -533% | -494% | |
| Response Time Grey 50% / Grey 80% * | 1.7 ? | 1.68 ? 1% | 12.8 ? -653% | 13.7 ? -706% | 11.9 ? -600% | 12.8 ? -653% |
| Response Time Black / White * | 1.7 ? | 1.77 ? -4% | 10.1 ? -494% | 9.6 ? -465% | 9.6 ? -465% | 7.4 ? -335% |
| PWM Frequency | 60 ? | 60 ? 0% | ||||
| Screen | -11% | -15% | 33% | 36% | 22% | |
| Brightness middle | 348.1 | 345.7 -1% | 510 47% | 521 50% | 514.6 48% | 407 17% |
| Brightness | 351 | 349 -1% | 517 47% | 484 38% | 495 41% | 388 11% |
| Brightness Distribution | 97 | 98 1% | 89 -8% | 89 -8% | 90 -7% | 88 -9% |
| Black Level * | 0.37 | 0.36 | 0.46 | 0.36 | ||
| Colorchecker dE 2000 * | 4.18 | 3.59 14% | 2.6 38% | 1.2 71% | 2.4 43% | 1.3 69% |
| Colorchecker dE 2000 max. * | 6.68 | 7.02 -5% | 5.2 22% | 2.5 63% | 4.86 27% | 2.5 63% |
| Colorchecker dE 2000 calibrated * | 0.97 | 0.99 -2% | 2.3 -137% | 1 -3% | 0.4 59% | 0.7 28% |
| Greyscale dE 2000 * | 1.7 | 3.1 -82% | 3.6 -112% | 1.4 18% | 1 41% | 2.1 -24% |
| Gamma | 2.2 100% | 2.13 103% | 2.26 97% | 2.25 98% | 2.3 96% | 2.26 97% |
| CCT | 6198 105% | 6448 101% | 5969 109% | 6682 97% | 6553 99% | 6437 101% |
| Contrast | 1378 | 1447 | 1119 | 1131 | ||
| Całkowita średnia (program / ustawienia) | -4% /
-6% | -202% /
-109% | -191% /
-84% | -167% /
-69% | -159% /
-70% |
* ... im mniej tym lepiej
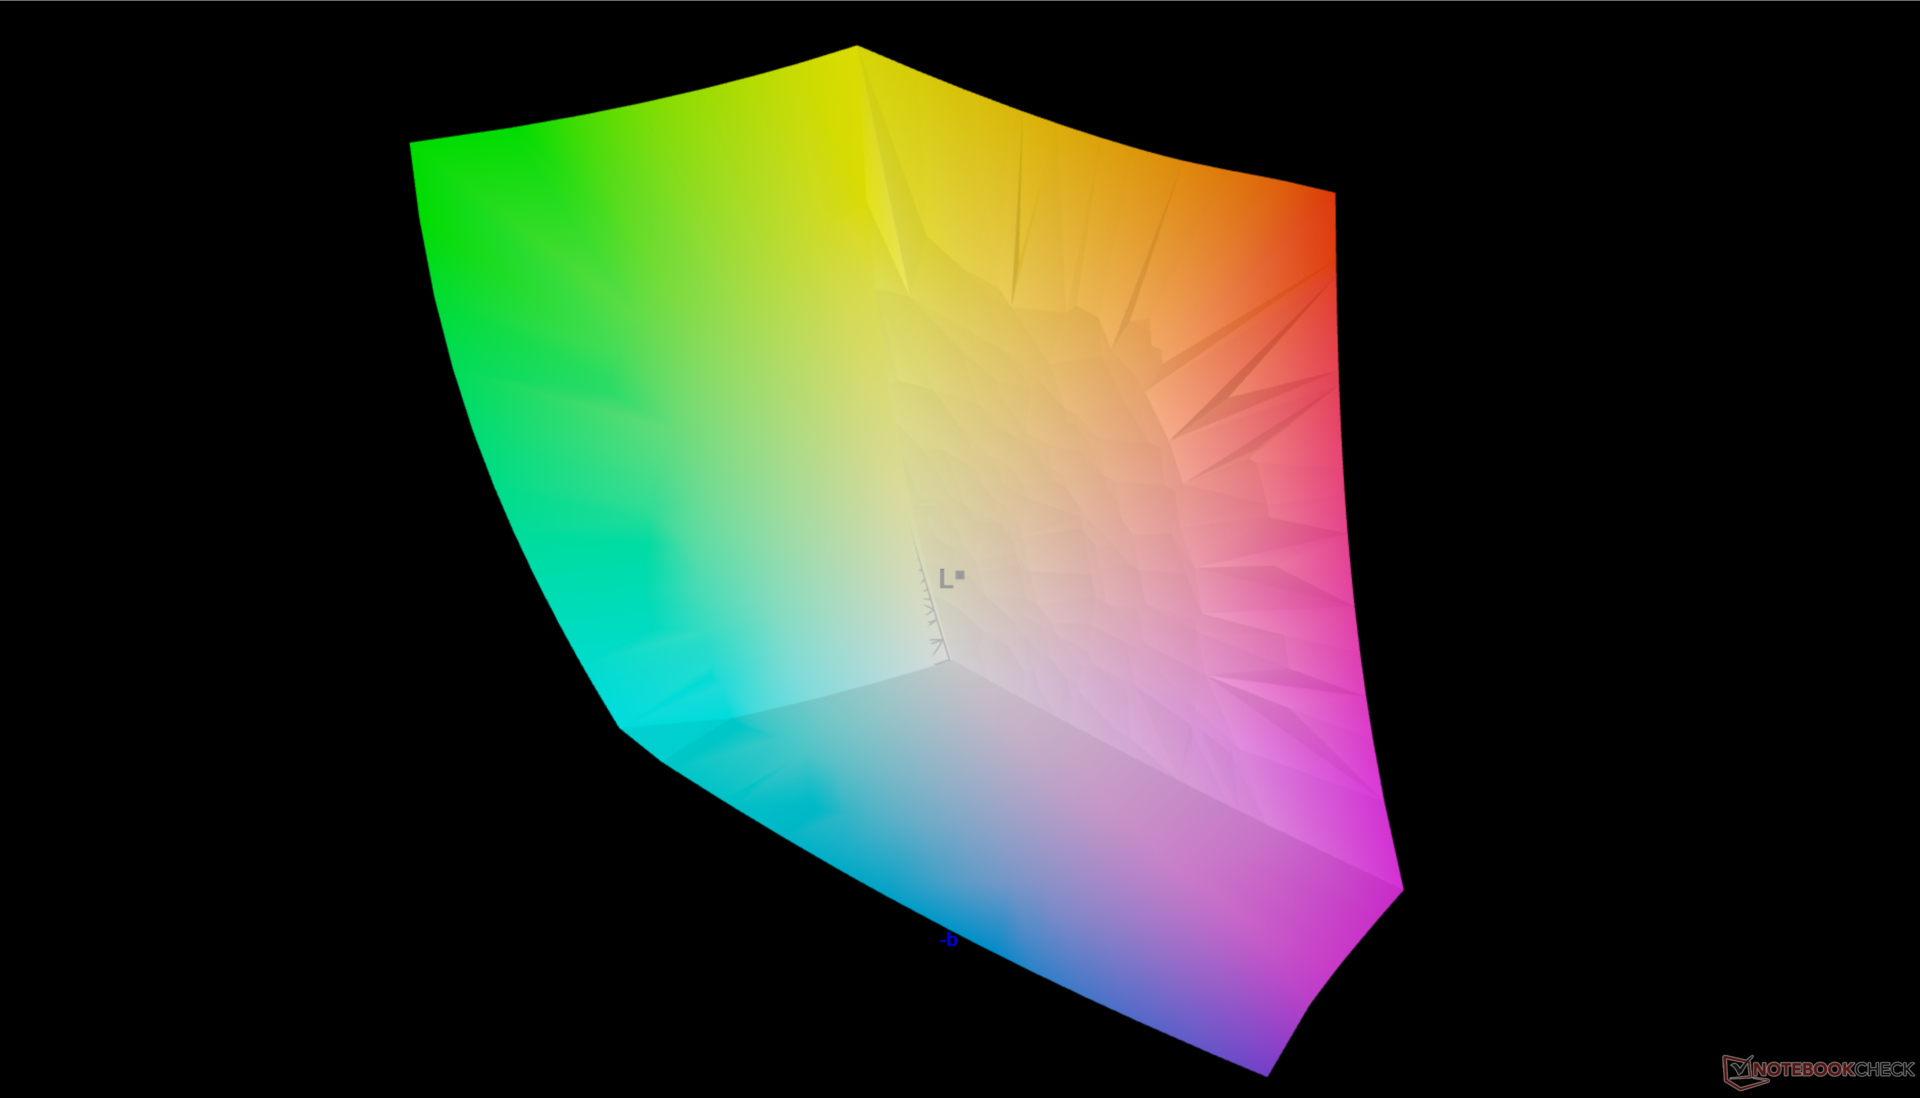
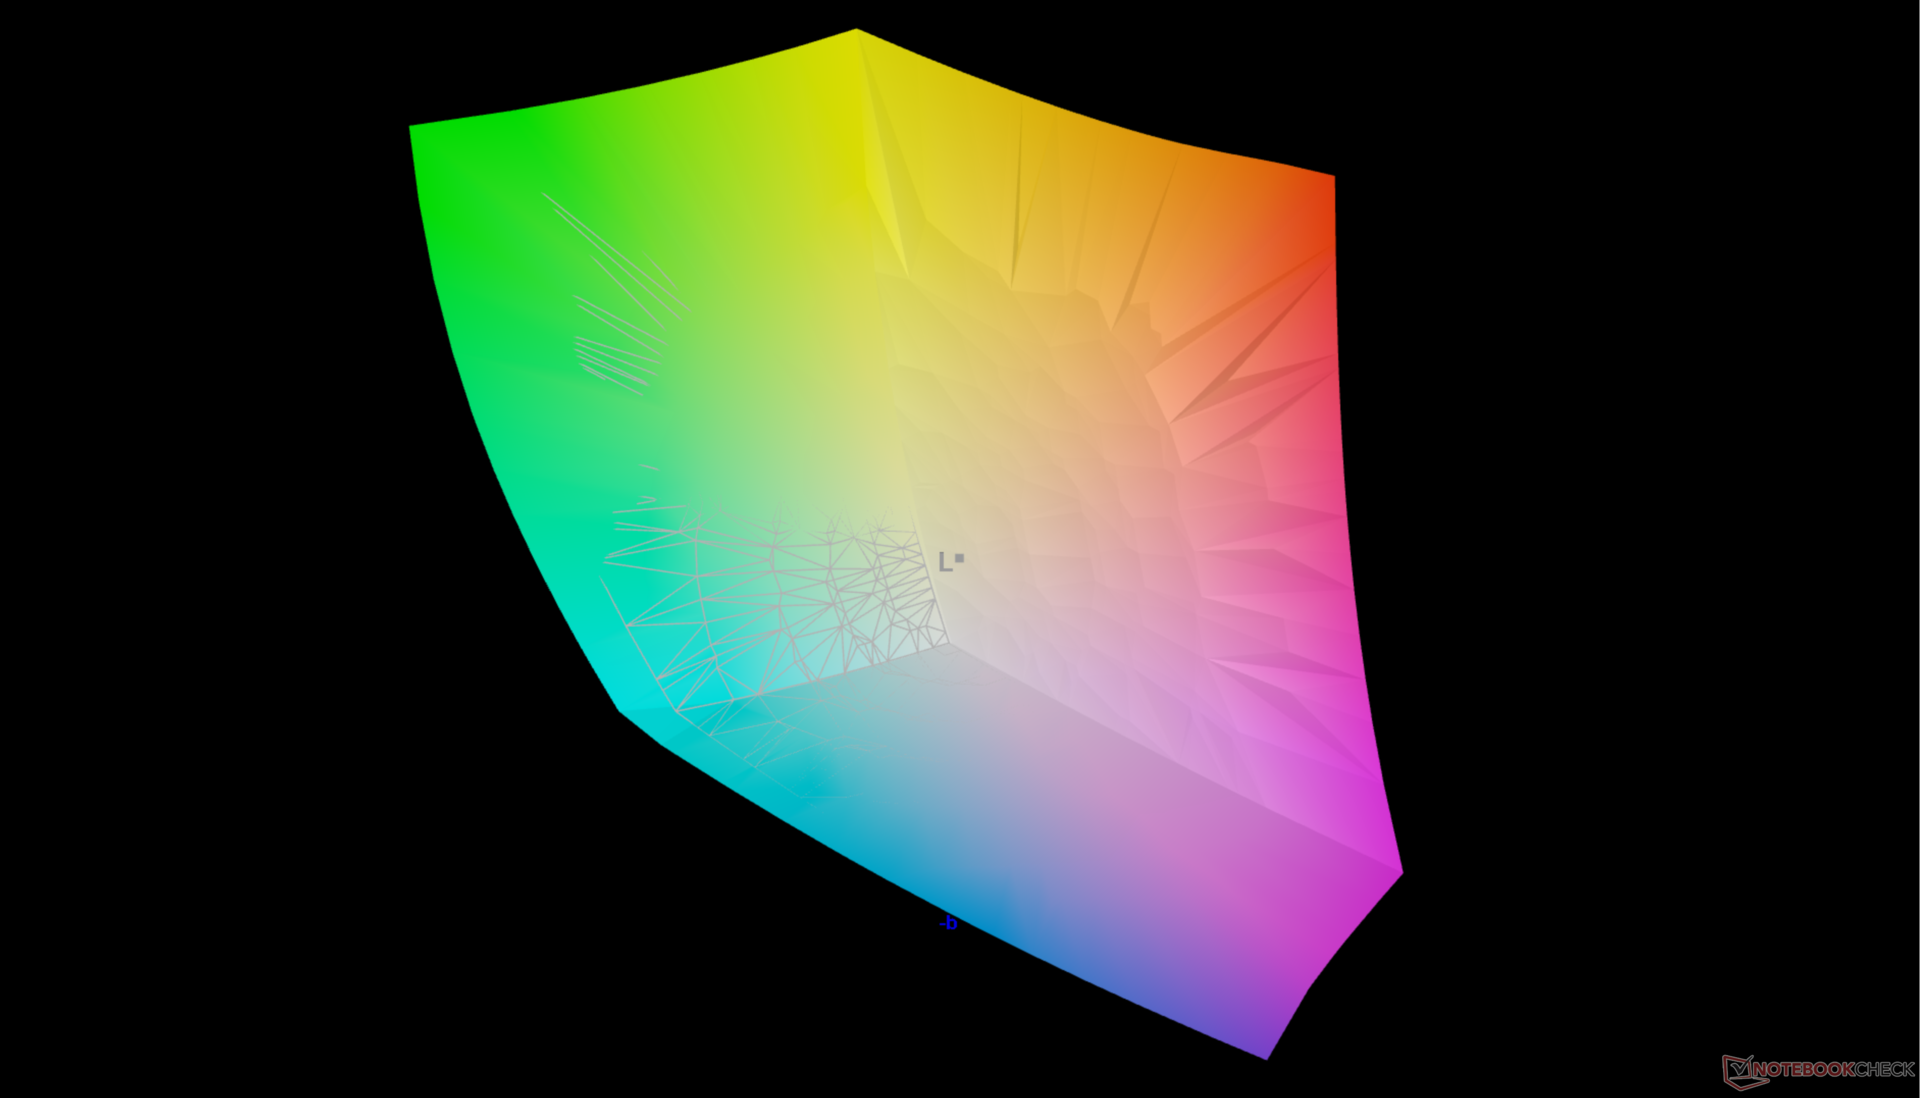
Wyświetlacz jest dobrze skalibrowany pod kątem standardu P3, a średnie wartości DeltaE dla skali szarości i kolorów wynoszą odpowiednio 1,7 i 4,18.
Wyświetl czasy reakcji
| ↔ Czas reakcji od czerni do bieli | ||
|---|---|---|
| 1.7 ms ... wzrost ↗ i spadek ↘ łącznie | ↗ 0.74 ms wzrost | 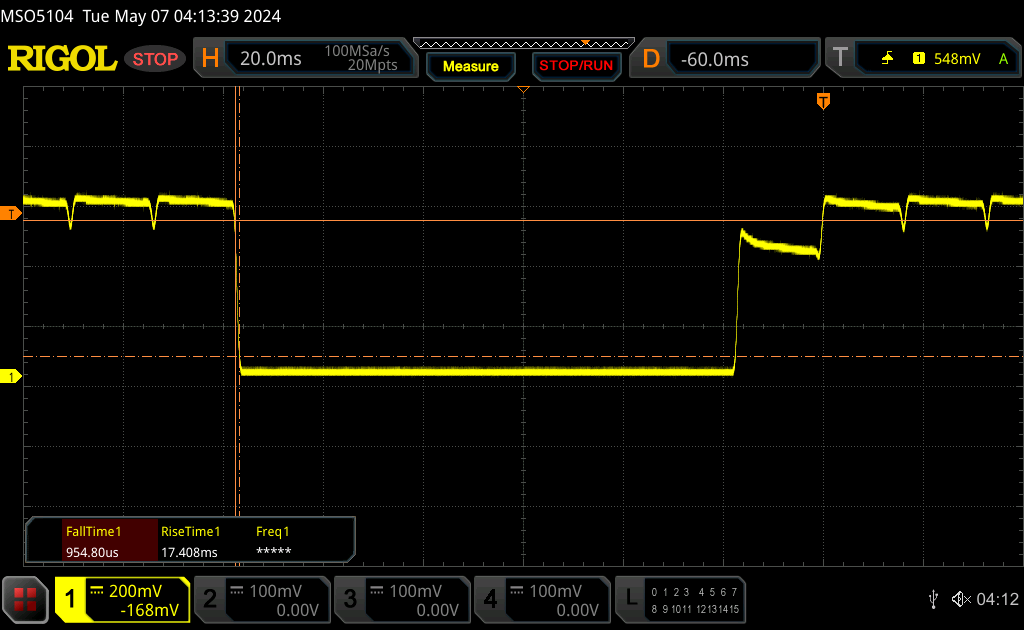 |
| ↘ 0.96 ms upadek | ||
| W naszych testach ekran wykazuje bardzo szybką reakcję i powinien bardzo dobrze nadawać się do szybkich gier. Dla porównania, wszystkie testowane urządzenia wahają się od 0.1 (minimum) do 240 (maksimum) ms. » 7 % wszystkich urządzeń jest lepszych. Oznacza to, że zmierzony czas reakcji jest lepszy od średniej wszystkich testowanych urządzeń (20.8 ms). | ||
| ↔ Czas reakcji 50% szarości do 80% szarości | ||
| 1.7 ms ... wzrost ↗ i spadek ↘ łącznie | ↗ 0.88 ms wzrost | 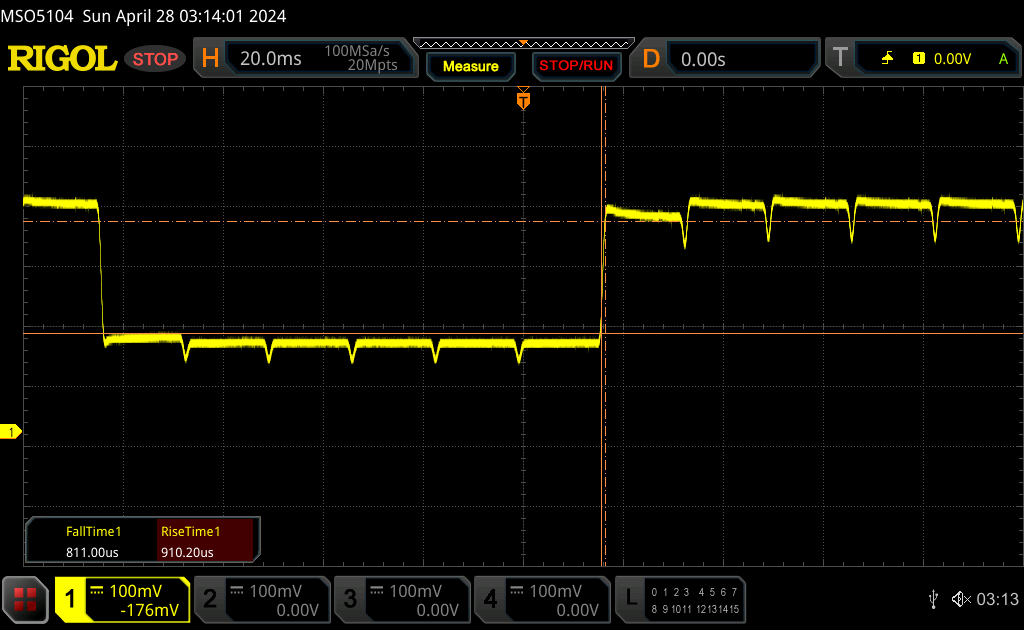 |
| ↘ 0.82 ms upadek | ||
| W naszych testach ekran wykazuje bardzo szybką reakcję i powinien bardzo dobrze nadawać się do szybkich gier. Dla porównania, wszystkie testowane urządzenia wahają się od 0.165 (minimum) do 636 (maksimum) ms. » 6 % wszystkich urządzeń jest lepszych. Oznacza to, że zmierzony czas reakcji jest lepszy od średniej wszystkich testowanych urządzeń (32.5 ms). | ||
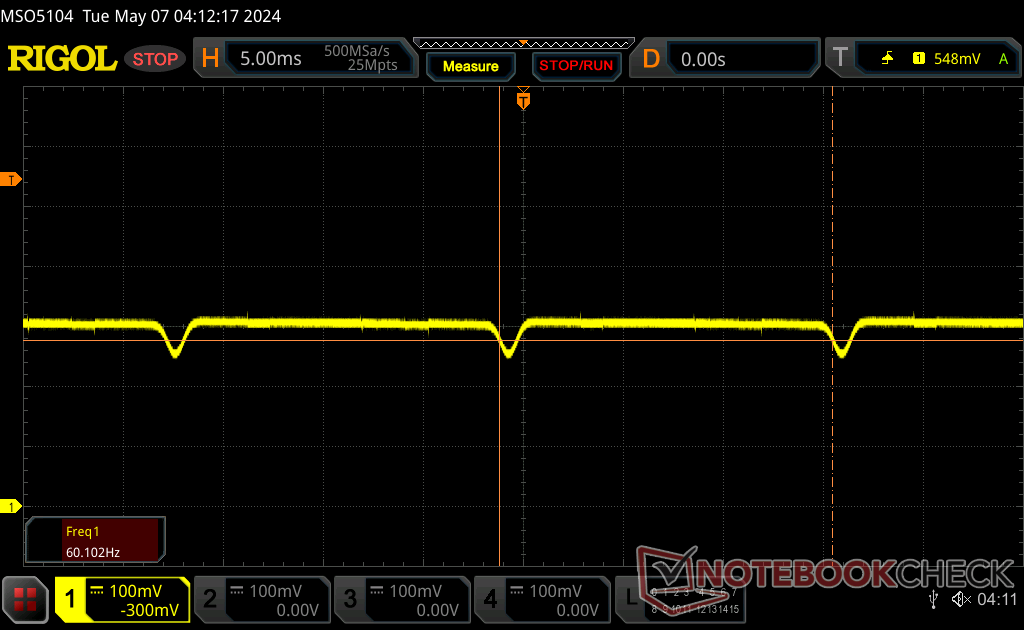
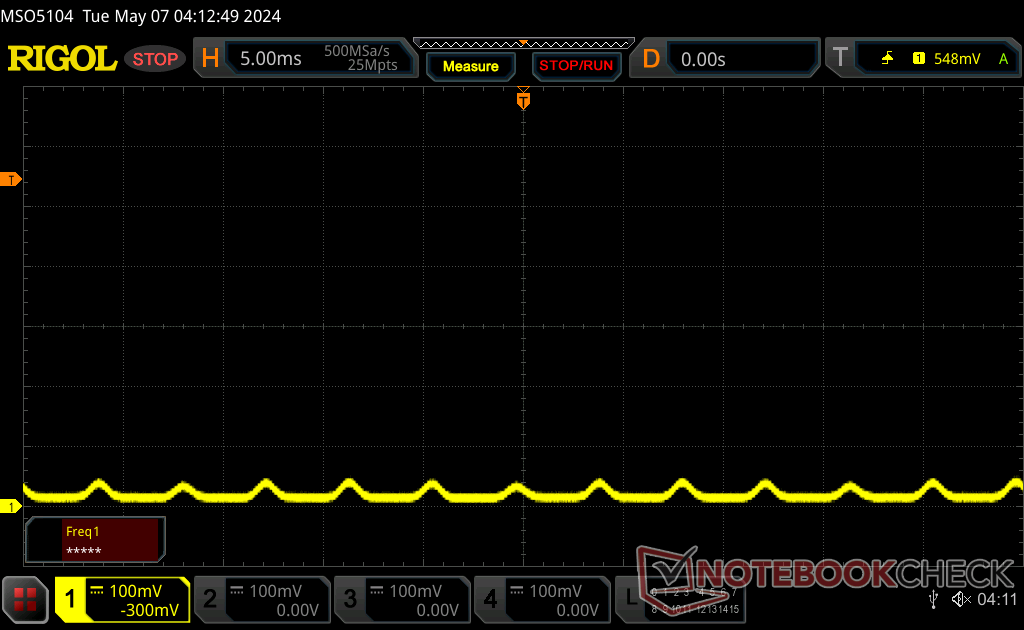
Migotanie ekranu / PWM (modulacja szerokości impulsu)
| Wykryto migotanie ekranu/wykryto PWM | 60 Hz | ≤ 100 % ustawienia jasności | 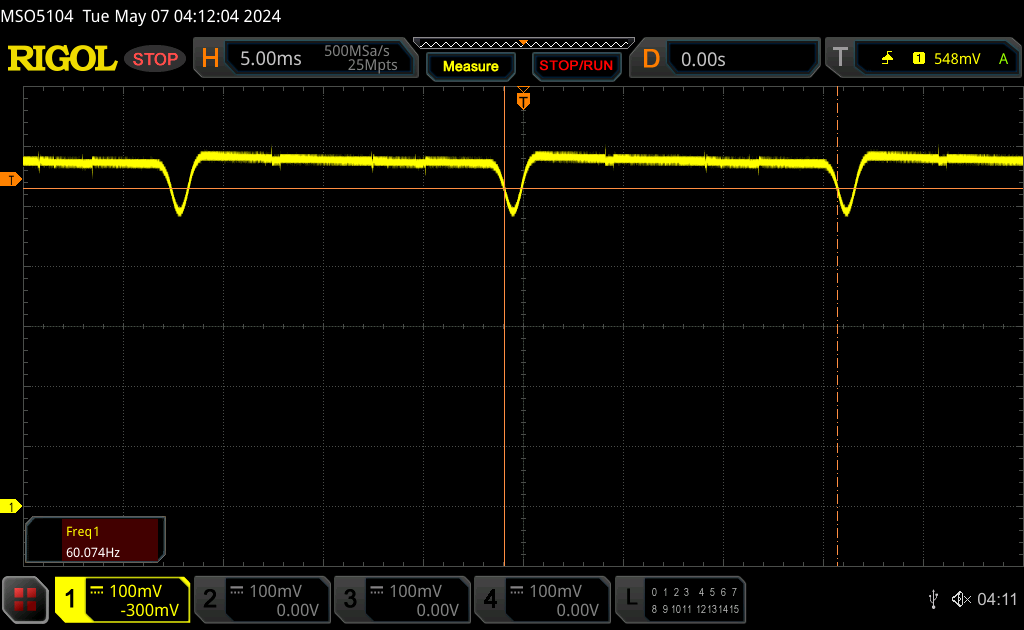 |
Podświetlenie wyświetlacza miga z częstotliwością 60 Hz (najgorszy przypadek, np. przy użyciu PWM) Wykryto migotanie przy ustawieniu jasności 100 % i poniżej. Powyżej tego ustawienia jasności nie powinno być żadnego migotania ani PWM. Częstotliwość 60 Hz jest bardzo niska, więc migotanie może powodować zmęczenie oczu i bóle głowy po dłuższym użytkowaniu. Dla porównania: 53 % wszystkich testowanych urządzeń nie używa PWM do przyciemniania wyświetlacza. Jeśli wykryto PWM, zmierzono średnio 8516 (minimum: 5 - maksimum: 343500) Hz. | |||

Wydajność
Warunki testowania
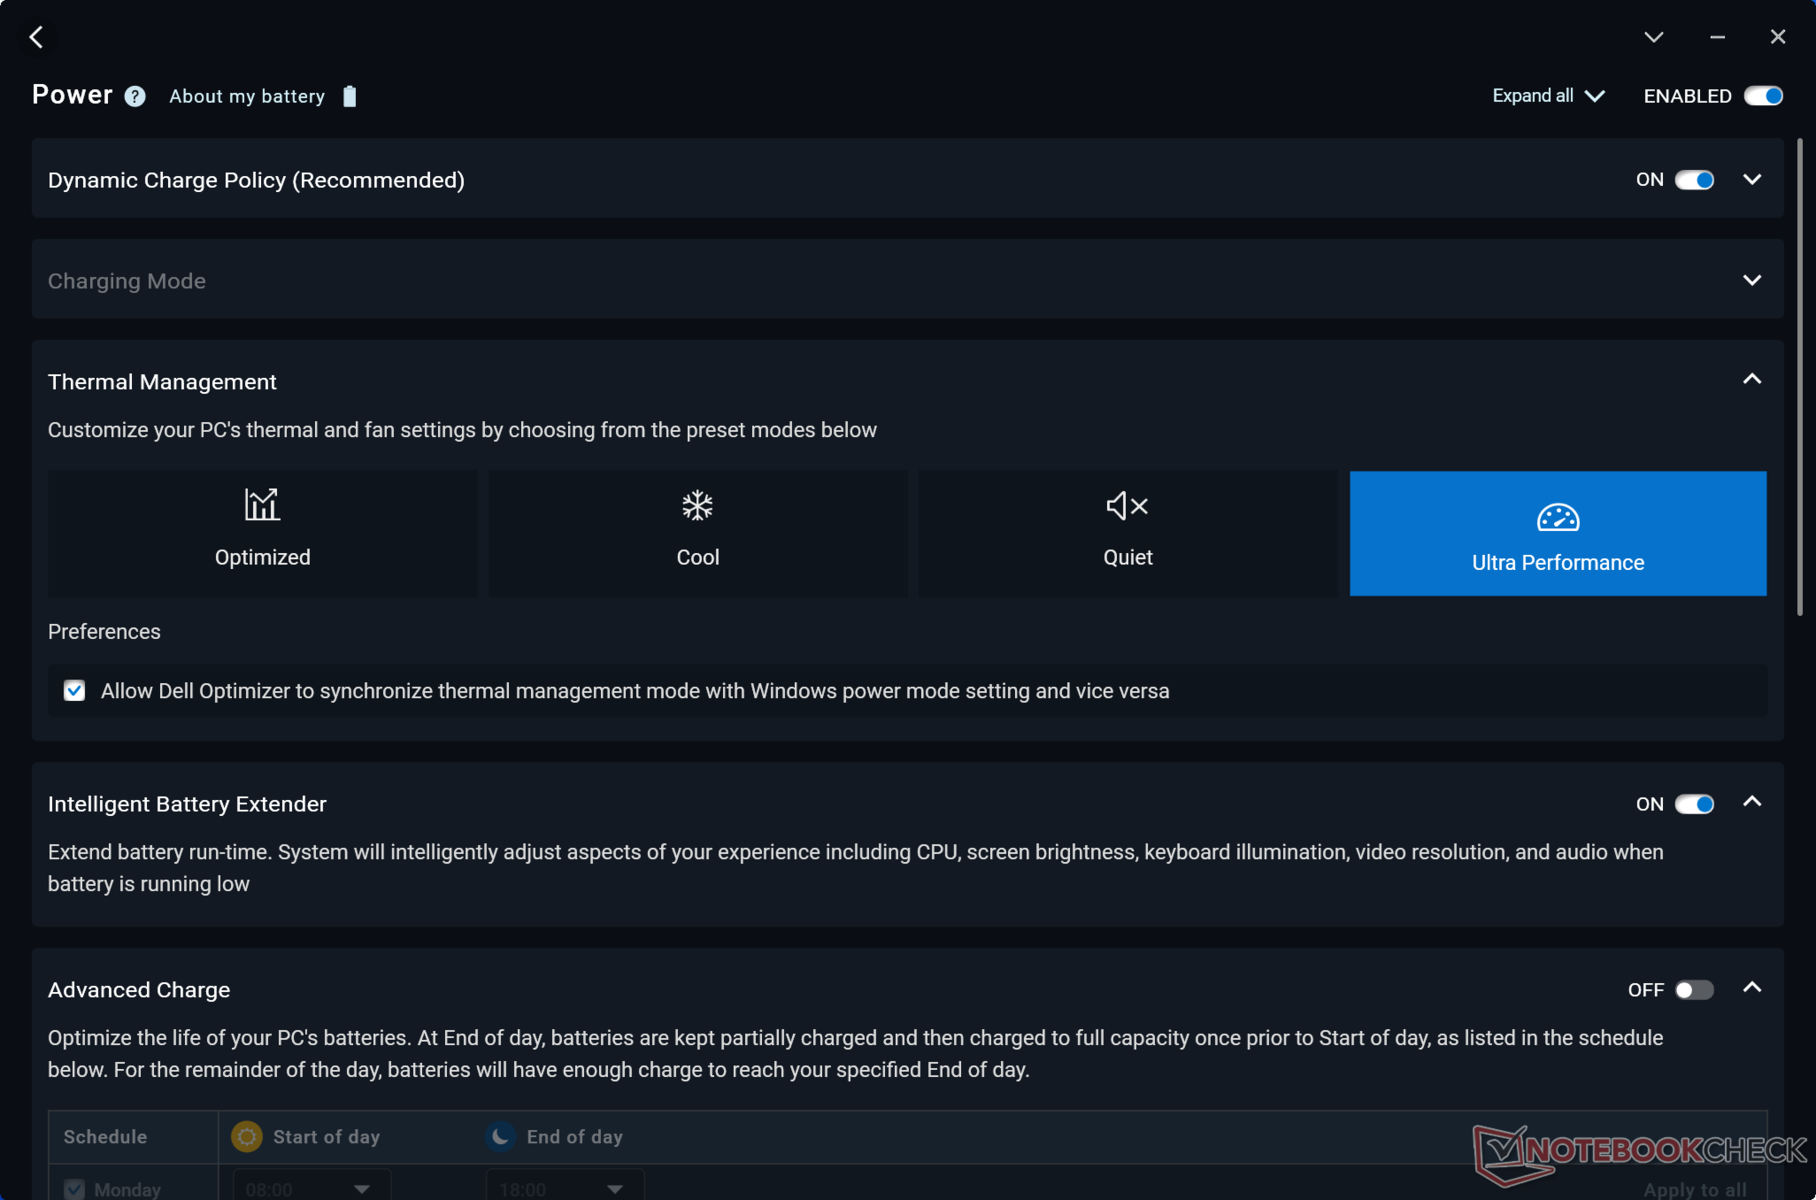
Przed wykonaniem poniższych testów ustawiliśmy Dell Optimizer na tryb Ultra Performance. Wyłączyliśmy również pamięć ECC VRAM za pośrednictwem Panelu sterowania Nvidia. Włączenie ECC VRAM zmniejsza dostępną pamięć o około 1 GB.

Procesor
The Core Ultra 9 185H działa niemal identycznie jak Core i9-13900H zarówno w obciążeniach jedno-, jak i wielowątkowych. Korzysta on bardziej z Turbo Boost dla tego szybszego początkowego impulsu prędkości, ale ta przewaga jest tylko tymczasowa, zanim ustabilizuje się na podobnym poziomie wydajności jak starszy Core i9 Precision 5680, jak pokazano na poniższym wykresie porównawczym.
Przejście na Core Ultra 7 165H i Ultra 5 135H powinien wpłynąć na wydajność procesora odpowiednio o 5 do 10 procent i 40 do 50 procent, co oznacza, że różnica w wydajności jest znacznie większa między Core Ultra 5 i Ultra 7 niż Core Ultra 7 i Ultra 9. Model Precision 5690 nie zawiera żadnych procesorów Raptor Lake-HX 14. generacji, które zwiększyłyby wydajność jeszcze szybciej niż Core Ultra 9 185H. W zamian jednak procesory Core Ultra zawierają zintegrowane jednostki NPU, które przyspieszą lokalne zadania AI, gdy staną się one łatwiej dostępne w najbliższej przyszłości.
Cinebench R15 Multi Loop
Cinebench R23: Multi Core | Single Core
Cinebench R20: CPU (Multi Core) | CPU (Single Core)
Cinebench R15: CPU Multi 64Bit | CPU Single 64Bit
Blender: v2.79 BMW27 CPU
7-Zip 18.03: 7z b 4 | 7z b 4 -mmt1
Geekbench 6.4: Multi-Core | Single-Core
Geekbench 5.5: Multi-Core | Single-Core
HWBOT x265 Benchmark v2.2: 4k Preset
LibreOffice : 20 Documents To PDF
R Benchmark 2.5: Overall mean
| CPU Performance Rating | |
| Lenovo Legion Pro 7 RTX4090 -2! | |
| HP ZBook Fury 16 G10 | |
| Dell Precision 5000 5680 | |
| Lenovo ThinkPad P1 G6-21FV000DGE | |
| Lenovo ThinkPad P16 G2 21FA000FGE -2! | |
| Dell Precision 5690 | |
| Dell XPS 16 9640 | |
| Przeciętny Intel Core Ultra 9 185H | |
| HP ZBook Fury 16 G9 -2! | |
| Lenovo ThinkPad P16 G1 21D6001DMB -2! | |
| MSI CreatorPro Z16P B12UKST -2! | |
| Lenovo ThinkPad P16v G1 AMD | |
| Lenovo ThinkPad P16s G2 21K9000CGE | |
| Samsung Galaxy Book4 Pro 360 -1! | |
| Asus ProArt StudioBook 16 W7600H5A-2BL2 -2! | |
| Lenovo ThinkPad P1 G4-20Y30017GE -2! | |
| Cinebench R23 / Multi Core | |
| Lenovo Legion Pro 7 RTX4090 | |
| HP ZBook Fury 16 G10 | |
| Lenovo ThinkPad P16 G2 21FA000FGE | |
| Dell Precision 5690 | |
| HP ZBook Fury 16 G9 | |
| Dell Precision 5000 5680 | |
| Lenovo ThinkPad P1 G6-21FV000DGE | |
| Dell XPS 16 9640 | |
| Przeciętny Intel Core Ultra 9 185H (12688 - 19851, n=19) | |
| Lenovo ThinkPad P16 G1 21D6001DMB | |
| MSI CreatorPro Z16P B12UKST | |
| Lenovo ThinkPad P16s G2 21K9000CGE | |
| Lenovo ThinkPad P16v G1 AMD | |
| Asus ProArt StudioBook 16 W7600H5A-2BL2 | |
| Samsung Galaxy Book4 Pro 360 | |
| Lenovo ThinkPad P1 G4-20Y30017GE | |
| Cinebench R23 / Single Core | |
| HP ZBook Fury 16 G10 | |
| Lenovo Legion Pro 7 RTX4090 | |
| Lenovo ThinkPad P1 G6-21FV000DGE | |
| Dell Precision 5000 5680 | |
| HP ZBook Fury 16 G9 | |
| Lenovo ThinkPad P16 G2 21FA000FGE | |
| Dell Precision 5690 | |
| Lenovo ThinkPad P16 G1 21D6001DMB | |
| Dell XPS 16 9640 | |
| Przeciętny Intel Core Ultra 9 185H (1166 - 1912, n=19) | |
| MSI CreatorPro Z16P B12UKST | |
| Lenovo ThinkPad P16s G2 21K9000CGE | |
| Samsung Galaxy Book4 Pro 360 | |
| Lenovo ThinkPad P16v G1 AMD | |
| Asus ProArt StudioBook 16 W7600H5A-2BL2 | |
| Lenovo ThinkPad P1 G4-20Y30017GE | |
| Cinebench R20 / CPU (Multi Core) | |
| Lenovo Legion Pro 7 RTX4090 | |
| HP ZBook Fury 16 G10 | |
| Lenovo ThinkPad P16 G2 21FA000FGE | |
| Dell Precision 5690 | |
| HP ZBook Fury 16 G9 | |
| Dell Precision 5000 5680 | |
| Dell XPS 16 9640 | |
| Lenovo ThinkPad P1 G6-21FV000DGE | |
| Przeciętny Intel Core Ultra 9 185H (4843 - 7651, n=19) | |
| Lenovo ThinkPad P16 G1 21D6001DMB | |
| MSI CreatorPro Z16P B12UKST | |
| Lenovo ThinkPad P16s G2 21K9000CGE | |
| Lenovo ThinkPad P16v G1 AMD | |
| Asus ProArt StudioBook 16 W7600H5A-2BL2 | |
| Samsung Galaxy Book4 Pro 360 | |
| Lenovo ThinkPad P1 G4-20Y30017GE | |
| Cinebench R20 / CPU (Single Core) | |
| HP ZBook Fury 16 G10 | |
| Lenovo ThinkPad P1 G6-21FV000DGE | |
| Dell Precision 5000 5680 | |
| Lenovo Legion Pro 7 RTX4090 | |
| HP ZBook Fury 16 G9 | |
| Lenovo ThinkPad P16 G2 21FA000FGE | |
| Lenovo ThinkPad P16 G1 21D6001DMB | |
| Dell Precision 5690 | |
| Przeciętny Intel Core Ultra 9 185H (442 - 735, n=19) | |
| MSI CreatorPro Z16P B12UKST | |
| Dell XPS 16 9640 | |
| Lenovo ThinkPad P16s G2 21K9000CGE | |
| Samsung Galaxy Book4 Pro 360 | |
| Lenovo ThinkPad P16v G1 AMD | |
| Asus ProArt StudioBook 16 W7600H5A-2BL2 | |
| Lenovo ThinkPad P1 G4-20Y30017GE | |
| Cinebench R15 / CPU Multi 64Bit | |
| Lenovo Legion Pro 7 RTX4090 | |
| HP ZBook Fury 16 G10 | |
| Dell Precision 5690 | |
| Lenovo ThinkPad P16 G2 21FA000FGE | |
| Lenovo ThinkPad P16 G1 21D6001DMB | |
| Dell XPS 16 9640 | |
| Przeciętny Intel Core Ultra 9 185H (1582 - 3165, n=21) | |
| Lenovo ThinkPad P1 G6-21FV000DGE | |
| HP ZBook Fury 16 G9 | |
| Lenovo ThinkPad P16s G2 21K9000CGE | |
| Lenovo ThinkPad P16v G1 AMD | |
| Dell Precision 5000 5680 | |
| MSI CreatorPro Z16P B12UKST | |
| Asus ProArt StudioBook 16 W7600H5A-2BL2 | |
| Samsung Galaxy Book4 Pro 360 | |
| Lenovo ThinkPad P1 G4-20Y30017GE | |
| Cinebench R15 / CPU Single 64Bit | |
| HP ZBook Fury 16 G10 | |
| Lenovo Legion Pro 7 RTX4090 | |
| Dell Precision 5000 5680 | |
| Lenovo ThinkPad P1 G6-21FV000DGE | |
| Lenovo ThinkPad P16 G2 21FA000FGE | |
| Dell Precision 5690 | |
| Lenovo ThinkPad P16 G1 21D6001DMB | |
| Lenovo ThinkPad P16s G2 21K9000CGE | |
| Przeciętny Intel Core Ultra 9 185H (191.9 - 281, n=19) | |
| Lenovo ThinkPad P16v G1 AMD | |
| Dell XPS 16 9640 | |
| Samsung Galaxy Book4 Pro 360 | |
| MSI CreatorPro Z16P B12UKST | |
| Asus ProArt StudioBook 16 W7600H5A-2BL2 | |
| Lenovo ThinkPad P1 G4-20Y30017GE | |
| HP ZBook Fury 16 G9 | |
| Blender / v2.79 BMW27 CPU | |
| Samsung Galaxy Book4 Pro 360 | |
| Lenovo ThinkPad P1 G4-20Y30017GE | |
| Asus ProArt StudioBook 16 W7600H5A-2BL2 | |
| Lenovo ThinkPad P16s G2 21K9000CGE | |
| Dell Precision 5690 | |
| Lenovo ThinkPad P16v G1 AMD | |
| MSI CreatorPro Z16P B12UKST | |
| Dell Precision 5000 5680 | |
| Lenovo ThinkPad P1 G6-21FV000DGE | |
| Przeciętny Intel Core Ultra 9 185H (163 - 285, n=19) | |
| Lenovo ThinkPad P16 G1 21D6001DMB | |
| Dell XPS 16 9640 | |
| HP ZBook Fury 16 G9 | |
| Lenovo ThinkPad P16 G2 21FA000FGE | |
| HP ZBook Fury 16 G10 | |
| Lenovo Legion Pro 7 RTX4090 | |
| 7-Zip 18.03 / 7z b 4 | |
| Lenovo Legion Pro 7 RTX4090 | |
| HP ZBook Fury 16 G10 | |
| Lenovo ThinkPad P16 G2 21FA000FGE | |
| HP ZBook Fury 16 G9 | |
| Dell Precision 5690 | |
| Lenovo ThinkPad P1 G6-21FV000DGE | |
| Dell Precision 5000 5680 | |
| Dell XPS 16 9640 | |
| Lenovo ThinkPad P16 G1 21D6001DMB | |
| Przeciętny Intel Core Ultra 9 185H (51738 - 76331, n=19) | |
| MSI CreatorPro Z16P B12UKST | |
| Lenovo ThinkPad P16v G1 AMD | |
| Lenovo ThinkPad P16s G2 21K9000CGE | |
| Asus ProArt StudioBook 16 W7600H5A-2BL2 | |
| Lenovo ThinkPad P1 G4-20Y30017GE | |
| 7-Zip 18.03 / 7z b 4 -mmt1 | |
| Lenovo Legion Pro 7 RTX4090 | |
| HP ZBook Fury 16 G10 | |
| Lenovo ThinkPad P1 G6-21FV000DGE | |
| Lenovo ThinkPad P16v G1 AMD | |
| Lenovo ThinkPad P16 G2 21FA000FGE | |
| Dell Precision 5000 5680 | |
| HP ZBook Fury 16 G9 | |
| Lenovo ThinkPad P16 G1 21D6001DMB | |
| Lenovo ThinkPad P16s G2 21K9000CGE | |
| MSI CreatorPro Z16P B12UKST | |
| Lenovo ThinkPad P1 G4-20Y30017GE | |
| Dell XPS 16 9640 | |
| Przeciętny Intel Core Ultra 9 185H (4199 - 5781, n=19) | |
| Asus ProArt StudioBook 16 W7600H5A-2BL2 | |
| Samsung Galaxy Book4 Pro 360 | |
| Dell Precision 5690 | |
| Geekbench 6.4 / Multi-Core | |
| HP ZBook Fury 16 G10 | |
| Dell Precision 5000 5680 | |
| Dell Precision 5690 | |
| Dell XPS 16 9640 | |
| Przeciętny Intel Core Ultra 9 185H (9140 - 14540, n=19) | |
| Lenovo ThinkPad P1 G6-21FV000DGE | |
| Lenovo ThinkPad P16s G2 21K9000CGE | |
| Samsung Galaxy Book4 Pro 360 | |
| Lenovo ThinkPad P16v G1 AMD | |
| Geekbench 6.4 / Single-Core | |
| HP ZBook Fury 16 G10 | |
| Lenovo ThinkPad P1 G6-21FV000DGE | |
| Dell Precision 5000 5680 | |
| Lenovo ThinkPad P16v G1 AMD | |
| Dell Precision 5690 | |
| Lenovo ThinkPad P16s G2 21K9000CGE | |
| Przeciętny Intel Core Ultra 9 185H (1490 - 2573, n=19) | |
| Dell XPS 16 9640 | |
| Samsung Galaxy Book4 Pro 360 | |
| Geekbench 5.5 / Multi-Core | |
| Lenovo Legion Pro 7 RTX4090 | |
| HP ZBook Fury 16 G10 | |
| Dell Precision 5000 5680 | |
| Lenovo ThinkPad P16 G2 21FA000FGE | |
| Dell Precision 5690 | |
| HP ZBook Fury 16 G9 | |
| Dell XPS 16 9640 | |
| Przeciętny Intel Core Ultra 9 185H (9330 - 14230, n=19) | |
| Lenovo ThinkPad P16 G1 21D6001DMB | |
| MSI CreatorPro Z16P B12UKST | |
| Lenovo ThinkPad P1 G6-21FV000DGE | |
| Lenovo ThinkPad P16s G2 21K9000CGE | |
| Lenovo ThinkPad P16v G1 AMD | |
| Samsung Galaxy Book4 Pro 360 | |
| Asus ProArt StudioBook 16 W7600H5A-2BL2 | |
| Lenovo ThinkPad P1 G4-20Y30017GE | |
| Geekbench 5.5 / Single-Core | |
| HP ZBook Fury 16 G10 | |
| Dell Precision 5000 5680 | |
| Lenovo Legion Pro 7 RTX4090 | |
| Lenovo ThinkPad P1 G6-21FV000DGE | |
| HP ZBook Fury 16 G9 | |
| Lenovo ThinkPad P16 G2 21FA000FGE | |
| Dell Precision 5690 | |
| Lenovo ThinkPad P16v G1 AMD | |
| MSI CreatorPro Z16P B12UKST | |
| Lenovo ThinkPad P16 G1 21D6001DMB | |
| Przeciętny Intel Core Ultra 9 185H (986 - 1902, n=19) | |
| Dell XPS 16 9640 | |
| Lenovo ThinkPad P16s G2 21K9000CGE | |
| Samsung Galaxy Book4 Pro 360 | |
| Lenovo ThinkPad P1 G4-20Y30017GE | |
| Asus ProArt StudioBook 16 W7600H5A-2BL2 | |
| HWBOT x265 Benchmark v2.2 / 4k Preset | |
| Lenovo Legion Pro 7 RTX4090 | |
| HP ZBook Fury 16 G10 | |
| Lenovo ThinkPad P16 G2 21FA000FGE | |
| Dell Precision 5690 | |
| Dell XPS 16 9640 | |
| Dell Precision 5000 5680 | |
| Przeciętny Intel Core Ultra 9 185H (14.1 - 22.7, n=19) | |
| HP ZBook Fury 16 G9 | |
| MSI CreatorPro Z16P B12UKST | |
| Lenovo ThinkPad P1 G6-21FV000DGE | |
| Lenovo ThinkPad P16v G1 AMD | |
| Lenovo ThinkPad P16s G2 21K9000CGE | |
| Lenovo ThinkPad P16 G1 21D6001DMB | |
| Asus ProArt StudioBook 16 W7600H5A-2BL2 | |
| Lenovo ThinkPad P1 G4-20Y30017GE | |
| Samsung Galaxy Book4 Pro 360 | |
| LibreOffice / 20 Documents To PDF | |
| Lenovo ThinkPad P16s G2 21K9000CGE | |
| Lenovo ThinkPad P1 G4-20Y30017GE | |
| Lenovo ThinkPad P16 G2 21FA000FGE | |
| Lenovo ThinkPad P1 G6-21FV000DGE | |
| Lenovo ThinkPad P16 G1 21D6001DMB | |
| Przeciętny Intel Core Ultra 9 185H (34.5 - 73.5, n=19) | |
| Lenovo ThinkPad P16v G1 AMD | |
| Dell XPS 16 9640 | |
| HP ZBook Fury 16 G10 | |
| Samsung Galaxy Book4 Pro 360 | |
| Dell Precision 5690 | |
| Lenovo Legion Pro 7 RTX4090 | |
| Dell Precision 5000 5680 | |
| MSI CreatorPro Z16P B12UKST | |
| HP ZBook Fury 16 G9 | |
| Asus ProArt StudioBook 16 W7600H5A-2BL2 | |
| R Benchmark 2.5 / Overall mean | |
| Lenovo ThinkPad P1 G4-20Y30017GE | |
| Asus ProArt StudioBook 16 W7600H5A-2BL2 | |
| Samsung Galaxy Book4 Pro 360 | |
| Dell XPS 16 9640 | |
| Przeciętny Intel Core Ultra 9 185H (0.4313 - 0.759, n=20) | |
| Lenovo ThinkPad P16s G2 21K9000CGE | |
| Dell Precision 5690 | |
| MSI CreatorPro Z16P B12UKST | |
| Lenovo ThinkPad P16 G1 21D6001DMB | |
| Lenovo ThinkPad P16 G2 21FA000FGE | |
| Lenovo ThinkPad P16v G1 AMD | |
| HP ZBook Fury 16 G9 | |
| Lenovo ThinkPad P1 G6-21FV000DGE | |
| Dell Precision 5000 5680 | |
| Lenovo Legion Pro 7 RTX4090 | |
| HP ZBook Fury 16 G10 | |
Cinebench R23: Multi Core | Single Core
Cinebench R20: CPU (Multi Core) | CPU (Single Core)
Cinebench R15: CPU Multi 64Bit | CPU Single 64Bit
Blender: v2.79 BMW27 CPU
7-Zip 18.03: 7z b 4 | 7z b 4 -mmt1
Geekbench 6.4: Multi-Core | Single-Core
Geekbench 5.5: Multi-Core | Single-Core
HWBOT x265 Benchmark v2.2: 4k Preset
LibreOffice : 20 Documents To PDF
R Benchmark 2.5: Overall mean
* ... im mniej tym lepiej
AIDA64: FP32 Ray-Trace | FPU Julia | CPU SHA3 | CPU Queen | FPU SinJulia | FPU Mandel | CPU AES | CPU ZLib | FP64 Ray-Trace | CPU PhotoWorxx
| Performance Rating | |
| HP ZBook Fury 16 G10 | |
| Dell Precision 5690 | |
| Lenovo ThinkPad P16 G2 21FA000FGE | |
| Przeciętny Intel Core Ultra 9 185H | |
| Dell Precision 5000 5680 | |
| MSI CreatorPro Z16P B12UKST | |
| Lenovo ThinkPad P1 G6-21FV000DGE | |
| AIDA64 / FP32 Ray-Trace | |
| HP ZBook Fury 16 G10 | |
| Dell Precision 5690 | |
| Lenovo ThinkPad P16 G2 21FA000FGE | |
| Przeciętny Intel Core Ultra 9 185H (9220 - 18676, n=19) | |
| Lenovo ThinkPad P1 G6-21FV000DGE | |
| Dell Precision 5000 5680 | |
| MSI CreatorPro Z16P B12UKST | |
| AIDA64 / FPU Julia | |
| HP ZBook Fury 16 G10 | |
| Dell Precision 5690 | |
| Lenovo ThinkPad P16 G2 21FA000FGE | |
| Przeciętny Intel Core Ultra 9 185H (48865 - 96463, n=19) | |
| Lenovo ThinkPad P1 G6-21FV000DGE | |
| Dell Precision 5000 5680 | |
| MSI CreatorPro Z16P B12UKST | |
| AIDA64 / CPU SHA3 | |
| HP ZBook Fury 16 G10 | |
| Dell Precision 5690 | |
| Lenovo ThinkPad P16 G2 21FA000FGE | |
| Przeciętny Intel Core Ultra 9 185H (2394 - 4534, n=19) | |
| Lenovo ThinkPad P1 G6-21FV000DGE | |
| MSI CreatorPro Z16P B12UKST | |
| Dell Precision 5000 5680 | |
| AIDA64 / CPU Queen | |
| HP ZBook Fury 16 G10 | |
| Dell Precision 5000 5680 | |
| Lenovo ThinkPad P1 G6-21FV000DGE | |
| Lenovo ThinkPad P16 G2 21FA000FGE | |
| MSI CreatorPro Z16P B12UKST | |
| Dell Precision 5690 | |
| Przeciętny Intel Core Ultra 9 185H (66785 - 95241, n=19) | |
| AIDA64 / FPU SinJulia | |
| HP ZBook Fury 16 G10 | |
| Lenovo ThinkPad P16 G2 21FA000FGE | |
| Dell Precision 5690 | |
| Przeciętny Intel Core Ultra 9 185H (7255 - 11392, n=19) | |
| Lenovo ThinkPad P1 G6-21FV000DGE | |
| Dell Precision 5000 5680 | |
| MSI CreatorPro Z16P B12UKST | |
| AIDA64 / FPU Mandel | |
| HP ZBook Fury 16 G10 | |
| Dell Precision 5690 | |
| Lenovo ThinkPad P16 G2 21FA000FGE | |
| Przeciętny Intel Core Ultra 9 185H (24004 - 48020, n=19) | |
| Lenovo ThinkPad P1 G6-21FV000DGE | |
| Dell Precision 5000 5680 | |
| MSI CreatorPro Z16P B12UKST | |
| AIDA64 / CPU AES | |
| MSI CreatorPro Z16P B12UKST | |
| HP ZBook Fury 16 G10 | |
| Przeciętny Intel Core Ultra 9 185H (53116 - 154066, n=19) | |
| Dell Precision 5690 | |
| Lenovo ThinkPad P16 G2 21FA000FGE | |
| Lenovo ThinkPad P1 G6-21FV000DGE | |
| Dell Precision 5000 5680 | |
| AIDA64 / CPU ZLib | |
| HP ZBook Fury 16 G10 | |
| Dell Precision 5690 | |
| Przeciętny Intel Core Ultra 9 185H (678 - 1341, n=19) | |
| Lenovo ThinkPad P16 G2 21FA000FGE | |
| Lenovo ThinkPad P1 G6-21FV000DGE | |
| MSI CreatorPro Z16P B12UKST | |
| Dell Precision 5000 5680 | |
| AIDA64 / FP64 Ray-Trace | |
| HP ZBook Fury 16 G10 | |
| Lenovo ThinkPad P16 G2 21FA000FGE | |
| Dell Precision 5690 | |
| Lenovo ThinkPad P1 G6-21FV000DGE | |
| Przeciętny Intel Core Ultra 9 185H (4428 - 10078, n=19) | |
| Dell Precision 5000 5680 | |
| MSI CreatorPro Z16P B12UKST | |
| AIDA64 / CPU PhotoWorxx | |
| Dell Precision 5690 | |
| Przeciętny Intel Core Ultra 9 185H (44547 - 53918, n=19) | |
| Dell Precision 5000 5680 | |
| MSI CreatorPro Z16P B12UKST | |
| HP ZBook Fury 16 G10 | |
| Lenovo ThinkPad P16 G2 21FA000FGE | |
| Lenovo ThinkPad P1 G6-21FV000DGE | |
Test warunków skrajnych
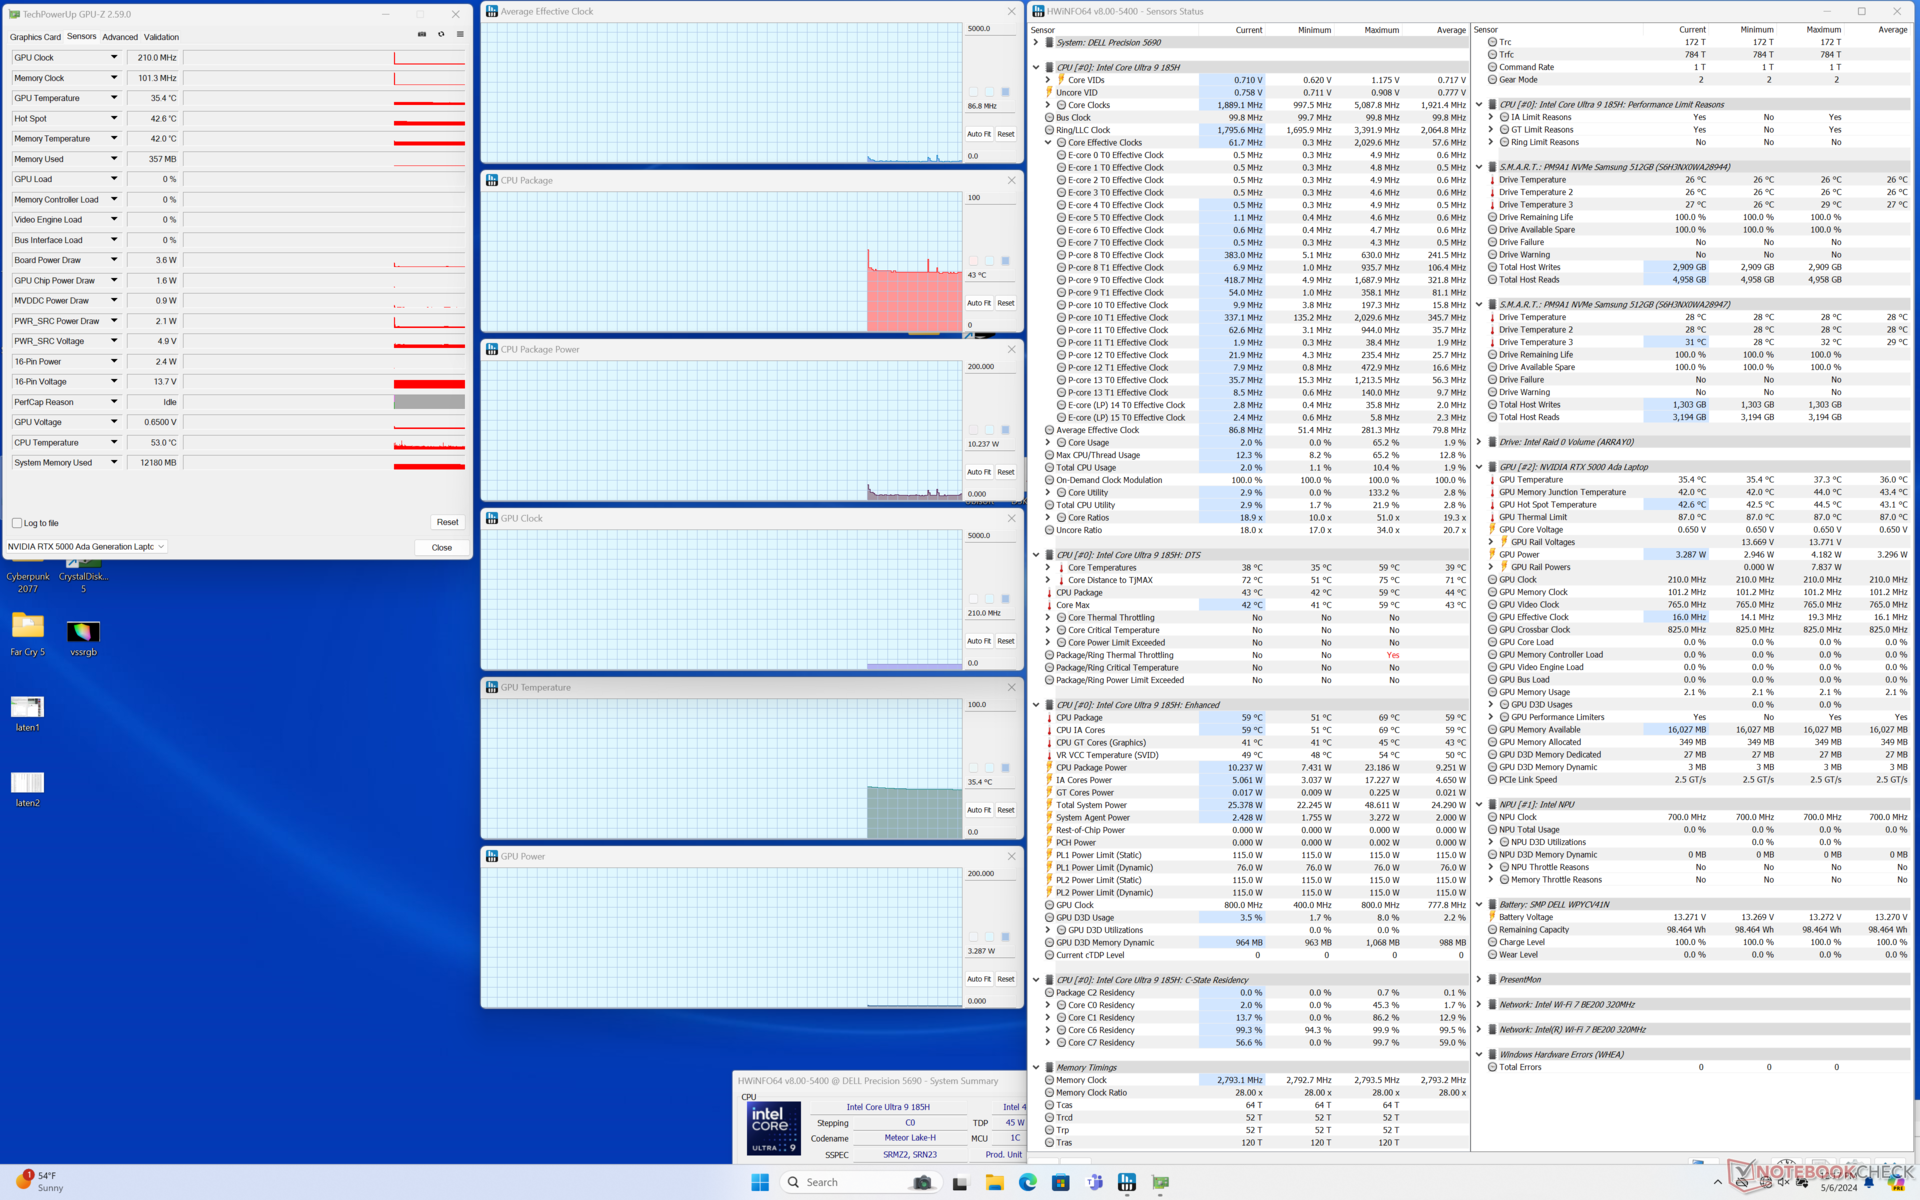
Po zainicjowaniu stresu Prime95, procesor przyspieszyłby do 3,7 GHz i 120 W, aż do osiągnięcia temperatury rdzenia 100 C zaledwie kilka sekund później. Następnie spadłby do 3 GHz i 73 W i pozostałby względnie stabilny przez cały czas. Zarówno temperatura rdzenia, jak i pobór mocy pakietu byłyby nieco wyższe niż te, które odnotowaliśmy na Precision 5680.
Pobór mocy karty graficznej podczas pracy Witcher 3 byłby stabilny na poziomie 72 W, mimo że GPU jest wymieniony jako 90 W w Nvidia Control Center. Wyniki są podobne do tych, które odnotowaliśmy na zeszłorocznym modelu.
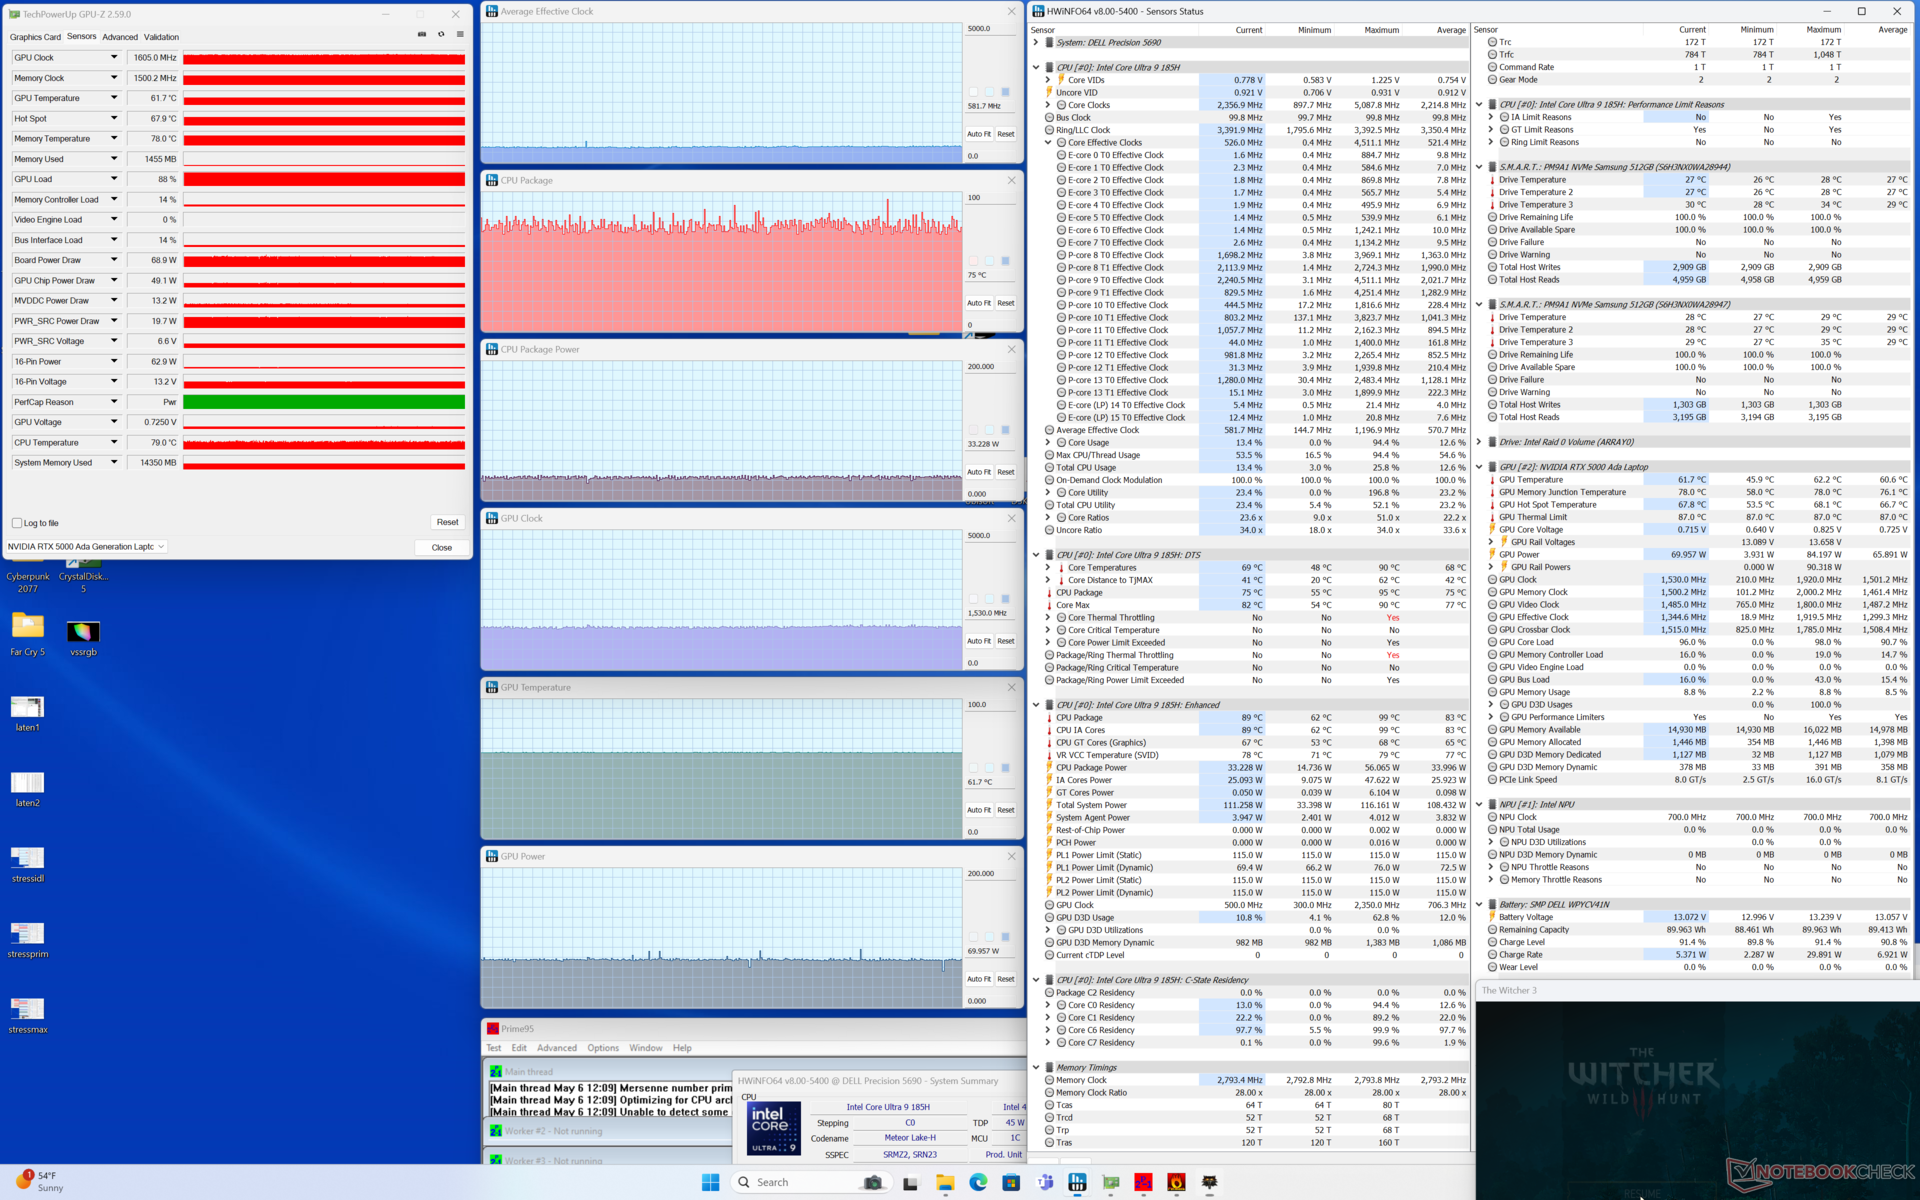
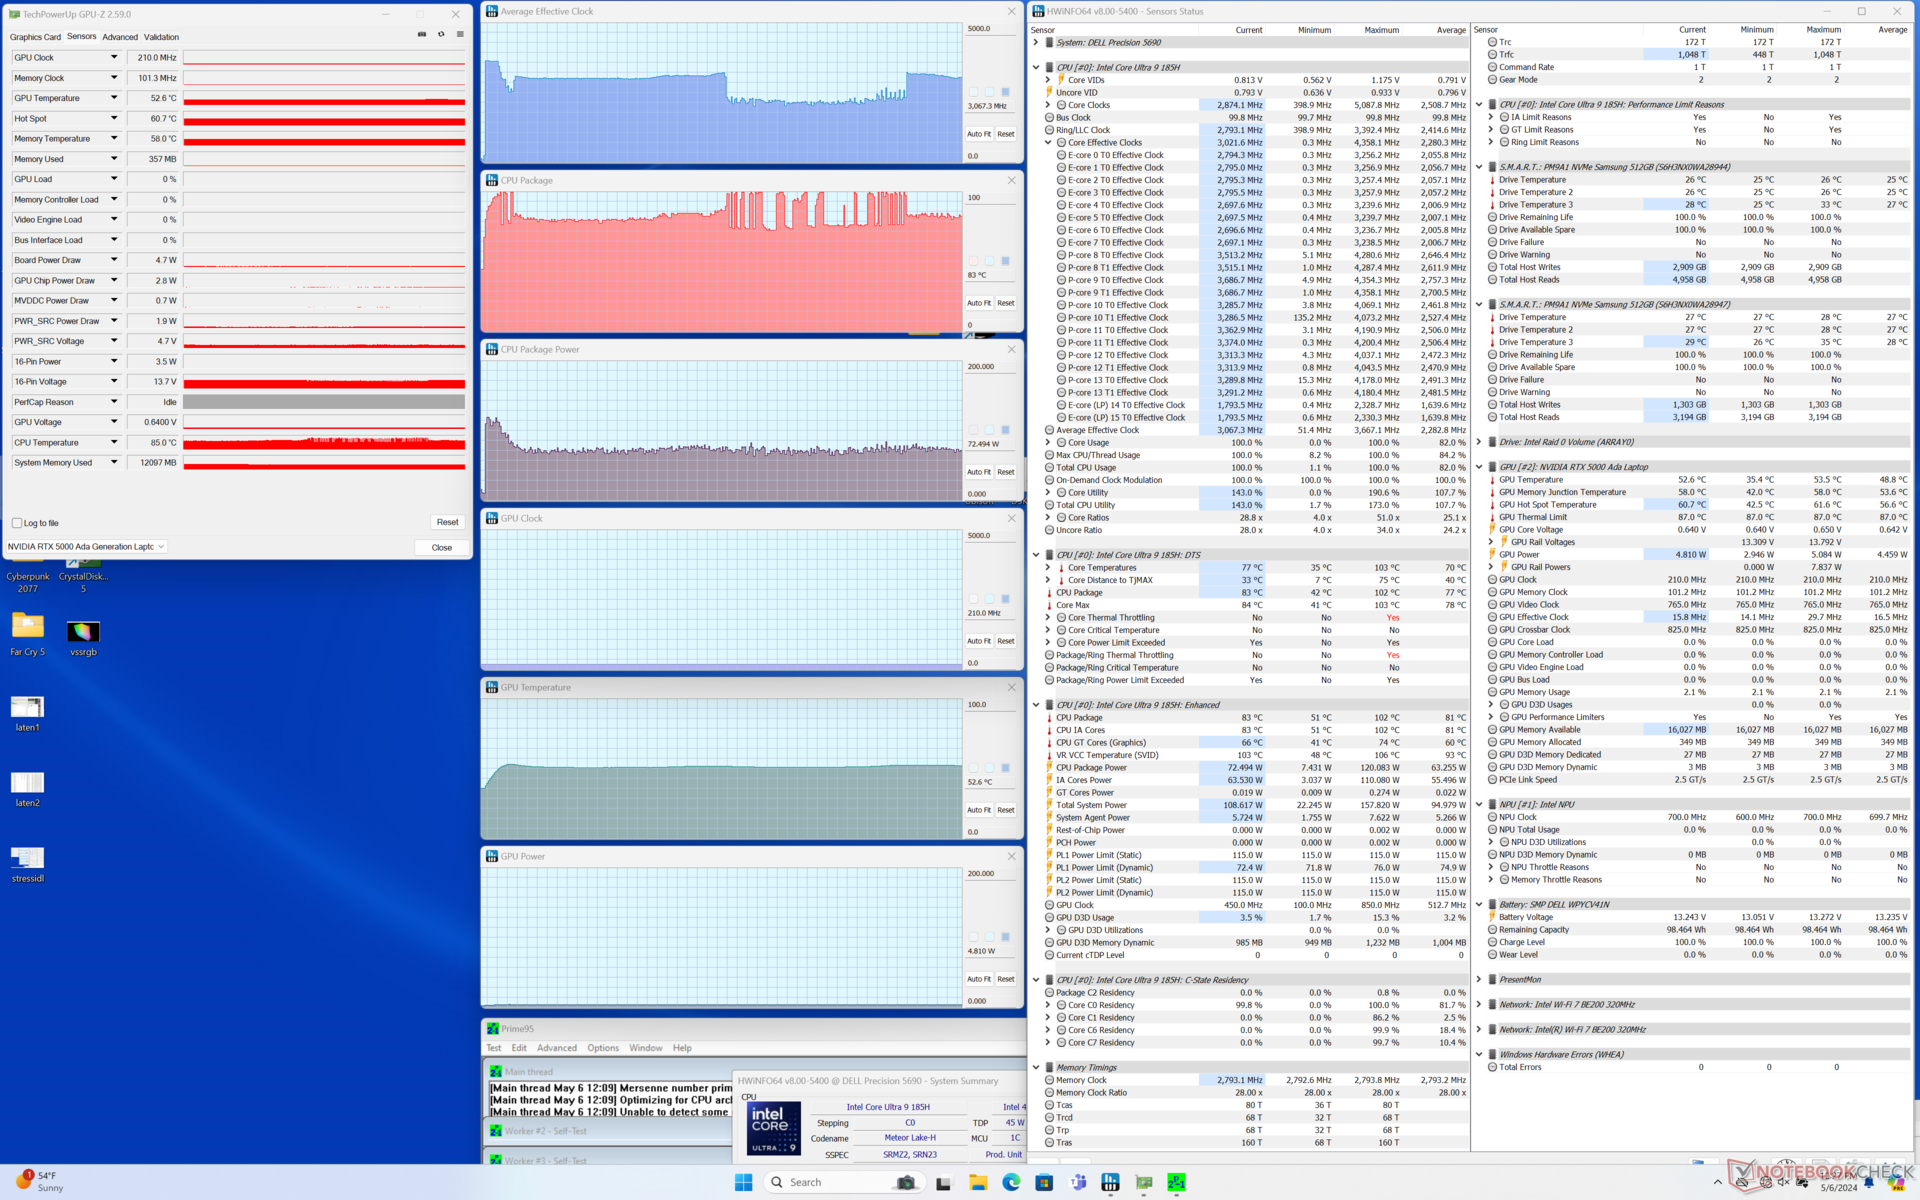
| Taktowanie CPU (GHz) | Taktowanie GPU (MHz) | Średnia temperatura CPU (°C) | Średnia temperatura GPU (°C) | |
| System w stanie spoczynku | -- | -- | 43 | 35 |
| Prime95Stress | 3.0 | -- | 83 | 53 |
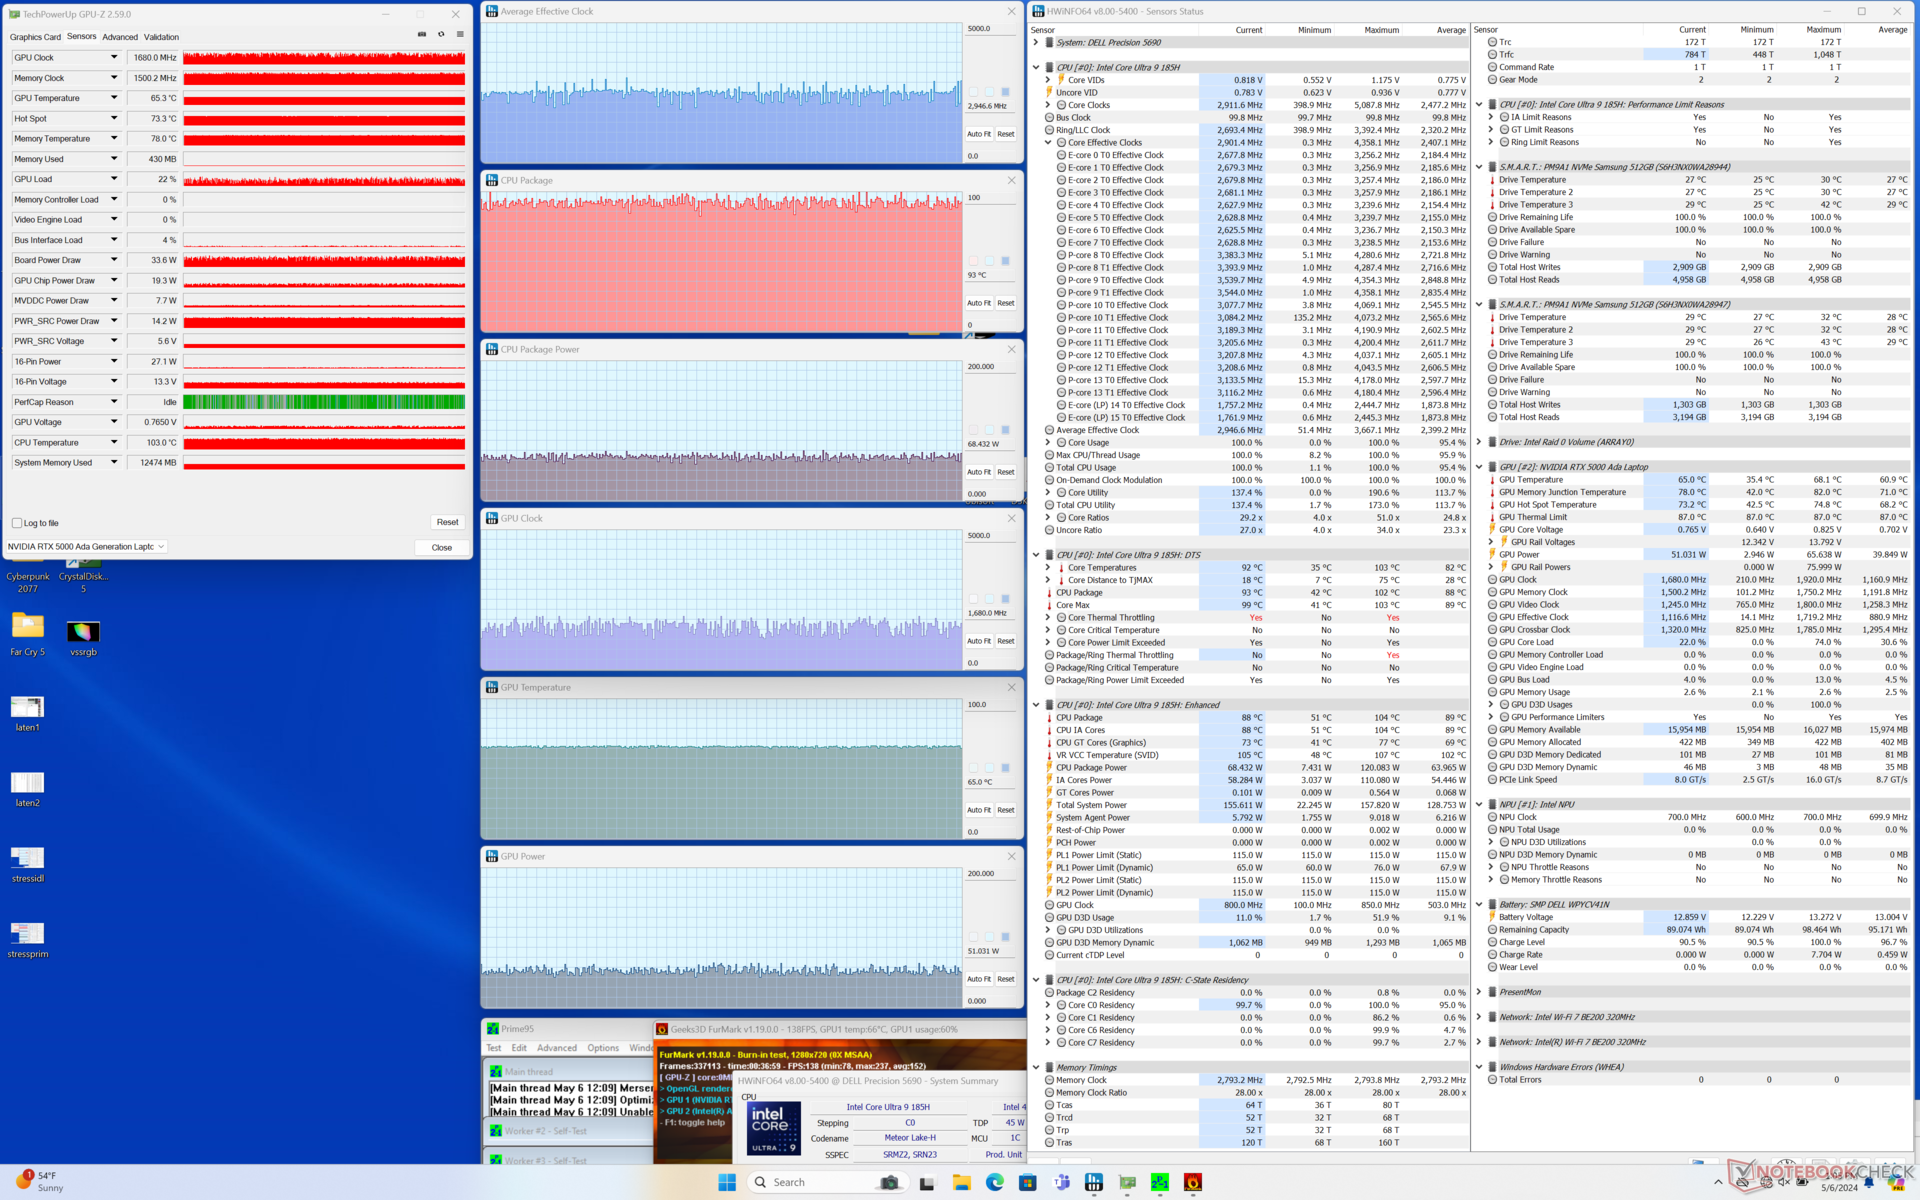
| Prime95+ FurMark Stress | ~3.0 | ~1680 | 93 | 65 |
| Witcher 3 Stres | ~0.6 | 1530 | 75 | 62 |
Wydajność systemu
Wyniki PCMark 10 są zasadniczo identyczne z tymi, które odnotowaliśmy na Precision 5680, co sugeruje brak większych różnic w wydajności między tymi dwoma modelami, jeśli chodzi o tradycyjne zadania.
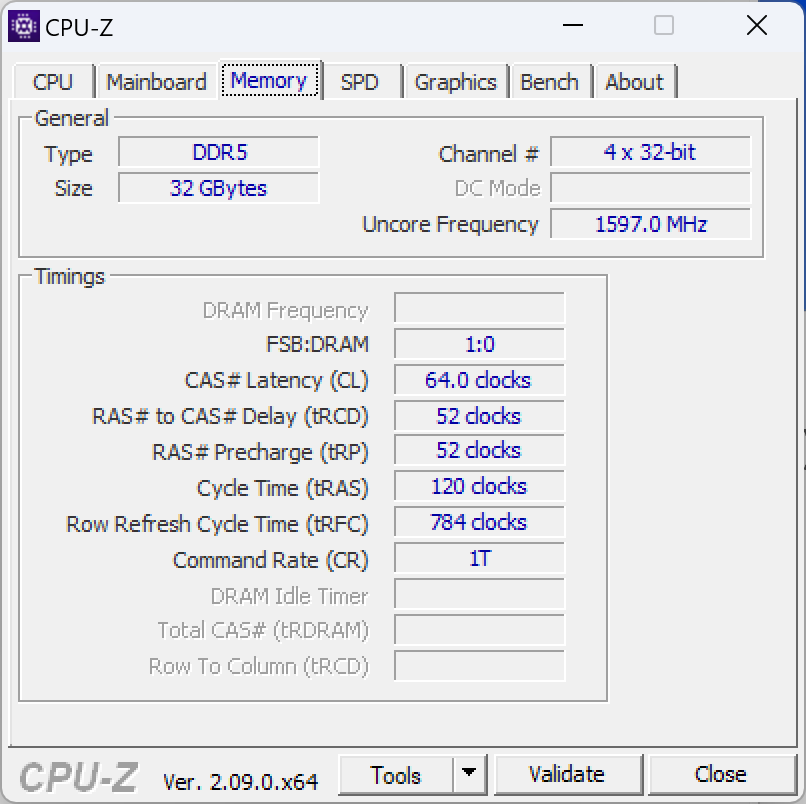
Systemowa pamięć RAM jest w tym roku nieco szybsza (7467 vs 6000 MT/s), co znajduje odzwierciedlenie w lepszych wynikach benchmarka AIDA64.

CrossMark: Overall | Productivity | Creativity | Responsiveness
WebXPRT 3: Overall
WebXPRT 4: Overall
Mozilla Kraken 1.1: Total
| PCMark 10 / Score | |
| Dell Precision 5000 5680 | |
| HP ZBook Fury 16 G10 | |
| Dell Precision 5690 | |
| Przeciętny Intel Core Ultra 9 185H, Nvidia RTX 5000 Ada Generation Laptop GPU (n=1) | |
| Lenovo ThinkPad P1 G6-21FV000DGE | |
| Lenovo ThinkPad P16 G2 21FA000FGE | |
| MSI CreatorPro Z16P B12UKST | |
| PCMark 10 / Essentials | |
| Dell Precision 5000 5680 | |
| Lenovo ThinkPad P1 G6-21FV000DGE | |
| HP ZBook Fury 16 G10 | |
| Dell Precision 5690 | |
| Przeciętny Intel Core Ultra 9 185H, Nvidia RTX 5000 Ada Generation Laptop GPU (n=1) | |
| Lenovo ThinkPad P16 G2 21FA000FGE | |
| MSI CreatorPro Z16P B12UKST | |
| PCMark 10 / Productivity | |
| Dell Precision 5000 5680 | |
| Dell Precision 5690 | |
| Przeciętny Intel Core Ultra 9 185H, Nvidia RTX 5000 Ada Generation Laptop GPU (n=1) | |
| Lenovo ThinkPad P1 G6-21FV000DGE | |
| Lenovo ThinkPad P16 G2 21FA000FGE | |
| MSI CreatorPro Z16P B12UKST | |
| HP ZBook Fury 16 G10 | |
| PCMark 10 / Digital Content Creation | |
| HP ZBook Fury 16 G10 | |
| Dell Precision 5000 5680 | |
| Dell Precision 5690 | |
| Przeciętny Intel Core Ultra 9 185H, Nvidia RTX 5000 Ada Generation Laptop GPU (n=1) | |
| Lenovo ThinkPad P1 G6-21FV000DGE | |
| MSI CreatorPro Z16P B12UKST | |
| Lenovo ThinkPad P16 G2 21FA000FGE | |
| CrossMark / Overall | |
| MSI CreatorPro Z16P B12UKST | |
| Dell Precision 5000 5680 | |
| HP ZBook Fury 16 G10 | |
| Lenovo ThinkPad P1 G6-21FV000DGE | |
| Lenovo ThinkPad P16 G2 21FA000FGE | |
| Dell Precision 5690 | |
| Przeciętny Intel Core Ultra 9 185H, Nvidia RTX 5000 Ada Generation Laptop GPU (n=1) | |
| CrossMark / Productivity | |
| HP ZBook Fury 16 G10 | |
| MSI CreatorPro Z16P B12UKST | |
| Dell Precision 5000 5680 | |
| Lenovo ThinkPad P1 G6-21FV000DGE | |
| Dell Precision 5690 | |
| Przeciętny Intel Core Ultra 9 185H, Nvidia RTX 5000 Ada Generation Laptop GPU (n=1) | |
| Lenovo ThinkPad P16 G2 21FA000FGE | |
| CrossMark / Creativity | |
| Dell Precision 5000 5680 | |
| Lenovo ThinkPad P16 G2 21FA000FGE | |
| HP ZBook Fury 16 G10 | |
| MSI CreatorPro Z16P B12UKST | |
| Lenovo ThinkPad P1 G6-21FV000DGE | |
| Dell Precision 5690 | |
| Przeciętny Intel Core Ultra 9 185H, Nvidia RTX 5000 Ada Generation Laptop GPU (n=1) | |
| CrossMark / Responsiveness | |
| MSI CreatorPro Z16P B12UKST | |
| HP ZBook Fury 16 G10 | |
| Lenovo ThinkPad P1 G6-21FV000DGE | |
| Dell Precision 5000 5680 | |
| Dell Precision 5690 | |
| Przeciętny Intel Core Ultra 9 185H, Nvidia RTX 5000 Ada Generation Laptop GPU (n=1) | |
| Lenovo ThinkPad P16 G2 21FA000FGE | |
| WebXPRT 3 / Overall | |
| Dell Precision 5000 5680 | |
| HP ZBook Fury 16 G10 | |
| Lenovo ThinkPad P16 G2 21FA000FGE | |
| Lenovo ThinkPad P1 G6-21FV000DGE | |
| MSI CreatorPro Z16P B12UKST | |
| Dell Precision 5690 | |
| Przeciętny Intel Core Ultra 9 185H, Nvidia RTX 5000 Ada Generation Laptop GPU (n=1) | |
| WebXPRT 4 / Overall | |
| Lenovo ThinkPad P1 G6-21FV000DGE | |
| HP ZBook Fury 16 G10 | |
| Dell Precision 5000 5680 | |
| Dell Precision 5690 | |
| Przeciętny Intel Core Ultra 9 185H, Nvidia RTX 5000 Ada Generation Laptop GPU (n=1) | |
| MSI CreatorPro Z16P B12UKST | |
| Mozilla Kraken 1.1 / Total | |
| MSI CreatorPro Z16P B12UKST | |
| Dell Precision 5690 | |
| Przeciętny Intel Core Ultra 9 185H, Nvidia RTX 5000 Ada Generation Laptop GPU (n=1) | |
| Lenovo ThinkPad P16 G2 21FA000FGE | |
| Dell Precision 5000 5680 | |
| Lenovo ThinkPad P1 G6-21FV000DGE | |
| HP ZBook Fury 16 G10 | |
* ... im mniej tym lepiej
| PCMark 10 Score | 8065 pkt. | |
Pomoc | ||
| AIDA64 / Memory Copy | |
| Dell Precision 5690 | |
| Przeciętny Intel Core Ultra 9 185H (69929 - 95718, n=19) | |
| Dell Precision 5000 5680 | |
| MSI CreatorPro Z16P B12UKST | |
| HP ZBook Fury 16 G10 | |
| Lenovo ThinkPad P16 G2 21FA000FGE | |
| Lenovo ThinkPad P1 G6-21FV000DGE | |
| AIDA64 / Memory Read | |
| Dell Precision 5690 | |
| Przeciętny Intel Core Ultra 9 185H (64619 - 87768, n=19) | |
| Dell Precision 5000 5680 | |
| MSI CreatorPro Z16P B12UKST | |
| HP ZBook Fury 16 G10 | |
| Lenovo ThinkPad P16 G2 21FA000FGE | |
| Lenovo ThinkPad P1 G6-21FV000DGE | |
| AIDA64 / Memory Write | |
| Dell Precision 5000 5680 | |
| Dell Precision 5690 | |
| Przeciętny Intel Core Ultra 9 185H (51114 - 93871, n=19) | |
| MSI CreatorPro Z16P B12UKST | |
| HP ZBook Fury 16 G10 | |
| Lenovo ThinkPad P16 G2 21FA000FGE | |
| Lenovo ThinkPad P1 G6-21FV000DGE | |
| AIDA64 / Memory Latency | |
| Przeciętny Intel Core Ultra 9 185H (121.4 - 259, n=19) | |
| Dell Precision 5690 | |
| HP ZBook Fury 16 G10 | |
| Lenovo ThinkPad P16 G2 21FA000FGE | |
| MSI CreatorPro Z16P B12UKST | |
| Dell Precision 5000 5680 | |
| Lenovo ThinkPad P1 G6-21FV000DGE | |
* ... im mniej tym lepiej
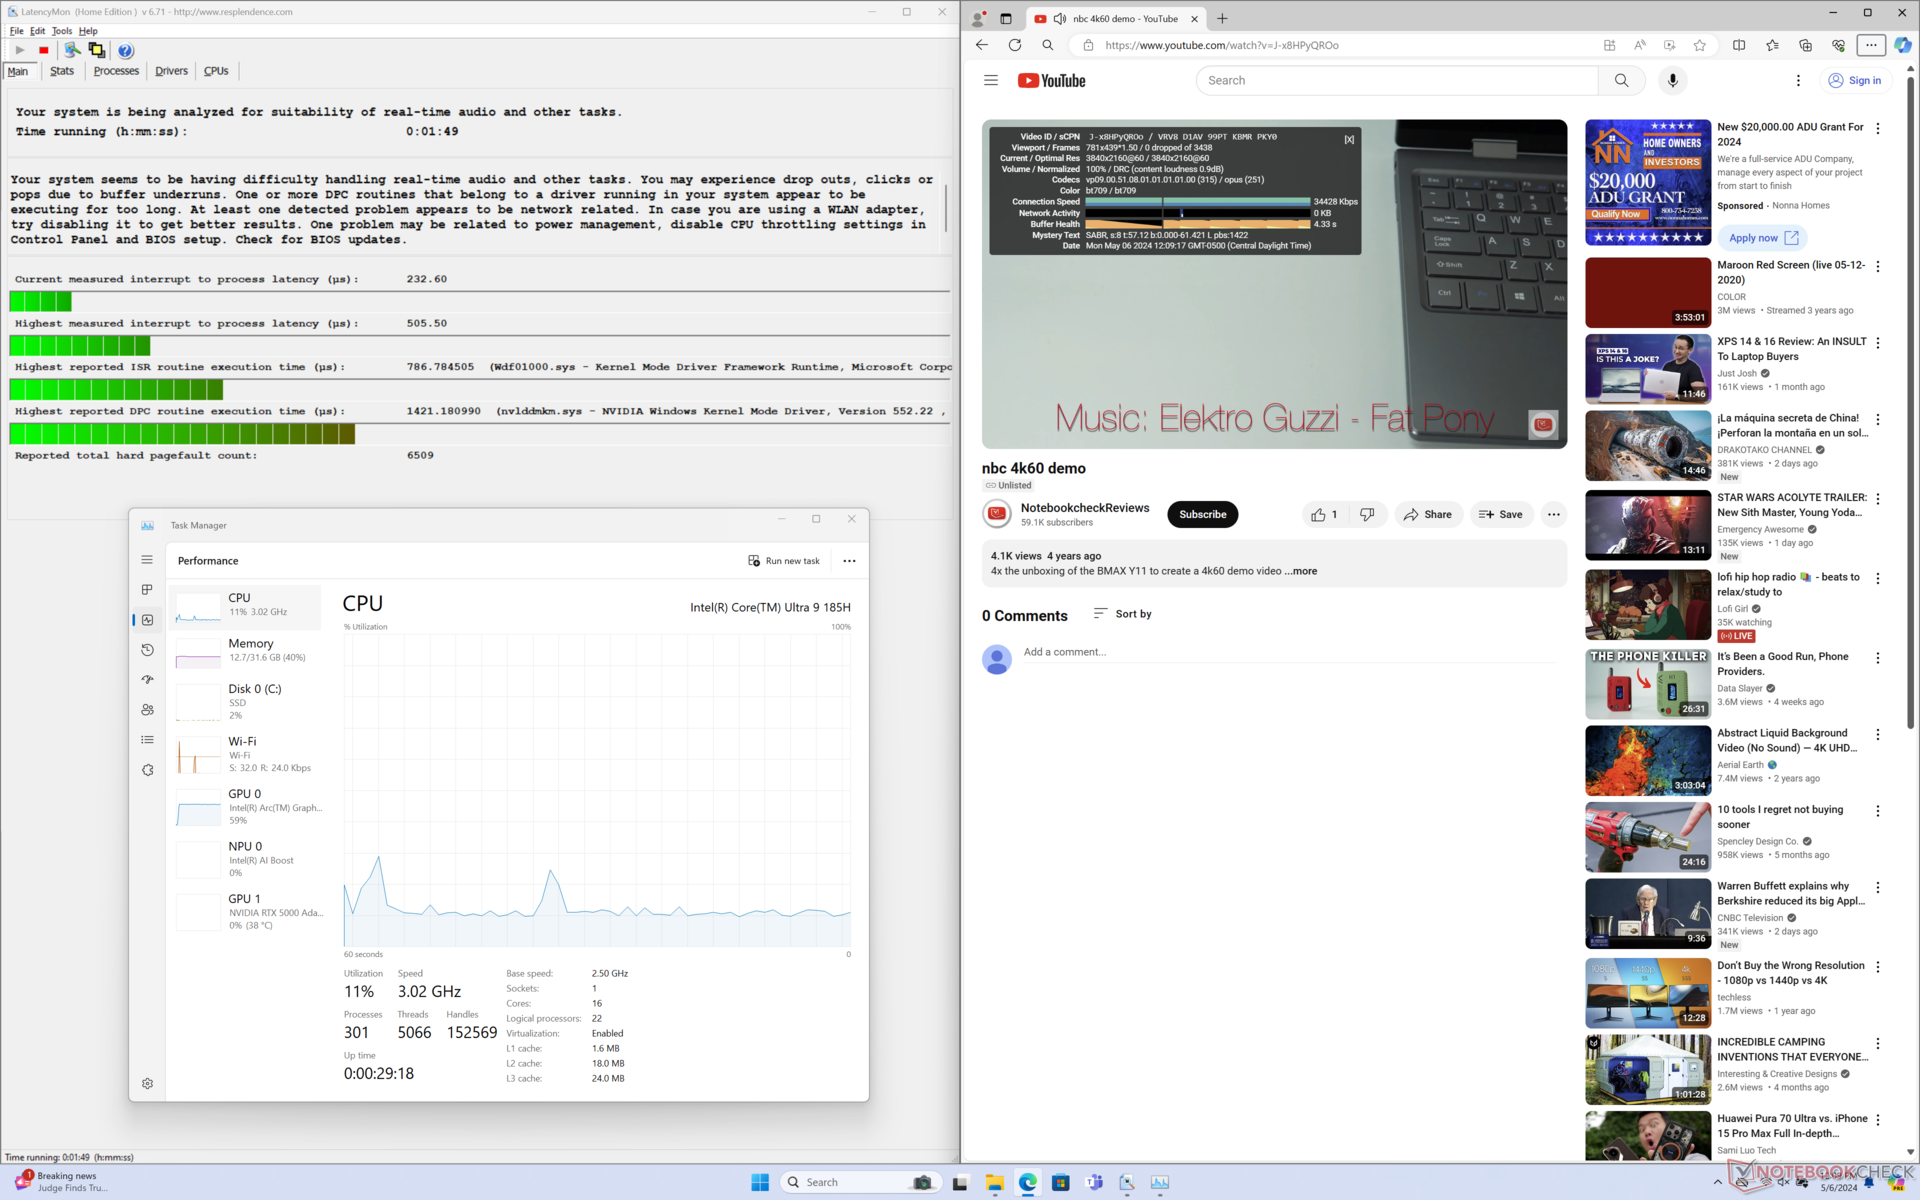
Opóźnienie DPC
LatencyMon ujawnia tylko niewielkie problemy z DPC podczas otwierania wielu kart przeglądarki na naszej stronie głównej. odtwarzanie wideo 4K przy 60 FPS jest poza tym idealne i nie odnotowano żadnych spadków klatek.

| DPC Latencies / LatencyMon - interrupt to process latency (max), Web, Youtube, Prime95 | |
| HP ZBook Fury 16 G10 | |
| Lenovo ThinkPad P1 G6-21FV000DGE | |
| Dell Precision 5000 5680 | |
| Lenovo ThinkPad P16 G2 21FA000FGE | |
| MSI CreatorPro Z16P B12UKST | |
| Dell Precision 5690 | |
* ... im mniej tym lepiej
Urządzenia pamięci masowej
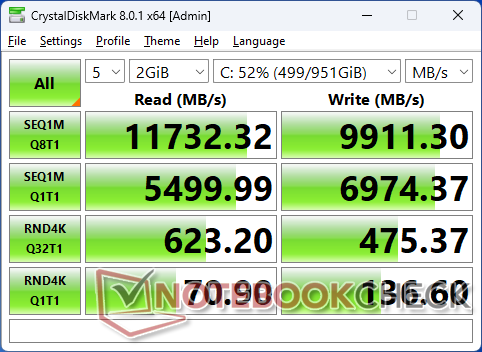
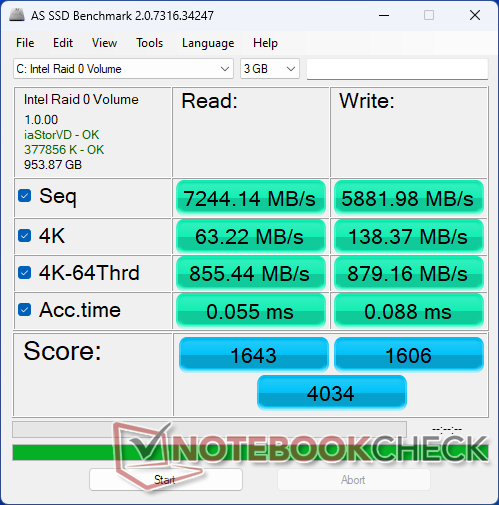
Nasza jednostka testowa jest dostarczana z dwoma Samsung PM9A1 PCIe4 x4 NVMe SSD w konfiguracji RAID 0 dla prędkości odczytu i zapisu przekraczających odpowiednio 12000 MB/s i 9000 MB/s. Wydajność jest stabilna i nie odnotowano dławienia podczas uruchamiania DiskSpd w pętli.

| Drive Performance Rating - Percent | |
| MSI CreatorPro Z16P B12UKST -8! | |
| Lenovo ThinkPad P1 G6-21FV000DGE | |
| Dell Precision 5690 | |
| HP ZBook Fury 16 G10 | |
| Dell Precision 5000 5680 | |
| Lenovo ThinkPad P16 G2 21FA000FGE | |
* ... im mniej tym lepiej
Disk Throttling: DiskSpd Read Loop, Queue Depth 8
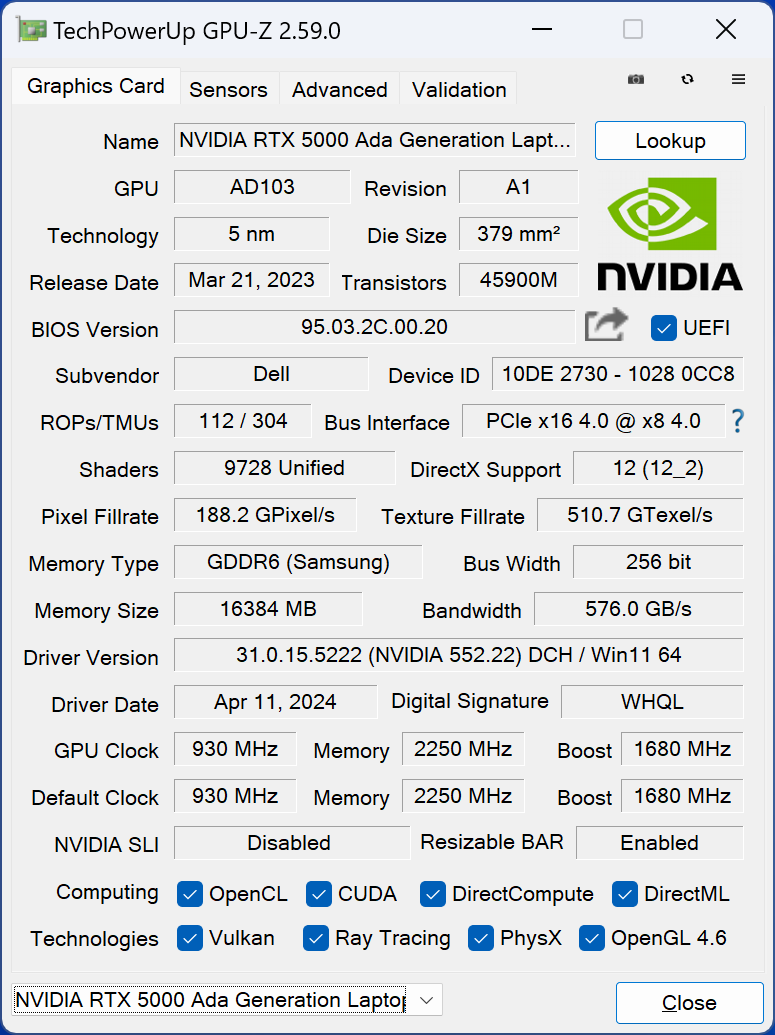
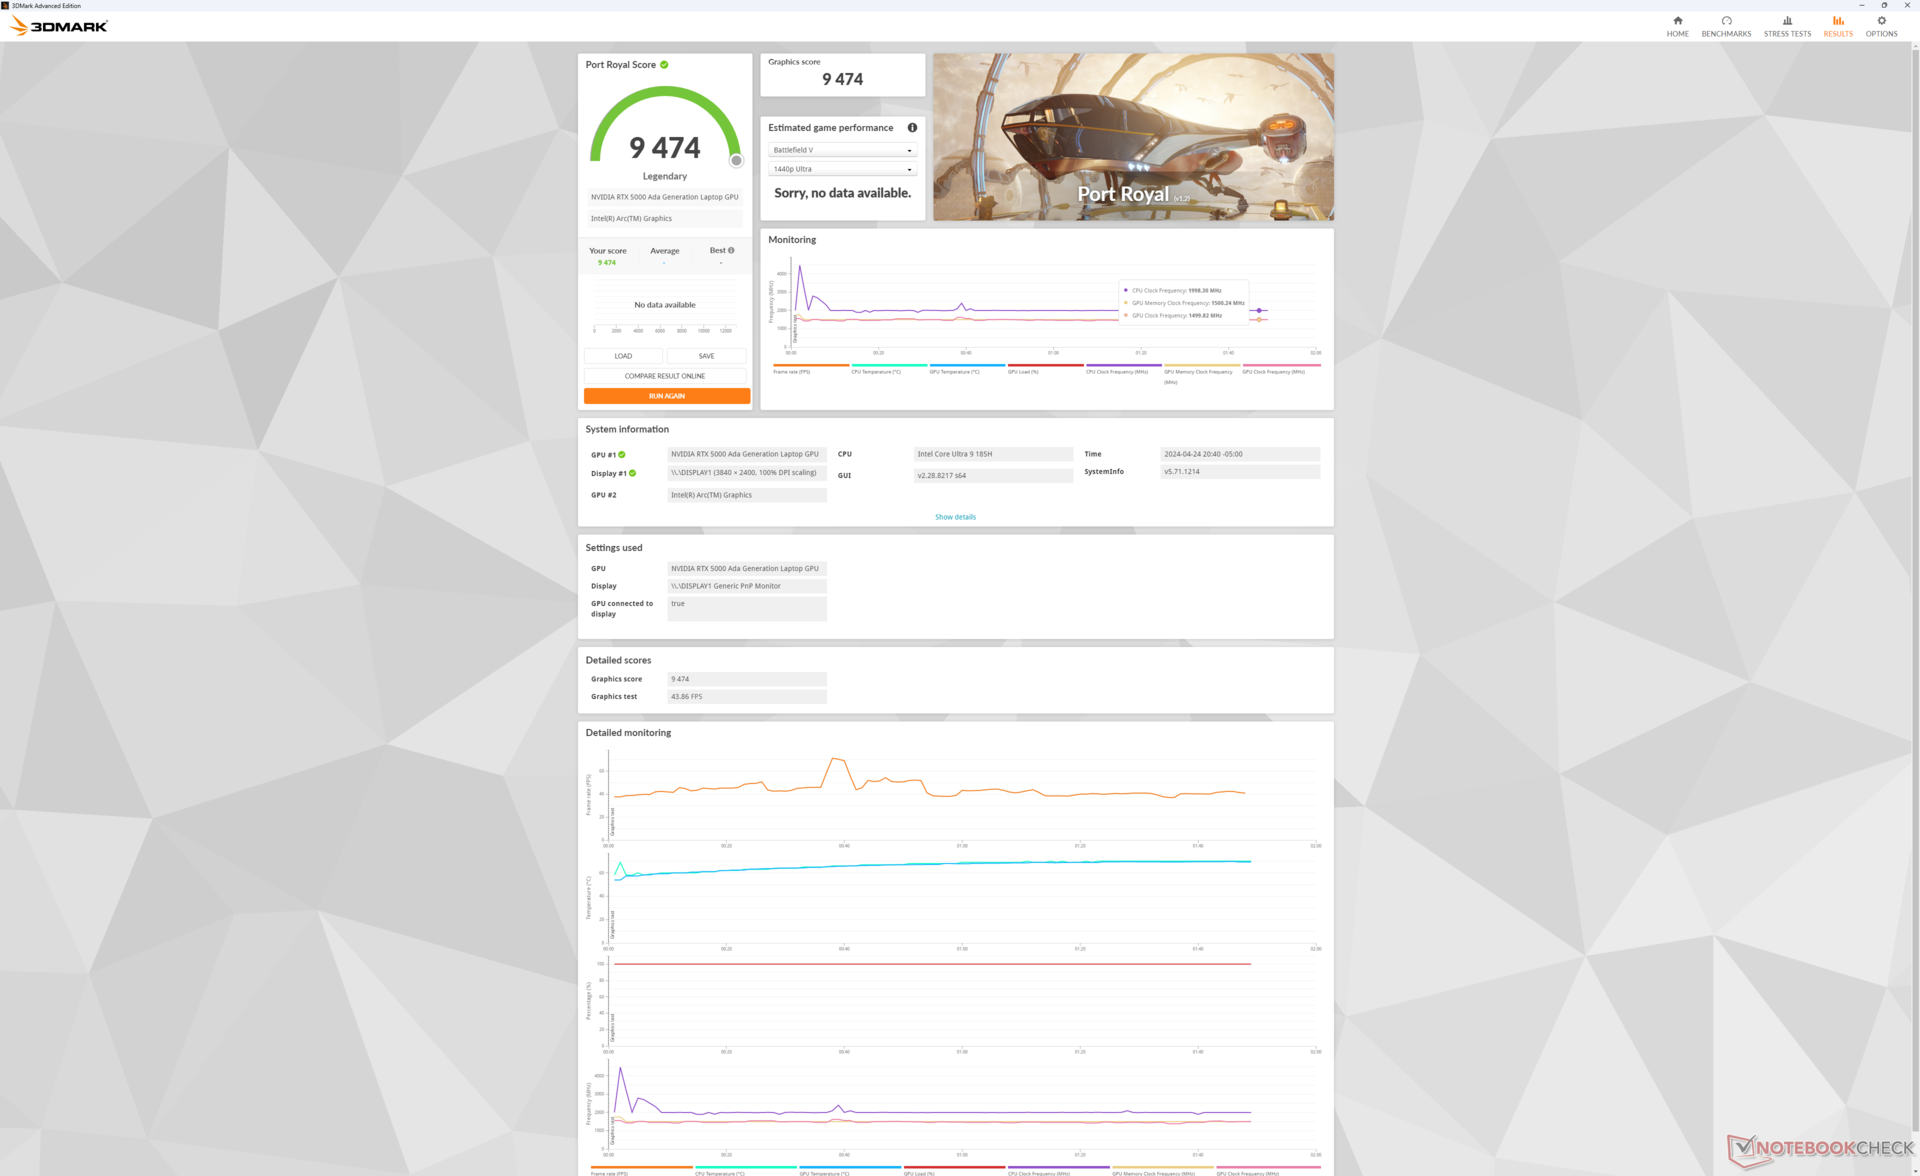
Wydajność GPU - do RTX 5000 Ada
Opcje procesorów graficznych Nvidia nie zmieniły się w stosunku do przeszłości, więc RTX 5000 Ada nadal jest opcją z najwyższej półki. Ten procesor graficzny wywodzi się z modelu GeForce RTX 4090, a więc w szczególności zawiera 16 GB pamięci VRAM zamiast 12 GB w przypadku konfiguracji z wolniejszym RTX 4000 Ada lub 3500 Ada. Użytkownicy mają do wyboru szeroką gamę procesorów graficznych RTX Ada, w tym RTX 1000 Ada, aż po naszą konfigurację RTX 5000 Ada.
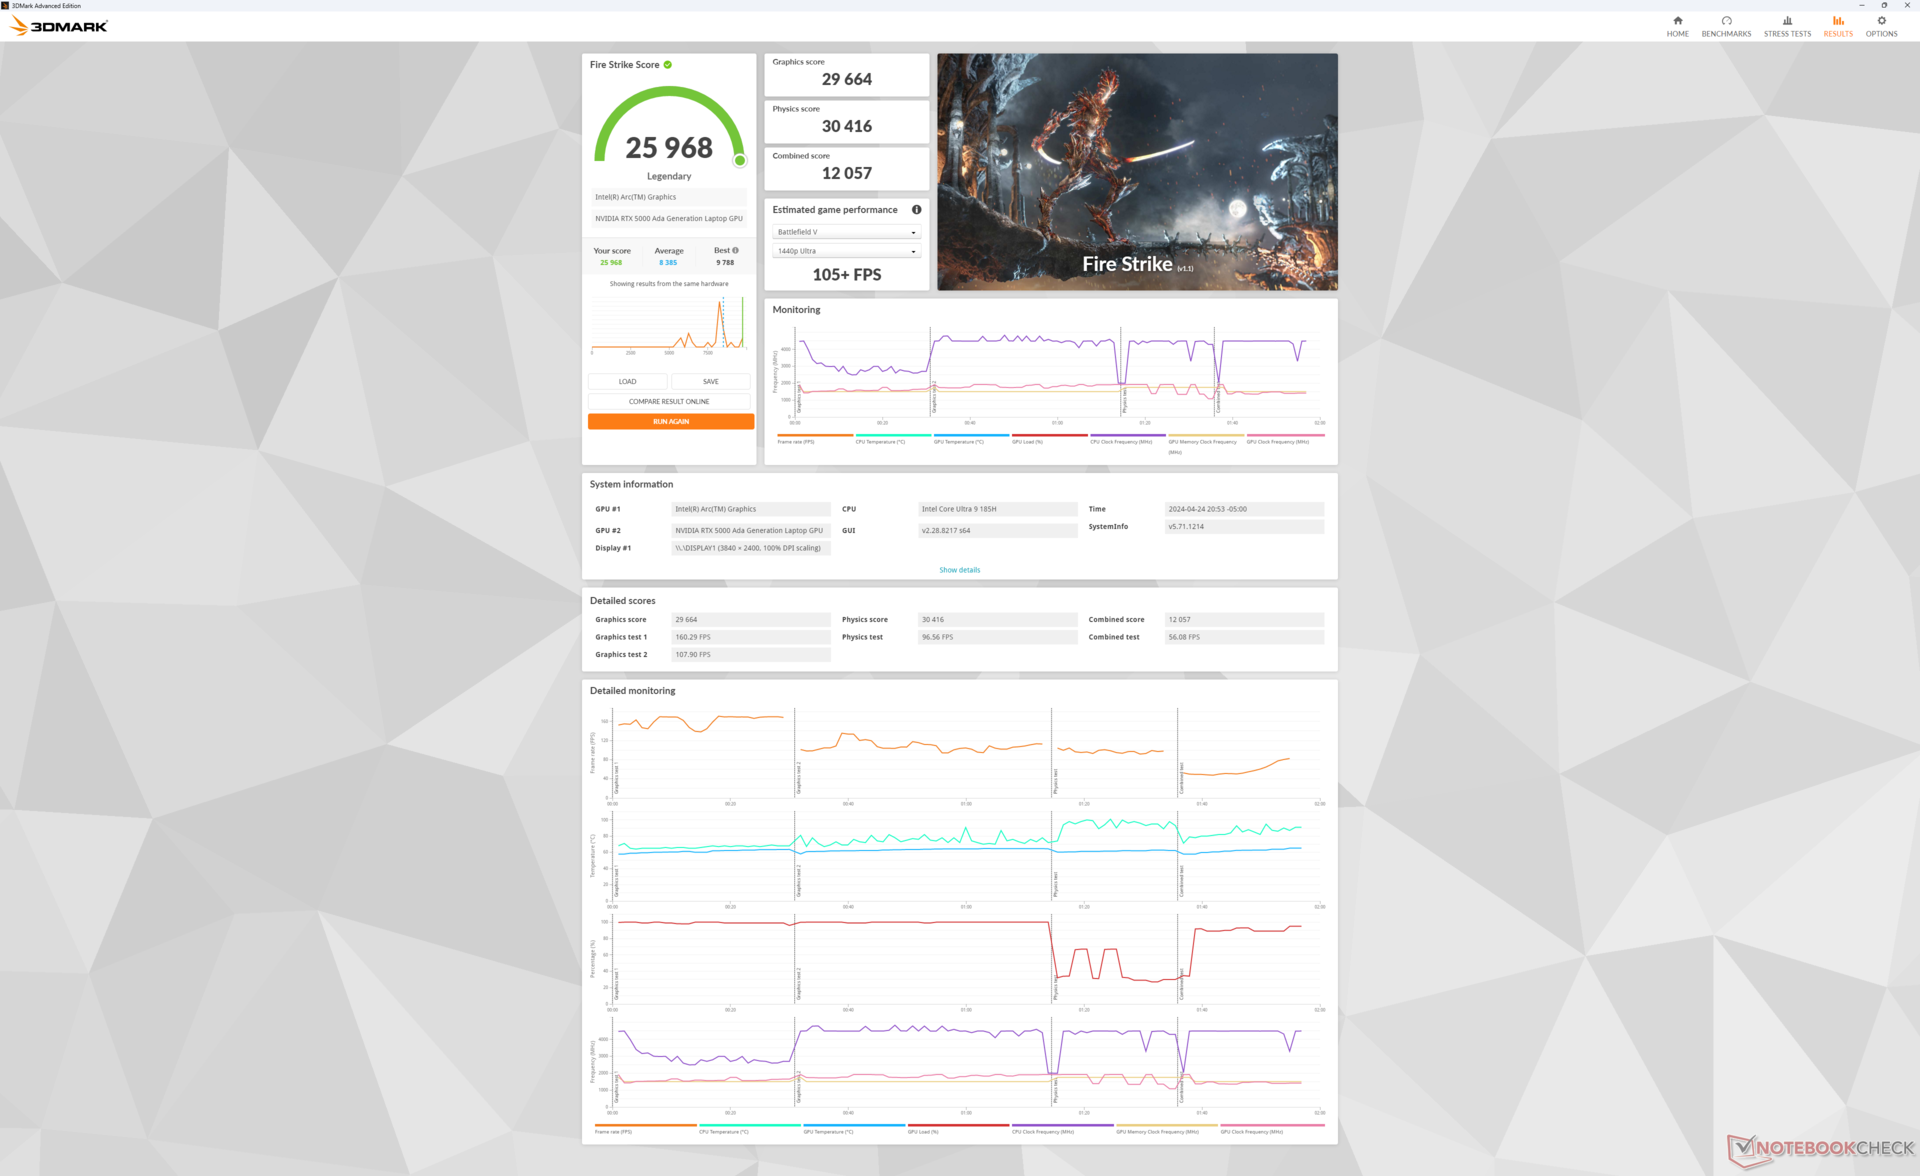
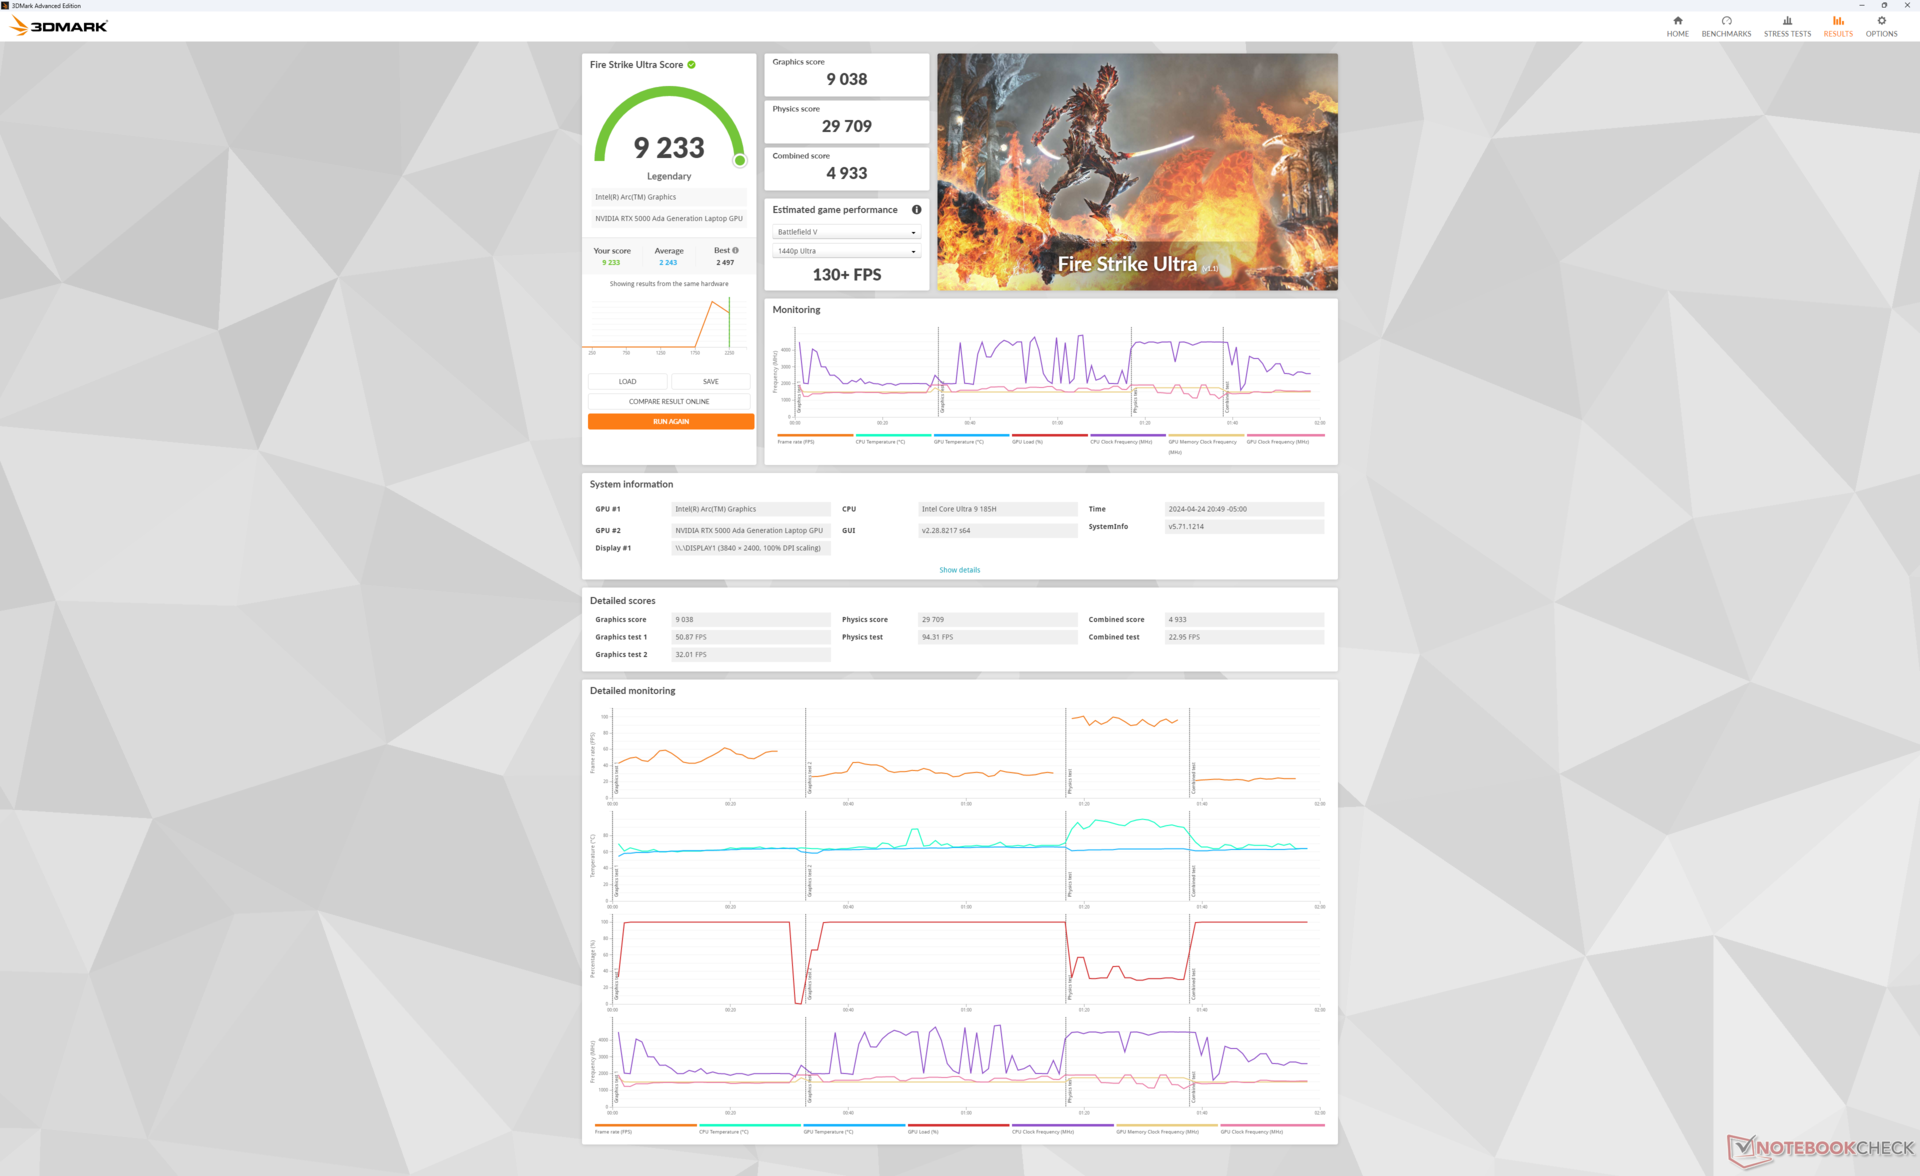
| Profil mocy | Wynik grafiki | Wynik fizyki | Wynik łączny |
| Tryb wydajności | 29664 | 30416 | 12057 |
| Tryb zrównoważony | 29771 (-0%) | 27199 (-11%) | 11770 (-2%) |
| Zasilanie bateryjne | 26674 (-10%) | 20268 (-33%) | 9539 (-21%) |
Praca w trybie zrównoważonym ma wpływ na wydajność procesora, podczas gdy wydajność grafiki pozostanie taka sama, jak pokazano w naszych wynikach Fire Strike powyżej.
| 3DMark Performance Rating - Percent | |
| HP ZBook Fury 16 G10 -2! | |
| Przeciętny Nvidia RTX 5000 Ada Generation Laptop GPU | |
| Dell Precision 5690 -2! | |
| Dell Precision 5000 5680 -2! | |
| Asus ProArt StudioBook 16 W7600H5A-2BL2 -20! | |
| HP ZBook Fury 16 G9 -2! | |
| Dell XPS 16 9640 -35! | |
| Lenovo ThinkPad P1 G6-21FV000DGE -16! | |
| Lenovo ThinkPad P16 G2 21FA000FGE -18! | |
| MSI CreatorPro Z16P B12UKST -17! | |
| Lenovo ThinkPad P16v G1 AMD -16! | |
| Lenovo ThinkPad P16 G1 21D6001DMB -18! | |
| Lenovo ThinkPad P1 G4-20Y30017GE -18! | |
| Lenovo ThinkPad P16s G2 21K9000CGE -18! | |
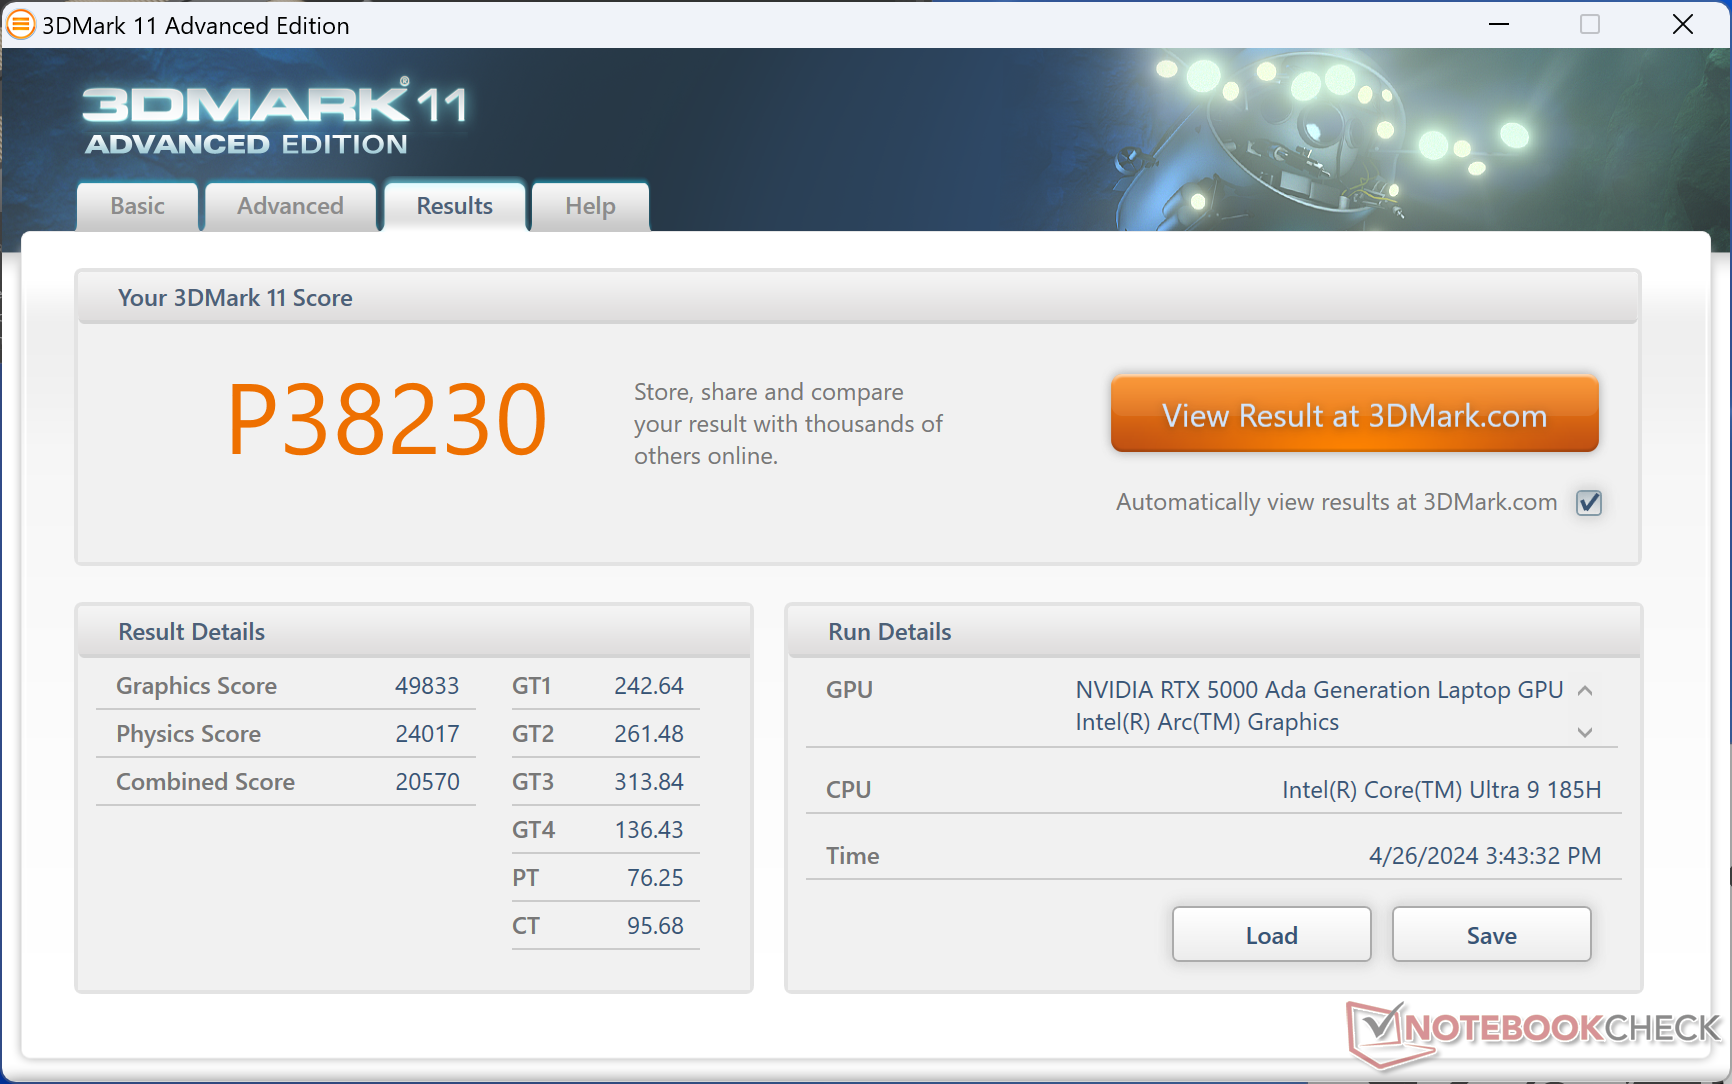
| 3DMark 11 Performance | 38230 pkt. | |
| 3DMark Fire Strike Score | 25968 pkt. | |
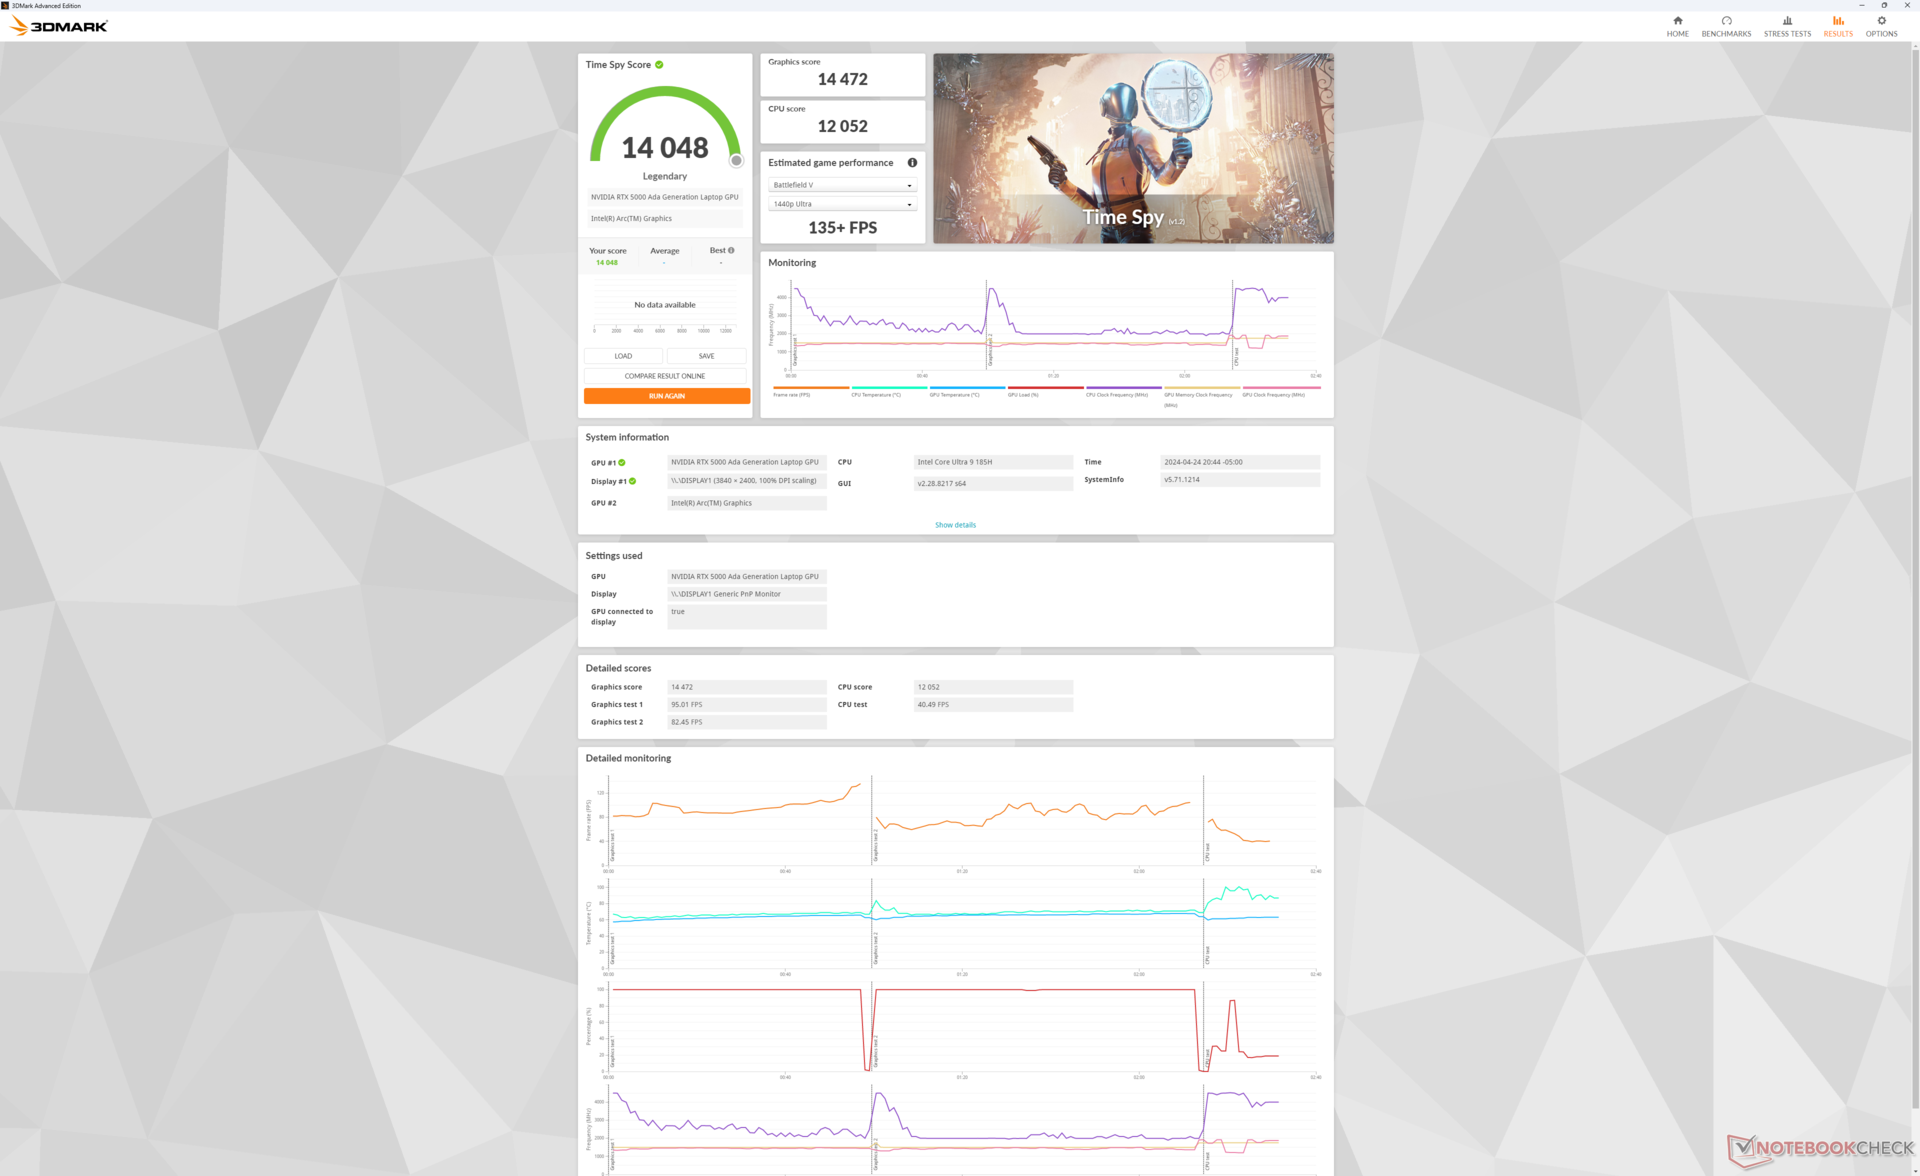
| 3DMark Time Spy Score | 14048 pkt. | |
Pomoc | ||
* ... im mniej tym lepiej
| Performance Rating - Percent | |
| HP ZBook Fury 16 G10 | |
| Dell Precision 5000 5680 -1! | |
| Dell Precision 5690 | |
| Lenovo ThinkPad P16 G2 21FA000FGE | |
| Lenovo ThinkPad P1 G6-21FV000DGE | |
| MSI CreatorPro Z16P B12UKST | |
| The Witcher 3 - 1920x1080 Ultra Graphics & Postprocessing (HBAO+) | |
| HP ZBook Fury 16 G10 | |
| Dell Precision 5690 | |
| Dell Precision 5000 5680 | |
| Lenovo ThinkPad P16 G2 21FA000FGE | |
| Lenovo ThinkPad P1 G6-21FV000DGE | |
| MSI CreatorPro Z16P B12UKST | |
| Final Fantasy XV Benchmark - 1920x1080 High Quality | |
| HP ZBook Fury 16 G10 | |
| Dell Precision 5690 | |
| Dell Precision 5000 5680 | |
| Lenovo ThinkPad P16 G2 21FA000FGE | |
| Lenovo ThinkPad P1 G6-21FV000DGE | |
| MSI CreatorPro Z16P B12UKST | |
| Strange Brigade - 1920x1080 ultra AA:ultra AF:16 | |
| HP ZBook Fury 16 G10 | |
| Dell Precision 5690 | |
| Lenovo ThinkPad P16 G2 21FA000FGE | |
| Lenovo ThinkPad P1 G6-21FV000DGE | |
| MSI CreatorPro Z16P B12UKST | |
| Dota 2 Reborn - 1920x1080 ultra (3/3) best looking | |
| HP ZBook Fury 16 G10 | |
| Lenovo ThinkPad P16 G2 21FA000FGE | |
| MSI CreatorPro Z16P B12UKST | |
| Dell Precision 5000 5680 | |
| Dell Precision 5690 | |
| Lenovo ThinkPad P1 G6-21FV000DGE | |
| X-Plane 11.11 - 1920x1080 high (fps_test=3) | |
| HP ZBook Fury 16 G10 | |
| Lenovo ThinkPad P1 G6-21FV000DGE | |
| Lenovo ThinkPad P16 G2 21FA000FGE | |
| Dell Precision 5000 5680 | |
| MSI CreatorPro Z16P B12UKST | |
| Dell Precision 5690 | |
| Baldur's Gate 3 | |
| 1920x1080 High Preset | |
| Dell Precision 5690 | |
| Przeciętny Nvidia RTX 5000 Ada Generation Laptop GPU (n=1) | |
| Dell XPS 16 9640 | |
| 1920x1080 Ultra Preset | |
| Dell Precision 5690 | |
| Przeciętny Nvidia RTX 5000 Ada Generation Laptop GPU (n=1) | |
| Dell XPS 16 9640 | |
| 2560x1440 Ultra Preset | |
| Dell Precision 5690 | |
| Przeciętny Nvidia RTX 5000 Ada Generation Laptop GPU (n=1) | |
| Dell XPS 16 9640 | |
| 3840x2160 Ultra Preset | |
| Dell Precision 5690 | |
| Przeciętny Nvidia RTX 5000 Ada Generation Laptop GPU (n=1) | |
| 3840x2160 Ultra Preset + Quality DLSS | |
| Dell Precision 5690 | |
| Przeciętny Nvidia RTX 5000 Ada Generation Laptop GPU (n=1) | |
| Cyberpunk 2077 2.2 Phantom Liberty | |
| 1920x1080 High Preset (FSR off) | |
| Dell Precision 5690 | |
| Przeciętny Nvidia RTX 5000 Ada Generation Laptop GPU (n=1) | |
| Dell XPS 16 9640 | |
| Lenovo ThinkPad P16v G1 AMD | |
| 1920x1080 Ultra Preset (FSR off) | |
| Dell Precision 5690 | |
| Przeciętny Nvidia RTX 5000 Ada Generation Laptop GPU (n=1) | |
| Dell XPS 16 9640 | |
| Lenovo ThinkPad P16v G1 AMD | |
| 2560x1440 Ultra Preset (FSR off) | |
| Dell Precision 5690 | |
| Przeciętny Nvidia RTX 5000 Ada Generation Laptop GPU (n=1) | |
| Dell XPS 16 9640 | |
| 3840x2160 Ultra Preset (FSR off) | |
| Dell Precision 5690 | |
| Przeciętny Nvidia RTX 5000 Ada Generation Laptop GPU (n=1) | |
| 1920x1080 Ray Tracing Ultra Preset (DLSS off) | |
| Dell Precision 5690 | |
| Przeciętny Nvidia RTX 5000 Ada Generation Laptop GPU (n=1) | |
| Tiny Tina's Wonderlands | |
| 1920x1080 High Preset (DX12) | |
| HP ZBook Fury 16 G10 | |
| Przeciętny Nvidia RTX 5000 Ada Generation Laptop GPU (145.5 - 171.7, n=3) | |
| Dell Precision 5000 5680 | |
| Dell Precision 5690 | |
| HP ZBook Fury 16 G9 | |
| 1920x1080 Badass Preset (DX12) | |
| HP ZBook Fury 16 G10 | |
| Przeciętny Nvidia RTX 5000 Ada Generation Laptop GPU (124 - 139.4, n=3) | |
| Dell Precision 5000 5680 | |
| Dell Precision 5690 | |
| HP ZBook Fury 16 G9 | |
| 2560x1440 Badass Preset (DX12) | |
| HP ZBook Fury 16 G10 | |
| Przeciętny Nvidia RTX 5000 Ada Generation Laptop GPU (87.1 - 99.4, n=3) | |
| Dell Precision 5000 5680 | |
| Dell Precision 5690 | |
| HP ZBook Fury 16 G9 | |
| 3840x2160 Badass Preset (DX12) | |
| HP ZBook Fury 16 G10 | |
| Przeciętny Nvidia RTX 5000 Ada Generation Laptop GPU (48.4 - 53.9, n=3) | |
| Dell Precision 5000 5680 | |
| Dell Precision 5690 | |
| HP ZBook Fury 16 G9 | |
| X-Plane 11.11 | |
| 1920x1080 high (fps_test=3) | |
| HP ZBook Fury 16 G10 | |
| Lenovo ThinkPad P1 G6-21FV000DGE | |
| Przeciętny Nvidia RTX 5000 Ada Generation Laptop GPU (88.7 - 122.4, n=3) | |
| HP ZBook Fury 16 G9 | |
| Lenovo ThinkPad P16 G2 21FA000FGE | |
| Dell Precision 5000 5680 | |
| MSI CreatorPro Z16P B12UKST | |
| Lenovo ThinkPad P16 G1 21D6001DMB | |
| Dell Precision 5690 | |
| Dell XPS 16 9640 | |
| Dell XPS 16 9640 | |
| Asus ProArt StudioBook 16 W7600H5A-2BL2 | |
| Lenovo ThinkPad P16v G1 AMD | |
| Lenovo ThinkPad P1 G4-20Y30017GE | |
| Lenovo ThinkPad P16s G2 21K9000CGE | |
| Lenovo ThinkPad P16s G2 21K9000CGE | |
| 3840x2160 high (fps_test=3) | |
| HP ZBook Fury 16 G10 | |
| Przeciętny Nvidia RTX 5000 Ada Generation Laptop GPU (74.8 - 102.6, n=3) | |
| Dell Precision 5000 5680 | |
| HP ZBook Fury 16 G9 | |
| Dell Precision 5690 | |
| Dell XPS 16 9640 | |
| Lenovo ThinkPad P1 G4-20Y30017GE | |
| Asus ProArt StudioBook 16 W7600H5A-2BL2 | |
| Lenovo ThinkPad P16s G2 21K9000CGE | |
Witcher 3 FPS Chart
| low | med. | high | ultra | QHD | 4K DLSS | 4K | |
|---|---|---|---|---|---|---|---|
| The Witcher 3 (2015) | 411.3 | 351.2 | 258.7 | 137.6 | 103.9 | ||
| Dota 2 Reborn (2015) | 169.4 | 149.2 | 150.1 | 139.9 | 130 | ||
| Final Fantasy XV Benchmark (2018) | 196.6 | 165.4 | 132.5 | 103.8 | 63.2 | ||
| X-Plane 11.11 (2018) | 132.8 | 113.9 | 88.7 | 74.8 | |||
| Far Cry 5 (2018) | 144 | 134 | 127 | 119 | 113 | 72 | |
| Strange Brigade (2018) | 405 | 314 | 276 | 252 | 190.6 | 105.3 | |
| Tiny Tina's Wonderlands (2022) | 196.5 | 179.4 | 145.5 | 124 | 87.1 | 48.4 | |
| F1 22 (2022) | 228 | 224 | 217 | 91.1 | 60.1 | 29.6 | |
| Baldur's Gate 3 (2023) | 172.3 | 155.2 | 139.2 | 134.6 | 100.5 | 87.8 | 53.3 |
| Cyberpunk 2077 2.2 Phantom Liberty (2023) | 125 | 116.6 | 94.6 | 108.5 | 63.7 | 28.8 |
Emisje
System Noise - Loud And In Charge
Hałas wentylatora jest wrażliwy na wybrany profil mocy. Na przykład w trybie cichym hałas wentylatora ma tendencję do utrzymywania się poniżej 25 dB(A) na cichym tle 23,4 dB(A). I odwrotnie, wentylatory mają tendencję do szybszego pulsowania do 30 dB(A), jeśli są ustawione na tryby Zrównoważony lub Wydajność, nawet podczas prozaicznych zadań, takich jak przeglądanie stron internetowych.
Pułap hałasu wentylatorów jest poza tym taki sam jak ten, który zarejestrowaliśmy na Precision 5680 na poziomie 51 dB(A), który jest tak głośny jak wiele laptopów do gier. Ten maksymalny poziom może zostać osiągnięty przy obciążeniu GPU przez więcej niż kilka minut.
Hałas
| luz |
| 23.6 / 24.9 / 30.9 dB |
| obciążenie |
| 40.4 / 51.9 dB |
 | ||
30 dB cichy 40 dB(A) słyszalny 50 dB(A) irytujący |
||
min: | ||
| Dell Precision 5690 NVIDIA RTX 5000 Ada Generation Laptop GPU, Ultra 9 185H, 2x Samsung PM9A1 1TB (RAID 0) | Dell Precision 5000 5680 NVIDIA RTX 5000 Ada Generation Laptop GPU, i9-13900H, 2x SK hynix PC801 HFS512GEJ9X101N RAID 0 | Lenovo ThinkPad P16 G2 21FA000FGE NVIDIA RTX 2000 Ada Generation Laptop GPU, i7-13700HX, SK hynix PC801 HFS001TEJ9X162N | Lenovo ThinkPad P1 G6-21FV000DGE NVIDIA RTX 2000 Ada Generation Laptop GPU, i9-13900H, SK Hynix PC711 1TB HFS001TDE9X084N | HP ZBook Fury 16 G10 NVIDIA RTX 5000 Ada Generation Laptop GPU, i9-13950HX, SK hynix PC801 HFS001TEJ9X101N | MSI CreatorPro Z16P B12UKST RTX A3000 Laptop GPU, i7-12700H, Samsung PM9A1 MZVL21T0HCLR | |
|---|---|---|---|---|---|---|
| Noise | 6% | -1% | 3% | 6% | -0% | |
| wyłączone / środowisko * | 23.4 | 22.8 3% | 23.5 -0% | 24.5 -5% | 22.9 2% | 24.1 -3% |
| Idle Minimum * | 23.6 | 23 3% | 23.5 -0% | 24.5 -4% | 22.9 3% | 27.1 -15% |
| Idle Average * | 24.9 | 23 8% | 29.2 -17% | 24.5 2% | 22.9 8% | 27.1 -9% |
| Idle Maximum * | 30.9 | 23 26% | 29.5 5% | 24.5 21% | 28.5 8% | 27.1 12% |
| Load Average * | 40.4 | 37.2 8% | 32.7 19% | 48 -19% | 40.6 -0% | 42.9 -6% |
| Witcher 3 ultra * | 48.3 | 51 -6% | 50.6 -5% | 40.7 16% | 44.1 9% | 44 9% |
| Load Maximum * | 51.9 | 51 2% | 56.6 -9% | 48 8% | 45.8 12% | 47 9% |
* ... im mniej tym lepiej
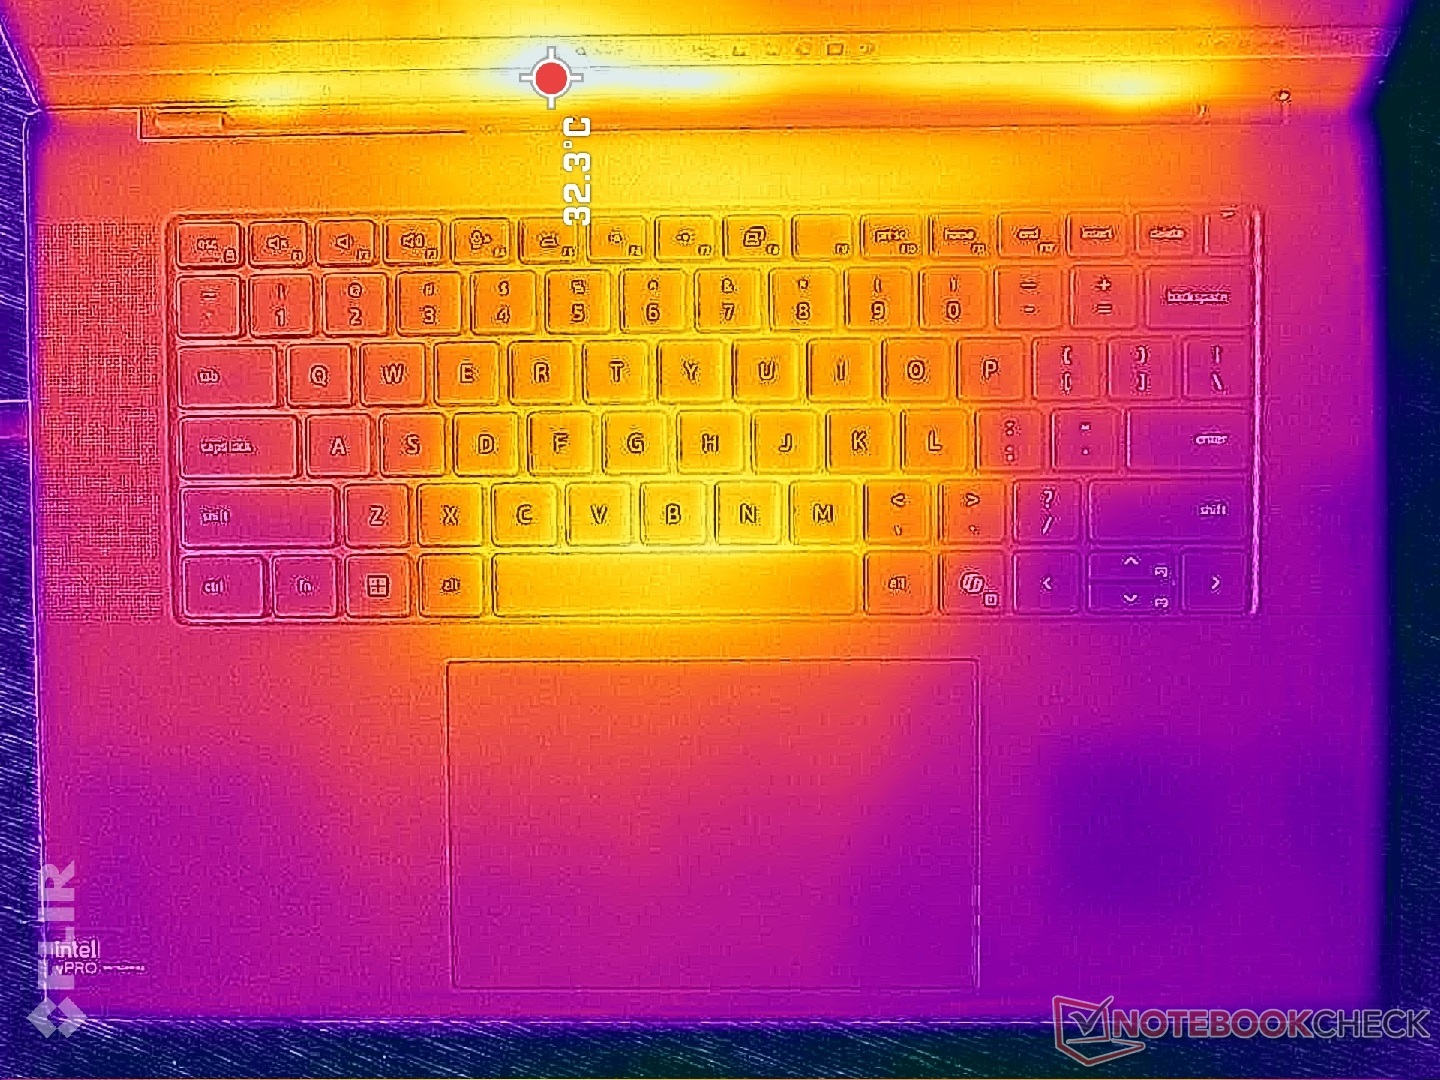
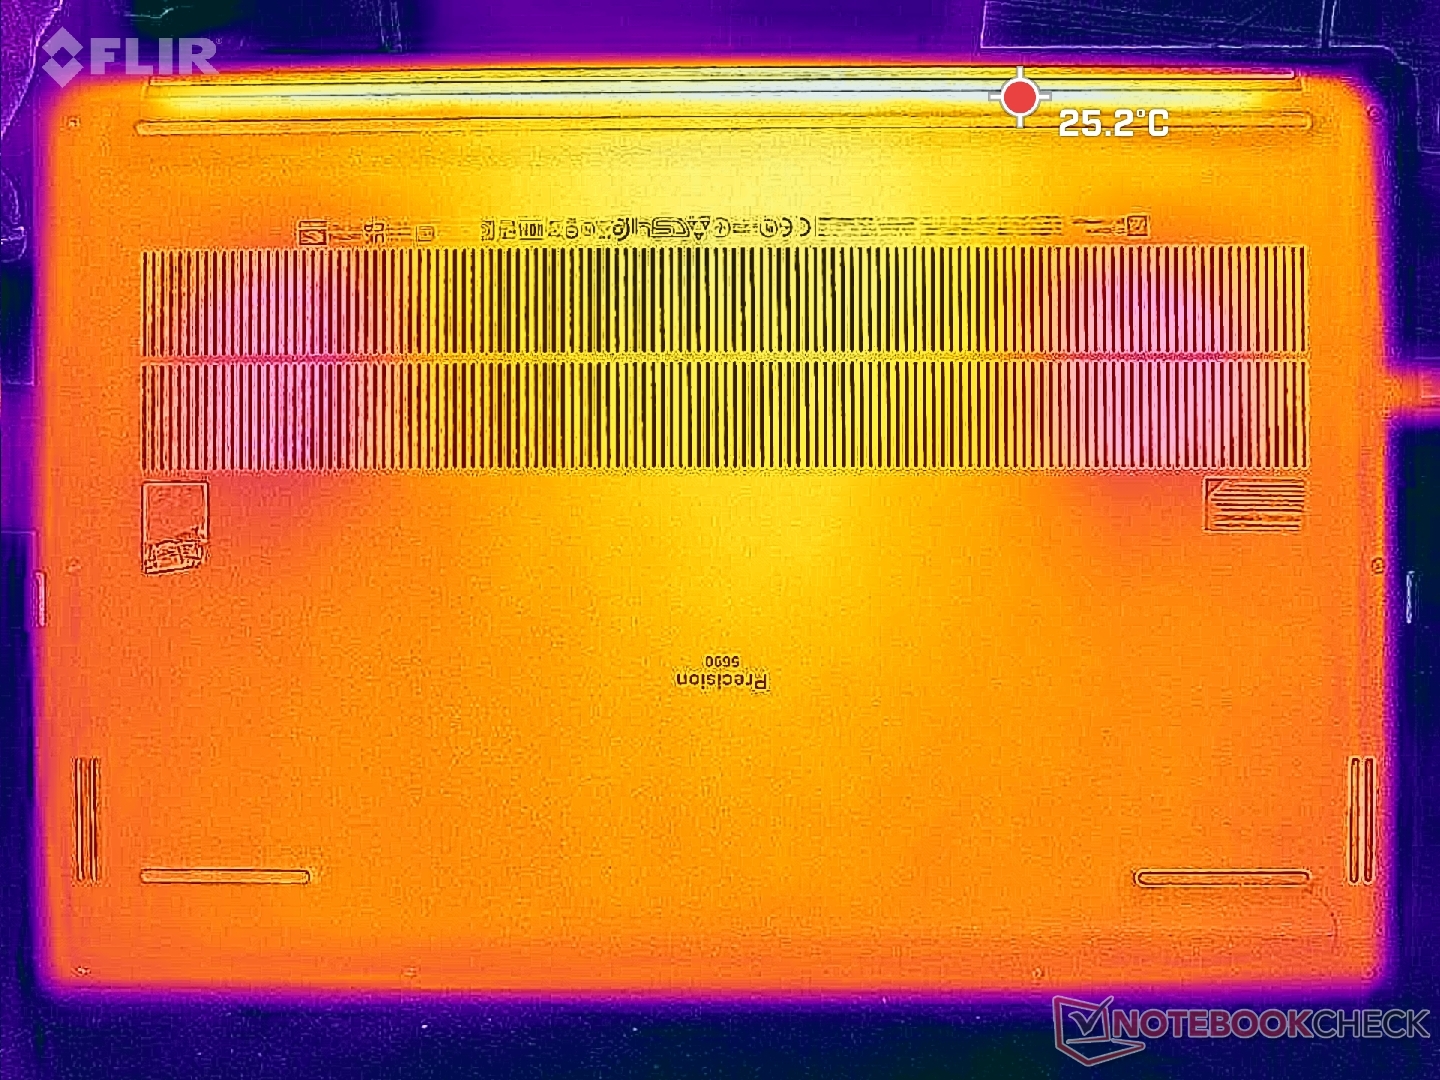
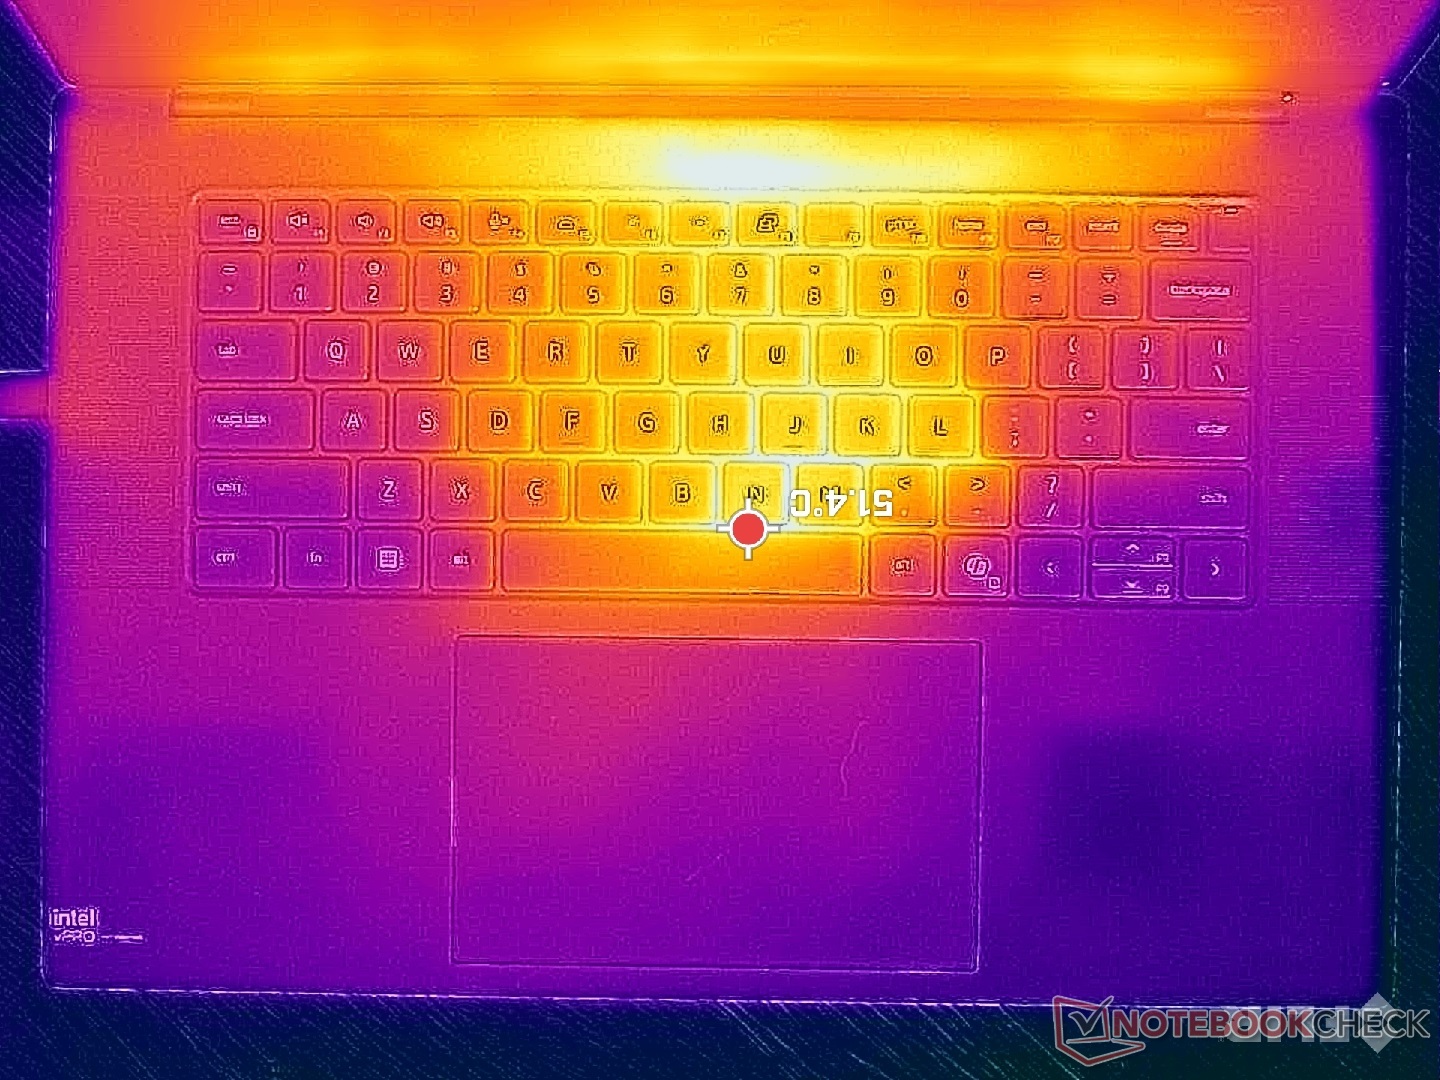
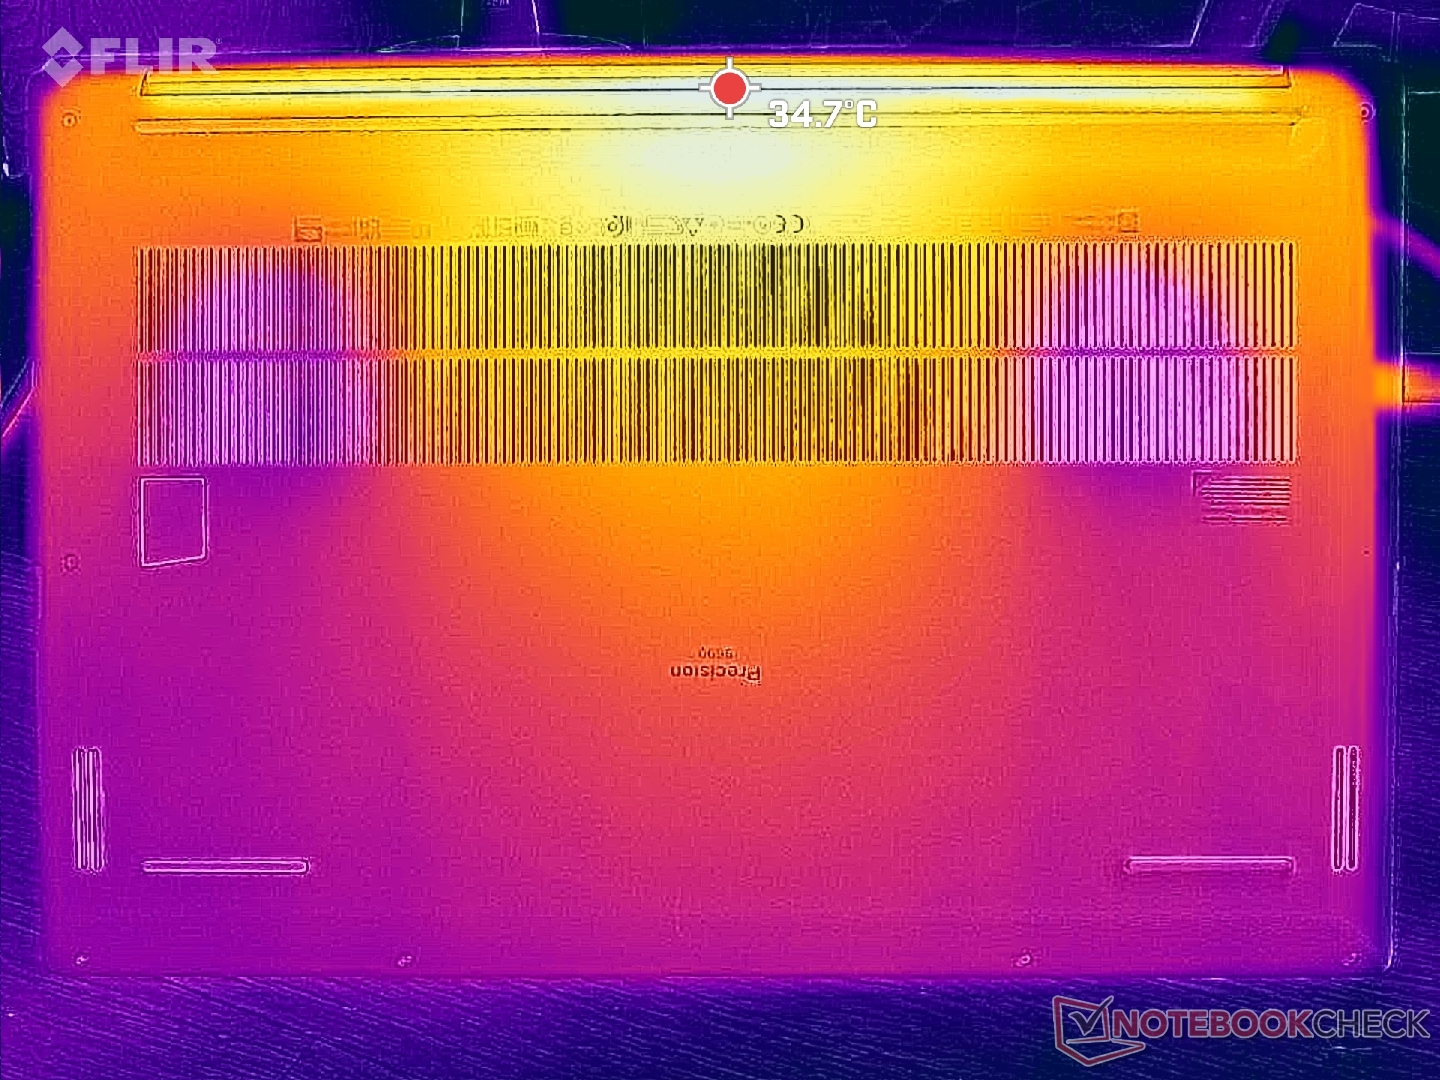
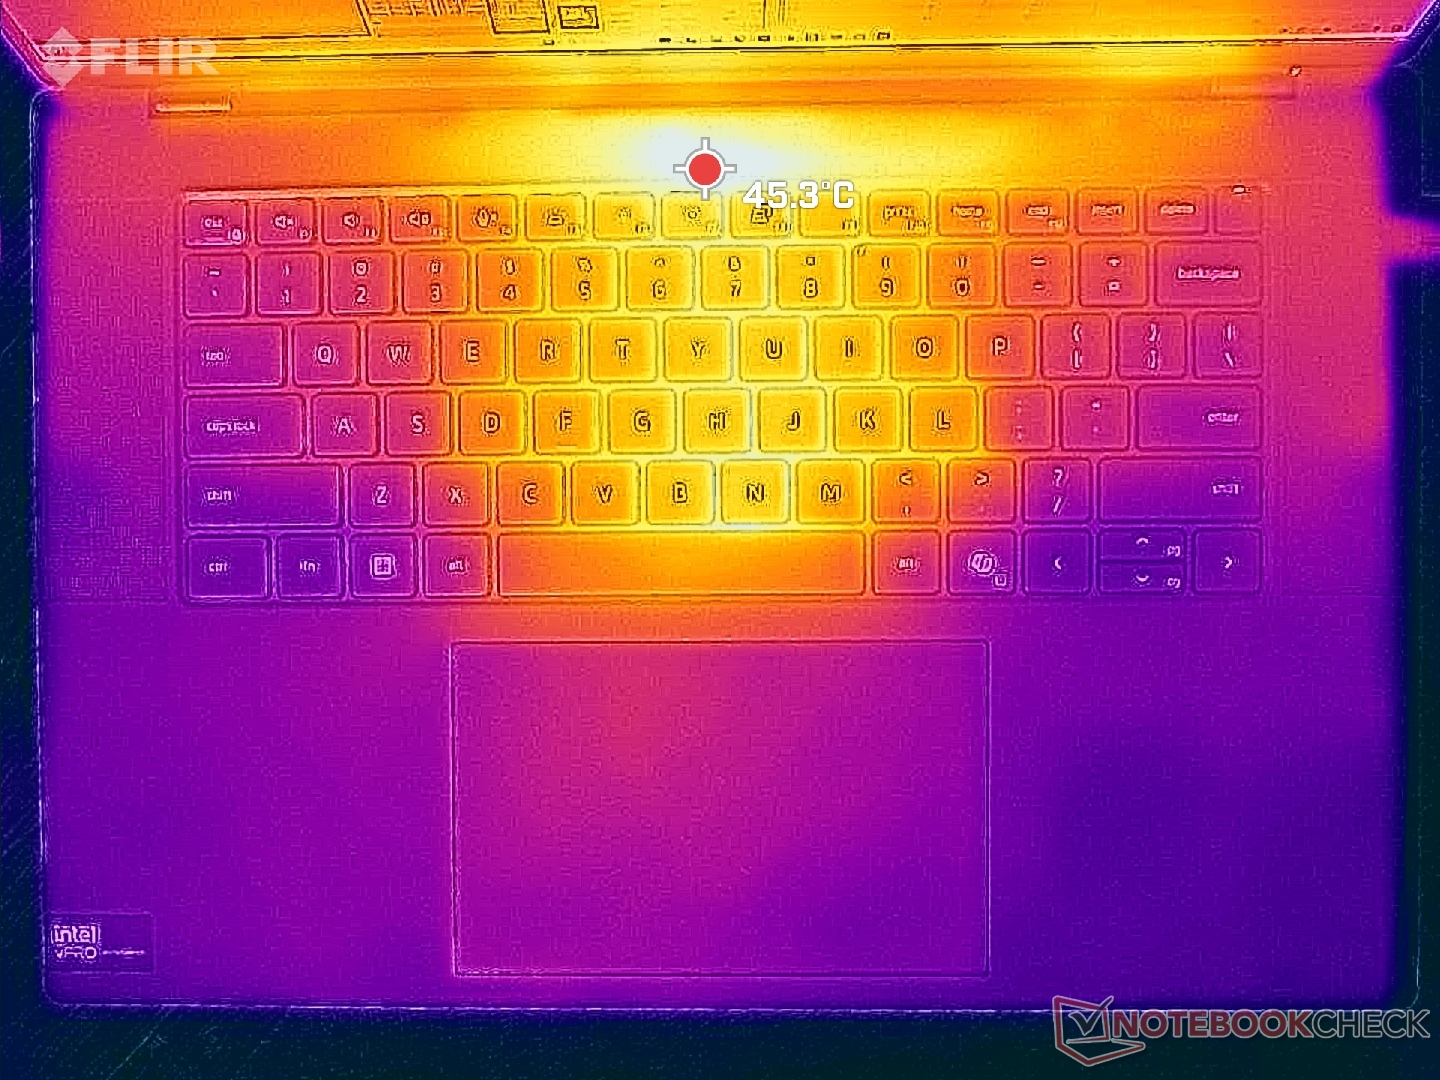
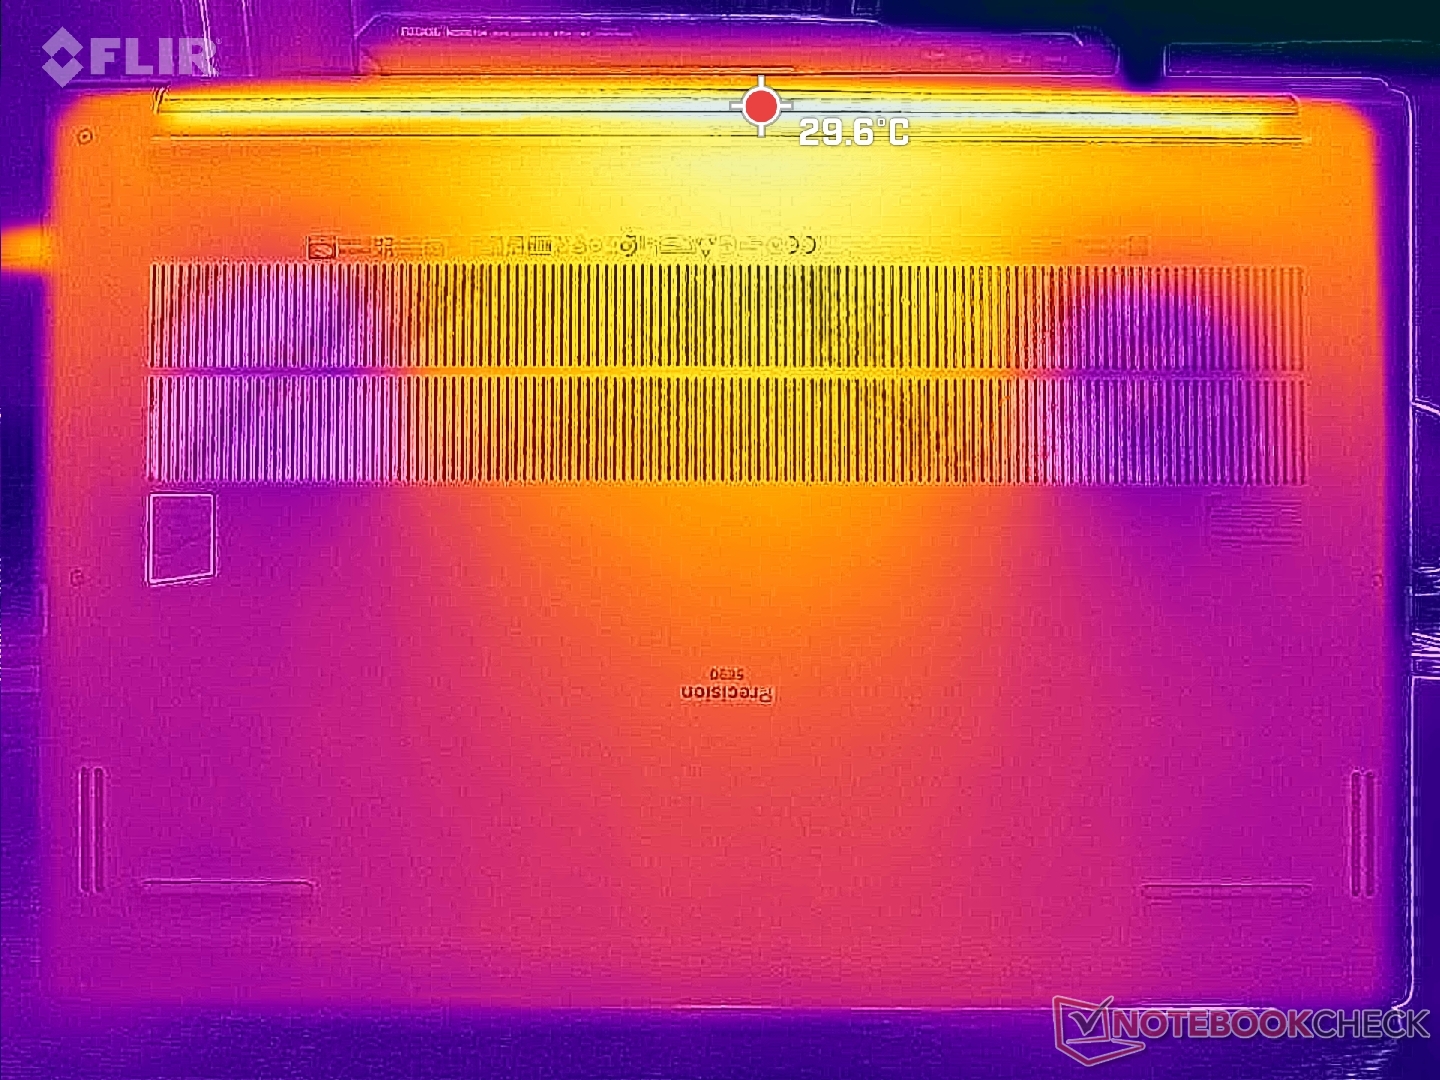
Temperatura
Rozwój temperatury powierzchni jest symetryczny z gorącymi punktami o temperaturze od 43 C do 47 C w pobliżu środka klawiatury. Dolna część obudowy pozostaje zauważalnie chłodniejsza niż klawiatura, nawet przy dużych obciążeniach.
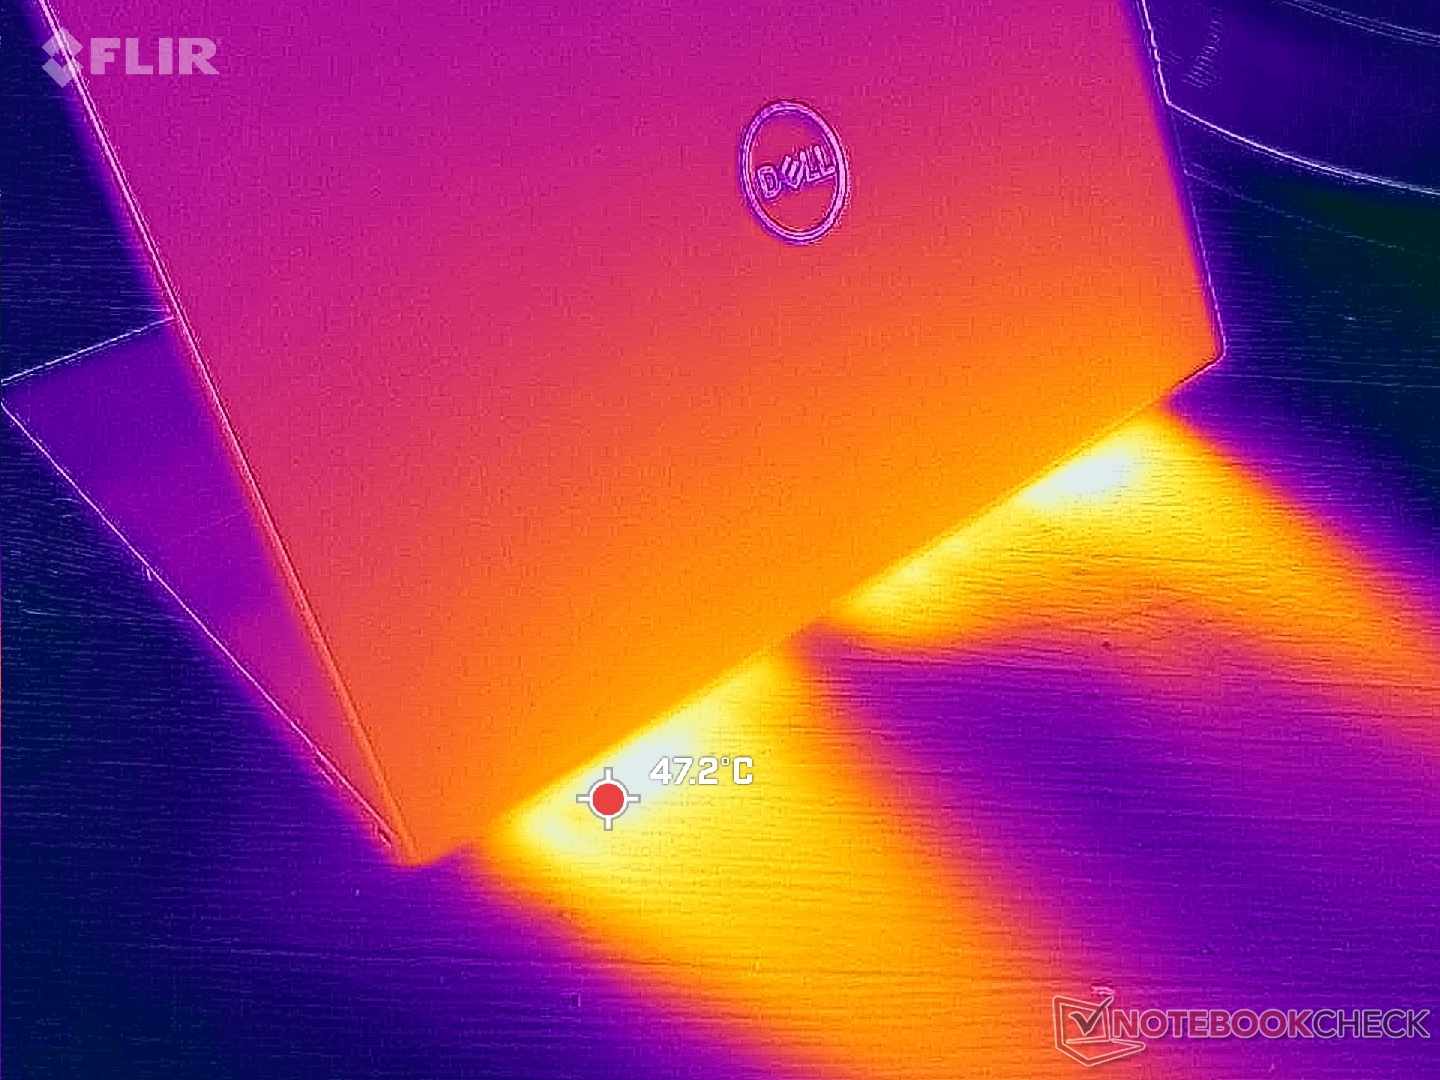
(-) Maksymalna temperatura w górnej części wynosi 46.6 °C / 116 F, w porównaniu do średniej 38.2 °C / 101 F , począwszy od 22.2 do 69.8 °C dla klasy Workstation.
(+) Dno nagrzewa się maksymalnie do 33 °C / 91 F, w porównaniu do średniej 41.2 °C / 106 F
(+) W stanie bezczynności średnia temperatura górnej części wynosi 29.2 °C / 85 F, w porównaniu ze średnią temperaturą urządzenia wynoszącą 32 °C / ### class_avg_f### F.
(±) Podczas gry w Wiedźmina 3 średnia temperatura górnej części wynosi 34 °C / 93 F, w porównaniu do średniej temperatury urządzenia wynoszącej 32 °C / ## #class_avg_f### F.
(+) Podpórki pod nadgarstki i touchpad są chłodniejsze niż temperatura skóry i maksymalnie 27.6 °C / 81.7 F i dlatego są chłodne w dotyku.
(±) Średnia temperatura obszaru podparcia dłoni w podobnych urządzeniach wynosiła 27.8 °C / 82 F (+0.2 °C / 0.3 F).
| Dell Precision 5690 Intel Core Ultra 9 185H, Nvidia RTX 5000 Ada Generation Laptop GPU | Dell Precision 5000 5680 Intel Core i9-13900H, Nvidia RTX 5000 Ada Generation Laptop GPU | Lenovo ThinkPad P16 G2 21FA000FGE Intel Core i7-13700HX, NVIDIA RTX 2000 Ada Generation Laptop GPU | Lenovo ThinkPad P1 G6-21FV000DGE Intel Core i9-13900H, NVIDIA RTX 2000 Ada Generation Laptop GPU | HP ZBook Fury 16 G10 Intel Core i9-13950HX, Nvidia RTX 5000 Ada Generation Laptop GPU | MSI CreatorPro Z16P B12UKST Intel Core i7-12700H, NVIDIA RTX A3000 Laptop GPU | |
|---|---|---|---|---|---|---|
| Heat | -7% | 2% | -13% | -16% | -24% | |
| Maximum Upper Side * | 46.6 | 50.2 -8% | 47.2 -1% | 47.1 -1% | 44.8 4% | 56.3 -21% |
| Maximum Bottom * | 33 | 32 3% | 39.5 -20% | 56.5 -71% | 50 -52% | 68.3 -107% |
| Idle Upper Side * | 32.4 | 37.4 -15% | 28.1 13% | 28.1 13% | 34.4 -6% | 25.2 22% |
| Idle Bottom * | 29.4 | 31.2 -6% | 25.3 14% | 27.6 6% | 31.8 -8% | 25.9 12% |
* ... im mniej tym lepiej
Głośniki
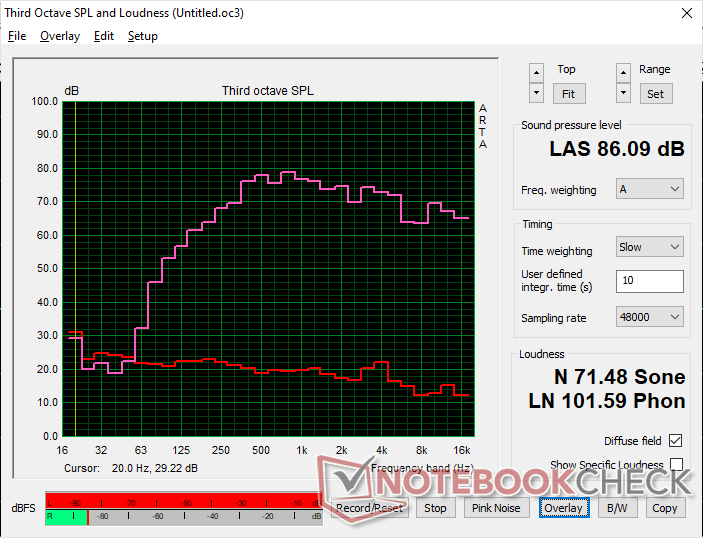
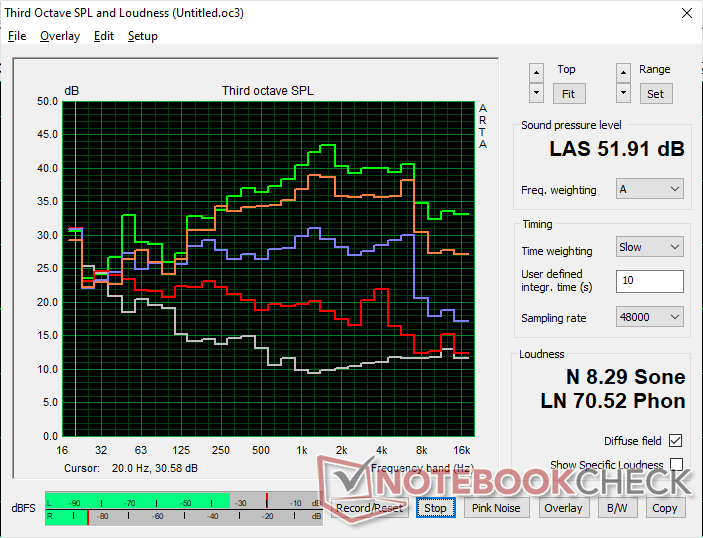
Dell Precision 5690 analiza dźwięku
(+) | głośniki mogą odtwarzać stosunkowo głośno (86.1 dB)
Bas 100 - 315 Hz
(±) | zredukowany bas - średnio 9.4% niższy od mediany
(±) | liniowość basu jest średnia (7.6% delta do poprzedniej częstotliwości)
Średnie 400 - 2000 Hz
(+) | zbalansowane środki średnie - tylko 4.7% od mediany
(+) | średnie są liniowe (4.8% delta do poprzedniej częstotliwości)
Wysokie 2–16 kHz
(+) | zrównoważone maksima - tylko 3.4% od mediany
(±) | liniowość wysokich wartości jest średnia (7.3% delta do poprzedniej częstotliwości)
Ogólnie 100 - 16.000 Hz
(+) | ogólny dźwięk jest liniowy (11.1% różnicy w stosunku do mediany)
W porównaniu do tej samej klasy
» 10% wszystkich testowanych urządzeń w tej klasie było lepszych, 3% podobnych, 87% gorszych
» Najlepszy miał deltę 7%, średnia wynosiła ###średnia###%, najgorsza wynosiła 35%
W porównaniu do wszystkich testowanych urządzeń
» 6% wszystkich testowanych urządzeń było lepszych, 2% podobnych, 93% gorszych
» Najlepszy miał deltę 4%, średnia wynosiła ###średnia###%, najgorsza wynosiła 134%
Apple MacBook Pro 16 2021 M1 Pro analiza dźwięku
(+) | głośniki mogą odtwarzać stosunkowo głośno (84.7 dB)
Bas 100 - 315 Hz
(+) | dobry bas - tylko 3.8% od mediany
(+) | bas jest liniowy (5.2% delta do poprzedniej częstotliwości)
Średnie 400 - 2000 Hz
(+) | zbalansowane środki średnie - tylko 1.3% od mediany
(+) | średnie są liniowe (2.1% delta do poprzedniej częstotliwości)
Wysokie 2–16 kHz
(+) | zrównoważone maksima - tylko 1.9% od mediany
(+) | wzloty są liniowe (2.7% delta do poprzedniej częstotliwości)
Ogólnie 100 - 16.000 Hz
(+) | ogólny dźwięk jest liniowy (4.6% różnicy w stosunku do mediany)
W porównaniu do tej samej klasy
» 0% wszystkich testowanych urządzeń w tej klasie było lepszych, 0% podobnych, 100% gorszych
» Najlepszy miał deltę 5%, średnia wynosiła ###średnia###%, najgorsza wynosiła 45%
W porównaniu do wszystkich testowanych urządzeń
» 0% wszystkich testowanych urządzeń było lepszych, 0% podobnych, 100% gorszych
» Najlepszy miał deltę 4%, średnia wynosiła ###średnia###%, najgorsza wynosiła 134%
Zarządzanie energią
Zużycie energii
Praca na biegu jałowym na pulpicie może wymagać od 8 W przy minimalnym ustawieniu jasności do 29 W przy maksymalnym ustawieniu jasności z całkowicie białym tłem. Zakres ten jest szerszy niż w większości laptopów IPS ze względu na sposób działania OLED. Zadania takie jak przeglądanie stron internetowych, przetwarzanie tekstu lub wprowadzanie danych w arkuszu kalkulacyjnym mogą wyczerpać baterię szybciej niż można by się spodziewać, ponieważ okna te są w większości białe. Obniżenie jasności lub wybranie ciemniejszych kolorów może pomóc wydłużyć czas pracy na baterii bardziej niż w przypadku alternatywy IPS.
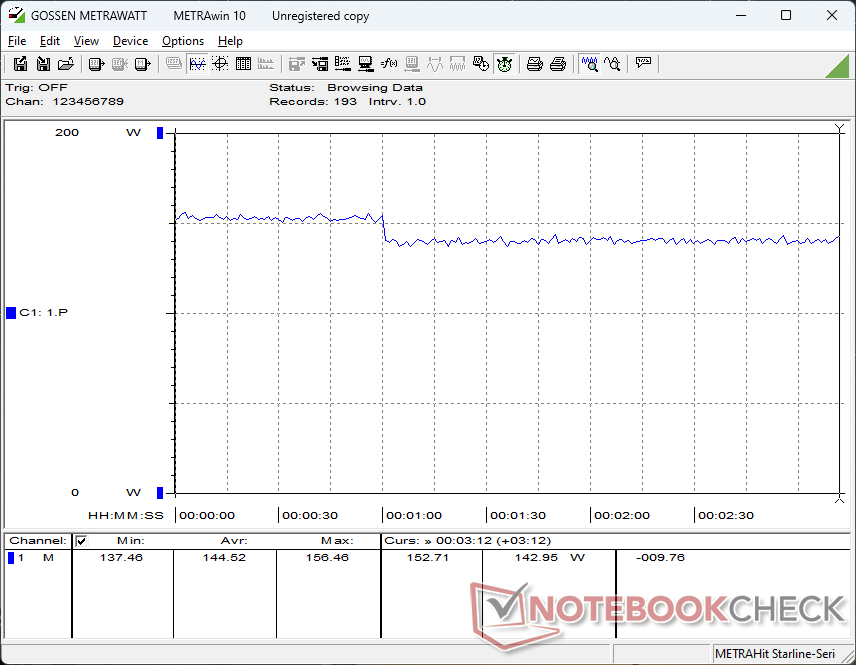
Zużycie energii przy wyższych obciążeniach, takich jak Witcher 3 byłoby prawie takie samo jak to, co zarejestrowaliśmy na starszym Precision 5680. Potwierdza to nasze powyższe dane benchmarkowe, które również pokazują jedynie marginalne różnice w wydajności między tymi dwoma modelami.
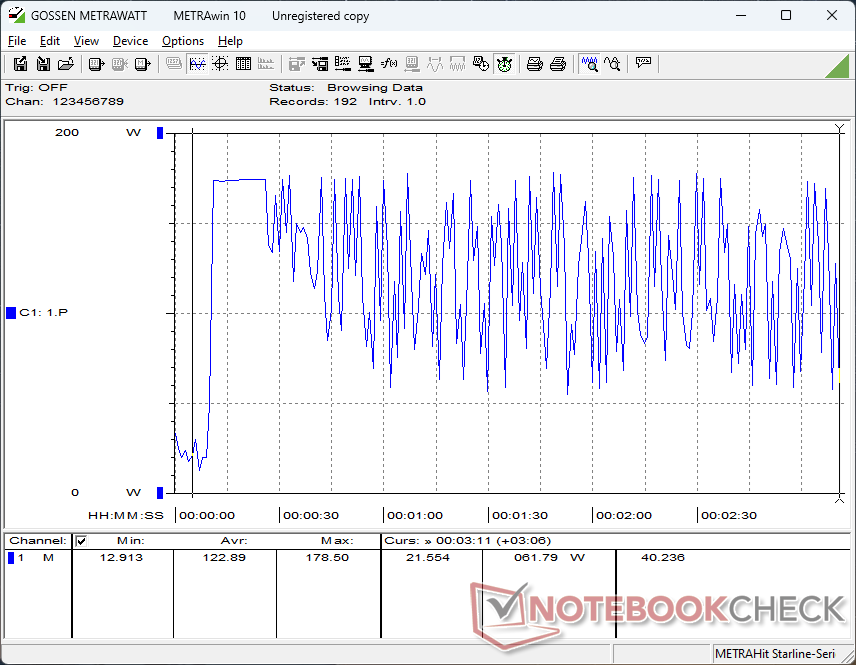
Co dziwne, zużycie energii ulegało dzikim wahaniom podczas obciążania Prime95, nawet po wielu ponownych testach. Poza tym, wydajność wydaje się być stabilna.
| wyłączony / stan wstrzymania | |
| luz | |
| obciążenie |
|
Legenda:
min: | |
| Dell Precision 5690 Ultra 9 185H, NVIDIA RTX 5000 Ada Generation Laptop GPU, 2x Samsung PM9A1 1TB (RAID 0), OLED, 3840x2400, 16" | Dell Precision 5000 5680 i9-13900H, NVIDIA RTX 5000 Ada Generation Laptop GPU, 2x SK hynix PC801 HFS512GEJ9X101N RAID 0, OLED, 3840x2400, 16" | Lenovo ThinkPad P16 G2 21FA000FGE i7-13700HX, NVIDIA RTX 2000 Ada Generation Laptop GPU, SK hynix PC801 HFS001TEJ9X162N, IPS LED, 2560x1600, 16" | Lenovo ThinkPad P1 G6-21FV000DGE i9-13900H, NVIDIA RTX 2000 Ada Generation Laptop GPU, SK Hynix PC711 1TB HFS001TDE9X084N, IPS, 2560x1600, 16" | HP ZBook Fury 16 G10 i9-13950HX, NVIDIA RTX 5000 Ada Generation Laptop GPU, SK hynix PC801 HFS001TEJ9X101N, IPS, 3840x2400, 16" | MSI CreatorPro Z16P B12UKST i7-12700H, RTX A3000 Laptop GPU, Samsung PM9A1 MZVL21T0HCLR, IPS, 2560x1600, 16" | |
|---|---|---|---|---|---|---|
| Power Consumption | 6% | -5% | 10% | -39% | -9% | |
| Idle Minimum * | 7.9 | 8 -1% | 9.3 -18% | 8.3 -5% | 15.3 -94% | 10.8 -37% |
| Idle Average * | 12 | 10.4 13% | 14.1 -18% | 14.5 -21% | 18.2 -52% | 16.3 -36% |
| Idle Maximum * | 28.6 | 30.5 -7% | 15.5 46% | 15.3 47% | 28 2% | 16.9 41% |
| Load Average * | 98.8 | 75.4 24% | 133.6 -35% | 91.8 7% | 137.9 -40% | 111.7 -13% |
| Witcher 3 ultra * | 144.5 | 134 7% | 144.9 -0% | 104.7 28% | 189.4 -31% | 152.1 -5% |
| Load Maximum * | 174.8 | 175 -0% | 179.6 -3% | 164.5 6% | 202 -16% | 177.4 -1% |
* ... im mniej tym lepiej
Power Consumption Witcher 3 / Stresstest
Power Consumption external Monitor
Żywotność baterii
Czasy pracy są mniej więcej takie same jak poprzednio, jeśli nie nieco krótsze. Nasz test WLAN trwał nieco ponad 9 godzin, podczas gdy Precision 5680 byłby bliżej 10 godzin w podobnych warunkach.
| Dell Precision 5690 Ultra 9 185H, NVIDIA RTX 5000 Ada Generation Laptop GPU, 98 Wh | Dell Precision 5000 5680 i9-13900H, NVIDIA RTX 5000 Ada Generation Laptop GPU, 98 Wh | Lenovo ThinkPad P16 G2 21FA000FGE i7-13700HX, NVIDIA RTX 2000 Ada Generation Laptop GPU, 94 Wh | Lenovo ThinkPad P1 G6-21FV000DGE i9-13900H, NVIDIA RTX 2000 Ada Generation Laptop GPU, 90 Wh | HP ZBook Fury 16 G10 i9-13950HX, NVIDIA RTX 5000 Ada Generation Laptop GPU, 95 Wh | MSI CreatorPro Z16P B12UKST i7-12700H, RTX A3000 Laptop GPU, 90 Wh | |
|---|---|---|---|---|---|---|
| Czasy pracy | 8% | -6% | 3% | -21% | -37% | |
| WiFi v1.3 | 549 | 592 8% | 515 -6% | 567 3% | 435 -21% | 348 -37% |
| Reader / Idle | 1072 | |||||
| Load | 101 | 67 | ||||
| H.264 | 674 |
Za
Przeciw
Werdykt - gotowi na rewolucję AI
Precision 5680 został wyposażony w nowy, elegancki design wywodzący się z XPS 16 wraz z procesorami vPro i wysokiej klasy grafiką Nvidia RTX Ada. Stał się on następnie jedną z najszybszych 16-calowych stacji roboczych dostępnych w stosunku do jego rozmiaru i wagi. Problem polega na tym, że Precision 5680 ma zaledwie pół roku i wciąż jest całkiem świeży. Nowszy Precision 5690 oferuje taką samą obudowę, GPU, wyświetlacz, poziom zużycia energii, czas pracy na baterii i wydajność procesora jak Precision 5680. Jeśli chcą Państwo zaoszczędzić trochę pieniędzy, to zeszłoroczny Precision 5680 może zaoferować zasadniczo takie same wrażenia użytkownika i wydajność za mniej.
)(()()
Główny czynnik odróżniający 2024 Precision 5690 od 2023 Precision 5680 sprowadza się do zintegrowanej jednostki NPU w procesorach z serii Meteor Lake-H. Nowszy model Della jest zatem "gotowy na AI", gdy system Windows zostanie zoptymalizowany pod kątem lokalnych zadań AI. Jeśli na przykład już korzystają Państwo z Co-Pilota lub spodziewają się uruchomić więcej aplikacji wykorzystujących sztuczną inteligencję w najbliższej przyszłości, to Precision 5690 powinien mieć znaczną przewagę dzięki akceleracji NPU. W przeciwnym razie większość "tradycyjnych" zadań nie będzie działać zauważalnie szybciej na najnowszym modelu.
Cena i dostępność
Dell dostarcza obecnie Precision 5690 w cenie od 2290 USD za procesor Core Ultra 5 135H, tylko zintegrowaną grafikę i wyświetlacz IPS 1200p do znacznie ponad 5000 USD w przypadku konfiguracji z Core Ultra 9 185H, RTX 5000 Ada i ekranem dotykowym OLED 2400p.
Dell Precision 5690
- 08/05/2024 v7 (old)
Allen Ngo
Przezroczystość
Wyboru urządzeń do recenzji dokonuje nasza redakcja. Próbka testowa została udostępniona autorowi jako pożyczka od producenta lub sprzedawcy detalicznego na potrzeby tej recenzji. Pożyczkodawca nie miał wpływu na tę recenzję, producent nie otrzymał też kopii tej recenzji przed publikacją. Nie było obowiązku publikowania tej recenzji. Nigdy nie przyjmujemy rekompensaty ani płatności w zamian za nasze recenzje. Jako niezależna firma medialna, Notebookcheck nie podlega władzy producentów, sprzedawców detalicznych ani wydawców.
Tak testuje Notebookcheck
Każdego roku Notebookcheck niezależnie sprawdza setki laptopów i smartfonów, stosując standardowe procedury, aby zapewnić porównywalność wszystkich wyników. Od około 20 lat stale rozwijamy nasze metody badawcze, ustanawiając przy tym standardy branżowe. W naszych laboratoriach testowych doświadczeni technicy i redaktorzy korzystają z wysokiej jakości sprzętu pomiarowego. Testy te obejmują wieloetapowy proces walidacji. Nasz kompleksowy system ocen opiera się na setkach uzasadnionych pomiarów i benchmarków, co pozwala zachować obiektywizm.Price comparison

