Recenzja Geekom AE7: NUC mini-PC z AMD Ryzen 9 7940HS, DDR5 RAM, nowoczesnymi interfejsami i jednym problemem
Jako rzekomy następca Geekom A5geekom AE7 otrzymał bardziej nowoczesny SoC. Podstawą jest procesor AMD Ryzen 7 7940HS który jest również wyposażony w bardzo wydajną AMD Radeon 780M iGPU. Tymczasem Geekom AE7 jest dostępny tylko w testowanej przez nas konfiguracji, co oznacza, że na pokładzie zawsze znajduje się 32 GB pamięci RAM DDR5 i dysk SSD o pojemności 1 TB. Za 740 euro Geekom AE7 nie jest tani i nie jest okazją. Teraz dowiemy się, czy cena jest uzasadniona jego wyjątkową wydajnością.
Mini-PC musi stawić czoła konkurencji ze strony własnej firmy. Inni konkurenci nie śpią, a Minisforum, Aoostar i Acemagic również mają w swojej ofercie potężne mini-PC, z których niektóre są nawet znacznie tańsze. Naszą listę konkurentów podsumowaliśmy w poniższej tabeli.
Potencjalni konkurenci w porównaniu
Ocena | Wersja | Data | Model | Waga | Wysokość | Cena |
|---|---|---|---|---|---|---|
| 78 % | v8 | 07/2024 | Geekom AE7 R9 7940HS, Radeon 780M | 578 g | 49.2 mm | |
| 80.8 % | v8 | 06/2024 | Aoostar GEM12 R7 8845HS, Radeon 780M | 653 g | 60 mm | |
| 72.1 % | v8 | 06/2024 | Geekom GT13 Pro i9-13900H, Iris Xe G7 96EUs | 440 g | 37 mm | |
| 87.5 % v7 (old) | v7 (old) | 05/2024 | Minisforum AtomMan X7 Ti Ultra 9 185H, Arc 8-Core | 863 g | 48.6 mm | |
| 84.9 % v7 (old) | v7 (old) | 05/2024 | Geekom A8, R9 8945HS R9 8945HS, Radeon 780M | 432 g | 38 mm | |
| 83.4 % v7 (old) | v7 (old) | 04/2024 | Acemagic F2A Ultra 7 155H, Arc 8-Core | 768 g | 57 mm | |
| 82.3 % v7 (old) | v7 (old) | 04/2024 | Acemagic AM18 R7 7840HS, Radeon 780M | 600 g | 58 mm | |
| 81.2 % v7 (old) | v7 (old) | 10/2023 | Geekom A5 R7 5800H, Vega 8 | 555 g | 49.2 mm |
Uwaga: Zaktualizowaliśmy nasz system oceniania i wyniki wersji 8 nie są porównywalne z wynikami wersji 7 tutaj.
Geekom AE7 w szczegółach
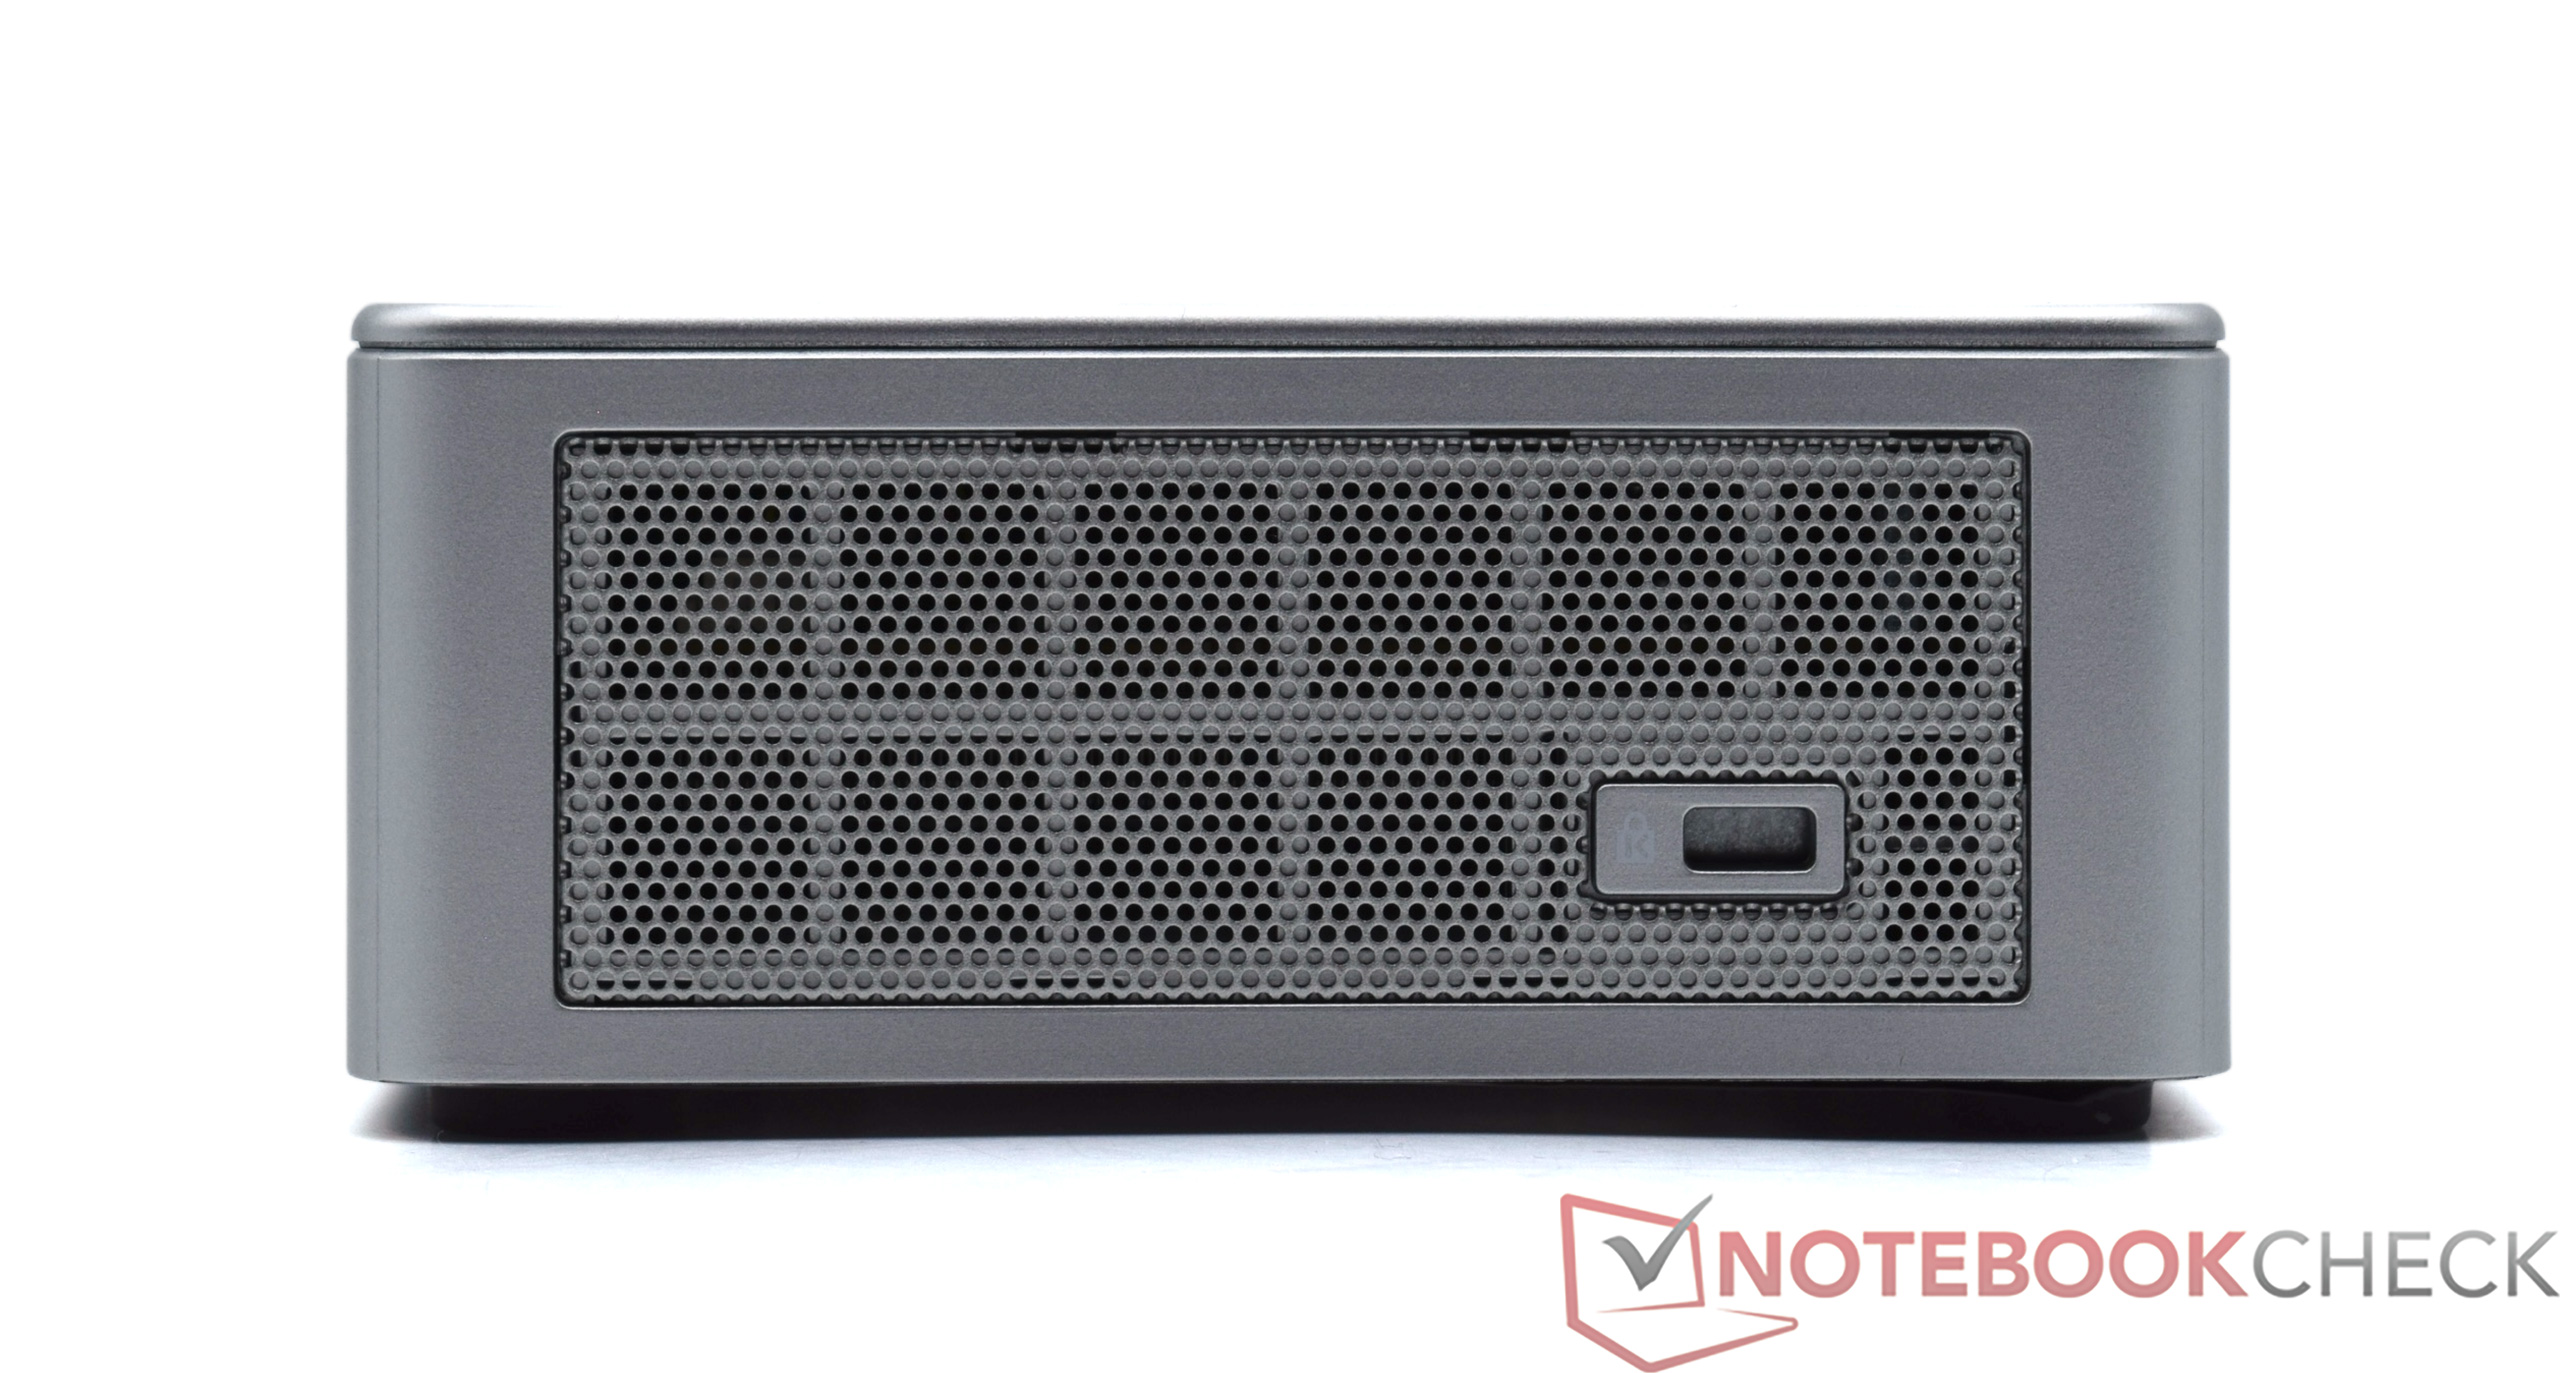
Sprawa - wszystko jak poprzednio
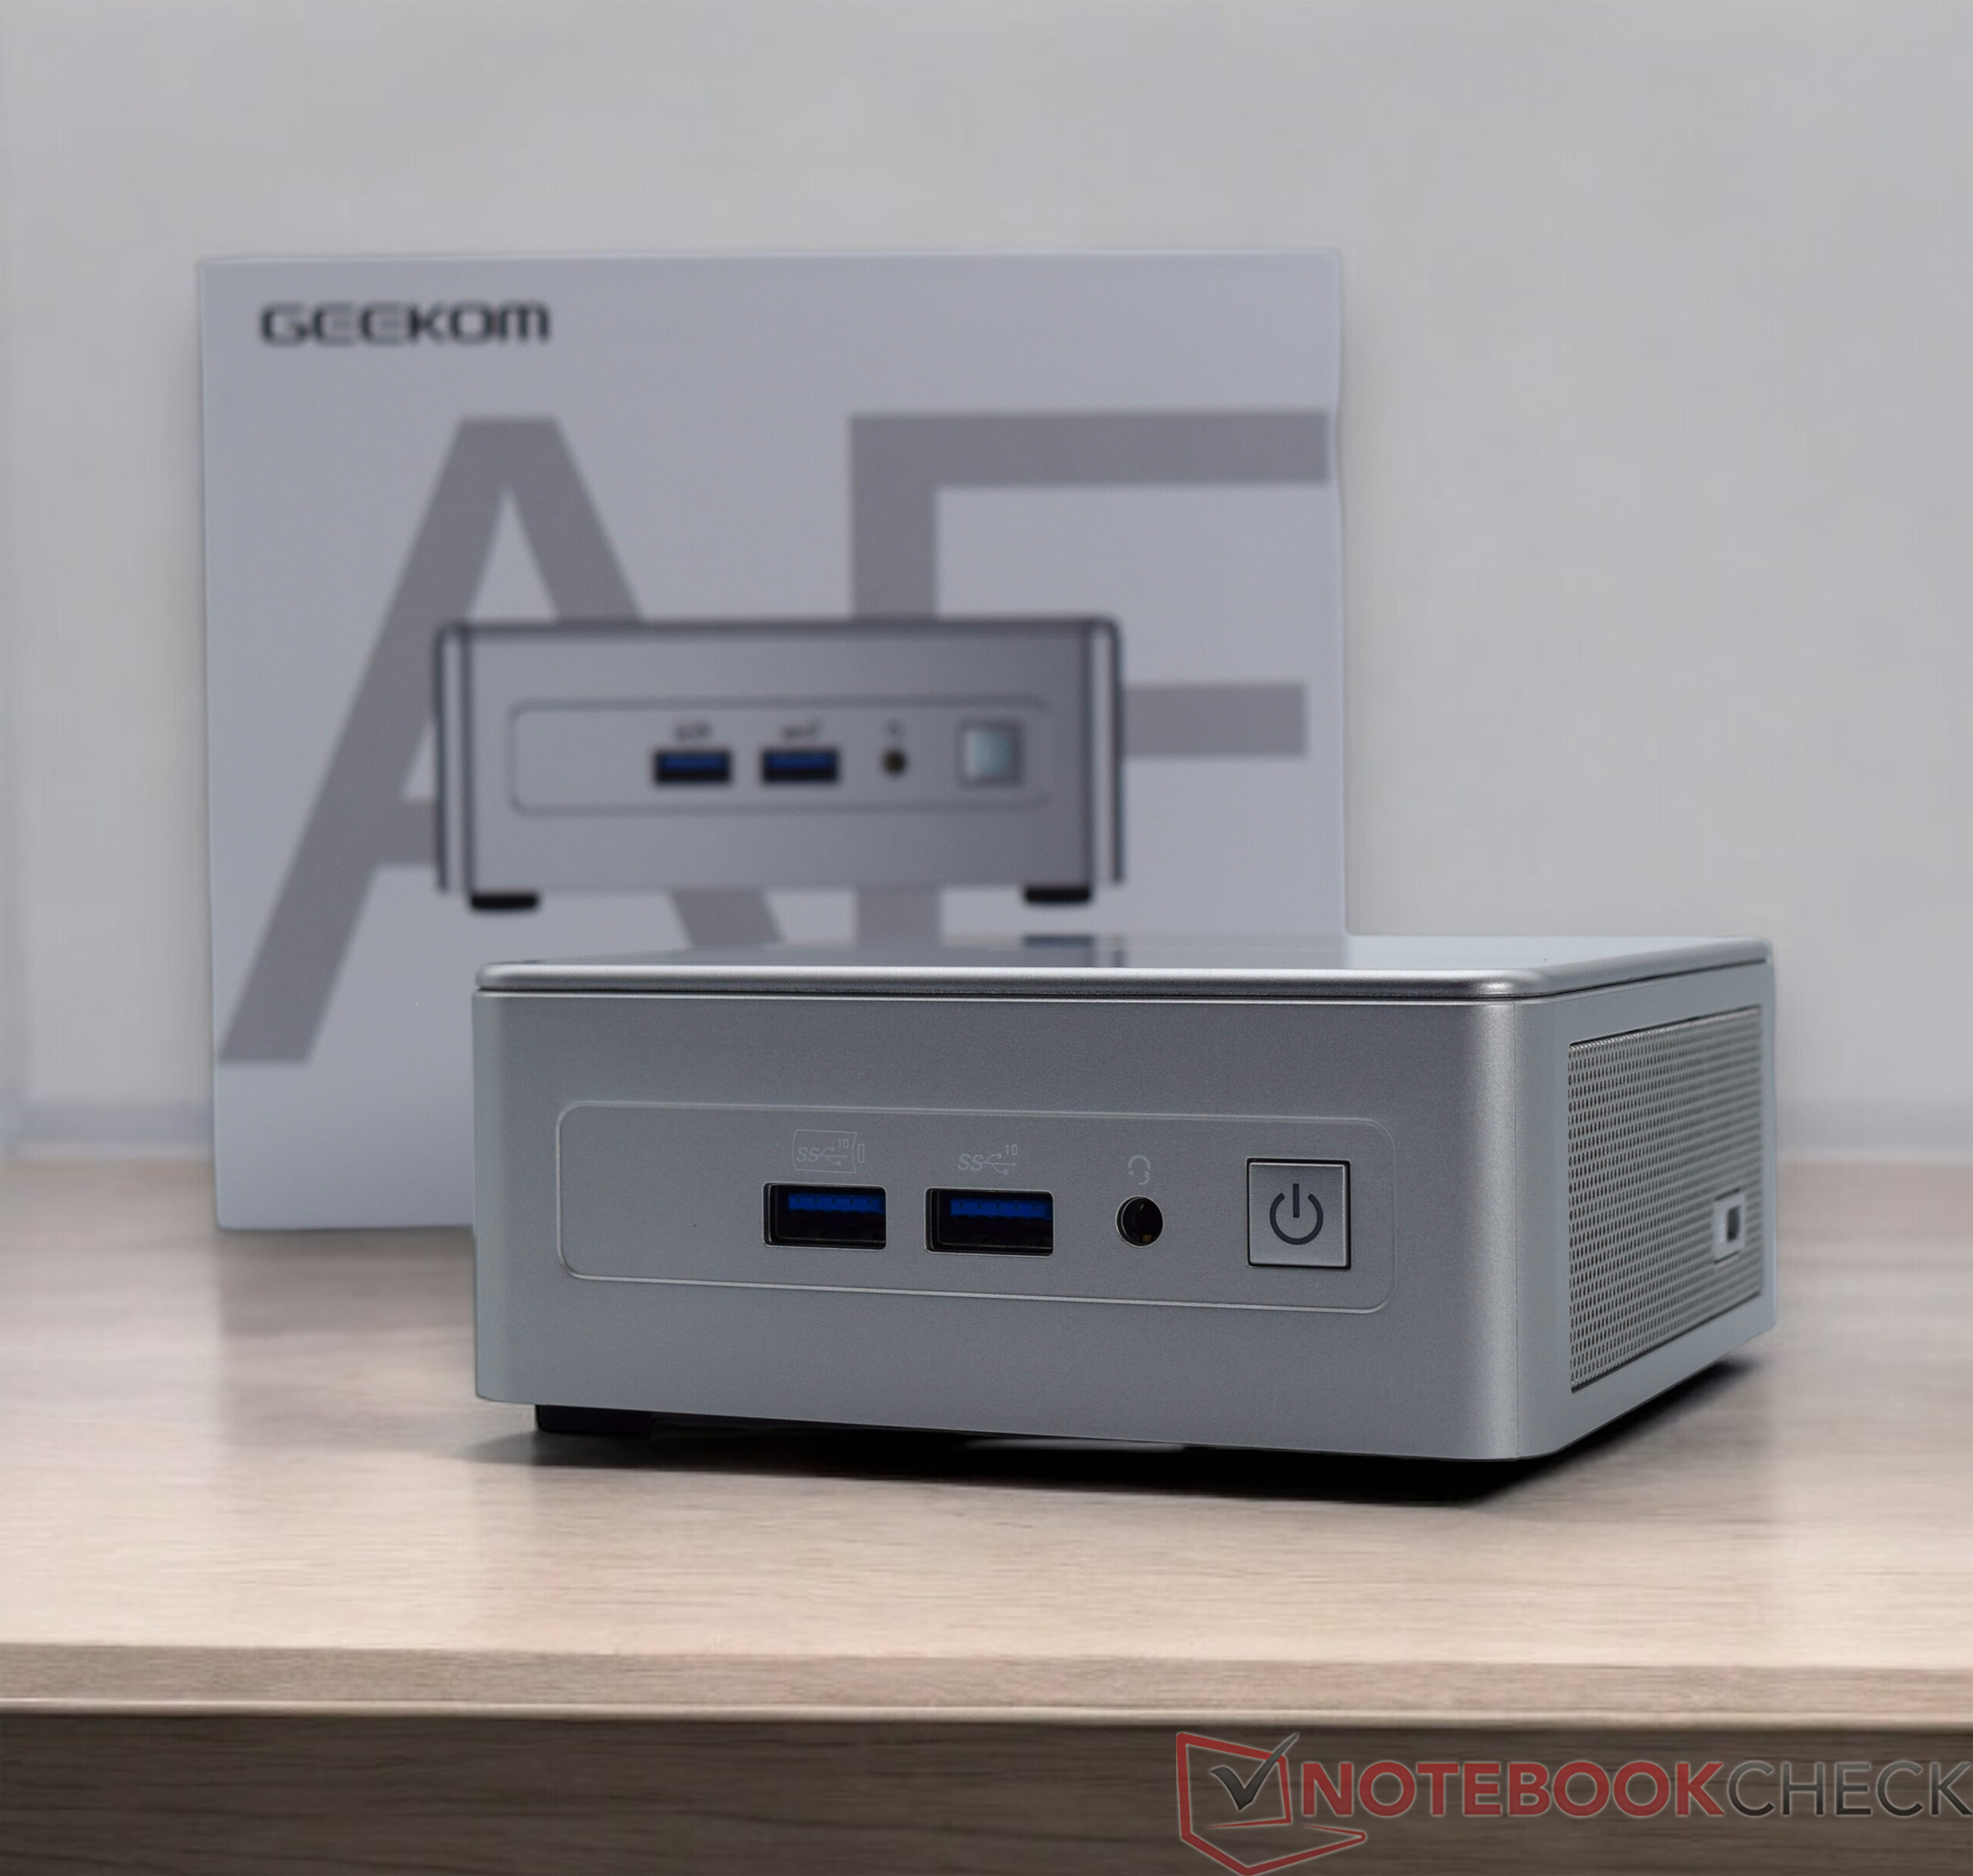
Po Geekom A8 a także Geekom GT13 Pro początkowo miały stylowe aluminiowe obudowy, Geekom cofnął się z AE7 i zdecydował się na starszą konstrukcję obudowy. Geekom IT11 i IT12 mają niemal identyczną konstrukcję jak modele Intel NUC. Geekom A5 był pierwszym, który miał APU AMD w takiej obudowie, który został teraz zastąpiony aktualizacją do AMD Ryzen 9 7940HS w Geekom AE7.
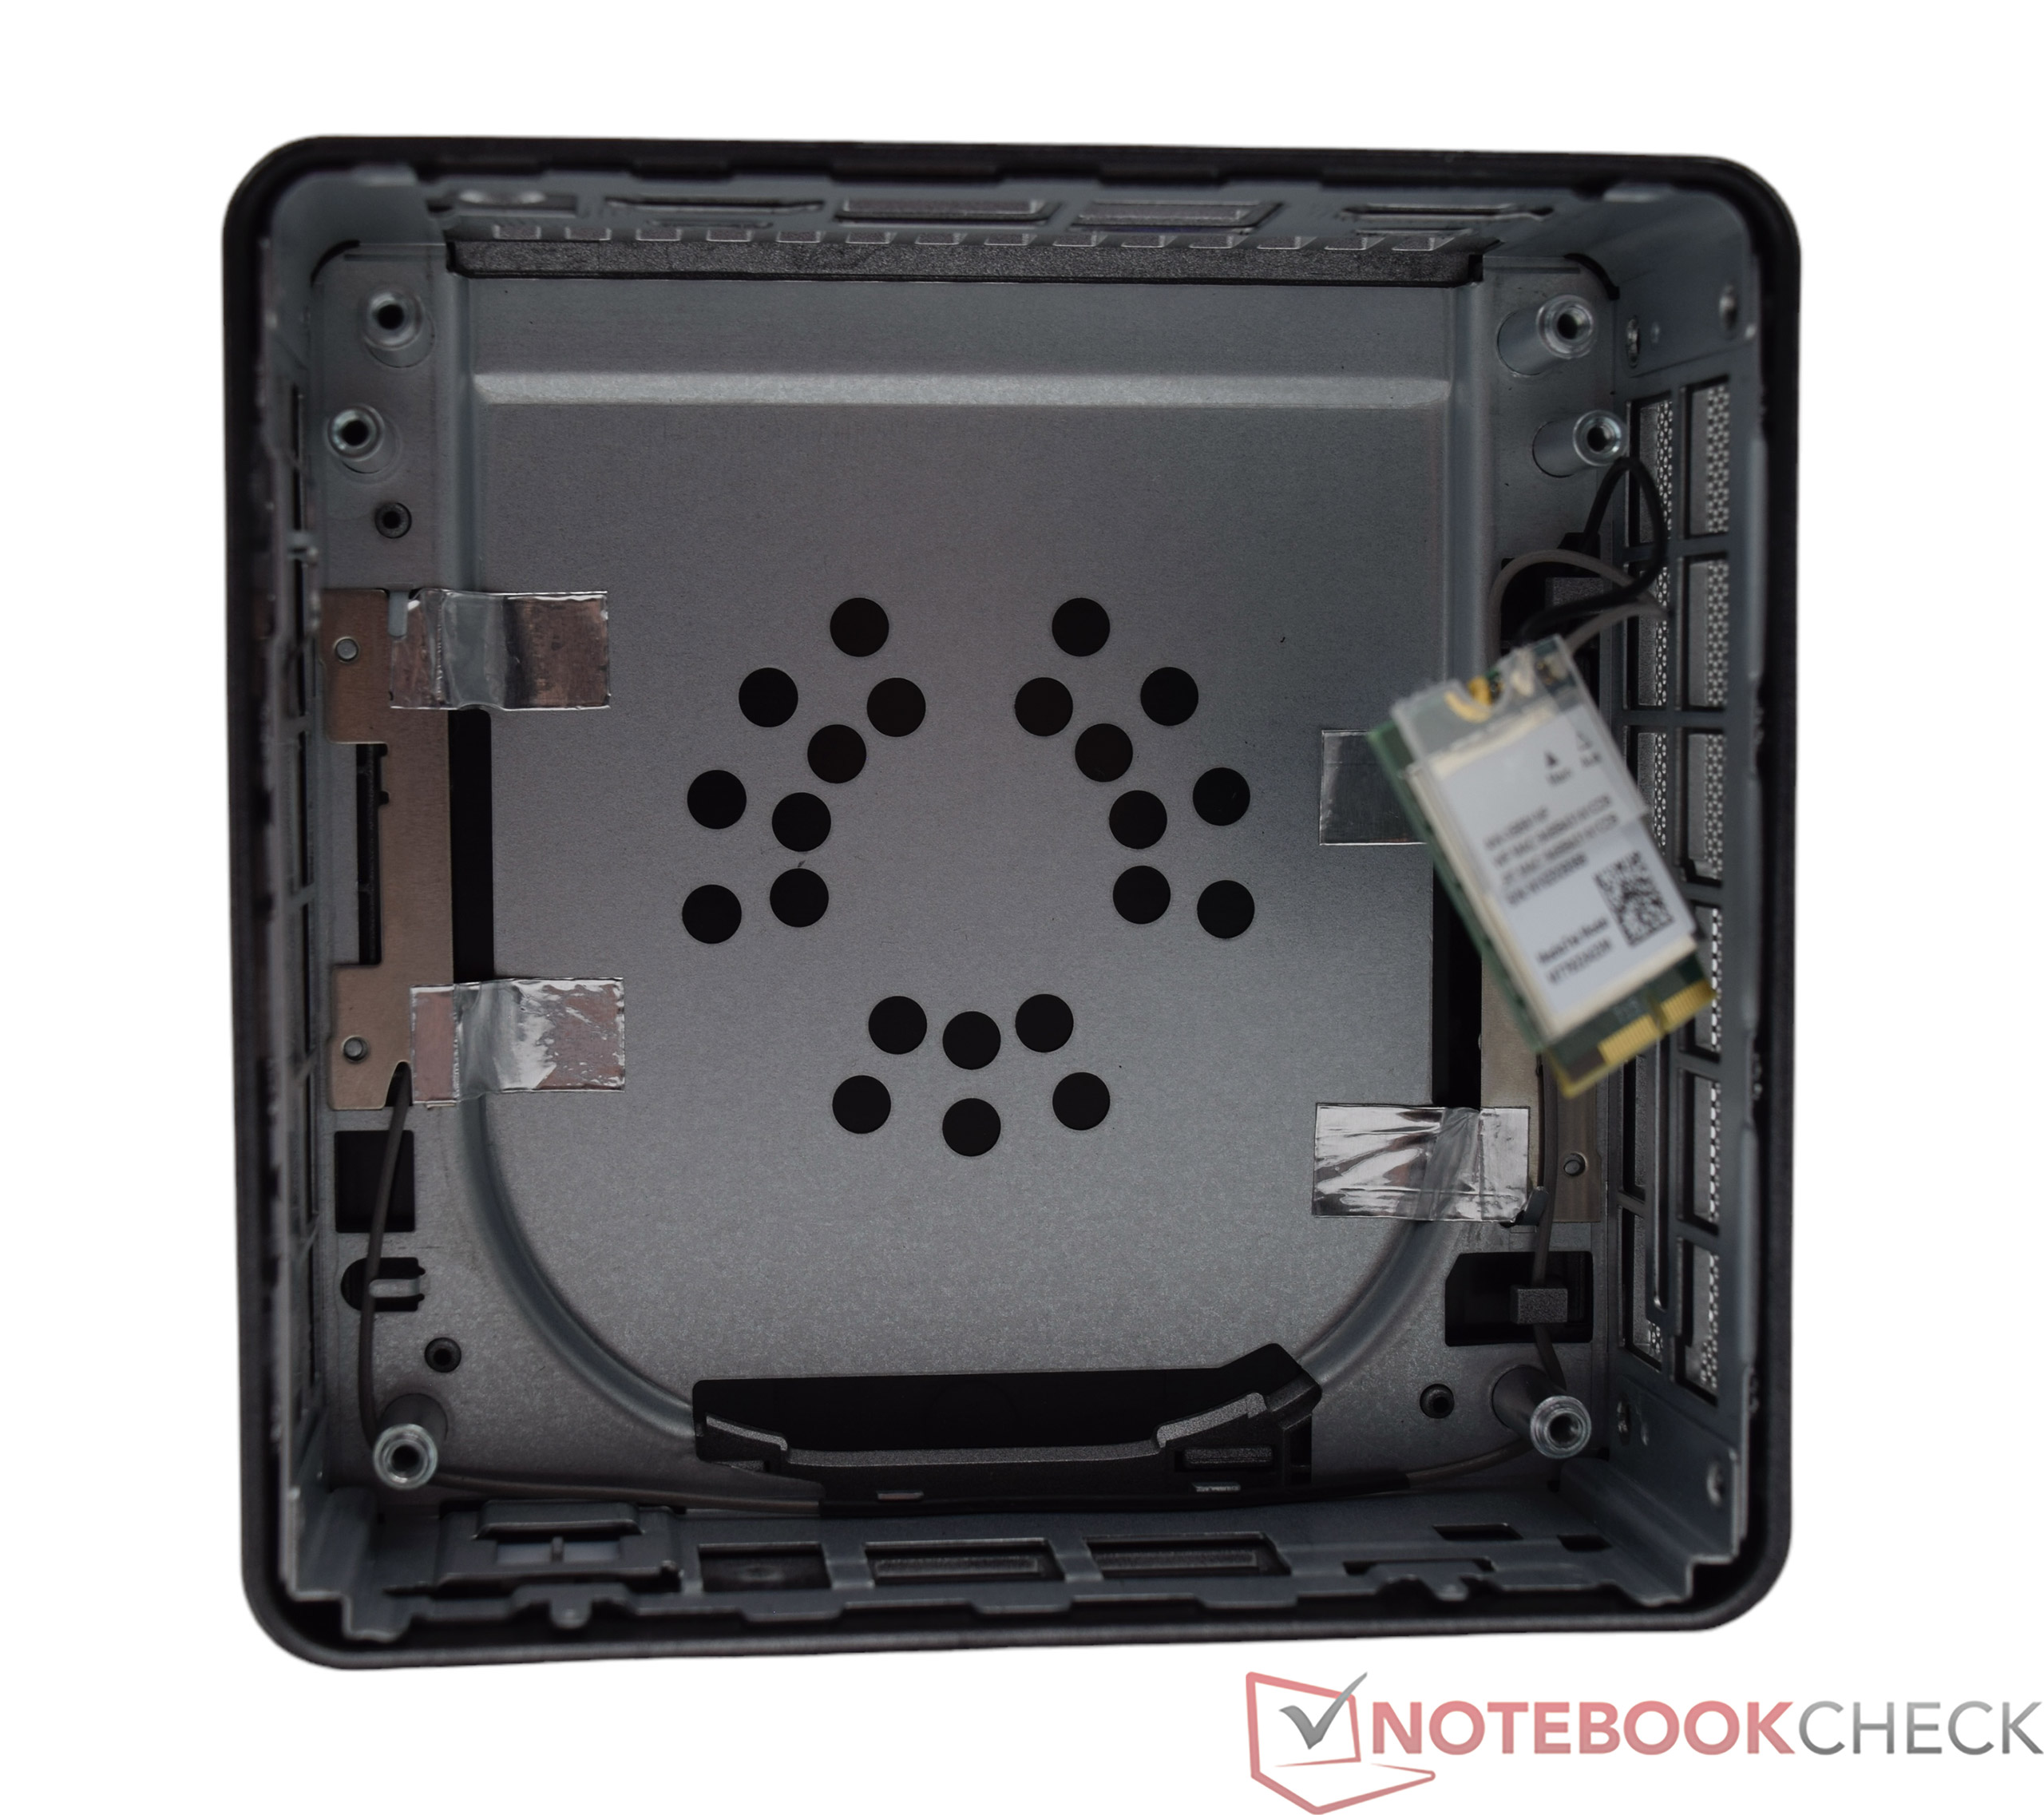
Jedyną istotną różnicą w stosunku do identycznego Geekom AE7 jest kolorystyka. Urządzenie jest pomalowane na srebrno. Ze względu na jednolity dobór materiałów, nie ma różnic kolorystycznych. Wewnątrz plastikowa obudowa jest nadal uzupełniona solidną metalową klatką. Jakość wykonania pozostaje na bardzo wysokim poziomie. Wszystkie elementy idealnie do siebie pasują, a matowe powierzchnie sprawiają, że odciski palców są ledwo widoczne. Jeśli chodzi o Geekom A8 lub Geekom GT13, Geekom pokazuje, że możliwe jest dostarczanie urządzeń wyższej jakości pod względem doboru materiałów. Całkowicie przeprojektowana obudowa nie tylko wniosłaby powiew świeżości do zakurzonego wyglądu, ale także zapewniłaby możliwość skuteczniejszego chłodzenia.
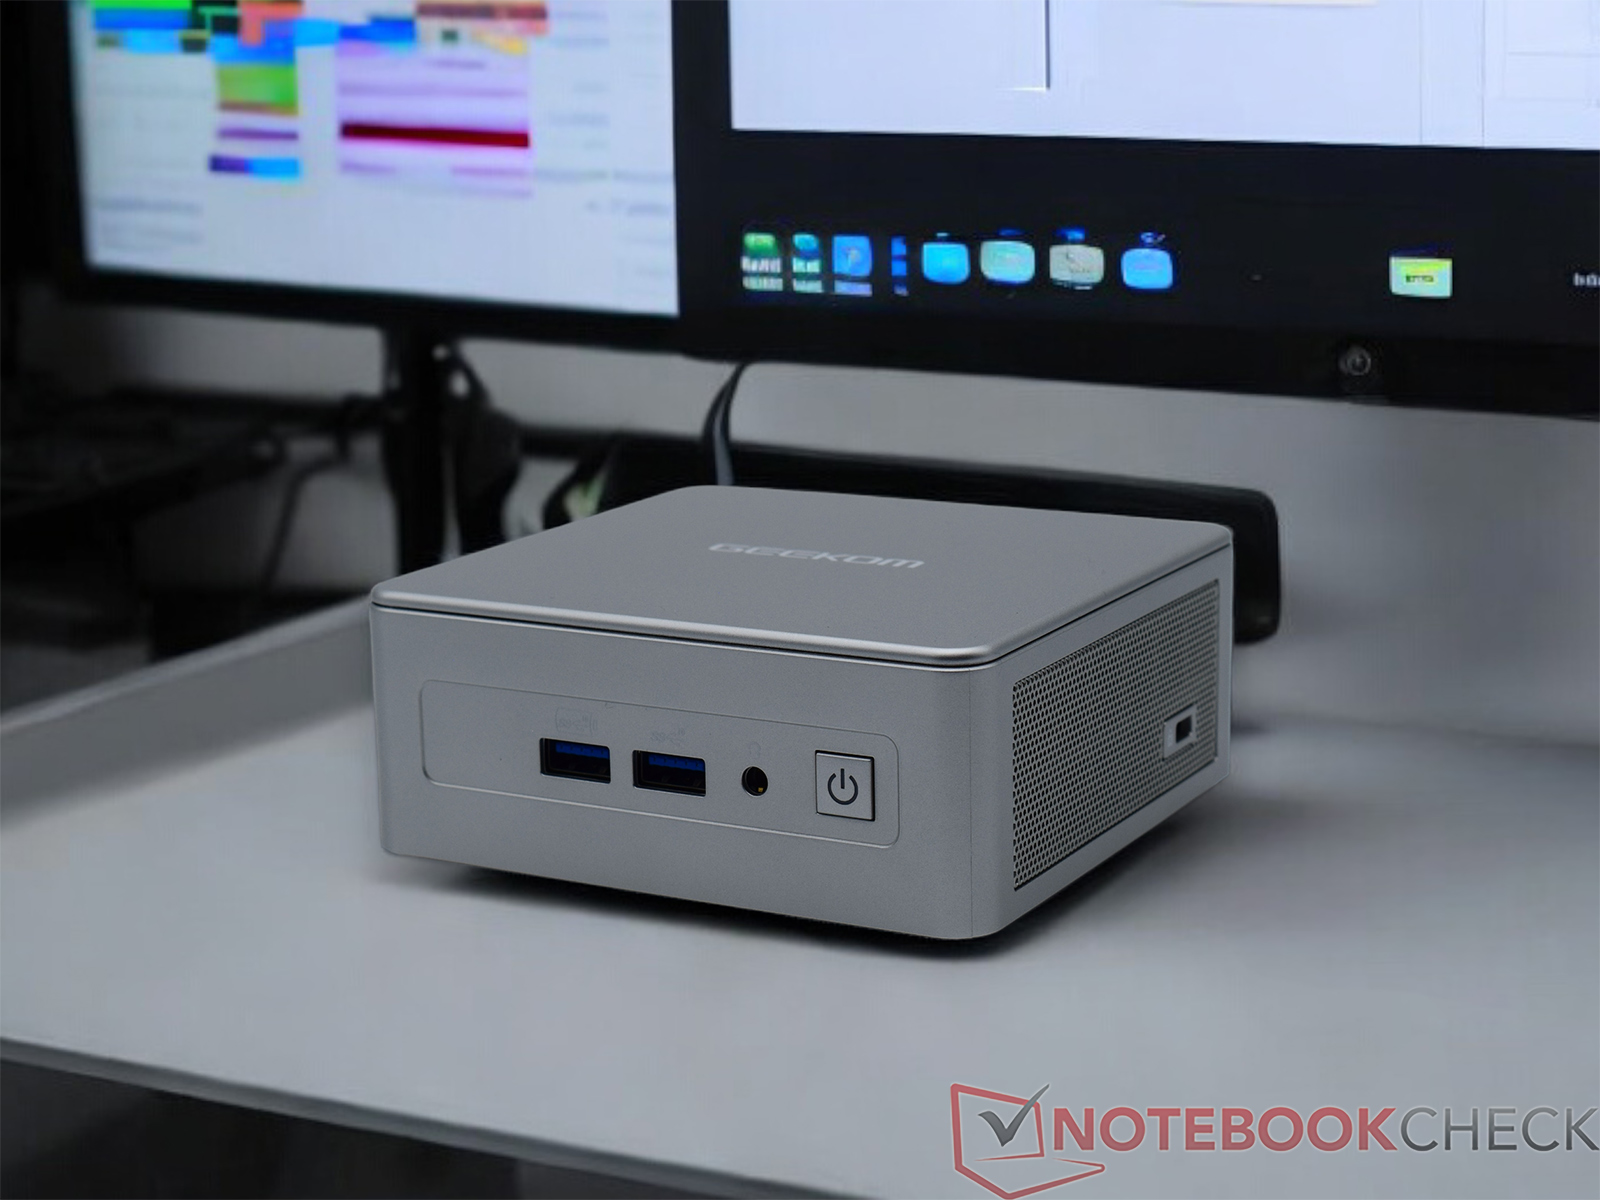
Nawiasem mówiąc, podobnie jak wiele innych mini-PC, Geekom AE7 można podłączyć bezpośrednio do monitora za pomocą dołączonego uchwytu VESA.
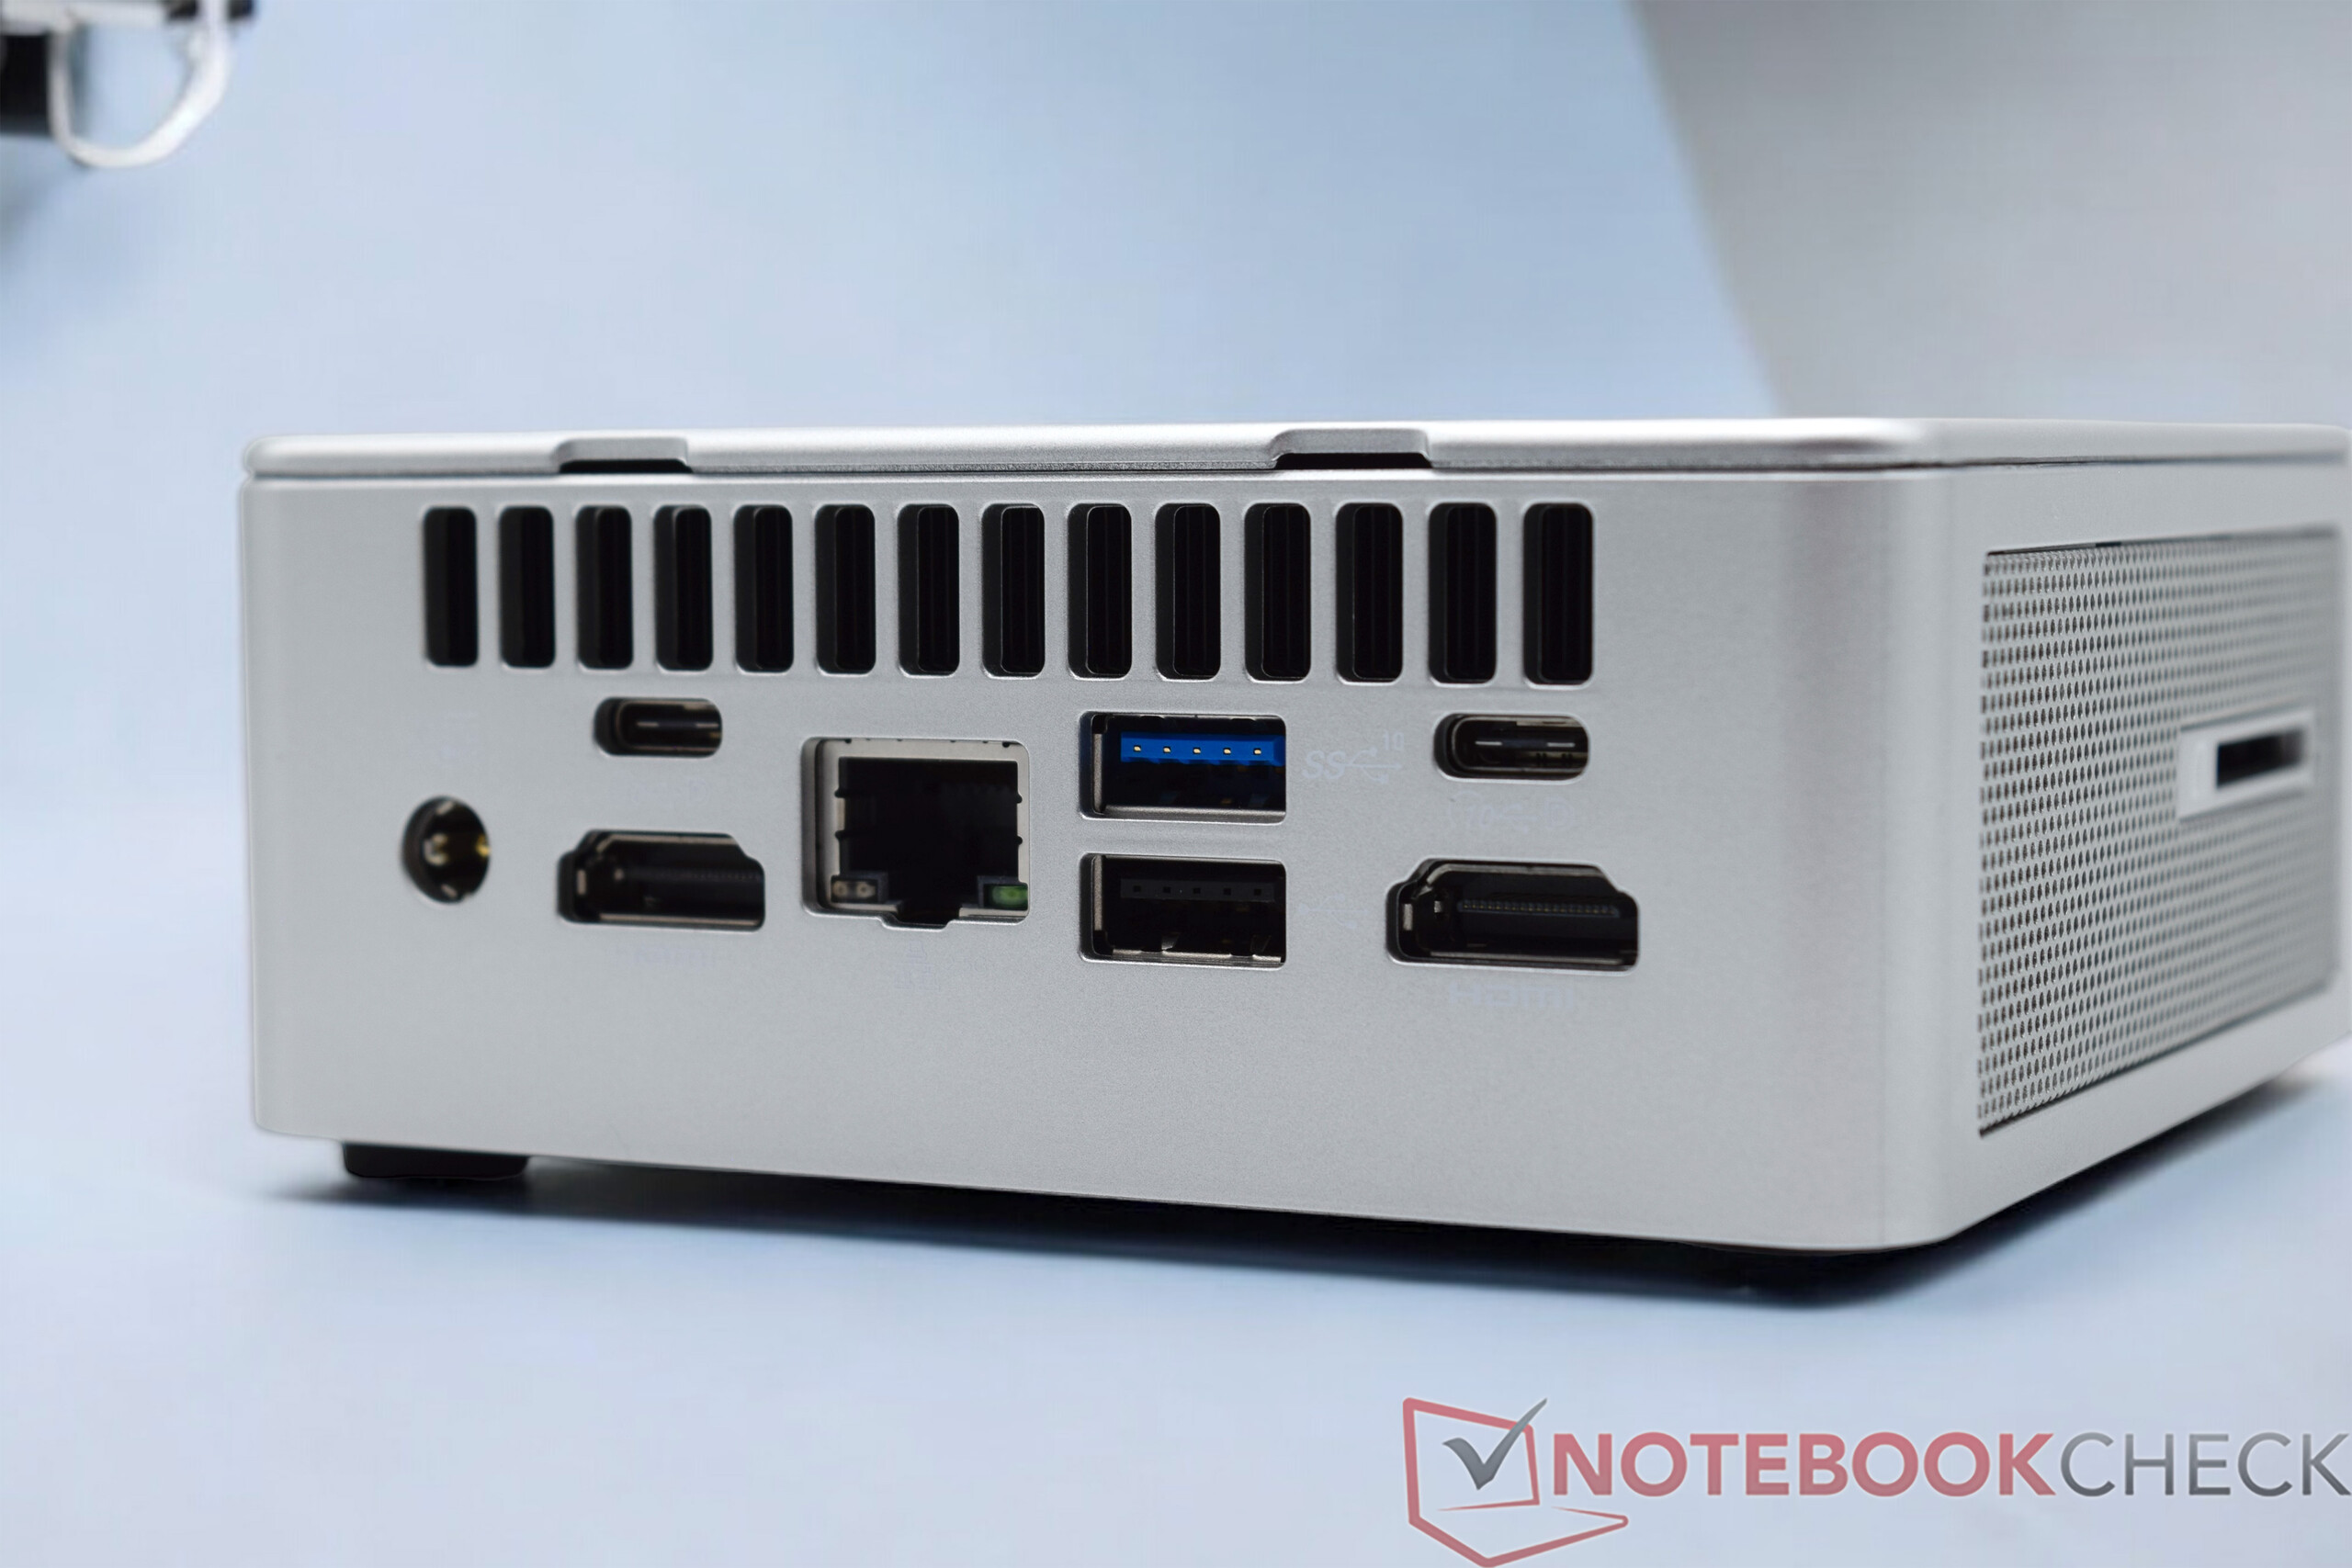
Sprzęt
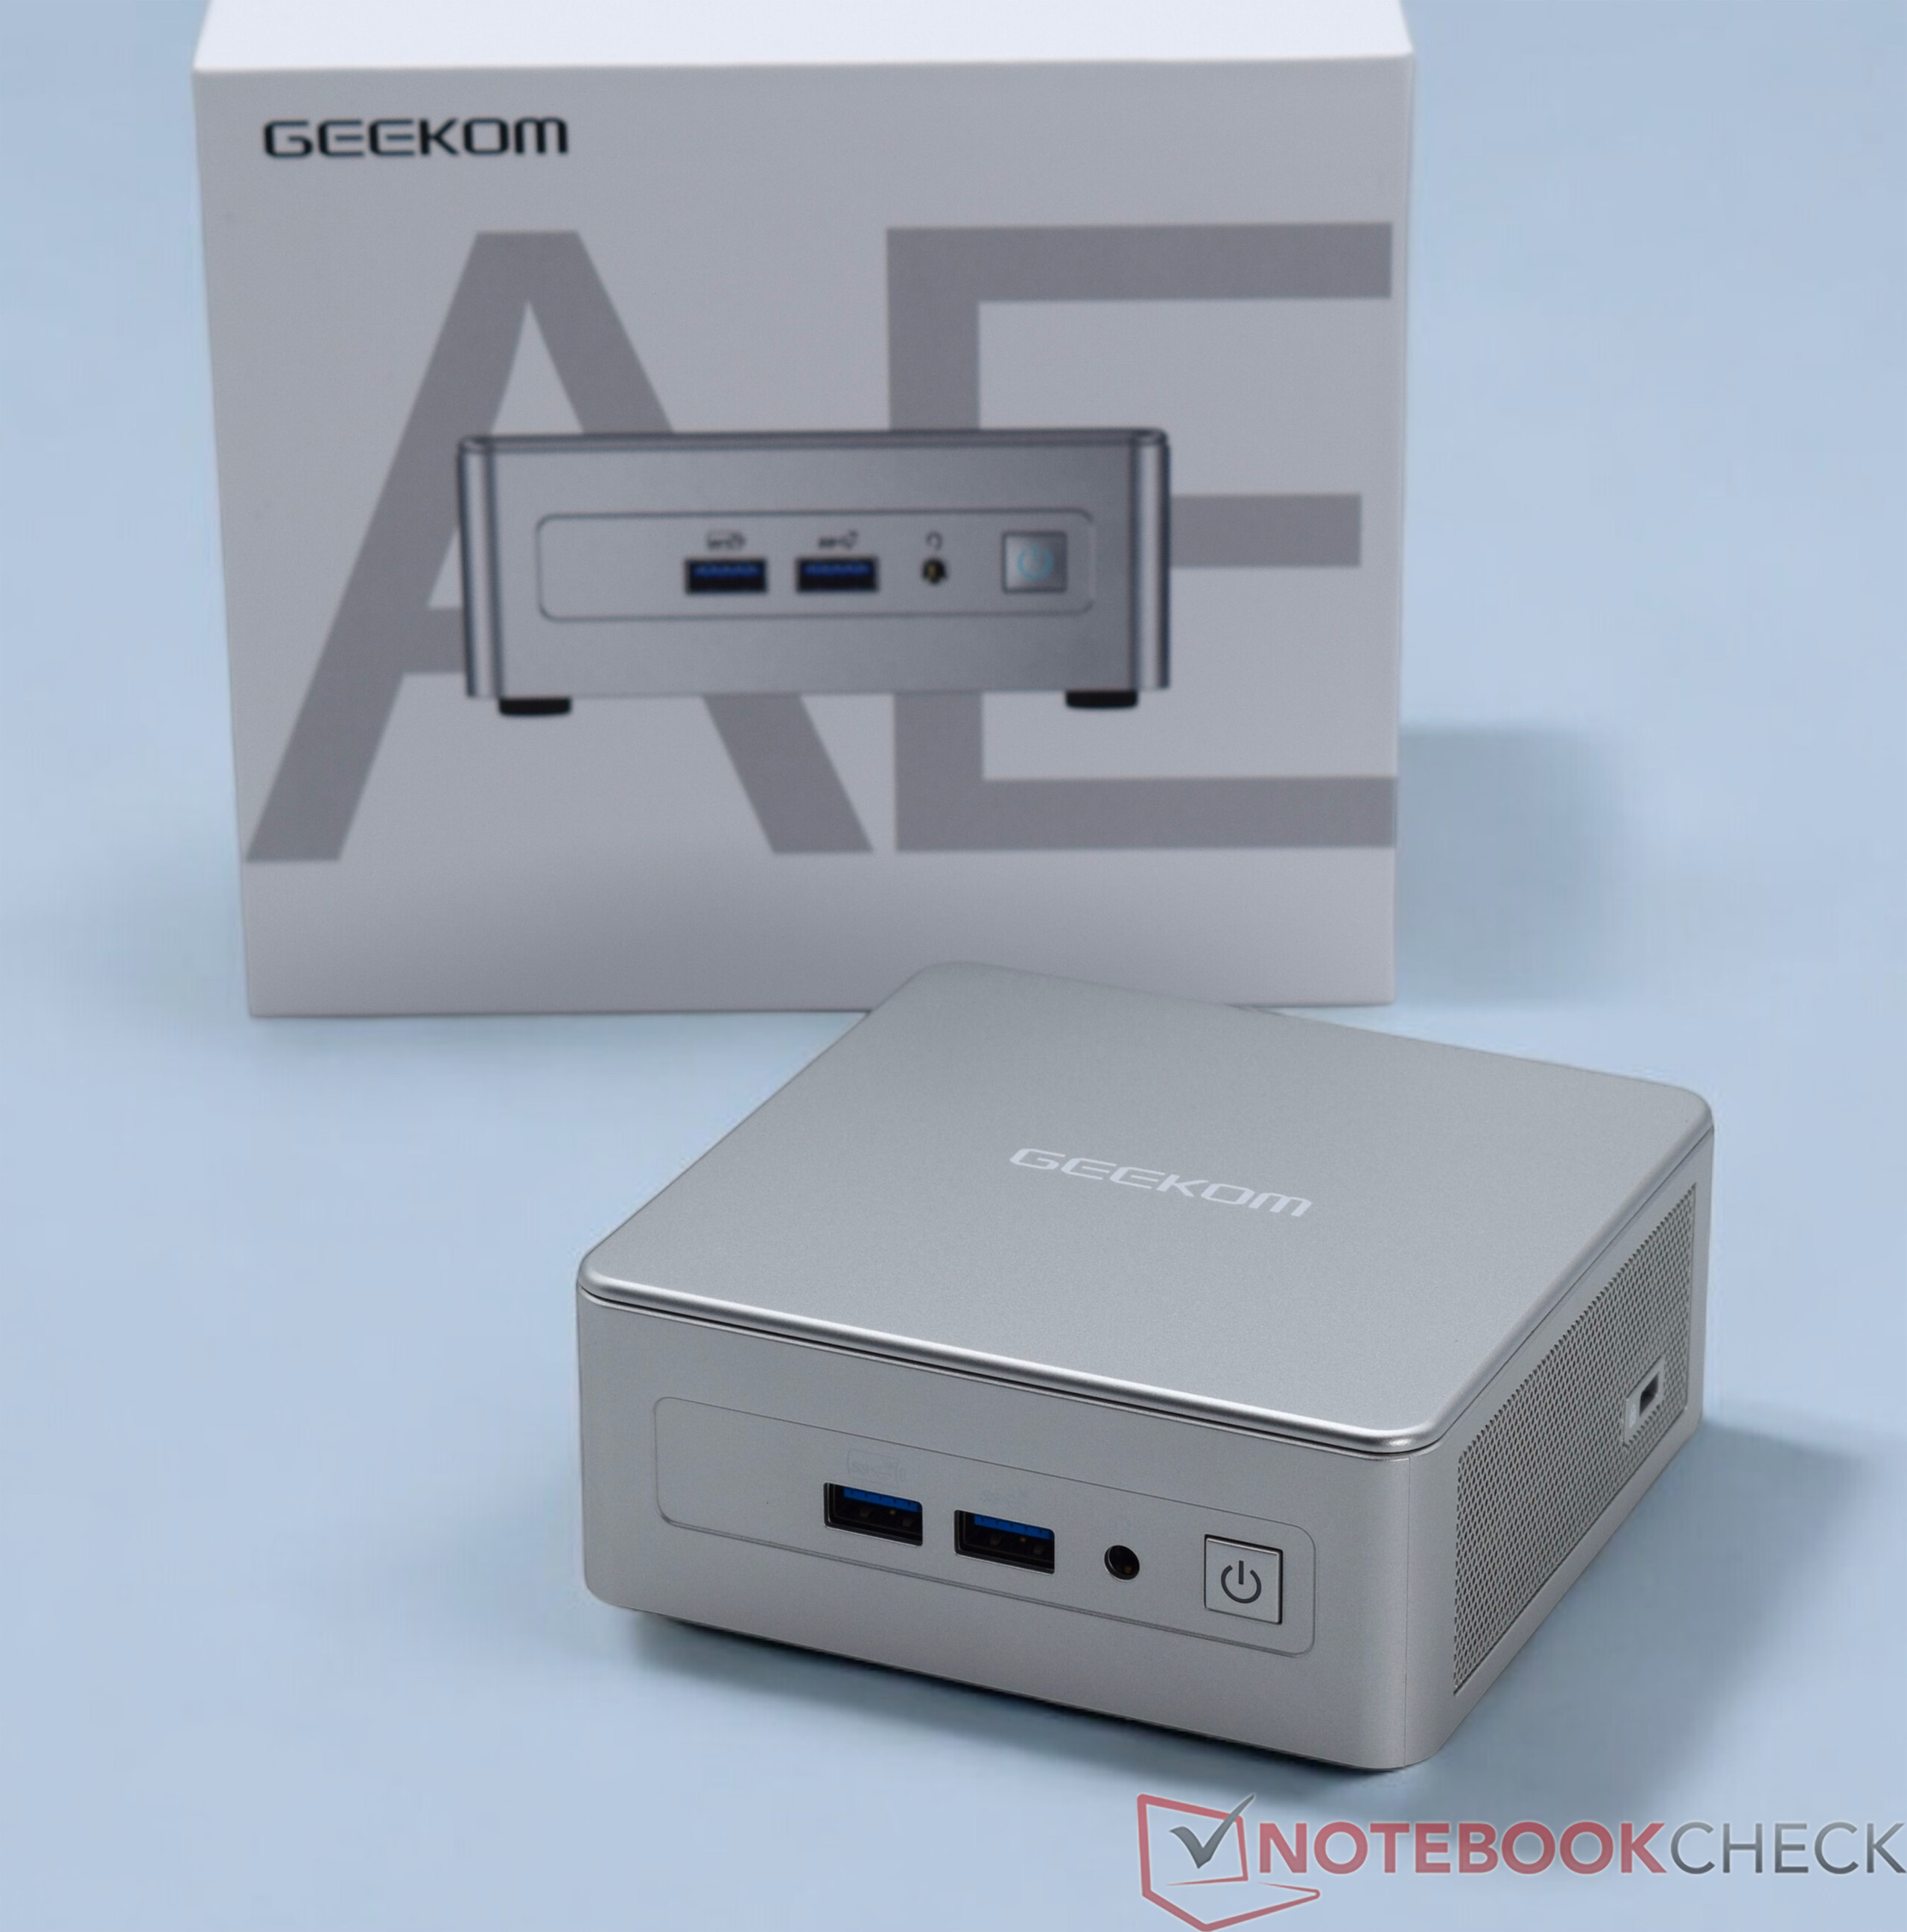
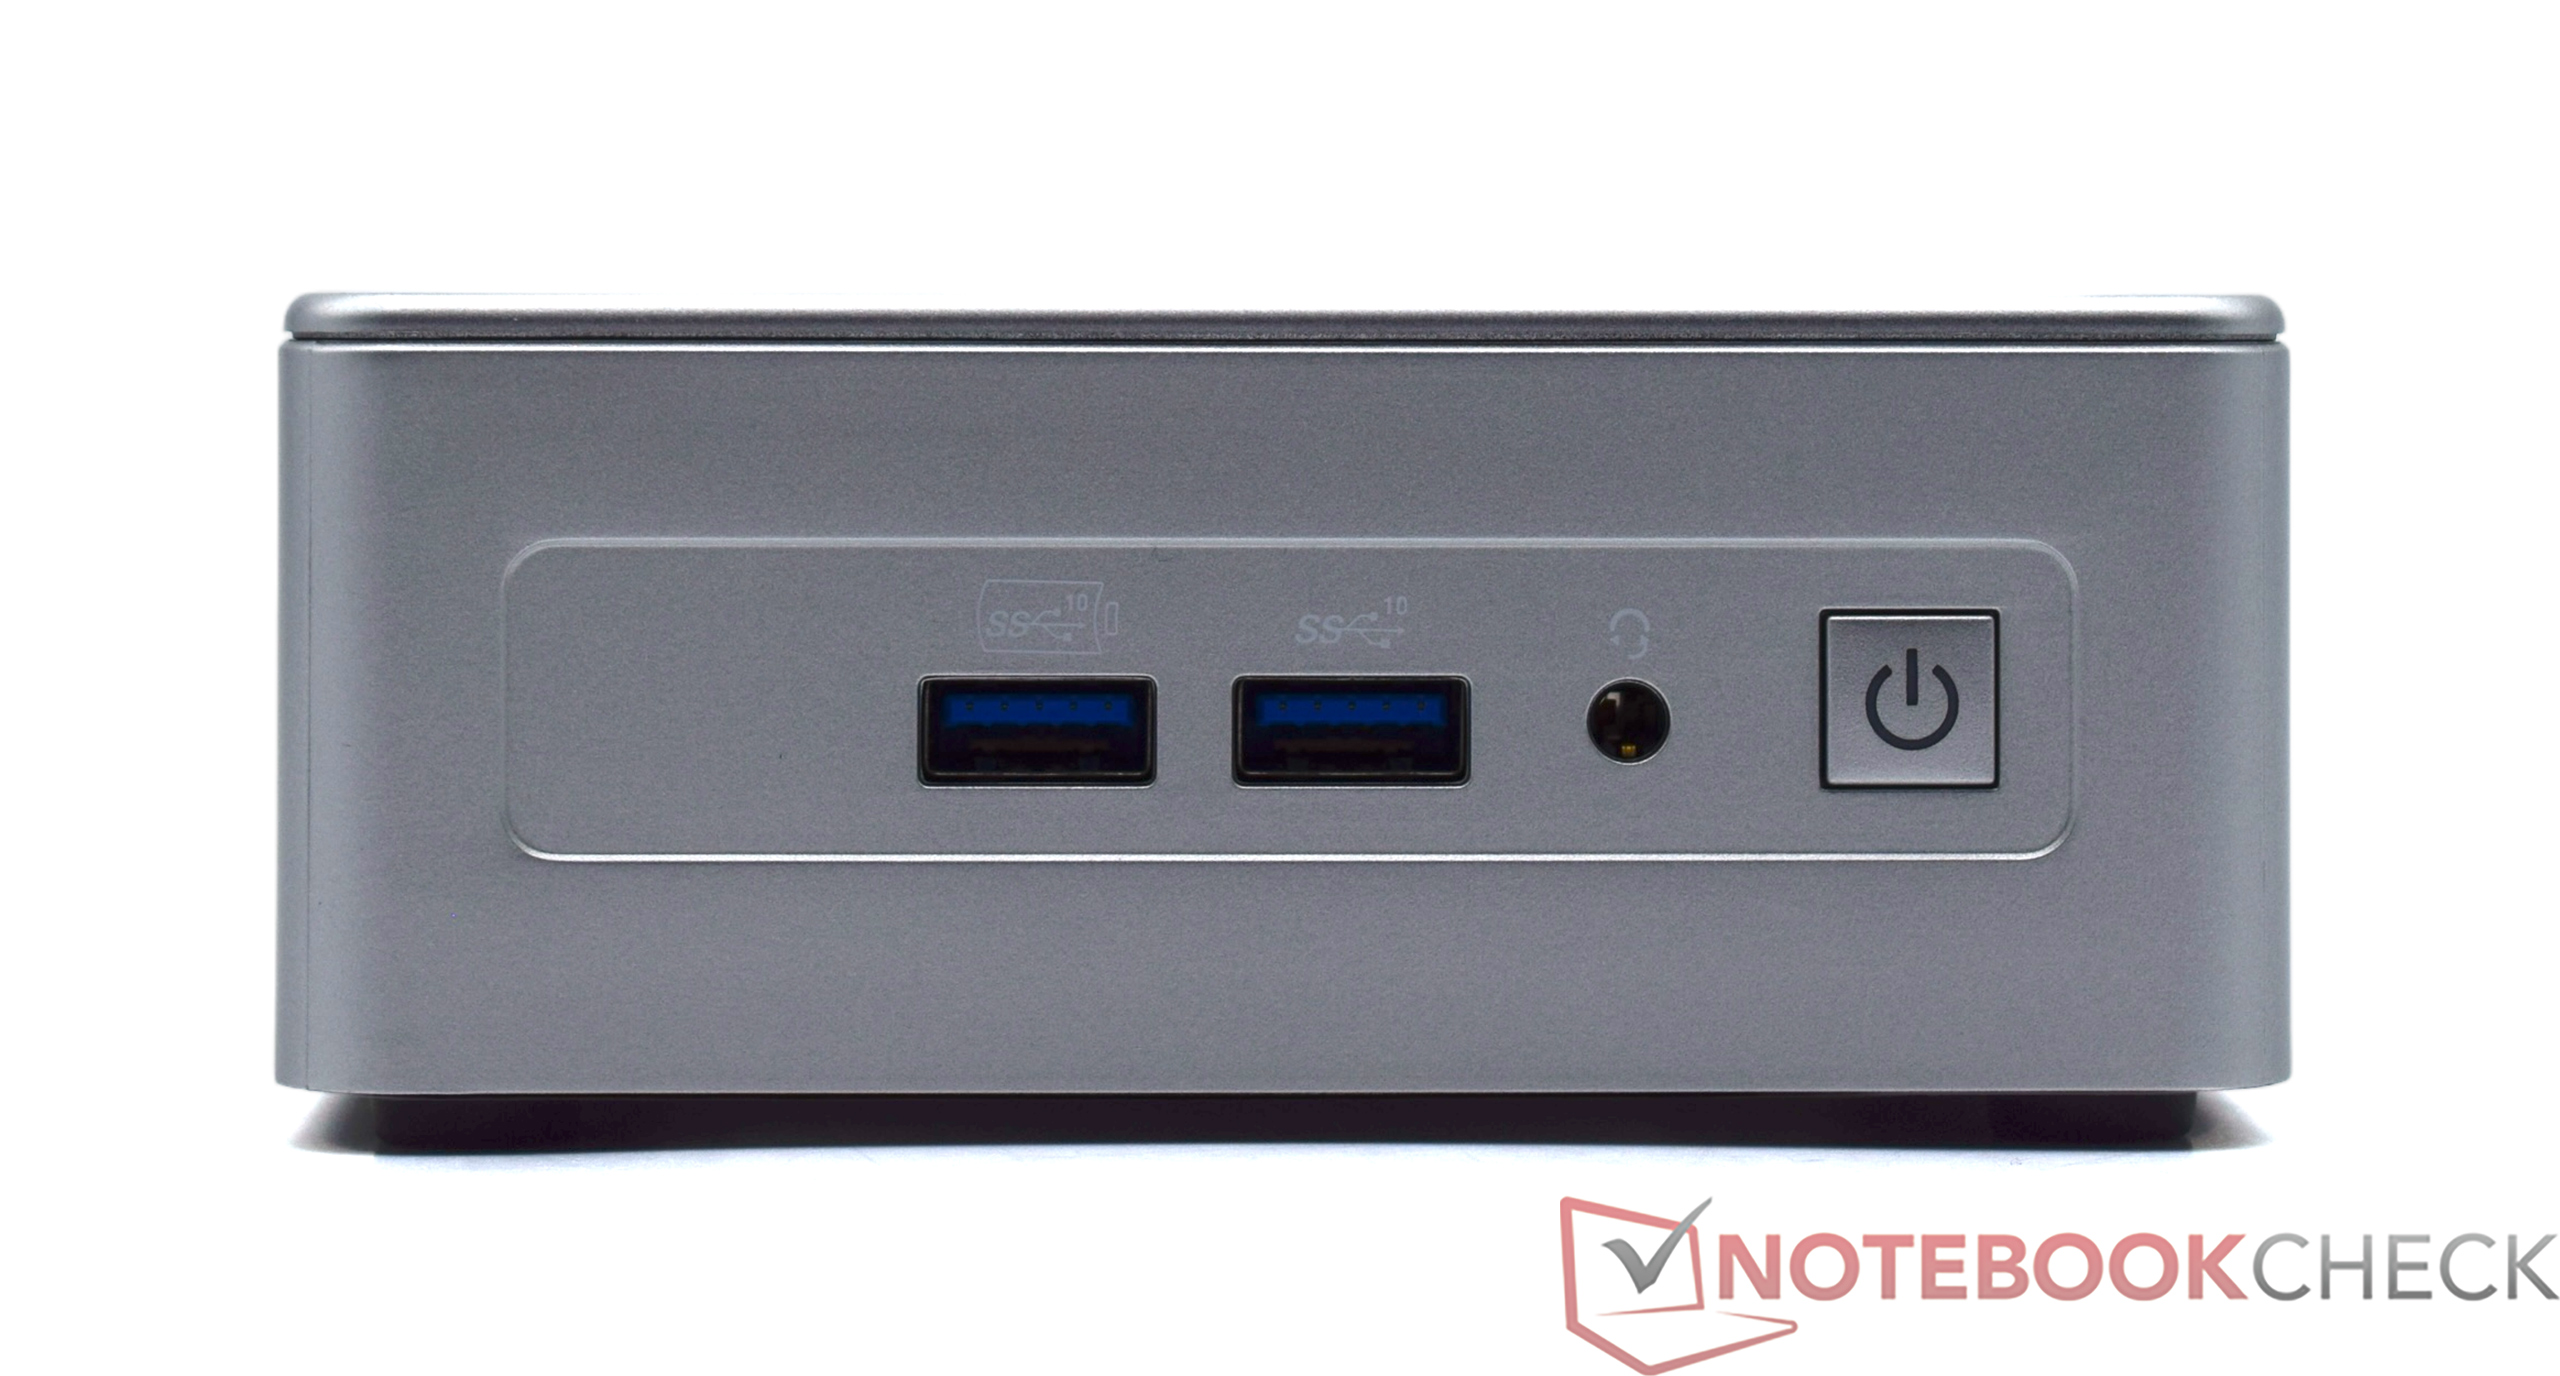
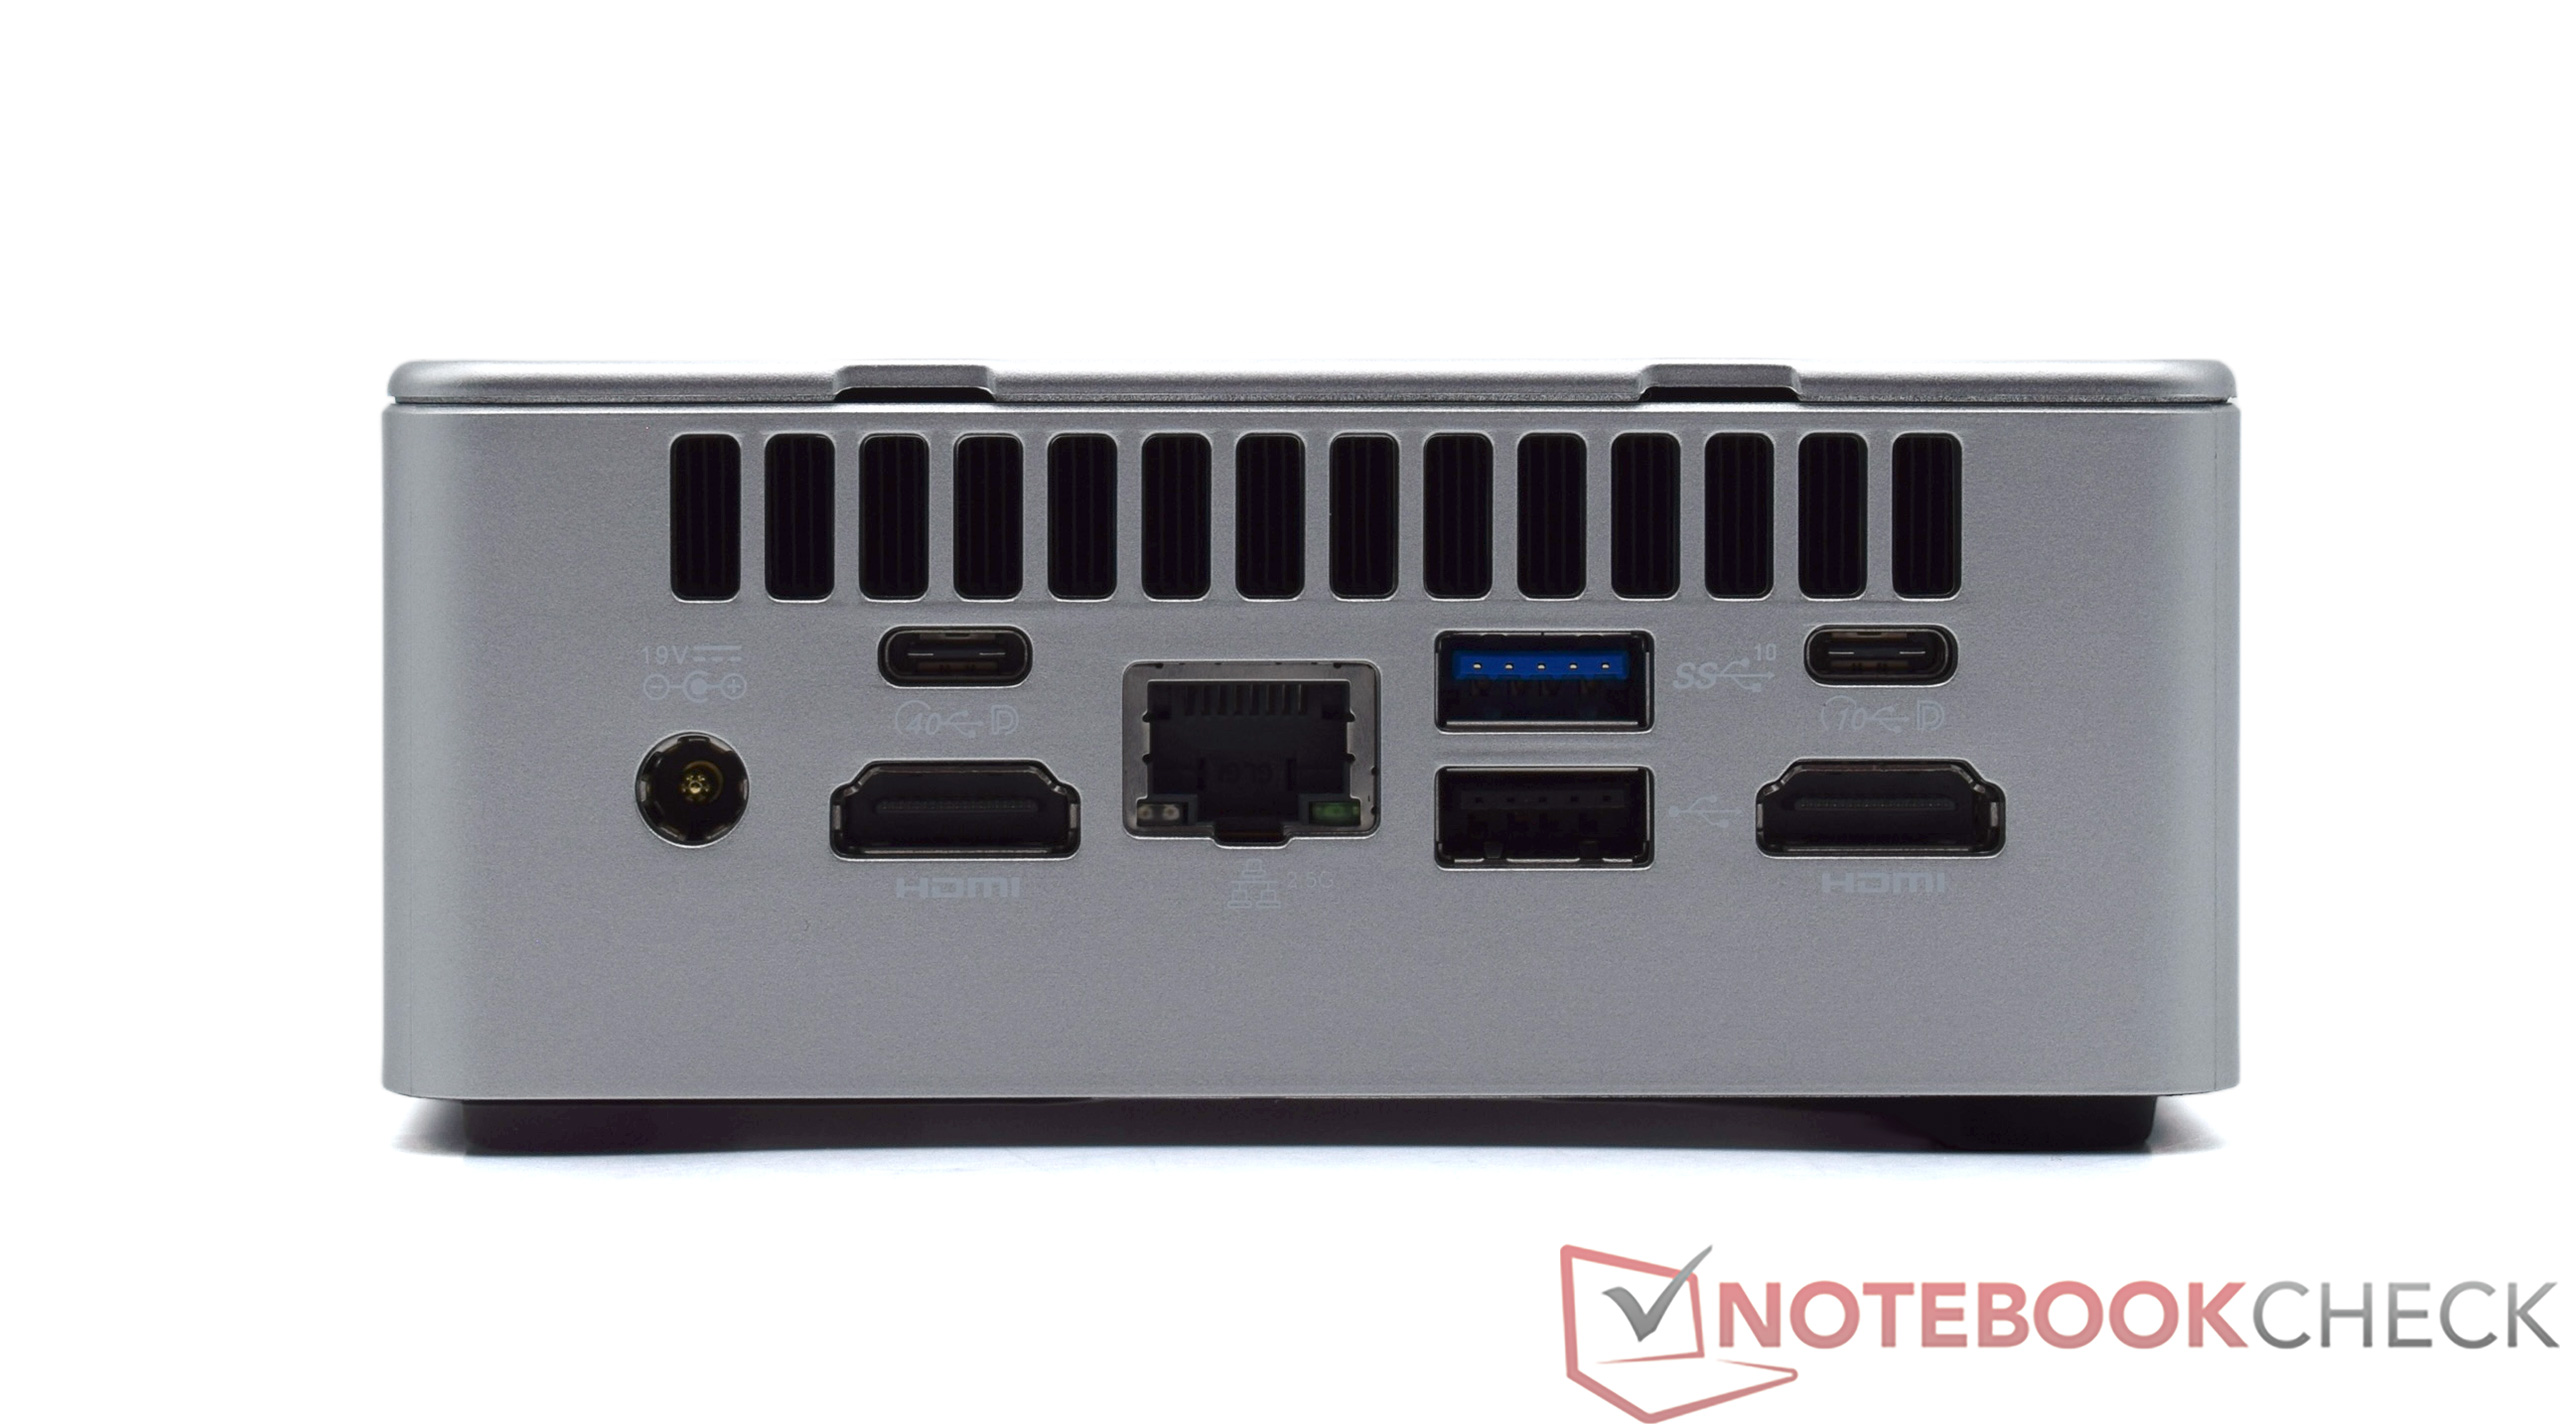
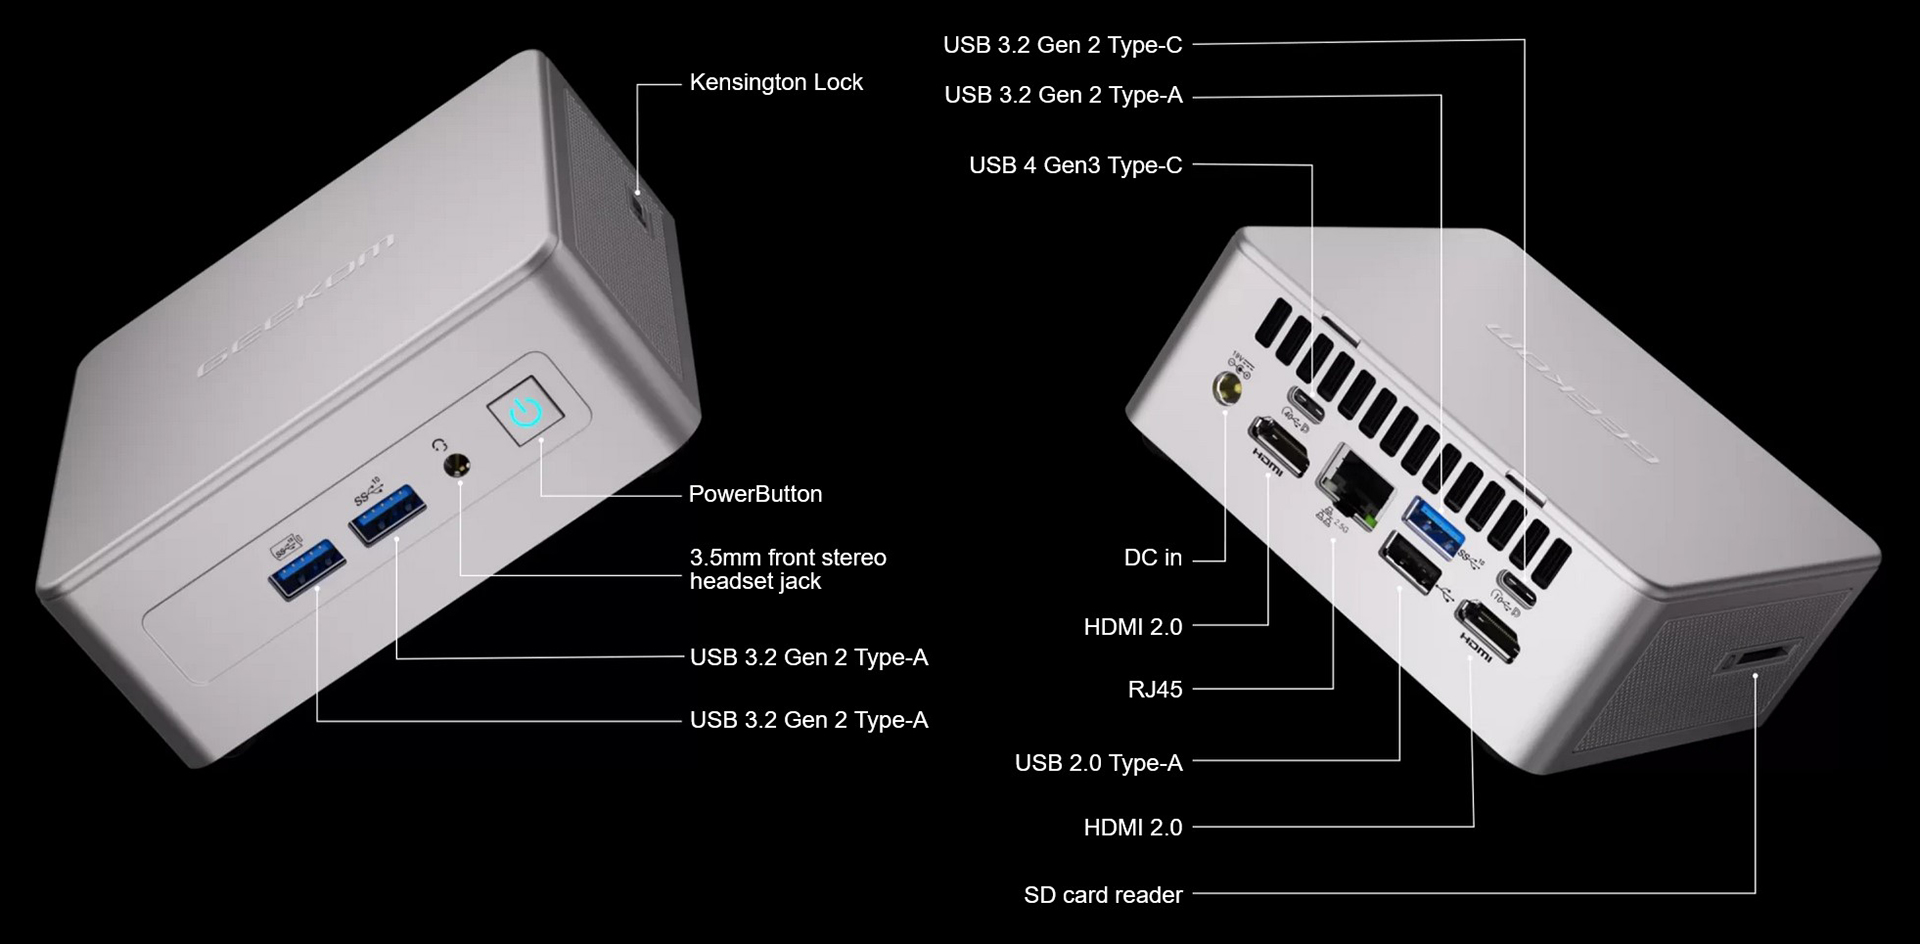
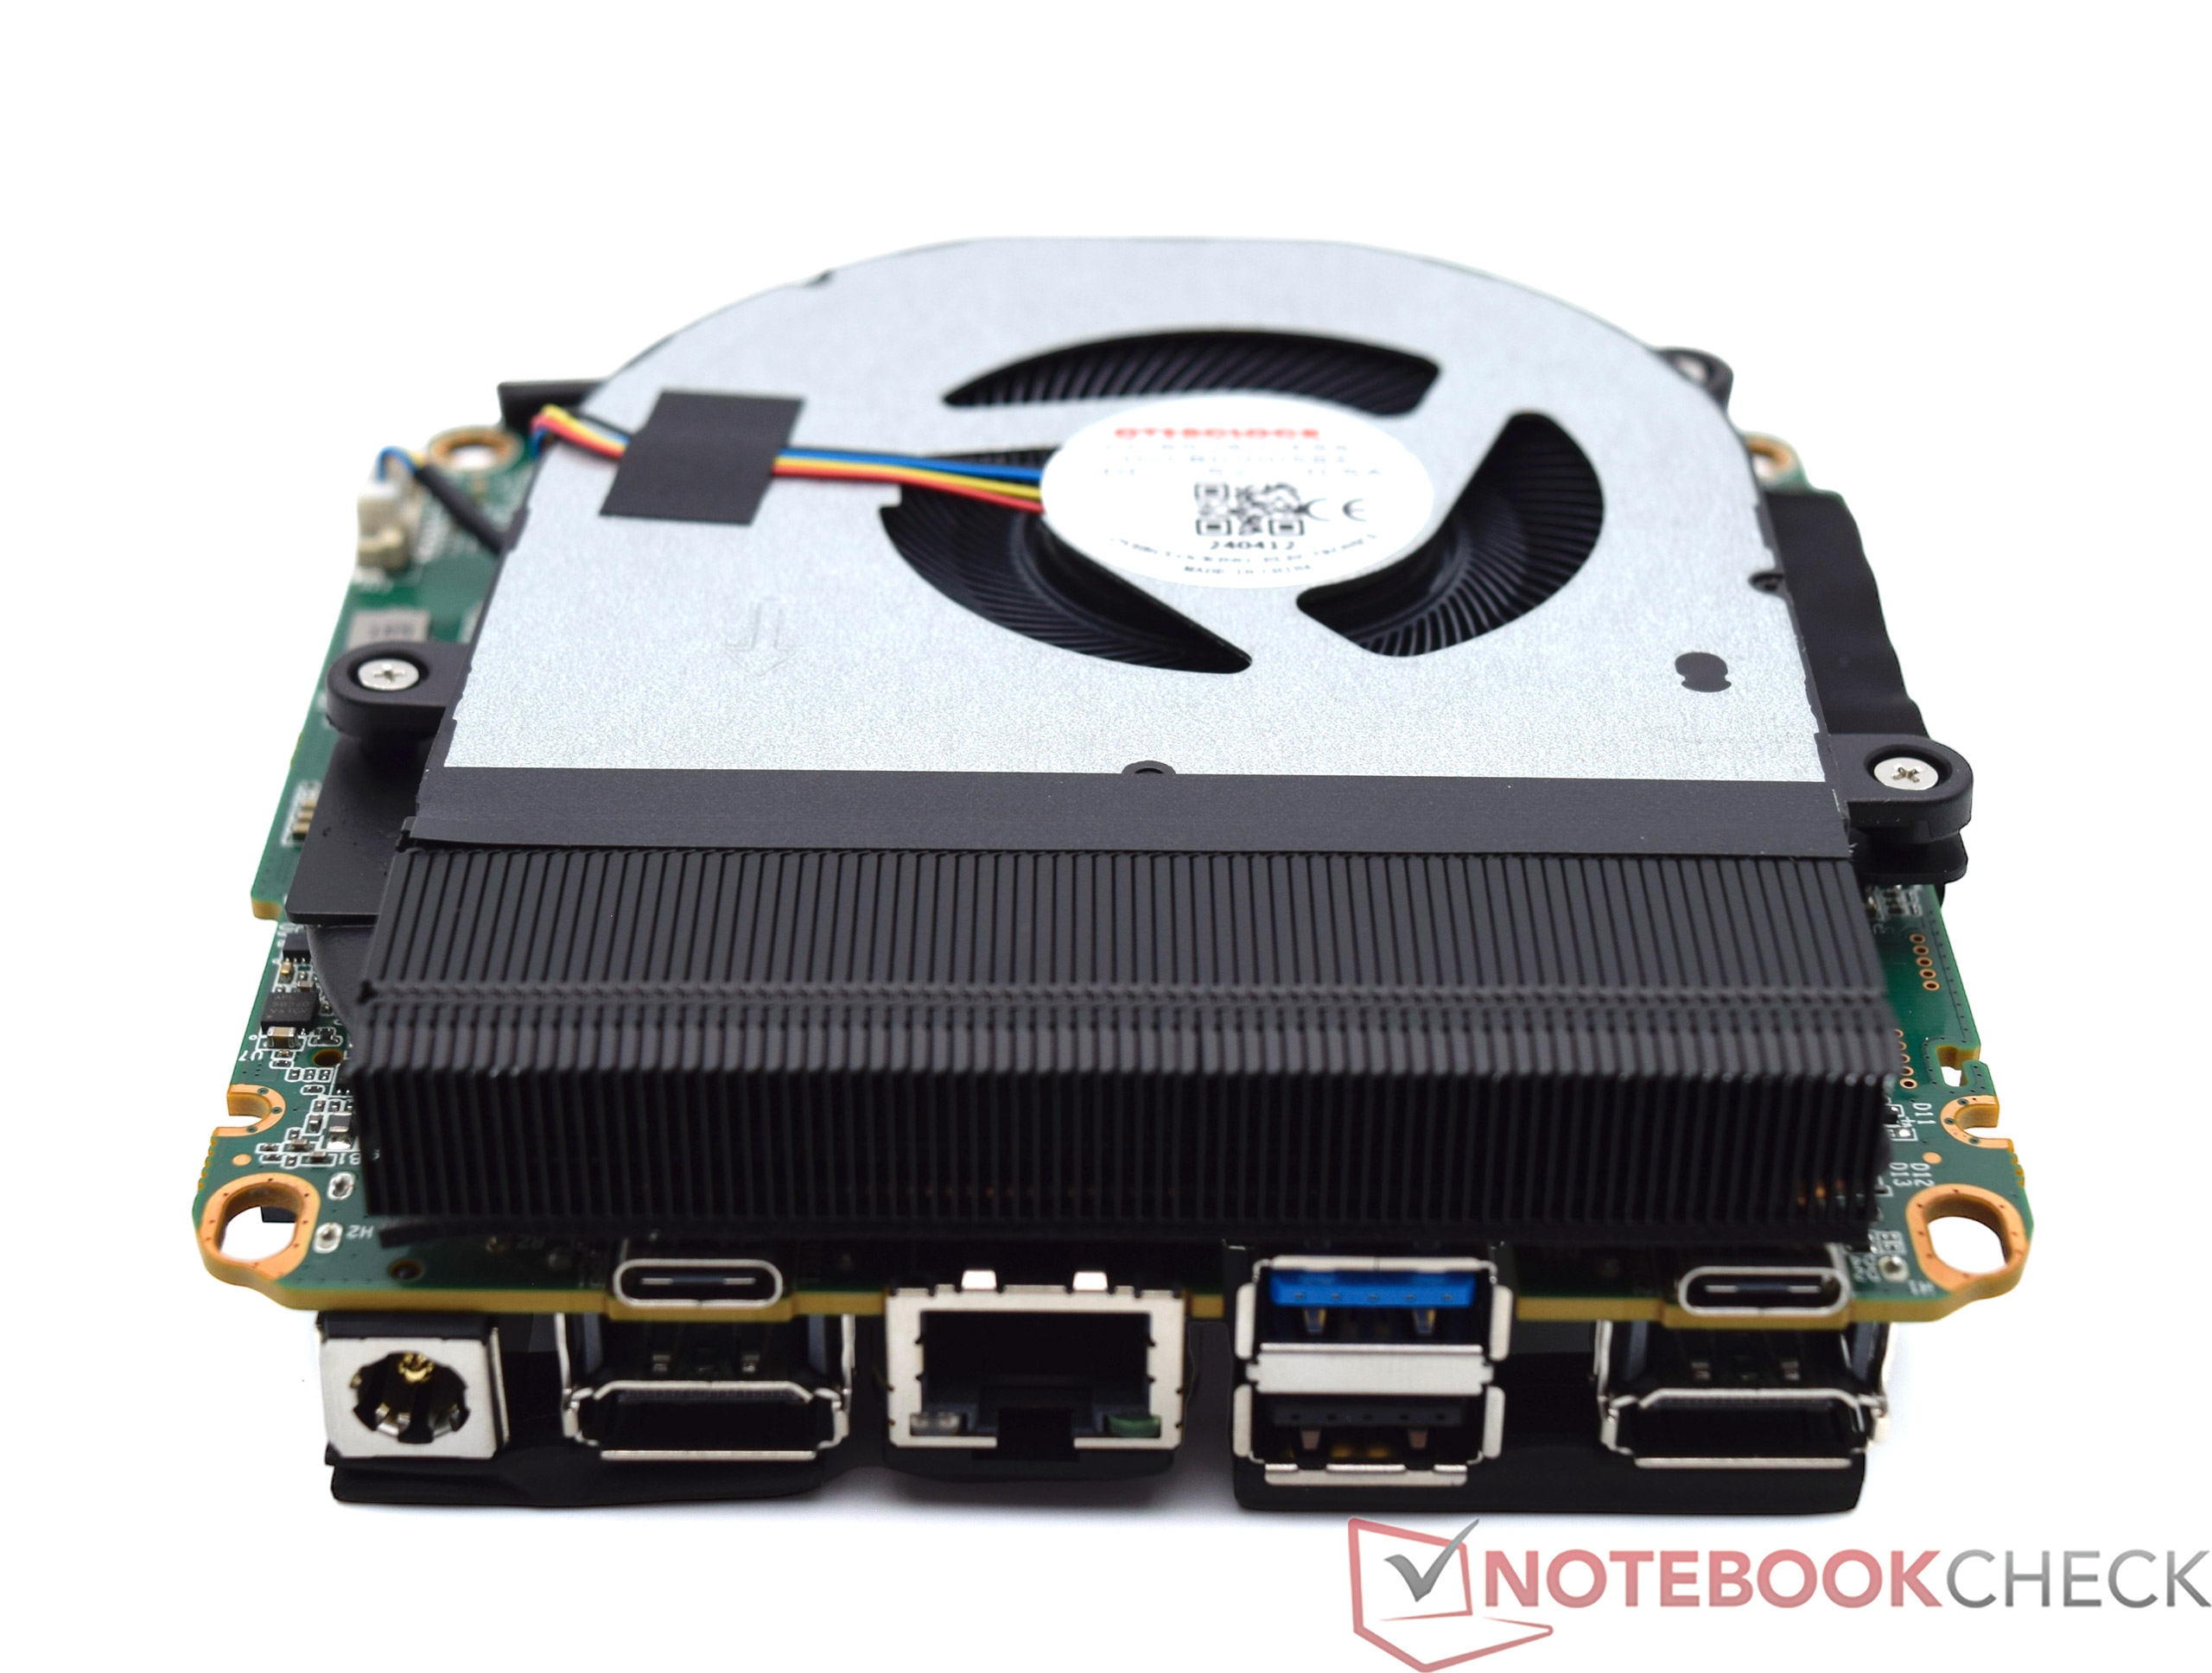
Zakres połączeń jest doskonały dla mini-PC. Geekom pozostaje wierny sobie w tej dyscyplinie, ponieważ producent systemu nie dostarczył jeszcze żadnych większych wpadek w tej dziedzinie. Większość złączy znajduje się z tyłu, co jest dobrze przemyślane dla użytkownika. Z przodu znajdują się również dwa szybkie porty USB, które przydadzą się w przypadku konieczności szybkiego podłączenia pamięci USB. Do czterech ekranów może być kontrolowanych jednocześnie, jeśli obraz jest również wyprowadzany przez dwa porty USB-C. Jeden z nich oferuje również prędkość USB4, która jest idealna do podłączania dodatkowych akcesoriów. Jak zawsze, przetestowaliśmy wydajność z zewnętrzną kartą graficzną, ale o tym później. Chcemy również wspomnieć o połączeniu sieciowym 2.5G i czytniku kart SD o wyjątkowej wydajności dzięki prędkości UHS-II.
Czytnik kart SD
| SD Card Reader | |
| average JPG Copy Test (av. of 3 runs) | |
| Geekom A5 (AV Pro SD microSD 128 GB V60) | |
| Geekom A8, R9 8945HS (AV Pro SD microSD 128 GB V60) | |
| Geekom AE7 | |
| Geekom GT13 Pro (AV Pro SD microSD 128 GB V60) | |
| Średnia w klasie Mini PC (15.1 - 214, n=25, ostatnie 2 lata) | |
| Minisforum AtomMan X7 Ti (AV Pro SD microSD 128 GB V60) | |
| maximum AS SSD Seq Read Test (1GB) | |
| Geekom AE7 | |
| Geekom A8, R9 8945HS (AV Pro SD microSD 128 GB V60) | |
| Geekom A5 (AV Pro SD microSD 128 GB V60) | |
| Geekom GT13 Pro (AV Pro SD microSD 128 GB V60) | |
| Średnia w klasie Mini PC (17.9 - 250, n=25, ostatnie 2 lata) | |
| Minisforum AtomMan X7 Ti (AV Pro SD microSD 128 GB V60) | |
Komunikacja
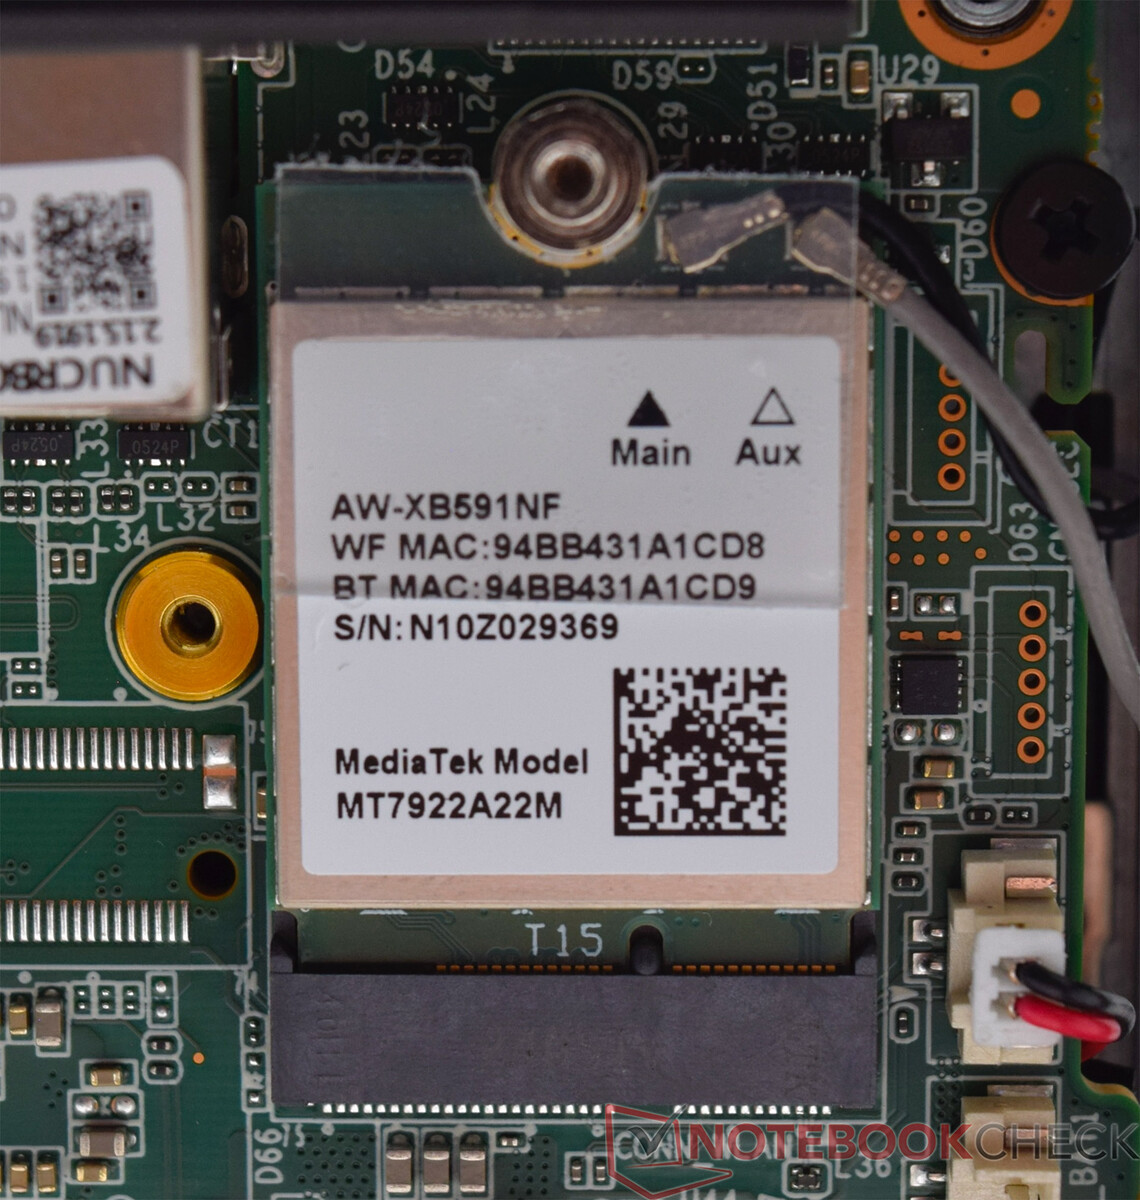
Geekom AE7 jest wyposażony w moduł radiowy MediaTek Wi-Fi 6E, który może również działać w paśmie częstotliwości 6 GHz. Nasze testy porównawcze pokazują, że ta opcja połączenia powinna być używana przede wszystkim, jeśli jest dostępna. W paśmie częstotliwości 5 GHz prędkości transferu są znacznie niższe niż u większości konkurentów. Jednak nadal doskonale nadaje się do codziennego użytku. Transfery danych są zauważalnie szybsze w przypadku korzystania z połączenia bezprzewodowego 6 GHz. Wartości zostały określone w połączeniu z naszym routerem Asus ROG Rapture GT-AXE11000.
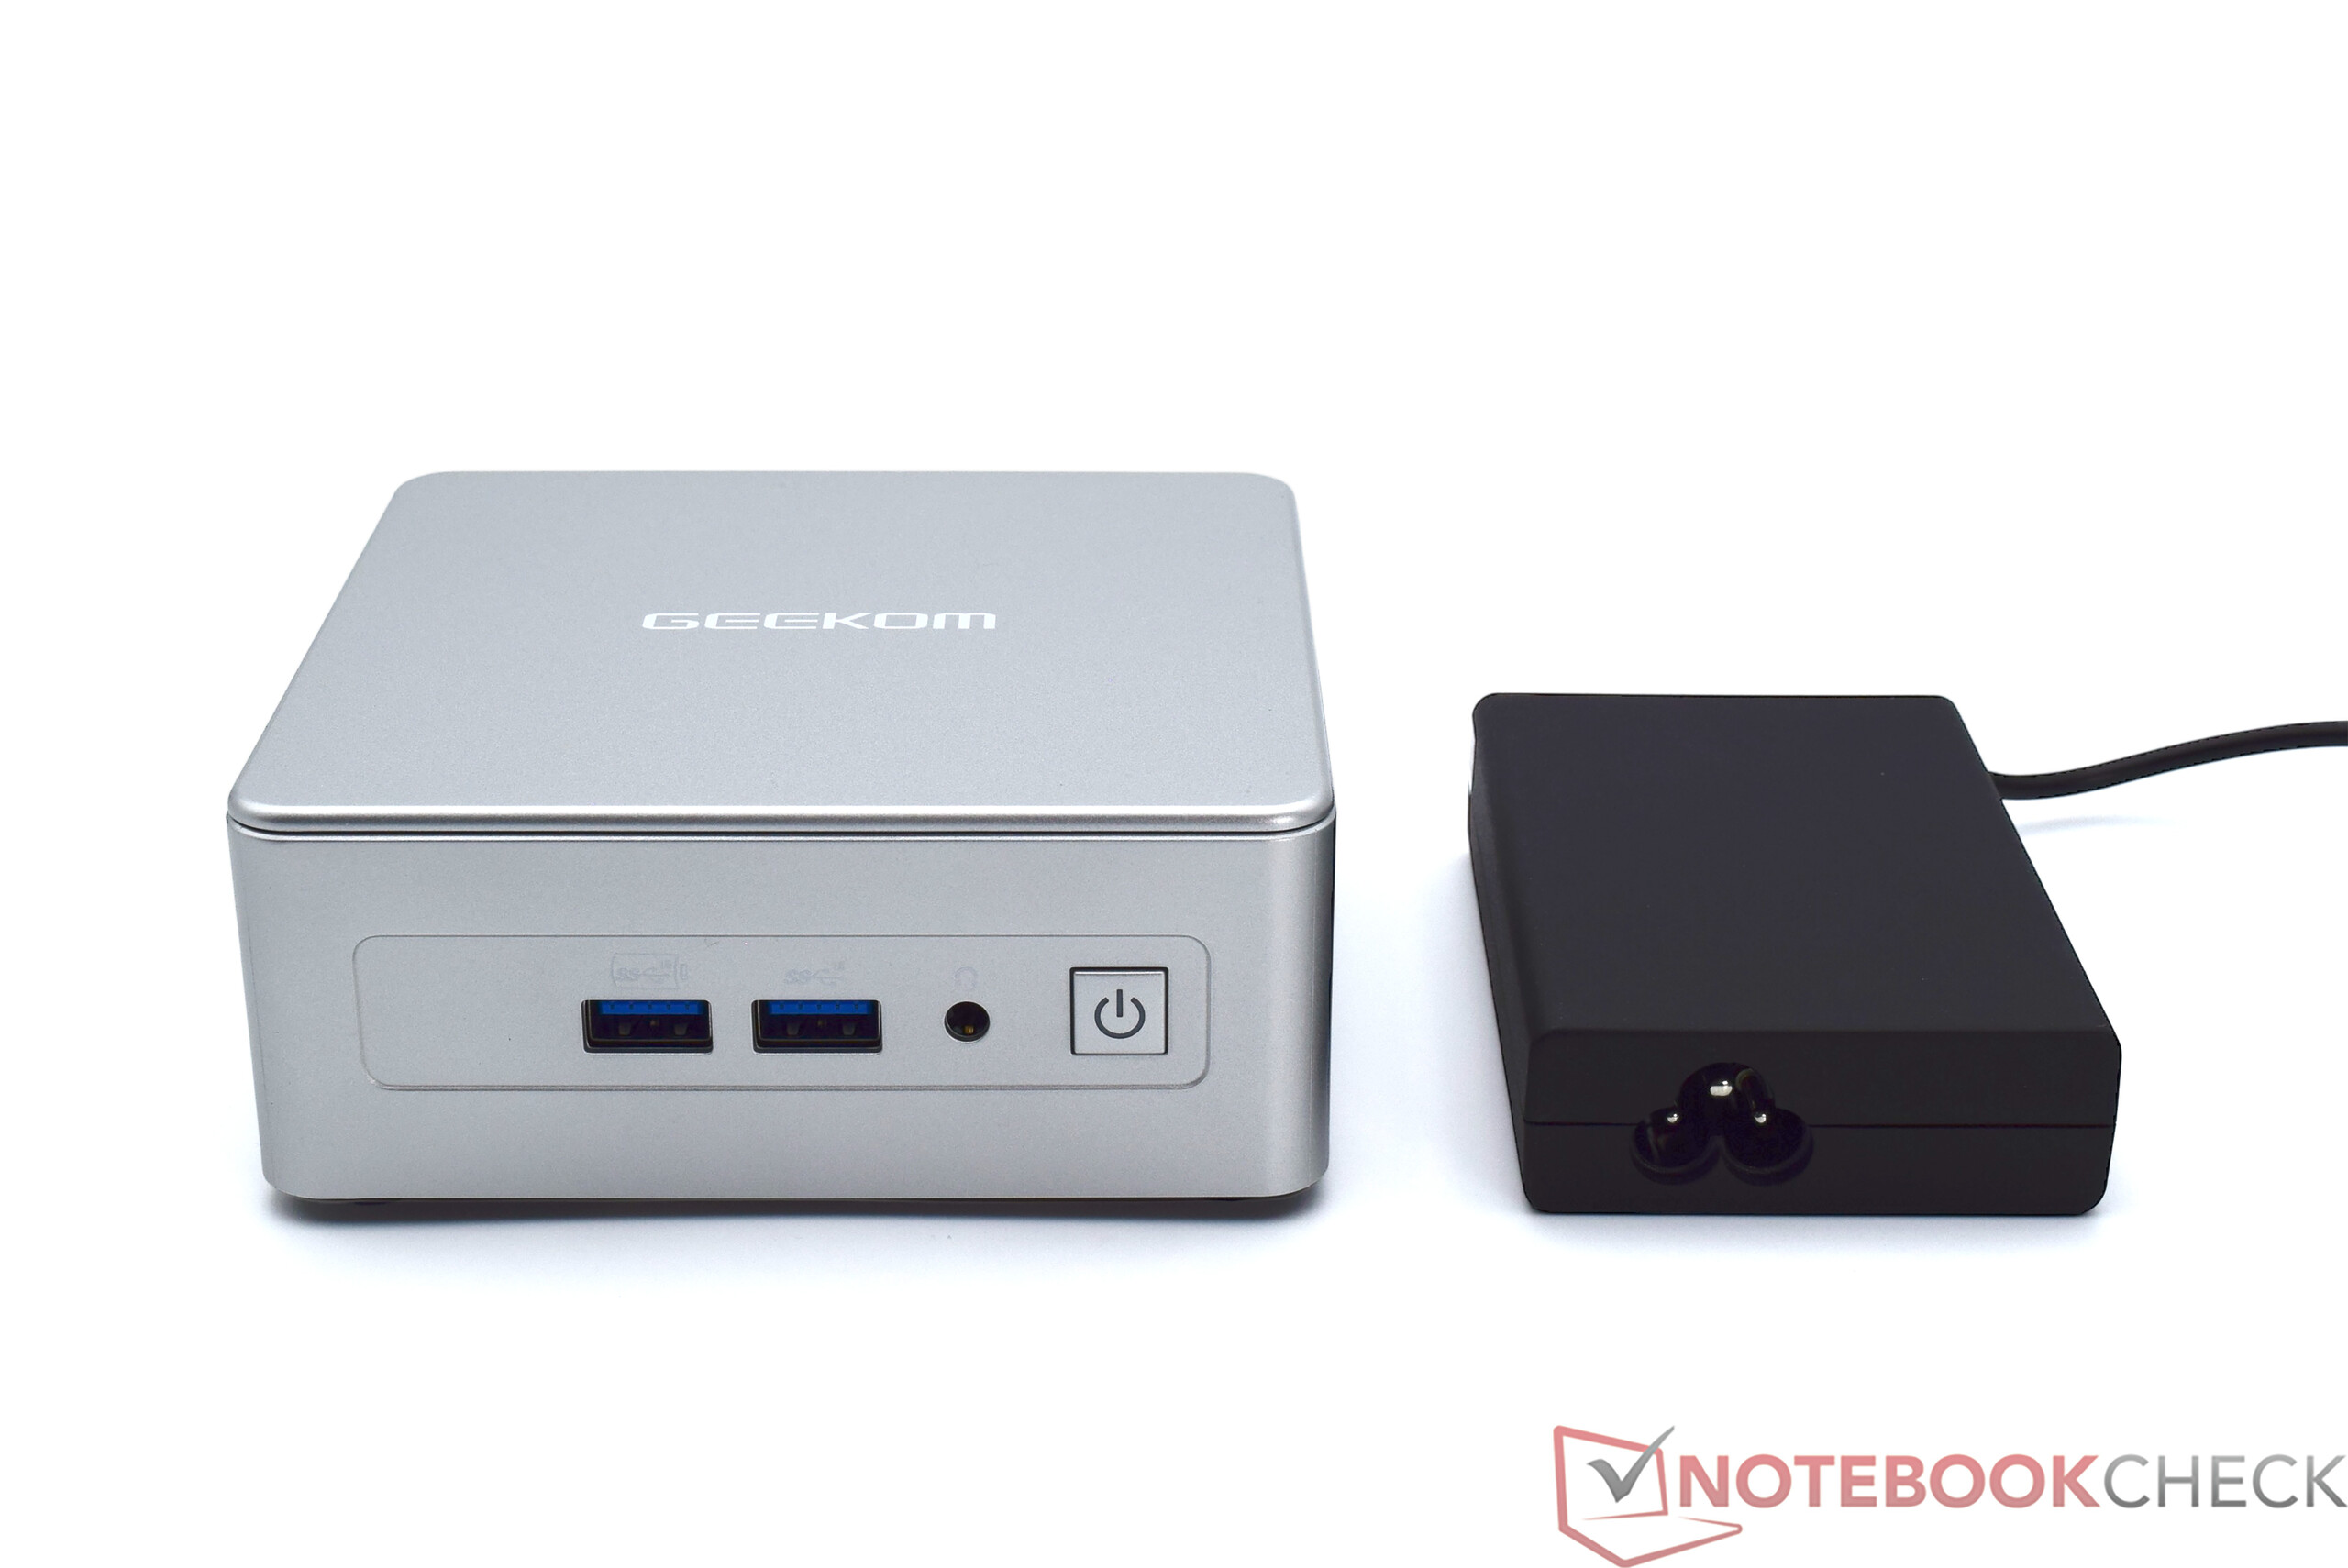
Akcesoria
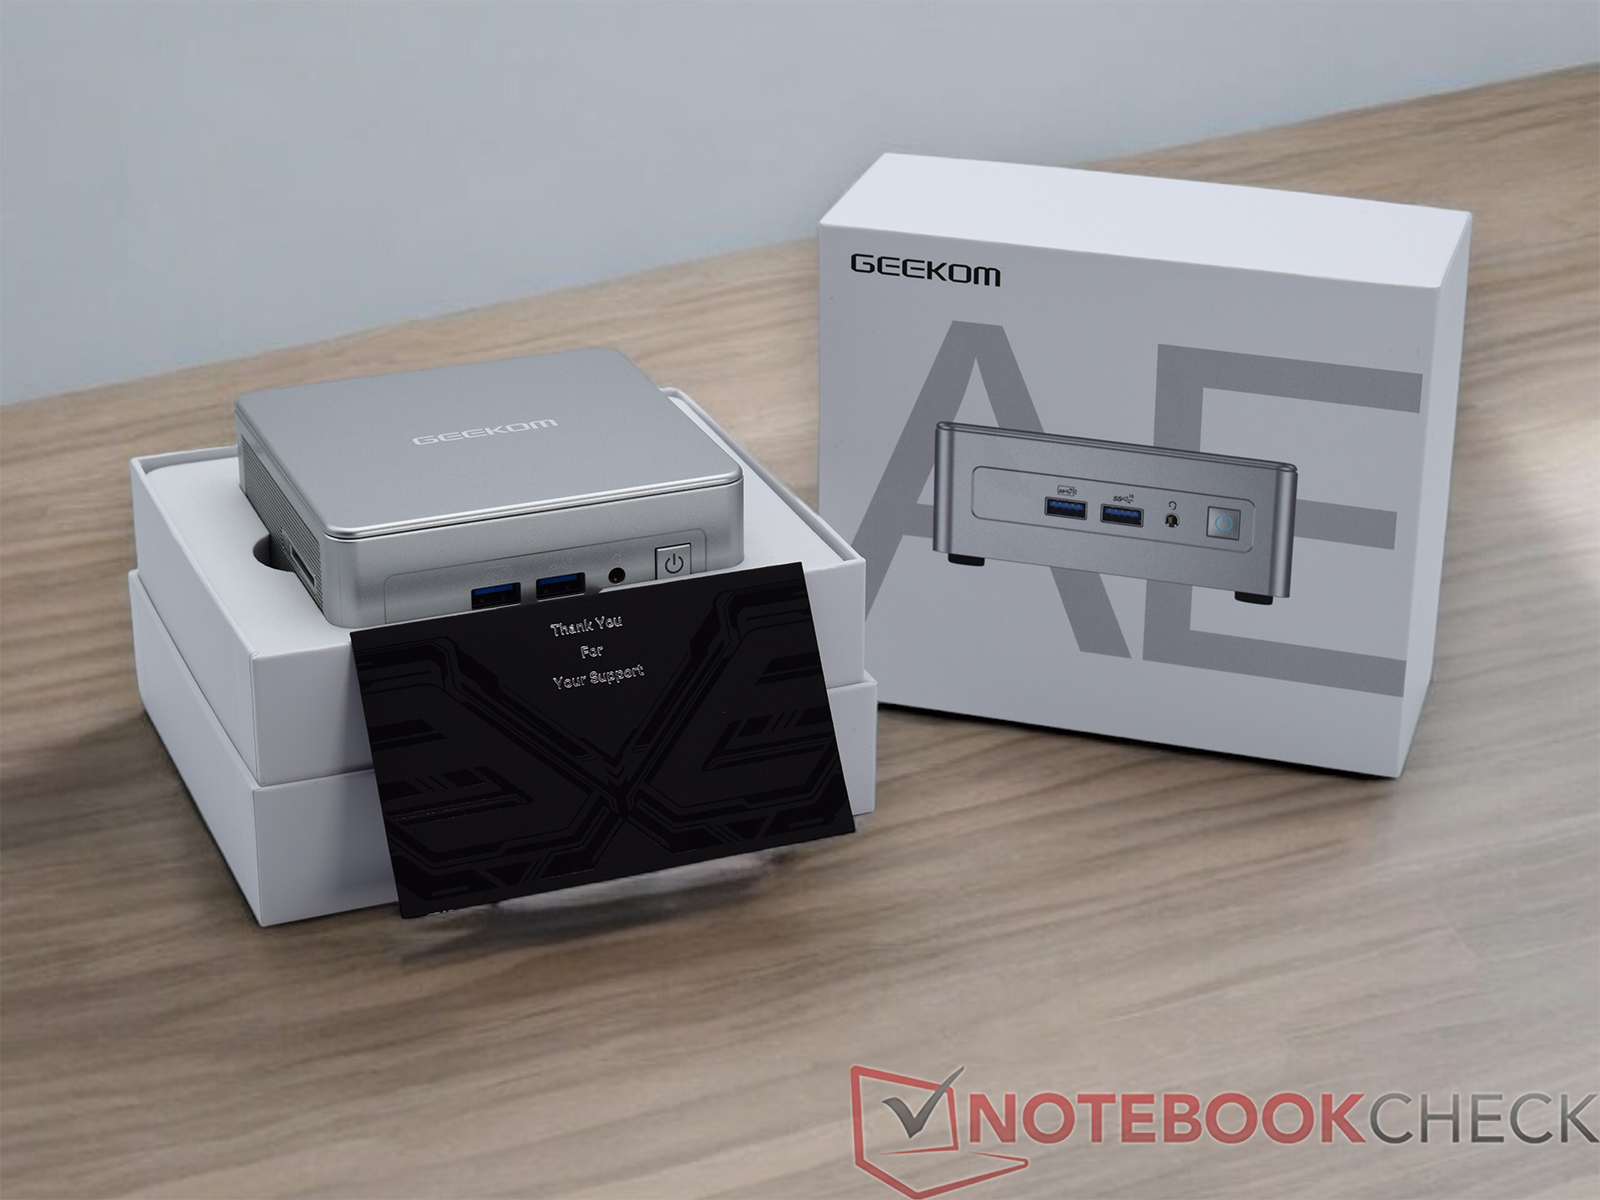
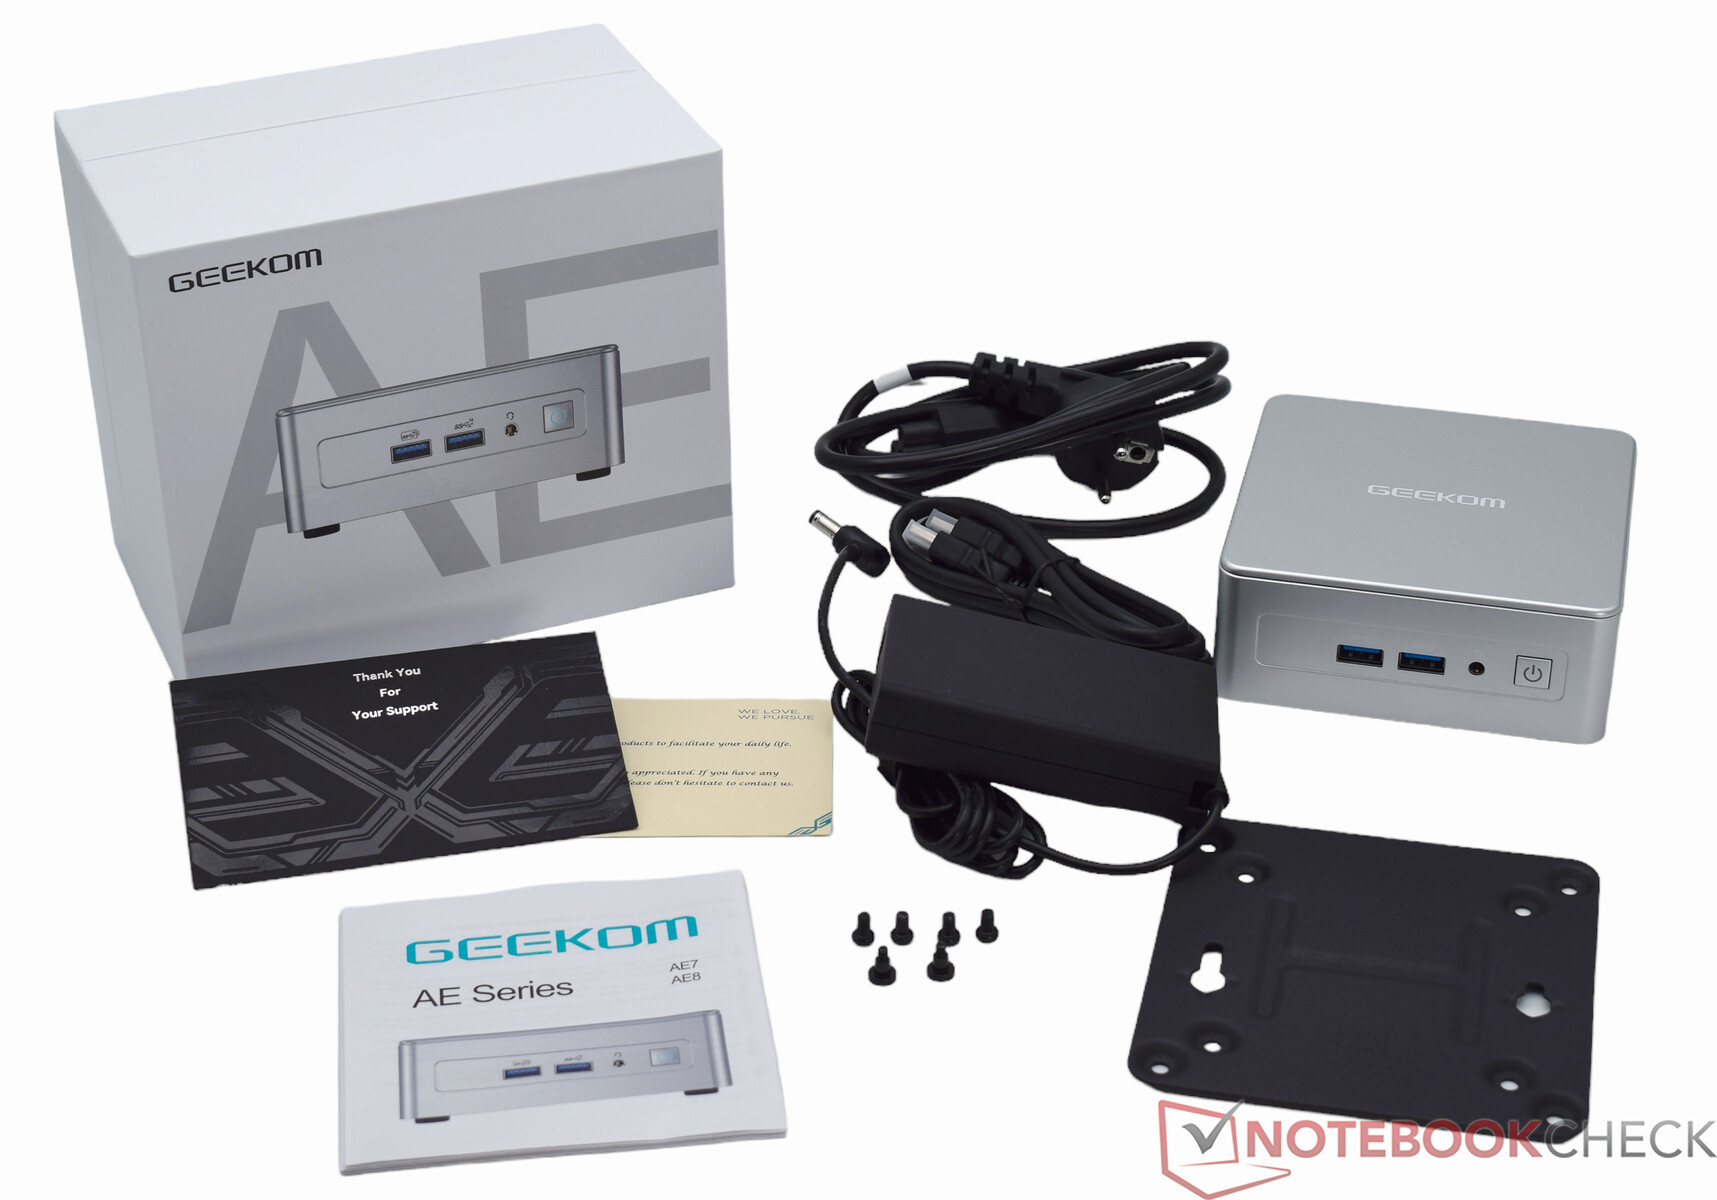
Zakres dostawy jest szeroki i obejmuje wszystko, czego potrzeba do natychmiastowego uruchomienia urządzenia. Oprócz samego mini-PC, w zestawie znajduje się również 120-watowy zasilacz i płyta montażowa do montażu VESA. W zestawie znajduje się również kabel HDMI, skrócona instrukcja obsługi i obowiązkowa karta z podziękowaniami.
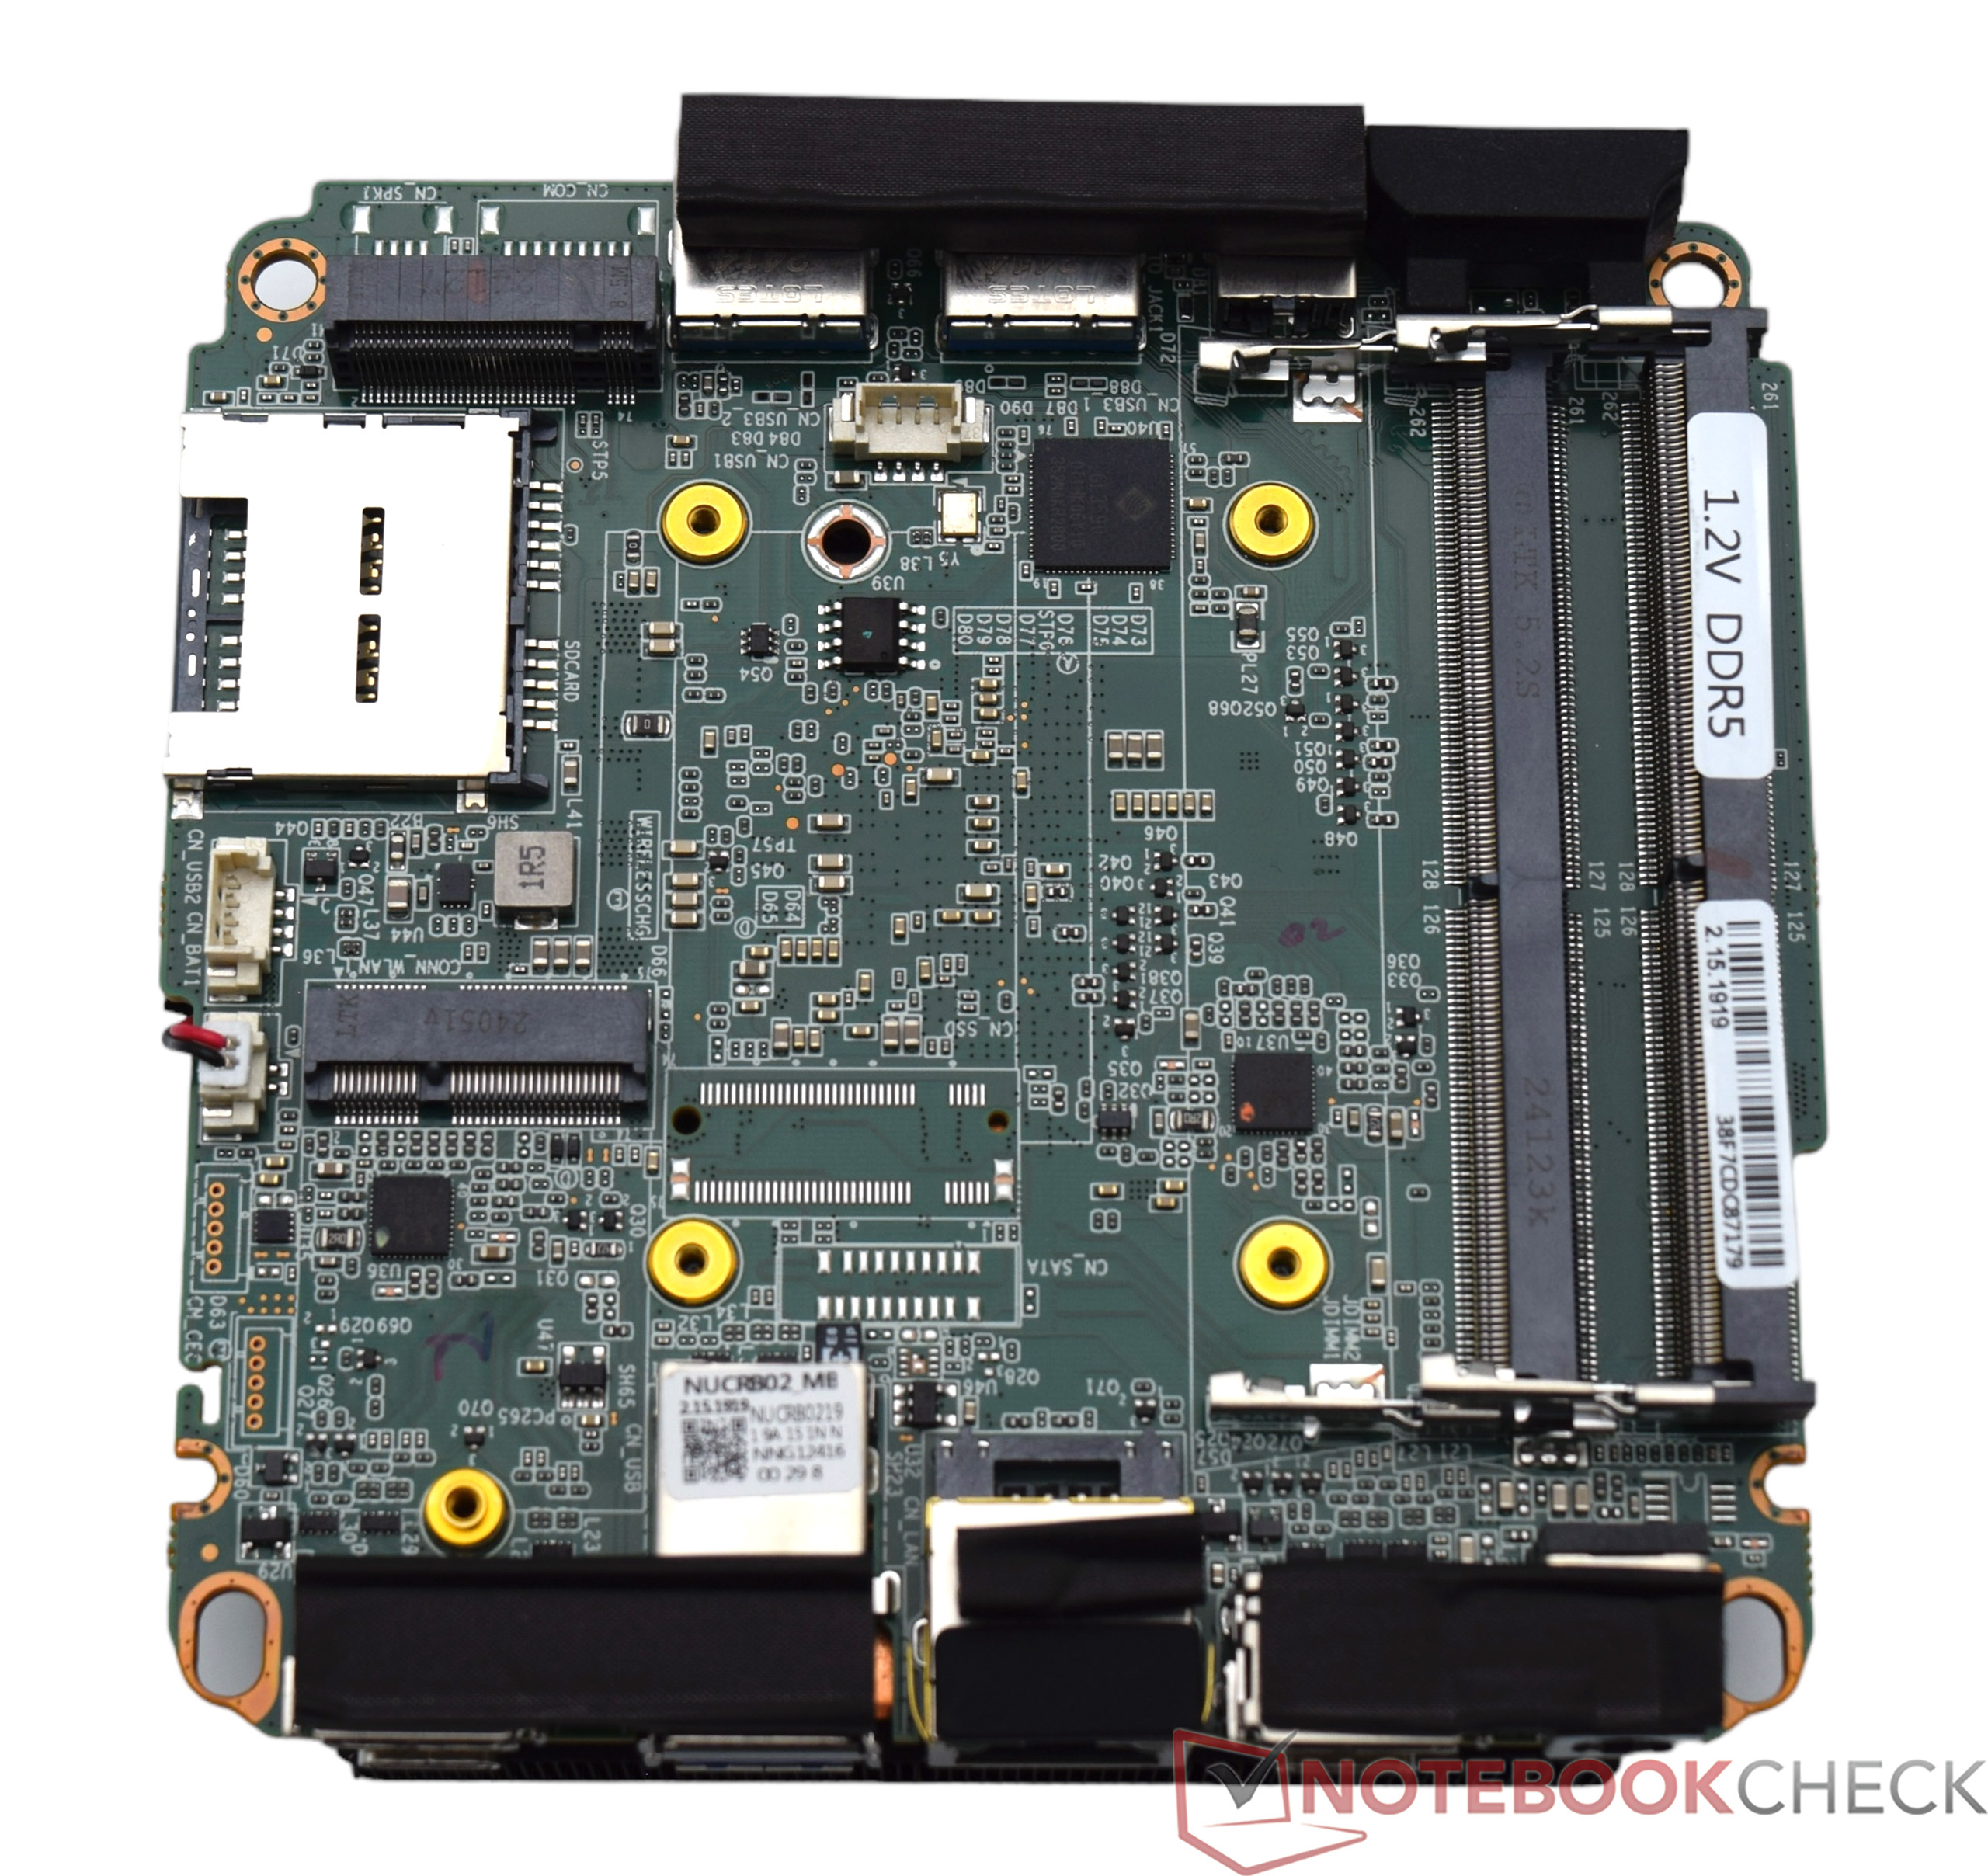
Konserwacja
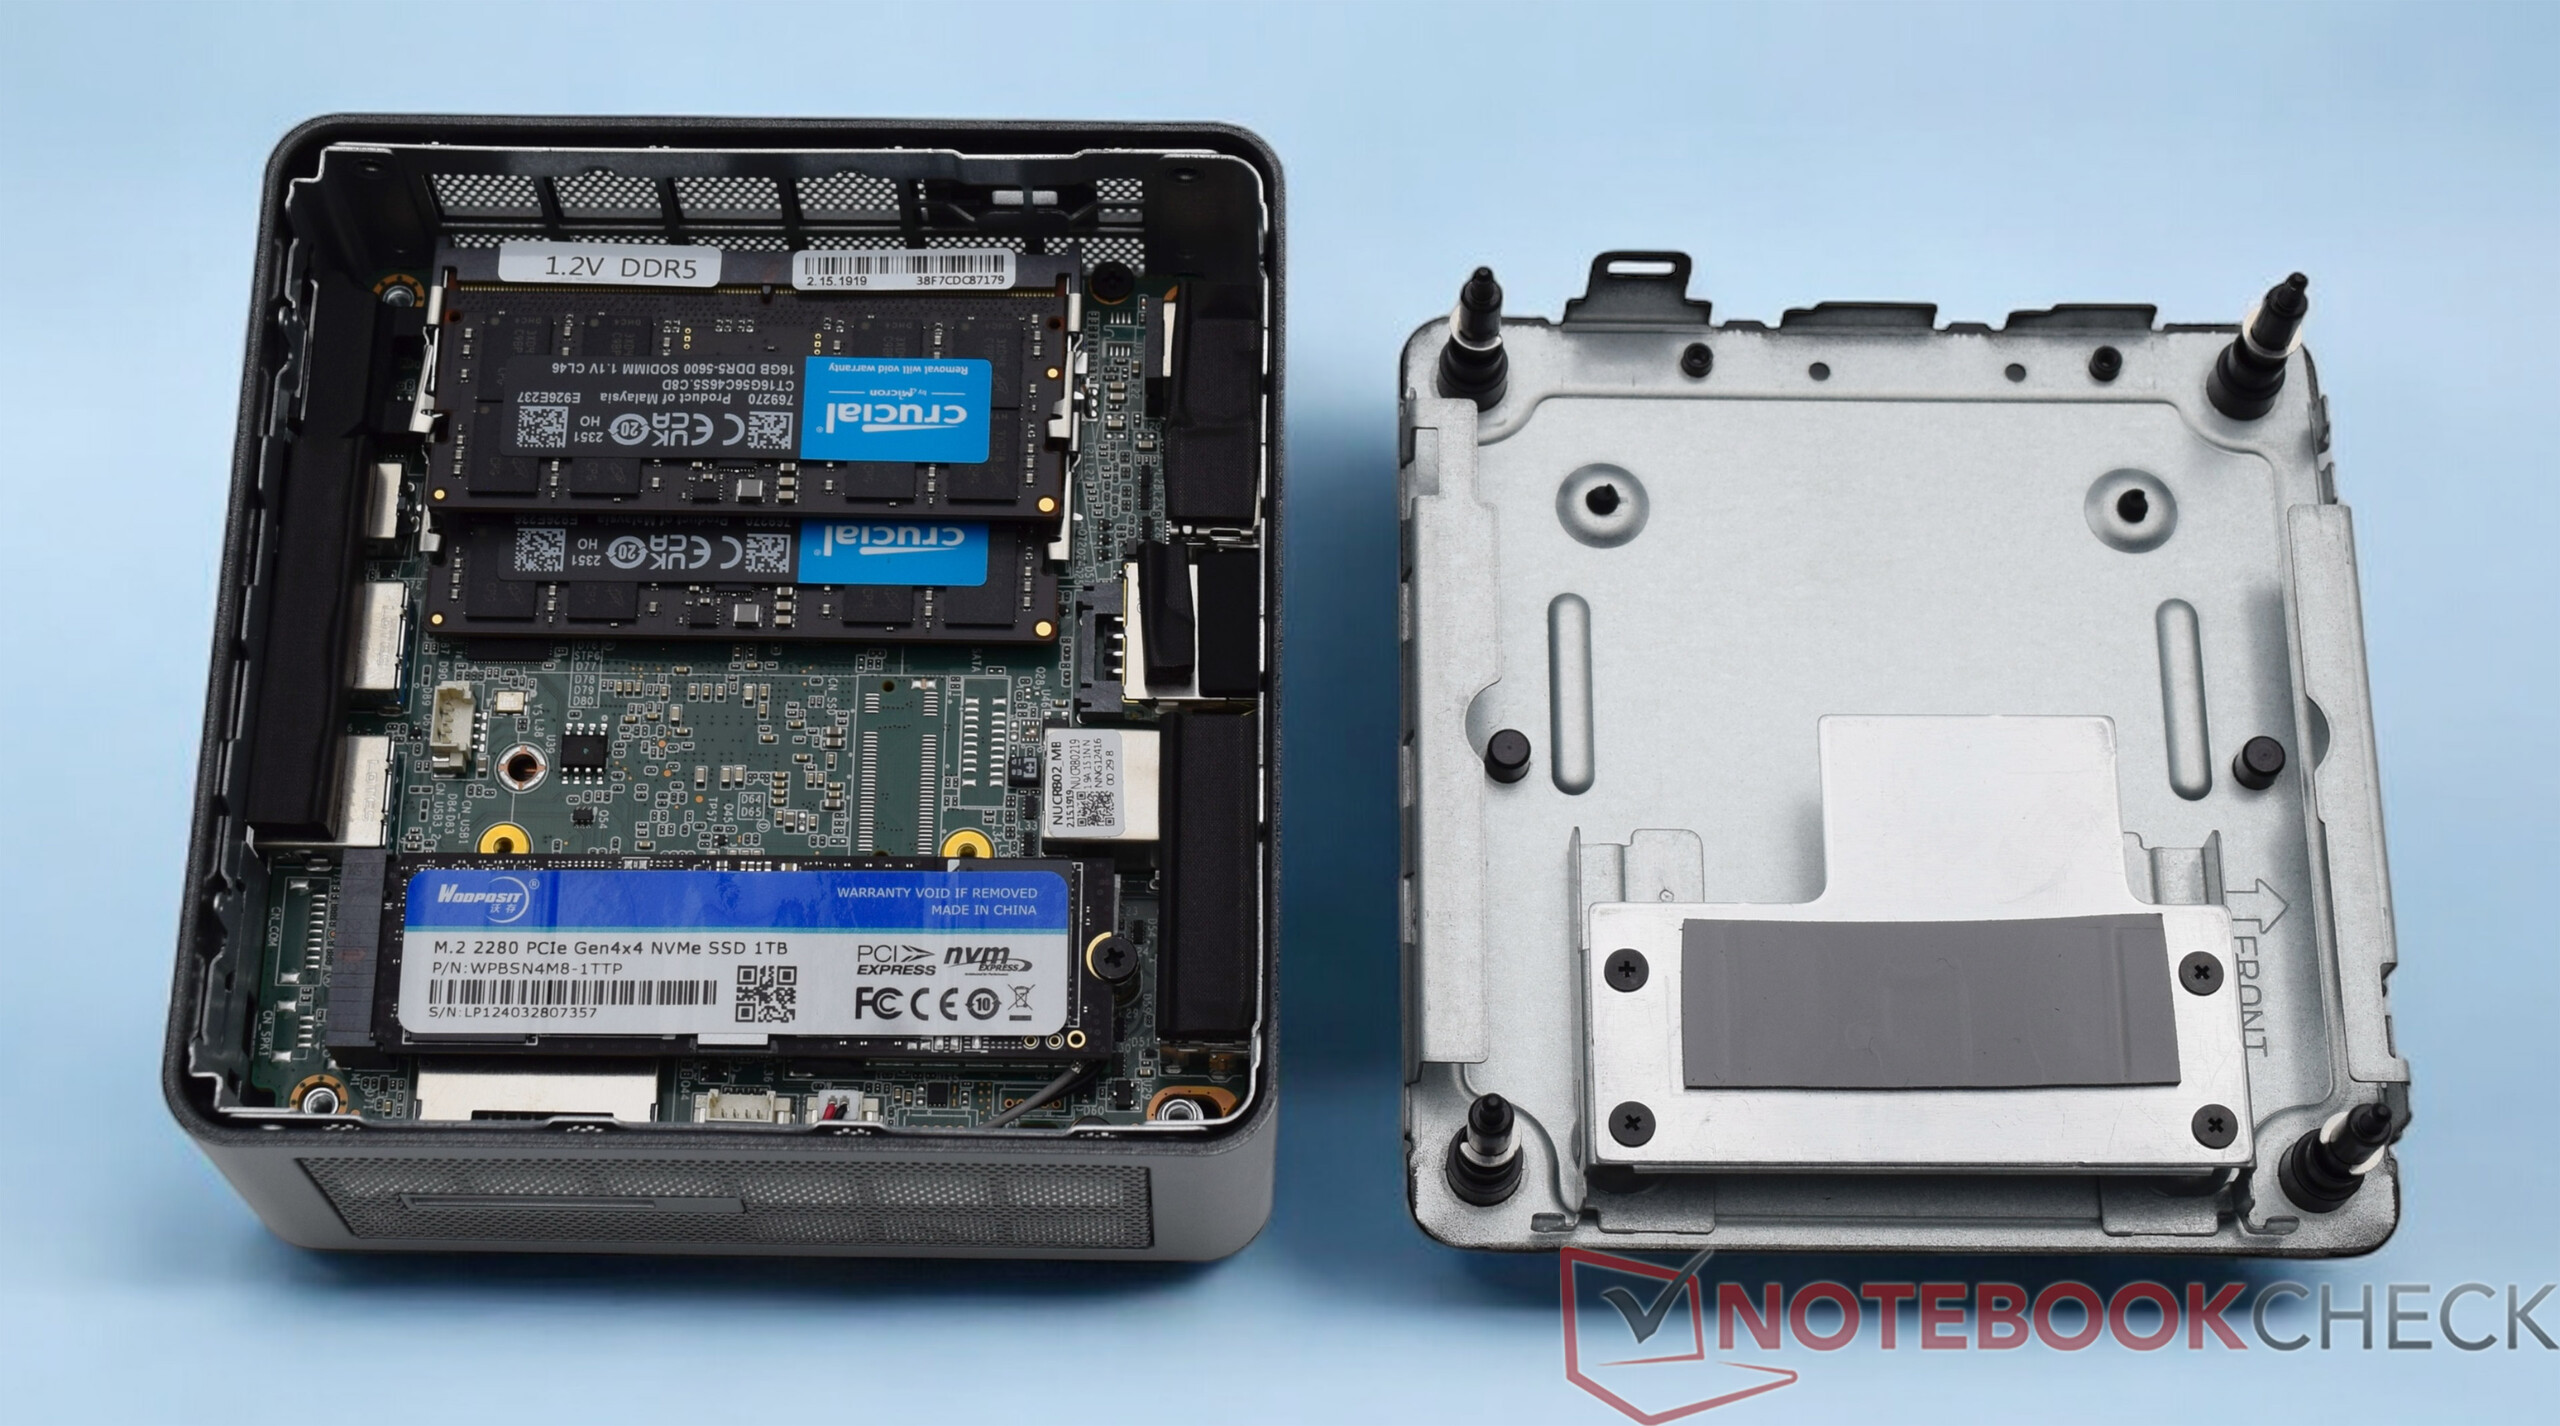
Kwestia konserwacji nie jest obecna na początku, ponieważ Geekom sprzedaje AE7 tylko w opcji wstępnie skonfigurowanej. Tak jak poprzednio, mini-PC jest łatwy do otwarcia. Tylko cztery małe śrubki muszą być poluzowane na spodzie, co pozwala na zdjęcie dolnego panelu. Po wejściu do środka możemy stosunkowo łatwo uzyskać dostęp do pamięci RAM i dysku SSD. W razie potrzeby można również wyjąć moduł WLAN. Znajduje się on bezpośrednio pod dyskiem SSD. Urządzenie jest już w pełni wyposażone, a modernizację można przeprowadzić tylko poprzez bezpośrednią wymianę komponentów. Aby uzyskać dostęp do wentylatora procesora, należy usunąć całą płytkę drukowaną. Jest to jednak również możliwe przy odrobinie umiejętności.
Zrównoważony rozwój
Geekom AE7 jest dostarczany w małym kartonowym pudełku, które jest odpowiednie do wymiarów rzeczywistego urządzenia testowego. Akcesoria ponownie zapakowane są w osobne plastikowe torebki, co nie sprzyja trwałości. Urządzenie wykonane jest głównie z plastiku i metalu. Nie wiemy, czy do jego produkcji użyto specjalnych materiałów pochodzących z recyklingu.
Wydajność - AMD Ryzen 9 7940HS z dobrą produktywnością
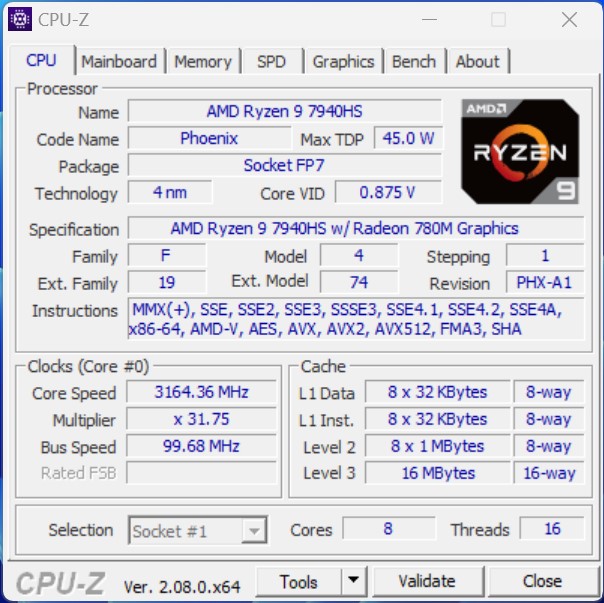
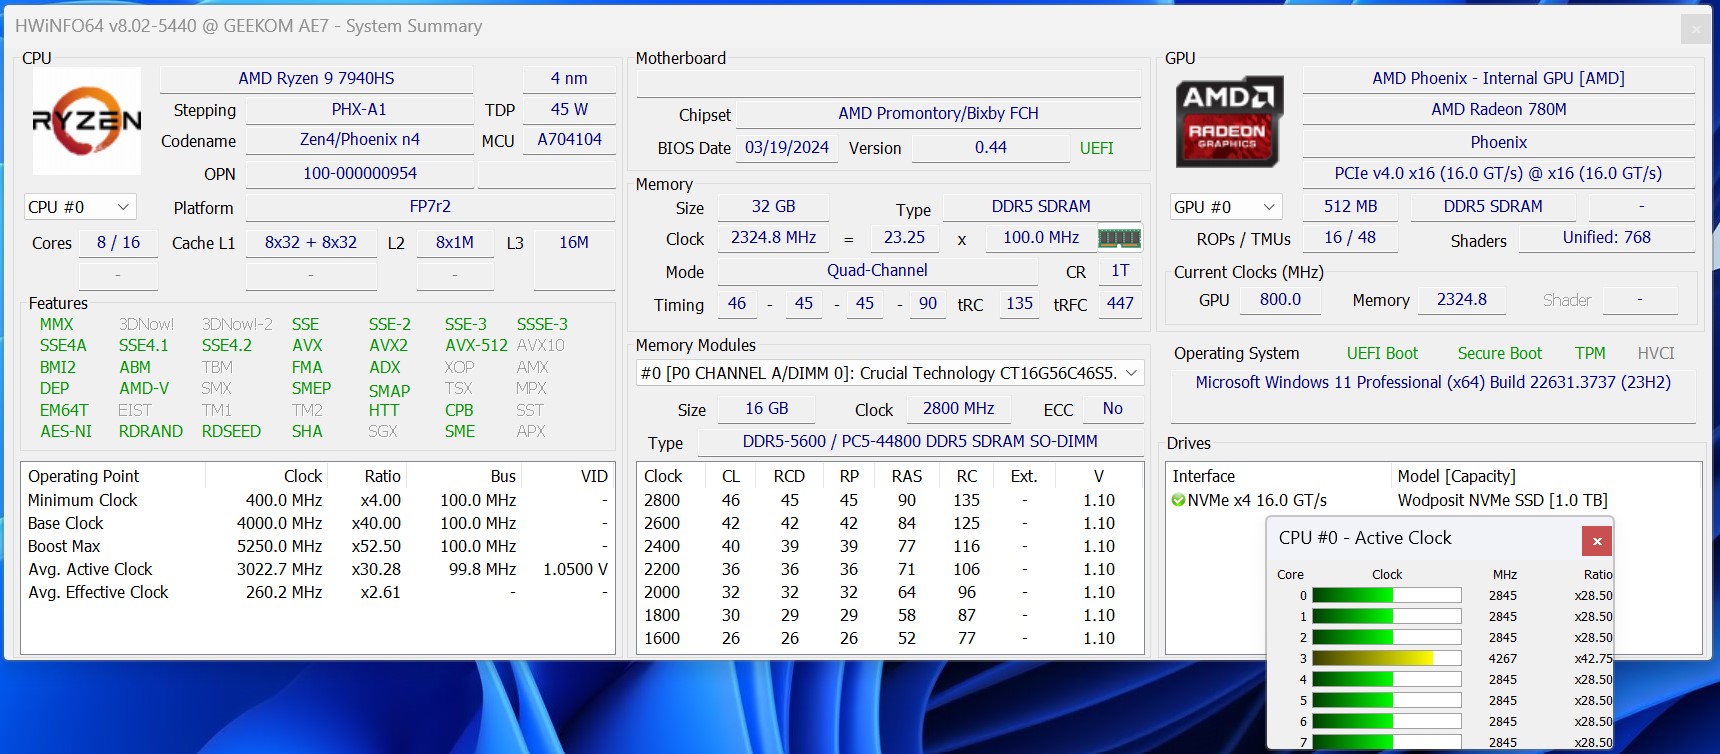
Geekom AE7 jest wyposażony w AMD Ryzen 9 7940HS. W przypadku modeli Ryzen 8000 mamy już do czynienia z następcą, ale jak zobaczymy w większości testów, Geekom AE7 nie musi ukrywać się z AMD Ryzen 9 7940HS, który oferuje nieco mniejszą wydajność AI. Pozostałe funkcje obejmują 32 GB pamięci RAM DDR5 i dysk SSD o pojemności 1 TB, co oznacza, że Geekom AE7 poradzi sobie również z codziennymi zadaniami wymagającymi dużej ilości pamięci.
Warunki testu
Wszystkie testy wydajności przeprowadziliśmy ze zrównoważonym
planem zasilania. Nie zmienialiśmy wydajności SoC i pozostawiliśmy go w stanie dostawy zgodnie z ustawieniami BIOS-u.
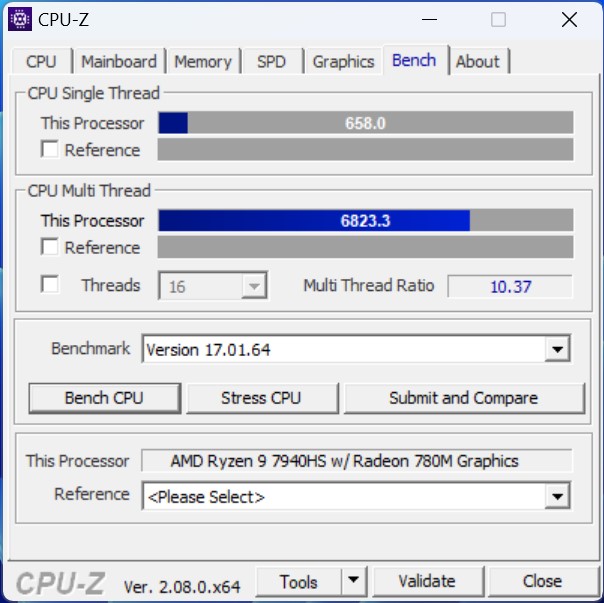
Procesor
AMD Ryzen 9 7940HS AMD Ryzen 9 7940HS nie należy jeszcze do przeszłości. Dzięki 8 rdzeniom Zen4, SoC może przetwarzać 16 wątków jednocześnie, a tym samym oferuje wyjątkową wydajność wielowątkową. W porównaniu do Geekom A5 odnotowaliśmy średni wzrost wydajności o 17 procent. W poszczególnych benchmarkach przewaga wynosi imponujące 50 procent, co po raz kolejny ilustruje wpływ, jaki może mieć nowsza architektura. Byliśmy również w stanie przetestować obecne procesory Intel Meteor Lake na niektórych urządzeniach. The Minisforum AtomMan X7 Ti wyposażony w procesor Intel Core Ultra 9 185H jest w stanie nadążyć. Geekom określa 65 watów jako krótkoterminowy limit mocy procesora w AE7. Pod ciągłym obciążeniem pobór mocy stopniowo spada do 45 watów, z czym system chłodzenia nadal może sobie poradzić.
W celu uzyskania dalszych porównań i testów porównawczych, proszę odnieść się do naszej Tabela porównawcza procesorów.
| Performance rating - Percent | |
| Geekom A8, R9 8945HS | |
| Geekom AE7 | |
| Geekom A7 | |
| Aoostar GEM12 | |
| Acemagic AM18 | |
| Minisforum AtomMan X7 Ti | |
| Acemagic F2A | |
| Geekom GT13 Pro | |
| Geekom A5 | |
| Cinebench R10 | |
| Rendering Single CPUs 64Bit | |
| Geekom A8, R9 8945HS | |
| Minisforum AtomMan X7 Ti | |
| Geekom A7 | |
| Geekom AE7 | |
| Aoostar GEM12 | |
| Acemagic AM18 | |
| Acemagic F2A | |
| Geekom GT13 Pro | |
| Geekom A5 | |
| Rendering Multiple CPUs 64Bit | |
| Acemagic F2A | |
| Geekom A8, R9 8945HS | |
| Minisforum AtomMan X7 Ti | |
| Geekom AE7 | |
| Aoostar GEM12 | |
| Geekom A7 | |
| Acemagic AM18 | |
| Geekom GT13 Pro | |
| Geekom A5 | |
| Blender - v2.79 BMW27 CPU | |
| Geekom A5 | |
| Geekom GT13 Pro | |
| Geekom A7 | |
| Acemagic AM18 | |
| Aoostar GEM12 | |
| Geekom AE7 | |
| Geekom A8, R9 8945HS | |
| Acemagic F2A | |
| Minisforum AtomMan X7 Ti | |
| WinRAR - Result | |
| Minisforum AtomMan X7 Ti | |
| Geekom A8, R9 8945HS | |
| Acemagic F2A | |
| Geekom AE7 | |
| Geekom A7 | |
| Aoostar GEM12 | |
| Geekom A5 | |
| Geekom GT13 Pro | |
| Acemagic AM18 | |
| 3DMark 11 - 1280x720 Performance Physics | |
| Geekom A8, R9 8945HS | |
| Acemagic AM18 | |
| Geekom A7 | |
| Geekom AE7 | |
| Minisforum AtomMan X7 Ti | |
| Aoostar GEM12 | |
| Acemagic F2A | |
| Geekom GT13 Pro | |
| Geekom A5 | |
| HWBOT x265 Benchmark v2.2 - 4k Preset | |
| Minisforum AtomMan X7 Ti | |
| Geekom A8, R9 8945HS | |
| Geekom AE7 | |
| Geekom A7 | |
| Acemagic AM18 | |
| Aoostar GEM12 | |
| Acemagic F2A | |
| Geekom GT13 Pro | |
| Geekom A5 | |
| R Benchmark 2.5 - Overall mean | |
| Geekom A5 | |
| Acemagic F2A | |
| Minisforum AtomMan X7 Ti | |
| Acemagic AM18 | |
| Geekom GT13 Pro | |
| Aoostar GEM12 | |
| Geekom A7 | |
| Geekom A8, R9 8945HS | |
| Geekom AE7 | |
| LibreOffice - 20 Documents To PDF | |
| Geekom A7 | |
| Geekom A5 | |
| Geekom AE7 | |
| Geekom A8, R9 8945HS | |
| Minisforum AtomMan X7 Ti | |
| Acemagic AM18 | |
| Aoostar GEM12 | |
| Acemagic F2A | |
| Geekom GT13 Pro | |
| WebXPRT 3 - Overall | |
| Geekom A7 | |
| Geekom AE7 | |
| Acemagic AM18 | |
| Geekom A8, R9 8945HS | |
| Geekom GT13 Pro | |
| Aoostar GEM12 | |
| Acemagic F2A | |
| Geekom A5 | |
| Minisforum AtomMan X7 Ti | |
| Mozilla Kraken 1.1 - Total | |
| Geekom A5 | |
| Acemagic F2A | |
| Minisforum AtomMan X7 Ti | |
| Acemagic AM18 | |
| Aoostar GEM12 | |
| Geekom GT13 Pro | |
| Geekom AE7 | |
| Geekom A8, R9 8945HS | |
| Geekom A7 | |
| Super Pi mod 1.5 XS 1M - 1M | |
| Geekom A5 | |
| Geekom GT13 Pro | |
| Geekom A7 | |
| Aoostar GEM12 | |
| Acemagic F2A | |
| Geekom AE7 | |
| Acemagic AM18 | |
| Geekom A8, R9 8945HS | |
| Minisforum AtomMan X7 Ti | |
| Super Pi mod 1.5 XS 2M - 2M | |
| Geekom A5 | |
| Geekom A7 | |
| Aoostar GEM12 | |
| Geekom AE7 | |
| Acemagic AM18 | |
| Geekom A8, R9 8945HS | |
| Geekom GT13 Pro | |
| Acemagic F2A | |
| Minisforum AtomMan X7 Ti | |
| Super Pi Mod 1.5 XS 32M - 32M | |
| Aoostar GEM12 | |
| Acemagic AM18 | |
| Geekom AE7 | |
| Geekom A8, R9 8945HS | |
| Geekom A7 | |
| Geekom A5 | |
| Geekom GT13 Pro | |
| Acemagic F2A | |
| Minisforum AtomMan X7 Ti | |
* ... im mniej tym lepiej
AIDA64: FP32 Ray-Trace | FPU Julia | CPU SHA3 | CPU Queen | FPU SinJulia | FPU Mandel | CPU AES | CPU ZLib | FP64 Ray-Trace | CPU PhotoWorxx
| Performance rating | |
| Geekom A8, R9 8945HS | |
| Geekom AE7 | |
| Acemagic AM18 | |
| Aoostar GEM12 | |
| Średnia w klasie Mini PC | |
| Minisforum AtomMan X7 Ti | |
| Acemagic F2A | |
| Geekom A5 | |
| Geekom GT13 Pro | |
| AIDA64 / FP32 Ray-Trace | |
| Geekom A8, R9 8945HS | |
| Geekom AE7 | |
| Aoostar GEM12 | |
| Acemagic AM18 | |
| Średnia w klasie Mini PC (974 - 82725, n=112, ostatnie 2 lata) | |
| Acemagic F2A | |
| Minisforum AtomMan X7 Ti | |
| Geekom A5 | |
| Geekom GT13 Pro | |
| AIDA64 / FPU Julia | |
| Geekom A8, R9 8945HS | |
| Geekom AE7 | |
| Aoostar GEM12 | |
| Acemagic AM18 | |
| Średnia w klasie Mini PC (6115 - 363782, n=112, ostatnie 2 lata) | |
| Minisforum AtomMan X7 Ti | |
| Acemagic F2A | |
| Geekom A5 | |
| Geekom GT13 Pro | |
| AIDA64 / CPU SHA3 | |
| Geekom A8, R9 8945HS | |
| Geekom AE7 | |
| Acemagic AM18 | |
| Aoostar GEM12 | |
| Minisforum AtomMan X7 Ti | |
| Acemagic F2A | |
| Średnia w klasie Mini PC (385 - 9475, n=112, ostatnie 2 lata) | |
| Geekom GT13 Pro | |
| Geekom A5 | |
| AIDA64 / CPU Queen | |
| Geekom A8, R9 8945HS | |
| Geekom AE7 | |
| Aoostar GEM12 | |
| Acemagic AM18 | |
| Geekom GT13 Pro | |
| Średnia w klasie Mini PC (20501 - 184747, n=103, ostatnie 2 lata) | |
| Geekom A5 | |
| Acemagic F2A | |
| Minisforum AtomMan X7 Ti | |
| AIDA64 / FPU SinJulia | |
| Geekom A8, R9 8945HS | |
| Geekom AE7 | |
| Aoostar GEM12 | |
| Acemagic AM18 | |
| Średnia w klasie Mini PC (1019 - 31931, n=112, ostatnie 2 lata) | |
| Geekom A5 | |
| Minisforum AtomMan X7 Ti | |
| Acemagic F2A | |
| Geekom GT13 Pro | |
| AIDA64 / FPU Mandel | |
| Geekom A8, R9 8945HS | |
| Geekom AE7 | |
| Aoostar GEM12 | |
| Acemagic AM18 | |
| Średnia w klasie Mini PC (3322 - 192994, n=112, ostatnie 2 lata) | |
| Acemagic F2A | |
| Minisforum AtomMan X7 Ti | |
| Geekom A5 | |
| Geekom GT13 Pro | |
| AIDA64 / CPU AES | |
| Geekom A8, R9 8945HS | |
| Geekom AE7 | |
| Acemagic AM18 | |
| Minisforum AtomMan X7 Ti | |
| Acemagic F2A | |
| Geekom A5 | |
| Geekom GT13 Pro | |
| Średnia w klasie Mini PC (9214 - 325960, n=111, ostatnie 2 lata) | |
| Aoostar GEM12 | |
| AIDA64 / CPU ZLib | |
| Minisforum AtomMan X7 Ti | |
| Acemagic F2A | |
| Średnia w klasie Mini PC (127.2 - 2431, n=112, ostatnie 2 lata) | |
| Aoostar GEM12 | |
| Acemagic AM18 | |
| Geekom A8, R9 8945HS | |
| Geekom AE7 | |
| Geekom GT13 Pro | |
| Geekom A5 | |
| AIDA64 / FP64 Ray-Trace | |
| Geekom A8, R9 8945HS | |
| Geekom AE7 | |
| Aoostar GEM12 | |
| Acemagic AM18 | |
| Średnia w klasie Mini PC (537 - 43587, n=112, ostatnie 2 lata) | |
| Acemagic F2A | |
| Minisforum AtomMan X7 Ti | |
| Geekom A5 | |
| Geekom GT13 Pro | |
| AIDA64 / CPU PhotoWorxx | |
| Minisforum AtomMan X7 Ti | |
| Geekom AE7 | |
| Acemagic AM18 | |
| Geekom A8, R9 8945HS | |
| Aoostar GEM12 | |
| Średnia w klasie Mini PC (8069 - 96843, n=112, ostatnie 2 lata) | |
| Acemagic F2A | |
| Geekom GT13 Pro | |
| Geekom A5 | |
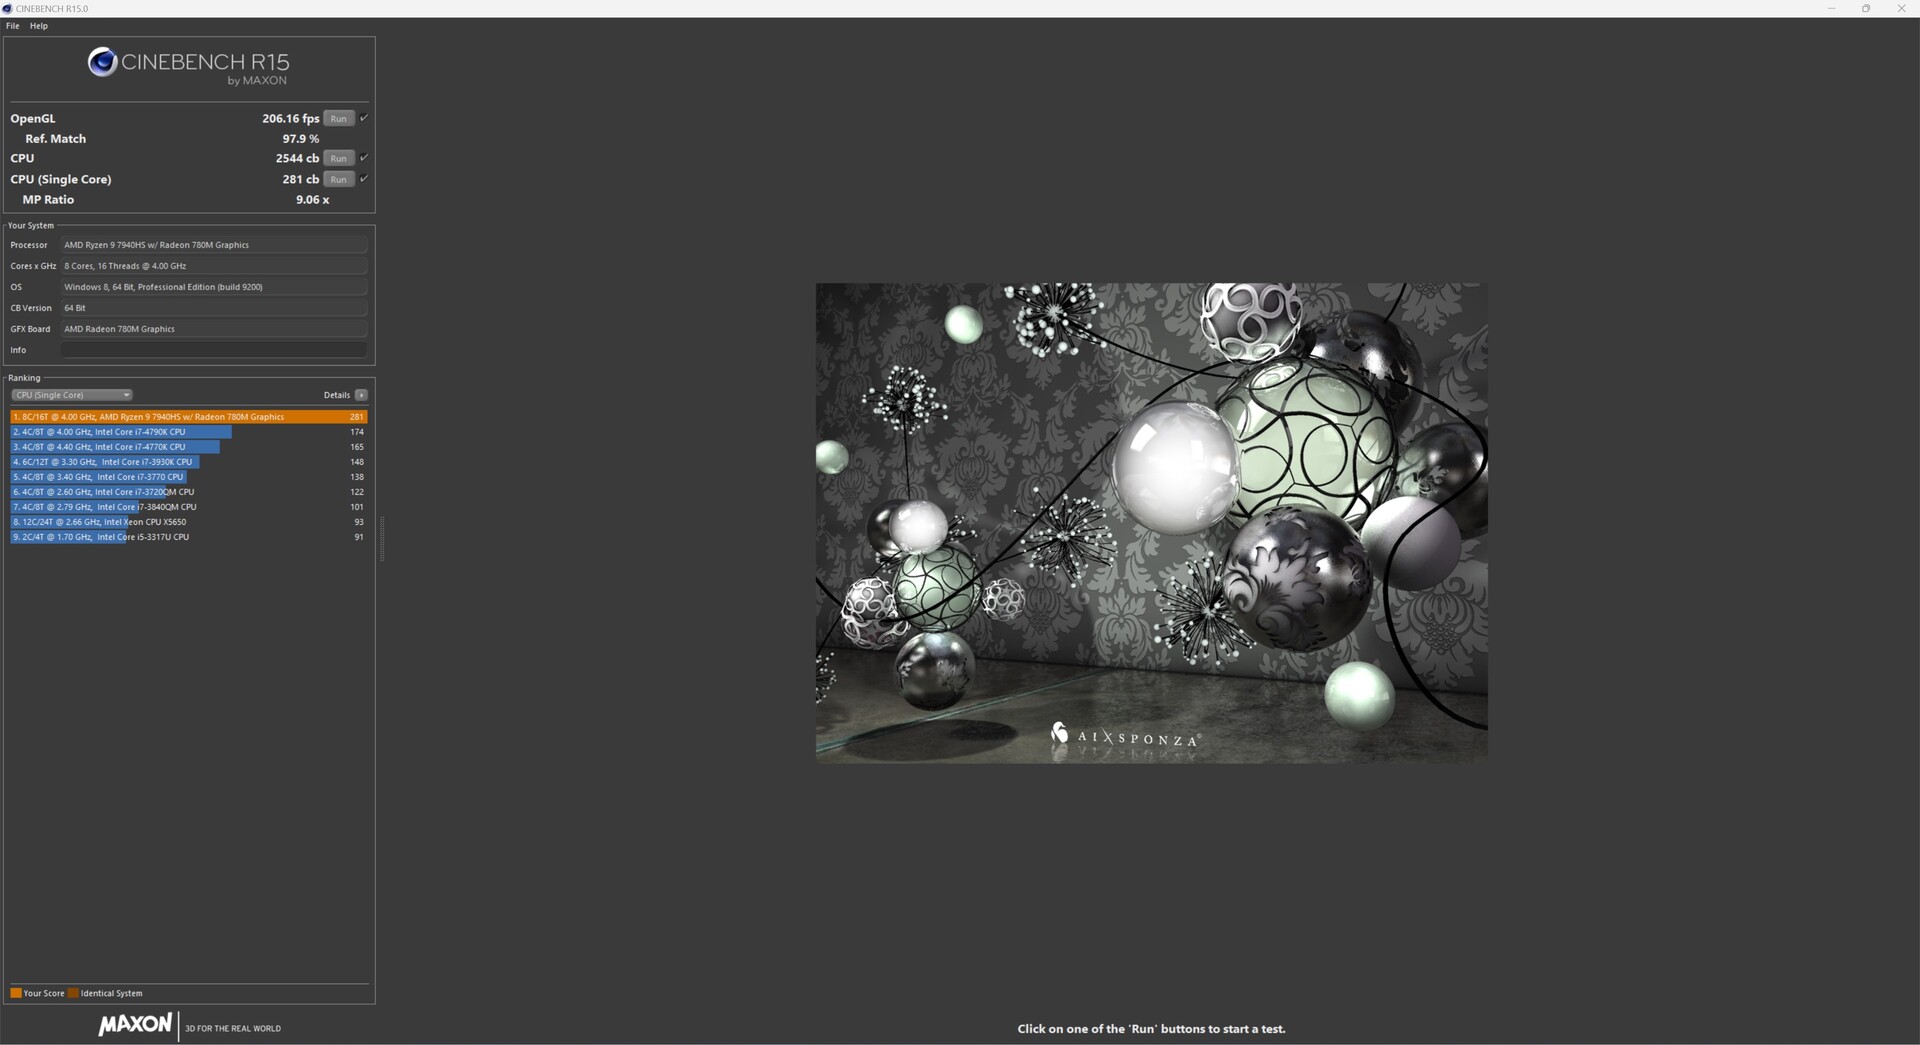
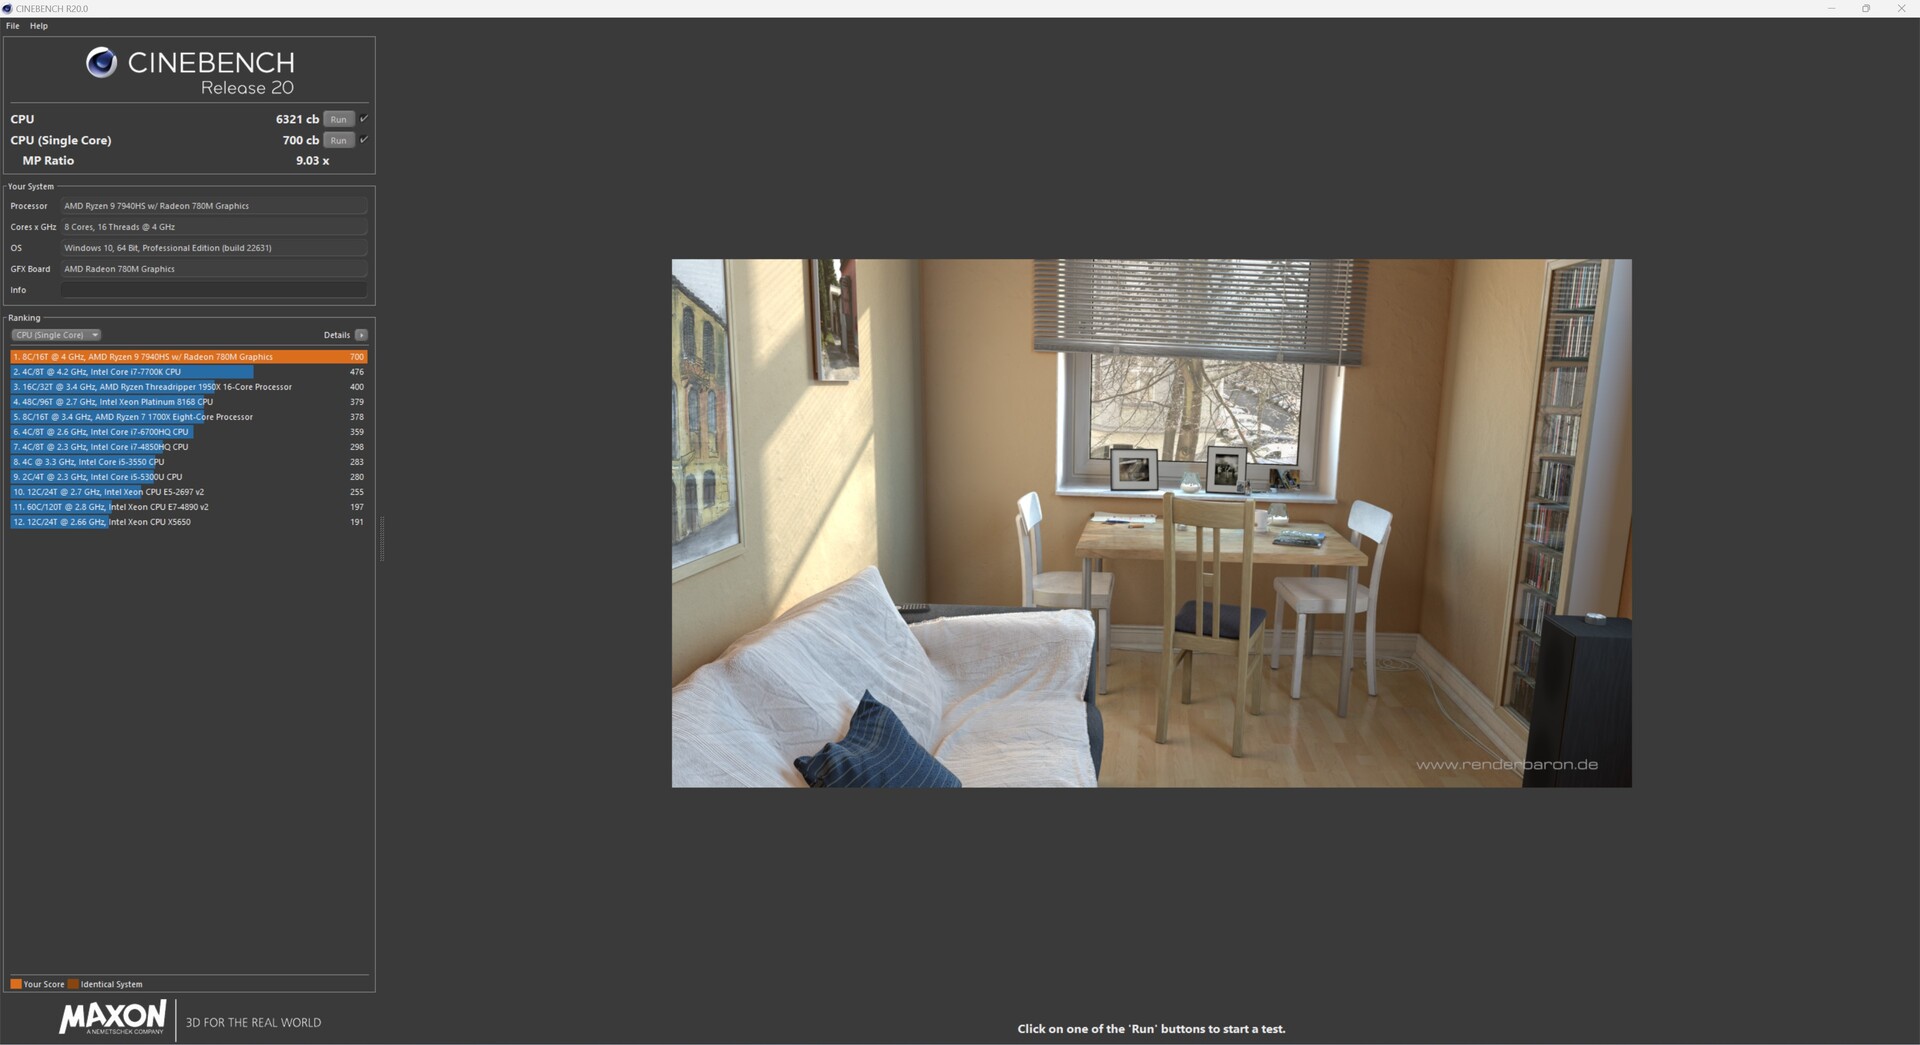
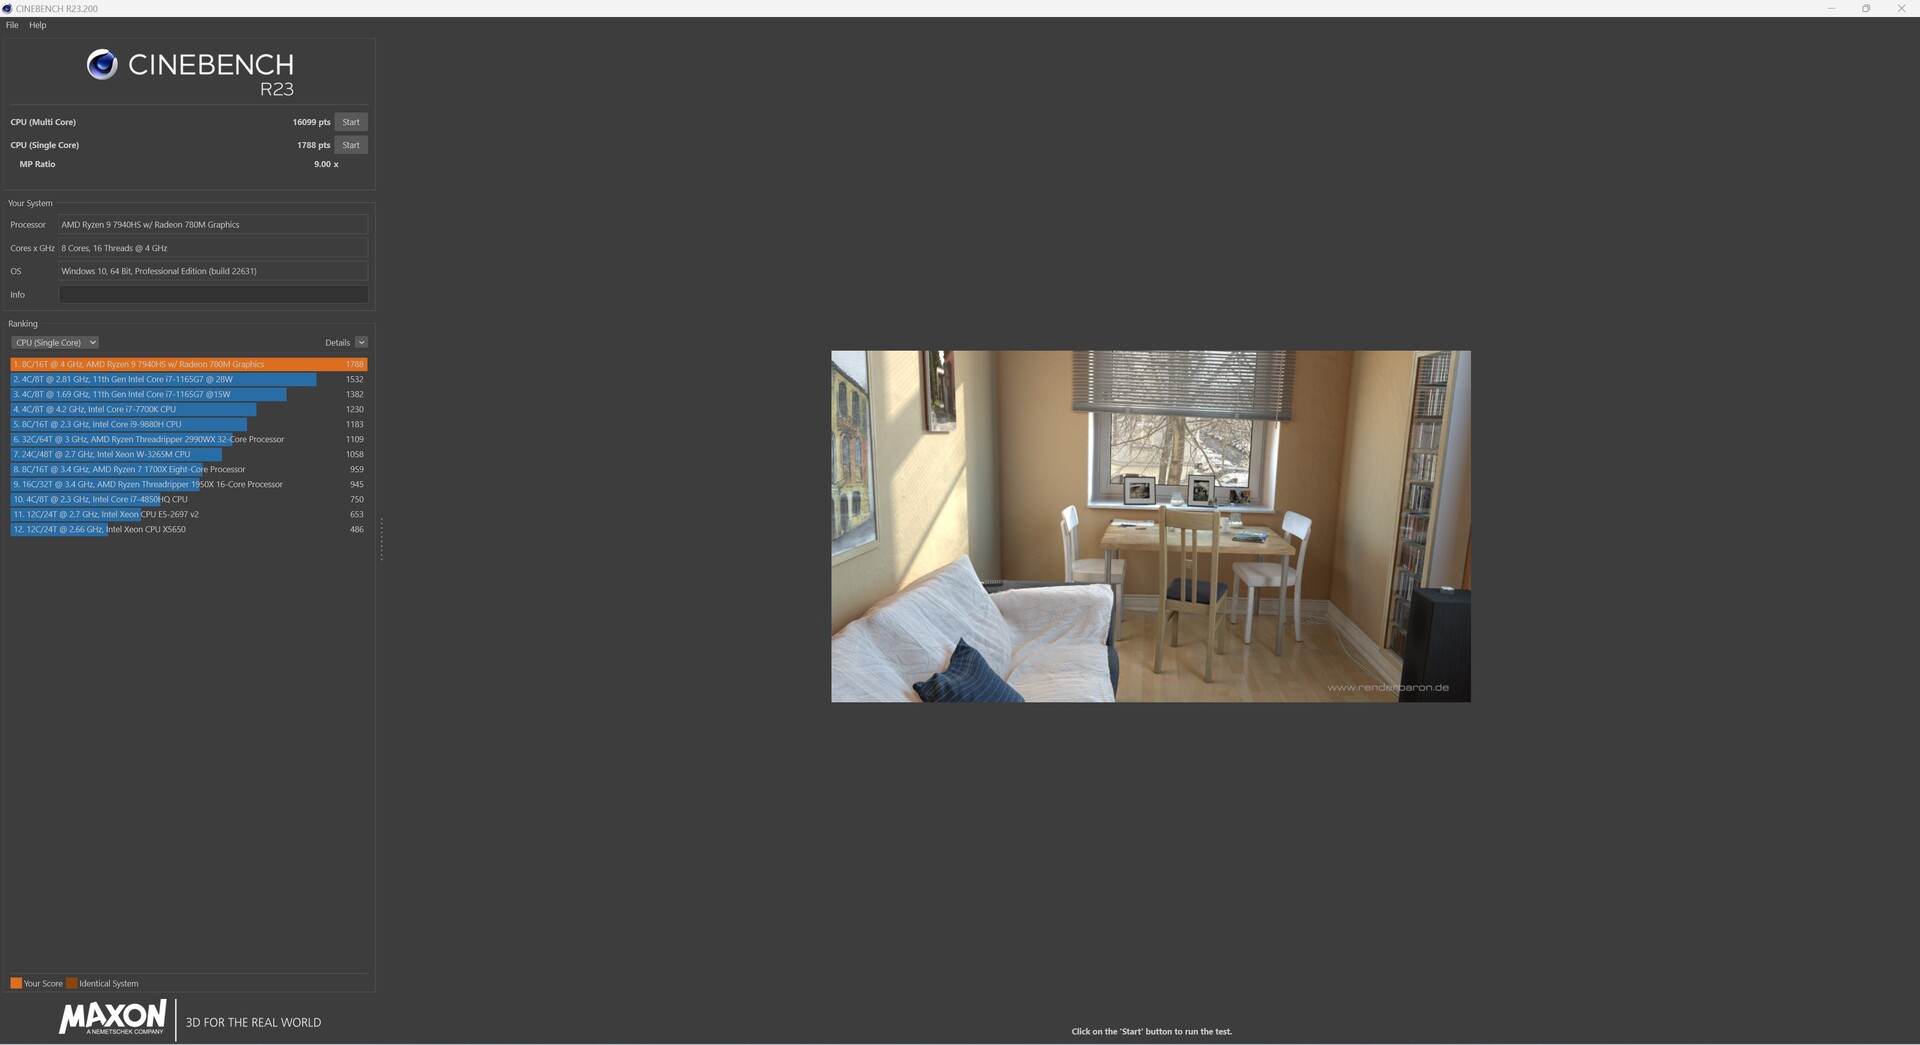
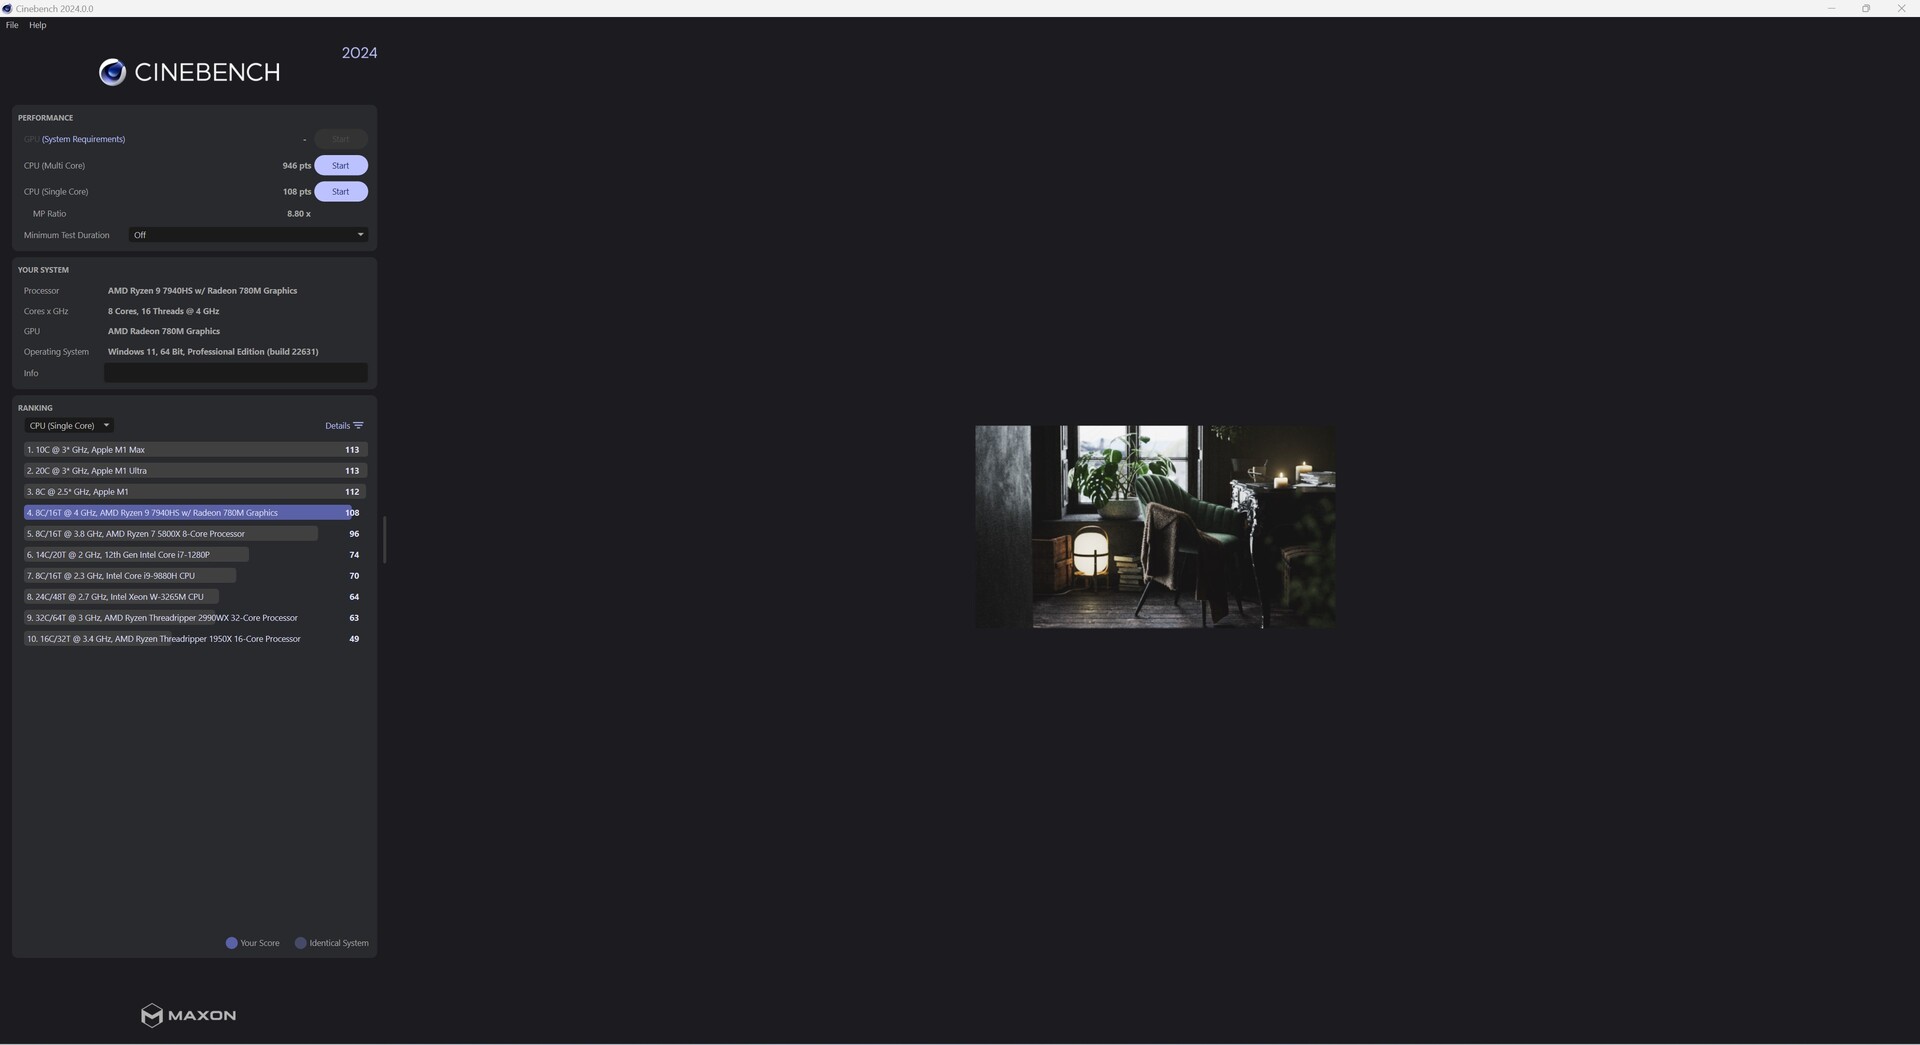
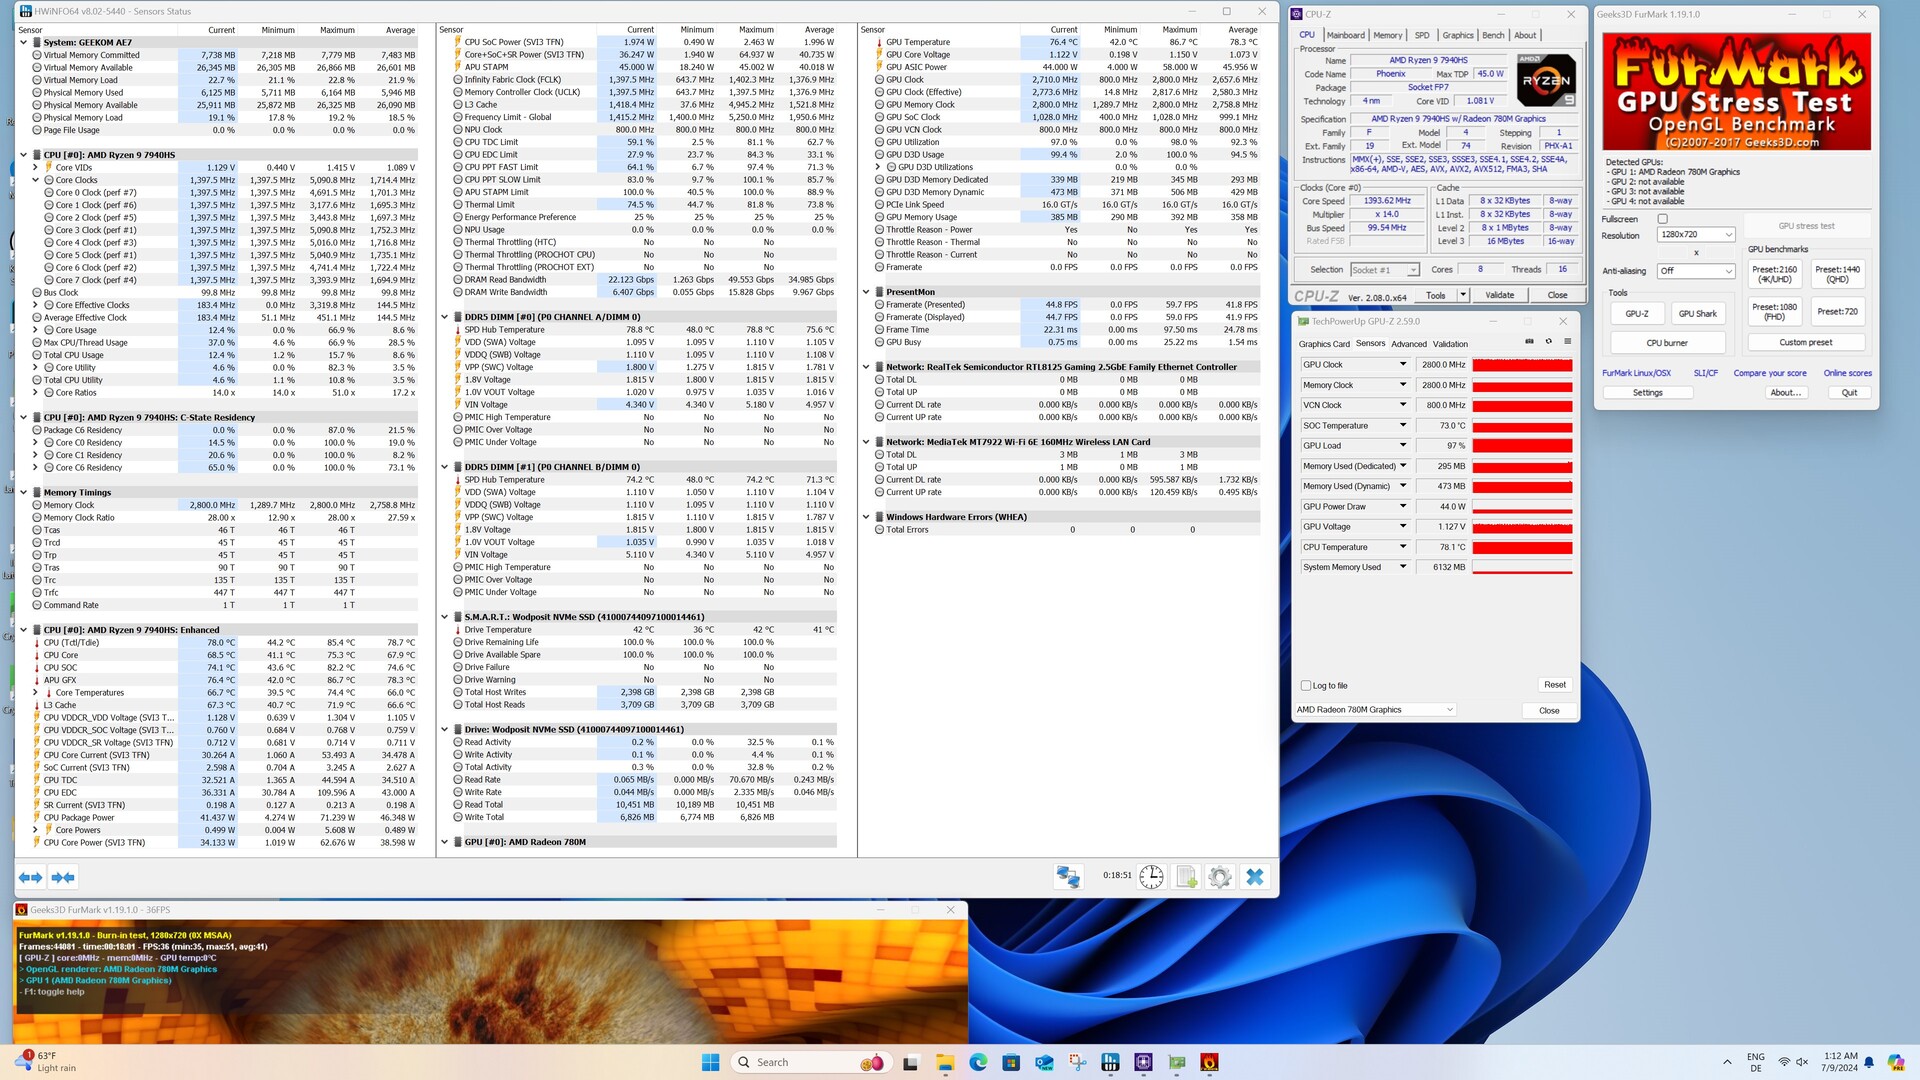
Cinebench R15 Multi loop
Na pierwszy rzut oka Geekom AE7 całkiem dobrze radzi sobie z ciągłą pętlą Cinebench R15. Bliższe spojrzenie na dane telemetryczne ujawnia, że temperatura procesora osiąga limit już podczas pierwszego uruchomienia. W rezultacie spadek wydajności nie jest bardzo wysoki w dalszym przebiegu. Niemniej jednak, z wynikiem 2563 punktów, AMD Ryzen 9 7940HS nadal zapewnia bardzo solidny wynik.

Wydajność systemu
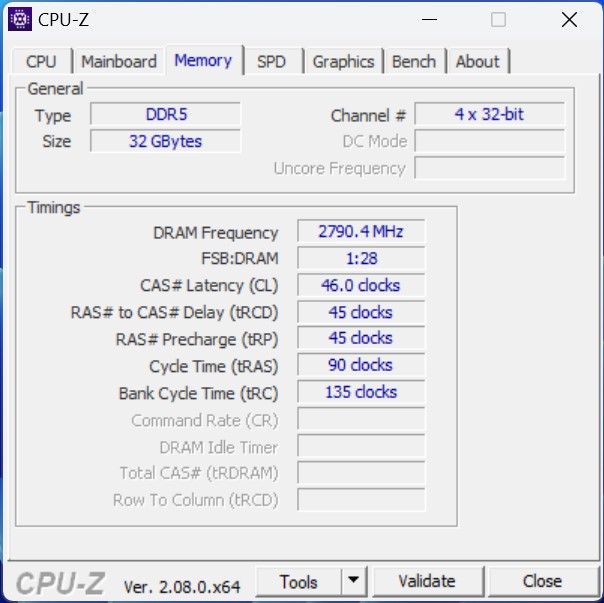
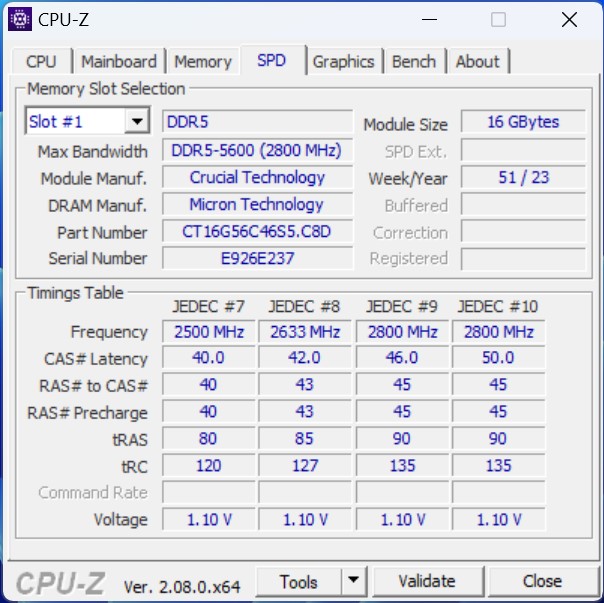
Nie ma co krytykować wydajności systemu Geekom AE7. Wszystkie nasze programy testowe były otwierane szybko i bez zauważalnych opóźnień. Zasadniczo dotyczy to wszystkich urządzeń porównawczych, które towarzyszą nam w tym teście. Ze względu na wysoką wydajność procesora, podczas normalnej codziennej pracy biurowej rzadko osiągną Państwo limity sprzętu. Geekom polega na 32 GB pamięci RAM DDR5 o prędkości 5600 MT/s dla zainstalowanej pamięci RAM. Dzięki temu system osiąga również dobre wyniki w naszych testach AIDA64. Tylko Minisforum AtomMan X7 Ti może się nieco wyróżnić.
| AIDA64 / Memory Copy | |
| Minisforum AtomMan X7 Ti | |
| Geekom A8, R9 8945HS | |
| Geekom AE7 | |
| Acemagic AM18 | |
| Aoostar GEM12 | |
| Średnia w klasie Mini PC (15933 - 163031, n=112, ostatnie 2 lata) | |
| Acemagic F2A | |
| Geekom GT13 Pro | |
| Geekom A5 | |
| AIDA64 / Memory Read | |
| Minisforum AtomMan X7 Ti | |
| Acemagic F2A | |
| Średnia w klasie Mini PC (14143 - 123769, n=112, ostatnie 2 lata) | |
| Geekom AE7 | |
| Geekom A8, R9 8945HS | |
| Acemagic AM18 | |
| Aoostar GEM12 | |
| Geekom A5 | |
| Geekom GT13 Pro | |
| AIDA64 / Memory Write | |
| Geekom AE7 | |
| Geekom A8, R9 8945HS | |
| Aoostar GEM12 | |
| Acemagic AM18 | |
| Średnia w klasie Mini PC (10630 - 216693, n=112, ostatnie 2 lata) | |
| Minisforum AtomMan X7 Ti | |
| Acemagic F2A | |
| Geekom A5 | |
| Geekom GT13 Pro | |
| AIDA64 / Memory Latency | |
| Acemagic F2A | |
| Minisforum AtomMan X7 Ti | |
| Średnia w klasie Mini PC (0 - 184.8, n=113, ostatnie 2 lata) | |
| Geekom A8, R9 8945HS | |
| Geekom AE7 | |
| Aoostar GEM12 | |
| Acemagic AM18 | |
| Geekom A5 | |
| Geekom GT13 Pro | |
* ... im mniej tym lepiej
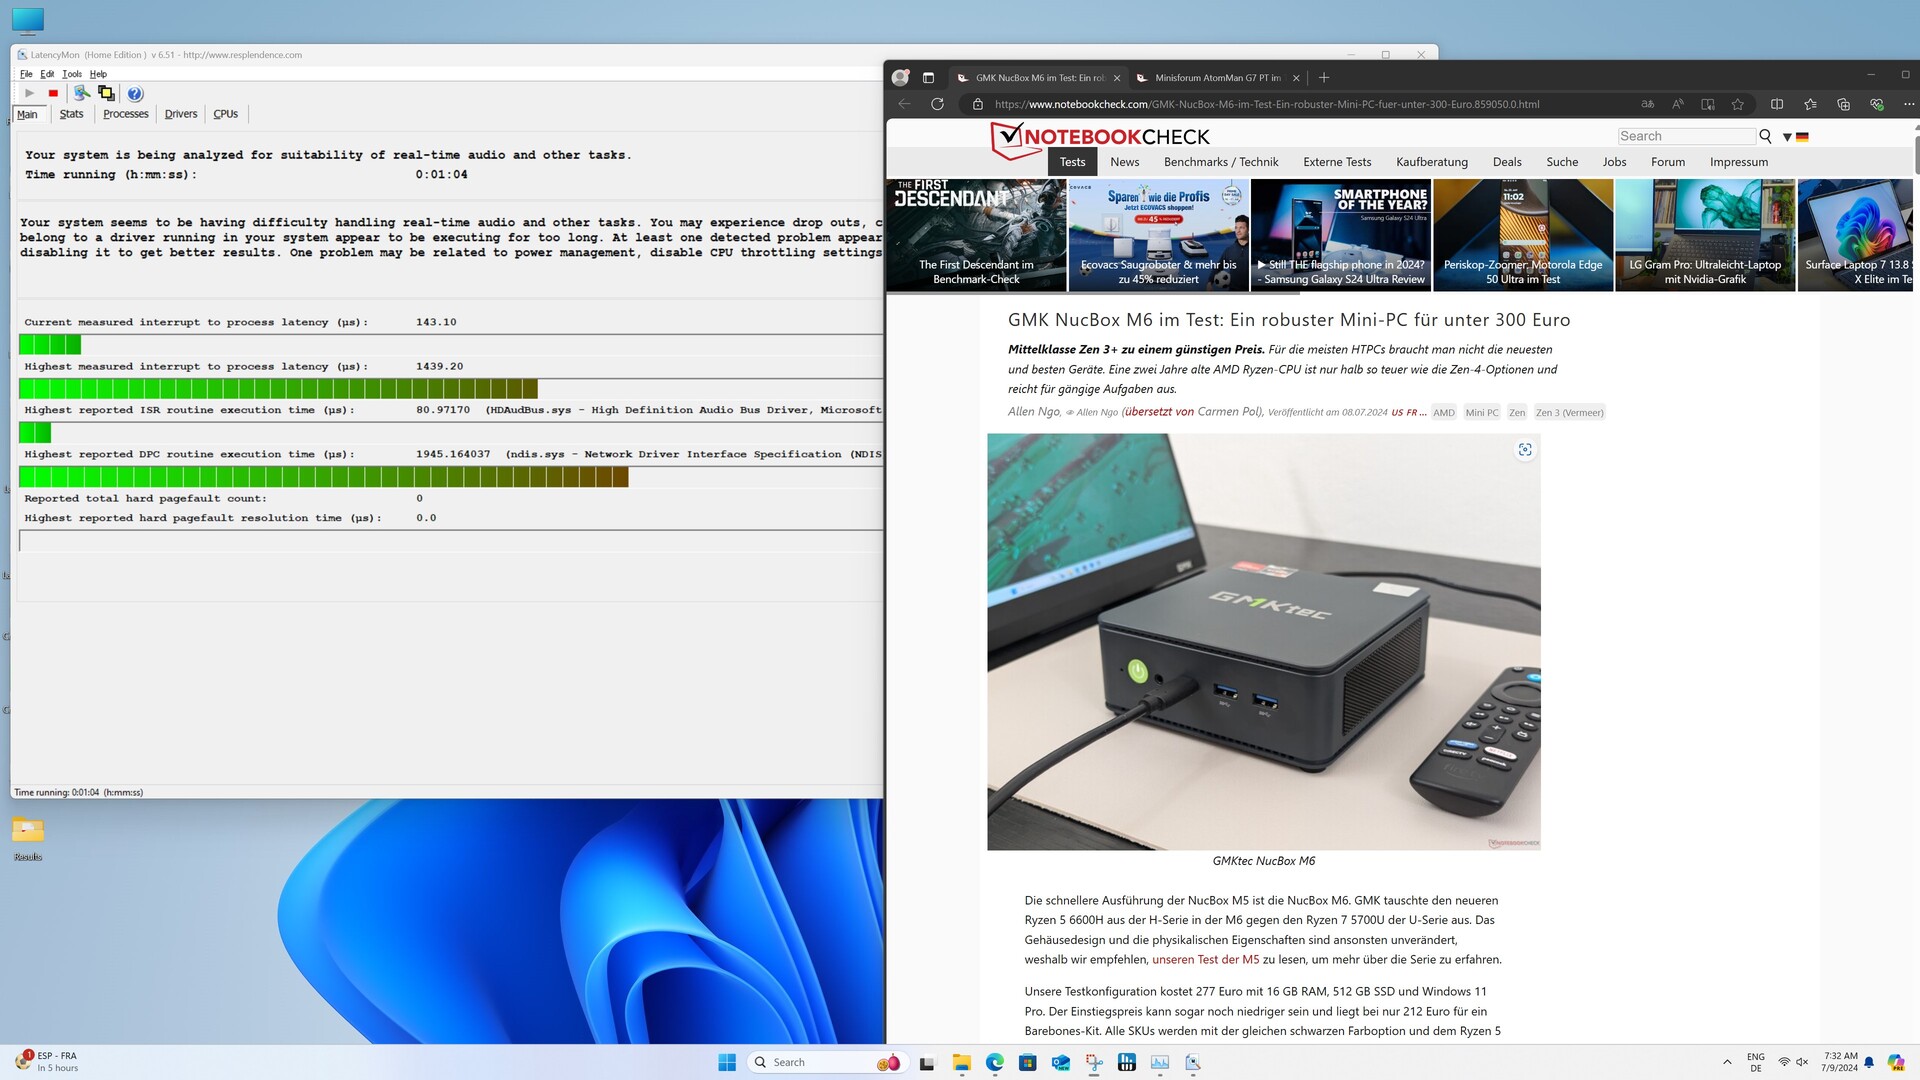
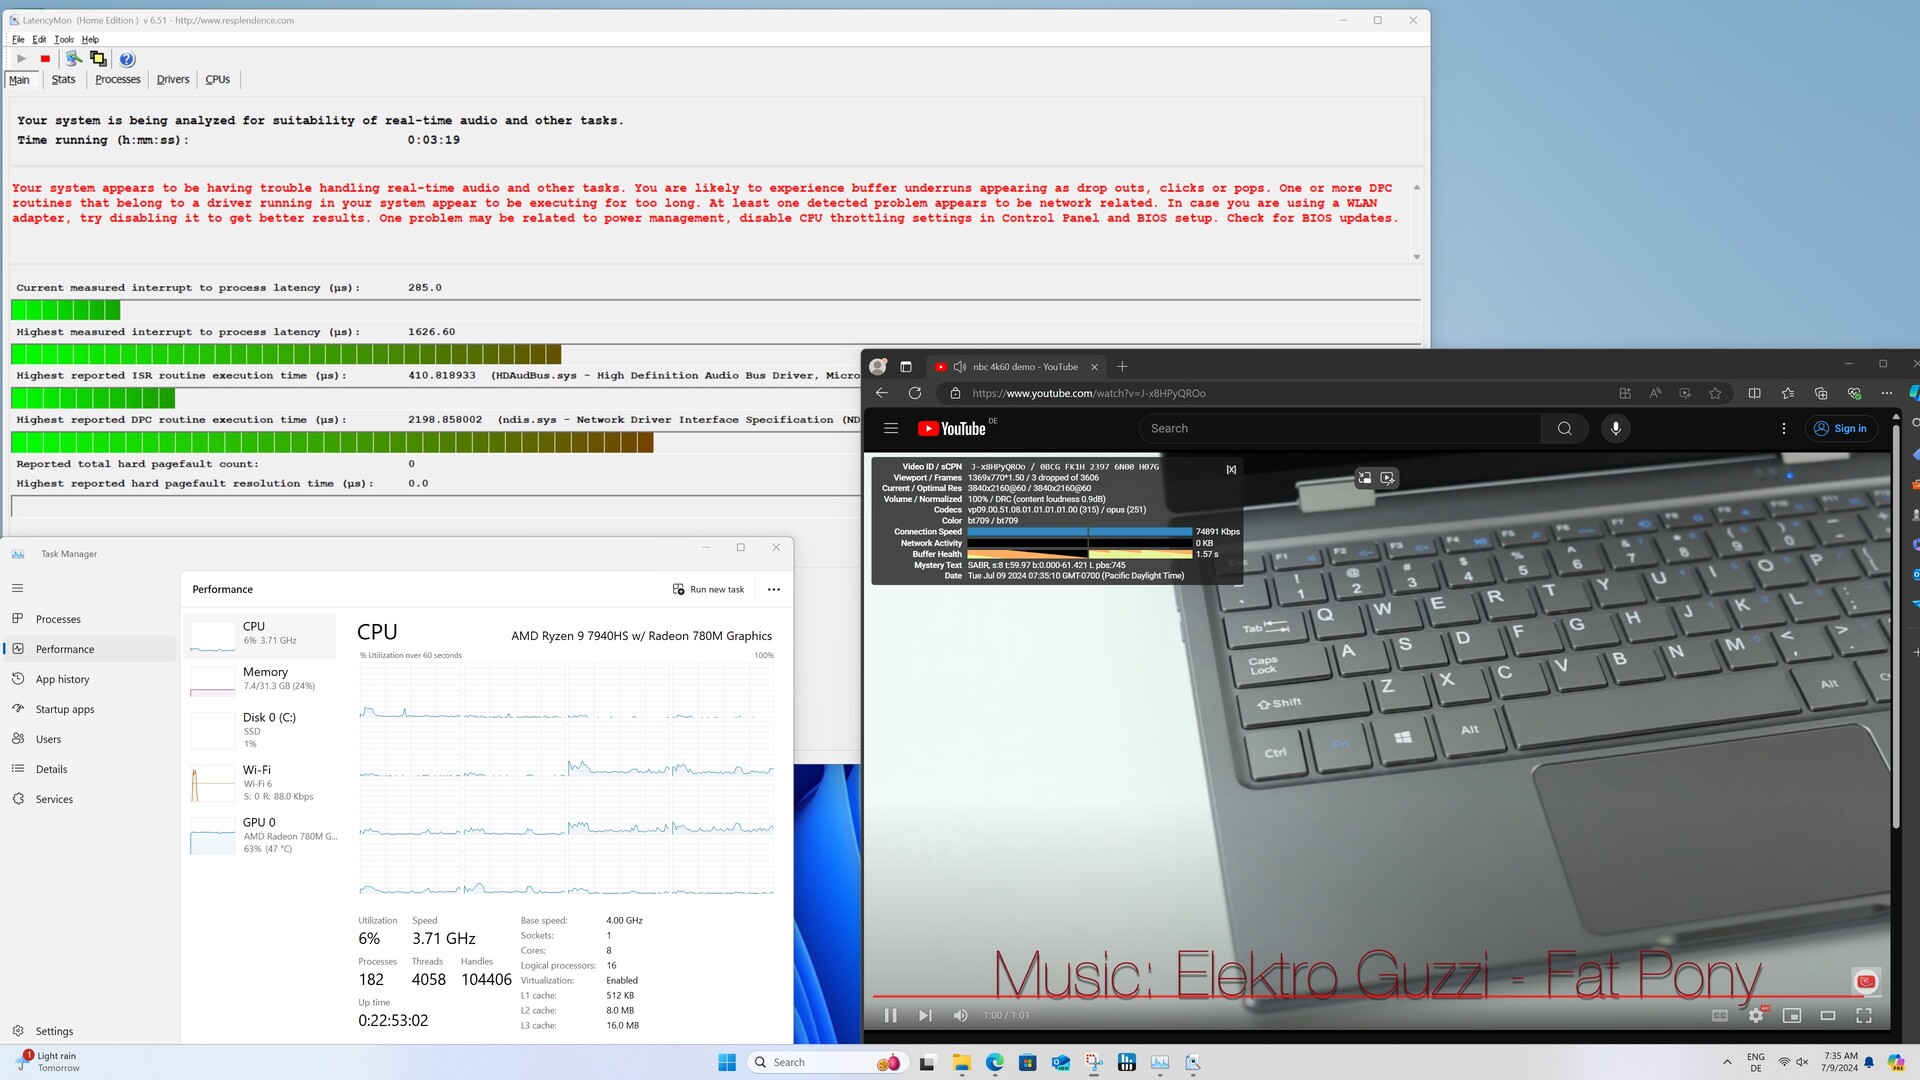
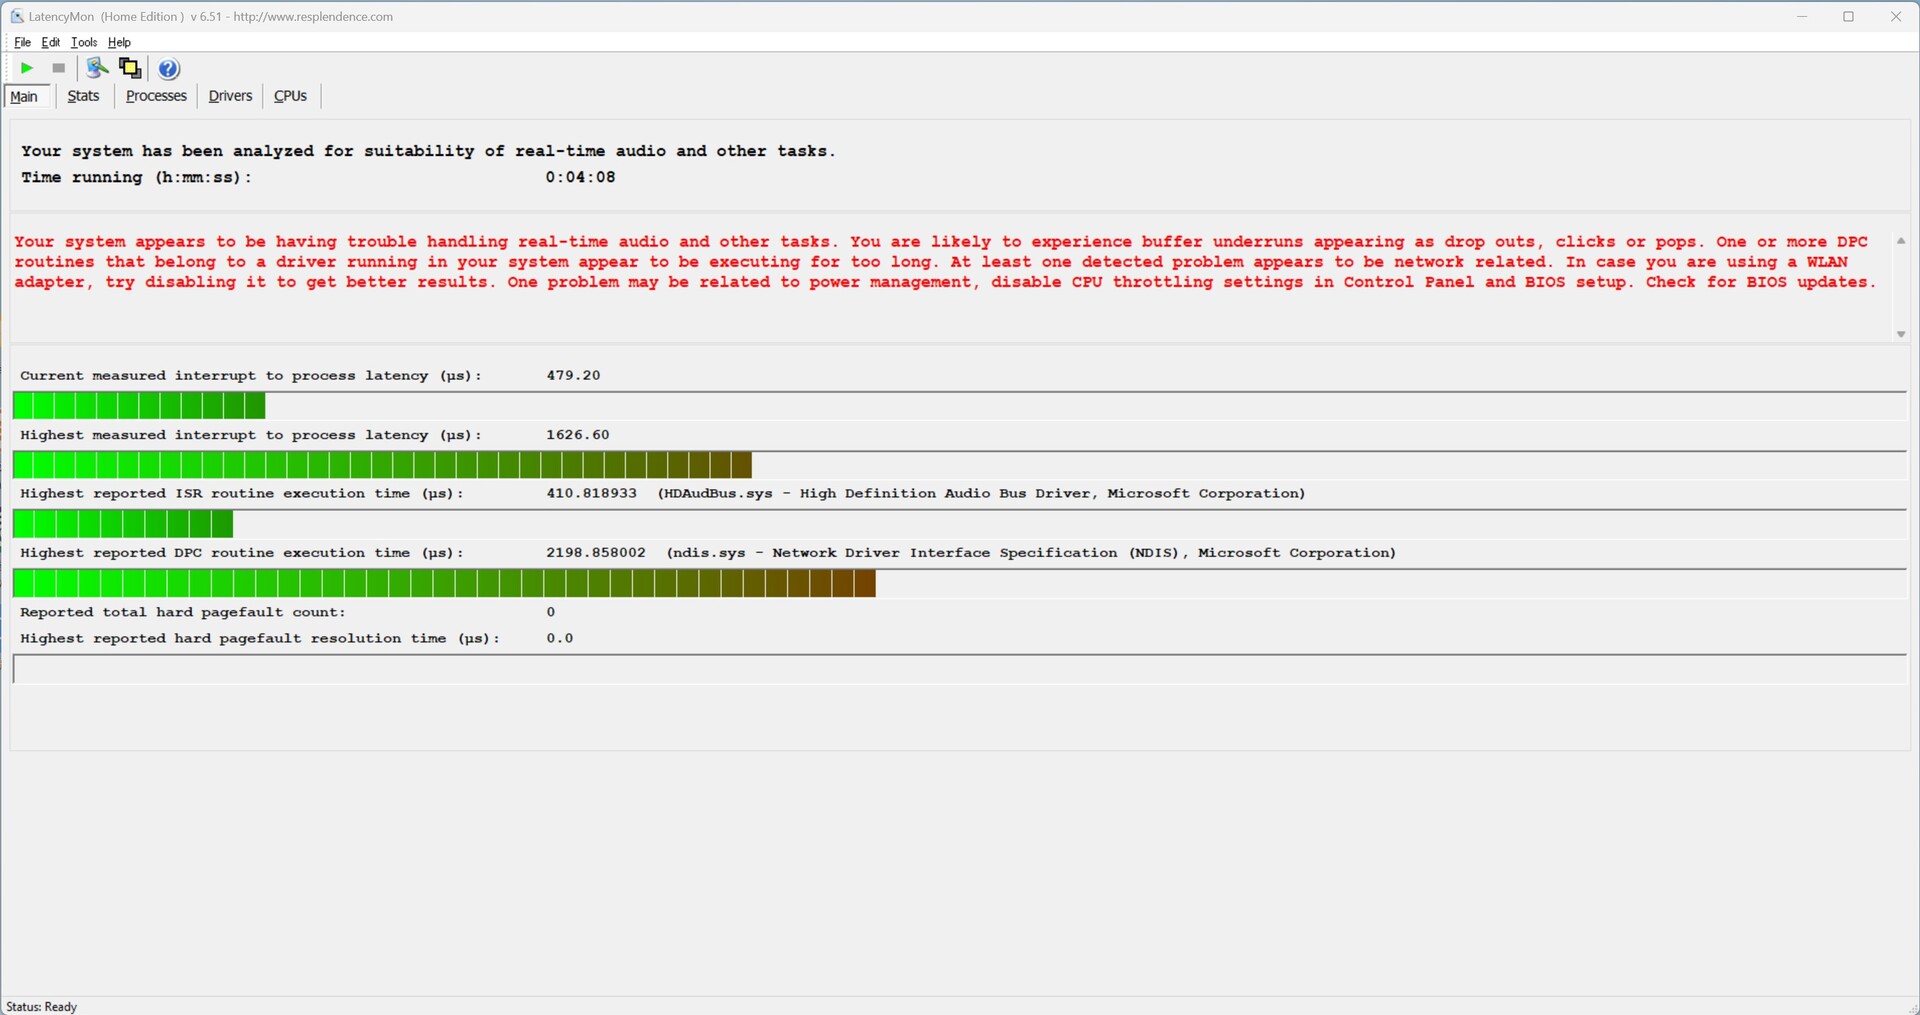
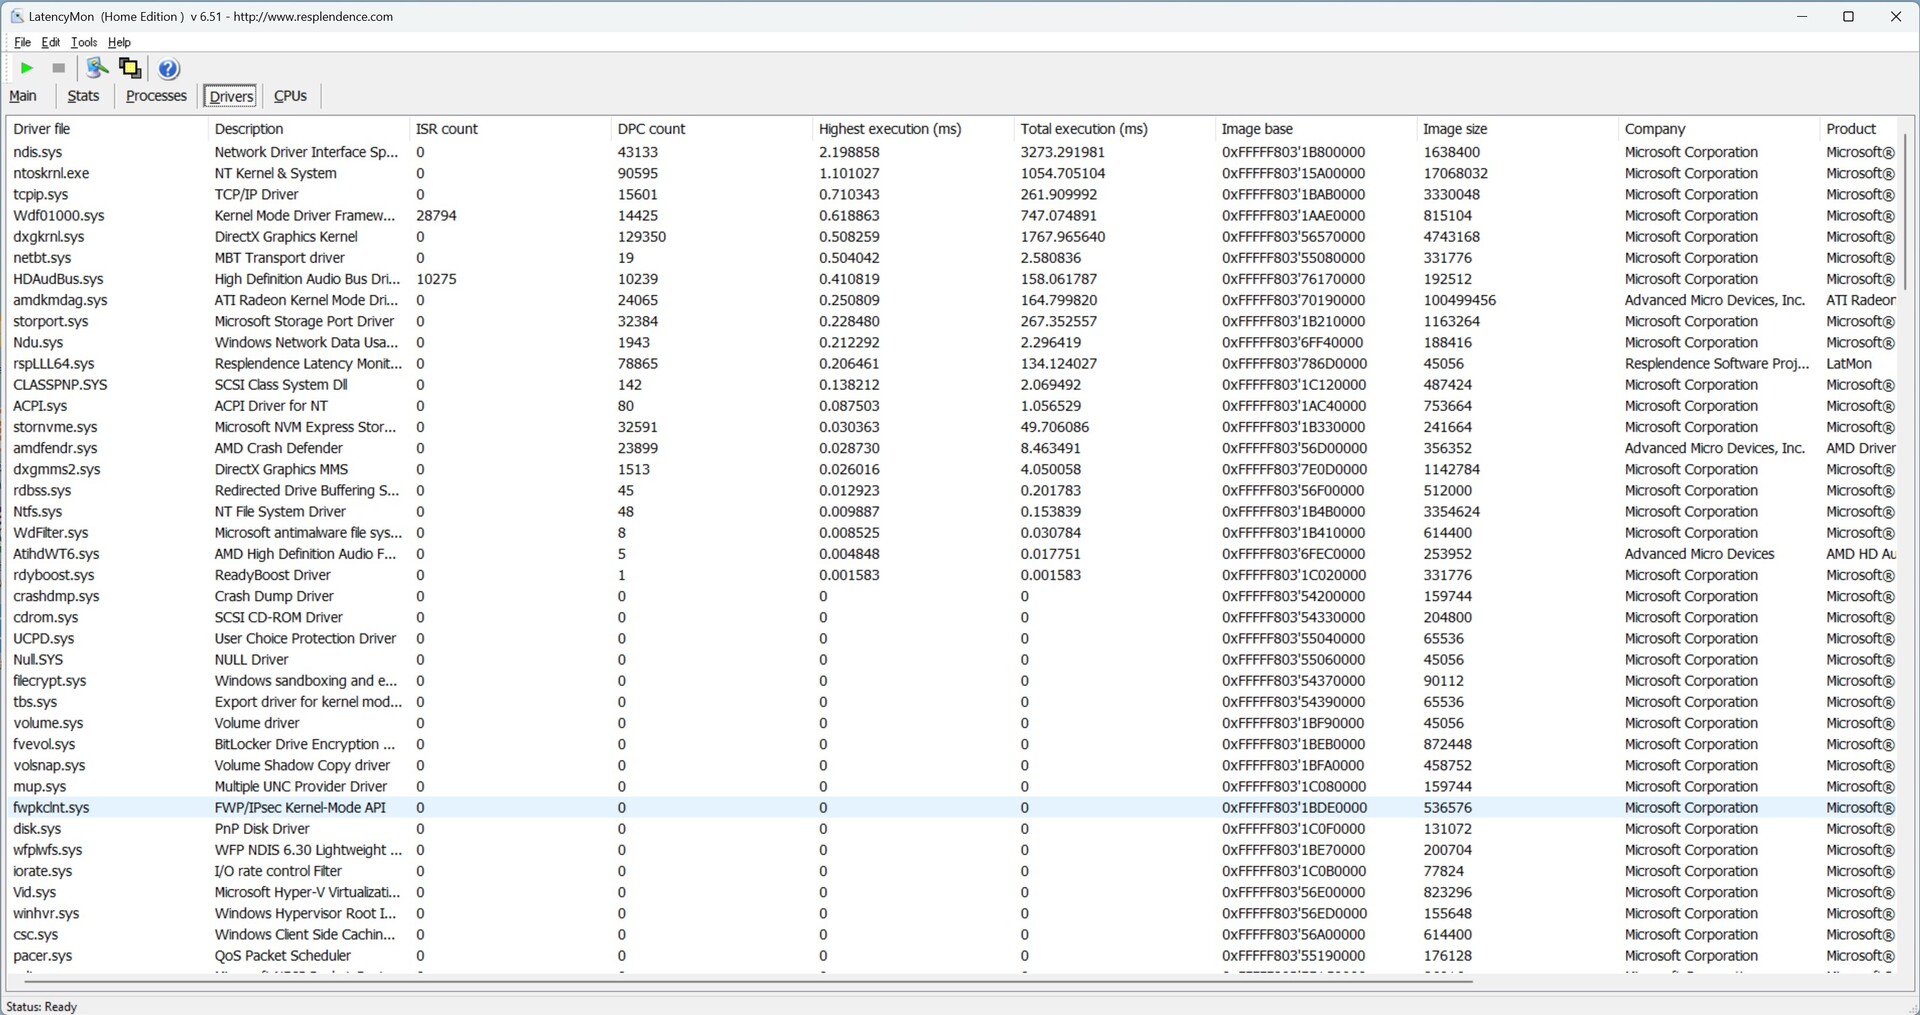
Opóźnienia DPC
Geekom AE7 nie jest przekonujący w naszych pomiarach opóźnień DPC. Podczas zwykłego surfowania po Internecie widzimy już znacznie wyższe wartości, które ponownie wzrastają podczas odtwarzania naszego testowego wideo 4K.
| DPC Latencies / LatencyMon - interrupt to process latency (max), Web, Youtube, Prime95 | |
| Acemagic F2A | |
| Geekom AE7 | |
| Geekom A8, R9 8945HS | |
| Minisforum AtomMan X7 Ti | |
| Geekom GT13 Pro | |
| Geekom A5 | |
| Aoostar GEM12 | |
| Acemagic AM18 | |
* ... im mniej tym lepiej
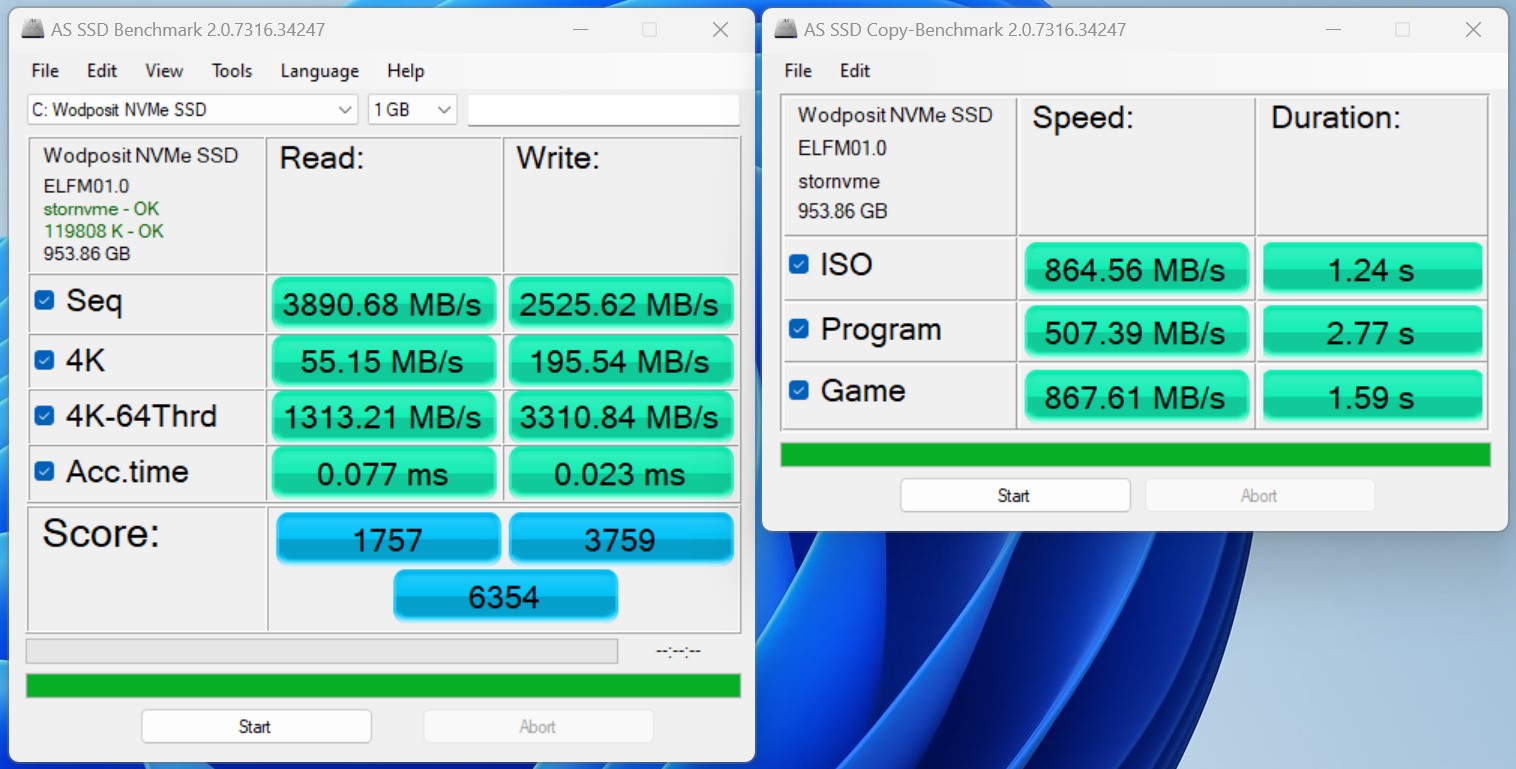
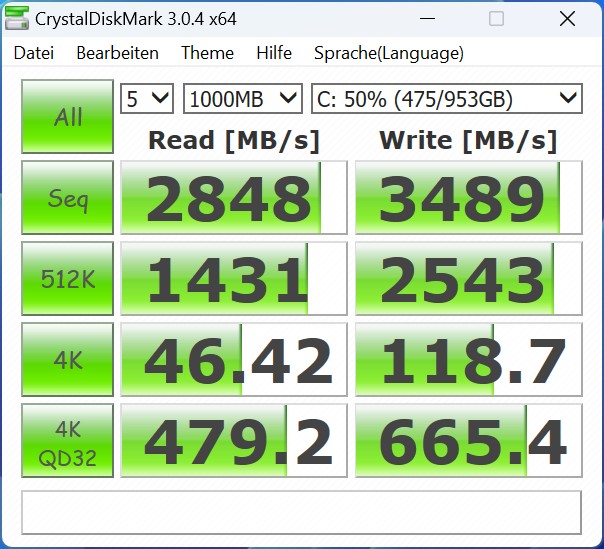
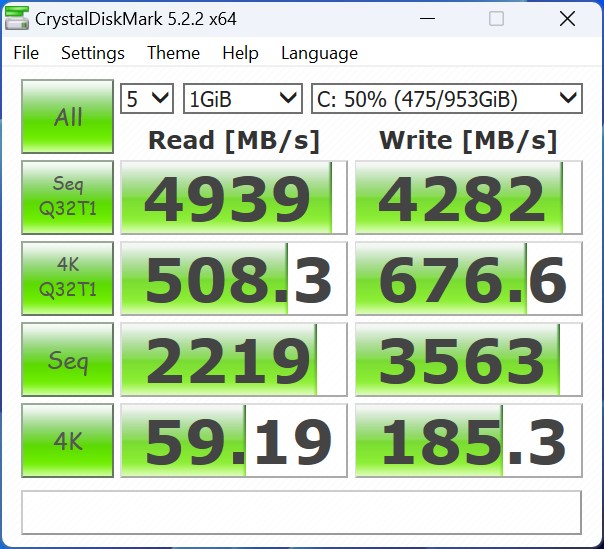
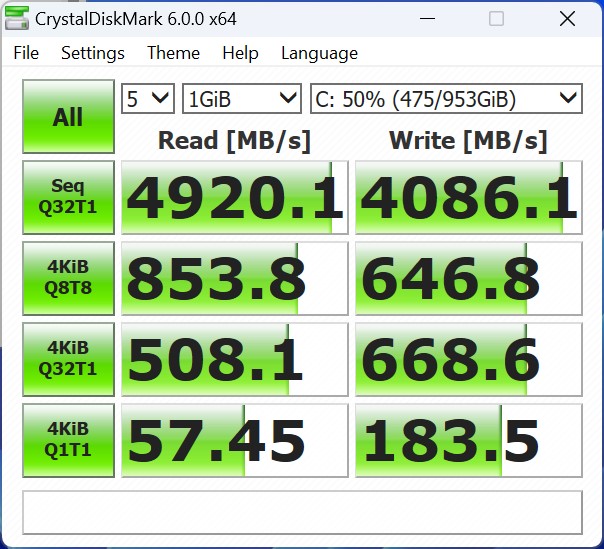
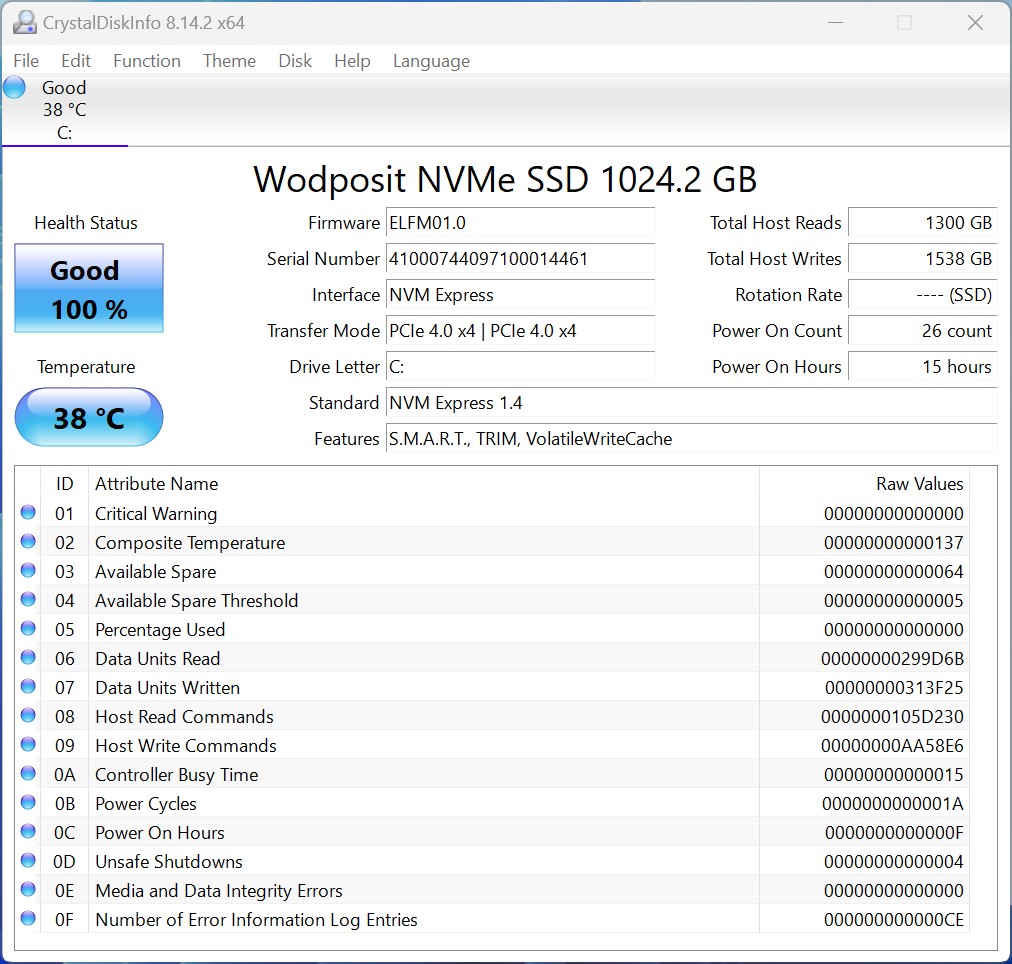
Pamięć masowa
Geekom AE7 zawiera dysk SSD Wodposit o pojemności 1 TB. Dysk SSD działa z prędkością PCIe 4.0 x4 i zapewnia dobre prędkości transferu w naszych testach. Wydajność Acer N7000 i Crucial P3 Plus dwóch szybszych modeli nie może się równać z SSD z naszej próbki testowej. Dzięki dobremu chłodzeniu, Geekom zapewnia stałą wydajność pamięci masowej w AE7 pod obciążeniem. Płyta bazowa służy do odprowadzania ciepła z dysku SSD. Ważne jest jednak, aby wiedzieć, że w Geekom AE7 można zainstalować tylko jedno urządzenie pamięci masowej.
W celu uzyskania dalszych porównań i testów porównawczych, proszę odnieść się do naszej Tabela porównawcza.

| Drive Performance rating - Percent | |
| Aoostar GEM12 | |
| Geekom GT13 Pro | |
| Geekom AE7 | |
| Minisforum AtomMan X7 Ti | |
| Średnia w klasie Mini PC | |
| Geekom A8, R9 8945HS | |
| Geekom A5 | |
| Acemagic F2A | |
| Acemagic AM18 | |
* ... im mniej tym lepiej
Continuous read: DiskSpd Read Loop, Queue Depth 8
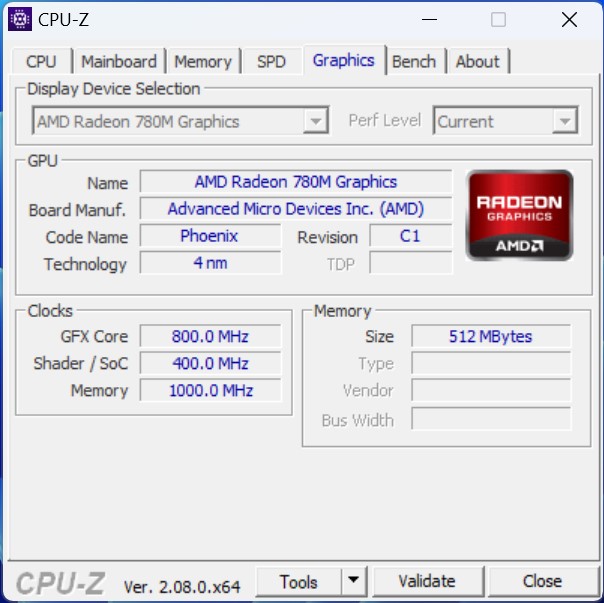
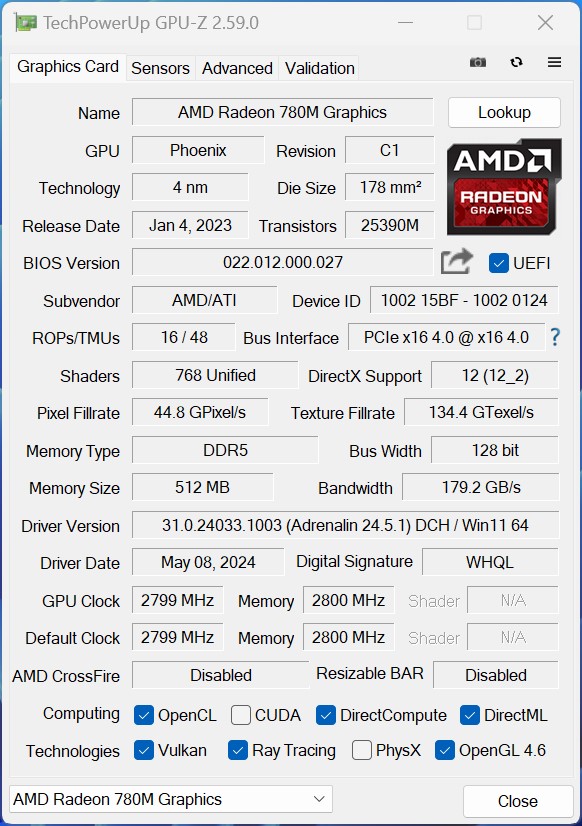
Karta graficzna - AMD Radeon 780M o dobrej wydajności
AMD zmieniło iGPU w procesorach Ryzen 7000. Karta graficzna AMD Radeon 780M jest obecnie jednym z najlepszych iGPU. Jednak jego wydajność w dużym stopniu zależy od wartości TDP APU. Jak już widzieliśmy, SoC może konsekwentnie działać przy 45 watów. W porównaniu wydajności wystarczy to do osiągnięcia doskonałego wyniku w benchmarkach 3DMark. Minisforum AtomMan X7 Ti z iGPU Intel Arc8 pokazuje, że Intel był w stanie nadrobić zaległości w tej dziedzinie. Niemniej jednak nasze urządzenie testowe było w stanie uzyskać przewagę 7 punktów procentowych.
Dalsze porównania i testy porównawcze można znaleźć w naszej Tabeli porównawczej GPU.
| 3DMark Performance rating - Percent | |
| Geekom AE7 | |
| Acemagic AM18 | |
| Geekom A8, R9 8945HS | |
| Aoostar GEM12 | |
| Acemagic F2A | |
| Minisforum AtomMan X7 Ti | |
| Geekom GT13 Pro | |
| Geekom A5 | |
| 3DMark 11 - 1280x720 Performance GPU | |
| Geekom AE7 | |
| Acemagic AM18 | |
| Geekom A8, R9 8945HS | |
| Aoostar GEM12 | |
| Acemagic F2A | |
| Minisforum AtomMan X7 Ti | |
| Geekom GT13 Pro | |
| Geekom A5 | |
| 3DMark | |
| 2560x1440 Time Spy Graphics | |
| Acemagic F2A | |
| Minisforum AtomMan X7 Ti | |
| Geekom AE7 | |
| Acemagic AM18 | |
| Geekom A8, R9 8945HS | |
| Aoostar GEM12 | |
| Geekom GT13 Pro | |
| Geekom A5 | |
| 1920x1080 Fire Strike Graphics | |
| Geekom AE7 | |
| Geekom A8, R9 8945HS | |
| Acemagic AM18 | |
| Aoostar GEM12 | |
| Acemagic F2A | |
| Minisforum AtomMan X7 Ti | |
| Geekom GT13 Pro | |
| Geekom A5 | |
| Unigine Heaven 4.0 | |
| Extreme Preset OpenGL | |
| Aoostar GEM12 | |
| Acemagic AM18 | |
| Geekom AE7 | |
| Acemagic F2A | |
| Minisforum AtomMan X7 Ti | |
| Geekom A8, R9 8945HS | |
| Geekom GT13 Pro | |
| Geekom A5 | |
| Extreme Preset DX11 | |
| Aoostar GEM12 | |
| Geekom AE7 | |
| Acemagic AM18 | |
| Minisforum AtomMan X7 Ti | |
| Geekom A8, R9 8945HS | |
| Acemagic F2A | |
| Geekom GT13 Pro | |
| Geekom A5 | |
| Unigine Valley 1.0 | |
| 1920x1080 Extreme HD DirectX AA:x8 | |
| Aoostar GEM12 | |
| Geekom AE7 | |
| Acemagic AM18 | |
| Geekom A8, R9 8945HS | |
| Minisforum AtomMan X7 Ti | |
| Acemagic F2A | |
| Geekom GT13 Pro | |
| Geekom A5 | |
| 1920x1080 Extreme HD Preset OpenGL AA:x8 | |
| Minisforum AtomMan X7 Ti | |
| Aoostar GEM12 | |
| Acemagic AM18 | |
| Geekom AE7 | |
| Acemagic F2A | |
| Geekom GT13 Pro | |
| Geekom A8, R9 8945HS | |
| Geekom A5 | |
| ComputeMark v2.1 | |
| 1024x600 Normal, Score | |
| Acemagic AM18 | |
| Geekom AE7 | |
| Aoostar GEM12 | |
| Geekom A8, R9 8945HS | |
| Acemagic F2A | |
| Minisforum AtomMan X7 Ti | |
| Geekom A5 | |
| Geekom GT13 Pro | |
| 1024x600 Normal, Fluid 3DTex | |
| Geekom A8, R9 8945HS | |
| Aoostar GEM12 | |
| Geekom AE7 | |
| Acemagic AM18 | |
| Minisforum AtomMan X7 Ti | |
| Acemagic F2A | |
| Geekom A5 | |
| Geekom GT13 Pro | |
| 1024x600 Normal, Fluid 2DTexArr | |
| Geekom A8, R9 8945HS | |
| Acemagic AM18 | |
| Geekom AE7 | |
| Aoostar GEM12 | |
| Minisforum AtomMan X7 Ti | |
| Acemagic F2A | |
| Geekom GT13 Pro | |
| Geekom A5 | |
| 1024x600 Normal, Mandel Vector | |
| Acemagic AM18 | |
| Geekom AE7 | |
| Aoostar GEM12 | |
| Geekom A8, R9 8945HS | |
| Acemagic F2A | |
| Minisforum AtomMan X7 Ti | |
| Geekom A5 | |
| Geekom GT13 Pro | |
| 1024x600 Normal, Mandel Scalar | |
| Acemagic AM18 | |
| Geekom AE7 | |
| Aoostar GEM12 | |
| Geekom A8, R9 8945HS | |
| Acemagic F2A | |
| Minisforum AtomMan X7 Ti | |
| Geekom A5 | |
| Geekom GT13 Pro | |
| 1024x600 Normal, QJuliaRayTrace | |
| Acemagic AM18 | |
| Geekom AE7 | |
| Aoostar GEM12 | |
| Geekom A8, R9 8945HS | |
| Acemagic F2A | |
| Minisforum AtomMan X7 Ti | |
| Geekom GT13 Pro | |
| Geekom A5 | |
| Affinity Photo 2 - Combined (Single / Multi GPU) | |
| Minisforum AtomMan X7 Ti | |
| Acemagic F2A | |
| Geekom GT13 Pro | |
| Geekom AE7 | |
| Aoostar GEM12 | |
| Geekom A5 | |
| Geekom A8, R9 8945HS | |
| Acemagic AM18 | |
| Premiere Pro PugetBench - GPU 0.9 | |
| Acemagic F2A | |
| Geekom AE7 | |
| Aoostar GEM12 | |
| Geekom A8, R9 8945HS | |
| Acemagic AM18 | |
| Geekom GT13 Pro | |
| Geekom A5 | |
| Minisforum AtomMan X7 Ti | |
| Photoshop PugetBench - GPU Score | |
| Geekom AE7 | |
| Geekom A8, R9 8945HS | |
| Acemagic AM18 | |
| Aoostar GEM12 | |
| Acemagic F2A | |
| Geekom A5 | |
| Minisforum AtomMan X7 Ti | |
| Geekom GT13 Pro | |
| DaVinci Resolve PugetBench - GPU Effects 0.93 | |
| Aoostar GEM12 | |
| Geekom AE7 | |
| Minisforum AtomMan X7 Ti | |
| Acemagic F2A | |
| Geekom GT13 Pro | |
| Geekom A5 | |
| Geekom AE7, AMD Radeon 780M R9 7940HS | Aoostar GEM12, AMD Radeon 780M R7 8845HS | Geekom GT13 Pro, Intel Iris Xe Graphics G7 96EUs i9-13900H | Minisforum AtomMan X7 Ti, Intel Arc 8-Core iGPU Ultra 9 185H | Geekom A8, R9 8945HS, AMD Radeon 780M R9 8945HS | Acemagic F2A, Intel Arc 8-Core iGPU Ultra 7 155H | Acemagic AM18, AMD Radeon 780M R7 7840HS | Geekom A5, AMD Radeon RX Vega 8 (Ryzen 4000/5000) R7 5800H | Średnia w klasie Mini PC | |
|---|---|---|---|---|---|---|---|---|---|
| SPECviewperf 12 | -2% | -52% | -46% | -4% | -48% | 2% | -42% | 37% | |
| 1900x1060 3ds Max (3dsmax-05) (fps) | 85.3 | 85.7 0% | 41.4 -51% | 49.7 -42% | 87.4 2% | 49.8 -42% | 83.7 -2% | 51.7 -39% | 121.9 ? 43% |
| 1900x1060 Catia (catia-04) (fps) | 90.9 | 86.6 -5% | 38.6 -58% | 51.3 -44% | 86.4 -5% | 48.2 -47% | 88.5 -3% | 44.2 -51% | 112.2 ? 23% |
| 1900x1060 Creo (creo-01) (fps) | 56.6 | 53.3 -6% | 28.2 -50% | 22.7 -60% | 55.1 -3% | 23.1 -59% | 56.3 -1% | 36.3 -36% | 58.3 ? 3% |
| 1900x1060 Maya (maya-04) (fps) | 71.3 | 67.3 -6% | 42.4 -41% | 58 -19% | 75 5% | 54.9 -23% | 71.5 0% | 40.3 -43% | 105.4 ? 48% |
| 1900x1060 Medical (medical-01) (fps) | 60.5 | 51.4 -15% | 12.2 -80% | 15.9 -74% | 47.7 -21% | 16.9 -72% | 60.5 0% | 18.2 -70% | 59.3 ? -2% |
| 1900x1060 Showcase (showcase-01) (fps) | 25.2 | 30.3 20% | 19.1 -24% | 19.9 -21% | 25.8 2% | 18.2 -28% | 30 19% | 21.7 -14% | 63.9 ? 154% |
| 1900x1060 Solidworks (sw-03) (fps) | 117 | 114 -3% | 46.6 -60% | 43 -63% | 106 -9% | 42.7 -64% | 116 -1% | 68.3 -42% | 104 ? -11% |
| SPECviewperf 13 | 0% | -55% | -52% | -3% | -53% | 4% | -43% | 46% | |
| 3ds Max (3dsmax-06) (fps) | 84 | 82.4 -2% | 41.2 -51% | 48.5 -42% | 85.8 2% | 46.4 -45% | 83.1 -1% | 51.6 -39% | 120.5 ? 43% |
| Catia (catia-05) (fps) | 132 | 124 -6% | 54.7 -59% | 76.8 -42% | 126 -5% | 71.6 -46% | 129 -2% | 62.1 -53% | 156.4 ? 18% |
| Creo (creo-02) (fps) | 87.2 | 90.7 4% | 42.7 -51% | 29.3 -66% | 92.8 6% | 29.6 -66% | 92 6% | 50.6 -42% | 130.1 ? 49% |
| Energy (energy-02) (fps) | 24.4 | 22.2 -9% | 4.62 -81% | 5.27 -78% | 22.6 -7% | 5.69 -77% | 24.1 -1% | 10.6 -57% | 29.9 ? 23% |
| Maya (maya-05) (fps) | 107 | 109 2% | 51.6 -52% | 62.5 -42% | 103 -4% | 59.5 -44% | 108 1% | 56.5 -47% | 163.1 ? 52% |
| Medical (medical-02) (fps) | 78.6 | 70.5 -10% | 15.6 -80% | 25 -68% | 69.2 -12% | 29.7 -62% | 79 1% | 31 -61% | 105.6 ? 34% |
| Showcase (showcase-02) (fps) | 25.4 | 29.9 18% | 19.1 -25% | 19.9 -22% | 24.2 -5% | 18.2 -28% | 29.9 18% | 21.5 -15% | 62 ? 144% |
| Solidworks (sw-04) (fps) | 98.9 | 104 5% | 58.3 -41% | 45.6 -54% | 97.3 -2% | 44.8 -55% | 107 8% | 72.4 -27% | 106.9 ? 8% |
| SPECviewperf 2020 | 6% | -64% | -51% | 20% | -54% | 1% | -48% | 82% | |
| 3840x2160 Medical (medical-03) (fps) | 12.7 | 11.2 -12% | 2.69 -79% | 4.23 -67% | 10.9 -14% | 5.05 -60% | 13 2% | 4.82 -62% | 20.8 ? 64% |
| 3840x2160 Energy (energy-03) (fps) | 14.4 | 19.9 38% | 3.17 -78% | 6.03 -58% | 31 115% | 4.61 -68% | 14.2 -1% | 5.33 -63% | 31.1 ? 116% |
| 3840x2160 Creo (creo-03) (fps) | 30.2 | 33.4 11% | 16.3 -46% | 18.5 -39% | 35.6 18% | 17.9 -41% | 31.2 3% | 19.1 -37% | 47.7 ? 58% |
| 3840x2160 CATIA (catia-06) (fps) | 23.7 | 23.2 -2% | 8.53 -64% | 11.1 -53% | 24.6 4% | 10 -58% | 24.7 4% | 13.1 -45% | 32.5 ? 37% |
| 3840x2160 3ds Max (3dsmax-07) (fps) | 20.7 | 20.4 -1% | 10.3 -50% | 14.9 -28% | 21 1% | 12.9 -38% | 20.7 0% | 11.3 -45% | 50.4 ? 143% |
| 3840x2160 Siemens NX (snx-04) (fps) | 61.3 | 64.1 5% | 6.62 -89% | 6.24 -90% | 65.9 8% | 5.7 -91% | 61.1 0% | 38 -38% | 50.3 ? -18% |
| 3840x2160 Maya (maya-06) (fps) | 47.4 | 47.7 1% | 27.3 -42% | 37.7 -20% | 50.1 6% | 35.4 -25% | 46.7 -1% | 25.8 -46% | 130.4 ? 175% |
| Całkowita średnia (program / ustawienia) | 1% /
1% | -57% /
-57% | -50% /
-50% | 4% /
4% | -52% /
-52% | 2% /
2% | -44% /
-44% | 55% /
55% |
| 3DMark 05 Standard | 64978 pkt. | |
| 3DMark 06 Standard Score | 44889 pkt. | |
| 3DMark Vantage P Result | 44603 pkt. | |
| 3DMark 11 Performance | 13551 pkt. | |
| 3DMark Ice Storm Standard Score | 165201 pkt. | |
| 3DMark Cloud Gate Standard Score | 37530 pkt. | |
| 3DMark Fire Strike Score | 7756 pkt. | |
| 3DMark Fire Strike Extreme Score | 4151 pkt. | |
| 3DMark Time Spy Score | 3335 pkt. | |
| 3DMark Steel Nomad Score | 495 pkt. | |
| 3DMark Steel Nomad Light Score | 2869 pkt. | |
Pomoc | ||
Wydajność w grach
Geekom AE7 nie jest wyraźnie reklamowany jako komputer do gier. Niemniej jednak, granie nie jest całkowicie niemożliwe. W przeszłości byliśmy już w stanie przetestować wiele innych urządzeń z tym samym iGPU z wieloma grami. Wybór ten potwierdza, że Geekom AE7 nadaje się również do okazjonalnego grania.
Aby uzyskać szczegółowy przegląd wydajności iGPU w porównaniu z innymi kartami graficznymi, proszę zapoznać się z naszą Listy gier GPU.
| Dota 2 Reborn | |
| 1280x720 min (0/3) fastest | |
| Acemagic AM18 | |
| Geekom AE7 | |
| Geekom A8, R9 8945HS | |
| Aoostar GEM12 | |
| Geekom A5 | |
| Geekom GT13 Pro | |
| Minisforum AtomMan X7 Ti | |
| Acemagic F2A | |
| 1920x1080 high (2/3) | |
| Geekom AE7 | |
| Geekom A8, R9 8945HS | |
| Aoostar GEM12 | |
| Acemagic AM18 | |
| Minisforum AtomMan X7 Ti | |
| Acemagic F2A | |
| Geekom A5 | |
| Geekom GT13 Pro | |
| Cyberpunk 2077 | |
| 1920x1080 Low Preset (FSR off) | |
| Acemagic AM18 | |
| Geekom AE7 | |
| Geekom A8, R9 8945HS | |
| Aoostar GEM12 | |
| Minisforum AtomMan X7 Ti | |
| Acemagic F2A | |
| Geekom A5 | |
| Geekom GT13 Pro | |
| 1920x1080 High Preset (FSR off) | |
| Acemagic AM18 | |
| Geekom AE7 | |
| Aoostar GEM12 | |
| Minisforum AtomMan X7 Ti | |
| Geekom A8, R9 8945HS | |
| Acemagic F2A | |
| Geekom GT13 Pro | |
| Geekom A5 | |
| Baldur's Gate 3 | |
| 1280x720 Low Preset AA:SM | |
| Geekom AE7 | |
| Acemagic AM18 | |
| Geekom A8, R9 8945HS | |
| Aoostar GEM12 | |
| Minisforum AtomMan X7 Ti | |
| Geekom A5 | |
| Geekom GT13 Pro | |
| 1920x1080 High Preset AA:T | |
| Acemagic AM18 | |
| Geekom AE7 | |
| Aoostar GEM12 | |
| Minisforum AtomMan X7 Ti | |
| Geekom A8, R9 8945HS | |
| Geekom A5 | |
| Geekom GT13 Pro | |
| F1 24 | |
| 1920x1080 Low Preset AA:T AF:16x | |
| Geekom AE7 | |
| Acemagic AM18 | |
| Geekom A8, R9 8945HS | |
| Minisforum AtomMan X7 Ti | |
| Acemagic F2A | |
| Geekom A5 | |
| Geekom GT13 Pro | |
| 1920x1080 High Preset AA:T AF:16x | |
| Geekom AE7 | |
| Acemagic AM18 | |
| Geekom A8, R9 8945HS | |
| Minisforum AtomMan X7 Ti | |
| Acemagic F2A | |
| Geekom A5 | |
| Geekom GT13 Pro | |
FPS chart
| low | med. | high | ultra | |
|---|---|---|---|---|
| GTA V (2015) | 168 | 158 | 65.1 | 23.9 |
| Dota 2 Reborn (2015) | 163 | 127.9 | 89.8 | 83.2 |
| Final Fantasy XV Benchmark (2018) | 75.1 | 36 | 27.5 | |
| X-Plane 11.11 (2018) | 64.4 | 47.1 | 39.6 | |
| Baldur's Gate 3 (2023) | 42.8 | 33 | 25.7 | 24.6 |
| Cyberpunk 2077 (2023) | 45 | 35.1 | 27.4 | 24.3 |
| F1 24 (2024) | 94.8 | 80.1 | 59.5 | 14.4 |
Geekom AE7 spotyka Nvidię GeForce RTX 3060 Ti
Geekom AE7 posiada port USB4, którego używamy do poprawy wydajności 3D przy użyciu eGPU. Bez wpływu na ogólną ocenę, przeprowadziliśmy kilka testów w połączeniu z Razer Core X i Nvidia GeForce RTX 3060 Ti. Ostatecznie wydajność 3D można drastycznie zwiększyć za pomocą zewnętrznej karty graficznej. Nawet nowoczesne gry mogą cieszyć się pełną szczegółowością. Należy jednak pamiętać, że pełna wydajność Nvidia GeForce RTX 3060 Ti nie jest osiągana w porównaniu z konwencjonalnym systemem stacjonarnym ze względu na połączenie USB4. Zewnętrzna karta graficzna może działać przez USB4, w najlepszym przypadku tylko z prędkością PCIe 3.0 x4.
| Performance rating - Percent | |
| Geekom AE7 (Nvidia GeForce RTX 3060 Ti FE) | |
| Geekom A8 (Nvidia GeForce RTX 3060 Ti FE) | |
| Geekom GT13 Pro (Nvidia GeForce RTX 3060 Ti FE) | |
| 3DMark 11 - 1280x720 Performance GPU | |
| Geekom A8 (Nvidia GeForce RTX 3060 Ti FE) | |
| Geekom AE7 (Nvidia GeForce RTX 3060 Ti FE) | |
| Geekom GT13 Pro (Nvidia GeForce RTX 3060 Ti FE) | |
| 3DMark | |
| 2560x1440 Time Spy Graphics | |
| Geekom A8 (Nvidia GeForce RTX 3060 Ti FE) | |
| Geekom AE7 (Nvidia GeForce RTX 3060 Ti FE) | |
| Geekom GT13 Pro (Nvidia GeForce RTX 3060 Ti FE) | |
| 1920x1080 Fire Strike Graphics | |
| Geekom AE7 (Nvidia GeForce RTX 3060 Ti FE) | |
| Geekom GT13 Pro (Nvidia GeForce RTX 3060 Ti FE) | |
| Geekom A8 (Nvidia GeForce RTX 3060 Ti FE) | |
| 3840x2160 Fire Strike Ultra Graphics | |
| Geekom GT13 Pro (Nvidia GeForce RTX 3060 Ti FE) | |
| Geekom AE7 (Nvidia GeForce RTX 3060 Ti FE) | |
| Geekom A8 (Nvidia GeForce RTX 3060 Ti FE) | |
| Unigine Superposition | |
| 1280x720 720p Low | |
| Geekom AE7 (Nvidia GeForce RTX 3060 Ti FE) | |
| Geekom GT13 Pro (Nvidia GeForce RTX 3060 Ti FE) | |
| Geekom A8 (Nvidia GeForce RTX 3060 Ti FE) | |
| 1920x1080 1080p High | |
| Geekom GT13 Pro (Nvidia GeForce RTX 3060 Ti FE) | |
| Geekom A8 (Nvidia GeForce RTX 3060 Ti FE) | |
| Geekom AE7 (Nvidia GeForce RTX 3060 Ti FE) | |
| 1920x1080 1080p Extreme | |
| Geekom GT13 Pro (Nvidia GeForce RTX 3060 Ti FE) | |
| Geekom A8 (Nvidia GeForce RTX 3060 Ti FE) | |
| Geekom AE7 (Nvidia GeForce RTX 3060 Ti FE) | |
| 3840x2160 4k Optimized | |
| Geekom GT13 Pro (Nvidia GeForce RTX 3060 Ti FE) | |
| Geekom A8 (Nvidia GeForce RTX 3060 Ti FE) | |
| Geekom AE7 (Nvidia GeForce RTX 3060 Ti FE) | |
| 7680x4320 8k Optimized | |
| Geekom GT13 Pro (Nvidia GeForce RTX 3060 Ti FE) | |
| Geekom A8 (Nvidia GeForce RTX 3060 Ti FE) | |
| Geekom AE7 (Nvidia GeForce RTX 3060 Ti FE) | |
| Unigine Valley 1.0 | |
| 1920x1080 Extreme HD DirectX AA:x8 | |
| Geekom GT13 Pro (Nvidia GeForce RTX 3060 Ti FE) | |
| Geekom A8 (Nvidia GeForce RTX 3060 Ti FE) | |
| Geekom AE7 (Nvidia GeForce RTX 3060 Ti FE) | |
| 1920x1080 Extreme HD Preset OpenGL AA:x8 | |
| Geekom GT13 Pro (Nvidia GeForce RTX 3060 Ti FE) | |
| Geekom A8 (Nvidia GeForce RTX 3060 Ti FE) | |
| Geekom AE7 (Nvidia GeForce RTX 3060 Ti FE) | |
| Unigine Heaven 4.0 | |
| Extreme Preset OpenGL | |
| Geekom A8 (Nvidia GeForce RTX 3060 Ti FE) | |
| Geekom AE7 (Nvidia GeForce RTX 3060 Ti FE) | |
| Geekom GT13 Pro (Nvidia GeForce RTX 3060 Ti FE) | |
| Extreme Preset DX11 | |
| Geekom GT13 Pro (Nvidia GeForce RTX 3060 Ti FE) | |
| Geekom A8 (Nvidia GeForce RTX 3060 Ti FE) | |
| Geekom AE7 (Nvidia GeForce RTX 3060 Ti FE) | |
| ComputeMark v2.1 | |
| 1024x600 Normal, Score | |
| Geekom GT13 Pro (Nvidia GeForce RTX 3060 Ti FE) | |
| Geekom AE7 (Nvidia GeForce RTX 3060 Ti FE) | |
| Geekom A8 (Nvidia GeForce RTX 3060 Ti FE) | |
| 1024x600 Normal, Fluid 3DTex | |
| Geekom GT13 Pro (Nvidia GeForce RTX 3060 Ti FE) | |
| Geekom AE7 (Nvidia GeForce RTX 3060 Ti FE) | |
| Geekom A8 (Nvidia GeForce RTX 3060 Ti FE) | |
| 1024x600 Normal, Fluid 2DTexArr | |
| Geekom GT13 Pro (Nvidia GeForce RTX 3060 Ti FE) | |
| Geekom AE7 (Nvidia GeForce RTX 3060 Ti FE) | |
| Geekom A8 (Nvidia GeForce RTX 3060 Ti FE) | |
| 1024x600 Normal, Mandel Vector | |
| Geekom GT13 Pro (Nvidia GeForce RTX 3060 Ti FE) | |
| Geekom AE7 (Nvidia GeForce RTX 3060 Ti FE) | |
| Geekom A8 (Nvidia GeForce RTX 3060 Ti FE) | |
| 1024x600 Normal, Mandel Scalar | |
| Geekom GT13 Pro (Nvidia GeForce RTX 3060 Ti FE) | |
| Geekom AE7 (Nvidia GeForce RTX 3060 Ti FE) | |
| Geekom A8 (Nvidia GeForce RTX 3060 Ti FE) | |
| 1024x600 Normal, QJuliaRayTrace | |
| Geekom GT13 Pro (Nvidia GeForce RTX 3060 Ti FE) | |
| Geekom AE7 (Nvidia GeForce RTX 3060 Ti FE) | |
| Geekom A8 (Nvidia GeForce RTX 3060 Ti FE) | |
| DaVinci Resolve PugetBench - GPU Effects 0.93 | |
| Geekom A8 (Nvidia GeForce RTX 3060 Ti FE) | |
| Geekom AE7 (Nvidia GeForce RTX 3060 Ti FE) | |
| Geekom GT13 Pro (Nvidia GeForce RTX 3060 Ti FE) | |
| Photoshop PugetBench - GPU Score | |
| Geekom A8 (Nvidia GeForce RTX 3060 Ti FE) | |
| Geekom AE7 (Nvidia GeForce RTX 3060 Ti FE) | |
| Geekom GT13 Pro (Nvidia GeForce RTX 3060 Ti FE) | |
| Premiere Pro PugetBench - GPU 0.9 | |
| Geekom A8 (Nvidia GeForce RTX 3060 Ti FE) | |
| Geekom AE7 (Nvidia GeForce RTX 3060 Ti FE) | |
| Geekom GT13 Pro (Nvidia GeForce RTX 3060 Ti FE) | |
| Performance rating - Percent | |
| Geekom AE7 (Nvidia GeForce RTX 3060 Ti FE) | |
| Geekom A8 (Nvidia GeForce RTX 3060 Ti FE) | |
| Geekom GT13 Pro (Nvidia GeForce RTX 3060 Ti FE) | |
| Cyberpunk 2077 | |
| 1280x720 Low Preset (FSR off) | |
| Geekom AE7 (Nvidia GeForce RTX 3060 Ti FE) | |
| Geekom A8 (Nvidia GeForce RTX 3060 Ti FE) | |
| Geekom GT13 Pro (Nvidia GeForce RTX 3060 Ti FE) | |
| 1920x1080 Medium Preset (FSR off) | |
| Geekom AE7 (Nvidia GeForce RTX 3060 Ti FE) | |
| Geekom A8 (Nvidia GeForce RTX 3060 Ti FE) | |
| Geekom GT13 Pro (Nvidia GeForce RTX 3060 Ti FE) | |
| 1920x1080 Ultra Preset (FSR off) | |
| Geekom AE7 (Nvidia GeForce RTX 3060 Ti FE) | |
| Geekom GT13 Pro (Nvidia GeForce RTX 3060 Ti FE) | |
| Geekom A8 (Nvidia GeForce RTX 3060 Ti FE) | |
| Baldur's Gate 3 | |
| 1920x1080 Low Preset AA:SM | |
| Geekom GT13 Pro (Nvidia GeForce RTX 3060 Ti FE) | |
| Geekom AE7 (Nvidia GeForce RTX 3060 Ti FE) | |
| Geekom A8 (Nvidia GeForce RTX 3060 Ti FE) | |
| 1920x1080 Medium Preset AA:T | |
| Geekom GT13 Pro (Nvidia GeForce RTX 3060 Ti FE) | |
| Geekom A8 (Nvidia GeForce RTX 3060 Ti FE) | |
| Geekom AE7 (Nvidia GeForce RTX 3060 Ti FE) | |
| 1920x1080 Ultra Preset AA:T | |
| Geekom GT13 Pro (Nvidia GeForce RTX 3060 Ti FE) | |
| Geekom A8 (Nvidia GeForce RTX 3060 Ti FE) | |
| Geekom AE7 (Nvidia GeForce RTX 3060 Ti FE) | |
| F1 24 | |
| 1920x1080 Low Preset AA:T AF:16x | |
| Geekom AE7 (Nvidia GeForce RTX 3060 Ti FE) | |
| Geekom A8 (Nvidia GeForce RTX 3060 Ti FE) | |
| Geekom GT13 Pro (Nvidia GeForce RTX 3060 Ti FE) | |
| 1920x1080 Medium Preset AA:T AF:16x | |
| Geekom A8 (Nvidia GeForce RTX 3060 Ti FE) | |
| Geekom AE7 (Nvidia GeForce RTX 3060 Ti FE) | |
| Geekom GT13 Pro (Nvidia GeForce RTX 3060 Ti FE) | |
| 1920x1080 Ultra High Preset AA:T AF:16x | |
| Geekom AE7 (Nvidia GeForce RTX 3060 Ti FE) | |
| Geekom A8 (Nvidia GeForce RTX 3060 Ti FE) | |
| Geekom GT13 Pro (Nvidia GeForce RTX 3060 Ti FE) | |
| Geekom AE7, AMD Radeon 780M R9 7940HS | Geekom AE7 (Nvidia GeForce RTX 3060 Ti FE), R9 7940HS | Geekom A8 (Nvidia GeForce RTX 3060 Ti FE), R9 8945HS | Geekom GT13 Pro (Nvidia GeForce RTX 3060 Ti FE), i9-13900H | Średnia w klasie Mini PC | |
|---|---|---|---|---|---|
| SPECviewperf 12 | 98% | 94% | 97% | 31% | |
| 1900x1060 3ds Max (3dsmax-05) (fps) | 85.3 | 147 72% | 146 71% | 147 72% | 121.9 ? 43% |
| 1900x1060 Catia (catia-04) (fps) | 90.9 | 113 24% | 112 23% | 116 28% | 112.2 ? 23% |
| 1900x1060 Creo (creo-01) (fps) | 56.6 | 62 10% | 62.9 11% | 62.9 11% | 58.3 ? 3% |
| 1900x1060 Energy (energy-01) (fps) | 20.9 | 13.3 -36% | 13.3 -36% | 13.4 -36% | 18.1 ? -13% |
| 1900x1060 Maya (maya-04) (fps) | 71.3 | 235 230% | 235 230% | 228 220% | 105.4 ? 48% |
| 1900x1060 Medical (medical-01) (fps) | 60.5 | 74.4 23% | 74.8 24% | 73.4 21% | 59.3 ? -2% |
| 1900x1060 Showcase (showcase-01) (fps) | 25.2 | 150 495% | 141 460% | 149 491% | 63.9 ? 154% |
| 1900x1060 Solidworks (sw-03) (fps) | 117 | 80.1 -32% | 81.6 -30% | 77.2 -34% | 104 ? -11% |
| SPECviewperf 13 | 125% | 120% | 127% | 46% | |
| 3ds Max (3dsmax-06) (fps) | 84 | 147 75% | 145 73% | 147 75% | 120.5 ? 43% |
| Catia (catia-05) (fps) | 132 | 163 23% | 163 23% | 164 24% | 156.4 ? 18% |
| Creo (creo-02) (fps) | 87.2 | 232 166% | 231 165% | 232 166% | 130.1 ? 49% |
| Energy (energy-02) (fps) | 24.4 | 25.9 6% | 25.9 6% | 25.9 6% | 29.9 ? 23% |
| Maya (maya-05) (fps) | 107 | 350 227% | 351 228% | 363 239% | 163.1 ? 52% |
| Medical (medical-02) (fps) | 78.6 | 64.1 -18% | 64.1 -18% | 65.2 -17% | 105.6 ? 34% |
| Showcase (showcase-02) (fps) | 25.4 | 151 494% | 141 455% | 151 494% | 62 ? 144% |
| Solidworks (sw-04) (fps) | 98.9 | 123 24% | 125 26% | 127 28% | 106.9 ? 8% |
| SPECviewperf 2020 | 91% | 116% | 89% | 82% | |
| 3840x2160 Medical (medical-03) (fps) | 12.7 | 13 2% | 10.8 -15% | 10.8 -15% | 20.8 ? 64% |
| 3840x2160 Energy (energy-03) (fps) | 14.4 | 20.9 45% | 50.3 249% | 21 46% | 31.1 ? 116% |
| 3840x2160 Creo (creo-03) (fps) | 30.2 | 76.8 154% | 76.6 154% | 76.4 153% | 47.7 ? 58% |
| 3840x2160 CATIA (catia-06) (fps) | 23.7 | 39.2 65% | 38.8 64% | 40.1 69% | 32.5 ? 37% |
| 3840x2160 3ds Max (3dsmax-07) (fps) | 20.7 | 46.5 125% | 45.9 122% | 47.3 129% | 50.4 ? 143% |
| 3840x2160 Siemens NX (snx-04) (fps) | 61.3 | 16.6 -73% | 16.6 -73% | 16.5 -73% | 50.3 ? -18% |
| 3840x2160 Maya (maya-06) (fps) | 47.4 | 199 320% | 195 311% | 196 314% | 130.4 ? 175% |
| Całkowita średnia (program / ustawienia) | 105% /
105% | 110% /
110% | 104% /
105% | 53% /
52% |
| low | med. | high | ultra | QHD | 4K | |
|---|---|---|---|---|---|---|
| Baldur's Gate 3 (2023) | 110.4 | 88.5 | 77.7 | 76.8 | 60.9 | 36.9 |
| Cyberpunk 2077 (2023) | 96.1 | 81.5 | 73 | 64.5 | 44.9 | 22.3 |
| F1 24 (2024) | 88.2 | 82.2 | 68.3 | 46.4 | 36.1 | 17.8 |
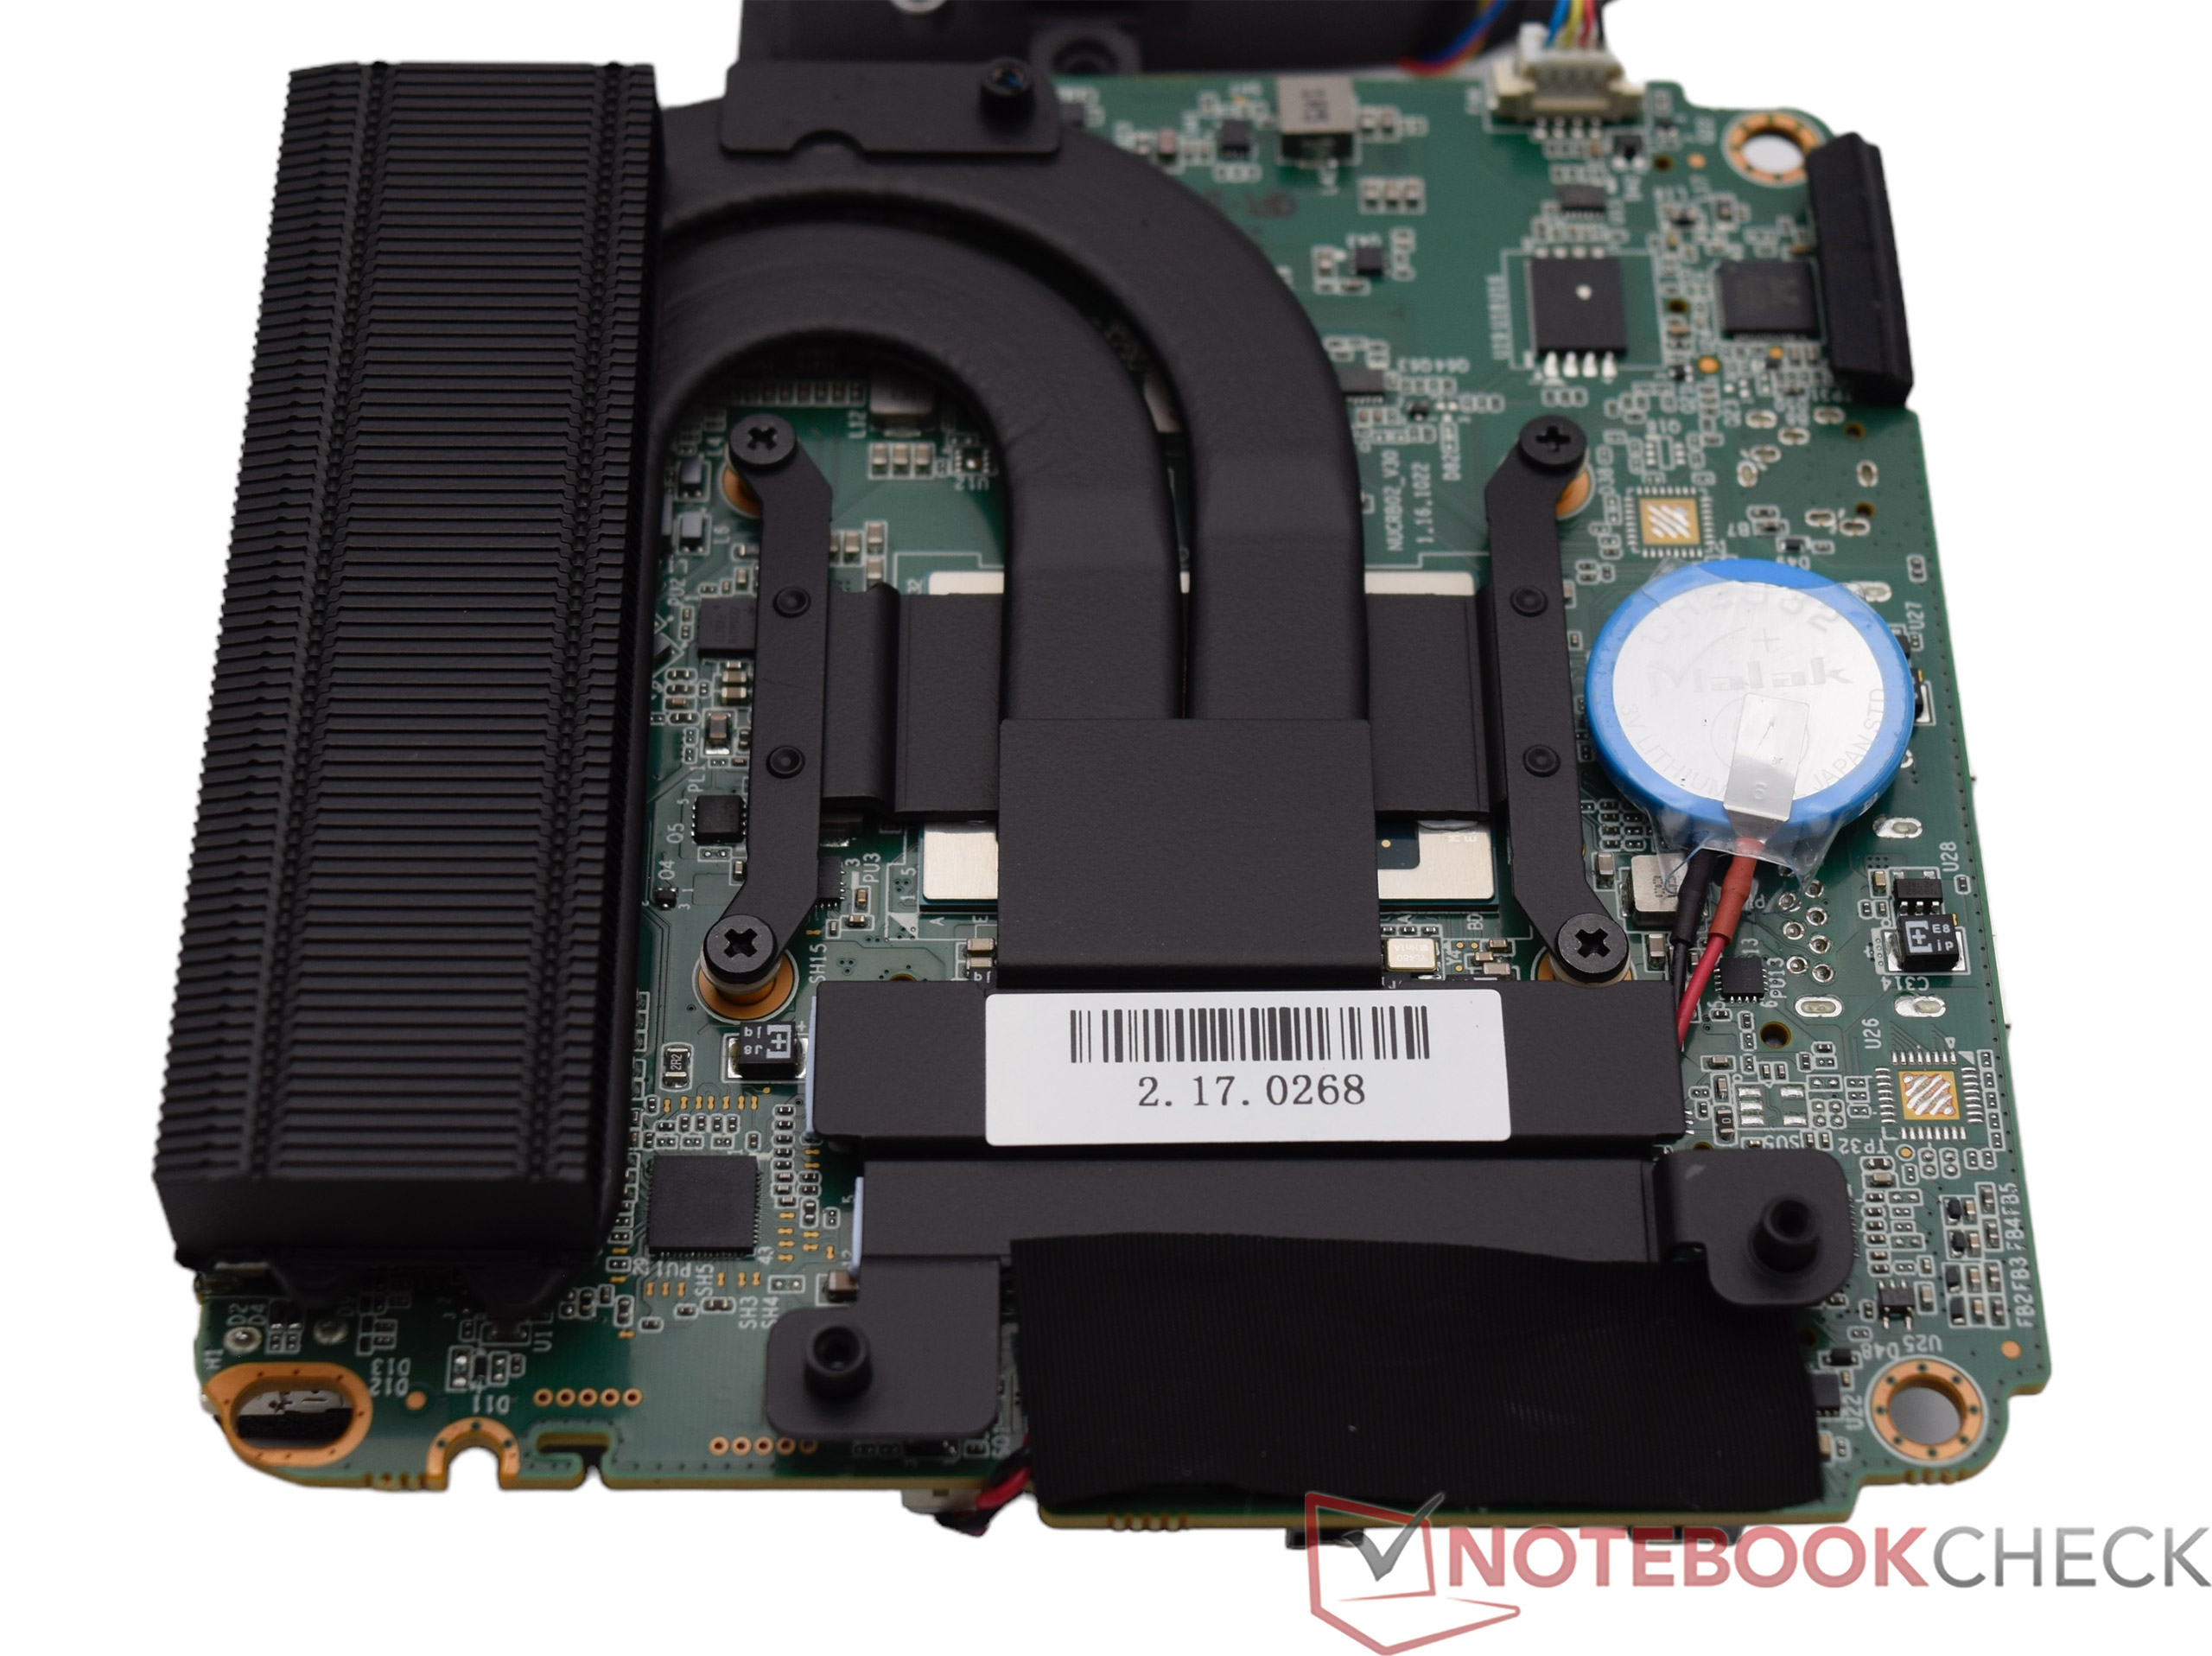
Emisje - Dobra wydajność przy słabej jednostce chłodzącej
Emisja hałasu
Emisja hałasu jest najsłabszym punktem Geekom AE7. Na biegu jałowym system jest nadal stosunkowo cichy, prawie bezgłośny. Jednak szybko zmienia się to pod obciążeniem. Wentylator znacznie się rozkręca i osiąga szczytową wartość do 52 dB(A). Nawet przy średnim obciążeniu niewiele się zmienia, a szkoda. Nieco lepiej dostrojona krzywa wentylatora subiektywnie poprawiłaby codzienne użytkowanie Geekom AE7. Zamontowanie go na monitorze mogłoby nieco poprawić subiektywny odbiór poziomu ciśnienia akustycznego, gdyż urządzenie nie znajdowałoby się wtedy bezpośrednio przed użytkownikiem na biurku.
Należy również wspomnieć, że prędkość wentylatora w BIOS-ie jest domyślnie ustawiona na tryb wydajności. Dostępne są również tryby Balanced i Quiet. Ten ostatni sprawia, że urządzenie jest nieco cichsze pod obciążeniem. Geekom AE7 jest jednak nadal słyszalny.
Hałas
| luz |
| 24.9 / 25 / 25 dB |
| obciążenie |
| 52 / 51.4 dB |
 | ||
30 dB cichy 40 dB(A) słyszalny 50 dB(A) irytujący |
||
min: | ||
| Geekom AE7 R9 7940HS, Radeon 780M | Aoostar GEM12 R7 8845HS, Radeon 780M | Geekom GT13 Pro i9-13900H, Iris Xe G7 96EUs | Minisforum AtomMan X7 Ti Ultra 9 185H, Arc 8-Core | Geekom A8, R9 8945HS R9 8945HS, Radeon 780M | Acemagic F2A Ultra 7 155H, Arc 8-Core | Acemagic AM18 R7 7840HS, Radeon 780M | Geekom A5 R7 5800H, Vega 8 | |
|---|---|---|---|---|---|---|---|---|
| Noise | 8% | -0% | -3% | 3% | 1% | -9% | -4% | |
| wyłączone / środowisko * (dB) | 24.4 | 24.3 -0% | 24.3 -0% | 24.1 1% | 24.4 -0% | 24.9 -2% | 24.8 -2% | 25 -2% |
| Idle Minimum * (dB) | 24.9 | 27.5 -10% | 27.9 -12% | 29.8 -20% | 24.5 2% | 25.4 -2% | 31 -24% | 28.2 -13% |
| Idle Average * (dB) | 25 | 27.6 -10% | 27.9 -12% | 29.9 -20% | 24.7 1% | 25.7 -3% | 31.2 -25% | 28.2 -13% |
| Idle Maximum * (dB) | 25 | 27.6 -10% | 28 -12% | 30 -20% | 24.7 1% | 25.7 -3% | 31.4 -26% | 28.2 -13% |
| Load Average * (dB) | 52 | 36 31% | 43.8 16% | 37.3 28% | 48.5 7% | 47.8 8% | 37.1 29% | 47.8 8% |
| Cyberpunk 2077 ultra * (dB) | 52 | 35.4 32% | 45.4 13% | |||||
| Load Maximum * (dB) | 51.4 | 38.2 26% | 48.5 6% | 43.5 15% | 49.2 4% | 49 5% | 53.7 -4% | 47.4 8% |
| Witcher 3 ultra * (dB) | 35.4 | 40.2 | 47 | 45.23 | 37.6 |
* ... im mniej tym lepiej
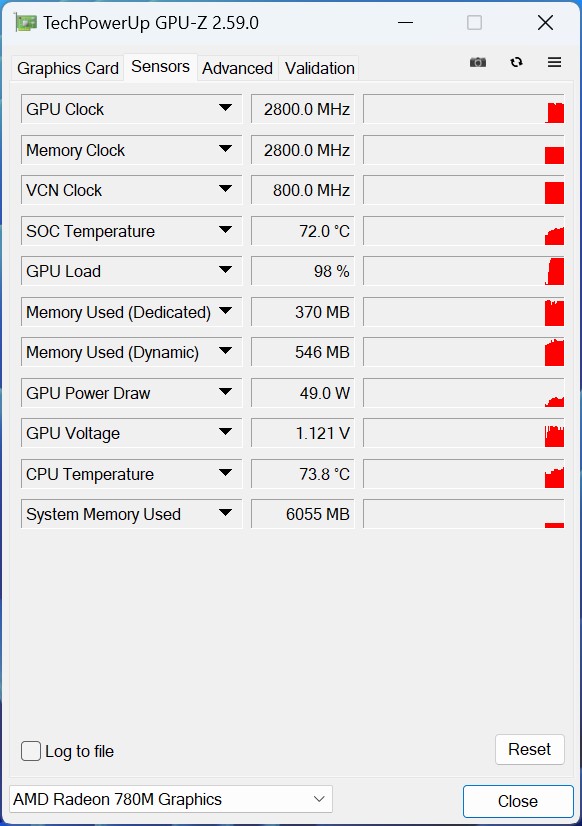
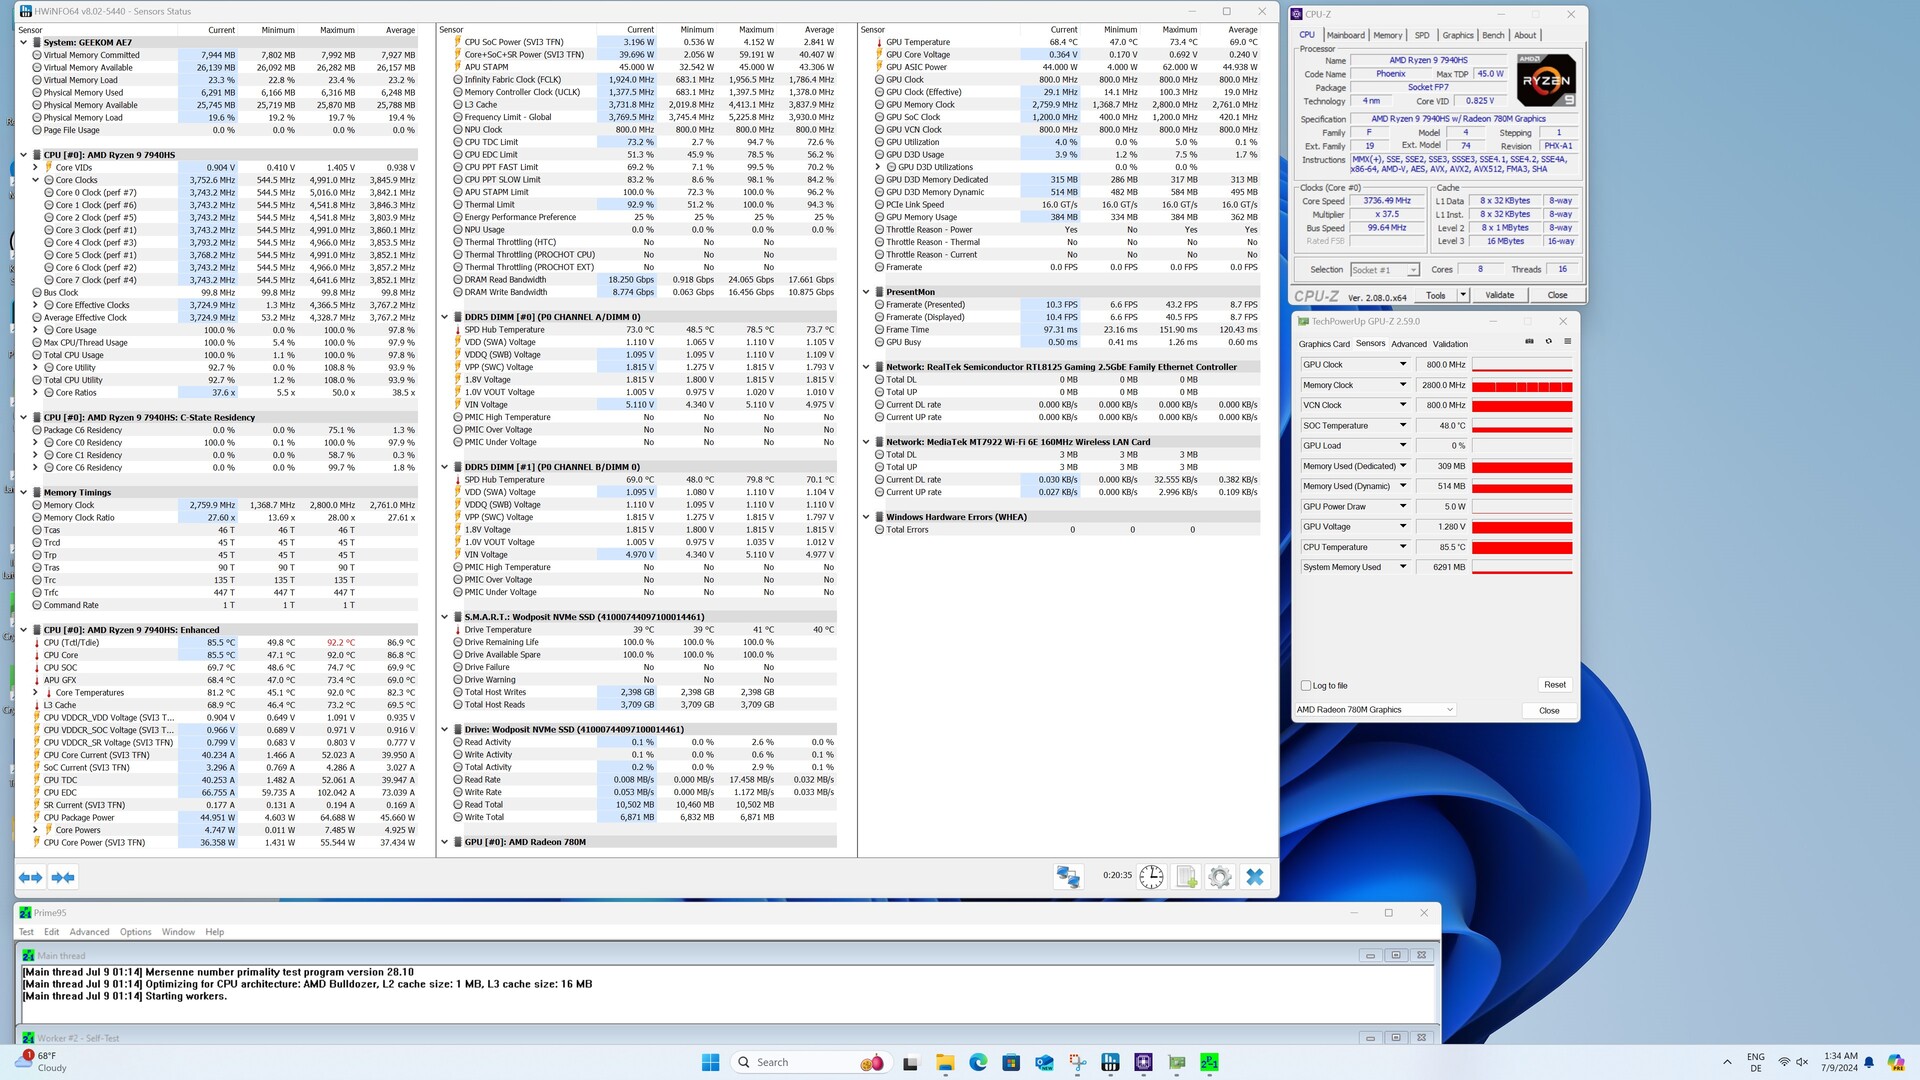
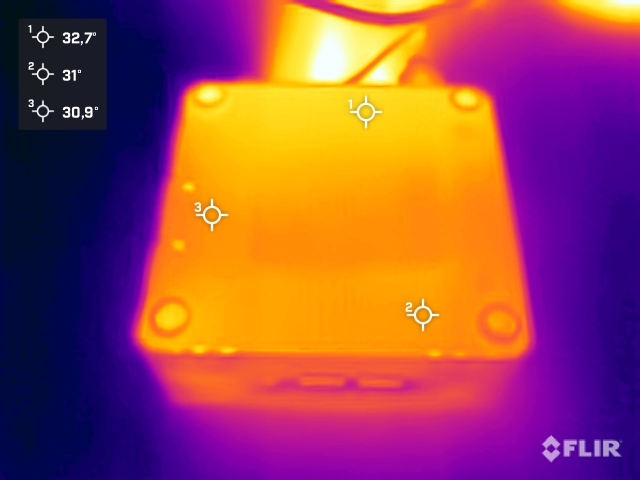
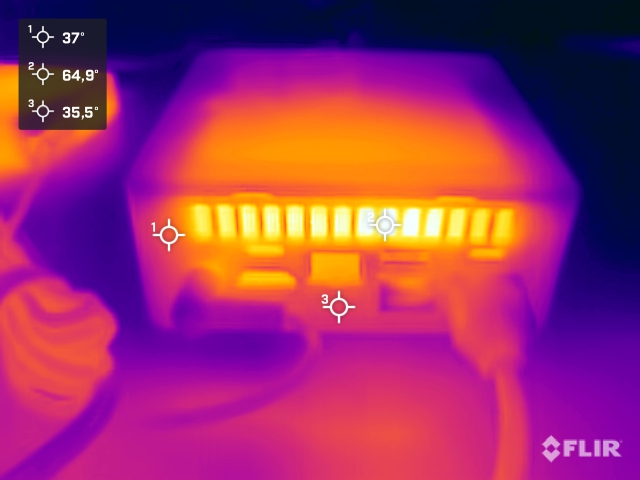
Temperatura
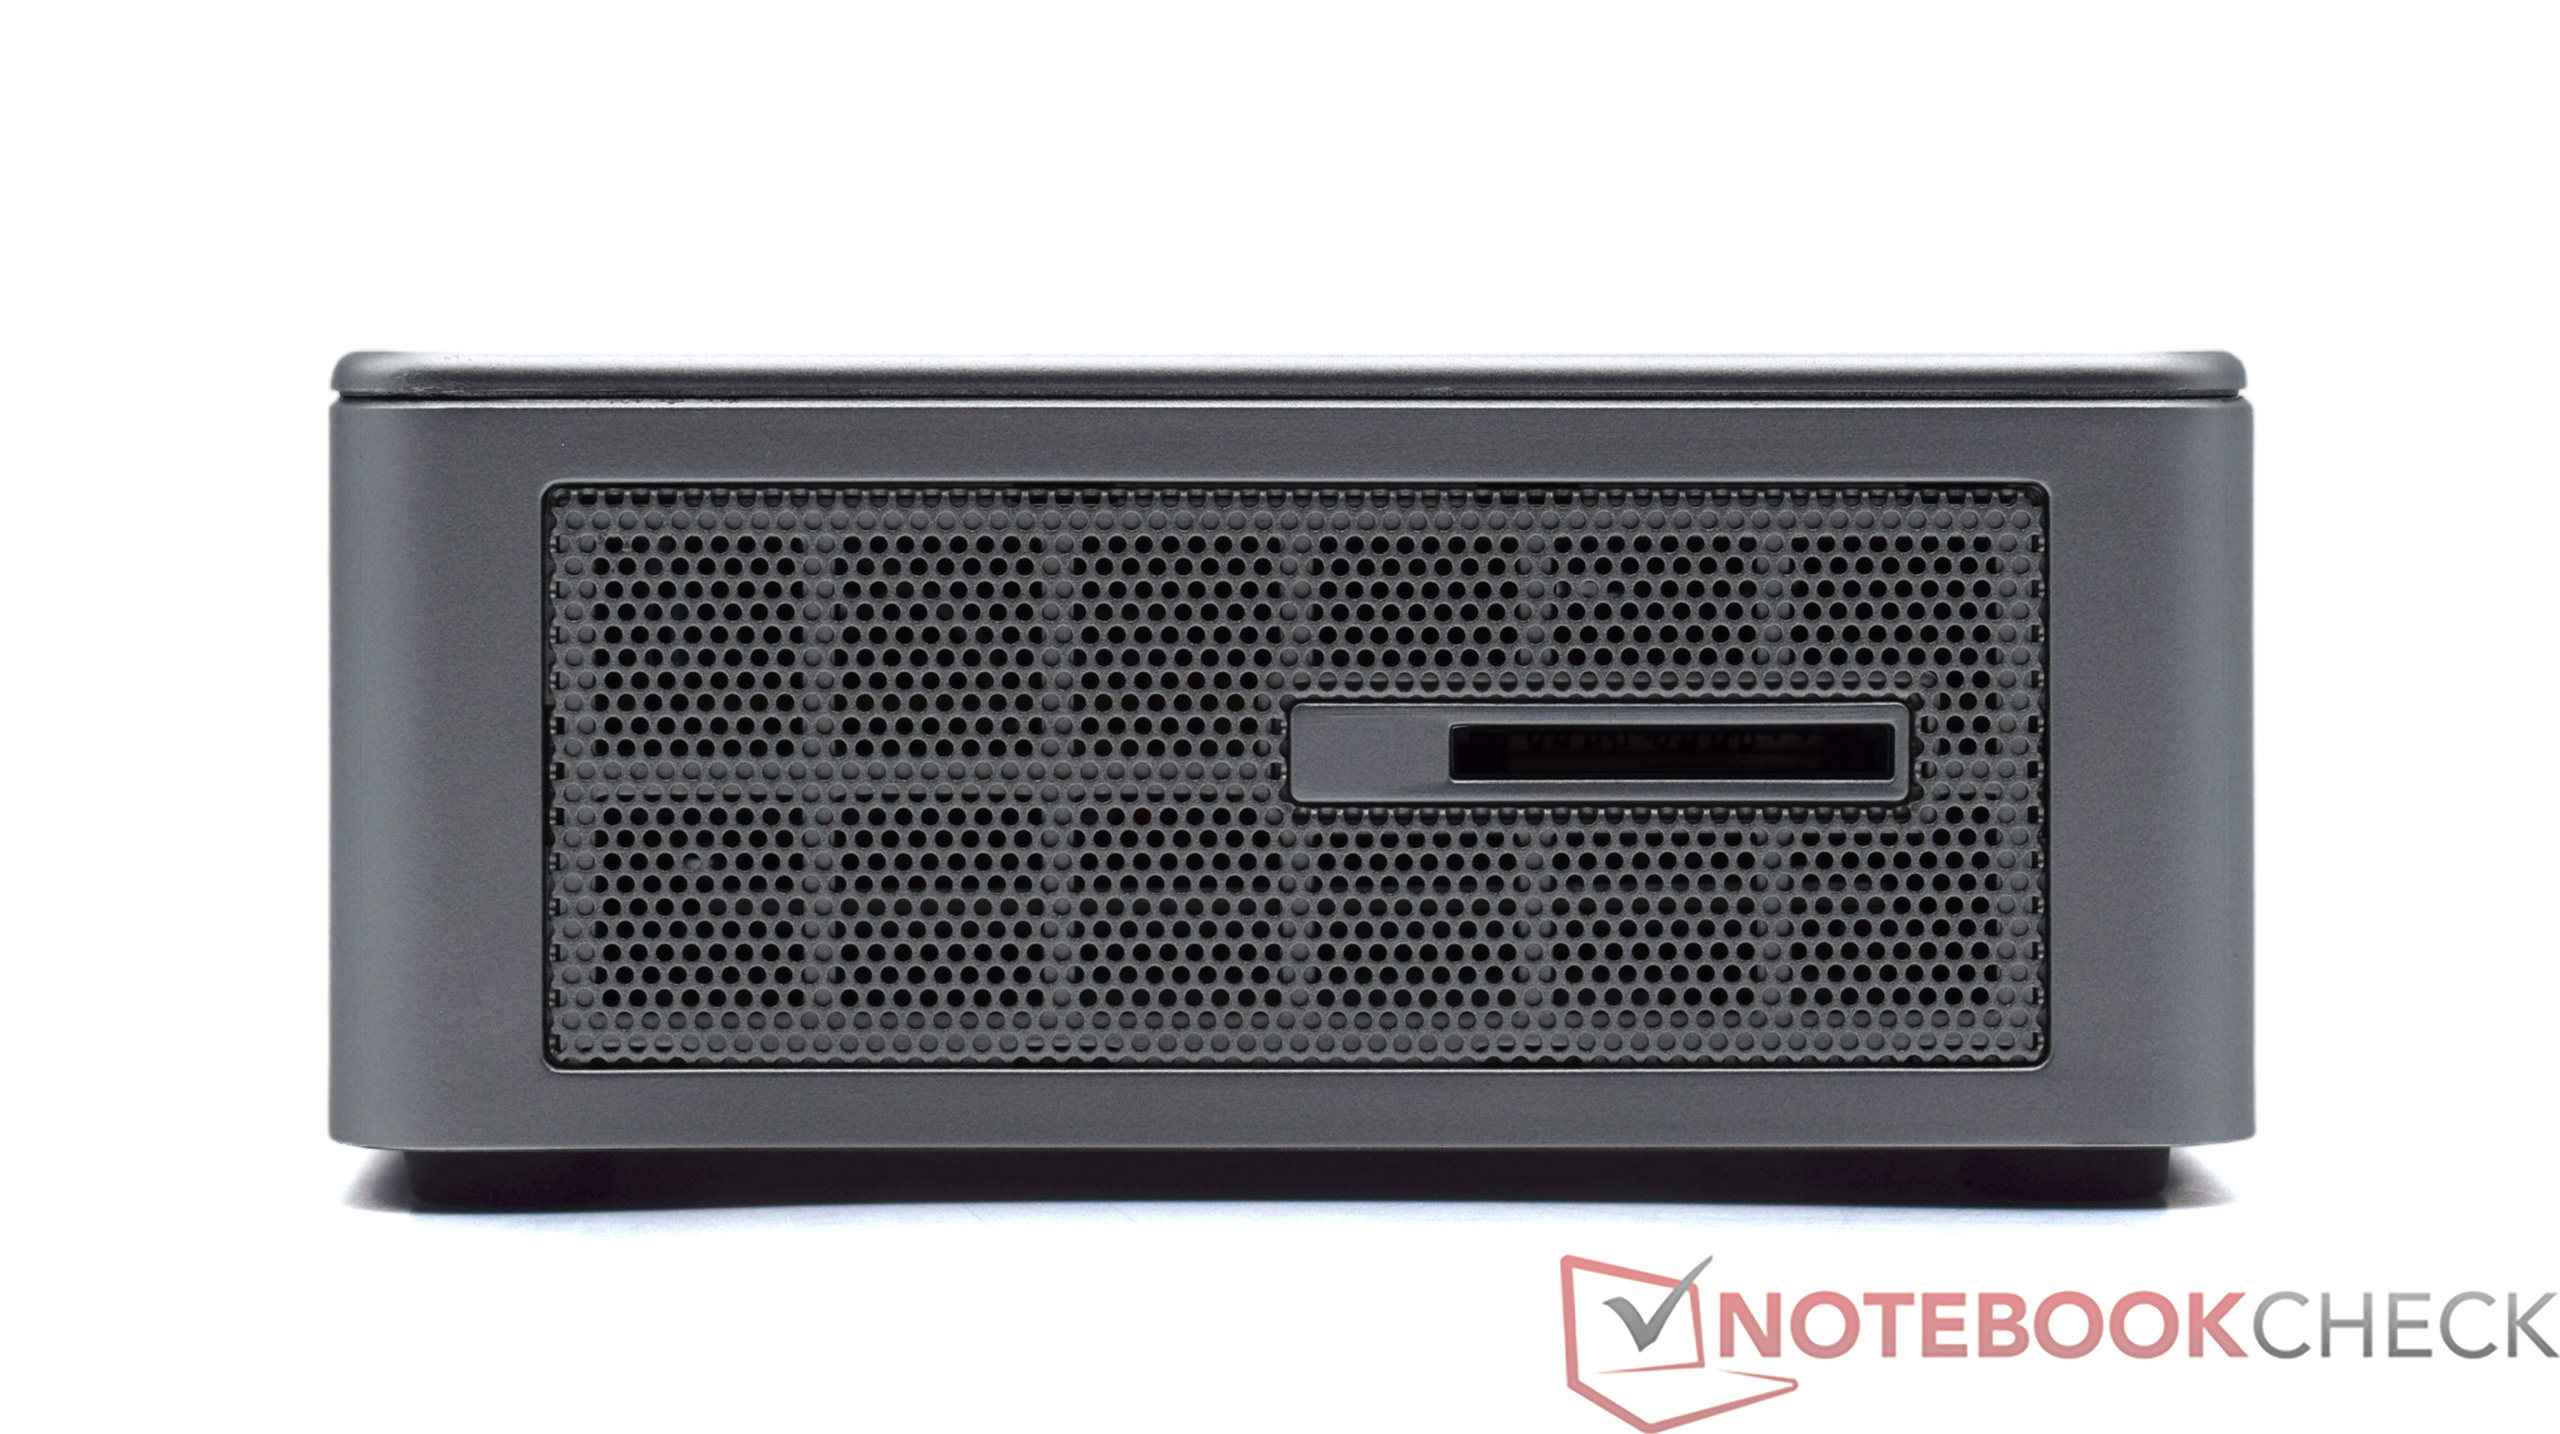
Jeśli chodzi o temperatury, najpierw przyjrzymy się wartościom obudowy. Geekom ma je pod kontrolą przez cały czas i zarejestrowaliśmy tylko maksymalnie 42,5 °C w teście obciążeniowym Cyberpunk. Jednostka chłodząca została zaprojektowana w taki sposób, że świeże powietrze może być zasysane z boku, a następnie kierowane z tyłu obudowy. W rezultacie miejscami z tyłu można osiągnąć nieco wyższe temperatury. Wygląda na to, że Geekom określił limit temperatury dla samego procesora na 92 °C. Widzieliśmy już tę wartość dla procesora w Cinbenench R15 multi-loop. W teście obciążeniowym Prime95 temperatura procesora wynosi średnio około 87°C. Stabilna praca przy poborze mocy na poziomie 45 W jest możliwa w naszym teście obciążeniowym.
Niemniej jednak, życzylibyśmy sobie nieco mocniejszej jednostki chłodzącej. Jeśli chodzi o wysokość, producent oddaje dużo miejsca w dolnej części, ponieważ i tak nie można zainstalować drugiego urządzenia pamięci masowej. Obudowa jest jednak do tego przystosowana, co oznaczałoby, że Geekom musiałby zaprojektować tutaj zupełnie nowy model.

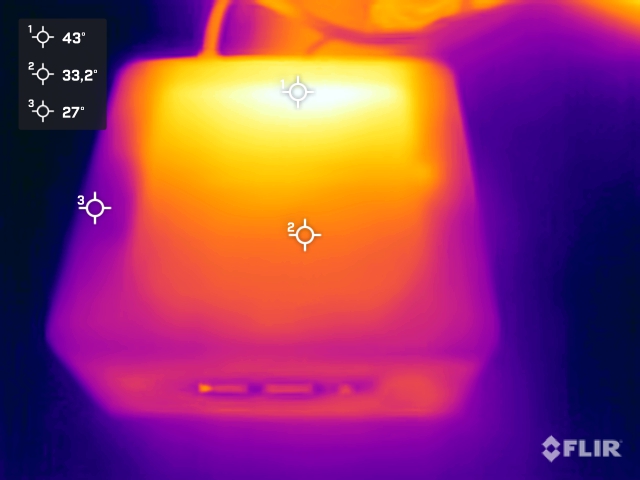
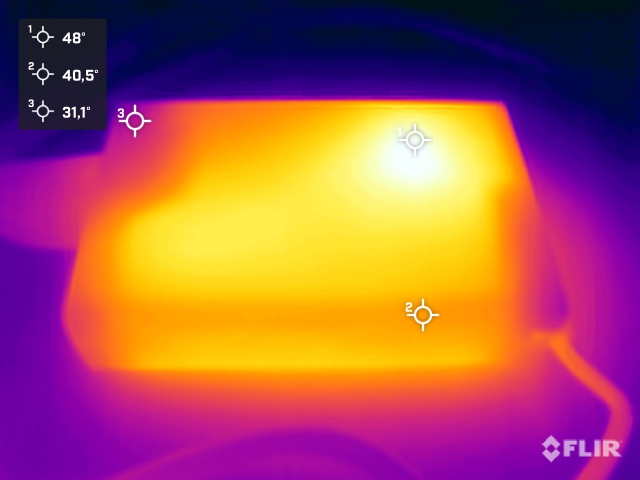
(±) Maksymalna temperatura w górnej części wynosi 41.1 °C / 106 F, w porównaniu do średniej 35.6 °C / 96 F , począwszy od 20.6 do 69.5 °C dla klasy Mini PC.
(+) Dno nagrzewa się maksymalnie do 33.9 °C / 93 F, w porównaniu do średniej 36.3 °C / 97 F
(±) W stanie bezczynności średnia temperatura górnej części wynosi 32.4 °C / 90 F, w porównaniu ze średnią temperaturą urządzenia wynoszącą 32.3 °C / ### class_avg_f### F.
(±) 3: The average temperature for the upper side is 34.7 °C / 94 F, compared to the average of 32.3 °C / 90 F for the class Mini PC.
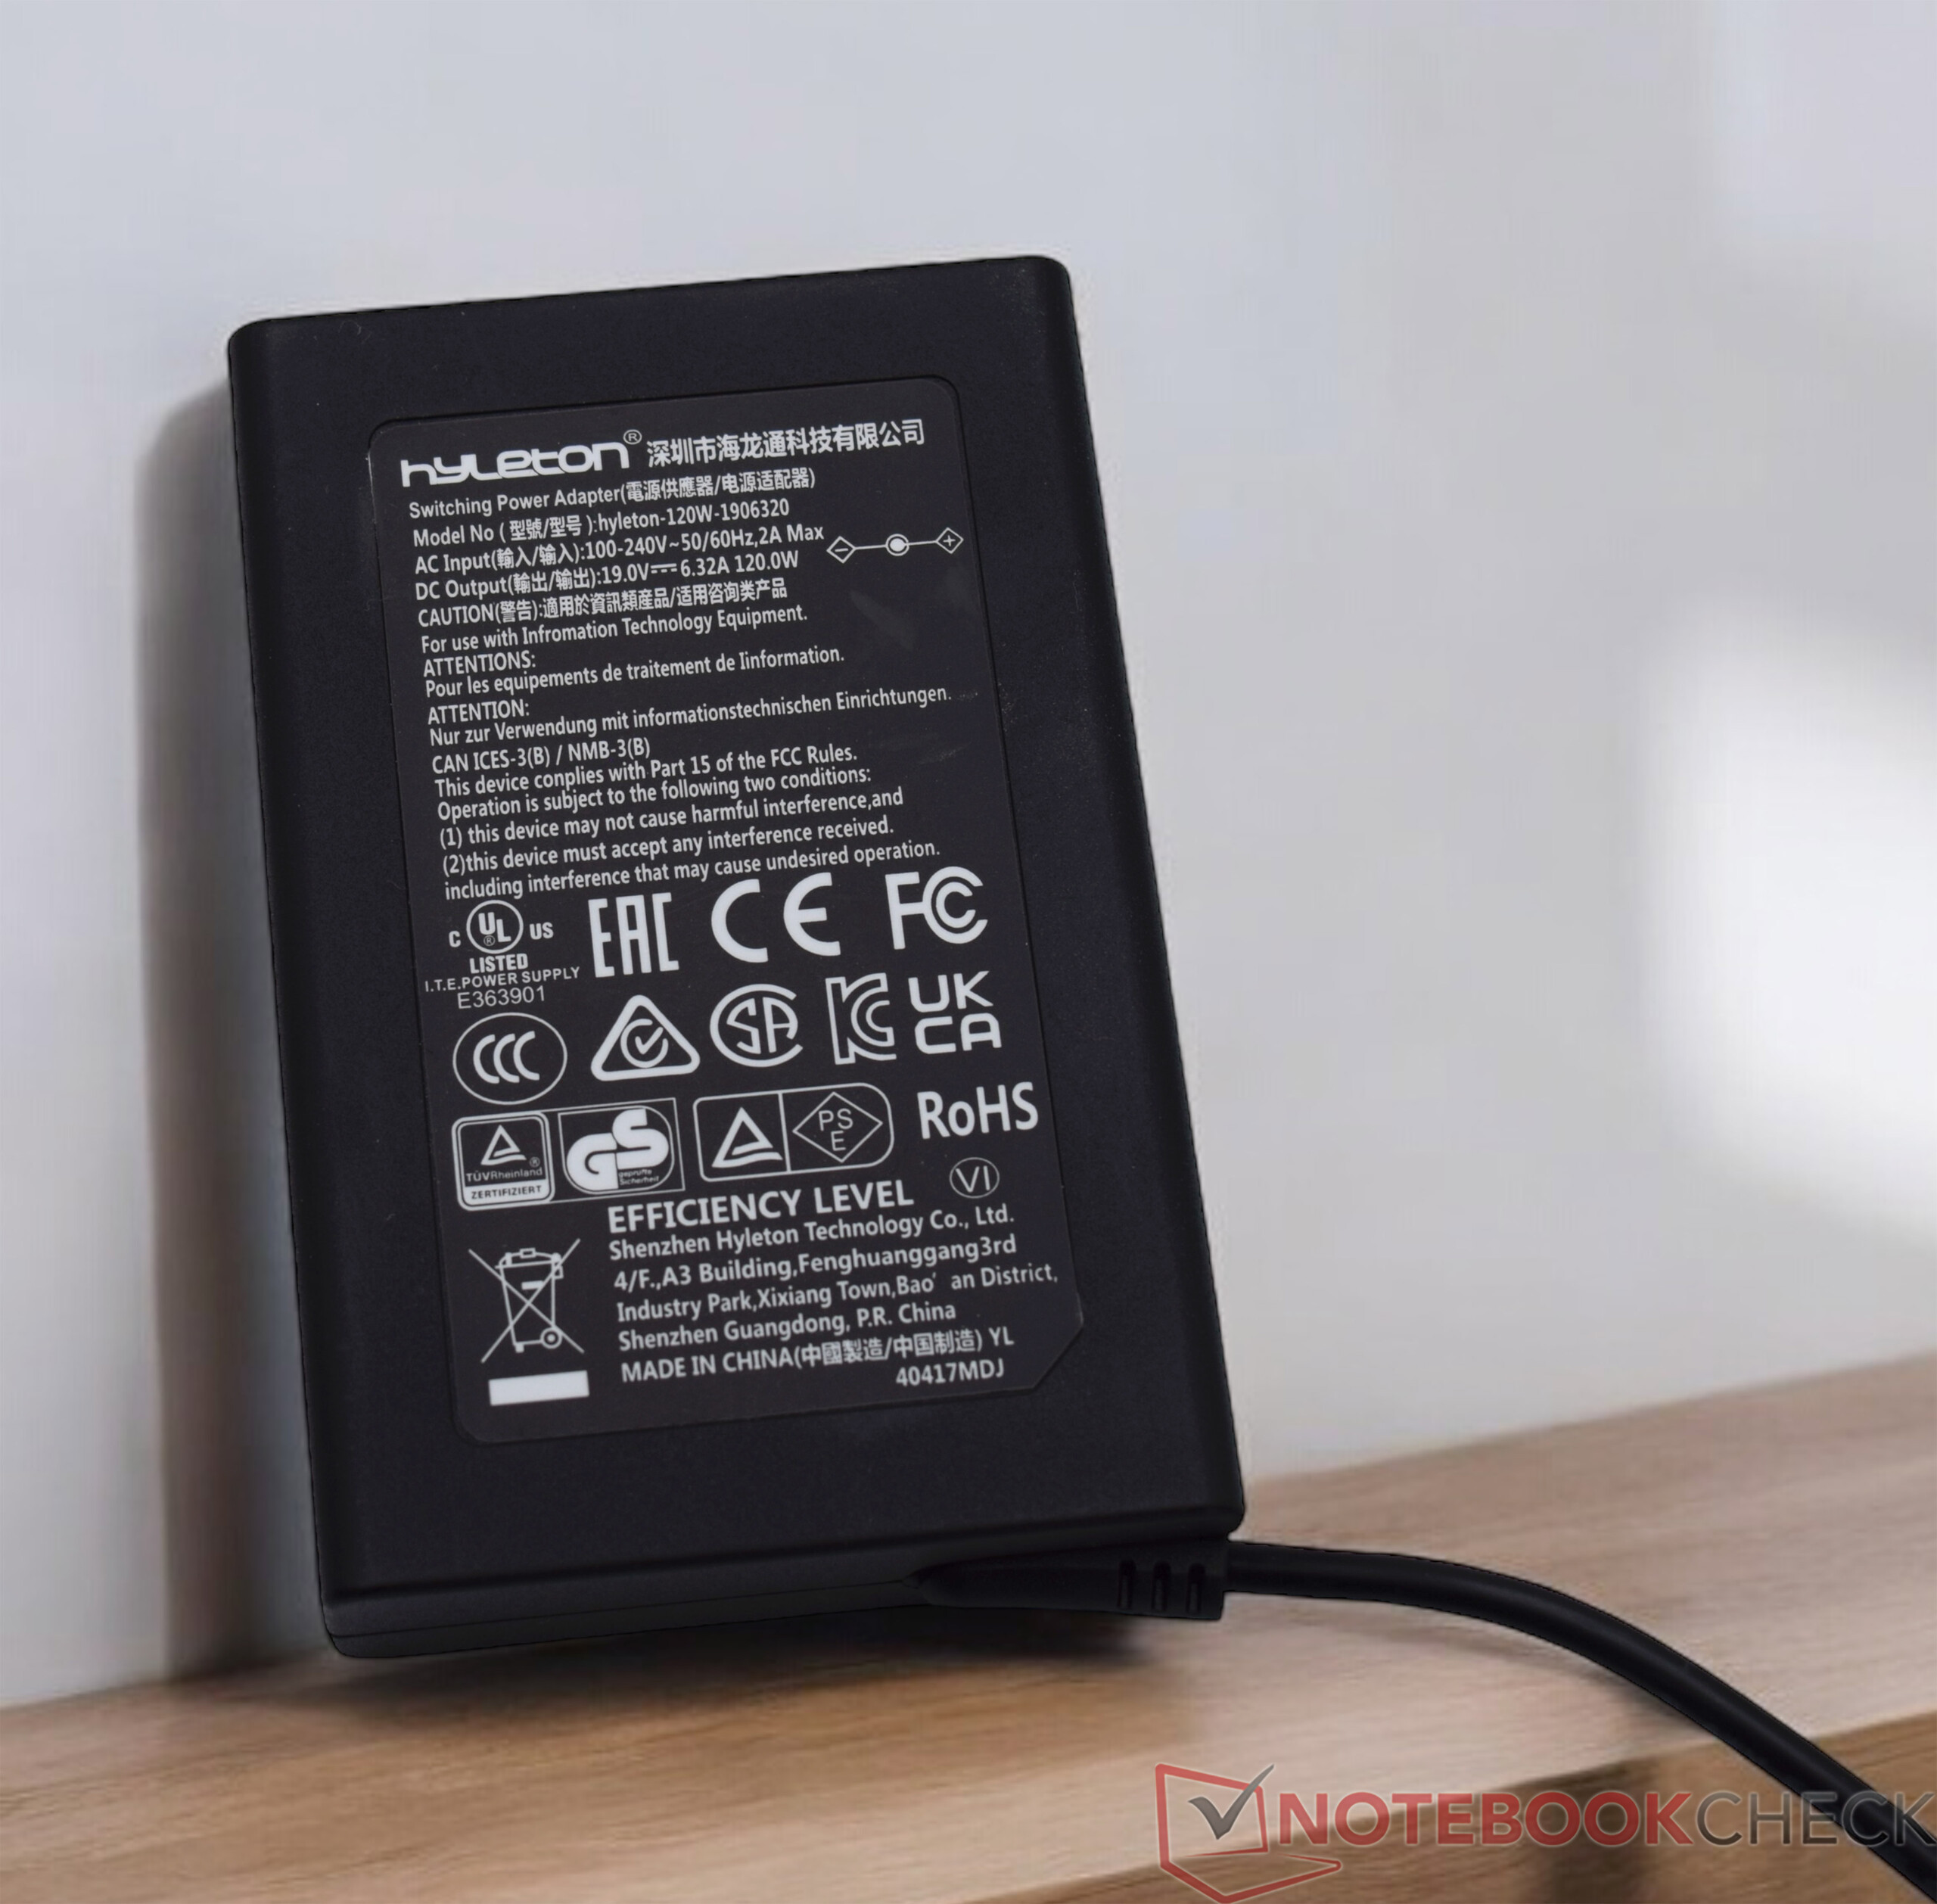
Zarządzanie energią
Jeśli chodzi o zużycie energii, Geekom AE7 zaskakuje niskimi wartościami w trybie bezczynności. Nawet Geekom A5, jak również Geekom A8uzyskały tutaj dobre wyniki. Jednak przy średnim obciążeniu zasilacz musi dostarczyć prawie 82 waty, mimo że nasze urządzenie pomiarowe pokazywało nieco ponad 100 watów w szczycie. Oznacza to, że Geekom AE7 nie jest jednym z najbardziej ekonomicznych mini-PC. Jednak w przeglądzie wydajności, który oceniamy za pomocą Cinebench, nasza próbka testowa wypada całkiem dobrze. Jedynie Geekom A8 oparty na procesorze AMD Ryzen 9 8945HS jest nieco wydajniejszy.
Znamy już 120-watowy zasilacz, który jest dołączany do wielu mini-PC Geekom. Podczas testów nie mieliśmy żadnych problemów z zasilaczem.
| wyłączony / stan wstrzymania | |
| luz | |
| obciążenie |
|
Legenda:
min: | |
| Geekom AE7 R9 7940HS, Radeon 780M | Aoostar GEM12 R7 8845HS, Radeon 780M | Geekom GT13 Pro i9-13900H, Iris Xe G7 96EUs | Minisforum AtomMan X7 Ti Ultra 9 185H, Arc 8-Core | Geekom A8, R9 8945HS R9 8945HS, Radeon 780M | Acemagic F2A Ultra 7 155H, Arc 8-Core | Acemagic AM18 R7 7840HS, Radeon 780M | Geekom A5 R7 5800H, Vega 8 | Przeciętny AMD Radeon 780M | Średnia w klasie Mini PC | |
|---|---|---|---|---|---|---|---|---|---|---|
| Power Consumption | -45% | -52% | -55% | 12% | -55% | -69% | -19% | -16% | -62% | |
| Idle Minimum * (Watt) | 4.5 | 8.2 -82% | 7.9 -76% | 8.2 -82% | 3.2 29% | 9.1 -102% | 9.8 -118% | 6.9 -53% | 6.01 ? -34% | 9 ? -100% |
| Idle Average * (Watt) | 4.7 | 10 -113% | 10.3 -119% | 12.1 -157% | 4.9 -4% | 10.3 -119% | 11.5 -145% | 7.9 -68% | 8.15 ? -73% | 11.2 ? -138% |
| Idle Maximum * (Watt) | 8.1 | 14.6 -80% | 22.3 -175% | 14 -73% | 6.8 16% | 14.4 -78% | 15.3 -89% | 8.9 -10% | 10.3 ? -27% | 14.4 ? -78% |
| Load Average * (Watt) | 81.8 | 73.9 10% | 57.44 30% | 53.1 35% | 71.3 13% | 54.9 33% | 75.3 8% | 60.8 26% | 57.6 ? 30% | 65.2 ? 20% |
| Cyberpunk 2077 ultra external monitor * (Watt) | 71.2 | 79.9 -12% | 55.9 21% | |||||||
| Load Maximum * (Watt) | 100.3 | 95.3 5% | 93.4 7% | 100.4 -0% | 93.2 7% | 110.4 -10% | 102.8 -2% | 89.7 11% | 77 ? 23% | 112.8 ? -12% |
* ... im mniej tym lepiej
Efficiency
| Performance rating - Percent | |
| Geekom A8, R9 8945HS | |
| Geekom AE7 | |
| Minisforum AtomMan X7 Ti | |
| Geekom GT13 Pro | |
| Acemagic F2A | |
| Power Consumption | |
| Cinebench R23 Multi Power Efficiency - external Monitor | |
| Geekom A8, R9 8945HS | |
| Geekom AE7 | |
| Geekom GT13 Pro | |
| Minisforum AtomMan X7 Ti | |
| Acemagic F2A | |
| Cinebench R23 Single Power Efficiency - external Monitor | |
| Geekom A8, R9 8945HS | |
| Geekom AE7 | |
| Minisforum AtomMan X7 Ti | |
| Geekom GT13 Pro | |
| Acemagic F2A | |
| Cinebench R15 Multi Efficiency (external Monitor) | |
| Geekom A8, R9 8945HS | |
| Geekom AE7 | |
| Minisforum AtomMan X7 Ti | |
| Acemagic F2A | |
| Geekom GT13 Pro | |
Power consumtion with external monitor
Power consumtion with external monitor
Za
Przeciw
Werdykt - Znajoma obudowa w połączeniu z nowym procesorem
Geekom AE7 to niepozorny mini-PC, który mimo to był w stanie zaimponować wysoką wydajnością w teście. Zewnętrznie Geekom zmienił jedynie kolor i tak już często używanej obudowy. Srebro dobrze prezentuje się na urządzeniu, nadając mini-PC elegancki i wysokiej jakości wygląd. Pod względem haptycznym Geekom ustawił już poprzeczkę bardzo wysoko w nowszych modelach, a Geekom AE7 musi teraz zostać zmierzony z tym. Nasza próbka testowa wyraźnie przegrywa pojedynek, ponieważ obudowa wykonana w całości z aluminium daje zupełnie inne odczucia. Gdyby cena nie była w tym miejscu, w którym jest obecnie, nie byłoby potrzeby rozszerzania tematu do tego stopnia, ponieważ konkurencja z naszej własnej firmy jest tylko nieznacznie droższa lub nawet tańsza. Przykładem może być Geekom A8 z AMD Ryzen 7 8845HS już za 699 dolarów.
Geekom AE7 to potężny mini-PC oparty na procesorze AMD Ryzen 9 7940HS. Jednak zakurzona konstrukcja i mała jednostka chłodząca mogłyby zostać poprawione.
Samemu wykonaniu nie można nic zarzucić. To samo tyczy się wydajności AMD Ryzen 9 7940HS, który może również stabilnie pracować pod obciążeniem do 45 watów. Na wyposażeniu znalazło się również 32 GB pamięci RAM DDR5 oraz dysk SSD o pojemności 1 TB, który poradzi sobie z większością zadań. Imponująca jest również łączność zewnętrzna, która obejmuje USB4. Tymczasem wiele nowoczesnych urządzeń oferuje opcję nieco wyższej przepustowości do wykorzystania zewnętrznych kart graficznych z OCuLink. Geekom nie ma jeszcze takiego rozwiązania w swoim portfolio, dlatego też muszą Państwo polegać jedynie na nieco wolniejszym złączu USB4.
Podsumowując, Geekom AE7 to świetny mini-PC o przyzwoitej wydajności. Jednostka chłodząca, która zawsze była wyraźnie słyszalna, mogłaby zostać ulepszona. Można temu zaradzić za pomocą trybu cichego, który trzeba najpierw aktywować w BIOS-ie. Większy wentylator byłby pożądany, ale skutkowałby znacznie większą obudową. Przykładem może być Aoostar GEM12. Jest ona tylko nieznacznie większa, ale oferuje znacznie wydajniejszy układ chłodzenia, który działa również znacznie ciszej.
Uwaga: Niedawno zaktualizowaliśmy nasz system oceny i wyniki wersji 8 nie są porównywalne z wynikami wersji 7. Więcej informacji można znaleźć tutaj.
Cena i dostępność
Producent oferuje Geekom AE7 w swoim sklepie internetowym w cenie 740 euro(664 USD w USA). W Stanach Zjednoczonych zainteresowani użytkownicy mogą zamówić mini-PC za pośrednictwem Amazon.
Geekom AE7
- 14/07/2024 v8
Sebastian Bade
 Total Sustainability Score:
 Przezroczystość
Wyboru urządzeń do recenzji dokonuje nasza redakcja. Próbka testowa została udostępniona autorowi przez producenta bezpłatnie do celów recenzji. Na tę recenzję nie miały wpływu osoby trzecie, a producent nie otrzymał kopii tej recenzji przed publikacją. Nie było obowiązku publikowania tej recenzji. Jako niezależna firma medialna, Notebookcheck nie podlega władzy producentów, sprzedawców detalicznych ani wydawców.
Tak testuje Notebookcheck
Każdego roku Notebookcheck niezależnie sprawdza setki laptopów i smartfonów, stosując standardowe procedury, aby zapewnić porównywalność wszystkich wyników. Od około 20 lat stale rozwijamy nasze metody badawcze, ustanawiając przy tym standardy branżowe. W naszych laboratoriach testowych doświadczeni technicy i redaktorzy korzystają z wysokiej jakości sprzętu pomiarowego. Testy te obejmują wieloetapowy proces walidacji. Nasz kompleksowy system ocen opiera się na setkach uzasadnionych pomiarów i benchmarków, co pozwala zachować obiektywizm.Price comparison
