Recenzja laptopa Lenovo ThinkBook 13x G4: Jeden z najlepszych subnotebooków poza klawiaturą
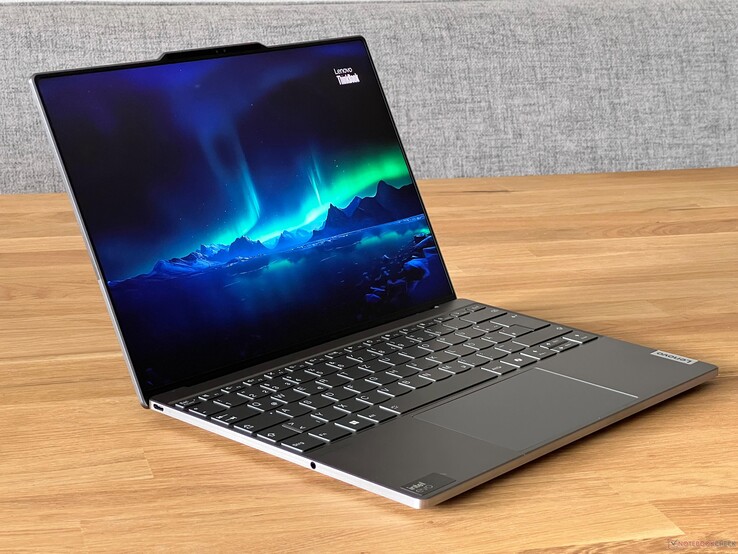
Modele z serii ThinkBook skierowane są przede wszystkim do klientów biznesowych, którzy nie chcą przeznaczać wysokich cen ThinkPadów dla swoich pracowników. Nowy ThinkBook 13x G4 to kompaktowy subnotebook, który może zainteresować również indywidualnych nabywców, gdyż oferuje przyzwoitą wydajność, pojemną baterię, wyświetlacz IPS o wysokiej rozdzielczości i proporcjach 3:2 z matową powierzchnią oraz aluminiową obudowę w cenie około 1100 dolarów
Nasz testowy model ThinkBook 13x G4 nosi numer modelu 21KR0008GE i jest wyposażony w następujące procesory Core Ultra 5 125H16 GB pamięci RAM, 512 GB pamięci masowej SSD i wyświetlaczem 2,8K (2880 x 1920) za 1 106 USD.
Potencjalni konkurenci w porównaniu
Ocena | Data | Model | Waga | Wysokość | Rozmiar | Rezolucja | Cena |
|---|---|---|---|---|---|---|---|
| 90.1 % v7 (old) | 05/2024 | Lenovo ThinkBook 13x G4 21KR0008GE Ultra 5 125H, Arc 7-Core | 1.2 kg | 12.9 mm | 13.50" | 2880x1920 | |
| 86.5 % v7 (old) | 05/2024 | Dell XPS 13 9340 Core Ultra 7 Ultra 7 155H, Arc 8-Core | 1.2 kg | 15.3 mm | 13.40" | 1920x1200 | |
| 92.4 % v7 (old) | 03/2024 | Apple MacBook Air 13 M3 10C GPU M3, M3 10-Core GPU | 1.2 kg | 11.3 mm | 13.60" | 2560x1664 | |
| 86.6 % v7 (old) | 03/2024 | MSI Prestige 13 AI Evo Ultra 7 155H, Arc 8-Core | 967 g | 16.9 mm | 13.30" | 2880x1800 | |
| 89.5 % v7 (old) | 01/2024 | Lenovo ThinkPad Z13 Gen 2 R7 PRO 7840U, Radeon 780M | 1.2 kg | 13.99 mm | 13.30" | 2880x1800 | |
| 91.9 % v7 (old) | 07/2023 | HP Dragonfly G4 i7-1365U, Iris Xe G7 96EUs | 1.1 kg | 16.3 mm | 13.50" | 1920x1280 |
Obudowa - ThinkBook z aluminiową obudową
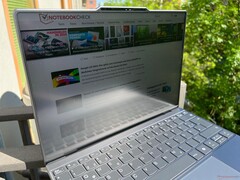
Zasadniczo konstrukcja ThinkBooka 13x G4 nie różni się od jego tańszego rodzeństwa, ponieważ srebrno-szara obudowa ma dwukolorową pokrywę z dużymi napisami i na pierwszy rzut oka wygląda bardzo prosto. Podczas gdy tańsze modele, takie jak ThinkBook 16 G6, zwykle mają tylko aluminiową pokrywę ekranu, a reszta obudowy jest wykonana z tworzywa sztucznego, ThinkBook 13x G4 również wykorzystuje aluminium w jednostce bazowej. Boki jednostki bazowej są polerowane, a urządzenie ma ogólnie bardzo wysokiej jakości wygląd. Podstawa nie jest zwężana po bokach, co sprawia, że urządzenie wydaje się nieco bardziej masywne niż jest w rzeczywistości.
Podobnie jak wszystkie inne modele, Lenovo wykorzystuje garb kamery, który tutaj wygląda na bardzo duży. Nie wygląda to ładnie, ale przynajmniej pomaga przy otwieraniu pokrywy. Dwie rzeczy rzucają się w oczy podczas otwierania pokrywy: bardzo wąskie krawędzie ekranu i znacznie ograniczony kąt otwarcia wynoszący maksymalnie 135 stopni w porównaniu do ThinkPadów. Niemniej jednak same zawiasy są dobrze wyregulowane i utrzymują pokrywę bezpiecznie na miejscu, poza minimalną ilością kołysania podczas regulacji kąta. Pomimo cienkiej konstrukcji, pokrywa jest bardzo stabilna i nie byliśmy w stanie wywołać żadnych błędów lub zniekształceń obrazu. Stabilność jednostki bazowej jest doskonała i tylko środkowy obszar klawiatury lekko ugina się pod naciskiem. Nie wykryliśmy żadnych odgłosów skrzypienia. Jakość wykonania również nie daje powodów do krytyki.
Jak opisano wcześniej, ThinkBook 13x G4 wydaje się nieco grubszy ze względu na swoją konstrukcję, ale pozory mylą i przy wysokości zaledwie 12,9 mm jest jednym z najcieńszych urządzeń w naszej grupie porównawczej i podcięty tylko przez MacBook Air M3. Z drugiej strony, laptop Lenovo zajmuje mniej miejsca na biurku niż Air M3, a także jest jednym z najbardziej kompaktowych modeli, dzięki czemu można go łatwo schować w każdej torbie. Jednak przy wadze 1,2 kg jest to również jedno z najcięższych urządzeń tutaj, a 65-watowy zasilacz wtykowy dodaje kolejne 191 gramów. Oficjalny arkusz danych wspomina również o modelu magnezowym o wadze około 1 kg, ale nie byliśmy w stanie znaleźć odpowiedniej konfiguracji.
Wyposażenie - 3x Thunderbolt 4
Lenovo wyposaża ThinkBooka 13x G4 w trzy szybkie porty USB-C, w tym Thunderbolt 4. Ich rozmieszczenie na początku wydaje się nieco nietypowe, ale w praktyce okazuje się całkiem praktyczne. Jeden z portów znajduje się z przodu po prawej stronie, gdzie można łatwo podłączyć pamięci USB, a urządzenie można ładować po obu stronach. W przypadku urządzeń USB-A wymagane są jednak przejściówki, nie ma też czytnika kart. Istnieją opcjonalne modele z połączeniem Lenovo Magic Bay, w którym to przypadku garb kamery jest grubszy i wyposażony w kołki pogo. W tym miejscu można podłączyć opcjonalne akcesoria, takie jak kamera internetowa 4K.
Komunikacja
Moduł WiFi 7 nie jest jeszcze zainstalowany w ThinkBooku 13x G4, ale dobrze znany moduł AX211 firmy Intel jest. Obsługuje on WiFi 6E, a także Bluetooth 5.3. W testach z naszym routerem referencyjnym Asus, prędkości transferu były bardzo wysokie i stabilne. Nie mieliśmy również problemów ze stabilnością sygnału.
| Networking | |
| Lenovo ThinkBook 13x G4 21KR0008GE | |
| iperf3 transmit AXE11000 | |
| iperf3 receive AXE11000 | |
| Dell XPS 13 9340 Core Ultra 7 | |
| iperf3 transmit AXE11000 | |
| iperf3 receive AXE11000 | |
| Apple MacBook Air 13 M3 10C GPU | |
| iperf3 transmit AXE11000 | |
| iperf3 receive AXE11000 | |
| MSI Prestige 13 AI Evo | |
| iperf3 transmit AXE11000 | |
| iperf3 receive AXE11000 | |
| Lenovo ThinkPad Z13 Gen 2 | |
| iperf3 transmit AXE11000 | |
| iperf3 receive AXE11000 | |
| iperf3 transmit AXE11000 6GHz | |
| iperf3 receive AXE11000 6GHz | |
| HP Dragonfly G4 | |
| iperf3 transmit AXE11000 | |
| iperf3 receive AXE11000 | |
| iperf3 transmit AXE11000 6GHz | |
| iperf3 receive AXE11000 6GHz | |
Kamera internetowa
Kamera internetowa 1080p w górnej ramce wyświetlacza spełnia swoje zadanie, ale nie należy oczekiwać cudów. Jest też czujnik podczerwieni do rozpoznawania twarzy przez Windows Hello.

Konserwacja
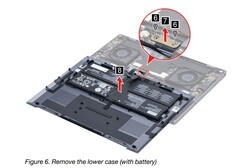
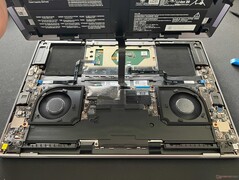
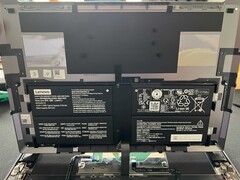
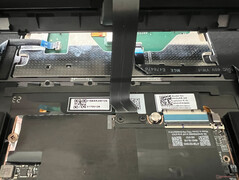
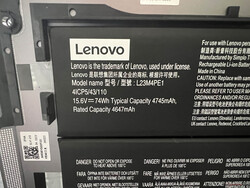
Byliśmy zaskoczeni, gdy otworzyliśmy obudowę: chociaż płytę bazową można łatwo zdjąć, opcje konserwacji są znacznie ograniczone. Bateria jest przymocowana do pokrywy podstawy i podłączona do płyty głównej za pomocą kabla taśmowego, który jest również przykręcony na miejscu. Jest to również opisane w instrukcji konserwacji, ale procedura może okazać się kłopotliwa dla niedoświadczonych użytkowników.
Urządzenia wejściowe - Haptyczny touchpad, ale słaba klawiatura
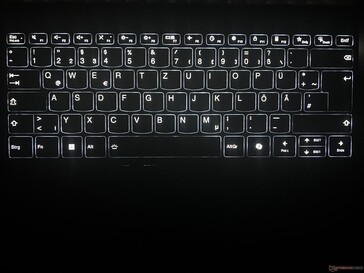
Klawiatura jest jednym ze słabszych punktów ThinkBooka 13x G4, gdyż skok klawiszy jest bardzo krótki, a pisanie niezbyt komfortowe. Same naciśnięcia klawiszy są precyzyjne i niezbyt głośne, ale jeśli dużo piszemy i jesteśmy przyzwyczajeni do klawiatury z większym skokiem klawiszy, to przed zakupem warto przetestować jej działanie. Układ klawiszy jest prosty i jest też klawisz drugiego pilota, choć klawisze strzałek pionowych są dość małe. Dostępne jest dwustopniowe białe podświetlenie, które może być również aktywowane automatycznie za pomocą czujnika.
Do sterowania wskaźnikiem dostępny jest haptyczny touchpad, który zapewnia sprzężenie zwrotne za pośrednictwem silników wibracyjnych. Działa to bardzo dobrze, ale odgłos kliknięcia mógłby być nieco cichszy. Zaletą tego rozwiązania jest to, że można kliknąć w dowolnym miejscu na podkładce i uzyskać taką samą informację zwrotną. Właściwości ślizgowe szklanej powierzchni są doskonałe. Przy wymiarach 12 x 7,5 cm jest wystarczająco dużo miejsca na ruchy/gesty.
Wyświetlacz - 2,8K IPS z odświeżaniem 120 Hz
Lenovo zrezygnowało z ekranu OLED w ThinkBooku 13x G4 i zamiast tego zainstalowało panel IPS o wysokiej rozdzielczości w formacie 3:2. Dzięki rozdzielczości 2880 x 1920 wszystkie treści są bardzo ostre, a kolory żywe, nawet jeśli nie na poziomie OLED. Ogólnie rzecz biorąc, subiektywna jakość obrazu jest bardzo dobra, ponieważ jasne obszary nie wydają się ziarniste, a ruchy korzystają ze zwiększonej częstotliwości. Brak migotania PWM jest również dużą zaletą, a czasy reakcji są również niepozorne. Zarówno jasność, jak i temperatura barwowa są automatycznie regulowane za pomocą czujnika.
Średnia jasność wynosi 513 cd/m², a poziom czerni jest nieco wyższy i wynosi 0,38 cd/m², ale i tak przekłada się to na bardzo dobry współczynnik kontrastu. Halo nie stanowi większego problemu, a panel obsługuje również treści HDR, ale maksymalna jasność to nadal 540 cd/m².
| |||||||||||||||||||||||||
rozświetlenie: 89 %
na akumulatorze: 539 cd/m²
kontrast: 1418:1 (czerń: 0.38 cd/m²)
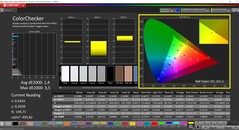
ΔE Color 1.4 | 0.5-29.43 Ø4.87, calibrated: 0.7
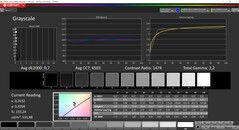
ΔE Greyscale 2.2 | 0.5-98 Ø5.1
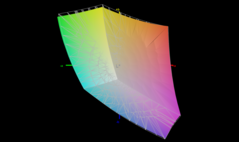
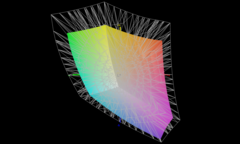
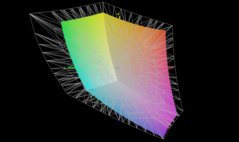
67.7% AdobeRGB 1998 (Argyll 2.2.0 3D)
97.3% sRGB (Argyll 2.2.0 3D)
65.5% Display P3 (Argyll 2.2.0 3D)
Gamma: 2.19
| Lenovo ThinkBook 13x G4 21KR0008GE LEN135WQ+, IPS, 2880x1920, 13.5" | Dell XPS 13 9340 Core Ultra 7 SHP1593, IPS, 1920x1200, 13.4" | Apple MacBook Air 13 M3 10C GPU IPS, 2560x1664, 13.6" | MSI Prestige 13 AI Evo ATNA33AA07-0, OLED, 2880x1800, 13.3" | Lenovo ThinkPad Z13 Gen 2 ATNA33AA02-0, OLED, 2880x1800, 13.3" | HP Dragonfly G4 Chi Mei CMN13C0, IPS, 1920x1280, 13.5" | |
|---|---|---|---|---|---|---|
| Display | 4% | 28% | 33% | 33% | 3% | |
| Display P3 Coverage | 65.5 | 69.4 6% | 98.4 50% | 99.9 53% | 99.7 52% | 68.4 4% |
| sRGB Coverage | 97.3 | 97.8 1% | 99.9 3% | 100 3% | 100 3% | 98.3 1% |
| AdobeRGB 1998 Coverage | 67.7 | 71.7 6% | 87.9 30% | 97.8 44% | 97.3 44% | 70.4 4% |
| Response Times | -87% | -70% | 92% | 88% | -112% | |
| Response Time Grey 50% / Grey 80% * | 27.3 ? | 43.2 ? -58% | 34.5 ? -26% | 1.54 ? 94% | 2.1 ? 92% | 48.8 ? -79% |
| Response Time Black / White * | 12.8 ? | 27.6 ? -116% | 27.2 ? -113% | 1.44 ? 89% | 2.2 ? 83% | 31.3 ? -145% |
| PWM Frequency | 240 ? | 60.1 ? | ||||
| Screen | -40% | 1% | -11% | 7% | -9% | |
| Brightness middle | 539 | 429 -20% | 525 -3% | 404 -25% | 372 -31% | 408.8 -24% |
| Brightness | 513 | 407 -21% | 506 -1% | 407 -21% | 375 -27% | 399 -22% |
| Brightness Distribution | 89 | 90 1% | 92 3% | 98 10% | 99 11% | 90 1% |
| Black Level * | 0.38 | 0.28 26% | 0.42 -11% | 0.32 16% | ||
| Contrast | 1418 | 1532 8% | 1250 -12% | 1278 -10% | ||
| Colorchecker dE 2000 * | 1.4 | 2.6 -86% | 1.4 -0% | 2.1 -50% | 0.88 37% | 2.02 -44% |
| Colorchecker dE 2000 max. * | 3.5 | 6.6 -89% | 2.8 20% | 4.3 -23% | 3.22 8% | 3.84 -10% |
| Colorchecker dE 2000 calibrated * | 0.7 | 1.4 -100% | 0.61 13% | |||
| Greyscale dE 2000 * | 2.2 | 4 -82% | 2 9% | 1.2 45% | 1.2 45% | 2.3 -5% |
| Gamma | 2.19 100% | 2.23 99% | 2.2 100% | 2.16 102% | 2.18 101% | 2.2 100% |
| CCT | 6710 97% | 7332 89% | 6876 95% | 6465 101% | 6326 103% | 6203 105% |
| Całkowita średnia (program / ustawienia) | -41% /
-37% | -14% /
-4% | 38% /
20% | 43% /
29% | -39% /
-21% |
* ... im mniej tym lepiej
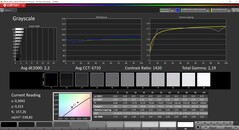
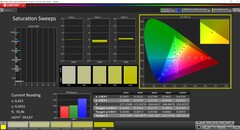
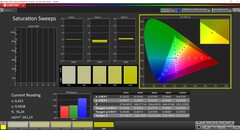
Wyświetlacz jest już fabrycznie dobrze wyregulowany, a nasza analiza za pomocą profesjonalnego oprogramowania CalMAN (X-Rite i1 Pro 2) wykazała jedynie minimalny niebieski odcień, który nie jest zauważalny w praktyce. Wszystkie kolory są już poniżej ważnego progu DeltaE-2000 wynoszącego 3 w porównaniu do referencyjnej przestrzeni kolorów sRGB, więc kalibracja nie jest absolutnie konieczna. Byliśmy w stanie nieco poprawić wyświetlanie dzięki naszej własnej kalibracji (odpowiedni profil jest dostępny do bezpłatnego pobrania powyżej), a także wyeliminować minimalny rzut kolorów. Przestrzeń kolorów sRGB jest prawie całkowicie pokryta, więc ThinkBook nadaje się do edycji wideo i zdjęć.
Wyświetl czasy reakcji
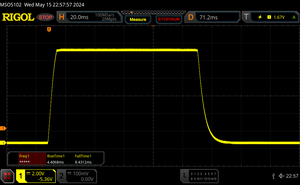
| ↔ Czas reakcji od czerni do bieli | ||
|---|---|---|
| 12.8 ms ... wzrost ↗ i spadek ↘ łącznie | ↗ 4.4 ms wzrost | |
| ↘ 8.4 ms upadek | ||
| W naszych testach ekran wykazuje dobry współczynnik reakcji, ale może być zbyt wolny dla graczy rywalizujących ze sobą. Dla porównania, wszystkie testowane urządzenia wahają się od 0.1 (minimum) do 240 (maksimum) ms. » 30 % wszystkich urządzeń jest lepszych. Oznacza to, że zmierzony czas reakcji jest lepszy od średniej wszystkich testowanych urządzeń (20.8 ms). | ||
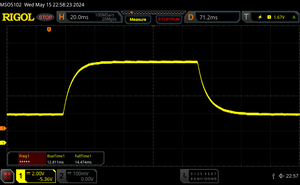
| ↔ Czas reakcji 50% szarości do 80% szarości | ||
| 27.3 ms ... wzrost ↗ i spadek ↘ łącznie | ↗ 12.8 ms wzrost | |
| ↘ 14.5 ms upadek | ||
| W naszych testach ekran wykazuje stosunkowo powolne tempo reakcji i może być zbyt wolny dla graczy. Dla porównania, wszystkie testowane urządzenia wahają się od 0.165 (minimum) do 636 (maksimum) ms. » 34 % wszystkich urządzeń jest lepszych. Oznacza to, że zmierzony czas reakcji jest lepszy od średniej wszystkich testowanych urządzeń (32.5 ms). | ||
Migotanie ekranu / PWM (modulacja szerokości impulsu)
| Migotanie ekranu/nie wykryto PWM | |||
Dla porównania: 53 % wszystkich testowanych urządzeń nie używa PWM do przyciemniania wyświetlacza. Jeśli wykryto PWM, zmierzono średnio 8516 (minimum: 5 - maksimum: 343500) Hz. | |||
Wydajność - Core Ultra i do 32 GB pamięci RAM
Co ciekawe, Lenovo oferuje ThinkBooka 13x G4 tylko z procesorem Core Ultra 5 125H lub z Core Ultra 9 185Hale popularny Core Ultra 7 155H nie jest dostępny. Muszą Państwo również wybrać Core Ultra 9, aby rozszerzyć pamięć RAM z 16 do 32 GB, co wiąże się z umiarkowanymi dopłatami.
Warunki testowania
Jak zwykle Lenovo oferuje różne tryby zasilania i w przeciwieństwie do modeli ThinkPad, nie są one bezpośrednio powiązane z ustawieniami zasilania systemu Windows. Profile można przełączać za pomocą preinstalowanego oprogramowania Vantage lub kombinacji klawiszy Fn + Q. W poniższej tabeli wymieniliśmy odpowiadające im wartości TDP. Do naszych testów wykorzystaliśmy profil Auto, który jest domyślnie aktywny.
| Tryb zasilania | TDP | CB R23 Multi | Time Spy Grafika | maks. głośność wentylatora |
|---|---|---|---|---|
| Oszczędzanie baterii | 44 -> 18 watów | 5,536 punktów | 2,471 punktów | 33.9 dB(A) |
| Auto | 51 -> 28 watów | 9,194 punktów | 3,248 punktów | 40.7 dB(A) -> 36.8 dB(A) |
| Wydajność | 51 -> 35 watów | 12 188 punktów | 3 382 punktów | 42,5 dB(A) |
W trybie wydajności procesor działa znacznie dłużej przy mocy 51 W, podczas gdy w trybie automatycznym jest to tylko kilka sekund. Jeśli potrzebują Państwo maksymalnej wydajności procesora, warto skorzystać z tego trybu. W przypadku mniej wymagających zadań w codziennym życiu można bez wahania korzystać z trybu oszczędzania baterii i korzystać z cichszych wentylatorów.
Procesor - Core Ultra 5 125H
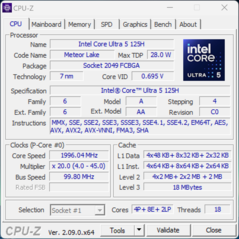
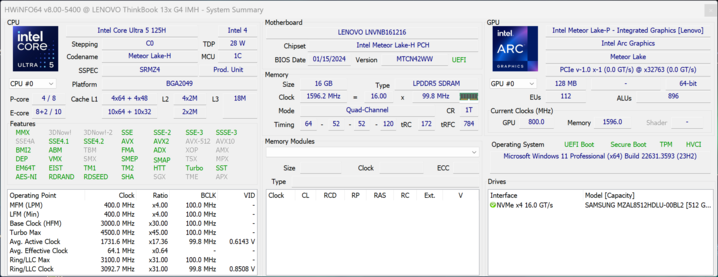
The Core Ultra 5 125H w naszym urządzeniu testowym należy do obecnej generacji Meteor Lake Intela i oferuje dwa wydajne rdzenie mniej niż powszechnie używany Core Ultra 7 155H. Cztery istniejące rdzenie P również osiągają niższą maksymalną częstotliwość taktowania do 4,5 GHz. W ThinkBooku procesor zużywa do 51 watów przez kilka sekund, zanim ustabilizuje się na poziomie 28 watów, co wyraźnie widać w naszej pętli Cinebench. Ten poziom wydajności jest całkowicie wystarczający do codziennych zadań, ale wyniki nie są naprawdę dobre, a Core Ultra 5 nie ma szans w starciu z procesorem Zen4 od AMD. Apple chłodzonym pasywnie M3 również oferuje lepszą wydajność, zarówno w testach jedno-, jak i wielordzeniowych. W trybie bateryjnym procesor może również zużywać do 51 watów, ale potem szybko spada do 25 watów, dlatego też wydajność jest tutaj nieco niższa niż przy zasilaniu sieciowym (-4%). Dalsze testy porównawcze procesora są dostępne w naszej sekcja techniczna.
Cinebench R15 Multi Sustained Load
Cinebench R23: Multi Core | Single Core
Cinebench R20: CPU (Multi Core) | CPU (Single Core)
Cinebench R15: CPU Multi 64Bit | CPU Single 64Bit
Blender: v2.79 BMW27 CPU
7-Zip 18.03: 7z b 4 | 7z b 4 -mmt1
Geekbench 6.4: Multi-Core | Single-Core
Geekbench 5.5: Multi-Core | Single-Core
HWBOT x265 Benchmark v2.2: 4k Preset
LibreOffice : 20 Documents To PDF
R Benchmark 2.5: Overall mean
| CPU Performance Rating | |
| Lenovo ThinkPad Z13 Gen 2 | |
| Apple MacBook Air 13 M3 10C GPU -9! | |
| Dell XPS 13 9340 Core Ultra 7 | |
| Średnia w klasie Subnotebook | |
| MSI Prestige 13 AI Evo | |
| Przeciętny Intel Core Ultra 5 125H | |
| Lenovo ThinkBook 13x G4 21KR0008GE -1! | |
| HP Dragonfly G4 -2! | |
| Cinebench R23 / Multi Core | |
| Lenovo ThinkPad Z13 Gen 2 | |
| Dell XPS 13 9340 Core Ultra 7 | |
| Przeciętny Intel Core Ultra 5 125H (9194 - 14564, n=6) | |
| Średnia w klasie Subnotebook (1555 - 21812, n=75, ostatnie 2 lata) | |
| Apple MacBook Air 13 M3 10C GPU | |
| MSI Prestige 13 AI Evo | |
| Lenovo ThinkBook 13x G4 21KR0008GE | |
| HP Dragonfly G4 | |
| Cinebench R23 / Single Core | |
| Apple MacBook Air 13 M3 10C GPU | |
| HP Dragonfly G4 | |
| Lenovo ThinkPad Z13 Gen 2 | |
| Dell XPS 13 9340 Core Ultra 7 | |
| Średnia w klasie Subnotebook (358 - 2165, n=75, ostatnie 2 lata) | |
| MSI Prestige 13 AI Evo | |
| Przeciętny Intel Core Ultra 5 125H (1549 - 1735, n=6) | |
| Lenovo ThinkBook 13x G4 21KR0008GE | |
| Cinebench R20 / CPU (Multi Core) | |
| Lenovo ThinkPad Z13 Gen 2 | |
| Dell XPS 13 9340 Core Ultra 7 | |
| Przeciętny Intel Core Ultra 5 125H (3673 - 5618, n=6) | |
| Średnia w klasie Subnotebook (579 - 8541, n=70, ostatnie 2 lata) | |
| MSI Prestige 13 AI Evo | |
| Lenovo ThinkBook 13x G4 21KR0008GE | |
| HP Dragonfly G4 | |
| Cinebench R20 / CPU (Single Core) | |
| HP Dragonfly G4 | |
| Lenovo ThinkPad Z13 Gen 2 | |
| Dell XPS 13 9340 Core Ultra 7 | |
| Lenovo ThinkBook 13x G4 21KR0008GE | |
| Przeciętny Intel Core Ultra 5 125H (622 - 664, n=6) | |
| Średnia w klasie Subnotebook (128 - 826, n=70, ostatnie 2 lata) | |
| MSI Prestige 13 AI Evo | |
| Cinebench R15 / CPU Multi 64Bit | |
| Dell XPS 13 9340 Core Ultra 7 | |
| Lenovo ThinkPad Z13 Gen 2 | |
| MSI Prestige 13 AI Evo | |
| Przeciętny Intel Core Ultra 5 125H (1700 - 2245, n=6) | |
| Średnia w klasie Subnotebook (327 - 3345, n=75, ostatnie 2 lata) | |
| Lenovo ThinkBook 13x G4 21KR0008GE | |
| HP Dragonfly G4 | |
| Cinebench R15 / CPU Single 64Bit | |
| Lenovo ThinkPad Z13 Gen 2 | |
| HP Dragonfly G4 | |
| Dell XPS 13 9340 Core Ultra 7 | |
| Średnia w klasie Subnotebook (72.4 - 322, n=71, ostatnie 2 lata) | |
| Lenovo ThinkBook 13x G4 21KR0008GE | |
| Przeciętny Intel Core Ultra 5 125H (235 - 251, n=6) | |
| MSI Prestige 13 AI Evo | |
| Blender / v2.79 BMW27 CPU | |
| Apple MacBook Air 13 M3 10C GPU | |
| HP Dragonfly G4 | |
| Średnia w klasie Subnotebook (159 - 2271, n=74, ostatnie 2 lata) | |
| Lenovo ThinkBook 13x G4 21KR0008GE | |
| MSI Prestige 13 AI Evo | |
| Przeciętny Intel Core Ultra 5 125H (228 - 364, n=6) | |
| Dell XPS 13 9340 Core Ultra 7 | |
| Lenovo ThinkPad Z13 Gen 2 | |
| 7-Zip 18.03 / 7z b 4 | |
| Lenovo ThinkPad Z13 Gen 2 | |
| Dell XPS 13 9340 Core Ultra 7 | |
| Średnia w klasie Subnotebook (11668 - 77867, n=66, ostatnie 2 lata) | |
| MSI Prestige 13 AI Evo | |
| HP Dragonfly G4 | |
| Przeciętny Intel Core Ultra 5 125H (0 - 0, n=2) | |
| 7-Zip 18.03 / 7z b 4 -mmt1 | |
| HP Dragonfly G4 | |
| Lenovo ThinkPad Z13 Gen 2 | |
| Średnia w klasie Subnotebook (2643 - 6442, n=68, ostatnie 2 lata) | |
| MSI Prestige 13 AI Evo | |
| Dell XPS 13 9340 Core Ultra 7 | |
| Lenovo ThinkBook 13x G4 21KR0008GE | |
| Przeciętny Intel Core Ultra 5 125H (4663 - 5136, n=6) | |
| Geekbench 6.4 / Multi-Core | |
| Lenovo ThinkPad Z13 Gen 2 | |
| Apple MacBook Air 13 M3 10C GPU | |
| Dell XPS 13 9340 Core Ultra 7 | |
| Średnia w klasie Subnotebook (2244 - 17489, n=72, ostatnie 2 lata) | |
| Przeciętny Intel Core Ultra 5 125H (11087 - 11749, n=6) | |
| Lenovo ThinkBook 13x G4 21KR0008GE | |
| MSI Prestige 13 AI Evo | |
| Geekbench 6.4 / Single-Core | |
| Apple MacBook Air 13 M3 10C GPU | |
| Średnia w klasie Subnotebook (960 - 3655, n=67, ostatnie 2 lata) | |
| Lenovo ThinkPad Z13 Gen 2 | |
| MSI Prestige 13 AI Evo | |
| Dell XPS 13 9340 Core Ultra 7 | |
| Lenovo ThinkBook 13x G4 21KR0008GE | |
| Przeciętny Intel Core Ultra 5 125H (2199 - 2316, n=6) | |
| Geekbench 5.5 / Multi-Core | |
| Dell XPS 13 9340 Core Ultra 7 | |
| Lenovo ThinkPad Z13 Gen 2 | |
| Apple MacBook Air 13 M3 10C GPU | |
| Przeciętny Intel Core Ultra 5 125H (9696 - 10856, n=6) | |
| Lenovo ThinkBook 13x G4 21KR0008GE | |
| Średnia w klasie Subnotebook (2557 - 17218, n=67, ostatnie 2 lata) | |
| MSI Prestige 13 AI Evo | |
| HP Dragonfly G4 | |
| Geekbench 5.5 / Single-Core | |
| Apple MacBook Air 13 M3 10C GPU | |
| HP Dragonfly G4 | |
| Lenovo ThinkPad Z13 Gen 2 | |
| Średnia w klasie Subnotebook (726 - 2350, n=67, ostatnie 2 lata) | |
| Dell XPS 13 9340 Core Ultra 7 | |
| MSI Prestige 13 AI Evo | |
| Lenovo ThinkBook 13x G4 21KR0008GE | |
| Przeciętny Intel Core Ultra 5 125H (1593 - 1699, n=6) | |
| HWBOT x265 Benchmark v2.2 / 4k Preset | |
| Lenovo ThinkPad Z13 Gen 2 | |
| Dell XPS 13 9340 Core Ultra 7 | |
| Przeciętny Intel Core Ultra 5 125H (9.7 - 16.7, n=6) | |
| Średnia w klasie Subnotebook (0.97 - 25.1, n=69, ostatnie 2 lata) | |
| MSI Prestige 13 AI Evo | |
| Lenovo ThinkBook 13x G4 21KR0008GE | |
| HP Dragonfly G4 | |
| LibreOffice / 20 Documents To PDF | |
| Średnia w klasie Subnotebook (38.5 - 220, n=67, ostatnie 2 lata) | |
| Przeciętny Intel Core Ultra 5 125H (42.7 - 70.9, n=6) | |
| Lenovo ThinkBook 13x G4 21KR0008GE | |
| Lenovo ThinkPad Z13 Gen 2 | |
| Dell XPS 13 9340 Core Ultra 7 | |
| HP Dragonfly G4 | |
| MSI Prestige 13 AI Evo | |
| R Benchmark 2.5 / Overall mean | |
| Średnia w klasie Subnotebook (0.403 - 1.456, n=69, ostatnie 2 lata) | |
| Przeciętny Intel Core Ultra 5 125H (0.4898 - 0.53, n=6) | |
| Lenovo ThinkBook 13x G4 21KR0008GE | |
| Dell XPS 13 9340 Core Ultra 7 | |
| Lenovo ThinkPad Z13 Gen 2 | |
| MSI Prestige 13 AI Evo | |
| HP Dragonfly G4 | |
* ... im mniej tym lepiej
AIDA64: FP32 Ray-Trace | FPU Julia | CPU SHA3 | CPU Queen | FPU SinJulia | FPU Mandel | CPU AES | CPU ZLib | FP64 Ray-Trace | CPU PhotoWorxx
| Performance Rating | |
| Lenovo ThinkPad Z13 Gen 2 | |
| Dell XPS 13 9340 Core Ultra 7 | |
| Przeciętny Intel Core Ultra 5 125H | |
| Średnia w klasie Subnotebook | |
| Lenovo ThinkBook 13x G4 21KR0008GE | |
| MSI Prestige 13 AI Evo | |
| HP Dragonfly G4 | |
| AIDA64 / FP32 Ray-Trace | |
| Lenovo ThinkPad Z13 Gen 2 | |
| Średnia w klasie Subnotebook (1135 - 32888, n=69, ostatnie 2 lata) | |
| Dell XPS 13 9340 Core Ultra 7 | |
| Przeciętny Intel Core Ultra 5 125H (8430 - 13639, n=6) | |
| Lenovo ThinkBook 13x G4 21KR0008GE | |
| HP Dragonfly G4 | |
| MSI Prestige 13 AI Evo | |
| AIDA64 / FPU Julia | |
| Lenovo ThinkPad Z13 Gen 2 | |
| Dell XPS 13 9340 Core Ultra 7 | |
| Średnia w klasie Subnotebook (5218 - 123315, n=69, ostatnie 2 lata) | |
| Przeciętny Intel Core Ultra 5 125H (43652 - 70880, n=6) | |
| MSI Prestige 13 AI Evo | |
| Lenovo ThinkBook 13x G4 21KR0008GE | |
| HP Dragonfly G4 | |
| AIDA64 / CPU SHA3 | |
| Lenovo ThinkPad Z13 Gen 2 | |
| Dell XPS 13 9340 Core Ultra 7 | |
| Średnia w klasie Subnotebook (444 - 5287, n=69, ostatnie 2 lata) | |
| Przeciętny Intel Core Ultra 5 125H (2047 - 3404, n=6) | |
| Lenovo ThinkBook 13x G4 21KR0008GE | |
| MSI Prestige 13 AI Evo | |
| HP Dragonfly G4 | |
| AIDA64 / CPU Queen | |
| Lenovo ThinkPad Z13 Gen 2 | |
| Lenovo ThinkBook 13x G4 21KR0008GE | |
| Dell XPS 13 9340 Core Ultra 7 | |
| Przeciętny Intel Core Ultra 5 125H (77892 - 79986, n=6) | |
| Średnia w klasie Subnotebook (10579 - 115682, n=69, ostatnie 2 lata) | |
| HP Dragonfly G4 | |
| MSI Prestige 13 AI Evo | |
| AIDA64 / FPU SinJulia | |
| Lenovo ThinkPad Z13 Gen 2 | |
| Dell XPS 13 9340 Core Ultra 7 | |
| Przeciętny Intel Core Ultra 5 125H (6588 - 7851, n=6) | |
| Średnia w klasie Subnotebook (744 - 18418, n=69, ostatnie 2 lata) | |
| Lenovo ThinkBook 13x G4 21KR0008GE | |
| MSI Prestige 13 AI Evo | |
| HP Dragonfly G4 | |
| AIDA64 / FPU Mandel | |
| Lenovo ThinkPad Z13 Gen 2 | |
| Dell XPS 13 9340 Core Ultra 7 | |
| Średnia w klasie Subnotebook (3341 - 65433, n=69, ostatnie 2 lata) | |
| Przeciętny Intel Core Ultra 5 125H (21210 - 35321, n=6) | |
| MSI Prestige 13 AI Evo | |
| Lenovo ThinkBook 13x G4 21KR0008GE | |
| HP Dragonfly G4 | |
| AIDA64 / CPU AES | |
| Lenovo ThinkPad Z13 Gen 2 | |
| Przeciętny Intel Core Ultra 5 125H (45524 - 108402, n=6) | |
| Dell XPS 13 9340 Core Ultra 7 | |
| Średnia w klasie Subnotebook (638 - 161430, n=69, ostatnie 2 lata) | |
| Lenovo ThinkBook 13x G4 21KR0008GE | |
| MSI Prestige 13 AI Evo | |
| HP Dragonfly G4 | |
| AIDA64 / CPU ZLib | |
| Lenovo ThinkPad Z13 Gen 2 | |
| Dell XPS 13 9340 Core Ultra 7 | |
| Przeciętny Intel Core Ultra 5 125H (594 - 994, n=6) | |
| Średnia w klasie Subnotebook (164.9 - 1379, n=69, ostatnie 2 lata) | |
| Lenovo ThinkBook 13x G4 21KR0008GE | |
| MSI Prestige 13 AI Evo | |
| HP Dragonfly G4 | |
| AIDA64 / FP64 Ray-Trace | |
| Lenovo ThinkPad Z13 Gen 2 | |
| Średnia w klasie Subnotebook (610 - 17495, n=69, ostatnie 2 lata) | |
| Dell XPS 13 9340 Core Ultra 7 | |
| Przeciętny Intel Core Ultra 5 125H (4345 - 7221, n=6) | |
| Lenovo ThinkBook 13x G4 21KR0008GE | |
| MSI Prestige 13 AI Evo | |
| HP Dragonfly G4 | |
| AIDA64 / CPU PhotoWorxx | |
| Dell XPS 13 9340 Core Ultra 7 | |
| Lenovo ThinkBook 13x G4 21KR0008GE | |
| Przeciętny Intel Core Ultra 5 125H (45724 - 49844, n=6) | |
| MSI Prestige 13 AI Evo | |
| Średnia w klasie Subnotebook (6569 - 64588, n=69, ostatnie 2 lata) | |
| Lenovo ThinkPad Z13 Gen 2 | |
| HP Dragonfly G4 | |
Wydajność systemu
W codziennym użytkowaniu ThinkBook 13x G4 jest szybkim laptopem, który przetwarza wszystkie dane wejściowe bez zauważalnych opóźnień. Wyniki benchmarków są zgodne z oczekiwaniami i nie doświadczyliśmy żadnych problemów ze stabilnością systemu podczas testów.
CrossMark: Overall | Productivity | Creativity | Responsiveness
WebXPRT 3: Overall
WebXPRT 4: Overall
Mozilla Kraken 1.1: Total
| PCMark 10 / Score | |
| Lenovo ThinkPad Z13 Gen 2 | |
| Dell XPS 13 9340 Core Ultra 7 | |
| Średnia w klasie Subnotebook (4993 - 7788, n=58, ostatnie 2 lata) | |
| Przeciętny Intel Core Ultra 5 125H, Intel Arc 7-Core iGPU (6194 - 6463, n=6) | |
| Lenovo ThinkBook 13x G4 21KR0008GE | |
| MSI Prestige 13 AI Evo | |
| HP Dragonfly G4 | |
| PCMark 10 / Essentials | |
| Lenovo ThinkPad Z13 Gen 2 | |
| HP Dragonfly G4 | |
| Dell XPS 13 9340 Core Ultra 7 | |
| Średnia w klasie Subnotebook (9363 - 11331, n=58, ostatnie 2 lata) | |
| Przeciętny Intel Core Ultra 5 125H, Intel Arc 7-Core iGPU (9427 - 10697, n=6) | |
| Lenovo ThinkBook 13x G4 21KR0008GE | |
| MSI Prestige 13 AI Evo | |
| PCMark 10 / Productivity | |
| Lenovo ThinkPad Z13 Gen 2 | |
| MSI Prestige 13 AI Evo | |
| Średnia w klasie Subnotebook (5435 - 10623, n=58, ostatnie 2 lata) | |
| Dell XPS 13 9340 Core Ultra 7 | |
| Lenovo ThinkBook 13x G4 21KR0008GE | |
| Przeciętny Intel Core Ultra 5 125H, Intel Arc 7-Core iGPU (7042 - 8000, n=6) | |
| HP Dragonfly G4 | |
| PCMark 10 / Digital Content Creation | |
| Lenovo ThinkPad Z13 Gen 2 | |
| Przeciętny Intel Core Ultra 5 125H, Intel Arc 7-Core iGPU (8198 - 9506, n=6) | |
| Średnia w klasie Subnotebook (5305 - 12442, n=58, ostatnie 2 lata) | |
| Dell XPS 13 9340 Core Ultra 7 | |
| Lenovo ThinkBook 13x G4 21KR0008GE | |
| MSI Prestige 13 AI Evo | |
| HP Dragonfly G4 | |
| CrossMark / Overall | |
| Apple MacBook Air 13 M3 10C GPU | |
| Dell XPS 13 9340 Core Ultra 7 | |
| HP Dragonfly G4 | |
| Średnia w klasie Subnotebook (365 - 2018, n=67, ostatnie 2 lata) | |
| Przeciętny Intel Core Ultra 5 125H, Intel Arc 7-Core iGPU (1522 - 1633, n=5) | |
| Lenovo ThinkBook 13x G4 21KR0008GE | |
| Lenovo ThinkPad Z13 Gen 2 | |
| MSI Prestige 13 AI Evo | |
| CrossMark / Productivity | |
| Apple MacBook Air 13 M3 10C GPU | |
| HP Dragonfly G4 | |
| Dell XPS 13 9340 Core Ultra 7 | |
| Średnia w klasie Subnotebook (364 - 1875, n=67, ostatnie 2 lata) | |
| Przeciętny Intel Core Ultra 5 125H, Intel Arc 7-Core iGPU (1432 - 1594, n=5) | |
| Lenovo ThinkBook 13x G4 21KR0008GE | |
| Lenovo ThinkPad Z13 Gen 2 | |
| MSI Prestige 13 AI Evo | |
| CrossMark / Creativity | |
| Apple MacBook Air 13 M3 10C GPU | |
| Dell XPS 13 9340 Core Ultra 7 | |
| Lenovo ThinkPad Z13 Gen 2 | |
| Średnia w klasie Subnotebook (372 - 2396, n=67, ostatnie 2 lata) | |
| HP Dragonfly G4 | |
| Przeciętny Intel Core Ultra 5 125H, Intel Arc 7-Core iGPU (1683 - 1765, n=5) | |
| Lenovo ThinkBook 13x G4 21KR0008GE | |
| MSI Prestige 13 AI Evo | |
| CrossMark / Responsiveness | |
| Dell XPS 13 9340 Core Ultra 7 | |
| HP Dragonfly G4 | |
| Apple MacBook Air 13 M3 10C GPU | |
| Przeciętny Intel Core Ultra 5 125H, Intel Arc 7-Core iGPU (1171 - 1520, n=5) | |
| Średnia w klasie Subnotebook (312 - 1899, n=67, ostatnie 2 lata) | |
| MSI Prestige 13 AI Evo | |
| Lenovo ThinkBook 13x G4 21KR0008GE | |
| Lenovo ThinkPad Z13 Gen 2 | |
| WebXPRT 3 / Overall | |
| Apple MacBook Air 13 M3 10C GPU | |
| Średnia w klasie Subnotebook (156 - 479, n=66, ostatnie 2 lata) | |
| HP Dragonfly G4 | |
| Lenovo ThinkPad Z13 Gen 2 | |
| Dell XPS 13 9340 Core Ultra 7 | |
| MSI Prestige 13 AI Evo | |
| Przeciętny Intel Core Ultra 5 125H, Intel Arc 7-Core iGPU (245 - 263, n=6) | |
| Lenovo ThinkBook 13x G4 21KR0008GE | |
| WebXPRT 4 / Overall | |
| Apple MacBook Air 13 M3 10C GPU | |
| HP Dragonfly G4 | |
| Średnia w klasie Subnotebook (132 - 348, n=67, ostatnie 2 lata) | |
| Dell XPS 13 9340 Core Ultra 7 | |
| MSI Prestige 13 AI Evo | |
| Lenovo ThinkBook 13x G4 21KR0008GE | |
| Lenovo ThinkPad Z13 Gen 2 | |
| Przeciętny Intel Core Ultra 5 125H, Intel Arc 7-Core iGPU (227 - 240, n=5) | |
| Mozilla Kraken 1.1 / Total | |
| Przeciętny Intel Core Ultra 5 125H, Intel Arc 7-Core iGPU (560 - 595, n=6) | |
| Lenovo ThinkPad Z13 Gen 2 | |
| Lenovo ThinkBook 13x G4 21KR0008GE | |
| MSI Prestige 13 AI Evo | |
| Dell XPS 13 9340 Core Ultra 7 | |
| Średnia w klasie Subnotebook (278 - 1104, n=75, ostatnie 2 lata) | |
| HP Dragonfly G4 | |
| Apple MacBook Air 13 M3 10C GPU | |
* ... im mniej tym lepiej
| PCMark 10 Score | 6293 pkt. | |
Pomoc | ||
| AIDA64 / Memory Copy | |
| Dell XPS 13 9340 Core Ultra 7 | |
| Lenovo ThinkBook 13x G4 21KR0008GE | |
| MSI Prestige 13 AI Evo | |
| Przeciętny Intel Core Ultra 5 125H (67482 - 87473, n=6) | |
| Średnia w klasie Subnotebook (14554 - 109035, n=69, ostatnie 2 lata) | |
| Lenovo ThinkPad Z13 Gen 2 | |
| HP Dragonfly G4 | |
| AIDA64 / Memory Read | |
| Dell XPS 13 9340 Core Ultra 7 | |
| Lenovo ThinkBook 13x G4 21KR0008GE | |
| Przeciętny Intel Core Ultra 5 125H (70520 - 76803, n=6) | |
| MSI Prestige 13 AI Evo | |
| Średnia w klasie Subnotebook (15948 - 122210, n=69, ostatnie 2 lata) | |
| Lenovo ThinkPad Z13 Gen 2 | |
| HP Dragonfly G4 | |
| AIDA64 / Memory Write | |
| Lenovo ThinkPad Z13 Gen 2 | |
| Średnia w klasie Subnotebook (15709 - 117898, n=69, ostatnie 2 lata) | |
| MSI Prestige 13 AI Evo | |
| Dell XPS 13 9340 Core Ultra 7 | |
| HP Dragonfly G4 | |
| Przeciętny Intel Core Ultra 5 125H (63162 - 72443, n=6) | |
| Lenovo ThinkBook 13x G4 21KR0008GE | |
| AIDA64 / Memory Latency | |
| MSI Prestige 13 AI Evo | |
| Przeciętny Intel Core Ultra 5 125H (127.3 - 184.8, n=6) | |
| Lenovo ThinkPad Z13 Gen 2 | |
| Lenovo ThinkBook 13x G4 21KR0008GE | |
| Dell XPS 13 9340 Core Ultra 7 | |
| Średnia w klasie Subnotebook (7.2 - 187.8, n=68, ostatnie 2 lata) | |
| HP Dragonfly G4 | |
* ... im mniej tym lepiej
Opóźnienie DPC
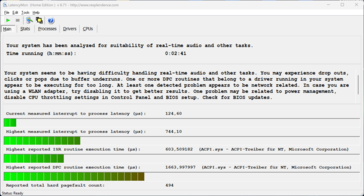
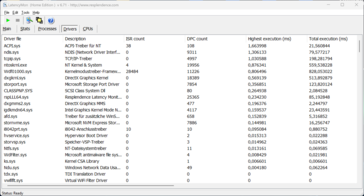
W naszym standardowym teście opóźnień (przeglądanie stron internetowych, odtwarzanie YouTube 4K, obciążenie procesora), nasze urządzenie testowe nie wykazuje żadnych ograniczeń w obecnej wersji BIOS-u. Chociaż jeden ze sterowników wykazuje skok, ważna wartość "przerwania do opóźnienia procesu" jest niska.
| DPC Latencies / LatencyMon - interrupt to process latency (max), Web, Youtube, Prime95 | |
| MSI Prestige 13 AI Evo | |
| Lenovo ThinkPad Z13 Gen 2 | |
| HP Dragonfly G4 | |
| Lenovo ThinkBook 13x G4 21KR0008GE | |
| Dell XPS 13 9340 Core Ultra 7 | |
* ... im mniej tym lepiej
Urządzenia pamięci masowej
Lenovo instaluje kompaktowy dysk SSD M.2-2242 ze złączem PCIe 4.0, który w naszym urządzeniu testowym pochodzi od Samsunga (PM9C1a) i oferuje pojemność 512 GB. Po pierwszym uruchomieniu pozostaje 422 GB. Prędkości transferu są w porządku, ale wydajność nie pozostaje stabilna przy długotrwałym obciążeniu. W codziennym użytkowaniu nie ma to jednak wpływu, ponieważ wydajność jest nadal wystarczająca (ponad 3,3 GB/s). Dalsze testy porównawcze SSD są wymienione tutaj.
* ... im mniej tym lepiej
Sustained Read Performance: DiskSpd Read Loop, Queue Depth 8
Karta graficzna - Arc Graphics z 7 rdzeniami Xe
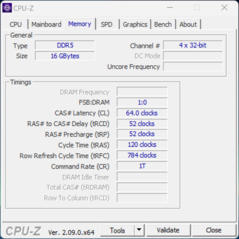
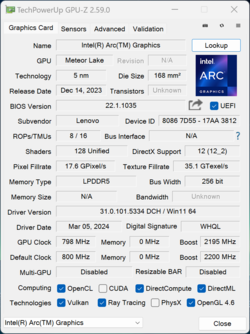
W połączeniu z Core Ultra 5 125H, wykorzystywany jest wolniejszy zintegrowany Intel Arc Graphics z 7 rdzeniami Xe. Dzięki szybkiej pamięci RAM, wydajność graficzna jest ogólnie bardzo dobra i prawie nie różni się od laptopów z szybszym 8-rdzeniowym wariantem, które testowaliśmy do tej pory. Dotyczy to również Dell XPS 13 9340 i MSI Prestige 13 AI Evo. Model ThinkPad Z13 Gen2 z procesorem AMD i kartą graficzną Radeon 780M również uzyskał lepsze wyniki w testach syntetycznych.
Radeon 780M nadal ma niewielką przewagę w benchmarkach gier, ale ThinkBook 13x G4 ponownie wyprzedza rzekomo szybsze Dell XPS 13 i MSI Prestige 13. Nie zauważyliśmy również żadnych problemów ze spadkami klatek podczas grania. Ogólnie rzecz biorąc, w wiele starszych lub mniej wymagających tytułów można grać płynnie przy średnich i wysokich detalach w rozdzielczości 1080p. W przypadku nowoczesnych tytułów, takich jak Cyberpunk 2077, robi się jednak ciasno i oprócz zmniejszonej rozdzielczości lub zmniejszonych detali, należy również zastosować technologie skalowania w górę.
Wydajność graficzna pozostaje stabilna przy długotrwałym obciążeniu i w trybie bateryjnym. Więcej benchmarków graficznych znajdą Państwo na w naszej sekcji technicznej.
| 3DMark 11 Performance | 11306 pkt. | |
| 3DMark Fire Strike Score | 7500 pkt. | |
| 3DMark Time Spy Score | 3498 pkt. | |
Pomoc | ||
| Blender / v3.3 Classroom CPU | |
| HP Dragonfly G4 | |
| Lenovo ThinkBook 13x G4 21KR0008GE | |
| MSI Prestige 13 AI Evo | |
| Średnia w klasie Subnotebook (241 - 1127, n=71, ostatnie 2 lata) | |
| Apple MacBook Air 13 M3 10C GPU | |
| Przeciętny Intel Arc 7-Core iGPU (391 - 671, n=6) | |
| Dell XPS 13 9340 Core Ultra 7 | |
| Lenovo ThinkPad Z13 Gen 2 | |
| Blender / v3.3 Classroom METAL | |
| Średnia w klasie Subnotebook (103 - 237, n=4, ostatnie 2 lata) | |
| Apple MacBook Air 13 M3 10C GPU | |
* ... im mniej tym lepiej
| Performance Rating - Percent | |
| Lenovo ThinkPad Z13 Gen 2 -1! | |
| Średnia w klasie Subnotebook | |
| Lenovo ThinkBook 13x G4 21KR0008GE | |
| Dell XPS 13 9340 Core Ultra 7 | |
| MSI Prestige 13 AI Evo | |
| HP Dragonfly G4 | |
| The Witcher 3 - 1920x1080 Ultra Graphics & Postprocessing (HBAO+) | |
| Lenovo ThinkPad Z13 Gen 2 | |
| Lenovo ThinkBook 13x G4 21KR0008GE | |
| Średnia w klasie Subnotebook (8.5 - 43.7, n=49, ostatnie 2 lata) | |
| Dell XPS 13 9340 Core Ultra 7 | |
| HP Dragonfly G4 | |
| MSI Prestige 13 AI Evo | |
| GTA V - 1920x1080 Highest Settings possible AA:4xMSAA + FX AF:16x | |
| Średnia w klasie Subnotebook (7.81 - 53, n=66, ostatnie 2 lata) | |
| Lenovo ThinkBook 13x G4 21KR0008GE | |
| Dell XPS 13 9340 Core Ultra 7 | |
| HP Dragonfly G4 | |
| MSI Prestige 13 AI Evo | |
| Final Fantasy XV Benchmark - 1920x1080 High Quality | |
| Lenovo ThinkPad Z13 Gen 2 | |
| Dell XPS 13 9340 Core Ultra 7 | |
| Lenovo ThinkBook 13x G4 21KR0008GE | |
| Średnia w klasie Subnotebook (11.9 - 44.2, n=71, ostatnie 2 lata) | |
| MSI Prestige 13 AI Evo | |
| HP Dragonfly G4 | |
| Strange Brigade - 1920x1080 ultra AA:ultra AF:16 | |
| Lenovo ThinkBook 13x G4 21KR0008GE | |
| Lenovo ThinkPad Z13 Gen 2 | |
| Średnia w klasie Subnotebook (17.7 - 70.7, n=70, ostatnie 2 lata) | |
| Dell XPS 13 9340 Core Ultra 7 | |
| MSI Prestige 13 AI Evo | |
| HP Dragonfly G4 | |
| Dota 2 Reborn - 1920x1080 ultra (3/3) best looking | |
| Lenovo ThinkPad Z13 Gen 2 | |
| Dell XPS 13 9340 Core Ultra 7 | |
| Lenovo ThinkBook 13x G4 21KR0008GE | |
| Średnia w klasie Subnotebook (13 - 99.5, n=74, ostatnie 2 lata) | |
| HP Dragonfly G4 | |
| MSI Prestige 13 AI Evo | |
| X-Plane 11.11 - 1920x1080 high (fps_test=3) | |
| Lenovo ThinkBook 13x G4 21KR0008GE | |
| Średnia w klasie Subnotebook (20.7 - 97.1, n=63, ostatnie 2 lata) | |
| MSI Prestige 13 AI Evo | |
| Dell XPS 13 9340 Core Ultra 7 | |
| HP Dragonfly G4 | |
| Lenovo ThinkPad Z13 Gen 2 | |
Witcher 3 FPS chart
| low | med. | high | ultra | |
|---|---|---|---|---|
| GTA V (2015) | 116.9 | 106.4 | 32.4 | 14.8 |
| The Witcher 3 (2015) | 126 | 80 | 45 | 23.4 |
| Dota 2 Reborn (2015) | 93.8 | 83 | 68.4 | 64.9 |
| Final Fantasy XV Benchmark (2018) | 59.8 | 33.4 | 25.3 | |
| X-Plane 11.11 (2018) | 52 | 40.1 | 34.2 | |
| Far Cry 5 (2018) | 64 | 37 | 35 | 31 |
| Strange Brigade (2018) | 141 | 68 | 54 | 44 |
| F1 23 (2023) | 58.7 | 53.5 | 37.3 | |
| Cyberpunk 2077 2.2 Phantom Liberty (2023) | 23.2 | 19.8 | 16.6 | 14.8 |
Emisja - doskonałe głośniki
Hałas
Oba wentylatory zazwyczaj pozostają bardzo ciche lub wyłączone w codziennym użytkowaniu i nie są w ogóle uciążliwe, nawet przy dużym obciążeniu. Maksymalną wartość 40,7 dB(A) odnotowaliśmy tylko przez krótki czas, zanim wentylatory ustabilizowały się na poziomie 36,8 dB(A). W trybie wydajnościowym maksimum wyniosło 42,5 dB(A), a w trybie oszczędzania baterii - 33,9 dB(A). Nie wykryto żadnych innych odgłosów elektronicznych, takich jak wycie cewki.
Hałas
| luz |
| 24.5 / 24.5 / 27.1 dB |
| obciążenie |
| 33.3 / 40.7 dB |
 | ||
30 dB cichy 40 dB(A) słyszalny 50 dB(A) irytujący |
||
min: | ||
| Lenovo ThinkBook 13x G4 21KR0008GE Arc 7-Core, Ultra 5 125H, Samsung PM9C1a MZAL8512HDLU | Dell XPS 13 9340 Core Ultra 7 Arc 8-Core, Ultra 7 155H, Micron 2550 512GB | MSI Prestige 13 AI Evo Arc 8-Core, Ultra 7 155H, Samsung PM9A1 MZVL21T0HCLR | Lenovo ThinkPad Z13 Gen 2 Radeon 780M, R7 PRO 7840U, SK hynix BC901 HFS001TEJ4X164N | HP Dragonfly G4 Iris Xe G7 96EUs, i7-1365U, Micron 3400 MTFDKBA512TFH 512GB | |
|---|---|---|---|---|---|
| Noise | -4% | 2% | -5% | 8% | |
| wyłączone / środowisko * | 24.5 | 25.1 -2% | 23.4 4% | 25.1 -2% | 23.3 5% |
| Idle Minimum * | 24.5 | 25.1 -2% | 23.4 4% | 25.8 -5% | 23.5 4% |
| Idle Average * | 24.5 | 25.1 -2% | 26.9 -10% | 25.8 -5% | 23.5 4% |
| Idle Maximum * | 27.1 | 25.1 7% | 26.9 1% | 28.3 -4% | 26.8 1% |
| Load Average * | 33.3 | 37.4 -12% | 32 4% | 28.3 15% | 27.2 18% |
| Witcher 3 ultra * | 36.8 | 42.5 -15% | 32 13% | 44.8 -22% | 32.7 11% |
| Load Maximum * | 40.7 | 42.5 -4% | 40.3 1% | 44.8 -10% | 35 14% |
* ... im mniej tym lepiej
Temperatura
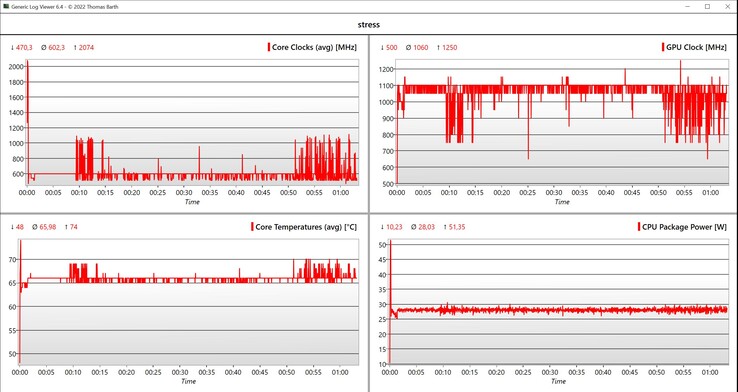
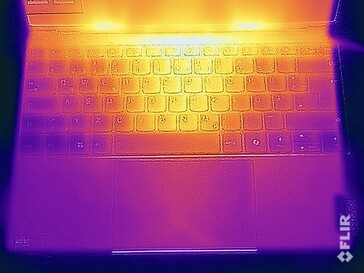
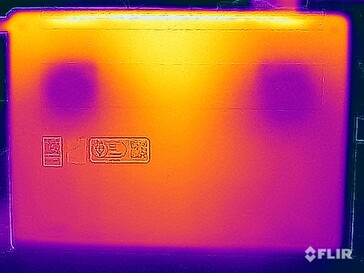
Lenovo dobrze kontroluje temperatury powierzchni ThinkBooka 13x G4. Urządzenie praktycznie w ogóle nie nagrzewa się na biegu jałowym i przy niskim obciążeniu, a jest tylko jeden hotspot, w którym zmierzyliśmy ponad 40 °C pod obciążeniem. Jest to górna część jednostki zasadniczej nad klawiaturą, gdzie i tak nie dotyka się urządzenia. Maksymalna temperatura na spodzie wynosi 39 °C, więc bez problemu można położyć urządzenie na udach, nawet pod obciążeniem. W teście obciążeniowym z połączonym obciążeniem CPU/GPU, SoC szybko stabilizuje się na poziomie 28 W i pozostaje na tym poziomie.
(±) Maksymalna temperatura w górnej części wynosi 43.1 °C / 110 F, w porównaniu do średniej 35.9 °C / 97 F , począwszy od 21.4 do 59 °C dla klasy Subnotebook.
(+) Dno nagrzewa się maksymalnie do 39.2 °C / 103 F, w porównaniu do średniej 39.3 °C / 103 F
(+) W stanie bezczynności średnia temperatura górnej części wynosi 27.1 °C / 81 F, w porównaniu ze średnią temperaturą urządzenia wynoszącą 30.8 °C / ### class_avg_f### F.
(±) Podczas gry w Wiedźmina 3 średnia temperatura górnej części wynosi 35 °C / 95 F, w porównaniu do średniej temperatury urządzenia wynoszącej 30.8 °C / ## #class_avg_f### F.
(+) Podpórki pod nadgarstki i touchpad są chłodniejsze niż temperatura skóry i maksymalnie 29.3 °C / 84.7 F i dlatego są chłodne w dotyku.
(±) Średnia temperatura obszaru podparcia dłoni w podobnych urządzeniach wynosiła 28.2 °C / 82.8 F (-1.1 °C / -1.9 F).
| Lenovo ThinkBook 13x G4 21KR0008GE Intel Core Ultra 5 125H, Intel Arc 7-Core iGPU | Dell XPS 13 9340 Core Ultra 7 Intel Core Ultra 7 155H, Intel Arc 8-Core iGPU | Apple MacBook Air 13 M3 10C GPU Apple M3, Apple M3 10-Core GPU | MSI Prestige 13 AI Evo Intel Core Ultra 7 155H, Intel Arc 8-Core iGPU | Lenovo ThinkPad Z13 Gen 2 AMD Ryzen 7 PRO 7840U, AMD Radeon 780M | HP Dragonfly G4 Intel Core i7-1365U, Intel Iris Xe Graphics G7 96EUs | |
|---|---|---|---|---|---|---|
| Heat | 4% | 7% | 6% | 2% | 1% | |
| Maximum Upper Side * | 43.1 | 41 5% | 44.3 -3% | 40.9 5% | 46.2 -7% | 38.6 10% |
| Maximum Bottom * | 39.2 | 43.5 -11% | 43.4 -11% | 40.4 -3% | 48.4 -23% | 40.4 -3% |
| Idle Upper Side * | 28.3 | 25.3 11% | 22.3 21% | 25 12% | 23.2 18% | 28.2 -0% |
| Idle Bottom * | 28 | 25.5 9% | 22.1 21% | 25.5 9% | 23 18% | 29 -4% |
* ... im mniej tym lepiej
Głośniki
ThinkBook 13x G4 oferuje cztery głośniki składające się z dwóch głośników wysokotonowych i dwóch niskotonowych o mocy 2 W każdy, co przekłada się na doskonałą jakość dźwięku. Tutaj ThinkBook może nawet konkurować z MacBook Air 13. Bas jest nieco ograniczony w porównaniu do większych laptopów multimedialnych, ale wynik jest nadal bardzo dobry, biorąc pod uwagę rozmiar obudowy.
Lenovo ThinkBook 13x G4 21KR0008GE analiza dźwięku
(+) | głośniki mogą odtwarzać stosunkowo głośno (83.8 dB)
Bas 100 - 315 Hz
(±) | zredukowany bas - średnio 9% niższy od mediany
(±) | liniowość basu jest średnia (8% delta do poprzedniej częstotliwości)
Średnie 400 - 2000 Hz
(+) | zbalansowane środki średnie - tylko 2.4% od mediany
(+) | średnie są liniowe (2.9% delta do poprzedniej częstotliwości)
Wysokie 2–16 kHz
(+) | zrównoważone maksima - tylko 3.2% od mediany
(+) | wzloty są liniowe (3.4% delta do poprzedniej częstotliwości)
Ogólnie 100 - 16.000 Hz
(+) | ogólny dźwięk jest liniowy (8.6% różnicy w stosunku do mediany)
W porównaniu do tej samej klasy
» 3% wszystkich testowanych urządzeń w tej klasie było lepszych, 1% podobnych, 97% gorszych
» Najlepszy miał deltę 5%, średnia wynosiła ###średnia###%, najgorsza wynosiła 53%
W porównaniu do wszystkich testowanych urządzeń
» 2% wszystkich testowanych urządzeń było lepszych, 1% podobnych, 97% gorszych
» Najlepszy miał deltę 4%, średnia wynosiła ###średnia###%, najgorsza wynosiła 134%
Dell XPS 13 9340 Core Ultra 7 analiza dźwięku
(+) | głośniki mogą odtwarzać stosunkowo głośno (83.2 dB)
Bas 100 - 315 Hz
(-) | prawie brak basu - średnio 17% niższa od mediany
(±) | liniowość basu jest średnia (9.3% delta do poprzedniej częstotliwości)
Średnie 400 - 2000 Hz
(+) | zbalansowane środki średnie - tylko 2.1% od mediany
(+) | średnie są liniowe (4.7% delta do poprzedniej częstotliwości)
Wysokie 2–16 kHz
(+) | zrównoważone maksima - tylko 2.5% od mediany
(+) | wzloty są liniowe (4.6% delta do poprzedniej częstotliwości)
Ogólnie 100 - 16.000 Hz
(+) | ogólny dźwięk jest liniowy (11.6% różnicy w stosunku do mediany)
W porównaniu do tej samej klasy
» 12% wszystkich testowanych urządzeń w tej klasie było lepszych, 3% podobnych, 85% gorszych
» Najlepszy miał deltę 5%, średnia wynosiła ###średnia###%, najgorsza wynosiła 53%
W porównaniu do wszystkich testowanych urządzeń
» 7% wszystkich testowanych urządzeń było lepszych, 2% podobnych, 91% gorszych
» Najlepszy miał deltę 4%, średnia wynosiła ###średnia###%, najgorsza wynosiła 134%
Apple MacBook Air 13 M3 10C GPU analiza dźwięku
(+) | głośniki mogą odtwarzać stosunkowo głośno (83.2 dB)
Bas 100 - 315 Hz
(±) | zredukowany bas - średnio 13.3% niższy od mediany
(±) | liniowość basu jest średnia (11.3% delta do poprzedniej częstotliwości)
Średnie 400 - 2000 Hz
(+) | zbalansowane środki średnie - tylko 0.4% od mediany
(+) | średnie są liniowe (1.6% delta do poprzedniej częstotliwości)
Wysokie 2–16 kHz
(+) | zrównoważone maksima - tylko 4.5% od mediany
(+) | wzloty są liniowe (1.9% delta do poprzedniej częstotliwości)
Ogólnie 100 - 16.000 Hz
(+) | ogólny dźwięk jest liniowy (10.7% różnicy w stosunku do mediany)
W porównaniu do tej samej klasy
» 8% wszystkich testowanych urządzeń w tej klasie było lepszych, 3% podobnych, 89% gorszych
» Najlepszy miał deltę 5%, średnia wynosiła ###średnia###%, najgorsza wynosiła 53%
W porównaniu do wszystkich testowanych urządzeń
» 5% wszystkich testowanych urządzeń było lepszych, 1% podobnych, 94% gorszych
» Najlepszy miał deltę 4%, średnia wynosiła ###średnia###%, najgorsza wynosiła 134%
Zarządzanie energią - Długi czas pracy
Zużycie energii
Nasze pomiary zużycia energii nie wykazały żadnych niespodzianek i zgodnie z oczekiwaniami, jasny panel o wysokiej rozdzielczości wymaga nieco więcej energii niż na przykład XPS 13 z ekranem 1080p. Przy maksymalnie 8,9 wata w trybie bezczynności, zużycie nie jest zbyt wysokie. Pod maksymalnym obciążeniem urządzenie na krótko osiąga limit 65-watowego zasilacza, ale już po kilku sekundach spada do ~45 watów i utrzymuje się na tym poziomie.
| wyłączony / stan wstrzymania | |
| luz | |
| obciążenie |
|
Legenda:
min: | |
| Lenovo ThinkBook 13x G4 21KR0008GE Ultra 5 125H, Arc 7-Core, Samsung PM9C1a MZAL8512HDLU, IPS, 2880x1920, 13.5" | Dell XPS 13 9340 Core Ultra 7 Ultra 7 155H, Arc 8-Core, Micron 2550 512GB, IPS, 1920x1200, 13.4" | Apple MacBook Air 13 M3 10C GPU M3, M3 10-Core GPU, Apple SSD AP0512Z, IPS, 2560x1664, 13.6" | MSI Prestige 13 AI Evo Ultra 7 155H, Arc 8-Core, Samsung PM9A1 MZVL21T0HCLR, OLED, 2880x1800, 13.3" | Lenovo ThinkPad Z13 Gen 2 R7 PRO 7840U, Radeon 780M, SK hynix BC901 HFS001TEJ4X164N, OLED, 2880x1800, 13.3" | HP Dragonfly G4 i7-1365U, Iris Xe G7 96EUs, Micron 3400 MTFDKBA512TFH 512GB, IPS, 1920x1280, 13.5" | Przeciętny Intel Arc 7-Core iGPU | Średnia w klasie Subnotebook | |
|---|---|---|---|---|---|---|---|---|
| Power Consumption | 13% | 28% | 14% | 1% | 14% | -20% | 7% | |
| Idle Minimum * | 5.4 | 3.8 30% | 1.95 64% | 4.5 17% | 5.8 -7% | 4.1 24% | 6.88 ? -27% | 4.31 ? 20% |
| Idle Average * | 7.8 | 7 10% | 8.7 -12% | 8 -3% | 6.2 21% | 7.5 4% | 9.02 ? -16% | 7.33 ? 6% |
| Idle Maximum * | 8.9 | 7.3 18% | 8.9 -0% | 8.7 2% | 12.7 -43% | 8.2 8% | 12.2 ? -37% | 9.09 ? -2% |
| Load Average * | 49.4 | 52.6 -6% | 34.3 31% | 36.1 27% | 27.2 45% | 35.5 28% | 51.4 ? -4% | 44.9 ? 9% |
| Witcher 3 ultra * | 44.4 | 38.3 14% | 28.6 36% | 29.7 33% | 54.1 -22% | 37.5 16% | ||
| Load Maximum * | 68.8 | 62.7 9% | 35.4 49% | 65 6% | 61.4 11% | 66.5 3% | 78.3 ? -14% | 68.7 ? -0% |
* ... im mniej tym lepiej
Power consumption Witcher 3 / Stress test
Power consumption with external monitor
Żywotność baterii
Dzięki dużej baterii o pojemności 74 Wh, ThinkBook 13x G4 osiąga dobre, ale nie wybitne czasy pracy w naszym teście WLAN. Przy 150 cd/m² (co odpowiada 56% maksymalnej jasności testowanego urządzenia), zmierzyliśmy nieco poniżej 11,5 godziny przy 60 Hz i około 10,5 godziny przy 120 Hz. Przy pełnej jasności nadal uzyskujemy 9 godzin (60 Hz) i 7,5 godziny (120 Hz). W teście wideo przy 150 cd/m² ThinkBook osiąga znakomity wynik 20,5 godziny i wyraźnie przewyższa wszystkich konkurentów. Przy pełnym obciążeniu i maksymalnej jasności kończy się po niecałych 2 godzinach. Pełne ładowanie trwa 113 minut przy włączonym urządzeniu (80% po 66 minutach). Dostępny jest również tryb ekspresowego ładowania, ale nie zapewnia on żadnej przewagi przy 65-watowym zasilaczu.
| Lenovo ThinkBook 13x G4 21KR0008GE Ultra 5 125H, Arc 7-Core, 74 Wh | Dell XPS 13 9340 Core Ultra 7 Ultra 7 155H, Arc 8-Core, 55 Wh | Apple MacBook Air 13 M3 10C GPU M3, M3 10-Core GPU, 52.6 Wh | MSI Prestige 13 AI Evo Ultra 7 155H, Arc 8-Core, 75 Wh | Lenovo ThinkPad Z13 Gen 2 R7 PRO 7840U, Radeon 780M, 51.5 Wh | HP Dragonfly G4 i7-1365U, Iris Xe G7 96EUs, 68 Wh | Średnia w klasie Subnotebook | |
|---|---|---|---|---|---|---|---|
| Czasy pracy | 4% | 22% | 10% | -31% | 53% | -2% | |
| H.264 | 1229 | 1053 -14% | 1044 -15% | 1002 -18% | 963 ? -22% | ||
| WiFi v1.3 | 684 | 769 12% | 914 34% | 694 1% | 469 -31% | 954 39% | 757 ? 11% |
| Load | 116 | 131 13% | 171 47% | 169 46% | 192 66% | 122 ? 5% |
Za
Przeciw
Werdykt - ThinkBook 13x G4 to świetny subnotebook, jeśli można pogodzić się z klawiaturą
ThinkBook 13x G4 zaskoczył nas, ponieważ Lenovo oferuje bardzo mobilny ultrabook z wysokiej jakości metalową obudową i matowym ekranem 3:2. Nie ma żadnych ograniczeń pod względem jakości wykonania czy stabilności, a nie spodziewaliby się Państwo metalowej obudowy w ThinkBooku (zazwyczaj tylko pokrywa jest wykonana z aluminium). Do dyspozycji są trzy porty Thunderbolt 4, co czasem wymaga przejściówek w codziennym użytkowaniu, ale powinno wystarczyć. Możliwości konserwacyjne są jednak ograniczone, ponieważ bateria jest przymocowana do spodu obudowy.
Wydajność procesora Core Ultra 5 125H jest wystarczająca do codziennego użytku, ale nie ustanawia żadnych rekordów. W rzeczywistości wolelibyśmy procesor AMD, biorąc pod uwagę limit mocy wynoszący 28 watów. Core Ultra 9 185H jest również dostępny jako opcja, ale tylko za wysoką dopłatą. 32 GB pamięci RAM można również połączyć tylko z Core Ultra 9. Matowy ekran IPS o odświeżaniu 120 Hz robi wrażenie pod każdym względem. Subiektywna jakość obrazu nie jest tak dobra jak na panelach OLED, ale nie ma odbić, a migotanie PWM nie występuje. Czas pracy na baterii jest całkowicie akceptowalny. Zintegrowano również świetny system audio z czterema głośnikami.
Lenovo ThinkBook 13x G4 imponuje wysokiej jakości obudową, świetnymi głośnikami, dobrym wyświetlaczem IPS i długim czasem pracy na baterii. Klawiatura ma jednak swoje ograniczenia.
Oprócz skromnych opcji konserwacji, w tym przylutowanej pamięci RAM, drugim poważnym słabym punktem ThinkBooka 13x G4 jest klawiatura. Choć skok klawiszy jest pewny, to jest on bardzo ograniczony, co zauważalnie wpływa na komfort pisania. Z pewnością można się do niej przyzwyczaić i zależy to również trochę od tego, z jakiego rodzaju klawiatury korzystaliśmy wcześniej, ale można było tego łatwo uniknąć przy nieco większym skoku klawiszy. Klawiatura Dell XPS 13 9340jest na przykład wygodniejsza, ale użytkownicy muszą pogodzić się z nietypowym układem i pojemnościowymi klawiszami funkcyjnymi. Ogólnie rzecz biorąc, 13x G4 oferuje znacznie lepszy stosunek ceny do wydajności. The Apple MacBook Air M3 pozostaje silnym konkurentem, oferując większą wydajność w połączeniu z pasywnym chłodzeniem, ale wykorzystuje tylko wyświetlacz 60 Hz.
Cena i dostępność
W amerykańskim sklepie internetowym Lenovo podstawowy model Thinkbook 13x Gen 4 zaczyna się od 1106,00 USD. Oczywiście można go skonfigurować z mocniejszym procesorem, dodatkową pamięcią RAM i większą pamięcią masową.
Lenovo ThinkBook 13x G4 21KR0008GE
- 23/05/2024 v7 (old)
Andreas Osthoff
Przezroczystość
Wyboru urządzeń do recenzji dokonuje nasza redakcja. Próbka testowa została udostępniona autorowi jako pożyczka od producenta lub sprzedawcy detalicznego na potrzeby tej recenzji. Pożyczkodawca nie miał wpływu na tę recenzję, producent nie otrzymał też kopii tej recenzji przed publikacją. Nie było obowiązku publikowania tej recenzji. Nigdy nie przyjmujemy rekompensaty ani płatności w zamian za nasze recenzje. Jako niezależna firma medialna, Notebookcheck nie podlega władzy producentów, sprzedawców detalicznych ani wydawców.
Tak testuje Notebookcheck
Każdego roku Notebookcheck niezależnie sprawdza setki laptopów i smartfonów, stosując standardowe procedury, aby zapewnić porównywalność wszystkich wyników. Od około 20 lat stale rozwijamy nasze metody badawcze, ustanawiając przy tym standardy branżowe. W naszych laboratoriach testowych doświadczeni technicy i redaktorzy korzystają z wysokiej jakości sprzętu pomiarowego. Testy te obejmują wieloetapowy proces walidacji. Nasz kompleksowy system ocen opiera się na setkach uzasadnionych pomiarów i benchmarków, co pozwala zachować obiektywizm.


