Notebookcheck Logo
Teaser

Recenzja mini-PC Asus NUC 14 Pro+ - potencjalny zabójca komputerów stacjonarnych ważący zaledwie 622 gramy

Wszechstronna moc z wyjątkowymi możliwościami.

Asus NUC 14 Pro+ obiecuje imponującą wydajność w kompaktowej obudowie, z najnowszymi procesorami i ogromną mocą. Ale jak sprawdza się w codziennym użytkowaniu? W tej recenzji poddajemy NUC 14 Pro+ testom, aby sprawdzić, czy spełnia on swoje obietnice i czy naprawdę może służyć jako ważny zamiennik komputera stacjonarnego.
Sebastian Bade, 👁 Sebastian Bade (tłumaczenie DeepL / Ninh Duy) Published 🇺🇸 🇩🇪 ...
Mini PC Desktop Intel Meteor Lake Thunderbolt

Werdykt - Wysoka wydajność wiąże się z kosztami

Asus NUC 14 Pro+ z procesorem Intel Core Ultra 9 185H wyróżnia się pod wieloma względami jako kompaktowy mini PC. Zasilany procesorem nowej generacji, zapewnia doskonałą wydajność do wymagających zadań, od wielozadaniowości po aplikacje kreatywne, takie jak edycja zdjęć i wideo. Wizualnie, Asus NUC 14 Pro+ wydaje się mniejszy niż wiele innych mini PC, dzięki eleganckiej srebrno-białej kolorystyce. Szczególnie imponującą cechą jest szeroki zakres opcji łączności, w tym dwa przyszłościowe porty Thunderbolt 4. Beznarzędziowy demontaż spodniej części obudowy to sprytny wybór, pozwalający na szybką i łatwą aktualizację dysku SSD lub pamięci RAM.

Minusem jest poziom hałasu przy wysokim lub średnim obciążeniu, który może być wyraźnie zauważalny w zależności od scenariusza użytkowania. Przydałaby się lepsza regulacja krzywej wentylatora od razu po wyjęciu z pudełka, zwłaszcza biorąc pod uwagę cenę zakupu. W końcu BIOS oferuje szereg ustawień, które mogą pomóc poprawić tę kwestię. Niemniej jednak, NUC 14 Pro+ pozostaje dobrym wyborem dla każdego, kto szuka wydajnego, zajmującego niewiele miejsca komputera, zarówno do codziennych zadań, multimediów, jak i kreatywnych zastosowań.

Za

+ wytrzymała obudowa o najwyższej jakości
+ nienaganna jakość wykonania
+ dwa porty Thunderbolt 4
+ Intel Core Ultra 9 185H o nieograniczonej wydajności
+ potężny zintegrowany procesor graficzny
+ pojemna pamięć RAM 32 GB
+ niezmiennie stabilna wydajność dysku SSD
+ rozbudowane opcje konfiguracji BIOS-u
+ 36-miesięczna gwarancja

Przeciw

- jednostka chłodząca działa wydajnie przy ekstremalnych obciążeniach
- zauważalny hałas przy częściowym i pełnym obciążeniu
- brak interfejsu OCuLink
- wysoka cena

Cena i dostępność

Amazon sprzedaje testowany przez nas model Asus NUC 14 Pro+ za 1050 USD. Począwszy od 882 USD, model barebone jest również dostępny na Amazon. Aby uzyskać bardziej przystępną cenowo opcję, proszę rozważyć Asus NUC 14 Pro+ z procesorem Intel Core Ultra 5 125H, w cenie od około 765 USD, wyposażony w 512 GB SSD i 16 GB pamięci RAM.

Amazon Logo
$1,000.00
ASUS NUC 14 Pro+ Full System Mini PC with Intel 14th Gen Core Ultra 9 185H, 32GB DDR5 RAM, 1TB PCIe G4x4 NVMe SSD, Thunderbolt 4, Win 11 Home, Silver Aluminum Chassis, VESA Mount Included
  • $993.99
    ASUS NUC 14 Pro Tall Full System Mini PC with Intel 14th Gen Core Ultra 7 155H, 32GB DDR5 RAM, 1TB PCIe G4x4 NVMe SSD, Thunderbolt 4,Win 11 Pro, Toolless Chassis Access, VESA Mount Included
  • $779.00
    ASUS NUC 14 Pro AI Mini Computer, NUC14RVHU5 Intel Core Ultra5-125H Processor(14C/18T,Up to 4.5GHz) Intel Arc GPU Graphics,DDR5 5600 32GB RAM&512GB NVMe SSD Support 8K/WiFi6E/BT5.3/2.5G LAN/Win11Pro

Porównanie możliwych alternatyw

Image
Model / Review
Geizhals
Weight
Height
Display
1.
75.3%
Asus NUC 14 Pro+
Asus NUC 14 Pro+
Intel Core Ultra 9 185H ⎘
Intel Arc 8-Core iGPU ⎘
32 GB Pamięć, 1024 GB SSD
Bestpreis 1283.09€ playox.de
2. 1283.11€ office-partner.de
3. 1293.88€ playox (AT)
622 g41 mmx
2.
80.8%
Aoostar GEM12
Aoostar GEM12
AMD Ryzen 7 8845HS ⎘
AMD Radeon 780M ⎘
32 GB Pamięć, 1024 GB SSD
Listenpreis 649 US-Dollar653 g60 mmx
3.
78.8%
Geekom GT1 Mega
Geekom GT1 Mega
Intel Core Ultra 9 185H ⎘
Intel Arc 8-Core iGPU ⎘
32 GB Pamięć, 2048 GB SSD
Listenpreis 1149 EUR
Geizhals Suche
693 g46.9 mmx
4.
78.4%
Geekom AX8 Pro
Geekom AX8 Pro
AMD Ryzen 9 8945H ⎘
AMD Radeon 780M ⎘
32 GB Pamięć, 2048 GB SSD
Listenpreis 999 EUR548 g37 mmx
5.
87.5% v7 (old)
Minisforum AtomMan X7 Ti
Intel Core Ultra 9 185H ⎘
Intel Arc 8-Core iGPU ⎘
32 GB Pamięć, 1024 GB SSD
Bestpreis 1222€ pclike
2. 1222€ pclike
863 g48.6 mmx
6.
83.4% v7 (old)
Acemagic F2A
Acemagic F2A
Intel Core Ultra 7 155H ⎘
Intel Arc 8-Core iGPU ⎘
32 GB Pamięć, 1024 GB SSD
Listenpreis 1199 EUR768 g57 mmx

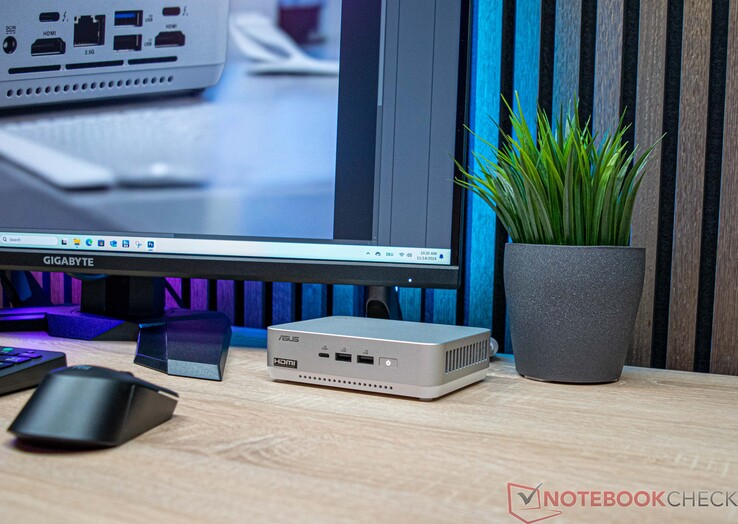
Asus NUC 14 Pro+ wyraźnie wyróżnia się wizualnie na tle serii NUC (Next Unit of Computing), która początkowo została wprowadzona przez firmę Intel. Ten niewielki mocarz jest nieco większy, ale wciąż bardzo kompaktowy, a w tej recenzji skupimy się na najlepszej konfiguracji wyposażonej w Intel Core Ultra 9 185H. Wraz z 32 GB pamięci RAM i dyskiem SSD o pojemności 1 TB system jest gotowy do użycia od razu, mimo że cena 1050 USD jest wyższa. Jeśli zdecydują się Państwo wyposażyć urządzenie we własną pamięć RAM i dysk SSD, zapłacą Państwo mniej. Dodatkowo, Asus NUC 14 Pro+ jest dostępny z procesorem Intel Core Ultra 5 125H lub Intel Core Ultra 7 155H jako alternatywne opcje. Te nieco mniej wydajne modele nadal są wystarczająco szybkie do codziennych zadań.

Na wysoce konkurencyjnym rynku Mini PC, Asus musi stawić czoła silnej konkurencji ze strony marek z Dalekiego Wschodu. Firmy takie jak Minisforum, Geekom i Aoostar oferują podobne urządzenia w bardziej konkurencyjnych cenach. Przyjrzyjmy się bliżej, jak Asus wypada na tle tych rywali.

Specyfikacje

Asus NUC 14 Pro+
Procesor
Intel Core Ultra 9 185H 16 x 3.8 - 5.1 GHz, 115 W PL2 / Short Burst, 115 W PL1 / Sustained, Meteor Lake-H
Karta grafiki
Intel Arc 8-Core iGPU, rdzeń: 2350 MHz
Pamięć
32 GB 
, 5600 MT/s, max 96 GB
Chipset
Intel Meteor Lake-U/P/H PCH
Dysk twardy
Samsung PM9A1a MZVL21T0HDLU, 1024 GB 
, 875 GB wolne miejsce
Karta dźwiękowa
Intel Meteor Lake-U/P/H PCH - cAVS (Audio, Voice, Speech)
Złącza
1 USB 2.0, 4 USB 3.1 Gen2, 2 USB 4.0 40 Gbps, 2 Thunderbolt, 2 HDMI, 2 DisplayPort, 1 blokada Kensingtona, 1 złącze stacji dokującej
Łączność
Intel Ethernet Controller I226-V (10/2500MBit/s), Intel Wi-Fi 6E AX211 (a/b/g/h/n = Wi-Fi 4/ac = Wi-Fi 5/ax = Wi-Fi 6/ Wi-Fi 6E 6 GHz), Bluetooth 5.3
Gabaryty
wysokość x szerokość x głębokość (mm): 41 x 144 x 112
System operacyjny
Microsoft Windows 11 Pro
Inne
150W Power Adapter, 36 miesiące(y) gwarancji
Waga
622 g, zasilacz: 303 g
Cena
1250 EUR
Note: The manufacturer may use components from different suppliers including display panels, drives or memory sticks with similar specifications.


Asus NUC 14 Pro+
Asus NUC 14 Pro+
Asus NUC 14 Pro+
Asus NUC 14 Pro+
Asus NUC 14 Pro+
Asus NUC 14 Pro+
Asus NUC 14 Pro+
Asus NUC 14 Pro+ z zasilaczem (19,5 V; 7,7 A)
Zasilacz (19,5 V; 7,7 A)

Obudowa - solidne połączenie metalu i plastiku

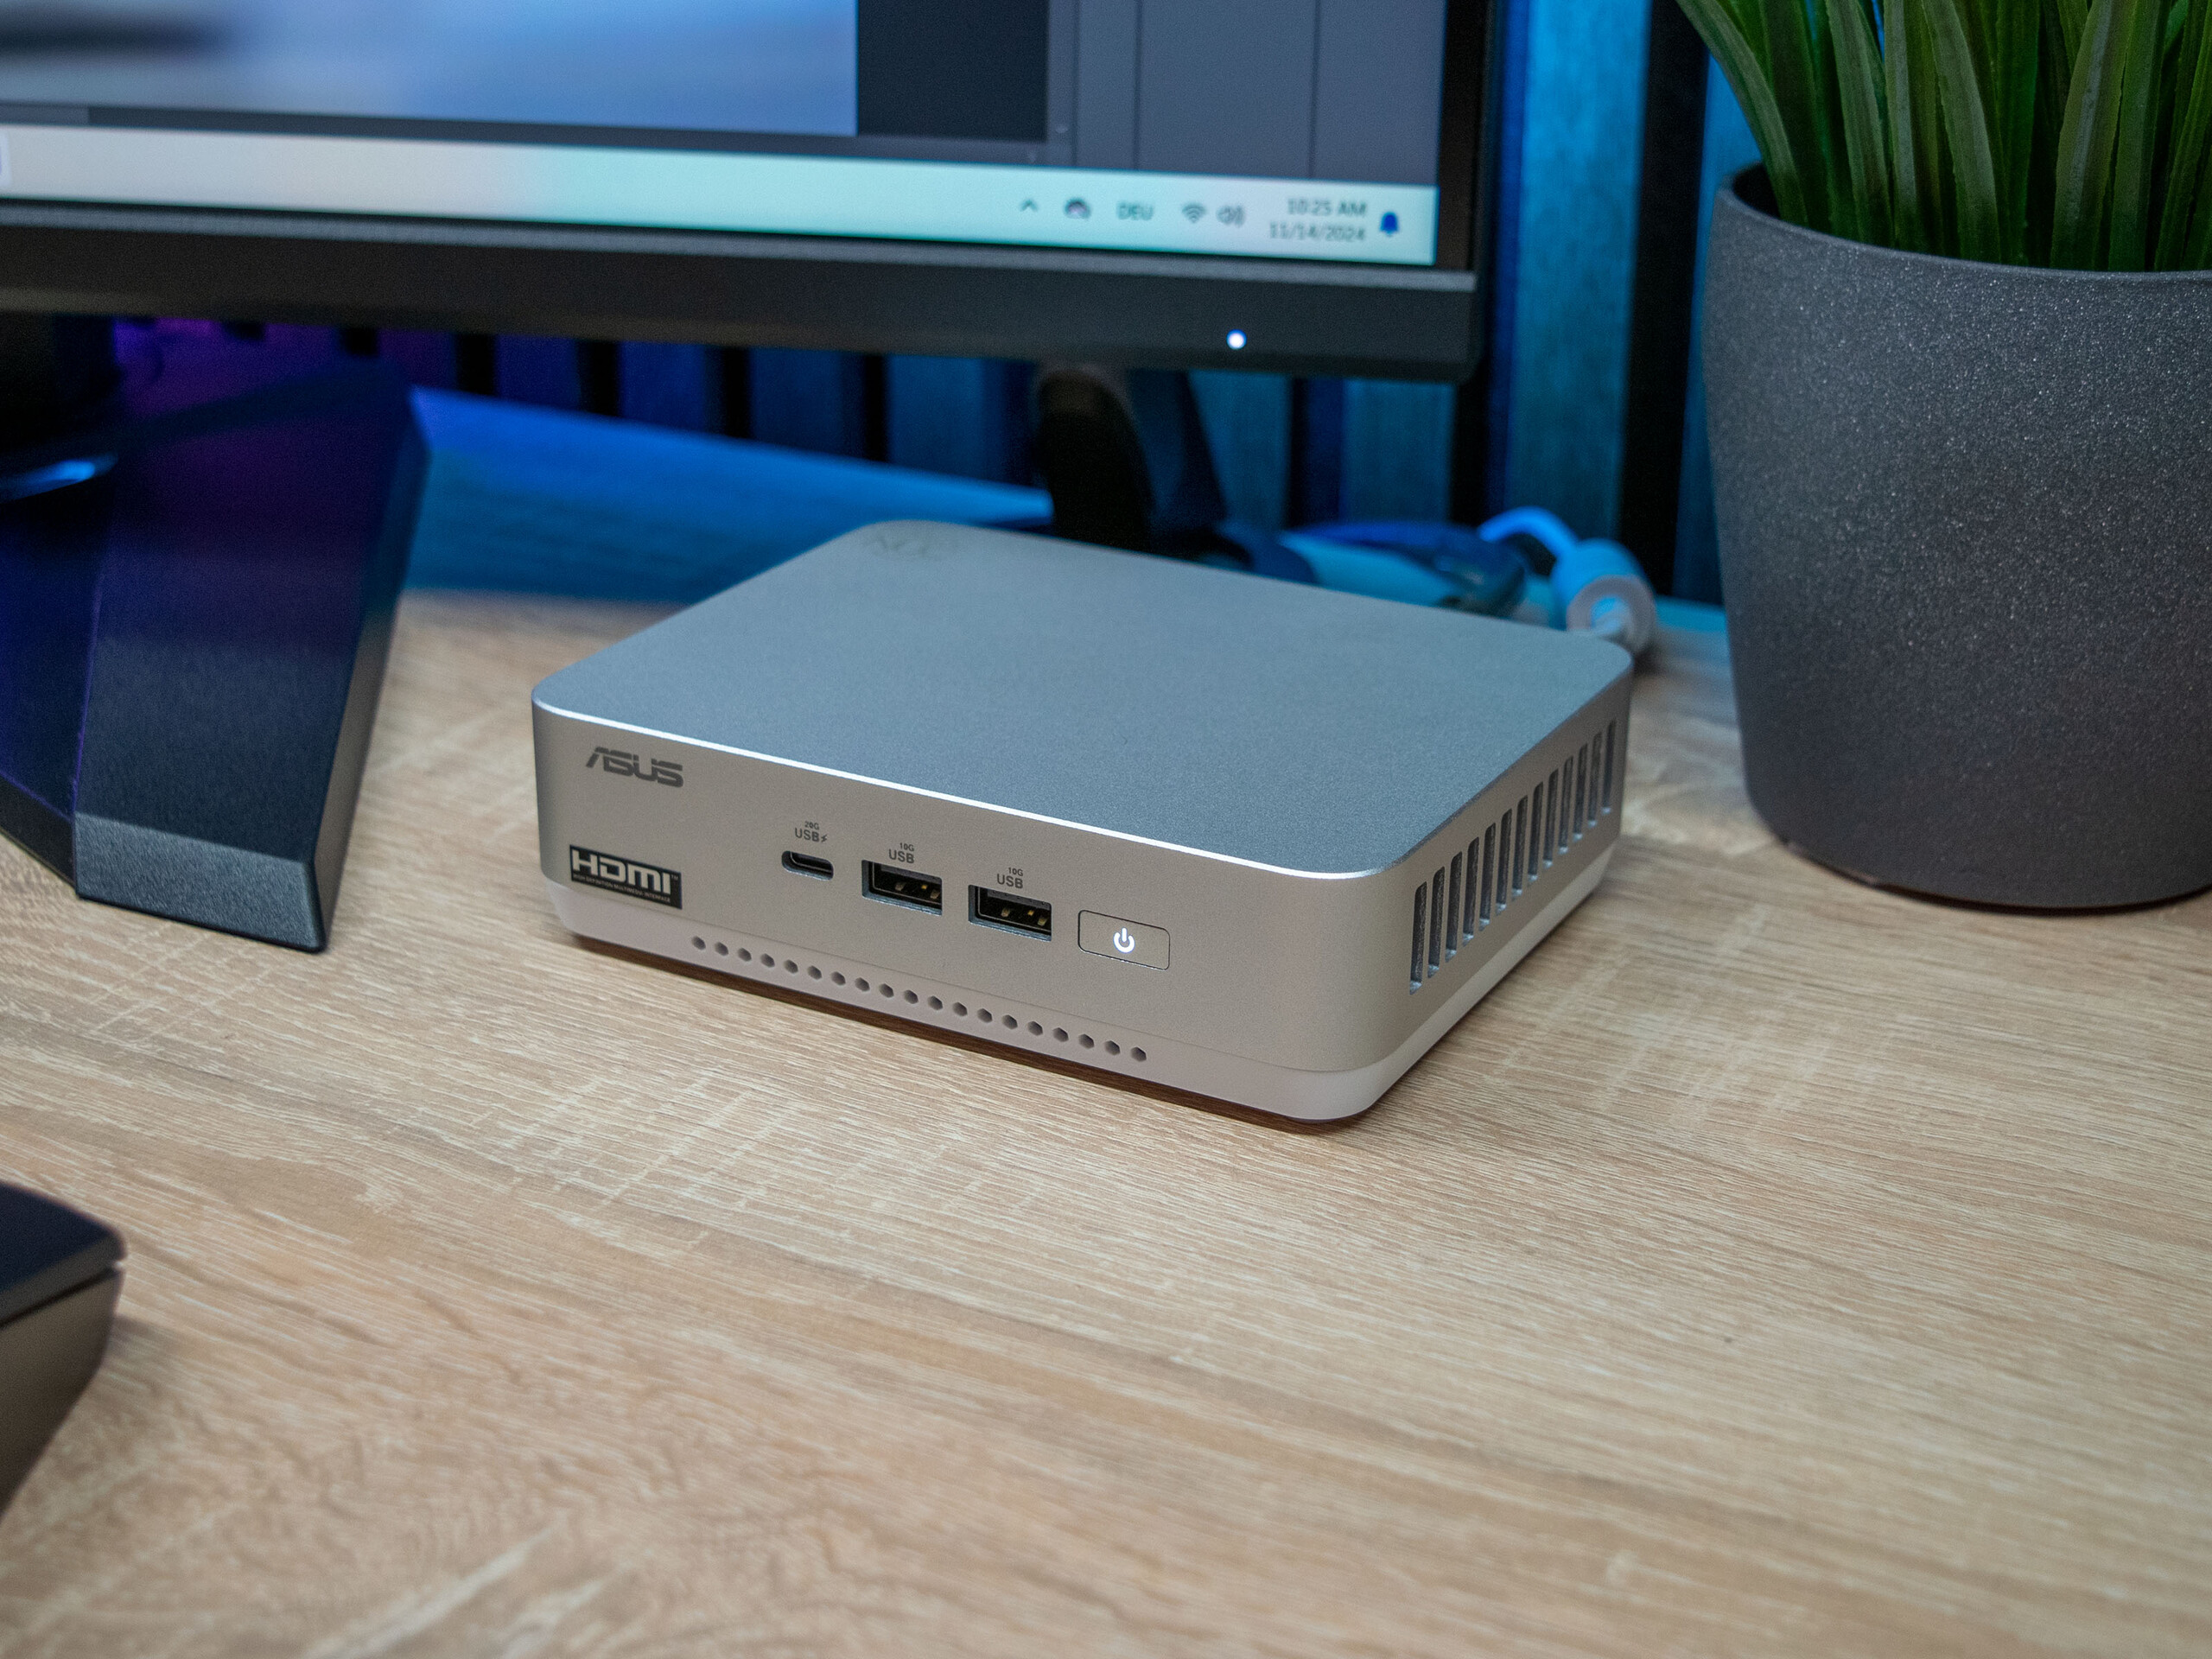
Wizualnie, Asus NUC 14 Pro+ wyraźnie wyróżnia się na tle znanych mini komputerów NUC, które są obecnie sprzedawane przez Asusa. Firma zdecydowała się na połączenie aluminium i plastiku jako materiałów. Spód, który działa również jako klapka konserwacyjna, jest wykonany z tworzywa sztucznego, podczas gdy góra jest wykonana z aluminium. Ogólnie rzecz biorąc, przetwarzanie małego komputera jest bezbłędne. Zarówno pod względem wizualnym, jak i taktycznym, nie ma nic do zarzucenia Asusowi NUC 14 Pro+. Pod względem zajmowanej powierzchni, Asus NUC 14 Pro+ zajmuje nieco więcej miejsca niż niektórzy z jego konkurentów. Jednak przy wymiarach 14,4 x 11,2 centymetra, jego rozmiar pozostaje rozsądny i powinien wygodnie zmieścić się na większości biurek. Dodatkowo, dzięki dołączonemu uchwytowi VESA, Asus NUC 14 Pro+ może być przymocowany bezpośrednio do monitora.
Porównanie rozmiarów

146 mm 146 mm 57 mm 768 g145 mm 145 mm 48.6 mm 863 g130 mm 130 mm 60 mm 653 g144 mm 112 mm 41 mm 622 g135 mm 132 mm 46.9 mm 693 g117 mm 112 mm 37 mm 548 g210 mm 148 mm 1 mm 2.9 g

Łączność - wszystkie niezbędne elementy w zestawie

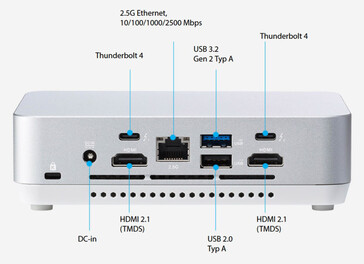
Mini-PC oferuje solidny wybór portów zewnętrznych, choć pod względem łącznej liczby połączeń nie dorównuje Geekom GT1 Mega. Asus udostępnił łącznie siedem portów USB, w tym cztery standardowe gniazda typu A i trzy typu C. Warto zauważyć, że dwa z portów USB-C obsługują Thunderbolt 4, co znacznie rozszerza potencjał Mini-PC w zakresie podłączania kompatybilnych akcesoriów. Dodatkowo, NUC 14 Pro+ wyposażony jest w dwa porty HDMI i połączenie sieciowe 2.5G. Ogólnie rzecz biorąc, rozkład połączeń jest dobrze przemyślany, zapewniając dobrą równowagę między wszechstronnością i dostępnością dla różnych przypadków użycia.

Złącza zewnętrzne w Asus NUC 14 Pro+ - przód (źródło: Asus)
Złącza zewnętrzne w Asus NUC 14 Pro+ - tył (źródło: Asus)
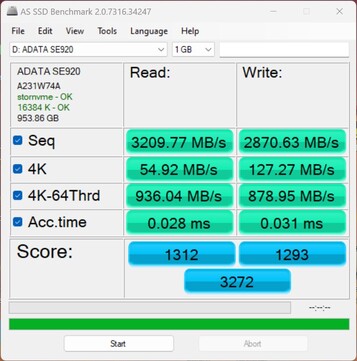
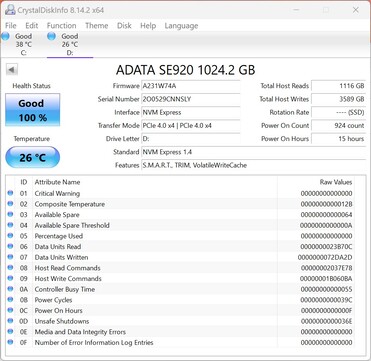
Sprawdzenie wydajności z ADATA SE920 przez USB4
ADATA SE920 działa z PCIe 4.0 x4
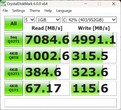
Connectivity - USB 3.x / USB4 / TB - AS SSD Seq Read Test (1GB)
Minisforum MS-A1
Radeon 780M, Ryzen 7 8700G, Kingston OM8PGP41024Q-A0
3245.45 MB/s
Asus NUC 14 Pro+
Arc 8-Core, Ultra 9 185H, Samsung PM9A1a MZVL21T0HDLU
3209.77 MB/s
Khadas Mind 2
Arc 8-Core, Ultra 7 155H, WD PC SN740 SDDPTQD-1T00
3165.4 MB/s
Average of class Mini PC
  (1611 - 3809, n=7, last 2 years)
2970 MB/s
Geekom GT1 Mega
Arc 8-Core, Ultra 9 185H, Crucial P3 Plus CT2000P3PSSD8
1611.37 MB/s

Komunikacja

Moduł WLAN jest wbudowany

Moduł Intel Wi-Fi 6E AX211 dołączony do Asus NUC 14 Pro+ zapewnia dobre wyniki podczas testów. Jego wydajność pozostaje jednak nieco w tyle za konkurencją. Aby uzyskać optymalną wydajność, zaleca się przede wszystkim korzystanie z pasma częstotliwości 6 GHz do komunikacji bezprzewodowej. Testy WLAN zostały przeprowadzone z wykorzystaniem routera Asus ROG Capture GT AXE11000.

Networking
iperf3 receive AXE11000 6GHz
Acemagic F2A
Intel Wi-Fi 7 BE200 320MHz
1770 (1584min - 1790max) MBit/s +22%
Minisforum AtomMan X7 Ti
Intel Wi-Fi 7 BE200 320MHz
1761 (1734min - 1774max) MBit/s +22%
Geekom AX8 Pro
MediaTek Wi-Fi 6E MT7922 160MHz Wireless LAN Card
1657 (1619min - 1670max) MBit/s +15%
Average Intel Wi-Fi 6E AX211
  (700 - 1857, n=216)
1494 MBit/s +3%
Asus NUC 14 Pro+
Intel Wi-Fi 6E AX211
1446 (1321min - 1486max) MBit/s
Average of class Mini PC
  (684 - 1771, n=57, last 2 years)
1390 MBit/s -4%
Geekom GT1 Mega
Intel Wi-Fi 7 BE200 320MHz
1149 (666min - 1346max) MBit/s -21%
iperf3 transmit AXE11000 6GHz
Geekom AX8 Pro
MediaTek Wi-Fi 6E MT7922 160MHz Wireless LAN Card
1800 (1737min - 1904max) MBit/s +47%
Acemagic F2A
Intel Wi-Fi 7 BE200 320MHz
1615 (767min - 1670max) MBit/s +32%
Minisforum AtomMan X7 Ti
Intel Wi-Fi 7 BE200 320MHz
1562 (1198min - 1713max) MBit/s +28%
Average Intel Wi-Fi 6E AX211
  (385 - 1851, n=216)
1368 MBit/s +12%
Average of class Mini PC
  (394 - 1800, n=57, last 2 years)
1334 MBit/s +9%
Geekom GT1 Mega
Intel Wi-Fi 7 BE200 320MHz
1242 (1110min - 1348max) MBit/s +2%
Asus NUC 14 Pro+
Intel Wi-Fi 6E AX211
1223 (1160min - 1303max) MBit/s
iperf3 receive AXE11000
Minisforum AtomMan X7 Ti
Intel Wi-Fi 7 BE200 320MHz
1599 (802min - 1683max) MBit/s +68%
Average Intel Wi-Fi 6E AX211
  (582 - 1890, n=246)
1383 MBit/s +45%
Geekom AX8 Pro
MediaTek Wi-Fi 6E MT7922 160MHz Wireless LAN Card
979 (962min - 989max) MBit/s +3%
Average of class Mini PC
  (349 - 1796, n=111, last 2 years)
953 MBit/s 0%
Asus NUC 14 Pro+
Intel Wi-Fi 6E AX211
951 (926min - 965max) MBit/s
Geekom GT1 Mega
Intel Wi-Fi 7 BE200 320MHz
888 (825min - 926max) MBit/s -7%
Acemagic F2A
Intel Wi-Fi 7 BE200 320MHz
838 (728min - 926max) MBit/s -12%
Aoostar GEM12
Intel Wi-Fi 6 AX200
740 (676min - 758max) MBit/s -22%
iperf3 transmit AXE11000
Minisforum AtomMan X7 Ti
Intel Wi-Fi 7 BE200 320MHz
1566 (904min - 1695max) MBit/s +121%
Average Intel Wi-Fi 6E AX211
  (64 - 1921, n=246)
1228 MBit/s +74%
Geekom AX8 Pro
MediaTek Wi-Fi 6E MT7922 160MHz Wireless LAN Card
966 (921min - 1008max) MBit/s +37%
Average of class Mini PC
  (269 - 1776, n=111, last 2 years)
883 MBit/s +25%
Geekom GT1 Mega
Intel Wi-Fi 7 BE200 320MHz
741 (690min - 797max) MBit/s +5%
Aoostar GEM12
Intel Wi-Fi 6 AX200
736 (369min - 756max) MBit/s +4%
Acemagic F2A
Intel Wi-Fi 7 BE200 320MHz
709 (369min - 977max) MBit/s 0%
Asus NUC 14 Pro+
Intel Wi-Fi 6E AX211
707 (666min - 737max) MBit/s
0501001502002503003504004505005506006507007508008509009501000105011001150120012501300135014001450150015501600165017001750180018501900Tooltip
Asus NUC 14 Pro+ Intel Wi-Fi 6E AX211; iperf3 transmit AXE11000 6GHz; iperf 3.1.3: Ø1223 (1160-1303)
Geekom GT1 Mega Intel Wi-Fi 7 BE200 320MHz; iperf3 transmit AXE11000 6GHz; iperf 3.1.3: Ø1242 (1110-1348)
Geekom AX8 Pro MediaTek Wi-Fi 6E MT7922 160MHz Wireless LAN Card; iperf3 transmit AXE11000 6GHz; iperf 3.1.3: Ø1800 (1737-1904)
Asus NUC 14 Pro+ Intel Wi-Fi 6E AX211; iperf3 receive AXE11000 6GHz; iperf 3.1.3: Ø1445 (1321-1486)
Geekom GT1 Mega Intel Wi-Fi 7 BE200 320MHz; iperf3 receive AXE11000 6GHz; iperf 3.1.3: Ø1126 (666-1346)
Geekom AX8 Pro MediaTek Wi-Fi 6E MT7922 160MHz Wireless LAN Card; iperf3 receive AXE11000 6GHz; iperf 3.1.3: Ø1656 (1619-1670)
Asus NUC 14 Pro+ Intel Wi-Fi 6E AX211; iperf3 receive AXE11000; iperf 3.1.3: Ø950 (926-965)
Geekom GT1 Mega Intel Wi-Fi 7 BE200 320MHz; iperf3 receive AXE11000; iperf 3.1.3: Ø887 (825-926)
Geekom AX8 Pro MediaTek Wi-Fi 6E MT7922 160MHz Wireless LAN Card; iperf3 receive AXE11000; iperf 3.1.3: Ø978 (962-989)
Asus NUC 14 Pro+ Intel Wi-Fi 6E AX211; iperf3 transmit AXE11000; iperf 3.1.3: Ø707 (666-737)
Geekom GT1 Mega Intel Wi-Fi 7 BE200 320MHz; iperf3 transmit AXE11000; iperf 3.1.3: Ø741 (690-797)
Geekom AX8 Pro MediaTek Wi-Fi 6E MT7922 160MHz Wireless LAN Card; iperf3 transmit AXE11000; iperf 3.1.3: Ø966 (921-1008)

Akcesoria

W zestawie z Asus NUC 14 Pro+ otrzymają Państwo 150-watowy zasilacz, podstawkę VESA oraz niezbędny zestaw montażowy. W zestawie nie ma żadnych innych urządzeń peryferyjnych, takich jak klawiatura czy mysz.

Konserwacja

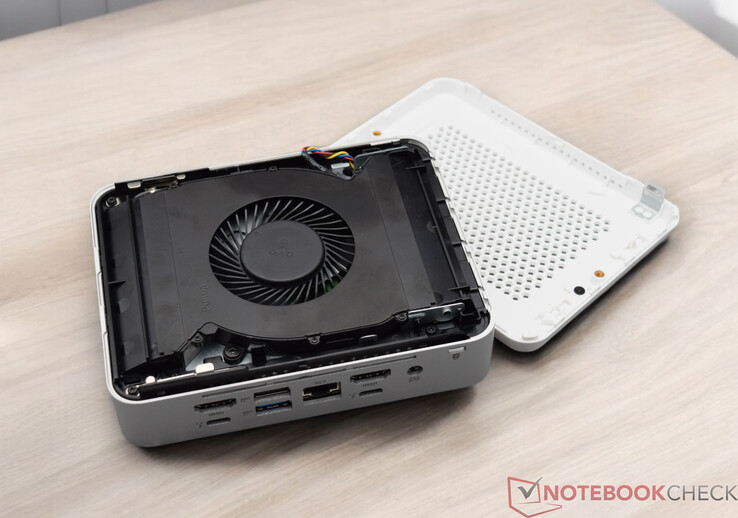
Asus NUC 14 Pro+ jest również dostępny w wersji barebone, co oznacza, że będą Państwo musieli samodzielnie zainstalować pamięć RAM i dysk SSD. Jest to dość proste, ponieważ spód można zdjąć bez użycia narzędzi. W naszym egzemplarzu testowym zainstalowano już dysk SSD i dwa moduły SO-DIMM. Wciąż jest miejsce na dodanie kolejnego dysku SSD, choć należy wziąć pod uwagę całkowitą długość wynoszącą 42 milimetry.

Asus NUC 14 Pro+ ze zdjętym spodem
Asus NUC 14 Pro+ z rozłożoną jednostką chłodzącą
Widok wnętrza Asus NUC 14 Pro+

Zrównoważony rozwój

W porównaniu do tradycyjnego komputera stacjonarnego, Asus NUC 14 Pro+ to kompaktowy komputer, który oferuje znaczne korzyści w zakresie oszczędności energii. Dostarczany jest w niewielkim, odpowiednio dużym pudełku. Sam mini PC wykonany jest głównie z metalu i plastiku, choć nie jest jasne, czy do jego budowy użyto materiałów pochodzących z recyklingu. Doceniamy trzyletni okres gwarancji, który jest godną uwagi cechą.

Wydajność - Intel Core Ultra 9 185H bez żadnych ograniczeń

Procesor Intel Core Ultra 9 185H to flagowy model firmy Intel z obecnej serii Meteor Lake H. Jego hybrydowa konstrukcja oferuje znaczną wydajność do codziennych zadań, a jednocześnie pozostaje energooszczędna, gdy pełna moc nie jest potrzebna. Asus NUC 14 Pro+ z procesorem Intel Core Ultra 7 155Hz taką samą liczbą rdzeni, jest nieco bardziej przystępną cenowo opcją. Umieszczony niżej w spektrum, Asus NUC 14 Pro+ z procesorem Intel Core Ultra 5 125H SoC również korzysta z hybrydowej konstrukcji i zawiera NPU. Model ten jest doskonałym wyborem dla osób, dla których priorytetem jest stosunek ceny do wydajności.

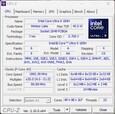
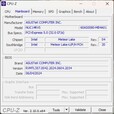
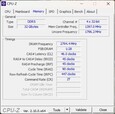
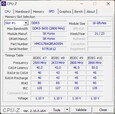
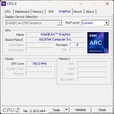
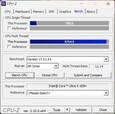
CPU-Z
CPU-Z
CPU-Z
CPU-Z
CPU-Z
CPU-Z
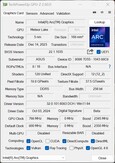
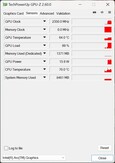
GPU-Z
GPU-Z
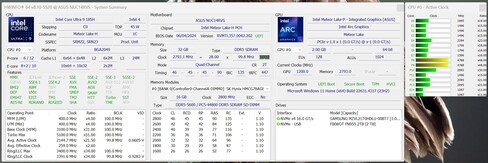
HWiNFO

Warunki testowania

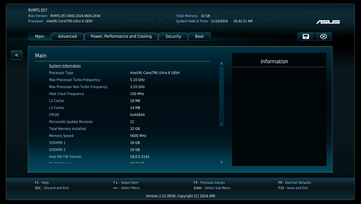
Wszystkie testy wydajności przeprowadziliśmy przy użyciu profilu energetycznego Balanced i nie zmienialiśmy wydajności SoC, pozostawiając go w stanie domyślnym zgodnie z ustawieniami BIOS-u (Balanced). Rozbudowane konfiguracje BIOS-u są doskonałe. W porównaniu do mini PC takich marek jak Geekom, Minisforum czy Acemagic, Asus wyraźnie wyróżnia się pod tym względem. Oprócz regulacji poboru mocy procesora, użytkownicy mogą nawet dezaktywować poszczególne porty USB, jeśli zajdzie taka potrzeba.

Procesor

Topowy model Asus NUC 14 Pro+ jest napędzany przez procesor Intel Core Ultra 9 185Hktóry oferuje 16 rdzeni i 22 wątki, zapewniając doskonałą wydajność wielowątkową. Asus nie ogranicza maksymalnego zużycia energii, co oznacza, że teoretycznie możliwe jest pobranie do 115 watów. W testach obciążeniowych zaobserwowaliśmy, że system radzi sobie z krótkimi skokami poboru mocy do 100 watów. Chociaż Asus nie wykorzystuje w pełni potencjału w tym zakresie, SoC w Asus NUC 14 Pro+ osiąga wyższe zużycie energii w porównaniu do innych mini PC. Różnice w wydajności pomiędzy konkurencyjnymi modelami są jednak minimalne, więc nie jest to zauważalna różnica.

Procesor Intel Core Ultra 5 125H został również uwzględniony do porównania wydajności. W porównaniu do Intel Core Ultra 9 185H, Intel Core Ultra 5 125H jest około 10 do 15 procent wolniejszy.

Aby uzyskać więcej porównań i szczegółowych testów porównawczych, proszę zapoznać się z naszą tabelą porównawczą procesorów.

Cinebench R15
Cinebench R15
Cinebench R20
Cinebench R20
Cinebench R23
Cinebench R23
Cinebench 2024
Cinebench 2024
Performance Rating - Percent
Asus NUC 14 Pro+
Intel Core Ultra 9 185H
55.6 pt
Geekom AX8 Pro
AMD Ryzen 9 8945H
55.6 pt
Minisforum AtomMan X7 Ti
Intel Core Ultra 9 185H
55.5 pt
Aoostar GEM12
AMD Ryzen 7 8845HS
55.4 pt
Geekom GT1 Mega
Intel Core Ultra 9 185H
55 pt
Acemagic F2A
Intel Core Ultra 7 155H
54.2 pt
Average Intel Core Ultra 5 125H
 
48.9 pt
Cinebench 2024
CPU Multi Core
Minisforum AtomMan X7 Ti
Intel Core Ultra 9 185H
1067 Points +8%
Acemagic F2A
Intel Core Ultra 7 155H
1022 Points +3%
Asus NUC 14 Pro+
Intel Core Ultra 9 185H
991 Points
Aoostar GEM12
AMD Ryzen 7 8845HS
933 Points -6%
Geekom GT1 Mega
Intel Core Ultra 9 185H
924 Points -7%
Geekom AX8 Pro
AMD Ryzen 9 8945H
852 Points -14%
Average Intel Core Ultra 5 125H
  (331 - 815, n=5)
638 Points -36%
CPU Single Core
Minisforum AtomMan X7 Ti
Intel Core Ultra 9 185H
110 Points +3%
Aoostar GEM12
AMD Ryzen 7 8845HS
107 Points 0%
Geekom AX8 Pro
AMD Ryzen 9 8945H
107 Points 0%
Geekom GT1 Mega
Intel Core Ultra 9 185H
107 Points 0%
Asus NUC 14 Pro+
Intel Core Ultra 9 185H
107 Points
Acemagic F2A
Intel Core Ultra 7 155H
106 Points -1%
Average Intel Core Ultra 5 125H
  (97 - 102.2, n=5)
100.2 Points -6%
Cinebench R23
Multi Core
Geekom GT1 Mega
Intel Core Ultra 9 185H
18608 Points +6%
Acemagic F2A
Intel Core Ultra 7 155H
18497 Points +5%
Minisforum AtomMan X7 Ti
Intel Core Ultra 9 185H
18016 Points +2%
Asus NUC 14 Pro+
Intel Core Ultra 9 185H
17615 Points
Aoostar GEM12
AMD Ryzen 7 8845HS
16130 Points -8%
Geekom AX8 Pro
AMD Ryzen 9 8945H
15516 Points -12%
Average Intel Core Ultra 5 125H
  (9194 - 14564, n=6)
12308 Points -30%
Single Core
Minisforum AtomMan X7 Ti
Intel Core Ultra 9 185H
1851 Points +5%
Geekom AX8 Pro
AMD Ryzen 9 8945H
1808 Points +2%
Aoostar GEM12
AMD Ryzen 7 8845HS
1783 Points +1%
Geekom GT1 Mega
Intel Core Ultra 9 185H
1774 Points +1%
Acemagic F2A
Intel Core Ultra 7 155H
1771 Points 0%
Asus NUC 14 Pro+
Intel Core Ultra 9 185H
1764 Points
Average Intel Core Ultra 5 125H
  (1549 - 1735, n=6)
1668 Points -5%
Cinebench R20
CPU (Single Core)
Minisforum AtomMan X7 Ti
Intel Core Ultra 9 185H
715 Points +2%
Geekom AX8 Pro
AMD Ryzen 9 8945H
703 Points 0%
Asus NUC 14 Pro+
Intel Core Ultra 9 185H
702 Points
Geekom GT1 Mega
Intel Core Ultra 9 185H
696 Points -1%
Aoostar GEM12
AMD Ryzen 7 8845HS
691 Points -2%
Acemagic F2A
Intel Core Ultra 7 155H
679 Points -3%
Average Intel Core Ultra 5 125H
  (622 - 664, n=6)
643 Points -8%
CPU (Multi Core)
Minisforum AtomMan X7 Ti
Intel Core Ultra 9 185H
7196 Points +3%
Geekom GT1 Mega
Intel Core Ultra 9 185H
7192 Points +3%
Acemagic F2A
Intel Core Ultra 7 155H
7188 Points +3%
Asus NUC 14 Pro+
Intel Core Ultra 9 185H
6997 Points
Aoostar GEM12
AMD Ryzen 7 8845HS
6346 Points -9%
Geekom AX8 Pro
AMD Ryzen 9 8945H
6153 Points -12%
Average Intel Core Ultra 5 125H
  (3673 - 5618, n=6)
4766 Points -32%
Cinebench R15
CPU Single 64Bit
Geekom AX8 Pro
AMD Ryzen 9 8945H
284 Points +8%
Aoostar GEM12
AMD Ryzen 7 8845HS
279 Points +6%
Minisforum AtomMan X7 Ti
Intel Core Ultra 9 185H
268 Points +2%
Geekom GT1 Mega
Intel Core Ultra 9 185H
262 Points 0%
Asus NUC 14 Pro+
Intel Core Ultra 9 185H
262 Points
Acemagic F2A
Intel Core Ultra 7 155H
258 Points -2%
Average Intel Core Ultra 5 125H
  (235 - 251, n=6)
244 Points -7%
CPU Multi 64Bit
Asus NUC 14 Pro+
Intel Core Ultra 9 185H
2863 Points
Geekom GT1 Mega
Intel Core Ultra 9 185H
2794 Points -2%
Minisforum AtomMan X7 Ti
Intel Core Ultra 9 185H
2746 Points -4%
Acemagic F2A
Intel Core Ultra 7 155H
2738 Points -4%
Aoostar GEM12
AMD Ryzen 7 8845HS
2537 Points -11%
Geekom AX8 Pro
AMD Ryzen 9 8945H
2521 Points -12%
Average Intel Core Ultra 5 125H
  (1700 - 2245, n=6)
1983 Points -31%
Cinebench R11.5
CPU Single 64Bit
Aoostar GEM12
AMD Ryzen 7 8845HS
3.32 Points +5%
Geekom AX8 Pro
AMD Ryzen 9 8945H
3.28 Points +4%
Minisforum AtomMan X7 Ti
Intel Core Ultra 9 185H
3.27 Points +4%
Asus NUC 14 Pro+
Intel Core Ultra 9 185H
3.15 Points
Acemagic F2A
Intel Core Ultra 7 155H
3.13 Points -1%
Geekom GT1 Mega
Intel Core Ultra 9 185H
3.13 Points -1%
Average Intel Core Ultra 5 125H
  (2.86 - 3.03, n=4)
2.94 Points -7%
CPU Multi 64Bit
Asus NUC 14 Pro+
Intel Core Ultra 9 185H
34.81 Points
Geekom GT1 Mega
Intel Core Ultra 9 185H
34.34 Points -1%
Minisforum AtomMan X7 Ti
Intel Core Ultra 9 185H
33.95 Points -2%
Acemagic F2A
Intel Core Ultra 7 155H
33.49 Points -4%
Aoostar GEM12
AMD Ryzen 7 8845HS
29.76 Points -15%
Geekom AX8 Pro
AMD Ryzen 9 8945H
29.14 Points -16%
Average Intel Core Ultra 5 125H
  (21.9 - 27, n=4)
25.6 Points -26%
Cinebench R10
Rendering Single CPUs 64Bit
Geekom AX8 Pro
AMD Ryzen 9 8945H
14451 Points +4%
Minisforum AtomMan X7 Ti
Intel Core Ultra 9 185H
14374 Points +3%
Aoostar GEM12
AMD Ryzen 7 8845HS
14163 Points +2%
Geekom GT1 Mega
Intel Core Ultra 9 185H
13997 Points +1%
Acemagic F2A
Intel Core Ultra 7 155H
13938 Points 0%
Asus NUC 14 Pro+
Intel Core Ultra 9 185H
13892 Points
Average Intel Core Ultra 5 125H
  (12858 - 13281, n=2)
13070 Points -6%
Rendering Multiple CPUs 64Bit
Acemagic F2A
Intel Core Ultra 7 155H
95005 Points +3%
Asus NUC 14 Pro+
Intel Core Ultra 9 185H
92183 Points
Geekom GT1 Mega
Intel Core Ultra 9 185H
91553 Points -1%
Minisforum AtomMan X7 Ti
Intel Core Ultra 9 185H
88902 Points -4%
Aoostar GEM12
AMD Ryzen 7 8845HS
85872 Points -7%
Geekom AX8 Pro
AMD Ryzen 9 8945H
84253 Points -9%
Average Intel Core Ultra 5 125H
  (78788 - 78817, n=2)
78803 Points -15%
Blender - v2.79 BMW27 CPU
Average Intel Core Ultra 5 125H
  (228 - 364, n=6)
285 Seconds * -55%
Geekom AX8 Pro
AMD Ryzen 9 8945H
206 Seconds * -12%
Aoostar GEM12
AMD Ryzen 7 8845HS
197 Seconds * -7%
Geekom GT1 Mega
Intel Core Ultra 9 185H
191 Seconds * -4%
Asus NUC 14 Pro+
Intel Core Ultra 9 185H
184 Seconds *
Acemagic F2A
Intel Core Ultra 7 155H
178 Seconds * +3%
Minisforum AtomMan X7 Ti
Intel Core Ultra 9 185H
171 Seconds * +7%
wPrime 2.10
32m
Average Intel Core Ultra 5 125H
  (4.11 - 9.5, n=3)
6.03 s * -77%
Acemagic F2A
Intel Core Ultra 7 155H
3.523 s * -3%
Asus NUC 14 Pro+
Intel Core Ultra 9 185H
3.411 s *
Geekom GT1 Mega
Intel Core Ultra 9 185H
3.271 s * +4%
Minisforum AtomMan X7 Ti
Intel Core Ultra 9 185H
3.254 s * +5%
Aoostar GEM12
AMD Ryzen 7 8845HS
2.703 s * +21%
Geekom AX8 Pro
AMD Ryzen 9 8945H
2.688 s * +21%
1024m
Minisforum AtomMan X7 Ti
Intel Core Ultra 9 185H
441.275 s * -405%
Average Intel Core Ultra 5 125H
  (149 - 297, n=3)
231 s * -164%
Geekom GT1 Mega
Intel Core Ultra 9 185H
165.075 s * -89%
Acemagic F2A
Intel Core Ultra 7 155H
139.617 s * -60%
Aoostar GEM12
AMD Ryzen 7 8845HS
98.896 s * -13%
Asus NUC 14 Pro+
Intel Core Ultra 9 185H
87.408 s *
Geekom AX8 Pro
AMD Ryzen 9 8945H
74.917 s * +14%
X264 HD Benchmark 4.0
Pass 1
Geekom GT1 Mega
Intel Core Ultra 9 185H
336.5 (329min - 346max) fps +6%
Minisforum AtomMan X7 Ti
Intel Core Ultra 9 185H
335.5 (329min - 340max) fps +6%
Acemagic F2A
Intel Core Ultra 7 155H
325 (323min - 328max) fps +3%
Asus NUC 14 Pro+
Intel Core Ultra 9 185H
317 (310min - 328max) fps
Average Intel Core Ultra 5 125H
  (305 - 309, n=3)
306 fps -3%
Geekom AX8 Pro
AMD Ryzen 9 8945H
300 (299min - 301max) fps -5%
Aoostar GEM12
AMD Ryzen 7 8845HS
289 (286min - 292max) fps -9%
Pass 2
Geekom GT1 Mega
Intel Core Ultra 9 185H
161.5 (159.8min - 163.8max) fps +5%
Minisforum AtomMan X7 Ti
Intel Core Ultra 9 185H
158.2 (157.4min - 158.8max) fps +3%
Acemagic F2A
Intel Core Ultra 7 155H
154.15 (153.8min - 154.3max) fps 0%
Asus NUC 14 Pro+
Intel Core Ultra 9 185H
153.6 (147.8min - 162.3max) fps
Aoostar GEM12
AMD Ryzen 7 8845HS
143.7 (143min - 145.2max) fps -6%
Geekom AX8 Pro
AMD Ryzen 9 8945H
141.2 (141min - 143.9max) fps -8%
Average Intel Core Ultra 5 125H
  (129.6 - 134, n=3)
132 fps -14%
WinRAR - Result
Geekom GT1 Mega
Intel Core Ultra 9 185H
8563 KB/s +10%
Minisforum AtomMan X7 Ti
Intel Core Ultra 9 185H
7940 KB/s +2%
Average Intel Core Ultra 5 125H
  (5594 - 13080, n=4)
7773 KB/s 0%
Asus NUC 14 Pro+
Intel Core Ultra 9 185H
7763 KB/s
Geekom AX8 Pro
AMD Ryzen 9 8945H
7744 KB/s 0%
Acemagic F2A
Intel Core Ultra 7 155H
7723 KB/s -1%
Aoostar GEM12
AMD Ryzen 7 8845HS
7327 KB/s -6%
TrueCrypt
AES Mean 100MB
Geekom AX8 Pro
AMD Ryzen 9 8945H
14.5 GB/s +20%
Aoostar GEM12
AMD Ryzen 7 8845HS
14.4 GB/s +19%
Asus NUC 14 Pro+
Intel Core Ultra 9 185H
12.1 GB/s
Minisforum AtomMan X7 Ti
Intel Core Ultra 9 185H
11.3 GB/s -7%
Geekom GT1 Mega
Intel Core Ultra 9 185H
11 GB/s -9%
Acemagic F2A
Intel Core Ultra 7 155H
10.6 GB/s -12%
Average Intel Core Ultra 5 125H
  (8.8 - 9, n=4)
8.93 GB/s -26%
Twofish Mean 100MB
Asus NUC 14 Pro+
Intel Core Ultra 9 185H
2.3 GB/s
Geekom AX8 Pro
AMD Ryzen 9 8945H
2.1 GB/s -9%
Aoostar GEM12
AMD Ryzen 7 8845HS
2 GB/s -13%
Geekom GT1 Mega
Intel Core Ultra 9 185H
1.9 GB/s -17%
Minisforum AtomMan X7 Ti
Intel Core Ultra 9 185H
1.8 GB/s -22%
Acemagic F2A
Intel Core Ultra 7 155H
1.7 GB/s -26%
Average Intel Core Ultra 5 125H
  (1.2 - 1.4, n=4)
1.35 GB/s -41%
Serpent Mean 100MB
Aoostar GEM12
AMD Ryzen 7 8845HS
1.3 GB/s 0%
Geekom AX8 Pro
AMD Ryzen 9 8945H
1.3 GB/s 0%
Asus NUC 14 Pro+
Intel Core Ultra 9 185H
1.3 GB/s
Minisforum AtomMan X7 Ti
Intel Core Ultra 9 185H
1.1 GB/s -15%
Geekom GT1 Mega
Intel Core Ultra 9 185H
1.1 GB/s -15%
Acemagic F2A
Intel Core Ultra 7 155H
1 GB/s -23%
Average Intel Core Ultra 5 125H
  (0.817 - 0.869, n=4)
0.843 GB/s -35%
Geekbench 5.5
Multi-Core
Geekom GT1 Mega
Intel Core Ultra 9 185H
13763 Points +1%
Asus NUC 14 Pro+
Intel Core Ultra 9 185H
13566 Points
Minisforum AtomMan X7 Ti
Intel Core Ultra 9 185H
13392 Points -1%
Acemagic F2A
Intel Core Ultra 7 155H
12662 Points -7%
Aoostar GEM12
AMD Ryzen 7 8845HS
12143 Points -10%
Geekom AX8 Pro
AMD Ryzen 9 8945H
11980 Points -12%
Average Intel Core Ultra 5 125H
  (9696 - 10856, n=6)
10408 Points -23%
Single-Core
Geekom AX8 Pro
AMD Ryzen 9 8945H
1994 Points +14%
Aoostar GEM12
AMD Ryzen 7 8845HS
1958 Points +12%
Minisforum AtomMan X7 Ti
Intel Core Ultra 9 185H
1856 Points +6%
Geekom GT1 Mega
Intel Core Ultra 9 185H
1852 Points +6%
Acemagic F2A
Intel Core Ultra 7 155H
1746 Points 0%
Asus NUC 14 Pro+
Intel Core Ultra 9 185H
1743 Points
Average Intel Core Ultra 5 125H
  (1593 - 1699, n=6)
1660 Points -5%
Geekbench 5.0
5.0 Multi-Core
Geekom GT1 Mega
Intel Core Ultra 9 185H
13822 Points +1%
Asus NUC 14 Pro+
Intel Core Ultra 9 185H
13736 Points
Minisforum AtomMan X7 Ti
Intel Core Ultra 9 185H
13228 Points -4%
Acemagic F2A
Intel Core Ultra 7 155H
12438 Points -9%
Aoostar GEM12
AMD Ryzen 7 8845HS
12086 Points -12%
Geekom AX8 Pro
AMD Ryzen 9 8945H
11804 Points -14%
Average Intel Core Ultra 5 125H
  (10676 - 10747, n=2)
10712 Points -22%
5.0 Single-Core
Geekom AX8 Pro
AMD Ryzen 9 8945H
1907 Points +13%
Aoostar GEM12
AMD Ryzen 7 8845HS
1900 Points +12%
Minisforum AtomMan X7 Ti
Intel Core Ultra 9 185H
1821 Points +7%
Geekom GT1 Mega
Intel Core Ultra 9 185H
1797 Points +6%
Acemagic F2A
Intel Core Ultra 7 155H
1708 Points +1%
Asus NUC 14 Pro+
Intel Core Ultra 9 185H
1695 Points
Average Intel Core Ultra 5 125H
  (1596 - 1659, n=2)
1628 Points -4%
Geekbench 4.4
64 Bit Single-Core Score
Geekom AX8 Pro
AMD Ryzen 9 8945H
8140 Points +16%
Aoostar GEM12
AMD Ryzen 7 8845HS
8034 Points +14%
Minisforum AtomMan X7 Ti
Intel Core Ultra 9 185H
7602 Points +8%
Geekom GT1 Mega
Intel Core Ultra 9 185H
7516 Points +7%
Asus NUC 14 Pro+
Intel Core Ultra 9 185H
7040 Points
Acemagic F2A
Intel Core Ultra 7 155H
6927 Points -2%
Average Intel Core Ultra 5 125H
  (6734 - 6964, n=3)
6816 Points -3%
64 Bit Multi-Core Score
Geekom GT1 Mega
Intel Core Ultra 9 185H
49924 Points 0%
Asus NUC 14 Pro+
Intel Core Ultra 9 185H
49826 Points
Minisforum AtomMan X7 Ti
Intel Core Ultra 9 185H
47960 Points -4%
Geekom AX8 Pro
AMD Ryzen 9 8945H
47917 Points -4%
Aoostar GEM12
AMD Ryzen 7 8845HS
47777 Points -4%
Acemagic F2A
Intel Core Ultra 7 155H
45250 Points -9%
Average Intel Core Ultra 5 125H
  (38648 - 38793, n=3)
38726 Points -22%
3DMark 11 - 1280x720 Performance Physics
Asus NUC 14 Pro+
Intel Core Ultra 9 185H
22681 Points
Geekom AX8 Pro
AMD Ryzen 9 8945H
22340 Points -2%
Minisforum AtomMan X7 Ti
Intel Core Ultra 9 185H
21875 Points -4%
Aoostar GEM12
AMD Ryzen 7 8845HS
21762 Points -4%
Acemagic F2A
Intel Core Ultra 7 155H
20846 Points -8%
Geekom GT1 Mega
Intel Core Ultra 9 185H
18130 Points -20%
Average Intel Core Ultra 5 125H
  (12766 - 17992, n=8)
16347 Points -28%
7-Zip 18.03
7z b 4
Minisforum AtomMan X7 Ti
Intel Core Ultra 9 185H
71934 MIPS +3%
Geekom GT1 Mega
Intel Core Ultra 9 185H
71050 MIPS +2%
Aoostar GEM12
AMD Ryzen 7 8845HS
70733 MIPS +1%
Asus NUC 14 Pro+
Intel Core Ultra 9 185H
69720 MIPS
Geekom AX8 Pro
AMD Ryzen 9 8945H
66557 MIPS -5%
Acemagic F2A
Intel Core Ultra 7 155H
66438 MIPS -5%
Average Intel Core Ultra 5 125H
  (0 - 0, n=2)
0 MIPS -100%
7z b 4 -mmt1
Geekom AX8 Pro
AMD Ryzen 9 8945H
6691 MIPS +17%
Aoostar GEM12
AMD Ryzen 7 8845HS
6644 MIPS +16%
Asus NUC 14 Pro+
Intel Core Ultra 9 185H
5713 MIPS
Geekom GT1 Mega
Intel Core Ultra 9 185H
5657 MIPS -1%
Minisforum AtomMan X7 Ti
Intel Core Ultra 9 185H
5560 MIPS -3%
Acemagic F2A
Intel Core Ultra 7 155H
5485 MIPS -4%
Average Intel Core Ultra 5 125H
  (4663 - 5136, n=6)
4948 MIPS -13%
HWBOT x265 Benchmark v2.2 - 4k Preset
Minisforum AtomMan X7 Ti
Intel Core Ultra 9 185H
20.9 fps +6%
Geekom AX8 Pro
AMD Ryzen 9 8945H
20.6 fps +5%
Aoostar GEM12
AMD Ryzen 7 8845HS
20.5 fps +4%
Geekom GT1 Mega
Intel Core Ultra 9 185H
20.2 fps +3%
Asus NUC 14 Pro+
Intel Core Ultra 9 185H
19.7 fps
Acemagic F2A
Intel Core Ultra 7 155H
19.6 fps -1%
Average Intel Core Ultra 5 125H
  (9.7 - 16.7, n=6)
13.4 fps -32%
R Benchmark 2.5 - Overall mean
Average Intel Core Ultra 5 125H
  (0.4898 - 0.53, n=6)
0.506 sec * -12%
Acemagic F2A
Intel Core Ultra 7 155H
0.4652 sec * -3%
Minisforum AtomMan X7 Ti
Intel Core Ultra 9 185H
0.4627 sec * -3%
Geekom AX8 Pro
AMD Ryzen 9 8945H
0.4576 sec * -2%
Geekom GT1 Mega
Intel Core Ultra 9 185H
0.4571 sec * -1%
Asus NUC 14 Pro+
Intel Core Ultra 9 185H
0.4504 sec *
Aoostar GEM12
AMD Ryzen 7 8845HS
0.4392 sec * +2%
LibreOffice - 20 Documents To PDF
Average Intel Core Ultra 5 125H
  (42.7 - 70.9, n=6)
53.4 s * -3%
Geekom GT1 Mega
Intel Core Ultra 9 185H
52.1 s * -1%
Asus NUC 14 Pro+
Intel Core Ultra 9 185H
51.8 s *
Geekom AX8 Pro
AMD Ryzen 9 8945H
49.8 s * +4%
Minisforum AtomMan X7 Ti
Intel Core Ultra 9 185H
49.5 s * +4%
Aoostar GEM12
AMD Ryzen 7 8845HS
47.5 s * +8%
Acemagic F2A
Intel Core Ultra 7 155H
44.5 s * +14%
WebXPRT 3 - Overall
Geekom AX8 Pro
AMD Ryzen 9 8945H
309 Points +15%
Aoostar GEM12
AMD Ryzen 7 8845HS
300 Points +12%
Geekom GT1 Mega
Intel Core Ultra 9 185H
286 Points +7%
Acemagic F2A
Intel Core Ultra 7 155H
276 Points +3%
Asus NUC 14 Pro+
Intel Core Ultra 9 185H
268 Points
Minisforum AtomMan X7 Ti
Intel Core Ultra 9 185H
264 Points -1%
Average Intel Core Ultra 5 125H
  (245 - 263, n=6)
255 Points -5%
Mozilla Kraken 1.1 - Total
Average Intel Core Ultra 5 125H
  (560 - 595, n=6)
575 ms * -9%
Acemagic F2A
Intel Core Ultra 7 155H
535 ms * -1%
Minisforum AtomMan X7 Ti
Intel Core Ultra 9 185H
532 ms * -1%
Asus NUC 14 Pro+
Intel Core Ultra 9 185H
528 ms *
Geekom GT1 Mega
Intel Core Ultra 9 185H
518 ms * +2%
Aoostar GEM12
AMD Ryzen 7 8845HS
517 ms * +2%
Geekom AX8 Pro
AMD Ryzen 9 8945H
506 ms * +4%
3DMark
1920x1080 Fire Strike Physics
Asus NUC 14 Pro+
Intel Core Ultra 9 185H
30340 Points
Geekom AX8 Pro
AMD Ryzen 9 8945H
27363 Points -10%
Aoostar GEM12
AMD Ryzen 7 8845HS
26194 Points -14%
Minisforum AtomMan X7 Ti
Intel Core Ultra 9 185H
26038 Points -14%
Acemagic F2A
Intel Core Ultra 7 155H
25043 Points -17%
Geekom GT1 Mega
Intel Core Ultra 9 185H
24366 Points -20%
Average Intel Core Ultra 5 125H
  (16291 - 22978, n=8)
20865 Points -31%
2560x1440 Time Spy CPU
Minisforum AtomMan X7 Ti
Intel Core Ultra 9 185H
11481 Points 0%
Asus NUC 14 Pro+
Intel Core Ultra 9 185H
11428 Points
Geekom AX8 Pro
AMD Ryzen 9 8945H
10844 Points -5%
Aoostar GEM12
AMD Ryzen 7 8845HS
10824 Points -5%
Acemagic F2A
Intel Core Ultra 7 155H
10014 Points -12%
Geekom GT1 Mega
Intel Core Ultra 9 185H
9687 Points -15%
Average Intel Core Ultra 5 125H
  (6216 - 9182, n=8)
8210 Points -28%
Super Pi mod 1.5 XS 1M - 1M
Average Intel Core Ultra 5 125H
  (7.4 - 7.74, n=4)
7.52 s * -10%
Aoostar GEM12
AMD Ryzen 7 8845HS
7.331 s * -7%
Acemagic F2A
Intel Core Ultra 7 155H
7.168 s * -5%
Geekom AX8 Pro
AMD Ryzen 9 8945H
6.962 s * -2%
Asus NUC 14 Pro+
Intel Core Ultra 9 185H
6.84 s *
Geekom GT1 Mega
Intel Core Ultra 9 185H
6.762 s * +1%
Minisforum AtomMan X7 Ti
Intel Core Ultra 9 185H
6.751 s * +1%
Super Pi mod 1.5 XS 2M - 2M
Aoostar GEM12
AMD Ryzen 7 8845HS
18.138 s * -23%
Geekom AX8 Pro
AMD Ryzen 9 8945H
17.404 s * -18%
Average Intel Core Ultra 5 125H
  (16.4 - 17, n=4)
16.6 s * -12%
Acemagic F2A
Intel Core Ultra 7 155H
16.125 s * -9%
Geekom GT1 Mega
Intel Core Ultra 9 185H
14.928 s * -1%
Minisforum AtomMan X7 Ti
Intel Core Ultra 9 185H
14.879 s * -1%
Asus NUC 14 Pro+
Intel Core Ultra 9 185H
14.786 s *
Affinity Photo 2 - Combined (Multi CPU)
Minisforum AtomMan X7 Ti
Intel Core Ultra 9 185H
813 Points +6%
Geekom GT1 Mega
Intel Core Ultra 9 185H
792 Points +3%
Acemagic F2A
Intel Core Ultra 7 155H
770 Points 0%
Asus NUC 14 Pro+
Intel Core Ultra 9 185H
768 Points
Aoostar GEM12
AMD Ryzen 7 8845HS
633 Points -18%
Average Intel Core Ultra 5 125H
  (594 - 615, n=2)
605 Points -21%
Geekom AX8 Pro
AMD Ryzen 9 8945H
603 Points -21%

* ... im mniej tym lepiej

Cinebench R10 Rendering Single 32Bit
9767
Cinebench R10 Shading 64Bit
19713 Points
Cinebench R10 Rendering Multiple CPUs 64Bit
92183 Points
Cinebench R10 Rendering Single CPUs 64Bit
13892 Points
Cinebench R10 Shading 32Bit
18259
Cinebench R10 Rendering Multiple CPUs 32Bit
67204
Cinebench R11.5 CPU Single 32Bit
2.72 Points
Cinebench R11.5 CPU Multi 32Bit
30.69 Points
Cinebench R11.5 OpenGL 32Bit
111.95 fps
Cinebench R11.5 CPU Single 64Bit
3.15 Points
Cinebench R11.5 CPU Multi 64Bit
34.81 Points
Cinebench R11.5 OpenGL 64Bit
115.68 fps
Cinebench R15 CPU Single 64Bit
262 Points
Cinebench R15 CPU Multi 64Bit
2863 Points
Cinebench R15 Ref. Match 64Bit
97.8 %
Cinebench R15 OpenGL 64Bit
160.26 fps
Cinebench R20 CPU (Single Core)
702 Points
Cinebench R20 CPU (Multi Core)
6997 Points
Cinebench R23 Multi Core
17615 Points
Cinebench R23 Single Core
1764 Points
Cinebench 2024 CPU Single Core
107 Points
Cinebench 2024 CPU Multi Core
991 Points
Pomoc
Performance Rating
Geekom AX8 Pro
AMD Ryzen 9 8945H, Radeon 780M
94.8 pt
Aoostar GEM12
AMD Ryzen 7 8845HS, Radeon 780M
92.3 pt
Minisforum AtomMan X7 Ti
Intel Core Ultra 9 185H, Arc 8-Core
82.5 pt
Acemagic F2A
Intel Core Ultra 7 155H, Arc 8-Core
78.5 pt
Geekom GT1 Mega
Intel Core Ultra 9 185H, Arc 8-Core
75.8 pt
Asus NUC 14 Pro+
Intel Core Ultra 9 185H, Arc 8-Core
73.1 pt
Average of class Mini PC
 
57.9 pt
AIDA64 / FP32 Ray-Trace
Aoostar GEM12
AMD Ryzen 7 8845HS, Radeon 780M
25916 KRay/s +66%
Geekom AX8 Pro
AMD Ryzen 9 8945H, Radeon 780M
24531 KRay/s +57%
Acemagic F2A
Intel Core Ultra 7 155H, Arc 8-Core
17544 KRay/s +13%
Minisforum AtomMan X7 Ti
Intel Core Ultra 9 185H, Arc 8-Core
17312 KRay/s +11%
Asus NUC 14 Pro+
Intel Core Ultra 9 185H, Arc 8-Core
15589 KRay/s
Geekom GT1 Mega
Intel Core Ultra 9 185H, Arc 8-Core
15184 KRay/s -3%
Average of class Mini PC
  (646 - 51004, n=118, last 2 years)
12899 KRay/s -17%
AIDA64 / FPU Julia
Aoostar GEM12
AMD Ryzen 7 8845HS, Radeon 780M
109747 Points +36%
Geekom AX8 Pro
AMD Ryzen 9 8945H, Radeon 780M
106518 Points +32%
Minisforum AtomMan X7 Ti
Intel Core Ultra 9 185H, Arc 8-Core
91112 Points +13%
Acemagic F2A
Intel Core Ultra 7 155H, Arc 8-Core
88829 Points +10%
Asus NUC 14 Pro+
Intel Core Ultra 9 185H, Arc 8-Core
80501 Points
Geekom GT1 Mega
Intel Core Ultra 9 185H, Arc 8-Core
78346 Points -3%
Average of class Mini PC
  (3857 - 214250, n=118, last 2 years)
64853 Points -19%
AIDA64 / CPU SHA3
Aoostar GEM12
AMD Ryzen 7 8845HS, Radeon 780M
4695 MB/s +20%
Geekom AX8 Pro
AMD Ryzen 9 8945H, Radeon 780M
4684 MB/s +20%
Minisforum AtomMan X7 Ti
Intel Core Ultra 9 185H, Arc 8-Core
4343 MB/s +11%
Acemagic F2A
Intel Core Ultra 7 155H, Arc 8-Core
4246 MB/s +9%
Asus NUC 14 Pro+
Intel Core Ultra 9 185H, Arc 8-Core
3909 MB/s
Geekom GT1 Mega
Intel Core Ultra 9 185H, Arc 8-Core
3753 MB/s -4%
Average of class Mini PC
  (260 - 9399, n=118, last 2 years)
2863 MB/s -27%
AIDA64 / CPU Queen
Aoostar GEM12
AMD Ryzen 7 8845HS, Radeon 780M
116083 Points +23%
Geekom AX8 Pro
AMD Ryzen 9 8945H, Radeon 780M
114586 Points +21%
Asus NUC 14 Pro+
Intel Core Ultra 9 185H, Arc 8-Core
94503 Points
Acemagic F2A
Intel Core Ultra 7 155H, Arc 8-Core
89748 Points -5%
Minisforum AtomMan X7 Ti
Intel Core Ultra 9 185H, Arc 8-Core
87291 Points -8%
Geekom GT1 Mega
Intel Core Ultra 9 185H, Arc 8-Core
86969 Points -8%
Average of class Mini PC
  (8172 - 184747, n=118, last 2 years)
80064 Points -15%
AIDA64 / FPU SinJulia
Aoostar GEM12
AMD Ryzen 7 8845HS, Radeon 780M
14876 Points +43%
Geekom AX8 Pro
AMD Ryzen 9 8945H, Radeon 780M
14631 Points +41%
Minisforum AtomMan X7 Ti
Intel Core Ultra 9 185H, Arc 8-Core
10759 Points +3%
Asus NUC 14 Pro+
Intel Core Ultra 9 185H, Arc 8-Core
10406 Points
Geekom GT1 Mega
Intel Core Ultra 9 185H, Arc 8-Core
10289 Points -1%
Acemagic F2A
Intel Core Ultra 7 155H, Arc 8-Core
10247 Points -2%
Average of class Mini PC
  (408 - 29064, n=118, last 2 years)
8760 Points -16%
AIDA64 / FPU Mandel
Aoostar GEM12
AMD Ryzen 7 8845HS, Radeon 780M
58597 Points +48%
Geekom AX8 Pro
AMD Ryzen 9 8945H, Radeon 780M
56505 Points +43%
Acemagic F2A
Intel Core Ultra 7 155H, Arc 8-Core
45718 Points +16%
Minisforum AtomMan X7 Ti
Intel Core Ultra 9 185H, Arc 8-Core
44874 Points +14%
Asus NUC 14 Pro+
Intel Core Ultra 9 185H, Arc 8-Core
39506 Points
Geekom GT1 Mega
Intel Core Ultra 9 185H, Arc 8-Core
38945 Points -1%
Average of class Mini PC
  (1987 - 113499, n=118, last 2 years)
33799 Points -14%
AIDA64 / CPU AES
Geekom AX8 Pro
AMD Ryzen 9 8945H, Radeon 780M
163032 MB/s +117%
Minisforum AtomMan X7 Ti
Intel Core Ultra 9 185H, Arc 8-Core
154066 MB/s +105%
Acemagic F2A
Intel Core Ultra 7 155H, Arc 8-Core
144741 MB/s +92%
Geekom GT1 Mega
Intel Core Ultra 9 185H, Arc 8-Core
138481 MB/s +84%
Average of class Mini PC
  (3691 - 325960, n=118, last 2 years)
88023 MB/s +17%
Aoostar GEM12
AMD Ryzen 7 8845HS, Radeon 780M
85572 MB/s +14%
Asus NUC 14 Pro+
Intel Core Ultra 9 185H, Arc 8-Core
75293 MB/s
AIDA64 / CPU ZLib
Minisforum AtomMan X7 Ti
Intel Core Ultra 9 185H, Arc 8-Core
1233 MB/s +7%
Acemagic F2A
Intel Core Ultra 7 155H, Arc 8-Core
1183 MB/s +2%
Geekom GT1 Mega
Intel Core Ultra 9 185H, Arc 8-Core
1181 MB/s +2%
Asus NUC 14 Pro+
Intel Core Ultra 9 185H, Arc 8-Core
1155 MB/s
Aoostar GEM12
AMD Ryzen 7 8845HS, Radeon 780M
1048 MB/s -9%
Geekom AX8 Pro
AMD Ryzen 9 8945H, Radeon 780M
976 MB/s -15%
Average of class Mini PC
  (74.9 - 2039, n=118, last 2 years)
741 MB/s -36%
AIDA64 / FP64 Ray-Trace
Aoostar GEM12
AMD Ryzen 7 8845HS, Radeon 780M
13875 KRay/s +68%
Geekom AX8 Pro
AMD Ryzen 9 8945H, Radeon 780M
13609 KRay/s +65%
Acemagic F2A
Intel Core Ultra 7 155H, Arc 8-Core
9284 KRay/s +12%
Minisforum AtomMan X7 Ti
Intel Core Ultra 9 185H, Arc 8-Core
9270 KRay/s +12%
Asus NUC 14 Pro+
Intel Core Ultra 9 185H, Arc 8-Core
8272 KRay/s
Geekom GT1 Mega
Intel Core Ultra 9 185H, Arc 8-Core
7925 KRay/s -4%
Average of class Mini PC
  (350 - 26952, n=118, last 2 years)
6891 KRay/s -17%
AIDA64 / CPU PhotoWorxx
Geekom GT1 Mega
Intel Core Ultra 9 185H, Arc 8-Core
47032 MPixel/s +4%
Minisforum AtomMan X7 Ti
Intel Core Ultra 9 185H, Arc 8-Core
45560 MPixel/s +1%
Asus NUC 14 Pro+
Intel Core Ultra 9 185H, Arc 8-Core
45293 MPixel/s
Aoostar GEM12
AMD Ryzen 7 8845HS, Radeon 780M
40245 MPixel/s -11%
Geekom AX8 Pro
AMD Ryzen 9 8945H, Radeon 780M
40114 MPixel/s -11%
Acemagic F2A
Intel Core Ultra 7 155H, Arc 8-Core
33092 MPixel/s -27%
Average of class Mini PC
  (4408 - 50500, n=118, last 2 years)
28353 MPixel/s -37%

Cinebench R15 Multi test ciągły

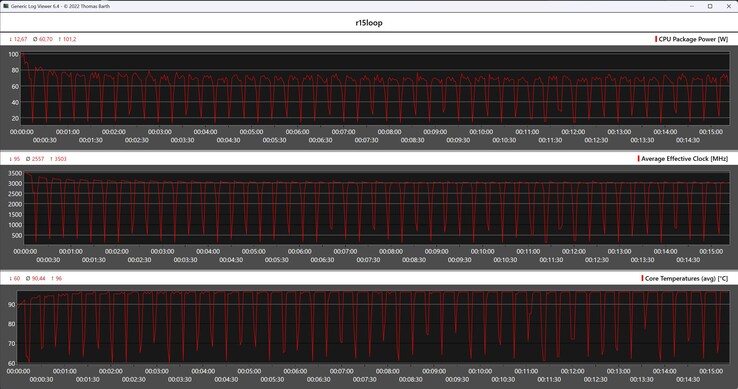
Wysoki limit wydajności Asusa NUC 14 Pro+ jest najbardziej zauważalny na początku testu wytrzymałości Cinebench R15. Podczas drugiego uruchomienia występuje niewielki spadek wydajności, ale strata ta stabilizuje się, a urządzenie ostatecznie kończy test obciążeniowy ze średnim wynikiem 2588 punktów. Asus wypada jednak słabo w porównaniu do Minisforum AtomMan X7 Ti i Acemagic F2Aco oznacza, że nasza próbka testowa zajmuje trzecie miejsce w tym porównaniu.

Metryki procesora podczas pętli Cinebench R15
01503004506007509001050120013501500165018001950210022502400255027002850Tooltip
Asus NUC 14 Pro+ Intel Core Ultra 9 185H, Intel Core Ultra 9 185H: Ø2588 (2519.69-2910.57)
Aoostar GEM12 AMD Ryzen 7 8845HS, AMD Ryzen 7 8845HS: Ø2530 (2503.13-2552.81)
Geekom GT1 Mega Intel Core Ultra 9 185H, Intel Core Ultra 9 185H: Ø2442 (2286.63-2795.05)
Geekom AX8 Pro AMD Ryzen 9 8945H, AMD Ryzen 9 8945H: Ø2223 (2100.4-2438.43)
Minisforum AtomMan X7 Ti Intel Core Ultra 9 185H, Intel Core Ultra 9 185H: Ø2784 (2721.64-2831.86)
Acemagic F2A Intel Core Ultra 7 155H, Intel Core Ultra 7 155H: Ø2759 (2690.7-2800.92)

Wydajność systemu

Asus NUC 14 Pro+ wyraźnie pokazuje, że choć dobre wyniki w benchmarkach CPU robią wrażenie, to nie zawsze przekładają się na równie wysoką wydajność w testach systemowych. Różnice względem szybszych konkurentów są stosunkowo niewielkie, co pokrywa się z naszym subiektywnym wrażeniem podczas okresu testowego. Zasilany przez Intel Core Ultra 9 185Hasus NUC 14 Pro+ oferuje wyjątkową wydajność, która pozostaje w dużej mierze niewykorzystana w codziennym użytkowaniu.

PCMark 10 / Score
Geekom AX8 Pro, AMD Ryzen 9 8945H
AMD Radeon 780M, Acer N7000
7553 Points +6%
Minisforum AtomMan X7 Ti, Intel Core Ultra 9 185H
Intel Arc 8-Core iGPU, Kingston OM8PGP41024Q-A0
7510 Points +6%
Aoostar GEM12, AMD Ryzen 7 8845HS
AMD Radeon 780M, Crucial P3 Plus CT1000P3PSSD8
7431 Points +5%
Geekom GT1 Mega, Intel Core Ultra 9 185H
Intel Arc 8-Core iGPU, Crucial P3 Plus CT2000P3PSSD8
7232 Points +2%
Acemagic F2A, Intel Core Ultra 7 155H
Intel Arc 8-Core iGPU, Kingston OM8SEP1024Q-A0
7120 Points 0%
Asus NUC 14 Pro+, Intel Core Ultra 9 185H
Intel Arc 8-Core iGPU, Samsung PM9A1a MZVL21T0HDLU
7103 Points
PCMark 10 / Essentials
Geekom AX8 Pro, AMD Ryzen 9 8945H
AMD Radeon 780M, Acer N7000
11227 Points +11%
Acemagic F2A, Intel Core Ultra 7 155H
Intel Arc 8-Core iGPU, Kingston OM8SEP1024Q-A0
11125 Points +10%
Minisforum AtomMan X7 Ti, Intel Core Ultra 9 185H
Intel Arc 8-Core iGPU, Kingston OM8PGP41024Q-A0
11030 Points +9%
Geekom GT1 Mega, Intel Core Ultra 9 185H
Intel Arc 8-Core iGPU, Crucial P3 Plus CT2000P3PSSD8
10824 Points +7%
Aoostar GEM12, AMD Ryzen 7 8845HS
AMD Radeon 780M, Crucial P3 Plus CT1000P3PSSD8
10822 Points +7%
Asus NUC 14 Pro+, Intel Core Ultra 9 185H
Intel Arc 8-Core iGPU, Samsung PM9A1a MZVL21T0HDLU
10135 Points
PCMark 10 / Productivity
Geekom AX8 Pro, AMD Ryzen 9 8945H
AMD Radeon 780M, Acer N7000
10774 Points +19%
Minisforum AtomMan X7 Ti, Intel Core Ultra 9 185H
Intel Arc 8-Core iGPU, Kingston OM8PGP41024Q-A0
10484 Points +16%
Aoostar GEM12, AMD Ryzen 7 8845HS
AMD Radeon 780M, Crucial P3 Plus CT1000P3PSSD8
10482 Points +16%
Asus NUC 14 Pro+, Intel Core Ultra 9 185H
Intel Arc 8-Core iGPU, Samsung PM9A1a MZVL21T0HDLU
9058 Points
Acemagic F2A, Intel Core Ultra 7 155H
Intel Arc 8-Core iGPU, Kingston OM8SEP1024Q-A0
8901 Points -2%
Geekom GT1 Mega, Intel Core Ultra 9 185H
Intel Arc 8-Core iGPU, Crucial P3 Plus CT2000P3PSSD8
8797 Points -3%
CrossMark / Overall
Aoostar GEM12, AMD Ryzen 7 8845HS
AMD Radeon 780M, Crucial P3 Plus CT1000P3PSSD8
1939 Points +13%
Geekom GT1 Mega, Intel Core Ultra 9 185H
Intel Arc 8-Core iGPU, Crucial P3 Plus CT2000P3PSSD8
1888 Points +10%
Geekom AX8 Pro, AMD Ryzen 9 8945H
AMD Radeon 780M, Acer N7000
1865 Points +9%
Acemagic F2A, Intel Core Ultra 7 155H
Intel Arc 8-Core iGPU, Kingston OM8SEP1024Q-A0
1802 Points +5%
Asus NUC 14 Pro+, Intel Core Ultra 9 185H
Intel Arc 8-Core iGPU, Samsung PM9A1a MZVL21T0HDLU
1713 Points
Minisforum AtomMan X7 Ti, Intel Core Ultra 9 185H
Intel Arc 8-Core iGPU, Kingston OM8PGP41024Q-A0
1675 Points -2%
CrossMark / Responsiveness
Geekom GT1 Mega, Intel Core Ultra 9 185H
Intel Arc 8-Core iGPU, Crucial P3 Plus CT2000P3PSSD8
1864 Points +35%
Aoostar GEM12, AMD Ryzen 7 8845HS
AMD Radeon 780M, Crucial P3 Plus CT1000P3PSSD8
1849 Points +34%
Acemagic F2A, Intel Core Ultra 7 155H
Intel Arc 8-Core iGPU, Kingston OM8SEP1024Q-A0
1700 Points +23%
Geekom AX8 Pro, AMD Ryzen 9 8945H
AMD Radeon 780M, Acer N7000
1583 Points +15%
Minisforum AtomMan X7 Ti, Intel Core Ultra 9 185H
Intel Arc 8-Core iGPU, Kingston OM8PGP41024Q-A0
1378 Points 0%
Asus NUC 14 Pro+, Intel Core Ultra 9 185H
Intel Arc 8-Core iGPU, Samsung PM9A1a MZVL21T0HDLU
1378 Points
CrossMark / Creativity
Geekom AX8 Pro, AMD Ryzen 9 8945H
AMD Radeon 780M, Acer N7000
2057 Points +4%
Aoostar GEM12, AMD Ryzen 7 8845HS
AMD Radeon 780M, Crucial P3 Plus CT1000P3PSSD8
2040 Points +3%
Asus NUC 14 Pro+, Intel Core Ultra 9 185H
Intel Arc 8-Core iGPU, Samsung PM9A1a MZVL21T0HDLU
1984 Points
Geekom GT1 Mega, Intel Core Ultra 9 185H
Intel Arc 8-Core iGPU, Crucial P3 Plus CT2000P3PSSD8
1959 Points -1%
Acemagic F2A, Intel Core Ultra 7 155H
Intel Arc 8-Core iGPU, Kingston OM8SEP1024Q-A0
1929 Points -3%
Minisforum AtomMan X7 Ti, Intel Core Ultra 9 185H
Intel Arc 8-Core iGPU, Kingston OM8PGP41024Q-A0
1883 Points -5%
CrossMark / Productivity
Aoostar GEM12, AMD Ryzen 7 8845HS
AMD Radeon 780M, Crucial P3 Plus CT1000P3PSSD8
1872 Points +18%
Geekom GT1 Mega, Intel Core Ultra 9 185H
Intel Arc 8-Core iGPU, Crucial P3 Plus CT2000P3PSSD8
1827 Points +15%
Geekom AX8 Pro, AMD Ryzen 9 8945H
AMD Radeon 780M, Acer N7000
1786 Points +12%
Acemagic F2A, Intel Core Ultra 7 155H
Intel Arc 8-Core iGPU, Kingston OM8SEP1024Q-A0
1717 Points +8%
Asus NUC 14 Pro+, Intel Core Ultra 9 185H
Intel Arc 8-Core iGPU, Samsung PM9A1a MZVL21T0HDLU
1591 Points
Minisforum AtomMan X7 Ti, Intel Core Ultra 9 185H
Intel Arc 8-Core iGPU, Kingston OM8PGP41024Q-A0
1589 Points 0%
AIDA64 / Memory Copy
Geekom GT1 Mega
Intel Core Ultra 9 185H, Arc 8-Core
73624 MB/s +5%
Minisforum AtomMan X7 Ti
Intel Core Ultra 9 185H, Arc 8-Core
71990 MB/s +3%
Asus NUC 14 Pro+
Intel Core Ultra 9 185H, Arc 8-Core
69929 MB/s
Geekom AX8 Pro
AMD Ryzen 9 8945H, Radeon 780M
68924 MB/s -1%
Aoostar GEM12
AMD Ryzen 7 8845HS, Radeon 780M
67777 MB/s -3%
Acemagic F2A
Intel Core Ultra 7 155H, Arc 8-Core
62397 MB/s -11%
Average of class Mini PC
  (6481 - 89287, n=118, last 2 years)
48312 MB/s -31%
AIDA64 / Memory Read
Geekom GT1 Mega
Intel Core Ultra 9 185H, Arc 8-Core
79371 MB/s +4%
Asus NUC 14 Pro+
Intel Core Ultra 9 185H, Arc 8-Core
76074 MB/s
Minisforum AtomMan X7 Ti
Intel Core Ultra 9 185H, Arc 8-Core
75449 MB/s -1%
Acemagic F2A
Intel Core Ultra 7 155H, Arc 8-Core
64323 MB/s -15%
Geekom AX8 Pro
AMD Ryzen 9 8945H, Radeon 780M
61624 MB/s -19%
Aoostar GEM12
AMD Ryzen 7 8845HS, Radeon 780M
61006 MB/s -20%
Average of class Mini PC
  (6914 - 99171, n=118, last 2 years)
49202 MB/s -35%
AIDA64 / Memory Write
Geekom AX8 Pro
AMD Ryzen 9 8945H, Radeon 780M
87138 MB/s +21%
Aoostar GEM12
AMD Ryzen 7 8845HS, Radeon 780M
86677 MB/s +20%
Asus NUC 14 Pro+
Intel Core Ultra 9 185H, Arc 8-Core
72287 MB/s
Geekom GT1 Mega
Intel Core Ultra 9 185H, Arc 8-Core
72187 MB/s 0%
Minisforum AtomMan X7 Ti
Intel Core Ultra 9 185H, Arc 8-Core
70596 MB/s -2%
Acemagic F2A
Intel Core Ultra 7 155H, Arc 8-Core
65057 MB/s -10%
Average of class Mini PC
  (6862 - 98583, n=118, last 2 years)
52727 MB/s -27%
AIDA64 / Memory Latency
Acemagic F2A
Intel Core Ultra 7 155H, Arc 8-Core
149 ns * -23%
Minisforum AtomMan X7 Ti
Intel Core Ultra 9 185H, Arc 8-Core
146.1 ns * -20%
Geekom GT1 Mega
Intel Core Ultra 9 185H, Arc 8-Core
136.7 ns * -13%
Asus NUC 14 Pro+
Intel Core Ultra 9 185H, Arc 8-Core
121.4 ns *
Average of class Mini PC
  (44.9 - 184.8, n=118, last 2 years)
91.6 ns * +25%
Geekom AX8 Pro
AMD Ryzen 9 8945H, Radeon 780M
91.4 ns * +25%
Aoostar GEM12
AMD Ryzen 7 8845HS, Radeon 780M
88.6 ns * +27%

* ... im mniej tym lepiej

Wydajność NPU

Jednostka NPU (Neural Processing Unit) jest kluczową cechą Intel Core Ultra 9 185H, umożliwiając SoC obsługę zadań AI z wyjątkową wydajnością. Nieograniczona moc procesora pozwala jednostce NPU osiągać najlepsze wyniki. Do porównania wydajności wykorzystaliśmy test UL Procyon AI Interface Benchmark. Jednak po raz kolejny Geekom GT1 Mega pozostaje silnym konkurentem pod tym względem.

UL Procyon for Windows / Overall Score Integer NPU
Geekom GT1 Mega
Intel Core Ultra 9 185H, Arc 8-Core
529 Points +2%
Asus NUC 14 Pro+
Intel Core Ultra 9 185H, Arc 8-Core
519 Points
Khadas Mind 2
Intel Core Ultra 7 155H, Arc 8-Core
504 Points -3%
Minisforum UH125 Pro
Intel Core Ultra 5 125H, Arc 7-Core
501 Points -3%
Acemagic F2A
Intel Core Ultra 7 155H, Arc 8-Core
499 Points -4%
UL Procyon for Windows / Overall Score Integer GPU
Acer Predator BiFrost Arc A770 OC, 16GB GDDR6
AMD Ryzen 9 7950X, Arc A770
1500 Points +79%
Acer Predator BiFrost Arc A750 OC
AMD Ryzen 9 7950X, Arc A750
1433 Points +71%
Asus NUC 14 Pro+
Intel Core Ultra 9 185H, Arc 8-Core
836 Points
Geekom GT1 Mega
Intel Core Ultra 9 185H, Arc 8-Core
801 Points -4%
Khadas Mind 2
Intel Core Ultra 7 155H, Arc 8-Core
687 Points -18%
Acemagic F2A
Intel Core Ultra 7 155H, Arc 8-Core
684 Points -18%
Minisforum UH125 Pro
Intel Core Ultra 5 125H, Arc 7-Core
547 Points -35%

Opóźnienia DPC

Wyniki opóźnień DPC Asus NUC 14 Pro+ są lepsze niż w przypadku innych mini PC. Wciąż jednak nie do końca przekonują. Zwiększone opóźnienia są już zauważalne podczas przeglądania Internetu za pomocą przeglądarki Edge, choć nie pogarszają się one podczas odtwarzania testowego wideo 4K. Dopiero podczas krótkiego testu obciążeniowego z Prime 95 opóźnienia ponownie rosną.

Maksymalne opóźnienie występuje podczas otwierania wielu kart przeglądarki
Maksymalne opóźnienie podczas odtwarzania materiałów wideo 4K
Maksymalne opóźnienie po dziesięciu sekundach Prime95
Sterownik uszeregowany według najdłuższego czasu wykonania
DPC Latencies / LatencyMon - interrupt to process latency (max), Web, Youtube, Prime95
Acemagic F2A
Arc 8-Core, Ultra 7 155H, Kingston OM8SEP1024Q-A0
2724 μs * -49%
Minisforum AtomMan X7 Ti
Arc 8-Core, Ultra 9 185H, Kingston OM8PGP41024Q-A0
2069.2 μs * -13%
Geekom AX8 Pro
Radeon 780M, R9 8945H, Acer N7000
1856 μs * -1%
Asus NUC 14 Pro+
Arc 8-Core, Ultra 9 185H, Samsung PM9A1a MZVL21T0HDLU
1831 μs *
Geekom GT1 Mega
Arc 8-Core, Ultra 9 185H, Crucial P3 Plus CT2000P3PSSD8
1145.7 μs * +37%
Aoostar GEM12
Radeon 780M, R7 8845HS, Crucial P3 Plus CT1000P3PSSD8
1001.9 μs * +45%

* ... im mniej tym lepiej

Urządzenia pamięci masowej

1 TB SSD
1 TB SSD

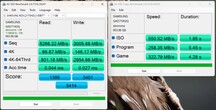
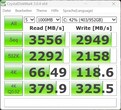
Asus wyposaża NUC 14 Pro+ w dysk SSD Samsung o pojemności 1 TB, który w pełni wykorzystuje interfejs M.2 z PCIe 4.0 x4 dla optymalnej wydajności. Zapewnia to doskonałą wydajność, porównywalną z dyskiem Acer N7000 używanym w komputerach Geekom AX8. Wraz z preinstalowanym dyskiem SSD 80 mm, dostępne jest dodatkowe gniazdo dla dysków SSD 42 mm. Oba dyski SSD są aktywnie chłodzone przez jednostkę umieszczoną na podstawie. Dysk SSD Samsunga dobrze wypadł w testach obciążeniowych, utrzymując stałą wydajność bez zauważalnych spadków. Porównanie z Acer N7000 pozostaje wyrównane.

W celu uzyskania dalszych porównań i testów porównawczych, proszę odnieść się do naszej tabela porównawcza.

AS SSD
AS SSD
CDM 3
CDM 3
CDM 5
CDM 5
CDM 6
CDM 6
CDI
CDI
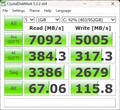
Samsung PM9A1a MZVL21T0HDLU
Sequential Read: 3556 MB/s
Sequential Write: 2949 MB/s
512K Read: 2292 MB/s
512K Write: 2158 MB/s
4K Read: 66.49 MB/s
4K Write: 118.6 MB/s
4K QD32 Read: 379.9 MB/s
4K QD32 Write: 325.5 MB/s
Drive Performance Rating - Percent
Aoostar GEM12
Crucial P3 Plus CT1000P3PSSD8
88.2 pt
Geekom GT1 Mega
Crucial P3 Plus CT2000P3PSSD8
82.6 pt
Geekom AX8 Pro
Acer N7000
63.7 pt
Asus NUC 14 Pro+
Samsung PM9A1a MZVL21T0HDLU
62.8 pt
Minisforum AtomMan X7 Ti
Kingston OM8PGP41024Q-A0
57.1 pt
Average of class Mini PC
 
46.2 pt
Acemagic F2A
Kingston OM8SEP1024Q-A0
45.1 pt
DiskSpd
seq read
Geekom AX8 Pro
Acer N7000
3921 (3897.31min - 3920.75max) MB/s +13%
Asus NUC 14 Pro+
Samsung PM9A1a MZVL21T0HDLU
3463 (3381.92min - 3463.03max) MB/s
Aoostar GEM12
Crucial P3 Plus CT1000P3PSSD8
3108 (3065.99min - 3107.56max) MB/s -10%
Geekom GT1 Mega
Crucial P3 Plus CT2000P3PSSD8
2734 (2730.27min - 2734.25max) MB/s -21%
Average of class Mini PC
  (277 - 4357, n=118, last 2 years)
2326 MB/s -33%
Minisforum AtomMan X7 Ti
Kingston OM8PGP41024Q-A0
2315 (2293.84min - 2315.26max) MB/s -33%
Acemagic F2A
Kingston OM8SEP1024Q-A0
1674 (1242.56min - 1673.54max) MB/s -52%
seq write
Aoostar GEM12
Crucial P3 Plus CT1000P3PSSD8
4619 (4584.79min - 4619.39max) MB/s +55%
Geekom GT1 Mega
Crucial P3 Plus CT2000P3PSSD8
3976 (425.08min - 3975.57max) MB/s +33%
Geekom AX8 Pro
Acer N7000
3791 (3695.18min - 3790.57max) MB/s +27%
Minisforum AtomMan X7 Ti
Kingston OM8PGP41024Q-A0
3386 (3076.94min - 3385.64max) MB/s +14%
Asus NUC 14 Pro+
Samsung PM9A1a MZVL21T0HDLU
2979 (2849.65min - 2979.21max) MB/s
Average of class Mini PC
  (229 - 5595, n=118, last 2 years)
2507 MB/s -16%
Acemagic F2A
Kingston OM8SEP1024Q-A0
1348 (1117.85min - 1347.87max) MB/s -55%
seq q8 t1 read
Geekom AX8 Pro
Acer N7000
7012 (5624.01min - 7012.25max) MB/s +1%
Asus NUC 14 Pro+
Samsung PM9A1a MZVL21T0HDLU
6962 (5614.59min - 6961.5max) MB/s
Aoostar GEM12
Crucial P3 Plus CT1000P3PSSD8
5213 (4500.71min - 5212.95max) MB/s -25%
Geekom GT1 Mega
Crucial P3 Plus CT2000P3PSSD8
5060 (4781.3min - 5060.16max) MB/s -27%
Minisforum AtomMan X7 Ti
Kingston OM8PGP41024Q-A0
4676 (4310.07min - 4675.81max) MB/s -33%
Average of class Mini PC
  (236 - 8430, n=118, last 2 years)
3797 MB/s -45%
Acemagic F2A
Kingston OM8SEP1024Q-A0
3194 (2810.81min - 3194.17max) MB/s -54%
seq q8 t1 write
Geekom AX8 Pro
Acer N7000
5685 (5389.6min - 5684.54max) MB/s +14%
Asus NUC 14 Pro+
Samsung PM9A1a MZVL21T0HDLU
4971 (4934.6min - 4970.75max) MB/s
Aoostar GEM12
Crucial P3 Plus CT1000P3PSSD8
4754 (4738.27min - 4754.03max) MB/s -4%
Geekom GT1 Mega
Crucial P3 Plus CT2000P3PSSD8
3985 (52.74min - 3985.01max) MB/s -20%
Minisforum AtomMan X7 Ti
Kingston OM8PGP41024Q-A0
3729 (3700.15min - 3728.95max) MB/s -25%
Average of class Mini PC
  (239 - 6669, n=118, last 2 years)
2813 MB/s -43%
Acemagic F2A
Kingston OM8SEP1024Q-A0
2212 (1222.43min - 2212.27max) MB/s -56%
4k q1 t1 read
Aoostar GEM12
Crucial P3 Plus CT1000P3PSSD8
78.7 (78.09min - 78.69max) MB/s +20%
Asus NUC 14 Pro+
Samsung PM9A1a MZVL21T0HDLU
65.8 (64.95min - 65.84max) MB/s
Minisforum AtomMan X7 Ti
Kingston OM8PGP41024Q-A0
63.5 (59.81min - 63.5max) MB/s -3%
Geekom GT1 Mega
Crucial P3 Plus CT2000P3PSSD8
62.5 (62.22min - 62.52max) MB/s -5%
Geekom AX8 Pro
Acer N7000
62.2 (61.55min - 62.23max) MB/s -5%
Average of class Mini PC
  (6.85 - 86.6, n=118, last 2 years)
55.3 MB/s -16%
Acemagic F2A
Kingston OM8SEP1024Q-A0
47.3 (47.07min - 47.31max) MB/s -28%
4k q1 t1 write
Geekom GT1 Mega
Crucial P3 Plus CT2000P3PSSD8
353 (348.24min - 353.16max) MB/s +195%
Aoostar GEM12
Crucial P3 Plus CT1000P3PSSD8
274 (271.38min - 273.89max) MB/s +129%
Average of class Mini PC
  (30.4 - 435, n=118, last 2 years)
196.1 MB/s +64%
Acemagic F2A
Kingston OM8SEP1024Q-A0
187.2 (181.54min - 187.2max) MB/s +57%
Geekom AX8 Pro
Acer N7000
187 (185.73min - 187.04max) MB/s +56%
Minisforum AtomMan X7 Ti
Kingston OM8PGP41024Q-A0
184.4 (177.6min - 184.36max) MB/s +54%
Asus NUC 14 Pro+
Samsung PM9A1a MZVL21T0HDLU
119.6 (116.09min - 119.59max) MB/s
4k q32 t16 read
Aoostar GEM12
Crucial P3 Plus CT1000P3PSSD8
3197 (3174.44min - 3196.85max) MB/s +266%
Geekom GT1 Mega
Crucial P3 Plus CT2000P3PSSD8
2876 (2861.34min - 2875.92max) MB/s +229%
Acemagic F2A
Kingston OM8SEP1024Q-A0
1824 (1239.47min - 1824.09max) MB/s +109%
Geekom AX8 Pro
Acer N7000
1644 (1568.76min - 1643.51max) MB/s +88%
Average of class Mini PC
  (26.1 - 4158, n=118, last 2 years)
1407 MB/s +61%
Minisforum AtomMan X7 Ti
Kingston OM8PGP41024Q-A0
1143 (1091.01min - 1142.98max) MB/s +31%
Asus NUC 14 Pro+
Samsung PM9A1a MZVL21T0HDLU
873 (810.06min - 872.85max) MB/s
4k q32 t16 write
Aoostar GEM12
Crucial P3 Plus CT1000P3PSSD8
3639 (3534.46min - 3639.09max) MB/s +943%
Geekom GT1 Mega
Crucial P3 Plus CT2000P3PSSD8
2822 (709.76min - 2821.52max) MB/s +709%
Acemagic F2A
Kingston OM8SEP1024Q-A0
1434 (1410.26min - 1433.71max) MB/s +311%
Average of class Mini PC
  (32.6 - 4288, n=118, last 2 years)
1325 MB/s +280%
Geekom AX8 Pro
Acer N7000
647 (598.22min - 647.4max) MB/s +85%
Minisforum AtomMan X7 Ti
Kingston OM8PGP41024Q-A0
497 (467.49min - 497.28max) MB/s +42%
Asus NUC 14 Pro+
Samsung PM9A1a MZVL21T0HDLU
349 (343.71min - 348.99max) MB/s
AS SSD
Score Total
Aoostar GEM12
Crucial P3 Plus CT1000P3PSSD8
10021 Points +85%
Geekom GT1 Mega
Crucial P3 Plus CT2000P3PSSD8
8215 Points +52%
Geekom AX8 Pro
Acer N7000
5512 Points +2%
Asus NUC 14 Pro+
Samsung PM9A1a MZVL21T0HDLU
5414 Points
Minisforum AtomMan X7 Ti
Kingston OM8PGP41024Q-A0
4987 Points -8%
Acemagic F2A
Kingston OM8SEP1024Q-A0
4412 Points -19%
Average of class Mini PC
  (211 - 10021, n=116, last 2 years)
4241 Points -22%
Score Read
Aoostar GEM12
Crucial P3 Plus CT1000P3PSSD8
3741 Points +168%
Geekom GT1 Mega
Crucial P3 Plus CT2000P3PSSD8
2779 Points +99%
Geekom AX8 Pro
Acer N7000
1793 Points +29%
Average of class Mini PC
  (76 - 3741, n=116, last 2 years)
1575 Points +13%
Acemagic F2A
Kingston OM8SEP1024Q-A0
1561 Points +12%
Minisforum AtomMan X7 Ti
Kingston OM8PGP41024Q-A0
1482 Points +6%
Asus NUC 14 Pro+
Samsung PM9A1a MZVL21T0HDLU
1395 Points
Score Write
Aoostar GEM12
Crucial P3 Plus CT1000P3PSSD8
4371 Points +29%
Geekom GT1 Mega
Crucial P3 Plus CT2000P3PSSD8
3987 Points +17%
Asus NUC 14 Pro+
Samsung PM9A1a MZVL21T0HDLU
3401 Points
Geekom AX8 Pro
Acer N7000
2896 Points -15%
Minisforum AtomMan X7 Ti
Kingston OM8PGP41024Q-A0
2807 Points -17%
Acemagic F2A
Kingston OM8SEP1024Q-A0
2082 Points -39%
Average of class Mini PC
  (88 - 4371, n=116, last 2 years)
1904 Points -44%
Seq Read
Asus NUC 14 Pro+
Samsung PM9A1a MZVL21T0HDLU
5266 MB/s
Geekom AX8 Pro
Acer N7000
4902 MB/s -7%
Aoostar GEM12
Crucial P3 Plus CT1000P3PSSD8
4317 MB/s -18%
Minisforum AtomMan X7 Ti
Kingston OM8PGP41024Q-A0
3779 MB/s -28%
Geekom GT1 Mega
Crucial P3 Plus CT2000P3PSSD8
3587 MB/s -32%
Average of class Mini PC
  (291 - 6620, n=116, last 2 years)
3235 MB/s -39%
Acemagic F2A
Kingston OM8SEP1024Q-A0
3010 MB/s -43%
Seq Write
Aoostar GEM12
Crucial P3 Plus CT1000P3PSSD8
4188 MB/s +39%
Geekom GT1 Mega
Crucial P3 Plus CT2000P3PSSD8
3938 MB/s +31%
Asus NUC 14 Pro+
Samsung PM9A1a MZVL21T0HDLU
3006 MB/s
Geekom AX8 Pro
Acer N7000
2835 MB/s -6%
Acemagic F2A
Kingston OM8SEP1024Q-A0
2369 MB/s -21%
Average of class Mini PC
  (242 - 5783, n=116, last 2 years)
2290 MB/s -24%
Minisforum AtomMan X7 Ti
Kingston OM8PGP41024Q-A0
2285 MB/s -24%
4K Read
Aoostar GEM12
Crucial P3 Plus CT1000P3PSSD8
89.3 MB/s +33%
Geekom GT1 Mega
Crucial P3 Plus CT2000P3PSSD8
83.6 MB/s +25%
Asus NUC 14 Pro+
Samsung PM9A1a MZVL21T0HDLU
66.9 MB/s
Minisforum AtomMan X7 Ti
Kingston OM8PGP41024Q-A0
63.3 MB/s -5%
Average of class Mini PC
  (18.2 - 104.3, n=116, last 2 years)
59.7 MB/s -11%
Geekom AX8 Pro
Acer N7000
59.1 MB/s -12%
Acemagic F2A
Kingston OM8SEP1024Q-A0
41.8 MB/s -38%
4K Write
Geekom GT1 Mega
Crucial P3 Plus CT2000P3PSSD8
314 MB/s +115%
Minisforum AtomMan X7 Ti
Kingston OM8PGP41024Q-A0
238 MB/s +63%
Aoostar GEM12
Crucial P3 Plus CT1000P3PSSD8
221 MB/s +51%
Acemagic F2A
Kingston OM8SEP1024Q-A0
196.9 MB/s +35%
Geekom AX8 Pro
Acer N7000
181.4 MB/s +24%
Average of class Mini PC
  (30.9 - 366, n=116, last 2 years)
177.3 MB/s +21%
Asus NUC 14 Pro+
Samsung PM9A1a MZVL21T0HDLU
146.2 MB/s
4K-64 Read
Aoostar GEM12
Crucial P3 Plus CT1000P3PSSD8
3220 MB/s +302%
Geekom GT1 Mega
Crucial P3 Plus CT2000P3PSSD8
2336 MB/s +192%
Geekom AX8 Pro
Acer N7000
1244 MB/s +55%
Acemagic F2A
Kingston OM8SEP1024Q-A0
1218 MB/s +52%
Average of class Mini PC
  (23.4 - 3220, n=116, last 2 years)
1192 MB/s +49%
Minisforum AtomMan X7 Ti
Kingston OM8PGP41024Q-A0
1041 MB/s +30%
Asus NUC 14 Pro+
Samsung PM9A1a MZVL21T0HDLU
801 MB/s
4K-64 Write
Aoostar GEM12
Crucial P3 Plus CT1000P3PSSD8
3731 MB/s +26%
Geekom GT1 Mega
Crucial P3 Plus CT2000P3PSSD8
3279 MB/s +11%
Asus NUC 14 Pro+
Samsung PM9A1a MZVL21T0HDLU
2955 MB/s
Geekom AX8 Pro
Acer N7000
2431 MB/s -18%
Minisforum AtomMan X7 Ti
Kingston OM8PGP41024Q-A0
2340 MB/s -21%
Acemagic F2A
Kingston OM8SEP1024Q-A0
1649 MB/s -44%
Average of class Mini PC
  (32.8 - 3731, n=116, last 2 years)
1497 MB/s -49%
Access Time Read
Average of class Mini PC
  (0.022 - 0.489, n=116, last 2 years)
0.09784 ms * -122%
Geekom AX8 Pro
Acer N7000
0.079 ms * -80%
Aoostar GEM12
Crucial P3 Plus CT1000P3PSSD8
0.076 ms * -73%
Minisforum AtomMan X7 Ti
Kingston OM8PGP41024Q-A0
0.067 ms * -52%
Acemagic F2A
Kingston OM8SEP1024Q-A0
0.046 ms * -5%
Asus NUC 14 Pro+
Samsung PM9A1a MZVL21T0HDLU
0.044 ms *
Geekom GT1 Mega
Crucial P3 Plus CT2000P3PSSD8
0.027 ms * +39%
Access Time Write
Acemagic F2A
Kingston OM8SEP1024Q-A0
0.126 ms * -367%
Average of class Mini PC
  (0.014 - 0.765, n=116, last 2 years)
0.1128 ms * -318%
Geekom AX8 Pro
Acer N7000
0.064 ms * -137%
Asus NUC 14 Pro+
Samsung PM9A1a MZVL21T0HDLU
0.027 ms *
Minisforum AtomMan X7 Ti
Kingston OM8PGP41024Q-A0
0.02 ms * +26%
Aoostar GEM12
Crucial P3 Plus CT1000P3PSSD8
0.017 ms * +37%
Geekom GT1 Mega
Crucial P3 Plus CT2000P3PSSD8
0.014 ms * +48%

* ... im mniej tym lepiej

Reading continuous performance:/Disk Throttling: DiskSpd Read Loop, Queue Depth 8

035571010651420177521302485284031953550390542604615497053255680603563906745Tooltip
Asus NUC 14 Pro+ Samsung PM9A1a MZVL21T0HDLU; diskspd 2.0.17 f: Ø6962 (5660.63-7000.13)
Aoostar GEM12 Crucial P3 Plus CT1000P3PSSD8; diskspd 2.0.17 f: Ø5121 (4152.57-5218.34)
Geekom GT1 Mega Crucial P3 Plus CT2000P3PSSD8 ; diskspd 2.0.17 f: Ø5055 (4738.1-5067.7)
Geekom AX8 Pro Acer N7000; diskspd 2.0.17 f: Ø6996 (5972.7-7027.76)
Minisforum AtomMan X7 Ti Kingston OM8PGP41024Q-A0; diskspd 2.0.17 f: Ø4683 (3872.18-4767.25)
Acemagic F2A Kingston OM8SEP1024Q-A0; diskspd 2.0.17 f: Ø1320 (771.89-3141.95)

Karta graficzna

Procesor graficzny iGPU w Asus NUC 14 Pro+ bazuje na architekturze Intel Arc, obecnie określanej jako Intel Arc 8-Coreoferując znacznie więcej mocy niż jego poprzednik, Intel Iris Xe G7 z 96 jednostkami EU. Intel Arc 8-Core iGPU jest znacznie bardziej konkurencyjny i jest w stanie konkurować z AMD Radeon 780M. Wciąż jednak nie osiąga poziomu wydajności Geekom GT1 Mega. W zadaniach takich jak uruchomienie Affinity Photo 2, iGPU Intela zapewnia wyjątkową wydajność, przewyższając rozwiązania iGPU AMD. Ważne jest, aby złagodzić oczekiwania, ponieważ jego wydajność pozostaje w tyle za GPU Nvidia GeForce RTX 4050 w porównaniu.

Aby uzyskać bardziej szczegółowe porównania i testy porównawcze, proszę zapoznać się z naszą Tabela porównawcza GPU.

3DMark Performance Rating - Percent
Average NVIDIA GeForce RTX 4050 Laptop GPU
 
100 pt
Geekom GT1 Mega
Intel Arc 8-Core iGPU, Intel Core Ultra 9 185H
44.7 pt
Asus NUC 14 Pro+
Intel Arc 8-Core iGPU, Intel Core Ultra 9 185H
43.5 pt
Geekom AX8 Pro
AMD Radeon 780M, AMD Ryzen 9 8945H
40.5 pt
Aoostar GEM12
AMD Radeon 780M, AMD Ryzen 7 8845HS
40.4 pt
Acemagic F2A
Intel Arc 8-Core iGPU, Intel Core Ultra 7 155H
40 pt
Minisforum AtomMan X7 Ti
Intel Arc 8-Core iGPU, Intel Core Ultra 9 185H
39.3 pt
3DMark 11 - 1280x720 Performance GPU
Average NVIDIA GeForce RTX 4050 Laptop GPU
  (13339 - 32642, n=39)
28592 Points +117%
Aoostar GEM12
AMD Radeon 780M, AMD Ryzen 7 8845HS
13410 Points +2%
Geekom GT1 Mega
Intel Arc 8-Core iGPU, Intel Core Ultra 9 185H
13309 Points +1%
Geekom AX8 Pro
AMD Radeon 780M, AMD Ryzen 9 8945H
13281 Points +1%
Asus NUC 14 Pro+
Intel Arc 8-Core iGPU, Intel Core Ultra 9 185H
13163 Points
Acemagic F2A
Intel Arc 8-Core iGPU, Intel Core Ultra 7 155H
12085 Points -8%
Minisforum AtomMan X7 Ti
Intel Arc 8-Core iGPU, Intel Core Ultra 9 185H
11691 Points -11%
3DMark
2560x1440 Time Spy Graphics
Average NVIDIA GeForce RTX 4050 Laptop GPU
  (5107 - 9040, n=37)
7800 Points +124%
Geekom GT1 Mega
Intel Arc 8-Core iGPU, Intel Core Ultra 9 185H
3610 Points +4%
Asus NUC 14 Pro+
Intel Arc 8-Core iGPU, Intel Core Ultra 9 185H
3476 Points
Acemagic F2A
Intel Arc 8-Core iGPU, Intel Core Ultra 7 155H
3205 Points -8%
Minisforum AtomMan X7 Ti
Intel Arc 8-Core iGPU, Intel Core Ultra 9 185H
3193 Points -8%
Geekom AX8 Pro
AMD Radeon 780M, AMD Ryzen 9 8945H
2852 Points -18%
Aoostar GEM12
AMD Radeon 780M, AMD Ryzen 7 8845HS
2846 Points -18%
1920x1080 Fire Strike Graphics
Average NVIDIA GeForce RTX 4050 Laptop GPU
  (13591 - 24007, n=37)
21120 Points +152%
Geekom GT1 Mega
Intel Arc 8-Core iGPU, Intel Core Ultra 9 185H
8726 Points +4%
Asus NUC 14 Pro+
Intel Arc 8-Core iGPU, Intel Core Ultra 9 185H
8396 Points
Geekom AX8 Pro
AMD Radeon 780M, AMD Ryzen 9 8945H
8117 Points -3%
Aoostar GEM12
AMD Radeon 780M, AMD Ryzen 7 8845HS
8007 Points -5%
Acemagic F2A
Intel Arc 8-Core iGPU, Intel Core Ultra 7 155H
7710 Points -8%
Minisforum AtomMan X7 Ti
Intel Arc 8-Core iGPU, Intel Core Ultra 9 185H
7599 Points -9%
Unigine Heaven 4.0
Extreme Preset OpenGL
Average NVIDIA GeForce RTX 4050 Laptop GPU
  ()
118.1 fps +235%
Geekom GT1 Mega
Intel Arc 8-Core iGPU, Intel Core Ultra 9 185H
36.4 fps +3%
Asus NUC 14 Pro+
Intel Arc 8-Core iGPU, Intel Core Ultra 9 185H
35.3 fps
Aoostar GEM12
AMD Radeon 780M, AMD Ryzen 7 8845HS
34.6 fps -2%
Acemagic F2A
Intel Arc 8-Core iGPU, Intel Core Ultra 7 155H
31.6 fps -10%
Geekom AX8 Pro
AMD Radeon 780M, AMD Ryzen 9 8945H
30 fps -15%
Minisforum AtomMan X7 Ti
Intel Arc 8-Core iGPU, Intel Core Ultra 9 185H
29.7 fps -16%
Extreme Preset DX11
Average NVIDIA GeForce RTX 4050 Laptop GPU
  ()
114.6 fps +216%
Geekom GT1 Mega
Intel Arc 8-Core iGPU, Intel Core Ultra 9 185H
37.5 fps +3%
Geekom AX8 Pro
AMD Radeon 780M, AMD Ryzen 9 8945H
36.4 fps 0%
Aoostar GEM12
AMD Radeon 780M, AMD Ryzen 7 8845HS
36.3 fps 0%
Asus NUC 14 Pro+
Intel Arc 8-Core iGPU, Intel Core Ultra 9 185H
36.3 fps
Minisforum AtomMan X7 Ti
Intel Arc 8-Core iGPU, Intel Core Ultra 9 185H
33.2 fps -9%
Acemagic F2A
Intel Arc 8-Core iGPU, Intel Core Ultra 7 155H
32.7 fps -10%
Unigine Valley 1.0
1920x1080 Extreme HD DirectX AA:x8
Aoostar GEM12
AMD Radeon 780M, AMD Ryzen 7 8845HS
24.5 fps +26%
Geekom AX8 Pro
AMD Radeon 780M, AMD Ryzen 9 8945H
23.1 fps +18%
Geekom GT1 Mega
Intel Arc 8-Core iGPU, Intel Core Ultra 9 185H
20.1 fps +3%
Asus NUC 14 Pro+
Intel Arc 8-Core iGPU, Intel Core Ultra 9 185H
19.5 fps
Minisforum AtomMan X7 Ti
Intel Arc 8-Core iGPU, Intel Core Ultra 9 185H
18.5 fps -5%
Acemagic F2A
Intel Arc 8-Core iGPU, Intel Core Ultra 7 155H
17.1 fps -12%
1920x1080 Extreme HD Preset OpenGL AA:x8
Minisforum AtomMan X7 Ti
Intel Arc 8-Core iGPU, Intel Core Ultra 9 185H
32.4 fps +53%
Geekom GT1 Mega
Intel Arc 8-Core iGPU, Intel Core Ultra 9 185H
21.9 fps +3%
Asus NUC 14 Pro+
Intel Arc 8-Core iGPU, Intel Core Ultra 9 185H
21.2 fps
Aoostar GEM12
AMD Radeon 780M, AMD Ryzen 7 8845HS
21 fps -1%
Geekom AX8 Pro
AMD Radeon 780M, AMD Ryzen 9 8945H
20.6 fps -3%
Acemagic F2A
Intel Arc 8-Core iGPU, Intel Core Ultra 7 155H
18.3 fps -14%
Unigine Superposition
1280x720 720p Low
Geekom GT1 Mega
Intel Arc 8-Core iGPU, Intel Core Ultra 9 185H
12451 Points +5%
Geekom AX8 Pro
AMD Radeon 780M, AMD Ryzen 9 8945H
12232 Points +3%
Aoostar GEM12
AMD Radeon 780M, AMD Ryzen 7 8845HS
12174 Points +2%
Asus NUC 14 Pro+
Intel Arc 8-Core iGPU, Intel Core Ultra 9 185H
11902 Points
Acemagic F2A
Intel Arc 8-Core iGPU, Intel Core Ultra 7 155H
10491 Points -12%
Minisforum AtomMan X7 Ti
Intel Arc 8-Core iGPU, Intel Core Ultra 9 185H
10102 Points -15%
1920x1080 1080p High
Geekom GT1 Mega
Intel Arc 8-Core iGPU, Intel Core Ultra 9 185H
3948 Points +3%
Asus NUC 14 Pro+
Intel Arc 8-Core iGPU, Intel Core Ultra 9 185H
3836 Points
Aoostar GEM12
AMD Radeon 780M, AMD Ryzen 7 8845HS
3592 Points -6%
Geekom AX8 Pro
AMD Radeon 780M, AMD Ryzen 9 8945H
3559 Points -7%
Acemagic F2A
Intel Arc 8-Core iGPU, Intel Core Ultra 7 155H
3391 Points -12%
Minisforum AtomMan X7 Ti
Intel Arc 8-Core iGPU, Intel Core Ultra 9 185H
3341 Points -13%
1920x1080 1080p Extreme
Geekom GT1 Mega
Intel Arc 8-Core iGPU, Intel Core Ultra 9 185H
2119 Points 0%
Asus NUC 14 Pro+
Intel Arc 8-Core iGPU, Intel Core Ultra 9 185H
2114 Points
Acemagic F2A
Intel Arc 8-Core iGPU, Intel Core Ultra 7 155H
1920 Points -9%
Minisforum AtomMan X7 Ti
Intel Arc 8-Core iGPU, Intel Core Ultra 9 185H
1812 Points -14%
Aoostar GEM12
AMD Radeon 780M, AMD Ryzen 7 8845HS
1737 Points -18%
Geekom AX8 Pro
AMD Radeon 780M, AMD Ryzen 9 8945H
1649 Points -22%
ComputeMark v2.1
1024x600 Normal, Score
Average NVIDIA GeForce RTX 4050 Laptop GPU
  ()
16302 Points +115%
Aoostar GEM12
AMD Radeon 780M, AMD Ryzen 7 8845HS
9494 Points +25%
Geekom AX8 Pro
AMD Radeon 780M, AMD Ryzen 9 8945H
8595 Points +13%
Geekom GT1 Mega
Intel Arc 8-Core iGPU, Intel Core Ultra 9 185H
7963 Points +5%
Asus NUC 14 Pro+
Intel Arc 8-Core iGPU, Intel Core Ultra 9 185H
7594 Points
Acemagic F2A
Intel Arc 8-Core iGPU, Intel Core Ultra 7 155H
7480 Points -2%
Minisforum AtomMan X7 Ti
Intel Arc 8-Core iGPU, Intel Core Ultra 9 185H
6270 Points -17%
1024x600 Normal, Fluid 3DTex
Average NVIDIA GeForce RTX 4050 Laptop GPU
  ()
1319 Points +182%
Geekom GT1 Mega
Intel Arc 8-Core iGPU, Intel Core Ultra 9 185H
492 Points +5%
Geekom AX8 Pro
AMD Radeon 780M, AMD Ryzen 9 8945H
488 Points +4%
Aoostar GEM12
AMD Radeon 780M, AMD Ryzen 7 8845HS
483 Points +3%
Minisforum AtomMan X7 Ti
Intel Arc 8-Core iGPU, Intel Core Ultra 9 185H
469 Points 0%
Asus NUC 14 Pro+
Intel Arc 8-Core iGPU, Intel Core Ultra 9 185H
468 Points
Acemagic F2A
Intel Arc 8-Core iGPU, Intel Core Ultra 7 155H
427 Points -9%
1024x600 Normal, Fluid 2DTexArr
Average NVIDIA GeForce RTX 4050 Laptop GPU
  ()
1284 Points +177%
Geekom GT1 Mega
Intel Arc 8-Core iGPU, Intel Core Ultra 9 185H
487 Points +5%
Aoostar GEM12
AMD Radeon 780M, AMD Ryzen 7 8845HS
481 Points +4%
Asus NUC 14 Pro+
Intel Arc 8-Core iGPU, Intel Core Ultra 9 185H
464 Points
Minisforum AtomMan X7 Ti
Intel Arc 8-Core iGPU, Intel Core Ultra 9 185H
462 Points 0%
Geekom AX8 Pro
AMD Radeon 780M, AMD Ryzen 9 8945H
427 Points -8%
Acemagic F2A
Intel Arc 8-Core iGPU, Intel Core Ultra 7 155H
422 Points -9%
1024x600 Normal, Mandel Vector
Average NVIDIA GeForce RTX 4050 Laptop GPU
  ()
3456 Points +82%
Aoostar GEM12
AMD Radeon 780M, AMD Ryzen 7 8845HS
2477 Points +30%
Geekom AX8 Pro
AMD Radeon 780M, AMD Ryzen 9 8945H
2362 Points +24%
Geekom GT1 Mega
Intel Arc 8-Core iGPU, Intel Core Ultra 9 185H
2039 Points +7%
Acemagic F2A
Intel Arc 8-Core iGPU, Intel Core Ultra 7 155H
1961 Points +3%
Asus NUC 14 Pro+
Intel Arc 8-Core iGPU, Intel Core Ultra 9 185H
1899 Points
Minisforum AtomMan X7 Ti
Intel Arc 8-Core iGPU, Intel Core Ultra 9 185H
1620 Points -15%
1024x600 Normal, Mandel Scalar
Average NVIDIA GeForce RTX 4050 Laptop GPU
  ()
3578 Points +118%
Aoostar GEM12
AMD Radeon 780M, AMD Ryzen 7 8845HS
2519 Points +53%
Geekom AX8 Pro
AMD Radeon 780M, AMD Ryzen 9 8945H
2449 Points +49%
Geekom GT1 Mega
Intel Arc 8-Core iGPU, Intel Core Ultra 9 185H
1701 Points +4%
Asus NUC 14 Pro+
Intel Arc 8-Core iGPU, Intel Core Ultra 9 185H
1643 Points
Acemagic F2A
Intel Arc 8-Core iGPU, Intel Core Ultra 7 155H
1594 Points -3%
Minisforum AtomMan X7 Ti
Intel Arc 8-Core iGPU, Intel Core Ultra 9 185H
1274 Points -22%
1024x600 Normal, QJuliaRayTrace
Average NVIDIA GeForce RTX 4050 Laptop GPU
  ()
6665 Points +114%
Aoostar GEM12
AMD Radeon 780M, AMD Ryzen 7 8845HS
3535 Points +13%
Geekom GT1 Mega
Intel Arc 8-Core iGPU, Intel Core Ultra 9 185H
3244 Points +4%
Asus NUC 14 Pro+
Intel Arc 8-Core iGPU, Intel Core Ultra 9 185H
3121 Points
Acemagic F2A
Intel Arc 8-Core iGPU, Intel Core Ultra 7 155H
3076 Points -1%
Geekom AX8 Pro
AMD Radeon 780M, AMD Ryzen 9 8945H
2868 Points -8%
Minisforum AtomMan X7 Ti
Intel Arc 8-Core iGPU, Intel Core Ultra 9 185H
2444 Points -22%
LuxMark v2.0 64Bit
Room GPUs-only
Average NVIDIA GeForce RTX 4050 Laptop GPU
  ()
2967 Samples/s +297%
Geekom AX8 Pro
AMD Radeon 780M, AMD Ryzen 9 8945H
1068 Samples/s +43%
Aoostar GEM12
AMD Radeon 780M, AMD Ryzen 7 8845HS
801 Samples/s +7%
Asus NUC 14 Pro+
Intel Arc 8-Core iGPU, Intel Core Ultra 9 185H
747 Samples/s
Geekom GT1 Mega
Intel Arc 8-Core iGPU, Intel Core Ultra 9 185H
656 Samples/s -12%
Minisforum AtomMan X7 Ti
Intel Arc 8-Core iGPU, Intel Core Ultra 9 185H
640 Samples/s -14%
Acemagic F2A
Intel Arc 8-Core iGPU, Intel Core Ultra 7 155H
549 Samples/s -27%
Sala GPUs-only
Average NVIDIA GeForce RTX 4050 Laptop GPU
  ()
8036 Samples/s +175%
Asus NUC 14 Pro+
Intel Arc 8-Core iGPU, Intel Core Ultra 9 185H
2927 Samples/s
Geekom GT1 Mega
Intel Arc 8-Core iGPU, Intel Core Ultra 9 185H
2888 Samples/s -1%
Minisforum AtomMan X7 Ti
Intel Arc 8-Core iGPU, Intel Core Ultra 9 185H
2732 Samples/s -7%
Acemagic F2A
Intel Arc 8-Core iGPU, Intel Core Ultra 7 155H
2319 Samples/s -21%
Geekom AX8 Pro
AMD Radeon 780M, AMD Ryzen 9 8945H
2218 Samples/s -24%
Aoostar GEM12
AMD Radeon 780M, AMD Ryzen 7 8845HS
1496 Samples/s -49%
Affinity Photo 2 - Combined (Single / Multi GPU)
Geekom GT1 Mega
Intel Arc 8-Core iGPU, Intel Core Ultra 9 185H
6468 Points +6%
Asus NUC 14 Pro+
Intel Arc 8-Core iGPU, Intel Core Ultra 9 185H
6081 Points
Minisforum AtomMan X7 Ti
Intel Arc 8-Core iGPU, Intel Core Ultra 9 185H
5308 Points -13%
Acemagic F2A
Intel Arc 8-Core iGPU, Intel Core Ultra 7 155H
4928 Points -19%
Geekom AX8 Pro
AMD Radeon 780M, AMD Ryzen 9 8945H
1831 Points -70%
Aoostar GEM12
AMD Radeon 780M, AMD Ryzen 7 8845HS
1709 Points -72%
Asus NUC 14 Pro+, Intel Arc 8-Core iGPU
Ultra 9 185H
Aoostar GEM12, AMD Radeon 780M
R7 8845HS
Geekom GT1 Mega, Intel Arc 8-Core iGPU
Ultra 9 185H
Geekom AX8 Pro, AMD Radeon 780M
R9 8945H
Minisforum AtomMan X7 Ti, Intel Arc 8-Core iGPU
Ultra 9 185H
Acemagic F2A, Intel Arc 8-Core iGPU
Ultra 7 155H
Average of class Mini PC
 
SPECviewperf 2020
244%
4%
237%
-0%
-9%
139%
3840x2160 Medical (medical-03)
6.99
11.2
60%
7.07
1%
12.8
83%
4.23
-39%
5.05
-28%
3840x2160 Energy (energy-03)
4.94
19.9
303%
5
1%
13.3
169%
6.03
22%
4.61
-7%
3840x2160 Creo (creo-03)
18.9
33.4
77%
19.8
5%
35.3
87%
18.5
-2%
17.9
-5%
3840x2160 CATIA (catia-06)
11.2
23.2
107%
11.7
4%
25.1
124%
11.1
-1%
10
-11%
3840x2160 3ds Max (3dsmax-07)
14.8
20.4
38%
15.5
5%
21.1
43%
14.9
1%
12.9
-13%
3840x2160 Siemens NX (snx-04)
5.37
64.1
1094%
5.68
6%
65.7
1123%
6.24
16%
5.7
6%
3840x2160 Maya (maya-06)
37.2
47.7
28%
38.8
4%
49.6
33%
37.7
1%
35.4
-5%
3DMark 05 Standard
50932 pkt.
3DMark 06 Standard Score
36407 pkt.
3DMark Vantage P Result
42630 pkt.
3DMark 11 Performance
13441 pkt.
3DMark Ice Storm Standard Score
148268 pkt.
3DMark Cloud Gate Standard Score
36112 pkt.
3DMark Fire Strike Score
7757 pkt.
3DMark Fire Strike Extreme Score
4006 pkt.
3DMark Time Spy Score
3881 pkt.
3DMark Steel Nomad Score
714 pkt.
3DMark Steel Nomad Light Score
3026 pkt.
Pomoc

Wydajność w grach

Wydajność Asus NUC 14 Pro+ w grach w porównaniu do urządzeń z dedykowanymi kartami graficznymi. Niemniej jednak granie jest nadal możliwe, jeśli są Państwo skłonni obniżyć ustawienia graficzne. Nawet przy obniżonych detalach, ten mini PC jest w stanie uruchomić kilka gier. W porównaniu do konkurentów Geekom GT1 Mega przewyższa naszą próbkę testową, ale zastosowanie karty graficznej AMD Radeon 780M zwiększa wydajność. Aby osiągnąć znaczący wzrost wydajności w grach, najbardziej efektywnym rozwiązaniem byłaby zewnętrzna karta graficzna.

Aby uzyskać szczegółowe porównanie wydajności iGPU dla różnych kart graficznych, proszę zapoznać się z naszą Lista gier GPU.

GTA V
1024x768 Lowest Settings possible
Average NVIDIA GeForce RTX 4050 Laptop GPU
  (163.6 - 186.7, n=14)
181.9 fps +12%
Geekom AX8 Pro
Radeon 780M, R9 8945H, Acer N7000
169.4 (3.69min, 125P1) fps +4%
Geekom GT1 Mega
Arc 8-Core, Ultra 9 185H, Crucial P3 Plus CT2000P3PSSD8
165.2 (3.77min, 100P1) fps +1%
Aoostar GEM12
Radeon 780M, R7 8845HS, Crucial P3 Plus CT1000P3PSSD8
165.1 (4.83min, 125P1) fps +1%
Minisforum AtomMan X7 Ti
Arc 8-Core, Ultra 9 185H, Kingston OM8PGP41024Q-A0
163.6 (4.63min, 111.1P1) fps 0%
Asus NUC 14 Pro+
Arc 8-Core, Ultra 9 185H, Samsung PM9A1a MZVL21T0HDLU
162.9 (3.78min, 111.1P1) fps
Acemagic F2A
Arc 8-Core, Ultra 7 155H, Kingston OM8SEP1024Q-A0
161 (4.76min, 100P1) fps -1%
1920x1080 High/On (Advanced Graphics Off) AA:2xMSAA + FX AF:8x
Average NVIDIA GeForce RTX 4050 Laptop GPU
  (106 - 177.3, n=27)
157.5 fps +288%
Geekom AX8 Pro
Radeon 780M, R9 8945H, Acer N7000
65.9 (2.44min, 41.7P1) fps +62%
Aoostar GEM12
Radeon 780M, R7 8845HS, Crucial P3 Plus CT1000P3PSSD8
65.3 (4.57min, 45.5P1) fps +61%
Geekom GT1 Mega
Arc 8-Core, Ultra 9 185H, Crucial P3 Plus CT2000P3PSSD8
43.5 (3.49min, 32.3P1) fps +7%
Minisforum AtomMan X7 Ti
Arc 8-Core, Ultra 9 185H, Kingston OM8PGP41024Q-A0
41.2 (3.12min, 30.3P1) fps +1%
Asus NUC 14 Pro+
Arc 8-Core, Ultra 9 185H, Samsung PM9A1a MZVL21T0HDLU
40.6 (3.3min, 30.3P1) fps
Acemagic F2A
Arc 8-Core, Ultra 7 155H, Kingston OM8SEP1024Q-A0
31.3 (2.94min, 22.7P1) fps -23%
Dota 2 Reborn
1280x720 min (0/3) fastest
Average NVIDIA GeForce RTX 4050 Laptop GPU
  (113.7 - 196.3, n=35)
164.3 fps +57%
Geekom AX8 Pro
Radeon 780M, R9 8945H, Acer N7000
157.5 (136min) fps +50%
Aoostar GEM12
Radeon 780M, R7 8845HS, Crucial P3 Plus CT1000P3PSSD8
152.7 (134.2min) fps +46%
Geekom GT1 Mega
Arc 8-Core, Ultra 9 185H, Crucial P3 Plus CT2000P3PSSD8
110.5 (63min) fps +6%
Minisforum AtomMan X7 Ti
Arc 8-Core, Ultra 9 185H, Kingston OM8PGP41024Q-A0
106.5 (61min) fps +2%
Asus NUC 14 Pro+
Arc 8-Core, Ultra 9 185H, Samsung PM9A1a MZVL21T0HDLU
104.7 (61.7min) fps
Acemagic F2A
Arc 8-Core, Ultra 7 155H, Kingston OM8SEP1024Q-A0
103.2 (59.8min) fps -1%
1920x1080 high (2/3)
Average NVIDIA GeForce RTX 4050 Laptop GPU
  (79.2 - 191.8, n=36)
141.6 fps +158%
Geekom AX8 Pro
Radeon 780M, R9 8945H, Acer N7000
88 (69.2min) fps +61%
Geekom GT1 Mega
Arc 8-Core, Ultra 9 185H, Crucial P3 Plus CT2000P3PSSD8
87.8 (28.3min) fps +60%
Aoostar GEM12
Radeon 780M, R7 8845HS, Crucial P3 Plus CT1000P3PSSD8
86.6 (72.2min) fps +58%
Minisforum AtomMan X7 Ti
Arc 8-Core, Ultra 9 185H, Kingston OM8PGP41024Q-A0
79 (48.2min) fps +44%
Acemagic F2A
Arc 8-Core, Ultra 7 155H, Kingston OM8SEP1024Q-A0
77.3 (52.5min) fps +41%
Asus NUC 14 Pro+
Arc 8-Core, Ultra 9 185H, Samsung PM9A1a MZVL21T0HDLU
54.8 (35.3min) fps
Cyberpunk 2077 2.1 Phantom Liberty
1920x1080 Low Preset (FSR off)
Average NVIDIA GeForce RTX 4050 Laptop GPU
  (67.2 - 103.1, n=6)
85.8 fps +147%
Aoostar GEM12
Radeon 780M, R7 8845HS, Crucial P3 Plus CT1000P3PSSD8
42.4 (35.7min) fps +22%
Geekom AX8 Pro
Radeon 780M, R9 8945H, Acer N7000
41.3 (34.5min) fps +19%
Geekom GT1 Mega
Arc 8-Core, Ultra 9 185H, Crucial P3 Plus CT2000P3PSSD8
38 (33.3min) fps +10%
Asus NUC 14 Pro+
Arc 8-Core, Ultra 9 185H, Samsung PM9A1a MZVL21T0HDLU
34.7 (30.4min) fps
Minisforum AtomMan X7 Ti
Arc 8-Core, Ultra 9 185H, Kingston OM8PGP41024Q-A0
34.3 (29.1min) fps -1%
Acemagic F2A
Arc 8-Core, Ultra 7 155H, Kingston OM8SEP1024Q-A0
29.5 (24.1min) fps -15%
1920x1080 High Preset (FSR off)
Average NVIDIA GeForce RTX 4050 Laptop GPU
  (42.4 - 75, n=7)
59 fps +145%
Aoostar GEM12
Radeon 780M, R7 8845HS, Crucial P3 Plus CT1000P3PSSD8
26.3 (22.2min) fps +9%
Geekom GT1 Mega
Arc 8-Core, Ultra 9 185H, Crucial P3 Plus CT2000P3PSSD8
26 (22.6min) fps +8%
Geekom AX8 Pro
Radeon 780M, R9 8945H, Acer N7000
25.8 (21.7min) fps +7%
Asus NUC 14 Pro+
Arc 8-Core, Ultra 9 185H, Samsung PM9A1a MZVL21T0HDLU
24.1 (21.1min) fps
Minisforum AtomMan X7 Ti
Arc 8-Core, Ultra 9 185H, Kingston OM8PGP41024Q-A0
24 (20.6min) fps 0%
Acemagic F2A
Arc 8-Core, Ultra 7 155H, Kingston OM8SEP1024Q-A0
20.4 (13.8min) fps -15%
Baldur's Gate 3
1280x720 Low Preset
Average NVIDIA GeForce RTX 4050 Laptop GPU
  ()
148.9 fps +164%
Geekom AX8 Pro
Radeon 780M, R9 8945H, Acer N7000
60.8 (21.6min, 28.1P0.1, 35.6P1) fps +8%
Aoostar GEM12
Radeon 780M, R7 8845HS, Crucial P3 Plus CT1000P3PSSD8
60.3 (21.3min, 36P0.1, 46.1P1) fps +7%
Geekom GT1 Mega
Arc 8-Core, Ultra 9 185H, Crucial P3 Plus CT2000P3PSSD8
57.6 (31.7min, 33.6P0.1, 37.9P1) fps +2%
Asus NUC 14 Pro+
Arc 8-Core, Ultra 9 185H, Samsung PM9A1a MZVL21T0HDLU
56.4 (29min, 30.5P0.1, 37.9P1) fps
1920x1080 High Preset
Average NVIDIA GeForce RTX 4050 Laptop GPU
  (49.8 - 83.5, n=8)
67.7 fps +169%
Geekom GT1 Mega
Arc 8-Core, Ultra 9 185H, Crucial P3 Plus CT2000P3PSSD8
25.4 (13.9min, 14.3P0.1, 16.3P1) fps +1%
Asus NUC 14 Pro+
Arc 8-Core, Ultra 9 185H, Samsung PM9A1a MZVL21T0HDLU
25.2 (14.5min, 14.6P0.1, 16.2P1) fps
Aoostar GEM12
Radeon 780M, R7 8845HS, Crucial P3 Plus CT1000P3PSSD8
24.7 (16.6min, 17.1P0.1, 19.4P1) fps -2%
Geekom AX8 Pro
Radeon 780M, R9 8945H, Acer N7000
24.5 (17.7min, 17.7P0.1, 19.8P1) fps -3%
F1 24
1920x1080 Low Preset AA:T AF:16x
Geekom GT1 Mega
Arc 8-Core, Ultra 9 185H, Crucial P3 Plus CT2000P3PSSD8
84.3 (70min, 66P1) fps +17%
Geekom AX8 Pro
Radeon 780M, R9 8945H, Acer N7000
83.4 (28min, 33P1) fps +16%
Asus NUC 14 Pro+
Arc 8-Core, Ultra 9 185H, Samsung PM9A1a MZVL21T0HDLU
71.8 (59min, 46P1) fps
1920x1080 High Preset AA:T AF:16x
Average NVIDIA GeForce RTX 4050 Laptop GPU
  ()
146 fps +202%
Geekom GT1 Mega
Arc 8-Core, Ultra 9 185H, Crucial P3 Plus CT2000P3PSSD8
54.8 (43min, 45P1) fps +13%
Geekom AX8 Pro
Radeon 780M, R9 8945H, Acer N7000
51.3 (23min, 15P1) fps +6%
Asus NUC 14 Pro+
Arc 8-Core, Ultra 9 185H, Samsung PM9A1a MZVL21T0HDLU
48.4 (40min, 36P1) fps

FPS chart - 30 min Cyberpunk 2077 1920 x 1080 Ultra Preset (FSR off)

05101520Tooltip
Asus NUC 14 Pro+ Ultra 9 185H, Arc 8-Core: Ø20.3 (18.2-21.9)
Aoostar GEM12 R7 8845HS, Radeon 780M: Ø21.7 (20.1-23.3)
Geekom GT1 Mega Ultra 9 185H, Arc 8-Core: Ø22.1 (18.6-24)
Geekom AX8 Pro R9 8945H, Radeon 780M: Ø19.2 (17.9-20.3)
lowmed.highultra
GTA V (2015) 162.9 154.1 40.6 15.8
Dota 2 Reborn (2015) 104.7 78 54.8 76
Final Fantasy XV Benchmark (2018) 75.3 40.2 28.6
X-Plane 11.11 (2018) 65.5 49.8 42.2
Baldur's Gate 3 (2023) 37.9 29.7 25.2 24.4
Cyberpunk 2077 2.1 Phantom Liberty (2023) 34.7 28.9 24.1 22
F1 24 (2024) 71.8 64.7 48.4

Test wydajności Asus NUC 14 Pro+ z kartą graficzną Nvidia GeForce RTX 4090

Asus NUC 14 Pro+ i Nvidia GeForce RTX 4090
GPU-Z
GPU-Z

Wyposażony w dwa porty Thunderbolt, Asus NUC 14 Pro+ obsługuje połączenia z zewnętrzną kartą graficzną. Należy jednak pamiętać o ograniczeniu przepustowości, ponieważ zewnętrzny procesor graficzny może działać tylko z prędkością PCIe 3.0 x4 za pośrednictwem połączenia USB4. Przetestowaliśmy wydajność z kartą Nvidia GeForce RTX 4090 aby sprawdzić, jakiego wzrostu wydajności można oczekiwać od najszybszej obecnie dostępnej konsumenckiej karty graficznej.

Podczas testu, wydajność 3D może odnotować znaczną poprawę w niektórych scenariuszach. Zarówno syntetyczne, jak i gamingowe benchmarki pokazują potencjalny wzrost. Zauważalny jest spadek wydajności w porównaniu do korzystania z karty graficznej w konwencjonalnym komputerze stacjonarnym. Dla porównania, porównaliśmy te wyniki z wynikami AMD Ryzen 5 9600X w połączeniu z kartą graficzną Nvidia GeForce RTX 4090. Potencjalnym rozwiązaniem minimalizującym spadek wydajności może być połączenie OCuLink, choć pozostaje ono rzadką opcją. The Minisforum MS-A1 pokazuje, co można osiągnąć dzięki tej konfiguracji.

Performance Rating - Percent
AMD Ryzen 5 9600X
AMD Ryzen 5 9600X
100 pt
Minisforum MS-A1 (Nvidia GeForce RTX 4090 @OCuLink)
AMD Ryzen 7 8700G
89.4 pt
Geekom GT1 Mega (Nvidia GeForce RTX 4090 @USB4)
Intel Core Ultra 9 185H
79.6 pt
Asus NUC 14 Pro+ (Nvidia GeForce RTX 4090 @USB4)
Intel Core Ultra 9 185H
78.2 pt
Khadas Mind 2 (Nvidia GeForce RTX 4090 @USB4)
Intel Core Ultra 7 155H
75.9 pt
3DMark 11 - 1280x720 Performance GPU
AMD Ryzen 5 9600X
AMD Ryzen 5 9600X
104516 Points +694%
Minisforum MS-A1 (Nvidia GeForce RTX 4090 @OCuLink)
AMD Ryzen 7 8700G
98454 Points +648%
Geekom GT1 Mega (Nvidia GeForce RTX 4090 @USB4)
Intel Core Ultra 9 185H
64648 Points +391%
Khadas Mind 2 (Nvidia GeForce RTX 4090 @USB4)
Intel Core Ultra 7 155H
62498 Points +375%
Asus NUC 14 Pro+ (Nvidia GeForce RTX 4090 @USB4)
Intel Core Ultra 9 185H
61826 Points +370%

13163 Points
3DMark
2560x1440 Time Spy Graphics
AMD Ryzen 5 9600X
AMD Ryzen 5 9600X
37161 Points +969%
Minisforum MS-A1 (Nvidia GeForce RTX 4090 @OCuLink)
AMD Ryzen 7 8700G
34984 Points +906%
Geekom GT1 Mega (Nvidia GeForce RTX 4090 @USB4)
Intel Core Ultra 9 185H
28844 Points +730%
Asus NUC 14 Pro+ (Nvidia GeForce RTX 4090 @USB4)
Intel Core Ultra 9 185H
28592 Points +723%
Khadas Mind 2 (Nvidia GeForce RTX 4090 @USB4)
Intel Core Ultra 7 155H
23140 Points +566%

3476 Points
1920x1080 Fire Strike Graphics
AMD Ryzen 5 9600X
AMD Ryzen 5 9600X
78579 Points +836%
Minisforum MS-A1 (Nvidia GeForce RTX 4090 @OCuLink)
AMD Ryzen 7 8700G
76191 Points +807%
Geekom GT1 Mega (Nvidia GeForce RTX 4090 @USB4)
Intel Core Ultra 9 185H
53367 Points +536%
Asus NUC 14 Pro+ (Nvidia GeForce RTX 4090 @USB4)
Intel Core Ultra 9 185H
50990 Points +507%
Khadas Mind 2 (Nvidia GeForce RTX 4090 @USB4)
Intel Core Ultra 7 155H
40417 Points +381%

8396 Points
3840x2160 Fire Strike Ultra Graphics
AMD Ryzen 5 9600X
AMD Ryzen 5 9600X
24915 Points +1148%
Minisforum MS-A1 (Nvidia GeForce RTX 4090 @OCuLink)
AMD Ryzen 7 8700G
23565 Points +1081%
Geekom GT1 Mega (Nvidia GeForce RTX 4090 @USB4)
Intel Core Ultra 9 185H
21506 Points +977%
Asus NUC 14 Pro+ (Nvidia GeForce RTX 4090 @USB4)
Intel Core Ultra 9 185H
21410 Points +973%
Khadas Mind 2 (Nvidia GeForce RTX 4090 @USB4)
Intel Core Ultra 7 155H
17047 Points +754%

1996 Points
Unigine Superposition
1280x720 720p Low
AMD Ryzen 5 9600X
AMD Ryzen 5 9600X
63603 Points +434%
Minisforum MS-A1 (Nvidia GeForce RTX 4090 @OCuLink)
AMD Ryzen 7 8700G
35453 Points +198%
Geekom GT1 Mega (Nvidia GeForce RTX 4090 @USB4)
Intel Core Ultra 9 185H
33318 Points +180%
Asus NUC 14 Pro+ (Nvidia GeForce RTX 4090 @USB4)
Intel Core Ultra 9 185H
30513 Points +156%
Khadas Mind 2 (Nvidia GeForce RTX 4090 @USB4)
Intel Core Ultra 7 155H
28104 Points +136%

11902 Points
1920x1080 1080p High
AMD Ryzen 5 9600X
AMD Ryzen 5 9600X
50230 Points +1209%
Minisforum MS-A1 (Nvidia GeForce RTX 4090 @OCuLink)
AMD Ryzen 7 8700G
32728 Points +753%
Geekom GT1 Mega (Nvidia GeForce RTX 4090 @USB4)
Intel Core Ultra 9 185H
30115 Points +685%
Asus NUC 14 Pro+ (Nvidia GeForce RTX 4090 @USB4)
Intel Core Ultra 9 185H
27938 Points +628%
Khadas Mind 2 (Nvidia GeForce RTX 4090 @USB4)
Intel Core Ultra 7 155H
26890 Points +601%

3836 Points
1920x1080 1080p Extreme
AMD Ryzen 5 9600X
AMD Ryzen 5 9600X
21586 Points +921%
Minisforum MS-A1 (Nvidia GeForce RTX 4090 @OCuLink)
AMD Ryzen 7 8700G
20934 Points +890%
Asus NUC 14 Pro+ (Nvidia GeForce RTX 4090 @USB4)
Intel Core Ultra 9 185H
20260 Points +858%
Geekom GT1 Mega (Nvidia GeForce RTX 4090 @USB4)
Intel Core Ultra 9 185H
19915 Points +842%
Khadas Mind 2 (Nvidia GeForce RTX 4090 @USB4)
Intel Core Ultra 7 155H
19877 Points +840%

2114 Points
3840x2160 4k Optimized
AMD Ryzen 5 9600X
AMD Ryzen 5 9600X
33095 Points
Minisforum MS-A1 (Nvidia GeForce RTX 4090 @OCuLink)
AMD Ryzen 7 8700G
30190 Points
Geekom GT1 Mega (Nvidia GeForce RTX 4090 @USB4)
Intel Core Ultra 9 185H
27686 Points
Asus NUC 14 Pro+ (Nvidia GeForce RTX 4090 @USB4)
Intel Core Ultra 9 185H
27334 Points
Khadas Mind 2 (Nvidia GeForce RTX 4090 @USB4)
Intel Core Ultra 7 155H
25802 Points
7680x4320 8k Optimized
AMD Ryzen 5 9600X
AMD Ryzen 5 9600X
12498 Points
Minisforum MS-A1 (Nvidia GeForce RTX 4090 @OCuLink)
AMD Ryzen 7 8700G
12251 Points
Geekom GT1 Mega (Nvidia GeForce RTX 4090 @USB4)
Intel Core Ultra 9 185H
12132 Points
Khadas Mind 2 (Nvidia GeForce RTX 4090 @USB4)
Intel Core Ultra 7 155H
12050 Points
Asus NUC 14 Pro+ (Nvidia GeForce RTX 4090 @USB4)
Intel Core Ultra 9 185H
12045 Points
Unigine Valley 1.0
1920x1080 Extreme HD DirectX AA:x8
AMD Ryzen 5 9600X
AMD Ryzen 5 9600X
324 fps +1562%
Minisforum MS-A1 (Nvidia GeForce RTX 4090 @OCuLink)
AMD Ryzen 7 8700G
216.1 fps +1008%
Geekom GT1 Mega (Nvidia GeForce RTX 4090 @USB4)
Intel Core Ultra 9 185H
208.7 fps +970%
Asus NUC 14 Pro+ (Nvidia GeForce RTX 4090 @USB4)
Intel Core Ultra 9 185H
196.3 fps +907%
Khadas Mind 2 (Nvidia GeForce RTX 4090 @USB4)
Intel Core Ultra 7 155H
187.1 fps +859%

19.5 fps
1920x1080 Extreme HD Preset OpenGL AA:x8
AMD Ryzen 5 9600X
AMD Ryzen 5 9600X
331.8 fps +1465%
Minisforum MS-A1 (Nvidia GeForce RTX 4090 @OCuLink)
AMD Ryzen 7 8700G
231.7 fps +993%
Asus NUC 14 Pro+ (Nvidia GeForce RTX 4090 @USB4)
Intel Core Ultra 9 185H
224.8 fps +960%
Geekom GT1 Mega (Nvidia GeForce RTX 4090 @USB4)
Intel Core Ultra 9 185H
224.4 fps +958%
Khadas Mind 2 (Nvidia GeForce RTX 4090 @USB4)
Intel Core Ultra 7 155H
200.5 fps +846%

21.2 fps
Unigine Heaven 4.0
Extreme Preset OpenGL
AMD Ryzen 5 9600X
AMD Ryzen 5 9600X
472.4 fps +1238%
Minisforum MS-A1 (Nvidia GeForce RTX 4090 @OCuLink)
AMD Ryzen 7 8700G
441.5 fps +1151%
Geekom GT1 Mega (Nvidia GeForce RTX 4090 @USB4)
Intel Core Ultra 9 185H
386.5 fps +995%
Asus NUC 14 Pro+ (Nvidia GeForce RTX 4090 @USB4)
Intel Core Ultra 9 185H
376.3 fps +966%
Khadas Mind 2 (Nvidia GeForce RTX 4090 @USB4)
Intel Core Ultra 7 155H
372.8 fps +956%

35.3 fps
Extreme Preset DX11
AMD Ryzen 5 9600X
AMD Ryzen 5 9600X
473.9 fps +1206%
Minisforum MS-A1 (Nvidia GeForce RTX 4090 @OCuLink)
AMD Ryzen 7 8700G
422.3 fps +1063%
Khadas Mind 2 (Nvidia GeForce RTX 4090 @USB4)
Intel Core Ultra 7 155H
344.6 fps +849%
Geekom GT1 Mega (Nvidia GeForce RTX 4090 @USB4)
Intel Core Ultra 9 185H
343 fps +845%
Asus NUC 14 Pro+ (Nvidia GeForce RTX 4090 @USB4)
Intel Core Ultra 9 185H
337.2 fps +829%

36.3 fps
ComputeMark v2.1
1024x600 Normal, Score
AMD Ryzen 5 9600X
AMD Ryzen 5 9600X
92222 Points +1114%
Minisforum MS-A1 (Nvidia GeForce RTX 4090 @OCuLink)
AMD Ryzen 7 8700G
90882 Points +1097%
Khadas Mind 2 (Nvidia GeForce RTX 4090 @USB4)
Intel Core Ultra 7 155H
86314 Points +1037%
Geekom GT1 Mega (Nvidia GeForce RTX 4090 @USB4)
Intel Core Ultra 9 185H
83349 Points +998%
Asus NUC 14 Pro+ (Nvidia GeForce RTX 4090 @USB4)
Intel Core Ultra 9 185H
82718 Points +989%

7594 Points
1024x600 Normal, Fluid 3DTex
AMD Ryzen 5 9600X
AMD Ryzen 5 9600X
10756 Points +2198%
Minisforum MS-A1 (Nvidia GeForce RTX 4090 @OCuLink)
AMD Ryzen 7 8700G
10664 Points +2179%
Khadas Mind 2 (Nvidia GeForce RTX 4090 @USB4)
Intel Core Ultra 7 155H
10373 Points +2116%
Geekom GT1 Mega (Nvidia GeForce RTX 4090 @USB4)
Intel Core Ultra 9 185H
9972 Points +2031%
Asus NUC 14 Pro+ (Nvidia GeForce RTX 4090 @USB4)
Intel Core Ultra 9 185H
9947 Points +2025%

468 Points
1024x600 Normal, Fluid 2DTexArr
AMD Ryzen 5 9600X
AMD Ryzen 5 9600X
6948 Points +1397%
Minisforum MS-A1 (Nvidia GeForce RTX 4090 @OCuLink)
AMD Ryzen 7 8700G
6907 Points +1389%
Khadas Mind 2 (Nvidia GeForce RTX 4090 @USB4)
Intel Core Ultra 7 155H
6771 Points +1359%
Geekom GT1 Mega (Nvidia GeForce RTX 4090 @USB4)
Intel Core Ultra 9 185H
6566 Points +1315%
Asus NUC 14 Pro+ (Nvidia GeForce RTX 4090 @USB4)
Intel Core Ultra 9 185H
6478 Points +1296%

464 Points
1024x600 Normal, Mandel Vector
AMD Ryzen 5 9600X
AMD Ryzen 5 9600X
17307 Points +811%
Minisforum MS-A1 (Nvidia GeForce RTX 4090 @OCuLink)
AMD Ryzen 7 8700G
17088 Points +800%
Khadas Mind 2 (Nvidia GeForce RTX 4090 @USB4)
Intel Core Ultra 7 155H
16044 Points +745%
Geekom GT1 Mega (Nvidia GeForce RTX 4090 @USB4)
Intel Core Ultra 9 185H
15583 Points +721%
Asus NUC 14 Pro+ (Nvidia GeForce RTX 4090 @USB4)
Intel Core Ultra 9 185H
15358 Points +709%

1899 Points
1024x600 Normal, Mandel Scalar
AMD Ryzen 5 9600X
AMD Ryzen 5 9600X
22843 Points +1290%
Minisforum MS-A1 (Nvidia GeForce RTX 4090 @OCuLink)
AMD Ryzen 7 8700G
22633 Points +1278%
Khadas Mind 2 (Nvidia GeForce RTX 4090 @USB4)
Intel Core Ultra 7 155H
21302 Points +1197%
Geekom GT1 Mega (Nvidia GeForce RTX 4090 @USB4)
Intel Core Ultra 9 185H
20574 Points +1152%
Asus NUC 14 Pro+ (Nvidia GeForce RTX 4090 @USB4)
Intel Core Ultra 9 185H
20445 Points +1144%

1643 Points
1024x600 Normal, QJuliaRayTrace
AMD Ryzen 5 9600X
AMD Ryzen 5 9600X
34367 Points +1001%
Minisforum MS-A1 (Nvidia GeForce RTX 4090 @OCuLink)
AMD Ryzen 7 8700G
33589 Points +976%
Khadas Mind 2 (Nvidia GeForce RTX 4090 @USB4)
Intel Core Ultra 7 155H
31824 Points +920%
Geekom GT1 Mega (Nvidia GeForce RTX 4090 @USB4)
Intel Core Ultra 9 185H
30654 Points +882%
Asus NUC 14 Pro+ (Nvidia GeForce RTX 4090 @USB4)
Intel Core Ultra 9 185H
30490 Points +877%

3121 Points
Performance Rating - Percent
AMD Ryzen 5 9600X
AMD Ryzen 5 9600X
100 pt
Minisforum MS-A1 (Nvidia GeForce RTX 4090 @OCuLink)
AMD Ryzen 7 8700G
75.5 pt
Geekom GT1 Mega (Nvidia GeForce RTX 4090 @USB4)
Intel Core Ultra 9 185H
42 pt
Asus NUC 14 Pro+ (Nvidia GeForce RTX 4090 @USB4)
Intel Core Ultra 9 185H
38.2 pt
Khadas Mind 2 (Nvidia GeForce RTX 4090 @USB4)
Intel Core Ultra 7 155H
33.7 pt
Cyberpunk 2077 2.1 Phantom Liberty
1280x720 Low Preset (FSR off)
AMD Ryzen 5 9600X
AMD Ryzen 5 9600X
256 (183.7min - 319max) fps +428%
Minisforum MS-A1 (Nvidia GeForce RTX 4090 @OCuLink)
AMD Ryzen 7 8700G
187.3 (143.6min - 225max) fps +286%
Geekom GT1 Mega (Nvidia GeForce RTX 4090 @USB4)
Intel Core Ultra 9 185H
88.9 (67.9min - 123.3max) fps +83%
Khadas Mind 2 (Nvidia GeForce RTX 4090 @USB4)
Intel Core Ultra 7 155H
79.7 (62.5min - 101.2max) fps +64%
Asus NUC 14 Pro+ (Nvidia GeForce RTX 4090 @USB4)
Intel Core Ultra 9 185H
74.1 (55.6min - 105.1max) fps +53%

48.5 (39.4min - 57.8max) fps
1920x1080 Medium Preset (FSR off)
AMD Ryzen 5 9600X
AMD Ryzen 5 9600X
252 (174.7min - 318max) fps +772%
Minisforum MS-A1 (Nvidia GeForce RTX 4090 @OCuLink)
AMD Ryzen 7 8700G
184.9 (141min - 225max) fps +540%
Geekom GT1 Mega (Nvidia GeForce RTX 4090 @USB4)
Intel Core Ultra 9 185H
87.8 (65.1min - 123max) fps +204%
Khadas Mind 2 (Nvidia GeForce RTX 4090 @USB4)
Intel Core Ultra 7 155H
77.5 (58.3min - 109.1max) fps +168%
Asus NUC 14 Pro+ (Nvidia GeForce RTX 4090 @USB4)
Intel Core Ultra 9 185H
71.7 (52.9min - 102.7max) fps +148%

28.9 (25.6min - 33.1max) fps
1920x1080 Ultra Preset (FSR off)
AMD Ryzen 5 9600X
AMD Ryzen 5 9600X
204 (126.1min - 264max) fps +827%
Minisforum MS-A1 (Nvidia GeForce RTX 4090 @OCuLink)
AMD Ryzen 7 8700G
161.8 (107min - 205max) fps +635%
Geekom GT1 Mega (Nvidia GeForce RTX 4090 @USB4)
Intel Core Ultra 9 185H
75 (50.3min - 110.2max) fps +241%
Khadas Mind 2 (Nvidia GeForce RTX 4090 @USB4)
Intel Core Ultra 7 155H
68.8 (46.7min - 98.6max) fps +213%
Asus NUC 14 Pro+ (Nvidia GeForce RTX 4090 @USB4)
Intel Core Ultra 9 185H
61.4 (39.5min - 89max) fps +179%

22 (18.9min - 26max) fps
Baldur's Gate 3
1920x1080 Low Preset
AMD Ryzen 5 9600X
AMD Ryzen 5 9600X
253 (30.2min, 76.7P0.1, 155.7P1 - 431max) fps +568%
Minisforum MS-A1 (Nvidia GeForce RTX 4090 @OCuLink)
AMD Ryzen 7 8700G
200 (109.4min, 129.1P0.1, 154.1P1 - 278max) fps +428%
Geekom GT1 Mega (Nvidia GeForce RTX 4090 @USB4)
Intel Core Ultra 9 185H
189.1 (95.1min, 108.7P0.1, 136.8P1 - 323max) fps +399%
Asus NUC 14 Pro+ (Nvidia GeForce RTX 4090 @USB4)
Intel Core Ultra 9 185H
171.8 (77.1min, 96.4P0.1, 118.1P1 - 312max) fps +353%
Khadas Mind 2 (Nvidia GeForce RTX 4090 @USB4)
Intel Core Ultra 7 155H
142.8 (70.4min, 75.8P0.1, 97.6P1 - 236max) fps +277%

37.9 (22.7min, 23.2P0.1, 26.9P1 - 91.7max) fps
1920x1080 Medium Preset
AMD Ryzen 5 9600X
AMD Ryzen 5 9600X
231 (52.4min, 123P0.1, 150.8P1 - 382max) fps +678%
Minisforum MS-A1 (Nvidia GeForce RTX 4090 @OCuLink)
AMD Ryzen 7 8700G
194.4 (102.5min, 120P0.1, 151.2P1 - 274max) fps +555%
Geekom GT1 Mega (Nvidia GeForce RTX 4090 @USB4)
Intel Core Ultra 9 185H
168.3 (71.8min, 94P0.1, 117.8P1 - 266max) fps +467%
Asus NUC 14 Pro+ (Nvidia GeForce RTX 4090 @USB4)
Intel Core Ultra 9 185H
157.9 (75.9min, 89.1P0.1, 105.9P1 - 265max) fps +432%
Khadas Mind 2 (Nvidia GeForce RTX 4090 @USB4)
Intel Core Ultra 7 155H
114 (35.5min, 44P0.1, 57.3P1 - 219max) fps +284%

29.7 (17.5min, 18.4P0.1, 19.7P1 - 65.1max) fps
1920x1080 Ultra Preset
AMD Ryzen 5 9600X
AMD Ryzen 5 9600X
212 (16.9min, 120.1P0.1, 151.8P1 - 372max) fps +769%
Minisforum MS-A1 (Nvidia GeForce RTX 4090 @OCuLink)
AMD Ryzen 7 8700G
190.9 (107.5min, 129.1P0.1, 148.8P1 - 259max) fps +682%
Geekom GT1 Mega (Nvidia GeForce RTX 4090 @USB4)
Intel Core Ultra 9 185H
151.8 (67.2min, 82P0.1, 101.9P1 - 254max) fps +522%
Asus NUC 14 Pro+ (Nvidia GeForce RTX 4090 @USB4)
Intel Core Ultra 9 185H
146.9 (66.9min, 80.1P0.1, 101.3P1 - 245max) fps +502%
Khadas Mind 2 (Nvidia GeForce RTX 4090 @USB4)
Intel Core Ultra 7 155H
109.2 (29.8min, 38.6P0.1, 55.9P1 - 199max) fps +348%

24.4 (8.14min, 11.8P0.1, 15.7P1 - 98.9max) fps
F1 24
1920x1080 Low Preset AA:T AF:16x
AMD Ryzen 5 9600X
AMD Ryzen 5 9600X
405 (297min, 246P1 - 476max) fps +464%
Minisforum MS-A1 (Nvidia GeForce RTX 4090 @OCuLink)
AMD Ryzen 7 8700G
269 (203min, 181P1 - 313max) fps +275%
Geekom GT1 Mega (Nvidia GeForce RTX 4090 @USB4)
Intel Core Ultra 9 185H
78.1 (43min, 45P1 - 98max) fps +9%
Asus NUC 14 Pro+ (Nvidia GeForce RTX 4090 @USB4)
Intel Core Ultra 9 185H
75.7 (42min, 44P1 - 92max) fps +5%
Khadas Mind 2 (Nvidia GeForce RTX 4090 @USB4)
Intel Core Ultra 7 155H
74.6 (42min, 44P1 - 94max) fps +4%

71.8 (59min, 46P1 - 83max) fps
1920x1080 Medium Preset AA:T AF:16x
AMD Ryzen 5 9600X
AMD Ryzen 5 9600X
421 (328min, 262P1 - 470max) fps +551%
Minisforum MS-A1 (Nvidia GeForce RTX 4090 @OCuLink)
AMD Ryzen 7 8700G
285 (216min, 190P1 - 313max) fps +340%
Geekom GT1 Mega (Nvidia GeForce RTX 4090 @USB4)
Intel Core Ultra 9 185H
74.4 (42min, 44P1 - 86max) fps +15%
Khadas Mind 2 (Nvidia GeForce RTX 4090 @USB4)
Intel Core Ultra 7 155H
72.1 (41min, 43P1 - 85max) fps +11%
Asus NUC 14 Pro+ (Nvidia GeForce RTX 4090 @USB4)
Intel Core Ultra 9 185H
70.5 (41min, 43P1 - 82max) fps +9%

64.7 (52min, 41P1 - 75max) fps
1920x1080 High Preset AA:T AF:16x
AMD Ryzen 5 9600X
AMD Ryzen 5 9600X
401 (305min, 241P1 - 449max) fps +729%
Minisforum MS-A1 (Nvidia GeForce RTX 4090 @OCuLink)
AMD Ryzen 7 8700G
267 (203min, 176P1 - 297max) fps +452%
Geekom GT1 Mega (Nvidia GeForce RTX 4090 @USB4)
Intel Core Ultra 9 185H
61.7 (35min, 37P1 - 75max) fps +27%
Khadas Mind 2 (Nvidia GeForce RTX 4090 @USB4)
Intel Core Ultra 7 155H
60.1 (35min, 36P1 - 74max) fps +24%
Asus NUC 14 Pro+ (Nvidia GeForce RTX 4090 @USB4)
Intel Core Ultra 9 185H
59.7 (35min, 35P1 - 73max) fps +23%

48.4 (40min, 36P1 - 56max) fps
lowmed.highultraQHD4K
Dota 2 Reborn (2015) 167.9 154.7 150.5 140 135
Final Fantasy XV Benchmark (2018) 195.5 184.4 158.2 150.6 118.7
X-Plane 11.11 (2018) 92.4 91.9 77.1 67.5
Baldur's Gate 3 (2023) 171.8 157.9 147.5 146.9 133.8 93.8
Cyberpunk 2077 2.1 Phantom Liberty (2023) 73.8 71.7 65.3 61.4 62.8 52.8
F1 24 (2024) 75.7 70.5 59.7 41.7 40.8 39.8

Emisje - miecz obosieczny

Hałas systemowy

Asus wykorzystuje aktywny system chłodzenia w NUC 14 Pro+, z wentylatorem umieszczonym na spodzie urządzenia. Zaobserwowaliśmy jednak, że rozwiązanie chłodzące szybko osiąga swoje granice podczas testu obciążeniowego Cinebench R15. Emisja hałasu wyraźnie wskazuje, że pojedynczy wentylator musi ciężko pracować, aby rozprowadzić wystarczającą ilość świeżego powietrza przez obudowę. Przy średnim poziomie hałasu wynoszącym 45,7 dB(A), Asus NUC 14 Pro+ jest wyraźnie słyszalny. Podczas testu obciążeniowego odnotowaliśmy wartość szczytową na poziomie 47,4 dB(A). W trybie bezczynności urządzenie działa cicho, choć wentylator nadal się obraca.

Profil wentylatora można regulować w BIOS-ie. Aby porównać, przetestowaliśmy system zarówno w trybie szeptu, jak i wydajności. W trybie szeptu maksymalny poziom hałasu spada do około 43 dB(A), co czyni go bardziej znośnym do długotrwałego użytkowania. Z drugiej strony, tryb wydajności powoduje znaczny wzrost hałasu, z poziomem ciśnienia akustycznego sięgającym prawie 58 dB(A), czego nie zalecamy do codziennego użytku.

Hałas

luz
24.7 / 29.6 / 29.8 dB
obciążenie
45.7 / 47.4 dB
  red to green bar
 
 
30 dB
cichy
40 dB(A)
słyszalny
50 dB(A)
irytujący
 
min: dark, med: mid, max: light   Earthworks M23R (odległość 15 cm)   environment noise: 24.6 dB(A)
dB(A) 0102030405060708090Deep BassMiddle BassHigh BassLower RangeMidsHigher MidsLower HighsMid HighsUpper HighsSuper Highs2042.648.63743.23839.942.62542.145.245.344.144.13642.13142.743.237.938.639.139.742.74036.346.128.229.127.434.136.35043.63531.330.230.331.243.66333.635.428.428.424.625.533.68027.333.827.325.721.321.827.310025.527.725.123.120.821.625.512525.325.716.814.611.112.725.316021.121.61813913.221.120024.222.516.815.49.210.324.225023.62314.514.58.89.623.63152523.51515.19.192540027.825.81918.98.6827.850030.328.820.619.78.88.330.363031.53118.618.78.9931.580036.134.122.421.89.69.536.1100035.734.420.220.49.69.835.712503634.617.317.410.411.1361600403819.419.411.210.840200039.337.518.518.61211.339.325003634.315.91612.612.136315037.235.315.7161312.837.2400034.332.114.614.613.613.634.3500028.726.414.514.2141428.763002623.514.514.514.414.526800022.320.514.814.614.614.522.31000019.318.41514.914.814.719.31250016.216.614.614.614.514.516.21600014.915.614.113.914.213.914.9SPL47.445.729.829.624.724.647.4N5.24.61.21.20.50.55.2median 27.8median 26.4median 16.8median 15.4median 11.2median 12.1median 27.8Delta6.96.52.42.42.52.56.9hearing rangehide median Fan NoiseAsus NUC 14 Pro+
Asus NUC 14 Pro+
Ultra 9 185H, Arc 8-Core
Aoostar GEM12
R7 8845HS, Radeon 780M
Geekom GT1 Mega
Ultra 9 185H, Arc 8-Core
Geekom AX8 Pro
R9 8945H, Radeon 780M
Minisforum AtomMan X7 Ti
Ultra 9 185H, Arc 8-Core
Acemagic F2A
Ultra 7 155H, Arc 8-Core
Noise
10%
-2%
1%
1%
3%
off / environment *
24.6
24.3
1%
24.8
-1%
24.9
-1%
24.1
2%
24.9
-1%
Idle Minimum *
24.7
27.5
-11%
25.4
-3%
24.9
-1%
29.8
-21%
25.4
-3%
Idle Average *
29.6
27.6
7%
27.2
8%
24.9
16%
29.9
-1%
25.7
13%
Idle Maximum *
29.8
27.6
7%
27.5
8%
24.9
16%
30
-1%
25.7
14%
Load Average *
45.7
36
21%
50.9
-11%
50.1
-10%
37.3
18%
47.8
-5%
Cyberpunk 2077 ultra *
47.7
35.4
26%
50.8
-6%
50
-5%
Load Maximum *
47.4
38.2
19%
50.9
-7%
50.2
-6%
43.5
8%
49
-3%
Witcher 3 ultra *
35.4
40.2
45.23

* ... im mniej tym lepiej

Temperatura

Temperatury powierzchni Asus NUC 14 Pro+ różnią się znacznie pomiędzy stanem spoczynku i obciążenia. Metalowa powierzchnia skutecznie rozprowadza ciepło, zapobiegając powstawaniu lokalnych hotspotów. Podczas testu obciążeniowego Intel Core Ultra 9 185H może z łatwością osiągnąć temperaturę 212 °F. SoC został zaprojektowany do obsługi do 239 watów pod ciągłym obciążeniem, chociaż ten szczyt nie jest w pełni wykorzystywany. W krótkim okresie pobór mocy osiąga wartość nieco powyżej 212 watów, ale przy stałym obciążeniu system zazwyczaj rozprasza tylko około 147 watów. Pomimo tego, SoC konsekwentnie działa w temperaturze powyżej 212 °F, z czym Intel Core Ultra 9 185H radzi sobie dobrze. Zgodnie ze specyfikacją techniczną, procesor jest przystosowany do pracy w temperaturach do 230°F.

Test warunków skrajnych Prime95, solo
Test warunków skrajnych FurMark, solo
Test warunków skrajnych Prime95 i FurMark
Asus NUC 14 Pro+ podczas testu obciążeniowego (góra)
Test obciążeniowy Asus NUC 14 Pro+ (spód)
Zasilacz podczas testu warunków skrajnych
 46.2 °C45.1 °C45.6 °C 
 46.2 °C45.8 °C45.7 °C 
 45.7 °C44.9 °C45.7 °C 
maks. w ogóle: 46.2 °C
średnia: 45.7 °C
31.6 °C30.3 °C31.4 °C
30.9 °C28.8 °C32.1 °C
30.9 °C33.2 °C33.5 °C
maks. w ogóle: 33.5 °C
średnia: 31.4 °C
zasilacz  51.6 °C | temperatura otoczenia 21.9 °C | Fluke t3000FC (calibrated)
(-) The average temperature for the upper side under maximal load is 45.7 °C / 114 F, compared to the average of 32.3 °C / 90 F for the devices in the class Mini PC.
(-) The maximum temperature on the upper side is 46.2 °C / 115 F, compared to the average of 35.8 °C / 96 F, ranging from 24 to 69.5 °C for the class Mini PC.
(+) The bottom heats up to a maximum of 33.5 °C / 92 F, compared to the average of 36.1 °C / 97 F
(±) In idle usage, the average temperature for the upper side is 32 °C / 90 F, compared to the device average of 32.3 °C / 90 F.
(-) 3: The average temperature for the upper side is 39.2 °C / 103 F, compared to the average of 32.3 °C / 90 F for the class Mini PC.

Zarządzanie energią

Asus NUC 14 Pro+ to zasadniczo niedrogi mini PC, który działa najlepiej w trybie bezczynności i pod umiarkowanym obciążeniem. Ze względu na szczytową moc wyjściową procesora, krótkoterminowy pobór mocy znacznie wzrasta w porównaniu do innych mini PC. Nasza próbka testowa zarejestrowała najwyższą wartość w tym porównaniu, wynoszącą nieco poniżej 145 watów. Warto zauważyć, że wartość ta jest osiągana tylko przez krótki czas. Zasilacz, zdolny do dostarczenia do 150 watów, jest dobrze dobrany do wielkości systemu.

Pobór mocy
wyłączony / stan wstrzymaniadarklight 0.78 / 1 W
luzdarkmidlight 4.2 / 7.2 / 13 W
obciążenie midlight 68.5 / 144.9 W
 color bar
Legenda: min: dark, med: mid, max: light        Metrahit Energy
Asus NUC 14 Pro+
Ultra 9 185H, Arc 8-Core
Aoostar GEM12
R7 8845HS, Radeon 780M
Geekom GT1 Mega
Ultra 9 185H, Arc 8-Core
Geekom AX8 Pro
R9 8945H, Radeon 780M
Minisforum AtomMan X7 Ti
Ultra 9 185H, Arc 8-Core
Acemagic F2A
Ultra 7 155H, Arc 8-Core
Average Intel Arc 8-Core iGPU
 
Average of class Mini PC
 
Power Consumption
-21%
10%
-60%
-24%
-25%
4%
-32%
Idle Minimum *
4.2
8.2
-95%
4.1
2%
14
-233%
8.2
-95%
9.1
-117%
5.42 ?(1.8 - 10.3, n=38)
-29%
Idle Average *
7.2
10
-39%
6.6
8%
15.9
-121%
12.1
-68%
10.3
-43%
8.63 ?(4.2 - 16, n=38)
-20%
Idle Maximum *
13
14.6
-12%
11.3
13%
19.5
-50%
14
-8%
14.4
-11%
Load Average *
68.5
73.9
-8%
65.8
4%
76.4
-12%
53.1
22%
54.9
20%
Cyberpunk 2077 ultra external monitor *
74.1
79.9
-8%
69.4
6%
54.3
27%
Load Maximum *
144.9
95.3
34%
104.8
28%
99.1
32%
100.4
31%
110.4
24%

* ... im mniej tym lepiej

Efficiency overview

Performance Rating - Percent
Geekom AX8 Pro
AMD Ryzen 9 8945H, Radeon 780M
100 pt
Minisforum AtomMan X7 Ti
Intel Core Ultra 9 185H, Arc 8-Core
92 pt
Geekom GT1 Mega
Intel Core Ultra 9 185H, Arc 8-Core
89.2 pt
Acemagic F2A
Intel Core Ultra 7 155H, Arc 8-Core
83.6 pt
Asus NUC 14 Pro+
Intel Core Ultra 9 185H, Arc 8-Core
79.6 pt
Power Consumption
Cinebench R23 Multi Power Efficiency - external Monitor
Geekom AX8 Pro
AMD Ryzen 9 8945H, Radeon 780M
219 Points per Watt +17%
Minisforum AtomMan X7 Ti
Intel Core Ultra 9 185H, Arc 8-Core
205 Points per Watt +9%
Geekom GT1 Mega
Intel Core Ultra 9 185H, Arc 8-Core
194.8 Points per Watt +4%
Asus NUC 14 Pro+
Intel Core Ultra 9 185H, Arc 8-Core
187.8 Points per Watt
Acemagic F2A
Intel Core Ultra 7 155H, Arc 8-Core
183.7 Points per Watt -2%
Cinebench R23 Single Power Efficiency - external Monitor
Geekom AX8 Pro
AMD Ryzen 9 8945H, Radeon 780M
58.3 Points per Watt +17%
Geekom GT1 Mega
Intel Core Ultra 9 185H, Arc 8-Core
56.7 Points per Watt +13%
Minisforum AtomMan X7 Ti
Intel Core Ultra 9 185H, Arc 8-Core
55.6 Points per Watt +11%
Acemagic F2A
Intel Core Ultra 7 155H, Arc 8-Core
54.2 Points per Watt +8%
Asus NUC 14 Pro+
Intel Core Ultra 9 185H, Arc 8-Core
50 Points per Watt
Cinebench R15 Multi Efficiency (external Monitor)
Geekom AX8 Pro
AMD Ryzen 9 8945H, Radeon 780M
35.9 Points per Watt +48%
Minisforum AtomMan X7 Ti
Intel Core Ultra 9 185H, Arc 8-Core
31.2 Points per Watt +29%
Geekom GT1 Mega
Intel Core Ultra 9 185H, Arc 8-Core
29.2 Points per Watt +21%
Acemagic F2A
Intel Core Ultra 7 155H, Arc 8-Core
26.6 Points per Watt +10%
Asus NUC 14 Pro+
Intel Core Ultra 9 185H, Arc 8-Core
24.2 Points per Watt

Power consumption with external monitor

0102030405060708090100110120130140Tooltip
Asus NUC 14 Pro+ Ultra 9 185H, Arc 8-Core; Idle 1min (external Monitor): Ø7.26 (4.91-13.1)
Geekom GT1 Mega Ultra 9 185H, Arc 8-Core; Idle 1min (external Monitor): Ø6.65 (4.54-11.3)
Geekom AX8 Pro R9 8945H, Radeon 780M; Idle 1min (external Monitor): Ø15.9 (14.3-19.4)
Asus NUC 14 Pro+ Ultra 9 185H, Arc 8-Core; 1280x720 Prime95 28.10 and Furmark 1.25: Ø114.7 (100.9-144.9)
Geekom GT1 Mega Ultra 9 185H, Arc 8-Core; 1280x720 Prime95 28.10 and Furmark 1.25: Ø75.4 (64.2-104.8)
Geekom AX8 Pro R9 8945H, Radeon 780M; 1280x720 Prime95 28.10 and Furmark 1.25: Ø89.4 (87.8-94.6)
Asus NUC 14 Pro+ Ultra 9 185H, Arc 8-Core; Cyberpunk 2077 FHD ultra no FSR (external Monitor): Ø74.1 (62.4-78.7)
Geekom GT1 Mega Ultra 9 185H, Arc 8-Core; Cyberpunk 2077 FHD ultra no FSR (external Monitor): Ø69.4 (66.7-76.7)
Geekom AX8 Pro R9 8945H, Radeon 780M; Cyberpunk 2077 FHD ultra no FSR (external Monitor): Ø54.3 (43.7-67.1)
Asus NUC 14 Pro+ Ultra 9 185H, Arc 8-Core; 3DMark06 Return To Proxycon: Ø68.5 (60-97.6)
Geekom GT1 Mega Ultra 9 185H, Arc 8-Core; 3DMark06 Return To Proxycon: Ø65.8 (59-72.8)
Geekom AX8 Pro R9 8945H, Radeon 780M; 3DMark06 Return To Proxycon: Ø76.5 (55.7-96.2)

Power consumption with external monitor

0102030405060708090100110120130140Tooltip
Asus NUC 14 Pro+ Ultra 9 185H, Arc 8-Core; Prime95 V2810 Stress (external Monitor): Ø104.2 (91.4-142.7)
Geekom GT1 Mega Ultra 9 185H, Arc 8-Core; Prime95 V2810 Stress (external Monitor): Ø75.6 (62.9-104.6)
Geekom AX8 Pro R9 8945H, Radeon 780M; Prime95 V2810 Stress (external Monitor): Ø75.9 (72.6-96)
Asus NUC 14 Pro+ Ultra 9 185H, Arc 8-Core; Cinebench R15 Multi (external Monitor): Ø118.5 (109.4-137.5)
Geekom GT1 Mega Ultra 9 185H, Arc 8-Core; Cinebench R15 Multi (external Monitor): Ø95.8 (95-96.5)
Geekom AX8 Pro R9 8945H, Radeon 780M; Cinebench R15 Multi (external Monitor): Ø70.3 (63.2-83)
Asus NUC 14 Pro+ Ultra 9 185H, Arc 8-Core; Cinebench R23 Single (external Monitor): Ø35.3 (25.6-81.6)
Geekom GT1 Mega Ultra 9 185H, Arc 8-Core; Cinebench R23 Single (external Monitor): Ø31.3 (15.7-81.3)
Geekom AX8 Pro R9 8945H, Radeon 780M; Cinebench R23 Single (external Monitor): Ø31 (25.6-51.4)
Asus NUC 14 Pro+ Ultra 9 185H, Arc 8-Core; Cinebench R23 Multi (external Monitor): Ø93.8 (87.6-109.2)
Geekom GT1 Mega Ultra 9 185H, Arc 8-Core; Cinebench R23 Multi (external Monitor): Ø95.5 (94-96.6)
Geekom AX8 Pro R9 8945H, Radeon 780M; Cinebench R23 Multi (external Monitor): Ø70.9 (66.8-89.8)
Asus NUC 14 Pro+ Ultra 9 185H, Arc 8-Core; 1280x720 FurMark 1.19 GPU Stress Test (external Monitor): Ø56.6 (55.1-70.1)
Geekom GT1 Mega Ultra 9 185H, Arc 8-Core; 1280x720 FurMark 1.19 GPU Stress Test (external Monitor): Ø58.2 (56.2-74.2)
Geekom AX8 Pro R9 8945H, Radeon 780M; 1280x720 FurMark 1.19 GPU Stress Test (external Monitor): Ø85.7 (73.1-99.9)

Ocena Notebookcheck

Wydajność Asus NUC 14 Pro+ jest niezwykła, dzięki najnowocześniejszej technologii i szerokiej gamie opcji łączności. Doskonałą wydajność w aplikacjach biurowych i łatwość obsługi wymagających dużej mocy zadań multimedialnych zapewnia procesor Intel Core Ultra 9 185H. Jedynym minusem jest okazjonalnie głośny system chłodzenia, który jest zauważalny nawet przy umiarkowanym obciążeniu.

Asus NUC 14 Pro+ - 14/11/2024 v8
Sebastian Bade

Wykonanie
84 / 98 → 85%
Komunikacja
62 / 81 → 77%
Waga
81%
Wydajność w grach
49 / 80 → 62%
Wydajność w programach użytkowych
82 / 92 → 90%
Workstation
32%
AI Performance
83%
Temperatura
86%
Hałas
73%
Średnio
55%
75%
Mini PC - Ważona średnia
CO2 Emissions
No Data
Materials
25%
Packaging
25%
Power Use
74.9%
Repairability
30%
Software Updates
50%
Recycle Logo Total Sustainability Score: 34.2%

Transparency

The selection of devices to be reviewed is made by our editorial team. The test sample was provided to the author as a loan by the manufacturer or retailer for the purpose of this review. The lender had no influence on this review, nor did the manufacturer receive a copy of this review before publication. There was no obligation to publish this review. We never accept compensation or payment in return for our reviews. As an independent media company, Notebookcheck is not subjected to the authority of manufacturers, retailers or publishers.

This is how Notebookcheck is testing

Every year, Notebookcheck independently reviews hundreds of laptops and smartphones using standardized procedures to ensure that all results are comparable. We have continuously developed our test methods for around 20 years and set industry standards in the process. In our test labs, high-quality measuring equipment is utilized by experienced technicians and editors. These tests involve a multi-stage validation process. Our complex rating system is based on hundreds of well-founded measurements and benchmarks, which maintains objectivity. Further information on our test methods can be found here.

Please share our article, every link counts!
Mail Logo
> laptopy testy i recenzje notebooki > Laptopy > Recenzja mini-PC Asus NUC 14 Pro+ - potencjalny zabójca komputerów stacjonarnych ważący zaledwie 622 gramy
Sebastian Bade, 2024-11-17 (Update: 2024-11-17)