Notebookcheck Logo
Geekom GT1 Mega in review

Recenzja Geekom GT1 Mega: Pierwszy mini PC AI Geekom nie przekonuje we wszystkich aspektach

Co dokładnie jest Mega w Geekom GT1 Mega?

Geekom GT1 Mega obiecuje potężną wydajność w obudowie mini PC i jest skierowany do użytkowników, którzy potrzebują dużej wydajności w najmniejszej przestrzeni. Wyposażony w procesor Intel Core Ultra 9 185H, Geekom po raz pierwszy zainstalował procesor Meteor Lake z dedykowaną jednostką NPU. W tym teście dowiemy się, czy Geekom GT1 Mega jest przekonujący w kilku aspektach, od funkcji po wydajność i chłodzenie.
Sebastian Bade, 👁 Sebastian Bade (tłumaczenie DeepL / Ninh Duy) Published 🇺🇸 🇩🇪 ...
Mini PC Desktop Intel Meteor Lake Business

Werdykt: Niewystarczająca premia w stosunku do ceny

Geekom GT1 Mega prezentuje się jako potężny mini PC, który imponuje w wielu obszarach. Dzięki wydajnemu sprzętowi, składającemu się z procesora Intel Core Ultra 9 185H, który ma również bardzo wydajną iGPU, mini PC idealnie nadaje się do zastosowań biurowych, a także multimediów i lekkich zadań kreatywnych.

Szczególnie pozytywną cechą jest różnorodność połączeń, co jest rzadkością w przypadku kompaktowego urządzenia tej wielkości. Dwa interfejsy USB4 są jednymi z najbardziej przydatnych portów, jeśli chodzi o zabezpieczenie na przyszłość. Możliwość rozbudowy pamięci i nienaganna jakość wykonania sprawiają, że GT1 Mega jest atrakcyjnym rozwiązaniem dla stacji roboczych, które wymagają niewiele miejsca.

Musimy jednak skrytykować poziom hałasu przy średnim i wysokim obciążeniu. Mini PC, który jest nieuchronnie umieszczony na biurku w bezpośrednim sąsiedztwie, po prostu nie powinien osiągać 50 dB(A).

Dlaczego Geekom nie włożył w to więcej energii, aby lepiej dostroić produkt pod względem krzywych wentylatorów, jest dla nas tajemnicą. Opcje BIOS-u są również bardzo prymitywne. Na szczęście można aktywować tryb cichy, ale jest to bardziej obejście niż właściwe rozwiązanie z utratą wydajności. Nie może to być idealne rozwiązanie, ponieważ Geekom żąda znacznie ponad 1000 euro za GT1 Mega zgodnie z ceną detaliczną.

Pomijając wysoki poziom hałasu, Geekom GT1 Mega to wydajne, elastyczne i kompaktowe rozwiązanie idealne dla biur i biur domowych, dla każdego, kto szuka niezawodnego, wszechstronnego komputera na małej przestrzeni, a także jako wydajne rozwiązanie multimedialne.

Za

+ świetny design
+ doskonała jakość wykonania
+ bardzo stabilna konstrukcja
+ 2x USB4
+ Podwójny 2.5G LAN
+ szybki czytnik kart SD
+ Wi-Fi 7
+ dobra wydajność na co dzień dzięki procesorowi Intel Core Ultra 9 185H
+ wydajne iGPU
+ pojemny dysk SSD 2 TB
+ 32 GB PAMIĘCI RAM
+ niskie zużycie energii
+ stabilna wydajność dysku SSD
+ 36 miesięcy gwarancji

Przeciw

- wyraźnie słyszalny przy częściowym i pełnym obciążeniu
- ograniczone opcje BIOS-u
- brak ręcznie konfigurowalnego sterowania wentylatorem
- brak interfejsu OCuLink
- bardzo drogi

Cena i dostępność

Geekom GT1 Mega w konfiguracji z naszej recenzji kosztuje €1,149 w Geekom DE i można go obecnie nabyć za $989 w Geekom US. Za jedyne 899 euro lub 849 dolarów GT1 Mega z procesorem Intel Core Ultra 7 155H jest bardziej opłacalną opcją.

W Stanach Zjednoczonych nabywcy mogą również zamówić Geekom GT1 Mega za pośrednictwem Amazon.

Amazon Logo
$989.00
GEEKOM GT1 Mega AI Mini PC,14th Gen Intel Core Ultra U9-185H Processor (16C/22T,up to 5.1 GHz),32GB DDR5 2TB PCIe Gen4 SSD,Mini Desktop Computers Windows 11 Pro,WiFi 7/BT 5.4/Dual 2.5G LAN/USB4.0/8K
  • $799.00
    GEEKOM GT1 Mega AI Mini PC,14th Gen Intel Core Ultra U7-155H (16C/22T,up to 4.8 GHz),32GB DDR5 1TB PCIe Gen4 SSD,NUC14 Pro Mini Desktop Computers Windows 11 Pro,WiFi 7/BT 5.4/Dual 2.5G LAN/USB4.0/8K
  • $958.55
    GEEKOM XT1 Mega AI Mini PC,14th Gen Intel Core Ultra U9-185H Processor(16C/22T,up to 5.1 GHz) 32GB DDR5 RAM 2TB PCIe Gen4 SSD Mini Desktop Computers, Windows 11Pro,WiFi7/BT5.4/Dual 2.5G LAN/USB4.0/8K

Price comparison

Porównanie możliwych alternatyw

Image
Model / Review
Geizhals
Weight
Height
Display
1.
78.8%
Geekom GT1 Mega
Geekom GT1 Mega
Intel Core Ultra 9 185H ⎘
Intel Arc 8-Core iGPU ⎘
32 GB Pamięć, 2048 GB SSD
Listenpreis 1149 EUR
Geizhals Suche
693 g46.9 mmx
2.
78.4%
Geekom AX8 Pro
Geekom AX8 Pro
AMD Ryzen 9 8945H ⎘
AMD Radeon 780M ⎘
32 GB Pamięć, 2048 GB SSD
Listenpreis 999 EUR548 g37 mmx
3.
74.7%
Asus NUC 14 Pro
Asus NUC 14 Pro
Intel Core Ultra 5 125H ⎘
Intel Arc 7-Core iGPU ⎘
, 2048 GB SSD
Bestpreis 510.51€ Senetic.de
2. 514.8€ Senetic AT
3. 517.99€ galaxus
525 g37 mmx
4.
74.5%
Minisforum UH125 Pro
Intel Core Ultra 5 125H ⎘
Intel Arc 7-Core iGPU ⎘
32 GB Pamięć, 1024 GB SSD
Listenpreis 879 EUR
Geizhals Suche
797 g49 mmx
5.
72.1%
Geekom GT13 Pro
Geekom GT13 Pro
Intel Core i9-13900H ⎘
Intel Iris Xe Graphics G7 96EUs ⎘
32 GB Pamięć, 2048 GB SSD
Listenpreis 930 EUR440 g37 mmx
6.
83.4% v7 (old)
Acemagic F2A
Acemagic F2A
Intel Core Ultra 7 155H ⎘
Intel Arc 8-Core iGPU ⎘
32 GB Pamięć, 1024 GB SSD
Listenpreis 1199 EUR768 g57 mmx

Geekom GT1 Mega to najnowszy mini PC od Geekom, po raz pierwszy wyposażony w procesor Intel Meteor Lake. Wizualnie, Geekom GT1 Mega przypomina model Geekom GT13 Pro.

Niemniej jednak, Geekom wprowadził kilka istotnych zmian konstrukcyjnych. Na pierwszy rzut oka znacznie większa konstrukcja przyciąga wzrok. Wkrótce przyjrzymy się, czy oferuje to jakieś nieodłączne zalety.

W tym teście skupiamy się na Geekom GT1 Mega w najwyższej konfiguracji. Jest on wyposażony w Intel Core Ultra 9 185H z 32 GB pamięci RAM i dyskiem SSD o pojemności 2 TB. Jeśli jednak chodzi o cenę, trzeba będzie sięgnąć głęboko do kieszeni, ponieważ przy cenie 1149 euro lub 989 dolarów, ten mini PC nie jest dokładnie okazją. Biorąc to pod uwagę, Geekom jest znany z okazjonalnej kampanii rabatowej lub dwóch, o których można spekulować, jeśli planują Państwo zakup tego urządzenia.

Jeśli Państwa budżet wynosi około €899, można również wyposażyć Geekom GT1 Mega w procesor Intel Core Ultra 7 155H z 32 GB pamięci RAM i dyskiem SSD o pojemności 1 TB. Na pierwszy rzut oka wygląda to na bardziej rozsądną konfigurację, ponieważ różnice techniczne między tymi dwoma procesorami są minimalne.

Geekom GT1 Mega konkuruje również z uznanymi mini PC innych producentów, takich jak Asus, Minisforum i Acemagic. Jednakże, GT1 Mega musi również stawić czoła konkurencji z własnych szeregów, jako że Geekom sam posiada kilka innych wysokowydajnych komputerów Mini PC w swoim obecnym portfolio.

Specyfikacje

Geekom GT1 Mega
Procesor
Intel Core Ultra 9 185H 16 x 3.8 - 5.1 GHz, 70 W PL2 / Short Burst, 45 W PL1 / Sustained, Meteor Lake-H
Karta grafiki
Intel Arc 8-Core iGPU, rdzeń: 2350 MHz, 32.0.101.6079
Pamięć
32 GB 
, DDR5-5600, max 64 GB
Chipset
Intel Meteor Lake-U/P/H PCH
Dysk twardy
Crucial P3 Plus CT2000P3PSSD8 , 2048 GB 
, 1760 GB wolne miejsce
Karta dźwiękowa
Intel Meteor Lake-U/P/H PCH - cAVS (Audio, Voice, Speech)
Złącza
1 USB 2.0, 5 USB 3.1 Gen2, 2 USB 4.0 40 Gbps, USB-C Power Delivery (PD), 2 HDMI, 2 DisplayPort, 1 blokada Kensingtona, 1 złącze stacji dokującej, gniazda audio: 3.5mm combo, czytnik kart: Full-Size-SD-Card (UHS II), Intel Ethernet Controller I226-V (10/2500MBit/s)
Łączność
Intel Ethernet Controller I226-V (10/2500MBit/s), Intel Wi-Fi 7 BE200 320MHz (a/b/g/n = Wi-Fi 4/ac = Wi-Fi 5/ax = Wi-Fi 6/ Wi-Fi 6E 6 GHz be = Wi-Fi 7), Bluetooth 5.4
Gabaryty
wysokość x szerokość x głębokość (mm): 46.9 x 135 x 132
System operacyjny
Microsoft Windows 11 Pro
Inne
120-Watt-Power-Adapter, 36 miesiące(y) gwarancji
Waga
693 g, zasilacz: 256 g
Cena
1149 EUR
Note: The manufacturer may use components from different suppliers including display panels, drives or memory sticks with similar specifications.


Geekom GT1 Mega
Geekom GT1 Mega
Geekom GT1 Mega
Geekom GT1 Mega vs. Geekom GT13 Pro
Geekom GT1 Mega
Geekom GT1 Mega
Geekom GT1 Mega
Geekom GT1 Mega
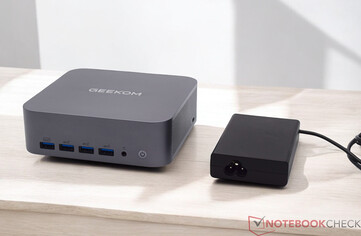
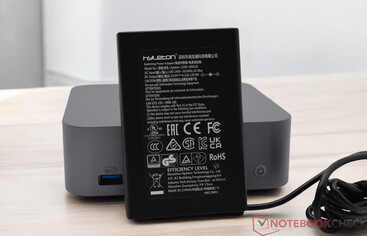
Geekom GT1 Mega z zasilaczem (19 V; 6,32 A)
Zasilacz (19 V; 6,32 A)

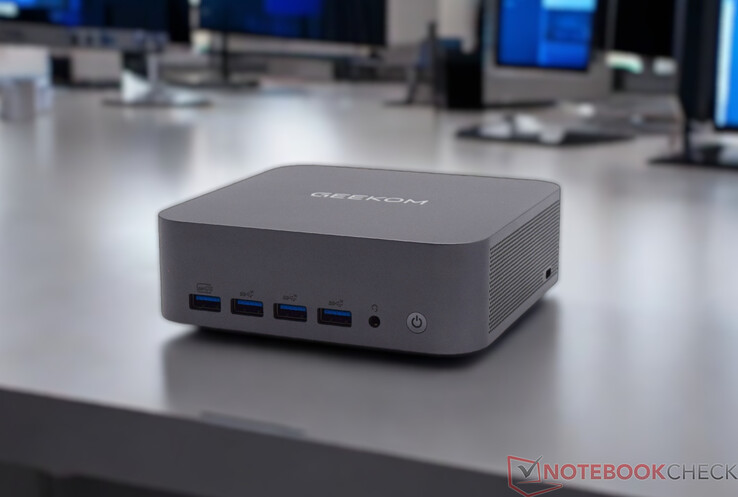
Obudowa: Doskonale wykończona aluminiowa obudowa

Geekom GT1 Mega jest znacznie większy niż poprzednie mini komputery Geekom. Nie stanowi to jednak większego problemu, gdyż pozwala na zastosowanie wydajniejszego układu chłodzenia.
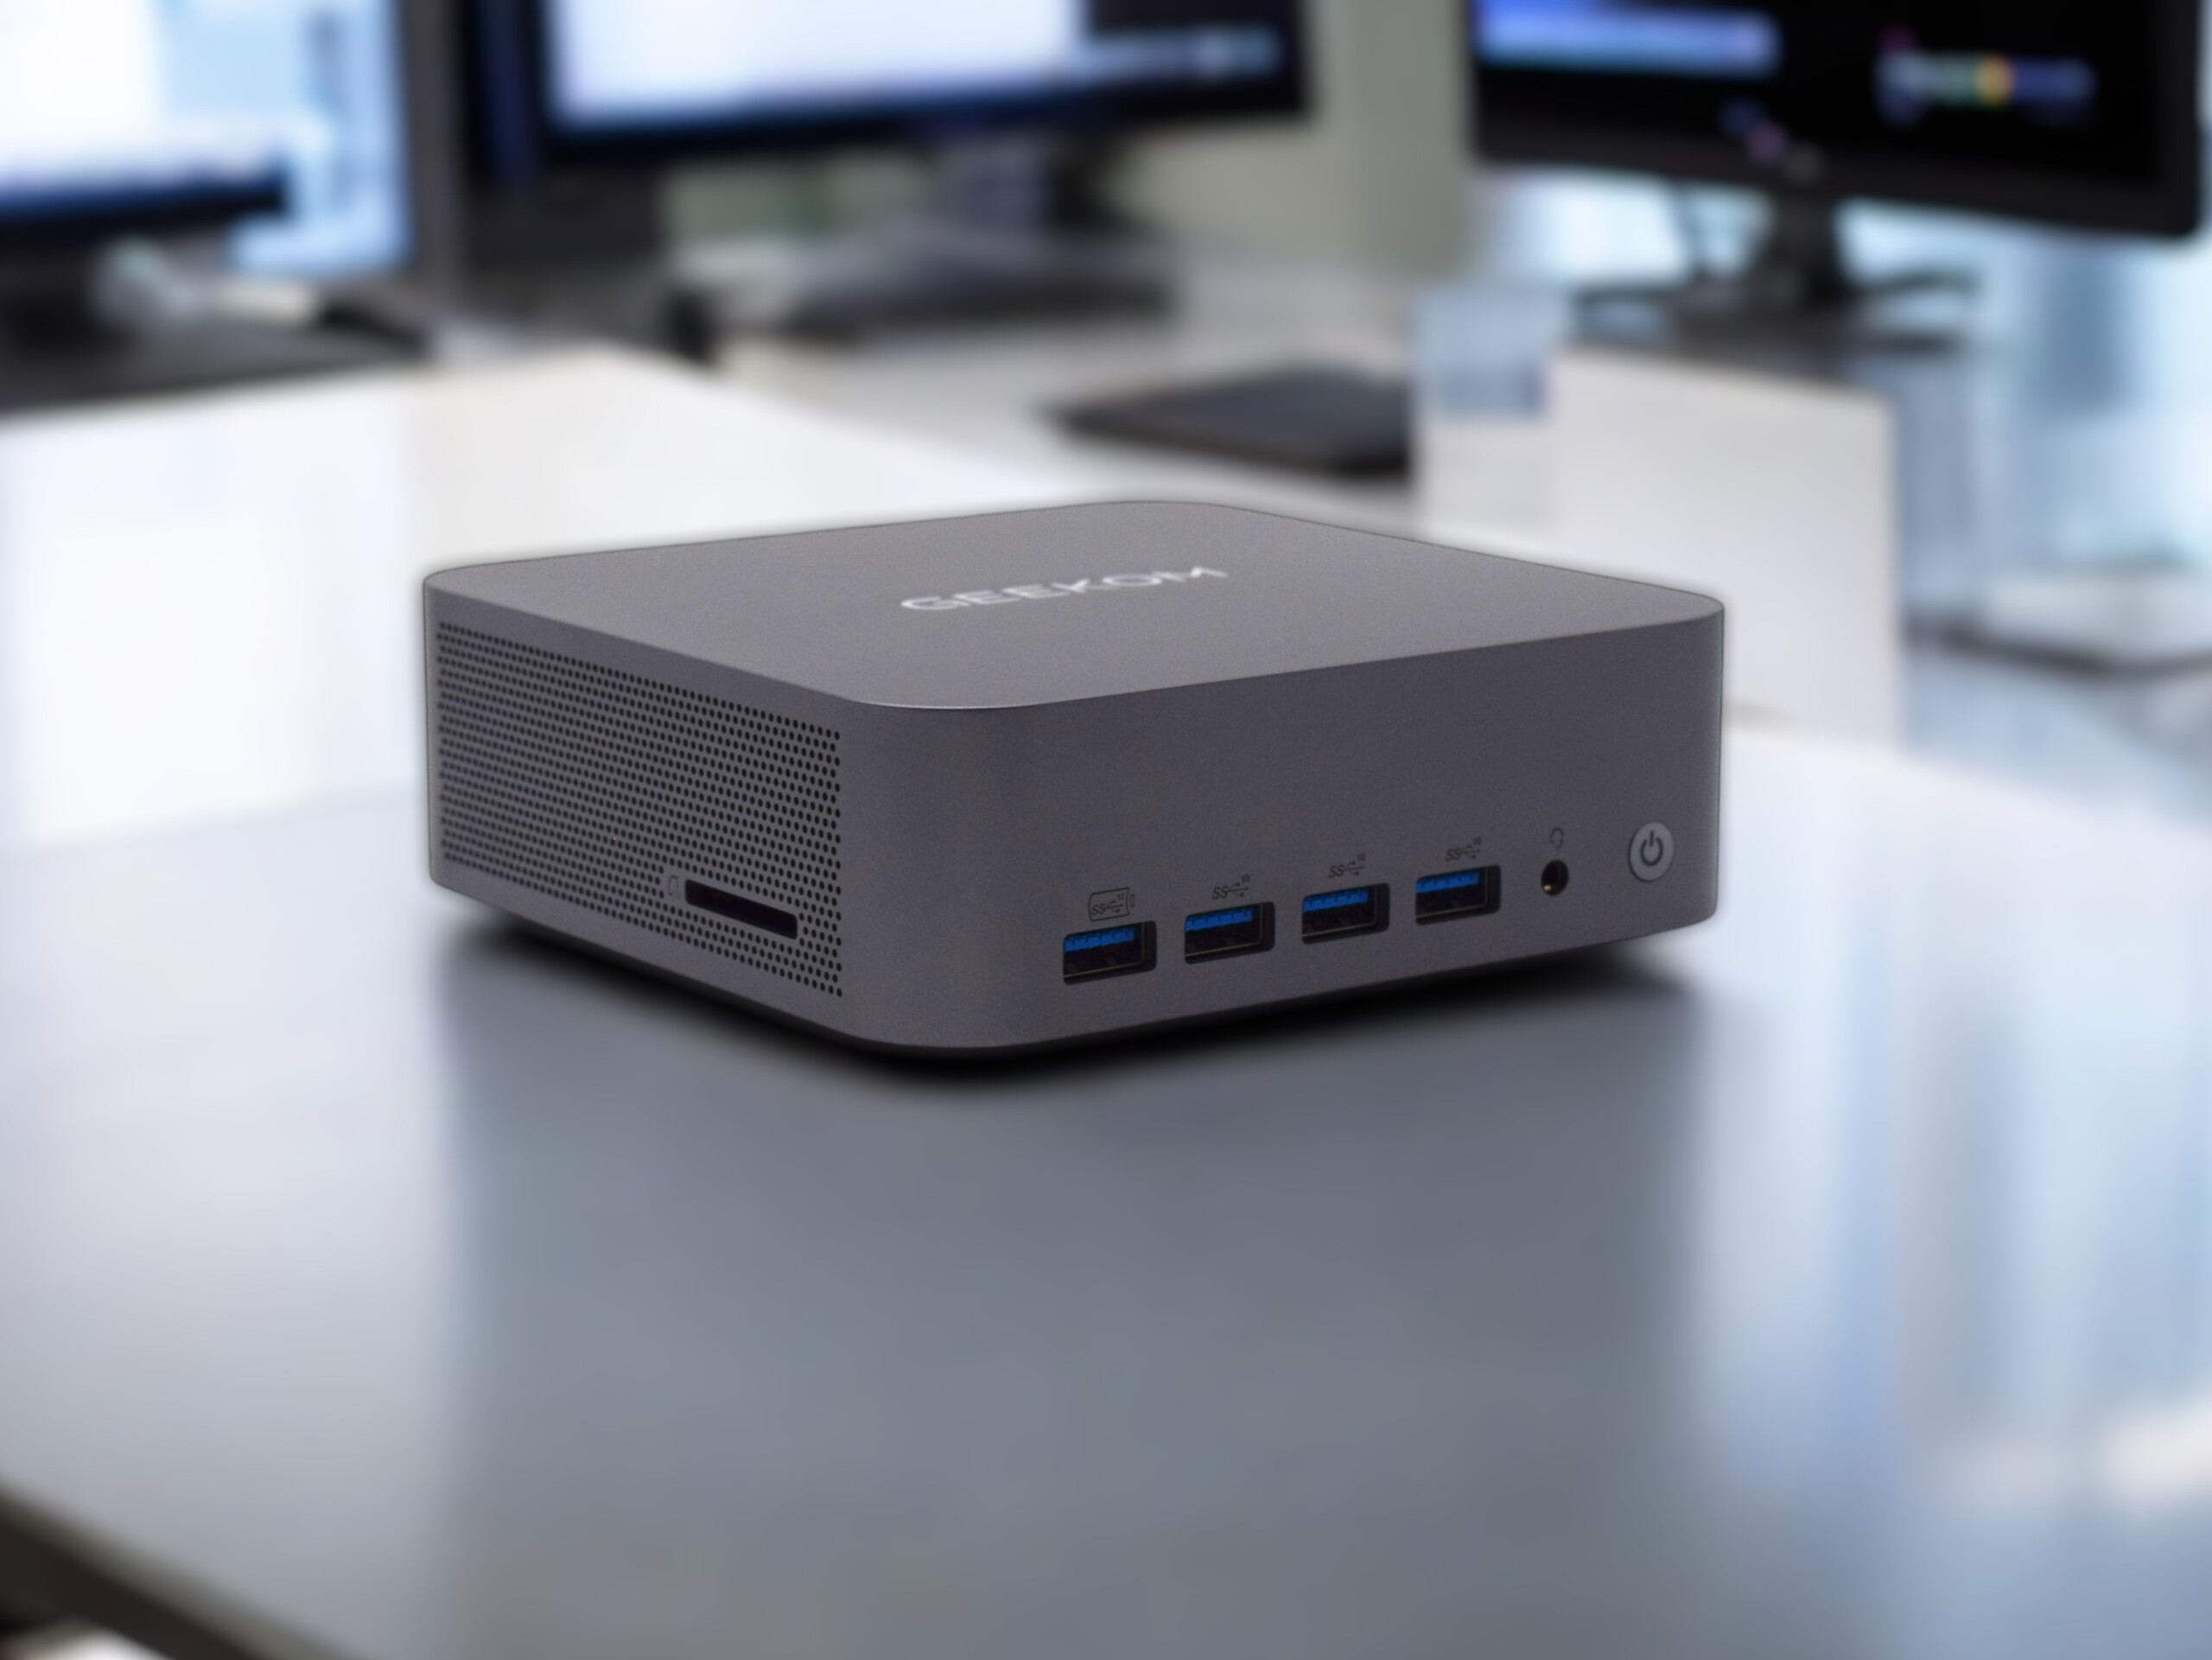
Jeśli chodzi o wybór materiałów, Geekom stawia przede wszystkim na aluminium, które wygląda bardzo wysokiej jakości w dyskretnym ciemnoszarym wykończeniu. Nie ma nic do zarzucenia jakości wykonania, ponieważ urządzenie wygląda na doskonale wykończone. Można się tego spodziewać, biorąc pod uwagę cenę.

Spód wykonany jest z tworzywa sztucznego podobnego do tego, co widzieliśmy w Geekom GT13 Pro. Większa konstrukcja ma również wpływ na wagę. Przy wadze nieco poniżej 700 g, nasza próbka testowa jest nadal nieco lżejsza niż Acemagic F2A lub Minisforum UH125 Pro.

Zasilacz waży 256 g, czyli mniej więcej tyle samo co Geekom AX8 Pro lub Geekom GT13 Pro. Wszystkie urządzenia Geekom, które tutaj porównaliśmy, są dostarczane z tym samym zasilaczem.

Możliwe jest również przymocowanie Geekom GT1 Mega bezpośrednio do monitora za pomocą dołączonego uchwytu VESA.

Porównanie rozmiarów

146 mm 146 mm 57 mm 768 g145 mm 145 mm 49 mm 797 g135 mm 132 mm 46.9 mm 693 g117 mm 112 mm 37 mm 548 g117 mm 112 mm 37 mm 525 g112.4 mm 112.4 mm 37 mm 440 g210 mm 148 mm 1 mm 2.9 g

Cechy: Wiele portów, w tym 2x USB4

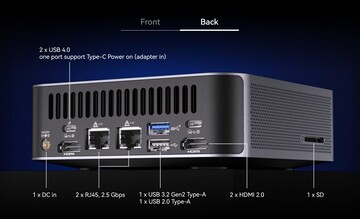
Geekom wykorzystuje większą konstrukcję i wyposaża GT1 Mega w dobry wybór portów. Nie powinno zabraknąć portów USB typu A, ponieważ jest ich w sumie sześć.

Na pytanie, czy cztery porty z przodu są przydatne, każdy musi odpowiedzieć sobie sam. Geekom zainstalował również dwa dodatkowe porty USB4 z tyłu, co oznacza, że mini PC może również współpracować na przykład z zewnętrzną kartą graficzną.

Dwa wyjścia HDMI z tyłu mogą być wykorzystane do wyjścia wideo. W połączeniu z dwoma portami USB4 możliwa jest jednoczesna obsługa do czterech wyświetlaczy. Nie należy zapominać o szybkim czytniku kart SD znajdującym się po lewej stronie i należy go pozytywnie podkreślić.

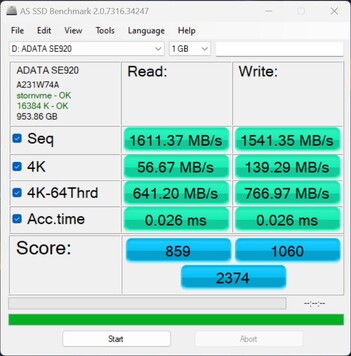
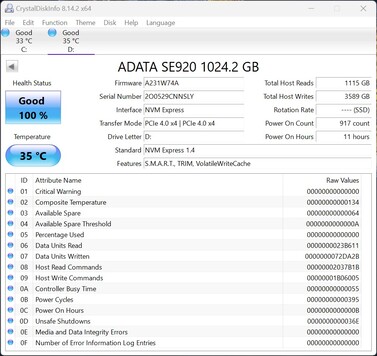
Wydajność, którą określamy za pośrednictwem interfejsu USB4, jest nieco otrzeźwiająca. Sekwencyjna szybkość odczytu naszego testowego dysku SSD (ADATA SE920) blednie w porównaniu do Minisforum MS-A1 lub Khadas Mind 2.

Przód: Zewnętrzne złącza na Geekom GT1 Mega (Źródło obrazu: Geekom)
Tył: Zewnętrzne złącza na Geekom GT1 Mega (Źródło obrazu: Geekom)
Sprawdzenie wydajności z ADATA SE920 przez USB4
ADATA SE920 współpracuje z PCIe 4.0 x4

Czytnik kart SD

SD Card Reader
average JPG Copy Test (av. of 3 runs)
Geekom GT1 Mega
Intel Core Ultra 9 185H
214.4 MB/s
Khadas Mind
Intel Core i7-1360P (AV Pro SD microSD 128 GB V60)
181.79 MB/s -15%
Geekom A5
AMD Ryzen 7 5800H (AV Pro SD microSD 128 GB V60)
176.8 MB/s -18%
Geekom Mini IT13
Intel Core i9-13900H
154.449 MB/s -28%
Geekom Mini IT12
Intel Core i7-1260P (AV Pro SD microSD 128 GB V60)
129.2 MB/s -40%
Average of class Mini PC
  (15.1 - 214, n=26, last 2 years)
97.7 MB/s -54%
Zotac ZBOX Magnus EN173070C
Intel Core i7-11800H (AV Pro SD microSD 128 GB V60)
65 MB/s -70%
maximum AS SSD Seq Read Test (1GB)
Geekom GT1 Mega
Intel Core Ultra 9 185H
220.9 MB/s
Khadas Mind
Intel Core i7-1360P (AV Pro SD microSD 128 GB V60)
200.48 MB/s -9%
Geekom A5
AMD Ryzen 7 5800H (AV Pro SD microSD 128 GB V60)
182.5 MB/s -17%
Geekom Mini IT13
Intel Core i9-13900H
180.4 MB/s -18%
Geekom Mini IT12
Intel Core i7-1260P (AV Pro SD microSD 128 GB V60)
176.8 MB/s -20%
Average of class Mini PC
  (18.2 - 221, n=26, last 2 years)
112.4 MB/s -49%
Zotac ZBOX Magnus EN173070C
Intel Core i7-11800H (AV Pro SD microSD 128 GB V60)
69.9 MB/s -68%
Connectivity - USB 3.x / USB4 / TB - AS SSD Seq Read Test (1GB)
Minisforum MS-A1
Radeon 780M, Ryzen 7 8700G, Kingston OM8PGP41024Q-A0
3245.45 MB/s
Khadas Mind 2
Arc 8-Core, Ultra 7 155H, WD PC SN740 SDDPTQD-1T00
3165.4 MB/s
Average of class Mini PC
  (1611 - 3809, n=7, last 2 years)
2970 MB/s
Geekom GT1 Mega
Arc 8-Core, Ultra 9 185H, Crucial P3 Plus CT2000P3PSSD8
1611.37 MB/s

Komunikacja

Moduł WLAN Intel Wi-Fi 7 BE200

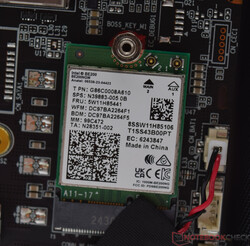
Geekom zainstalował Intel Wi-Fi 7 BE200 w GT1 Mega. Moduł Wi-Fi umożliwia pracę w zakresach częstotliwości 2,4 GHz, 5 GHz i 6 GHz.

Nasze pomiary w tym teście są ograniczone do pasm częstotliwości 5 GHz i 6 GHz. Wyniki są otrzeźwiające w porównaniu do konkurencji. Jak widać z wyników, pasmo częstotliwości 6 GHz powinno być używane zawsze, gdy jest to możliwe, aby osiągnąć najlepszą wydajność.

Testy zostały przeprowadzone w połączeniu z naszym referencyjnym routerem testowym Asus ROG Rapture GT-AXE11000. Wyższe transmisje danych są możliwe za pośrednictwem RJ-45 Ethernet. Geekom zainstalował dwa gniazda LAN, które pozwalają na transfer danych z prędkością do 2,5 GBit/s.

Networking
iperf3 receive AXE11000 6GHz
Acemagic F2A
Intel Wi-Fi 7 BE200 320MHz
1770 (1584min - 1790max) MBit/s +54%
Minisforum UH125 Pro
Intel Wi-Fi 6E AX210
1755 (1737min - 1766max) MBit/s +53%
Asus NUC 14 Pro
Intel Wi-Fi 6E AX211
1729 (1594min - 1755max) MBit/s +50%
Geekom AX8 Pro
MediaTek Wi-Fi 6E MT7922 160MHz Wireless LAN Card
1657 (1619min - 1670max) MBit/s +44%
Geekom GT13 Pro
MediaTek Wi-Fi 6E MT7922 160MHz Wireless LAN Card
1583 (1557min - 1611max) MBit/s +38%
Average Intel Wi-Fi 7 BE200 320MHz
  (1149 - 1770, n=15)
1537 MBit/s +34%
Average of class Mini PC
  (684 - 1771, n=57, last 2 years)
1390 MBit/s +21%
Geekom GT1 Mega
Intel Wi-Fi 7 BE200 320MHz
1149 (666min - 1346max) MBit/s
iperf3 transmit AXE11000 6GHz
Geekom AX8 Pro
MediaTek Wi-Fi 6E MT7922 160MHz Wireless LAN Card
1800 (1737min - 1904max) MBit/s +45%
Acemagic F2A
Intel Wi-Fi 7 BE200 320MHz
1615 (767min - 1670max) MBit/s +30%
Minisforum UH125 Pro
Intel Wi-Fi 6E AX210
1605 (1238min - 1652max) MBit/s +29%
Geekom GT13 Pro
MediaTek Wi-Fi 6E MT7922 160MHz Wireless LAN Card
1429 (1392min - 1511max) MBit/s +15%
Average Intel Wi-Fi 7 BE200 320MHz
  (943 - 1653, n=15)
1390 MBit/s +12%
Asus NUC 14 Pro
Intel Wi-Fi 6E AX211
1379 (1299min - 1425max) MBit/s +11%
Average of class Mini PC
  (394 - 1800, n=57, last 2 years)
1334 MBit/s +7%
Geekom GT1 Mega
Intel Wi-Fi 7 BE200 320MHz
1242 (1110min - 1348max) MBit/s
iperf3 receive AXE11000
Geekom GT13 Pro
MediaTek Wi-Fi 6E MT7922 160MHz Wireless LAN Card
1398 (1261min - 1453max) MBit/s +57%
Asus NUC 14 Pro
Intel Wi-Fi 6E AX211
1379 (1016min - 1613max) MBit/s +55%
Average Intel Wi-Fi 7 BE200 320MHz
  (838 - 1701, n=20)
1358 MBit/s +53%
Geekom AX8 Pro
MediaTek Wi-Fi 6E MT7922 160MHz Wireless LAN Card
979 (962min - 989max) MBit/s +10%
Average of class Mini PC
  (349 - 1796, n=112, last 2 years)
956 MBit/s +8%
Minisforum UH125 Pro
Intel Wi-Fi 6E AX210
936 (907min - 946max) MBit/s +5%
Geekom GT1 Mega
Intel Wi-Fi 7 BE200 320MHz
888 (825min - 926max) MBit/s
Acemagic F2A
Intel Wi-Fi 7 BE200 320MHz
838 (728min - 926max) MBit/s -6%
iperf3 transmit AXE11000
Asus NUC 14 Pro
Intel Wi-Fi 6E AX211
1331 (1187min - 1442max) MBit/s +80%
Average Intel Wi-Fi 7 BE200 320MHz
  (469 - 1642, n=20)
1192 MBit/s +61%
Geekom GT13 Pro
MediaTek Wi-Fi 6E MT7922 160MHz Wireless LAN Card
1146 (846min - 1308max) MBit/s +55%
Geekom AX8 Pro
MediaTek Wi-Fi 6E MT7922 160MHz Wireless LAN Card
966 (921min - 1008max) MBit/s +30%
Average of class Mini PC
  (269 - 1776, n=112, last 2 years)
886 MBit/s +20%
Minisforum UH125 Pro
Intel Wi-Fi 6E AX210
758 (727min - 793max) MBit/s +2%
Geekom GT1 Mega
Intel Wi-Fi 7 BE200 320MHz
741 (690min - 797max) MBit/s
Acemagic F2A
Intel Wi-Fi 7 BE200 320MHz
709 (369min - 977max) MBit/s -4%
0501001502002503003504004505005506006507007508008509009501000105011001150120012501300135014001450150015501600165017001750180018501900Tooltip
Geekom GT1 Mega Intel Wi-Fi 7 BE200 320MHz; iperf3 transmit AXE11000 6GHz; iperf 3.1.3: Ø1242 (1110-1348)
Geekom AX8 Pro MediaTek Wi-Fi 6E MT7922 160MHz Wireless LAN Card; iperf3 transmit AXE11000 6GHz; iperf 3.1.3: Ø1800 (1737-1904)
Geekom GT1 Mega Intel Wi-Fi 7 BE200 320MHz; iperf3 receive AXE11000 6GHz; iperf 3.1.3: Ø1126 (666-1346)
Geekom AX8 Pro MediaTek Wi-Fi 6E MT7922 160MHz Wireless LAN Card; iperf3 receive AXE11000 6GHz; iperf 3.1.3: Ø1656 (1619-1670)
Geekom GT1 Mega Intel Wi-Fi 7 BE200 320MHz; iperf3 receive AXE11000; iperf 3.1.3: Ø887 (825-926)
Geekom AX8 Pro MediaTek Wi-Fi 6E MT7922 160MHz Wireless LAN Card; iperf3 receive AXE11000; iperf 3.1.3: Ø978 (962-989)
Geekom GT1 Mega Intel Wi-Fi 7 BE200 320MHz; iperf3 transmit AXE11000; iperf 3.1.3: Ø741 (690-797)
Geekom AX8 Pro MediaTek Wi-Fi 6E MT7922 160MHz Wireless LAN Card; iperf3 transmit AXE11000; iperf 3.1.3: Ø966 (921-1008)

Akcesoria

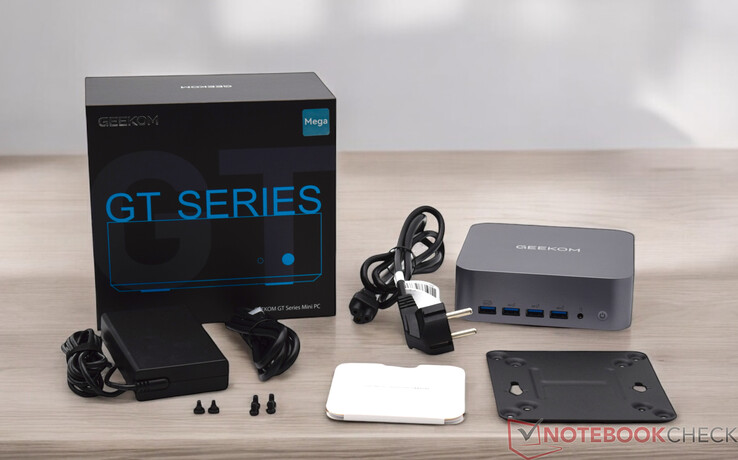
Geekom GT1 Mega jest dostarczany z zasilaczem o mocy 120 W. W standardowym zakresie dostawy znajduje się również kabel HDMI oraz płytka montażowa VESA.

Producent dołącza również instrukcję obsługi, w której opisano m.in. opcje podłączenia oraz instalację pamięci RAM i dysku SSD.

Zakres dostawy Geekom GT1 Mega

Konserwacja

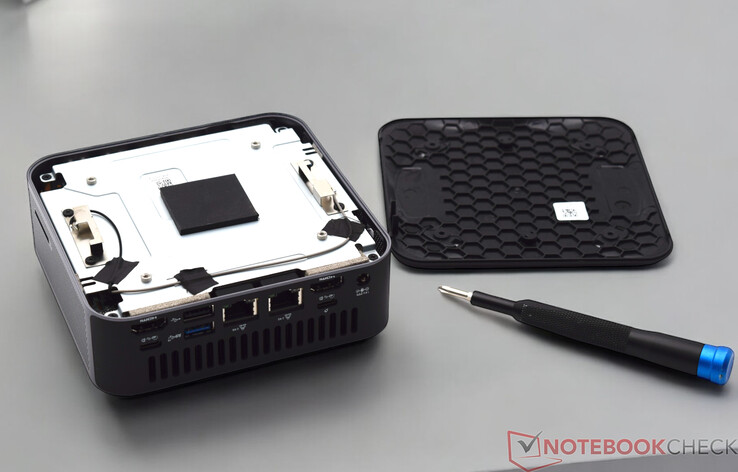
Geekom GT1 Mega jest zawsze sprzedawany w połączeniu z preinstalowaną pamięcią RAM i dyskiem SSD. Oznacza to, że GT1 Mega jest natychmiast gotowy do użycia. Urządzenie można jednak otworzyć przy odrobinie wprawy.

Procedura jest tutaj podobna do Geekom GT13 Pro, chociaż G1 Mega jest tylko nieznacznie większy. Cztery małe śrubki ukryte są pod przyklejonymi gumowymi nóżkami, które należy najpierw odkręcić, aby zdjąć spód. Kolejna metalowa płytka blokuje drogę do zainstalowanych komponentów, które należy najpierw usunąć, aby uzyskać dostęp do pamięci RAM, dysku SSD lub modułu WLAN.

Jeden wolny slot M.2 jest nadal dostępny, co oznacza, że Geekom GT1 Mega można wyposażyć w dwa dyski SSD. Drugie gniazdo M.2 może technicznie pomieścić zarówno dyski SSD NVMe, jak i SATA. Długość dysku SSD jest jednak ograniczona do 42 mm.

Geekom GT1 Mega z otwartym spodem
Śruby znajdują się pod gumowymi nóżkami
Płytka drukowana z jednostką chłodzącą
Płytka drukowana
Geekom GT1 Mega zdemontowany

Zrównoważony rozwój

Geekom GT1 Mega to kompaktowy mini PC, co oznacza, że naprawa w przypadku usterki jest prawie niemożliwa. Niemniej jednak Geekom oferuje 36-miesięczną gwarancję, co odróżnia go od większości innych producentów w tej dziedzinie.

Geekom można pochwalić za kompaktowe opakowanie, które z pewnością ułatwia transport. Jeśli chodzi o zrównoważony rozwój, Geekom reklamuje niższe zużycie energii w porównaniu do konwencjonalnego komputera stacjonarnego. Brakuje jednak szczegółowych informacji na temat wykorzystania w produkcji materiałów pochodzących z recyklingu.

Wydajność: Geekom po raz pierwszy instaluje procesor AI

Po raz pierwszy Geekom zainstalował procesor Intel Core Ultra 9 185Hktóry ze względu na swoją konstrukcję może również szczególnie wydajnie wykonywać specjalne obliczenia AI. Wraz z 32 GB pamięci RAM DDR5 są Państwo wyposażeni do prawie wszystkich zadań. Alternatywny wariant wyposażenia, oparty na Intel Core Ultra 7 155Hzapewnia podobną wydajność i jest wyposażony w te same innowacje.

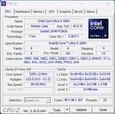
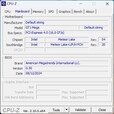
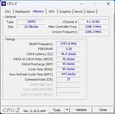
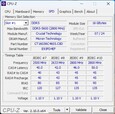
CPU-Z
CPU-Z
CPU-Z
CPU-Z
CPU-Z
CPU-Z
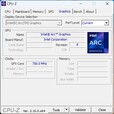
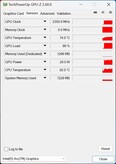
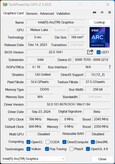
GPU-Z
GPU-Z
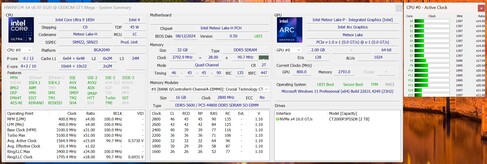
HWiNFO

Warunki testu

Wszystkie testy wydajności przeprowadziliśmy z profilem energetycznym "Wysoka wydajność". Nie zmieniliśmy wydajności procesora Intel Core Ultra 9 185H i pozostawiliśmy go w trybie normalnym zgodnie z ustawieniami BIOS-u.

Odmienne plany oszczędzania energii zostały wykorzystane tylko do pomiarów zużycia energii zgodnie z naszymi Kryteria testu.

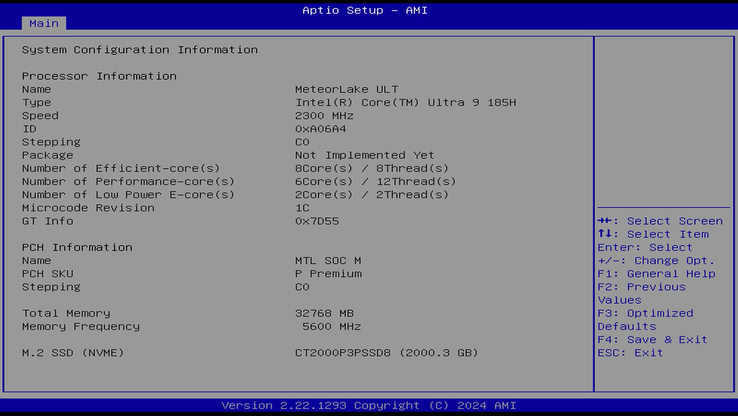
Geekom GT1 Mega - Opcje BIOS-u

Procesor

Najwyższej klasy Geekom GT1 Mega jest zasilany przez Intel Core Ultra 9 185H. 16 rdzeni z łączną liczbą 22 wątków zapewnia wysoką prędkość pracy, co opłaca się przede wszystkim w zadaniach wielowątkowych.

Nasz testowany egzemplarz nie jest jednak garbusem, jeśli chodzi o wydajność pojedynczego rdzenia. GT1 Mega często prowadzi w wynikach benchmarków. Ogólnie rzecz biorąc, nasza próbka testowa zajmuje drugie miejsce w porównaniu. Najtrudniejszym konkurentem jest tutaj Geekom AX8 Pro który testowaliśmy z procesorem AMD Ryzen 9 8945HS.

Jeśli chodzi o zużycie energii, należy wspomnieć, że Geekom obsługuje Intel Core Ultra 9 185H zgodnie ze specyfikacją producenta. Dostarczony profil trybu normalnego jest aktywny w BIOS-ie. Oznacza to, że SoC działa z mocą 45 W pod ciągłym obciążeniem, chociaż w trybie Turbo możliwe jest osiągnięcie nawet 70 W.

Oprócz trybu normalnego, Geekom GT1 Mega może również pracować w trybie cichym lub trybie wydajności. Ma to niewielki wpływ na limity mocy procesora, co również zmienia nieco wydajność. Przeprowadziliśmy kilka testów z różnymi trybami i podsumowaliśmy je w tabeli.

Wyniki pokazują, że nie ma znaczącej przewagi w trybie wydajności. Aby zmniejszyć obciążenie akustyczne, zalecamy tryb cichy. Związana z tym utrata wydajności z pewnością może być tolerowana.

Aby uzyskać więcej porównań i testów porównawczych, proszę zapoznać się z naszą tabelą porównawczą procesorów Mobile Processors - Benchmark List .

Tryb mocy PL1/PL2 w W Cinebench R15 1T Cinebench R15 nT Cinebench R20 1T Cinebench R20 nT Cinebench R23 1T Cinebench R23 nT
tryb cichy 45/50 260 2,430 696 6,403 1,820 16,536
tryb normalny 45/70 262 2,794 696 7,192 1,774 18,608
tryb wydajności 65/70 264 2,800 704 7,213 1,826 18,739

Wyniki Cinebench: Tryb normalny - PL2 70 W; PL1 45 W

Cinebench R15
Cinebench R15
Cinebench R20
Cinebench R20
Cinebench R23
Cinebench R23
Cinebench 2024
Cinebench 2024
Performance Rating - Percent
Geekom AX8 Pro
AMD Ryzen 9 8945H
56.6 pt
Geekom GT1 Mega
Intel Core Ultra 9 185H
56.1 pt
Acemagic F2A
Intel Core Ultra 7 155H
55.3 pt
Geekom GT13 Pro
Intel Core i9-13900H
53.5 pt
Asus NUC 14 Pro
Intel Core Ultra 5 125H
50.9 pt
Minisforum UH125 Pro
Intel Core Ultra 5 125H
50.1 pt
Cinebench 2024
CPU Multi Core
Acemagic F2A
Intel Core Ultra 7 155H
1022 Points +11%
Geekom GT1 Mega
Intel Core Ultra 9 185H
924 Points
Geekom AX8 Pro
AMD Ryzen 9 8945H
852 Points -8%
Asus NUC 14 Pro
Intel Core Ultra 5 125H
815 Points -12%
Minisforum UH125 Pro
Intel Core Ultra 5 125H
814 Points -12%
Geekom GT13 Pro
Intel Core i9-13900H
703 Points -24%
CPU Single Core
Geekom AX8 Pro
AMD Ryzen 9 8945H
107 Points 0%
Geekom GT1 Mega
Intel Core Ultra 9 185H
107 Points
Acemagic F2A
Intel Core Ultra 7 155H
106 Points -1%
Geekom GT13 Pro
Intel Core i9-13900H
104 Points -3%
Asus NUC 14 Pro
Intel Core Ultra 5 125H
102 Points -5%
Minisforum UH125 Pro
Intel Core Ultra 5 125H
97 Points -9%
Cinebench R23
Multi Core
Geekom GT1 Mega
Intel Core Ultra 9 185H
18608 Points
Acemagic F2A
Intel Core Ultra 7 155H
18497 Points -1%
Geekom AX8 Pro
AMD Ryzen 9 8945H
15516 Points -17%
Minisforum UH125 Pro
Intel Core Ultra 5 125H
14564 Points -22%
Asus NUC 14 Pro
Intel Core Ultra 5 125H
14516 Points -22%
Geekom GT13 Pro
Intel Core i9-13900H
13015 Points -30%
Single Core
Geekom AX8 Pro
AMD Ryzen 9 8945H
1808 Points +2%
Geekom GT1 Mega
Intel Core Ultra 9 185H
1774 Points
Acemagic F2A
Intel Core Ultra 7 155H
1771 Points 0%
Asus NUC 14 Pro
Intel Core Ultra 5 125H
1721 Points -3%
Geekom GT13 Pro
Intel Core i9-13900H
1715 Points -3%
Minisforum UH125 Pro
Intel Core Ultra 5 125H
1640 Points -8%
Cinebench R20
CPU (Single Core)
Geekom AX8 Pro
AMD Ryzen 9 8945H
703 Points +1%
Geekom GT1 Mega
Intel Core Ultra 9 185H
696 Points
Acemagic F2A
Intel Core Ultra 7 155H
679 Points -2%
Geekom GT13 Pro
Intel Core i9-13900H
659 Points -5%
Minisforum UH125 Pro
Intel Core Ultra 5 125H
629 Points -10%
Asus NUC 14 Pro
Intel Core Ultra 5 125H
622 Points -11%
CPU (Multi Core)
Geekom GT1 Mega
Intel Core Ultra 9 185H
7192 Points
Acemagic F2A
Intel Core Ultra 7 155H
7188 Points 0%
Geekom AX8 Pro
AMD Ryzen 9 8945H
6153 Points -14%
Minisforum UH125 Pro
Intel Core Ultra 5 125H
5618 Points -22%
Asus NUC 14 Pro
Intel Core Ultra 5 125H
5617 Points -22%
Geekom GT13 Pro
Intel Core i9-13900H
5013 Points -30%
Cinebench R15
CPU Single 64Bit
Geekom AX8 Pro
AMD Ryzen 9 8945H
284 Points +8%
Geekom GT1 Mega
Intel Core Ultra 9 185H
262 Points
Acemagic F2A
Intel Core Ultra 7 155H
258 Points -2%
Asus NUC 14 Pro
Intel Core Ultra 5 125H
248 Points -5%
Geekom GT13 Pro
Intel Core i9-13900H
245 Points -6%
Minisforum UH125 Pro
Intel Core Ultra 5 125H
235 Points -10%
CPU Multi 64Bit
Geekom GT1 Mega
Intel Core Ultra 9 185H
2794 Points
Acemagic F2A
Intel Core Ultra 7 155H
2738 Points -2%
Geekom AX8 Pro
AMD Ryzen 9 8945H
2521 Points -10%
Geekom GT13 Pro
Intel Core i9-13900H
2260 Points -19%
Minisforum UH125 Pro
Intel Core Ultra 5 125H
2245 Points -20%
Asus NUC 14 Pro
Intel Core Ultra 5 125H
2141 Points -23%
Cinebench R11.5
CPU Single 64Bit
Geekom AX8 Pro
AMD Ryzen 9 8945H
3.28 Points +5%
Acemagic F2A
Intel Core Ultra 7 155H
3.13 Points 0%
Geekom GT1 Mega
Intel Core Ultra 9 185H
3.13 Points
Asus NUC 14 Pro
Intel Core Ultra 5 125H
3.03 Points -3%
Geekom GT13 Pro
Intel Core i9-13900H
2.98 Points -5%
Minisforum UH125 Pro
Intel Core Ultra 5 125H
2.86 Points -9%
CPU Multi 64Bit
Geekom GT1 Mega
Intel Core Ultra 9 185H
34.34 Points
Acemagic F2A
Intel Core Ultra 7 155H
33.49 Points -2%
Geekom AX8 Pro
AMD Ryzen 9 8945H
29.14 Points -15%
Geekom GT13 Pro
Intel Core i9-13900H
27.48 Points -20%
Minisforum UH125 Pro
Intel Core Ultra 5 125H
27.02 Points -21%
Asus NUC 14 Pro
Intel Core Ultra 5 125H
26.92 Points -22%
Cinebench R10
Rendering Single CPUs 64Bit
Geekom AX8 Pro
AMD Ryzen 9 8945H
14451 Points +3%
Geekom GT1 Mega
Intel Core Ultra 9 185H
13997 Points
Acemagic F2A
Intel Core Ultra 7 155H
13938 Points 0%
Geekom GT13 Pro
Intel Core i9-13900H
13820 Points -1%
Asus NUC 14 Pro
Intel Core Ultra 5 125H
13281 Points -5%
Minisforum UH125 Pro
Intel Core Ultra 5 125H
12858 Points -8%
Rendering Multiple CPUs 64Bit
Acemagic F2A
Intel Core Ultra 7 155H
95005 Points +4%
Geekom GT1 Mega
Intel Core Ultra 9 185H
91553 Points
Geekom AX8 Pro
AMD Ryzen 9 8945H
84253 Points -8%
Geekom GT13 Pro
Intel Core i9-13900H
79014 Points -14%
Minisforum UH125 Pro
Intel Core Ultra 5 125H
78817 Points -14%
Asus NUC 14 Pro
Intel Core Ultra 5 125H
78788 Points -14%
Blender - v2.79 BMW27 CPU
Geekom GT13 Pro
Intel Core i9-13900H
262 Seconds * -37%
Minisforum UH125 Pro
Intel Core Ultra 5 125H
230 Seconds * -20%
Asus NUC 14 Pro
Intel Core Ultra 5 125H
228 Seconds * -19%
Geekom AX8 Pro
AMD Ryzen 9 8945H
206 Seconds * -8%
Geekom GT1 Mega
Intel Core Ultra 9 185H
191 Seconds *
Acemagic F2A
Intel Core Ultra 7 155H
178 Seconds * +7%
wPrime 2.10
32m
Minisforum UH125 Pro
Intel Core Ultra 5 125H
4.48 s * -37%
Asus NUC 14 Pro
Intel Core Ultra 5 125H
4.107 s * -26%
Acemagic F2A
Intel Core Ultra 7 155H
3.523 s * -8%
Geekom GT13 Pro
Intel Core i9-13900H
3.518 s * -8%
Geekom GT1 Mega
Intel Core Ultra 9 185H
3.271 s *
Geekom AX8 Pro
AMD Ryzen 9 8945H
2.688 s * +18%
1024m
Geekom GT13 Pro
Intel Core i9-13900H
412.775 s * -150%
Minisforum UH125 Pro
Intel Core Ultra 5 125H
246.982 s * -50%
Geekom GT1 Mega
Intel Core Ultra 9 185H
165.075 s *
Asus NUC 14 Pro
Intel Core Ultra 5 125H
148.994 s * +10%
Acemagic F2A
Intel Core Ultra 7 155H
139.617 s * +15%
Geekom AX8 Pro
AMD Ryzen 9 8945H
74.917 s * +55%
X264 HD Benchmark 4.0
Pass 1
Geekom GT1 Mega
Intel Core Ultra 9 185H
336.5 (329min - 346max) fps
Acemagic F2A
Intel Core Ultra 7 155H
325 (323min - 328max) fps -3%
Asus NUC 14 Pro
Intel Core Ultra 5 125H
308.5 (306min - 311max) fps -8%
Minisforum UH125 Pro
Intel Core Ultra 5 125H
304.5 (304min - 306max) fps -10%
Geekom GT13 Pro
Intel Core i9-13900H
300.5 (288min - 319max) fps -11%
Geekom AX8 Pro
AMD Ryzen 9 8945H
300 (299min - 301max) fps -11%
Pass 2
Geekom GT1 Mega
Intel Core Ultra 9 185H
161.5 (159.8min - 163.8max) fps
Acemagic F2A
Intel Core Ultra 7 155H
154.15 (153.8min - 154.3max) fps -5%
Geekom AX8 Pro
AMD Ryzen 9 8945H
141.2 (141min - 143.9max) fps -13%
Minisforum UH125 Pro
Intel Core Ultra 5 125H
134 (133.7min - 134.5max) fps -17%
Asus NUC 14 Pro
Intel Core Ultra 5 125H
132.3 (129.2min - 135max) fps -18%
Geekom GT13 Pro
Intel Core i9-13900H
113.95 (106.5min - 136.6max) fps -29%
WinRAR - Result
Geekom GT1 Mega
Intel Core Ultra 9 185H
8563 KB/s
Geekom AX8 Pro
AMD Ryzen 9 8945H
7744 KB/s -10%
Acemagic F2A
Intel Core Ultra 7 155H
7723 KB/s -10%
Geekom GT13 Pro
Intel Core i9-13900H
6800 KB/s -21%
Asus NUC 14 Pro
Intel Core Ultra 5 125H
6315 KB/s -26%
Minisforum UH125 Pro
Intel Core Ultra 5 125H
5594 KB/s -35%
TrueCrypt
AES Mean 100MB
Geekom AX8 Pro
AMD Ryzen 9 8945H
14.5 GB/s +32%
Geekom GT13 Pro
Intel Core i9-13900H
13.2 GB/s +20%
Geekom GT1 Mega
Intel Core Ultra 9 185H
11 GB/s
Acemagic F2A
Intel Core Ultra 7 155H
10.6 GB/s -4%
Minisforum UH125 Pro
Intel Core Ultra 5 125H
9 GB/s -18%
Asus NUC 14 Pro
Intel Core Ultra 5 125H
8.8 GB/s -20%
Twofish Mean 100MB
Geekom GT13 Pro
Intel Core i9-13900H
2.4 GB/s +26%
Geekom AX8 Pro
AMD Ryzen 9 8945H
2.1 GB/s +11%
Geekom GT1 Mega
Intel Core Ultra 9 185H
1.9 GB/s
Acemagic F2A
Intel Core Ultra 7 155H
1.7 GB/s -11%
Minisforum UH125 Pro
Intel Core Ultra 5 125H
1.4 GB/s -26%
Asus NUC 14 Pro
Intel Core Ultra 5 125H
1.4 GB/s -26%
Serpent Mean 100MB
Geekom AX8 Pro
AMD Ryzen 9 8945H
1.3 GB/s +18%
Geekom GT13 Pro
Intel Core i9-13900H
1.2 GB/s +9%
Geekom GT1 Mega
Intel Core Ultra 9 185H
1.1 GB/s
Acemagic F2A
Intel Core Ultra 7 155H
1 GB/s -9%
Asus NUC 14 Pro
Intel Core Ultra 5 125H
0.869 GB/s -21%
Minisforum UH125 Pro
Intel Core Ultra 5 125H
0.854 GB/s -22%
Geekbench 5.5
Multi-Core
Geekom GT1 Mega
Intel Core Ultra 9 185H
13763 Points
Acemagic F2A
Intel Core Ultra 7 155H
12662 Points -8%
Geekom AX8 Pro
AMD Ryzen 9 8945H
11980 Points -13%
Geekom GT13 Pro
Intel Core i9-13900H
11283 Points -18%
Asus NUC 14 Pro
Intel Core Ultra 5 125H
10856 Points -21%
Minisforum UH125 Pro
Intel Core Ultra 5 125H
10788 Points -22%
Single-Core
Geekom AX8 Pro
AMD Ryzen 9 8945H
1994 Points +8%
Geekom GT1 Mega
Intel Core Ultra 9 185H
1852 Points
Geekom GT13 Pro
Intel Core i9-13900H
1841 Points -1%
Acemagic F2A
Intel Core Ultra 7 155H
1746 Points -6%
Asus NUC 14 Pro
Intel Core Ultra 5 125H
1685 Points -9%
Minisforum UH125 Pro
Intel Core Ultra 5 125H
1593 Points -14%
Geekbench 5.0
5.0 Multi-Core
Geekom GT1 Mega
Intel Core Ultra 9 185H
13822 Points
Acemagic F2A
Intel Core Ultra 7 155H
12438 Points -10%
Geekom AX8 Pro
AMD Ryzen 9 8945H
11804 Points -15%
Geekom GT13 Pro
Intel Core i9-13900H
11168 Points -19%
Asus NUC 14 Pro
Intel Core Ultra 5 125H
10747 Points -22%
Minisforum UH125 Pro
Intel Core Ultra 5 125H
10676 Points -23%
5.0 Single-Core
Geekom AX8 Pro
AMD Ryzen 9 8945H
1907 Points +6%
Geekom GT13 Pro
Intel Core i9-13900H
1810 Points +1%
Geekom GT1 Mega
Intel Core Ultra 9 185H
1797 Points
Acemagic F2A
Intel Core Ultra 7 155H
1708 Points -5%
Asus NUC 14 Pro
Intel Core Ultra 5 125H
1659 Points -8%
Minisforum UH125 Pro
Intel Core Ultra 5 125H
1596 Points -11%
Geekbench 4.4
64 Bit Single-Core Score
Geekom AX8 Pro
AMD Ryzen 9 8945H
8140 Points +8%
Geekom GT13 Pro
Intel Core i9-13900H
7787 Points +4%
Geekom GT1 Mega
Intel Core Ultra 9 185H
7516 Points
Asus NUC 14 Pro
Intel Core Ultra 5 125H
6964 Points -7%
Acemagic F2A
Intel Core Ultra 7 155H
6927 Points -8%
Minisforum UH125 Pro
Intel Core Ultra 5 125H
6734 Points -10%
64 Bit Multi-Core Score
Geekom GT1 Mega
Intel Core Ultra 9 185H
49924 Points
Geekom AX8 Pro
AMD Ryzen 9 8945H
47917 Points -4%
Acemagic F2A
Intel Core Ultra 7 155H
45250 Points -9%
Geekom GT13 Pro
Intel Core i9-13900H
41851 Points -16%
Asus NUC 14 Pro
Intel Core Ultra 5 125H
38793 Points -22%
Minisforum UH125 Pro
Intel Core Ultra 5 125H
38648 Points -23%
3DMark 11 - 1280x720 Performance Physics
Geekom AX8 Pro
AMD Ryzen 9 8945H
22340 Points +23%
Acemagic F2A
Intel Core Ultra 7 155H
20846 Points +15%
Geekom GT13 Pro
Intel Core i9-13900H
18383 Points +1%
Geekom GT1 Mega
Intel Core Ultra 9 185H
18130 Points
Asus NUC 14 Pro
Intel Core Ultra 5 125H
17624 Points -3%
Minisforum UH125 Pro
Intel Core Ultra 5 125H
17138 Points -5%
7-Zip 18.03
7z b 4
Geekom GT1 Mega
Intel Core Ultra 9 185H
71050 MIPS
Geekom AX8 Pro
AMD Ryzen 9 8945H
66557 MIPS -6%
Acemagic F2A
Intel Core Ultra 7 155H
66438 MIPS -6%
Geekom GT13 Pro
Intel Core i9-13900H
52479 MIPS -26%
Minisforum UH125 Pro
Intel Core Ultra 5 125H
0 MIPS -100%
Asus NUC 14 Pro
Intel Core Ultra 5 125H
0 MIPS -100%
7z b 4 -mmt1
Geekom AX8 Pro
AMD Ryzen 9 8945H
6691 MIPS +18%
Geekom GT13 Pro
Intel Core i9-13900H
6321 MIPS +12%
Geekom GT1 Mega
Intel Core Ultra 9 185H
5657 MIPS
Acemagic F2A
Intel Core Ultra 7 155H
5485 MIPS -3%
Asus NUC 14 Pro
Intel Core Ultra 5 125H
5136 MIPS -9%
Minisforum UH125 Pro
Intel Core Ultra 5 125H
4699 MIPS -17%
HWBOT x265 Benchmark v2.2 - 4k Preset
Geekom AX8 Pro
AMD Ryzen 9 8945H
20.6 fps +2%
Geekom GT1 Mega
Intel Core Ultra 9 185H
20.2 fps
Acemagic F2A
Intel Core Ultra 7 155H
19.6 fps -3%
Minisforum UH125 Pro
Intel Core Ultra 5 125H
16.7 fps -17%
Asus NUC 14 Pro
Intel Core Ultra 5 125H
15.7 fps -22%
Geekom GT13 Pro
Intel Core i9-13900H
14.1 fps -30%
R Benchmark 2.5 - Overall mean
Minisforum UH125 Pro
Intel Core Ultra 5 125H
0.513 sec * -12%
Asus NUC 14 Pro
Intel Core Ultra 5 125H
0.4982 sec * -9%
Acemagic F2A
Intel Core Ultra 7 155H
0.4652 sec * -2%
Geekom AX8 Pro
AMD Ryzen 9 8945H
0.4576 sec * -0%
Geekom GT1 Mega
Intel Core Ultra 9 185H
0.4571 sec *
Geekom GT13 Pro
Intel Core i9-13900H
0.4395 sec * +4%
LibreOffice - 20 Documents To PDF
Minisforum UH125 Pro
Intel Core Ultra 5 125H
70.9 s * -36%
Asus NUC 14 Pro
Intel Core Ultra 5 125H
55.7 s * -7%
Geekom GT1 Mega
Intel Core Ultra 9 185H
52.1 s *
Geekom AX8 Pro
AMD Ryzen 9 8945H
49.8 s * +4%
Acemagic F2A
Intel Core Ultra 7 155H
44.5 s * +15%
Geekom GT13 Pro
Intel Core i9-13900H
39.4 s * +24%
WebXPRT 3 - Overall
Geekom AX8 Pro
AMD Ryzen 9 8945H
309 Points +8%
Geekom GT13 Pro
Intel Core i9-13900H
304 Points +6%
Geekom GT1 Mega
Intel Core Ultra 9 185H
286 Points
Acemagic F2A
Intel Core Ultra 7 155H
276 Points -3%
Minisforum UH125 Pro
Intel Core Ultra 5 125H
254 Points -11%
Asus NUC 14 Pro
Intel Core Ultra 5 125H
254 Points -11%
Mozilla Kraken 1.1 - Total
Minisforum UH125 Pro
Intel Core Ultra 5 125H
595 ms * -15%
Asus NUC 14 Pro
Intel Core Ultra 5 125H
567 ms * -9%
Acemagic F2A
Intel Core Ultra 7 155H
535 ms * -3%
Geekom GT1 Mega
Intel Core Ultra 9 185H
518 ms *
Geekom GT13 Pro
Intel Core i9-13900H
517 ms * -0%
Geekom AX8 Pro
AMD Ryzen 9 8945H
506 ms * +2%
3DMark
1920x1080 Fire Strike Physics
Geekom AX8 Pro
AMD Ryzen 9 8945H
27363 Points +12%
Acemagic F2A
Intel Core Ultra 7 155H
25043 Points +3%
Geekom GT1 Mega
Intel Core Ultra 9 185H
24366 Points
Geekom GT13 Pro
Intel Core i9-13900H
23626 Points -3%
Asus NUC 14 Pro
Intel Core Ultra 5 125H
22863 Points -6%
Minisforum UH125 Pro
Intel Core Ultra 5 125H
21391 Points -12%
2560x1440 Time Spy CPU
Geekom AX8 Pro
AMD Ryzen 9 8945H
10844 Points +12%
Acemagic F2A
Intel Core Ultra 7 155H
10014 Points +3%
Geekom GT1 Mega
Intel Core Ultra 9 185H
9687 Points
Geekom GT13 Pro
Intel Core i9-13900H
9347 Points -4%
Minisforum UH125 Pro
Intel Core Ultra 5 125H
9182 Points -5%
Asus NUC 14 Pro
Intel Core Ultra 5 125H
8719 Points -10%
Super Pi mod 1.5 XS 1M - 1M
Minisforum UH125 Pro
Intel Core Ultra 5 125H
7.744 s * -15%
Geekom GT13 Pro
Intel Core i9-13900H
7.445 s * -10%
Asus NUC 14 Pro
Intel Core Ultra 5 125H
7.444 s * -10%
Acemagic F2A
Intel Core Ultra 7 155H
7.168 s * -6%
Geekom AX8 Pro
AMD Ryzen 9 8945H
6.962 s * -3%
Geekom GT1 Mega
Intel Core Ultra 9 185H
6.762 s *
Super Pi mod 1.5 XS 2M - 2M
Geekom AX8 Pro
AMD Ryzen 9 8945H
17.404 s * -17%
Minisforum UH125 Pro
Intel Core Ultra 5 125H
16.967 s * -14%
Asus NUC 14 Pro
Intel Core Ultra 5 125H
16.446 s * -10%
Geekom GT13 Pro
Intel Core i9-13900H
16.234 s * -9%
Acemagic F2A
Intel Core Ultra 7 155H
16.125 s * -8%
Geekom GT1 Mega
Intel Core Ultra 9 185H
14.928 s *
Super Pi Mod 1.5 XS 32M - 32M
Geekom AX8 Pro
AMD Ryzen 9 8945H
644.49 s * -76%
Minisforum UH125 Pro
Intel Core Ultra 5 125H
423.565 s * -15%
Geekom GT13 Pro
Intel Core i9-13900H
417.103 s * -14%
Acemagic F2A
Intel Core Ultra 7 155H
394.754 s * -8%
Asus NUC 14 Pro
Intel Core Ultra 5 125H
394.697 s * -8%
Geekom GT1 Mega
Intel Core Ultra 9 185H
366.851 s *
Affinity Photo 2 - Combined (Multi CPU)
Geekom GT1 Mega
Intel Core Ultra 9 185H
792 Points
Acemagic F2A
Intel Core Ultra 7 155H
770 Points -3%
Minisforum UH125 Pro
Intel Core Ultra 5 125H
615 Points -22%
Geekom AX8 Pro
AMD Ryzen 9 8945H
603 Points -24%
Asus NUC 14 Pro
Intel Core Ultra 5 125H
594 Points -25%
Geekom GT13 Pro
Intel Core i9-13900H
547 Points -31%

* ... im mniej tym lepiej

Cinebench R10 Rendering Single 32Bit
9719
Cinebench R10 Shading 64Bit
21485 Points
Cinebench R10 Rendering Multiple CPUs 64Bit
91553 Points
Cinebench R10 Rendering Single CPUs 64Bit
13997 Points
Cinebench R10 Shading 32Bit
19892
Cinebench R10 Rendering Multiple CPUs 32Bit
61959
Cinebench R11.5 CPU Single 32Bit
2.74 Points
Cinebench R11.5 CPU Multi 32Bit
30.5 Points
Cinebench R11.5 OpenGL 32Bit
111.51 fps
Cinebench R11.5 CPU Single 64Bit
3.13 Points
Cinebench R11.5 CPU Multi 64Bit
34.34 Points
Cinebench R11.5 OpenGL 64Bit
111.5 fps
Cinebench R15 CPU Single 64Bit
262 Points
Cinebench R15 CPU Multi 64Bit
2794 Points
Cinebench R15 Ref. Match 64Bit
97.8 %
Cinebench R15 OpenGL 64Bit
163.41 fps
Cinebench R20 CPU (Single Core)
696 Points
Cinebench R20 CPU (Multi Core)
7192 Points
Cinebench R23 Multi Core
18608 Points
Cinebench R23 Single Core
1774 Points
Cinebench 2024 CPU Single Core
107 Points
Cinebench 2024 CPU Multi Core
924 Points
Pomoc
Performance Rating
Geekom AX8 Pro
AMD Ryzen 9 8945H, Radeon 780M
96.7 pt
Acemagic F2A
Intel Core Ultra 7 155H, Arc 8-Core
80.2 pt
Geekom GT1 Mega
Intel Core Ultra 9 185H, Arc 8-Core
77.3 pt
Minisforum UH125 Pro
Intel Core Ultra 5 125H, Arc 7-Core
65.3 pt
Asus NUC 14 Pro
Intel Core Ultra 5 125H, Arc 7-Core
64.5 pt
Average of class Mini PC
 
59.2 pt
Geekom GT13 Pro
Intel Core i9-13900H, Iris Xe G7 96EUs
58.5 pt
AIDA64 / FP32 Ray-Trace
Geekom AX8 Pro
AMD Ryzen 9 8945H, Radeon 780M
24531 KRay/s +62%
Acemagic F2A
Intel Core Ultra 7 155H, Arc 8-Core
17544 KRay/s +16%
Geekom GT1 Mega
Intel Core Ultra 9 185H, Arc 8-Core
15184 KRay/s
Minisforum UH125 Pro
Intel Core Ultra 5 125H, Arc 7-Core
13639 KRay/s -10%
Asus NUC 14 Pro
Intel Core Ultra 5 125H, Arc 7-Core
13347 KRay/s -12%
Average of class Mini PC
  (646 - 51004, n=119, last 2 years)
12898 KRay/s -15%
Geekom GT13 Pro
Intel Core i9-13900H, Iris Xe G7 96EUs
11735 KRay/s -23%
AIDA64 / FPU Julia
Geekom AX8 Pro
AMD Ryzen 9 8945H, Radeon 780M
106518 Points +36%
Acemagic F2A
Intel Core Ultra 7 155H, Arc 8-Core
88829 Points +13%
Geekom GT1 Mega
Intel Core Ultra 9 185H, Arc 8-Core
78346 Points
Minisforum UH125 Pro
Intel Core Ultra 5 125H, Arc 7-Core
70880 Points -10%
Asus NUC 14 Pro
Intel Core Ultra 5 125H, Arc 7-Core
68551 Points -13%
Average of class Mini PC
  (3857 - 214250, n=119, last 2 years)
65003 Points -17%
Geekom GT13 Pro
Intel Core i9-13900H, Iris Xe G7 96EUs
59094 Points -25%
AIDA64 / CPU SHA3
Geekom AX8 Pro
AMD Ryzen 9 8945H, Radeon 780M
4684 MB/s +25%
Acemagic F2A
Intel Core Ultra 7 155H, Arc 8-Core
4246 MB/s +13%
Geekom GT1 Mega
Intel Core Ultra 9 185H, Arc 8-Core
3753 MB/s
Minisforum UH125 Pro
Intel Core Ultra 5 125H, Arc 7-Core
3404 MB/s -9%
Asus NUC 14 Pro
Intel Core Ultra 5 125H, Arc 7-Core
3323 MB/s -11%
Average of class Mini PC
  (260 - 9399, n=119, last 2 years)
2863 MB/s -24%
Geekom GT13 Pro
Intel Core i9-13900H, Iris Xe G7 96EUs
2718 MB/s -28%
AIDA64 / CPU Queen
Geekom AX8 Pro
AMD Ryzen 9 8945H, Radeon 780M
114586 Points +32%
Geekom GT13 Pro
Intel Core i9-13900H, Iris Xe G7 96EUs
93952 Points +8%
Acemagic F2A
Intel Core Ultra 7 155H, Arc 8-Core
89748 Points +3%
Geekom GT1 Mega
Intel Core Ultra 9 185H, Arc 8-Core
86969 Points
Average of class Mini PC
  (8172 - 184747, n=119, last 2 years)
80179 Points -8%
Asus NUC 14 Pro
Intel Core Ultra 5 125H, Arc 7-Core
79866 Points -8%
Minisforum UH125 Pro
Intel Core Ultra 5 125H, Arc 7-Core
78098 Points -10%
AIDA64 / FPU SinJulia
Geekom AX8 Pro
AMD Ryzen 9 8945H, Radeon 780M
14631 Points +42%
Geekom GT1 Mega
Intel Core Ultra 9 185H, Arc 8-Core
10289 Points
Acemagic F2A
Intel Core Ultra 7 155H, Arc 8-Core
10247 Points 0%
Average of class Mini PC
  (408 - 29064, n=119, last 2 years)
8787 Points -15%
Geekom GT13 Pro
Intel Core i9-13900H, Iris Xe G7 96EUs
8026 Points -22%
Asus NUC 14 Pro
Intel Core Ultra 5 125H, Arc 7-Core
7851 Points -24%
Minisforum UH125 Pro
Intel Core Ultra 5 125H, Arc 7-Core
7842 Points -24%
AIDA64 / FPU Mandel
Geekom AX8 Pro
AMD Ryzen 9 8945H, Radeon 780M
56505 Points +45%
Acemagic F2A
Intel Core Ultra 7 155H, Arc 8-Core
45718 Points +17%
Geekom GT1 Mega
Intel Core Ultra 9 185H, Arc 8-Core
38945 Points
Minisforum UH125 Pro
Intel Core Ultra 5 125H, Arc 7-Core
35321 Points -9%
Asus NUC 14 Pro
Intel Core Ultra 5 125H, Arc 7-Core
34225 Points -12%
Average of class Mini PC
  (1987 - 113499, n=119, last 2 years)
33896 Points -13%
Geekom GT13 Pro
Intel Core i9-13900H, Iris Xe G7 96EUs
29138 Points -25%
AIDA64 / CPU AES
Geekom AX8 Pro
AMD Ryzen 9 8945H, Radeon 780M
163032 MB/s +18%
Acemagic F2A
Intel Core Ultra 7 155H, Arc 8-Core
144741 MB/s +5%
Geekom GT1 Mega
Intel Core Ultra 9 185H, Arc 8-Core
138481 MB/s
Geekom GT13 Pro
Intel Core i9-13900H, Iris Xe G7 96EUs
102677 MB/s -26%
Average of class Mini PC
  (3691 - 325960, n=119, last 2 years)
88279 MB/s -36%
Minisforum UH125 Pro
Intel Core Ultra 5 125H, Arc 7-Core
65304 MB/s -53%
Asus NUC 14 Pro
Intel Core Ultra 5 125H, Arc 7-Core
64107 MB/s -54%
AIDA64 / CPU ZLib
Acemagic F2A
Intel Core Ultra 7 155H, Arc 8-Core
1183 MB/s 0%
Geekom GT1 Mega
Intel Core Ultra 9 185H, Arc 8-Core
1181 MB/s
Minisforum UH125 Pro
Intel Core Ultra 5 125H, Arc 7-Core
994 MB/s -16%
Geekom AX8 Pro
AMD Ryzen 9 8945H, Radeon 780M
976 MB/s -17%
Asus NUC 14 Pro
Intel Core Ultra 5 125H, Arc 7-Core
969 MB/s -18%
Geekom GT13 Pro
Intel Core i9-13900H, Iris Xe G7 96EUs
789 MB/s -33%
Average of class Mini PC
  (74.9 - 2039, n=119, last 2 years)
741 MB/s -37%
AIDA64 / FP64 Ray-Trace
Geekom AX8 Pro
AMD Ryzen 9 8945H, Radeon 780M
13609 KRay/s +72%
Acemagic F2A
Intel Core Ultra 7 155H, Arc 8-Core
9284 KRay/s +17%
Geekom GT1 Mega
Intel Core Ultra 9 185H, Arc 8-Core
7925 KRay/s
Minisforum UH125 Pro
Intel Core Ultra 5 125H, Arc 7-Core
7221 KRay/s -9%
Average of class Mini PC
  (350 - 26952, n=119, last 2 years)
6891 KRay/s -13%
Asus NUC 14 Pro
Intel Core Ultra 5 125H, Arc 7-Core
6786 KRay/s -14%
Geekom GT13 Pro
Intel Core i9-13900H, Iris Xe G7 96EUs
6205 KRay/s -22%
AIDA64 / CPU PhotoWorxx
Asus NUC 14 Pro
Intel Core Ultra 5 125H, Arc 7-Core
47377 MPixel/s +1%
Geekom GT1 Mega
Intel Core Ultra 9 185H, Arc 8-Core
47032 MPixel/s
Minisforum UH125 Pro
Intel Core Ultra 5 125H, Arc 7-Core
45789 MPixel/s -3%
Geekom AX8 Pro
AMD Ryzen 9 8945H, Radeon 780M
40114 MPixel/s -15%
Acemagic F2A
Intel Core Ultra 7 155H, Arc 8-Core
33092 MPixel/s -30%
Average of class Mini PC
  (4408 - 50500, n=119, last 2 years)
28369 MPixel/s -40%
Geekom GT13 Pro
Intel Core i9-13900H, Iris Xe G7 96EUs
28269 MPixel/s -40%

Wielordzeniowa pętla Cinebench R15

Spojrzenie na wielordzeniową pętlę ciągłą Cinebench R15 pokazuje, że poszczególne wyniki są nieco gorsze krótko po starcie. W porównaniu wydajności nadal wystarcza to na stabilne drugie miejsce.

Tylko Acemagic F2A osiąga konsekwentnie wyższą wydajność. The Geekom AX8 Pro nie jest w stanie utrzymać wysokiej wydajności procesora, dlatego też traci zauważalnie więcej wydajności przy długotrwałym obciążeniu i ześlizguje się do środkowego pola.

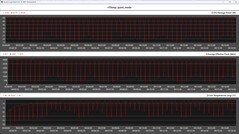
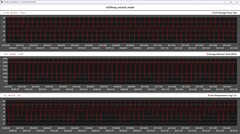
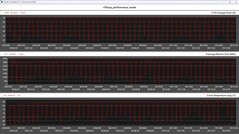
Z danych telemetrycznych ciągłej pętli Cinebench R15, którą uruchomiliśmy raz ze wszystkimi trybami wydajności, widać, że procesor osiąga ustalone limity wydajności.

Metryki procesora podczas pętli Cinebench R15 (tryb cichy)
Metryki procesora podczas pętli Cinebench R15 (tryb normalny)
Metryki procesora podczas pętli Cinebench R15 (tryb wydajności)
01452904355807258701015116013051450159517401885203021752320246526102755Tooltip
Geekom GT1 Mega Intel Core Ultra 9 185H, Intel Core Ultra 9 185H: Ø2442 (2286.63-2795.05)
Geekom AX8 Pro AMD Ryzen 9 8945H, AMD Ryzen 9 8945H: Ø2223 (2100.4-2438.43)
Asus NUC 14 Pro Intel Core Ultra 5 125H, Intel Core Ultra 5 125H: Ø2021 (1900.15-2203.13)
Minisforum UH125 Pro Intel Core Ultra 5 125H, Intel Core Ultra 5 125H: Ø2186 (2040.4-2248.33)
Geekom GT13 Pro Intel Core i9-13900H, Intel Core i9-13900H: Ø1776 (1688.48-2326.12)
Acemagic F2A Intel Core Ultra 7 155H, Intel Core Ultra 7 155H: Ø2759 (2690.7-2800.92)

Wydajność systemu

Geekom GT1 Mega wypada znakomicie w testach systemowych. Z jednym wyjątkiem, nasza próbka testowa zawsze była w stanie zapewnić sobie pierwsze miejsce. Odzwierciedla to również nasze subiektywne postrzeganie wydajności podczas okresu testowego.

Nie było żadnych problemów pod względem wydajności, a nawet instalacja kilku aplikacji jednocześnie nie stanowiła dla mini PC zadania niemożliwego do wykonania. Dzięki dużej ilości pamięci RAM, możliwe jest również jednoczesne zarządzanie wieloma kartami przeglądarki.

PCMark 10 / Score
Geekom AX8 Pro, AMD Ryzen 9 8945H
AMD Radeon 780M, Acer N7000
7553 Points +4%
Geekom GT1 Mega, Intel Core Ultra 9 185H
Intel Arc 8-Core iGPU, Crucial P3 Plus CT2000P3PSSD8
7232 Points
Acemagic F2A, Intel Core Ultra 7 155H
Intel Arc 8-Core iGPU, Kingston OM8SEP1024Q-A0
7120 Points -2%
Asus NUC 14 Pro, Intel Core Ultra 5 125H
Intel Arc 7-Core iGPU, Kingston KC3000 2048G SKC3000D2048G
6282 Points -13%
Minisforum UH125 Pro, Intel Core Ultra 5 125H
Intel Arc 7-Core iGPU, Kingston OM8PGP41024Q-A0
6194 Points -14%
Geekom GT13 Pro, Intel Core i9-13900H
Intel Iris Xe Graphics G7 96EUs, Acer N7000
5944 Points -18%
PCMark 10 / Essentials
Geekom AX8 Pro, AMD Ryzen 9 8945H
AMD Radeon 780M, Acer N7000
11227 Points +4%
Acemagic F2A, Intel Core Ultra 7 155H
Intel Arc 8-Core iGPU, Kingston OM8SEP1024Q-A0
11125 Points +3%
Geekom GT1 Mega, Intel Core Ultra 9 185H
Intel Arc 8-Core iGPU, Crucial P3 Plus CT2000P3PSSD8
10824 Points
Geekom GT13 Pro, Intel Core i9-13900H
Intel Iris Xe Graphics G7 96EUs, Acer N7000
10347 Points -4%
Asus NUC 14 Pro, Intel Core Ultra 5 125H
Intel Arc 7-Core iGPU, Kingston KC3000 2048G SKC3000D2048G
10050 Points -7%
Minisforum UH125 Pro, Intel Core Ultra 5 125H
Intel Arc 7-Core iGPU, Kingston OM8PGP41024Q-A0
9427 Points -13%
PCMark 10 / Productivity
Geekom AX8 Pro, AMD Ryzen 9 8945H
AMD Radeon 780M, Acer N7000
10774 Points +22%
Acemagic F2A, Intel Core Ultra 7 155H
Intel Arc 8-Core iGPU, Kingston OM8SEP1024Q-A0
8901 Points +1%
Geekom GT1 Mega, Intel Core Ultra 9 185H
Intel Arc 8-Core iGPU, Crucial P3 Plus CT2000P3PSSD8
8797 Points
Minisforum UH125 Pro, Intel Core Ultra 5 125H
Intel Arc 7-Core iGPU, Kingston OM8PGP41024Q-A0
7715 Points -12%
Geekom GT13 Pro, Intel Core i9-13900H
Intel Iris Xe Graphics G7 96EUs, Acer N7000
7319 Points -17%
Asus NUC 14 Pro, Intel Core Ultra 5 125H
Intel Arc 7-Core iGPU, Kingston KC3000 2048G SKC3000D2048G
7042 Points -20%
CrossMark / Overall
Geekom GT1 Mega, Intel Core Ultra 9 185H
Intel Arc 8-Core iGPU, Crucial P3 Plus CT2000P3PSSD8
1888 Points
Geekom AX8 Pro, AMD Ryzen 9 8945H
AMD Radeon 780M, Acer N7000
1865 Points -1%
Acemagic F2A, Intel Core Ultra 7 155H
Intel Arc 8-Core iGPU, Kingston OM8SEP1024Q-A0
1802 Points -5%
Geekom GT13 Pro, Intel Core i9-13900H
Intel Iris Xe Graphics G7 96EUs, Acer N7000
1766 Points -6%
Minisforum UH125 Pro, Intel Core Ultra 5 125H
Intel Arc 7-Core iGPU, Kingston OM8PGP41024Q-A0
1533 Points -19%
Asus NUC 14 Pro, Intel Core Ultra 5 125H
Intel Arc 7-Core iGPU, Kingston KC3000 2048G SKC3000D2048G
1522 Points -19%
CrossMark / Responsiveness
Geekom GT1 Mega, Intel Core Ultra 9 185H
Intel Arc 8-Core iGPU, Crucial P3 Plus CT2000P3PSSD8
1864 Points
Geekom GT13 Pro, Intel Core i9-13900H
Intel Iris Xe Graphics G7 96EUs, Acer N7000
1790 Points -4%
Acemagic F2A, Intel Core Ultra 7 155H
Intel Arc 8-Core iGPU, Kingston OM8SEP1024Q-A0
1700 Points -9%
Geekom AX8 Pro, AMD Ryzen 9 8945H
AMD Radeon 780M, Acer N7000
1583 Points -15%
Minisforum UH125 Pro, Intel Core Ultra 5 125H
Intel Arc 7-Core iGPU, Kingston OM8PGP41024Q-A0
1332 Points -29%
Asus NUC 14 Pro, Intel Core Ultra 5 125H
Intel Arc 7-Core iGPU, Kingston KC3000 2048G SKC3000D2048G
1171 Points -37%
CrossMark / Creativity
Geekom AX8 Pro, AMD Ryzen 9 8945H
AMD Radeon 780M, Acer N7000
2057 Points +5%
Geekom GT1 Mega, Intel Core Ultra 9 185H
Intel Arc 8-Core iGPU, Crucial P3 Plus CT2000P3PSSD8
1959 Points
Acemagic F2A, Intel Core Ultra 7 155H
Intel Arc 8-Core iGPU, Kingston OM8SEP1024Q-A0
1929 Points -2%
Geekom GT13 Pro, Intel Core i9-13900H
Intel Iris Xe Graphics G7 96EUs, Acer N7000
1789 Points -9%
Asus NUC 14 Pro, Intel Core Ultra 5 125H
Intel Arc 7-Core iGPU, Kingston KC3000 2048G SKC3000D2048G
1765 Points -10%
Minisforum UH125 Pro, Intel Core Ultra 5 125H
Intel Arc 7-Core iGPU, Kingston OM8PGP41024Q-A0
1683 Points -14%
CrossMark / Productivity
Geekom GT1 Mega, Intel Core Ultra 9 185H
Intel Arc 8-Core iGPU, Crucial P3 Plus CT2000P3PSSD8
1827 Points
Geekom AX8 Pro, AMD Ryzen 9 8945H
AMD Radeon 780M, Acer N7000
1786 Points -2%
Geekom GT13 Pro, Intel Core i9-13900H
Intel Iris Xe Graphics G7 96EUs, Acer N7000
1736 Points -5%
Acemagic F2A, Intel Core Ultra 7 155H
Intel Arc 8-Core iGPU, Kingston OM8SEP1024Q-A0
1717 Points -6%
Minisforum UH125 Pro, Intel Core Ultra 5 125H
Intel Arc 7-Core iGPU, Kingston OM8PGP41024Q-A0
1463 Points -20%
Asus NUC 14 Pro, Intel Core Ultra 5 125H
Intel Arc 7-Core iGPU, Kingston KC3000 2048G SKC3000D2048G
1432 Points -22%
AIDA64 / Memory Copy
Geekom GT1 Mega
Intel Core Ultra 9 185H, Arc 8-Core
73624 MB/s
Minisforum UH125 Pro
Intel Core Ultra 5 125H, Arc 7-Core
69592 MB/s -5%
Asus NUC 14 Pro
Intel Core Ultra 5 125H, Arc 7-Core
69264 MB/s -6%
Geekom AX8 Pro
AMD Ryzen 9 8945H, Radeon 780M
68924 MB/s -6%
Acemagic F2A
Intel Core Ultra 7 155H, Arc 8-Core
62397 MB/s -15%
Average of class Mini PC
  (6481 - 89287, n=119, last 2 years)
48336 MB/s -34%
Geekom GT13 Pro
Intel Core i9-13900H, Iris Xe G7 96EUs
45721 MB/s -38%
AIDA64 / Memory Read
Geekom GT1 Mega
Intel Core Ultra 9 185H, Arc 8-Core
79371 MB/s
Asus NUC 14 Pro
Intel Core Ultra 5 125H, Arc 7-Core
74415 MB/s -6%
Minisforum UH125 Pro
Intel Core Ultra 5 125H, Arc 7-Core
72711 MB/s -8%
Acemagic F2A
Intel Core Ultra 7 155H, Arc 8-Core
64323 MB/s -19%
Geekom AX8 Pro
AMD Ryzen 9 8945H, Radeon 780M
61624 MB/s -22%
Average of class Mini PC
  (6914 - 99171, n=119, last 2 years)
49222 MB/s -38%
Geekom GT13 Pro
Intel Core i9-13900H, Iris Xe G7 96EUs
45995 MB/s -42%
AIDA64 / Memory Write
Geekom AX8 Pro
AMD Ryzen 9 8945H, Radeon 780M
87138 MB/s +21%
Asus NUC 14 Pro
Intel Core Ultra 5 125H, Arc 7-Core
72443 MB/s 0%
Geekom GT1 Mega
Intel Core Ultra 9 185H, Arc 8-Core
72187 MB/s
Minisforum UH125 Pro
Intel Core Ultra 5 125H, Arc 7-Core
71514 MB/s -1%
Acemagic F2A
Intel Core Ultra 7 155H, Arc 8-Core
65057 MB/s -10%
Average of class Mini PC
  (6862 - 98583, n=119, last 2 years)
52748 MB/s -27%
Geekom GT13 Pro
Intel Core i9-13900H, Iris Xe G7 96EUs
45733 MB/s -37%
AIDA64 / Memory Latency
Minisforum UH125 Pro
Intel Core Ultra 5 125H, Arc 7-Core
184.8 ns * -35%
Acemagic F2A
Intel Core Ultra 7 155H, Arc 8-Core
149 ns * -9%
Geekom GT1 Mega
Intel Core Ultra 9 185H, Arc 8-Core
136.7 ns *
Asus NUC 14 Pro
Intel Core Ultra 5 125H, Arc 7-Core
127.3 ns * +7%
Average of class Mini PC
  (44.9 - 184.8, n=119, last 2 years)
91.5 ns * +33%
Geekom AX8 Pro
AMD Ryzen 9 8945H, Radeon 780M
91.4 ns * +33%
Geekom GT13 Pro
Intel Core i9-13900H, Iris Xe G7 96EUs
75.8 ns * +45%

* ... im mniej tym lepiej

Wydajność NPU

Procesor Intel Core Ultra 9 185H jest wyposażony w jednostkę NPU (Neural Processing Unit), która umożliwia SoC szczególnie wydajne obliczanie aplikacji AI. Aby zilustrować porównanie wydajności, korzystamy z testu UL Procyon AI Interface Benchmark.

Wszystkie porównywane urządzenia bazują na procesorach Intel Meteor Lake, co oznacza, że wszystkie wykorzystują tę samą jednostkę NPU. Różnica pomiędzy poszczególnymi konkurentami jest bardzo niewielka. Geekom GT1 Mega wychodzi na prowadzenie z niewielkim marginesem.

UL Procyon for Windows / Overall Score Integer NPU
Geekom GT1 Mega
Intel Core Ultra 9 185H, Arc 8-Core
529 Points
Asus NUC 14 Pro
Intel Core Ultra 5 125H, Arc 7-Core
508 Points -4%
Khadas Mind 2
Intel Core Ultra 7 155H, Arc 8-Core
504 Points -5%
Minisforum UH125 Pro
Intel Core Ultra 5 125H, Arc 7-Core
501 Points -5%
Acemagic F2A
Intel Core Ultra 7 155H, Arc 8-Core
499 Points -6%
UL Procyon for Windows / Overall Score Integer GPU
Acer Predator BiFrost Arc A770 OC, 16GB GDDR6
AMD Ryzen 9 7950X, Arc A770
1500 Points +87%
Acer Predator BiFrost Arc A750 OC
AMD Ryzen 9 7950X, Arc A750
1433 Points +79%
Geekom GT1 Mega
Intel Core Ultra 9 185H, Arc 8-Core
801 Points
Asus NUC 14 Pro
Intel Core Ultra 5 125H, Arc 7-Core
741 Points -7%
Khadas Mind 2
Intel Core Ultra 7 155H, Arc 8-Core
687 Points -14%
Acemagic F2A
Intel Core Ultra 7 155H, Arc 8-Core
684 Points -15%
Minisforum UH125 Pro
Intel Core Ultra 5 125H, Arc 7-Core
547 Points -32%

Opóźnienia DPC

Patrząc na wyniki, Geekom GT1 Mega wypada lepiej niż urządzenia porównawcze. Podczas surfowania po Internecie za pomocą przeglądarki Edge nie udokumentowaliśmy żadnych zwiększonych opóźnień DPC, które zmieniły się podczas odtwarzania testowego wideo 4K.

Wartości te nie są jednak ekstremalnie wysokie, co oznacza, że nasze urządzenie testowe nadal zapewnia najlepsze wyniki w porównaniu.

Maksymalne opóźnienie podczas otwierania wielu kart przeglądarki
Maksymalne opóźnienie podczas odtwarzania wideo 4K
Maksymalne opóźnienie po dziesięciu sekundach Prime95
Sterowniki uszeregowane według najdłuższego czasu wykonania
DPC Latencies / LatencyMon - interrupt to process latency (max), Web, Youtube, Prime95
Asus NUC 14 Pro
Arc 7-Core, Ultra 5 125H, Kingston KC3000 2048G SKC3000D2048G
2776 μs * -142%
Acemagic F2A
Arc 8-Core, Ultra 7 155H, Kingston OM8SEP1024Q-A0
2724 μs * -138%
Geekom AX8 Pro
Radeon 780M, R9 8945H, Acer N7000
1856 μs * -62%
Geekom GT13 Pro
Iris Xe G7 96EUs, i9-13900H, Acer N7000
1533.4 μs * -34%
Minisforum UH125 Pro
Arc 7-Core, Ultra 5 125H, Kingston OM8PGP41024Q-A0
1438 μs * -26%
Geekom GT1 Mega
Arc 8-Core, Ultra 9 185H, Crucial P3 Plus CT2000P3PSSD8
1145.7 μs *

* ... im mniej tym lepiej

Urządzenia pamięci masowej

Crucial P3 Plus 2 TB SSD

Jak już kilkukrotnie wspominaliśmy, testujemy Geekom GT1 Mega w topowej konfiguracji. Oznacza to, że model ten posiada dysk SSD o pojemności 2 TB, który pozwala na przechowywanie dużej ilości danych.

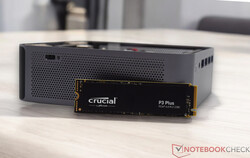
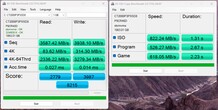
Dokładniej jest to Crucial P3 Plus, który działa z prędkością PCIe 4.0 x4. System pamięci masowej osiągnął świetne wyniki w teście, a nasze urządzenie testowe zdegradowało wszystkich konkurentów do tyłu stawki.

Dysk Crucial P3 Plus bezbłędnie poradził sobie również w teście obciążeniowym, dzięki czemu nie należy spodziewać się żadnych spadków wydajności. Geekom GT1 Mega może pomieścić dwa dyski SSD. Oprócz już zainstalowanego dysku SSD, można zainstalować kolejny dysk SSD M.2. Należy jednak zwrócić uwagę na całkowitą długość wynoszącą 42 mm. Technicznie obsługiwane są dyski SSD SATA NVMe.

W celu uzyskania dalszych porównań i testów porównawczych, proszę odnieść się do naszej Tabela porównawcza dysków SSD.

AS SSD
AS SSD
CDM 3
CDM 3
CDM 5
CDM 5
CDM 6
CDM 6
CDI
CDI
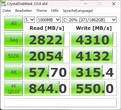
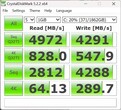
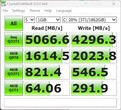
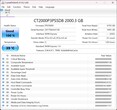
Crucial P3 Plus CT2000P3PSSD8
Sequential Read: 2822 MB/s
Sequential Write: 4310 MB/s
512K Read: 2054 MB/s
512K Write: 4132 MB/s
4K Read: 57.7 MB/s
4K Write: 315.4 MB/s
4K QD32 Read: 844 MB/s
4K QD32 Write: 550 MB/s
Drive Performance Rating - Percent
Geekom GT1 Mega
Crucial P3 Plus CT2000P3PSSD8
88.4 pt
Geekom GT13 Pro
Acer N7000
80.8 pt
Geekom AX8 Pro
Acer N7000
67.3 pt
Asus NUC 14 Pro
Kingston KC3000 2048G SKC3000D2048G
61.8 pt
Minisforum UH125 Pro
Kingston OM8PGP41024Q-A0
51.6 pt
Average of class Mini PC
 
50 pt
Acemagic F2A
Kingston OM8SEP1024Q-A0
48.4 pt
DiskSpd
seq read
Geekom GT13 Pro
Acer N7000
4357 (4314.26min - 4356.72max) MB/s +59%
Geekom AX8 Pro
Acer N7000
3921 (3897.31min - 3920.75max) MB/s +43%
Asus NUC 14 Pro
Kingston KC3000 2048G SKC3000D2048G
3706 (3594.04min - 3706.37max) MB/s +36%
Geekom GT1 Mega
Crucial P3 Plus CT2000P3PSSD8
2734 (2730.27min - 2734.25max) MB/s
Minisforum UH125 Pro
Kingston OM8PGP41024Q-A0
2351 (2320.68min - 2350.61max) MB/s -14%
Average of class Mini PC
  (277 - 4357, n=119, last 2 years)
2332 MB/s -15%
Acemagic F2A
Kingston OM8SEP1024Q-A0
1674 (1242.56min - 1673.54max) MB/s -39%
seq write
Geekom GT13 Pro
Acer N7000
4544 (4380.79min - 4543.83max) MB/s +14%
Geekom GT1 Mega
Crucial P3 Plus CT2000P3PSSD8
3976 (425.08min - 3975.57max) MB/s
Geekom AX8 Pro
Acer N7000
3791 (3695.18min - 3790.57max) MB/s -5%
Minisforum UH125 Pro
Kingston OM8PGP41024Q-A0
3331 (3244.92min - 3330.75max) MB/s -16%
Asus NUC 14 Pro
Kingston KC3000 2048G SKC3000D2048G
2928 (1958.53min - 2927.62max) MB/s -26%
Average of class Mini PC
  (229 - 5595, n=119, last 2 years)
2505 MB/s -37%
Acemagic F2A
Kingston OM8SEP1024Q-A0
1348 (1117.85min - 1347.87max) MB/s -66%
seq q8 t1 read
Asus NUC 14 Pro
Kingston KC3000 2048G SKC3000D2048G
7110 (6058.21min - 7110.02max) MB/s +41%
Geekom AX8 Pro
Acer N7000
7012 (5624.01min - 7012.25max) MB/s +39%
Geekom GT13 Pro
Acer N7000
7007 (6166.72min - 7006.62max) MB/s +38%
Geekom GT1 Mega
Crucial P3 Plus CT2000P3PSSD8
5060 (4781.3min - 5060.16max) MB/s
Minisforum UH125 Pro
Kingston OM8PGP41024Q-A0
4802 (4169.19min - 4801.68max) MB/s -5%
Average of class Mini PC
  (236 - 8430, n=119, last 2 years)
3795 MB/s -25%
Acemagic F2A
Kingston OM8SEP1024Q-A0
3194 (2810.81min - 3194.17max) MB/s -37%
seq q8 t1 write
Geekom AX8 Pro
Acer N7000
5685 (5389.6min - 5684.54max) MB/s +43%
Geekom GT13 Pro
Acer N7000
5261 (5018.9min - 5261.3max) MB/s +32%
Asus NUC 14 Pro
Kingston KC3000 2048G SKC3000D2048G
4712 (3064.99min - 4711.88max) MB/s +18%
Geekom GT1 Mega
Crucial P3 Plus CT2000P3PSSD8
3985 (52.74min - 3985.01max) MB/s
Minisforum UH125 Pro
Kingston OM8PGP41024Q-A0
3902 (3839.68min - 3901.75max) MB/s -2%
Average of class Mini PC
  (239 - 6669, n=119, last 2 years)
2809 MB/s -30%
Acemagic F2A
Kingston OM8SEP1024Q-A0
2212 (1222.43min - 2212.27max) MB/s -44%
4k q1 t1 read
Geekom GT13 Pro
Acer N7000
85.3 (82.57min - 85.32max) MB/s +36%
Geekom GT1 Mega
Crucial P3 Plus CT2000P3PSSD8
62.5 (62.22min - 62.52max) MB/s
Geekom AX8 Pro
Acer N7000
62.2 (61.55min - 62.23max) MB/s 0%
Minisforum UH125 Pro
Kingston OM8PGP41024Q-A0
60 (58.44min - 60.02max) MB/s -4%
Average of class Mini PC
  (6.85 - 86.6, n=119, last 2 years)
55.2 MB/s -12%
Asus NUC 14 Pro
Kingston KC3000 2048G SKC3000D2048G
53.4 (49.89min - 53.35max) MB/s -15%
Acemagic F2A
Kingston OM8SEP1024Q-A0
47.3 (47.07min - 47.31max) MB/s -24%
4k q1 t1 write
Geekom GT1 Mega
Crucial P3 Plus CT2000P3PSSD8
353 (348.24min - 353.16max) MB/s
Geekom GT13 Pro
Acer N7000
327 (306.06min - 326.78max) MB/s -7%
Average of class Mini PC
  (30.4 - 435, n=119, last 2 years)
196.4 MB/s -44%
Acemagic F2A
Kingston OM8SEP1024Q-A0
187.2 (181.54min - 187.2max) MB/s -47%
Geekom AX8 Pro
Acer N7000
187 (185.73min - 187.04max) MB/s -47%
Minisforum UH125 Pro
Kingston OM8PGP41024Q-A0
136.8 (131.56min - 136.81max) MB/s -61%
Asus NUC 14 Pro
Kingston KC3000 2048G SKC3000D2048G
83.1 (75.3min - 83.11max) MB/s -76%
4k q32 t16 read
Geekom GT13 Pro
Acer N7000
3593 (3380.17min - 3593.41max) MB/s +25%
Geekom GT1 Mega
Crucial P3 Plus CT2000P3PSSD8
2876 (2861.34min - 2875.92max) MB/s
Acemagic F2A
Kingston OM8SEP1024Q-A0
1824 (1239.47min - 1824.09max) MB/s -37%
Geekom AX8 Pro
Acer N7000
1644 (1568.76min - 1643.51max) MB/s -43%
Average of class Mini PC
  (26.1 - 4158, n=119, last 2 years)
1409 MB/s -51%
Asus NUC 14 Pro
Kingston KC3000 2048G SKC3000D2048G
731 (660.89min - 731.29max) MB/s -75%
Minisforum UH125 Pro
Kingston OM8PGP41024Q-A0
698 (691.89min - 697.84max) MB/s -76%
4k q32 t16 write
Geekom GT1 Mega
Crucial P3 Plus CT2000P3PSSD8
2822 (709.76min - 2821.52max) MB/s
Acemagic F2A
Kingston OM8SEP1024Q-A0
1434 (1410.26min - 1433.71max) MB/s -49%
Average of class Mini PC
  (32.6 - 4288, n=119, last 2 years)
1326 MB/s -53%
Geekom GT13 Pro
Acer N7000
762 (700.88min - 761.76max) MB/s -73%
Geekom AX8 Pro
Acer N7000
647 (598.22min - 647.4max) MB/s -77%
Minisforum UH125 Pro
Kingston OM8PGP41024Q-A0
311 (252.72min - 310.91max) MB/s -89%
Asus NUC 14 Pro
Kingston KC3000 2048G SKC3000D2048G
186.7 (155.05min - 186.74max) MB/s -93%
AS SSD
Score Total
Geekom GT1 Mega
Crucial P3 Plus CT2000P3PSSD8
8215 Points
Geekom GT13 Pro
Acer N7000
6798 Points -17%
Geekom AX8 Pro
Acer N7000
5512 Points -33%
Asus NUC 14 Pro
Kingston KC3000 2048G SKC3000D2048G
5131 Points -38%
Acemagic F2A
Kingston OM8SEP1024Q-A0
4412 Points -46%
Average of class Mini PC
  (211 - 10021, n=117, last 2 years)
4241 Points -48%
Minisforum UH125 Pro
Kingston OM8PGP41024Q-A0
3878 Points -53%
Score Read
Geekom GT13 Pro
Acer N7000
2866 Points +3%
Geekom GT1 Mega
Crucial P3 Plus CT2000P3PSSD8
2779 Points
Geekom AX8 Pro
Acer N7000
1793 Points -35%
Average of class Mini PC
  (76 - 3741, n=117, last 2 years)
1575 Points -43%
Acemagic F2A
Kingston OM8SEP1024Q-A0
1561 Points -44%
Asus NUC 14 Pro
Kingston KC3000 2048G SKC3000D2048G
1275 Points -54%
Minisforum UH125 Pro
Kingston OM8PGP41024Q-A0
1096 Points -61%
Score Write
Geekom GT1 Mega
Crucial P3 Plus CT2000P3PSSD8
3987 Points
Asus NUC 14 Pro
Kingston KC3000 2048G SKC3000D2048G
3313 Points -17%
Geekom AX8 Pro
Acer N7000
2896 Points -27%
Geekom GT13 Pro
Acer N7000
2516 Points -37%
Minisforum UH125 Pro
Kingston OM8PGP41024Q-A0
2306 Points -42%
Acemagic F2A
Kingston OM8SEP1024Q-A0
2082 Points -48%
Average of class Mini PC
  (88 - 4371, n=117, last 2 years)
1903 Points -52%
Seq Read
Asus NUC 14 Pro
Kingston KC3000 2048G SKC3000D2048G
5158 MB/s +44%
Geekom AX8 Pro
Acer N7000
4902 MB/s +37%
Geekom GT13 Pro
Acer N7000
4546 MB/s +27%
Minisforum UH125 Pro
Kingston OM8PGP41024Q-A0
3808 MB/s +6%
Geekom GT1 Mega
Crucial P3 Plus CT2000P3PSSD8
3587 MB/s
Average of class Mini PC
  (291 - 6620, n=117, last 2 years)
3234 MB/s -10%
Acemagic F2A
Kingston OM8SEP1024Q-A0
3010 MB/s -16%
Seq Write
Geekom GT1 Mega
Crucial P3 Plus CT2000P3PSSD8
3938 MB/s
Geekom GT13 Pro
Acer N7000
3374 MB/s -14%
Geekom AX8 Pro
Acer N7000
2835 MB/s -28%
Asus NUC 14 Pro
Kingston KC3000 2048G SKC3000D2048G
2646 MB/s -33%
Acemagic F2A
Kingston OM8SEP1024Q-A0
2369 MB/s -40%
Average of class Mini PC
  (242 - 5783, n=117, last 2 years)
2287 MB/s -42%
Minisforum UH125 Pro
Kingston OM8PGP41024Q-A0
1787 MB/s -55%
4K Read
Geekom GT1 Mega
Crucial P3 Plus CT2000P3PSSD8
83.6 MB/s
Geekom GT13 Pro
Acer N7000
83.4 MB/s 0%
Asus NUC 14 Pro
Kingston KC3000 2048G SKC3000D2048G
63.6 MB/s -24%
Average of class Mini PC
  (18.2 - 104.3, n=117, last 2 years)
59.5 MB/s -29%
Geekom AX8 Pro
Acer N7000
59.1 MB/s -29%
Minisforum UH125 Pro
Kingston OM8PGP41024Q-A0
57.3 MB/s -31%
Acemagic F2A
Kingston OM8SEP1024Q-A0
41.8 MB/s -50%
4K Write
Geekom GT1 Mega
Crucial P3 Plus CT2000P3PSSD8
314 MB/s
Geekom GT13 Pro
Acer N7000
296 MB/s -6%
Acemagic F2A
Kingston OM8SEP1024Q-A0
196.9 MB/s -37%
Minisforum UH125 Pro
Kingston OM8PGP41024Q-A0
182.1 MB/s -42%
Geekom AX8 Pro
Acer N7000
181.4 MB/s -42%
Average of class Mini PC
  (30.9 - 366, n=117, last 2 years)
177.5 MB/s -43%
Asus NUC 14 Pro
Kingston KC3000 2048G SKC3000D2048G
169.5 MB/s -46%
4K-64 Read
Geekom GT1 Mega
Crucial P3 Plus CT2000P3PSSD8
2336 MB/s
Geekom GT13 Pro
Acer N7000
2328 MB/s 0%
Geekom AX8 Pro
Acer N7000
1244 MB/s -47%
Acemagic F2A
Kingston OM8SEP1024Q-A0
1218 MB/s -48%
Average of class Mini PC
  (23.4 - 3220, n=117, last 2 years)
1193 MB/s -49%
Asus NUC 14 Pro
Kingston KC3000 2048G SKC3000D2048G
695 MB/s -70%
Minisforum UH125 Pro
Kingston OM8PGP41024Q-A0
658 MB/s -72%
4K-64 Write
Geekom GT1 Mega
Crucial P3 Plus CT2000P3PSSD8
3279 MB/s
Asus NUC 14 Pro
Kingston KC3000 2048G SKC3000D2048G
2878 MB/s -12%
Geekom AX8 Pro
Acer N7000
2431 MB/s -26%
Minisforum UH125 Pro
Kingston OM8PGP41024Q-A0
1945 MB/s -41%
Geekom GT13 Pro
Acer N7000
1883 MB/s -43%
Acemagic F2A
Kingston OM8SEP1024Q-A0
1649 MB/s -50%
Average of class Mini PC
  (32.8 - 3731, n=117, last 2 years)
1496 MB/s -54%
Access Time Read
Geekom GT13 Pro
Acer N7000
0.127 ms * -370%
Minisforum UH125 Pro
Kingston OM8PGP41024Q-A0
0.101 ms * -274%
Average of class Mini PC
  (0.022 - 0.489, n=117, last 2 years)
0.09742 ms * -261%
Geekom AX8 Pro
Acer N7000
0.079 ms * -193%
Asus NUC 14 Pro
Kingston KC3000 2048G SKC3000D2048G
0.053 ms * -96%
Acemagic F2A
Kingston OM8SEP1024Q-A0
0.046 ms * -70%
Geekom GT1 Mega
Crucial P3 Plus CT2000P3PSSD8
0.027 ms *
Access Time Write
Acemagic F2A
Kingston OM8SEP1024Q-A0
0.126 ms * -800%
Average of class Mini PC
  (0.014 - 0.765, n=117, last 2 years)
0.1149 ms * -721%
Geekom AX8 Pro
Acer N7000
0.064 ms * -357%
Geekom GT13 Pro
Acer N7000
0.059 ms * -321%
Asus NUC 14 Pro
Kingston KC3000 2048G SKC3000D2048G
0.043 ms * -207%
Minisforum UH125 Pro
Kingston OM8PGP41024Q-A0
0.024 ms * -71%
Geekom GT1 Mega
Crucial P3 Plus CT2000P3PSSD8
0.014 ms *

* ... im mniej tym lepiej

Disk throttling: DiskSpd Read Loop, Queue Depth 8

036072010801440180021602520288032403600396043204680504054005760612064806840Tooltip
Geekom GT1 Mega Crucial P3 Plus CT2000P3PSSD8 ; diskspd 2.0.17 f: Ø5055 (4738.1-5067.7)
Geekom AX8 Pro Acer N7000; diskspd 2.0.17 f: Ø6996 (5972.7-7027.76)
Asus NUC 14 Pro Kingston KC3000 2048G SKC3000D2048G; diskspd 2.0.17 f: Ø6306 (1073.74-7111.48)
Minisforum UH125 Pro Kingston OM8PGP41024Q-A0; diskspd 2.0.17 f: Ø4790 (4223.81-4803.95)
Geekom GT13 Pro Acer N7000; diskspd 2.0.17 f: Ø5377 (3710.83-7006.62)
Acemagic F2A Kingston OM8SEP1024Q-A0; diskspd 2.0.17 f: Ø1320 (771.89-3141.95)

Wydajność GPU

Wydajność 3D Geekom GT1 Mega jest zapewniona przez Intel Arc 8-Core iGPU układu Intel Core Ultra 9 185H. Wynik jest niezwykle pozytywny, ponieważ GT1 Mega prawie zawsze może zająć pierwsze miejsce również w tej dyscyplinie.

W przeciwnym razie potężny AMD Radeon 780M może być czasami wyraźnie lepszy. Tylko w testach renderowania (SPECviewperf 2020) iGPU od Intela nie jest konkurencyjne i pozostaje daleko w tyle za Geekom AX8 Pro pod względem akceptacji.

Dalsze porównania i testy porównawcze można znaleźć w naszej Tabeli porównawczej GPU.

3DMark Performance Rating - Percent
Geekom GT1 Mega
Intel Arc 8-Core iGPU, Intel Core Ultra 9 185H
100 pt
Geekom AX8 Pro
AMD Radeon 780M, AMD Ryzen 9 8945H
90.6 pt
Asus NUC 14 Pro
Intel Arc 7-Core iGPU, Intel Core Ultra 5 125H
89.3 pt
Acemagic F2A
Intel Arc 8-Core iGPU, Intel Core Ultra 7 155H
89.3 pt
Minisforum UH125 Pro
Intel Arc 7-Core iGPU, Intel Core Ultra 5 125H
78.5 pt
Geekom GT13 Pro
Intel Iris Xe Graphics G7 96EUs, Intel Core i9-13900H
56.4 pt
3DMark 11 - 1280x720 Performance GPU
Geekom GT1 Mega
Intel Arc 8-Core iGPU, Intel Core Ultra 9 185H
13309 Points
Geekom AX8 Pro
AMD Radeon 780M, AMD Ryzen 9 8945H
13281 Points 0%
Acemagic F2A
Intel Arc 8-Core iGPU, Intel Core Ultra 7 155H
12085 Points -9%
Asus NUC 14 Pro
Intel Arc 7-Core iGPU, Intel Core Ultra 5 125H
11785 Points -11%
Minisforum UH125 Pro
Intel Arc 7-Core iGPU, Intel Core Ultra 5 125H
10303 Points -23%
Geekom GT13 Pro
Intel Iris Xe Graphics G7 96EUs, Intel Core i9-13900H
7424 Points -44%
3DMark
2560x1440 Time Spy Graphics
Geekom GT1 Mega
Intel Arc 8-Core iGPU, Intel Core Ultra 9 185H
3610 Points
Acemagic F2A
Intel Arc 8-Core iGPU, Intel Core Ultra 7 155H
3205 Points -11%
Asus NUC 14 Pro
Intel Arc 7-Core iGPU, Intel Core Ultra 5 125H
3205 Points -11%
Geekom AX8 Pro
AMD Radeon 780M, AMD Ryzen 9 8945H
2852 Points -21%
Minisforum UH125 Pro
Intel Arc 7-Core iGPU, Intel Core Ultra 5 125H
2796 Points -23%
Geekom GT13 Pro
Intel Iris Xe Graphics G7 96EUs, Intel Core i9-13900H
1690 Points -53%
1920x1080 Fire Strike Graphics
Geekom GT1 Mega
Intel Arc 8-Core iGPU, Intel Core Ultra 9 185H
8726 Points
Geekom AX8 Pro
AMD Radeon 780M, AMD Ryzen 9 8945H
8117 Points -7%
Asus NUC 14 Pro
Intel Arc 7-Core iGPU, Intel Core Ultra 5 125H
7900 Points -9%
Acemagic F2A
Intel Arc 8-Core iGPU, Intel Core Ultra 7 155H
7710 Points -12%
Minisforum UH125 Pro
Intel Arc 7-Core iGPU, Intel Core Ultra 5 125H
7047 Points -19%
Geekom GT13 Pro
Intel Iris Xe Graphics G7 96EUs, Intel Core i9-13900H
5812 Points -33%
Unigine Heaven 4.0
Extreme Preset OpenGL
Geekom GT1 Mega
Intel Arc 8-Core iGPU, Intel Core Ultra 9 185H
36.4 fps
Asus NUC 14 Pro
Intel Arc 7-Core iGPU, Intel Core Ultra 5 125H
33.3 fps -9%
Acemagic F2A
Intel Arc 8-Core iGPU, Intel Core Ultra 7 155H
31.6 fps -13%
Geekom AX8 Pro
AMD Radeon 780M, AMD Ryzen 9 8945H
30 fps -18%
Minisforum UH125 Pro
Intel Arc 7-Core iGPU, Intel Core Ultra 5 125H
29.6 fps -19%
Geekom GT13 Pro
Intel Iris Xe Graphics G7 96EUs, Intel Core i9-13900H
25.1 fps -31%
Extreme Preset DX11
Geekom GT1 Mega
Intel Arc 8-Core iGPU, Intel Core Ultra 9 185H
37.5 fps
Geekom AX8 Pro
AMD Radeon 780M, AMD Ryzen 9 8945H
36.4 fps -3%
Asus NUC 14 Pro
Intel Arc 7-Core iGPU, Intel Core Ultra 5 125H
34.5 fps -8%
Acemagic F2A
Intel Arc 8-Core iGPU, Intel Core Ultra 7 155H
32.7 fps -13%
Minisforum UH125 Pro
Intel Arc 7-Core iGPU, Intel Core Ultra 5 125H
31.5 fps -16%
Geekom GT13 Pro
Intel Iris Xe Graphics G7 96EUs, Intel Core i9-13900H
26 fps -31%
Unigine Valley 1.0
1920x1080 Extreme HD DirectX AA:x8
Geekom AX8 Pro
AMD Radeon 780M, AMD Ryzen 9 8945H
23.1 fps +15%
Geekom GT1 Mega
Intel Arc 8-Core iGPU, Intel Core Ultra 9 185H
20.1 fps
Asus NUC 14 Pro
Intel Arc 7-Core iGPU, Intel Core Ultra 5 125H
18.8 fps -6%
Acemagic F2A
Intel Arc 8-Core iGPU, Intel Core Ultra 7 155H
17.1 fps -15%
Minisforum UH125 Pro
Intel Arc 7-Core iGPU, Intel Core Ultra 5 125H
16.9 fps -16%
Geekom GT13 Pro
Intel Iris Xe Graphics G7 96EUs, Intel Core i9-13900H
15.1 fps -25%
1920x1080 Extreme HD Preset OpenGL AA:x8
Geekom GT1 Mega
Intel Arc 8-Core iGPU, Intel Core Ultra 9 185H
21.9 fps
Geekom AX8 Pro
AMD Radeon 780M, AMD Ryzen 9 8945H
20.6 fps -6%
Asus NUC 14 Pro
Intel Arc 7-Core iGPU, Intel Core Ultra 5 125H
20.2 fps -8%
Acemagic F2A
Intel Arc 8-Core iGPU, Intel Core Ultra 7 155H
18.3 fps -16%
Minisforum UH125 Pro
Intel Arc 7-Core iGPU, Intel Core Ultra 5 125H
18.3 fps -16%
Geekom GT13 Pro
Intel Iris Xe Graphics G7 96EUs, Intel Core i9-13900H
15.7 fps -28%
Unigine Superposition
1280x720 720p Low
Geekom GT1 Mega
Intel Arc 8-Core iGPU, Intel Core Ultra 9 185H
12451 Points
Geekom AX8 Pro
AMD Radeon 780M, AMD Ryzen 9 8945H
12232 Points -2%
Asus NUC 14 Pro
Intel Arc 7-Core iGPU, Intel Core Ultra 5 125H
10872 Points -13%
Acemagic F2A
Intel Arc 8-Core iGPU, Intel Core Ultra 7 155H
10491 Points -16%
Minisforum UH125 Pro
Intel Arc 7-Core iGPU, Intel Core Ultra 5 125H
10026 Points -19%
Geekom GT13 Pro
Intel Iris Xe Graphics G7 96EUs, Intel Core i9-13900H
6619 Points -47%
1920x1080 1080p High
Geekom GT1 Mega
Intel Arc 8-Core iGPU, Intel Core Ultra 9 185H
3948 Points
Asus NUC 14 Pro
Intel Arc 7-Core iGPU, Intel Core Ultra 5 125H
3609 Points -9%
Geekom AX8 Pro
AMD Radeon 780M, AMD Ryzen 9 8945H
3559 Points -10%
Acemagic F2A
Intel Arc 8-Core iGPU, Intel Core Ultra 7 155H
3391 Points -14%
Minisforum UH125 Pro
Intel Arc 7-Core iGPU, Intel Core Ultra 5 125H
3066 Points -22%
Geekom GT13 Pro
Intel Iris Xe Graphics G7 96EUs, Intel Core i9-13900H
2306 Points -42%
1920x1080 1080p Extreme
Geekom GT1 Mega
Intel Arc 8-Core iGPU, Intel Core Ultra 9 185H
2119 Points
Asus NUC 14 Pro
Intel Arc 7-Core iGPU, Intel Core Ultra 5 125H
1981 Points -7%
Acemagic F2A
Intel Arc 8-Core iGPU, Intel Core Ultra 7 155H
1920 Points -9%
Minisforum UH125 Pro
Intel Arc 7-Core iGPU, Intel Core Ultra 5 125H
1686 Points -20%
Geekom AX8 Pro
AMD Radeon 780M, AMD Ryzen 9 8945H
1649 Points -22%
Geekom GT13 Pro
Intel Iris Xe Graphics G7 96EUs, Intel Core i9-13900H
1124 Points -47%
ComputeMark v2.1
1024x600 Normal, Score
Geekom AX8 Pro
AMD Radeon 780M, AMD Ryzen 9 8945H
8595 Points +8%
Geekom GT1 Mega
Intel Arc 8-Core iGPU, Intel Core Ultra 9 185H
7963 Points
Acemagic F2A
Intel Arc 8-Core iGPU, Intel Core Ultra 7 155H
7480 Points -6%
Asus NUC 14 Pro
Intel Arc 7-Core iGPU, Intel Core Ultra 5 125H
6698 Points -16%
Minisforum UH125 Pro
Intel Arc 7-Core iGPU, Intel Core Ultra 5 125H
5613 Points -30%
Geekom GT13 Pro
Intel Iris Xe Graphics G7 96EUs, Intel Core i9-13900H
3650 Points -54%
1024x600 Normal, Fluid 3DTex
Geekom GT1 Mega
Intel Arc 8-Core iGPU, Intel Core Ultra 9 185H
492 Points
Asus NUC 14 Pro
Intel Arc 7-Core iGPU, Intel Core Ultra 5 125H
490 Points 0%
Geekom AX8 Pro
AMD Radeon 780M, AMD Ryzen 9 8945H
488 Points -1%
Minisforum UH125 Pro
Intel Arc 7-Core iGPU, Intel Core Ultra 5 125H
471 Points -4%
Acemagic F2A
Intel Arc 8-Core iGPU, Intel Core Ultra 7 155H
427 Points -13%
Geekom GT13 Pro
Intel Iris Xe Graphics G7 96EUs, Intel Core i9-13900H
286 Points -42%
1024x600 Normal, Fluid 2DTexArr
Geekom GT1 Mega
Intel Arc 8-Core iGPU, Intel Core Ultra 9 185H
487 Points
Asus NUC 14 Pro
Intel Arc 7-Core iGPU, Intel Core Ultra 5 125H
472 Points -3%
Minisforum UH125 Pro
Intel Arc 7-Core iGPU, Intel Core Ultra 5 125H
439 Points -10%
Geekom AX8 Pro
AMD Radeon 780M, AMD Ryzen 9 8945H
427 Points -12%
Acemagic F2A
Intel Arc 8-Core iGPU, Intel Core Ultra 7 155H
422 Points -13%
Geekom GT13 Pro
Intel Iris Xe Graphics G7 96EUs, Intel Core i9-13900H
294 Points -40%
1024x600 Normal, Mandel Vector
Geekom AX8 Pro
AMD Radeon 780M, AMD Ryzen 9 8945H
2362 Points +16%
Geekom GT1 Mega
Intel Arc 8-Core iGPU, Intel Core Ultra 9 185H
2039 Points
Acemagic F2A
Intel Arc 8-Core iGPU, Intel Core Ultra 7 155H
1961 Points -4%
Asus NUC 14 Pro
Intel Arc 7-Core iGPU, Intel Core Ultra 5 125H
1715 Points -16%
Minisforum UH125 Pro
Intel Arc 7-Core iGPU, Intel Core Ultra 5 125H
1447 Points -29%
Geekom GT13 Pro
Intel Iris Xe Graphics G7 96EUs, Intel Core i9-13900H
873 Points -57%
1024x600 Normal, Mandel Scalar
Geekom AX8 Pro
AMD Radeon 780M, AMD Ryzen 9 8945H
2449 Points +44%
Geekom GT1 Mega
Intel Arc 8-Core iGPU, Intel Core Ultra 9 185H
1701 Points
Acemagic F2A
Intel Arc 8-Core iGPU, Intel Core Ultra 7 155H
1594 Points -6%
Asus NUC 14 Pro
Intel Arc 7-Core iGPU, Intel Core Ultra 5 125H
1360 Points -20%
Minisforum UH125 Pro
Intel Arc 7-Core iGPU, Intel Core Ultra 5 125H
1112 Points -35%
Geekom GT13 Pro
Intel Iris Xe Graphics G7 96EUs, Intel Core i9-13900H
888 Points -48%
1024x600 Normal, QJuliaRayTrace
Geekom GT1 Mega
Intel Arc 8-Core iGPU, Intel Core Ultra 9 185H
3244 Points
Acemagic F2A
Intel Arc 8-Core iGPU, Intel Core Ultra 7 155H
3076 Points -5%
Geekom AX8 Pro
AMD Radeon 780M, AMD Ryzen 9 8945H
2868 Points -12%
Asus NUC 14 Pro
Intel Arc 7-Core iGPU, Intel Core Ultra 5 125H
2662 Points -18%
Minisforum UH125 Pro
Intel Arc 7-Core iGPU, Intel Core Ultra 5 125H
2143 Points -34%
Geekom GT13 Pro
Intel Iris Xe Graphics G7 96EUs, Intel Core i9-13900H
1310 Points -60%
LuxMark v2.0 64Bit
Room GPUs-only
Geekom AX8 Pro
AMD Radeon 780M, AMD Ryzen 9 8945H
1068 Samples/s +63%
Asus NUC 14 Pro
Intel Arc 7-Core iGPU, Intel Core Ultra 5 125H
801 Samples/s +22%
Minisforum UH125 Pro
Intel Arc 7-Core iGPU, Intel Core Ultra 5 125H
710 Samples/s +8%
Geekom GT1 Mega
Intel Arc 8-Core iGPU, Intel Core Ultra 9 185H
656 Samples/s
Geekom GT13 Pro
Intel Iris Xe Graphics G7 96EUs, Intel Core i9-13900H
651 Samples/s -1%
Acemagic F2A
Intel Arc 8-Core iGPU, Intel Core Ultra 7 155H
549 Samples/s -16%
Sala GPUs-only
Geekom GT1 Mega
Intel Arc 8-Core iGPU, Intel Core Ultra 9 185H
2888 Samples/s
Asus NUC 14 Pro
Intel Arc 7-Core iGPU, Intel Core Ultra 5 125H
2807 Samples/s -3%
Minisforum UH125 Pro
Intel Arc 7-Core iGPU, Intel Core Ultra 5 125H
2517 Samples/s -13%
Acemagic F2A
Intel Arc 8-Core iGPU, Intel Core Ultra 7 155H
2319 Samples/s -20%
Geekom AX8 Pro
AMD Radeon 780M, AMD Ryzen 9 8945H
2218 Samples/s -23%
Geekom GT13 Pro
Intel Iris Xe Graphics G7 96EUs, Intel Core i9-13900H
2104 Samples/s -27%
Affinity Photo 2 - Combined (Single / Multi GPU)
Geekom GT1 Mega
Intel Arc 8-Core iGPU, Intel Core Ultra 9 185H
6468 Points
Minisforum UH125 Pro
Intel Arc 7-Core iGPU, Intel Core Ultra 5 125H
5244 Points -19%
Asus NUC 14 Pro
Intel Arc 7-Core iGPU, Intel Core Ultra 5 125H
5105 Points -21%
Acemagic F2A
Intel Arc 8-Core iGPU, Intel Core Ultra 7 155H
4928 Points -24%
Geekom GT13 Pro
Intel Iris Xe Graphics G7 96EUs, Intel Core i9-13900H
4460 Points -31%
Geekom AX8 Pro
AMD Radeon 780M, AMD Ryzen 9 8945H
1831 Points -72%
Geekom GT1 Mega, Intel Arc 8-Core iGPU
Ultra 9 185H
Geekom AX8 Pro, AMD Radeon 780M
R9 8945H
Asus NUC 14 Pro, Intel Arc 7-Core iGPU
Ultra 5 125H
Minisforum UH125 Pro, Intel Arc 7-Core iGPU
Ultra 5 125H
Geekom GT13 Pro, Intel Iris Xe Graphics G7 96EUs
i9-13900H
Acemagic F2A, Intel Arc 8-Core iGPU
Ultra 7 155H
Average of class Mini PC
 
SPECviewperf 2020
223%
-13%
-19%
-27%
-13%
129%
3840x2160 Medical (medical-03)
7.07
12.8
81%
5.87
-17%
4.8
-32%
2.69
-62%
5.05
-29%
3840x2160 Energy (energy-03)
5
13.3
166%
3.81
-24%
3.38
-32%
3.17
-37%
4.61
-8%
3840x2160 Creo (creo-03)
19.8
35.3
78%
15.3
-23%
15.4
-22%
16.3
-18%
17.9
-10%
3840x2160 CATIA (catia-06)
11.7
25.1
115%
10.4
-11%
9.7
-17%
8.53
-27%
10
-15%
3840x2160 3ds Max (3dsmax-07)
15.5
21.1
36%
14.5
-6%
13.2
-15%
10.3
-34%
12.9
-17%
3840x2160 Siemens NX (snx-04)
5.68
65.7
1057%
5.82
2%
5.54
-2%
6.62
17%
5.7
0%
3840x2160 Maya (maya-06)
38.8
49.6
28%
34.7
-11%
32.8
-15%
27.3
-30%
35.4
-9%
3DMark 05 Standard
53214 pkt.
3DMark 06 Standard Score
38204 pkt.
3DMark Vantage P Result
43259 pkt.
3DMark 11 Performance
13104 pkt.
3DMark Ice Storm Standard Score
145222 pkt.
3DMark Cloud Gate Standard Score
35142 pkt.
3DMark Fire Strike Score
7968 pkt.
3DMark Fire Strike Extreme Score
4087 pkt.
3DMark Time Spy Score
3984 pkt.
3DMark Steel Nomad Score
781 pkt.
3DMark Steel Nomad Light Score
3222 pkt.
Pomoc

Wydajność w grach

Doskonałe wyniki Intel Arc 8-Core iGPU w syntetycznych benchmarkach nie znajdują niestety odzwierciedlenia w testach gier. Geekom GT1 Mega wypada bardzo wyraźnie gorzej niż Geekom AX8 Pro.

Karta AMD Radeon 780M również zapewnia jedynie ograniczoną wydajność w grach, czemu towarzyszą ograniczenia w praktyce. Ogólnie rzecz biorąc, iGPU Intel Arc 8-Core zapewnia jednak wystarczającą wydajność w przypadku starszych lub mniej wymagających tytułów.

Aby uzyskać szczegółowy przegląd wydajności iGPU w porównaniu z innymi kartami graficznymi, proszę zapoznać się z naszą Lista gier GPU.

GTA V
1024x768 Lowest Settings possible
Geekom AX8 Pro
Radeon 780M, R9 8945H, Acer N7000
169.4 (3.69min, 125P1) fps +3%
Geekom GT1 Mega
Arc 8-Core, Ultra 9 185H, Crucial P3 Plus CT2000P3PSSD8
165.2 (3.77min, 100P1) fps
Acemagic F2A
Arc 8-Core, Ultra 7 155H, Kingston OM8SEP1024Q-A0
161 (4.76min, 100P1) fps -3%
Asus NUC 14 Pro
Arc 7-Core, Ultra 5 125H, Kingston KC3000 2048G SKC3000D2048G
156.3 (4.92min, 90.9P1) fps -5%
Minisforum UH125 Pro
Arc 7-Core, Ultra 5 125H, Kingston OM8PGP41024Q-A0
132.4 (4.93min, 90.9P1) fps -20%
Geekom GT13 Pro
Iris Xe G7 96EUs, i9-13900H, Acer N7000
119.7 (7.51min, 66.7P1) fps -28%
1920x1080 High/On (Advanced Graphics Off) AA:2xMSAA + FX AF:8x
Geekom AX8 Pro
Radeon 780M, R9 8945H, Acer N7000
65.9 (2.44min, 41.7P1) fps +51%
Geekom GT1 Mega
Arc 8-Core, Ultra 9 185H, Crucial P3 Plus CT2000P3PSSD8
43.5 (3.49min, 32.3P1) fps
Asus NUC 14 Pro
Arc 7-Core, Ultra 5 125H, Kingston KC3000 2048G SKC3000D2048G
39.9 (3.1min, 29.4P1) fps -8%
Minisforum UH125 Pro
Arc 7-Core, Ultra 5 125H, Kingston OM8PGP41024Q-A0
38.9 (3.15min, 28.6P1) fps -11%
Acemagic F2A
Arc 8-Core, Ultra 7 155H, Kingston OM8SEP1024Q-A0
31.3 (2.94min, 22.7P1) fps -28%
Geekom GT13 Pro
Iris Xe G7 96EUs, i9-13900H, Acer N7000
22 (6.3min, 16.4P1) fps -49%
Dota 2 Reborn
1280x720 min (0/3) fastest
Geekom AX8 Pro
Radeon 780M, R9 8945H, Acer N7000
157.5 (136min) fps +43%
Geekom GT1 Mega
Arc 8-Core, Ultra 9 185H, Crucial P3 Plus CT2000P3PSSD8
110.5 (63min) fps
Geekom GT13 Pro
Iris Xe G7 96EUs, i9-13900H, Acer N7000
109.8 (85min) fps -1%
Acemagic F2A
Arc 8-Core, Ultra 7 155H, Kingston OM8SEP1024Q-A0
103.2 (59.8min) fps -7%
Asus NUC 14 Pro
Arc 7-Core, Ultra 5 125H, Kingston KC3000 2048G SKC3000D2048G
97.1 (61.8min) fps -12%
Minisforum UH125 Pro
Arc 7-Core, Ultra 5 125H, Kingston OM8PGP41024Q-A0
95.5 (63.7min) fps -14%
1920x1080 high (2/3)
Geekom AX8 Pro
Radeon 780M, R9 8945H, Acer N7000
88 (69.2min) fps 0%
Geekom GT1 Mega
Arc 8-Core, Ultra 9 185H, Crucial P3 Plus CT2000P3PSSD8
87.8 (28.3min) fps
Acemagic F2A
Arc 8-Core, Ultra 7 155H, Kingston OM8SEP1024Q-A0
77.3 (52.5min) fps -12%
Asus NUC 14 Pro
Arc 7-Core, Ultra 5 125H, Kingston KC3000 2048G SKC3000D2048G
75.9 (45.7min) fps -14%
Minisforum UH125 Pro
Arc 7-Core, Ultra 5 125H, Kingston OM8PGP41024Q-A0
73.6 (47.5min) fps -16%
Geekom GT13 Pro
Iris Xe G7 96EUs, i9-13900H, Acer N7000
65.5 (56.1min) fps -25%
Cyberpunk 2077 2.1 Phantom Liberty
1920x1080 Low Preset (FSR off)
Geekom AX8 Pro
Radeon 780M, R9 8945H, Acer N7000
41.3 (34.5min) fps +9%
Geekom GT1 Mega
Arc 8-Core, Ultra 9 185H, Crucial P3 Plus CT2000P3PSSD8
38 (33.3min) fps
Asus NUC 14 Pro
Arc 7-Core, Ultra 5 125H, Kingston KC3000 2048G SKC3000D2048G
30.1 (25.8min) fps -21%
Acemagic F2A
Arc 8-Core, Ultra 7 155H, Kingston OM8SEP1024Q-A0
29.5 (24.1min) fps -22%
Minisforum UH125 Pro
Arc 7-Core, Ultra 5 125H, Kingston OM8PGP41024Q-A0
29.5 (25.4min) fps -22%
Geekom GT13 Pro
Iris Xe G7 96EUs, i9-13900H, Acer N7000
18.2 (14.7min) fps -52%
1920x1080 High Preset (FSR off)
Geekom GT1 Mega
Arc 8-Core, Ultra 9 185H, Crucial P3 Plus CT2000P3PSSD8
26 (22.6min) fps
Geekom AX8 Pro
Radeon 780M, R9 8945H, Acer N7000
25.8 (21.7min) fps -1%
Asus NUC 14 Pro
Arc 7-Core, Ultra 5 125H, Kingston KC3000 2048G SKC3000D2048G
21.7 (18.8min) fps -17%
Minisforum UH125 Pro
Arc 7-Core, Ultra 5 125H, Kingston OM8PGP41024Q-A0
20.6 (17.9min) fps -21%
Acemagic F2A
Arc 8-Core, Ultra 7 155H, Kingston OM8SEP1024Q-A0
20.4 (13.8min) fps -22%
Geekom GT13 Pro
Iris Xe G7 96EUs, i9-13900H, Acer N7000
12.8 (10.9min) fps -51%
Baldur's Gate 3
1280x720 Low Preset
Geekom AX8 Pro
Radeon 780M, R9 8945H, Acer N7000
60.8 (21.6min, 28.1P0.1, 35.6P1) fps +6%
Geekom GT1 Mega
Arc 8-Core, Ultra 9 185H, Crucial P3 Plus CT2000P3PSSD8
57.6 (31.7min, 33.6P0.1, 37.9P1) fps
Asus NUC 14 Pro
Arc 7-Core, Ultra 5 125H, Kingston KC3000 2048G SKC3000D2048G
50.2 (27.7min, 29.7P0.1, 32.6P1) fps -13%
Minisforum UH125 Pro
Arc 7-Core, Ultra 5 125H, Kingston OM8PGP41024Q-A0
45 (14.9min, 19.4P0.1, 29P1) fps -22%
Geekom GT13 Pro
Iris Xe G7 96EUs, i9-13900H, Acer N7000
26.2 (4.4min, 7.02P0.1, 18.4P1) fps -55%
1920x1080 High Preset
Geekom GT1 Mega
Arc 8-Core, Ultra 9 185H, Crucial P3 Plus CT2000P3PSSD8
25.4 (13.9min, 14.3P0.1, 16.3P1) fps
Geekom AX8 Pro
Radeon 780M, R9 8945H, Acer N7000
24.5 (17.7min, 17.7P0.1, 19.8P1) fps -4%
Asus NUC 14 Pro
Arc 7-Core, Ultra 5 125H, Kingston KC3000 2048G SKC3000D2048G
22.4 (14min, 14.2P0.1, 15.3P1) fps -12%
Minisforum UH125 Pro
Arc 7-Core, Ultra 5 125H, Kingston OM8PGP41024Q-A0
19.5 (9.2min, 10.4P0.1, 12.7P1) fps -23%
Geekom GT13 Pro
Iris Xe G7 96EUs, i9-13900H, Acer N7000
11.7 (3.43min, 3.51P0.1, 3.99P1) fps -54%
F1 24
1920x1080 Low Preset AA:T AF:16x
Geekom GT1 Mega
Arc 8-Core, Ultra 9 185H, Crucial P3 Plus CT2000P3PSSD8
84.3 (70min, 66P1) fps
Geekom AX8 Pro
Radeon 780M, R9 8945H, Acer N7000
83.4 (28min, 33P1) fps -1%
Asus NUC 14 Pro
Arc 7-Core, Ultra 5 125H, Kingston KC3000 2048G SKC3000D2048G
66.2 (56min, 54P1) fps -21%
Minisforum UH125 Pro
Arc 7-Core, Ultra 5 125H, Kingston OM8PGP41024Q-A0
64.3 (55min, 53P1) fps -24%
Geekom GT13 Pro
Iris Xe G7 96EUs, i9-13900H, Acer N7000
40.4 (34min, 33P1) fps -52%
1920x1080 High Preset AA:T AF:16x
Geekom GT1 Mega
Arc 8-Core, Ultra 9 185H, Crucial P3 Plus CT2000P3PSSD8
54.8 (43min, 45P1) fps
Geekom AX8 Pro
Radeon 780M, R9 8945H, Acer N7000
51.3 (23min, 15P1) fps -6%
Asus NUC 14 Pro
Arc 7-Core, Ultra 5 125H, Kingston KC3000 2048G SKC3000D2048G
43.4 (34min, 35P1) fps -21%
Minisforum UH125 Pro
Arc 7-Core, Ultra 5 125H, Kingston OM8PGP41024Q-A0
41.7 (34min, 34P1) fps -24%
Geekom GT13 Pro
Iris Xe G7 96EUs, i9-13900H, Acer N7000
25.6 (22min, 21P1) fps -53%

FPS-Diagramm - 30 Min. Cyberpunk 2077 1.920 x 1.080 Ultra Preset (FSR off)

05101520Tooltip
Geekom GT1 Mega Ultra 9 185H, Arc 8-Core: Ø22.1 (18.6-24)
Geekom AX8 Pro R9 8945H, Radeon 780M: Ø19.2 (17.9-20.3)
Asus NUC 14 Pro Ultra 5 125H, Arc 7-Core: Ø18.5 (12.6-20.7)
Geekom GT13 Pro i9-13900H, Iris Xe G7 96EUs: Ø11.1 (5.97-12.3)
lowmed.highultra
GTA V (2015) 165.2 151.8 43.5 16.6
Dota 2 Reborn (2015) 110.5 62.8 87.8 45.5
Final Fantasy XV Benchmark (2018) 79.2 41 28.9
X-Plane 11.11 (2018) 66.4 52.1 42.3
Baldur's Gate 3 (2023) 39.3 30.3 25.4 25.2
Cyberpunk 2077 2.1 Phantom Liberty (2023) 38 31.4 26 23.3
F1 24 (2024) 84.3 73.8 54.8

Test wydajności Geekom GT1 Mega z kartą graficzną Nvidia GeForce RTX 4090

GPU-Z
GPU-Z

Geekom GT1 Mega umożliwia korzystanie z zewnętrznych rozwiązań graficznych przez USB4 dzięki swojej łączności. Ważną kwestią jest ograniczenie przepustowości, co oznacza, że zewnętrzna karta graficzna działa tylko z prędkością PCIe 3.0 x4 za pośrednictwem połączenia USB4.

W połączeniu z kartą Nvidia GeForce RTX 4090 przeprowadziliśmy kilka testów porównawczych, aby pokazać wzrost wydajności, jakiego można oczekiwać od najszybszej obecnie dostępnej konsumenckiej karty graficznej.

Zasadniczo, wydajność 3D może zostać zauważalnie zwiększona w porównaniu do iGPU. Dla porównania, połączenie z Geekom GT1 Mega zapewnia nieco większą wydajność niż mini PC od Khadas.

W porównaniu do Minisforum MS-A1, nasza próbka testowa musi jednak przyznać się do porażki. Techniczna wada połączenia USB4 w porównaniu do interfejsu OCuLink jest tutaj wyraźnie widoczna. Interfejs OCuLink oferuje prędkość PCIe 4.0 x4, co odpowiada podwojeniu przepustowości.

Performance Rating - Percent
AMD Ryzen 5 9600X
AMD Ryzen 5 9600X
98.7 pt
Intel Core i5-14600K
96.9 pt
Minisforum MS-A1 (Nvidia GeForce RTX 4090 @OCuLink)
AMD Ryzen 7 8700G
88.1 pt
Geekom GT1 Mega (Nvidia GeForce RTX 4090 @USB4)
Intel Core Ultra 9 185H
78.6 pt
Khadas Mind 2 (Nvidia GeForce RTX 4090 @USB4)
Intel Core Ultra 7 155H
75 pt
3DMark 11 - 1280x720 Performance GPU
Intel Core i5-14600K
110994 Points +734%
AMD Ryzen 5 9600X
AMD Ryzen 5 9600X
104516 Points +685%
Minisforum MS-A1 (Nvidia GeForce RTX 4090 @OCuLink)
AMD Ryzen 7 8700G
98454 Points +640%
Geekom GT1 Mega (Nvidia GeForce RTX 4090 @USB4)
Intel Core Ultra 9 185H
64648 Points +386%
Khadas Mind 2 (Nvidia GeForce RTX 4090 @USB4)
Intel Core Ultra 7 155H
62498 Points +370%

13309 Points
3DMark
2560x1440 Time Spy Graphics
Intel Core i5-14600K
37769 Points +946%
AMD Ryzen 5 9600X
AMD Ryzen 5 9600X
37161 Points +929%
Minisforum MS-A1 (Nvidia GeForce RTX 4090 @OCuLink)
AMD Ryzen 7 8700G
34984 Points +869%
Geekom GT1 Mega (Nvidia GeForce RTX 4090 @USB4)
Intel Core Ultra 9 185H
28844 Points +699%
Khadas Mind 2 (Nvidia GeForce RTX 4090 @USB4)
Intel Core Ultra 7 155H
23140 Points +541%

3610 Points
1920x1080 Fire Strike Graphics
Intel Core i5-14600K
86031 Points +886%
AMD Ryzen 5 9600X
AMD Ryzen 5 9600X
78579 Points +801%
Minisforum MS-A1 (Nvidia GeForce RTX 4090 @OCuLink)
AMD Ryzen 7 8700G
76191 Points +773%
Geekom GT1 Mega (Nvidia GeForce RTX 4090 @USB4)
Intel Core Ultra 9 185H
53367 Points +512%
Khadas Mind 2 (Nvidia GeForce RTX 4090 @USB4)
Intel Core Ultra 7 155H
40417 Points +363%

8726 Points
3840x2160 Fire Strike Ultra Graphics
Intel Core i5-14600K
25342 Points +1150%
AMD Ryzen 5 9600X
AMD Ryzen 5 9600X
24915 Points +1129%
Minisforum MS-A1 (Nvidia GeForce RTX 4090 @OCuLink)
AMD Ryzen 7 8700G
23565 Points +1062%
Geekom GT1 Mega (Nvidia GeForce RTX 4090 @USB4)
Intel Core Ultra 9 185H
21506 Points +960%
Khadas Mind 2 (Nvidia GeForce RTX 4090 @USB4)
Intel Core Ultra 7 155H
17047 Points +741%

2028 Points
Unigine Superposition
1280x720 720p Low
AMD Ryzen 5 9600X
AMD Ryzen 5 9600X
63603 Points +411%
Intel Core i5-14600K
49203 Points +295%
Minisforum MS-A1 (Nvidia GeForce RTX 4090 @OCuLink)
AMD Ryzen 7 8700G
35453 Points +185%
Geekom GT1 Mega (Nvidia GeForce RTX 4090 @USB4)
Intel Core Ultra 9 185H
33318 Points +168%
Khadas Mind 2 (Nvidia GeForce RTX 4090 @USB4)
Intel Core Ultra 7 155H
28104 Points +126%

12451 Points
1920x1080 1080p High
AMD Ryzen 5 9600X
AMD Ryzen 5 9600X
50230 Points +1172%
Intel Core i5-14600K
45162 Points +1044%
Minisforum MS-A1 (Nvidia GeForce RTX 4090 @OCuLink)
AMD Ryzen 7 8700G
32728 Points +729%
Geekom GT1 Mega (Nvidia GeForce RTX 4090 @USB4)
Intel Core Ultra 9 185H
30115 Points +663%
Khadas Mind 2 (Nvidia GeForce RTX 4090 @USB4)
Intel Core Ultra 7 155H
26890 Points +581%

3948 Points
1920x1080 1080p Extreme
Intel Core i5-14600K
21954 Points +936%
AMD Ryzen 5 9600X
AMD Ryzen 5 9600X
21586 Points +919%
Minisforum MS-A1 (Nvidia GeForce RTX 4090 @OCuLink)
AMD Ryzen 7 8700G
20934 Points +888%
Geekom GT1 Mega (Nvidia GeForce RTX 4090 @USB4)
Intel Core Ultra 9 185H
19915 Points +840%
Khadas Mind 2 (Nvidia GeForce RTX 4090 @USB4)
Intel Core Ultra 7 155H
19877 Points +838%

2119 Points
3840x2160 4k Optimized
Intel Core i5-14600K
33700 Points
AMD Ryzen 5 9600X
AMD Ryzen 5 9600X
33095 Points
Minisforum MS-A1 (Nvidia GeForce RTX 4090 @OCuLink)
AMD Ryzen 7 8700G
30190 Points
Geekom GT1 Mega (Nvidia GeForce RTX 4090 @USB4)
Intel Core Ultra 9 185H
27686 Points
Khadas Mind 2 (Nvidia GeForce RTX 4090 @USB4)
Intel Core Ultra 7 155H
25802 Points
7680x4320 8k Optimized
Intel Core i5-14600K
12791 Points
AMD Ryzen 5 9600X
AMD Ryzen 5 9600X
12498 Points
Minisforum MS-A1 (Nvidia GeForce RTX 4090 @OCuLink)
AMD Ryzen 7 8700G
12251 Points
Geekom GT1 Mega (Nvidia GeForce RTX 4090 @USB4)
Intel Core Ultra 9 185H
12132 Points
Khadas Mind 2 (Nvidia GeForce RTX 4090 @USB4)
Intel Core Ultra 7 155H
12050 Points
Unigine Valley 1.0
1920x1080 Extreme HD DirectX AA:x8
AMD Ryzen 5 9600X
AMD Ryzen 5 9600X
324 fps +1512%
Intel Core i5-14600K
283.4 fps +1310%
Minisforum MS-A1 (Nvidia GeForce RTX 4090 @OCuLink)
AMD Ryzen 7 8700G
216.1 fps +975%
Geekom GT1 Mega (Nvidia GeForce RTX 4090 @USB4)
Intel Core Ultra 9 185H
208.7 fps +938%
Khadas Mind 2 (Nvidia GeForce RTX 4090 @USB4)
Intel Core Ultra 7 155H
187.1 fps +831%

20.1 fps
1920x1080 Extreme HD Preset OpenGL AA:x8
AMD Ryzen 5 9600X
AMD Ryzen 5 9600X
331.8 fps +1415%
Intel Core i5-14600K
303.2 fps +1284%
Minisforum MS-A1 (Nvidia GeForce RTX 4090 @OCuLink)
AMD Ryzen 7 8700G
231.7 fps +958%
Geekom GT1 Mega (Nvidia GeForce RTX 4090 @USB4)
Intel Core Ultra 9 185H
224.4 fps +925%
Khadas Mind 2 (Nvidia GeForce RTX 4090 @USB4)
Intel Core Ultra 7 155H
200.5 fps +816%

21.9 fps
Unigine Heaven 4.0
Extreme Preset OpenGL
AMD Ryzen 5 9600X
AMD Ryzen 5 9600X
472.4 fps +1198%
Intel Core i5-14600K
456.3 fps +1154%
Minisforum MS-A1 (Nvidia GeForce RTX 4090 @OCuLink)
AMD Ryzen 7 8700G
441.5 fps +1113%
Geekom GT1 Mega (Nvidia GeForce RTX 4090 @USB4)
Intel Core Ultra 9 185H
386.5 fps +962%
Khadas Mind 2 (Nvidia GeForce RTX 4090 @USB4)
Intel Core Ultra 7 155H
372.8 fps +924%

36.4 fps
Extreme Preset DX11
AMD Ryzen 5 9600X
AMD Ryzen 5 9600X
473.9 fps +1164%
Intel Core i5-14600K
473 fps +1161%
Minisforum MS-A1 (Nvidia GeForce RTX 4090 @OCuLink)
AMD Ryzen 7 8700G
422.3 fps +1026%
Khadas Mind 2 (Nvidia GeForce RTX 4090 @USB4)
Intel Core Ultra 7 155H
344.6 fps +819%
Geekom GT1 Mega (Nvidia GeForce RTX 4090 @USB4)
Intel Core Ultra 9 185H
343 fps +815%

37.5 fps
ComputeMark v2.1
1024x600 Normal, Score
Intel Core i5-14600K
92397 Points +1060%
AMD Ryzen 5 9600X
AMD Ryzen 5 9600X
92222 Points +1058%
Minisforum MS-A1 (Nvidia GeForce RTX 4090 @OCuLink)
AMD Ryzen 7 8700G
90882 Points +1041%
Khadas Mind 2 (Nvidia GeForce RTX 4090 @USB4)
Intel Core Ultra 7 155H
86314 Points +984%
Geekom GT1 Mega (Nvidia GeForce RTX 4090 @USB4)
Intel Core Ultra 9 185H
83349 Points +947%

7963 Points
1024x600 Normal, Fluid 3DTex
Intel Core i5-14600K
10797 Points +2095%
AMD Ryzen 5 9600X
AMD Ryzen 5 9600X
10756 Points +2086%
Minisforum MS-A1 (Nvidia GeForce RTX 4090 @OCuLink)
AMD Ryzen 7 8700G
10664 Points +2067%
Khadas Mind 2 (Nvidia GeForce RTX 4090 @USB4)
Intel Core Ultra 7 155H
10373 Points +2008%
Geekom GT1 Mega (Nvidia GeForce RTX 4090 @USB4)
Intel Core Ultra 9 185H
9972 Points +1927%

492 Points
1024x600 Normal, Fluid 2DTexArr
AMD Ryzen 5 9600X
AMD Ryzen 5 9600X
6948 Points +1327%
Intel Core i5-14600K
6920 Points +1321%
Minisforum MS-A1 (Nvidia GeForce RTX 4090 @OCuLink)
AMD Ryzen 7 8700G
6907 Points +1318%
Khadas Mind 2 (Nvidia GeForce RTX 4090 @USB4)
Intel Core Ultra 7 155H
6771 Points +1290%
Geekom GT1 Mega (Nvidia GeForce RTX 4090 @USB4)
Intel Core Ultra 9 185H
6566 Points +1248%

487 Points
1024x600 Normal, Mandel Vector
Intel Core i5-14600K
17355 Points +751%
AMD Ryzen 5 9600X
AMD Ryzen 5 9600X
17307 Points +749%
Minisforum MS-A1 (Nvidia GeForce RTX 4090 @OCuLink)
AMD Ryzen 7 8700G
17088 Points +738%
Khadas Mind 2 (Nvidia GeForce RTX 4090 @USB4)
Intel Core Ultra 7 155H
16044 Points +687%
Geekom GT1 Mega (Nvidia GeForce RTX 4090 @USB4)
Intel Core Ultra 9 185H
15583 Points +664%

2039 Points
1024x600 Normal, Mandel Scalar
Intel Core i5-14600K
22992 Points +1252%
AMD Ryzen 5 9600X
AMD Ryzen 5 9600X
22843 Points +1243%
Minisforum MS-A1 (Nvidia GeForce RTX 4090 @OCuLink)
AMD Ryzen 7 8700G
22633 Points +1231%
Khadas Mind 2 (Nvidia GeForce RTX 4090 @USB4)
Intel Core Ultra 7 155H
21302 Points +1152%
Geekom GT1 Mega (Nvidia GeForce RTX 4090 @USB4)
Intel Core Ultra 9 185H
20574 Points +1110%

1701 Points
1024x600 Normal, QJuliaRayTrace
AMD Ryzen 5 9600X
AMD Ryzen 5 9600X
34367 Points +959%
Intel Core i5-14600K
34333 Points +958%
Minisforum MS-A1 (Nvidia GeForce RTX 4090 @OCuLink)
AMD Ryzen 7 8700G
33589 Points +935%
Khadas Mind 2 (Nvidia GeForce RTX 4090 @USB4)
Intel Core Ultra 7 155H
31824 Points +881%
Geekom GT1 Mega (Nvidia GeForce RTX 4090 @USB4)
Intel Core Ultra 9 185H
30654 Points +845%

3244 Points
Performance Rating - Percent
AMD Ryzen 5 9600X
AMD Ryzen 5 9600X
100 pt
Minisforum MS-A1 (Nvidia GeForce RTX 4090 @OCuLink)
AMD Ryzen 7 8700G
75.5 pt
Geekom GT1 Mega (Nvidia GeForce RTX 4090 @USB4)
Intel Core Ultra 9 185H
39.9 pt
Khadas Mind 2 (Nvidia GeForce RTX 4090 @USB4)
Intel Core Ultra 7 155H
32.4 pt
Cyberpunk 2077 2.1 Phantom Liberty
1280x720 Low Preset (FSR off)
AMD Ryzen 5 9600X
AMD Ryzen 5 9600X
256 (183.7min - 319max) fps +341%
Minisforum MS-A1 (Nvidia GeForce RTX 4090 @OCuLink)
AMD Ryzen 7 8700G
187.3 (143.6min - 225max) fps +223%
Geekom GT1 Mega (Nvidia GeForce RTX 4090 @USB4)
Intel Core Ultra 9 185H
88.9 (67.9min - 123.3max) fps +53%
Khadas Mind 2 (Nvidia GeForce RTX 4090 @USB4)
Intel Core Ultra 7 155H
79.7 (62.5min - 101.2max) fps +37%

58 (49.1min - 71.8max) fps
1920x1080 Medium Preset (FSR off)
AMD Ryzen 5 9600X
AMD Ryzen 5 9600X
252 (174.7min - 318max) fps +703%
Minisforum MS-A1 (Nvidia GeForce RTX 4090 @OCuLink)
AMD Ryzen 7 8700G
184.9 (141min - 225max) fps +489%
Geekom GT1 Mega (Nvidia GeForce RTX 4090 @USB4)
Intel Core Ultra 9 185H
87.8 (65.1min - 123max) fps +180%
Khadas Mind 2 (Nvidia GeForce RTX 4090 @USB4)
Intel Core Ultra 7 155H
77.5 (58.3min - 109.1max) fps +147%

31.4 (27.8min - 35.6max) fps
1920x1080 Ultra Preset (FSR off)
AMD Ryzen 5 9600X
AMD Ryzen 5 9600X
204 (126.1min - 264max) fps +776%
Minisforum MS-A1 (Nvidia GeForce RTX 4090 @OCuLink)
AMD Ryzen 7 8700G
161.8 (107min - 205max) fps +594%
Geekom GT1 Mega (Nvidia GeForce RTX 4090 @USB4)
Intel Core Ultra 9 185H
75 (50.3min - 110.2max) fps +222%
Khadas Mind 2 (Nvidia GeForce RTX 4090 @USB4)
Intel Core Ultra 7 155H
68.8 (46.7min - 98.6max) fps +195%

23.3 (20.1min - 28.1max) fps
Baldur's Gate 3
1920x1080 Low Preset
AMD Ryzen 5 9600X
AMD Ryzen 5 9600X
253 (30.2min, 76.7P0.1, 155.7P1 - 431max) fps +544%
Minisforum MS-A1 (Nvidia GeForce RTX 4090 @OCuLink)
AMD Ryzen 7 8700G
200 (109.4min, 129.1P0.1, 154.1P1 - 278max) fps +409%
Geekom GT1 Mega (Nvidia GeForce RTX 4090 @USB4)
Intel Core Ultra 9 185H
189.1 (95.1min, 108.7P0.1, 136.8P1 - 323max) fps +381%
Khadas Mind 2 (Nvidia GeForce RTX 4090 @USB4)
Intel Core Ultra 7 155H
142.8 (70.4min, 75.8P0.1, 97.6P1 - 236max) fps +263%

39.3 (24.3min, 25.4P0.1, 28P1 - 90.7max) fps
1920x1080 Medium Preset
AMD Ryzen 5 9600X
AMD Ryzen 5 9600X
231 (52.4min, 123P0.1, 150.8P1 - 382max) fps +662%
Minisforum MS-A1 (Nvidia GeForce RTX 4090 @OCuLink)
AMD Ryzen 7 8700G
194.4 (102.5min, 120P0.1, 151.2P1 - 274max) fps +542%
Geekom GT1 Mega (Nvidia GeForce RTX 4090 @USB4)
Intel Core Ultra 9 185H
168.3 (71.8min, 94P0.1, 117.8P1 - 266max) fps +455%
Khadas Mind 2 (Nvidia GeForce RTX 4090 @USB4)
Intel Core Ultra 7 155H
114 (35.5min, 44P0.1, 57.3P1 - 219max) fps +276%

30.3 (18.1min, 18.2P0.1, 20.2P1 - 85.2max) fps
1920x1080 Ultra Preset
AMD Ryzen 5 9600X
AMD Ryzen 5 9600X
212 (16.9min, 120.1P0.1, 151.8P1 - 372max) fps +741%
Minisforum MS-A1 (Nvidia GeForce RTX 4090 @OCuLink)
AMD Ryzen 7 8700G
190.9 (107.5min, 129.1P0.1, 148.8P1 - 259max) fps +658%
Geekom GT1 Mega (Nvidia GeForce RTX 4090 @USB4)
Intel Core Ultra 9 185H
151.8 (67.2min, 82P0.1, 101.9P1 - 254max) fps +502%
Khadas Mind 2 (Nvidia GeForce RTX 4090 @USB4)
Intel Core Ultra 7 155H
109.2 (29.8min, 38.6P0.1, 55.9P1 - 199max) fps +333%

25.2 (11.9min, 13P0.1, 16.6P1 - 75.3max) fps
F1 24
1920x1080 Low Preset AA:T AF:16x
AMD Ryzen 5 9600X
AMD Ryzen 5 9600X
405 (297min, 246P1 - 476max) fps +380%
Minisforum MS-A1 (Nvidia GeForce RTX 4090 @OCuLink)
AMD Ryzen 7 8700G
269 (203min, 181P1 - 313max) fps +219%

84.3 (70min, 66P1 - 97max) fps
Geekom GT1 Mega (Nvidia GeForce RTX 4090 @USB4)
Intel Core Ultra 9 185H
78.1 (43min, 45P1 - 98max) fps -7%
Khadas Mind 2 (Nvidia GeForce RTX 4090 @USB4)
Intel Core Ultra 7 155H
74.6 (42min, 44P1 - 94max) fps -12%
1920x1080 Medium Preset AA:T AF:16x
AMD Ryzen 5 9600X
AMD Ryzen 5 9600X
421 (328min, 262P1 - 470max) fps +470%
Minisforum MS-A1 (Nvidia GeForce RTX 4090 @OCuLink)
AMD Ryzen 7 8700G
285 (216min, 190P1 - 313max) fps +286%
Geekom GT1 Mega (Nvidia GeForce RTX 4090 @USB4)
Intel Core Ultra 9 185H
74.4 (42min, 44P1 - 86max) fps +1%

73.8 (61min, 59P1 - 88max) fps
Khadas Mind 2 (Nvidia GeForce RTX 4090 @USB4)
Intel Core Ultra 7 155H
72.1 (41min, 43P1 - 85max) fps -2%
1920x1080 High Preset AA:T AF:16x
AMD Ryzen 5 9600X
AMD Ryzen 5 9600X
401 (305min, 241P1 - 449max) fps +632%
Minisforum MS-A1 (Nvidia GeForce RTX 4090 @OCuLink)
AMD Ryzen 7 8700G
267 (203min, 176P1 - 297max) fps +387%
Geekom GT1 Mega (Nvidia GeForce RTX 4090 @USB4)
Intel Core Ultra 9 185H
61.7 (35min, 37P1 - 75max) fps +13%
Khadas Mind 2 (Nvidia GeForce RTX 4090 @USB4)
Intel Core Ultra 7 155H
60.1 (35min, 36P1 - 74max) fps +10%

54.8 (43min, 45P1 - 64max) fps
1920x1080 Ultra High Preset AA:T AF:16x
AMD Ryzen 5 9600X
AMD Ryzen 5 9600X
205 (90min, 114P1 - 235max) fps
Minisforum MS-A1 (Nvidia GeForce RTX 4090 @OCuLink)
AMD Ryzen 7 8700G
154.4 (74min, 88P1 - 171max) fps
Geekom GT1 Mega (Nvidia GeForce RTX 4090 @USB4)
Intel Core Ultra 9 185H
43.9 (24min, 26P1 - 52max) fps
Khadas Mind 2 (Nvidia GeForce RTX 4090 @USB4)
Intel Core Ultra 7 155H
41.7 (23min, 24P1 - 48max) fps
Geekom GT1 Mega, Intel Arc 8-Core iGPU
Ultra 9 185H
Geekom GT1 Mega (Nvidia GeForce RTX 4090 @USB4) ,
Ultra 9 185H
Khadas Mind 2 (Nvidia GeForce RTX 4090 @USB4) ,
Ultra 7 155H
Minisforum MS-A1 (Nvidia GeForce RTX 4090 @OCuLink) ,
Ryzen 7 8700G
AMD Ryzen 5 9600X, NVIDIA GeForce RTX 4090
Ryzen 5 9600X
Intel Core i5-14600K, NVIDIA GeForce RTX 4090
i5-14600K
Average of class Mini PC
 
SPECviewperf 2020
775%
786%
1064%
1037%
1398%
129%
3840x2160 Medical (medical-03)
7.07
42.1
495%
42.3
498%
43.2
511%
43.5
515%
40.2
469%
3840x2160 Energy (energy-03)
5
92.8
1756%
95.3
1806%
141
2720%
95.6
1812%
229
4480%
3840x2160 Creo (creo-03)
19.8
91.1
360%
83.8
323%
128
546%
143
622%
139
602%
3840x2160 CATIA (catia-06)
11.7
77.3
561%
75.7
547%
85.2
628%
94.2
705%
94.3
706%
3840x2160 3ds Max (3dsmax-07)
15.5
158
919%
160
932%
204
1216%
231
1390%
235
1416%
3840x2160 Siemens NX (snx-04)
5.68
31.9
462%
33
481%
40.3
610%
48.1
747%
46.3
715%
3840x2160 Maya (maya-06)
38.8
378
874%
393
913%
512
1220%
609
1470%
lowmed.highultraQHD4K
Dota 2 Reborn (2015) 182.3 156.9 153.6 143 136
Final Fantasy XV Benchmark (2018) 209 196.8 164.3 156.8 119.2
X-Plane 11.11 (2018) 143.6 134.1 101.8 87.2
Baldur's Gate 3 (2023) 189.1 168.3 152.7 151.8 136.9 96.1
Cyberpunk 2077 2.1 Phantom Liberty (2023) 88.8 87.8 79.3 75 74.3 53.1
F1 24 (2024) 78.1 74.4 61.7 43.9 43.2 42

Emisje: Zbyt głośny i nieprzyjazny dla użytkownika

Emisja hałasu

Chociaż Geekom zaprojektował GT1 Mega tak, aby był większy i w rezultacie dał mu większą jednostkę chłodzącą, system działa cicho tylko w trybie bezczynności, gdy jest dostarczany. Jeśli zażądają Państwo czegoś od urządzenia, wentylator włącza się i wytwarza hałas, którego nie można zignorować.

W porównaniu widzimy podobieństwa do Geekom AX8 Pro, który jest znacznie mniejszy. Dzięki UH125 Pro Minisforum pokazuje, jak można to zrobić lepiej, jeśli ograniczymy się do poziomu ciśnienia akustycznego pod obciążeniem.

W związku z tym zalecamy aktywację trybu cichego w BIOS-ie, aby nieco zmniejszyć głośność pod obciążeniem. Ogólnie rzecz biorąc, obszar sterowania wentylatorami wydaje się bardzo niedojrzały. Więcej opcji regulacji prędkości wentylatorów byłoby z pewnością pierwszym krokiem. Sensowne byłoby również opracowanie małego narzędzia do zmiany prędkości wentylatora z poziomu systemu Windows.

Hałas

luz
25.4 / 27.2 / 27.5 dB
obciążenie
50.9 / 50.9 dB
  red to green bar
 
 
30 dB
cichy
40 dB(A)
słyszalny
50 dB(A)
irytujący
 
min: dark, med: mid, max: light   Earthworks M23R (odległość 15 cm)   environment noise: 24.8 dB(A)
dB(A) 0102030405060708090Deep BassMiddle BassHigh BassLower RangeMidsHigher MidsLower HighsMid HighsUpper HighsSuper Highs2034.138.635.837.434.13734.12535.434.332.936.236.331.135.43139.738.139.640.338.64039.74026.629.625.426.423.223.926.650293428.630.426.225.3296327.832.533.93227.923.227.88024.525.922.424.622.722.724.510024.924.921.623.221.92124.912524.723.815.915.914.813.424.716022.72314.114.111.99.322.720025.525.214.715.614.210.525.525027.627.412.812.912.79.627.631526.826.911.11313.39.226.840026.926.91011.511.69.626.950030.430.310.813.412.38.830.463031.230.810.513.412.88.931.280034.734.811.314.514.19.334.7100039.138.512.716.816.69.939.1125040.940.612.917.51710.640.9160040.440.511.916.215.711.240.4200042.642.512.616.115.811.842.6250040.340.513.115.215.112.540.3315037.938.213.415.615.213.437.9400043.143.113.815.414.91443.150003736.914.314.414.214.237630029.429.614.614.814.814.529.4800029.73014.814.914.914.829.71000024.525.514.914.915.114.624.51250017.819.414.714.714.814.417.8160001617.514.314.314.31416SPL50.950.925.427.627.224.850.9N6.76.70.60.90.80.56.7median 29.7median 30median 13.4median 14.9median 14.8median 11.8median 29.7Delta6.57.21.70.90.82.46.5hearing rangehide median Fan NoiseGeekom GT1 Mega
Geekom GT1 Mega
Ultra 9 185H, Arc 8-Core
Geekom AX8 Pro
R9 8945H, Radeon 780M
Asus NUC 14 Pro
Ultra 5 125H, Arc 7-Core
Minisforum UH125 Pro
Ultra 5 125H, Arc 7-Core
Geekom GT13 Pro
i9-13900H, Iris Xe G7 96EUs
Acemagic F2A
Ultra 7 155H, Arc 8-Core
Noise
3%
6%
-6%
2%
4%
off / environment *
24.8
24.9
-0%
24
3%
24.8
-0%
24.3
2%
24.9
-0%
Idle Minimum *
25.4
24.9
2%
26
-2%
35
-38%
27.9
-10%
25.4
-0%
Idle Average *
27.2
24.9
8%
26.2
4%
35
-29%
27.9
-3%
25.7
6%
Idle Maximum *
27.5
24.9
9%
26.2
5%
35
-27%
28
-2%
25.7
7%
Load Average *
50.9
50.1
2%
42.4
17%
42.2
17%
43.8
14%
47.8
6%
Cyberpunk 2077 ultra *
50.8
50
2%
47.7
6%
40.8
20%
45.4
11%
Load Maximum *
50.9
50.2
1%
47.8
6%
43.9
14%
48.5
5%
49
4%
Witcher 3 ultra *
45.23

* ... im mniej tym lepiej

Temperatura

Obudowa Geekom GT1 Mega nagrzewa się tylko nieznacznie podczas bezczynności. Dzięki szybko obracającemu się wentylatorowi, generowane ciepło jest natychmiast odprowadzane z obudowy, co prowadzi do niskich temperatur powierzchni nawet pod obciążeniem.

Procesor Intel Core Ultra 9 185H nie osiąga 100 °C w teście obciążeniowym. Średnio temperatura spada do niekrytycznego zakresu. Maksymalna wartość jest osiągana tylko wtedy, gdy SoC korzysta z PL2.

System chłodzenia jest w stanie dobrze rozproszyć 45 W przez dłuższy czas. Ze względu na większą konstrukcję GT1 Mega w porównaniu do poprzednich urządzeń Geekom, niestety nie ma większej przewagi.

Test warunków skrajnych Prime95, solo
Test obciążeniowy FurMark, solo
Prime95 i test warunków skrajnych FurMark
Test obciążeniowy Geekom GT1 Mega (górna strona)
Test obciążeniowy Geekom GT1 Mega (spód)
Test obciążeniowy Geekom GT1 Mega (tył)
Zasilacz podczas testu warunków skrajnych
w stresie
 31.2 °C32.9 °C32.9 °C 
 28.9 °C30.7 °C30.1 °C 
 29.4 °C29.6 °C29.6 °C 
maks. w ogóle: 32.9 °C
średnia: 30.6 °C
34.3 °C33.6 °C32.2 °C
33 °C36.5 °C30.3 °C
31.6 °C28.8 °C28.8 °C
maks. w ogóle: 36.5 °C
średnia: 32.1 °C
zasilacz  44.3 °C | temperatura otoczenia 21.9 °C | Fluke t3000FC (calibrated)
(+) The average temperature for the upper side under maximal load is 30.6 °C / 87 F, compared to the average of 32.3 °C / 90 F for the devices in the class Mini PC.
(+) The maximum temperature on the upper side is 32.9 °C / 91 F, compared to the average of 35.8 °C / 96 F, ranging from 24 to 69.5 °C for the class Mini PC.
(+) The bottom heats up to a maximum of 36.5 °C / 98 F, compared to the average of 36.1 °C / 97 F
(+) In idle usage, the average temperature for the upper side is 29.7 °C / 85 F, compared to the device average of 32.3 °C / 90 F.

Zarządzanie energią: Na równi z Asus NUC 14 Pro

Geekom GT1 Mega to ekonomiczny mini PC, jeśli chodzi o zużycie energii, co potwierdziły nasze pomiary. Nawet w stanie spoczynku urządzenie jest bardzo oszczędne. Tylko Asus NUC 14 Pro może nadążyć za Geekom GT1 Mega i osiągnąć podobnie dobre wartości.

Pod obciążeniem nasza próbka testowa jest nadal stosunkowo oszczędna ze średnią 65,8 W, chociaż możliwe są wartości szczytowe do 105 W. Pod względem wydajności wystarcza to jednak tylko na drugie miejsce. W tym przypadku Geekom AX8 Pro z AMD Ryzen 9 8945HS wypada ogólnie lepiej.

Zasilacz o mocy 120 W dostarczany z Geekom GT1 Mega spotkaliśmy w różnych mini PC od Geekom. Maksymalna wydajność jest wystarczająca i jest wystarczająco dużo miejsca na opcjonalne drugie urządzenie do przechowywania danych.

Geekom GT1 Mega z zasilaczem (19 V; 6,32 A)
Zasilacz (19 V; 6,32 A)
Pobór mocy
wyłączony / stan wstrzymaniadarklight 1.35 / 5.4 W
luzdarkmidlight 4.1 / 6.6 / 11.3 W
obciążenie midlight 65.8 / 104.8 W
 color bar
Legenda: min: dark, med: mid, max: light        Metrahit Energy
Geekom GT1 Mega
Ultra 9 185H, Arc 8-Core
Geekom AX8 Pro
R9 8945H, Radeon 780M
Asus NUC 14 Pro
Ultra 5 125H, Arc 7-Core
Minisforum UH125 Pro
Ultra 5 125H, Arc 7-Core
Geekom GT13 Pro
i9-13900H, Iris Xe G7 96EUs
Acemagic F2A
Ultra 7 155H, Arc 8-Core
Average Intel Arc 8-Core iGPU
 
Average of class Mini PC
 
Power Consumption
-74%
-3%
-47%
-34%
-39%
-6%
-46%
Idle Minimum *
4.1
14
-241%
5.1
-24%
11.9
-190%
7.9
-93%
9.1
-122%
5.42 ?(1.8 - 10.3, n=38)
-32%
Idle Average *
6.6
15.9
-141%
6.4
3%
14.6
-121%
10.3
-56%
10.3
-56%
8.63 ?(4.2 - 16, n=38)
-31%
Idle Maximum *
11.3
19.5
-73%
14.7
-30%
15.4
-36%
22.3
-97%
14.4
-27%
Load Average *
65.8
76.4
-16%
55.5
16%
48.3
27%
57.44
13%
54.9
17%
Cyberpunk 2077 ultra external monitor *
69.4
54.3
22%
59.1
15%
52.7
24%
55.9
19%
Load Maximum *
104.8
99.1
5%
103.3
1%
89.8
14%
93.4
11%
110.4
-5%

* ... im mniej tym lepiej

Power efficiency

Performance Rating - Percent
Geekom AX8 Pro
AMD Ryzen 9 8945H, Radeon 780M
94.7 pt
Geekom GT1 Mega
Intel Core Ultra 9 185H, Arc 8-Core
84 pt
Geekom GT13 Pro
Intel Core i9-13900H, Iris Xe G7 96EUs
81.1 pt
Minisforum UH125 Pro
Intel Core Ultra 5 125H, Arc 7-Core
81 pt
Asus NUC 14 Pro
Intel Core Ultra 5 125H, Arc 7-Core
80.5 pt
Acemagic F2A
Intel Core Ultra 7 155H, Arc 8-Core
78.7 pt
Power Consumption
Cinebench R23 Multi Power Efficiency - external Monitor
Geekom AX8 Pro
AMD Ryzen 9 8945H, Radeon 780M
219 Points per Watt +12%
Geekom GT13 Pro
Intel Core i9-13900H, Iris Xe G7 96EUs
210 Points per Watt +8%
Geekom GT1 Mega
Intel Core Ultra 9 185H, Arc 8-Core
194.8 Points per Watt
Acemagic F2A
Intel Core Ultra 7 155H, Arc 8-Core
183.7 Points per Watt -6%
Minisforum UH125 Pro
Intel Core Ultra 5 125H, Arc 7-Core
181.1 Points per Watt -7%
Asus NUC 14 Pro
Intel Core Ultra 5 125H, Arc 7-Core
163.7 Points per Watt -16%
Cinebench R23 Single Power Efficiency - external Monitor
Asus NUC 14 Pro
Intel Core Ultra 5 125H, Arc 7-Core
69.4 Points per Watt +22%
Geekom AX8 Pro
AMD Ryzen 9 8945H, Radeon 780M
58.3 Points per Watt +3%
Minisforum UH125 Pro
Intel Core Ultra 5 125H, Arc 7-Core
57.1 Points per Watt +1%
Geekom GT1 Mega
Intel Core Ultra 9 185H, Arc 8-Core
56.7 Points per Watt
Geekom GT13 Pro
Intel Core i9-13900H, Iris Xe G7 96EUs
54.3 Points per Watt -4%
Acemagic F2A
Intel Core Ultra 7 155H, Arc 8-Core
54.2 Points per Watt -4%
Cinebench R15 Multi Efficiency (external Monitor)
Geekom AX8 Pro
AMD Ryzen 9 8945H, Radeon 780M
35.9 Points per Watt +23%
Geekom GT1 Mega
Intel Core Ultra 9 185H, Arc 8-Core
29.2 Points per Watt
Minisforum UH125 Pro
Intel Core Ultra 5 125H, Arc 7-Core
28 Points per Watt -4%
Acemagic F2A
Intel Core Ultra 7 155H, Arc 8-Core
26.6 Points per Watt -9%
Geekom GT13 Pro
Intel Core i9-13900H, Iris Xe G7 96EUs
24.8 Points per Watt -15%
Asus NUC 14 Pro
Intel Core Ultra 5 125H, Arc 7-Core
24 Points per Watt -18%

Power consumption: External monitor

0102030405060708090100Tooltip
Geekom GT1 Mega Ultra 9 185H, Arc 8-Core; Idle 1min (external Monitor): Ø6.65 (4.54-11.3)
Geekom AX8 Pro R9 8945H, Radeon 780M; Idle 1min (external Monitor): Ø15.9 (14.3-19.4)
Asus NUC 14 Pro Ultra 5 125H, Arc 7-Core; Idle 1min (external Monitor): Ø6.48 (4.52-12)
Geekom GT1 Mega Ultra 9 185H, Arc 8-Core; 1280x720 Prime95 28.10 and Furmark 1.25: Ø75.4 (64.2-104.8)
Geekom AX8 Pro R9 8945H, Radeon 780M; 1280x720 Prime95 28.10 and Furmark 1.25: Ø89.4 (87.8-94.6)
Asus NUC 14 Pro Ultra 5 125H, Arc 7-Core; 1280x720 Prime95 28.10 and Furmark 1.25: Ø90.8 (85.1-98.5)
Geekom GT1 Mega Ultra 9 185H, Arc 8-Core; Cyberpunk 2077 FHD ultra no FSR (external Monitor): Ø69.4 (66.7-76.7)
Geekom AX8 Pro R9 8945H, Radeon 780M; Cyberpunk 2077 FHD ultra no FSR (external Monitor): Ø54.3 (43.7-67.1)
Asus NUC 14 Pro Ultra 5 125H, Arc 7-Core; Cyberpunk 2077 FHD ultra no FSR (external Monitor): Ø59.1 (55.8-67.9)
Geekom GT1 Mega Ultra 9 185H, Arc 8-Core; 3DMark06 Return To Proxycon: Ø65.8 (59-72.8)
Geekom AX8 Pro R9 8945H, Radeon 780M; 3DMark06 Return To Proxycon: Ø76.5 (55.7-96.2)
Asus NUC 14 Pro Ultra 5 125H, Arc 7-Core; 3DMark06 Return To Proxycon: Ø55.5 (51.2-61.4)

Power consumption: External monitor

0102030405060708090100Tooltip
Geekom GT1 Mega Ultra 9 185H, Arc 8-Core; Prime95 V2810 Stress (external Monitor): Ø75.6 (62.9-104.6)
Geekom AX8 Pro R9 8945H, Radeon 780M; Prime95 V2810 Stress (external Monitor): Ø75.9 (72.6-96)
Asus NUC 14 Pro Ultra 5 125H, Arc 7-Core; Prime95 V2810 Stress (external Monitor): Ø90.6 (79.2-103.3)
Geekom GT1 Mega Ultra 9 185H, Arc 8-Core; Cinebench R15 Multi (external Monitor): Ø95.8 (95-96.5)
Geekom AX8 Pro R9 8945H, Radeon 780M; Cinebench R15 Multi (external Monitor): Ø70.3 (63.2-83)
Asus NUC 14 Pro Ultra 5 125H, Arc 7-Core; Cinebench R15 Multi (external Monitor): Ø89.2 (88-90.9)
Geekom GT1 Mega Ultra 9 185H, Arc 8-Core; Cinebench R23 Single (external Monitor): Ø31.3 (15.7-81.3)
Geekom AX8 Pro R9 8945H, Radeon 780M; Cinebench R23 Single (external Monitor): Ø31 (25.6-51.4)
Asus NUC 14 Pro Ultra 5 125H, Arc 7-Core; Cinebench R23 Single (external Monitor): Ø24.8 (20.8-58)
Geekom GT1 Mega Ultra 9 185H, Arc 8-Core; Cinebench R23 Multi (external Monitor): Ø95.5 (94-96.6)
Geekom AX8 Pro R9 8945H, Radeon 780M; Cinebench R23 Multi (external Monitor): Ø70.9 (66.8-89.8)
Asus NUC 14 Pro Ultra 5 125H, Arc 7-Core; Cinebench R23 Multi (external Monitor): Ø88.7 (86.9-91.6)
Geekom GT1 Mega Ultra 9 185H, Arc 8-Core; 1280x720 FurMark 1.19 GPU Stress Test (external Monitor): Ø58.2 (56.2-74.2)
Geekom AX8 Pro R9 8945H, Radeon 780M; 1280x720 FurMark 1.19 GPU Stress Test (external Monitor): Ø85.7 (73.1-99.9)
Asus NUC 14 Pro Ultra 5 125H, Arc 7-Core; 1280x720 FurMark 1.19 GPU Stress Test (external Monitor): Ø56.9 (53.6-63.3)

Ogólna ocena Notebookcheck

Geekom GT1 Mega to potężny mini PC o szerokim zakresie zastosowań. Dzięki najnowocześniejszemu sprzętowi i szerokiej gamie połączeń, mini PC jest przyszłościowy.

Oparty na procesorze Intel Core Ultra 9 185H i 32 GB pamięci RAM, GT1 Mega zapewnia doskonałą wydajność w testach aplikacji biurowych, a także radzi sobie z wymagającymi dużej mocy zadaniami multimedialnymi. Jedyną wadą jest momentami głośne chłodzenie, które jest wyraźnie słyszalne nawet przy średnim obciążeniu.

Geekom GT1 Mega - 06/11/2024 v8
Sebastian Bade

Wykonanie
87 / 98 → 89%
Komunikacja
74 / 81 → 91%
Waga
80%
Wydajność w grach
48 / 80 → 60%
Wydajność w programach użytkowych
84 / 92 → 91%
Workstation
34%
AI Performance
84%
Temperatura
93%
Hałas
73%
Średnio
54%
79%
Mini PC - Ważona średnia
CO2 Emissions
No Data
Materials
25%
Packaging
25%
Power Use
63.4%
Repairability
30%
Software Updates
39%
Recycle Logo Total Sustainability Score: 30.4%

Transparency

The selection of devices to be reviewed is made by our editorial team. The test sample was given to the author by the manufacturer free of charge for the purposes of review. There was no third-party influence on this review, nor did the manufacturer receive a copy of this review before publication. There was no obligation to publish this review. We never accept compensation or payment in return for our reviews. As an independent media company, Notebookcheck is not subjected to the authority of manufacturers, retailers or publishers.

This is how Notebookcheck is testing

Every year, Notebookcheck independently reviews hundreds of laptops and smartphones using standardized procedures to ensure that all results are comparable. We have continuously developed our test methods for around 20 years and set industry standards in the process. In our test labs, high-quality measuring equipment is utilized by experienced technicians and editors. These tests involve a multi-stage validation process. Our complex rating system is based on hundreds of well-founded measurements and benchmarks, which maintains objectivity. Further information on our test methods can be found here.

Please share our article, every link counts!
Mail Logo
> laptopy testy i recenzje notebooki > Laptopy > Recenzja Geekom GT1 Mega: Pierwszy mini PC AI Geekom nie przekonuje we wszystkich aspektach
Sebastian Bade, 2024-11-14 (Update: 2024-11-14)