Notebookcheck Logo
Teaser

Recenzja Dell Pro 14 Premium: Flagowy subnotebook OLED dla biznesu

Latitude z nastawieniem.

W tym roku firma Dell zamierza zresetować wszystkie swoje laptopy. Czy po śmierci nazwy Latitude nowy Dell Pro 14 Premium może przejąć jej rolę?
Allen Ngo, 👁 Allen Ngo (tłumaczenie DeepL / Ninh Duy) Opublikowany 🇺🇸 🇫🇷 ...
Laptop / Notebook Lunar Lake Business

Werdykt - smuklejszy i bardziej wydajny z ekranem OLED w zestawie

Nie widać tego po matowo-szarej obudowie, ale Dell Pro 14 Premium kryje w sobie mnóstwo ulepszeń i zmian w stosunku do zeszłorocznej serii Latitude 7440 lub Latitude 9440. Jego najbardziej godną uwagi cechą jest prawdopodobnie nowy ekran dotykowy OLED, który zapewnia poziom wierności, który był wcześniej niedostępny w starszym Latitude 14. Tymczasem procesor Lunar Lake oferuje znaczną poprawę zarówno pod względem wydajności graficznej, jak i efektywności energetycznej, do tego stopnia, że czas pracy na baterii jest zauważalnie dłuższy niż w poprzedniej generacji, pomimo ogólnie szybszej wydajności i bardziej wymagającego panelu OLED.

Chociaż nie ma żadnych poważnych niepowodzeń, warto wspomnieć o kilku mniejszych. Choć panel OLED może być niezły, jego częstotliwość odświeżania 60 Hz wydaje się przestarzała, gdy 90 Hz lub więcej staje się powszechne. Opcje aktualizacji są ograniczone, jeśli chodzi o pamięć masową, a fotografowie lub redaktorzy w szczególności mogą nienawidzić braku zintegrowanego czytnika kart SD, aby lepiej wykorzystać kolory OLED i szybszą zintegrowaną moc graficzną. Doświadczenie pisania jest nieco płytsze i bardziej gąbczaste niż na HP EliteBook Ultra G1i 14 który jest również cieńszy i lżejszy (choć mniej naprawialny) niż nasz Dell, a jednocześnie oferuje szybsze opcje OLED 120 Hz. Dell Pro 14 Premium to nadal jeden z najlepszych subnotebooków Della dla firm i ulepszenie w stosunku do poprzedników Latitude 14, ale przydałaby mu się dodatkowa moc, aby jeszcze bardziej wyprzedzić konkurencję.

Za

+ cicha praca przy niskich i średnich obciążeniach
+ wysoka wydajność w przeliczeniu na wat
+ niskie temperatury pracy
+ głośne głośniki wewnętrzne
+ długa żywotność baterii

Przeciw

- obsługuje tylko krótsze dyski M.2 2230
- minimalny wzrost wydajności procesora
- mniej portów USB-A niż wcześniej
- poziom hałasu wentylatora mógłby być niższy
- brak opcji wysokiej częstotliwości odświeżania

Cena i dostępność

Dell Pro 14 Premium jest już dostępny w sprzedaży w firmie Dell w cenie od 1800 USD za podstawową konfigurację Core Ultra 5 FHD+ do 2500 USD za konfigurację Core Ultra 7 QHD+ OLED, zgodnie z recenzją.

Amazon Logo
$49.99
Smatree 14 inch Laptop Sleeve for DELL Pro 14 Plus PB14250, for DELL Pro 14 Premium PA14250, Laptop Case with Accessory Pocket, YKK Zipper, Patented Shockproof Design (E425)
  • $39.99
    Smatree Hard EVA Protective Sleeve Case Compatible for 14 inch Dell Pro 14 Premium (PA14250), for 14 inch DELL Latitude 9450/9440/9430/9420/9410 or 2-in-1 Laptop Notebook Sleeve Bag (X8038)
  • $22.99
    Alapmk Protective Case for Dell Pro 14 Premium PA14250/ThinkPad X1 2-in-1 Gen 10 Aura Edition/Slim 7i Aura Edition 14 Gen 10/EliteBook Ultra 14 G1i/EliteBook X Flip 14 G1i/EliteBook X 14 G1i,Black

Dell Pro 14 Premium to zupełnie nowa, biznesowa seria wprowadzona w tym roku w celu zastąpienia starszej 14-calowej serii Latitude 14 7400 lub 9400. Chociaż konwencja nazewnictwa uległa zmianie, model nadal ma wiele cech wspólnych z zeszłorocznym Latitude 7440 lub 9440 2-w-1 dzięki czemu można poczuć się jak na Latitude.

Nasza jednostka testowa to wyższej klasy konfiguracja z procesorem Lunar Lake Core Ultra 7 268V, 32 GB pamięci RAM i ekranem dotykowym OLED 1800p za około 2500 USD. Niższe opcje obejmują Core Ultra 5 236V i bezdotykowy wyświetlacz IPS 1200p za 1800 USD.

Alternatywy dla Dell Pro 14 Premium obejmują inne flagowe subnotebooki biurowe, takie jak HP EliteBook Ultra G1i 14 lub Lenovo ThinkPad T14s Gen 6.

Więcej recenzji Dell:

Specyfikacje

Dell Pro 14 Premium
Procesor
Intel Core Ultra 7 268V 8 x 2.2 - 5 GHz, 40 W PL2 / Short Burst, 31 W PL1 / Sustained, Lunar Lake
Karta grafiki
Intel Arc Graphics 140V, rdzeń: 2000 MHz, LPDDR5x, 32.0.101.6647
Pamięć
32 GB 
, LPDDR5x, 8533 MT/s, Soldered
Matryca
14.00 cali 16:10, 2880 x 1800 pikseli 243 PPI, 10-point capacitive, LG Phillips 140WT1, OLED, Dell P/N: XFT7J, LGD07A0, refleksująca: tak, HDR, 60 Hz
Dysk twardy
Kioxia BG6 KBG6AZNV1T02, 1024 GB 
Karta dźwiękowa
Intel Lunar Lake SOC - cAVS (Audio, Voice, Speech)
Złącza
1 USB 3.0, 2 USB 3.2 Gen 2x2 20Gbps, 2 Thunderbolt, USB-C Power Delivery (PD), 1 HDMI, 2 DisplayPort, 1 blokada Kensingtona, gniazda audio: 3.5 mm combo, 1 czytnik linii papilarnych, Czujnik jasności
Łączność
Intel BE201 320MHz (a/b/g/h/n = Wi-Fi 4/ac = Wi-Fi 5/ax = Wi-Fi 6/ Wi-Fi 6E 6 GHz be = Wi-Fi 7), Bluetooth 5.4
Gabaryty
wysokość x szerokość x głębokość (mm): 17.95 x 311.2 x 216.7
Akumulator
60 Wh litowo-polimerowy
System operacyjny
Microsoft Windows 11 Pro
Kamera
kamerka: 1440p30
Główny aparat: 8.3 MPix
Inne
głośniki: Quad, 2x 2 W, klawiatura: Zer0-lattice, podświetlanie klawiatury: tak, Dell Optimizer, 36 miesiące(y) gwarancji
Waga
1.261 kg, zasilacz: 304 g
Cena
2500 USD
Uwaga: Producent może używać komponentów pochodzących od różnych dostawców, w tym paneli wyświetlaczy, napędów lub kart pamięci o podobnych specyfikacjach.


Przypadek

Szkielet to w dużej mierze stop magnezu o doskonałej sztywności i odporności na skręcanie i wgłębienia. Problemy, które zaobserwowaliśmy na Latitude 7440 nie występują w Dell Pro 14 Premium, więc ogólne wrażenia są bardziej podobne do Latitude 9440.

System nie wydaje się szczególnie słabszy lub mocniejszy niż konkurencyjne modele, takie jak HP EliteBook Ultra G1i 14 lub Lenovo ThinkPad T14s Gen 6, ale wolimy sztywniejsze zawiasy Della w porównaniu do HP.

Wymiary i waga są niemal identyczne jak w przypadku Latitude 7440. Dell Pro 14 Premium może być nieco mniejszy i cięższy, jeśli mamy się czepiać, ale poza tym grubość jest taka sama.

Raczej nudny i monochromatyczny szary kolor od góry do dołu
Teksturowana powierzchnia z matowego aluminium bardzo dobrze ukrywa odciski palców
Pokrywa otwiera się o pełne 180 stopni. Sztywność zawiasów jest doskonała i prawie nie występują żadne drgania podczas regulacji kątów
Przycisk zasilania z obsługą odcisków palców
Przednia krawędź z fizyczną migawką aparatu i wcięciem do otwierania ekranu
Zaokrąglone krawędzie i narożniki bez ostrych punktów

Porównanie rozmiarów

324.5 mm 214.4 mm 19.7 mm 1.5 kg320 mm 216 mm 19 mm 1.8 kg313.6 mm 219.4 mm 19 mm 1.3 kg313 mm 220.2 mm 17.95 mm 1.2 kg311.2 mm 216.7 mm 17.95 mm 1.3 kg313.7 mm 217.3 mm 12.1 mm 1.2 kg297 mm 210 mm 1 mm 5.7 g

Łączność

Jest o jeden port USB-A mniej niż w Latitude 7440. Aby to zrekompensować, jeden z dwóch portów USB-C został przeniesiony na prawą krawędź obudowy, aby zapewnić bardziej ergonomiczne ładowanie lub dokowanie.

Przód: Brak portów
Przód: Brak portów
Z prawej strony: USB-A 3.2 Gen. 1, USB-C Thunderbolt 4 z DisplayPort 2.1 + Power Delivery 3.1
Tył: Brak portów
Tył: Brak portów
Po lewej: HDMI 2.1, USB-C Thunderbolt 4 z DisplayPort 2.1 + Power Delivery 3.1, zestaw słuchawkowy 3,5 mm

Komunikacja

Intel BE201 jest standardowo wyposażony w Wi-Fi 7 i Bluetooth 5.4. WAN jest opcjonalną konfiguracją wraz z gniazdem nanoSIM.

Niewymienny moduł WLAN
Networking
iperf3 transmit AXE11000
Dell XPS 14 2024 OLED
Intel Wi-Fi 6E AX211
1661 (1545min, 1557.76P1 - 1704max) MBit/s +81%
HP EliteBook Ultra G1i 14
Intel BE201 320MHz
1655 (1536min - 1722max) MBit/s +80%
Asus ExpertBook B1 B1403CVA
Intel Wi-Fi 6E AX211
1545 (1408min, 1430.33P1 - 1593max) MBit/s +68%
Lenovo ThinkPad T14s Gen 6 Intel
Intel BE201 320MHz
1372 (748min - 1499max) MBit/s +49%
Dell Pro 14 Premium
Intel BE201 320MHz
918 (540min - 1100max) MBit/s
Dell Latitude 7440
Intel Wi-Fi 6E AX211
767 (626min - 867max) MBit/s -16%
iperf3 receive AXE11000
Dell XPS 14 2024 OLED
Intel Wi-Fi 6E AX211
1683 (1617min, 1623.67P1 - 1701max) MBit/s +44%
Asus ExpertBook B1 B1403CVA
Intel Wi-Fi 6E AX211
1651 (1562min, 1569.25P1 - 1687max) MBit/s +41%
HP EliteBook Ultra G1i 14
Intel BE201 320MHz
1536 (1478min - 1580max) MBit/s +31%
Lenovo ThinkPad T14s Gen 6 Intel
Intel BE201 320MHz
1527 (1462min - 1575max) MBit/s +30%
Dell Latitude 7440
Intel Wi-Fi 6E AX211
1239 (1088min - 1309max) MBit/s +6%
Dell Pro 14 Premium
Intel BE201 320MHz
1172 (997min - 1258max) MBit/s
iperf3 transmit AXE11000 6GHz
Lenovo ThinkPad T14s Gen 6 Intel
Intel BE201 320MHz
1543 (1332min - 1636max) MBit/s +21%
Dell Pro 14 Premium
Intel BE201 320MHz
1279 (1138min - 1394max) MBit/s
Dell Latitude 7440
Intel Wi-Fi 6E AX211
1009 (740min - 1193max) MBit/s -21%
iperf3 receive AXE11000 6GHz
Lenovo ThinkPad T14s Gen 6 Intel
Intel BE201 320MHz
1624 (1562min - 1645max) MBit/s +12%
Dell Pro 14 Premium
Intel BE201 320MHz
1449 (1352min - 1523max) MBit/s
Dell Latitude 7440
Intel Wi-Fi 6E AX211
1223 (1075min - 1257max) MBit/s -16%
05010015020025030035040045050055060065070075080085090095010001050110011501200125013001350140014501500Tooltip
Dell Pro 14 Premium; iperf3 transmit AXE11000 6GHz; iperf 3.1.3: Ø1279 (1138-1394)
Dell Pro 14 Premium; iperf3 receive AXE11000 6GHz; iperf 3.1.3: Ø1448 (1352-1523)

Kamera internetowa

Kamera internetowa 8 MP jest standardowo wyposażona w podczerwień i fizyczną migawkę. Wykrywanie obecności jest opcjonalne.

ColorChecker
12.3 ∆E
8.7 ∆E
13.6 ∆E
20.5 ∆E
13.6 ∆E
11.9 ∆E
5.2 ∆E
7.3 ∆E
11.7 ∆E
11.5 ∆E
10 ∆E
6 ∆E
3.4 ∆E
10 ∆E
13.5 ∆E
5.3 ∆E
8.2 ∆E
13.1 ∆E
10.1 ∆E
4.4 ∆E
6.4 ∆E
7.6 ∆E
6.2 ∆E
2.8 ∆E
ColorChecker Dell Pro 14 Premium: 9.31 ∆E min: 2.77 - max: 20.51 ∆E

Konserwacja

Dolny panel jest zabezpieczony siedmioma śrubami krzyżakowymi, co ułatwia serwisowanie. Po wejściu do środka można wyjąć tylko baterię i główny dysk SSD M.2, ponieważ moduły WLAN i RAM są przylutowane. Proszę zauważyć, że podwójne wentylatory są nieco większe niż te w Latitude 9440 2-in-1.

Dell Pro 14 Premium
Dell Pro 14 Premium

Zrównoważony rozwój

Jest to jeden z pierwszych komputerów biznesowych wyposażonych w modułowe porty USB-C, które można łatwo wymienić w razie potrzeby. Dla porównania, porty USB-C są wysoce zintegrowane z płytami głównymi większości innych laptopów, co może utrudnić naprawę lub wymianę, jeśli kiedykolwiek się zepsują.

Sam model składa się w 90 procentach z magnezu pochodzącego z recyklingu, podczas gdy opakowanie składa się w 100 procentach z materiałów pochodzących z recyklingu lub odnowionych.

Akcesoria i gwarancja

W pudełku detalicznym nie ma żadnych dodatków poza zasilaczem sieciowym i dokumentacją. W standardzie otrzymują Państwo 3-letnią gwarancję z naprawą na miejscu w następnym dniu roboczym.

Urządzenia wejściowe

Klawiatura

Klawiatura zero-lattice jest dokładnie taka sama jak w modelu Latitude 9440 2-w-1 zapewniając identyczne wrażenia z pisania. Choć estetycznie atrakcyjna, sprzężenie zwrotne mogłoby być większe dla klawisza Enter, podczas gdy skok jest prawdopodobnie po płytkiej stronie.

Panel dotykowy

Klawiatura została zmieniona w stosunku do modelu Latitude 9440 2-w-1, aby wyglądać bardziej tradycyjnie. W rezultacie jest nieco mniejszy (12,5 x 7,5 cm w porównaniu do 13,5 x 9 cm), przez co wydaje się nieco bardziej ciasny niż wcześniej, ale poza tym działa bez problemów. Clatter jest szczególnie cichy i prawdopodobnie po gąbczastej stronie podczas naciskania na jego powierzchnię.

Klawiatura typu zero-lattice z bardziej tradycyjnym clickpadem
Gładki panel dotykowy świetnie nadaje się do sterowania kursorem, ale niektórzy mogą preferować mocniejsze i bardziej wyraźne sprzężenie zwrotne
Klawiatura typu "zero-lattice" odróżnia prosumenckie modele Dell od tańszych opcji
Klawisz Enter mógłby korzystać z mocniejszego sprzężenia zwrotnego

Wyświetlacz - piękny OLED, ale tylko 60 Hz

Ostre subpiksele OLED

Ekran dotykowy OLED 1800p to unikalna cecha tego modelu, która nie była dostępna w poprzedniej generacji Latitude 14. Oferuje on typowe korzyści w porównaniu z podstawową konfiguracją IPS, takie jak głębsze kolory, czarny jak smoła współczynnik kontrastu, obsługa HDR, wyższa rozdzielczość i krótszy czas reakcji czerni i bieli, co zapewnia znacznie lepsze wrażenia wizualne.

Głównymi wadami wyświetlacza są podstawowa częstotliwość odświeżania 60 Hz i zaledwie przeciętna jasność jak na panel OLED. Dla porównania, opcja OLED dla XPS 14 ma płynniejszą częstotliwość odświeżania 120 Hz, podczas gdy konkurencyjne modele, takie jak Lenovo ThinkPad T14s lub MacBook Pro 14, mają jaśniejsze wyświetlacze. Maksymalna jasność jest ograniczona do 400 nitów w trybie SDR lub 512 nitów w trybie HDR, zgodnie z naszymi pomiarami.

Dostępne są opcje bezdotykowe IPS i dotykowe OLED
Wąskie ramki boczne
Wąskie ramki boczne
397.5
cd/m²
382.9
cd/m²
381.7
cd/m²
403.7
cd/m²
392.3
cd/m²
388.4
cd/m²
401.5
cd/m²
392.6
cd/m²
388.6
cd/m²
podświetlenie ekranu
LG Phillips 140WT1 testowany z X-Rite i1Pro 3
maksimum: 403.7 cd/m² (Nits) średnia: 392.1 cd/m² Minimum: 2.15 cd/m²
rozświetlenie: 95 %
na akumulatorze: 392.3 cd/m²
kontrast: ∞:1 (czerń: 0 cd/m²)
ΔE Color 3.39 | 0.5-29.43 Ø4.84, calibrated: 0.99
ΔE Greyscale 1.1 | 0.09-98 Ø5.1
95.8% AdobeRGB 1998 (Argyll 2.2.0 3D)
100% sRGB (Argyll 2.2.0 3D)
99% Display P3 (Argyll 2.2.0 3D)
Gamma: 2.23
Dell Pro 14 Premium
LG Phillips 140WT1, OLED, 2880x1800, 14", 60 Hz
Dell Latitude 7440
AU Optronics B140QAX, IPS, 2560x1600, 14", 60 Hz
Dell XPS 14 2024 OLED
SDC41A2, OLED, 3200x2000, 14.5", 120 Hz
Lenovo ThinkPad T14s Gen 6 Intel
B140UAN02.7, IPS LED, 1920x1200, 14", 60 Hz
HP EliteBook Ultra G1i 14
SDC41AA, OLED, 2880x1800, 14", 120 Hz
Asus ExpertBook B1 B1403CVA
MNE001BS1-4, IPS, 1920x1080, 14", 60 Hz
Display
-15%
-3%
-14%
1%
-53%
Display P3 Coverage
99
75.4
-24%
98.5
-1%
76.6
-23%
99.7
1%
39.6
-60%
sRGB Coverage
100
99.9
0%
100
0%
97
-3%
100
0%
58.9
-41%
AdobeRGB 1998 Coverage
95.8
76.2
-20%
87.2
-9%
80.7
-16%
98
2%
40.9
-57%
Response Times
-2471%
61%
-1676%
47%
-1135%
Response Time Grey 50% / Grey 80% *
1.4 ?(0.7, 0.7)
56 ?(26.1, 29.9)
-3900%
0.7 ?(0.39, 0.31)
50%
36.8 ?(17.8, 19)
-2529%
0.74 ?(0.4, 0.34)
47%
26.6 ?(12.9, 13.7)
-1800%
Response Time Black / White *
2.7 ?(1.6, 1.1)
30.8 ?(14, 16.8)
-1041%
0.77 ?(0.42, 0.35)
71%
24.9 ?(14.2, 10.7)
-822%
0.7 ?(0.39, 0.31)
74%
15.4 ?(7.5, 7.9)
-470%
PWM Frequency
241.1 ?(100)
480
480 ?(100)
PWM Amplitude *
32
26
19%
Screen
-54%
-9%
-59%
-8%
-172%
Brightness middle
392.3
517.3
32%
351
-11%
509
30%
392
0%
331
-16%
Brightness
392
488
24%
353
-10%
475
21%
378
-4%
331
-16%
Brightness Distribution
95
88
-7%
97
2%
87
-8%
95
0%
91
-4%
Black Level *
0.34
0.26
0.23
Colorchecker dE 2000 *
3.39
3.3
3%
1.7
50%
3.2
6%
2.4
29%
6.8
-101%
Colorchecker dE 2000 max. *
6.53
7.81
-20%
2.2
66%
7.7
-18%
6.6
-1%
19.9
-205%
Colorchecker dE 2000 calibrated *
0.99
1.02
-3%
0.8
19%
1.7
-72%
4.9
-395%
Greyscale dE 2000 *
1.1
5.6
-409%
3.1
-182%
5.2
-373%
1.9
-73%
6.2
-464%
Gamma
2.23 99%
2.37 93%
2.12 104%
2.2 100%
2.21 100%
2.22 99%
CCT
6502 100%
6804 96%
6616 98%
6702 97%
6463 101%
6387 102%
Contrast
1521
1958
1439
Całkowita średnia (program / ustawienia)
-847% / -447%
16% / 4%
-583% / -317%
13% / 8%
-453% / -302%

* ... im mniej tym lepiej

vs. sRGB
vs. sRGB
vs. P3
vs. P3

Wyświetlacz jest dobrze skalibrowany względem standardu P3 ze średnimi wartościami deltaE skali szarości i kolorów wynoszącymi odpowiednio zaledwie 1,1 i 3,39.

Skala szarości (vs. P3)
Przemiatanie nasycenia (vs. P3)
ColorChecker (vs. P3)

Wyświetl czasy reakcji

Czasy reakcji wyświetlacza pokazują, jak szybko ekran może zmieniać kolor z jednego koloru na drugi. Długi czas reakcji może powodować powstawanie powidoków i sprawiać, że poruszające się obiekty będą niewyraźne (duchy). Gracze szybkich tytułów 3D powinni zwrócić szczególną uwagę na szybki czas reakcji.
       Czas reakcji od czerni do bieli
2.7 ms ... wzrost ↗ i spadek ↘ łącznie↗ 1.6 ms wzrost
↘ 1.1 ms upadek
W naszych testach ekran wykazuje bardzo szybką reakcję i powinien bardzo dobrze nadawać się do szybkich gier.
Dla porównania, wszystkie testowane urządzenia wahają się od 0.1 (minimum) do 240 (maksimum) ms. » 11 % wszystkich urządzeń jest lepszych.
Oznacza to, że zmierzony czas reakcji jest lepszy od średniej wszystkich testowanych urządzeń (20.5 ms).
       Czas reakcji 50% szarości do 80% szarości
1.4 ms ... wzrost ↗ i spadek ↘ łącznie↗ 0.7 ms wzrost
↘ 0.7 ms upadek
W naszych testach ekran wykazuje bardzo szybką reakcję i powinien bardzo dobrze nadawać się do szybkich gier.
Dla porównania, wszystkie testowane urządzenia wahają się od 0.165 (minimum) do 636 (maksimum) ms. » 5 % wszystkich urządzeń jest lepszych.
Oznacza to, że zmierzony czas reakcji jest lepszy od średniej wszystkich testowanych urządzeń (32.1 ms).

Migotanie ekranu / PWM (modulacja szerokości impulsu)

Aby przyciemnić ekran, niektóre notebooki po prostu w krótkich odstępach czasu włączają i wyłączają podświetlenie — jest to metoda zwana modulacją szerokości impulsu (PWM). W idealnym przypadku ta częstotliwość cykli powinna być niewykrywalna dla ludzkiego oka. Jeśli wspomniana częstotliwość jest zbyt niska, użytkownicy o wrażliwych oczach mogą odczuwać zmęczenie lub bóle głowy, a nawet całkowicie zauważyć migotanie.
Wykryto migotanie ekranu/wykryto PWM 241.1 Hz
Amplitude: 32 %
≤ 100 % ustawienia jasności

Podświetlenie wyświetlacza miga z częstotliwością 241.1 Hz (najgorszy przypadek, np. przy użyciu PWM) Wykryto migotanie przy ustawieniu jasności 100 % i poniżej. Powyżej tego ustawienia jasności nie powinno być żadnego migotania ani PWM.

Częstotliwość 241.1 Hz jest stosunkowo niska, więc wrażliwi użytkownicy prawdopodobnie zauważą migotanie i odczują zmęczenie oczu przy podanym ustawieniu jasności i poniżej.

Dla porównania: 53 % wszystkich testowanych urządzeń nie używa PWM do przyciemniania wyświetlacza. Jeśli wykryto PWM, zmierzono średnio 8363 (minimum: 5 - maksimum: 343500) Hz.

100 procent jasności
75 procent jasności
75 procent jasności
50 procent jasności
50 procent jasności
25 procent jasności
25 procent jasności
0 procent jasności
0 procent jasności

Ekran dotykowy OLED może być ostry i żywy, ale nadal nie jest wystarczająco jasny, aby wygodnie oglądać go na zewnątrz. Kolory stają się wyblakłe, a odblaski są ewidentne.

Na zewnątrz przy dużym zachmurzeniu
Szerokie kąty widzenia OLED

Wydajność - wydajność to nazwa gry


Warunki testowania

Przed wykonaniem poniższych testów ustawiliśmy Dell Optimizer na tryb Performance. Profile zasilania Optimizer mogą automatycznie synchronizować się ze zwykłymi profilami zasilania Windows, co nie zawsze ma miejsce w przypadku laptopów Lenovo lub HP.

Procesor

The Core Ultra 7 268V jest tylko nieznacznie szybszy niż Raptor Lake Core i5-1345U lub Core i7-1355U w zeszłorocznej serii Latitude 14, jeśli chodzi o tradycyjne zadania CPU. Jest to w dużej mierze zamierzone, ponieważ Lunar Lake-V koncentruje się na NPU, GPU, pamięci RAM i ogólnym wzroście wydajności, a nie na surowej wydajności procesora. Niemniej jednak, Core Ultra 7 268V wykazuje mniejszy throttling, gdy jest obciążony, co zapewnia bardziej spójną wydajność w czasie, co pokazują nasze wyniki testu pętli CineBench R15 xT poniżej.

Cinebench R15 Multi Loop

0135270405540675810945108012151350148516201755189020252160229524302565Tooltip
Dell Pro 14 Premium Intel Core Ultra 7 268V: Ø1553 (1539.35-1573.81)
Dell Latitude 7440 Intel Core i5-1345U: Ø1310 (929.37-1541.9)
Dell XPS 14 2024 OLED Intel Core Ultra 7 155H: Ø1865 (1743.3-2620.37)
Lenovo ThinkPad T14s Gen 6 Intel Intel Core Ultra 5 228V: Ø1259 (1160.83-1469.89)
HP EliteBook Ultra G1i 14 Intel Core Ultra 7 258V: Ø1216 (1054.19-1619.89)
Asus ExpertBook B1 B1403CVA Intel Core i5-13420H: Ø1179 (1150.48-1492.48)
CPU Performance Rating: Percent
Cinebench R23: Multi Core | Single Core
Cinebench R20: CPU (Multi Core) | CPU (Single Core)
Cinebench R15: CPU Multi 64Bit | CPU Single 64Bit
Blender: v2.79 BMW27 CPU
7-Zip 18.03: 7z b 4 | 7z b 4 -mmt1
Geekbench 6.4: Multi-Core | Single-Core
Geekbench 5.5: Multi-Core | Single-Core
HWBOT x265 Benchmark v2.2: 4k Preset
LibreOffice : 20 Documents To PDF
R Benchmark 2.5: Overall mean
CPU Performance Rating
Lenovo Yoga Book 9 14IAH10
Intel Core Ultra 7 255H
88.3 pt
Lenovo Yoga Slim 7 14AKP G10
AMD Ryzen AI 7 350
82.9 pt
Dell XPS 14 2024 OLED
Intel Core Ultra 7 155H
74.8 pt
Lenovo Yoga 7 2-in-1 14AHP9
AMD Ryzen 7 8840HS
73.9 pt
Lenovo Yoga 7 2-in-1 14AKP10
AMD Ryzen AI 5 340
70.4 pt
Dell Pro 14 Premium
Intel Core Ultra 7 268V
68.9 pt
Przeciętny Intel Core Ultra 7 268V
 
67.8 pt
HP EliteBook Ultra G1i 14
Intel Core Ultra 7 258V
66.6 pt
Dell Latitude 9440 2-in-1 -3!
Intel Core i7-1365U
62.5 pt
Lenovo ThinkPad T14s Gen 6 Intel
Intel Core Ultra 5 228V
61.9 pt
Asus Vivobook S 14 OLED S5406SA
Intel Core Ultra 5 226V
61.4 pt
Dell Latitude 7440 -2!
Intel Core i5-1345U
59.6 pt
Asus ExpertBook B1 B1403CVA
Intel Core i5-13420H
56.4 pt
Lenovo ThinkPad L14 G4 21H1003DGE
Intel Core i5-1335U
53.5 pt
Cinebench R23 / Multi Core
Lenovo Yoga Book 9 14IAH10
Intel Core Ultra 7 255H
17878 (14381.2min - 17878.1max) Points +68%
Lenovo Yoga Slim 7 14AKP G10
AMD Ryzen AI 7 350
16210 Points +52%
Dell XPS 14 2024 OLED
Intel Core Ultra 7 155H
14166 Points +33%
Lenovo Yoga 7 2-in-1 14AHP9
AMD Ryzen 7 8840HS
14060 (13631.1min - 14060.2max) Points +32%
Lenovo Yoga 7 2-in-1 14AKP10
AMD Ryzen AI 5 340
12044 Points +13%
Dell Pro 14 Premium
Intel Core Ultra 7 268V
10653 (10400min - 10653.5max) Points
Przeciętny Intel Core Ultra 7 268V
  (9835 - 10868, n=4)
10473 Points -2%
Asus Vivobook S 14 OLED S5406SA
Intel Core Ultra 5 226V
9940 Points -7%
Dell Latitude 7440
Intel Core i5-1345U
9795 (7630.48min - 9794.71max) Points -8%
Lenovo ThinkPad T14s Gen 6 Intel
Intel Core Ultra 5 228V
9787 Points -8%
HP EliteBook Ultra G1i 14
Intel Core Ultra 7 258V
9605 Points -10%
Dell Latitude 9440 2-in-1
Intel Core i7-1365U
9576 (7962.38min - 9576.21max) Points -10%
Lenovo ThinkPad L14 G4 21H1003DGE
Intel Core i5-1335U
9021 Points -15%
Asus ExpertBook B1 B1403CVA
Intel Core i5-13420H
8691 Points -18%
Cinebench R23 / Single Core
Lenovo Yoga Book 9 14IAH10
Intel Core Ultra 7 255H
2111 Points +8%
Lenovo Yoga Slim 7 14AKP G10
AMD Ryzen AI 7 350
1972 Points +1%
Dell Pro 14 Premium
Intel Core Ultra 7 268V
1952 Points
Przeciętny Intel Core Ultra 7 268V
  (1910 - 1985, n=4)
1942 Points -1%
Lenovo Yoga 7 2-in-1 14AKP10
AMD Ryzen AI 5 340
1919 Points -2%
Dell Latitude 9440 2-in-1
Intel Core i7-1365U
1883 Points -4%
HP EliteBook Ultra G1i 14
Intel Core Ultra 7 258V
1878 Points -4%
Dell XPS 14 2024 OLED
Intel Core Ultra 7 155H
1775 Points -9%
Dell Latitude 7440
Intel Core i5-1345U
1757 Points -10%
Lenovo ThinkPad T14s Gen 6 Intel
Intel Core Ultra 5 228V
1755 Points -10%
Asus Vivobook S 14 OLED S5406SA
Intel Core Ultra 5 226V
1720 Points -12%
Lenovo Yoga 7 2-in-1 14AHP9
AMD Ryzen 7 8840HS
1719 Points -12%
Lenovo ThinkPad L14 G4 21H1003DGE
Intel Core i5-1335U
1707 Points -13%
Asus ExpertBook B1 B1403CVA
Intel Core i5-13420H
1705 Points -13%
Cinebench R20 / CPU (Multi Core)
Lenovo Yoga Book 9 14IAH10
Intel Core Ultra 7 255H
7015 Points +70%
Lenovo Yoga Slim 7 14AKP G10
AMD Ryzen AI 7 350
6329 Points +53%
Dell XPS 14 2024 OLED
Intel Core Ultra 7 155H
6099 Points +47%
Lenovo Yoga 7 2-in-1 14AHP9
AMD Ryzen 7 8840HS
5556 Points +34%
Lenovo Yoga 7 2-in-1 14AKP10
AMD Ryzen AI 5 340
4692 Points +13%
Dell Pro 14 Premium
Intel Core Ultra 7 268V
4136 Points
Przeciętny Intel Core Ultra 7 268V
  (3811 - 4255, n=4)
4083 Points -1%
Asus Vivobook S 14 OLED S5406SA
Intel Core Ultra 5 226V
3885 Points -6%
Lenovo ThinkPad T14s Gen 6 Intel
Intel Core Ultra 5 228V
3820 Points -8%
HP EliteBook Ultra G1i 14
Intel Core Ultra 7 258V
3743 Points -10%
Dell Latitude 9440 2-in-1
Intel Core i7-1365U
3667 Points -11%
Dell Latitude 7440
Intel Core i5-1345U
3610 Points -13%
Lenovo ThinkPad L14 G4 21H1003DGE
Intel Core i5-1335U
3343 Points -19%
Asus ExpertBook B1 B1403CVA
Intel Core i5-13420H
3329 Points -20%
Cinebench R20 / CPU (Single Core)
Lenovo Yoga Book 9 14IAH10
Intel Core Ultra 7 255H
811 Points +10%
Lenovo Yoga Slim 7 14AKP G10
AMD Ryzen AI 7 350
771 Points +5%
Lenovo Yoga 7 2-in-1 14AKP10
AMD Ryzen AI 5 340
752 Points +2%
Przeciętny Intel Core Ultra 7 268V
  (736 - 764, n=4)
744 Points +1%
Dell Pro 14 Premium
Intel Core Ultra 7 268V
737 Points
HP EliteBook Ultra G1i 14
Intel Core Ultra 7 258V
722 Points -2%
Dell Latitude 9440 2-in-1
Intel Core i7-1365U
719 Points -2%
Lenovo ThinkPad T14s Gen 6 Intel
Intel Core Ultra 5 228V
677 Points -8%
Dell XPS 14 2024 OLED
Intel Core Ultra 7 155H
672 Points -9%
Lenovo Yoga 7 2-in-1 14AHP9
AMD Ryzen 7 8840HS
671 Points -9%
Asus Vivobook S 14 OLED S5406SA
Intel Core Ultra 5 226V
658 Points -11%
Dell Latitude 7440
Intel Core i5-1345U
656 Points -11%
Lenovo ThinkPad L14 G4 21H1003DGE
Intel Core i5-1335U
655 Points -11%
Asus ExpertBook B1 B1403CVA
Intel Core i5-13420H
655 Points -11%
Cinebench R15 / CPU Multi 64Bit
Lenovo Yoga Book 9 14IAH10
Intel Core Ultra 7 255H
2835 (2075.66min - 2834.87max) Points +80%
Dell XPS 14 2024 OLED
Intel Core Ultra 7 155H
2620 (1743.3min - 2620.37max) Points +66%
Lenovo Yoga Slim 7 14AKP G10
AMD Ryzen AI 7 350
2477 (2416.92min - 2477.39max) Points +57%
Lenovo Yoga 7 2-in-1 14AHP9
AMD Ryzen 7 8840HS
2244 (2179.36min - 2243.79max) Points +43%
Lenovo Yoga 7 2-in-1 14AKP10
AMD Ryzen AI 5 340
1849 (1756.08min - 1848.6max) Points +17%
HP EliteBook Ultra G1i 14
Intel Core Ultra 7 258V
1620 (1054.19min - 1619.89max) Points +3%
Przeciętny Intel Core Ultra 7 268V
  (1574 - 1651, n=4)
1611 Points +2%
Dell Pro 14 Premium
Intel Core Ultra 7 268V
1574 (1539.35min - 1573.81max) Points
Dell Latitude 7440
Intel Core i5-1345U
1542 (929.37min - 1541.9max) Points -2%
Asus Vivobook S 14 OLED S5406SA
Intel Core Ultra 5 226V
1514 (1499.42min - 1513.6max) Points -4%
Dell Latitude 9440 2-in-1
Intel Core i7-1365U
1504 (1217.51min - 1503.93max) Points -4%
Asus ExpertBook B1 B1403CVA
Intel Core i5-13420H
1492 (1150.48min - 1492.48max) Points -5%
Lenovo ThinkPad T14s Gen 6 Intel
Intel Core Ultra 5 228V
1470 (1160.83min - 1469.89max) Points -7%
Lenovo ThinkPad L14 G4 21H1003DGE
Intel Core i5-1335U
1464 (1070.41min - 1463.54max) Points -7%
Cinebench R15 / CPU Single 64Bit
Lenovo Yoga Book 9 14IAH10
Intel Core Ultra 7 255H
317 Points +8%
Lenovo Yoga Slim 7 14AKP G10
AMD Ryzen AI 7 350
299 Points +2%
Przeciętny Intel Core Ultra 7 268V
  (287 - 302, n=4)
295 Points +1%
Lenovo Yoga 7 2-in-1 14AKP10
AMD Ryzen AI 5 340
293 Points 0%
Dell Pro 14 Premium
Intel Core Ultra 7 268V
293 Points
HP EliteBook Ultra G1i 14
Intel Core Ultra 7 258V
287 Points -2%
Lenovo Yoga 7 2-in-1 14AHP9
AMD Ryzen 7 8840HS
270 Points -8%
Dell Latitude 9440 2-in-1
Intel Core i7-1365U
268 Points -9%
Asus Vivobook S 14 OLED S5406SA
Intel Core Ultra 5 226V
261 Points -11%
Lenovo ThinkPad T14s Gen 6 Intel
Intel Core Ultra 5 228V
261 Points -11%
Dell XPS 14 2024 OLED
Intel Core Ultra 7 155H
255 Points -13%
Dell Latitude 7440
Intel Core i5-1345U
244 Points -17%
Asus ExpertBook B1 B1403CVA
Intel Core i5-13420H
244 Points -17%
Lenovo ThinkPad L14 G4 21H1003DGE
Intel Core i5-1335U
239 Points -18%
Blender / v2.79 BMW27 CPU
Lenovo ThinkPad L14 G4 21H1003DGE
Intel Core i5-1335U
786 Seconds * -148%
Lenovo ThinkPad L14 G4 21H1003DGE
Intel Core i5-1335U
398 Seconds * -26%
Asus ExpertBook B1 B1403CVA
Intel Core i5-13420H
403 Seconds * -27%
Lenovo ThinkPad T14s Gen 6 Intel
Intel Core Ultra 5 228V
388 Seconds * -22%
HP EliteBook Ultra G1i 14
Intel Core Ultra 7 258V
382 Seconds * -21%
Przeciętny Intel Core Ultra 7 268V
  (317 - 410, n=4)
350 Seconds * -10%
Asus Vivobook S 14 OLED S5406SA
Intel Core Ultra 5 226V
346 Seconds * -9%
Dell Latitude 7440
Intel Core i5-1345U
332 Seconds * -5%
Dell Pro 14 Premium
Intel Core Ultra 7 268V
317 Seconds *
Lenovo Yoga 7 2-in-1 14AKP10
AMD Ryzen AI 5 340
269 Seconds * +15%
Dell XPS 14 2024 OLED
Intel Core Ultra 7 155H
253 Seconds * +20%
Lenovo Yoga 7 2-in-1 14AHP9
AMD Ryzen 7 8840HS
229 Seconds * +28%
Lenovo Yoga Book 9 14IAH10
Intel Core Ultra 7 255H
216 Seconds * +32%
Lenovo Yoga Slim 7 14AKP G10
AMD Ryzen AI 7 350
199 Seconds * +37%
7-Zip 18.03 / 7z b 4
Lenovo Yoga Slim 7 14AKP G10
AMD Ryzen AI 7 350
60764 MIPS +66%
Lenovo Yoga 7 2-in-1 14AHP9
AMD Ryzen 7 8840HS
59682 MIPS +63%
Lenovo Yoga Book 9 14IAH10
Intel Core Ultra 7 255H
56787 MIPS +55%
Dell XPS 14 2024 OLED
Intel Core Ultra 7 155H
54409 MIPS +48%
Lenovo Yoga 7 2-in-1 14AKP10
AMD Ryzen AI 5 340
45003 MIPS +23%
Dell Latitude 7440
Intel Core i5-1345U
40563 MIPS +11%
Dell Latitude 9440 2-in-1
Intel Core i7-1365U
40377 MIPS +10%
Dell Pro 14 Premium
Intel Core Ultra 7 268V
36654 MIPS
Asus ExpertBook B1 B1403CVA
Intel Core i5-13420H
35680 MIPS -3%
Przeciętny Intel Core Ultra 7 268V
  (32797 - 36654, n=4)
35437 MIPS -3%
Lenovo ThinkPad L14 G4 21H1003DGE
Intel Core i5-1335U
34183 MIPS -7%
HP EliteBook Ultra G1i 14
Intel Core Ultra 7 258V
34169 MIPS -7%
Lenovo ThinkPad T14s Gen 6 Intel
Intel Core Ultra 5 228V
33631 MIPS -8%
Asus Vivobook S 14 OLED S5406SA
Intel Core Ultra 5 226V
33302 MIPS -9%
7-Zip 18.03 / 7z b 4 -mmt1
Lenovo Yoga Slim 7 14AKP G10
AMD Ryzen AI 7 350
6081 MIPS +7%
Lenovo Yoga Book 9 14IAH10
Intel Core Ultra 7 255H
6063 MIPS +7%
Lenovo Yoga 7 2-in-1 14AKP10
AMD Ryzen AI 5 340
5959 MIPS +5%
Przeciętny Intel Core Ultra 7 268V
  (5688 - 6021, n=4)
5896 MIPS +4%
Dell Latitude 9440 2-in-1
Intel Core i7-1365U
5866 MIPS +3%
HP EliteBook Ultra G1i 14
Intel Core Ultra 7 258V
5823 MIPS +2%
Lenovo Yoga 7 2-in-1 14AHP9
AMD Ryzen 7 8840HS
5702 MIPS 0%
Dell Pro 14 Premium
Intel Core Ultra 7 268V
5688 MIPS
Dell XPS 14 2024 OLED
Intel Core Ultra 7 155H
5395 MIPS -5%
Asus ExpertBook B1 B1403CVA
Intel Core i5-13420H
5320 MIPS -6%
Dell Latitude 7440
Intel Core i5-1345U
5296 MIPS -7%
Asus Vivobook S 14 OLED S5406SA
Intel Core Ultra 5 226V
5272 MIPS -7%
Lenovo ThinkPad T14s Gen 6 Intel
Intel Core Ultra 5 228V
5257 MIPS -8%
Lenovo ThinkPad L14 G4 21H1003DGE
Intel Core i5-1335U
5184 MIPS -9%
Geekbench 6.4 / Multi-Core
Lenovo Yoga Book 9 14IAH10
Intel Core Ultra 7 255H
15456 Points +39%
Lenovo Yoga Slim 7 14AKP G10
AMD Ryzen AI 7 350
13854 Points +25%
Dell XPS 14 2024 OLED
Intel Core Ultra 7 155H
13301 Points +20%
Lenovo Yoga 7 2-in-1 14AHP9
AMD Ryzen 7 8840HS
11700 Points +6%
HP EliteBook Ultra G1i 14
Intel Core Ultra 7 258V
11334 Points +2%
Dell Pro 14 Premium
Intel Core Ultra 7 268V
11087 Points
Przeciętny Intel Core Ultra 7 268V
  (10589 - 11388, n=5)
11051 Points 0%
Lenovo Yoga 7 2-in-1 14AKP10
AMD Ryzen AI 5 340
10668 Points -4%
Asus Vivobook S 14 OLED S5406SA
Intel Core Ultra 5 226V
10151 Points -8%
Lenovo ThinkPad T14s Gen 6 Intel
Intel Core Ultra 5 228V
10036 Points -9%
Asus ExpertBook B1 B1403CVA
Intel Core i5-13420H
9262 Points -16%
Lenovo ThinkPad L14 G4 21H1003DGE
Intel Core i5-1335U
6604 Points -40%
Geekbench 6.4 / Single-Core
Lenovo Yoga Book 9 14IAH10
Intel Core Ultra 7 255H
2894 Points +3%
Lenovo Yoga Slim 7 14AKP G10
AMD Ryzen AI 7 350
2866 Points +2%
Dell Pro 14 Premium
Intel Core Ultra 7 268V
2822 Points
Przeciętny Intel Core Ultra 7 268V
  (2583 - 2871, n=5)
2788 Points -1%
HP EliteBook Ultra G1i 14
Intel Core Ultra 7 258V
2780 Points -1%
Lenovo Yoga 7 2-in-1 14AKP10
AMD Ryzen AI 5 340
2776 Points -2%
Asus Vivobook S 14 OLED S5406SA
Intel Core Ultra 5 226V
2564 Points -9%
Lenovo ThinkPad T14s Gen 6 Intel
Intel Core Ultra 5 228V
2562 Points -9%
Lenovo Yoga 7 2-in-1 14AHP9
AMD Ryzen 7 8840HS
2477 Points -12%
Dell XPS 14 2024 OLED
Intel Core Ultra 7 155H
2440 Points -14%
Asus ExpertBook B1 B1403CVA
Intel Core i5-13420H
2365 Points -16%
Lenovo ThinkPad L14 G4 21H1003DGE
Intel Core i5-1335U
2255 Points -20%
Geekbench 5.5 / Multi-Core
Lenovo Yoga Book 9 14IAH10
Intel Core Ultra 7 255H
14856 Points +54%
Dell XPS 14 2024 OLED
Intel Core Ultra 7 155H
12905 Points +34%
Lenovo Yoga Slim 7 14AKP G10
AMD Ryzen AI 7 350
11943 Points +24%
Lenovo Yoga 7 2-in-1 14AHP9
AMD Ryzen 7 8840HS
10884 Points +13%
HP EliteBook Ultra G1i 14
Intel Core Ultra 7 258V
9864 Points +2%
Przeciętny Intel Core Ultra 7 268V
  (9491 - 9855, n=5)
9709 Points +1%
Dell Pro 14 Premium
Intel Core Ultra 7 268V
9634 Points
Lenovo ThinkPad T14s Gen 6 Intel
Intel Core Ultra 5 228V
8979 Points -7%
Asus Vivobook S 14 OLED S5406SA
Intel Core Ultra 5 226V
8899 Points -8%
Lenovo Yoga 7 2-in-1 14AKP10
AMD Ryzen AI 5 340
8735 Points -9%
Dell Latitude 9440 2-in-1
Intel Core i7-1365U
8272 Points -14%
Dell Latitude 7440
Intel Core i5-1345U
8263 Points -14%
Asus ExpertBook B1 B1403CVA
Intel Core i5-13420H
7925 Points -18%
Lenovo ThinkPad L14 G4 21H1003DGE
Intel Core i5-1335U
6244 Points -35%
Geekbench 5.5 / Single-Core
Lenovo Yoga Slim 7 14AKP G10
AMD Ryzen AI 7 350
2105 Points +4%
Lenovo Yoga Book 9 14IAH10
Intel Core Ultra 7 255H
2103 Points +4%
Przeciętny Intel Core Ultra 7 268V
  (2008 - 2097, n=5)
2045 Points +1%
Lenovo Yoga 7 2-in-1 14AKP10
AMD Ryzen AI 5 340
2033 Points 0%
HP EliteBook Ultra G1i 14
Intel Core Ultra 7 258V
2027 Points 0%
Dell Pro 14 Premium
Intel Core Ultra 7 268V
2023 Points
Lenovo ThinkPad T14s Gen 6 Intel
Intel Core Ultra 5 228V
1904 Points -6%
Asus Vivobook S 14 OLED S5406SA
Intel Core Ultra 5 226V
1888 Points -7%
Dell Latitude 9440 2-in-1
Intel Core i7-1365U
1841 Points -9%
Lenovo Yoga 7 2-in-1 14AHP9
AMD Ryzen 7 8840HS
1822 Points -10%
Dell XPS 14 2024 OLED
Intel Core Ultra 7 155H
1751 Points -13%
Dell Latitude 7440
Intel Core i5-1345U
1710 Points -15%
Asus ExpertBook B1 B1403CVA
Intel Core i5-13420H
1669 Points -17%
Lenovo ThinkPad L14 G4 21H1003DGE
Intel Core i5-1335U
1576 Points -22%
HWBOT x265 Benchmark v2.2 / 4k Preset
Lenovo Yoga Book 9 14IAH10
Intel Core Ultra 7 255H
20.5 fps +52%
Lenovo Yoga Slim 7 14AKP G10
AMD Ryzen AI 7 350
19 fps +41%
Lenovo Yoga 7 2-in-1 14AHP9
AMD Ryzen 7 8840HS
17.4 fps +29%
Dell XPS 14 2024 OLED
Intel Core Ultra 7 155H
15.6 fps +16%
Lenovo Yoga 7 2-in-1 14AKP10
AMD Ryzen AI 5 340
13.6 fps +1%
Dell Pro 14 Premium
Intel Core Ultra 7 268V
13.5 fps
Asus Vivobook S 14 OLED S5406SA
Intel Core Ultra 5 226V
12.8 fps -5%
Przeciętny Intel Core Ultra 7 268V
  (10.4 - 13.5, n=4)
12.4 fps -8%
Lenovo ThinkPad T14s Gen 6 Intel
Intel Core Ultra 5 228V
11.8 fps -13%
HP EliteBook Ultra G1i 14
Intel Core Ultra 7 258V
11.4 fps -16%
Dell Latitude 7440
Intel Core i5-1345U
10.8 fps -20%
Dell Latitude 9440 2-in-1
Intel Core i7-1365U
10.3 fps -24%
Asus ExpertBook B1 B1403CVA
Intel Core i5-13420H
8.75 fps -35%
Lenovo ThinkPad L14 G4 21H1003DGE
Intel Core i5-1335U
8.4 fps -38%
LibreOffice / 20 Documents To PDF
Asus ExpertBook B1 B1403CVA
Intel Core i5-13420H
62.2 s * -39%
Asus Vivobook S 14 OLED S5406SA
Intel Core Ultra 5 226V
59.9 s * -33%
Lenovo Yoga 7 2-in-1 14AKP10
AMD Ryzen AI 5 340
56.7 s * -26%
Lenovo Yoga Slim 7 14AKP G10
AMD Ryzen AI 7 350
51.1 s * -14%
Przeciętny Intel Core Ultra 7 268V
  (44.9 - 60.8, n=4)
50.5 s * -12%
Lenovo ThinkPad T14s Gen 6 Intel
Intel Core Ultra 5 228V
49.8 s * -11%
Dell XPS 14 2024 OLED
Intel Core Ultra 7 155H
49.6 s * -10%
Lenovo Yoga 7 2-in-1 14AHP9
AMD Ryzen 7 8840HS
49.6 s * -10%
Dell Latitude 9440 2-in-1
Intel Core i7-1365U
47.5 s * -6%
Lenovo ThinkPad L14 G4 21H1003DGE
Intel Core i5-1335U
47 s * -5%
Dell Latitude 7440
Intel Core i5-1345U
45.5 s * -1%
Dell Pro 14 Premium
Intel Core Ultra 7 268V
44.9 s *
HP EliteBook Ultra G1i 14
Intel Core Ultra 7 258V
43.8 s * +2%
Lenovo Yoga Book 9 14IAH10
Intel Core Ultra 7 255H
43.2 s * +4%
R Benchmark 2.5 / Overall mean
Lenovo ThinkPad L14 G4 21H1003DGE
Intel Core i5-1335U
0.516 sec * -19%
Asus ExpertBook B1 B1403CVA
Intel Core i5-13420H
0.501 sec * -15%
Dell Latitude 7440
Intel Core i5-1345U
0.4948 sec * -14%
Asus Vivobook S 14 OLED S5406SA
Intel Core Ultra 5 226V
0.4863 sec * -12%
Lenovo ThinkPad T14s Gen 6 Intel
Intel Core Ultra 5 228V
0.4856 sec * -12%
Lenovo Yoga 7 2-in-1 14AHP9
AMD Ryzen 7 8840HS
0.4774 sec * -10%
Dell XPS 14 2024 OLED
Intel Core Ultra 7 155H
0.4711 sec * -8%
Dell Latitude 9440 2-in-1
Intel Core i7-1365U
0.4582 sec * -5%
HP EliteBook Ultra G1i 14
Intel Core Ultra 7 258V
0.4496 sec * -3%
Przeciętny Intel Core Ultra 7 268V
  (0.4344 - 0.4565, n=4)
0.4405 sec * -1%
Dell Pro 14 Premium
Intel Core Ultra 7 268V
0.4349 sec *
Lenovo Yoga Book 9 14IAH10
Intel Core Ultra 7 255H
0.4341 sec * -0%
Lenovo Yoga 7 2-in-1 14AKP10
AMD Ryzen AI 5 340
0.4262 sec * +2%
Lenovo Yoga Slim 7 14AKP G10
AMD Ryzen AI 7 350
0.4103 sec * +6%
CPU Performance Rating: Percent
Cinebench R23: Multi Core | Single Core
Cinebench R20: CPU (Multi Core) | CPU (Single Core)
Cinebench R15: CPU Multi 64Bit | CPU Single 64Bit
Blender: v2.79 BMW27 CPU
7-Zip 18.03: 7z b 4 | 7z b 4 -mmt1
Geekbench 6.4: Multi-Core | Single-Core
Geekbench 5.5: Multi-Core | Single-Core
HWBOT x265 Benchmark v2.2: 4k Preset
LibreOffice : 20 Documents To PDF
R Benchmark 2.5: Overall mean

* ... im mniej tym lepiej

Cinebench R15 CPU Multi 64Bit
1574 Points
Cinebench R15 OpenGL 64Bit
167.6 fps
Cinebench R15 Ref. Match 64Bit
97.8 %
Cinebench R15 CPU Single 64Bit
293 Points
Cinebench R20 CPU (Multi Core)
4136 Points
Cinebench R20 CPU (Single Core)
737 Points
Cinebench R23 Single Core
1952 Points
Cinebench R23 Multi Core
10653 Points
Cinebench 2024 CPU Single Core
122.6 Points
Cinebench 2024 CPU Multi Core
630 Points
Pomoc
Performance Rating
Dell XPS 14 2024 OLED
Intel Core Ultra 7 155H, NVIDIA GeForce RTX 4050 Laptop GPU
97.5 pt
Dell Pro 14 Premium
Intel Core Ultra 7 268V, Arc 140V
83.3 pt
Przeciętny Intel Core Ultra 7 268V
 
78.6 pt
Lenovo ThinkPad T14s Gen 6 Intel
Intel Core Ultra 5 228V, Arc 130V
76.9 pt
HP EliteBook Ultra G1i 14
Intel Core Ultra 7 258V, Arc 140V
73.9 pt
Dell Latitude 7440
Intel Core i5-1345U, Iris Xe G7 80EUs
69.4 pt
Asus ExpertBook B1 B1403CVA
Intel Core i5-13420H, UHD Graphics Xe G4 48EUs
63.6 pt
AIDA64 / FP32 Ray-Trace
Dell Pro 14 Premium
Intel Core Ultra 7 268V, Arc 140V
12549 KRay/s
Dell XPS 14 2024 OLED
Intel Core Ultra 7 155H, NVIDIA GeForce RTX 4050 Laptop GPU
11916 KRay/s -5%
Przeciętny Intel Core Ultra 7 268V
  (10556 - 12759, n=4)
11853 KRay/s -6%
Lenovo ThinkPad T14s Gen 6 Intel
Intel Core Ultra 5 228V, Arc 130V
11773 KRay/s -6%
HP EliteBook Ultra G1i 14
Intel Core Ultra 7 258V, Arc 140V
10505 KRay/s -16%
Dell Latitude 7440
Intel Core i5-1345U, Iris Xe G7 80EUs
8830 KRay/s -30%
Asus ExpertBook B1 B1403CVA
Intel Core i5-13420H, UHD Graphics Xe G4 48EUs
7922 KRay/s -37%
AIDA64 / FPU Julia
Dell XPS 14 2024 OLED
Intel Core Ultra 7 155H, NVIDIA GeForce RTX 4050 Laptop GPU
63589 Points +3%
Dell Pro 14 Premium
Intel Core Ultra 7 268V, Arc 140V
61769 Points
Lenovo ThinkPad T14s Gen 6 Intel
Intel Core Ultra 5 228V, Arc 130V
57301 Points -7%
Przeciętny Intel Core Ultra 7 268V
  (47659 - 62102, n=4)
56957 Points -8%
HP EliteBook Ultra G1i 14
Intel Core Ultra 7 258V, Arc 140V
52585 Points -15%
Dell Latitude 7440
Intel Core i5-1345U, Iris Xe G7 80EUs
43149 Points -30%
Asus ExpertBook B1 B1403CVA
Intel Core i5-13420H, UHD Graphics Xe G4 48EUs
40587 Points -34%
AIDA64 / CPU SHA3
Dell XPS 14 2024 OLED
Intel Core Ultra 7 155H, NVIDIA GeForce RTX 4050 Laptop GPU
2941 MB/s +7%
Dell Pro 14 Premium
Intel Core Ultra 7 268V, Arc 140V
2737 MB/s
Przeciętny Intel Core Ultra 7 268V
  (2117 - 2784, n=4)
2544 MB/s -7%
HP EliteBook Ultra G1i 14
Intel Core Ultra 7 258V, Arc 140V
2406 MB/s -12%
Lenovo ThinkPad T14s Gen 6 Intel
Intel Core Ultra 5 228V, Arc 130V
2395 MB/s -12%
Dell Latitude 7440
Intel Core i5-1345U, Iris Xe G7 80EUs
2265 MB/s -17%
Asus ExpertBook B1 B1403CVA
Intel Core i5-13420H, UHD Graphics Xe G4 48EUs
1724 MB/s -37%
AIDA64 / CPU Queen
Dell XPS 14 2024 OLED
Intel Core Ultra 7 155H, NVIDIA GeForce RTX 4050 Laptop GPU
83816 Points +69%
Asus ExpertBook B1 B1403CVA
Intel Core i5-13420H, UHD Graphics Xe G4 48EUs
70001 Points +41%
Dell Latitude 7440
Intel Core i5-1345U, Iris Xe G7 80EUs
62953 Points +27%
Dell Pro 14 Premium
Intel Core Ultra 7 268V, Arc 140V
49702 Points
Przeciętny Intel Core Ultra 7 268V
  (49630 - 49759, n=4)
49684 Points 0%
HP EliteBook Ultra G1i 14
Intel Core Ultra 7 258V, Arc 140V
49510 Points 0%
Lenovo ThinkPad T14s Gen 6 Intel
Intel Core Ultra 5 228V, Arc 130V
46469 Points -7%
AIDA64 / FPU SinJulia
Dell XPS 14 2024 OLED
Intel Core Ultra 7 155H, NVIDIA GeForce RTX 4050 Laptop GPU
8787 Points +99%
Asus ExpertBook B1 B1403CVA
Intel Core i5-13420H, UHD Graphics Xe G4 48EUs
5485 Points +24%
Dell Latitude 7440
Intel Core i5-1345U, Iris Xe G7 80EUs
5206 Points +18%
HP EliteBook Ultra G1i 14
Intel Core Ultra 7 258V, Arc 140V
4440 Points 0%
Dell Pro 14 Premium
Intel Core Ultra 7 268V, Arc 140V
4419 Points
Przeciętny Intel Core Ultra 7 268V
  (4353 - 4429, n=4)
4407 Points 0%
Lenovo ThinkPad T14s Gen 6 Intel
Intel Core Ultra 5 228V, Arc 130V
3918 Points -11%
AIDA64 / FPU Mandel
Dell Pro 14 Premium
Intel Core Ultra 7 268V, Arc 140V
32800 Points
Dell XPS 14 2024 OLED
Intel Core Ultra 7 155H, NVIDIA GeForce RTX 4050 Laptop GPU
30530 Points -7%
Lenovo ThinkPad T14s Gen 6 Intel
Intel Core Ultra 5 228V, Arc 130V
30384 Points -7%
Przeciętny Intel Core Ultra 7 268V
  (25929 - 32800, n=4)
30051 Points -8%
HP EliteBook Ultra G1i 14
Intel Core Ultra 7 258V, Arc 140V
27375 Points -17%
Dell Latitude 7440
Intel Core i5-1345U, Iris Xe G7 80EUs
21556 Points -34%
Asus ExpertBook B1 B1403CVA
Intel Core i5-13420H, UHD Graphics Xe G4 48EUs
19684 Points -40%
AIDA64 / CPU AES
Dell XPS 14 2024 OLED
Intel Core Ultra 7 155H, NVIDIA GeForce RTX 4050 Laptop GPU
63756 MB/s +63%
Dell Latitude 7440
Intel Core i5-1345U, Iris Xe G7 80EUs
41994 MB/s +7%
Dell Pro 14 Premium
Intel Core Ultra 7 268V, Arc 140V
39140 MB/s
HP EliteBook Ultra G1i 14
Intel Core Ultra 7 258V, Arc 140V
37728 MB/s -4%
Przeciętny Intel Core Ultra 7 268V
  (33196 - 39140, n=4)
37496 MB/s -4%
Lenovo ThinkPad T14s Gen 6 Intel
Intel Core Ultra 5 228V, Arc 130V
35960 MB/s -8%
Asus ExpertBook B1 B1403CVA
Intel Core i5-13420H, UHD Graphics Xe G4 48EUs
35531 MB/s -9%
AIDA64 / CPU ZLib
Dell XPS 14 2024 OLED
Intel Core Ultra 7 155H, NVIDIA GeForce RTX 4050 Laptop GPU
876 MB/s +39%
Dell Latitude 7440
Intel Core i5-1345U, Iris Xe G7 80EUs
640 MB/s +2%
Dell Pro 14 Premium
Intel Core Ultra 7 268V, Arc 140V
630 MB/s
Przeciętny Intel Core Ultra 7 268V
  (441 - 631, n=4)
571 MB/s -9%
Lenovo ThinkPad T14s Gen 6 Intel
Intel Core Ultra 5 228V, Arc 130V
553 MB/s -12%
HP EliteBook Ultra G1i 14
Intel Core Ultra 7 258V, Arc 140V
551 MB/s -13%
Asus ExpertBook B1 B1403CVA
Intel Core i5-13420H, UHD Graphics Xe G4 48EUs
509 MB/s -19%
AIDA64 / FP64 Ray-Trace
Dell Pro 14 Premium
Intel Core Ultra 7 268V, Arc 140V
6824 KRay/s
Lenovo ThinkPad T14s Gen 6 Intel
Intel Core Ultra 5 228V, Arc 130V
6455 KRay/s -5%
Przeciętny Intel Core Ultra 7 268V
  (5938 - 6824, n=4)
6445 KRay/s -6%
Dell XPS 14 2024 OLED
Intel Core Ultra 7 155H, NVIDIA GeForce RTX 4050 Laptop GPU
6330 KRay/s -7%
HP EliteBook Ultra G1i 14
Intel Core Ultra 7 258V, Arc 140V
5554 KRay/s -19%
Dell Latitude 7440
Intel Core i5-1345U, Iris Xe G7 80EUs
4640 KRay/s -32%
Asus ExpertBook B1 B1403CVA
Intel Core i5-13420H, UHD Graphics Xe G4 48EUs
4283 KRay/s -37%
AIDA64 / CPU PhotoWorxx
Dell Pro 14 Premium
Intel Core Ultra 7 268V, Arc 140V
54608 MPixel/s
Lenovo ThinkPad T14s Gen 6 Intel
Intel Core Ultra 5 228V, Arc 130V
52680 MPixel/s -4%
Przeciętny Intel Core Ultra 7 268V
  (46733 - 54886, n=4)
52442 MPixel/s -4%
HP EliteBook Ultra G1i 14
Intel Core Ultra 7 258V, Arc 140V
51458 MPixel/s -6%
Dell XPS 14 2024 OLED
Intel Core Ultra 7 155H, NVIDIA GeForce RTX 4050 Laptop GPU
51365 MPixel/s -6%
Dell Latitude 7440
Intel Core i5-1345U, Iris Xe G7 80EUs
39231 MPixel/s -28%
Asus ExpertBook B1 B1403CVA
Intel Core i5-13420H, UHD Graphics Xe G4 48EUs
37044 MPixel/s -32%

Wydajność systemu

Wyniki PCMark w porównaniu do zeszłorocznego Latitude 7440 lub 9440 2-in-1 są najbardziej ulepszone w podteście Digital Content Creation ze względu na znacznie szybszy zintegrowany procesor graficzny Lunar Lake. W przeciwnym razie tradycyjne zadania biurowe nie są dużo szybsze na Dell Pro 14 Premium, czego przykładem jest stosunkowo niewielki wzrost wydajności surowego procesora wspomniany powyżej.

Wydajność pamięci RAM jest prawie dwa razy wyższa dzięki unikalnemu rozwiązaniu pamięci RAM on-die Lunar Lake w porównaniu do starszej architektury Raptor Lake.

PCMark 10 Standard
PCMark 10 Standard
Performance Rating: Percent
PCMark 10: Score | Essentials | Productivity | Digital Content Creation
CrossMark: Overall | Productivity | Creativity | Responsiveness
WebXPRT 3: Overall
WebXPRT 4: Overall
Mozilla Kraken 1.1: Total
Performance Rating
Dell Pro 14 Premium
Arc 140V, Core Ultra 7 268V, Kioxia BG6 KBG6AZNV1T02
91.3 pt
HP EliteBook Ultra G1i 14
Arc 140V, Core Ultra 7 258V, Kioxia XG8 KXG80ZNV1T02
90.1 pt
Przeciętny Intel Core Ultra 7 268V, Intel Arc Graphics 140V
 
88.8 pt
Dell XPS 14 2024 OLED
NVIDIA GeForce RTX 4050 Laptop GPU, Ultra 7 155H, Samsung PM9A1 MZVL21T0HCLR
84.3 pt
Lenovo ThinkPad T14s Gen 6 Intel
Arc 130V, Core Ultra 5 228V, SK hynix PCB01 HFS001TFM9X179N GL
82.8 pt
Asus ExpertBook B1 B1403CVA
UHD Graphics Xe G4 48EUs, i5-13420H, Western Digital PC SN5000S SDEQNSJ-512G-1002
75.3 pt
Dell Latitude 7440 -4!
Iris Xe G7 80EUs, i5-1345U, Samsung MZ9L4512HBLU-00BMV
68.7 pt
PCMark 10 / Score
Dell Pro 14 Premium
Arc 140V, Core Ultra 7 268V, Kioxia BG6 KBG6AZNV1T02
7166 Points
HP EliteBook Ultra G1i 14
Arc 140V, Core Ultra 7 258V, Kioxia XG8 KXG80ZNV1T02
7162 Points 0%
Przeciętny Intel Core Ultra 7 268V, Intel Arc Graphics 140V
  (6729 - 7236, n=4)
7014 Points -2%
Lenovo ThinkPad T14s Gen 6 Intel
Arc 130V, Core Ultra 5 228V, SK hynix PCB01 HFS001TFM9X179N GL
6594 Points -8%
Dell XPS 14 2024 OLED
NVIDIA GeForce RTX 4050 Laptop GPU, Ultra 7 155H, Samsung PM9A1 MZVL21T0HCLR
6537 Points -9%
Dell Latitude 7440
Iris Xe G7 80EUs, i5-1345U, Samsung MZ9L4512HBLU-00BMV
5554 Points -22%
Asus ExpertBook B1 B1403CVA
UHD Graphics Xe G4 48EUs, i5-13420H, Western Digital PC SN5000S SDEQNSJ-512G-1002
5406 Points -25%
PCMark 10 / Essentials
Dell Latitude 7440
Iris Xe G7 80EUs, i5-1345U, Samsung MZ9L4512HBLU-00BMV
10758 Points +3%
HP EliteBook Ultra G1i 14
Arc 140V, Core Ultra 7 258V, Kioxia XG8 KXG80ZNV1T02
10505 Points 0%
Dell Pro 14 Premium
Arc 140V, Core Ultra 7 268V, Kioxia BG6 KBG6AZNV1T02
10465 Points
Asus ExpertBook B1 B1403CVA
UHD Graphics Xe G4 48EUs, i5-13420H, Western Digital PC SN5000S SDEQNSJ-512G-1002
10385 Points -1%
Przeciętny Intel Core Ultra 7 268V, Intel Arc Graphics 140V
  (10007 - 10701, n=4)
10381 Points -1%
Dell XPS 14 2024 OLED
NVIDIA GeForce RTX 4050 Laptop GPU, Ultra 7 155H, Samsung PM9A1 MZVL21T0HCLR
10044 Points -4%
Lenovo ThinkPad T14s Gen 6 Intel
Arc 130V, Core Ultra 5 228V, SK hynix PCB01 HFS001TFM9X179N GL
9816 Points -6%
PCMark 10 / Productivity
HP EliteBook Ultra G1i 14
Arc 140V, Core Ultra 7 258V, Kioxia XG8 KXG80ZNV1T02
9619 Points +4%
Dell Pro 14 Premium
Arc 140V, Core Ultra 7 268V, Kioxia BG6 KBG6AZNV1T02
9206 Points
Przeciętny Intel Core Ultra 7 268V, Intel Arc Graphics 140V
  (8766 - 9217, n=4)
9003 Points -2%
Dell XPS 14 2024 OLED
NVIDIA GeForce RTX 4050 Laptop GPU, Ultra 7 155H, Samsung PM9A1 MZVL21T0HCLR
8769 Points -5%
Lenovo ThinkPad T14s Gen 6 Intel
Arc 130V, Core Ultra 5 228V, SK hynix PCB01 HFS001TFM9X179N GL
8484 Points -8%
Dell Latitude 7440
Iris Xe G7 80EUs, i5-1345U, Samsung MZ9L4512HBLU-00BMV
7189 Points -22%
Asus ExpertBook B1 B1403CVA
UHD Graphics Xe G4 48EUs, i5-13420H, Western Digital PC SN5000S SDEQNSJ-512G-1002
6848 Points -26%
PCMark 10 / Digital Content Creation
Dell Pro 14 Premium
Arc 140V, Core Ultra 7 268V, Kioxia BG6 KBG6AZNV1T02
10366 Points
Przeciętny Intel Core Ultra 7 268V, Intel Arc Graphics 140V
  (9425 - 10427, n=4)
10020 Points -3%
HP EliteBook Ultra G1i 14
Arc 140V, Core Ultra 7 258V, Kioxia XG8 KXG80ZNV1T02
9865 Points -5%
Lenovo ThinkPad T14s Gen 6 Intel
Arc 130V, Core Ultra 5 228V, SK hynix PCB01 HFS001TFM9X179N GL
9347 Points -10%
Dell XPS 14 2024 OLED
NVIDIA GeForce RTX 4050 Laptop GPU, Ultra 7 155H, Samsung PM9A1 MZVL21T0HCLR
8609 Points -17%
Asus ExpertBook B1 B1403CVA
UHD Graphics Xe G4 48EUs, i5-13420H, Western Digital PC SN5000S SDEQNSJ-512G-1002
6030 Points -42%
Dell Latitude 7440
Iris Xe G7 80EUs, i5-1345U, Samsung MZ9L4512HBLU-00BMV
6012 Points -42%
CrossMark / Overall
Dell Pro 14 Premium
Arc 140V, Core Ultra 7 268V, Kioxia BG6 KBG6AZNV1T02
1746 Points
HP EliteBook Ultra G1i 14
Arc 140V, Core Ultra 7 258V, Kioxia XG8 KXG80ZNV1T02
1739 Points 0%
Przeciętny Intel Core Ultra 7 268V, Intel Arc Graphics 140V
  (1643 - 1763, n=4)
1723 Points -1%
Dell XPS 14 2024 OLED
NVIDIA GeForce RTX 4050 Laptop GPU, Ultra 7 155H, Samsung PM9A1 MZVL21T0HCLR
1690 Points -3%
Lenovo ThinkPad T14s Gen 6 Intel
Arc 130V, Core Ultra 5 228V, SK hynix PCB01 HFS001TFM9X179N GL
1570 Points -10%
Asus ExpertBook B1 B1403CVA
UHD Graphics Xe G4 48EUs, i5-13420H, Western Digital PC SN5000S SDEQNSJ-512G-1002
1538 Points -12%
CrossMark / Productivity
Dell Pro 14 Premium
Arc 140V, Core Ultra 7 268V, Kioxia BG6 KBG6AZNV1T02
1684 Points
HP EliteBook Ultra G1i 14
Arc 140V, Core Ultra 7 258V, Kioxia XG8 KXG80ZNV1T02
1674 Points -1%
Przeciętny Intel Core Ultra 7 268V, Intel Arc Graphics 140V
  (1577 - 1696, n=4)
1659 Points -1%
Dell XPS 14 2024 OLED
NVIDIA GeForce RTX 4050 Laptop GPU, Ultra 7 155H, Samsung PM9A1 MZVL21T0HCLR
1603 Points -5%
Lenovo ThinkPad T14s Gen 6 Intel
Arc 130V, Core Ultra 5 228V, SK hynix PCB01 HFS001TFM9X179N GL
1519 Points -10%
Asus ExpertBook B1 B1403CVA
UHD Graphics Xe G4 48EUs, i5-13420H, Western Digital PC SN5000S SDEQNSJ-512G-1002
1498 Points -11%
CrossMark / Creativity
Dell Pro 14 Premium
Arc 140V, Core Ultra 7 268V, Kioxia BG6 KBG6AZNV1T02
1992 Points
HP EliteBook Ultra G1i 14
Arc 140V, Core Ultra 7 258V, Kioxia XG8 KXG80ZNV1T02
1977 Points -1%
Przeciętny Intel Core Ultra 7 268V, Intel Arc Graphics 140V
  (1866 - 2021, n=4)
1964 Points -1%
Dell XPS 14 2024 OLED
NVIDIA GeForce RTX 4050 Laptop GPU, Ultra 7 155H, Samsung PM9A1 MZVL21T0HCLR
1909 Points -4%
Lenovo ThinkPad T14s Gen 6 Intel
Arc 130V, Core Ultra 5 228V, SK hynix PCB01 HFS001TFM9X179N GL
1762 Points -12%
Asus ExpertBook B1 B1403CVA
UHD Graphics Xe G4 48EUs, i5-13420H, Western Digital PC SN5000S SDEQNSJ-512G-1002
1658 Points -17%
CrossMark / Responsiveness
Dell XPS 14 2024 OLED
NVIDIA GeForce RTX 4050 Laptop GPU, Ultra 7 155H, Samsung PM9A1 MZVL21T0HCLR
1373 Points +5%
Asus ExpertBook B1 B1403CVA
UHD Graphics Xe G4 48EUs, i5-13420H, Western Digital PC SN5000S SDEQNSJ-512G-1002
1331 Points +2%
HP EliteBook Ultra G1i 14
Arc 140V, Core Ultra 7 258V, Kioxia XG8 KXG80ZNV1T02
1329 Points +2%
Dell Pro 14 Premium
Arc 140V, Core Ultra 7 268V, Kioxia BG6 KBG6AZNV1T02
1309 Points
Przeciętny Intel Core Ultra 7 268V, Intel Arc Graphics 140V
  (1267 - 1313, n=4)
1300 Points -1%
Lenovo ThinkPad T14s Gen 6 Intel
Arc 130V, Core Ultra 5 228V, SK hynix PCB01 HFS001TFM9X179N GL
1229 Points -6%
WebXPRT 3 / Overall
Dell Pro 14 Premium
Arc 140V, Core Ultra 7 268V, Kioxia BG6 KBG6AZNV1T02
317 Points
HP EliteBook Ultra G1i 14
Arc 140V, Core Ultra 7 258V, Kioxia XG8 KXG80ZNV1T02
298 Points -6%
Przeciętny Intel Core Ultra 7 268V, Intel Arc Graphics 140V
  (266 - 317, n=4)
296 Points -7%
Lenovo ThinkPad T14s Gen 6 Intel
Arc 130V, Core Ultra 5 228V, SK hynix PCB01 HFS001TFM9X179N GL
288 Points -9%
Dell XPS 14 2024 OLED
NVIDIA GeForce RTX 4050 Laptop GPU, Ultra 7 155H, Samsung PM9A1 MZVL21T0HCLR
281 Points -11%
Dell Latitude 7440
Iris Xe G7 80EUs, i5-1345U, Samsung MZ9L4512HBLU-00BMV
274 Points -14%
Asus ExpertBook B1 B1403CVA
UHD Graphics Xe G4 48EUs, i5-13420H, Western Digital PC SN5000S SDEQNSJ-512G-1002
267 Points -16%
WebXPRT 4 / Overall
Dell Pro 14 Premium
Arc 140V, Core Ultra 7 268V, Kioxia BG6 KBG6AZNV1T02
292 Points
HP EliteBook Ultra G1i 14
Arc 140V, Core Ultra 7 258V, Kioxia XG8 KXG80ZNV1T02
280 Points -4%
Przeciętny Intel Core Ultra 7 268V, Intel Arc Graphics 140V
  (245 - 292, n=4)
275 Points -6%
Lenovo ThinkPad T14s Gen 6 Intel
Arc 130V, Core Ultra 5 228V, SK hynix PCB01 HFS001TFM9X179N GL
266 Points -9%
Dell XPS 14 2024 OLED
NVIDIA GeForce RTX 4050 Laptop GPU, Ultra 7 155H, Samsung PM9A1 MZVL21T0HCLR
256 Points -12%
Asus ExpertBook B1 B1403CVA
UHD Graphics Xe G4 48EUs, i5-13420H, Western Digital PC SN5000S SDEQNSJ-512G-1002
251 Points -14%
Dell Latitude 7440
Iris Xe G7 80EUs, i5-1345U, Samsung MZ9L4512HBLU-00BMV
242 Points -17%
Mozilla Kraken 1.1 / Total
Asus ExpertBook B1 B1403CVA
UHD Graphics Xe G4 48EUs, i5-13420H, Western Digital PC SN5000S SDEQNSJ-512G-1002
546 ms * -19%
Dell Latitude 7440
Iris Xe G7 80EUs, i5-1345U, Samsung MZ9L4512HBLU-00BMV
538 ms * -17%
Dell XPS 14 2024 OLED
NVIDIA GeForce RTX 4050 Laptop GPU, Ultra 7 155H, Samsung PM9A1 MZVL21T0HCLR
522 ms * -13%
Lenovo ThinkPad T14s Gen 6 Intel
Arc 130V, Core Ultra 5 228V, SK hynix PCB01 HFS001TFM9X179N GL
499 ms * -8%
HP EliteBook Ultra G1i 14
Arc 140V, Core Ultra 7 258V, Kioxia XG8 KXG80ZNV1T02
473 ms * -3%
Przeciętny Intel Core Ultra 7 268V, Intel Arc Graphics 140V
  (460 - 476, n=4)
470 ms * -2%
Dell Pro 14 Premium
Arc 140V, Core Ultra 7 268V, Kioxia BG6 KBG6AZNV1T02
460 ms *

* ... im mniej tym lepiej

PCMark 10 Score
7166 pkt.
Pomoc
AIDA64 / Memory Copy
HP EliteBook Ultra G1i 14
Intel Core Ultra 7 258V, Arc 140V
108212 MB/s 0%
Dell Pro 14 Premium
Intel Core Ultra 7 268V, Arc 140V
108195 MB/s
Przeciętny Intel Core Ultra 7 268V
  (100445 - 108317, n=4)
106016 MB/s -2%
Lenovo ThinkPad T14s Gen 6 Intel
Intel Core Ultra 5 228V, Arc 130V
105922 MB/s -2%
Dell XPS 14 2024 OLED
Intel Core Ultra 7 155H, NVIDIA GeForce RTX 4050 Laptop GPU
92722 MB/s -14%
Asus ExpertBook B1 B1403CVA
Intel Core i5-13420H, UHD Graphics Xe G4 48EUs
59609 MB/s -45%
Dell Latitude 7440
Intel Core i5-1345U, Iris Xe G7 80EUs
57716 MB/s -47%
AIDA64 / Memory Read
HP EliteBook Ultra G1i 14
Intel Core Ultra 7 258V, Arc 140V
88446 MB/s +1%
Dell Pro 14 Premium
Intel Core Ultra 7 268V, Arc 140V
87731 MB/s
Przeciętny Intel Core Ultra 7 268V
  (82511 - 88341, n=4)
86583 MB/s -1%
Dell XPS 14 2024 OLED
Intel Core Ultra 7 155H, NVIDIA GeForce RTX 4050 Laptop GPU
86033 MB/s -2%
Lenovo ThinkPad T14s Gen 6 Intel
Intel Core Ultra 5 228V, Arc 130V
83869 MB/s -4%
Asus ExpertBook B1 B1403CVA
Intel Core i5-13420H, UHD Graphics Xe G4 48EUs
68085 MB/s -22%
Dell Latitude 7440
Intel Core i5-1345U, Iris Xe G7 80EUs
50185 MB/s -43%
AIDA64 / Memory Write
Dell Pro 14 Premium
Intel Core Ultra 7 268V, Arc 140V
117867 MB/s
HP EliteBook Ultra G1i 14
Intel Core Ultra 7 258V, Arc 140V
117826 MB/s 0%
Przeciętny Intel Core Ultra 7 268V
  (115959 - 117888, n=4)
117393 MB/s 0%
Lenovo ThinkPad T14s Gen 6 Intel
Intel Core Ultra 5 228V, Arc 130V
111521 MB/s -5%
Dell XPS 14 2024 OLED
Intel Core Ultra 7 155H, NVIDIA GeForce RTX 4050 Laptop GPU
73767 MB/s -37%
Dell Latitude 7440
Intel Core i5-1345U, Iris Xe G7 80EUs
72373 MB/s -39%
Asus ExpertBook B1 B1403CVA
Intel Core i5-13420H, UHD Graphics Xe G4 48EUs
62529 MB/s -47%
AIDA64 / Memory Latency
Dell XPS 14 2024 OLED
Intel Core Ultra 7 155H, NVIDIA GeForce RTX 4050 Laptop GPU
135.8 ns * -34%
Dell Latitude 7440
Intel Core i5-1345U, Iris Xe G7 80EUs
102.1 ns * -1%
Dell Pro 14 Premium
Intel Core Ultra 7 268V, Arc 140V
101.5 ns *
Przeciętny Intel Core Ultra 7 268V
  (94.4 - 101.5, n=4)
98.6 ns * +3%
Asus ExpertBook B1 B1403CVA
Intel Core i5-13420H, UHD Graphics Xe G4 48EUs
96.3 ns * +5%
Lenovo ThinkPad T14s Gen 6 Intel
Intel Core Ultra 5 228V, Arc 130V
95.8 ns * +6%
HP EliteBook Ultra G1i 14
Intel Core Ultra 7 258V, Arc 140V
95.7 ns * +6%

* ... im mniej tym lepiej

Opóźnienie DPC

LatencyMon pokazuje problemy z DPC podczas otwierania wielu kart przeglądarki na naszej stronie głównej, ale poza tym nie rejestruje spadków klatek podczas strumieniowania treści wideo 4K60.

LatencyMon
LatencyMon
Lista kierowców
Lista kierowców
DPC Latencies / LatencyMon - interrupt to process latency (max), Web, Youtube, Prime95
Dell Pro 14 Premium
Arc 140V, Core Ultra 7 268V, Kioxia BG6 KBG6AZNV1T02
5706.7 μs *
Dell XPS 14 2024 OLED
NVIDIA GeForce RTX 4050 Laptop GPU, Ultra 7 155H, Samsung PM9A1 MZVL21T0HCLR
2192.4 μs * +62%
HP EliteBook Ultra G1i 14
Arc 140V, Core Ultra 7 258V, Kioxia XG8 KXG80ZNV1T02
1584.8 μs * +72%
Dell Latitude 7440
Iris Xe G7 80EUs, i5-1345U, Samsung MZ9L4512HBLU-00BMV
1203.08 μs * +79%
Asus ExpertBook B1 B1403CVA
UHD Graphics Xe G4 48EUs, i5-13420H, Western Digital PC SN5000S SDEQNSJ-512G-1002
1134.8 μs * +80%
Lenovo ThinkPad T14s Gen 6 Intel
Arc 130V, Core Ultra 5 228V, SK hynix PCB01 HFS001TFM9X179N GL
930.4 μs * +84%

* ... im mniej tym lepiej

Urządzenia pamięci masowej

Kioxia BG6 Kioxia BG6 w systemie działa zarówno szybciej, jak i bardziej konsekwentnie niż dyski Samsung w zeszłorocznych modelach Latitude 14, co pokazuje poniższy wykres. Maksymalne prędkości transferu są stabilne na poziomie około 6000 MB/s w porównaniu do <3500 MB/s na Latitude 7440 lub 9440 2-w-1.

CDM 8
CDM 8
AS SSD
AS SSD
Proszę pamiętać, że model ten nie obsługuje dysków SSD 80 mm (lub 2280). Nie ma wsparcia dla dodatkowych dysków wewnętrznych
Kioxia BG6 KBG6AZNV1T02
CDM 5/6 Read Seq Q32T1: 6090 MB/s
CDM 5/6 Write Seq Q32T1: 5266 MB/s
CDM 5/6 Read 4K Q32T1: 446.6 MB/s
CDM 5/6 Write 4K Q32T1: 392.6 MB/s
CDM 5 Read Seq: 2407 MB/s
CDM 5 Write Seq: 2376 MB/s
CDM 5/6 Read 4K: 52.57 MB/s
CDM 5/6 Write 4K: 118.5 MB/s
Drive Performance Rating - Percent
Asus ExpertBook B1 B1403CVA
Western Digital PC SN5000S SDEQNSJ-512G-1002
82.6 pt
Lenovo ThinkPad T14s Gen 6 Intel
SK hynix PCB01 HFS001TFM9X179N GL
80.6 pt
Dell XPS 14 2024 OLED
Samsung PM9A1 MZVL21T0HCLR
80.3 pt
HP EliteBook Ultra G1i 14
Kioxia XG8 KXG80ZNV1T02
69.2 pt
Dell Latitude 7440
Samsung MZ9L4512HBLU-00BMV
63 pt
Dell Pro 14 Premium
Kioxia BG6 KBG6AZNV1T02
62.3 pt
DiskSpd
seq read
Lenovo ThinkPad T14s Gen 6 Intel
SK hynix PCB01 HFS001TFM9X179N GL
4346 (4284.27min - 4345.72max) MB/s +53%
Dell XPS 14 2024 OLED
Samsung PM9A1 MZVL21T0HCLR
3751 (3682.81min - 3751.22max) MB/s +32%
HP EliteBook Ultra G1i 14
Kioxia XG8 KXG80ZNV1T02
3344 (3324.2min - 3344.14max) MB/s +18%
Dell Pro 14 Premium
Kioxia BG6 KBG6AZNV1T02
2842 (2812.74min - 2841.62max) MB/s
Dell Latitude 7440
Samsung MZ9L4512HBLU-00BMV
2443 (2427.84min - 2443.39max) MB/s -14%
Asus ExpertBook B1 B1403CVA
Western Digital PC SN5000S SDEQNSJ-512G-1002
1553 (1337.56min - 1552.94max) MB/s -45%
seq write
Asus ExpertBook B1 B1403CVA
Western Digital PC SN5000S SDEQNSJ-512G-1002
3640 (3340.55min - 3640.3max) MB/s +57%
Lenovo ThinkPad T14s Gen 6 Intel
SK hynix PCB01 HFS001TFM9X179N GL
3468 (3090.57min - 3468.06max) MB/s +50%
Dell XPS 14 2024 OLED
Samsung PM9A1 MZVL21T0HCLR
3171 (3136.31min - 3170.84max) MB/s +37%
HP EliteBook Ultra G1i 14
Kioxia XG8 KXG80ZNV1T02
2639 (2398.3min - 2638.85max) MB/s +14%
Dell Pro 14 Premium
Kioxia BG6 KBG6AZNV1T02
2313 (2192.36min - 2312.74max) MB/s
Dell Latitude 7440
Samsung MZ9L4512HBLU-00BMV
1776 (1737.28min - 1776.3max) MB/s -23%
seq q8 t1 read
Lenovo ThinkPad T14s Gen 6 Intel
SK hynix PCB01 HFS001TFM9X179N GL
13331 (11681.3min - 13330.9max) MB/s +118%
HP EliteBook Ultra G1i 14
Kioxia XG8 KXG80ZNV1T02
6781 (5790.28min - 6781.35max) MB/s +11%
Dell XPS 14 2024 OLED
Samsung PM9A1 MZVL21T0HCLR
6743 (5552.84min - 6743.39max) MB/s +10%
Asus ExpertBook B1 B1403CVA
Western Digital PC SN5000S SDEQNSJ-512G-1002
6347 (5492.65min - 6347.13max) MB/s +4%
Dell Pro 14 Premium
Kioxia BG6 KBG6AZNV1T02
6110 (5320.32min - 6110.05max) MB/s
Dell Latitude 7440
Samsung MZ9L4512HBLU-00BMV
3519 (2577.61min - 3518.81max) MB/s -42%
seq q8 t1 write
Lenovo ThinkPad T14s Gen 6 Intel
SK hynix PCB01 HFS001TFM9X179N GL
8043 (6617.56min - 8043.21max) MB/s +52%
HP EliteBook Ultra G1i 14
Kioxia XG8 KXG80ZNV1T02
5570 (5433.72min - 5570.22max) MB/s +6%
Dell Pro 14 Premium
Kioxia BG6 KBG6AZNV1T02
5279 (5231.58min - 5279.37max) MB/s
Dell XPS 14 2024 OLED
Samsung PM9A1 MZVL21T0HCLR
5221 (5171.16min - 5220.69max) MB/s -1%
Asus ExpertBook B1 B1403CVA
Western Digital PC SN5000S SDEQNSJ-512G-1002
4385 (3683.44min - 4385.35max) MB/s -17%
Dell Latitude 7440
Samsung MZ9L4512HBLU-00BMV
2210 (2175.38min - 2210.17max) MB/s -58%
4k q1 t1 read
Asus ExpertBook B1 B1403CVA
Western Digital PC SN5000S SDEQNSJ-512G-1002
85.9 (84.26min - 85.93max) MB/s +95%
Dell Latitude 7440
Samsung MZ9L4512HBLU-00BMV
78.8 (76.59min - 78.83max) MB/s +79%
Dell XPS 14 2024 OLED
Samsung PM9A1 MZVL21T0HCLR
69 (68.86min - 68.99max) MB/s +56%
Lenovo ThinkPad T14s Gen 6 Intel
SK hynix PCB01 HFS001TFM9X179N GL
59.1 (58.45min - 59.13max) MB/s +34%
HP EliteBook Ultra G1i 14
Kioxia XG8 KXG80ZNV1T02
50.3 (47.64min - 50.26max) MB/s +14%
Dell Pro 14 Premium
Kioxia BG6 KBG6AZNV1T02
44.1 (43.53min - 44.13max) MB/s
4k q1 t1 write
Asus ExpertBook B1 B1403CVA
Western Digital PC SN5000S SDEQNSJ-512G-1002
169.8 (164.34min - 169.77max) MB/s +39%
Dell Latitude 7440
Samsung MZ9L4512HBLU-00BMV
131.4 (129.27min - 131.42max) MB/s +8%
Dell XPS 14 2024 OLED
Samsung PM9A1 MZVL21T0HCLR
122.2 (121.32min - 122.19max) MB/s 0%
Dell Pro 14 Premium
Kioxia BG6 KBG6AZNV1T02
121.8 (119.08min - 121.81max) MB/s
HP EliteBook Ultra G1i 14
Kioxia XG8 KXG80ZNV1T02
119 (109.35min - 118.96max) MB/s -2%
Lenovo ThinkPad T14s Gen 6 Intel
SK hynix PCB01 HFS001TFM9X179N GL
115.7 (114.19min - 115.74max) MB/s -5%
4k q32 t16 read
Dell Pro 14 Premium
Kioxia BG6 KBG6AZNV1T02
639 (624.64min - 639.07max) MB/s
Asus ExpertBook B1 B1403CVA
Western Digital PC SN5000S SDEQNSJ-512G-1002
628 (619.12min - 627.94max) MB/s -2%
HP EliteBook Ultra G1i 14
Kioxia XG8 KXG80ZNV1T02
609 (591.46min - 609.16max) MB/s -5%
Lenovo ThinkPad T14s Gen 6 Intel
SK hynix PCB01 HFS001TFM9X179N GL
571 (554.31min - 571.4max) MB/s -11%
Dell XPS 14 2024 OLED
Samsung PM9A1 MZVL21T0HCLR
567 (560.08min - 567.34max) MB/s -11%
Dell Latitude 7440
Samsung MZ9L4512HBLU-00BMV
476 (466.05min - 475.52max) MB/s -26%
4k q32 t16 write
Asus ExpertBook B1 B1403CVA
Western Digital PC SN5000S SDEQNSJ-512G-1002
480 (395.08min - 479.75max) MB/s +19%
Lenovo ThinkPad T14s Gen 6 Intel
SK hynix PCB01 HFS001TFM9X179N GL
410 (23.47min - 409.57max) MB/s +2%
Dell Pro 14 Premium
Kioxia BG6 KBG6AZNV1T02
403 (313.61min - 402.71max) MB/s
Dell XPS 14 2024 OLED
Samsung PM9A1 MZVL21T0HCLR
379 (370.97min - 379.33max) MB/s -6%
Dell Latitude 7440
Samsung MZ9L4512HBLU-00BMV
360 (355.44min - 360.36max) MB/s -11%
HP EliteBook Ultra G1i 14
Kioxia XG8 KXG80ZNV1T02
279 (259.99min - 278.51max) MB/s -31%
AS SSD
Score Total
Dell XPS 14 2024 OLED
Samsung PM9A1 MZVL21T0HCLR
4358 Points +30%
Asus ExpertBook B1 B1403CVA
Western Digital PC SN5000S SDEQNSJ-512G-1002
4092 Points +22%
Lenovo ThinkPad T14s Gen 6 Intel
SK hynix PCB01 HFS001TFM9X179N GL
3877 Points +15%
Dell Latitude 7440
Samsung MZ9L4512HBLU-00BMV
3533 Points +5%
Dell Pro 14 Premium
Kioxia BG6 KBG6AZNV1T02
3357 Points
HP EliteBook Ultra G1i 14
Kioxia XG8 KXG80ZNV1T02
3346 Points 0%
Score Read
Lenovo ThinkPad T14s Gen 6 Intel
SK hynix PCB01 HFS001TFM9X179N GL
1412 Points +22%
Asus ExpertBook B1 B1403CVA
Western Digital PC SN5000S SDEQNSJ-512G-1002
1339 Points +16%
Dell XPS 14 2024 OLED
Samsung PM9A1 MZVL21T0HCLR
1304 Points +13%
HP EliteBook Ultra G1i 14
Kioxia XG8 KXG80ZNV1T02
1190 Points +3%
Dell Pro 14 Premium
Kioxia BG6 KBG6AZNV1T02
1156 Points
Dell Latitude 7440
Samsung MZ9L4512HBLU-00BMV
1028 Points -11%
Score Write
Dell XPS 14 2024 OLED
Samsung PM9A1 MZVL21T0HCLR
2497 Points +50%
Asus ExpertBook B1 B1403CVA
Western Digital PC SN5000S SDEQNSJ-512G-1002
2147 Points +29%
Dell Latitude 7440
Samsung MZ9L4512HBLU-00BMV
2029 Points +22%
Lenovo ThinkPad T14s Gen 6 Intel
SK hynix PCB01 HFS001TFM9X179N GL
1851 Points +11%
Dell Pro 14 Premium
Kioxia BG6 KBG6AZNV1T02
1669 Points
HP EliteBook Ultra G1i 14
Kioxia XG8 KXG80ZNV1T02
1661 Points 0%
Seq Read
Lenovo ThinkPad T14s Gen 6 Intel
SK hynix PCB01 HFS001TFM9X179N GL
7478 MB/s +60%
HP EliteBook Ultra G1i 14
Kioxia XG8 KXG80ZNV1T02
5250 MB/s +12%
Dell XPS 14 2024 OLED
Samsung PM9A1 MZVL21T0HCLR
5025 MB/s +7%
Asus ExpertBook B1 B1403CVA
Western Digital PC SN5000S SDEQNSJ-512G-1002
4780 MB/s +2%
Dell Pro 14 Premium
Kioxia BG6 KBG6AZNV1T02
4681.73 MB/s
Dell Latitude 7440
Samsung MZ9L4512HBLU-00BMV
3017.95 MB/s -36%
Seq Write
Lenovo ThinkPad T14s Gen 6 Intel
SK hynix PCB01 HFS001TFM9X179N GL
5004 MB/s +50%
Dell Pro 14 Premium
Kioxia BG6 KBG6AZNV1T02
3344.41 MB/s
HP EliteBook Ultra G1i 14
Kioxia XG8 KXG80ZNV1T02
2760 MB/s -17%
Asus ExpertBook B1 B1403CVA
Western Digital PC SN5000S SDEQNSJ-512G-1002
2702 MB/s -19%
Dell XPS 14 2024 OLED
Samsung PM9A1 MZVL21T0HCLR
2497 MB/s -25%
Dell Latitude 7440
Samsung MZ9L4512HBLU-00BMV
1520.78 MB/s -55%
4K Read
Asus ExpertBook B1 B1403CVA
Western Digital PC SN5000S SDEQNSJ-512G-1002
78.8 MB/s +88%
Dell Latitude 7440
Samsung MZ9L4512HBLU-00BMV
72.35 MB/s +73%
Lenovo ThinkPad T14s Gen 6 Intel
SK hynix PCB01 HFS001TFM9X179N GL
63.4 MB/s +51%
Dell XPS 14 2024 OLED
Samsung PM9A1 MZVL21T0HCLR
63.1 MB/s +50%
HP EliteBook Ultra G1i 14
Kioxia XG8 KXG80ZNV1T02
51 MB/s +22%
Dell Pro 14 Premium
Kioxia BG6 KBG6AZNV1T02
41.94 MB/s
4K Write
Asus ExpertBook B1 B1403CVA
Western Digital PC SN5000S SDEQNSJ-512G-1002
220 MB/s +78%
Dell Latitude 7440
Samsung MZ9L4512HBLU-00BMV
197.6 MB/s +60%
Dell XPS 14 2024 OLED
Samsung PM9A1 MZVL21T0HCLR
152.6 MB/s +24%
HP EliteBook Ultra G1i 14
Kioxia XG8 KXG80ZNV1T02
126.6 MB/s +3%
Lenovo ThinkPad T14s Gen 6 Intel
SK hynix PCB01 HFS001TFM9X179N GL
125.9 MB/s +2%
Dell Pro 14 Premium
Kioxia BG6 KBG6AZNV1T02
123.27 MB/s
4K-64 Read
Asus ExpertBook B1 B1403CVA
Western Digital PC SN5000S SDEQNSJ-512G-1002
783 MB/s +21%
Dell XPS 14 2024 OLED
Samsung PM9A1 MZVL21T0HCLR
739 MB/s +14%
Dell Latitude 7440
Samsung MZ9L4512HBLU-00BMV
654.24 MB/s +1%
Dell Pro 14 Premium
Kioxia BG6 KBG6AZNV1T02
645.47 MB/s
HP EliteBook Ultra G1i 14
Kioxia XG8 KXG80ZNV1T02
614 MB/s -5%
Lenovo ThinkPad T14s Gen 6 Intel
SK hynix PCB01 HFS001TFM9X179N GL
601 MB/s -7%
4K-64 Write
Dell XPS 14 2024 OLED
Samsung PM9A1 MZVL21T0HCLR
2094 MB/s +73%
Dell Latitude 7440
Samsung MZ9L4512HBLU-00BMV
1678.93 MB/s +39%
Asus ExpertBook B1 B1403CVA
Western Digital PC SN5000S SDEQNSJ-512G-1002
1657 MB/s +37%
HP EliteBook Ultra G1i 14
Kioxia XG8 KXG80ZNV1T02
1258 MB/s +4%
Lenovo ThinkPad T14s Gen 6 Intel
SK hynix PCB01 HFS001TFM9X179N GL
1224 MB/s +1%
Dell Pro 14 Premium
Kioxia BG6 KBG6AZNV1T02
1211.62 MB/s
Access Time Read
Lenovo ThinkPad T14s Gen 6 Intel
SK hynix PCB01 HFS001TFM9X179N GL
0.1 ms * -47%
Dell Latitude 7440
Samsung MZ9L4512HBLU-00BMV
0.098 ms * -44%
Dell Pro 14 Premium
Kioxia BG6 KBG6AZNV1T02
0.068 ms *
HP EliteBook Ultra G1i 14
Kioxia XG8 KXG80ZNV1T02
0.042 ms * +38%
Asus ExpertBook B1 B1403CVA
Western Digital PC SN5000S SDEQNSJ-512G-1002
0.029 ms * +57%
Dell XPS 14 2024 OLED
Samsung PM9A1 MZVL21T0HCLR
0.027 ms * +60%
Access Time Write
Dell Pro 14 Premium
Kioxia BG6 KBG6AZNV1T02
0.276 ms *
Dell Latitude 7440
Samsung MZ9L4512HBLU-00BMV
0.091 ms * +67%
Lenovo ThinkPad T14s Gen 6 Intel
SK hynix PCB01 HFS001TFM9X179N GL
0.032 ms * +88%
Asus ExpertBook B1 B1403CVA
Western Digital PC SN5000S SDEQNSJ-512G-1002
0.027 ms * +90%
Dell XPS 14 2024 OLED
Samsung PM9A1 MZVL21T0HCLR
0.024 ms * +91%
HP EliteBook Ultra G1i 14
Kioxia XG8 KXG80ZNV1T02
0.022 ms * +92%

* ... im mniej tym lepiej

Disk Throttling: DiskSpd Read Loop, Queue Depth 8

03056109151220152518302135244027453050335536603965427045754880518554905795Tooltip
Dell Pro 14 Premium Kioxia BG6 KBG6AZNV1T02; diskspd 2.0.17 f: Ø6009 (5149.35-6061.61)
Dell Latitude 9440 2-in-1 Samsung PM9B1 1024GB MZAL41T0HBLB: Ø2885 (2580.84-3672.95)
Dell Latitude 7440 Samsung MZ9L4512HBLU-00BMV: Ø3517 (2935.18-3532.44)

Wydajność GPU

Zintegrowany Arc 140V jest szybszy niż można by się spodziewać, zwłaszcza w przypadku biznesowego subnotebooka. Nowszy procesor graficzny jest znaczącym ulepszeniem w stosunku do serii Serii Iris Xe w zeszłorocznych modelach Latitude 7440 lub 9440 2-w-1 o ponad 2x w wielu przypadkach. Wymagające tytuły, takie jak Cyberpunk 2077, są grywalne w 1080p i 30 FPS na średnich ustawieniach, podczas gdy takie gry byłyby niegrywalne na starszych subnotebookach Latitude bez względu na ustawienia.

Profil mocyWynik grafikiWynik fizykiWynik łączny
Tryb wydajności8941182852954
Tryb zrównoważony8402 (-6%)16811 (-8%)2313 (-22%)
Zasilanie bateryjne8685 (-3%)16092 (-12%)2399 (-18%)

Uruchomienie systemu w trybie zrównoważonym lub bateryjnym zamiast w trybie wydajności zmniejszyłoby wydajność o kilka punktów procentowych, jak pokazuje nasza tabela wyników Fire Strike powyżej.

3DMark 11
3DMark 11
Fire Strike
Fire Strike
Time Spy
Time Spy
Speed Way
Speed Way
3DMark Performance Rating - Percent
Dell XPS 14 2024 OLED
NVIDIA GeForce RTX 4050 Laptop GPU, Intel Core Ultra 7 155H
100 pt
HP EliteBook Ultra G1i 14
Intel Arc Graphics 140V, Intel Core Ultra 7 258V
78.9 pt
Lenovo Yoga Book 9 14IAH10
Intel Arc Graphics 140T, Intel Core Ultra 7 255H
78.2 pt
Przeciętny Intel Arc Graphics 140V
 
77.8 pt
Dell Pro 14 Premium
Intel Arc Graphics 140V, Intel Core Ultra 7 268V
76.7 pt
Lenovo Yoga 7 2-in-1 14AHP9
AMD Radeon 780M, AMD Ryzen 7 8840HS
68.6 pt
Lenovo ThinkPad T14s Gen 6 Intel
Intel Arc Graphics 130V, Intel Core Ultra 5 228V
68.1 pt
Lenovo Yoga Slim 7 14AKP G10
AMD Radeon 860M, AMD Ryzen AI 7 350
64 pt
Asus Vivobook S 14 OLED S5406SA
Intel Arc Graphics 130V, Intel Core Ultra 5 226V
60.7 pt
Lenovo Yoga 7 2-in-1 14AKP10
AMD Radeon 840M, AMD Ryzen AI 5 340
43.4 pt
Dell Latitude 9440 2-in-1
Intel Iris Xe Graphics G7 96EUs, Intel Core i7-1365U
38.6 pt
Dell Latitude 7440
Intel Iris Xe Graphics G7 80EUs, Intel Core i5-1345U
31.9 pt
Asus ExpertBook B1 B1403CVA
Intel UHD Graphics Xe G4 48EUs, Intel Core i5-13420H
25.5 pt
Lenovo ThinkPad L14 G4 21H1003DGE
Intel Iris Xe Graphics G7 80EUs, Intel Core i5-1335U
23.9 pt
3DMark 11 - 1280x720 Performance GPU
Dell XPS 14 2024 OLED
NVIDIA GeForce RTX 4050 Laptop GPU, Intel Core Ultra 7 155H
13339 Points +6%
Lenovo Yoga 7 2-in-1 14AHP9
AMD Radeon 780M, AMD Ryzen 7 8840HS
13168 Points +5%
Dell Pro 14 Premium
Intel Arc Graphics 140V, Intel Core Ultra 7 268V
12580 Points
Lenovo Yoga Book 9 14IAH10
Intel Arc Graphics 140T, Intel Core Ultra 7 255H
11868 Points -6%
Lenovo Yoga Slim 7 14AKP G10
AMD Radeon 860M, AMD Ryzen AI 7 350
11680 Points -7%
HP EliteBook Ultra G1i 14
Intel Arc Graphics 140V, Intel Core Ultra 7 258V
11458 Points -9%
Przeciętny Intel Arc Graphics 140V
  (10499 - 12772, n=28)
11372 Points -10%
Lenovo ThinkPad T14s Gen 6 Intel
Intel Arc Graphics 130V, Intel Core Ultra 5 228V
10269 Points -18%
Lenovo Yoga 7 2-in-1 14AKP10
AMD Radeon 840M, AMD Ryzen AI 5 340
8453 Points -33%
Asus Vivobook S 14 OLED S5406SA
Intel Arc Graphics 130V, Intel Core Ultra 5 226V
8129 Points -35%
Dell Latitude 9440 2-in-1
Intel Iris Xe Graphics G7 96EUs, Intel Core i7-1365U
6490 Points -48%
Dell Latitude 7440
Intel Iris Xe Graphics G7 80EUs, Intel Core i5-1345U
5485 Points -56%
Lenovo ThinkPad L14 G4 21H1003DGE
Intel Iris Xe Graphics G7 80EUs, Intel Core i5-1335U
4801 Points -62%
Asus ExpertBook B1 B1403CVA
Intel UHD Graphics Xe G4 48EUs, Intel Core i5-13420H
4524 Points -64%
3DMark
1920x1080 Fire Strike Graphics
Dell XPS 14 2024 OLED
NVIDIA GeForce RTX 4050 Laptop GPU, Intel Core Ultra 7 155H
13591 Points +52%
HP EliteBook Ultra G1i 14
Intel Arc Graphics 140V, Intel Core Ultra 7 258V
9819 Points +10%
Przeciętny Intel Arc Graphics 140V
  (6790 - 10476, n=29)
9591 Points +7%
Dell Pro 14 Premium
Intel Arc Graphics 140V, Intel Core Ultra 7 268V
8941 Points
Lenovo Yoga Book 9 14IAH10
Intel Arc Graphics 140T, Intel Core Ultra 7 255H
8697 Points -3%
Lenovo ThinkPad T14s Gen 6 Intel
Intel Arc Graphics 130V, Intel Core Ultra 5 228V
8306 Points -7%
Lenovo Yoga 7 2-in-1 14AHP9
AMD Radeon 780M, AMD Ryzen 7 8840HS
8120 Points -9%
Asus Vivobook S 14 OLED S5406SA
Intel Arc Graphics 130V, Intel Core Ultra 5 226V
7536 Points -16%
Lenovo Yoga Slim 7 14AKP G10
AMD Radeon 860M, AMD Ryzen AI 7 350
7335 Points -18%
Lenovo Yoga 7 2-in-1 14AKP10
AMD Radeon 840M, AMD Ryzen AI 5 340
5606 Points -37%
Dell Latitude 9440 2-in-1
Intel Iris Xe Graphics G7 96EUs, Intel Core i7-1365U
5340 Points -40%
Dell Latitude 7440
Intel Iris Xe Graphics G7 80EUs, Intel Core i5-1345U
4442 Points -50%
Asus ExpertBook B1 B1403CVA
Intel UHD Graphics Xe G4 48EUs, Intel Core i5-13420H
3571 Points -60%
Lenovo ThinkPad L14 G4 21H1003DGE
Intel Iris Xe Graphics G7 80EUs, Intel Core i5-1335U
2812 Points -69%
2560x1440 Time Spy Graphics
Dell XPS 14 2024 OLED
NVIDIA GeForce RTX 4050 Laptop GPU, Intel Core Ultra 7 155H
5107 Points +37%
HP EliteBook Ultra G1i 14
Intel Arc Graphics 140V, Intel Core Ultra 7 258V
4008 Points +7%
Lenovo Yoga Book 9 14IAH10
Intel Arc Graphics 140T, Intel Core Ultra 7 255H
3985 Points +7%
Przeciętny Intel Arc Graphics 140V
  (2955 - 4415, n=32)
3956 Points +6%
Dell Pro 14 Premium
Intel Arc Graphics 140V, Intel Core Ultra 7 268V
3730 Points
Lenovo ThinkPad T14s Gen 6 Intel
Intel Arc Graphics 130V, Intel Core Ultra 5 228V
3414 Points -8%
Asus Vivobook S 14 OLED S5406SA
Intel Arc Graphics 130V, Intel Core Ultra 5 226V
3182 Points -15%
Lenovo Yoga 7 2-in-1 14AHP9
AMD Radeon 780M, AMD Ryzen 7 8840HS
2887 Points -23%
Lenovo Yoga Slim 7 14AKP G10
AMD Radeon 860M, AMD Ryzen AI 7 350
2868 Points -23%
Lenovo Yoga 7 2-in-1 14AKP10
AMD Radeon 840M, AMD Ryzen AI 5 340
1705 Points -54%
Dell Latitude 9440 2-in-1
Intel Iris Xe Graphics G7 96EUs, Intel Core i7-1365U
1637 Points -56%
Dell Latitude 7440
Intel Iris Xe Graphics G7 80EUs, Intel Core i5-1345U
1318 Points -65%
Asus ExpertBook B1 B1403CVA
Intel UHD Graphics Xe G4 48EUs, Intel Core i5-13420H
1022 Points -73%
Lenovo ThinkPad L14 G4 21H1003DGE
Intel Iris Xe Graphics G7 80EUs, Intel Core i5-1335U
962 Points -74%
2560x1440 Time Spy Score
Dell XPS 14 2024 OLED
NVIDIA GeForce RTX 4050 Laptop GPU, Intel Core Ultra 7 155H
5395 Points +35%
Lenovo Yoga Book 9 14IAH10
Intel Arc Graphics 140T, Intel Core Ultra 7 255H
4421 Points +11%
HP EliteBook Ultra G1i 14
Intel Arc Graphics 140V, Intel Core Ultra 7 258V
4259 Points +7%
Przeciętny Intel Arc Graphics 140V
  (3336 - 4721, n=29)
4214 Points +6%
Dell Pro 14 Premium
Intel Arc Graphics 140V, Intel Core Ultra 7 268V
3985 Points
Lenovo ThinkPad T14s Gen 6 Intel
Intel Arc Graphics 130V, Intel Core Ultra 5 228V
3649 Points -8%
Asus Vivobook S 14 OLED S5406SA
Intel Arc Graphics 130V, Intel Core Ultra 5 226V
3451 Points -13%
Lenovo Yoga 7 2-in-1 14AHP9
AMD Radeon 780M, AMD Ryzen 7 8840HS
3206 Points -20%
Lenovo Yoga Slim 7 14AKP G10
AMD Radeon 860M, AMD Ryzen AI 7 350
3147 Points -21%
Lenovo Yoga 7 2-in-1 14AKP10
AMD Radeon 840M, AMD Ryzen AI 5 340
1928 Points -52%
Dell Latitude 9440 2-in-1
Intel Iris Xe Graphics G7 96EUs, Intel Core i7-1365U
1850 Points -54%
Dell Latitude 7440
Intel Iris Xe Graphics G7 80EUs, Intel Core i5-1345U
1501 Points -62%
Asus ExpertBook B1 B1403CVA
Intel UHD Graphics Xe G4 48EUs, Intel Core i5-13420H
1167 Points -71%
Lenovo ThinkPad L14 G4 21H1003DGE
Intel Iris Xe Graphics G7 80EUs, Intel Core i5-1335U
1086 Points -73%
3DMark 11 Performance
12784 pkt.
3DMark Cloud Gate Standard Score
30158 pkt.
3DMark Fire Strike Score
7940 pkt.
3DMark Time Spy Score
3985 pkt.
Pomoc
Blender
v3.3 Classroom OPTIX/RTX
Dell XPS 14 2024 OLED
NVIDIA GeForce RTX 4050 Laptop GPU, Intel Core Ultra 7 155H
37 Seconds *
v3.3 Classroom CUDA
Dell XPS 14 2024 OLED
NVIDIA GeForce RTX 4050 Laptop GPU, Intel Core Ultra 7 155H
67 Seconds *
v3.3 Classroom CPU
Lenovo ThinkPad L14 G4 21H1003DGE
Intel Iris Xe Graphics G7 80EUs, Intel Core i5-1335U
808 Seconds * -55%
Asus ExpertBook B1 B1403CVA
Intel UHD Graphics Xe G4 48EUs, Intel Core i5-13420H
719 Seconds * -38%
Lenovo ThinkPad T14s Gen 6 Intel
Intel Arc Graphics 130V, Intel Core Ultra 5 228V
702 Seconds * -35%
Dell Latitude 9440 2-in-1
Intel Iris Xe Graphics G7 96EUs, Intel Core i7-1365U
660 Seconds * -27%
HP EliteBook Ultra G1i 14
Intel Arc Graphics 140V, Intel Core Ultra 7 258V
646 Seconds * -24%
Dell Latitude 7440
Intel Iris Xe Graphics G7 80EUs, Intel Core i5-1345U
632 Seconds * -22%
Przeciętny Intel Arc Graphics 140V
  (509 - 748, n=29)
591 Seconds * -14%
Asus Vivobook S 14 OLED S5406SA
Intel Arc Graphics 130V, Intel Core Ultra 5 226V
550 Seconds * -6%
Dell Pro 14 Premium
Intel Arc Graphics 140V, Intel Core Ultra 7 268V
520 Seconds *
Dell XPS 14 2024 OLED
NVIDIA GeForce RTX 4050 Laptop GPU, Intel Core Ultra 7 155H
447 Seconds * +14%
Lenovo Yoga 7 2-in-1 14AKP10
AMD Radeon 840M, AMD Ryzen AI 5 340
431 Seconds * +17%
Lenovo Yoga 7 2-in-1 14AHP9
AMD Radeon 780M, AMD Ryzen 7 8840HS
375 Seconds * +28%
Lenovo Yoga Book 9 14IAH10
Intel Arc Graphics 140T, Intel Core Ultra 7 255H
365 Seconds * +30%
Lenovo Yoga Slim 7 14AKP G10
AMD Radeon 860M, AMD Ryzen AI 7 350
312 Seconds * +40%
v3.3 Classroom oneAPI/Intel
Przeciętny Intel Arc Graphics 140V
  (204 - 405, n=16)
255 Seconds * -25%
Dell Pro 14 Premium
Intel Arc Graphics 140V, Intel Core Ultra 7 268V
204 Seconds *
Lenovo Yoga Book 9 14IAH10
Intel Arc Graphics 140T, Intel Core Ultra 7 255H
147 Seconds * +28%

* ... im mniej tym lepiej

F1 24
1920x1080 Low Preset AA:T AF:16x
Dell Pro 14 Premium
Intel Core Ultra 7 268V, Intel Arc Graphics 140V
82.4 (52min, 52P1) fps
Przeciętny Intel Arc Graphics 140V
  (54 - 99, n=19)
81.1 fps -2%
Lenovo Yoga Book 9 14IAH10
Intel Core Ultra 7 255H, Intel Arc Graphics 140T
76 (40min, 54P1) fps -8%
Lenovo Yoga Slim 7 14AKP G10
AMD Ryzen AI 7 350, AMD Radeon 860M
72.9 (58min, 54P1) fps -12%
Lenovo ThinkPad T14s Gen 6 Intel
Intel Core Ultra 5 228V, Intel Arc Graphics 130V
72.6 (57min, 49P1) fps -12%
Lenovo Yoga 7 2-in-1 14AKP10
AMD Ryzen AI 5 340, AMD Radeon 840M
44 (35min) fps -47%
1920x1080 Medium Preset AA:T AF:16x
Dell Pro 14 Premium
Intel Core Ultra 7 268V, Intel Arc Graphics 140V
75.7 (58min, 48P1) fps
Przeciętny Intel Arc Graphics 140V
  (49.2 - 87, n=19)
75.5 fps 0%
Lenovo Yoga Book 9 14IAH10
Intel Core Ultra 7 255H, Intel Arc Graphics 140T
69.4 (26min, 52P1) fps -8%
Lenovo ThinkPad T14s Gen 6 Intel
Intel Core Ultra 5 228V, Intel Arc Graphics 130V
66.1 (51min, 45P1) fps -13%
Lenovo Yoga Slim 7 14AKP G10
AMD Ryzen AI 7 350, AMD Radeon 860M
65.2 (45min, 43P1) fps -14%
Lenovo Yoga 7 2-in-1 14AKP10
AMD Ryzen AI 5 340, AMD Radeon 840M
38 (26min) fps -50%
1920x1080 High Preset AA:T AF:16x
Dell Pro 14 Premium
Intel Core Ultra 7 268V, Intel Arc Graphics 140V
59.9 (46min, 43P1) fps
Przeciętny Intel Arc Graphics 140V
  (34.4 - 66.4, n=20)
56.8 fps -5%
Lenovo ThinkPad T14s Gen 6 Intel
Intel Core Ultra 5 228V, Intel Arc Graphics 130V
52.1 (39min, 37P1) fps -13%
Lenovo Yoga Slim 7 14AKP G10
AMD Ryzen AI 7 350, AMD Radeon 860M
48.7 (34min, 34P1) fps -19%
Lenovo Yoga 7 2-in-1 14AKP10
AMD Ryzen AI 5 340, AMD Radeon 840M
27 (14min) fps -55%
1920x1080 Ultra High Preset AA:T AF:16x
Dell Pro 14 Premium
Intel Core Ultra 7 268V, Intel Arc Graphics 140V
19.1 (7min, 14P1) fps
Przeciętny Intel Arc Graphics 140V
  (15.8 - 21.2, n=18)
19 fps -1%
Lenovo ThinkPad T14s Gen 6 Intel
Intel Core Ultra 5 228V, Intel Arc Graphics 130V
16.4 (13min, 12P1) fps -14%
Lenovo Yoga Slim 7 14AKP G10
AMD Ryzen AI 7 350, AMD Radeon 860M
10.4 (7min, 7P1) fps -46%
Strange Brigade
1280x720 lowest AF:1
Dell XPS 14 2024 OLED
Intel Core Ultra 7 155H, NVIDIA GeForce RTX 4050 Laptop GPU
239 fps +23%
HP EliteBook Ultra G1i 14
Intel Core Ultra 7 258V, Intel Arc Graphics 140V
222 (112min, 156.4P1) fps +14%
Przeciętny Intel Arc Graphics 140V
  (138.1 - 248, n=29)
217 fps +12%
Dell Pro 14 Premium
Intel Core Ultra 7 268V, Intel Arc Graphics 140V
194.3 (46.6min, 130.1P1) fps
Asus Vivobook S 14 OLED S5406SA
Intel Core Ultra 5 226V, Intel Arc Graphics 130V
192.6 (46.1min, 153.5P1) fps -1%
Lenovo Yoga Slim 7 14AKP G10
AMD Ryzen AI 7 350, AMD Radeon 860M
165.4 (113.1min, 141.4P1) fps -15%
Lenovo Yoga Book 9 14IAH10
Intel Core Ultra 7 255H, Intel Arc Graphics 140T
160.5 (29.7min, 105.2P1) fps -17%
Lenovo Yoga 7 2-in-1 14AHP9
AMD Ryzen 7 8840HS, AMD Radeon 780M
150.5 (49.5min, 117.2P1) fps -23%
Lenovo Yoga 7 2-in-1 14AKP10
AMD Ryzen AI 5 340, AMD Radeon 840M
131.9 (41.1min, 113P1) fps -32%
Dell Latitude 9440 2-in-1
Intel Core i7-1365U, Intel Iris Xe Graphics G7 96EUs
90.3 (20.1min, 30.2P1) fps -54%
Dell Latitude 7440
Intel Core i5-1345U, Intel Iris Xe Graphics G7 80EUs
78.5 (10.9min, 23.7P1) fps -60%
Asus ExpertBook B1 B1403CVA
Intel Core i5-13420H, Intel UHD Graphics Xe G4 48EUs
74.1 (16.5min, 22.8P1) fps -62%
1920x1080 medium AA:medium AF:4
Dell XPS 14 2024 OLED
Intel Core Ultra 7 155H, NVIDIA GeForce RTX 4050 Laptop GPU
130 fps +62%
HP EliteBook Ultra G1i 14
Intel Core Ultra 7 258V, Intel Arc Graphics 140V
82.3 (60.9min, 73.1P1) fps +3%
Dell Pro 14 Premium
Intel Core Ultra 7 268V, Intel Arc Graphics 140V
80.2 (22.5min, 67.6P1) fps
Przeciętny Intel Arc Graphics 140V
  (55.5 - 87, n=29)
79 fps -1%
Asus Vivobook S 14 OLED S5406SA
Intel Core Ultra 5 226V, Intel Arc Graphics 130V
73.6 (43min, 63.5P1) fps -8%
Lenovo Yoga Slim 7 14AKP G10
AMD Ryzen AI 7 350, AMD Radeon 860M
65 (46.1min, 54.3P1) fps -19%
Lenovo Yoga 7 2-in-1 14AHP9
AMD Ryzen 7 8840HS, AMD Radeon 780M
64.4 (20.8min, 53P1) fps -20%
Lenovo Yoga Book 9 14IAH10
Intel Core Ultra 7 255H, Intel Arc Graphics 140T
61.6 (44.3min, 50.6P1) fps -23%
Lenovo Yoga 7 2-in-1 14AKP10
AMD Ryzen AI 5 340, AMD Radeon 840M
50.6 (20.9min, 42.1P1) fps -37%
Dell Latitude 9440 2-in-1
Intel Core i7-1365U, Intel Iris Xe Graphics G7 96EUs
40.5 (14.4min, 22P1) fps -50%
Dell Latitude 7440
Intel Core i5-1345U, Intel Iris Xe Graphics G7 80EUs
33.8 (11.5min, 18.6P1) fps -58%
Asus ExpertBook B1 B1403CVA
Intel Core i5-13420H, Intel UHD Graphics Xe G4 48EUs
30.3 (8.2min, 16.6P1) fps -62%
1920x1080 high AA:high AF:8
Dell XPS 14 2024 OLED
Intel Core Ultra 7 155H, NVIDIA GeForce RTX 4050 Laptop GPU
105 fps +56%
HP EliteBook Ultra G1i 14
Intel Core Ultra 7 258V, Intel Arc Graphics 140V
68.5 (41.3min, 53.8P1) fps +2%
Dell Pro 14 Premium
Intel Core Ultra 7 268V, Intel Arc Graphics 140V
67.4 (18.8min, 52.5P1) fps
Przeciętny Intel Arc Graphics 140V
  (45.3 - 73.2, n=29)
66.6 fps -1%
Asus Vivobook S 14 OLED S5406SA
Intel Core Ultra 5 226V, Intel Arc Graphics 130V
60.3 (22.6min, 46.4P1) fps -11%
Lenovo Yoga Book 9 14IAH10
Intel Core Ultra 7 255H, Intel Arc Graphics 140T
56.6 (17.3min, 37.4P1) fps -16%
Lenovo Yoga Slim 7 14AKP G10
AMD Ryzen AI 7 350, AMD Radeon 860M
53.9 (39.9min, 41P1) fps -20%
Lenovo Yoga 7 2-in-1 14AHP9
AMD Ryzen 7 8840HS, AMD Radeon 780M
53.3 (7.6min, 38P1) fps -21%
Lenovo Yoga 7 2-in-1 14AKP10
AMD Ryzen AI 5 340, AMD Radeon 840M
41.1 (24.3min, 30.8P1) fps -39%
Dell Latitude 9440 2-in-1
Intel Core i7-1365U, Intel Iris Xe Graphics G7 96EUs
31.9 (8.5min, 17.4P1) fps -53%
Dell Latitude 7440
Intel Core i5-1345U, Intel Iris Xe Graphics G7 80EUs
26.9 (6.9min, 12.5P1) fps -60%
Asus ExpertBook B1 B1403CVA
Intel Core i5-13420H, Intel UHD Graphics Xe G4 48EUs
23.9 (6.1min, 10.3P1) fps -65%
1920x1080 ultra AA:ultra AF:16
Dell XPS 14 2024 OLED
Intel Core Ultra 7 155H, NVIDIA GeForce RTX 4050 Laptop GPU
92 fps +60%
HP EliteBook Ultra G1i 14
Intel Core Ultra 7 258V, Intel Arc Graphics 140V
57.7 (25.5min, 43.6P1) fps 0%
Dell Pro 14 Premium
Intel Core Ultra 7 268V, Intel Arc Graphics 140V
57.6 (15.1min, 29.8P1) fps
Przeciętny Intel Arc Graphics 140V
  (39 - 62.5, n=29)
56.9 fps -1%
Asus Vivobook S 14 OLED S5406SA
Intel Core Ultra 5 226V, Intel Arc Graphics 130V
51.8 (21.8min, 27.6P1) fps -10%
Lenovo Yoga Book 9 14IAH10
Intel Core Ultra 7 255H, Intel Arc Graphics 140T
48.6 (25.9min, 29.6P1) fps -16%
Lenovo Yoga Slim 7 14AKP G10
AMD Ryzen AI 7 350, AMD Radeon 860M
45.7 (33.2min, 34.9P1) fps -21%
Lenovo Yoga 7 2-in-1 14AHP9
AMD Ryzen 7 8840HS, AMD Radeon 780M
44.1 (7.2min, 9.62P1) fps -23%
Lenovo Yoga 7 2-in-1 14AKP10
AMD Ryzen AI 5 340, AMD Radeon 840M
34.2 (13.2min, 17.8P1) fps -41%
Dell Latitude 9440 2-in-1
Intel Core i7-1365U, Intel Iris Xe Graphics G7 96EUs
25.8 (5.1min, 8.07P1) fps -55%
Dell Latitude 7440
Intel Core i5-1345U, Intel Iris Xe Graphics G7 80EUs
21.9 (5min, 6.24P1) fps -62%
Asus ExpertBook B1 B1403CVA
Intel Core i5-13420H, Intel UHD Graphics Xe G4 48EUs
19.4 (5min, 5.11P1) fps -66%
Final Fantasy XV Benchmark
1280x720 Lite Quality
Dell XPS 14 2024 OLED
Intel Core Ultra 7 155H, NVIDIA GeForce RTX 4050 Laptop GPU
99.2 fps +12%
Dell Pro 14 Premium
Intel Core Ultra 7 268V, Intel Arc Graphics 140V
88.5 fps
Przeciętny Intel Arc Graphics 140V
  (54.1 - 97.1, n=32)
82 fps -7%
HP EliteBook Ultra G1i 14
Intel Core Ultra 7 258V, Intel Arc Graphics 140V
80.5 fps -9%
Lenovo Yoga Slim 7 14AKP G10
AMD Ryzen AI 7 350, AMD Radeon 860M
78.7 fps -11%
Lenovo ThinkPad T14s Gen 6 Intel
Intel Core Ultra 5 228V, Intel Arc Graphics 130V
74.6 fps -16%
Asus Vivobook S 14 OLED S5406SA
Intel Core Ultra 5 226V, Intel Arc Graphics 130V
73.4 fps -17%
Lenovo Yoga Book 9 14IAH10
Intel Core Ultra 7 255H, Intel Arc Graphics 140T
72.9 fps -18%
Lenovo Yoga 7 2-in-1 14AHP9
AMD Ryzen 7 8840HS, AMD Radeon 780M
72.3 fps -18%
Lenovo Yoga 7 2-in-1 14AKP10
AMD Ryzen AI 5 340, AMD Radeon 840M
61.1 fps -31%
Dell Latitude 9440 2-in-1
Intel Core i7-1365U, Intel Iris Xe Graphics G7 96EUs
46.7 fps -47%
Dell Latitude 7440
Intel Core i5-1345U, Intel Iris Xe Graphics G7 80EUs
37.9 fps -57%
Asus ExpertBook B1 B1403CVA
Intel Core i5-13420H, Intel UHD Graphics Xe G4 48EUs
32.5 fps -63%
Lenovo ThinkPad L14 G4 21H1003DGE
Intel Core i5-1335U, Intel Iris Xe Graphics G7 80EUs
24.7 fps -72%
1920x1080 Standard Quality
Dell XPS 14 2024 OLED
Intel Core Ultra 7 155H, NVIDIA GeForce RTX 4050 Laptop GPU
70.8 fps +43%
Dell Pro 14 Premium
Intel Core Ultra 7 268V, Intel Arc Graphics 140V
49.5 fps
Przeciętny Intel Arc Graphics 140V
  (31.6 - 87.6, n=33)
46.8 fps -5%
Lenovo Yoga Book 9 14IAH10
Intel Core Ultra 7 255H, Intel Arc Graphics 140T
42 fps -15%
Lenovo ThinkPad T14s Gen 6 Intel
Intel Core Ultra 5 228V, Intel Arc Graphics 130V
41.3 fps -17%
Asus Vivobook S 14 OLED S5406SA
Intel Core Ultra 5 226V, Intel Arc Graphics 130V
40.8 fps -18%
HP EliteBook Ultra G1i 14
Intel Core Ultra 7 258V, Intel Arc Graphics 140V
39.9 fps -19%
Lenovo Yoga Slim 7 14AKP G10
AMD Ryzen AI 7 350, AMD Radeon 860M
37.9 fps -23%
Lenovo Yoga 7 2-in-1 14AHP9
AMD Ryzen 7 8840HS, AMD Radeon 780M
36.4 fps -26%
Lenovo Yoga 7 2-in-1 14AKP10
AMD Ryzen AI 5 340, AMD Radeon 840M
25.6 fps -48%
Dell Latitude 9440 2-in-1
Intel Core i7-1365U, Intel Iris Xe Graphics G7 96EUs
24.5 fps -51%
Dell Latitude 7440
Intel Core i5-1345U, Intel Iris Xe Graphics G7 80EUs
21 fps -58%
Asus ExpertBook B1 B1403CVA
Intel Core i5-13420H, Intel UHD Graphics Xe G4 48EUs
17 fps -66%
Lenovo ThinkPad L14 G4 21H1003DGE
Intel Core i5-1335U, Intel Iris Xe Graphics G7 80EUs
13.5 fps -73%
1920x1080 High Quality
Dell XPS 14 2024 OLED
Intel Core Ultra 7 155H, NVIDIA GeForce RTX 4050 Laptop GPU
52.3 fps +43%
Dell Pro 14 Premium
Intel Core Ultra 7 268V, Intel Arc Graphics 140V
36.5 fps
Przeciętny Intel Arc Graphics 140V
  (23 - 37.2, n=32)
32.9 fps -10%
Lenovo ThinkPad T14s Gen 6 Intel
Intel Core Ultra 5 228V, Intel Arc Graphics 130V
30 fps -18%
HP EliteBook Ultra G1i 14
Intel Core Ultra 7 258V, Intel Arc Graphics 140V
29.7 fps -19%
Asus Vivobook S 14 OLED S5406SA
Intel Core Ultra 5 226V, Intel Arc Graphics 130V
27.9 fps -24%
Lenovo Yoga Book 9 14IAH10
Intel Core Ultra 7 255H, Intel Arc Graphics 140T
27.9 fps -24%
Lenovo Yoga 7 2-in-1 14AHP9
AMD Ryzen 7 8840HS, AMD Radeon 780M
27.2 fps -25%
Lenovo Yoga Slim 7 14AKP G10
AMD Ryzen AI 7 350, AMD Radeon 860M
27.1 fps -26%
Dell Latitude 9440 2-in-1
Intel Core i7-1365U, Intel Iris Xe Graphics G7 96EUs
17.1 fps -53%
Dell Latitude 7440
Intel Core i5-1345U, Intel Iris Xe Graphics G7 80EUs
16.8 fps -54%
Lenovo Yoga 7 2-in-1 14AKP10
AMD Ryzen AI 5 340, AMD Radeon 840M
16.7 fps -54%
Asus ExpertBook B1 B1403CVA
Intel Core i5-13420H, Intel UHD Graphics Xe G4 48EUs
12.6 fps -65%
Lenovo ThinkPad L14 G4 21H1003DGE
Intel Core i5-1335U, Intel Iris Xe Graphics G7 80EUs
9.59 fps -74%
Dota 2 Reborn - 1920x1080 ultra (3/3) best looking
Dell XPS 14 2024 OLED
Intel Core Ultra 7 155H, NVIDIA GeForce RTX 4050 Laptop GPU
103.6 (85.7min) fps +19%
Dell Pro 14 Premium
Intel Core Ultra 7 268V, Intel Arc Graphics 140V
87.4 (56.9min) fps
Lenovo Yoga Book 9 14IAH10
Intel Core Ultra 7 255H, Intel Arc Graphics 140T
80.1 (51.6min) fps -8%
Asus Vivobook S 14 OLED S5406SA
Intel Core Ultra 5 226V, Intel Arc Graphics 130V
78.1 (52.8min) fps -11%
Lenovo Yoga Slim 7 14AKP G10
AMD Ryzen AI 7 350, AMD Radeon 860M
77 (64.9min) fps -12%
Przeciętny Intel Arc Graphics 140V
  (33.3 - 93, n=33)
75.2 fps -14%
HP EliteBook Ultra G1i 14
Intel Core Ultra 7 258V, Intel Arc Graphics 140V
70.1 (42.4min) fps -20%
Lenovo Yoga 7 2-in-1 14AHP9
AMD Ryzen 7 8840HS, AMD Radeon 780M
69.9 (58.9min) fps -20%
Lenovo Yoga 7 2-in-1 14AKP10
AMD Ryzen AI 5 340, AMD Radeon 840M
66 (56.4min) fps -24%
Lenovo ThinkPad T14s Gen 6 Intel
Intel Core Ultra 5 228V, Intel Arc Graphics 130V
65.3 (38.5min) fps -25%
Dell Latitude 9440 2-in-1
Intel Core i7-1365U, Intel Iris Xe Graphics G7 96EUs
57.8 (49.3min) fps -34%
Dell Latitude 7440
Intel Core i5-1345U, Intel Iris Xe Graphics G7 80EUs
56.3 (41.5min) fps -36%
Asus ExpertBook B1 B1403CVA
Intel Core i5-13420H, Intel UHD Graphics Xe G4 48EUs
49.3 (28.8min) fps -44%
Lenovo ThinkPad L14 G4 21H1003DGE
Intel Core i5-1335U, Intel Iris Xe Graphics G7 80EUs
36.8 (32.9min) fps -58%
Cyberpunk 2077 2.2 Phantom Liberty
1280x720 Low Preset (FSR off)
Dell Pro 14 Premium
Intel Core Ultra 7 268V, Intel Arc Graphics 140V
69.4 (53.8min, 46.8P1) fps
Przeciętny Intel Arc Graphics 140V
  (51 - 72.5, n=16)
64.8 fps -7%
Lenovo Yoga 7 2-in-1 14AHP9
AMD Ryzen 7 8840HS, AMD Radeon 780M
62.9 (52.2min) fps -9%
Lenovo Yoga Book 9 14IAH10
Intel Core Ultra 7 255H, Intel Arc Graphics 140T
54.2 (42.8min, 39.7P1) fps -22%
Lenovo ThinkPad L14 G4 21H1003DGE
Intel Core i5-1335U, Intel Iris Xe Graphics G7 80EUs
20.2 (16.2min) fps -71%
1920x1080 Low Preset (FSR off)
Dell XPS 14 2024 OLED
Intel Core Ultra 7 155H, NVIDIA GeForce RTX 4050 Laptop GPU
67.2 (55min) fps +41%
Dell Pro 14 Premium
Intel Core Ultra 7 268V, Intel Arc Graphics 140V
47.8 (40.1min, 37.9P1) fps
Przeciętny Intel Arc Graphics 140V
  (30.5 - 49.1, n=34)
43.5 fps -9%
HP EliteBook Ultra G1i 14
Intel Core Ultra 7 258V, Intel Arc Graphics 140V
41.7 (33.8min) fps -13%
Asus Vivobook S 14 OLED S5406SA
Intel Core Ultra 5 226V, Intel Arc Graphics 130V
41.2 (33.3min) fps -14%
Lenovo Yoga Slim 7 14AKP G10
AMD Ryzen AI 7 350, AMD Radeon 860M
40.4 (32.7min) fps -15%
Lenovo Yoga 7 2-in-1 14AHP9
AMD Ryzen 7 8840HS, AMD Radeon 780M
38.5 (33.2min) fps -19%
Lenovo ThinkPad T14s Gen 6 Intel
Intel Core Ultra 5 228V, Intel Arc Graphics 130V
38.3 (32.6min, 31P1) fps -20%
Lenovo Yoga Book 9 14IAH10
Intel Core Ultra 7 255H, Intel Arc Graphics 140T
37.3 (31.8min, 30P1) fps -22%
Lenovo Yoga 7 2-in-1 14AKP10
AMD Ryzen AI 5 340, AMD Radeon 840M
24.8 (21min) fps -48%
Asus ExpertBook B1 B1403CVA
Intel Core i5-13420H, Intel UHD Graphics Xe G4 48EUs
12.2 (9.34min) fps -74%
Lenovo ThinkPad L14 G4 21H1003DGE
Intel Core i5-1335U, Intel Iris Xe Graphics G7 80EUs
11.5 (9.33min) fps -76%
1920x1080 Medium Preset (FSR off)
Dell XPS 14 2024 OLED
Intel Core Ultra 7 155H, NVIDIA GeForce RTX 4050 Laptop GPU
50.1 (42.7min) fps +30%
Dell Pro 14 Premium
Intel Core Ultra 7 268V, Intel Arc Graphics 140V
38.5 (32.6min, 31P1) fps
Przeciętny Intel Arc Graphics 140V
  (24.3 - 39.3, n=33)
35.9 fps -7%
Lenovo ThinkPad T14s Gen 6 Intel
Intel Core Ultra 5 228V, Intel Arc Graphics 130V
32.8 (27.5min, 25.6P1) fps -15%
HP EliteBook Ultra G1i 14
Intel Core Ultra 7 258V, Intel Arc Graphics 140V
32.1 (26.7min) fps -17%
Asus Vivobook S 14 OLED S5406SA
Intel Core Ultra 5 226V, Intel Arc Graphics 130V
31.9 (26.4min) fps -17%
Lenovo Yoga Book 9 14IAH10
Intel Core Ultra 7 255H, Intel Arc Graphics 140T
30.4 (26.5min, 25.4P1) fps -21%
Lenovo Yoga 7 2-in-1 14AHP9
AMD Ryzen 7 8840HS, AMD Radeon 780M
30.3 (26min) fps -21%
Lenovo Yoga Slim 7 14AKP G10
AMD Ryzen AI 7 350, AMD Radeon 860M
29.9 (25.7min) fps -22%
Lenovo Yoga 7 2-in-1 14AKP10
AMD Ryzen AI 5 340, AMD Radeon 840M
18.4 (16min) fps -52%
Asus ExpertBook B1 B1403CVA
Intel Core i5-13420H, Intel UHD Graphics Xe G4 48EUs
9.5 (7.73min) fps -75%
Lenovo ThinkPad L14 G4 21H1003DGE
Intel Core i5-1335U, Intel Iris Xe Graphics G7 80EUs
9.32 (7.82min) fps -76%
1920x1080 High Preset (FSR off)
Dell XPS 14 2024 OLED
Intel Core Ultra 7 155H, NVIDIA GeForce RTX 4050 Laptop GPU
42.4 (36.1min) fps +27%
Dell Pro 14 Premium
Intel Core Ultra 7 268V, Intel Arc Graphics 140V
33.4 (27.8min, 26.4P1) fps
Przeciętny Intel Arc Graphics 140V
  (20 - 34.4, n=34)
30.3 fps -9%
Asus Vivobook S 14 OLED S5406SA
Intel Core Ultra 5 226V, Intel Arc Graphics 130V
28.6 (23.6min) fps -14%
Lenovo ThinkPad T14s Gen 6 Intel
Intel Core Ultra 5 228V, Intel Arc Graphics 130V
28.5 (24.3min, 23.6P1) fps -15%
Lenovo Yoga Book 9 14IAH10
Intel Core Ultra 7 255H, Intel Arc Graphics 140T
26.6 (22.8min, 21.5P1) fps -20%
HP EliteBook Ultra G1i 14
Intel Core Ultra 7 258V, Intel Arc Graphics 140V
26.5 (21.9min) fps -21%
Lenovo Yoga 7 2-in-1 14AHP9
AMD Ryzen 7 8840HS, AMD Radeon 780M
25.3 (21.3min) fps -24%
Lenovo Yoga Slim 7 14AKP G10
AMD Ryzen AI 7 350, AMD Radeon 860M
23.6 (19.9min) fps -29%
Lenovo Yoga 7 2-in-1 14AKP10
AMD Ryzen AI 5 340, AMD Radeon 840M
15.2 (13min) fps -54%
Asus ExpertBook B1 B1403CVA
Intel Core i5-13420H, Intel UHD Graphics Xe G4 48EUs
8.21 (6.75min) fps -75%
Lenovo ThinkPad L14 G4 21H1003DGE
Intel Core i5-1335U, Intel Iris Xe Graphics G7 80EUs
7.59 (6.59min) fps -77%
1920x1080 Ultra Preset (FSR off)
Dell XPS 14 2024 OLED
Intel Core Ultra 7 155H, NVIDIA GeForce RTX 4050 Laptop GPU
35.8 (30min) fps +23%
Dell Pro 14 Premium
Intel Core Ultra 7 268V, Intel Arc Graphics 140V
29 (24.3min, 23.4P1) fps
Przeciętny Intel Arc Graphics 140V
  (17.5 - 30.1, n=34)
26.2 fps -10%
Lenovo ThinkPad T14s Gen 6 Intel
Intel Core Ultra 5 228V, Intel Arc Graphics 130V
25.6 (21min, 20P1) fps -12%
Asus Vivobook S 14 OLED S5406SA
Intel Core Ultra 5 226V, Intel Arc Graphics 130V
24.9 (20.4min) fps -14%
Lenovo Yoga Book 9 14IAH10
Intel Core Ultra 7 255H, Intel Arc Graphics 140T
24.5 (20.9min, 19.5P1) fps -16%
HP EliteBook Ultra G1i 14
Intel Core Ultra 7 258V, Intel Arc Graphics 140V
23.4 (19.1min) fps -19%
Lenovo Yoga 7 2-in-1 14AHP9
AMD Ryzen 7 8840HS, AMD Radeon 780M
22 (18.4min) fps -24%
Lenovo Yoga Slim 7 14AKP G10
AMD Ryzen AI 7 350, AMD Radeon 860M
19.1 (15.5min) fps -34%
Lenovo Yoga 7 2-in-1 14AKP10
AMD Ryzen AI 5 340, AMD Radeon 840M
12.2 (10min) fps -58%
Asus ExpertBook B1 B1403CVA
Intel Core i5-13420H, Intel UHD Graphics Xe G4 48EUs
7.08 (5.91min) fps -76%
Lenovo ThinkPad L14 G4 21H1003DGE
Intel Core i5-1335U, Intel Iris Xe Graphics G7 80EUs
6.65 (5.77min) fps -77%
Baldur's Gate 3
1280x720 Low Preset AA:SM
Dell Pro 14 Premium
Intel Core Ultra 7 268V, Intel Arc Graphics 140V
64.1 fps
Przeciętny Intel Arc Graphics 140V
  (49.3 - 73.3, n=13)
60.2 fps -6%
Lenovo Yoga 7 2-in-1 14AHP9
AMD Ryzen 7 8840HS, AMD Radeon 780M
57 fps -11%
Lenovo Yoga Book 9 14IAH10
Intel Core Ultra 7 255H, Intel Arc Graphics 140T
51.7 fps -19%
Lenovo ThinkPad L14 G4 21H1003DGE
Intel Core i5-1335U, Intel Iris Xe Graphics G7 80EUs
18.1 (11.8min, 12.6P0.1, 13.8P1) fps -72%
1920x1080 Low Preset AA:SM
Dell XPS 14 2024 OLED
Intel Core Ultra 7 155H, NVIDIA GeForce RTX 4050 Laptop GPU
73.4 fps +68%
Dell Pro 14 Premium
Intel Core Ultra 7 268V, Intel Arc Graphics 140V
43.6 fps
HP EliteBook Ultra G1i 14
Intel Core Ultra 7 258V, Intel Arc Graphics 140V
39.7 fps -9%
Przeciętny Intel Arc Graphics 140V
  (23.7 - 47, n=30)
39.2 fps -10%
Lenovo Yoga 7 2-in-1 14AHP9
AMD Ryzen 7 8840HS, AMD Radeon 780M
38 fps -13%
Lenovo ThinkPad T14s Gen 6 Intel
Intel Core Ultra 5 228V, Intel Arc Graphics 130V
36.1 (1.431min, 4.2P0.1, 31.6P1) fps -17%
Lenovo Yoga Slim 7 14AKP G10
AMD Ryzen AI 7 350, AMD Radeon 860M
36 fps -17%
Lenovo Yoga Book 9 14IAH10
Intel Core Ultra 7 255H, Intel Arc Graphics 140T
35.6 fps -18%
Asus Vivobook S 14 OLED S5406SA
Intel Core Ultra 5 226V, Intel Arc Graphics 130V
29.9 fps -31%
Lenovo Yoga 7 2-in-1 14AKP10
AMD Ryzen AI 5 340, AMD Radeon 840M
23.1 (19.7min, 19.8P0.1, 20.9P1) fps -47%
Asus ExpertBook B1 B1403CVA
Intel Core i5-13420H, Intel UHD Graphics Xe G4 48EUs
13.5 fps -69%
Lenovo ThinkPad L14 G4 21H1003DGE
Intel Core i5-1335U, Intel Iris Xe Graphics G7 80EUs
12.3 (9.61min, 9.91P0.1, 10.5P1) fps -72%
1920x1080 Medium Preset AA:T
Dell XPS 14 2024 OLED
Intel Core Ultra 7 155H, NVIDIA GeForce RTX 4050 Laptop GPU
56 fps +52%
Dell Pro 14 Premium
Intel Core Ultra 7 268V, Intel Arc Graphics 140V
36.8 fps
HP EliteBook Ultra G1i 14
Intel Core Ultra 7 258V, Intel Arc Graphics 140V
31.9 fps -13%
Lenovo Yoga 7 2-in-1 14AHP9
AMD Ryzen 7 8840HS, AMD Radeon 780M
31.5 fps -14%
Przeciętny Intel Arc Graphics 140V
  (19.6 - 36.8, n=31)
31.4 fps -15%
Lenovo ThinkPad T14s Gen 6 Intel
Intel Core Ultra 5 228V, Intel Arc Graphics 130V
29.6 (25.9min, 26P0.1, 26.4P1) fps -20%
Lenovo Yoga Slim 7 14AKP G10
AMD Ryzen AI 7 350, AMD Radeon 860M
29 fps -21%
Lenovo Yoga Book 9 14IAH10
Intel Core Ultra 7 255H, Intel Arc Graphics 140T
28.4 fps -23%
Asus Vivobook S 14 OLED S5406SA
Intel Core Ultra 5 226V, Intel Arc Graphics 130V
23.9 fps -35%
Lenovo Yoga 7 2-in-1 14AKP10
AMD Ryzen AI 5 340, AMD Radeon 840M
18.6 (13.7min, 14.1P0.1, 16.9P1) fps -49%
Asus ExpertBook B1 B1403CVA
Intel Core i5-13420H, Intel UHD Graphics Xe G4 48EUs
10.7 fps -71%
Lenovo ThinkPad L14 G4 21H1003DGE
Intel Core i5-1335U, Intel Iris Xe Graphics G7 80EUs
9.41 (8.09min, 8.11P0.1, 8.33P1) fps -74%
1920x1080 High Preset AA:T
Dell XPS 14 2024 OLED
Intel Core Ultra 7 155H, NVIDIA GeForce RTX 4050 Laptop GPU
49.8 fps +55%
Dell Pro 14 Premium
Intel Core Ultra 7 268V, Intel Arc Graphics 140V
32.2 fps
Przeciętny Intel Arc Graphics 140V
  (17 - 32.2, n=31)
27.8 fps -14%
HP EliteBook Ultra G1i 14
Intel Core Ultra 7 258V, Intel Arc Graphics 140V
27.5 fps -15%
Lenovo Yoga 7 2-in-1 14AHP9
AMD Ryzen 7 8840HS, AMD Radeon 780M
26 fps -19%
Lenovo ThinkPad T14s Gen 6 Intel
Intel Core Ultra 5 228V, Intel Arc Graphics 130V
25.8 (22.7min, 22.8P0.1, 23.2P1) fps -20%
Lenovo Yoga Book 9 14IAH10
Intel Core Ultra 7 255H, Intel Arc Graphics 140T
25.3 fps -21%
Lenovo Yoga Slim 7 14AKP G10
AMD Ryzen AI 7 350, AMD Radeon 860M
23 fps -29%
Asus Vivobook S 14 OLED S5406SA
Intel Core Ultra 5 226V, Intel Arc Graphics 130V
20.8 fps -35%
Lenovo Yoga 7 2-in-1 14AKP10
AMD Ryzen AI 5 340, AMD Radeon 840M
13.3 (11.4min, 11.7P0.1, 12.4P1) fps -59%
Asus ExpertBook B1 B1403CVA
Intel Core i5-13420H, Intel UHD Graphics Xe G4 48EUs
9.5 fps -70%
Lenovo ThinkPad L14 G4 21H1003DGE
Intel Core i5-1335U, Intel Iris Xe Graphics G7 80EUs
8.17 (5.21min, 5.84P0.1, 7.26P1) fps -75%
1920x1080 Ultra Preset AA:T
Dell XPS 14 2024 OLED
Intel Core Ultra 7 155H, NVIDIA GeForce RTX 4050 Laptop GPU
48.3 fps +53%
Dell Pro 14 Premium
Intel Core Ultra 7 268V, Intel Arc Graphics 140V
31.6 fps
Przeciętny Intel Arc Graphics 140V
  (16.6 - 31.6, n=31)
26.8 fps -15%
HP EliteBook Ultra G1i 14
Intel Core Ultra 7 258V, Intel Arc Graphics 140V
26 fps -18%
Lenovo Yoga 7 2-in-1 14AHP9
AMD Ryzen 7 8840HS, AMD Radeon 780M
25.7 fps -19%
Lenovo ThinkPad T14s Gen 6 Intel
Intel Core Ultra 5 228V, Intel Arc Graphics 130V
25.2 (22min, 22.3P0.1, 22.7P1) fps -20%
Lenovo Yoga Book 9 14IAH10
Intel Core Ultra 7 255H, Intel Arc Graphics 140T
24.8 fps -22%
Lenovo Yoga Slim 7 14AKP G10
AMD Ryzen AI 7 350, AMD Radeon 860M
22.5 fps -29%
Asus Vivobook S 14 OLED S5406SA
Intel Core Ultra 5 226V, Intel Arc Graphics 130V
20.4 fps -35%
Lenovo Yoga 7 2-in-1 14AKP10
AMD Ryzen AI 5 340, AMD Radeon 840M
12.8 (7.34min, 7.86P0.1, 10.4P1) fps -59%
Asus ExpertBook B1 B1403CVA
Intel Core i5-13420H, Intel UHD Graphics Xe G4 48EUs
9.2 fps -71%
Lenovo ThinkPad L14 G4 21H1003DGE
Intel Core i5-1335U, Intel Iris Xe Graphics G7 80EUs
7.96 (4.77min, 4.89P0.1, 6.71P1) fps -75%
X-Plane 11.11
1280x720 low (fps_test=1)
Dell XPS 14 2024 OLED
Intel Core Ultra 7 155H, NVIDIA GeForce RTX 4050 Laptop GPU
109.8 fps +138%
Lenovo Yoga Slim 7 14AKP G10
AMD Ryzen AI 7 350, AMD Radeon 860M
77.6 fps +68%
Lenovo Yoga 7 2-in-1 14AKP10
AMD Ryzen AI 5 340, AMD Radeon 840M
59 fps +28%
Dell Latitude 9440 2-in-1
Intel Core i7-1365U, Intel Iris Xe Graphics G7 96EUs
58.4 fps +26%
Lenovo Yoga Book 9 14IAH10
Intel Core Ultra 7 255H, Intel Arc Graphics 140T
53.1 fps +15%
Lenovo Yoga 7 2-in-1 14AHP9
AMD Ryzen 7 8840HS, AMD Radeon 780M
49.2 fps +6%
Lenovo ThinkPad T14s Gen 6 Intel
Intel Core Ultra 5 228V, Intel Arc Graphics 130V
47.4 fps +3%
Przeciętny Intel Arc Graphics 140V
  (38.9 - 57, n=34)
47.4 fps +3%
Dell Pro 14 Premium
Intel Core Ultra 7 268V, Intel Arc Graphics 140V
46.2 fps
Asus Vivobook S 14 OLED S5406SA
Intel Core Ultra 5 226V, Intel Arc Graphics 130V
44.5 fps -4%
HP EliteBook Ultra G1i 14
Intel Core Ultra 7 258V, Intel Arc Graphics 140V
44 fps -5%
Dell Latitude 7440
Intel Core i5-1345U, Intel Iris Xe Graphics G7 80EUs
33.8 fps -27%
Lenovo ThinkPad L14 G4 21H1003DGE
Intel Core i5-1335U, Intel Iris Xe Graphics G7 80EUs
31.5 fps -32%
Asus ExpertBook B1 B1403CVA
Intel Core i5-13420H, Intel UHD Graphics Xe G4 48EUs
fps -100%
1920x1080 med (fps_test=2)
Dell XPS 14 2024 OLED
Intel Core Ultra 7 155H, NVIDIA GeForce RTX 4050 Laptop GPU
86.2 fps +118%
Lenovo Yoga Slim 7 14AKP G10
AMD Ryzen AI 7 350, AMD Radeon 860M
59 fps +49%
Lenovo Yoga Book 9 14IAH10
Intel Core Ultra 7 255H, Intel Arc Graphics 140T
43.2 fps +9%
Dell Latitude 9440 2-in-1
Intel Core i7-1365U, Intel Iris Xe Graphics G7 96EUs
43 fps +9%
Lenovo Yoga 7 2-in-1 14AKP10
AMD Ryzen AI 5 340, AMD Radeon 840M
42 fps +6%
Dell Pro 14 Premium
Intel Core Ultra 7 268V, Intel Arc Graphics 140V
39.6 fps
Lenovo ThinkPad T14s Gen 6 Intel
Intel Core Ultra 5 228V, Intel Arc Graphics 130V
38.4 fps -3%
Przeciętny Intel Arc Graphics 140V
  (34.1 - 44.3, n=34)
38.3 fps -3%
Asus Vivobook S 14 OLED S5406SA
Intel Core Ultra 5 226V, Intel Arc Graphics 130V
36.7 fps -7%
Lenovo Yoga 7 2-in-1 14AHP9
AMD Ryzen 7 8840HS, AMD Radeon 780M
36.2 fps -9%
HP EliteBook Ultra G1i 14
Intel Core Ultra 7 258V, Intel Arc Graphics 140V
35.9 fps -9%
Dell Latitude 7440
Intel Core i5-1345U, Intel Iris Xe Graphics G7 80EUs
28.3 fps -29%
Lenovo ThinkPad L14 G4 21H1003DGE
Intel Core i5-1335U, Intel Iris Xe Graphics G7 80EUs
22 fps -44%
1920x1080 high (fps_test=3)
Dell XPS 14 2024 OLED
Intel Core Ultra 7 155H, NVIDIA GeForce RTX 4050 Laptop GPU
77.1 fps +121%
Lenovo Yoga Slim 7 14AKP G10
AMD Ryzen AI 7 350, AMD Radeon 860M
48.6 fps +39%
Lenovo ThinkPad T14s Gen 6 Intel
Intel Core Ultra 5 228V, Intel Arc Graphics 130V
38.9 fps +11%
Lenovo Yoga Book 9 14IAH10
Intel Core Ultra 7 255H, Intel Arc Graphics 140T
38.1 fps +9%
Dell Latitude 9440 2-in-1
Intel Core i7-1365U, Intel Iris Xe Graphics G7 96EUs
37.4 fps +7%
Lenovo Yoga 7 2-in-1 14AKP10
AMD Ryzen AI 5 340, AMD Radeon 840M
36.5 fps +5%
Dell Pro 14 Premium
Intel Core Ultra 7 268V, Intel Arc Graphics 140V
34.9 fps
Przeciętny Intel Arc Graphics 140V
  (28.5 - 37.9, n=34)
33.6 fps -4%
Asus Vivobook S 14 OLED S5406SA
Intel Core Ultra 5 226V, Intel Arc Graphics 130V
32.8 fps -6%
Lenovo Yoga 7 2-in-1 14AHP9
AMD Ryzen 7 8840HS, AMD Radeon 780M
29.4 fps -16%
HP EliteBook Ultra G1i 14
Intel Core Ultra 7 258V, Intel Arc Graphics 140V
29.1 fps -17%
Dell Latitude 7440
Intel Core i5-1345U, Intel Iris Xe Graphics G7 80EUs
21.3 fps -39%
Lenovo ThinkPad L14 G4 21H1003DGE
Intel Core i5-1335U, Intel Iris Xe Graphics G7 80EUs
20.6 fps -41%

Cyberpunk 2077 ultra FPS Chart

0510152025Tooltip
Dell Pro 14 Premium Core Ultra 7 268V, Arc 140V: Ø26.6 (23-27.4)
lowmed.highultra
Dota 2 Reborn (2015) 104.1 89.5 75 87.4
Final Fantasy XV Benchmark (2018) 88.5 49.5 36.5
X-Plane 11.11 (2018) 46.2 39.6 34.9
Strange Brigade (2018) 194.3 80.2 67.4 57.6
Baldur's Gate 3 (2023) 43.6 36.8 32.2 31.6
Cyberpunk 2077 2.2 Phantom Liberty (2023) 47.8 38.5 33.4 29
F1 24 (2024) 82.4 75.7 59.9 19.1

Emisje

Hałas systemowy

Profil hałasu wentylatora i zachowanie są podobne do tego, co zaobserwowaliśmy na Latitude 9440 2-w-1 co być może nie jest zaskakujące, biorąc pod uwagę, że mają one wiele podobnych cech fizycznych. Dell Pro 14 Premium jest zasadniczo cichy podczas codziennych obciążeń biurowych, takich jak przeglądanie stron internetowych lub przetwarzanie tekstu z minimalnym pulsowaniem. Jeśli wentylatory zwiększą prędkość, to stosunkowo szybko spadną, gdy dodatkowa moc obliczeniowa nie będzie już potrzebna.

Pułap hałasu wentylatora wynoszący 44 dB(A) jest zbliżony do tego, który zarejestrowaliśmy na Latitude 9440 2-w-1, który jest głośniejszy niż wiele innych biznesowych subnotebooków. Wysokość dźwięku jest również stosunkowo ostra, a przez to bardziej zauważalna niż byśmy chcieli.

Chłodzenie składa się z dwóch wentylatorów ~40 mm oraz pojedynczej rurki cieplnej między nimi
Dell obiecuje o 20 procent większy przepływ powietrza w porównaniu do modeli z 2024 r. Latitude 14
Profil hałasu wentylatora (Biały: Tło, Czerwony: System bezczynny, Niebieski: 3DMark 06, Pomarańczowy: Cyberpunk 2077, Zielony: Prime95 stress)

Hałas

luz
23.1 / 23.1 / 23.1 dB
obciążenie
38.2 / 44.2 dB
  red to green bar
 
 
30 dB
cichy
40 dB(A)
słyszalny
50 dB(A)
irytujący
 
min: dark, med: mid, max: light   Earthworks M23R, Arta (odległość 15 cm)   hałas otoczenia: 23.1 dB(A)
dB(A) 0102030405060708090Deep BassMiddle BassHigh BassLower RangeMidsHigher MidsLower HighsMid HighsUpper HighsSuper Highs2033.735.532.634.134.72524.827.325.924.125.43121.123.524.32223.94020.820.319.716.618.35026.221.323.320.622.46322.623.524.923.620.98026.722252229.210020.619.619.916.619.512518.219.217.615.71716020.418.813.71420.720022.918.714.314.821.825023.52012.512.523.331527.222.314.115.926.740027.722.312.214.227.650027.122.210.110.927.663027.221.69.59.827.380027.421.99.29.927.6100028.623.29.69.229.3125028.123.39.69.328.4160031.526.1109.931.5200031.626.19.81031.6250031.225.410.210.331.2315032.827.110.810.733400033.227.711.411.233.1500034.831.21211.534.8630037.328.71211.736.6800033.121.311.911.632.81000025.216.21211.82512500231511.811.722.51600018.712.711.610.818.4SPL44.238.223.123.144N4.52.70.40.44.5median 27.4median 22.2median 11.8median 11.5median 27.6Delta4.53.41.924.6hearing rangehide median Fan NoiseDell Pro 14 Premium
Dell Pro 14 Premium
Arc 140V, Core Ultra 7 268V, Kioxia BG6 KBG6AZNV1T02
Dell Latitude 7440
Iris Xe G7 80EUs, i5-1345U, Samsung MZ9L4512HBLU-00BMV
Dell XPS 14 2024 OLED
NVIDIA GeForce RTX 4050 Laptop GPU, Ultra 7 155H, Samsung PM9A1 MZVL21T0HCLR
Lenovo ThinkPad T14s Gen 6 Intel
Arc 130V, Core Ultra 5 228V, SK hynix PCB01 HFS001TFM9X179N GL
HP EliteBook Ultra G1i 14
Arc 140V, Core Ultra 7 258V, Kioxia XG8 KXG80ZNV1T02
Asus ExpertBook B1 B1403CVA
UHD Graphics Xe G4 48EUs, i5-13420H, Western Digital PC SN5000S SDEQNSJ-512G-1002
Noise
8%
-7%
3%
10%
6%
wyłączone / środowisko *
23.1
22.8
1%
24.3
-5%
24.2
-5%
23.9
-3%
23.6
-2%
Idle Minimum *
23.1
22.8
1%
24.3
-5%
24.2
-5%
23.9
-3%
23.6
-2%
Idle Average *
23.1
22.8
1%
26.5
-15%
24.2
-5%
23.9
-3%
23.6
-2%
Idle Maximum *
23.1
22.8
1%
28.5
-23%
24.2
-5%
23.9
-3%
23.7
-3%
Load Average *
38.2
26.3
31%
37
3%
30.2
21%
28.4
26%
28.7
25%
Cyberpunk 2077 ultra *
44.2
39.3
11%
31.5
29%
34.3
22%
Load Maximum *
44.2
38.3
13%
43.3
2%
39.6
10%
31.5
29%
41.4
6%
Witcher 3 ultra *
30
39.1

* ... im mniej tym lepiej

Temperatura

Temperatury powierzchni są znacznie niższe niż te, które zarejestrowaliśmy zarówno na Latitude 9440 2-w-1, jak i Latitude 7440. Gorące punkty na powierzchni klawiatury i dolnym panelu osiągają odpowiednio zaledwie 33 C i 28 C, w porównaniu do 40 C w wyżej wymienionych modelach Latitude. Poprawę można w dużej mierze przypisać wydajniejszemu procesorowi Lunar Lake.

Tylny układ wydechowy
Ultralekki zasilacz sieciowy osiąga ponad 52°C podczas pracy z wymagającymi obciążeniami
w stresie
 31 °C33 °C27.6 °C 
 27.4 °C30 °C26.2 °C 
 25.4 °C23.2 °C23.8 °C 
maks. w ogóle: 33 °C
średnia: 27.5 °C
24.6 °C28 °C26 °C
24.8 °C28 °C25.6 °C
23.6 °C25.2 °C24.6 °C
maks. w ogóle: 28 °C
średnia: 25.6 °C
zasilacz  47.4 °C | temperatura otoczenia 20 °C | Fluke 62 Mini IR Thermometer
(+) Średnia temperatura górnej części przy maksymalnym obciążeniu wynosi 27.5 °C / 82 F, w porównaniu do średniej 29.5 °C / ###class_avg_f# ## F dla urządzeń w klasie Office.
(+) Maksymalna temperatura w górnej części wynosi 33 °C / 91 F, w porównaniu do średniej 34.3 °C / 94 F , począwszy od 21.2 do 62.5 °C dla klasy Office.
(+) Dno nagrzewa się maksymalnie do 28 °C / 82 F, w porównaniu do średniej 36.8 °C / 98 F
(+) W stanie bezczynności średnia temperatura górnej części wynosi 26 °C / 79 F, w porównaniu ze średnią temperaturą urządzenia wynoszącą 29.5 °C / ### class_avg_f### F.
(+) Podpórki pod nadgarstki i touchpad są chłodniejsze niż temperatura skóry i maksymalnie 25.4 °C / 77.7 F i dlatego są chłodne w dotyku.
(+) Średnia temperatura obszaru podparcia dłoni w podobnych urządzeniach wynosiła 27.6 °C / 81.7 F (+2.2 °C / 4 F).
System bezczynny (pokrywa C)
System bezczynny (pokrywa D)
Prime95+FurMark stress (okładka C)
Prime95+FurMark stres (okładka D)
Dell Pro 14 Premium
Intel Core Ultra 7 268V, Intel Arc Graphics 140V
Dell Latitude 7440
Intel Core i5-1345U, Intel Iris Xe Graphics G7 80EUs
Dell XPS 14 2024 OLED
Intel Core Ultra 7 155H, NVIDIA GeForce RTX 4050 Laptop GPU
Lenovo ThinkPad T14s Gen 6 Intel
Intel Core Ultra 5 228V, Intel Arc Graphics 130V
HP EliteBook Ultra G1i 14
Intel Core Ultra 7 258V, Intel Arc Graphics 140V
Asus ExpertBook B1 B1403CVA
Intel Core i5-13420H, Intel UHD Graphics Xe G4 48EUs
Heat
-16%
-17%
-18%
-10%
-19%
Maximum Upper Side *
33
39
-18%
40.5
-23%
42.6
-29%
37.9
-15%
41.2
-25%
Maximum Bottom *
28
40.6
-45%
42.6
-52%
41.6
-49%
44.3
-58%
44.4
-59%
Idle Upper Side *
28
28
-0%
26.9
4%
27.1
3%
23.3
17%
26.7
5%
Idle Bottom *
28.8
28.8
-0%
27.8
3%
27.6
4%
23.6
18%
28
3%

* ... im mniej tym lepiej

Test warunków skrajnych

Procesor przyspieszał do 3,3 GHz i 38 W podczas inicjowania stresu Prime95, aż do osiągnięcia temperatury rdzenia 96 C około 40 sekund później. Następnie wydajność nieznacznie spadła do 3 GHz i 31 W, aby utrzymać niższą temperaturę w dolnym zakresie 80 C. Maksymalny Turbo Boost jest więc ograniczony, czego można oczekiwać od laptopów ULV.

Temperatura rdzenia podczas grania utrzymuje się nieco poniżej 60 C w porównaniu do ponad 80 C na Latitude 9440 2-w-1. Nie trzeba dodawać, że Dell Pro 14 Premium jest znacznie wydajniejszy podczas pracy z dużym obciążeniem GPU.

System bezczynny
System bezczynny
Cyberpunk 2077 - stres
Stres Prime95
Stres Prime95
Stres Prime95+FurMark
Średnie taktowanie CPU (GHz) Taktowanie GPU (MHz) Średnia temperatura CPU (°C)
System bezczynności -- -- 32
Prime95 Stress 3.0 -- 82
Prime95 + FurMark Stress 1.6 1500 58
Cyberpunk 2077 Stress 1.2 2000 58

Głośniki

Dwa głośniki górne i dwa głośniki dolne - łącznie cztery głośniki
Szum różowy wykazuje bardzo dużą głośność maksymalną, zwłaszcza jak na 14-calowy subnotebook
dB(A) 0102030405060708090Deep BassMiddle BassHigh BassLower RangeMidsHigher MidsLower HighsMid HighsUpper HighsSuper Highs2037.632.637.62533.425.933.4313324.3334031.919.731.95034.923.334.96335.424.935.48049.72549.710057.719.957.712560.617.660.61606613.76620067.314.367.325065.412.565.431566.714.166.740070.912.270.950073.510.173.563079.19.579.180081.89.281.8100080.89.680.8125081.29.681.2160080.81080.8200076.89.876.8250076.310.276.331507010.870400072.211.472.2500078.61278.6630075.41275.4800068.511.968.51000070.21270.21250064.711.864.71600059.811.659.8SPL89.823.189.8N84.50.484.5median 72.2median 11.8median 72.2Delta6.31.96.326.325.821.422.12624.925.127.622.532.523.448.72655.818.860.922.167.2267019.372.317.674.217.774.319.575.31571.711.871.311.27410.574.21072.710.17210.67210.97511.374.811.671.71269.71269.612.371.112.669.61270.111.269.824.784.70.666.6median 12median 71.73.42.2hearing rangehide median Pink NoiseDell Pro 14 PremiumApple MacBook Pro 16 2021 M1 Pro
Wykres częstotliwości (pola wyboru można zaznaczyć i odznaczyć, aby porównać urządzenia)
Dell Pro 14 Premium analiza dźwięku

(+) | głośniki mogą odtwarzać stosunkowo głośno (89.8 dB)
Bas 100 - 315 Hz
(±) | zredukowany bas - średnio 8.2% niższy od mediany
(+) | bas jest liniowy (5.7% delta do poprzedniej częstotliwości)
Średnie 400 - 2000 Hz
(±) | wyższe średnie - średnio 6.3% wyższe niż mediana
(+) | średnie są liniowe (4.3% delta do poprzedniej częstotliwości)
Wysokie 2–16 kHz
(+) | zrównoważone maksima - tylko 3.1% od mediany
(+) | wzloty są liniowe (6.4% delta do poprzedniej częstotliwości)
Ogólnie 100 - 16.000 Hz
(+) | ogólny dźwięk jest liniowy (11.3% różnicy w stosunku do mediany)
W porównaniu do tej samej klasy
» 2% wszystkich testowanych urządzeń w tej klasie było lepszych, 2% podobnych, 97% gorszych
» Najlepszy miał deltę 7%, średnia wynosiła ###średnia###%, najgorsza wynosiła 53%
W porównaniu do wszystkich testowanych urządzeń
» 6% wszystkich testowanych urządzeń było lepszych, 2% podobnych, 92% gorszych
» Najlepszy miał deltę 4%, średnia wynosiła ###średnia###%, najgorsza wynosiła 134%

Apple MacBook Pro 16 2021 M1 Pro analiza dźwięku

(+) | głośniki mogą odtwarzać stosunkowo głośno (84.7 dB)
Bas 100 - 315 Hz
(+) | dobry bas - tylko 3.8% od mediany
(+) | bas jest liniowy (5.2% delta do poprzedniej częstotliwości)
Średnie 400 - 2000 Hz
(+) | zbalansowane środki średnie - tylko 1.3% od mediany
(+) | średnie są liniowe (2.1% delta do poprzedniej częstotliwości)
Wysokie 2–16 kHz
(+) | zrównoważone maksima - tylko 1.9% od mediany
(+) | wzloty są liniowe (2.7% delta do poprzedniej częstotliwości)
Ogólnie 100 - 16.000 Hz
(+) | ogólny dźwięk jest liniowy (4.6% różnicy w stosunku do mediany)
W porównaniu do tej samej klasy
» 0% wszystkich testowanych urządzeń w tej klasie było lepszych, 0% podobnych, 100% gorszych
» Najlepszy miał deltę 5%, średnia wynosiła ###średnia###%, najgorsza wynosiła 45%
W porównaniu do wszystkich testowanych urządzeń
» 0% wszystkich testowanych urządzeń było lepszych, 0% podobnych, 100% gorszych
» Najlepszy miał deltę 4%, średnia wynosiła ###średnia###%, najgorsza wynosiła 134%

Zarządzanie energią

Zużycie energii

System jest o około 15 procent bardziej wydajny niż Latitude 7440 przy obciążeniu CPU, jednocześnie oferując do 15 procent wyższą wydajność w procesie poprawy wydajności na wat. Korzyści są znacznie większe w przypadku zadań akcelerowanych przez sztuczną inteligencję lub obciążeń GPU, w których Lunar Lake przoduje w porównaniu do Raptor Lake.

Udało nam się zarejestrować maksymalny pobór mocy na poziomie 61 W z niewielkiego (~6,5 x 5,5 x 2,2 cm) zasilacza sieciowego USB-C o mocy 60 W, gdy procesor jest wykorzystywany w 100 procentach.

zużycie 3DMark 06
zużycie 3DMark 06
Cyberpunk 2077 1080p Ultra zużycie
Zużycie energii wzrosło do 56 W podczas inicjowania stresu Prime95, a następnie spadło do zaledwie 32 W po około 40 sekundach z powodu ograniczonej trwałości Turbo Boost
Prime95+FurMark stres zainicjowany w 10s mark
Pobór mocy
wyłączony / stan wstrzymaniadarklight 0.16 / 1.3 W
luzdarkmidlight 3.5 / 4.3 / 7.9 W
obciążenie midlight 38.9 / 60.7 W
 color bar
Legenda: min: dark, med: mid, max: light        Metrahit Energy
Dell Pro 14 Premium
Core Ultra 7 268V, Arc 140V, Kioxia BG6 KBG6AZNV1T02, OLED, 2880x1800, 14"
Dell Latitude 7440
i5-1345U, Iris Xe G7 80EUs, Samsung MZ9L4512HBLU-00BMV, IPS, 2560x1600, 14"
Dell XPS 14 2024 OLED
Ultra 7 155H, NVIDIA GeForce RTX 4050 Laptop GPU, Samsung PM9A1 MZVL21T0HCLR, OLED, 3200x2000, 14.5"
Lenovo ThinkPad T14s Gen 6 Intel
Core Ultra 5 228V, Arc 130V, SK hynix PCB01 HFS001TFM9X179N GL, IPS LED, 1920x1200, 14"
HP EliteBook Ultra G1i 14
Core Ultra 7 258V, Arc 140V, Kioxia XG8 KXG80ZNV1T02, OLED, 2880x1800, 14"
Asus ExpertBook B1 B1403CVA
i5-13420H, UHD Graphics Xe G4 48EUs, Western Digital PC SN5000S SDEQNSJ-512G-1002, IPS, 1920x1080, 14"
Power Consumption
-22%
-93%
9%
2%
-23%
Idle Minimum *
3.5
4.5
-29%
8.1
-131%
3
14%
3.7
-6%
3.7
-6%
Idle Average *
4.3
6.5
-51%
9.9
-130%
4.7
-9%
5.4
-26%
8.3
-93%
Idle Maximum *
7.9
7.3
8%
10.4
-32%
5.4
32%
5.7
28%
8.6
-9%
Load Average *
38.9
52.5
-35%
75.6
-94%
31.8
18%
39.4
-1%
52.5
-35%
Cyberpunk 2077 ultra external monitor *
38.7
37.1
4%
32.4
16%
41.1
-6%
Cyberpunk 2077 ultra *
39
38.7
1%
35.3
9%
42.8
-10%
Load Maximum *
60.7
63
-4%
107.1
-76%
58.9
3%
62.9
-4%
63.2
-4%
Witcher 3 ultra *
46.2
65.6

* ... im mniej tym lepiej

Power Consumption Cyberpunk / Stress Test

051015202530354045505560Tooltip
Dell Pro 14 Premium Core Ultra 7 268V, Arc 140V; 1280x720 Prime95 28.10 and Furmark 1.25: Ø39.1 (30.1-60.6)
Dell Latitude 7440 i5-1345U, Iris Xe G7 80EUs; 1280x720 Prime95 28.10 and Furmark 1.25: Ø44.1 (34-63)
Dell Pro 14 Premium Core Ultra 7 268V, Arc 140V; Idle 150cd/m2: Ø3.65 (3.26-6.12)
Dell Latitude 7440 i5-1345U, Iris Xe G7 80EUs; Idle 150cd/m2: Ø5.33 (4.64-6.77)
Dell Pro 14 Premium Core Ultra 7 268V, Arc 140V; Cyberpunk 2077 FHD ultra no FSR 150cd: Ø39 (37.9-50.3)

Power Consumption external Monitor

051015202530354045505560Tooltip
Dell Pro 14 Premium Core Ultra 7 268V, Arc 140V; Prime95 V2810 Stress (external Monitor): Ø39.4 (32-56)
Dell Latitude 7440 i5-1345U, Iris Xe G7 80EUs; Prime95 V2810 Stress (external Monitor): Ø39.2 (37-63)
Dell Pro 14 Premium Core Ultra 7 268V, Arc 140V; Cinebench R15 Multi (external Monitor): Ø53.3 (52.4-54.1)
Dell Latitude 7440 i5-1345U, Iris Xe G7 80EUs; Cinebench R15 Multi (external Monitor): Ø62.9 (62.5-63)
Dell Pro 14 Premium Core Ultra 7 268V, Arc 140V; 1280x720 FurMark 1.19 GPU Stress Test (external Monitor): Ø32.8 (27.3-40.8)
Dell Latitude 7440 i5-1345U, Iris Xe G7 80EUs; 1280x720 FurMark 1.19 GPU Stress Test (external Monitor): Ø36.3 (35.4-47.5)
Dell Pro 14 Premium Core Ultra 7 268V, Arc 140V; Idle 1min (external Monitor): Ø3.57 (3.14-6)
Dell Latitude 7440 i5-1345U, Iris Xe G7 80EUs; Idle 1min (external Monitor): Ø4.52 (3.81-5.31)
Dell Pro 14 Premium Core Ultra 7 268V, Arc 140V; Cyberpunk 2077 FHD ultra no FSR (external Monitor): Ø38.7 (37.7-41.1)

Żywotność baterii

Mały uniwersalny zasilacz sieciowy USB-C o mocy 60 W

Czas pracy poprawił się w porównaniu do ostatniej generacji Latitude 14, mimo że pojemność baterii nie zmieniła się zbytnio. Udało nam się zarejestrować nieco ponad 15 godzin rzeczywistego przeglądania sieci WLAN przed automatycznym wyłączeniem, co stanowi co najmniej dwie godziny dłużej niż w przypadku Latitude 7440 w podobnych warunkach. Oczekuje się, że żywotność baterii będzie jeszcze dłuższa w przypadku konfiguracji z podstawowym panelem IPS zamiast naszego panelu OLED.

Ładowanie od stanu pustego do pełnego trwa nieco ponad 90 minut.

Wydajność akumulatora
WiFi Websurfing
15h 9min
Dell Pro 14 Premium
Core Ultra 7 268V, Arc 140V, 60 Wh
Dell Latitude 7440
i5-1345U, Iris Xe G7 80EUs, 57 Wh
Dell XPS 14 2024 OLED
Ultra 7 155H, NVIDIA GeForce RTX 4050 Laptop GPU, 69.5 Wh
Lenovo ThinkPad T14s Gen 6 Intel
Core Ultra 5 228V, Arc 130V, 58 Wh
HP EliteBook Ultra G1i 14
Core Ultra 7 258V, Arc 140V, 64 Wh
Asus ExpertBook B1 B1403CVA
i5-13420H, UHD Graphics Xe G4 48EUs, 50 Wh
Czasy pracy
-14%
-49%
44%
-21%
-54%
WiFi v1.3
909
781
-14%
465
-49%
1308
44%
722
-21%
422
-54%
Reader / Idle
1427
Load
164
79
105
H.264
635

Ocena Notebookcheck

Dell Pro 14 Premium - 19/06/2025 v8
Allen Ngo

Wykonanie
88 / 98 → 89%
Klawiatura
85%
Myszka
77%
Komunikacja
72 / 80 → 90%
Waga
72 / 20-75 → 94%
Akumulator
90%
Wyświetlacz
85%
Wydajność w grach
58 / 75 → 77%
Wydajność w programach użytkowych
84 / 92 → 91%
AI Performance
90%
Temperatura
95%
Hałas
84%
Głośniki
81%
Kamerka
45 / 75 → 59%
Średnio
70%
86%
Office - Ważona średnia
CO2 Emissions
No Data
Materials
50%
Packaging
100%
Power Use
84.5%
Repairability
60%
Software Updates
22.3%
Recycle Logo Total Sustainability Score: 52.8%

Potential Competitors in Comparison

Obraz
Model / recenzja
Cena
Waga
Wysokość
Ekran
1.
86.4%
Dell Pro 14 Premium
Dell Pro 14 Premium
Intel Core Ultra 7 268V ⎘
Intel Arc Graphics 140V ⎘
32 GB Pamięć, 1024 GB SSD
Amazon:
1. $49.99
Smatree 14 inch Laptop Sleev...
2. $39.99
Smatree Hard EVA Protective ...
3. $22.99
Alapmk Protective Case for D...
Cena katalogowa: 2500 USD
1.3 kg17.95 mm14.00"
2880x1800
243 PPI
OLED
2.
90.3% v7 (old)
Dell Latitude 7440
Dell Latitude 7440
Intel Core i5-1345U ⎘
Intel Iris Xe Graphics G7 80EUs ⎘
16 GB Pamięć, 512 GB SSD
Amazon:
1. $1,299.77
Dell Latitude 7440 Laptop 14...
2. $837.99
Dell Inspiron 14 7440 2-in-1...
3. $1,538.93
Dell Latitude 7000 7440 14" ...
Cena katalogowa: 1900 USD
1.2 kg17.95 mm14.00"
2560x1600
216 PPI
IPS
3.
86.3% v7 (old)
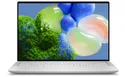
Dell XPS 14 2024 OLED
Intel Core Ultra 7 155H ⎘
NVIDIA GeForce RTX 4050 Laptop GPU ⎘
32 GB Pamięć, 1024 GB SSD
Amazon: $1,907.83
Cena katalogowa: 2949€
1.8 kg19 mm14.50"
3200x2000
260 PPI
OLED
4.
88.6%
Lenovo ThinkPad T14s Gen 6 Intel
Intel Core Ultra 5 228V ⎘
Intel Arc Graphics 130V ⎘
32 GB Pamięć, 1024 GB SSD
Amazon:
1. $1,294.11
Lenovo ThinkPad T14s Gen 6-2...
2. $1,229.99
Lenovo ThinkPad T14 Gen 5 AI...
3. $1,399.98
Lenovo ThinkPad T14s Gen 6 B...
Cena katalogowa: 2070 Euo
1.3 kg19 mm14.00"
1920x1200
162 PPI
IPS LED
5.
89.6%
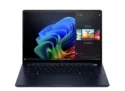
HP EliteBook Ultra G1i 14
Intel Core Ultra 7 258V ⎘
Intel Arc Graphics 140V ⎘
32 GB Pamięć, 1024 GB SSD
Amazon:
1. $1,516.77
HP EliteBook 6 G1i 14" Noteb...
2. $2,039.61
HP EliteBook Ultra G1i 14 in...
3. $1,199.98
HP EliteBook 840 G11 Busines...
Cena katalogowa: 2349€
1.2 kg12.1 mm14.00"
2880x1800
243 PPI
OLED
6.
80.9%
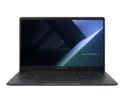
Asus ExpertBook B1 B1403CVA
Intel Core i5-13420H ⎘
Intel UHD Graphics Xe G4 48EUs ⎘
16 GB Pamięć, 512 GB SSD
Amazon:
1. $25.99
65W 45W Charger Fit for Asus...
2. $57.74
A-Tech 16GB RAM for ASUS Exp...
3. $19.88
Alapmk Protective Case for L...
Cena katalogowa: 700€
1.5 kg19.7 mm14.00"
1920x1080
157 PPI
IPS

Przezroczystość

Wyboru urządzeń do recenzji dokonuje nasza redakcja. Próbka testowa została udostępniona autorowi jako pożyczka od producenta lub sprzedawcy detalicznego na potrzeby tej recenzji. Pożyczkodawca nie miał wpływu na tę recenzję, producent nie otrzymał też kopii tej recenzji przed publikacją. Nie było obowiązku publikowania tej recenzji. Nigdy nie przyjmujemy rekompensaty ani płatności w zamian za nasze recenzje. Jako niezależna firma medialna, Notebookcheck nie podlega władzy producentów, sprzedawców detalicznych ani wydawców.

Tak testuje Notebookcheck

Każdego roku Notebookcheck niezależnie sprawdza setki laptopów i smartfonów, stosując standardowe procedury, aby zapewnić porównywalność wszystkich wyników. Od około 20 lat stale rozwijamy nasze metody badawcze, ustanawiając przy tym standardy branżowe. W naszych laboratoriach testowych doświadczeni technicy i redaktorzy korzystają z wysokiej jakości sprzętu pomiarowego. Testy te obejmują wieloetapowy proces walidacji. Nasz kompleksowy system ocen opiera się na setkach uzasadnionych pomiarów i benchmarków, co pozwala zachować obiektywizm.
Please share our article, every link counts!
Mail Logo
> laptopy testy i recenzje notebooki > Laptopy > Recenzja Dell Pro 14 Premium: Flagowy subnotebook OLED dla biznesu
Allen Ngo, 2025-06-20 (Update: 2025-06-20)