


Intel walczy z Qualcommem: Recenzja Medion SPRCHRGD 14 S2
Bitwa producentów procesorów.
Podczas gdy pierwsza wersja SPRCHRGD 14 opierała się na procesorze firmy Qualcomm, jego następca wykorzystuje model firmy Intel. Proszę przeczytać naszą recenzję, aby dowiedzieć się, jaki wpływ miało to na wydajność, emisję spalin i żywotność baterii.Florian Glaser, 👁 Florian Glaser (tłumaczenie DeepL / Ninh Duy) Opublikowany 🇺🇸 🇩🇪 ...
Werdykt - wersja Intel jest bardziej zrównoważona niż jej odpowiednik Qualcomm
Nowy SPRCHRGD 14 S2 jest w gorącym wyścigu łeb w łeb ze swoim poprzednikiem, przy czym wersja Intela jest naszym zdaniem na szczycie - choć ma również wyższą cenę (obecnie około 1400 USD w porównaniu do około 1100 USD). Następca SPRCHRGD 14 S1 może pochwalić się nie tylko stabilniejszą wydajnością procesora Core Ultra 7 258V, ale także znacznie wyższą wydajnością graficzną iGPU. Według naszych testów porównawczych, Arc Graphics 140V czasami oblicza dwa razy szybciej niż SD X Adreno X1-85.
Z drugiej strony, wersja Qualcomm wytwarza niższy poziom hałasu i korzysta z dłuższej żywotności baterii. Niemniej jednak skłaniamy się ku 14 S2, ponieważ ogólnie sprawia bardziej harmonijne wrażenie. Niemniej jednak, w zależności od Państwa preferencji w różnych kategoriach, tańszy poprzednik może być również lepszym wyborem dla Państwa.
Za
Przeciw
Cena i dostępność
Obecnie laptop ten nie jest dostępny w sprzedaży w USA. W Niemczech, gdzie przeprowadzono ten test, kosztuje on około 1400 USD.
Specyfikacje
Przypadek
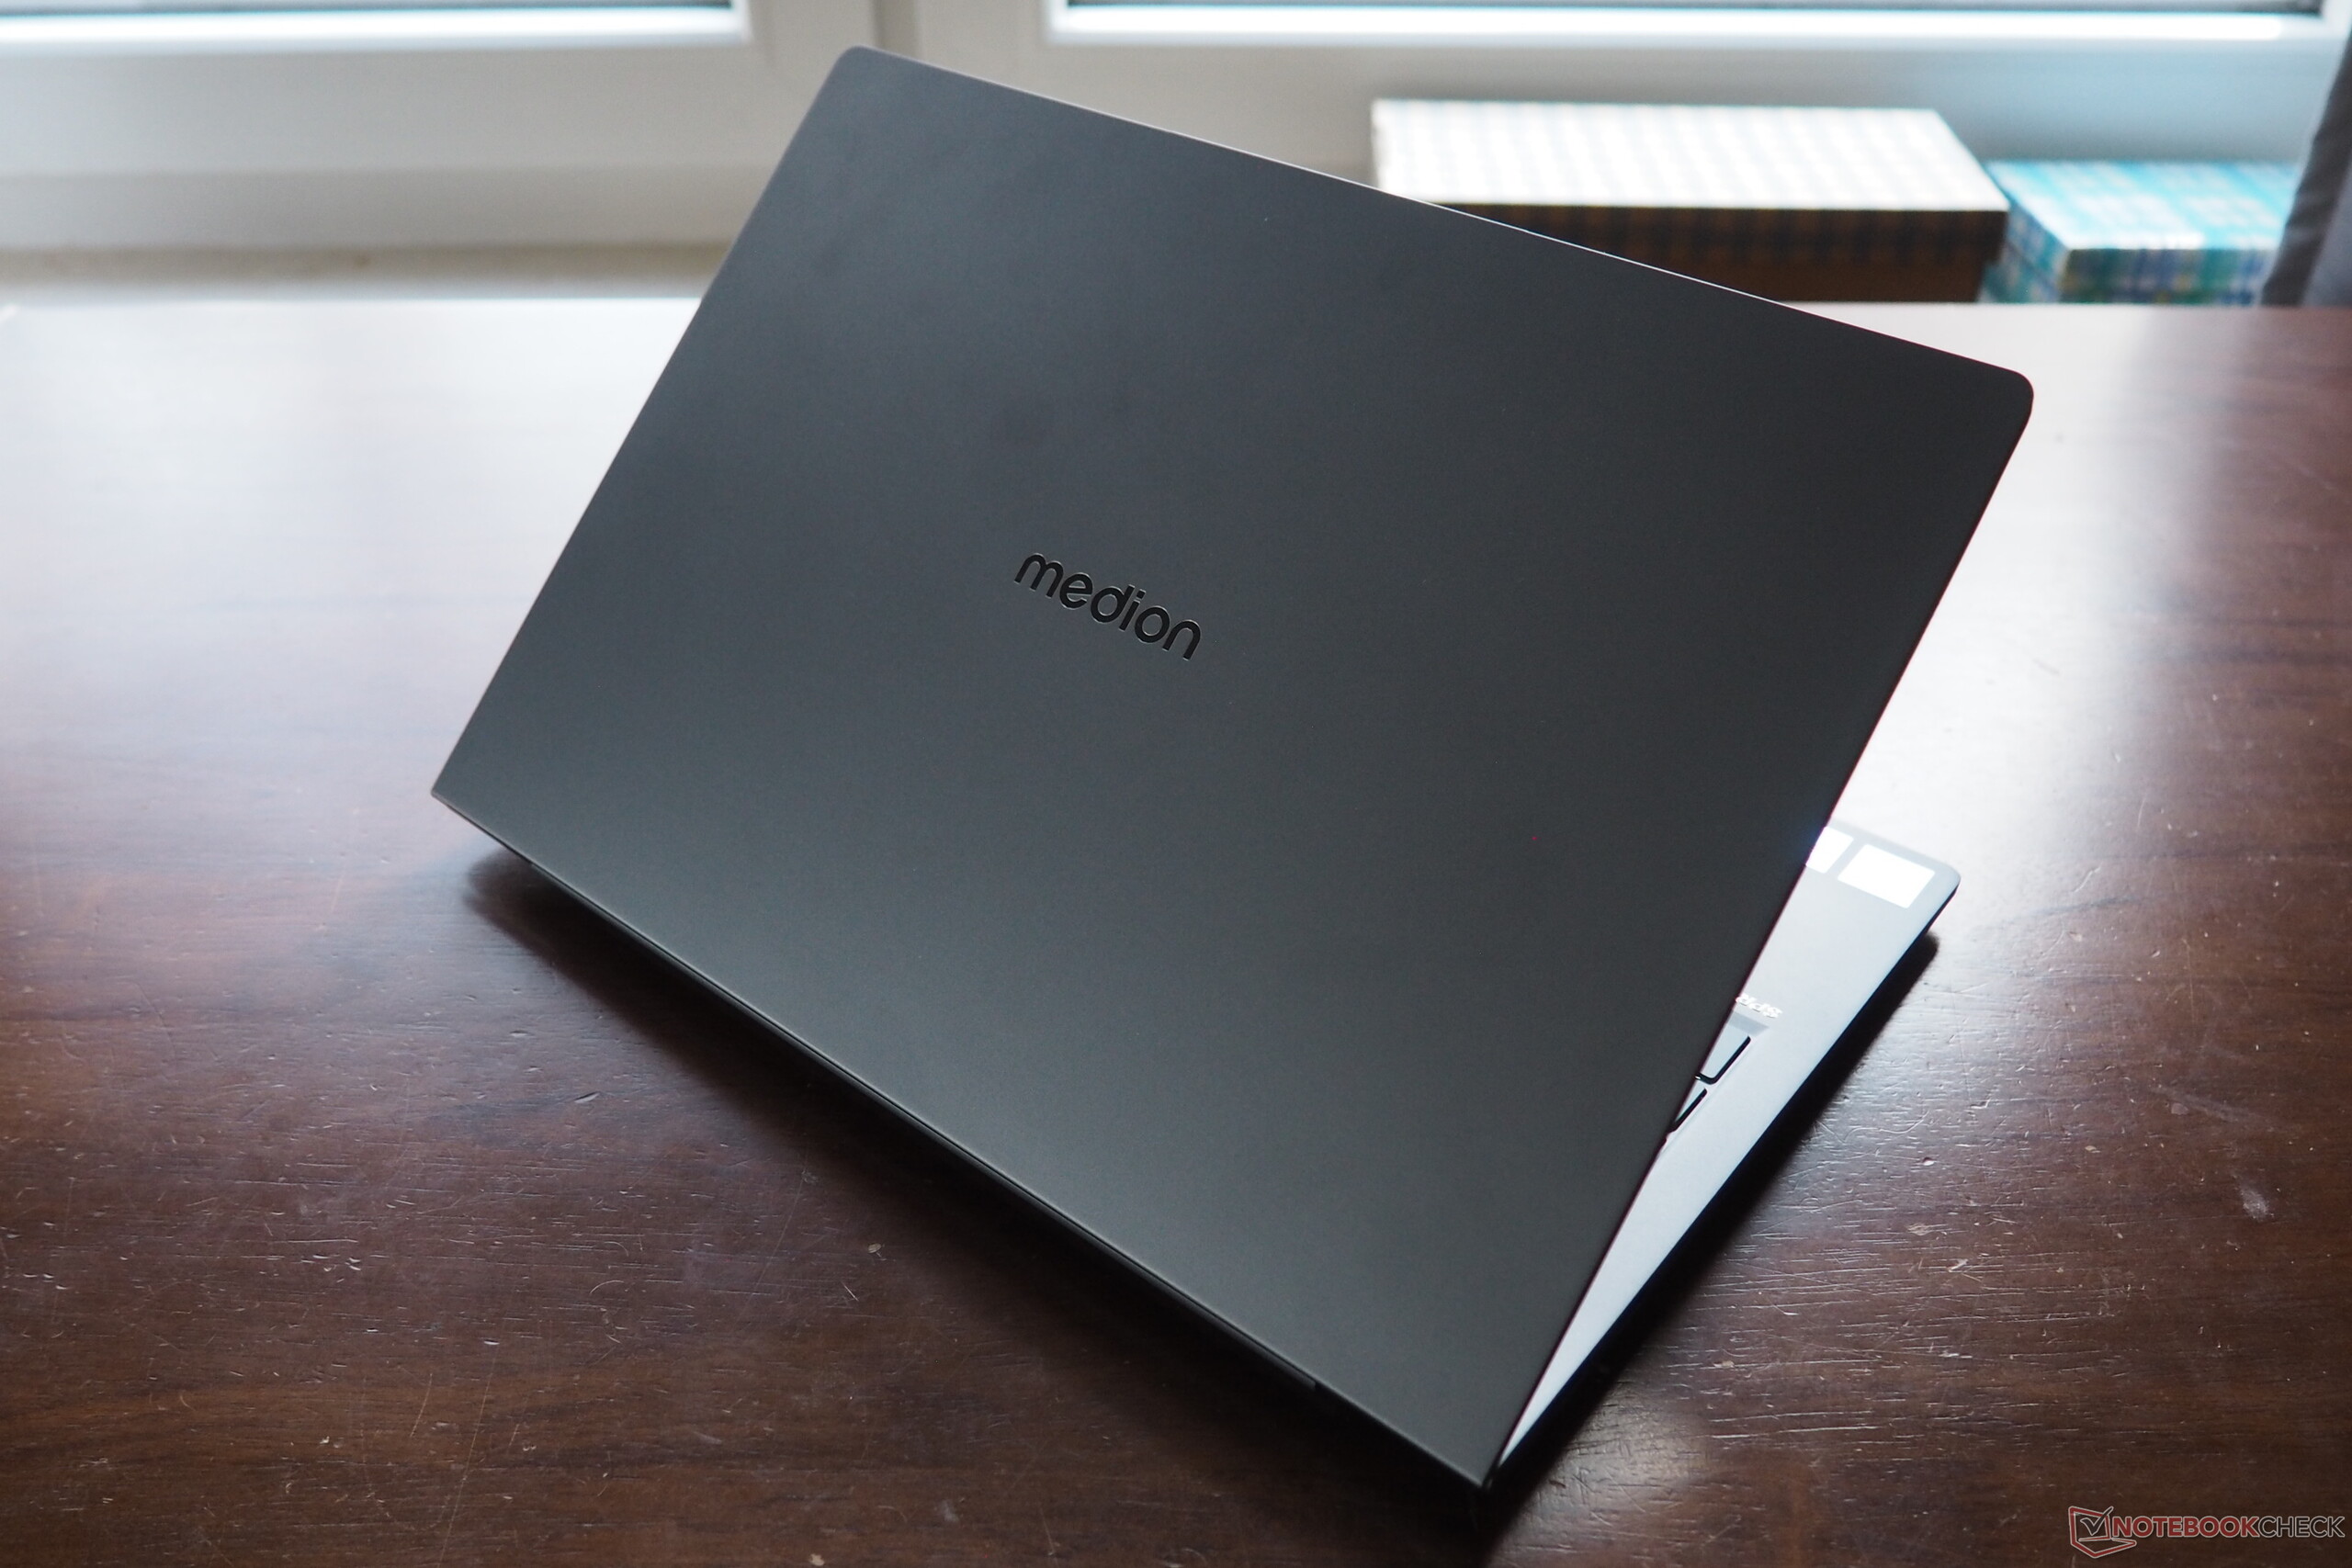
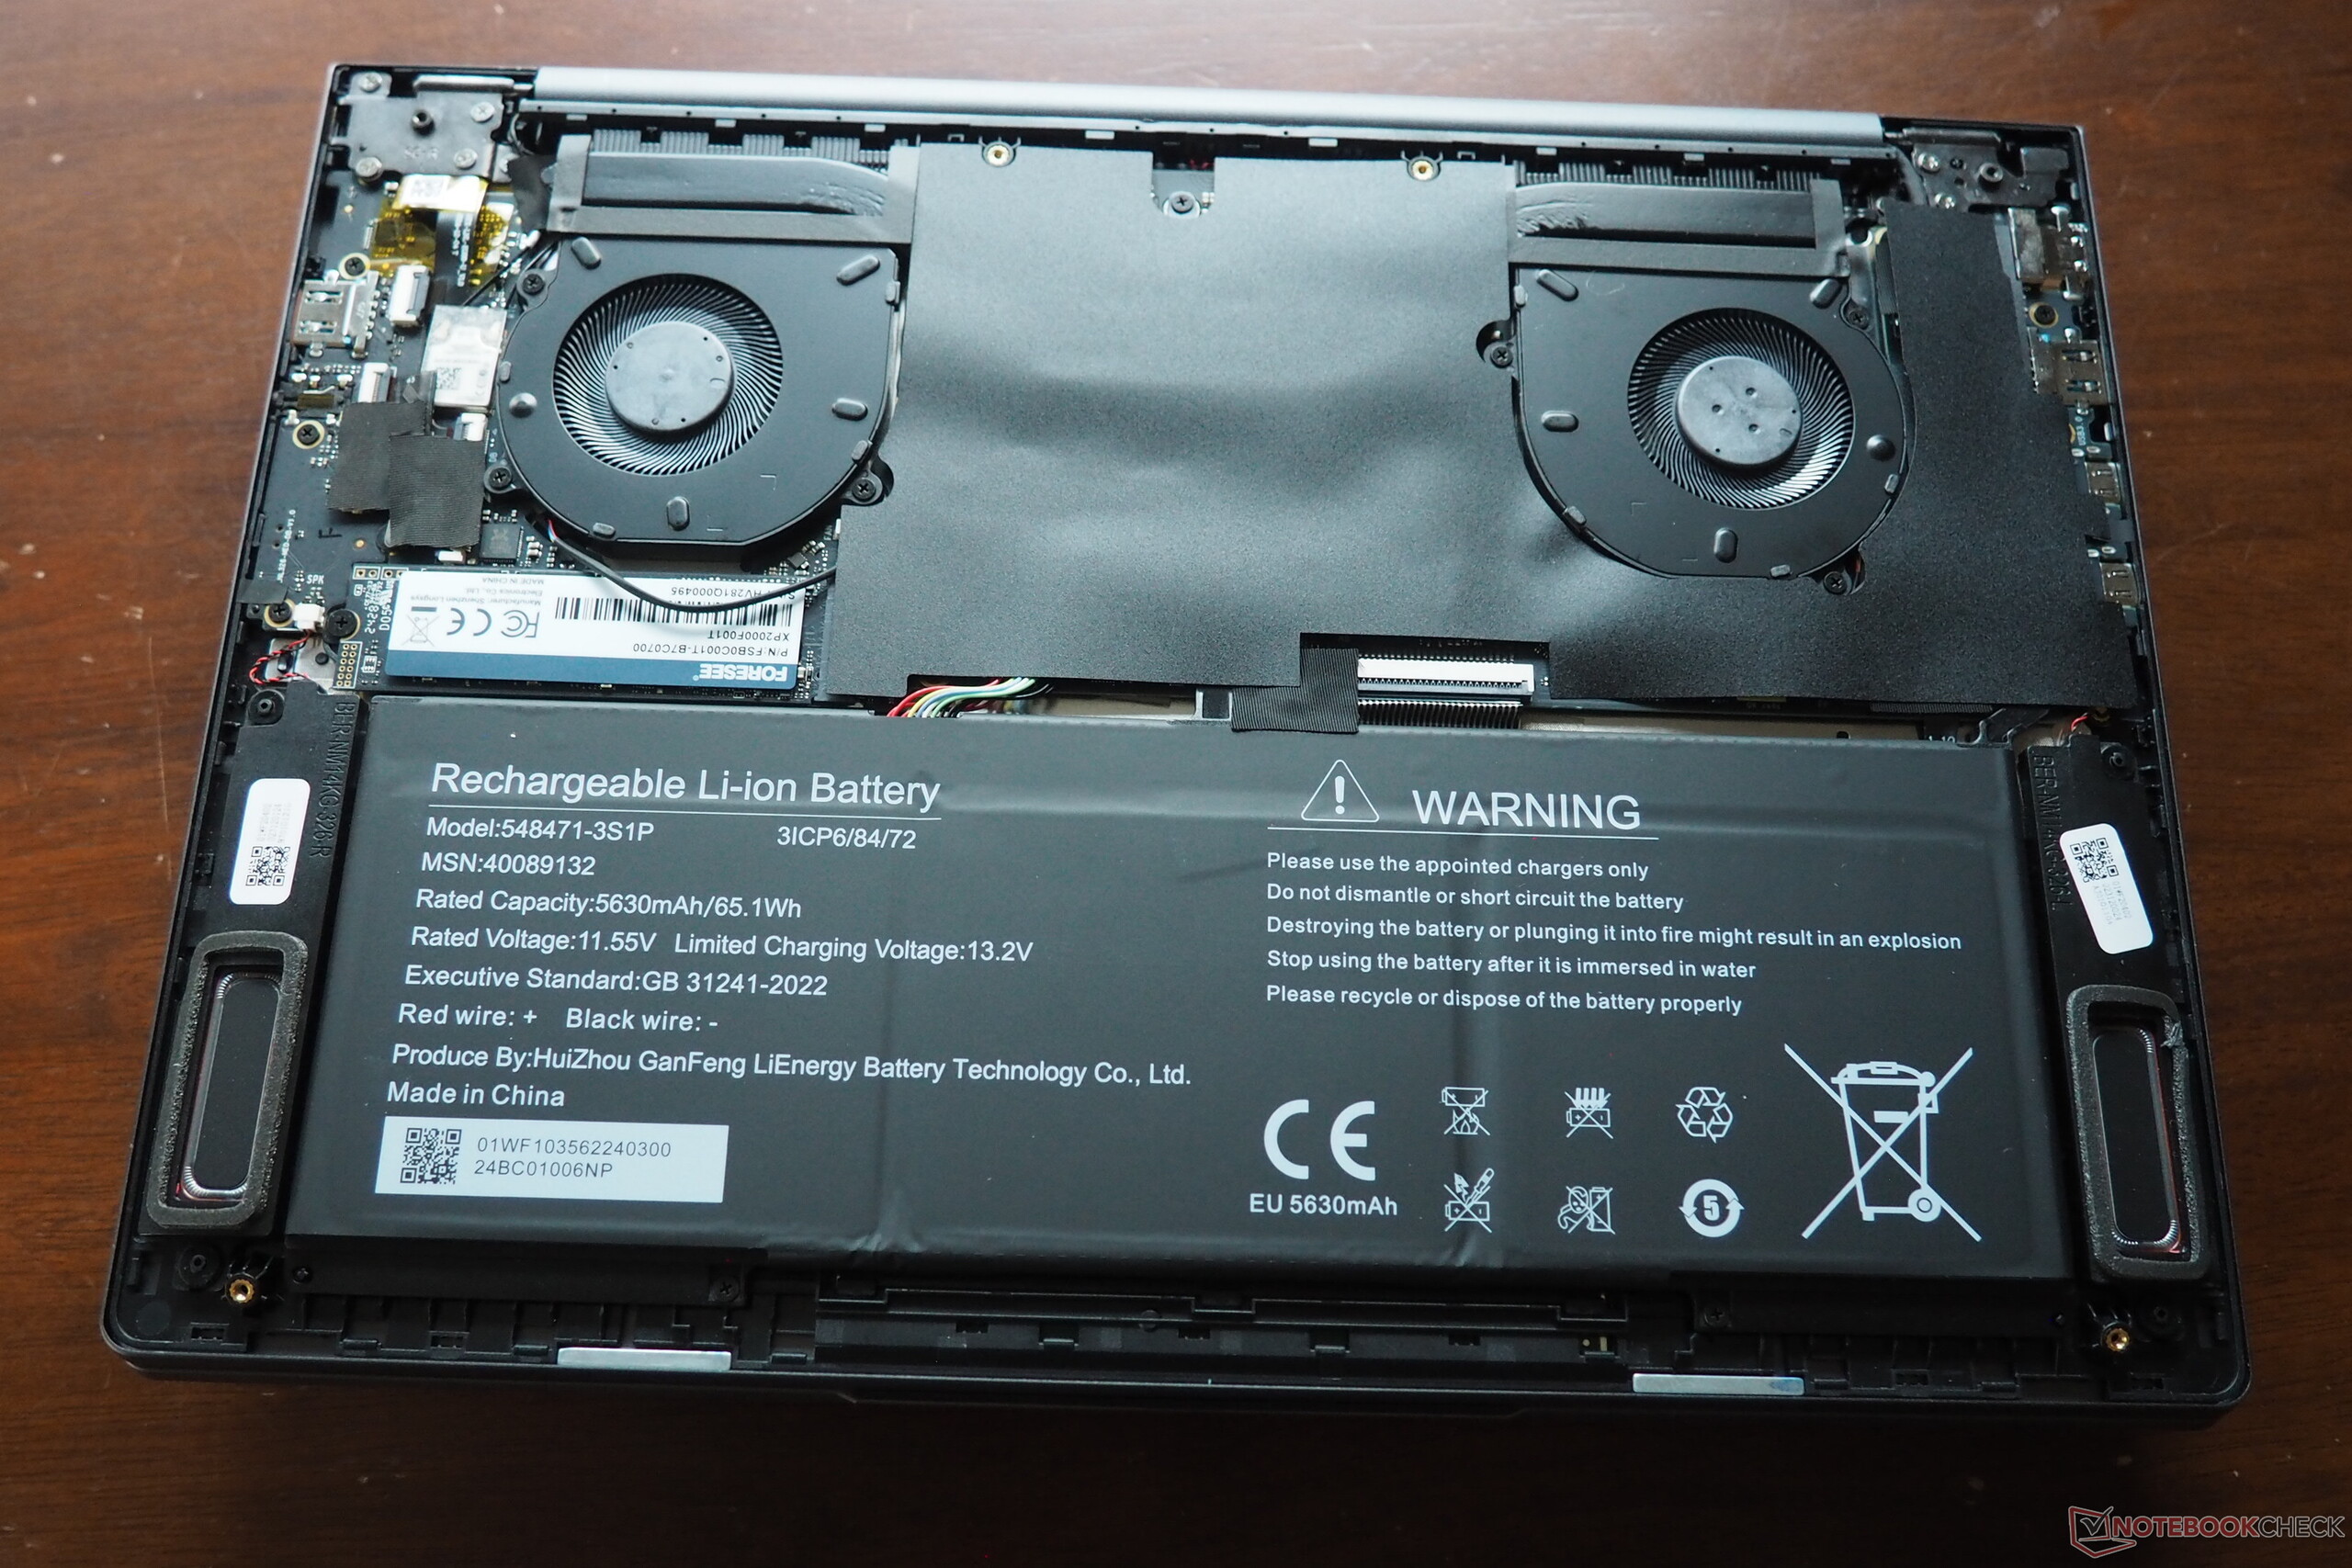
Dzięki dużej metalowej wkładce, obudowa urządzenia jest bardzo wysokiej jakości i, z kilkoma drobnymi wyjątkami, charakteryzuje się dobrą stabilnością. W połączeniu z niską całkowitą wysokością wynoszącą 17 milimetrów, rezultatem jest szykowne i eleganckie wrażenie wizualne. Konstrukcja zawiasów wygląda dobrze, chociaż pokrywę można otworzyć tylko o około 135°. 1,4-kilogramowa waga laptopa jest przeciętna w porównaniu do konkurencji i zapewnia wygodny transport. Dołączony zasilacz USB-C (65 W) jest również dość kompaktowy i lekki. Jakość wykonania urządzenia jest dobra, choć nie idealna (niektóre przejścia mogłyby być jeszcze płynniejsze).
Łączność
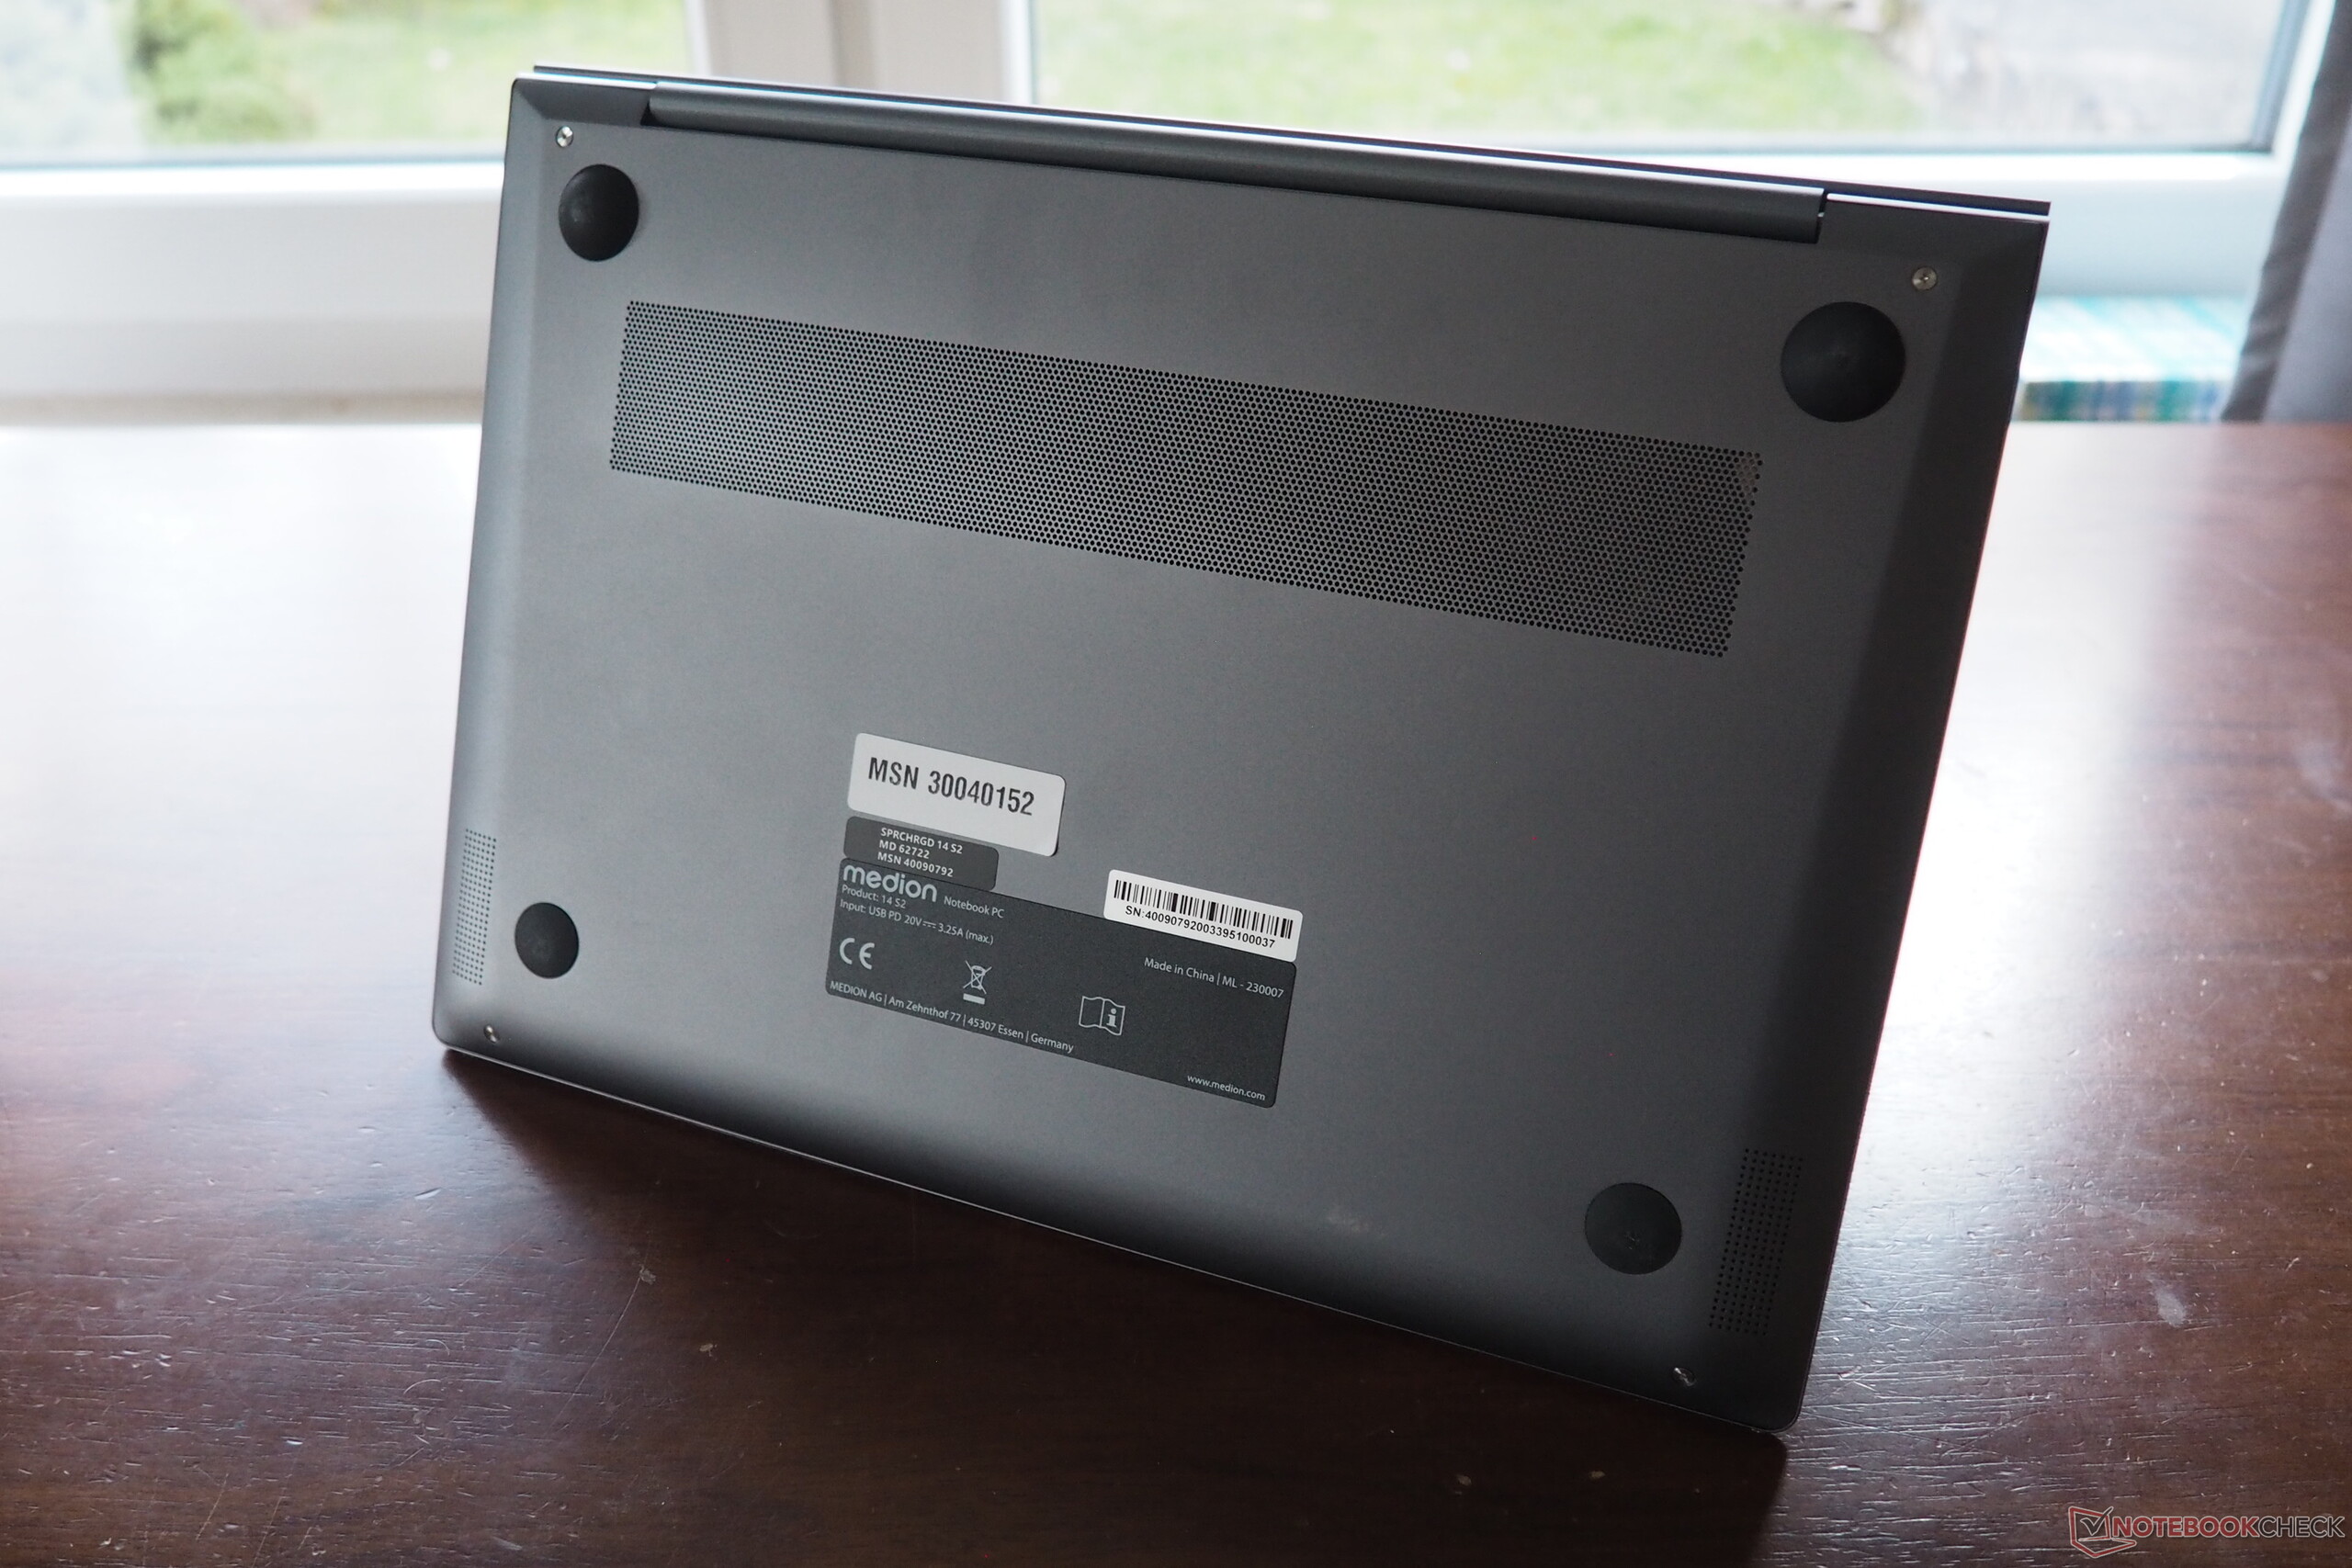
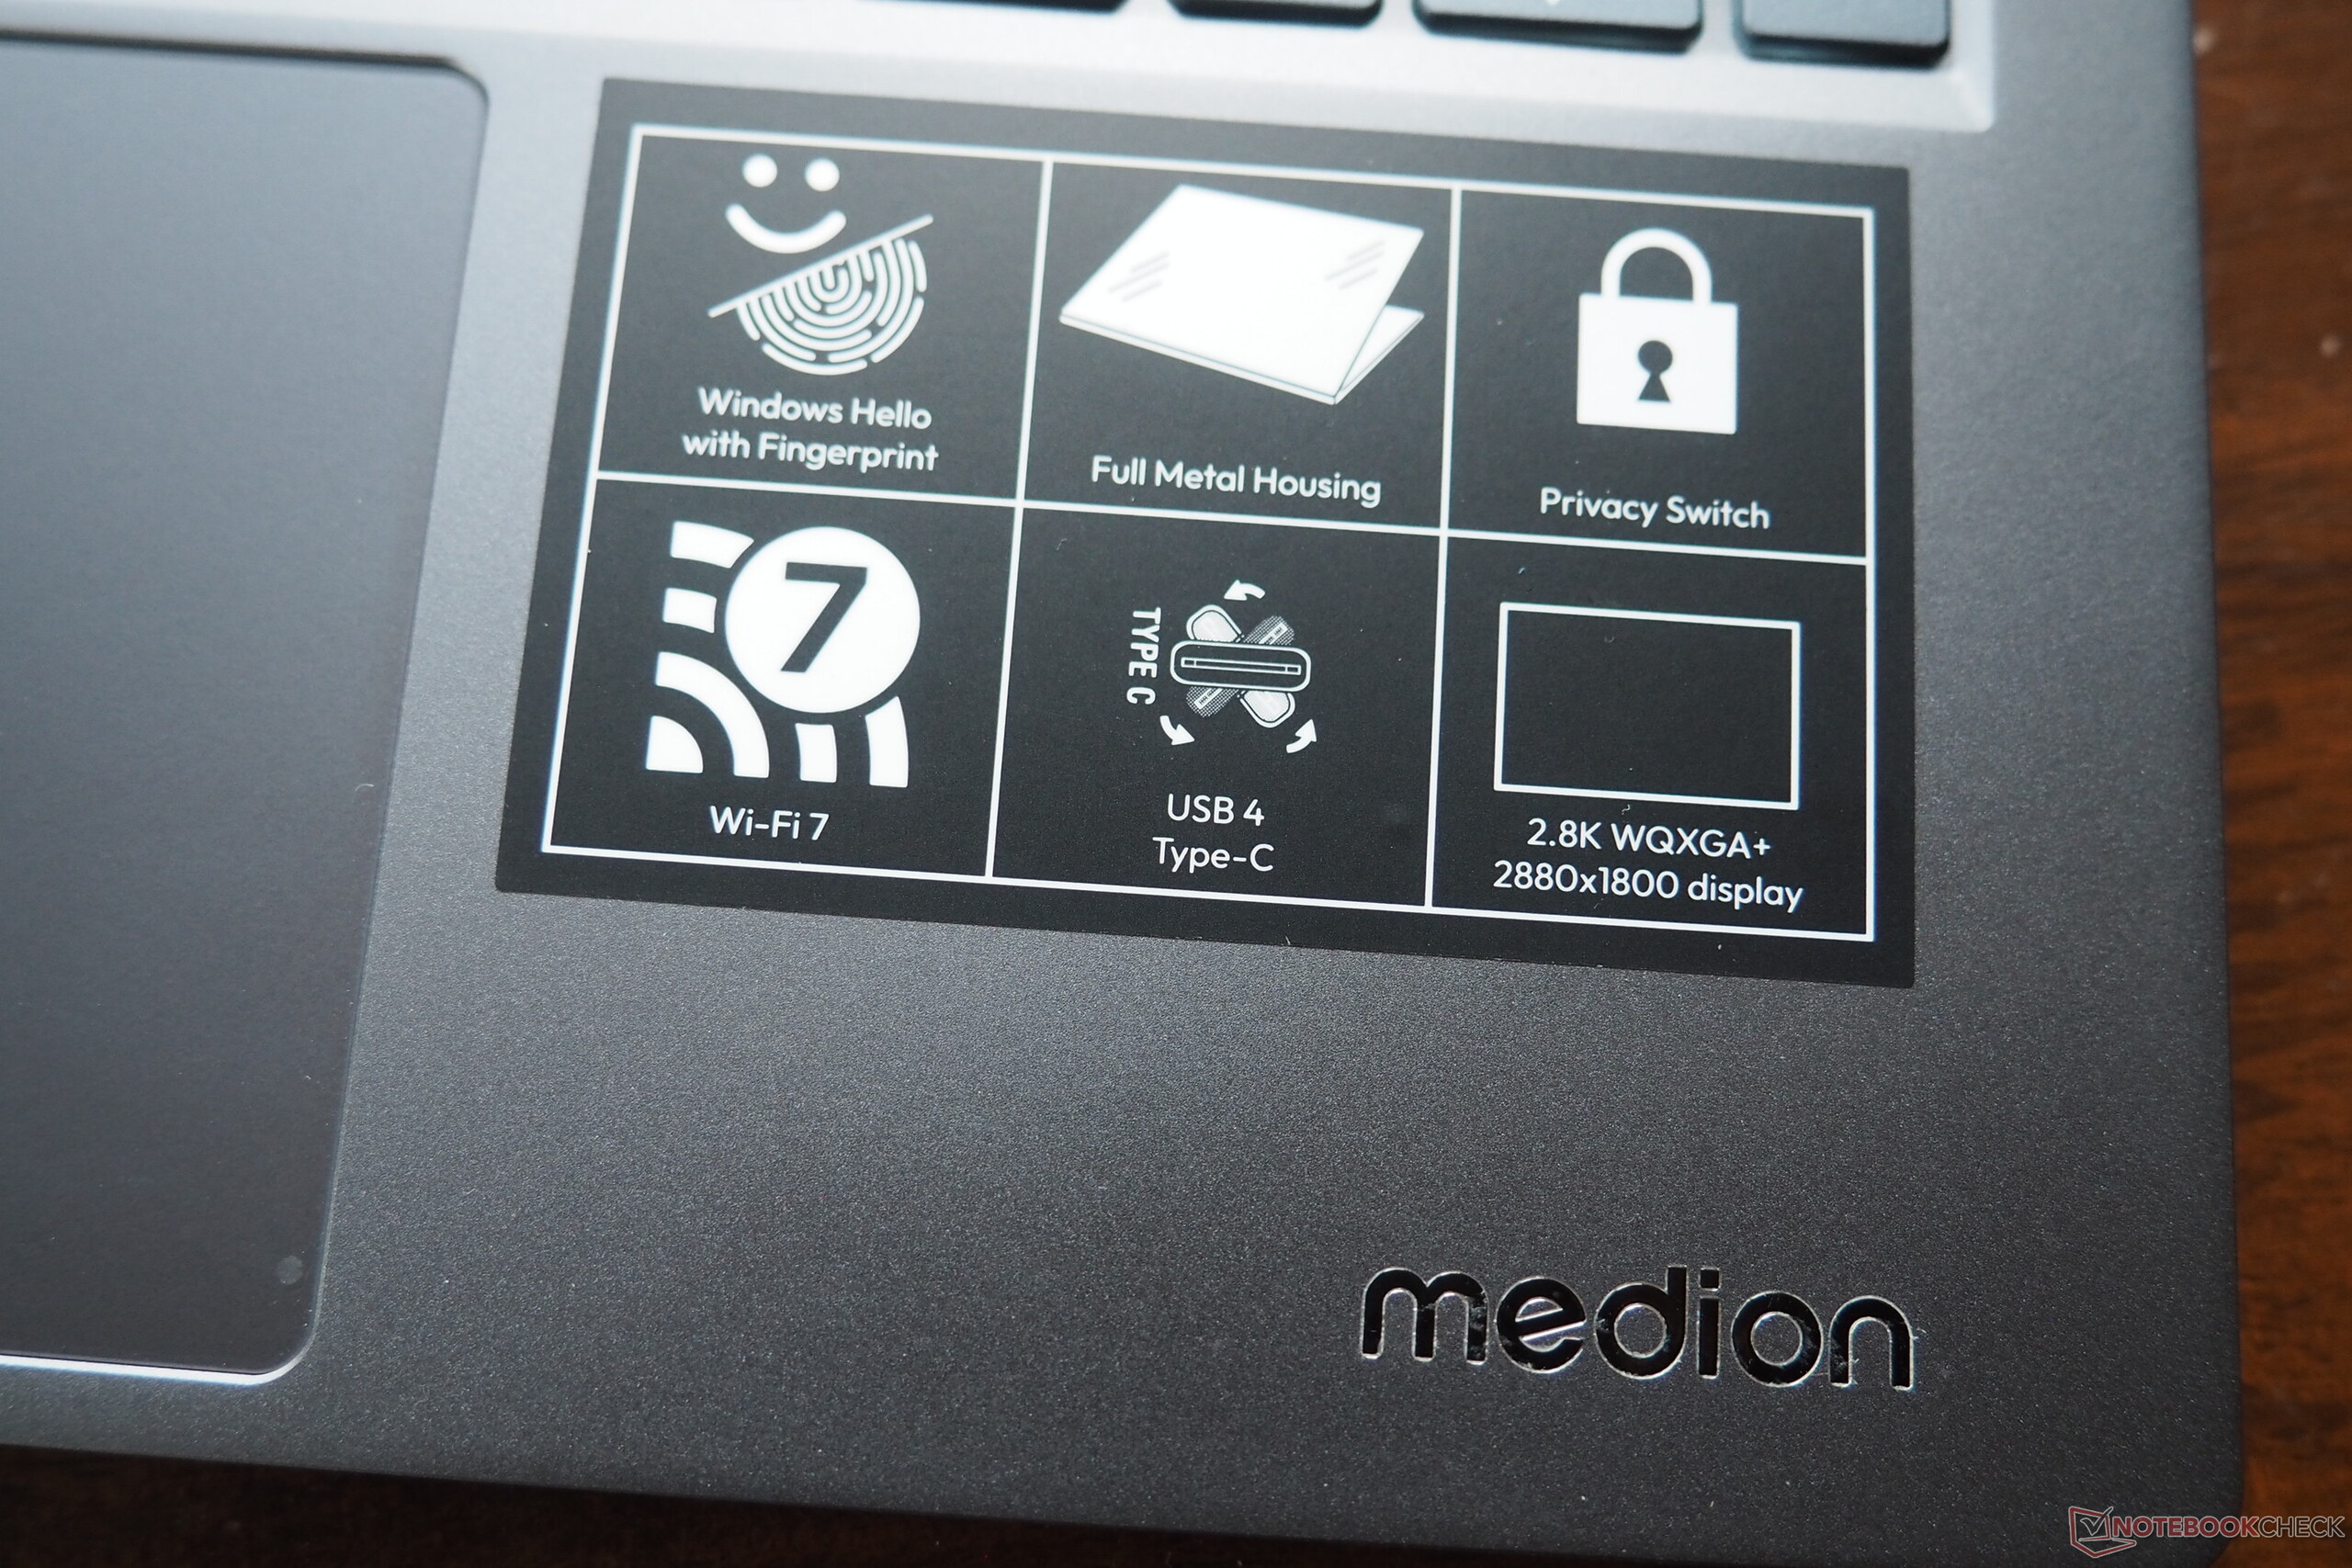
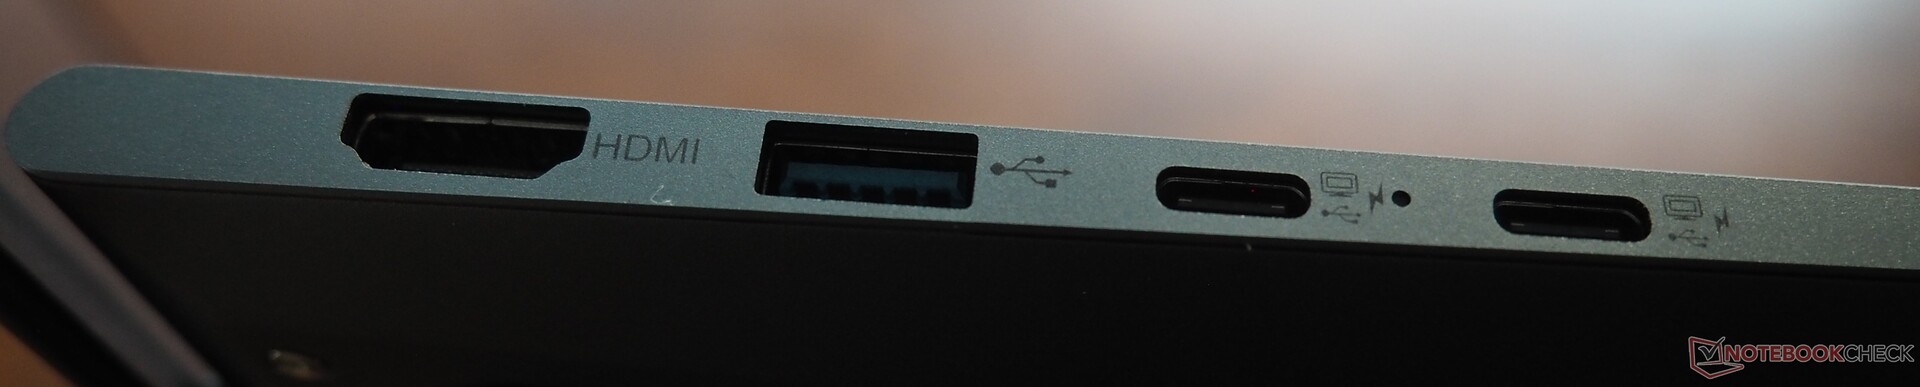
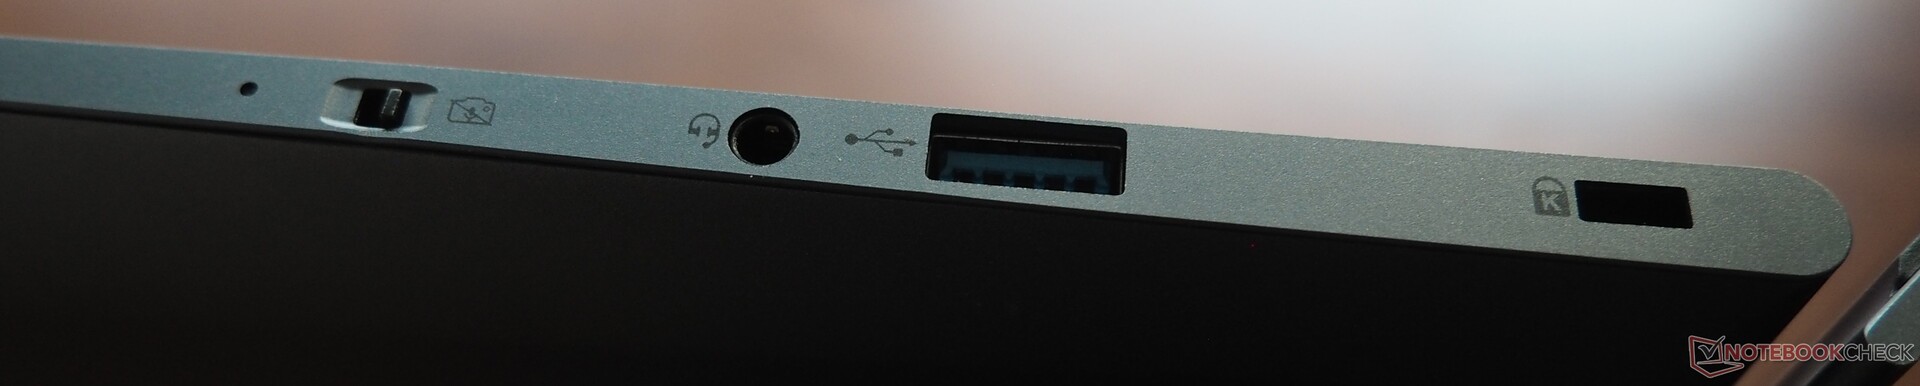
Chociaż jego obudowa jest niemal identyczna jak w przypadku poprzednika poprzednikato jego interfejsy zostały zaktualizowane: Zamiast jednego portu USB 4 z DisplayPort i PowerDelivery, ten model ma teraz dwa. Dostępne są również dwa porty typu A (1x 3.2 Gen2, 1x 3.2 Gen1), wyjście HDMI, gniazdo audio, przełącznik kamery internetowej i otwór na blokady Kensington. Z drugiej strony, nabywcy nadal muszą obejść się bez czytnika kart.
Zainstalowany moduł bezprzewodowy Wi-Fi 7 pochodzi od Intela (model BE201) i zapewnia wydajność od dobrej (nadawanie) do bardzo dobrej (odbiór).
Kamera internetowa Full HD laptopa generuje obraz o przyzwoitej ostrości, choć dokładność odwzorowania kolorów mogłaby być nieco lepsza - jak to często bywa.
Komunikacja
Kamera internetowa


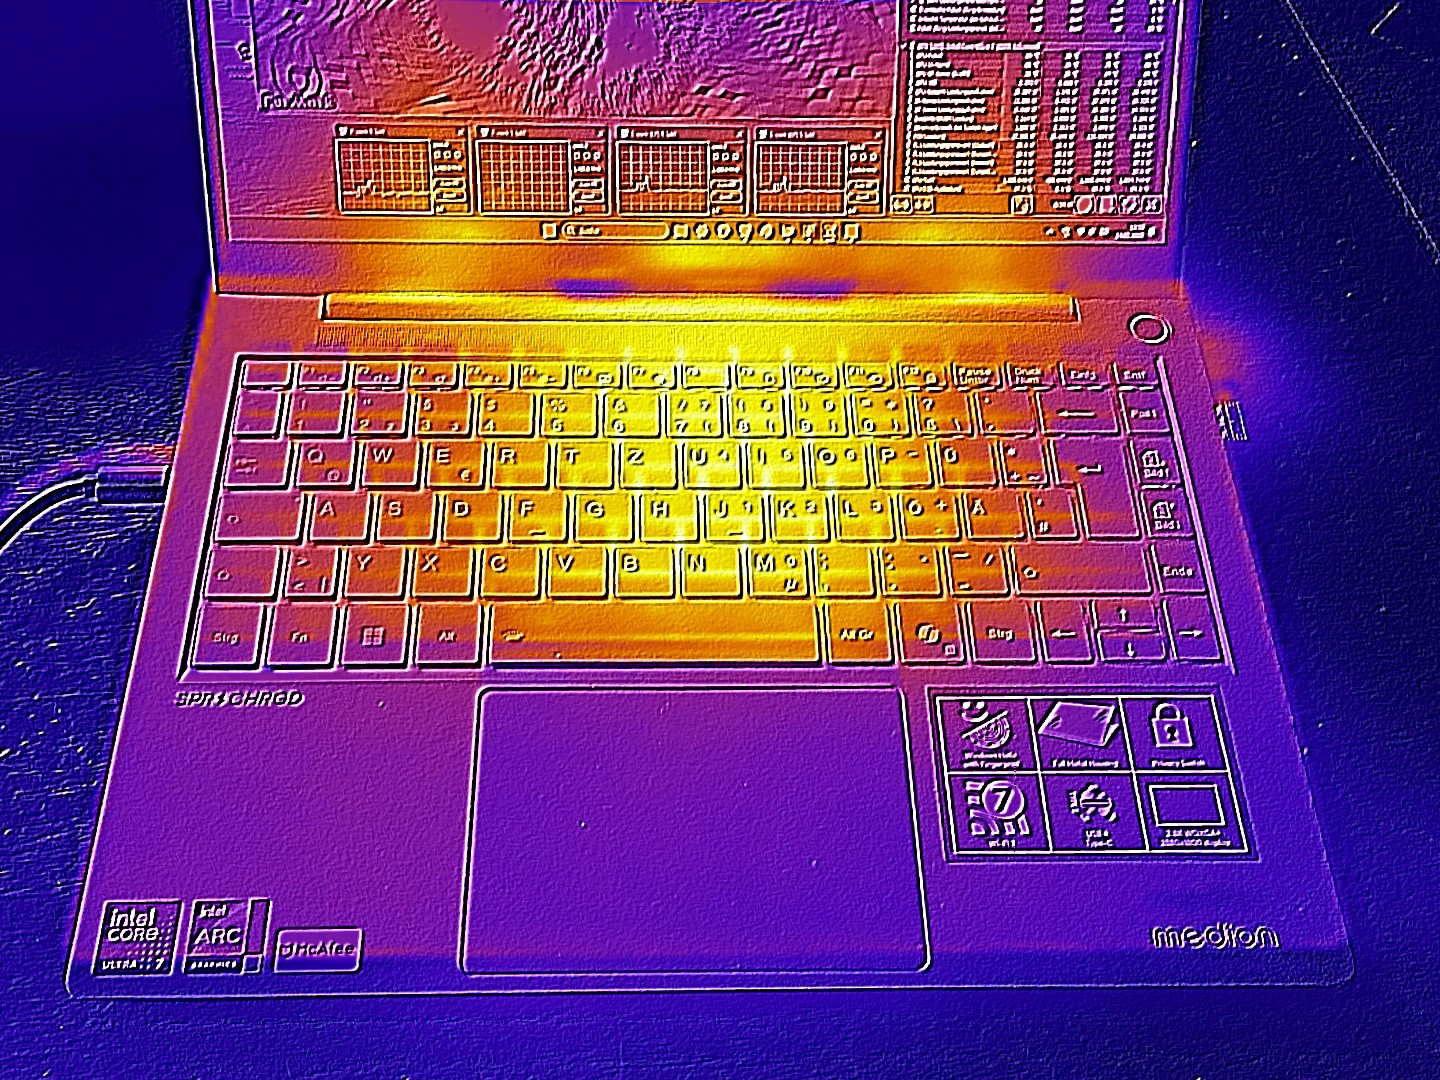
Urządzenia wejściowe
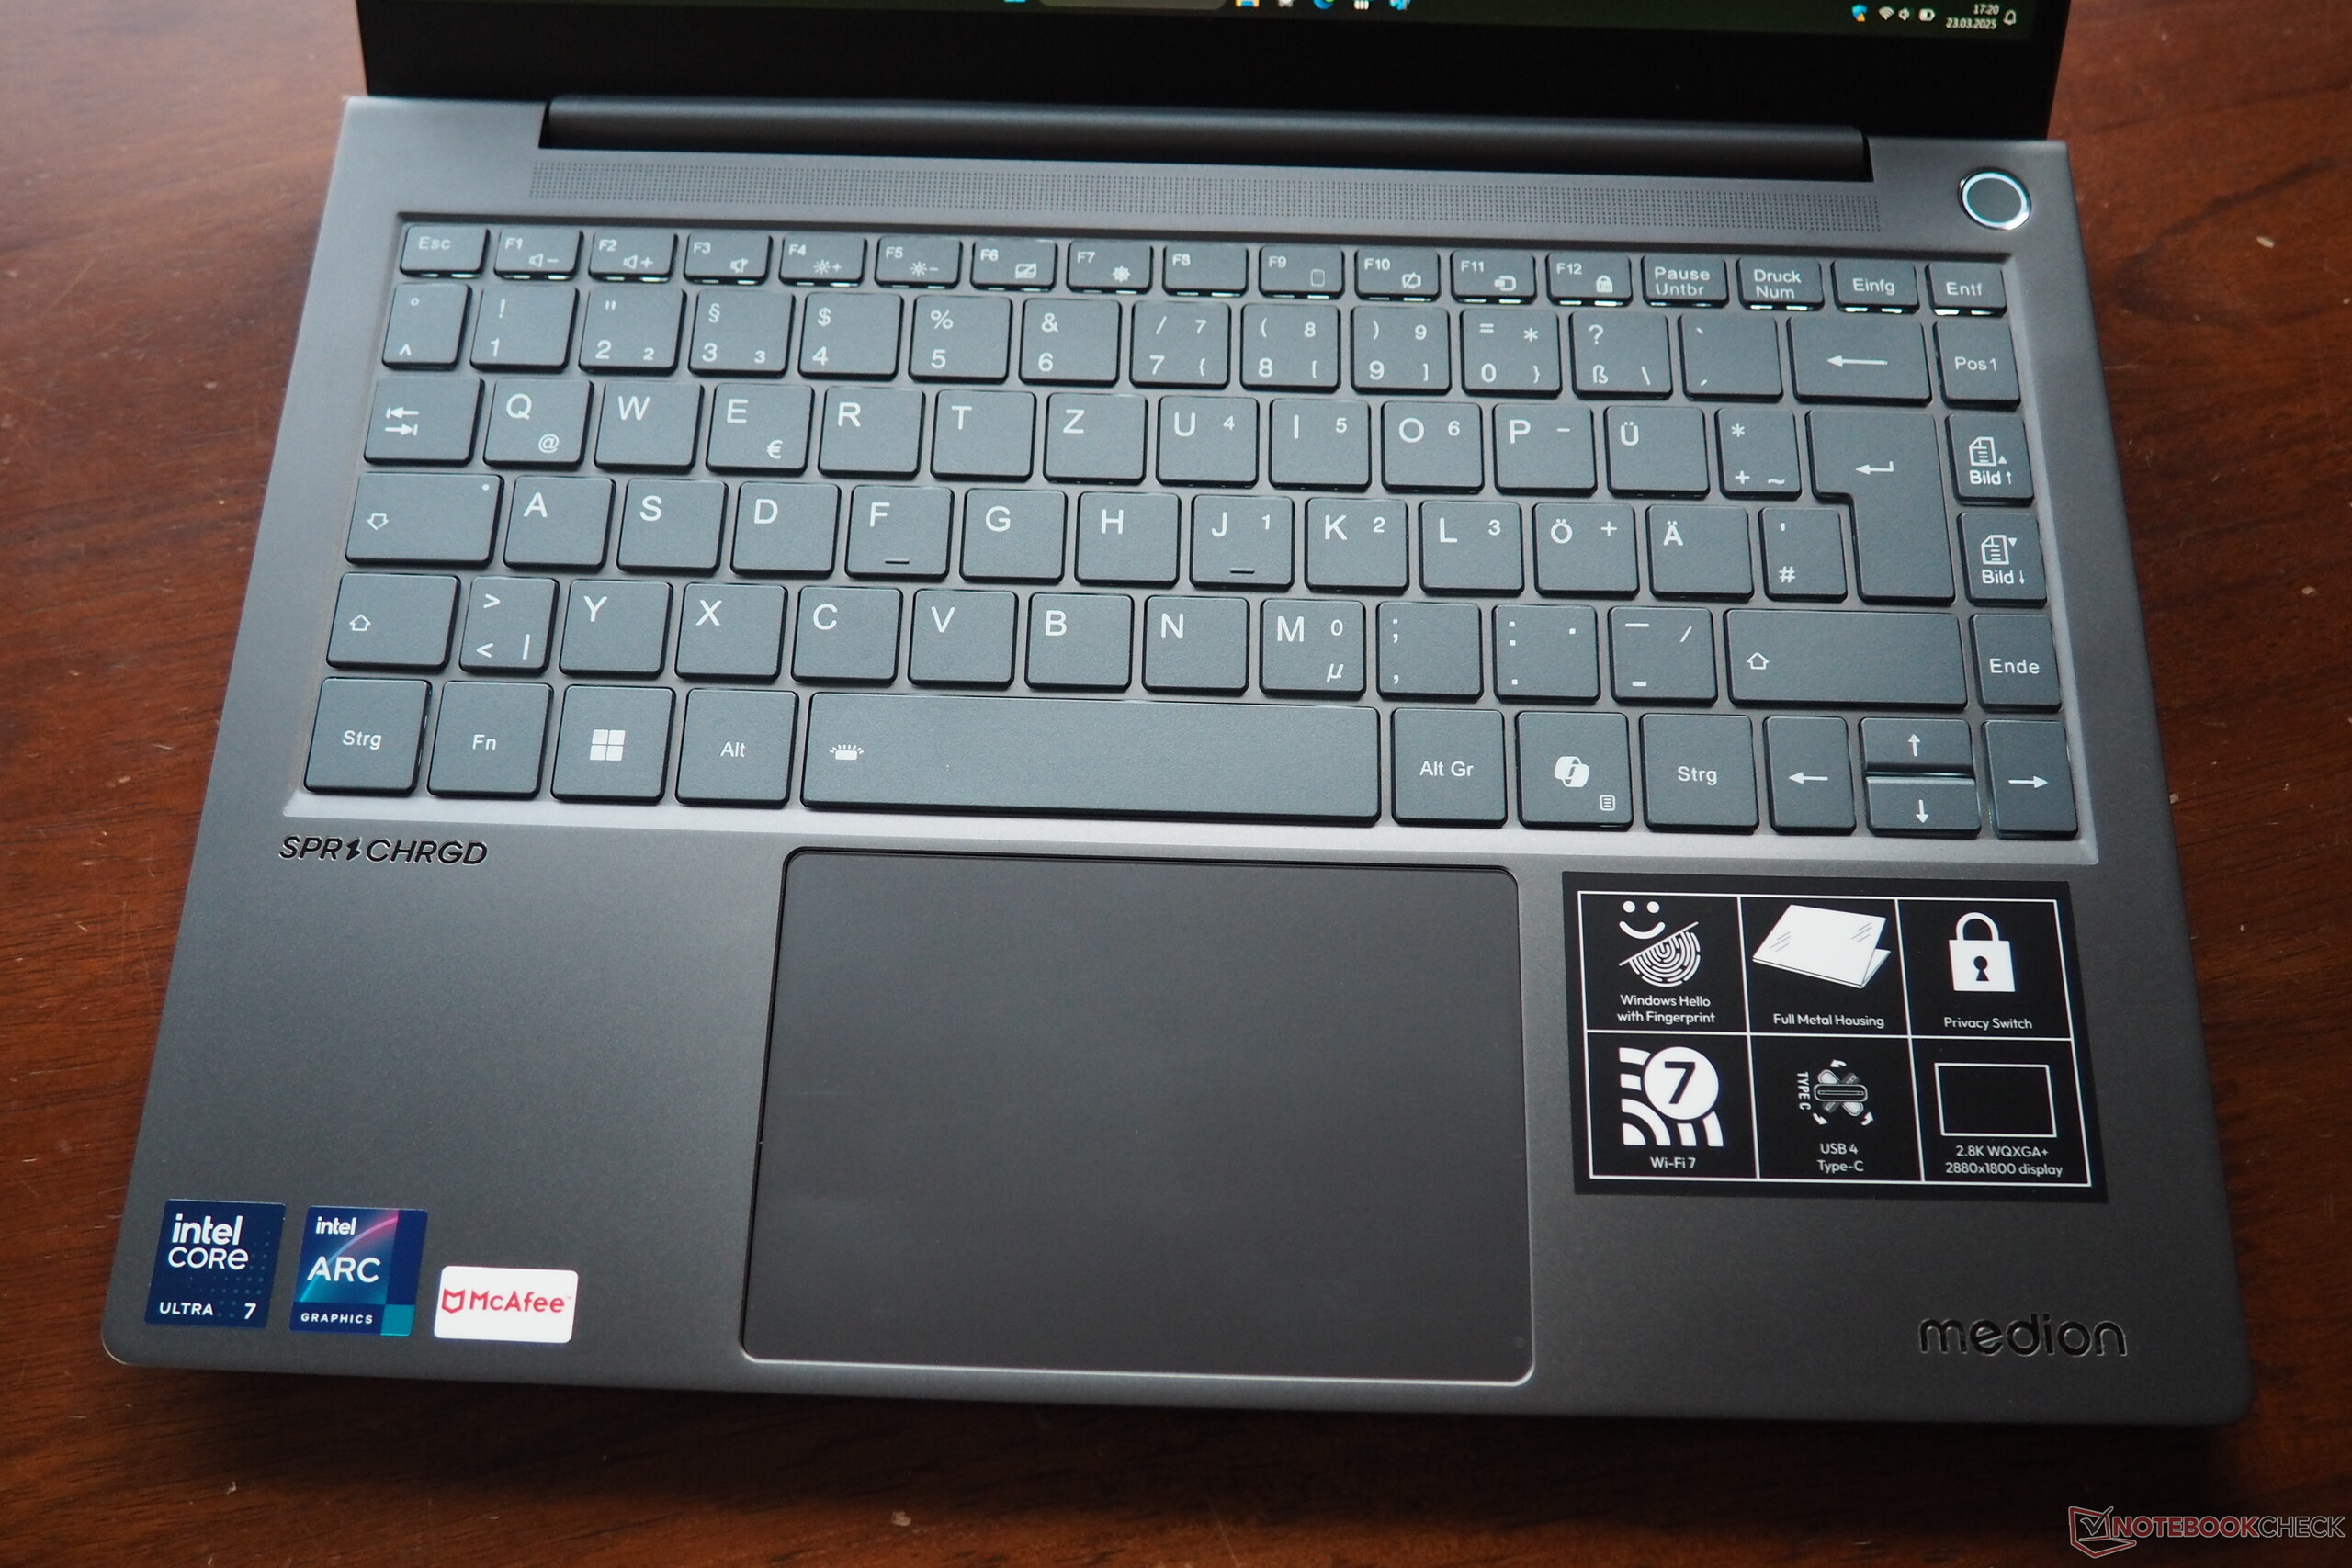
SPRCHRGD 14 S2 jest wyposażony w klawiaturę nadającą się do codziennego użytku z dość krótkim skokiem klawiszy. Jej układ jest prawdopodobnie kwestią gustu, biorąc pod uwagę układ Mediona wzdłuż prawej krawędzi i wymaga pewnego zapoznania. Na pokładzie znajduje się białe podświetlenie (dwa poziomy), dzięki czemu można korzystać z urządzenia w ciemnym otoczeniu.
Touchpad ma wymiary 11,5 x 7,7 cm, co jest więcej niż wystarczające dla 14-calowego urządzenia. Wymiana myszy jest przyjemna i gładka i ma mocne (prawie zbyt mocne) obszary kliknięć.

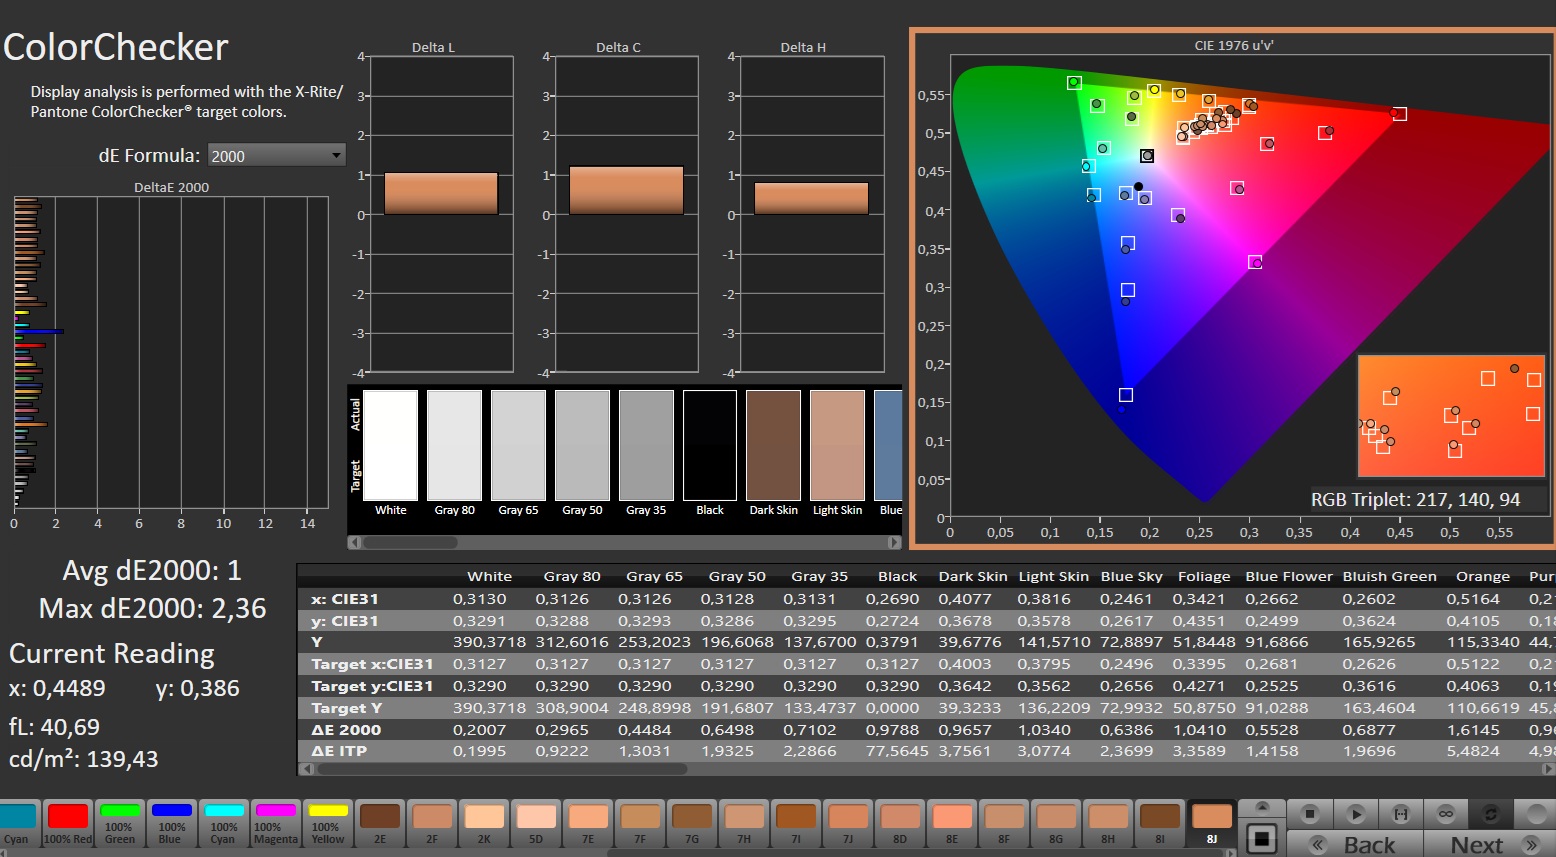
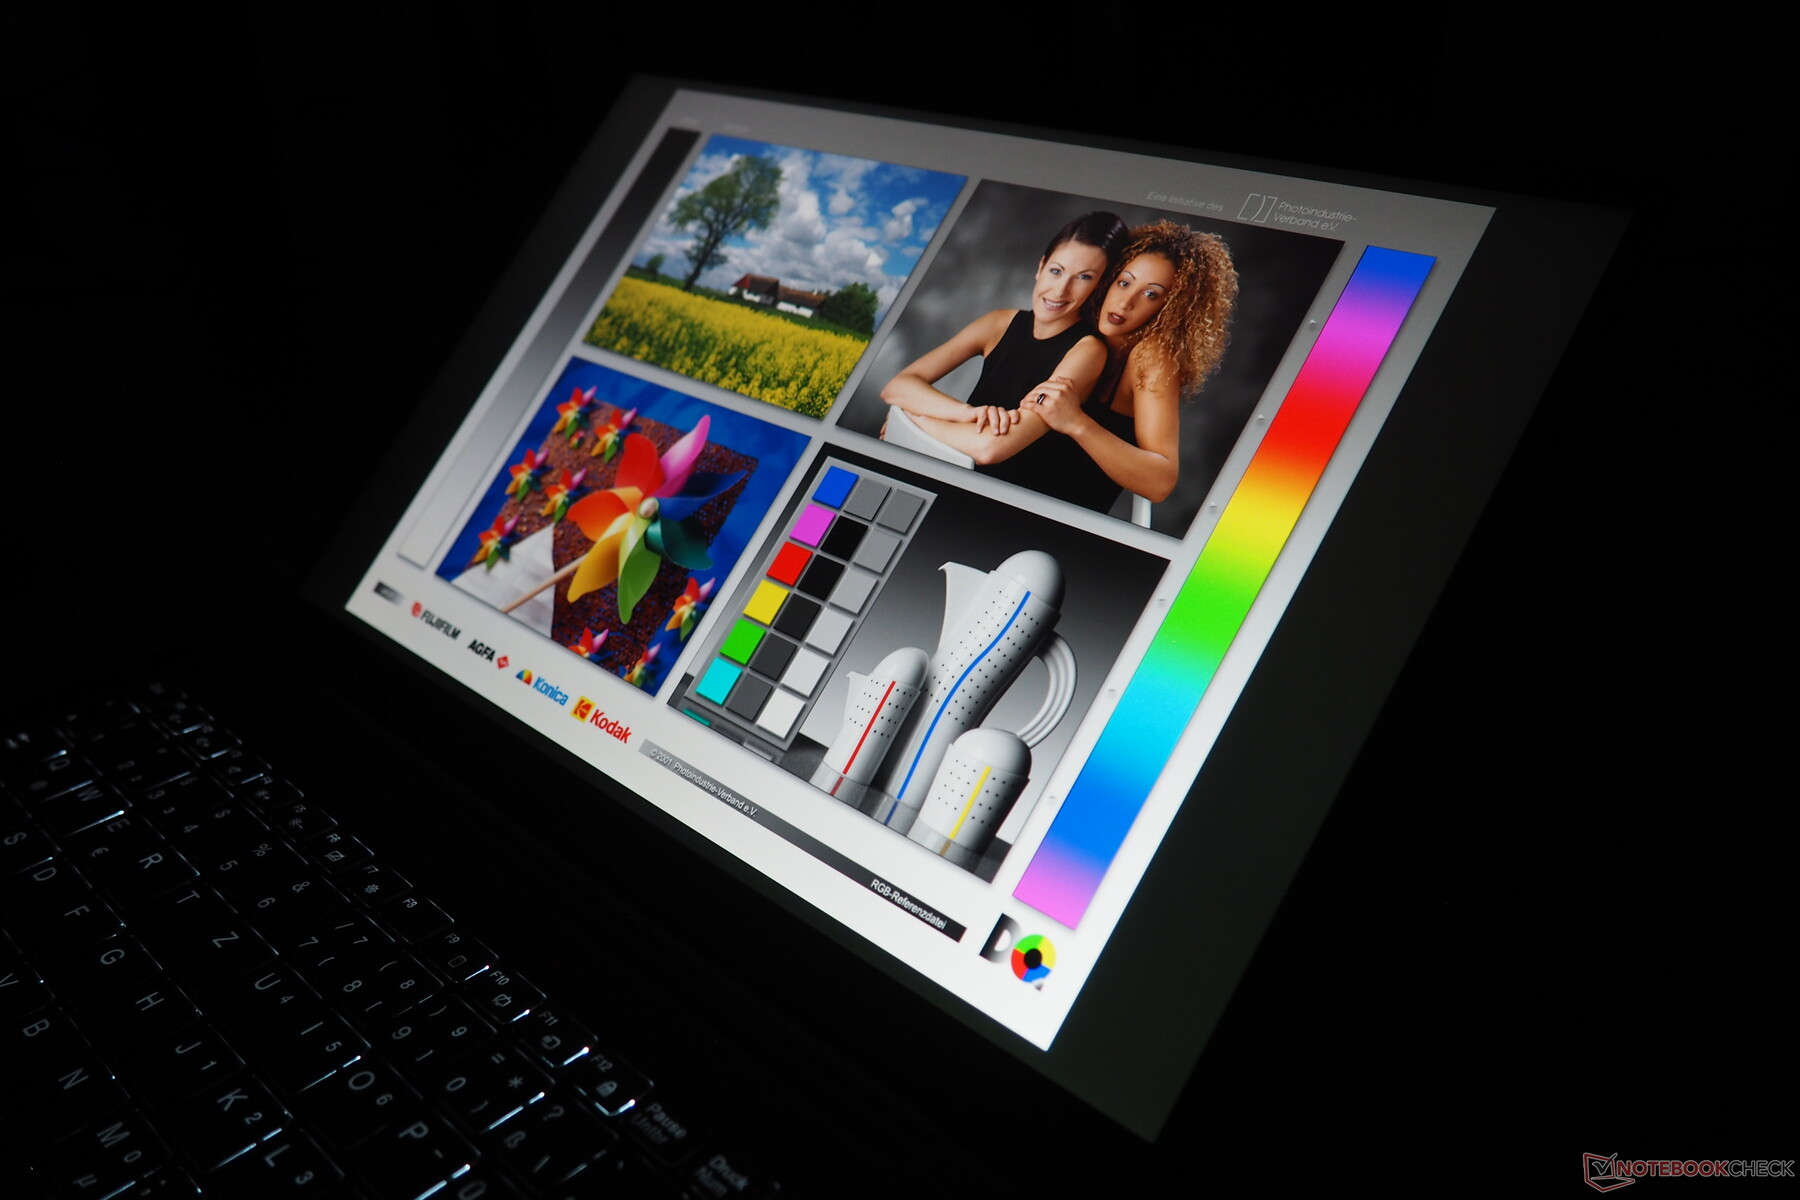
Wyświetlacz
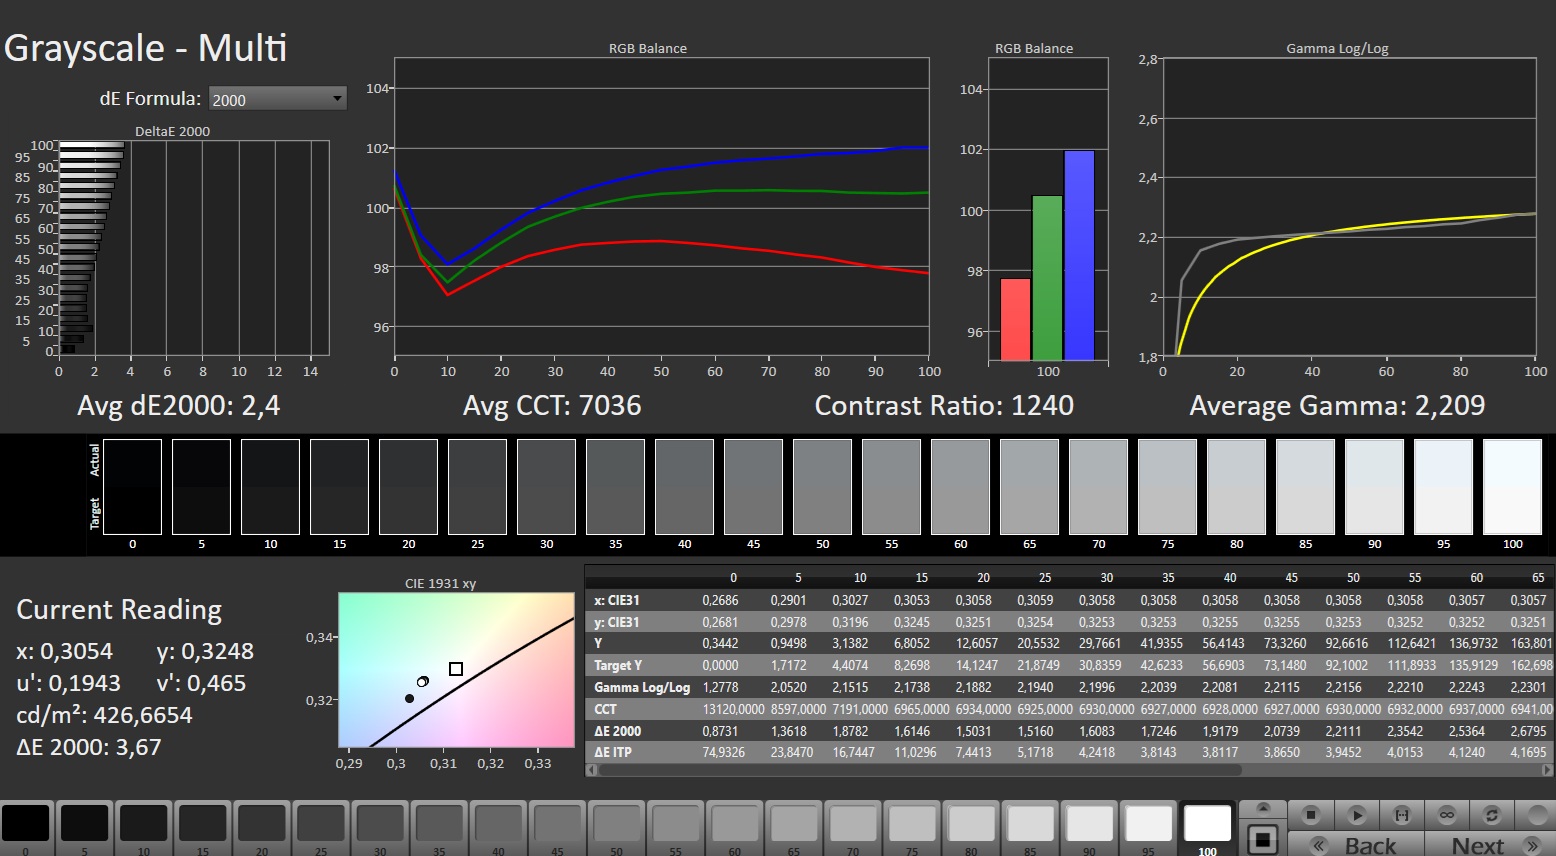
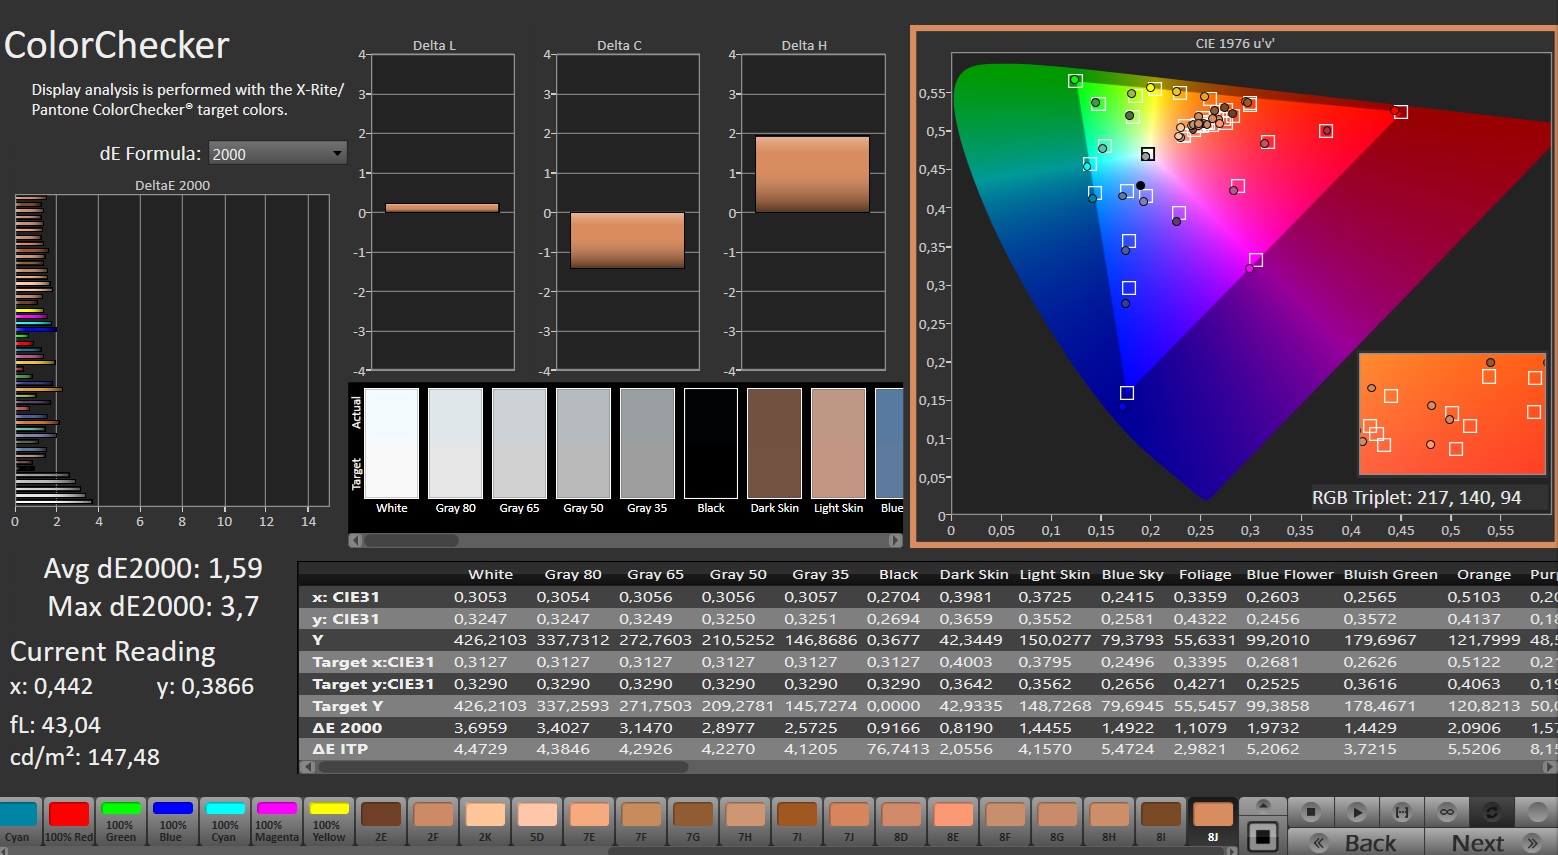
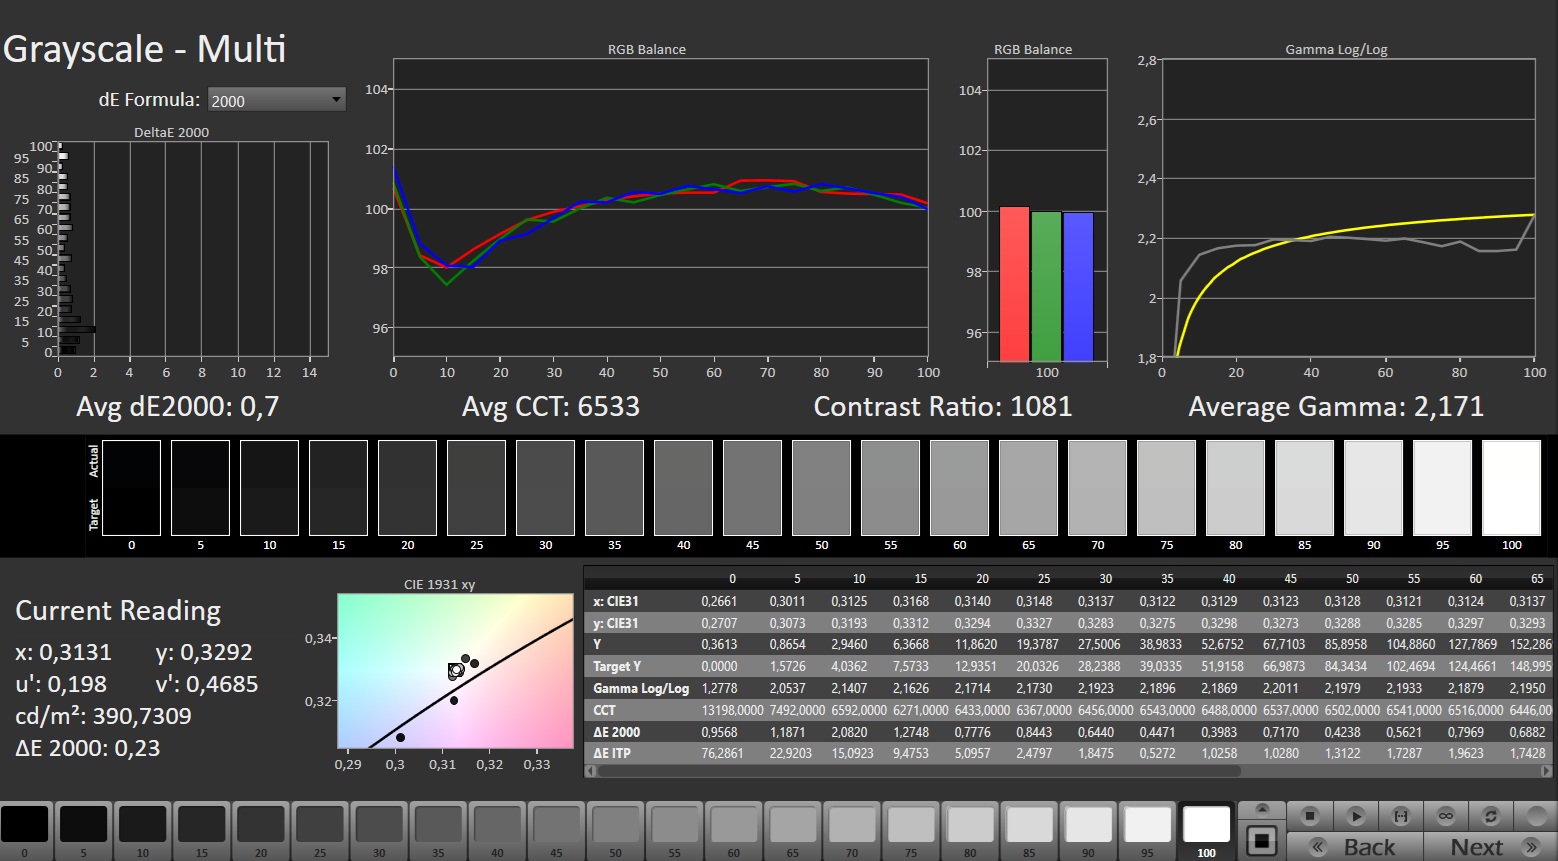
Jego wyświetlacz jest bardzo podobny do tego z SPRCHRGD 14 S1. Medion po raz kolejny zdecydował się na panel IPS o rozdzielczości 2880 x 1800 pikseli, co gwarantuje bardzo ostry obraz. 120 Hz to również plus, choć zmierzone przez nas czasy reakcji są dość słabe. Profesjonalni użytkownicy zwrócą większą uwagę na pokrycie przestrzeni barw: Tutaj 14-calowe urządzenie ma do zaoferowania nieco poniżej 100% sRGB i około 70% AdobeRGB lub DCI-P3. Dokładność odwzorowania kolorów jest dobra już po wyjęciu z pudełka, więc kalibracja nie jest konieczna, z wyjątkiem korekty lekkiego niebieskiego odcienia. Przy nieco ponad 400:1, jego jasność jest w zupełności wystarczająca do dziwnych wypadów na zewnątrz. Pod względem kontrastu (około 1200:1) laptop Medion również nie wykazuje żadnych słabości - jeśli wykluczyć panele OLED niektórych konkurentów. Kąty widzenia są zgodne z typowym poziomem IPS.
| |||||||||||||||||||||||||
rozświetlenie: 94 %
na akumulatorze: 421 cd/m²
kontrast: 1203:1 (czerń: 0.35 cd/m²)
ΔE ColorChecker Calman: 1.59 | ∀{0.5-29.43 Ø4.78}
calibrated: 1
ΔE Greyscale Calman: 2.4 | ∀{0.09-98 Ø5}
71.2% AdobeRGB 1998 (Argyll 3D)
99.5% sRGB (Argyll 3D)
69.2% Display P3 (Argyll 3D)
Gamma: 2.209
CCT: 7036 K
| Medion SPRCHRGD 14 S2 CSOT MNE007ZA3-2, IPS, 2880x1800, 14", 120 Hz | Medion SPRCHRGD 14 S1 Elite CSOT MNE007ZA3-2, IPS, 2880x1800, 14", 120 Hz | Lenovo Yoga Slim 9 14ILL10 LEN140WQ+, OLED, 3840x2400, 14", 120 Hz | Asus Zenbook S 14 UX5406 ATNA40CU09-0, OLED, 2880x1800, 14", 120 Hz | Lenovo ThinkPad T14 Gen 5 21MC003QGE B140UAN02.1, IPS LED, 1920x1200, 14", 60 Hz | |
|---|---|---|---|---|---|
| Display | 3% | 22% | 23% | 5% | |
| Display P3 Coverage (%) | 69.2 | 74.4 8% | 97.7 41% | 99 43% | 74.6 8% |
| sRGB Coverage (%) | 99.5 | 99.7 0% | 100 1% | 100 1% | 100 1% |
| AdobeRGB 1998 Coverage (%) | 71.2 | 71.7 1% | 87.6 23% | 89.2 25% | 76.2 7% |
| Response Times | 14% | 96% | 97% | -66% | |
| Response Time Grey 50% / Grey 80% * (ms) | 31.2 ? | 28.4 ? 9% | 0.67 ? 98% | 0.7 ? 98% | 44 ? -41% |
| Response Time Black / White * (ms) | 15.2 ? | 12.4 ? 18% | 0.93 ? 94% | 0.71 ? 95% | 28.9 ? -90% |
| PWM Frequency (Hz) | 120 ? | 480 ? | |||
| PWM Amplitude * (%) | 70 | 26 | |||
| Screen | -12% | -45% | 20% | -1% | |
| Brightness middle (cd/m²) | 421 | 395 -6% | 371.8 -12% | 374 -11% | 474 13% |
| Brightness (cd/m²) | 407 | 387 -5% | 382 -6% | 379 -7% | 439 8% |
| Brightness Distribution (%) | 94 | 90 -4% | 95 1% | 98 4% | 89 -5% |
| Black Level * (cd/m²) | 0.35 | 0.33 6% | 0.22 37% | ||
| Contrast (:1) | 1203 | 1197 0% | 2155 79% | ||
| Colorchecker dE 2000 * | 1.59 | 1.86 -17% | 4.32 -172% | 1 37% | 2.2 -38% |
| Colorchecker dE 2000 max. * | 3.7 | 3.48 6% | 6.7 -81% | 2.2 41% | 4.4 -19% |
| Colorchecker dE 2000 calibrated * | 1 | 1.86 -86% | 2.18 -118% | 1.6 -60% | |
| Greyscale dE 2000 * | 2.4 | 2.52 -5% | 0.6 75% | 1.1 54% | 3 -25% |
| Gamma | 2.209 100% | 2.35 94% | 2.2 100% | 2.15 102% | 2.31 95% |
| CCT | 7036 92% | 6999 93% | 6437 101% | 6549 99% | 6880 94% |
| Całkowita średnia (program / ustawienia) | 2% /
-5% | 24% /
-5% | 47% /
35% | -21% /
-9% |
* ... im mniej tym lepiej

Wyświetl czasy reakcji
| ↔ Czas reakcji od czerni do bieli | ||
|---|---|---|
| 15.2 ms ... wzrost ↗ i spadek ↘ łącznie | ↗ 5.8 ms wzrost | 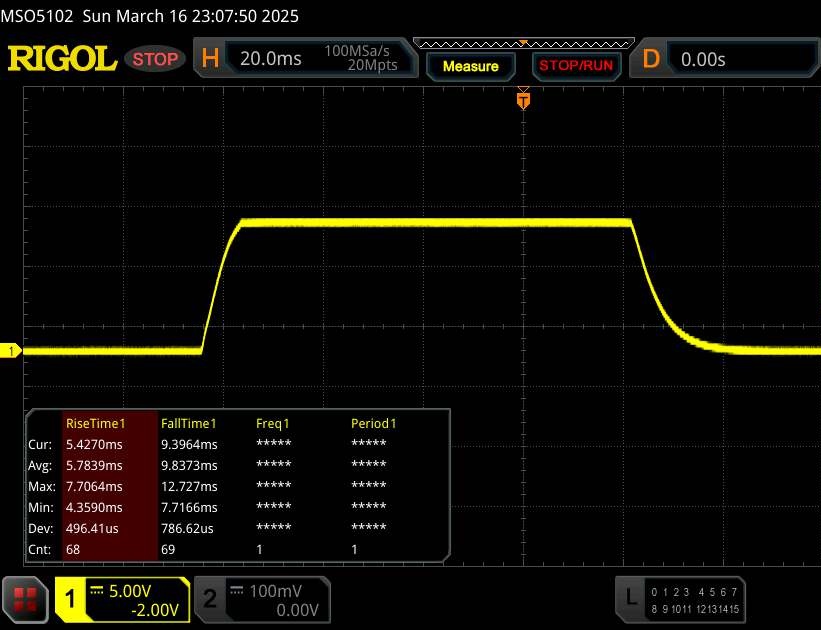 |
| ↘ 9.4 ms upadek | ||
| W naszych testach ekran wykazuje dobry współczynnik reakcji, ale może być zbyt wolny dla graczy rywalizujących ze sobą. Dla porównania, wszystkie testowane urządzenia wahają się od 0.1 (minimum) do 240 (maksimum) ms. » 35 % wszystkich urządzeń jest lepszych. Oznacza to, że zmierzony czas reakcji jest lepszy od średniej wszystkich testowanych urządzeń (20.2 ms). | ||
| ↔ Czas reakcji 50% szarości do 80% szarości | ||
| 31.2 ms ... wzrost ↗ i spadek ↘ łącznie | ↗ 15 ms wzrost | 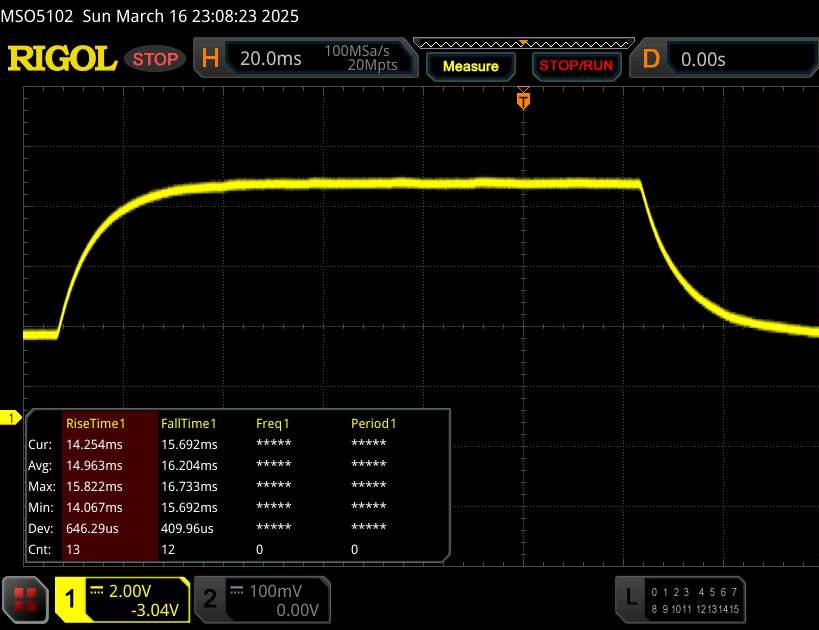 |
| ↘ 16.2 ms upadek | ||
| W naszych testach ekran wykazuje powolne tempo reakcji, co będzie niezadowalające dla graczy. Dla porównania, wszystkie testowane urządzenia wahają się od 0.165 (minimum) do 636 (maksimum) ms. » 41 % wszystkich urządzeń jest lepszych. Oznacza to, że zmierzony czas reakcji jest zbliżony do średniej wszystkich testowanych urządzeń (31.6 ms). | ||
Migotanie ekranu / PWM (modulacja szerokości impulsu)
| Migotanie ekranu/nie wykryto PWM |  | ||
Dla porównania: 53 % wszystkich testowanych urządzeń nie używa PWM do przyciemniania wyświetlacza. Jeśli wykryto PWM, zmierzono średnio 8121 (minimum: 5 - maksimum: 343500) Hz. | |||
Wydajność
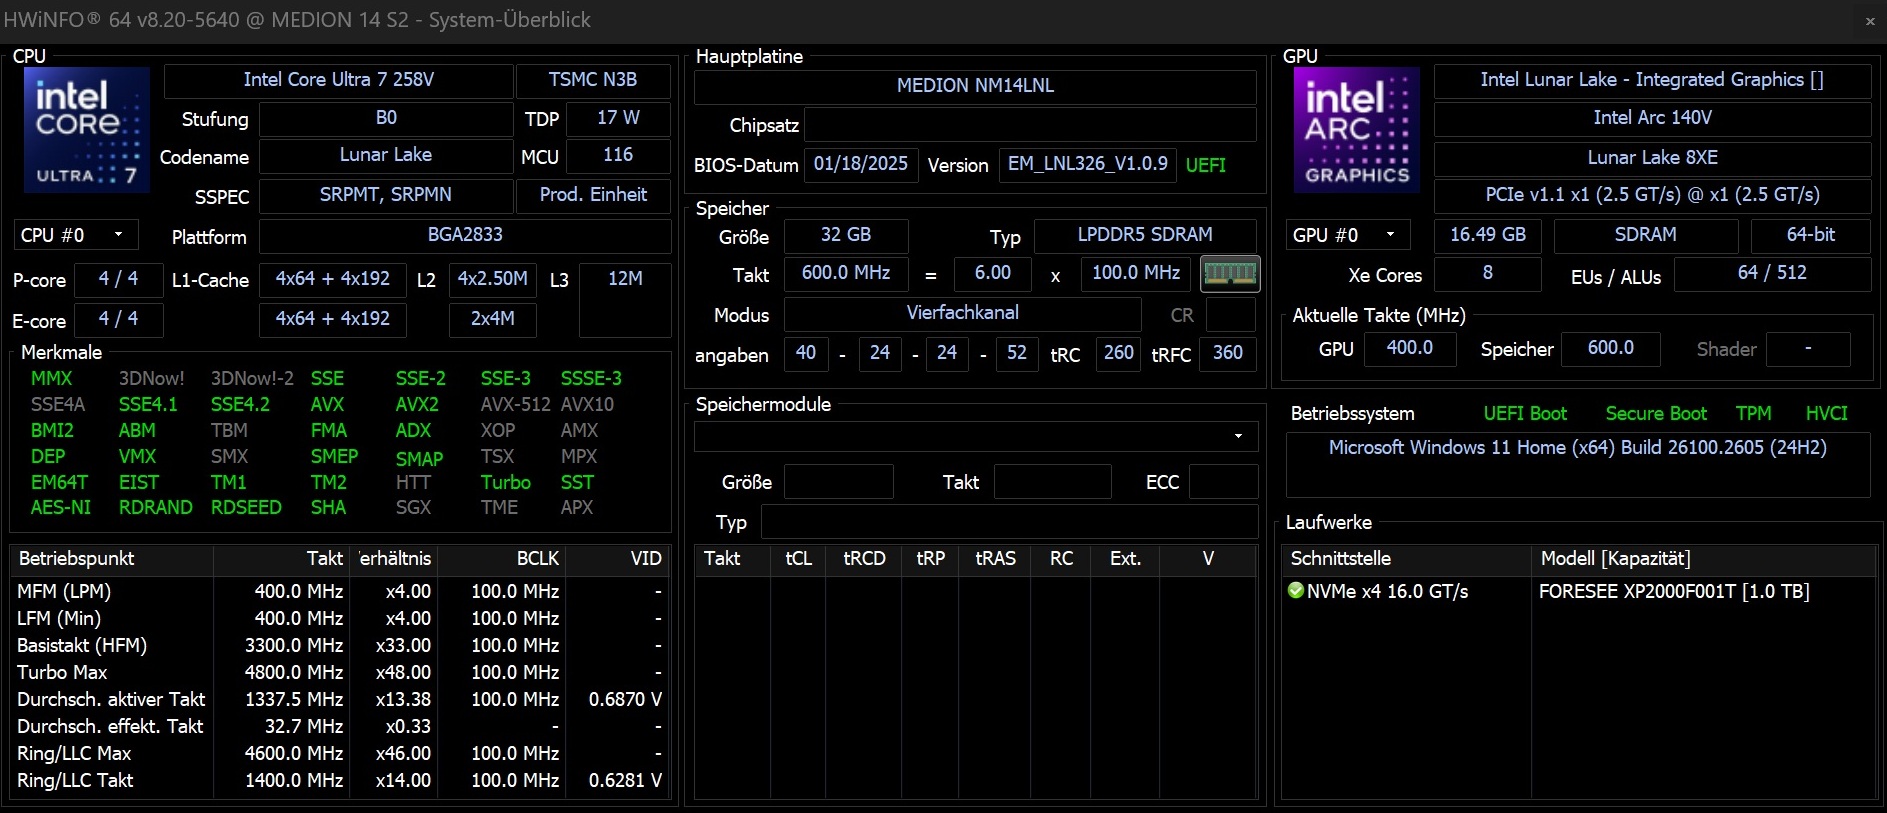
W obecnej konfiguracji SPRCHRGD 14 S2 plasuje się w średniej klasie subnotebooków. Podczas gdy dysk SSD (14-calowy model ma gniazdo M.2-2280) można wymienić, pamięci RAM nie można rozszerzyć.
Warunki testowania
Co ciekawe, Medion nie używa narzędzia producenta do kontrolowania trybu pracy laptopa, więc procesor jest zawsze ustawiony na 30 watów (PL1) i 37 watów (PL2).
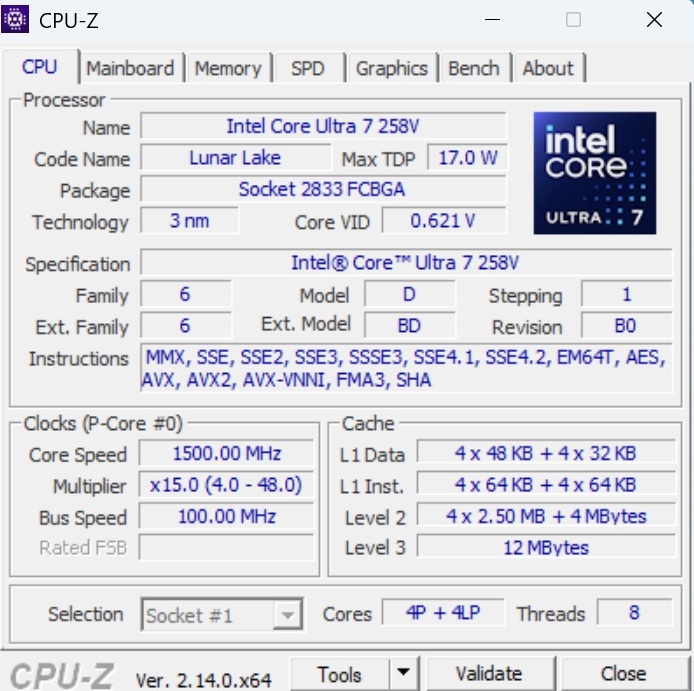
Procesor
The Core Ultra 7 258V to dość oszczędny model z generacji Lunar Lake (3 nm), zawierający cztery wydajne rdzenie i cztery wydajne rdzenie. Nasz test porównawczy postawił SPRCHRGD 14 S2 na równi z innymi laptopami opartymi na 258V, chociaż nie mógł osiągnąć poziomu Ryzen 7 8840Una przykład. Procesor Qualcomm poprzednika (Snapdragon X Elite X1E-78-100) naprawdę się rozkręcił po zimnym starcie, ale - jak widać bardzo wyraźnie w pętli Cinebench - z czasem stracił dużo na wydajności, co może być również spowodowane jego układem chłodzenia.
Cinebench R15 Multi continuous test
* ... im mniej tym lepiej
AIDA64: FP32 Ray-Trace | FPU Julia | CPU SHA3 | CPU Queen | FPU SinJulia | FPU Mandel | CPU AES | CPU ZLib | FP64 Ray-Trace | CPU PhotoWorxx
| Performance rating | |
| Lenovo ThinkPad T14 Gen 5 21MC003QGE | |
| Średnia w klasie Subnotebook | |
| Lenovo Yoga Slim 9 14ILL10 | |
| Medion SPRCHRGD 14 S2 | |
| Przeciętny Intel Core Ultra 7 258V | |
| Asus Zenbook S 14 UX5406 | |
| Medion SPRCHRGD 14 S1 Elite | |
| AIDA64 / FP32 Ray-Trace | |
| Lenovo ThinkPad T14 Gen 5 21MC003QGE | |
| Średnia w klasie Subnotebook (1135 - 32888, n=70, ostatnie 2 lata) | |
| Lenovo Yoga Slim 9 14ILL10 | |
| Medion SPRCHRGD 14 S2 | |
| Przeciętny Intel Core Ultra 7 258V (8454 - 12781, n=23) | |
| Asus Zenbook S 14 UX5406 | |
| Medion SPRCHRGD 14 S1 Elite | |
| AIDA64 / FPU Julia | |
| Lenovo ThinkPad T14 Gen 5 21MC003QGE | |
| Lenovo Yoga Slim 9 14ILL10 | |
| Średnia w klasie Subnotebook (5218 - 123315, n=70, ostatnie 2 lata) | |
| Medion SPRCHRGD 14 S2 | |
| Przeciętny Intel Core Ultra 7 258V (40875 - 63401, n=23) | |
| Asus Zenbook S 14 UX5406 | |
| Medion SPRCHRGD 14 S1 Elite | |
| AIDA64 / CPU SHA3 | |
| Lenovo ThinkPad T14 Gen 5 21MC003QGE | |
| Średnia w klasie Subnotebook (444 - 5287, n=70, ostatnie 2 lata) | |
| Medion SPRCHRGD 14 S1 Elite | |
| Lenovo Yoga Slim 9 14ILL10 | |
| Medion SPRCHRGD 14 S2 | |
| Przeciętny Intel Core Ultra 7 258V (1930 - 2817, n=23) | |
| Asus Zenbook S 14 UX5406 | |
| AIDA64 / CPU Queen | |
| Lenovo ThinkPad T14 Gen 5 21MC003QGE | |
| Średnia w klasie Subnotebook (10579 - 115682, n=70, ostatnie 2 lata) | |
| Medion SPRCHRGD 14 S1 Elite | |
| Asus Zenbook S 14 UX5406 | |
| Medion SPRCHRGD 14 S2 | |
| Przeciętny Intel Core Ultra 7 258V (48816 - 49818, n=23) | |
| Lenovo Yoga Slim 9 14ILL10 | |
| AIDA64 / FPU SinJulia | |
| Lenovo ThinkPad T14 Gen 5 21MC003QGE | |
| Średnia w klasie Subnotebook (744 - 18418, n=70, ostatnie 2 lata) | |
| Lenovo Yoga Slim 9 14ILL10 | |
| Medion SPRCHRGD 14 S2 | |
| Przeciętny Intel Core Ultra 7 258V (3817 - 4440, n=23) | |
| Asus Zenbook S 14 UX5406 | |
| Medion SPRCHRGD 14 S1 Elite | |
| AIDA64 / FPU Mandel | |
| Lenovo ThinkPad T14 Gen 5 21MC003QGE | |
| Lenovo Yoga Slim 9 14ILL10 | |
| Średnia w klasie Subnotebook (3341 - 65433, n=70, ostatnie 2 lata) | |
| Medion SPRCHRGD 14 S2 | |
| Przeciętny Intel Core Ultra 7 258V (21670 - 33565, n=23) | |
| Asus Zenbook S 14 UX5406 | |
| Medion SPRCHRGD 14 S1 Elite | |
| AIDA64 / CPU AES | |
| Lenovo ThinkPad T14 Gen 5 21MC003QGE | |
| Średnia w klasie Subnotebook (638 - 161430, n=70, ostatnie 2 lata) | |
| Medion SPRCHRGD 14 S1 Elite | |
| Medion SPRCHRGD 14 S2 | |
| Przeciętny Intel Core Ultra 7 258V (30957 - 40753, n=23) | |
| Lenovo Yoga Slim 9 14ILL10 | |
| Asus Zenbook S 14 UX5406 | |
| AIDA64 / CPU ZLib | |
| Lenovo ThinkPad T14 Gen 5 21MC003QGE | |
| Średnia w klasie Subnotebook (164.9 - 1379, n=70, ostatnie 2 lata) | |
| Medion SPRCHRGD 14 S1 Elite | |
| Lenovo Yoga Slim 9 14ILL10 | |
| Medion SPRCHRGD 14 S2 | |
| Przeciętny Intel Core Ultra 7 258V (422 - 632, n=23) | |
| Asus Zenbook S 14 UX5406 | |
| AIDA64 / FP64 Ray-Trace | |
| Lenovo ThinkPad T14 Gen 5 21MC003QGE | |
| Średnia w klasie Subnotebook (610 - 17495, n=70, ostatnie 2 lata) | |
| Lenovo Yoga Slim 9 14ILL10 | |
| Medion SPRCHRGD 14 S2 | |
| Przeciętny Intel Core Ultra 7 258V (4258 - 6930, n=23) | |
| Asus Zenbook S 14 UX5406 | |
| Medion SPRCHRGD 14 S1 Elite | |
| AIDA64 / CPU PhotoWorxx | |
| Lenovo Yoga Slim 9 14ILL10 | |
| Medion SPRCHRGD 14 S2 | |
| Przeciętny Intel Core Ultra 7 258V (44223 - 55458, n=23) | |
| Asus Zenbook S 14 UX5406 | |
| Średnia w klasie Subnotebook (6569 - 64588, n=70, ostatnie 2 lata) | |
| Lenovo ThinkPad T14 Gen 5 21MC003QGE | |
| Medion SPRCHRGD 14 S1 Elite | |
Wydajność systemu
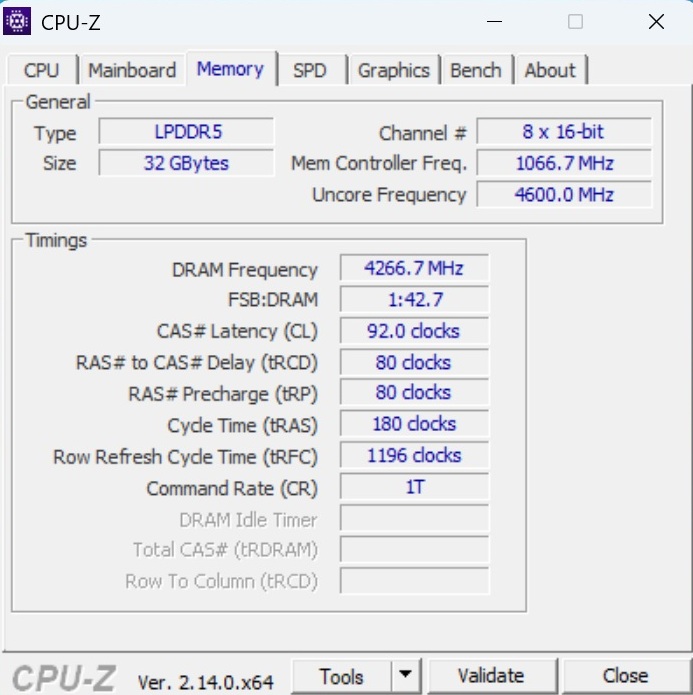
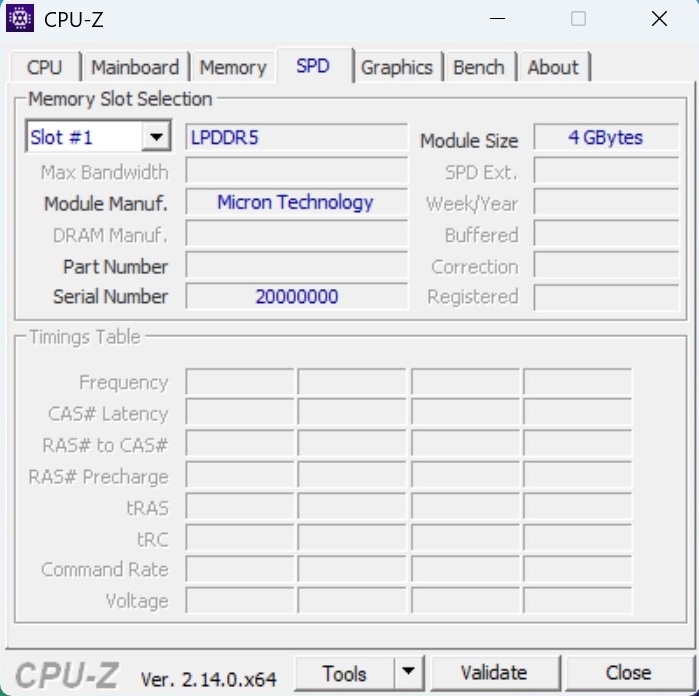
Jeśli chodzi o wydajność systemu, wersja Intela również nie wykazała żadnych odchyleń podczas naszych testów, a jej wyniki były zgodne z oczekiwaniami. Na pochwałę zasługuje zwłaszcza szybka pamięć RAM DDR5.
CrossMark: Overall | Productivity | Creativity | Responsiveness
WebXPRT 3: Overall
WebXPRT 4: Overall
Mozilla Kraken 1.1: Total
| PCMark 10 / Score | |
| Przeciętny Intel Core Ultra 7 258V, Intel Arc Graphics 140V (6265 - 7314, n=22) | |
| Asus Zenbook S 14 UX5406 | |
| Lenovo ThinkPad T14 Gen 5 21MC003QGE | |
| Średnia w klasie Subnotebook (4920 - 7883, n=57, ostatnie 2 lata) | |
| Medion SPRCHRGD 14 S2 | |
| Lenovo Yoga Slim 9 14ILL10 | |
| PCMark 10 / Essentials | |
| Lenovo ThinkPad T14 Gen 5 21MC003QGE | |
| Średnia w klasie Subnotebook (8552 - 11406, n=57, ostatnie 2 lata) | |
| Przeciętny Intel Core Ultra 7 258V, Intel Arc Graphics 140V (9295 - 11467, n=22) | |
| Lenovo Yoga Slim 9 14ILL10 | |
| Medion SPRCHRGD 14 S2 | |
| Asus Zenbook S 14 UX5406 | |
| PCMark 10 / Productivity | |
| Lenovo ThinkPad T14 Gen 5 21MC003QGE | |
| Asus Zenbook S 14 UX5406 | |
| Średnia w klasie Subnotebook (5435 - 10842, n=57, ostatnie 2 lata) | |
| Przeciętny Intel Core Ultra 7 258V, Intel Arc Graphics 140V (7357 - 9619, n=22) | |
| Medion SPRCHRGD 14 S2 | |
| Lenovo Yoga Slim 9 14ILL10 | |
| PCMark 10 / Digital Content Creation | |
| Lenovo Yoga Slim 9 14ILL10 | |
| Przeciętny Intel Core Ultra 7 258V, Intel Arc Graphics 140V (8914 - 10308, n=22) | |
| Asus Zenbook S 14 UX5406 | |
| Medion SPRCHRGD 14 S2 | |
| Średnia w klasie Subnotebook (5722 - 12442, n=57, ostatnie 2 lata) | |
| Lenovo ThinkPad T14 Gen 5 21MC003QGE | |
| CrossMark / Overall | |
| Lenovo ThinkPad T14 Gen 5 21MC003QGE | |
| Lenovo Yoga Slim 9 14ILL10 | |
| Przeciętny Intel Core Ultra 7 258V, Intel Arc Graphics 140V (1551 - 1742, n=21) | |
| Asus Zenbook S 14 UX5406 | |
| Średnia w klasie Subnotebook (365 - 2038, n=71, ostatnie 2 lata) | |
| Medion SPRCHRGD 14 S1 Elite | |
| CrossMark / Productivity | |
| Lenovo ThinkPad T14 Gen 5 21MC003QGE | |
| Lenovo Yoga Slim 9 14ILL10 | |
| Przeciętny Intel Core Ultra 7 258V, Intel Arc Graphics 140V (1479 - 1684, n=21) | |
| Asus Zenbook S 14 UX5406 | |
| Średnia w klasie Subnotebook (364 - 1918, n=71, ostatnie 2 lata) | |
| Medion SPRCHRGD 14 S1 Elite | |
| CrossMark / Creativity | |
| Lenovo ThinkPad T14 Gen 5 21MC003QGE | |
| Lenovo Yoga Slim 9 14ILL10 | |
| Przeciętny Intel Core Ultra 7 258V, Intel Arc Graphics 140V (1727 - 1977, n=21) | |
| Asus Zenbook S 14 UX5406 | |
| Średnia w klasie Subnotebook (372 - 2396, n=71, ostatnie 2 lata) | |
| Medion SPRCHRGD 14 S1 Elite | |
| CrossMark / Responsiveness | |
| Medion SPRCHRGD 14 S1 Elite | |
| Lenovo ThinkPad T14 Gen 5 21MC003QGE | |
| Średnia w klasie Subnotebook (312 - 1889, n=71, ostatnie 2 lata) | |
| Lenovo Yoga Slim 9 14ILL10 | |
| Przeciętny Intel Core Ultra 7 258V, Intel Arc Graphics 140V (1246 - 1411, n=21) | |
| Asus Zenbook S 14 UX5406 | |
| WebXPRT 3 / Overall | |
| Medion SPRCHRGD 14 S1 Elite | |
| Średnia w klasie Subnotebook (156 - 482, n=69, ostatnie 2 lata) | |
| Lenovo Yoga Slim 9 14ILL10 | |
| Lenovo ThinkPad T14 Gen 5 21MC003QGE | |
| Przeciętny Intel Core Ultra 7 258V, Intel Arc Graphics 140V (219 - 317, n=21) | |
| Asus Zenbook S 14 UX5406 | |
| Medion SPRCHRGD 14 S2 | |
| WebXPRT 4 / Overall | |
| Medion SPRCHRGD 14 S1 Elite | |
| Lenovo Yoga Slim 9 14ILL10 | |
| Przeciętny Intel Core Ultra 7 258V, Intel Arc Graphics 140V (199.5 - 291, n=21) | |
| Średnia w klasie Subnotebook (132 - 348, n=71, ostatnie 2 lata) | |
| Asus Zenbook S 14 UX5406 | |
| Lenovo ThinkPad T14 Gen 5 21MC003QGE | |
| Medion SPRCHRGD 14 S2 | |
| Mozilla Kraken 1.1 / Total | |
| Asus Zenbook S 14 UX5406 | |
| Lenovo ThinkPad T14 Gen 5 21MC003QGE | |
| Średnia w klasie Subnotebook (265 - 1104, n=75, ostatnie 2 lata) | |
| Medion SPRCHRGD 14 S2 | |
| Przeciętny Intel Core Ultra 7 258V, Intel Arc Graphics 140V (468 - 559, n=23) | |
| Lenovo Yoga Slim 9 14ILL10 | |
| Medion SPRCHRGD 14 S1 Elite | |
* ... im mniej tym lepiej
| PCMark 10 Score | 6683 pkt. | |
Pomoc | ||
| AIDA64 / Memory Copy | |
| Medion SPRCHRGD 14 S2 | |
| Asus Zenbook S 14 UX5406 | |
| Przeciętny Intel Core Ultra 7 258V (104408 - 114336, n=23) | |
| Lenovo Yoga Slim 9 14ILL10 | |
| Średnia w klasie Subnotebook (14554 - 109035, n=70, ostatnie 2 lata) | |
| Lenovo ThinkPad T14 Gen 5 21MC003QGE | |
| Medion SPRCHRGD 14 S1 Elite | |
| AIDA64 / Memory Read | |
| Medion SPRCHRGD 14 S1 Elite | |
| Medion SPRCHRGD 14 S2 | |
| Przeciętny Intel Core Ultra 7 258V (82846 - 89417, n=23) | |
| Lenovo Yoga Slim 9 14ILL10 | |
| Asus Zenbook S 14 UX5406 | |
| Średnia w klasie Subnotebook (15948 - 127174, n=70, ostatnie 2 lata) | |
| Lenovo ThinkPad T14 Gen 5 21MC003QGE | |
| AIDA64 / Memory Write | |
| Medion SPRCHRGD 14 S2 | |
| Lenovo Yoga Slim 9 14ILL10 | |
| Przeciętny Intel Core Ultra 7 258V (108842 - 117989, n=23) | |
| Asus Zenbook S 14 UX5406 | |
| Lenovo ThinkPad T14 Gen 5 21MC003QGE | |
| Średnia w klasie Subnotebook (15709 - 117898, n=70, ostatnie 2 lata) | |
| Medion SPRCHRGD 14 S1 Elite | |
| AIDA64 / Memory Latency | |
| Średnia w klasie Subnotebook (6.8 - 187.8, n=69, ostatnie 2 lata) | |
| Lenovo ThinkPad T14 Gen 5 21MC003QGE | |
| Asus Zenbook S 14 UX5406 | |
| Przeciętny Intel Core Ultra 7 258V (95 - 101.1, n=23) | |
| Medion SPRCHRGD 14 S2 | |
| Lenovo Yoga Slim 9 14ILL10 | |
| Medion SPRCHRGD 14 S1 Elite | |
* ... im mniej tym lepiej
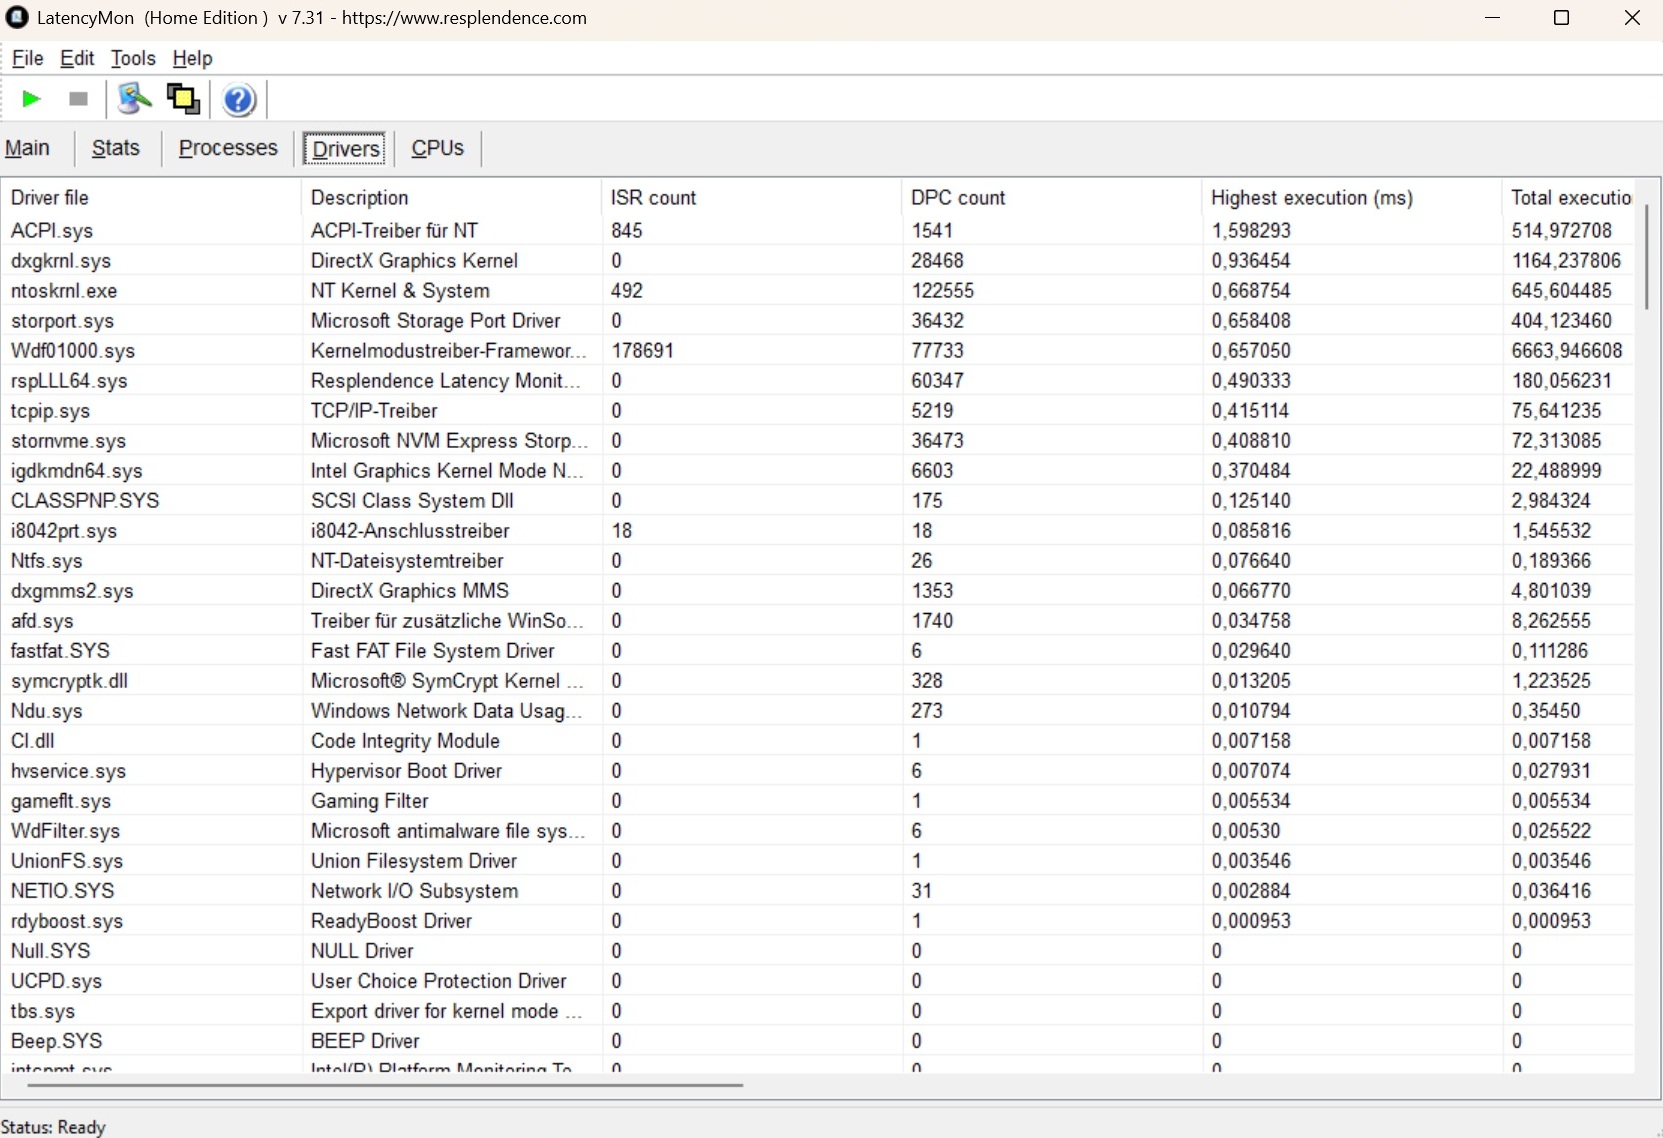
Opóźnienia DPC
Nie należy oczekiwać idealnych opóźnień od 14-calowego urządzenia. Podobnie jak w przypadku większości laptopów, jego wartości nie są najlepsze.

| DPC Latencies / LatencyMon - interrupt to process latency (max), Web, Youtube, Prime95 | |
| Asus Zenbook S 14 UX5406 | |
| Medion SPRCHRGD 14 S2 | |
| Lenovo Yoga Slim 9 14ILL10 | |
| Lenovo ThinkPad T14 Gen 5 21MC003QGE | |
* ... im mniej tym lepiej
Urządzenie pamięci masowej
Jego pamięć masowa jest nieco mieszana. Z jednej strony prędkość 1 TB dysku SSD od Foresee jest ograniczona, ale z drugiej strony nie występują już wahania wydajności SPRCHRGD 14 S1 (patrz pętla DiskSpd).

* ... im mniej tym lepiej
Reading continuous performance: DiskSpd Read Loop, Queue Depth 8
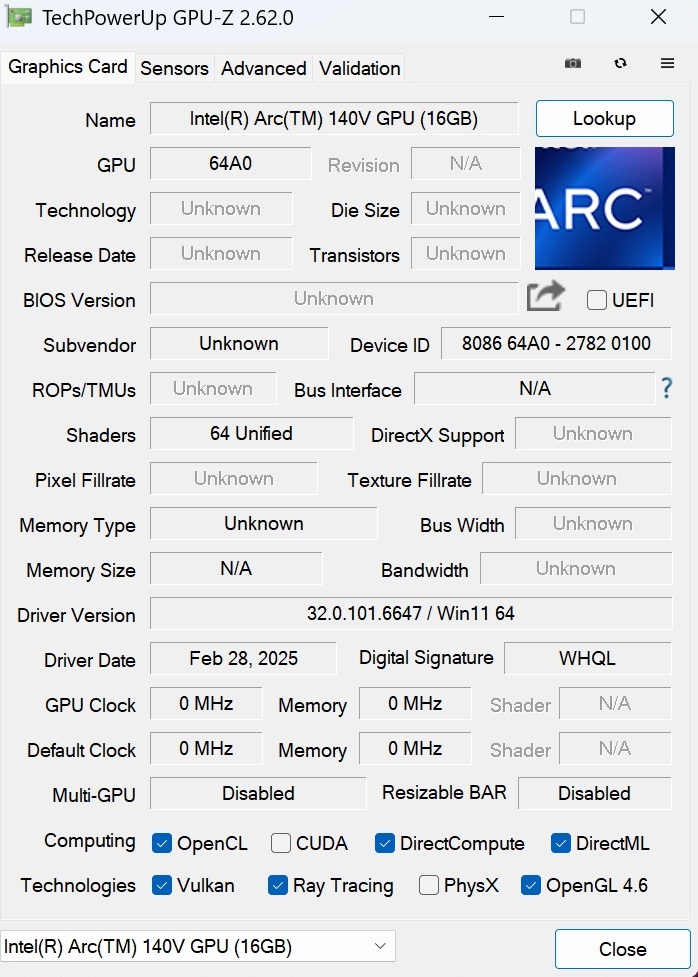
Karta graficzna
Jedną z najważniejszych cech SPRCHRGD 14 S2 jest ponadprzeciętna szybkość jego iGPU. Karta graficzna Arc Graphics 140V zainstalowany w Core Ultra 7 258V przewyższył poprzednią średnią wartość wszystkich odpowiadających mu urządzeń o prawie 10% w 3DMarks (przewaga była nieco mniejsza w grach). Jak wspomnieliśmy na początku, przeskok względem GPU Adreno z poprzedniego modelu jest wyjątkowo duży, więc entuzjaści 3D i gier powinni być zdecydowanie bardziej zadowoleni z wersji Intela.
| 3DMark 11 Performance | 12746 pkt. | |
| 3DMark Ice Storm Standard Score | 203344 pkt. | |
| 3DMark Cloud Gate Standard Score | 35866 pkt. | |
| 3DMark Fire Strike Score | 9063 pkt. | |
| 3DMark Time Spy Score | 4477 pkt. | |
Pomoc | ||
* ... im mniej tym lepiej
Wydajność w grach
Chociaż Arc 140V nie oferuje wystarczającej mocy do obsługi nowoczesnych lub wymagających gier, takich jak Stalker 2 i Indiana Jones (masowe użycie FSR może czasami pomóc), ale starsze lub mniej obciążające procesor tytuły, takie jak Civilization 7 można czasem uruchomić na średnich lub wysokich ustawieniach.
| Strange Brigade - 1920x1080 ultra AA:ultra AF:16 | |
| Medion SPRCHRGD 14 S2 | |
| Lenovo Yoga Slim 9 14ILL10 | |
| Przeciętny Intel Arc Graphics 140V (39 - 62.5, n=35) | |
| Asus Zenbook S 14 UX5406 | |
| Średnia w klasie Subnotebook (17.7 - 70.7, n=67, ostatnie 2 lata) | |
| Medion SPRCHRGD 14 S1 Elite | |
| low | med. | high | ultra | |
|---|---|---|---|---|
| GTA V (2015) | 161.1 | 154.2 | 69 | 28.7 |
| Dota 2 Reborn (2015) | 97.5 | 76.4 | 63.9 | 86 |
| Final Fantasy XV Benchmark (2018) | 97.1 | 51.3 | 37.2 | |
| X-Plane 11.11 (2018) | 43.6 | 34.6 | 28.5 | |
| Strange Brigade (2018) | 248 | 84.8 | 72.2 | 59.9 |
| Baldur's Gate 3 (2023) | 35.7 | 30.4 | 26.2 | 25.6 |
| Cyberpunk 2077 (2023) | 46.5 | 38.7 | 33.4 | 29.7 |
| Stalker 2 (2024) | 19 | 18.8 | 15.9 | |
| Indiana Jones and the Great Circle (2024) | 23.4 | 18.3 | ||
| Kingdom Come Deliverance 2 (2025) | 43.4 | 31.3 | 25.1 | |
| Civilization 7 (2025) | 142.2 | 68.7 | 39.5 |
Uzupełnia to stabilna, ciągła wydajność, jak pokazał nasz 30-minutowy test z Cyberpunk 2077 udowodnił.
Cyberpunk 2077 ultra FPS diagram
Emisje
Emisja hałasu
Podczas gdy SPRCHRGD 14 S2 pozostawał miły i cichy w trybie bezczynności na poziomie od 24 do 26 dB(A), dwa wentylatory obudowy znacznie zwiększyły głośność pod obciążeniem. 45 do 48 dB(A) nie tylko wyprzedziło starego 14 S1, ale było również najwyższą wartością w naszym polu testowym. Najpóźniej kilka profili wydajności miałoby tutaj sens.
Hałas
| luz |
| 24 / 25 / 26 dB |
| obciążenie |
| 45 / 48 dB |
 | ||
30 dB cichy 40 dB(A) słyszalny 50 dB(A) irytujący |
||
min: | ||
| Medion SPRCHRGD 14 S2 Core Ultra 7 258V, Arc 140V | Medion SPRCHRGD 14 S1 Elite SD X Elite X1E-78-100, Adreno X1-85 3.8 TFLOPS | Lenovo Yoga Slim 9 14ILL10 Core Ultra 7 258V, Arc 140V | Asus Zenbook S 14 UX5406 Core Ultra 7 258V, Arc 140V | Lenovo ThinkPad T14 Gen 5 21MC003QGE R7 8840U, Radeon 780M | |
|---|---|---|---|---|---|
| Noise | 9% | 6% | 16% | 11% | |
| wyłączone / środowisko * (dB) | 24 | 23 4% | 25.4 -6% | 23.7 1% | 23.1 4% |
| Idle Minimum * (dB) | 24 | 23 4% | 26 -8% | 23.7 1% | 23.1 4% |
| Idle Average * (dB) | 25 | 23 8% | 26 -4% | 23.7 5% | 23.1 8% |
| Idle Maximum * (dB) | 26 | 23 12% | 26 -0% | 23.7 9% | 23.1 11% |
| Load Average * (dB) | 45 | 35.8 20% | 30.5 32% | 23.1 49% | |
| Cyberpunk 2077 ultra * (dB) | 48 | 40.79 15% | 35.8 25% | 31.1 35% | 47.1 2% |
| Load Maximum * (dB) | 48 | 41.72 13% | 39.6 17% | 33.6 30% | 47.2 2% |
* ... im mniej tym lepiej
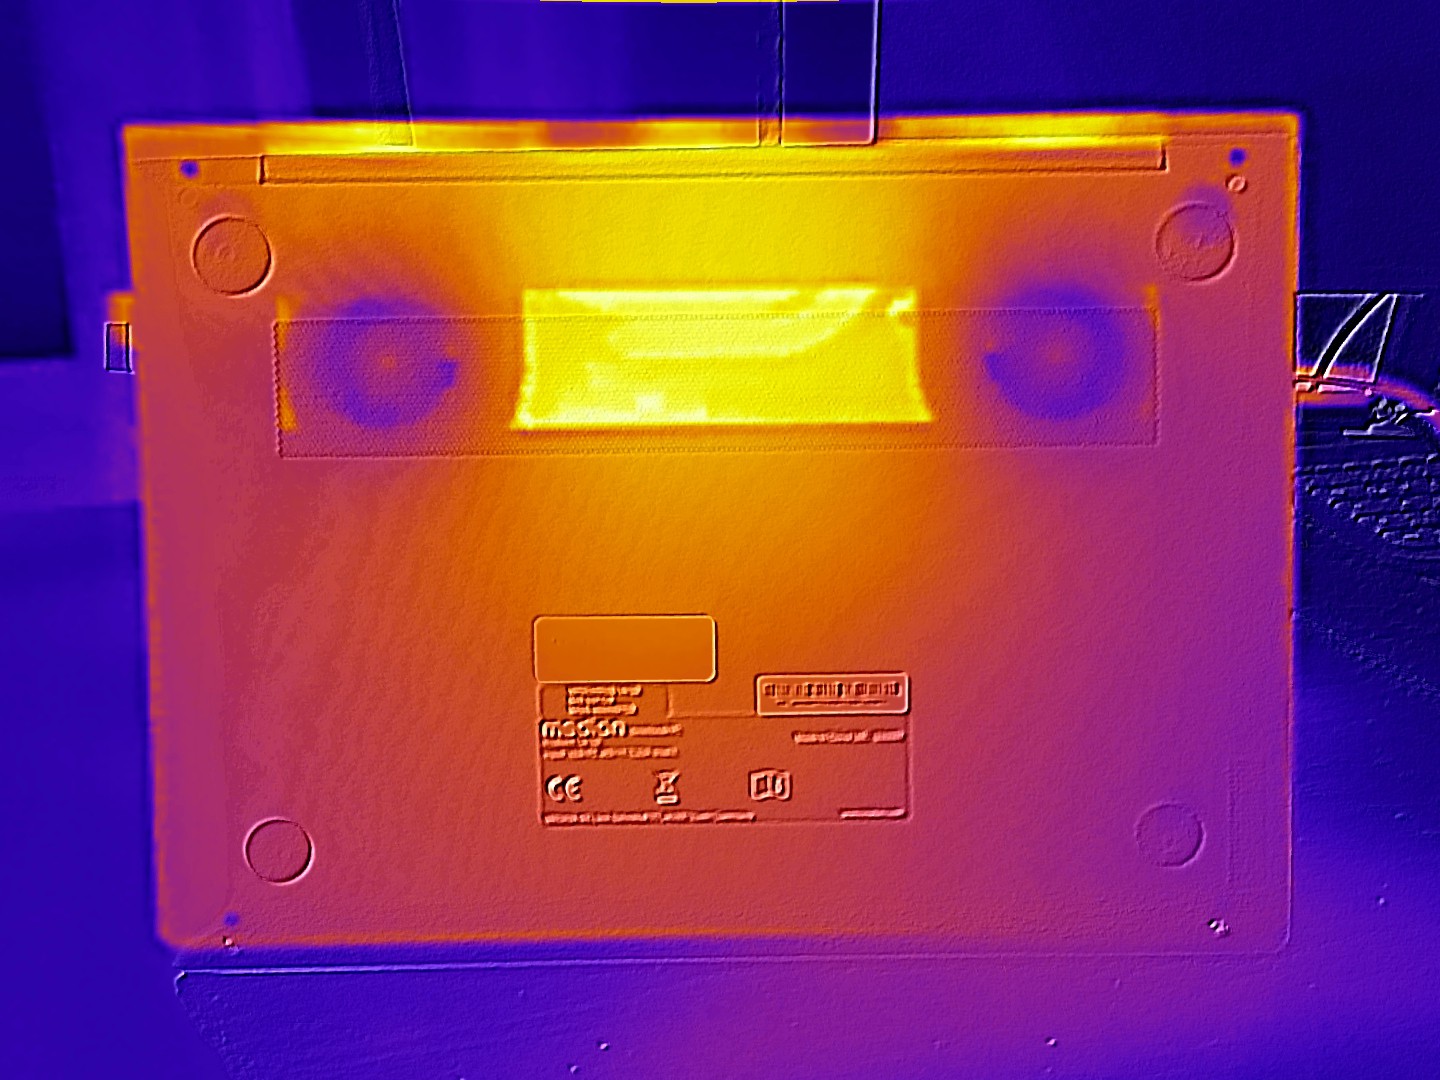
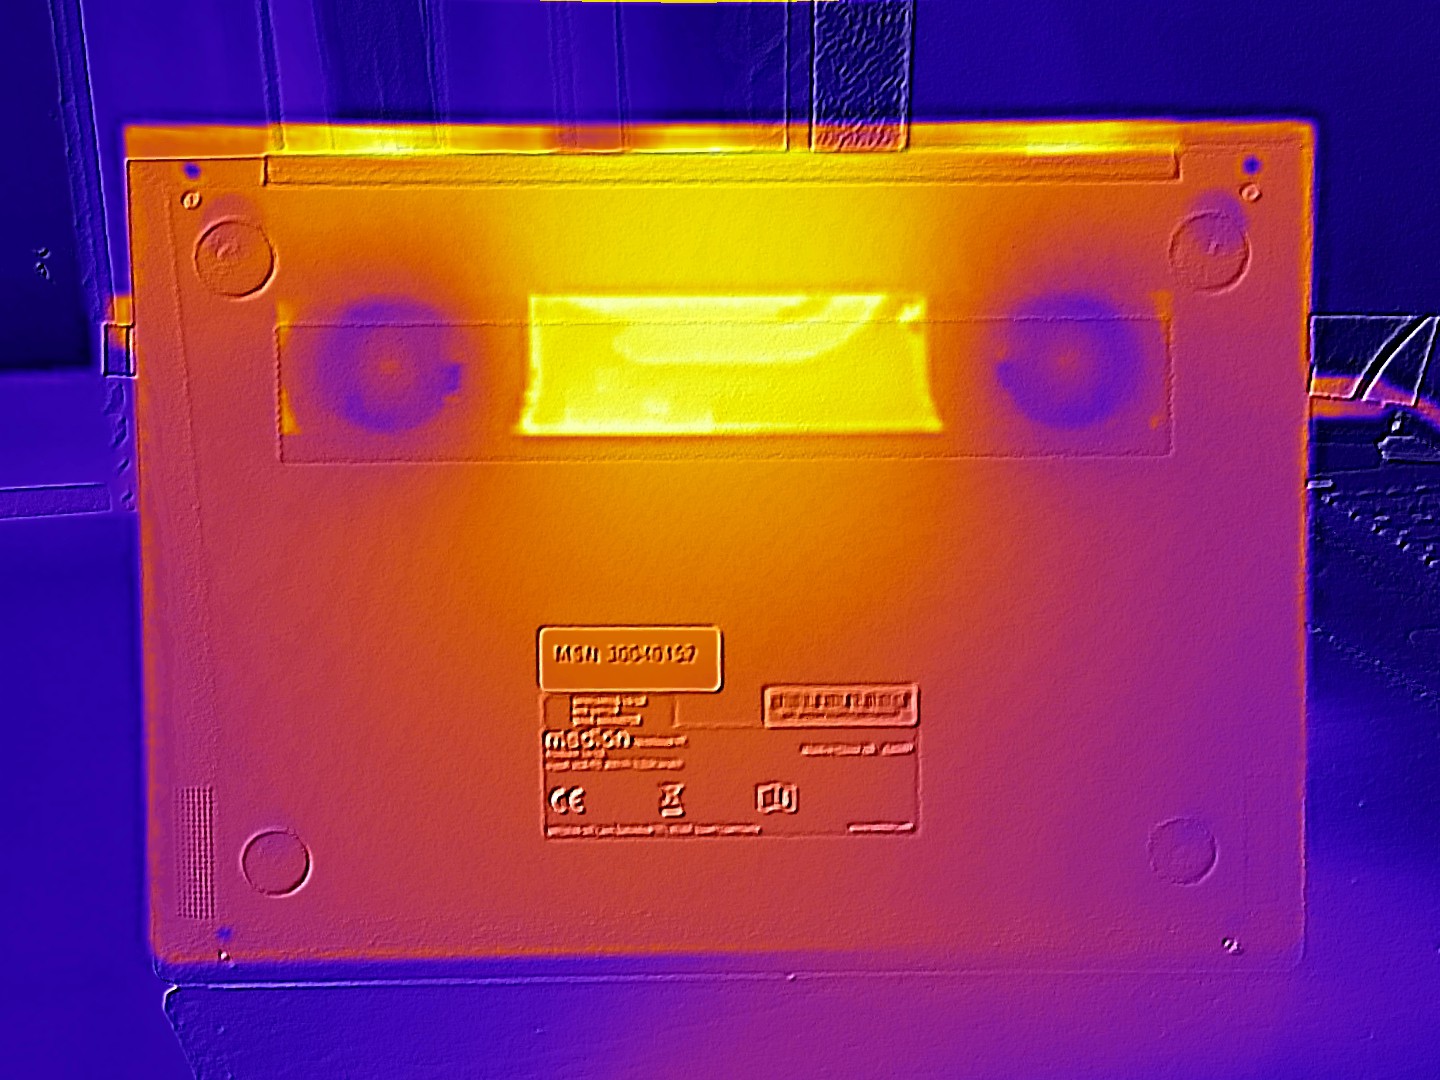
Temperatura
Z kolei temperatury pod obciążeniem były przyzwoite i nie wyprzedziły konkurencji, osiągając maksymalnie 42 °C na górze i 46 °C na dole obudowy. W trybie bezczynności nagrzewał się do nieco ponad 30 °C, co nie jest ani niską, ani szczególnie wysoką wartością.
(±) Maksymalna temperatura w górnej części wynosi 43 °C / 109 F, w porównaniu do średniej 35.9 °C / 97 F , począwszy od 21.4 do 59 °C dla klasy Subnotebook.
(-) Dno nagrzewa się maksymalnie do 46 °C / 115 F, w porównaniu do średniej 39.3 °C / 103 F
(+) W stanie bezczynności średnia temperatura górnej części wynosi 29 °C / 84 F, w porównaniu ze średnią temperaturą urządzenia wynoszącą 30.8 °C / ### class_avg_f### F.
(±) 3: The average temperature for the upper side is 35.8 °C / 96 F, compared to the average of 30.8 °C / 87 F for the class Subnotebook.
(+) Podpórki pod nadgarstki i touchpad są chłodniejsze niż temperatura skóry i maksymalnie 31 °C / 87.8 F i dlatego są chłodne w dotyku.
(-) Średnia temperatura obszaru podparcia dłoni w podobnych urządzeniach wynosiła 28.2 °C / 82.8 F (-2.8 °C / -5 F).
| Medion SPRCHRGD 14 S2 Core Ultra 7 258V, Arc 140V | Medion SPRCHRGD 14 S1 Elite SD X Elite X1E-78-100, Adreno X1-85 3.8 TFLOPS | Lenovo Yoga Slim 9 14ILL10 Core Ultra 7 258V, Arc 140V | Asus Zenbook S 14 UX5406 Core Ultra 7 258V, Arc 140V | Lenovo ThinkPad T14 Gen 5 21MC003QGE R7 8840U, Radeon 780M | |
|---|---|---|---|---|---|
| Heat | -11% | 18% | 8% | -15% | |
| Maximum Upper Side * (°C) | 43 | 45 -5% | 34.2 20% | 43.7 -2% | 51 -19% |
| Maximum Bottom * (°C) | 46 | 49 -7% | 40.6 12% | 46.9 -2% | 61.5 -34% |
| Idle Upper Side * (°C) | 32 | 36 -13% | 24.8 22% | 25.8 19% | 31.3 2% |
| Idle Bottom * (°C) | 31 | 37 -19% | 25.6 17% | 26.3 15% | 33.6 -8% |
* ... im mniej tym lepiej
Test warunków skrajnych
Test obciążeniowy z użyciem narzędzi Furmark i Prime95 zaowocował umiarkowaną temperaturą procesora na poziomie około 70 °C. Podobnie sytuacja wyglądała w Cyberpunku.


Głośniki
Jakość dźwięku laptopa plasuje się w średnim zakresie. Ma trochę do nadrobienia - większość laptopów przesyła pozdrowienia - zwłaszcza jeśli chodzi o basy.
Medion SPRCHRGD 14 S2 analiza dźwięku
(±) | głośność głośnika jest średnia, ale dobra (81 dB)
Bas 100 - 315 Hz
(-) | prawie brak basu - średnio 23.2% niższa od mediany
(±) | liniowość basu jest średnia (8.6% delta do poprzedniej częstotliwości)
Średnie 400 - 2000 Hz
(+) | zbalansowane środki średnie - tylko 4.5% od mediany
(+) | średnie są liniowe (6.7% delta do poprzedniej częstotliwości)
Wysokie 2–16 kHz
(+) | zrównoważone maksima - tylko 2.5% od mediany
(+) | wzloty są liniowe (4.4% delta do poprzedniej częstotliwości)
Ogólnie 100 - 16.000 Hz
(±) | liniowość ogólnego dźwięku jest średnia (18.3% różnicy w stosunku do mediany)
W porównaniu do tej samej klasy
» 52% wszystkich testowanych urządzeń w tej klasie było lepszych, 7% podobnych, 41% gorszych
» Najlepszy miał deltę 5%, średnia wynosiła ###średnia###%, najgorsza wynosiła 53%
W porównaniu do wszystkich testowanych urządzeń
» 39% wszystkich testowanych urządzeń było lepszych, 8% podobnych, 53% gorszych
» Najlepszy miał deltę 4%, średnia wynosiła ###średnia###%, najgorsza wynosiła 134%
Lenovo ThinkPad T14 Gen 5 21MC003QGE analiza dźwięku
(±) | głośność głośnika jest średnia, ale dobra (78.5 dB)
Bas 100 - 315 Hz
(-) | prawie brak basu - średnio 17.8% niższa od mediany
(±) | liniowość basu jest średnia (9.4% delta do poprzedniej częstotliwości)
Średnie 400 - 2000 Hz
(±) | wyższe średnie - średnio 6.2% wyższe niż mediana
(+) | średnie są liniowe (4.1% delta do poprzedniej częstotliwości)
Wysokie 2–16 kHz
(+) | zrównoważone maksima - tylko 3.2% od mediany
(+) | wzloty są liniowe (6.1% delta do poprzedniej częstotliwości)
Ogólnie 100 - 16.000 Hz
(±) | liniowość ogólnego dźwięku jest średnia (18.5% różnicy w stosunku do mediany)
W porównaniu do tej samej klasy
» 32% wszystkich testowanych urządzeń w tej klasie było lepszych, 7% podobnych, 61% gorszych
» Najlepszy miał deltę 7%, średnia wynosiła ###średnia###%, najgorsza wynosiła 53%
W porównaniu do wszystkich testowanych urządzeń
» 40% wszystkich testowanych urządzeń było lepszych, 8% podobnych, 52% gorszych
» Najlepszy miał deltę 4%, średnia wynosiła ###średnia###%, najgorsza wynosiła 134%
Zarządzanie energią
Zużycie energii
Po Lenovo Thinkpad T14 z procesorem AMD, SPRCHRGD 14 S2 był drugim najbardziej oszczędnym laptopem w naszym polu testowym - przynajmniej w trybie bezczynności. 4.od 8 do 7,5 wata to bardzo dobry wynik, choć pod obciążeniem jego zużycie wzrosło do 67 watów, co można było również powiedzieć o pierwszej wersji urządzenia. W Cyberpunk układ Qualcomm poprzednika zużywał znacznie mniej (54 vs 35 watów).
| wyłączony / stan wstrzymania | |
| luz | |
| obciążenie |
|
Legenda:
min: | |
| Medion SPRCHRGD 14 S2 Core Ultra 7 258V, Arc 140V | Medion SPRCHRGD 14 S1 Elite SD X Elite X1E-78-100, Adreno X1-85 3.8 TFLOPS | Lenovo Yoga Slim 9 14ILL10 Core Ultra 7 258V, Arc 140V | Asus Zenbook S 14 UX5406 Core Ultra 7 258V, Arc 140V | Lenovo ThinkPad T14 Gen 5 21MC003QGE R7 8840U, Radeon 780M | Średnia w klasie Subnotebook | |
|---|---|---|---|---|---|---|
| Power Consumption | -14% | -10% | 14% | 16% | -5% | |
| Idle Minimum * (Watt) | 4.8 | 6.4 -33% | 5.6 -17% | 5.1 -6% | 2.7 44% | 4.06 ? 15% |
| Idle Average * (Watt) | 5.4 | 9.3 -72% | 6.7 -24% | 6.2 -15% | 4.9 9% | 6.94 ? -29% |
| Idle Maximum * (Watt) | 7.5 | 10.7 -43% | 12.4 -65% | 6.9 8% | 5.2 31% | 8.55 ? -14% |
| Load Average * (Watt) | 47 | 38.1 19% | 38.7 18% | 45.6 3% | 44.5 ? 5% | |
| Cyberpunk 2077 ultra external monitor * (Watt) | 51.6 | 35 32% | 50.6 2% | 28.6 45% | 47.3 8% | |
| Cyberpunk 2077 ultra * (Watt) | 54.1 | 35 35% | 51.1 6% | 33.1 39% | 47.3 13% | |
| Load Maximum * (Watt) | 67 | 67 -0% | 61.5 8% | 60 10% | 66.3 1% | 68 ? -1% |
* ... im mniej tym lepiej
Power consumption Cyberpunk / stress test
Power consumption with external monitor
Czas trwania
Intel nie ma szans z Qualcommem, jeśli chodzi o żywotność baterii. Podczas gdy 14 S1 wytrzymał około 16 godzin w naszym teście Wi-Fi (jasność zredukowana do 150 cd/m²), następca "tylko" zarządzał nieco poniżej 12,5 godziny, co plasuje go na przedostatnim miejscu w polu testowym.
| Medion SPRCHRGD 14 S2 Core Ultra 7 258V, Arc 140V, 65 Wh | Medion SPRCHRGD 14 S1 Elite SD X Elite X1E-78-100, Adreno X1-85 3.8 TFLOPS, 65 Wh | Lenovo Yoga Slim 9 14ILL10 Core Ultra 7 258V, Arc 140V, 75 Wh | Asus Zenbook S 14 UX5406 Core Ultra 7 258V, Arc 140V, 72 Wh | Lenovo ThinkPad T14 Gen 5 21MC003QGE R7 8840U, Radeon 780M, 52.5 Wh | Średnia w klasie Subnotebook | |
|---|---|---|---|---|---|---|
| Czasy pracy | 31% | 28% | 16% | -16% | 8% | |
| WiFi v1.3 (h) | 12.3 | 16.1 31% | 15.8 28% | 14.3 16% | 10.3 -16% | 13.3 ? 8% |
| Reader / Idle (h) | 23.4 | 30.7 ? | ||||
| Load (h) | 3.8 | 2.6 | 2.2 | 1.935 ? | ||
| H.264 (h) | 20 | 16.7 ? |
Łączna ocena Notebookcheck
SPRCHRGD 14 S2 to niemal wszechstronnie udany 14-calowy laptop, który nie ma żadnego powodu, by ukrywać się za produktami większych producentów - z wyjątkiem dużego hałasu w trybie 3D.
Medion SPRCHRGD 14 S2
- 24/03/2025 v8
Florian Glaser
 Total Sustainability Score:
 Possible alternatives compared
Obraz | Model / recenzja | Cena | Waga | Wysokość | Ekran |
|---|---|---|---|---|---|
1. 83.5%  | Medion SPRCHRGD 14 S2 Intel Core Ultra 7 258V ⎘ Intel Arc Graphics 140V ⎘ 32 GB Pamięć | Cena katalogowa: 1300 EUR | 1.4 kg | 17 mm | 14.00" 2880x1800 243 PPI IPS |
2. 82.7%  | Medion SPRCHRGD 14 S1 Elite Qualcomm Snapdragon X Elite X1E-78-100 ⎘ Qualcomm SD X Adreno X1-85 3.8 TFLOPS ⎘ 32 GB Pamięć, 1024 GB SSD | Amazon: 1. $34.99 Navitech Grey Sleek Water Re... 2. $45.99 Broonel Black Leather Folio ... 3. $34.99 Navitech Red Sleek Water Res... Cena katalogowa: 1300 Euro | 1.4 kg | 16.9 mm | 14.00" 2880x1800 243 PPI IPS |
3. 86.7%  | Lenovo Yoga Slim 9 14ILL10 Intel Core Ultra 7 258V ⎘ Intel Arc Graphics 140V ⎘ 32 GB Pamięć, 1024 GB SSD | Amazon: 1. $10.99 3-Pack Designed for 2025 New... 2. $9.25 i-Tensodo 2 Pack 14 inch Ant... 3. $52.99 XJchen Laptop Cover for Leno... Cena katalogowa: 1900 USD | 1.2 kg | 14.55 mm | 14.00" 3840x2400 323 PPI OLED |
4. 88.1%  | Asus Zenbook S 14 UX5406 Intel Core Ultra 7 258V ⎘ Intel Arc Graphics 140V ⎘ 32 GB Pamięć, 1024 GB SSD | Amazon: 1. $1,109.99 ASUS - Zenbook S 14" 3K(2880... 2. $1,349.98 ASUS Zenbook 14 AI PC Touchs... 3. $1,692.00 ASUS Zenbook DUO Laptop, Dua... Cena katalogowa: 1999€ | 1.2 kg | 13 mm | 14.00" 2880x1800 243 PPI OLED |
5. 86.3%  | Lenovo ThinkPad T14 Gen 5 21MC003QGE AMD Ryzen 7 8840U ⎘ AMD Radeon 780M ⎘ 32 GB Pamięć, 1024 GB SSD | Amazon: $1,028.90 Cena katalogowa: 1889 Euro | 1.5 kg | 21.5 mm | 14.00" 1920x1200 162 PPI IPS LED |
Przezroczystość
Wyboru urządzeń do recenzji dokonuje nasza redakcja. Próbka testowa została udostępniona autorowi jako pożyczka od producenta lub sprzedawcy detalicznego na potrzeby tej recenzji. Pożyczkodawca nie miał wpływu na tę recenzję, producent nie otrzymał też kopii tej recenzji przed publikacją. Nie było obowiązku publikowania tej recenzji. Jako niezależna firma medialna, Notebookcheck nie podlega władzy producentów, sprzedawców detalicznych ani wydawców.
Tak testuje Notebookcheck
Każdego roku Notebookcheck niezależnie sprawdza setki laptopów i smartfonów, stosując standardowe procedury, aby zapewnić porównywalność wszystkich wyników. Od około 20 lat stale rozwijamy nasze metody badawcze, ustanawiając przy tym standardy branżowe. W naszych laboratoriach testowych doświadczeni technicy i redaktorzy korzystają z wysokiej jakości sprzętu pomiarowego. Testy te obejmują wieloetapowy proces walidacji. Nasz kompleksowy system ocen opiera się na setkach uzasadnionych pomiarów i benchmarków, co pozwala zachować obiektywizm.
