
Recenzja Asus Prime GeForce RTX 5080 OC Edition: 13% wzrost w porównaniu do RX 7900 XTX przy 30% wzroście ceny w porównaniu do RTX 5080 FE
Prime bez Optimusa.
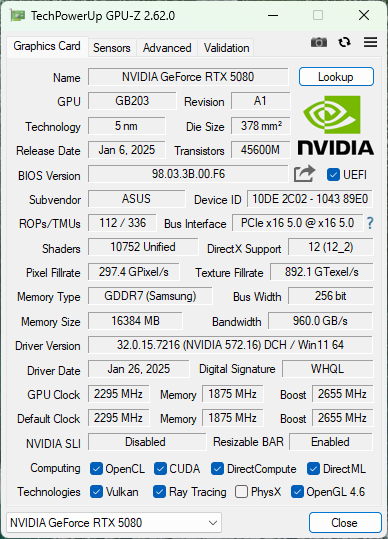
Asus Prime GeForce RTX 5080 Founders Edition to karta graficzna SFF oparta na najnowszym GPU Nvidii GB203 Blackwell. Prime RTX 5080 OC oferuje nieco wyższe zegary niż RTX 5080 Founders Edition, ale rzeczywisty wzrost wydajności niekoniecznie skaluje się z wyższą ceną.Vaidyanathan Subramaniam, 👁 Vaidyanathan Subramaniam (tłumaczenie DeepL / Ninh Duy) Opublikowany 🇺🇸 🇫🇷 ...
Werdykt: RTX 5080 SFF GPU z wątpliwą propozycją wartości
Asus wykonał w tym roku interesujący ruch, rozszerzając swoją tradycyjnie skoncentrowaną na średnim segmencie serię Prime o flagowy model RTX 5080. Karta Prime GeForce RTX 5080 OC Edition ma być wydajną alternatywą dla RTX 5080 Founders Edition firmy Nvidia.
Prime RTX 5080 OC ma minimalistyczną, ale funkcjonalną konstrukcję, która zajmuje zaledwie 2,5 gniazda, dzięki czemu idealnie nadaje się do małych obudów (SFF).
Pod względem surowej wydajności, Prime RTX 5080 OC Edition zapewnia skromny 2-3% wzrost w porównaniu do RTX 5080 FE zarówno w syntetycznych testach porównawczych, jak i w rzeczywistych scenariuszach gamingowych.
Wzrost w stosunku do Radeona RX 7900 XTX jest bardziej namacalny i wynosi 10-13% w zależności od benchmarku lub gry.
Prime RTX 5090 OC korzysta również z bardzo chwalonego stosu oprogramowania Nvidii, a karta w pełni obsługuje najnowsze możliwości generowania wielu klatek DLSS 4 w architekturze Blackwell.

Asus zastosował skuteczne rozwiązanie chłodzące dla Prime RTX 5080 OC, które utrzymuje emisję ciepła i hałasu karty na rozsądnym poziomie, biorąc pod uwagę oferowaną wydajność.
Chociaż nie można się pomylić z Prime RTX 5080 OC, należy pamiętać o kilku zastrzeżeniach. Pobór mocy tej karty podczas grania może być nieco wyższy w porównaniu do RTX 5080 FE, bez zauważalnego przyrostu klatek.
Pamięć VRAM GDDR7 o pojemności 16 GB, choć znacznie szybsza niż zeszłoroczna implementacja GDDR6X, może szybko stać się wąskim gardłem w niektórych wymagających tytułach, choć dotyczy to ogólnie wszystkich RTX 5080.
Najbardziej kontrowersyjnym aspektem Prime RTX 5080 OC jest jednak jego cena. Zakładając, że uda się ją zdobyć, proszę spodziewać się ceny o 321 USD wyższej niż sugerowana cena detaliczna RTX 5080 FE wynosząca 999 USD za praktycznie zerowy wzrost wydajności.
Biorąc pod uwagę, że karty RX 7900 XTX powracają teraz do swoich pierwotnych cen premierowych po niedawnych gwałtownych obniżkach cen, a na horyzoncie pojawia się Radeon RX 9070 XT oparty na RDNA 4, być może lepiej będzie poczekać i obserwować, jak dynamika cen zmieni się w nadchodzących tygodniach, zanim wyłożą Państwo pieniądze.
Za
Przeciw
Cena i dostępność
Kartę Asus Prime GeForce RTX 5080 OC Edition można nabyć w sklepach Amazon i Best Buy US w cenie 1 319,99 USD, ale w chwili pisania tego tekstu jest ona już wyprzedana.
W Indiach Prime GeForce RTX 5080 OC jest oficjalnie wyceniony na 1 59 999 jenów i objęty trzyletnią gwarancją, ale obecnie jest sprzedawany z wyższą marżą u lokalnych sprzedawców detalicznych.
Spis treści
- Werdykt: RTX 5080 SFF GPU z wątpliwą propozycją wartości
- Szybki przegląd karty Asus Prime GeForce RTX 5080 OC Edition
- Stanowisko testowe: Prime RTX 5080 OC dobrze współpracuje z Core i9-14900K
- Syntetyczne testy porównawcze: Wyprzedza RTX 5080 FE o włos
- Wydajność AI i obliczeniowa: Przewyższa Radeona RX 7900 XTX o znaczną marżę
- Wydajność w grach: Namacalna przewaga w rasteryzacji nad RX 7900 XTX
- Emisje: Dopuszczalna emisja ciepła i hałasu
- Zarządzanie energią: Mile widziany wzrost wydajności w grach w porównaniu do RX 7900 XTX
- Wrażenia Notebookcheck dotyczące karty Asus Prime GeForce RTX 5080 OC Edition
Chociaż RTX 5080 Founders Edition (FE) może być trudna do zdobycia, na rynku nie brakuje kart partnerskich typu add-in board (AiB). Asus oferuje procesory graficzne z serii RTX 50 w kategoriach ROG, TUF Gaming i Prime.
Seria Prime została zaprojektowana z myślą o komputerach PC w małych obudowach (SFF). Po raz pierwszy została wprowadzona wraz z linią RTX 40 Series, ale była ograniczona tylko do procesorów graficznych RTX 4060 i RTX 4070 oraz ich wersji. W tym roku Asus rozszerzył serię Prime o model RTX 5080.
Niedawno recenzowaliśmy kartę Asus TUF Gaming GeForce RTX 5080 OC. W tej recenzji przyjrzymy się karcie Asus Prime GeForce RTX 5080 OC Edition i zobaczymy, jak wypada ona w porównaniu z RTX 5080 FE.
Porównanie karty Prime GeForce RTX 5080 OC z innymi układami GPU Nvidia
| Specyfikacja | RTX 5090 FE | Prime RTX 5080 OC | RTX 5080 FE | RTX 4090 FE | RTX 4080 Super FE | RTX 4080 FE | Asus TUF RTX 4070 Ti Super | RTX 4070 Super FE | KFA2RTX 4060 Ti EX | RTX 3090 Ti FE | RTX 3090 FE | RTX 3080 Ti FE |
|---|---|---|---|---|---|---|---|---|---|---|---|---|
| Chip | GB202 | GB203 | GB203 | AD102 | AD103 | AD103 | AD103 | AD104 | AD106 | GA102 | GA102 | GA102 |
| Proces FinFET | Niestandardowy 4N | Niestandardowy 4N | Niestandardowy 4N | Niestandardowy 4N | Niestandardowy 4N | Niestandardowy 4N | Niestandardowy 4N | Niestandardowy 4N | Niestandardowy 4N | 8 nm | 8 nm | 8 nm |
| Rdzenie CUDA | 21,760 | 10,752 | 10,752 | 16,384 | 10,240 | 9,728 | 8,448 | 7,168 | 4,352 | 10,752 | 10,496 | 10,240 |
| Jednostki tekstury | 680 | 336 | 336 | 512 | 320 | 304 | 264 | 224 | 136 | 336 | 328 | 320 |
| Rdzenie tensorowe | 680 5. gen. | 336 5. gen. | 336 5. gen. | 512 4. gen. | 320 4. gen. | 304 4. gen. | 264 4. gen. | 224 4. gen. | 136 4. gen. | 336 3. gen. | 328 3. gen. | 320 3. gen. |
| Rdzenie RT | 170 4. gen. | 84 4. gen. | 84 4. gen. | 128 3. gen. | 80 3. gen. | 76 3. gen. | 66 3. gen. | 56 3. gen. | 34 3. gen. | 84 2. gen. | 82 2. gen. | 80 2. gen. |
| Zegar bazowy GPU | 2,017 MHz | 2,295 MHz | 2,295 MHz | 2,235 MHz | 2,295 MHz | 2,205 MHz | 2,340 MHz | 1,980 MHz | 2,310 MHz | 1,560 MHz | 1,395 MHz | 1,365 MHz |
| GPU Boost Clock | 2,407 MHz | 2,655 MHz / 2,685 MHz (tryb OC) | 2,617 MHz | 2,520 MHz | 2,550 MHz | 2,505 MHz | 2,610 MHz | 2,475 MHz | 2,535 MHz | 1,860 MHz | 1,695 MHz | 1,665 MHz |
| Magistrala pamięci | 512-bit | 256-bit | 256-bit | 384-bit | 256-bit | 256-bit | 256-bit | 192-bit | 128-bit | 384-bit | 384-bit | 384-bit |
| Przepustowość pamięci | 1,79 TB/s | 960 GB/s | 960 GB/s | 1 008 GB/s | 736,3 GB/s | 716,8 GB/s | 672 GB/s | 504 GB/s | 288 GB/s | 1 008 GB/s | 936 GB/s | 912 GB/s |
| Pamięć wideo | 32 GB GDDR7 | 16 GB GDDR7 | 16 GB GDDR7 | 24 GB GDDR6X | 16 GB GDDR6X | 16 GB GDDR6X | 16 GB GDDR6X | 12 GB GDDR6X | 8 GB GDDR6 | 24 GB GDDR6X | 24 GB GDDR6X | 12 GB GDDR6X |
| Pobór mocy | 575 W | 360 W | 360 W | 450 W | 320 W | 320 W | 285 W | 220 W | 160 W | 450 W | 350 W | 350 W |
Szybki przegląd karty Asus Prime GeForce RTX 5080 OC Edition
Mierząca 304 x 126 x 50 mm karta Prime GeForce RTX 5080 OC jest nieco grubsza niż RTX 5080 FE. Pozostaje jednak kartą SFF, zajmując zaledwie 2,5 slotu.
Przednia osłona wykonana jest z wysokiej jakości tworzywa sztucznego, choć chcielibyśmy, aby była solidniejsza, a uzupełnia ją metalowa płyta tylna.
Logotypy "GeForce RTX" i "PRIME" są wyraźnie widoczne na przedniej osłonie, ale nie ma wokół nich żadnego rodzaju RGB.


Prime RTX 5080 OC oferuje typowy zestaw złączy wyświetlacza, jak zdecydowana większość dostępnych na rynku procesorów graficznych. Trzy złącza DisplayPort w końcu obsługują standard DisplayPort 2.1b.
W przeciwieństwie do serii TUF Gaming, która oferuje 2 wyjścia HDMI, Prime RTX 5080 OC oferuje tylko jedno wyjście HDMI 2.1b.
Złącze 12VHPWR zapewnia karcie wymagane zasilanie. Asus dołącza adapter 12VHPWR do 3x 8-pin do użytku z zasilaczami, które nie są kompatybilne z ATX 3.x.
Podobnie jak w przypadku innych kart Asusa, wskaźnik LED obok złącza 12VHPWR świeci na czerwono, wskazując nieprawidłowe podłączenie adaptera lub nieodpowiednie zasilanie.
Prime RTX 5080 OC posiada podwójny przełącznik trybu BIOS, który przełącza się między trybami Performance i Quiet. We wszystkich testach porównawczych korzystaliśmy z trybu wydajności, a także porównaliśmy poziomy hałasu wentylatorów w obu trybach.


W pudełku znajdą Państwo wiele akcesoriów, w tym następujące:
- Instrukcja obsługi
- Rzepy
- Karta z podziękowaniami
- Skrócona instrukcja obsługi
- kabel przejściowy z 12VHPWR na 3x 8-pin
W zestawie nie znajdziemy uchwytu na GPU ze zintegrowanym śrubokrętem, jak ma to miejsce w serii TUF Gaming, prawdopodobnie ze względu na kompaktową obudowę karty.
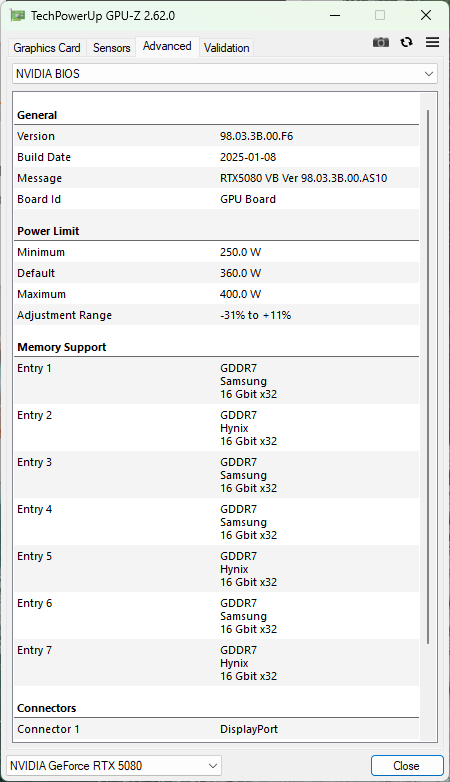
Prime GeForce RTX 5080 OC charakteryzuje się domyślnym taktowaniem boost wynoszącym 2655 MHz, czyli o 38 MHz szybszym niż Founders Edition, przy zachowaniu tej samej całkowitej mocy graficznej (TGP) wynoszącej 360 W. W trybie wydajności karta ta może dodatkowo zwiększyć taktowanie do 2,685 MHz.
Możliwe jest zwiększenie limitu mocy o dodatkowe 11% dla maksymalnego TGP wynoszącego 400 W.
Stanowisko testowe: Prime RTX 5080 OC dobrze współpracuje z Core i9-14900K
W naszym stanowisku testowym wykorzystaliśmy następujące komponenty:
- Cooler Master MasterFrame 700 open test bench
- Intel Core i9-14900K z profilem Intel Extreme ustawionym w BIOS-ie
- Płyta główna Gigabyte Z790 Aorus Master
- Sabrent Rocket 4 Plus Gen4 2 TB NVMe SSD i 2x Crucial MX500 1 TB SATA SSD dla systemu operacyjnego, testów porównawczych i gier
- 2x 16 GB pamięci RAM Kingston Fury Renegade DDR5-6400 z timingami 32-39-39-80 przy napięciu 1,40 V
- Monitor Alienware AW3225QF 4K 240 Hz QD-OLED
- Thermaltake TH420 V2 Ultra EX ARGB Chłodnica AiO
- W pełni modularny zasilacz Cooler Master MVE Gold V2 1250 ATX 3.0
Zastosowano system Windows 11 24H2 z najnowszymi łatkami oraz sterownik Nvidia Game Ready Driver w wersji 572.16 wydany dla prasy.
Chcielibyśmy podziękować firmie Cooler Master za dostarczenie stanowiska testowego i zasilacza, firmie Gigabyte za płytę główną, firmie Sabrent za dysk SSD, firmie Dell za monitor Alienware, firmie Thermaltake za cooler AiO, firmie Kingston za zestaw pamięci DDR5 i wreszcie firmie Asus za kartę graficzną Prime RTX 5080 Gaming OC Edition.
Syntetyczne testy porównawcze: Wyprzedza RTX 5080 FE o włos
Asus Prime GeForce RTX 5080 OC Edition wypada mniej więcej podobnie do RTX 5080 FE w syntetycznych testach porównawczych. Nieznacznie wyższe przyspieszenie przekłada się na zaledwie 2% przewagę w testach 3DMark i Unigine.
W międzyczasie Sapphire Pulse Radeon RX 7900 XTX zdołał zyskać 4% w stosunku do Prime RTX 5080 OC w 3DMark Fire Strike Graphics, ale został zmiażdżony w testach Port Royal i Speed Way, które obejmują ray tracing.
| Performance rating - Percent | |
| NVIDIA GeForce RTX 5090 Founders Edition | |
| NVIDIA GeForce RTX 4090 | |
| Asus Prime GeForce RTX 5080 OC Edition | |
| NVIDIA GeForce RTX 5080 Founders Edition | |
| Sapphire Pulse AMD Radeon RX 7900 XTX | |
| NVIDIA GeForce RTX 4080 Founders Edition | |
| Sapphire Pulse AMD Radeon RX 7900 XT | |
| 3DMark | |
| 1920x1080 Fire Strike Graphics | |
| NVIDIA GeForce RTX 5090 Founders Edition | |
| NVIDIA GeForce RTX 4090 | |
| Sapphire Pulse AMD Radeon RX 7900 XTX | |
| Asus Prime GeForce RTX 5080 OC Edition | |
| Sapphire Pulse AMD Radeon RX 7900 XT | |
| NVIDIA GeForce RTX 5080 Founders Edition | |
| NVIDIA GeForce RTX 4080 Founders Edition | |
| Fire Strike Extreme Graphics | |
| NVIDIA GeForce RTX 5090 Founders Edition | |
| NVIDIA GeForce RTX 4090 | |
| Asus Prime GeForce RTX 5080 OC Edition | |
| NVIDIA GeForce RTX 5080 Founders Edition | |
| Sapphire Pulse AMD Radeon RX 7900 XTX | |
| Sapphire Pulse AMD Radeon RX 7900 XT | |
| NVIDIA GeForce RTX 4080 Founders Edition | |
| 3840x2160 Fire Strike Ultra Graphics | |
| NVIDIA GeForce RTX 5090 Founders Edition | |
| NVIDIA GeForce RTX 4090 | |
| Asus Prime GeForce RTX 5080 OC Edition | |
| NVIDIA GeForce RTX 5080 Founders Edition | |
| Sapphire Pulse AMD Radeon RX 7900 XTX | |
| Sapphire Pulse AMD Radeon RX 7900 XT | |
| NVIDIA GeForce RTX 4080 Founders Edition | |
| 2560x1440 Port Royal Graphics | |
| NVIDIA GeForce RTX 5090 Founders Edition | |
| NVIDIA GeForce RTX 4090 | |
| Asus Prime GeForce RTX 5080 OC Edition | |
| NVIDIA GeForce RTX 5080 Founders Edition | |
| NVIDIA GeForce RTX 4080 Founders Edition | |
| Sapphire Pulse AMD Radeon RX 7900 XTX | |
| Sapphire Pulse AMD Radeon RX 7900 XT | |
| 2560x1440 Speed Way Score | |
| NVIDIA GeForce RTX 5090 Founders Edition | |
| NVIDIA GeForce RTX 4090 | |
| Asus Prime GeForce RTX 5080 OC Edition | |
| NVIDIA GeForce RTX 5080 Founders Edition | |
| NVIDIA GeForce RTX 4080 Founders Edition | |
| Sapphire Pulse AMD Radeon RX 7900 XTX | |
| Sapphire Pulse AMD Radeon RX 7900 XT | |
| Steel Nomad Score | |
| NVIDIA GeForce RTX 5090 Founders Edition | |
| NVIDIA GeForce RTX 4090 | |
| NVIDIA GeForce RTX 5080 Founders Edition | |
| Asus Prime GeForce RTX 5080 OC Edition | |
| Sapphire Pulse AMD Radeon RX 7900 XTX | |
| NVIDIA GeForce RTX 4080 Founders Edition | |
| Sapphire Pulse AMD Radeon RX 7900 XT | |
| 2560x1440 Time Spy Graphics | |
| NVIDIA GeForce RTX 5090 Founders Edition | |
| NVIDIA GeForce RTX 4090 | |
| Asus Prime GeForce RTX 5080 OC Edition | |
| NVIDIA GeForce RTX 5080 Founders Edition | |
| Sapphire Pulse AMD Radeon RX 7900 XTX | |
| Sapphire Pulse AMD Radeon RX 7900 XT | |
| NVIDIA GeForce RTX 4080 Founders Edition | |
| Unigine Heaven 4.0 - Extreme Preset DX11 | |
| NVIDIA GeForce RTX 5090 Founders Edition | |
| NVIDIA GeForce RTX 4090 | |
| Asus Prime GeForce RTX 5080 OC Edition | |
| NVIDIA GeForce RTX 5080 Founders Edition | |
| Sapphire Pulse AMD Radeon RX 7900 XTX | |
| NVIDIA GeForce RTX 4080 Founders Edition | |
| Sapphire Pulse AMD Radeon RX 7900 XT | |
| Unigine Valley 1.0 - 1920x1080 Extreme HD DirectX AA:x8 | |
| Sapphire Pulse AMD Radeon RX 7900 XTX | |
| Sapphire Pulse AMD Radeon RX 7900 XT | |
| Asus Prime GeForce RTX 5080 OC Edition | |
| NVIDIA GeForce RTX 4090 | |
| NVIDIA GeForce RTX 5090 Founders Edition | |
| NVIDIA GeForce RTX 4080 Founders Edition | |
| NVIDIA GeForce RTX 5080 Founders Edition | |
| Unigine Superposition | |
| 3840x2160 4k Optimized | |
| NVIDIA GeForce RTX 5090 Founders Edition | |
| NVIDIA GeForce RTX 4090 | |
| Asus Prime GeForce RTX 5080 OC Edition | |
| NVIDIA GeForce RTX 5080 Founders Edition | |
| Sapphire Pulse AMD Radeon RX 7900 XTX | |
| NVIDIA GeForce RTX 4080 Founders Edition | |
| Sapphire Pulse AMD Radeon RX 7900 XT | |
| 7680x4320 8k Optimized | |
| NVIDIA GeForce RTX 5090 Founders Edition | |
| NVIDIA GeForce RTX 4090 | |
| Asus Prime GeForce RTX 5080 OC Edition | |
| NVIDIA GeForce RTX 5080 Founders Edition | |
| Sapphire Pulse AMD Radeon RX 7900 XTX | |
| NVIDIA GeForce RTX 4080 Founders Edition | |
| Sapphire Pulse AMD Radeon RX 7900 XT | |
| 3DMark Fire Strike Score | 48491 pkt. | |
| 3DMark Fire Strike Extreme Score | 36605 pkt. | |
| 3DMark Time Spy Score | 30376 pkt. | |
| 3DMark Steel Nomad Score | 7979 pkt. | |
Pomoc | ||
Wydajność AI i obliczeniowa: Przewyższa Radeona RX 7900 XTX o znaczną marżę
Po raz kolejny Prime GeForce RTX 5080 OC zdołał o włos wyprzedzić RTX 5080 FE w benchmarku MLPerf AI.
Zarówno Prime RTX 5080 OC, jak i RTX 5080 FE potrzebują tyle samo czasu, aby ukończyć renderowanie Blendera 3.3 Classroom CUDA i Classroom Optix, nie wykazując praktycznej różnicy w testach V-Ray.
Karty AMD są w oczywistej niekorzystnej sytuacji w benchmarkach CUDA i RTX, ale Radeon RX 7900 XTX zdołał pokonać oba modele RTX 5080 w niektórych podtestach ComputeMark.
| MLPerf Client 0.5 - overall generation rate | |
| NVIDIA GeForce RTX 5090 Founders Edition | |
| NVIDIA GeForce RTX 4090 | |
| Asus Prime GeForce RTX 5080 OC Edition | |
| NVIDIA GeForce RTX 5080 Founders Edition | |
| Sapphire Pulse AMD Radeon RX 7900 XTX | |
| NVIDIA GeForce RTX 4080 Founders Edition | |
| Sapphire Pulse AMD Radeon RX 7900 XT | |
| Blender | |
| v3.3 Classroom CUDA | |
| NVIDIA GeForce RTX 4080 Founders Edition | |
| NVIDIA GeForce RTX 5080 Founders Edition | |
| Asus Prime GeForce RTX 5080 OC Edition | |
| NVIDIA GeForce RTX 4090 | |
| NVIDIA GeForce RTX 5090 Founders Edition | |
| v3.3 Classroom OPTIX/RTX | |
| NVIDIA GeForce RTX 4080 Founders Edition | |
| NVIDIA GeForce RTX 5080 Founders Edition | |
| Asus Prime GeForce RTX 5080 OC Edition | |
| NVIDIA GeForce RTX 4090 | |
| NVIDIA GeForce RTX 5090 Founders Edition | |
| V-Ray Benchmark Next 4.10 - GPU | |
| NVIDIA GeForce RTX 5090 Founders Edition | |
| NVIDIA GeForce RTX 4090 | |
| NVIDIA GeForce RTX 5080 Founders Edition | |
| Asus Prime GeForce RTX 5080 OC Edition | |
| NVIDIA GeForce RTX 4080 Founders Edition | |
| Sapphire Pulse AMD Radeon RX 7900 XTX | |
| Sapphire Pulse AMD Radeon RX 7900 XT | |
| V-Ray 5 Benchmark | |
| GPU CUDA | |
| NVIDIA GeForce RTX 5090 Founders Edition | |
| NVIDIA GeForce RTX 4090 | |
| Asus Prime GeForce RTX 5080 OC Edition | |
| NVIDIA GeForce RTX 5080 Founders Edition | |
| NVIDIA GeForce RTX 4080 Founders Edition | |
| Sapphire Pulse AMD Radeon RX 7900 XTX | |
| Sapphire Pulse AMD Radeon RX 7900 XT | |
| GPU RTX | |
| NVIDIA GeForce RTX 5090 Founders Edition | |
| NVIDIA GeForce RTX 4090 | |
| NVIDIA GeForce RTX 5080 Founders Edition | |
| Asus Prime GeForce RTX 5080 OC Edition | |
| NVIDIA GeForce RTX 4080 Founders Edition | |
| ComputeMark v2.1 | |
| 1024x600 Normal, Score | |
| NVIDIA GeForce RTX 5090 Founders Edition | |
| NVIDIA GeForce RTX 4090 | |
| Asus Prime GeForce RTX 5080 OC Edition | |
| NVIDIA GeForce RTX 5080 Founders Edition | |
| Sapphire Pulse AMD Radeon RX 7900 XTX | |
| Sapphire Pulse AMD Radeon RX 7900 XT | |
| NVIDIA GeForce RTX 4080 Founders Edition | |
| 1024x600 Normal, Fluid 3DTex | |
| NVIDIA GeForce RTX 5090 Founders Edition | |
| Asus Prime GeForce RTX 5080 OC Edition | |
| NVIDIA GeForce RTX 5080 Founders Edition | |
| NVIDIA GeForce RTX 4090 | |
| Sapphire Pulse AMD Radeon RX 7900 XTX | |
| Sapphire Pulse AMD Radeon RX 7900 XT | |
| NVIDIA GeForce RTX 4080 Founders Edition | |
| 1024x600 Normal, Fluid 2DTexArr | |
| NVIDIA GeForce RTX 5090 Founders Edition | |
| Sapphire Pulse AMD Radeon RX 7900 XTX | |
| Sapphire Pulse AMD Radeon RX 7900 XT | |
| Asus Prime GeForce RTX 5080 OC Edition | |
| NVIDIA GeForce RTX 5080 Founders Edition | |
| NVIDIA GeForce RTX 4090 | |
| NVIDIA GeForce RTX 4080 Founders Edition | |
| 1024x600 Normal, Mandel Vector | |
| NVIDIA GeForce RTX 5090 Founders Edition | |
| Sapphire Pulse AMD Radeon RX 7900 XTX | |
| NVIDIA GeForce RTX 4090 | |
| Asus Prime GeForce RTX 5080 OC Edition | |
| NVIDIA GeForce RTX 5080 Founders Edition | |
| Sapphire Pulse AMD Radeon RX 7900 XT | |
| NVIDIA GeForce RTX 4080 Founders Edition | |
| 1024x600 Normal, Mandel Scalar | |
| NVIDIA GeForce RTX 5090 Founders Edition | |
| NVIDIA GeForce RTX 4090 | |
| Sapphire Pulse AMD Radeon RX 7900 XTX | |
| Asus Prime GeForce RTX 5080 OC Edition | |
| NVIDIA GeForce RTX 5080 Founders Edition | |
| Sapphire Pulse AMD Radeon RX 7900 XT | |
| NVIDIA GeForce RTX 4080 Founders Edition | |
| 1024x600 Normal, QJuliaRayTrace | |
| NVIDIA GeForce RTX 5090 Founders Edition | |
| NVIDIA GeForce RTX 4090 | |
| Asus Prime GeForce RTX 5080 OC Edition | |
| NVIDIA GeForce RTX 5080 Founders Edition | |
| NVIDIA GeForce RTX 4080 Founders Edition | |
| Sapphire Pulse AMD Radeon RX 7900 XTX | |
| Sapphire Pulse AMD Radeon RX 7900 XT | |
| LuxMark v2.0 64Bit | |
| Room GPUs-only | |
| NVIDIA GeForce RTX 5090 Founders Edition | |
| NVIDIA GeForce RTX 4090 | |
| Asus Prime GeForce RTX 5080 OC Edition | |
| NVIDIA GeForce RTX 5080 Founders Edition | |
| NVIDIA GeForce RTX 4080 Founders Edition | |
| Sapphire Pulse AMD Radeon RX 7900 XTX | |
| Sapphire Pulse AMD Radeon RX 7900 XT | |
| Sala GPUs-only | |
| NVIDIA GeForce RTX 5090 Founders Edition | |
| NVIDIA GeForce RTX 4090 | |
| Asus Prime GeForce RTX 5080 OC Edition | |
| NVIDIA GeForce RTX 5080 Founders Edition | |
| NVIDIA GeForce RTX 4080 Founders Edition | |
| Sapphire Pulse AMD Radeon RX 7900 XTX | |
| Sapphire Pulse AMD Radeon RX 7900 XT | |
* ... im mniej tym lepiej
Wydajność w grach: Namacalna przewaga w rasteryzacji nad RX 7900 XTX
Prime GeForce RTX 5080 OC Edition wyprzedza RTX 5080 FE jedynie o niewielki margines w skumulowanych testach w grach w rozdzielczości 1080p, 1440p i 4K Ultra, jednocześnie przewyższając Radeona RX 7900 XTX o 13%.
Największa przewaga nad RX 7900 XTX pochodzi z F1 24 w 4K Ultra, gdzie Prime RTX 5080 OC jest o 47% szybszy.
Co ciekawe, w grze Alan Wake 2 flagowy procesor graficzny RDNA 3 wykazuje do 12% przewagi nad Prime RTX 5080 OC i do 18% przewagi nad RTX 5080 FE.
Ogólnie rzecz biorąc, Prime RTX 5080 OC nie ma trudności z osiągnięciem, a nawet przekroczeniem poziomu 4K 60 fps bez pomocy skalowania w ustawieniach Ultra w wielu współczesnych tytułach AAA.
| Performance rating - Percent | |
| NVIDIA GeForce RTX 5090 Founders Edition | |
| NVIDIA GeForce RTX 4090 | |
| Asus Prime GeForce RTX 5080 OC Edition | |
| NVIDIA GeForce RTX 5080 Founders Edition | |
| Sapphire Pulse AMD Radeon RX 7900 XTX | |
| NVIDIA GeForce RTX 4080 Founders Edition | |
| Sapphire Pulse AMD Radeon RX 7900 XT | |
| Indiana Jones and the Great Circle | |
| 3840x2160 Very Ultra Preset | |
| NVIDIA GeForce RTX 5090 Founders Edition | |
| NVIDIA GeForce RTX 4090 | |
| Asus Prime GeForce RTX 5080 OC Edition | |
| NVIDIA GeForce RTX 5080 Founders Edition | |
| Sapphire Pulse AMD Radeon RX 7900 XTX | |
| NVIDIA GeForce RTX 4080 Founders Edition | |
| Sapphire Pulse AMD Radeon RX 7900 XT | |
| 2560x1440 Very Ultra Preset | |
| NVIDIA GeForce RTX 5090 Founders Edition | |
| NVIDIA GeForce RTX 4090 | |
| Asus Prime GeForce RTX 5080 OC Edition | |
| NVIDIA GeForce RTX 5080 Founders Edition | |
| Sapphire Pulse AMD Radeon RX 7900 XTX | |
| Sapphire Pulse AMD Radeon RX 7900 XT | |
| NVIDIA GeForce RTX 4080 Founders Edition | |
| 1920x1080 Very Ultra Preset | |
| NVIDIA GeForce RTX 5090 Founders Edition | |
| NVIDIA GeForce RTX 4090 | |
| Asus Prime GeForce RTX 5080 OC Edition | |
| NVIDIA GeForce RTX 5080 Founders Edition | |
| Sapphire Pulse AMD Radeon RX 7900 XTX | |
| Sapphire Pulse AMD Radeon RX 7900 XT | |
| NVIDIA GeForce RTX 4080 Founders Edition | |
| Black Myth: Wukong | |
| 3840x2160 cinematic TSR 100 | |
| NVIDIA GeForce RTX 5090 Founders Edition | |
| NVIDIA GeForce RTX 4090 | |
| NVIDIA GeForce RTX 5080 Founders Edition | |
| Asus Prime GeForce RTX 5080 OC Edition | |
| NVIDIA GeForce RTX 4080 Founders Edition | |
| Sapphire Pulse AMD Radeon RX 7900 XTX | |
| Sapphire Pulse AMD Radeon RX 7900 XT | |
| 2560x1440 cinematic TSR 100 | |
| NVIDIA GeForce RTX 5090 Founders Edition | |
| NVIDIA GeForce RTX 4090 | |
| Asus Prime GeForce RTX 5080 OC Edition | |
| NVIDIA GeForce RTX 5080 Founders Edition | |
| Sapphire Pulse AMD Radeon RX 7900 XTX | |
| NVIDIA GeForce RTX 4080 Founders Edition | |
| Sapphire Pulse AMD Radeon RX 7900 XT | |
| 1920x1080 cinematic TSR 100 | |
| NVIDIA GeForce RTX 5090 Founders Edition | |
| NVIDIA GeForce RTX 4090 | |
| Asus Prime GeForce RTX 5080 OC Edition | |
| NVIDIA GeForce RTX 5080 Founders Edition | |
| NVIDIA GeForce RTX 4080 Founders Edition | |
| Sapphire Pulse AMD Radeon RX 7900 XTX | |
| Sapphire Pulse AMD Radeon RX 7900 XT | |
| Alan Wake 2 | |
| 3840x2160 High Preset | |
| NVIDIA GeForce RTX 5090 Founders Edition | |
| NVIDIA GeForce RTX 4090 | |
| Sapphire Pulse AMD Radeon RX 7900 XTX | |
| Asus Prime GeForce RTX 5080 OC Edition | |
| NVIDIA GeForce RTX 5080 Founders Edition | |
| Sapphire Pulse AMD Radeon RX 7900 XT | |
| NVIDIA GeForce RTX 4080 Founders Edition | |
| 2560x1440 High Preset | |
| NVIDIA GeForce RTX 5090 Founders Edition | |
| Sapphire Pulse AMD Radeon RX 7900 XTX | |
| NVIDIA GeForce RTX 4090 | |
| Asus Prime GeForce RTX 5080 OC Edition | |
| NVIDIA GeForce RTX 5080 Founders Edition | |
| Sapphire Pulse AMD Radeon RX 7900 XT | |
| NVIDIA GeForce RTX 4080 Founders Edition | |
| 1920x1080 High Preset | |
| NVIDIA GeForce RTX 5090 Founders Edition | |
| NVIDIA GeForce RTX 4090 | |
| Sapphire Pulse AMD Radeon RX 7900 XTX | |
| Asus Prime GeForce RTX 5080 OC Edition | |
| NVIDIA GeForce RTX 5080 Founders Edition | |
| Sapphire Pulse AMD Radeon RX 7900 XT | |
| NVIDIA GeForce RTX 4080 Founders Edition | |
| F1 24 | |
| 3840x2160 Ultra High Preset AA:T AF:16x | |
| NVIDIA GeForce RTX 5090 Founders Edition | |
| NVIDIA GeForce RTX 4090 | |
| Asus Prime GeForce RTX 5080 OC Edition | |
| NVIDIA GeForce RTX 5080 Founders Edition | |
| NVIDIA GeForce RTX 4080 Founders Edition | |
| Sapphire Pulse AMD Radeon RX 7900 XTX | |
| Sapphire Pulse AMD Radeon RX 7900 XT | |
| 2560x1440 Ultra High Preset AA:T AF:16x | |
| NVIDIA GeForce RTX 5090 Founders Edition | |
| NVIDIA GeForce RTX 4090 | |
| Asus Prime GeForce RTX 5080 OC Edition | |
| NVIDIA GeForce RTX 5080 Founders Edition | |
| NVIDIA GeForce RTX 4080 Founders Edition | |
| Sapphire Pulse AMD Radeon RX 7900 XTX | |
| Sapphire Pulse AMD Radeon RX 7900 XT | |
| 1920x1080 Ultra High Preset AA:T AF:16x | |
| NVIDIA GeForce RTX 5090 Founders Edition | |
| NVIDIA GeForce RTX 4090 | |
| Asus Prime GeForce RTX 5080 OC Edition | |
| NVIDIA GeForce RTX 5080 Founders Edition | |
| NVIDIA GeForce RTX 4080 Founders Edition | |
| Sapphire Pulse AMD Radeon RX 7900 XTX | |
| Sapphire Pulse AMD Radeon RX 7900 XT | |
| Assassin's Creed Mirage | |
| 3840x2160 Ultra High Preset (Adaptive Quality Off) | |
| NVIDIA GeForce RTX 5090 Founders Edition | |
| NVIDIA GeForce RTX 4090 | |
| NVIDIA GeForce RTX 5080 Founders Edition | |
| Asus Prime GeForce RTX 5080 OC Edition | |
| Sapphire Pulse AMD Radeon RX 7900 XTX | |
| NVIDIA GeForce RTX 4080 Founders Edition | |
| Sapphire Pulse AMD Radeon RX 7900 XT | |
| 2560x1440 Ultra High Preset (Adaptive Quality Off) | |
| NVIDIA GeForce RTX 5090 Founders Edition | |
| Asus Prime GeForce RTX 5080 OC Edition | |
| NVIDIA GeForce RTX 5080 Founders Edition | |
| Sapphire Pulse AMD Radeon RX 7900 XTX | |
| Sapphire Pulse AMD Radeon RX 7900 XT | |
| NVIDIA GeForce RTX 4080 Founders Edition | |
| NVIDIA GeForce RTX 4090 | |
| 1920x1080 Ultra High Preset (Adaptive Quality Off) | |
| NVIDIA GeForce RTX 4090 | |
| NVIDIA GeForce RTX 5090 Founders Edition | |
| NVIDIA GeForce RTX 5080 Founders Edition | |
| Asus Prime GeForce RTX 5080 OC Edition | |
| Sapphire Pulse AMD Radeon RX 7900 XTX | |
| Sapphire Pulse AMD Radeon RX 7900 XT | |
| NVIDIA GeForce RTX 4080 Founders Edition | |
| Avatar Frontiers of Pandora | |
| 3840x2160 Ultra Preset AA:T | |
| NVIDIA GeForce RTX 5090 Founders Edition | |
| NVIDIA GeForce RTX 4090 | |
| NVIDIA GeForce RTX 5080 Founders Edition | |
| Asus Prime GeForce RTX 5080 OC Edition | |
| Sapphire Pulse AMD Radeon RX 7900 XTX | |
| NVIDIA GeForce RTX 4080 Founders Edition | |
| Sapphire Pulse AMD Radeon RX 7900 XT | |
| 2560x1440 Ultra Preset AA:T | |
| NVIDIA GeForce RTX 5090 Founders Edition | |
| NVIDIA GeForce RTX 4090 | |
| NVIDIA GeForce RTX 5080 Founders Edition | |
| Asus Prime GeForce RTX 5080 OC Edition | |
| Sapphire Pulse AMD Radeon RX 7900 XTX | |
| NVIDIA GeForce RTX 4080 Founders Edition | |
| Sapphire Pulse AMD Radeon RX 7900 XT | |
| 1920x1080 Ultra Preset AA:T | |
| NVIDIA GeForce RTX 5090 Founders Edition | |
| NVIDIA GeForce RTX 4090 | |
| NVIDIA GeForce RTX 5080 Founders Edition | |
| Asus Prime GeForce RTX 5080 OC Edition | |
| Sapphire Pulse AMD Radeon RX 7900 XTX | |
| NVIDIA GeForce RTX 4080 Founders Edition | |
| Sapphire Pulse AMD Radeon RX 7900 XT | |
| Cyberpunk 2077 | |
| 2560x1440 Ultra Preset (FSR off) | |
| NVIDIA GeForce RTX 5090 Founders Edition | |
| Asus Prime GeForce RTX 5080 OC Edition | |
| NVIDIA GeForce RTX 5080 Founders Edition | |
| NVIDIA GeForce RTX 4090 | |
| Sapphire Pulse AMD Radeon RX 7900 XTX | |
| Sapphire Pulse AMD Radeon RX 7900 XT | |
| NVIDIA GeForce RTX 4080 Founders Edition | |
| 1920x1080 Ultra Preset (FSR off) | |
| NVIDIA GeForce RTX 5090 Founders Edition | |
| Sapphire Pulse AMD Radeon RX 7900 XTX | |
| NVIDIA GeForce RTX 4090 | |
| Asus Prime GeForce RTX 5080 OC Edition | |
| Sapphire Pulse AMD Radeon RX 7900 XT | |
| NVIDIA GeForce RTX 5080 Founders Edition | |
| NVIDIA GeForce RTX 4080 Founders Edition | |
| X-Plane 11.11 | |
| 3840x2160 high (fps_test=3) | |
| NVIDIA GeForce RTX 5090 Founders Edition | |
| NVIDIA GeForce RTX 4090 | |
| Asus Prime GeForce RTX 5080 OC Edition | |
| NVIDIA GeForce RTX 5080 Founders Edition | |
| NVIDIA GeForce RTX 4080 Founders Edition | |
| Sapphire Pulse AMD Radeon RX 7900 XTX | |
| Sapphire Pulse AMD Radeon RX 7900 XT | |
| 1920x1080 high (fps_test=3) | |
| NVIDIA GeForce RTX 5090 Founders Edition | |
| NVIDIA GeForce RTX 5080 Founders Edition | |
| NVIDIA GeForce RTX 4090 | |
| Asus Prime GeForce RTX 5080 OC Edition | |
| NVIDIA GeForce RTX 4080 Founders Edition | |
| Sapphire Pulse AMD Radeon RX 7900 XTX | |
| Sapphire Pulse AMD Radeon RX 7900 XT | |
Wydajność śledzenia promieni
Przewagi RX 7900 XTX w rasteryzacji gry Alan Wake 2 nie da się przenieść na ustawienia ray tracingu, gdzie Prime RTX 5080 OC ustępuje mu o 47% w rozdzielczości 4K.
W grze Cyberpunk 2077 Phantom Liberty, Prime RTX 5080 OC uzyskuje aż 58% przewagę nad RX 7900 XTX. Jednak zyski pochodzące z RTX 5080 FE są raczej niewielkie.
16 GB pamięci VRAM GDDR7 w RTX 5080 jest o 30% szybsze niż odpowiednik GDDR6X w RTX 4080 Super. Może to jednak okazać się poważnym ograniczeniem w niektórych ustawieniach w nowoczesnych tytułach AAA.
Przykładowo, w grze Indiana Jones and the Great Circle niemożliwe jest nawet poruszanie się po menu, nie mówiąc już o graniu, gdy włączone jest pełne śledzenie ścieżki w rozdzielczości 4K. Włączenie DLSS i generowania klatek również nie pomaga.
| Indiana Jones and the Great Circle - 2560x1440 Very Ultra Preset + Full Path Tracing + Quality DLSS + Frame Generation | |
| NVIDIA GeForce RTX 5090 Founders Edition | |
| NVIDIA GeForce RTX 4090 | |
| Asus Prime GeForce RTX 5080 OC Edition | |
| NVIDIA GeForce RTX 5080 Founders Edition | |
| NVIDIA GeForce RTX 4080 Founders Edition | |
| Black Myth: Wukong | |
| 3840x2160 cinematic RT: Very High DLSS 68 FG | |
| NVIDIA GeForce RTX 4090 | |
| NVIDIA GeForce RTX 5090 Founders Edition | |
| Asus Prime GeForce RTX 5080 OC Edition | |
| NVIDIA GeForce RTX 5080 Founders Edition | |
| NVIDIA GeForce RTX 4080 Founders Edition | |
| 2560x1440 cinematic RT: Very High DLSS 68 FG | |
| NVIDIA GeForce RTX 5090 Founders Edition | |
| NVIDIA GeForce RTX 4090 | |
| Asus Prime GeForce RTX 5080 OC Edition | |
| NVIDIA GeForce RTX 5080 Founders Edition | |
| NVIDIA GeForce RTX 4080 Founders Edition | |
| Alan Wake 2 | |
| 3840x2160 High Preset + High Ray Tracing | |
| NVIDIA GeForce RTX 5090 Founders Edition | |
| NVIDIA GeForce RTX 4090 | |
| Asus Prime GeForce RTX 5080 OC Edition | |
| NVIDIA GeForce RTX 5080 Founders Edition | |
| NVIDIA GeForce RTX 4080 Founders Edition | |
| Sapphire Pulse AMD Radeon RX 7900 XTX | |
| Sapphire Pulse AMD Radeon RX 7900 XT | |
| 1920x1080 High Preset + High Ray Tracing | |
| NVIDIA GeForce RTX 5090 Founders Edition | |
| NVIDIA GeForce RTX 4090 | |
| Asus Prime GeForce RTX 5080 OC Edition | |
| NVIDIA GeForce RTX 5080 Founders Edition | |
| NVIDIA GeForce RTX 4080 Founders Edition | |
| Sapphire Pulse AMD Radeon RX 7900 XTX | |
| Sapphire Pulse AMD Radeon RX 7900 XT | |
| 3840x2160 High Preset + High Ray Tracing + Quality DLSS + FG | |
| NVIDIA GeForce RTX 5090 Founders Edition | |
| NVIDIA GeForce RTX 4090 | |
| Asus Prime GeForce RTX 5080 OC Edition | |
| NVIDIA GeForce RTX 5080 Founders Edition | |
| NVIDIA GeForce RTX 4080 Founders Edition | |
| Cyberpunk 2077 | |
| 3840x2160 Ray Tracing Ultra Preset (DLSS off, no Path Tracing) | |
| NVIDIA GeForce RTX 5090 Founders Edition | |
| NVIDIA GeForce RTX 4090 | |
| NVIDIA GeForce RTX 5080 Founders Edition | |
| Asus Prime GeForce RTX 5080 OC Edition | |
| NVIDIA GeForce RTX 4080 Founders Edition | |
| Sapphire Pulse AMD Radeon RX 7900 XTX | |
| Sapphire Pulse AMD Radeon RX 7900 XT | |
| 1920x1080 Ray Tracing Ultra Preset (DLSS off) | |
| NVIDIA GeForce RTX 5090 Founders Edition | |
| NVIDIA GeForce RTX 4090 | |
| Asus Prime GeForce RTX 5080 OC Edition | |
| NVIDIA GeForce RTX 5080 Founders Edition | |
| NVIDIA GeForce RTX 4080 Founders Edition | |
| Sapphire Pulse AMD Radeon RX 7900 XTX | |
| Sapphire Pulse AMD Radeon RX 7900 XT | |
Generowanie wielu ramek DLSS 4
Tylko kilka tytułów obsługuje obecnie generowanie wielu klatek DLSS 4 (MFG) po wyjęciu z pudełka. Jednak wiele innych obsługiwanych gier może wykorzystywać DLSS 4 (dla wszystkich procesorów graficznych RTX) i MFG (tylko dla procesorów graficznych Blackwell) poprzez nadpisywanie w aplikacji Nvidia
W porównaniu do Alan Wake 2 lub Cyberpunk 2077 Phantom Liberty, Star Wars Outlaws wykazuje 5-7% wzrost na Prime RTX 5080 OC w porównaniu do RTX 5080 FE z włączonym DLSS i generowaniem klatek.
Co ciekawe, zauważyliśmy anomalie w Cyberpunk 2077 Phantom Liberty z włączonym MFG 2x w presecie 4K Ray Tracing Overdrive, gdzie Prime RTX 5080 OC działał o 31% wolniej niż RTX 5080 FE.
Pomimo dwukrotnego sprawdzenia, czy ustawienia, sterownik i wersja systemu operacyjnego były identyczne dla obu testów, karta Asusa niespodziewanie wypadła gorzej.
| Alan Wake 2 | |
| 3840x2160 High Preset + Ultra Ray Tracing + Quality DLSS + FG 4x | |
| NVIDIA GeForce RTX 5090 Founders Edition | |
| Asus Prime GeForce RTX 5080 OC Edition | |
| NVIDIA GeForce RTX 5080 Founders Edition | |
| 3840x2160 High Preset + Ultra Ray Tracing + Quality DLSS + FG 2x | |
| NVIDIA GeForce RTX 5090 Founders Edition | |
| Asus Prime GeForce RTX 5080 OC Edition | |
| NVIDIA GeForce RTX 5080 Founders Edition | |
| 3840x2160 High Preset + High Ray Tracing + Quality DLSS + FG | |
| NVIDIA GeForce RTX 5090 Founders Edition | |
| NVIDIA GeForce RTX 4090 | |
| Asus Prime GeForce RTX 5080 OC Edition | |
| NVIDIA GeForce RTX 5080 Founders Edition | |
| Cyberpunk 2077 | |
| 3840x2160 Ray Tracing Overdrive Preset + DLSS 4 Transformer Quality + Frame Generation MFG 4x | |
| NVIDIA GeForce RTX 5090 Founders Edition | |
| NVIDIA GeForce RTX 5080 Founders Edition | |
| Asus Prime GeForce RTX 5080 OC Edition | |
| 3840x2160 Ray Tracing Overdrive Preset + DLSS 4 Transformer Quality + Frame Generation (M)FG 2x | |
| NVIDIA GeForce RTX 5090 Founders Edition | |
| NVIDIA GeForce RTX 5080 Founders Edition | |
| Asus Prime GeForce RTX 5080 OC Edition | |
| 2560x1440 Ultra Preset DLSS4 quality no FG | |
| NVIDIA GeForce RTX 5090 Founders Edition | |
| Asus Prime GeForce RTX 5080 OC Edition | |
| Star Wars Outlaws | |
| 2560x1440 cinem. ultra, RT ultra, DLSS, FG RR | |
| NVIDIA GeForce RTX 5090 Founders Edition | |
| NVIDIA GeForce RTX 4090 | |
| Asus Prime GeForce RTX 5080 OC Edition | |
| NVIDIA GeForce RTX 5080 Founders Edition | |
| 3840x2160 cinem. ultra, RT ultra, DLSS, FG RR | |
| NVIDIA GeForce RTX 5090 Founders Edition | |
| NVIDIA GeForce RTX 4090 | |
| Asus Prime GeForce RTX 5080 OC Edition | |
| NVIDIA GeForce RTX 5080 Founders Edition | |
| 3840x2160 cinem. ultra, RT ultra, DLSS, FG 4x, RR | |
| NVIDIA GeForce RTX 5090 Founders Edition | |
| Asus Prime GeForce RTX 5080 OC Edition | |
| NVIDIA GeForce RTX 5080 Founders Edition | |
| low | med. | high | ultra | QHD DLSS | QHD | 4K DLSS | 4K | |
|---|---|---|---|---|---|---|---|---|
| The Witcher 3 (2015) | 278 | 232 | 225 | |||||
| X-Plane 11.11 (2018) | 154.2 | 128.1 | ||||||
| Baldur's Gate 3 (2023) | 240 | 193.7 | 169.8 | 109.4 | ||||
| Cyberpunk 2077 (2023) | 180.2 | 163.3 | 152.5 | |||||
| Assassin's Creed Mirage (2023) | 194 | 163 | 140 | 109 | ||||
| Alan Wake 2 (2023) | 146.9 | 108.6 | 95.2 | 57.6 | ||||
| Avatar Frontiers of Pandora (2023) | 132.6 | 94.5 | 85.9 | 51.1 | ||||
| F1 24 (2024) | 204 | 204 | 141.9 | 122 | 73.2 | |||
| Black Myth: Wukong (2024) | 80 | 88 | 63 | 65 | 38 | |||
| Star Wars Outlaws (2024) | 108.7 | 104.3 | 80.6 | 71.4 | 50 | |||
| Stalker 2 (2024) | 102.4 | 171.6 | 87.4 | 113.7 | 55 | |||
| Indiana Jones and the Great Circle (2024) | 168.5 | 139.4 | 93 |
Emisje: Dopuszczalna emisja ciepła i hałasu
Asus Prime GeForce RTX 5080 OC Edition ma kilka sztuczek w rękawie, aby zarządzać termiką. Nie ma materiału interfejsu termicznego z ciekłego metalu, ale Asus twierdzi, że karta wykorzystuje podkładkę termiczną z przemianą fazową dla lepszej przewodności, w połączeniu z kombinacją komory parowej i radiatora.
Co więcej, wentylowana metalowa płyta tylna została zaprojektowana tak, aby pomóc w lepszym rozpraszaniu ciepła.
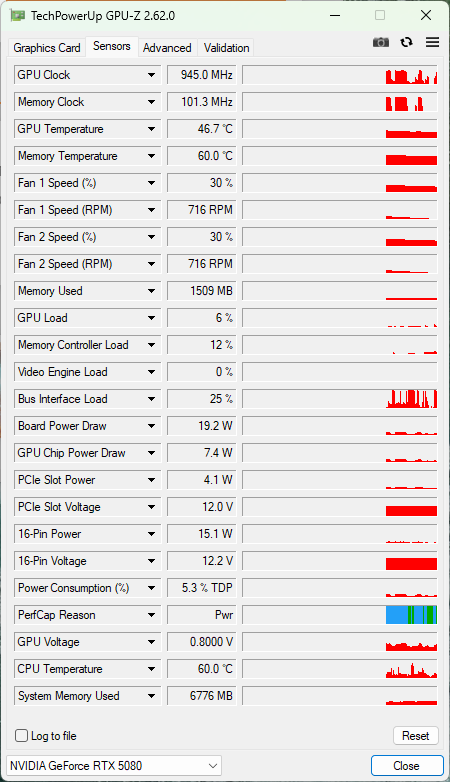
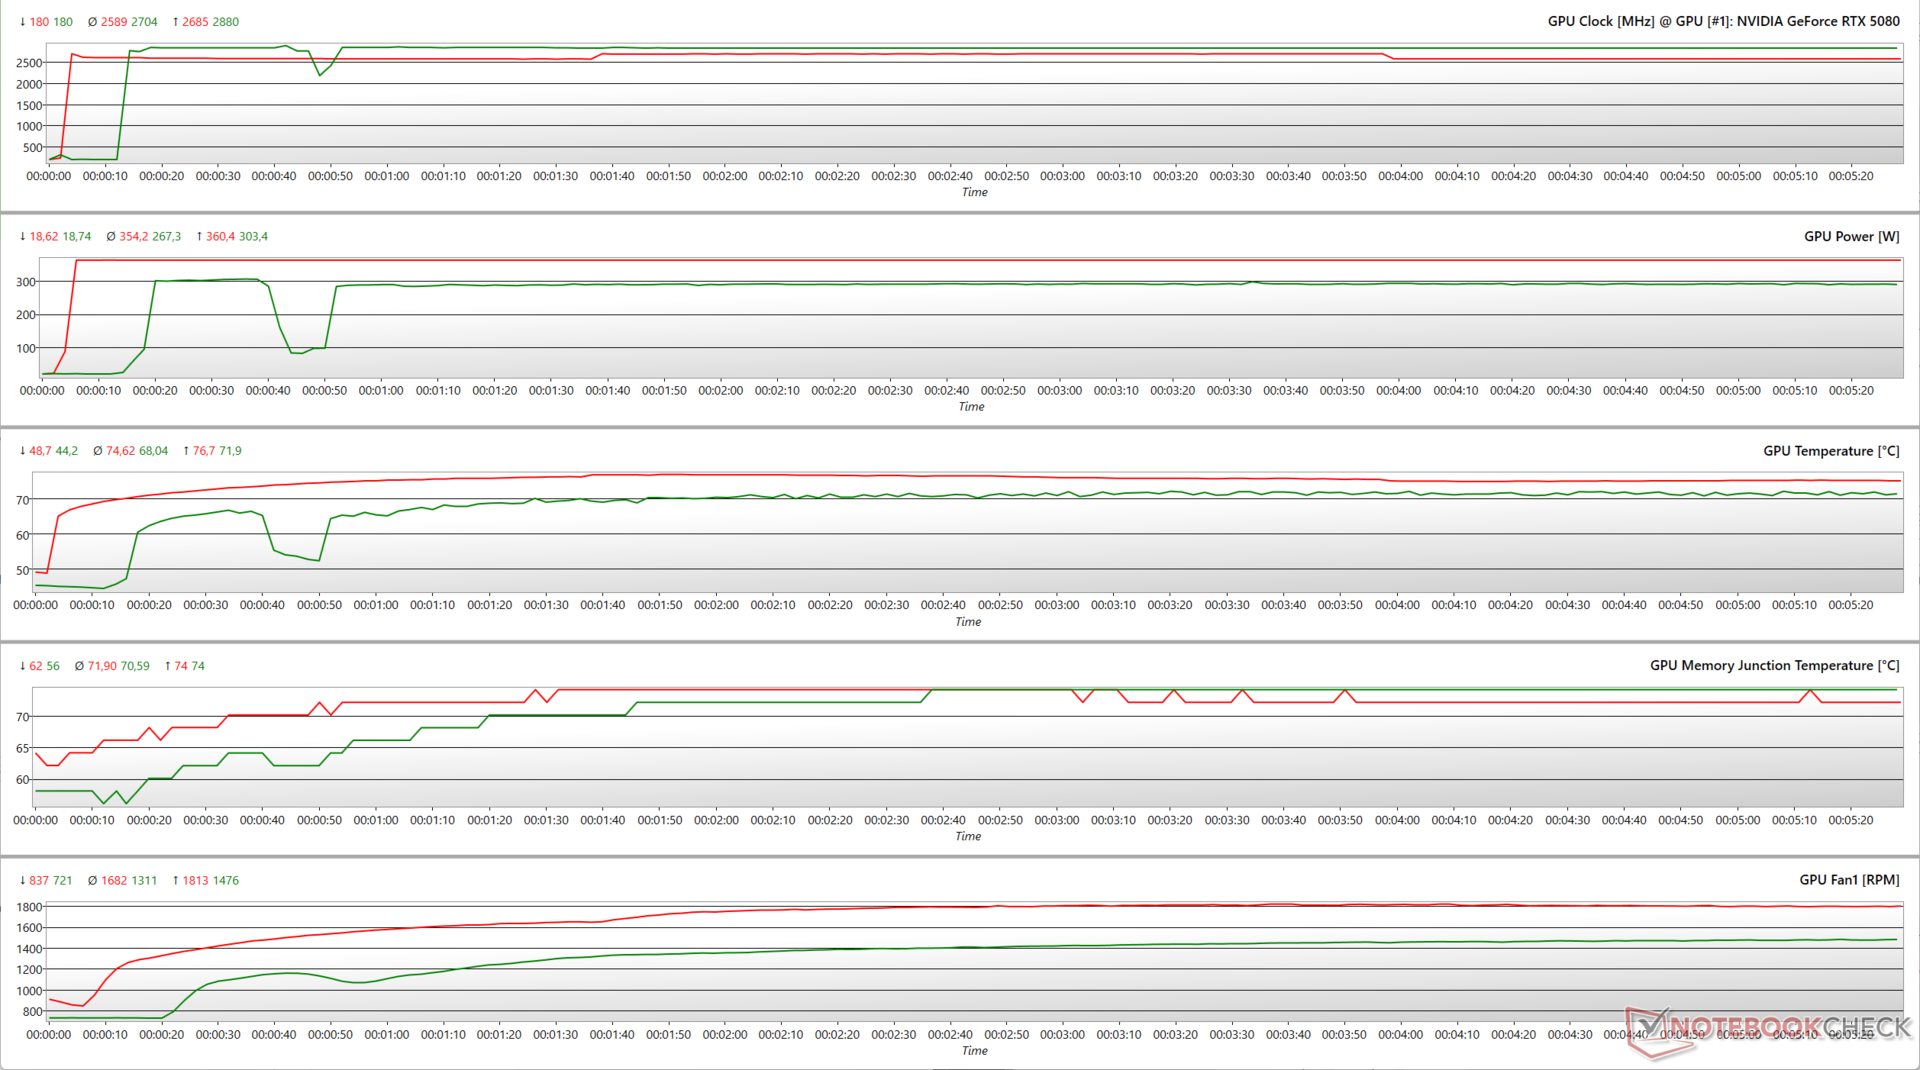
Test warunków skrajnych
Przeprowadzenie krótkiego testu obciążeniowego za pomocą FurMark (1280x720, bez AA) pokazuje, że Prime RTX 5080 OC jest w stanie osiągnąć znamionowe podkręcenie do 2685 MHz przy zużyciu 360 W i średnich temperaturach rdzenia w okolicach 74,6°C.
Podkręcając grę Cyberpunk 2077 Phantom Liberty w rozdzielczości 1080p na ustawieniach Ultra, Prime RTX 5080 OC osiąga jeszcze wyższe taktowanie do 2,880 MHz przy zaledwie 303 W i średnich temperaturach na poziomie 68 °C.
Pokazuje to, że Blackwell jest dość podobny do Ady, jeśli chodzi o oportunistyczne zwiększanie zegarów w oparciu o dostępny zapas ciepła i mocy.
Temperatury powierzchni
Przednia osłona Prime RTX 5080 OC pozostaje dość chłodna nawet przy dużym obciążeniu, choć płyta tylna osiąga temperaturę 62 °C, a obszar GPU może osiągnąć 78 °C, gdy temperatura otoczenia wynosi 23 °C
W pobliżu złącza 12VHPWR odnotowaliśmy temperatury w okolicach 46 °C, co nie jest niepokojące.


Poziomy hałasu

Potrójne wentylatory Axial-tech zastosowane w Prime RTX 5080 OC posiadają podwójne łożyska kulkowe i dłuższe łopatki dla lepszej niezawodności i chłodzenia.
W domyślnej krzywej wentylatora, wentylatory zatrzymują się na biegu jałowym, gdy temperatura rdzenia spadnie poniżej 50 °C.
Maksymalny poziom ciśnienia akustycznego (SPL) wyniósł 47,6 dB(A) podczas testu FurMark przy 111% docelowej mocy.
Użytkownicy mogą wybierać pomiędzy trybami Performance i Quiet VBIOS, przy czym tryb Quiet jest w dużej mierze skuteczny w ograniczaniu poziomu hałasu w okolicach 40 db(A).
| Test obciążeniowy | Tryb VBIOS/ Docelowa moc | Hałas wentylatora dB(A) |
| FurMark 1280 x 720, bez AA | Wydajność / 100% | 45,26 |
| FurMark 1280 x 720, bez AA | Cisza / 100% | 40.01 |
| FurMark 1280 x 720, bez AA | Wydajność / 111% | 47.60 |
| FurMark 1280 x 720, bez AA | Cicha / 111% | 43.35 |
| Cyberpunk 2077 1080p Ultra | Wydajność / 100% | 40.75 |
| Cyberpunk 2077 1080p Ultra | Cichy / 100% | 38.80 |
| Cyberpunk 2077 1080p Ultra | Wydajność / 111% | 41.58 |
| Cyberpunk 2077 1080p Ultra | Cichy / 111% | 38.58 |
Zarządzanie energią: Mile widziany wzrost wydajności w grach w porównaniu do RX 7900 XTX
Prime GeForce RTX 5080 OC Edition wykazuje nieco niższy pobór mocy ze ściany niż RTX 5080 FE w FurMark (1280x720, bez AA), pomimo wyższego taktowania.
I odwrotnie, podczas gdy pobór mocy w Cyberpunk 2077 1080p Ultra jest praktycznie identyczny pomiędzy GPU Prime RTX 5080 OC i RTX 5080 FE, karta Asusa wykazuje o 13% wyższe zużycie energii w porównaniu do FE w The Witcher 3 w 1080p Ultra.
W konsekwencji, procesor graficzny Prime jest o 4% bardziej energooszczędny niż karta FE w Cyberpunk 2077, podczas gdy ta druga wykazuje o 13% wyższą wydajność w The Witcher 3.
To powiedziawszy, Prime RTX 5080 OC jest o dobre 20% bardziej energooszczędny w The Witcher 3 niż Radeon RX 7900 XTX.
Power consumption: External monitor
:
| Power Consumption / FurMark 1.19 GPU Stress Test (external Monitor) | |
| NVIDIA GeForce RTX 5090 Founders Edition (Idle: 90 W) | |
| NVIDIA GeForce RTX 4090 (Idle: 82 W) | |
| Sapphire Pulse AMD Radeon RX 7900 XTX (Idle: 74 W) | |
| NVIDIA GeForce RTX 5080 Founders Edition (Idle: 70 W) | |
| Sapphire Pulse AMD Radeon RX 7900 XT (Idle: 94 W) | |
| Asus Prime GeForce RTX 5080 OC Edition (Idle: 78 W) | |
| NVIDIA GeForce RTX 4080 Founders Edition (Idle: 72 W) | |
| Power Consumption / Cyberpunk 2077 FHD ultra no FSR (external Monitor) | |
| Sapphire Pulse AMD Radeon RX 7900 XTX (Idle: 74 W) | |
| Sapphire Pulse AMD Radeon RX 7900 XT (Idle: 94 W) | |
| NVIDIA GeForce RTX 5090 Founders Edition (Idle: 90 ) | |
| NVIDIA GeForce RTX 4090 (Idle: 82 W) | |
| Asus Prime GeForce RTX 5080 OC Edition (Idle: 78 W) | |
| NVIDIA GeForce RTX 5080 Founders Edition (Idle: 70 W) | |
| NVIDIA GeForce RTX 4080 Founders Edition (Idle: 72 W) | |
| Power Consumption / Cyberpunk 2077 ultra Efficiency | |
| Asus Prime GeForce RTX 5080 OC Edition | |
| NVIDIA GeForce RTX 5080 Founders Edition | |
| NVIDIA GeForce RTX 4090 | |
| NVIDIA GeForce RTX 4080 Founders Edition | |
| NVIDIA GeForce RTX 5090 Founders Edition | |
| Sapphire Pulse AMD Radeon RX 7900 XT | |
| Sapphire Pulse AMD Radeon RX 7900 XTX | |
| Power Consumption / The Witcher 3 ultra (external Monitor) | |
| NVIDIA GeForce RTX 5090 Founders Edition (Idle: 90 W) | |
| Sapphire Pulse AMD Radeon RX 7900 XTX (Idle: 74 W) | |
| NVIDIA GeForce RTX 4090 (Idle: 82 W) | |
| Sapphire Pulse AMD Radeon RX 7900 XT (Idle: 94 W) | |
| Asus Prime GeForce RTX 5080 OC Edition (Idle: 78 W) | |
| NVIDIA GeForce RTX 5080 Founders Edition (Idle: 70 W) | |
| NVIDIA GeForce RTX 4080 Founders Edition (Idle: 72 W) | |
| Power Consumption / Witcher 3 ultra Efficiency (external Monitor) | |
| NVIDIA GeForce RTX 5080 Founders Edition | |
| NVIDIA GeForce RTX 4080 Founders Edition | |
| NVIDIA GeForce RTX 4090 | |
| Asus Prime GeForce RTX 5080 OC Edition | |
| NVIDIA GeForce RTX 5090 Founders Edition | |
| Sapphire Pulse AMD Radeon RX 7900 XT | |
| Sapphire Pulse AMD Radeon RX 7900 XTX | |
| 1280x720 FurMark 1.19 GPU Stress Test (external Monitor) | |
| 1920x1080 The Witcher 3 ultra (external Monitor) | |
* ... im mniej tym lepiej
Wrażenia Notebookcheck dotyczące karty Asus Prime GeForce RTX 5080 OC Edition
Dzięki Prime GeForce RTX 5080 OC Edition, Asus dostarczył realną opcję AiB dla własnej GeForce RTX 5080 Founders Edition firmy Nvidia. Jednak marża w wysokości 320 USD w stosunku do RTX 5080 FE może odstraszyć potencjalnych nabywców.
Przezroczystość
Wyboru urządzeń do recenzji dokonuje nasza redakcja. Próbka testowa została udostępniona autorowi jako pożyczka od producenta lub sprzedawcy detalicznego na potrzeby tej recenzji. Pożyczkodawca nie miał wpływu na tę recenzję, producent nie otrzymał też kopii tej recenzji przed publikacją. Nie było obowiązku publikowania tej recenzji. Jako niezależna firma medialna, Notebookcheck nie podlega władzy producentów, sprzedawców detalicznych ani wydawców.
Tak testuje Notebookcheck
Każdego roku Notebookcheck niezależnie sprawdza setki laptopów i smartfonów, stosując standardowe procedury, aby zapewnić porównywalność wszystkich wyników. Od około 20 lat stale rozwijamy nasze metody badawcze, ustanawiając przy tym standardy branżowe. W naszych laboratoriach testowych doświadczeni technicy i redaktorzy korzystają z wysokiej jakości sprzętu pomiarowego. Testy te obejmują wieloetapowy proces walidacji. Nasz kompleksowy system ocen opiera się na setkach uzasadnionych pomiarów i benchmarków, co pozwala zachować obiektywizm.
