

Recenzja Geekom XT13 Pro: NUC mini-PC bez Meteor Lake i tylko z procesorem Intel Core i9-13900H
Geekom XT13 Pro odziedziczył po Geekom XT12 Pro i jest dostępny w najwyższej konfiguracji z procesorem Intel Core i9-13900H wyposażony. Jest też 32 GB pamięci RAM DDR4 i dysk SSD o pojemności 2 TB, choć ma to swoją cenę. Cena wynosi 999 euro, więc naprawdę nie jest to okazja. Za 769 euro Geekom XT13 Pro jest dostępny z procesorem Intel Core i7-13620H i dyskiem SSD o pojemności 1 TB. Geekom zdecydował się nie używać nowszych procesorów Meteor Lake i trzyma się starszych procesorów Raptor Lake. Ten test pokaże, czy jest to właściwy sposób na stawienie czoła konkurencji.
Pojawia się również pytanie, czy takie ceny są uzasadnione. Tym ważnym punktem również zajmiemy się po analizie wydajności. W każdym razie sam producent stawia poprzeczkę bardzo wysoko.
Potencjalni konkurenci w porównaniu
Ocena | Wersja | Data | Model | Pamięć | Waga | Wysokość |
|---|---|---|---|---|---|---|
| 72.4 % | v8 | 08/2024 | Geekom XT13 Pro i9-13900H, Iris Xe G7 96EUs | 32768 MB | 555 g | 37 mm |
| 80.8 % | v8 | 06/2024 | Aoostar GEM12 R7 8845HS, Radeon 780M | 32768 MB | 653 g | 60 mm |
| 87.5 % v7 (old) | v7 (old) | 05/2024 | Minisforum AtomMan X7 Ti Ultra 9 185H, Arc 8-Core | 32768 MB | 863 g | 48.6 mm |
| 83.4 % v7 (old) | v7 (old) | 04/2024 | Acemagic F2A Ultra 7 155H, Arc 8-Core | 32768 MB | 768 g | 57 mm |
| 84.1 % | v8 | 04/2024 | Geekom XT12 Pro i9-12900H, Iris Xe G7 96EUs | 32768 MB | 545 g | 37 mm |
| 82.6 % v7 (old) | v7 (old) | 03/2024 | Geekom A7 R9 7940HS, Radeon 780M | 32768 MB | 417 g | 38 mm |
Uwaga: Zaktualizowaliśmy nasz system oceniania i wyniki wersji 8 nie są porównywalne z wynikami wersji 7 dostępnej tutaj.

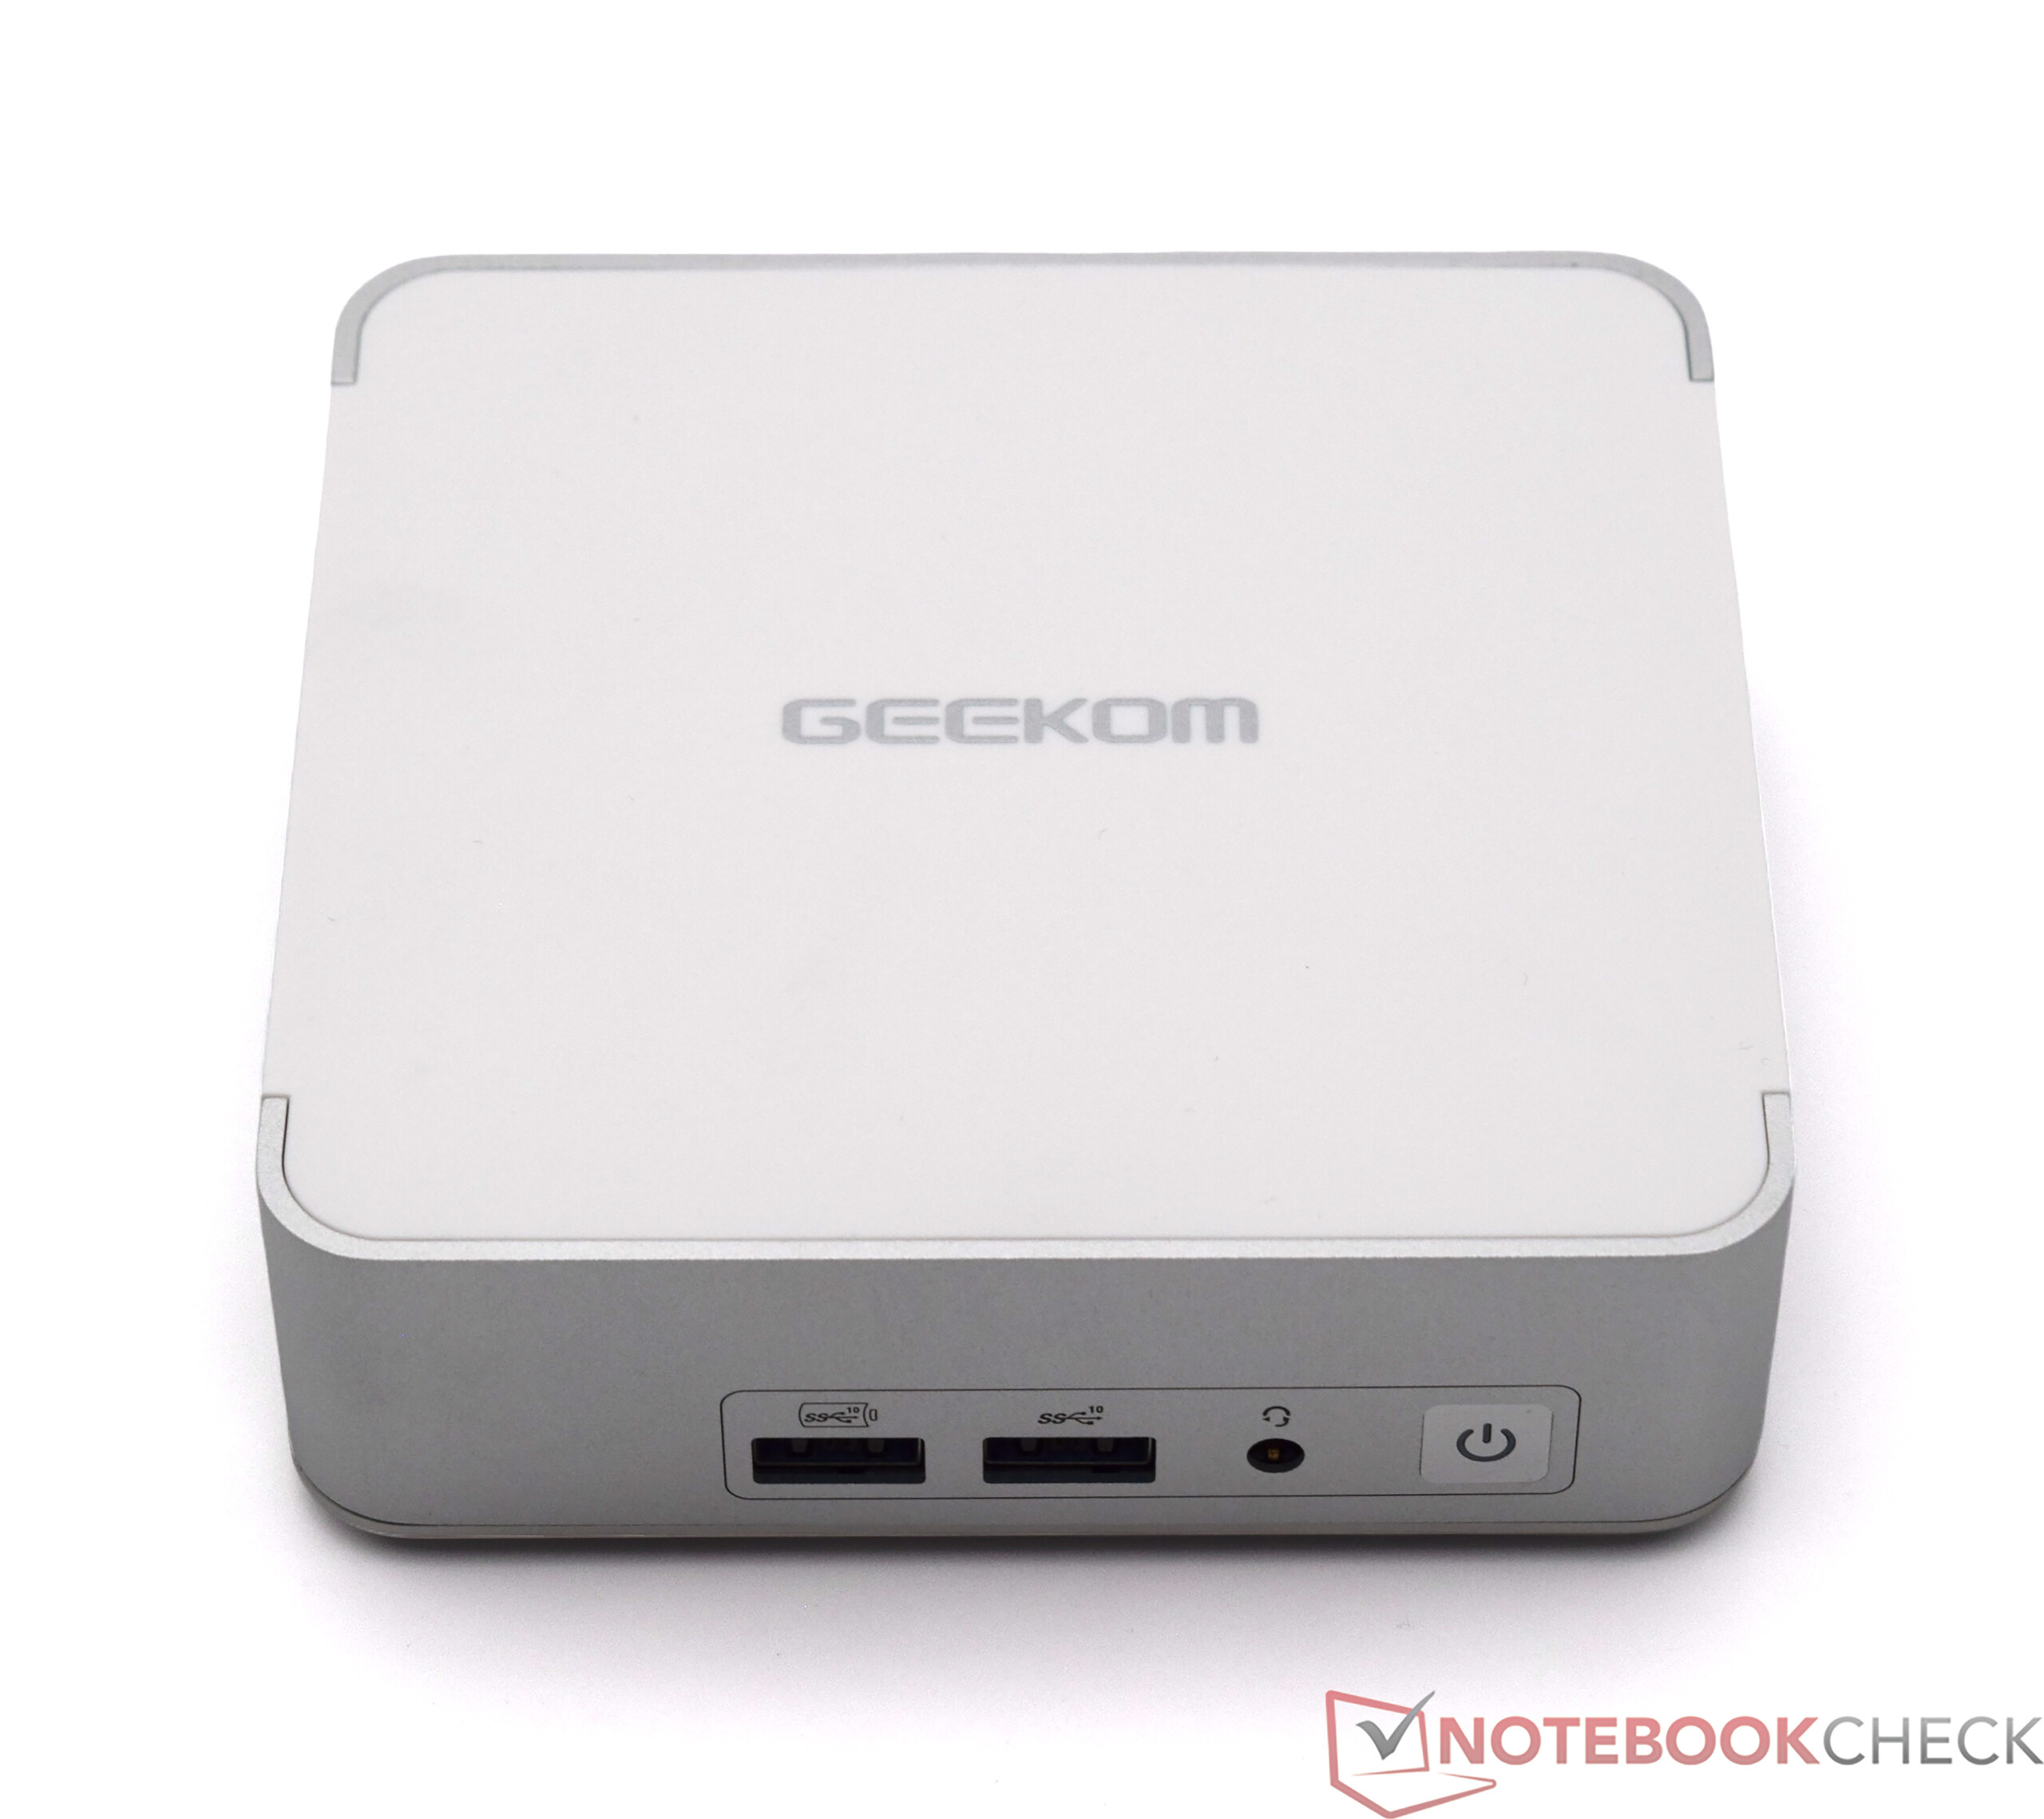
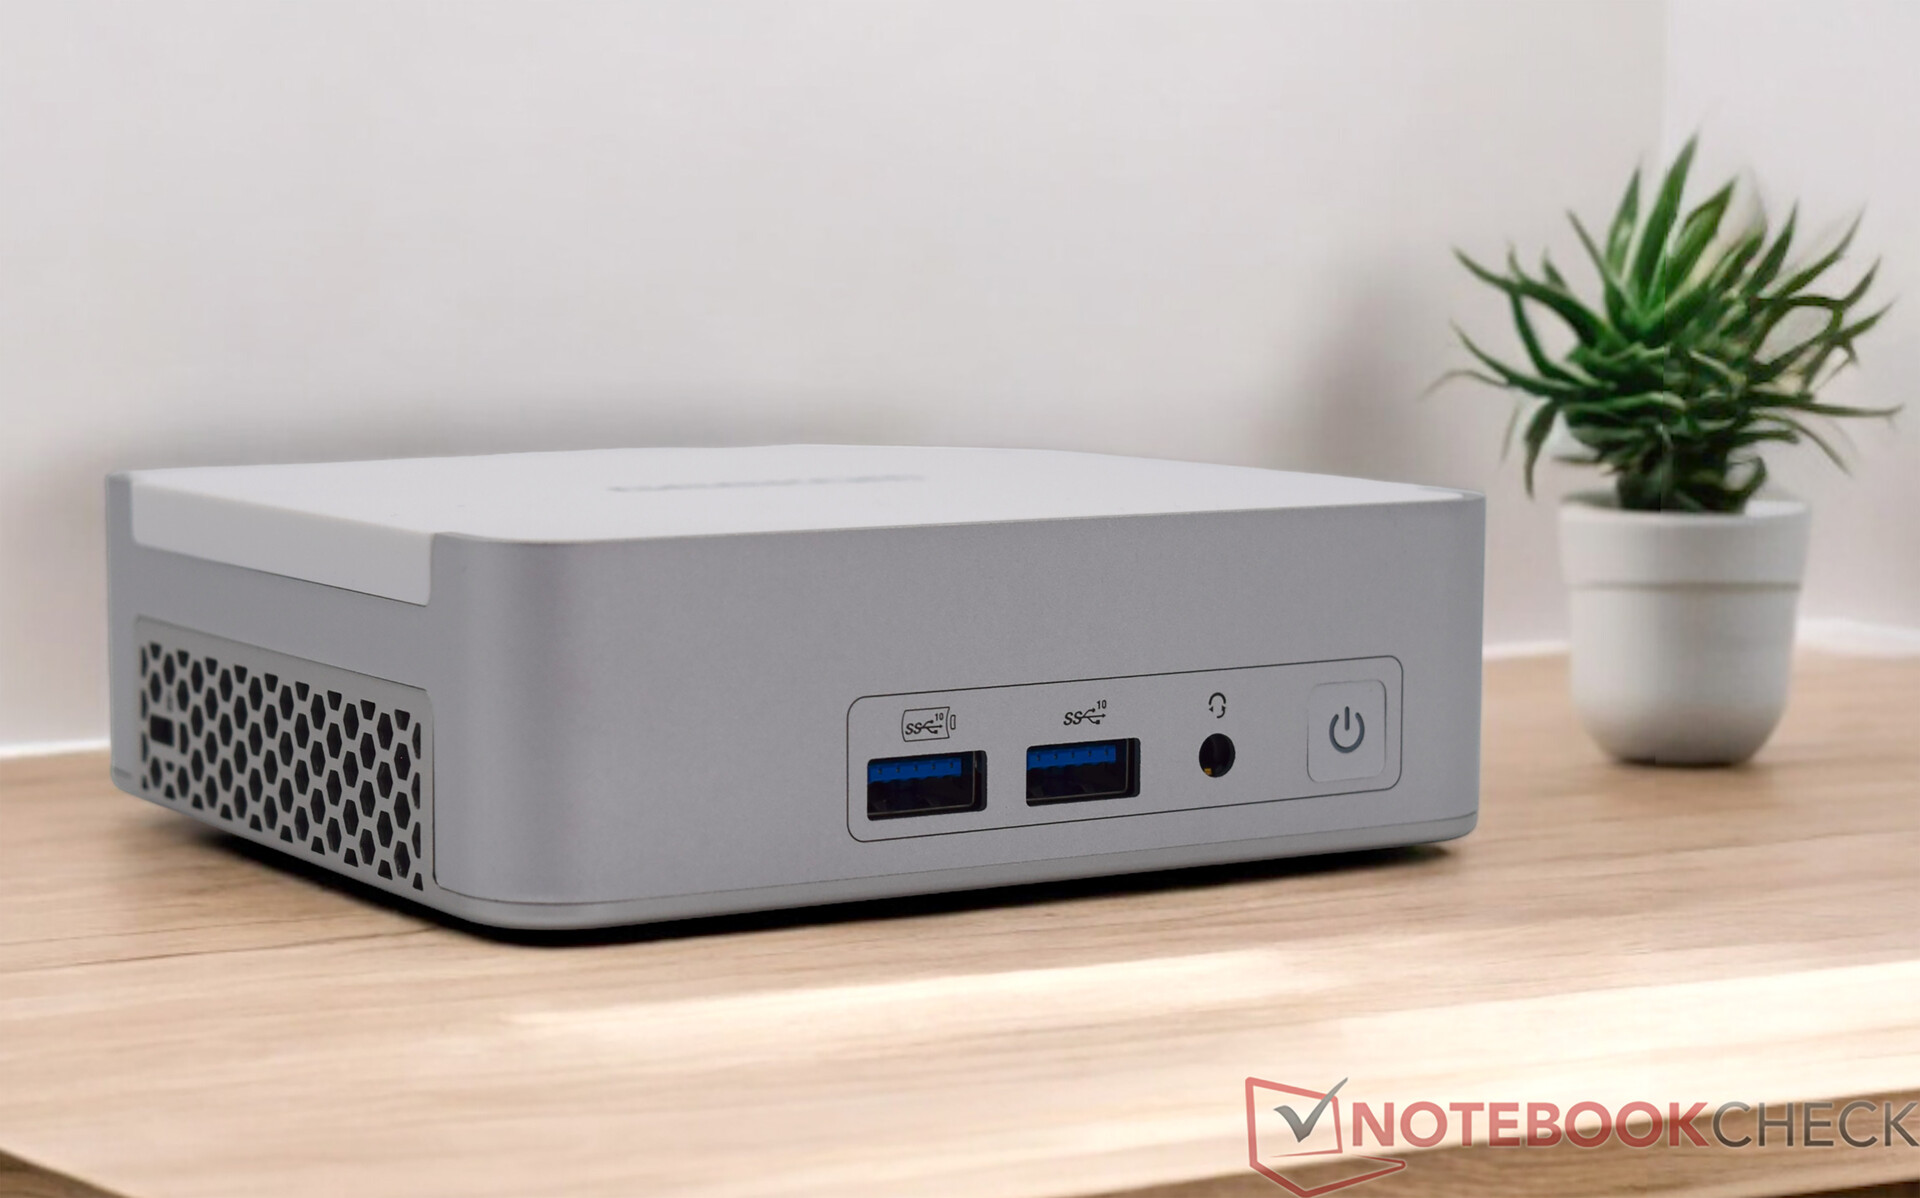
Obudowa - Doskonała obróbka metalu i plastiku
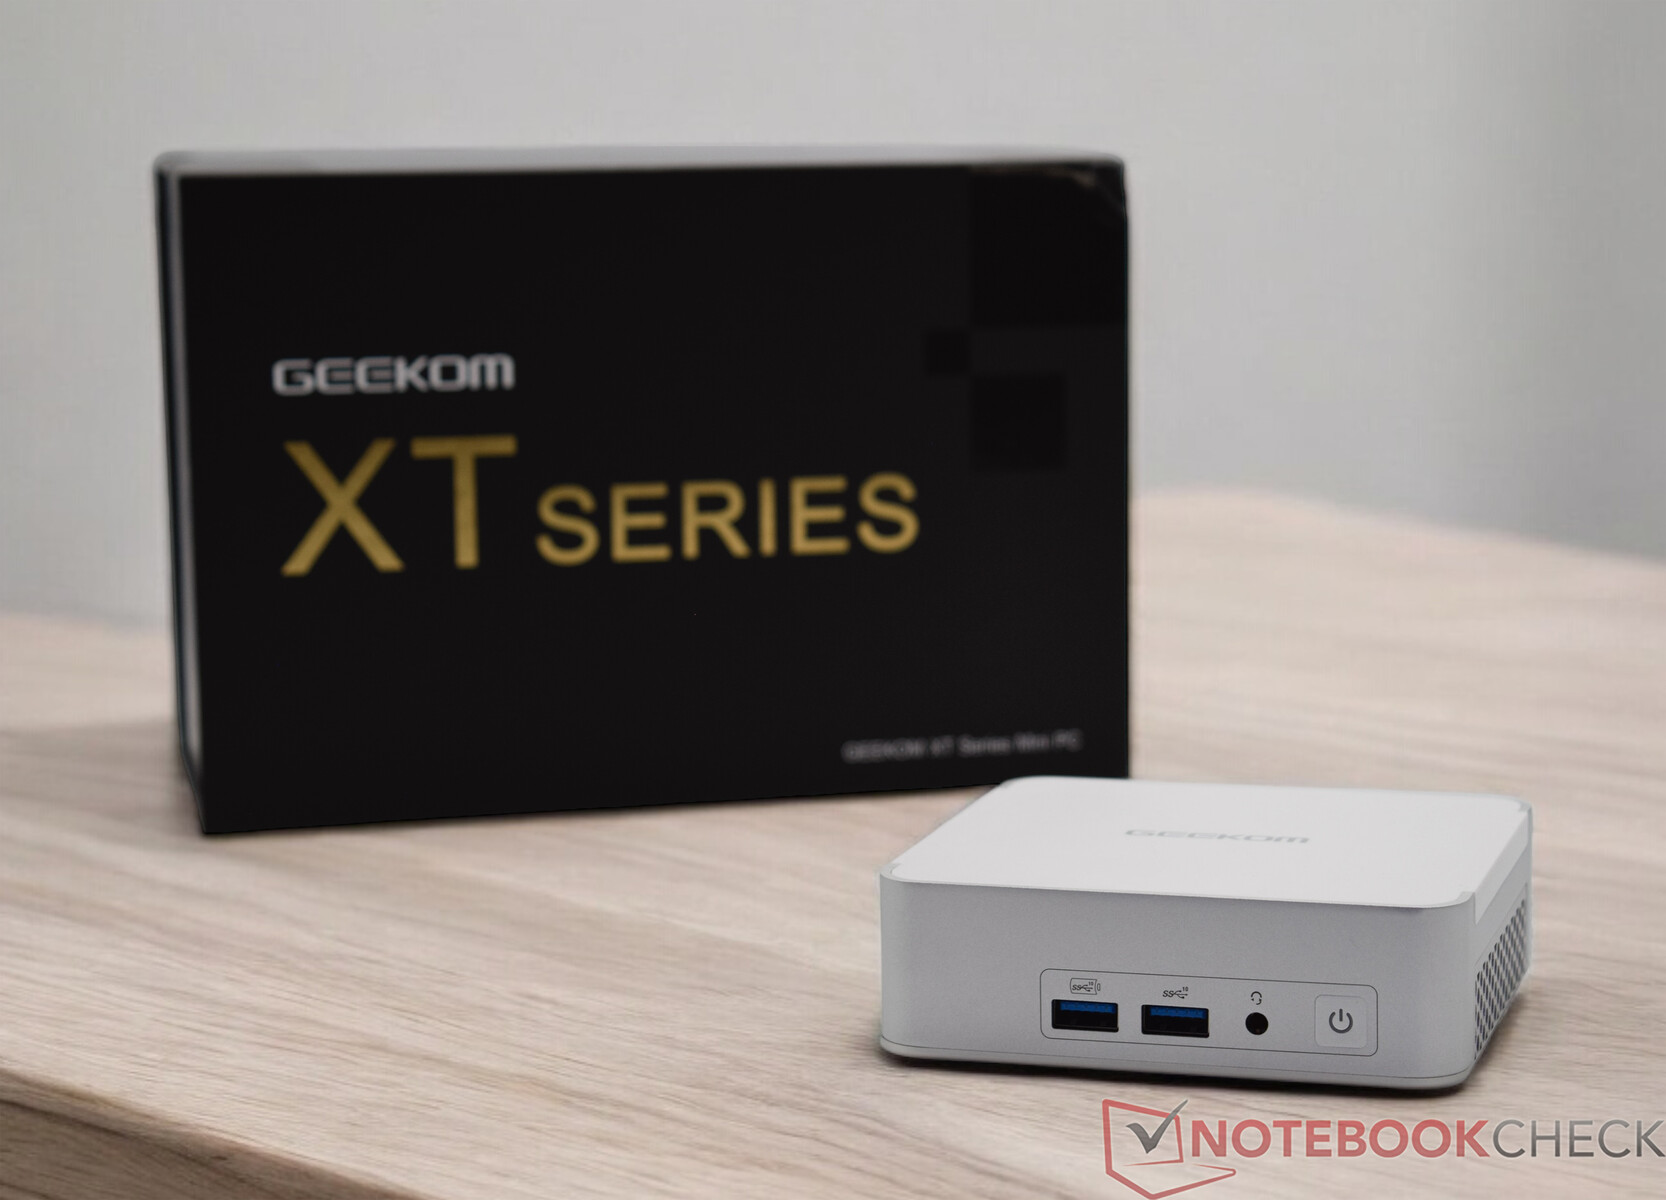
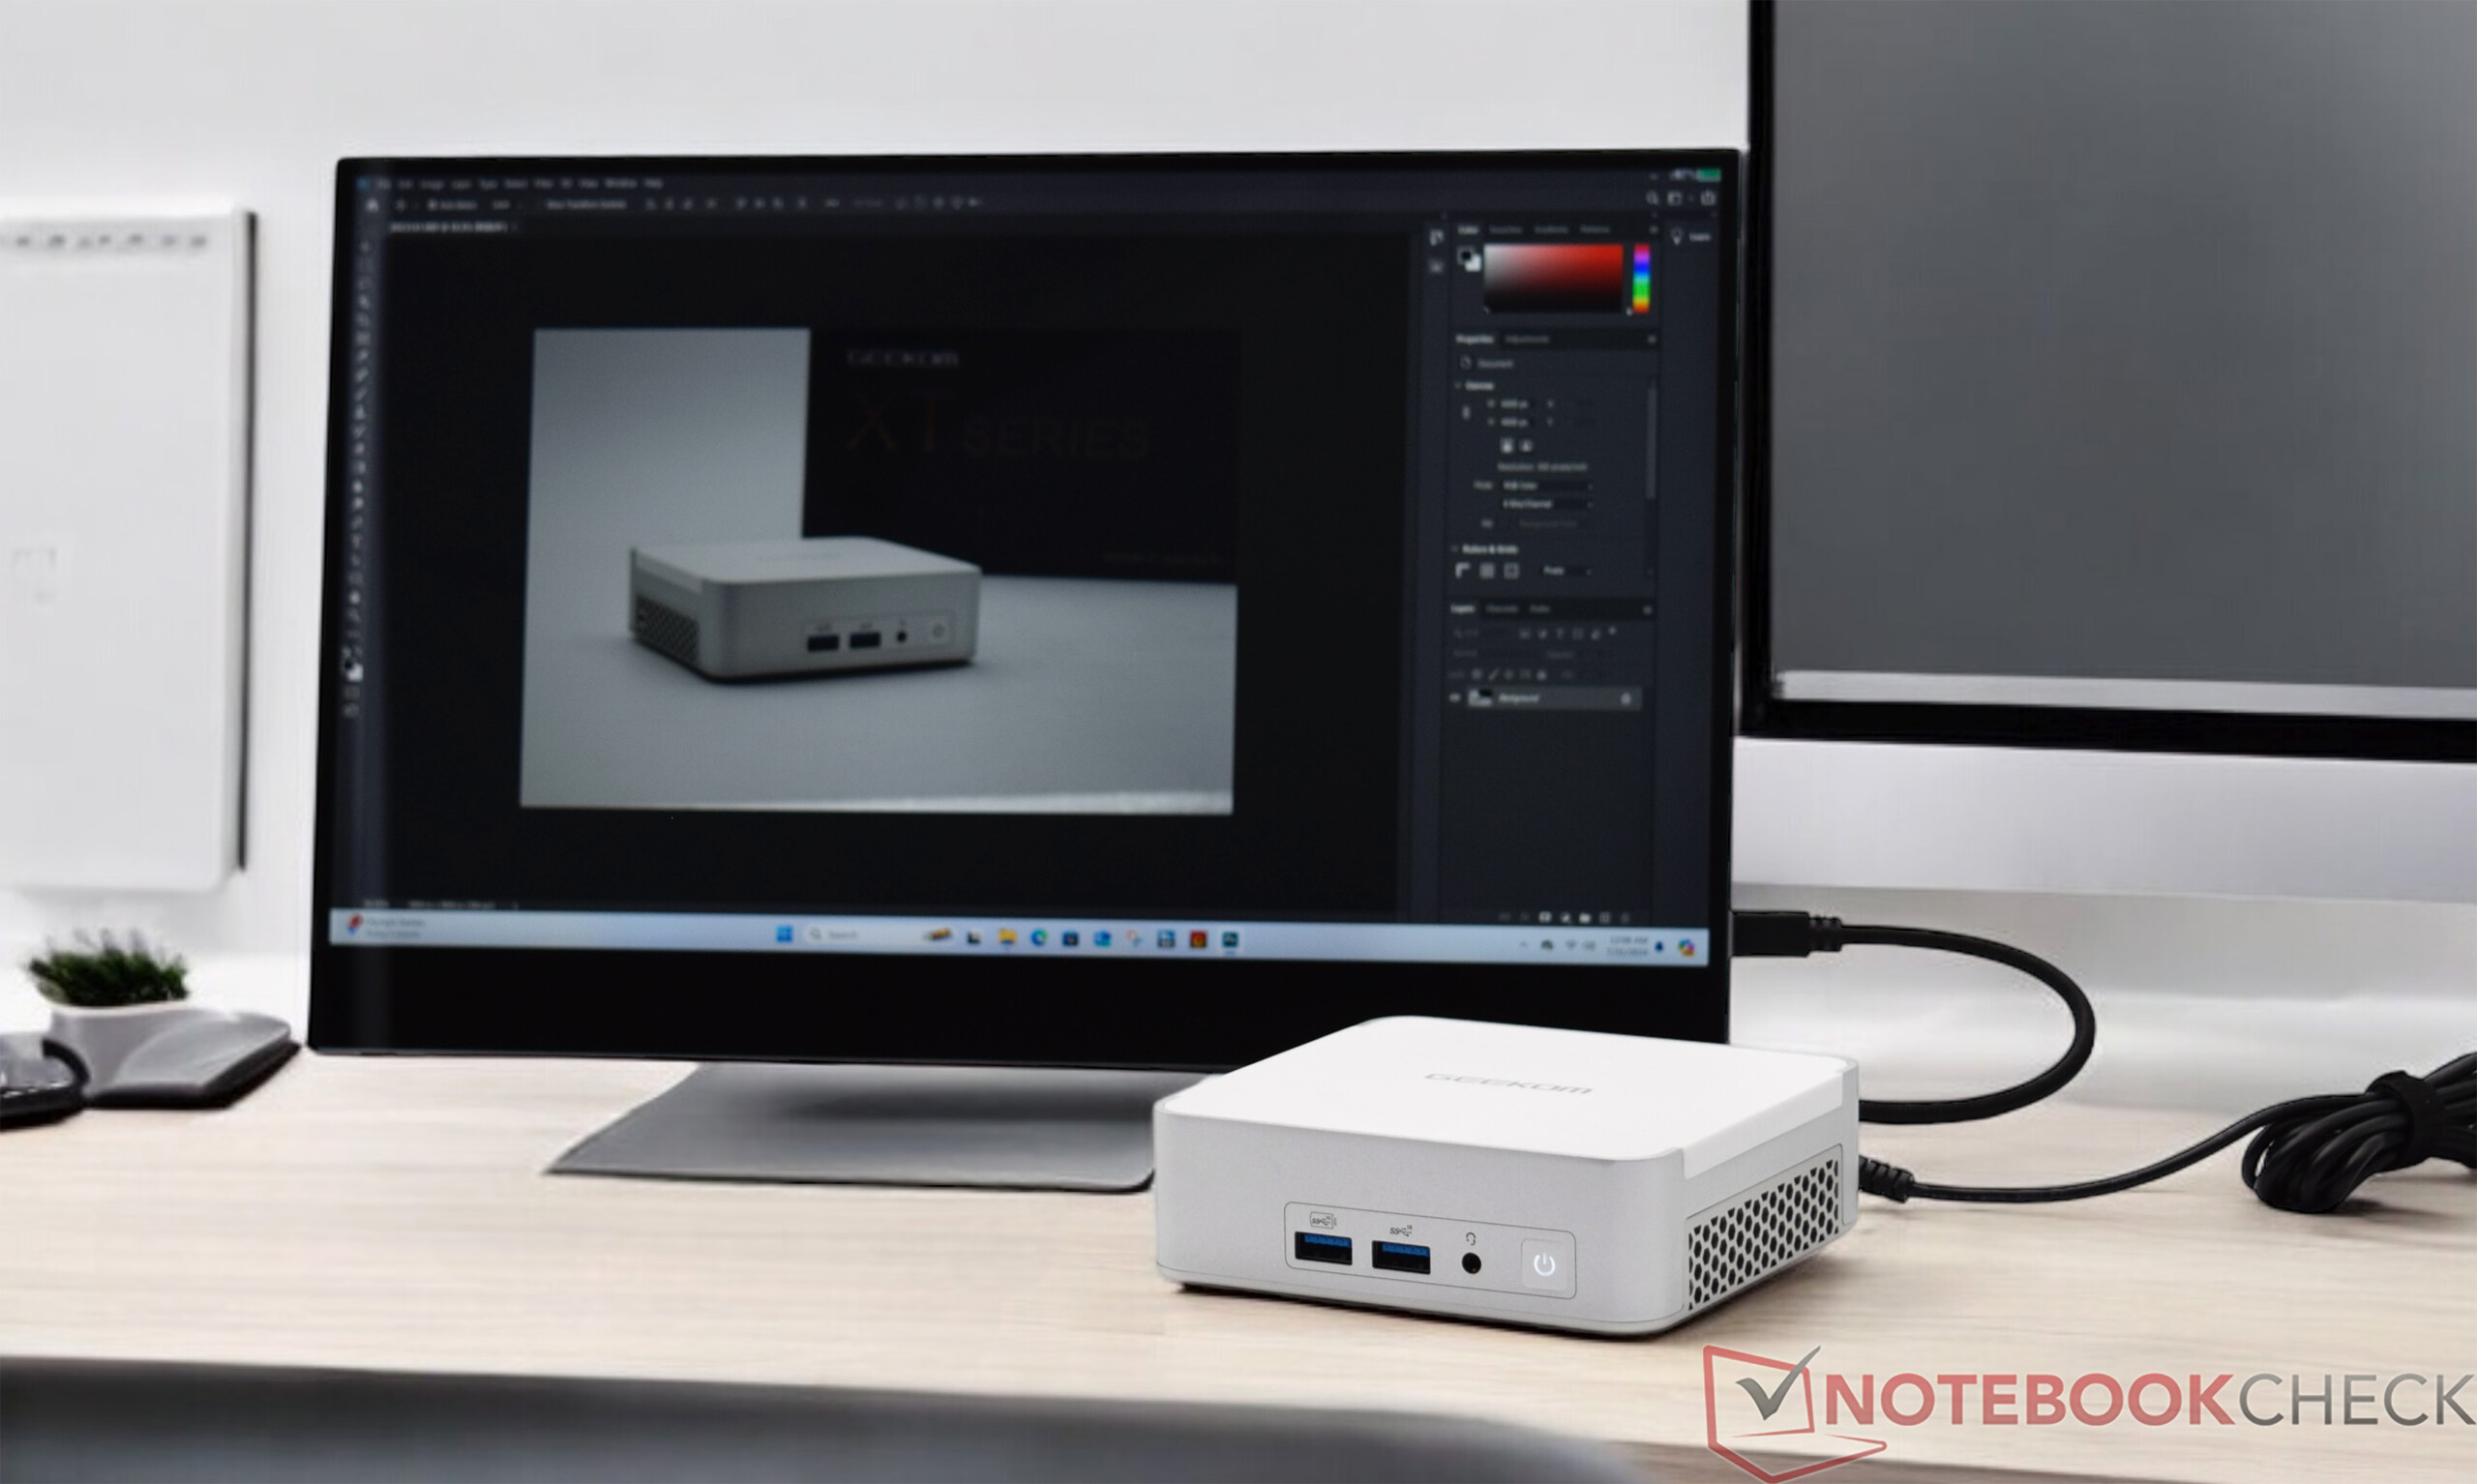
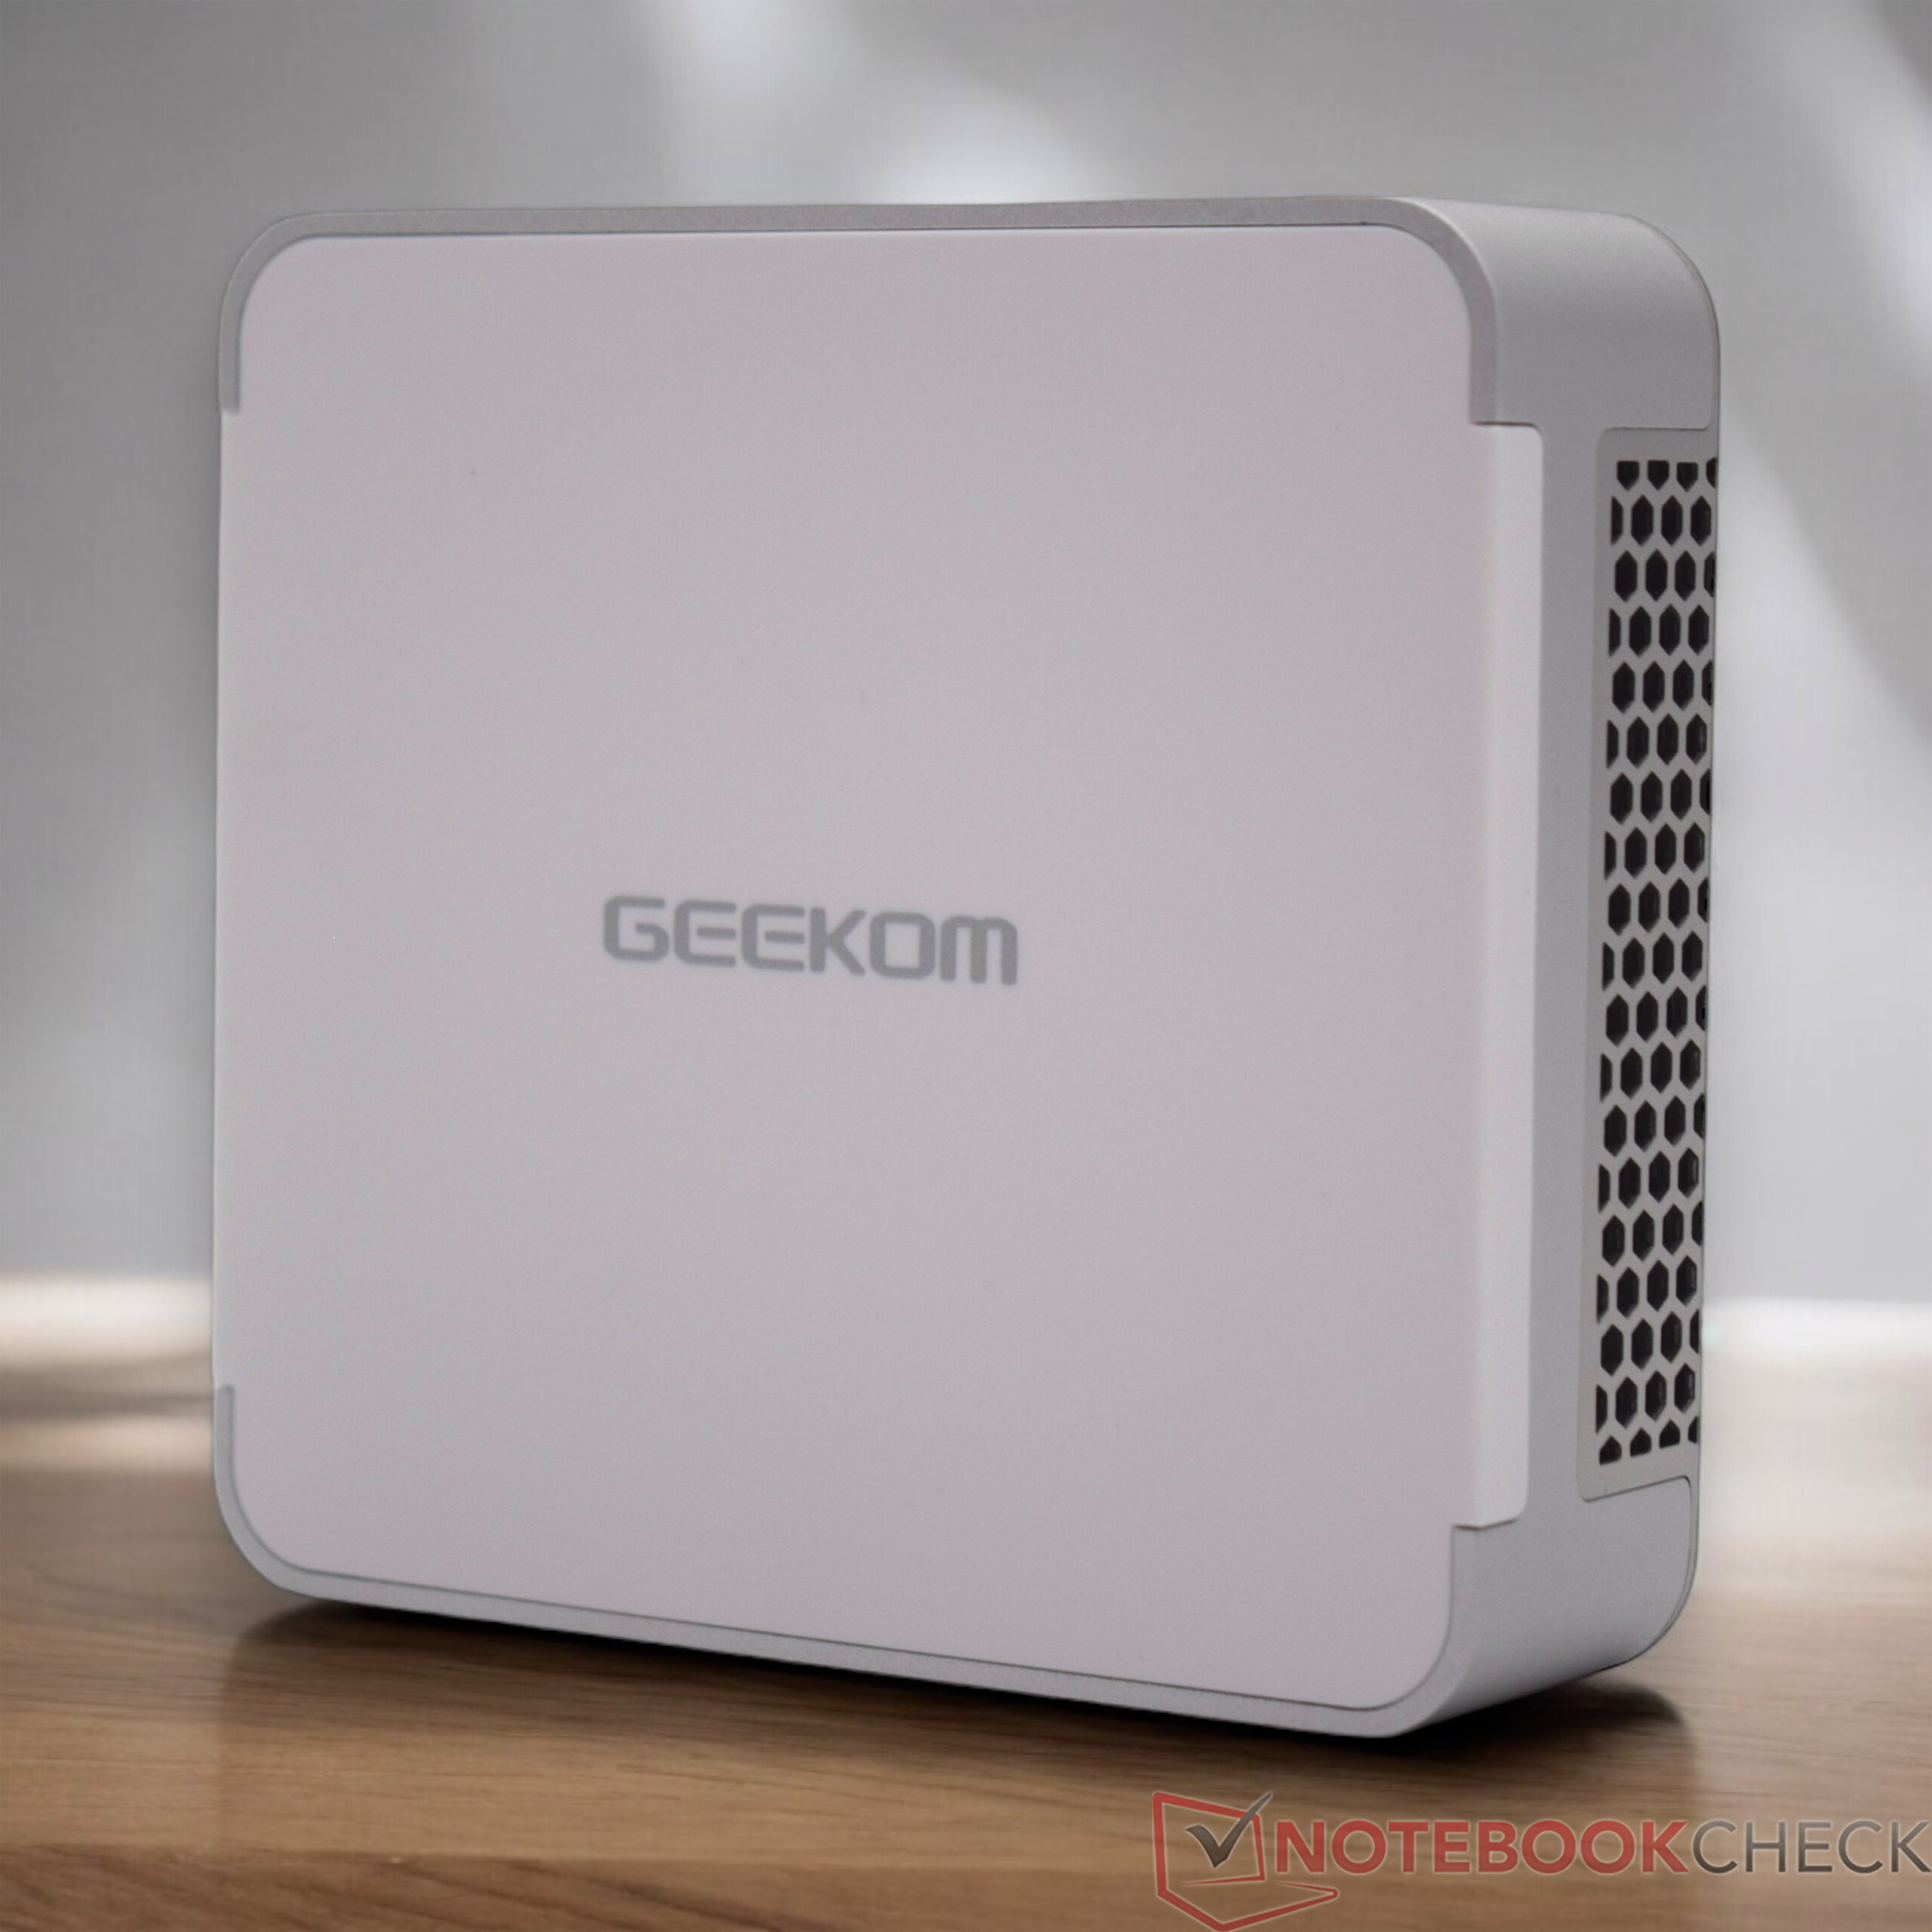
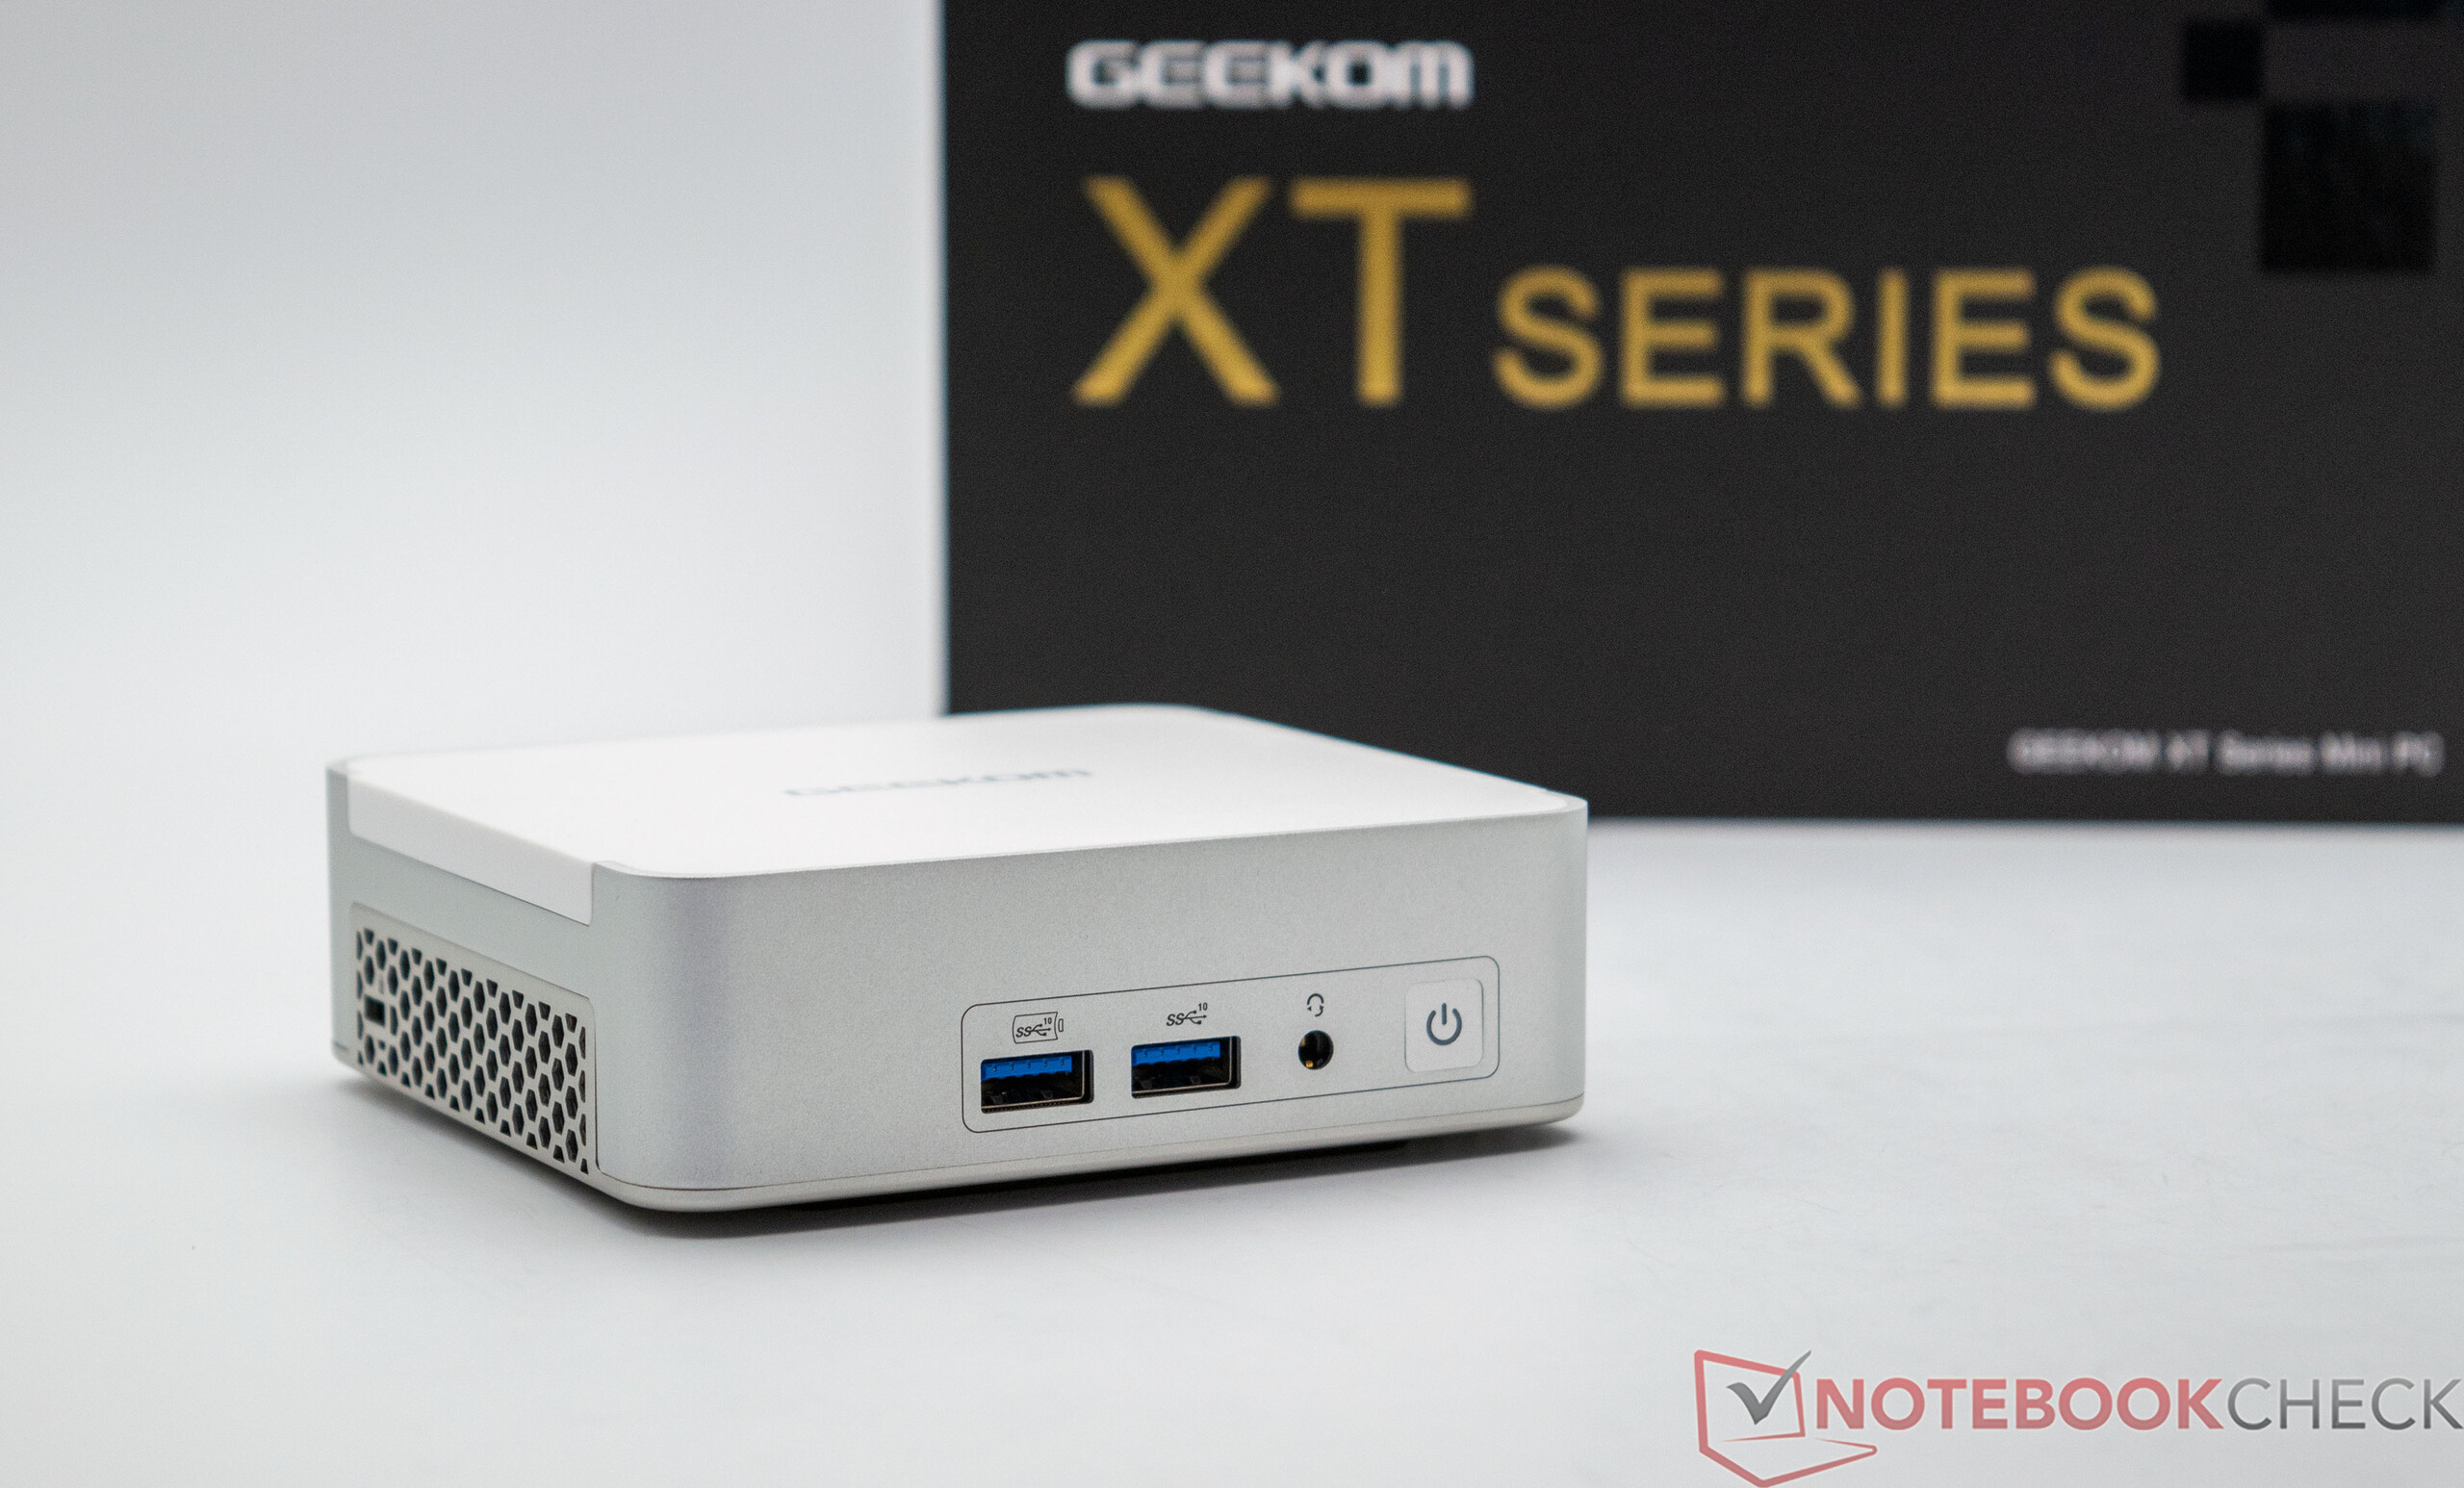
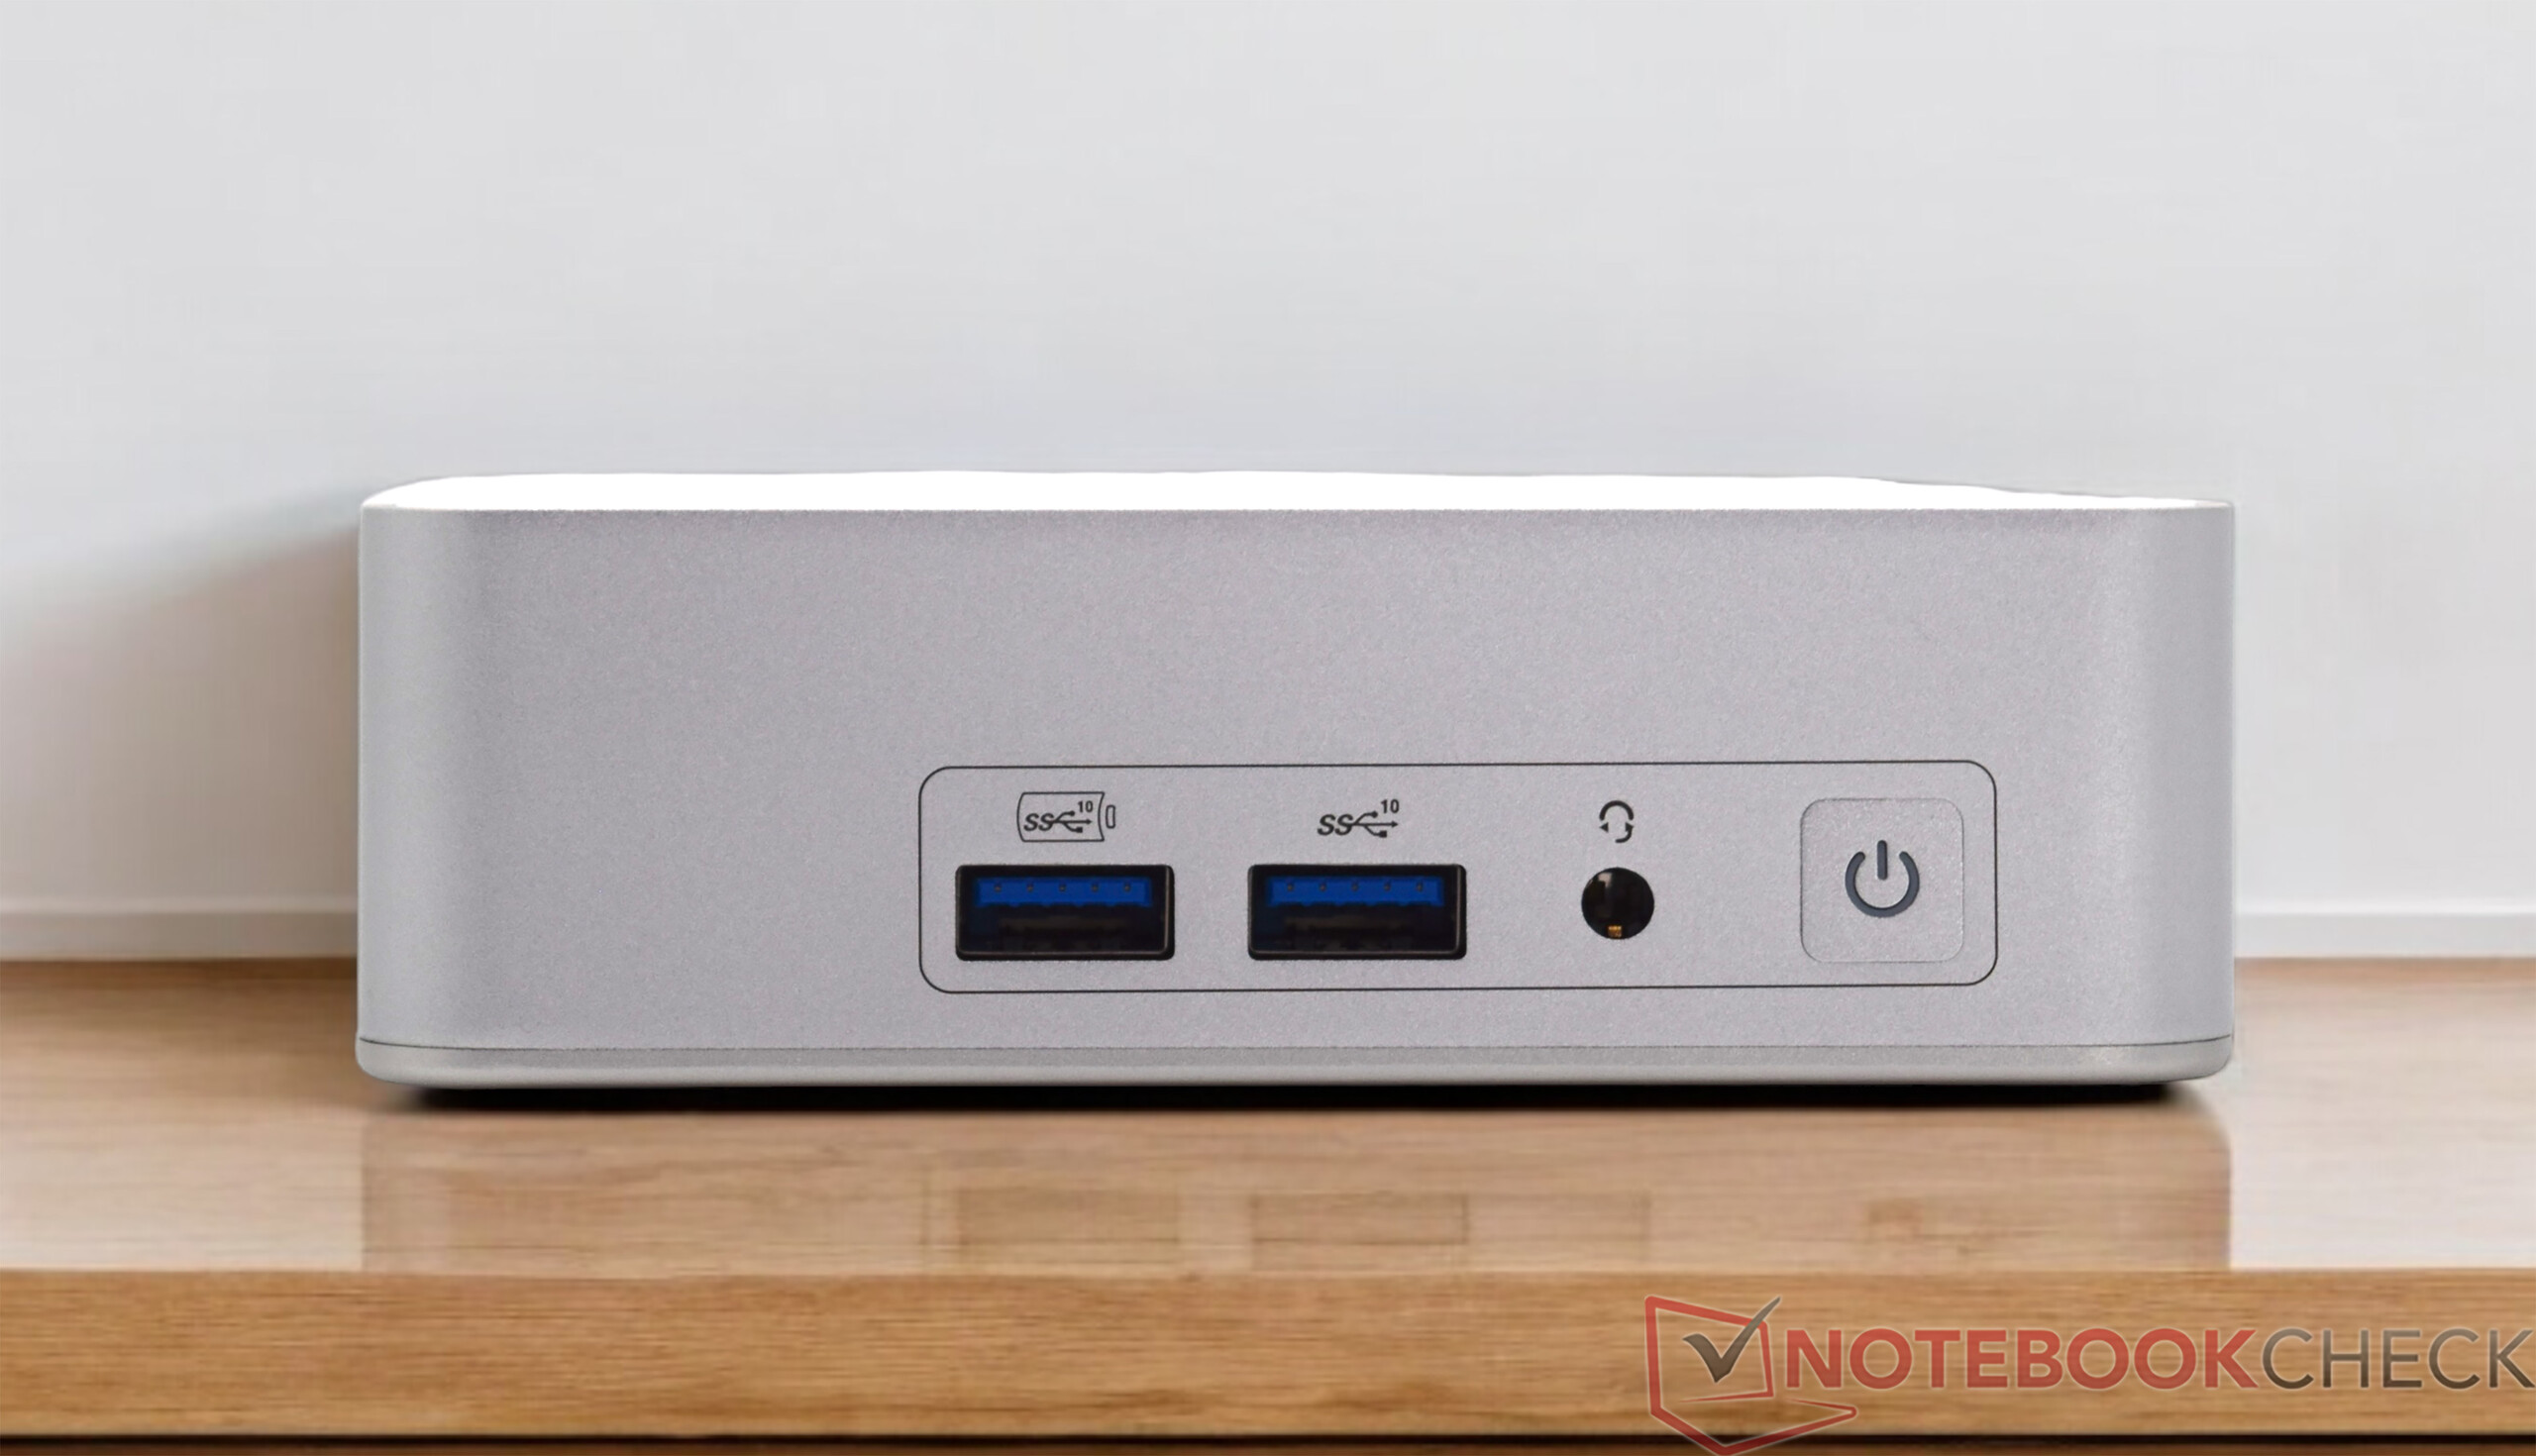
Obudowa Geekom XT13 Pro jest znajoma, została ona wykorzystana w Geekom XT12 Pro. Nie można również zaprzeczyć podobieństwu do zestawu Intel NUC 13 Pro Desk Edition. Zasadniczo nie ma nic złego w wyglądzie. Nasza próbka testowa jest po raz kolejny doskonale wykończona i wszystko świetnie do siebie pasuje. Niemniej jednak chcielibyśmy zobaczyć nową obudowę, aby nieco odróżnić ją od wewnętrznej konkurencji. Mini-PC zajmuje tylko 11,7 x 11,2 centymetra na biurku, co czyni go jednym z bardziej kompaktowych urządzeń. Geekom XT13 Pro można również przymocować bezpośrednio do monitora za pomocą dołączonego uchwytu VESA.
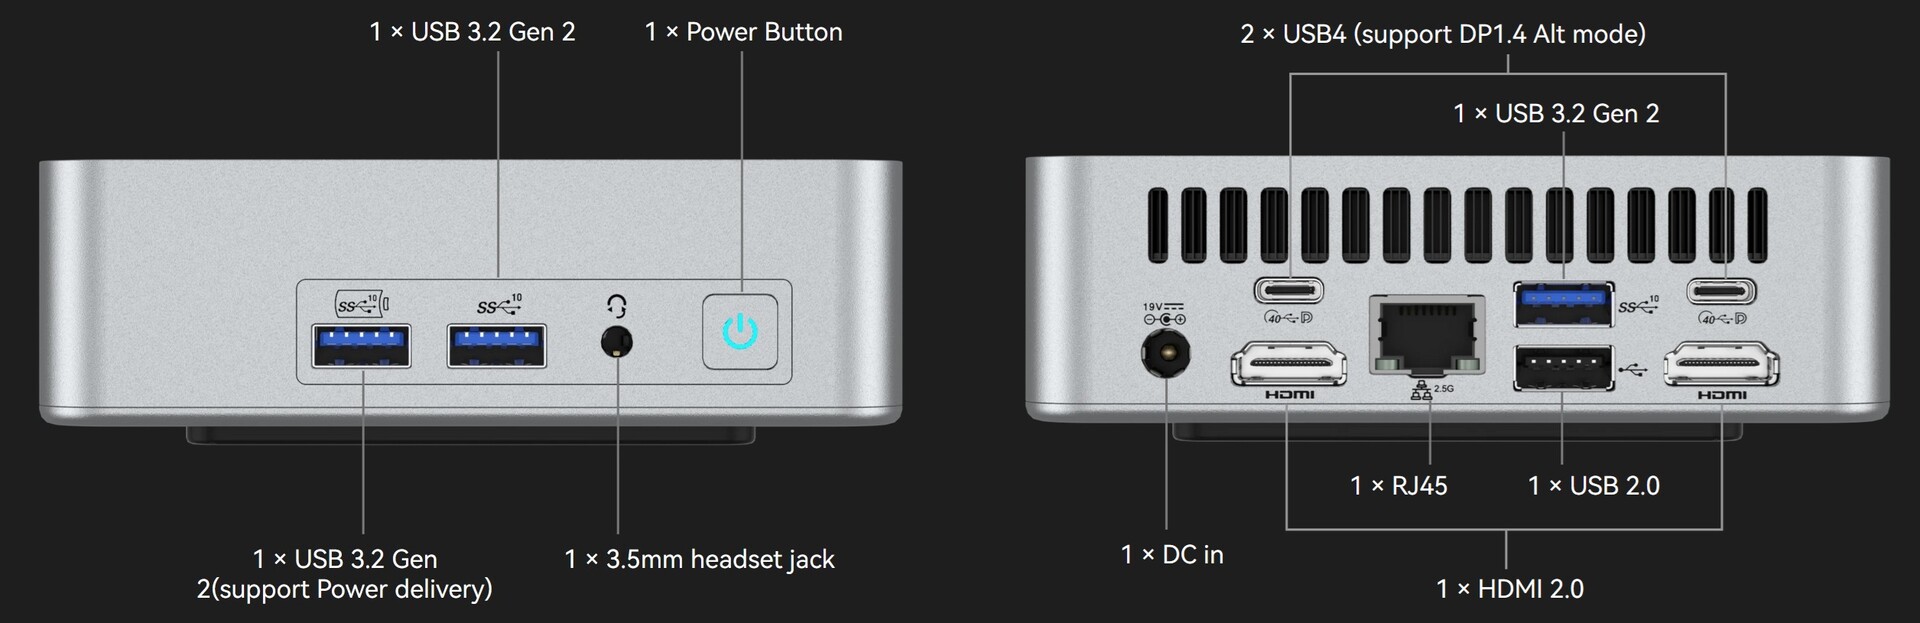
Wyposażenie - dobry wybór i 2x USB4
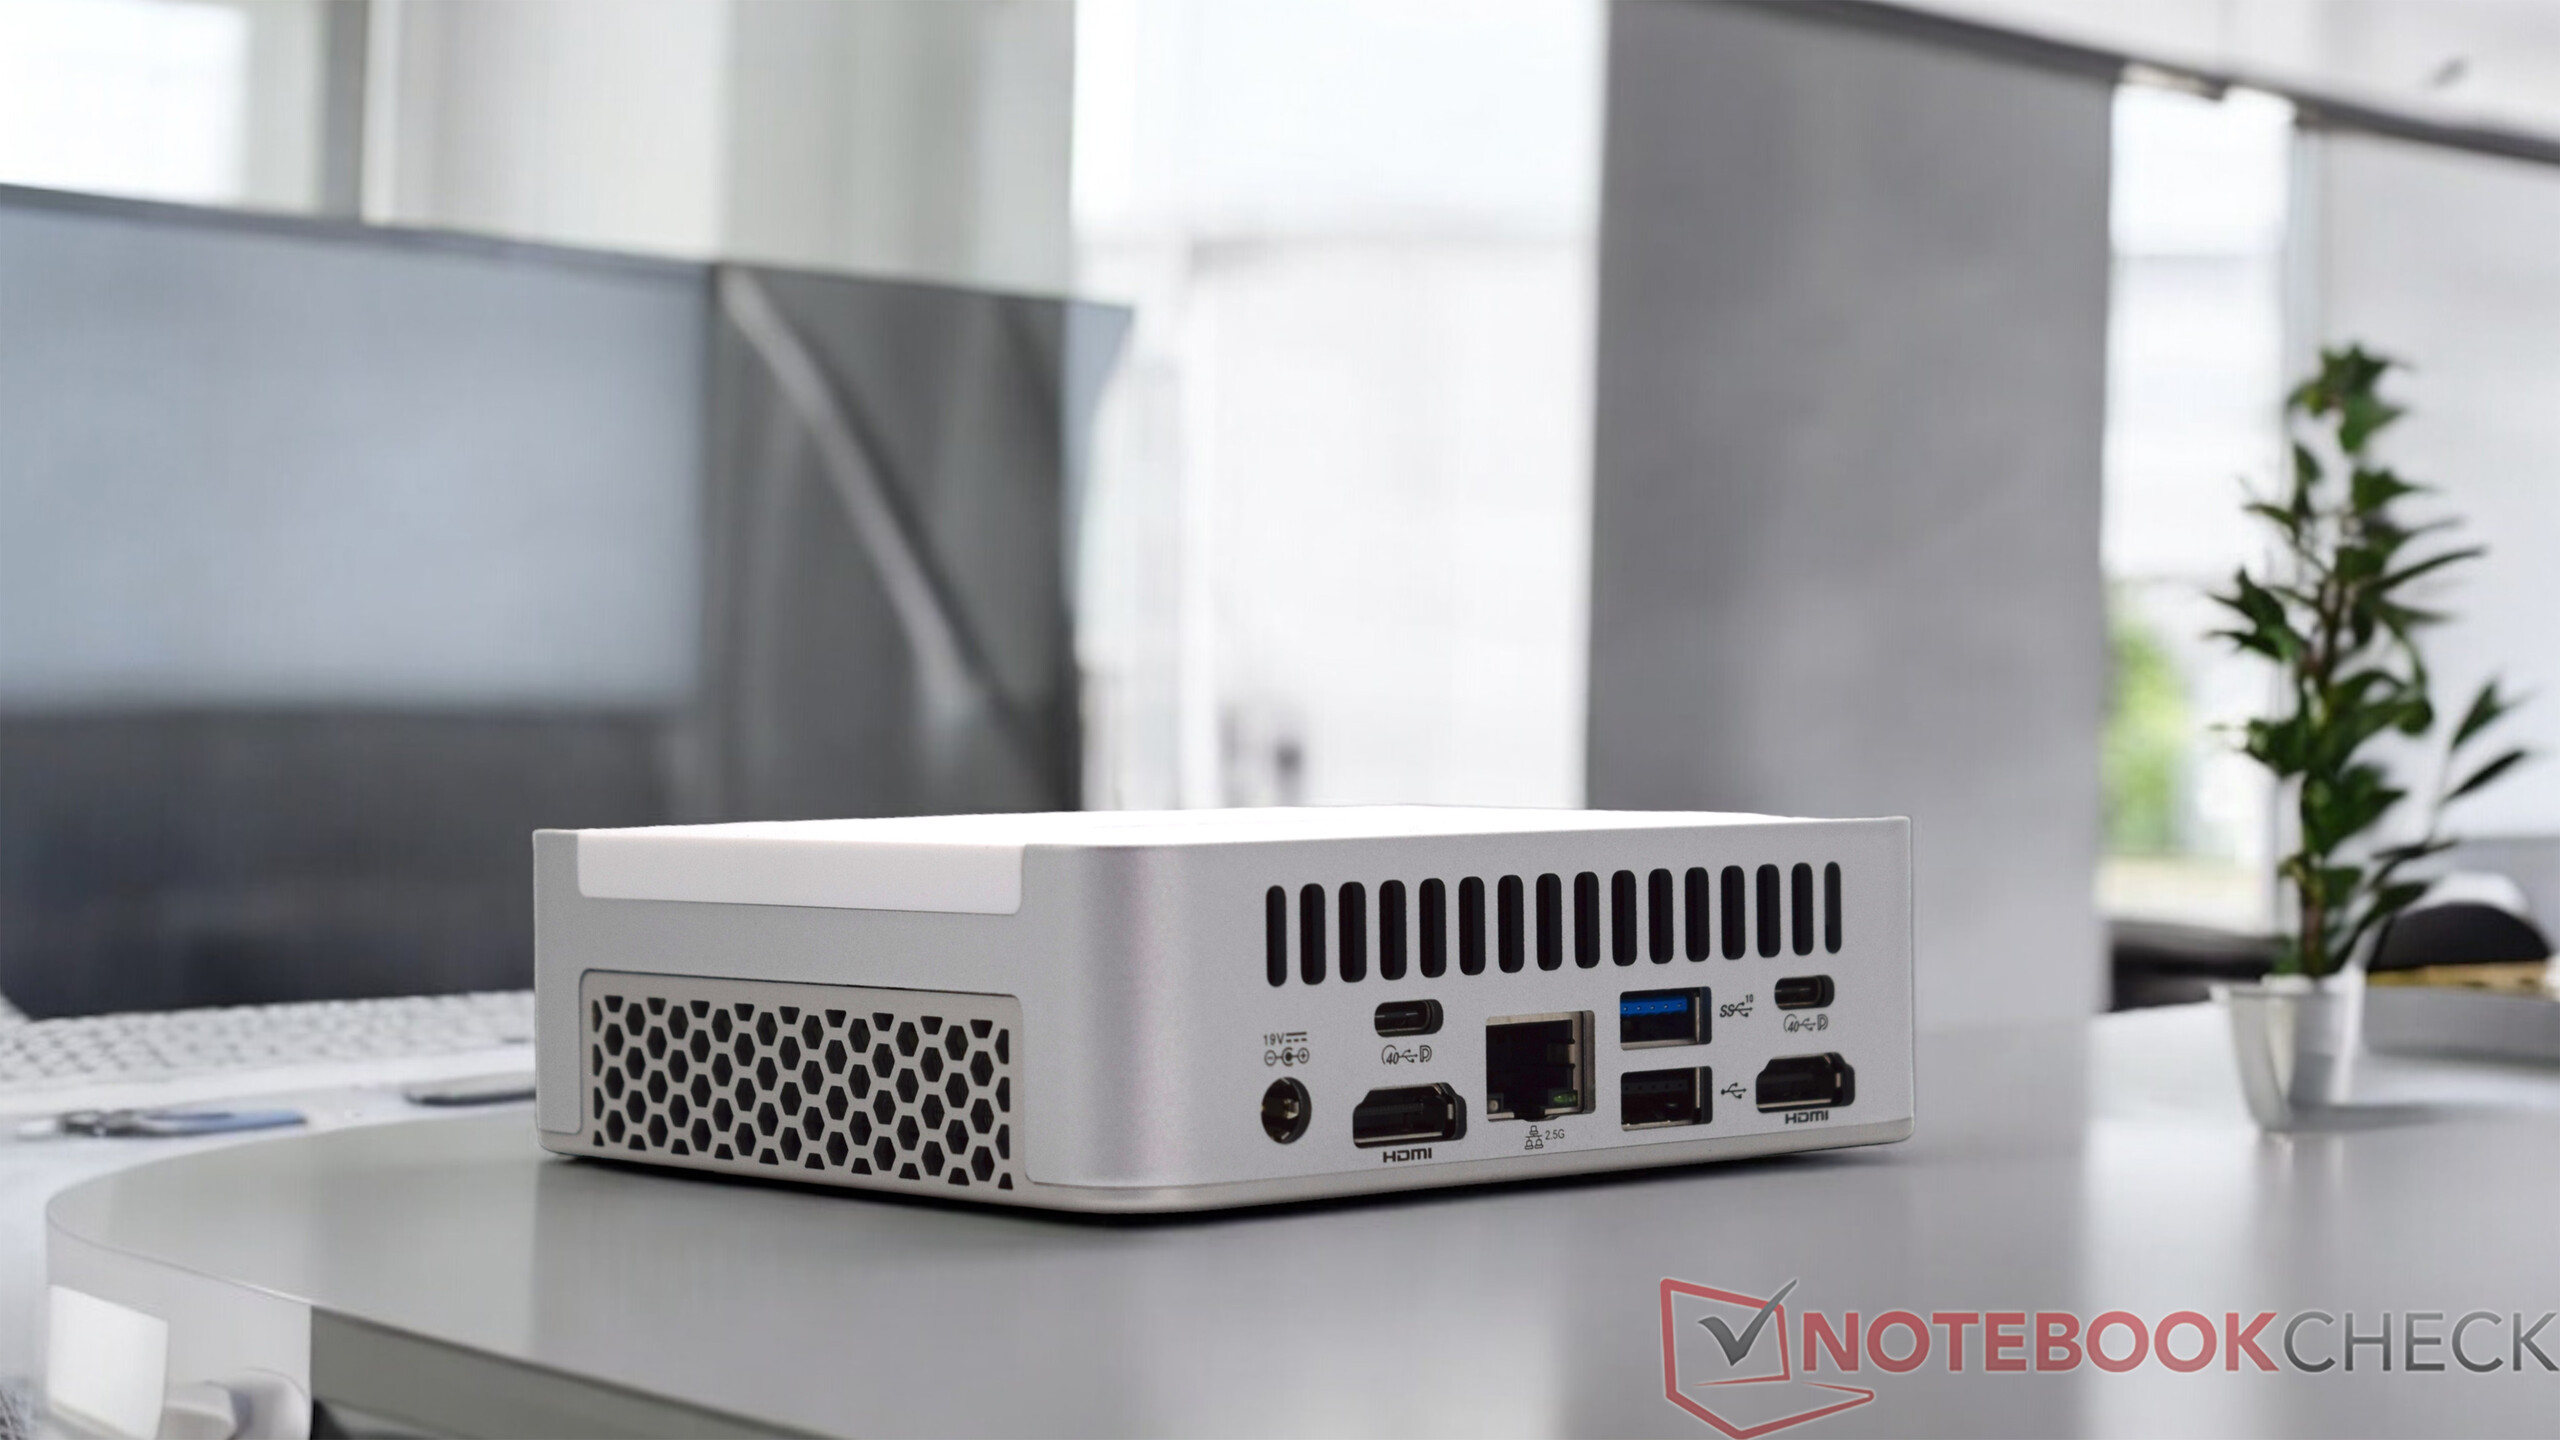
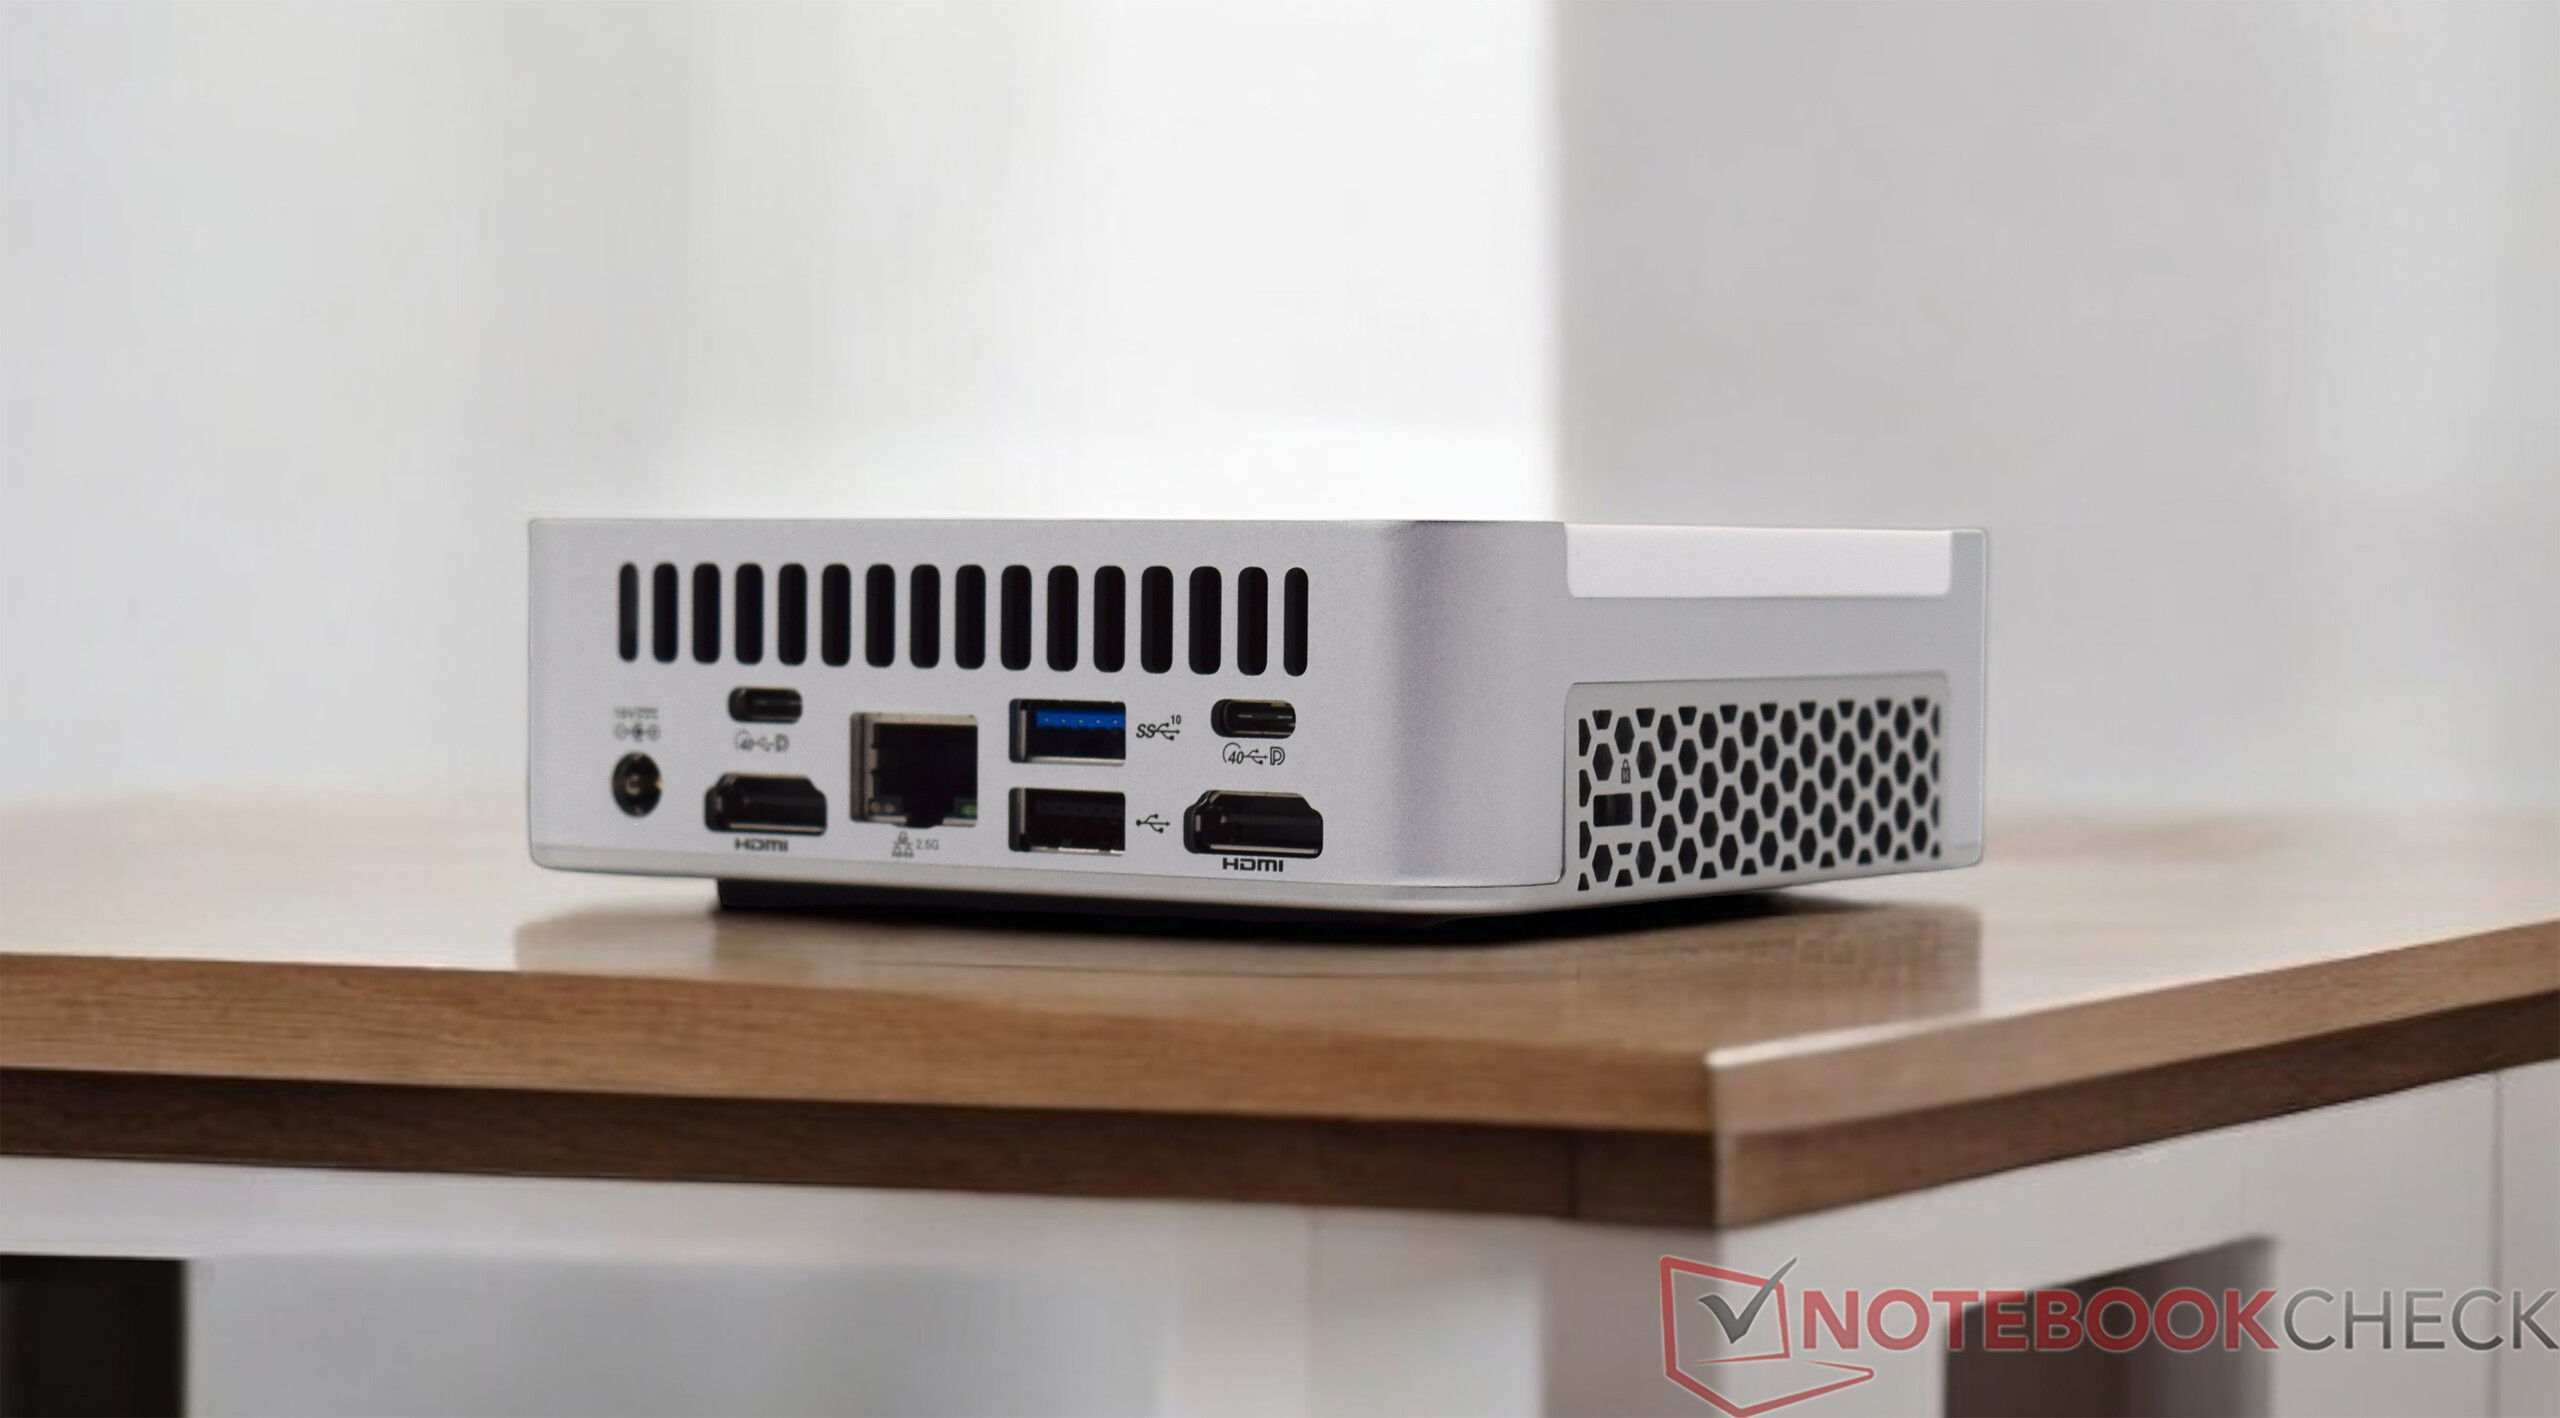
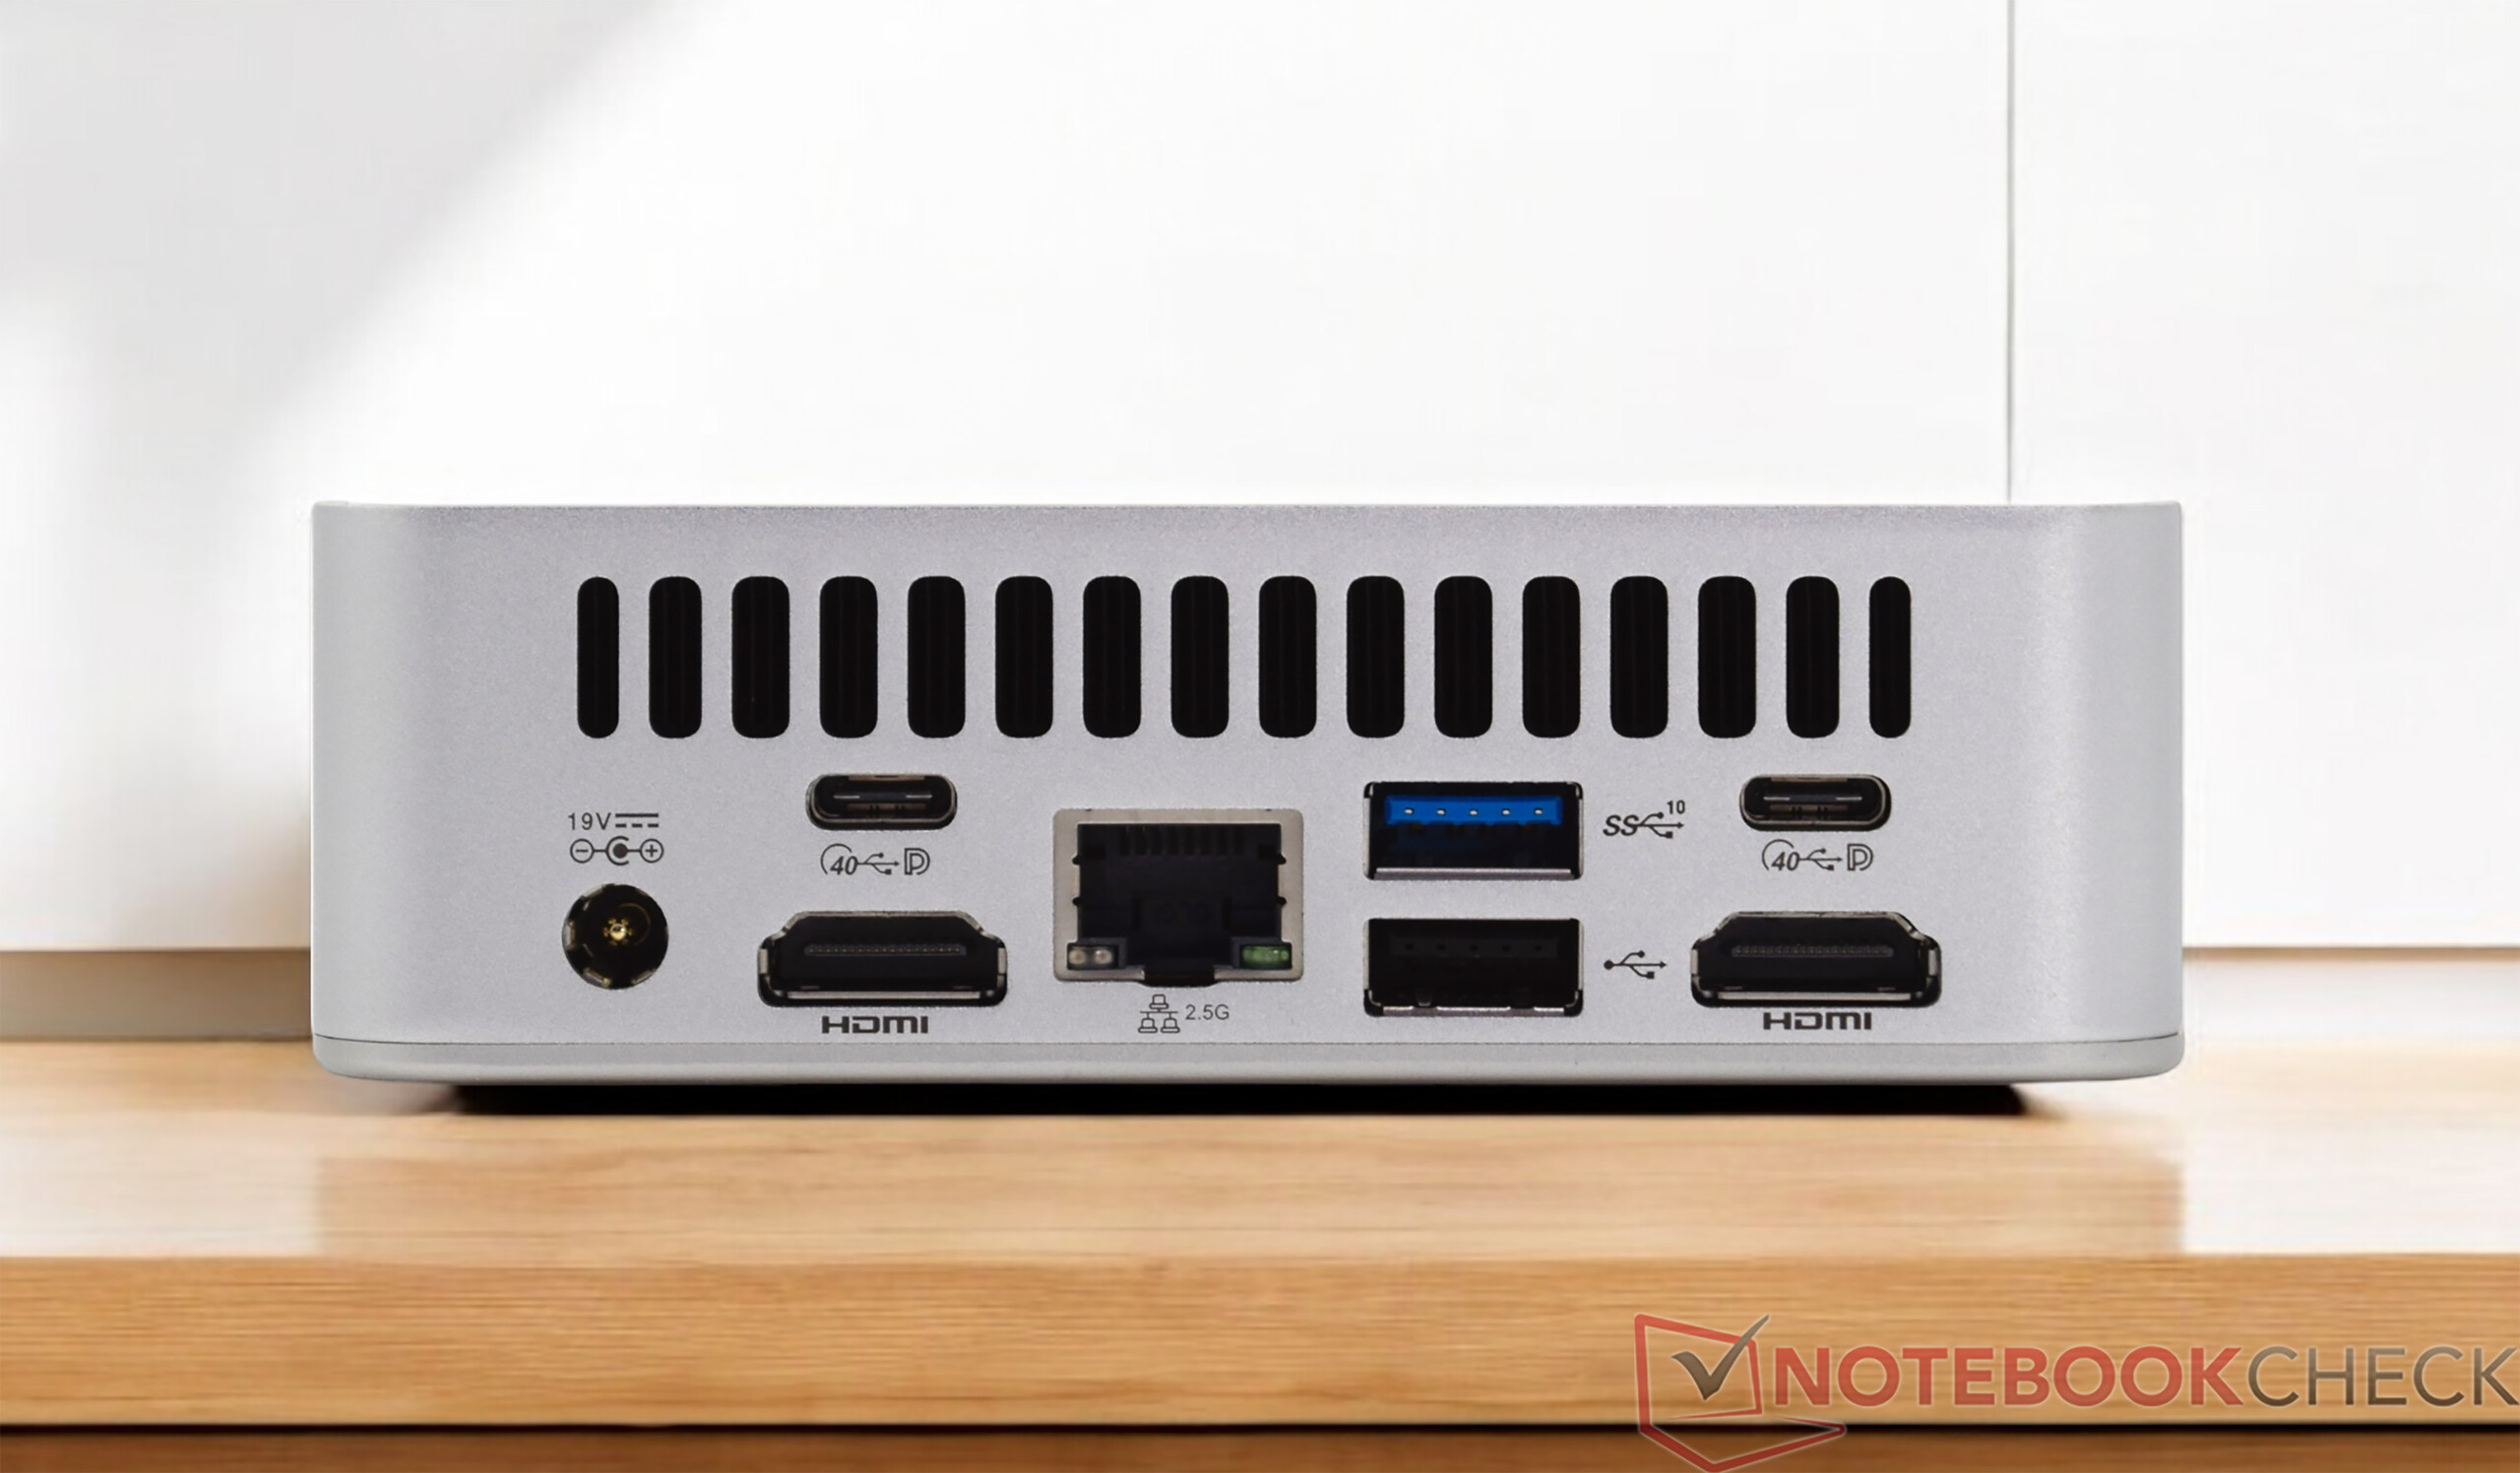
Jeśli chodzi o interfejsy zewnętrzne, Geekom XT13 Pro ma takie same opcje jak Geekom XT12 Pro. Chociaż urządzenie jest bardzo kompaktowe, istnieje wiele różnych połączeń. Dwa gniazda USB-C z tyłu to nowoczesne porty USB4, znacznie rozszerzające zakres zastosowań dzięki odpowiednim akcesoriom. W sumie cztery ekrany mogą być obsługiwane jednocześnie, a także połączenie LAN.
Komunikacja
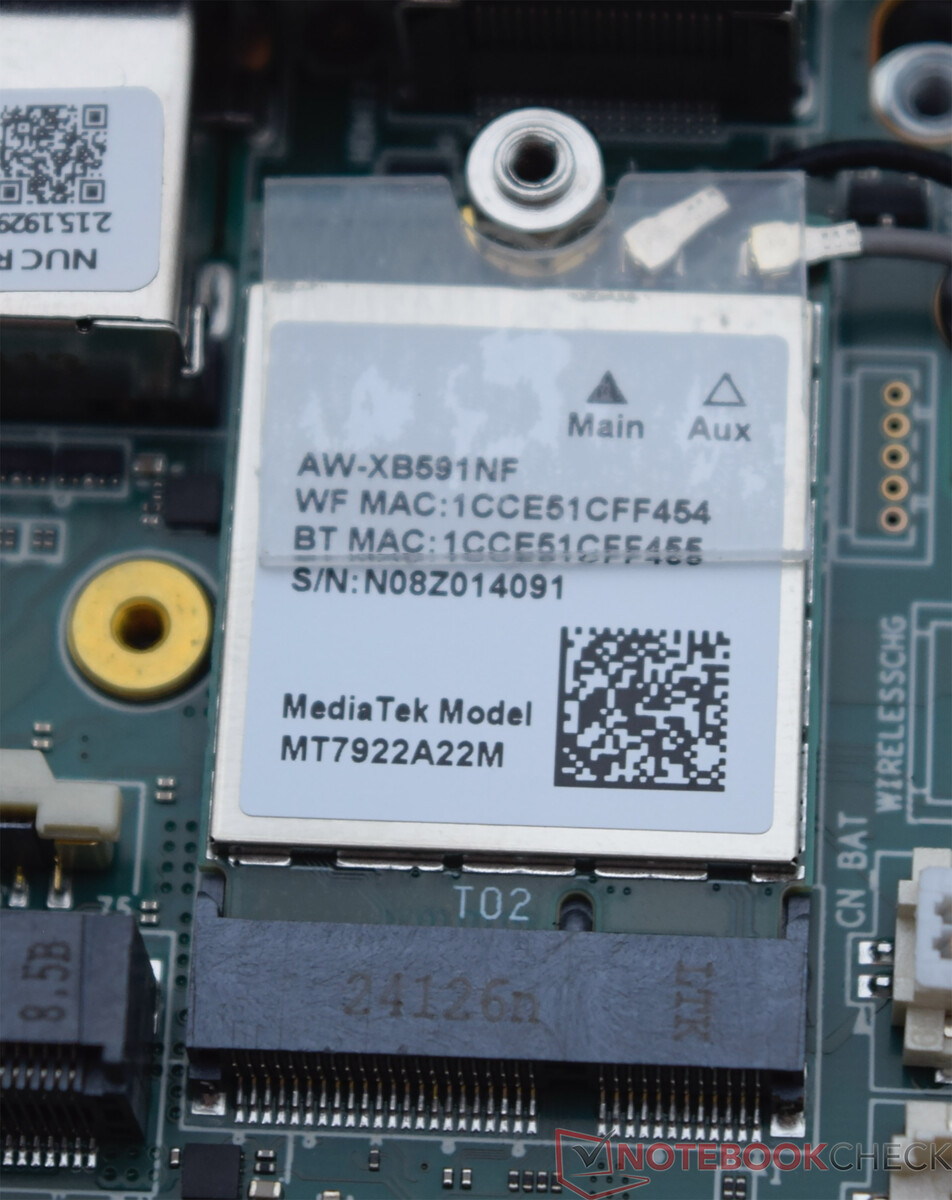
Geekom XT13 Pro wykorzystuje dobrze znany moduł bezprzewodowy, który Geekom instaluje w wielu swoich urządzeniach. Moduł WLAN MediaTek Wi-Fi 6E MT7922 może zapewnić odpowiednią wydajność w naszym urządzeniu testowym. Jeśli to jednak możliwe, należy przede wszystkim korzystać z zakresu częstotliwości 6 GHz. Alternatywnie można również użyć połączenia kablowego. Szybkość transmisji danych do 2,5 GBit/s jest wtedy nawet możliwa.
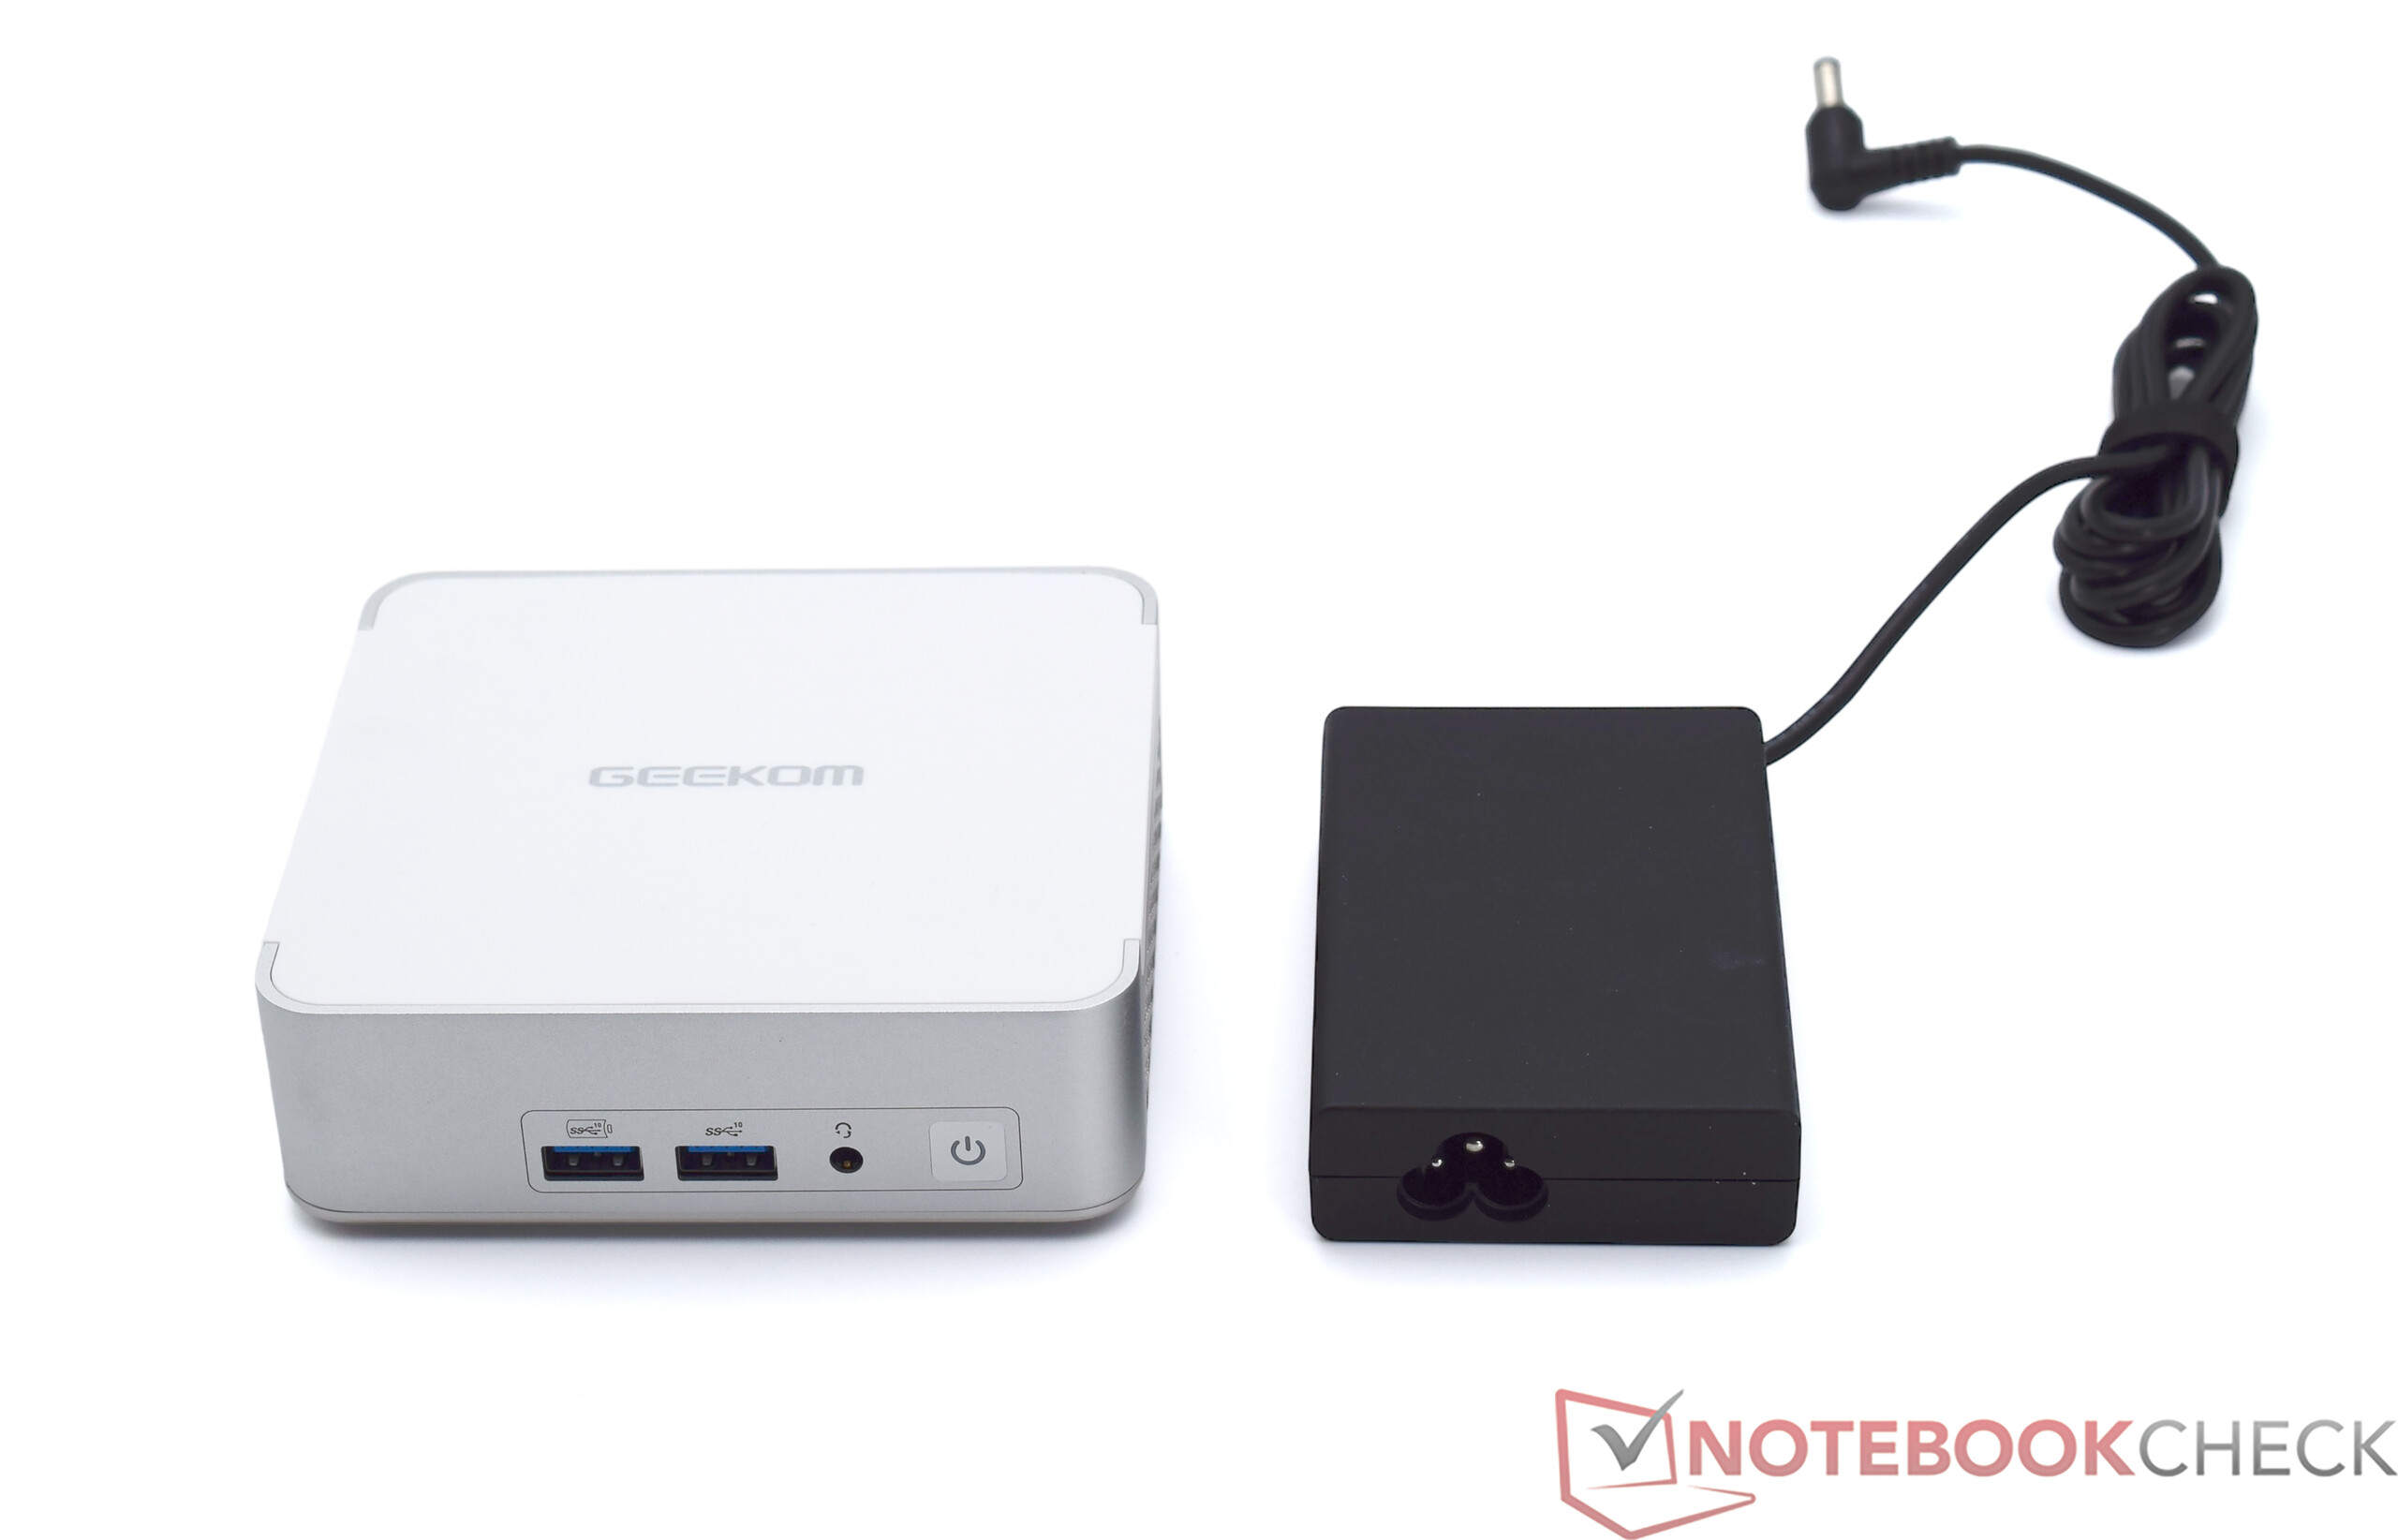
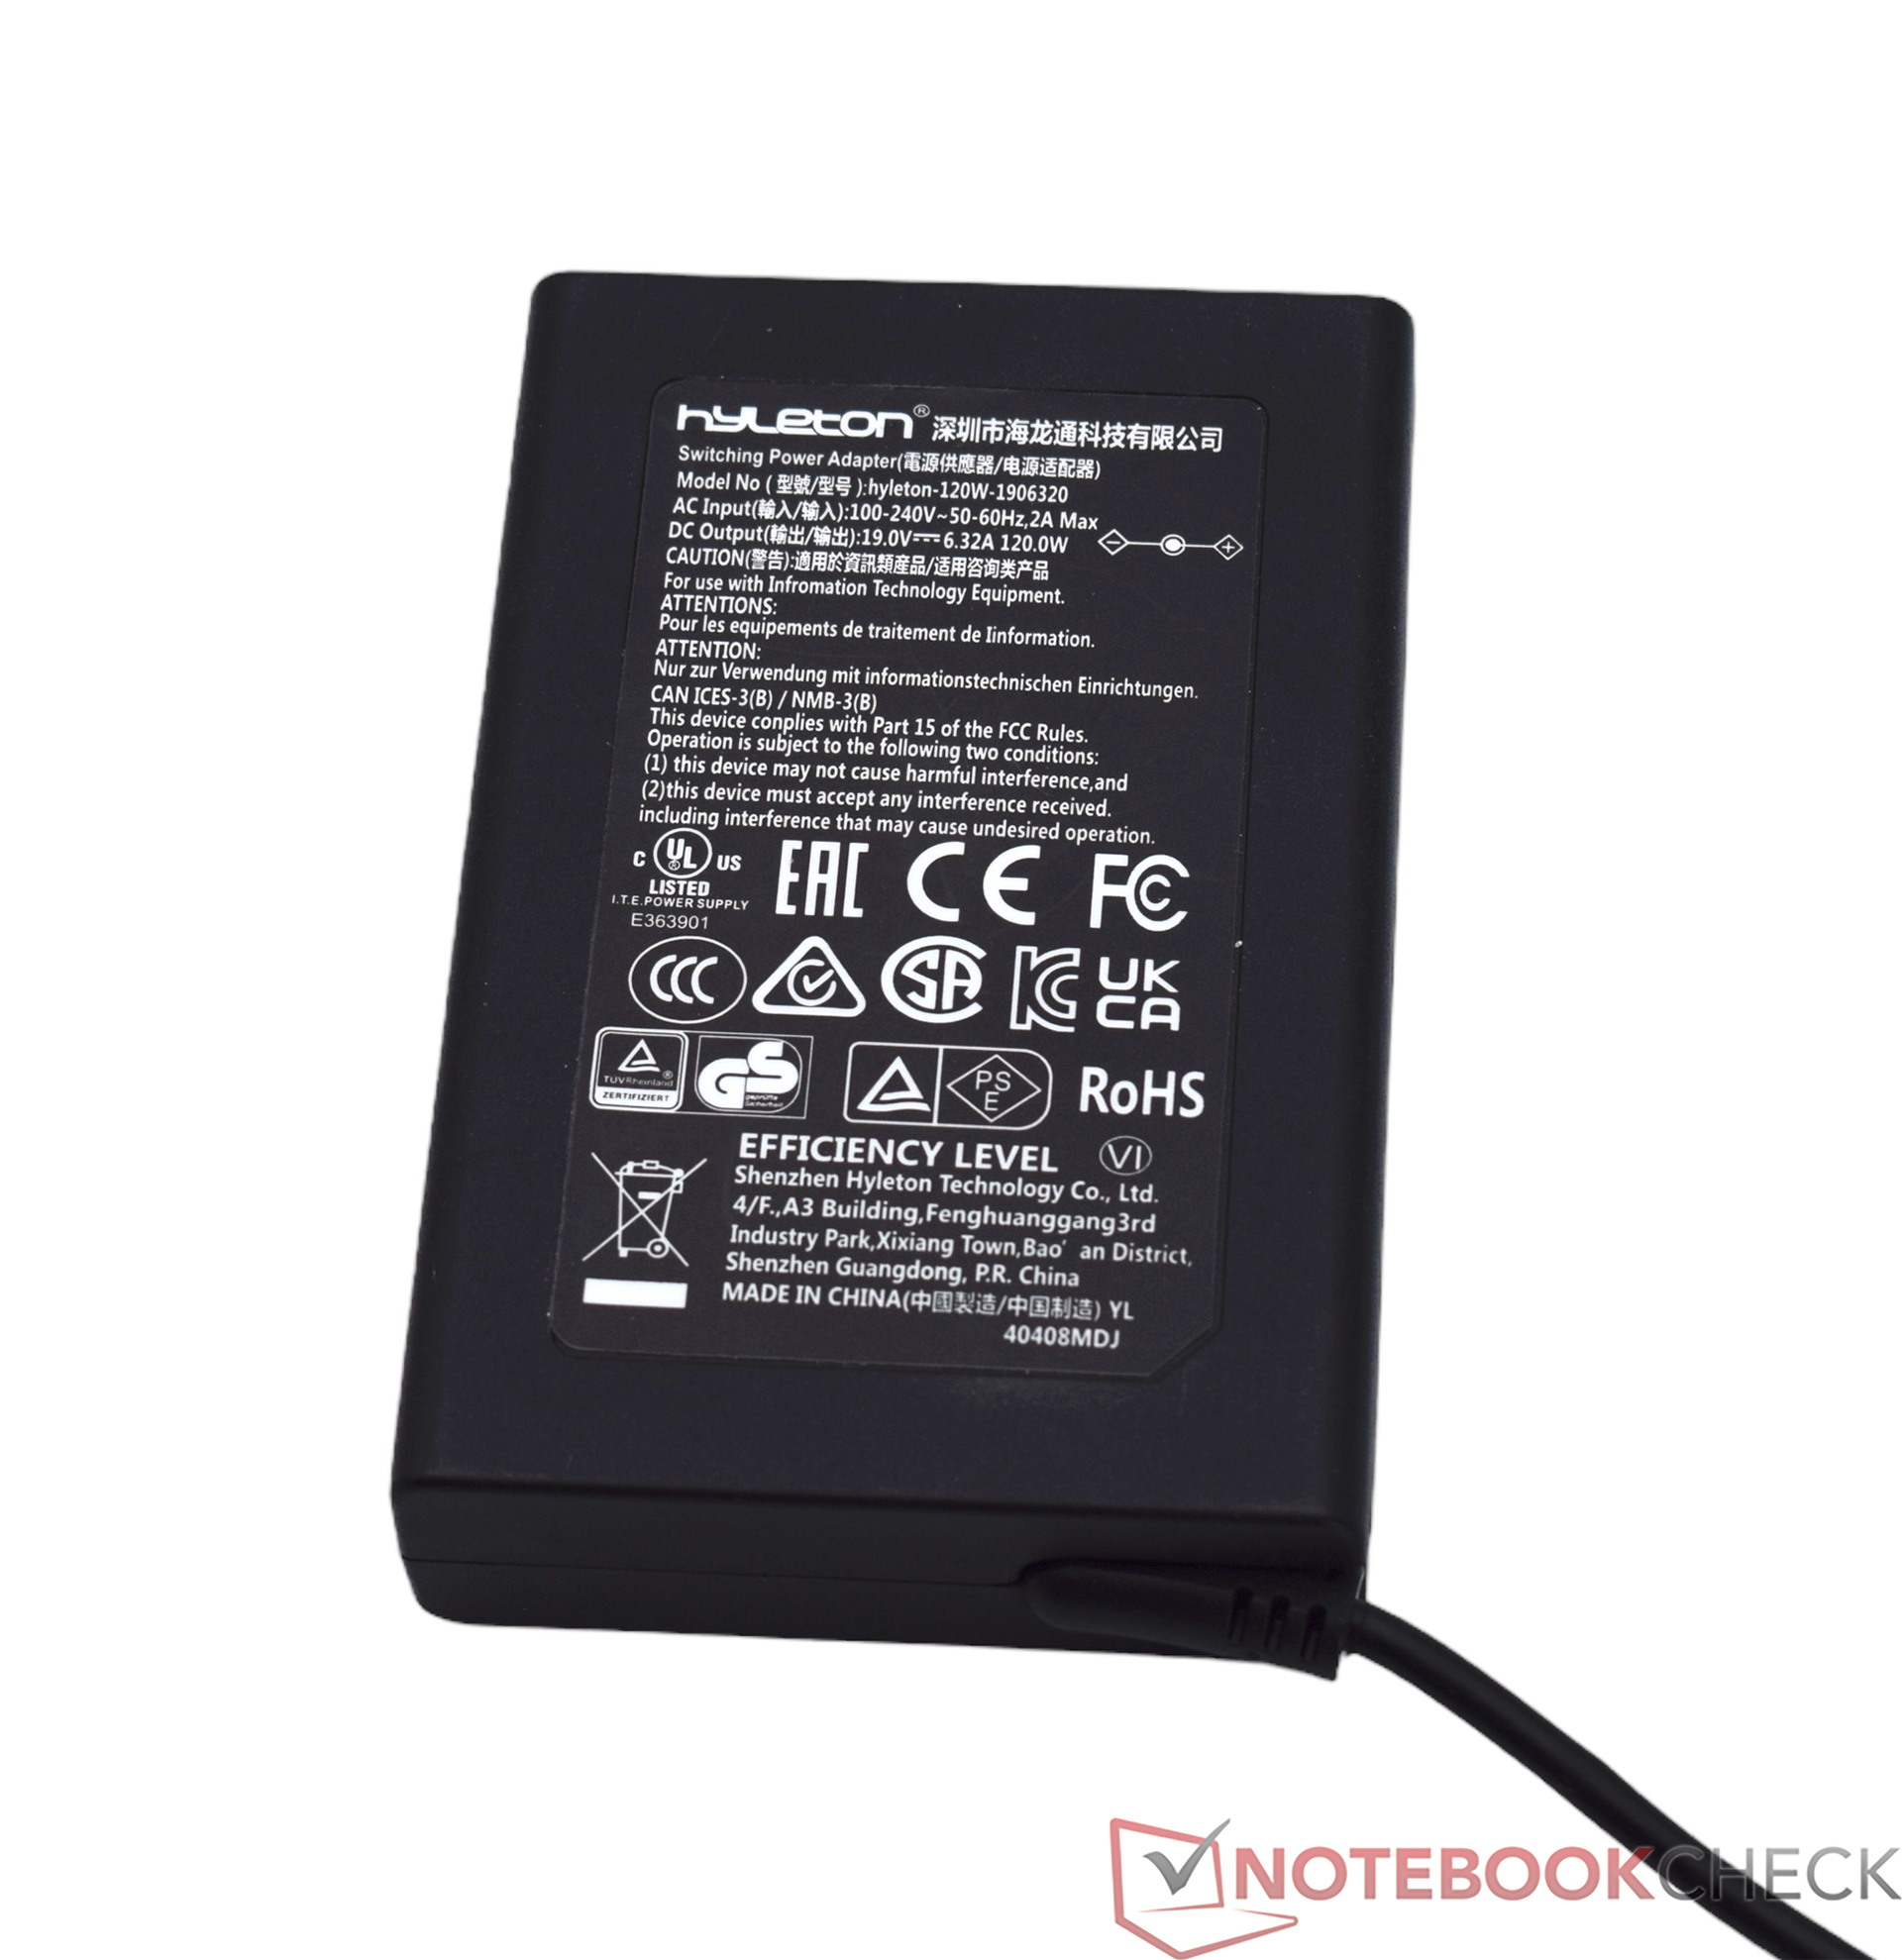
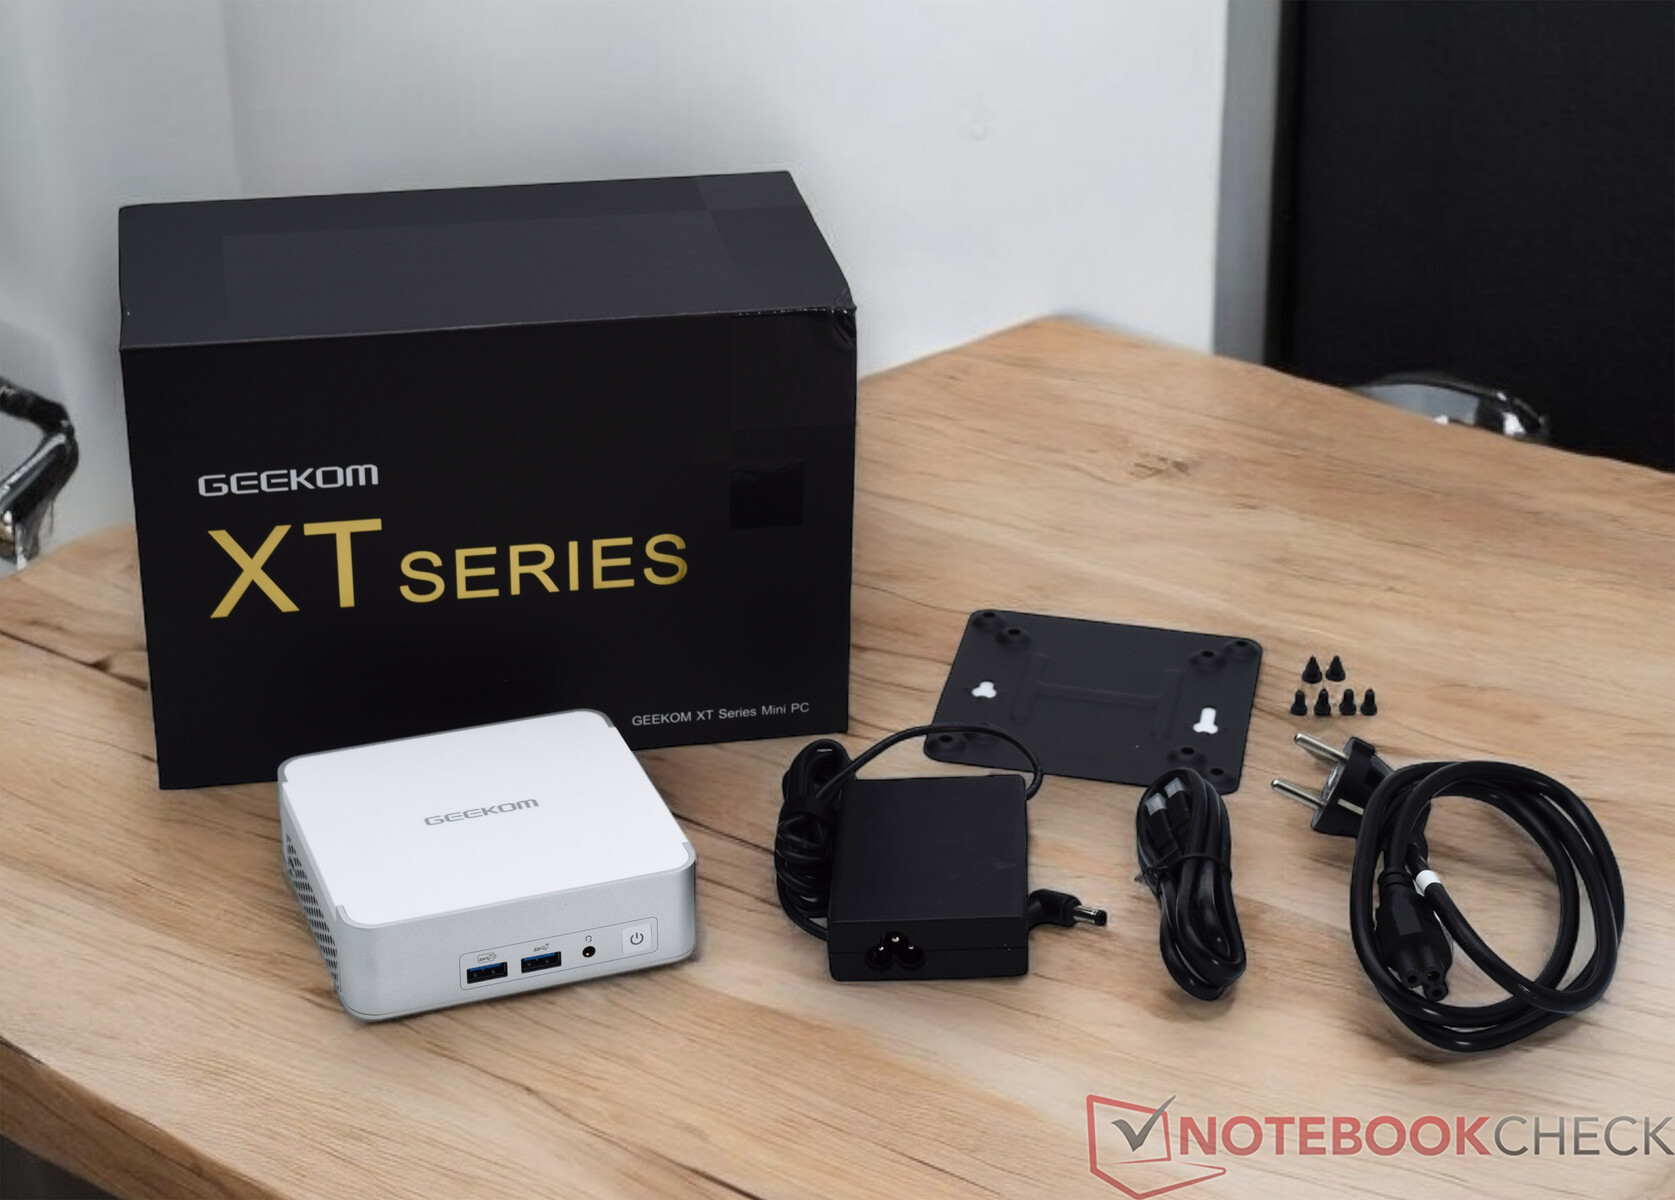
Akcesoria
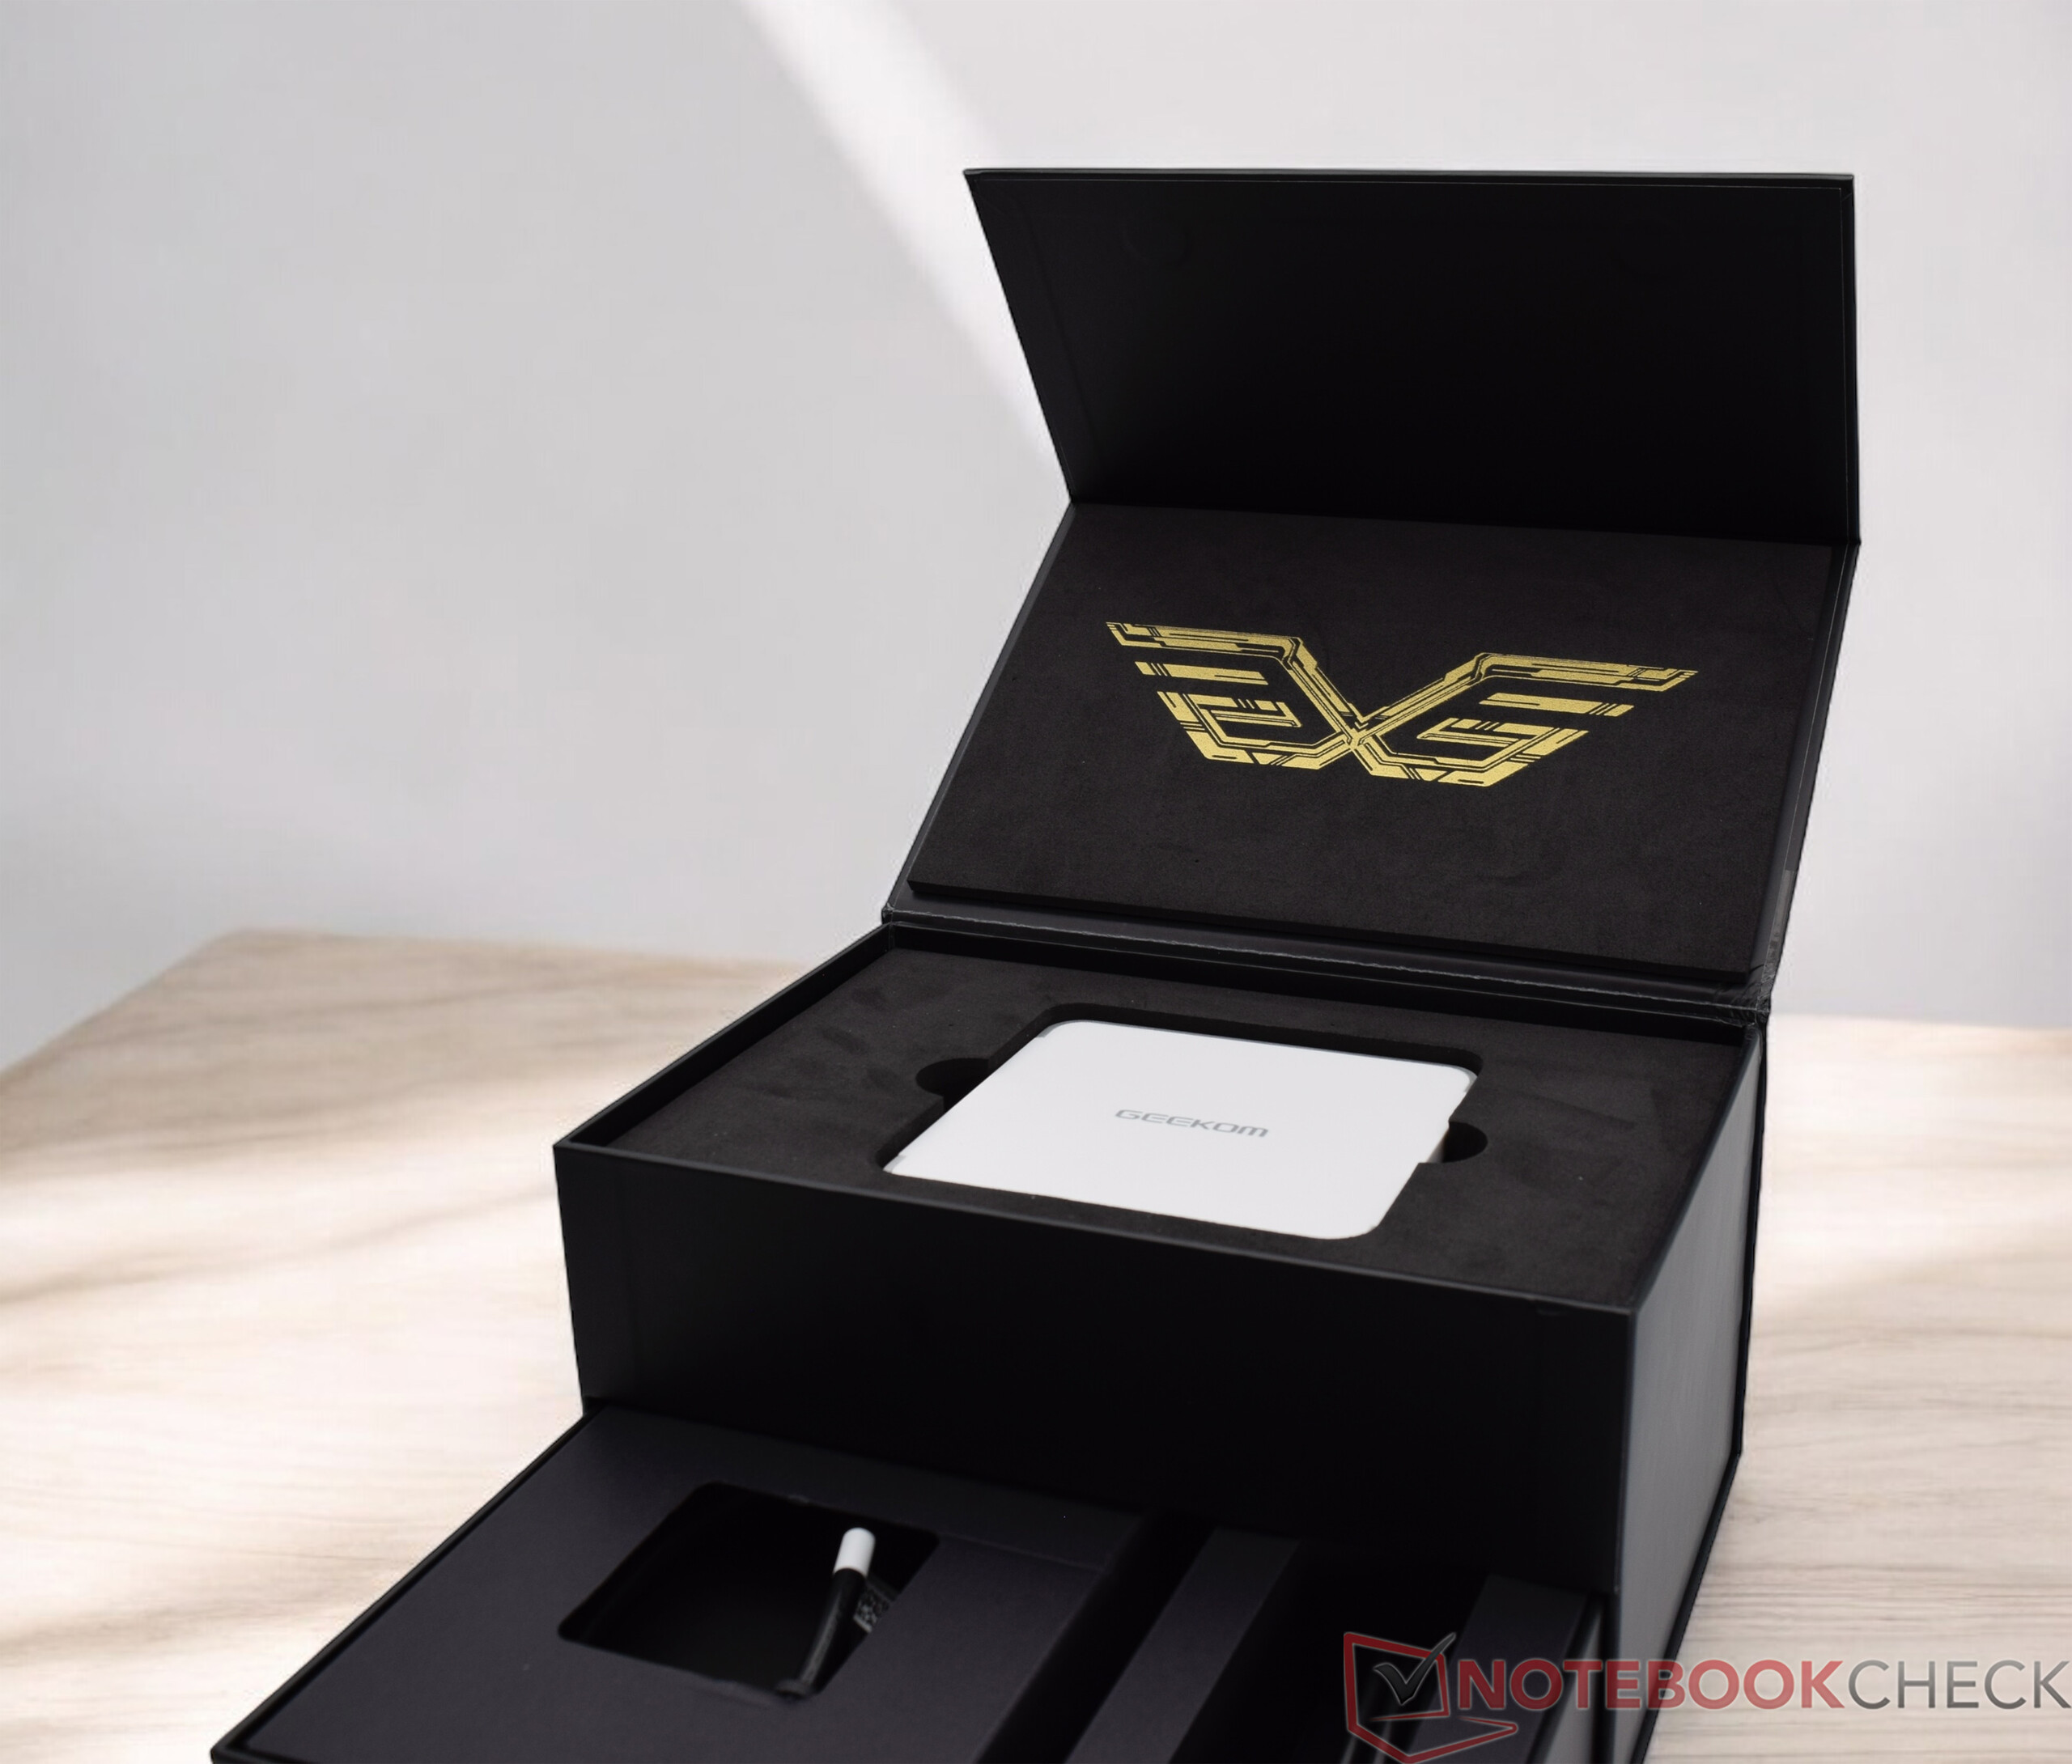
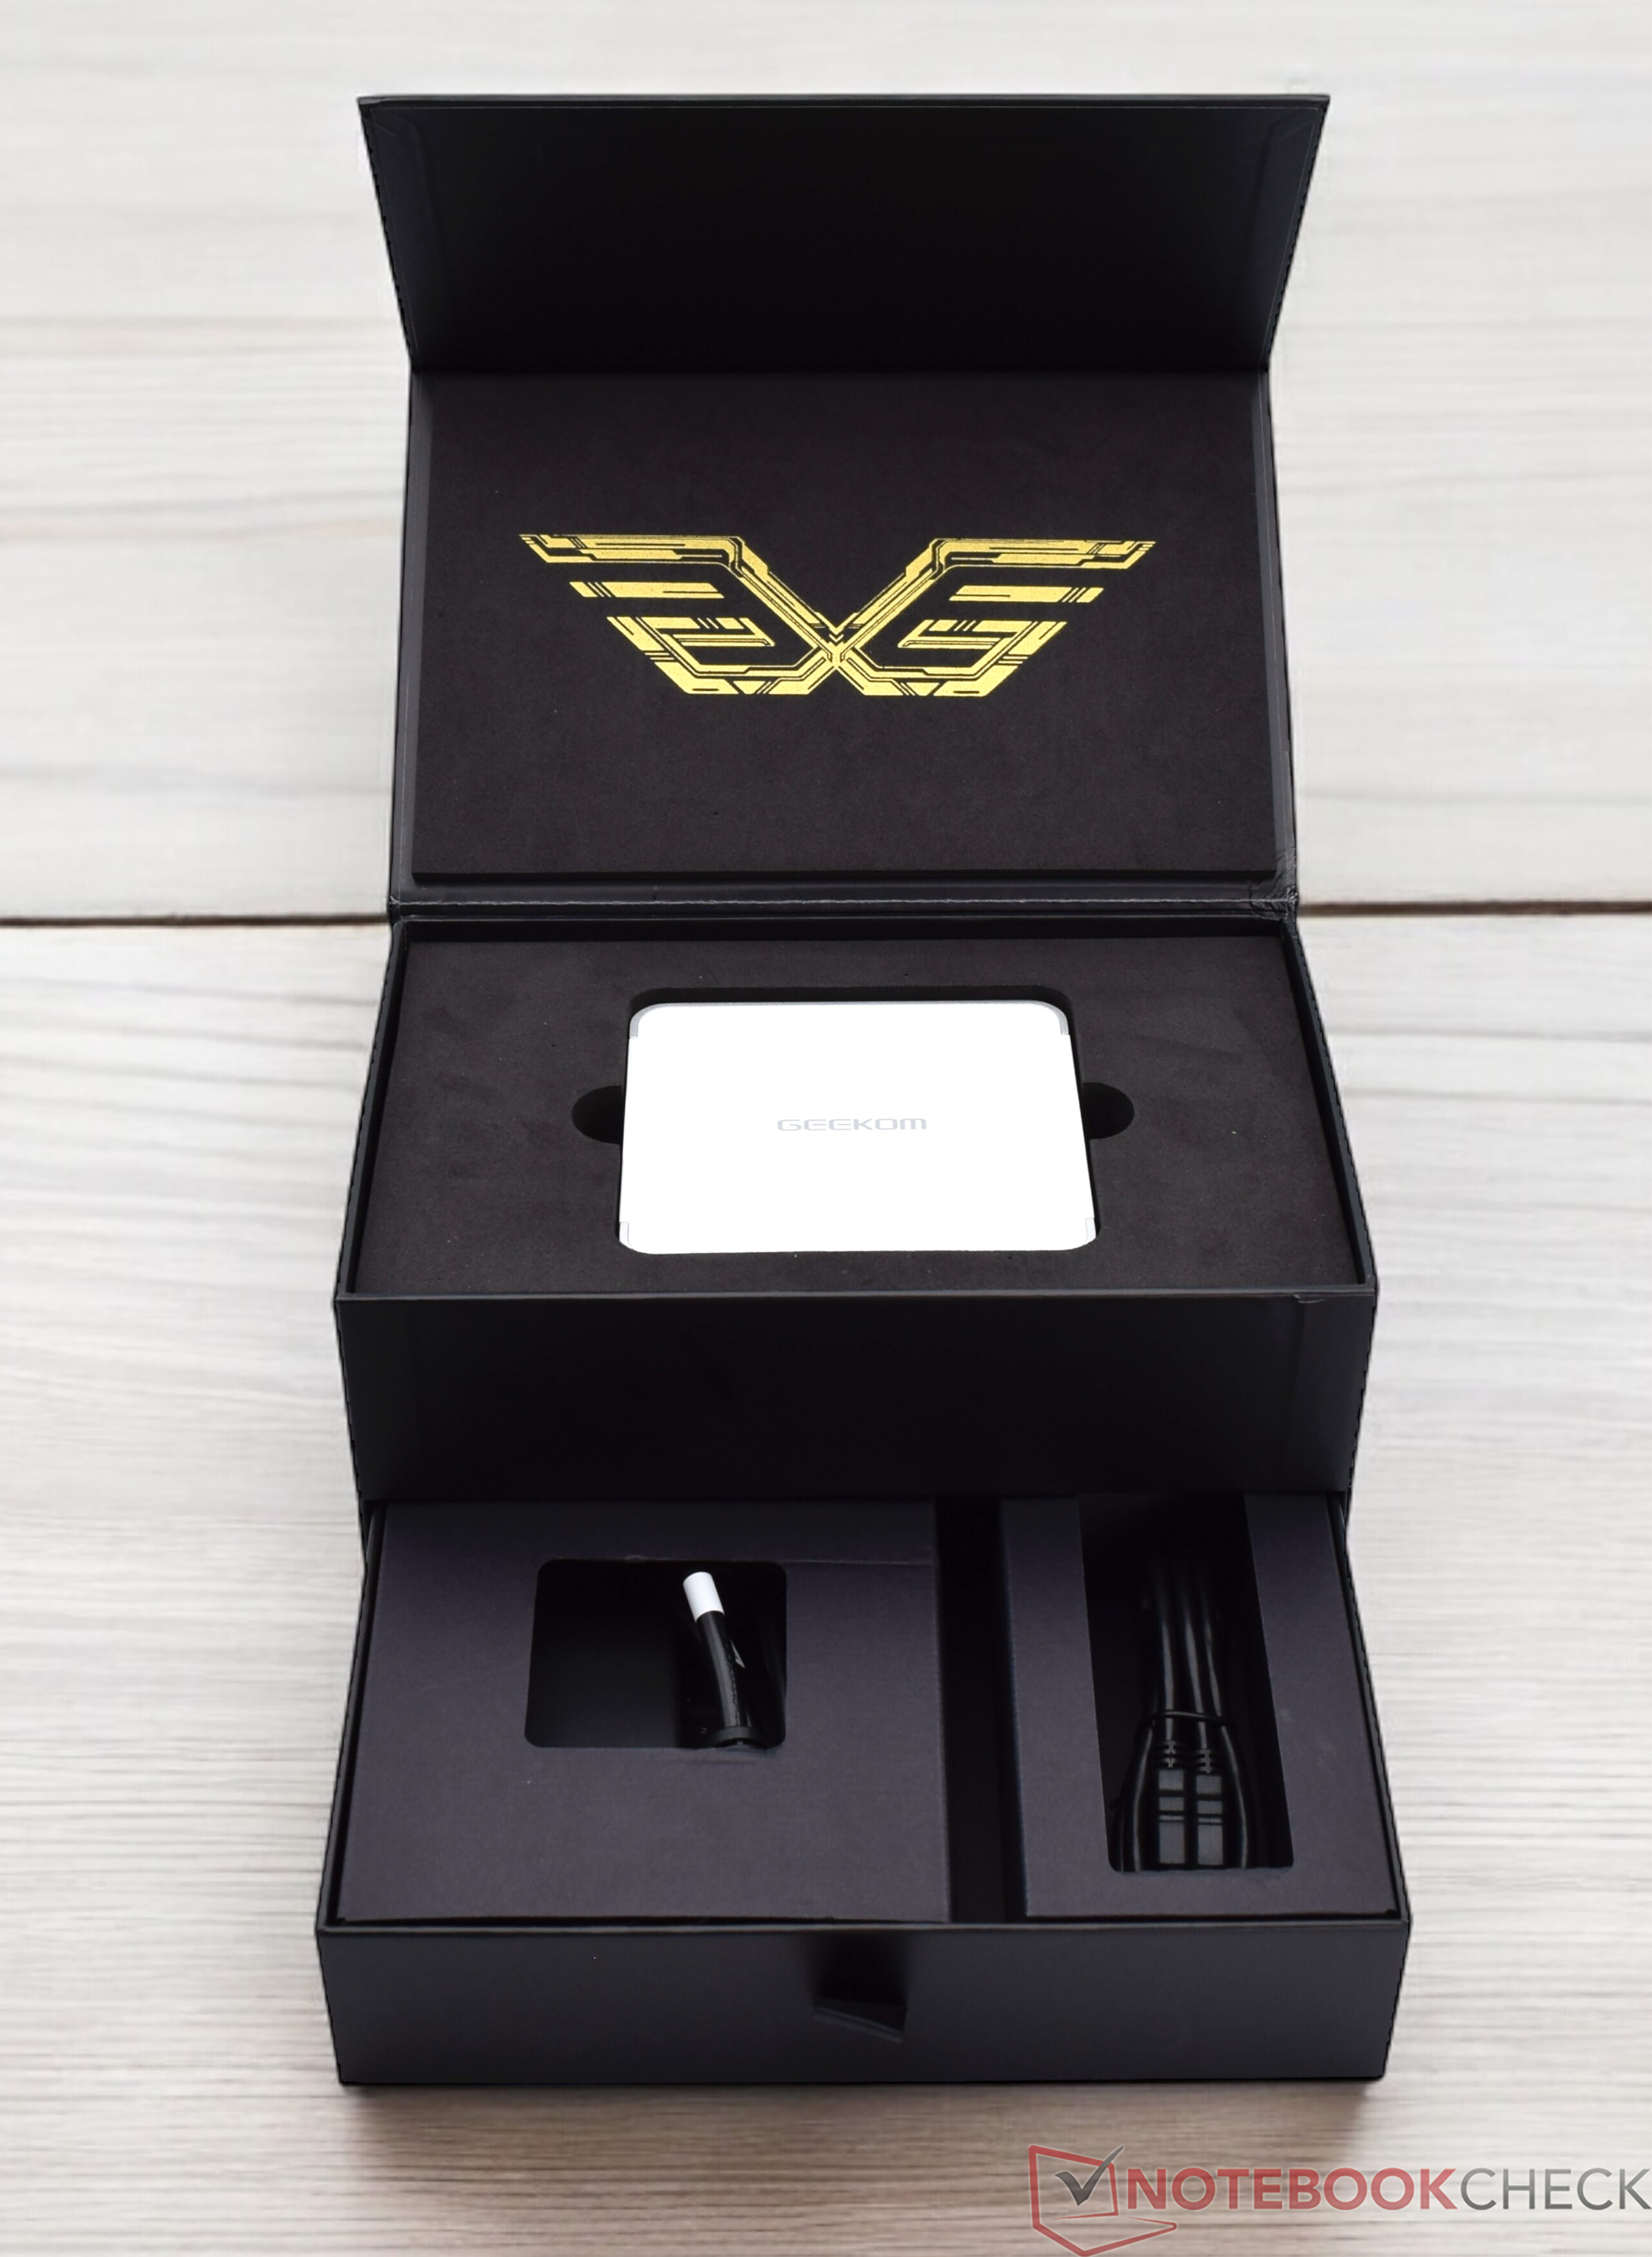
Zakres dostawy Geekom XT13 Pro oferuje zwykły standard. Oprócz samego urządzenia, pudełko zawiera również 120-watowy zasilacz i uchwyt VESA z materiałem montażowym. W zestawie znajduje się również kabel HDMI i obowiązkowa kartka z podziękowaniami od Geekom.
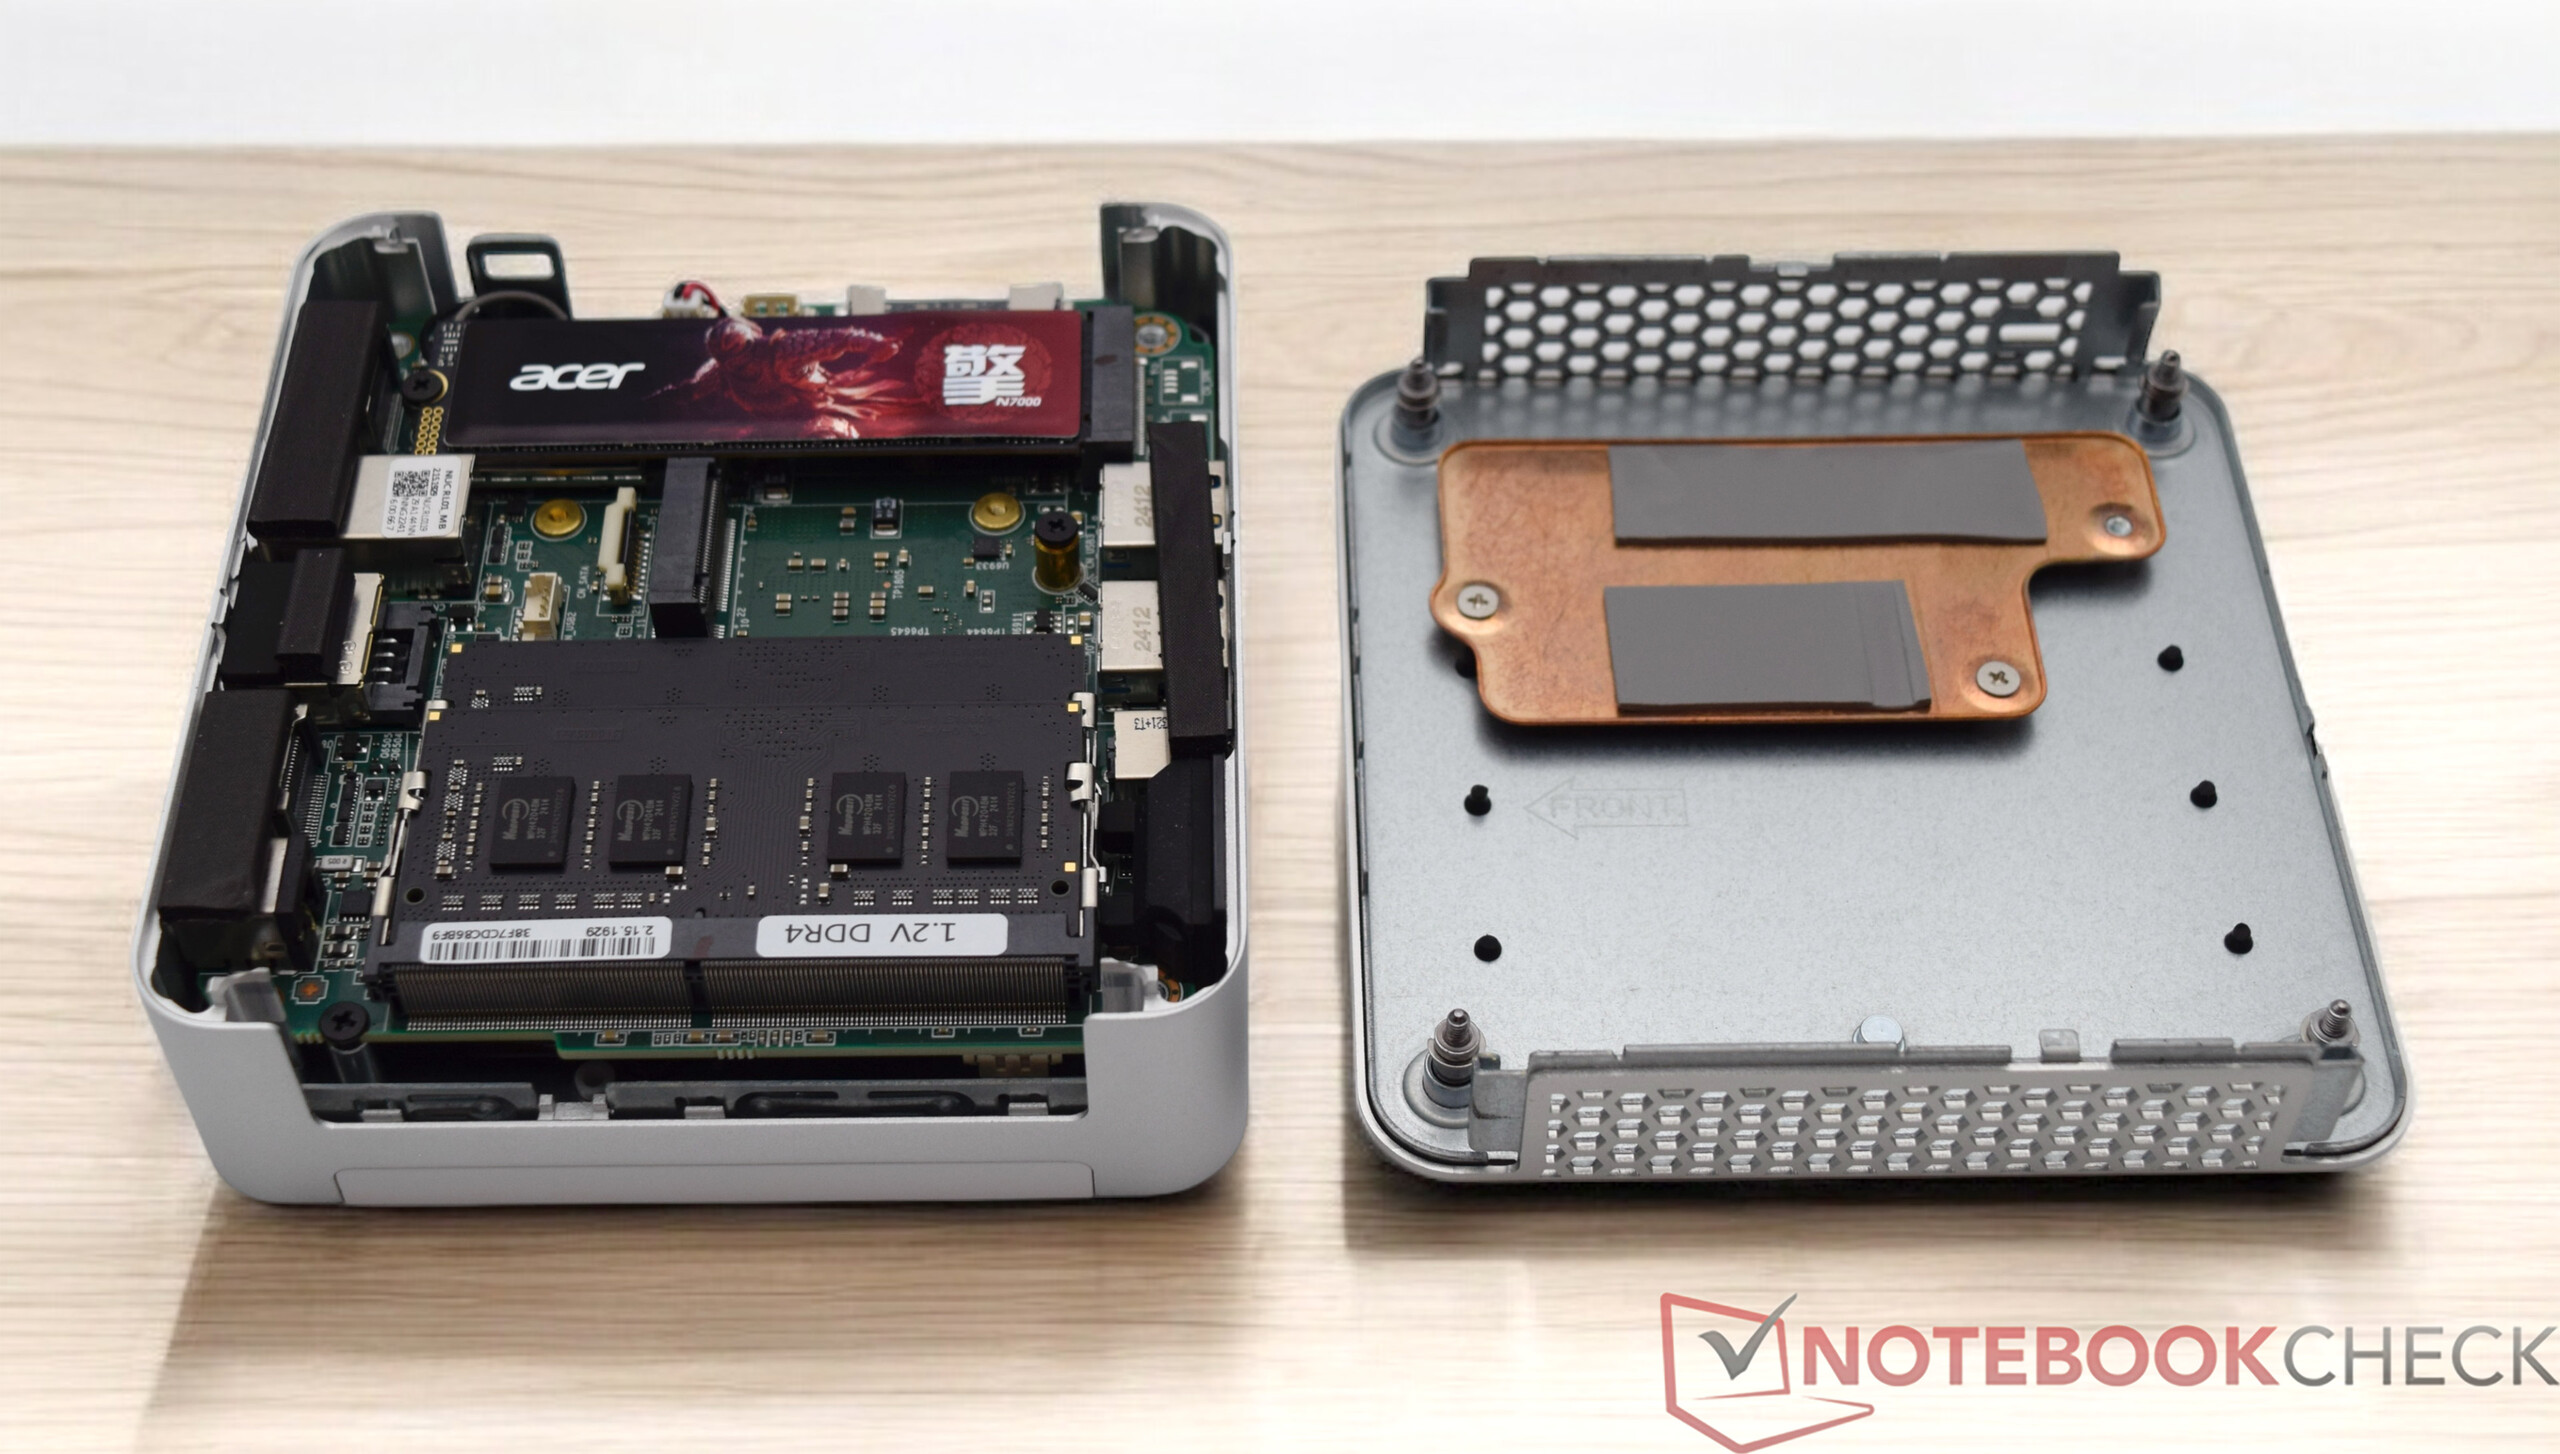
Konserwacja
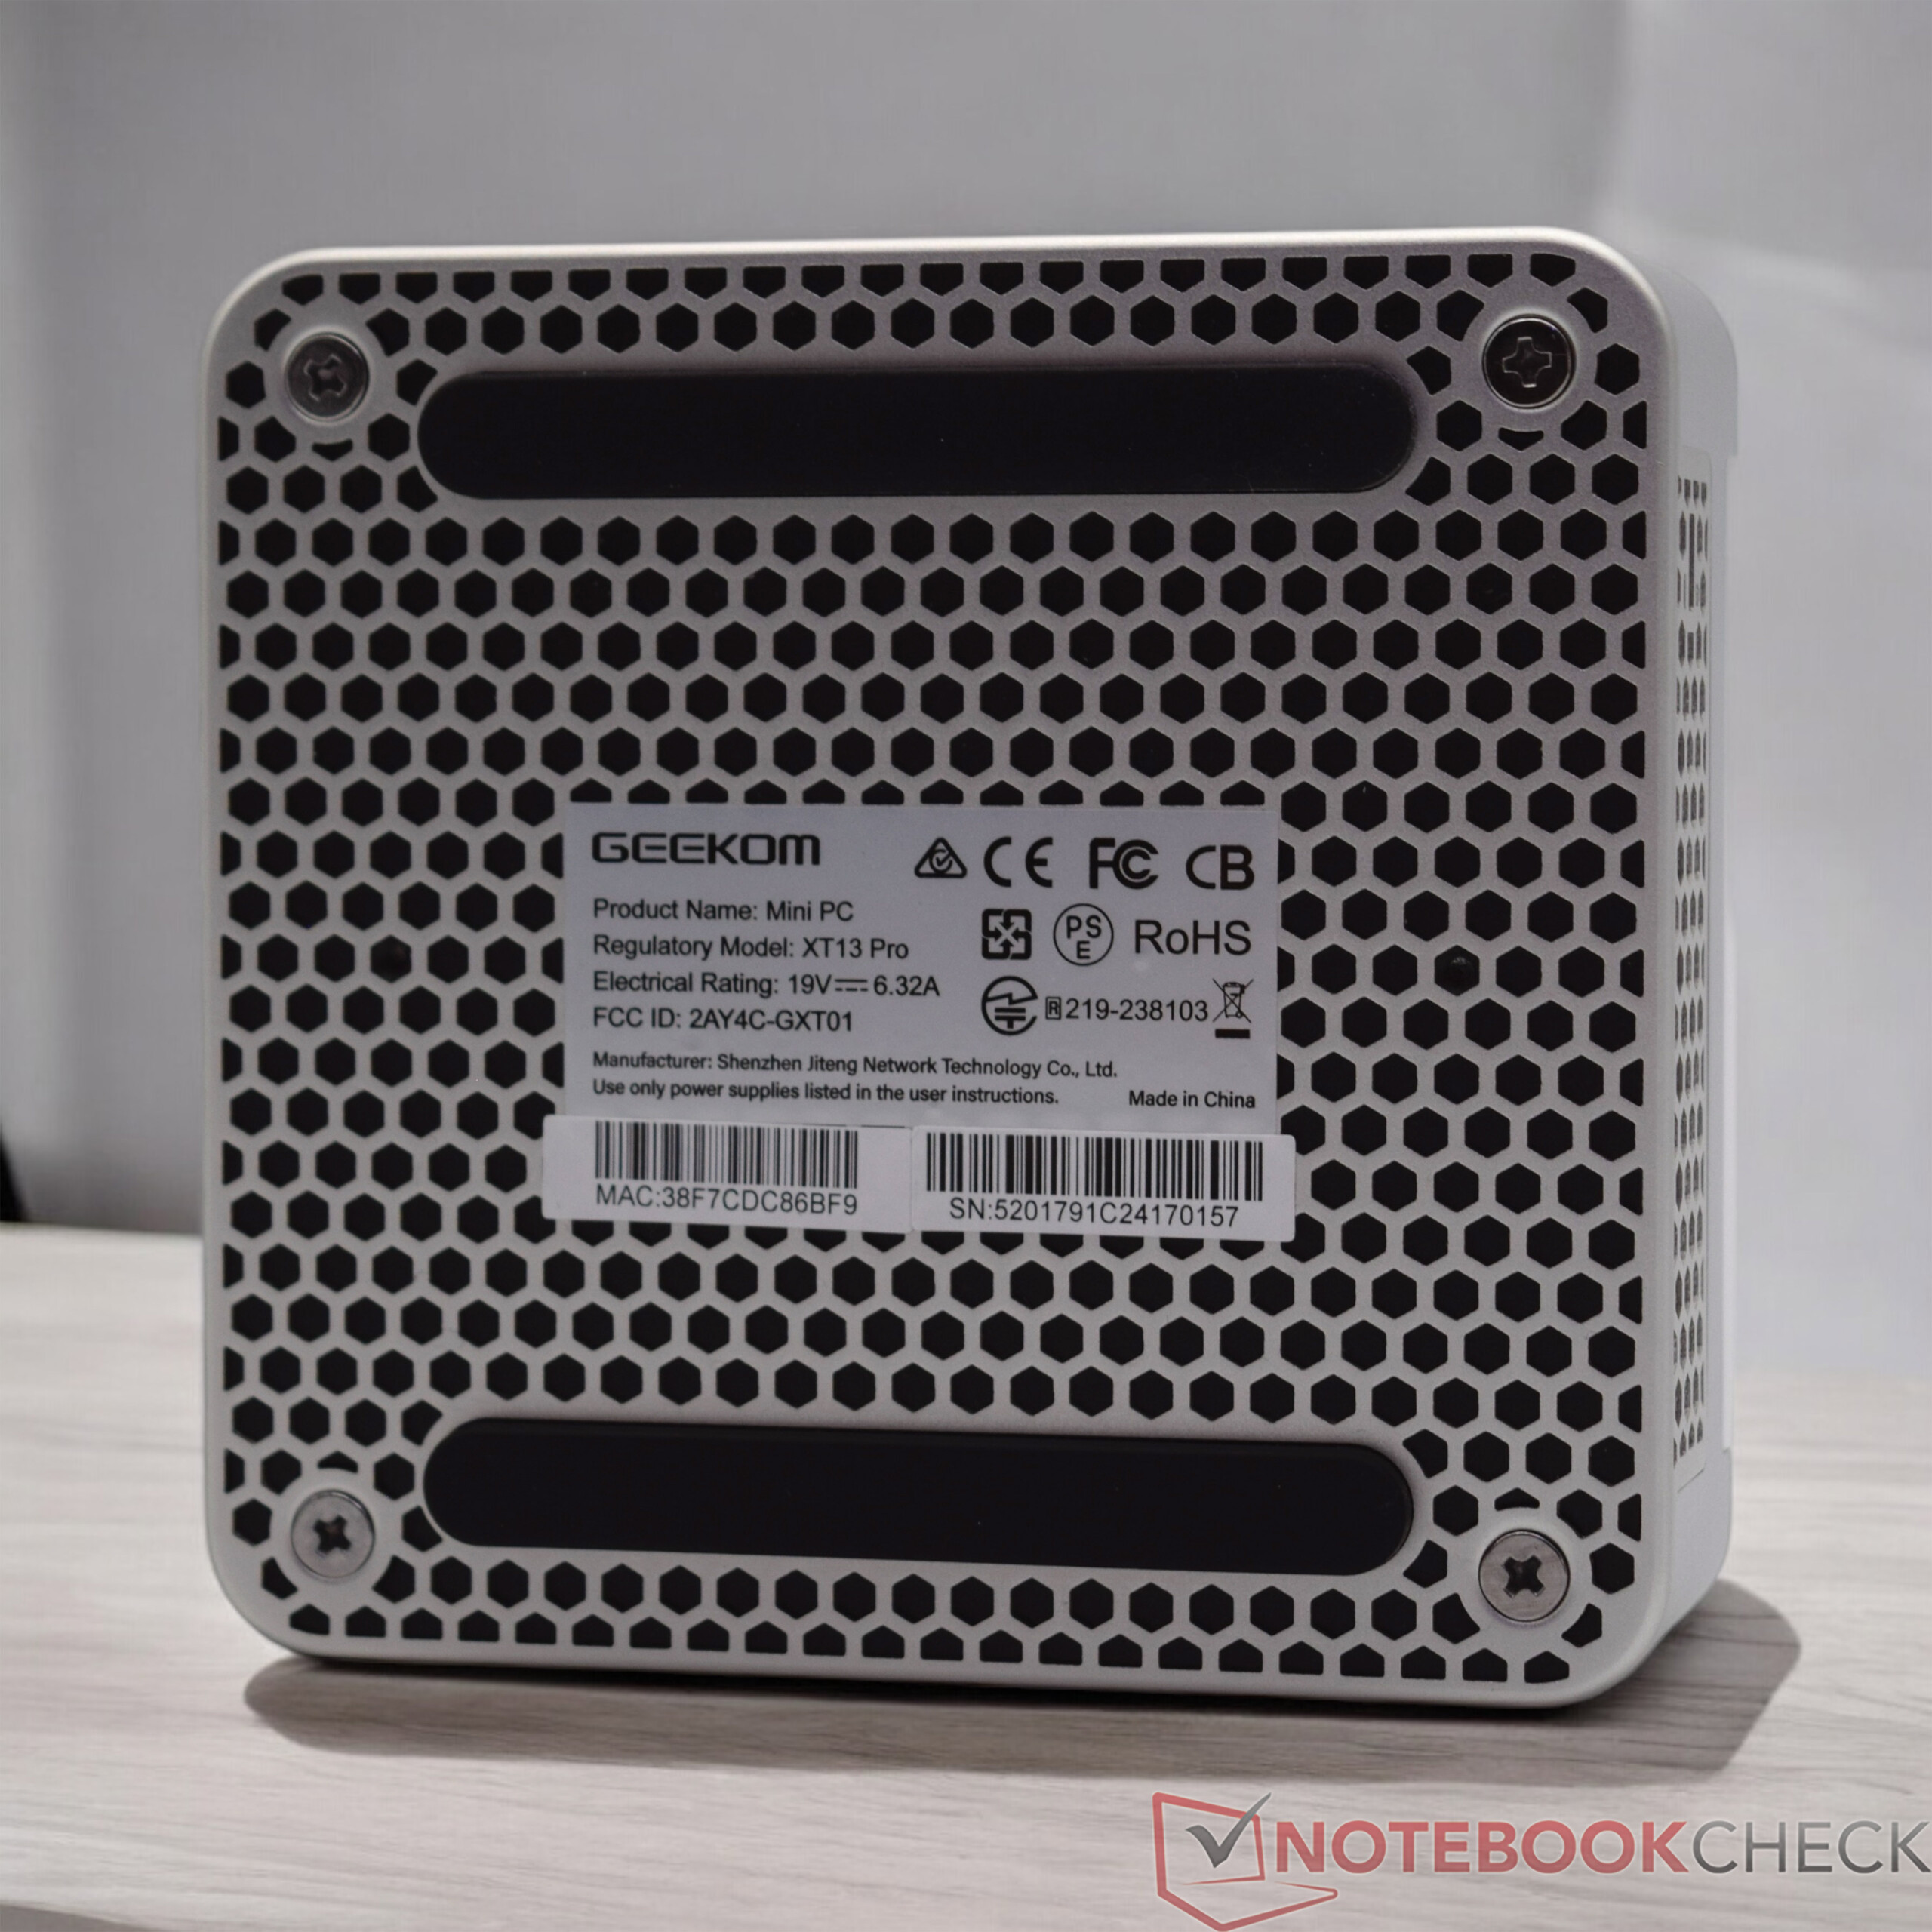
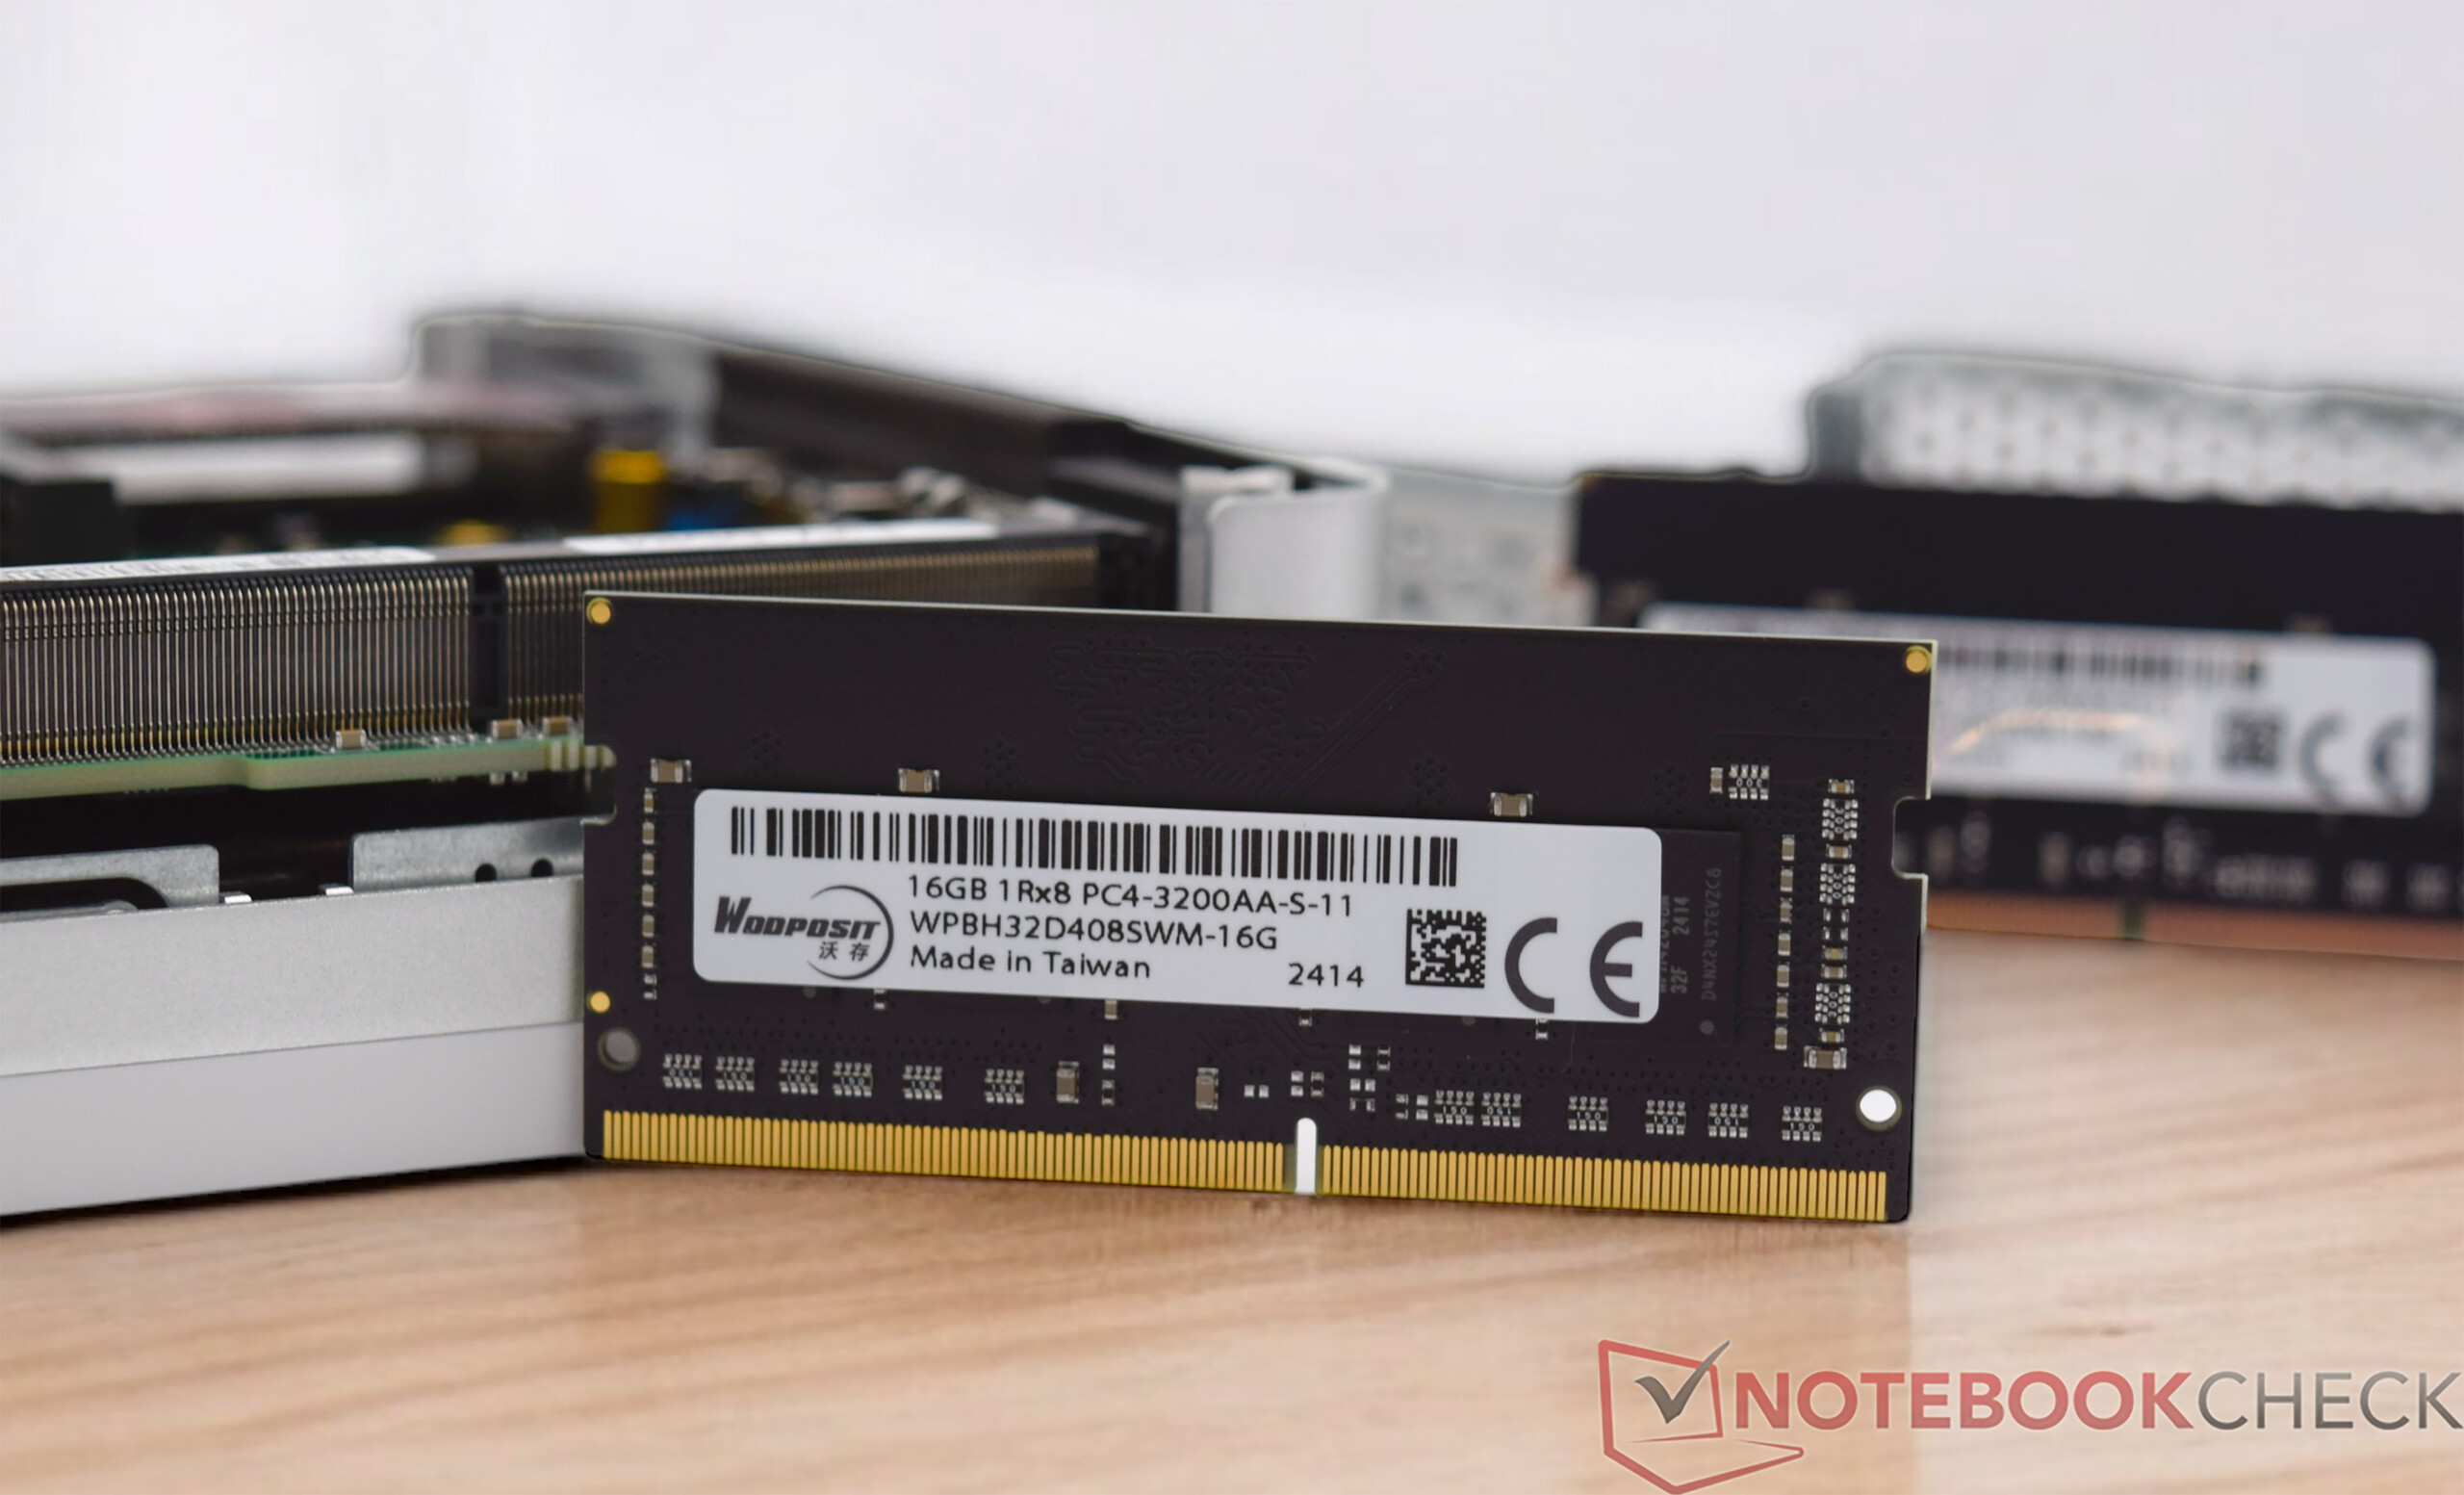
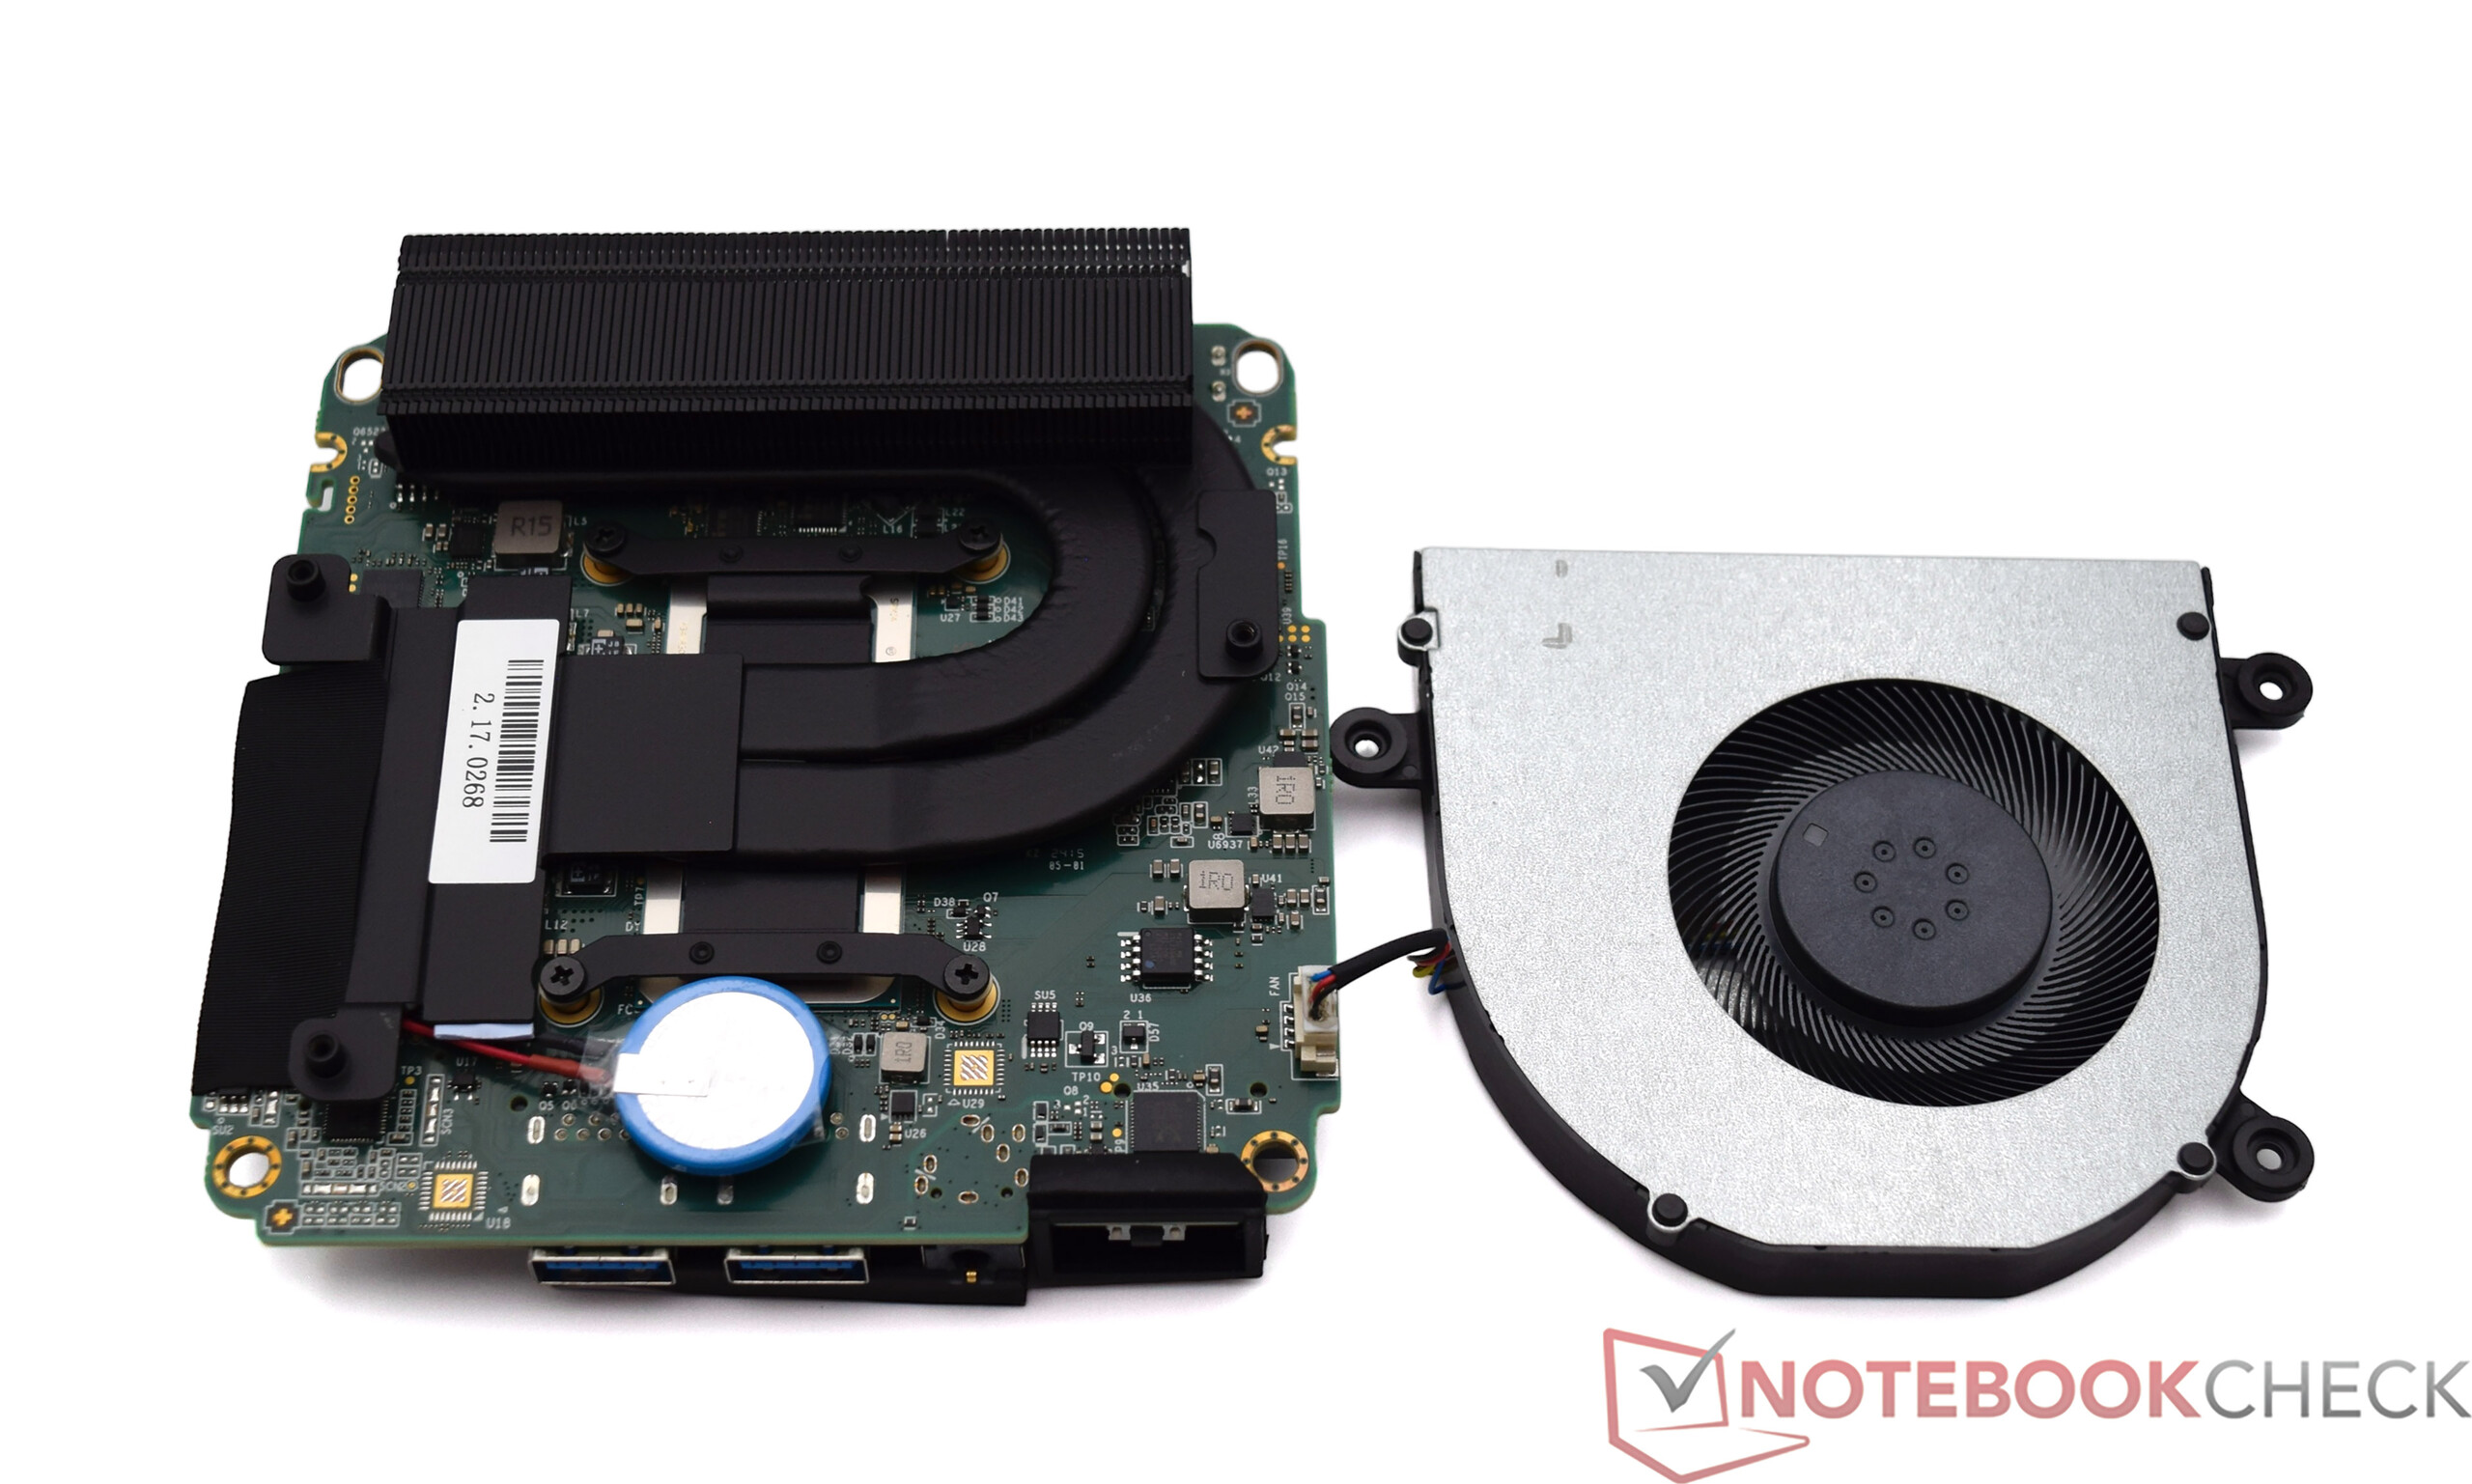
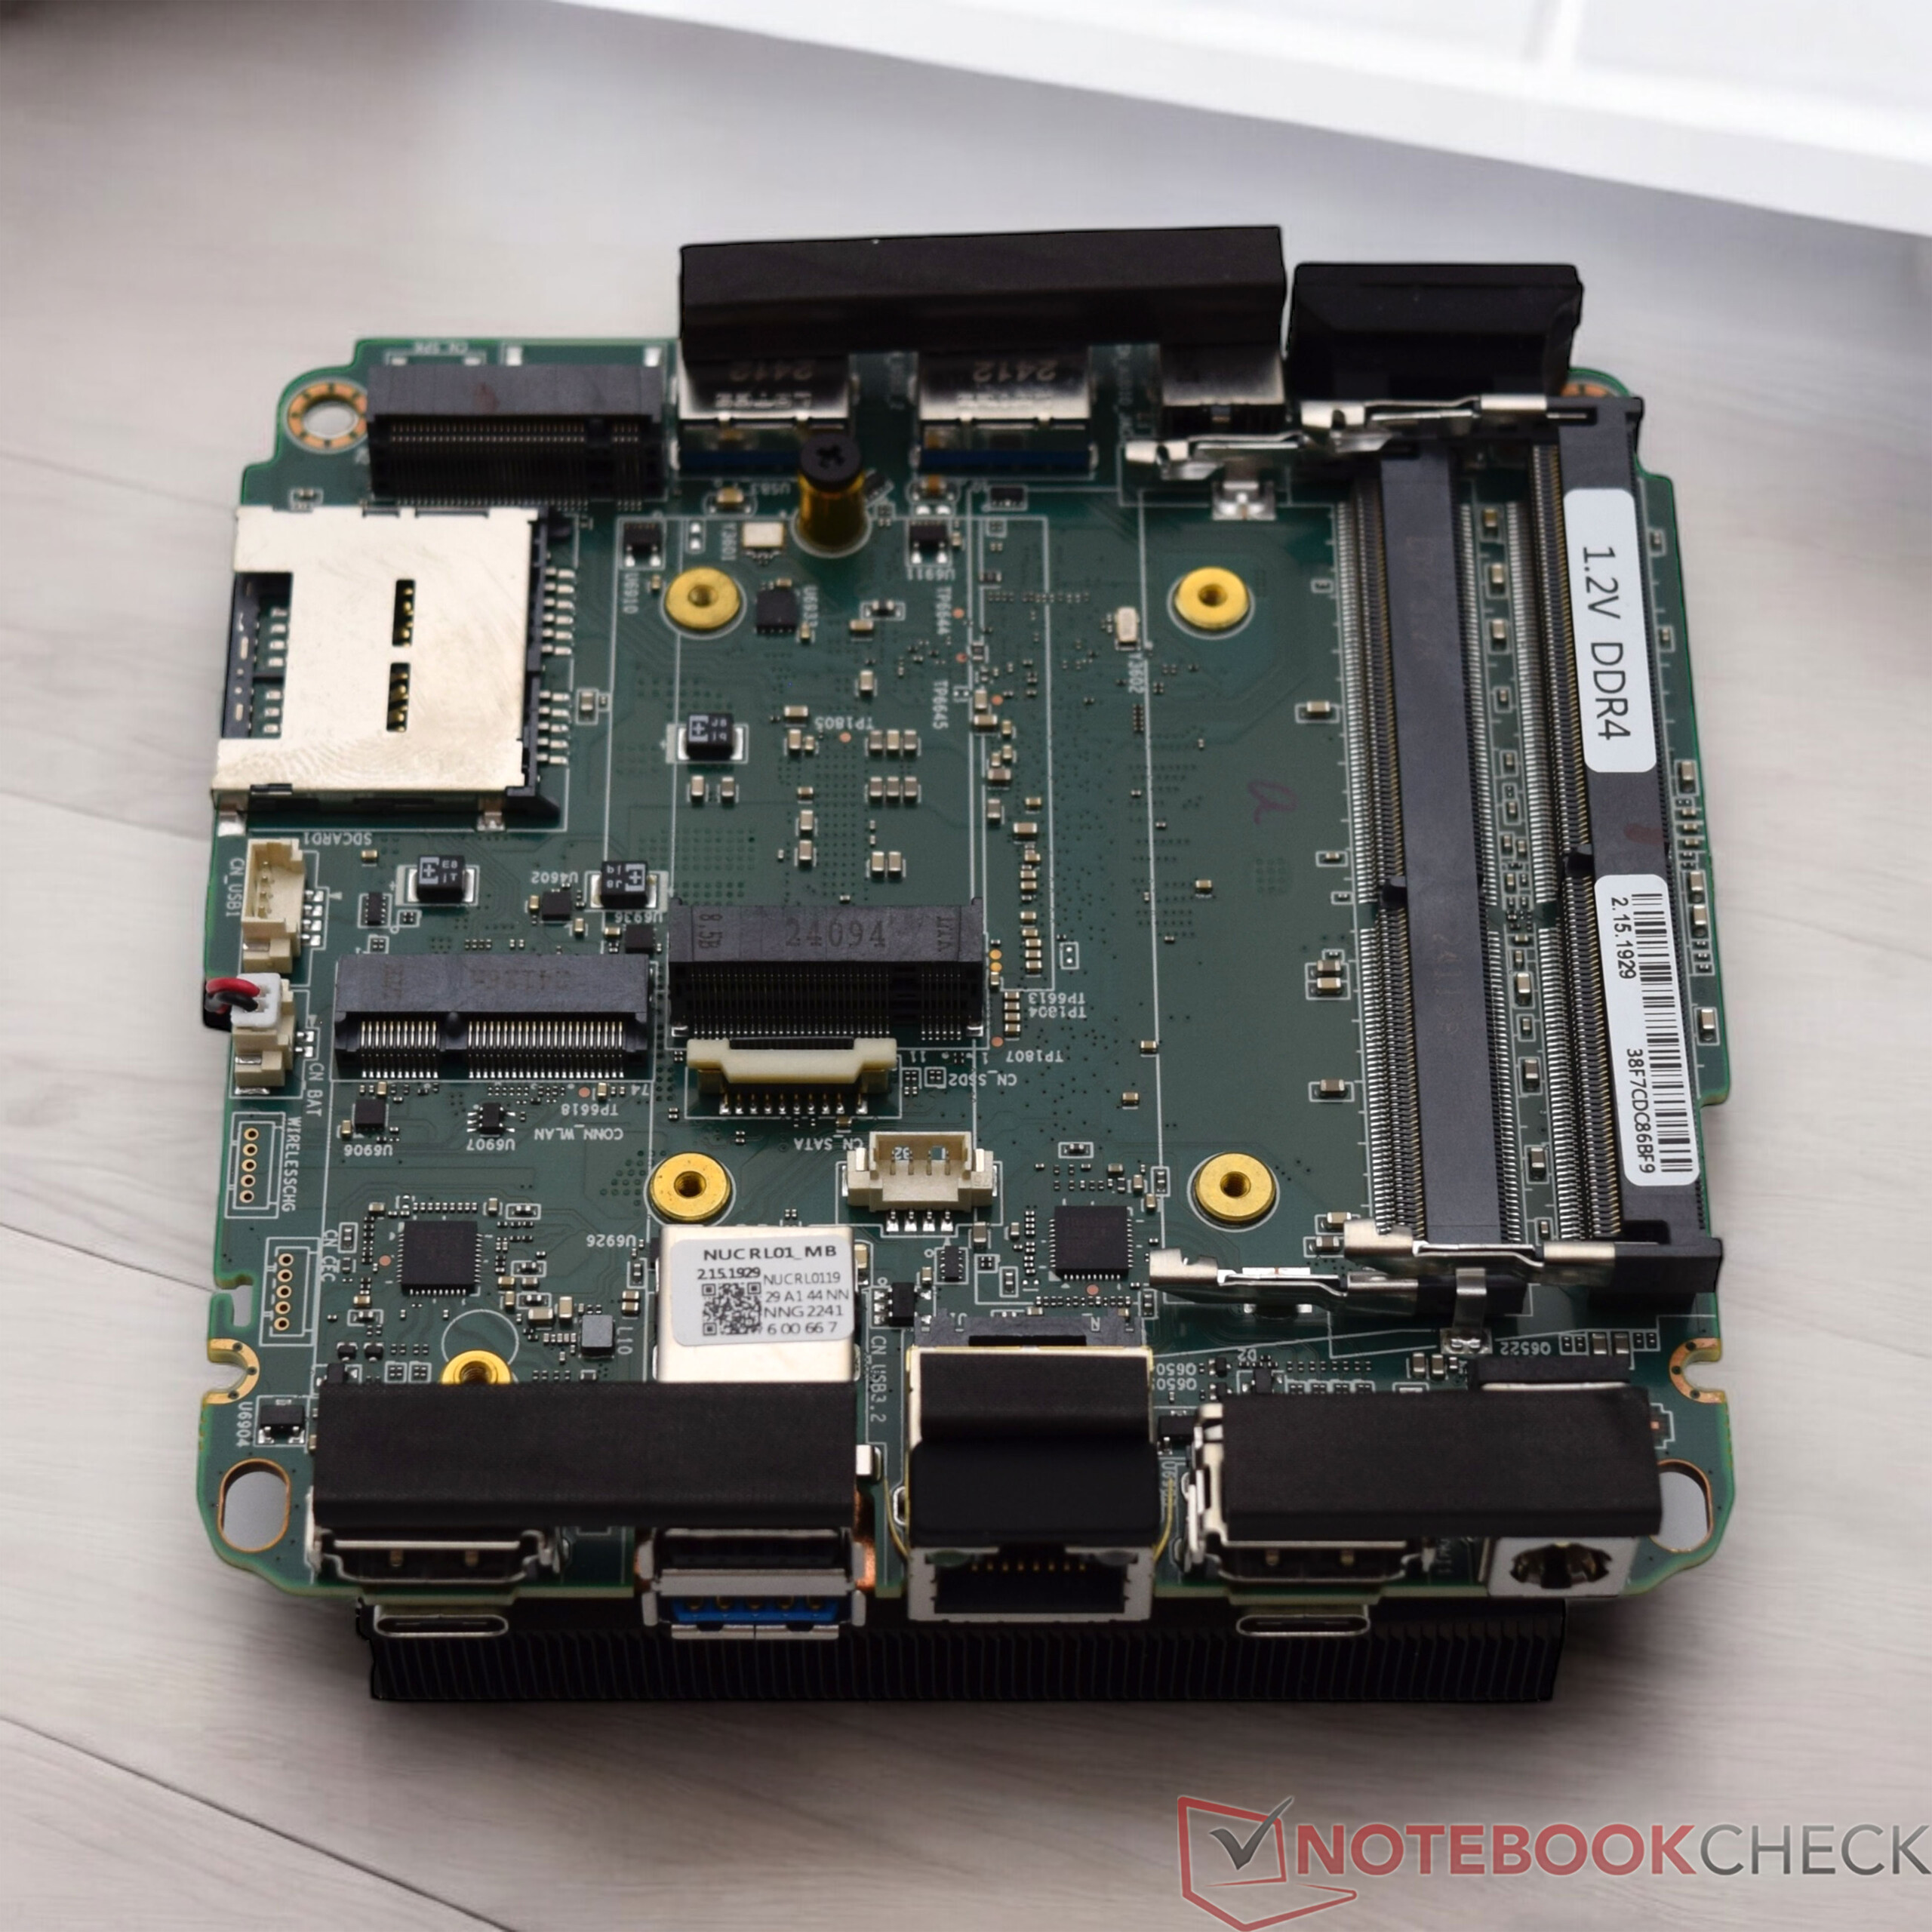
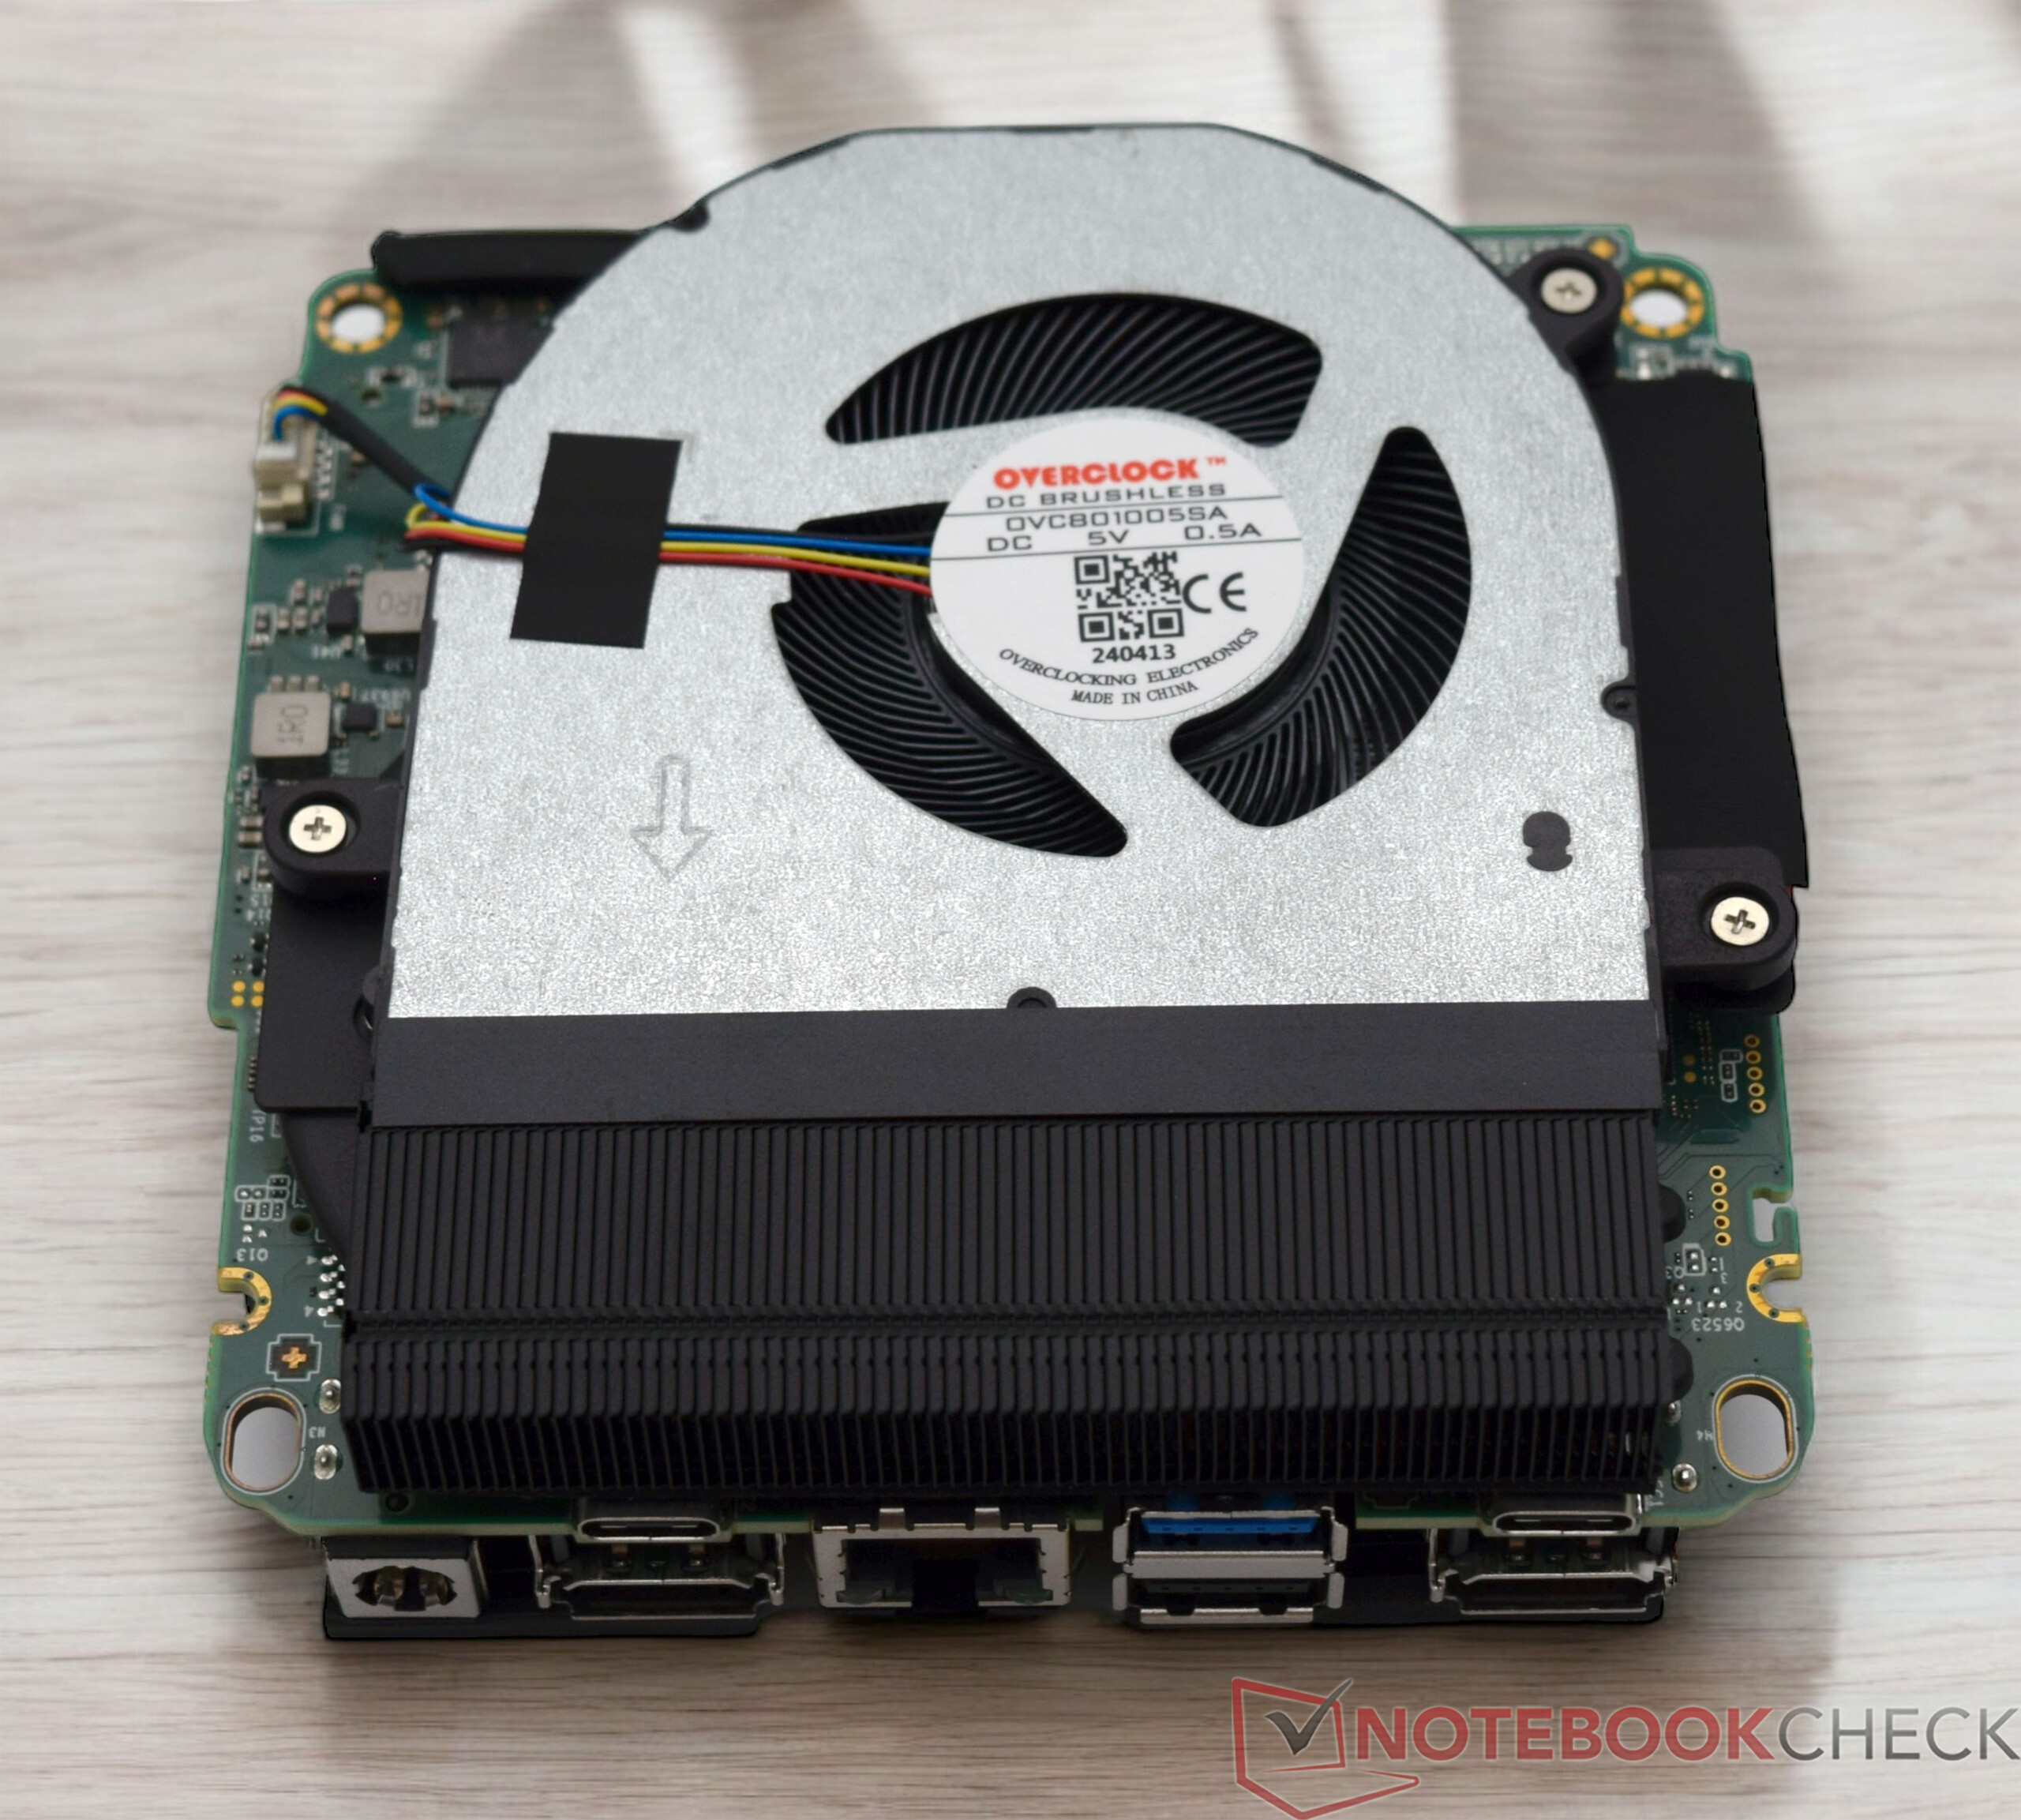
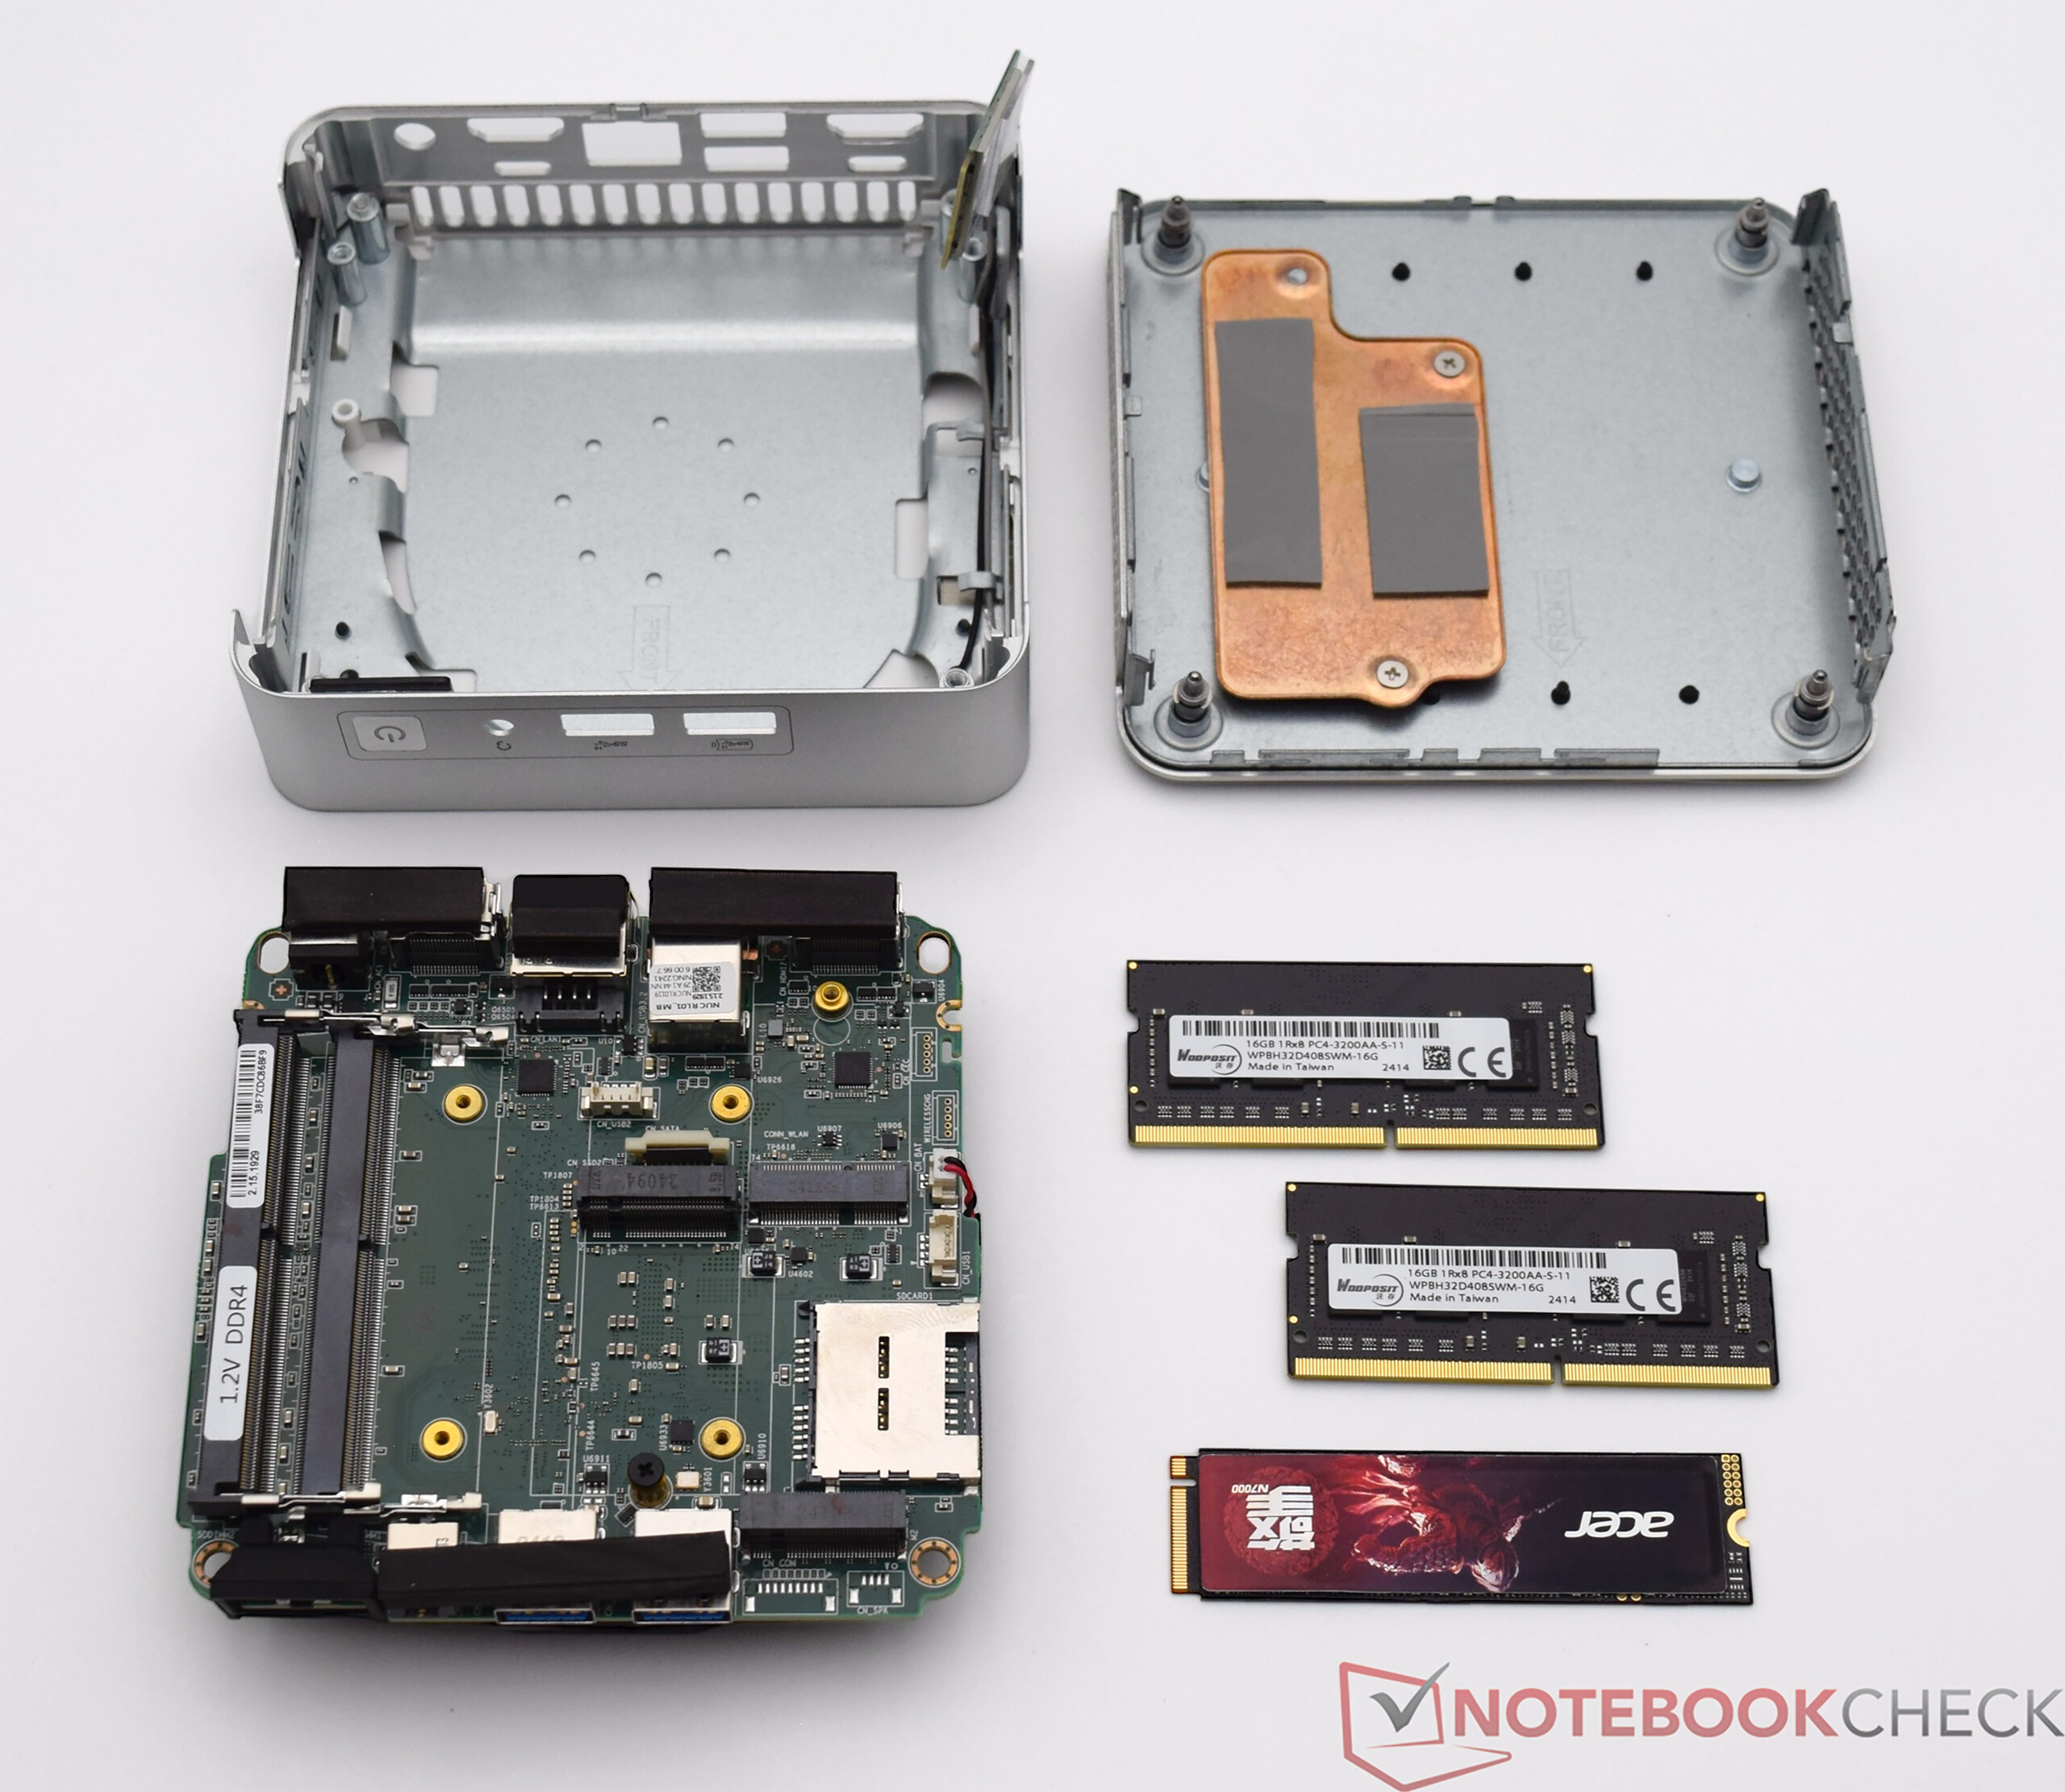
Obudowa Geekom XT13 Pro jest łatwa do otwarcia. Od spodu należy odkręcić tylko cztery małe śrubki, które mocują płytę bazową do reszty obudowy. Na samej płycie bazowej znajduje się chłodnica SSD, dlatego w tym momencie należy zachować nieco większą ostrożność. Pamięć RAM i pamięć masowa są wtedy łatwo dostępne. W naszym przypadku można zainstalować dodatkowy dysk SSD. Należy jednak przestrzegać odpowiedniego standardu, ponieważ kompatybilne są tylko dyski SSD SATA o długości 42 milimetrów.
Zrównoważony rozwój
Geekom XT13 Pro jest dostarczany w stosunkowo dużym pudełku z dużą ilością "powietrza". Widzieliśmy, że Geekom robi to inaczej. Co więcej, standardowe dostarczone akcesoria są zapakowane w oddzielne plastikowe torby, co można poprawić pod względem trwałości. Samo urządzenie wykonane jest głównie z metalu i plastiku. Nie wiemy jednak, czy do jego produkcji użyto materiałów pochodzących z recyklingu. Pozytywnym aspektem jest fakt, że producent oferuje 36-miesięczną gwarancję.
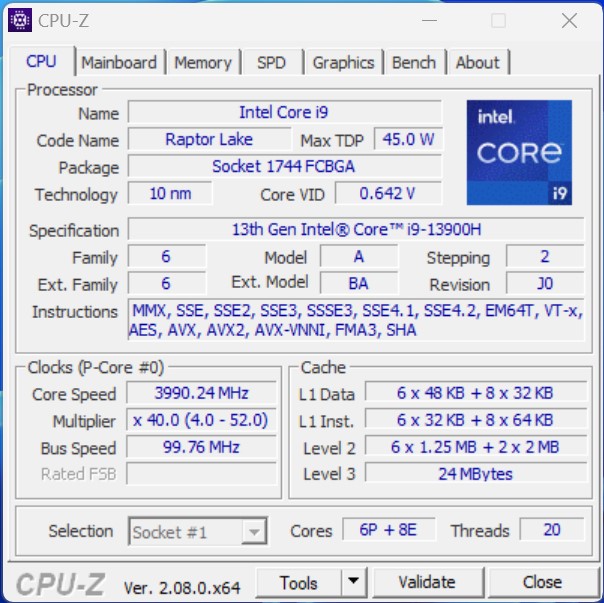
Wydajność - Intel Core i9-13900H z 14 rdzeniami i 20 wątkami
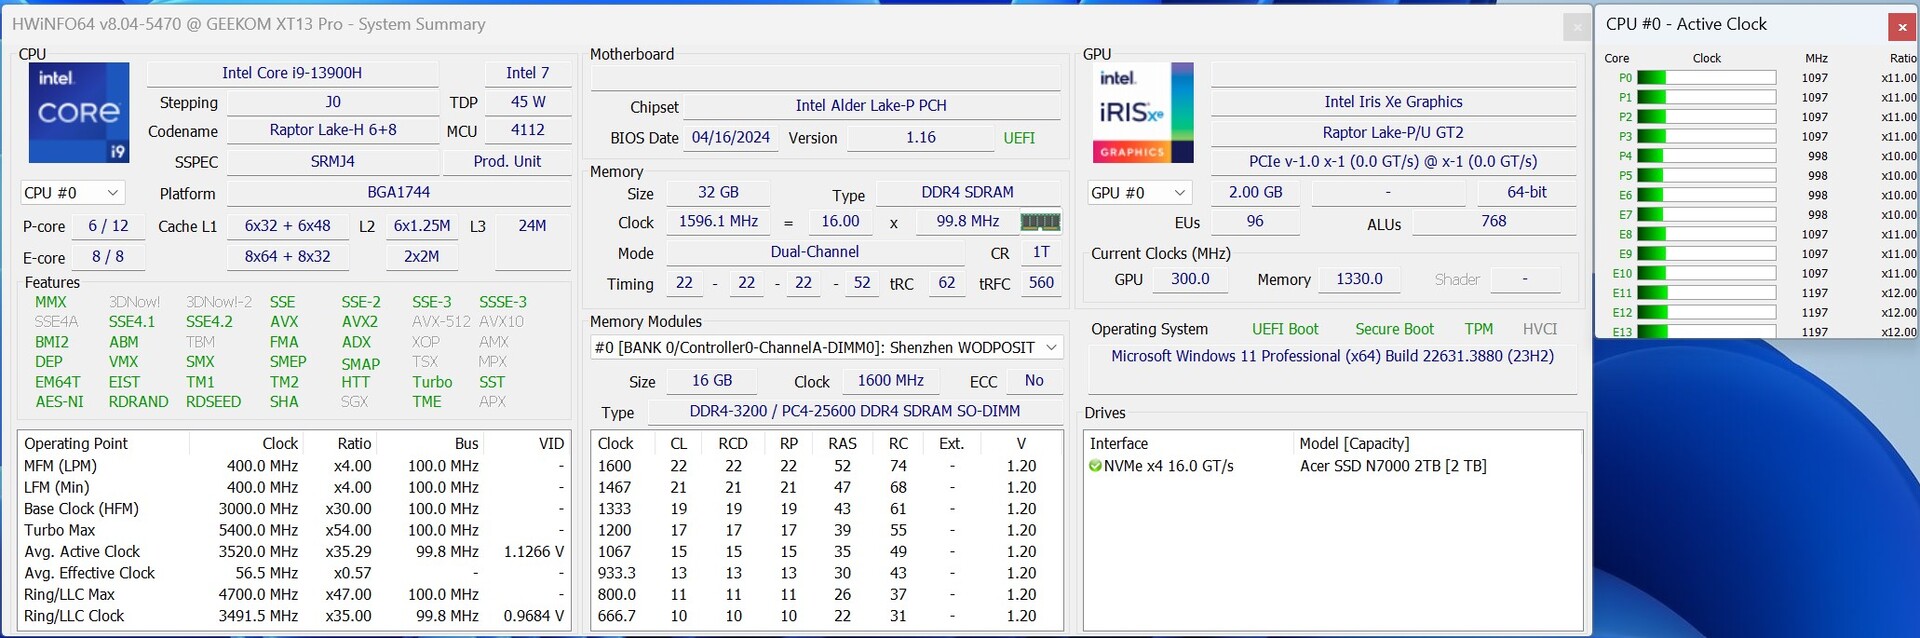
Geekom XT13 Pro jest dostępny w najwyższej konfiguracji z procesorem Intel Core i9-13900H w topowej konfiguracji. Alternatywnie, komputer NUC może być również wyposażony w nieco słabszy procesor Intel Core i7-13620H który również jest wyposażony w 6 rdzeni i powinien być tylko nieznacznie gorszy od topowego modelu pod względem wydajności. w zestawie zawsze znajduje się 32 GB pamięci RAM DDR4, choć szybki dysk SSD NVMe zapewnia solidną podstawową konfigurację. Geekom XT13 Pro nie jest też zadaniem nie do pokonania dla wymagających wydajności aplikacji. Niemniej jednak, wydajność 3D iGPU jest największym słabym punktem, ale można to znacznie poprawić za pomocą eGPU.
Warunki testu
Do wszystkich testów wydajności Geekom XT13 Pro używamy profilu energetycznego "Wysoka wydajność". Odchylenia od niego wystąpiły tylko w pomiarach zużycia energii i hałasu zgodnie z naszymi kryteriami testowymi Kryteria testu. Zgodnie ze specyfikacją producenta, Geekom pozwala SoC działać przy najniższym zużyciu energii. W liczbach oznacza to limit mocy 35 watów przy ciągłym obciążeniu, chociaż do 64 watów jest dozwolone przez krótkie okresy.
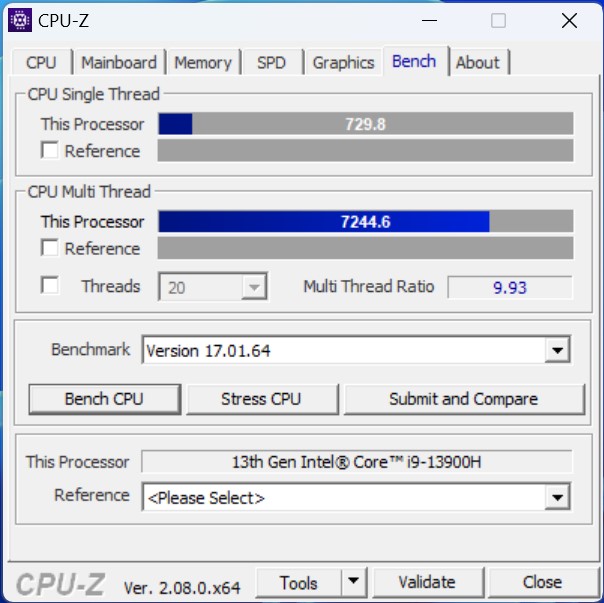
Procesor

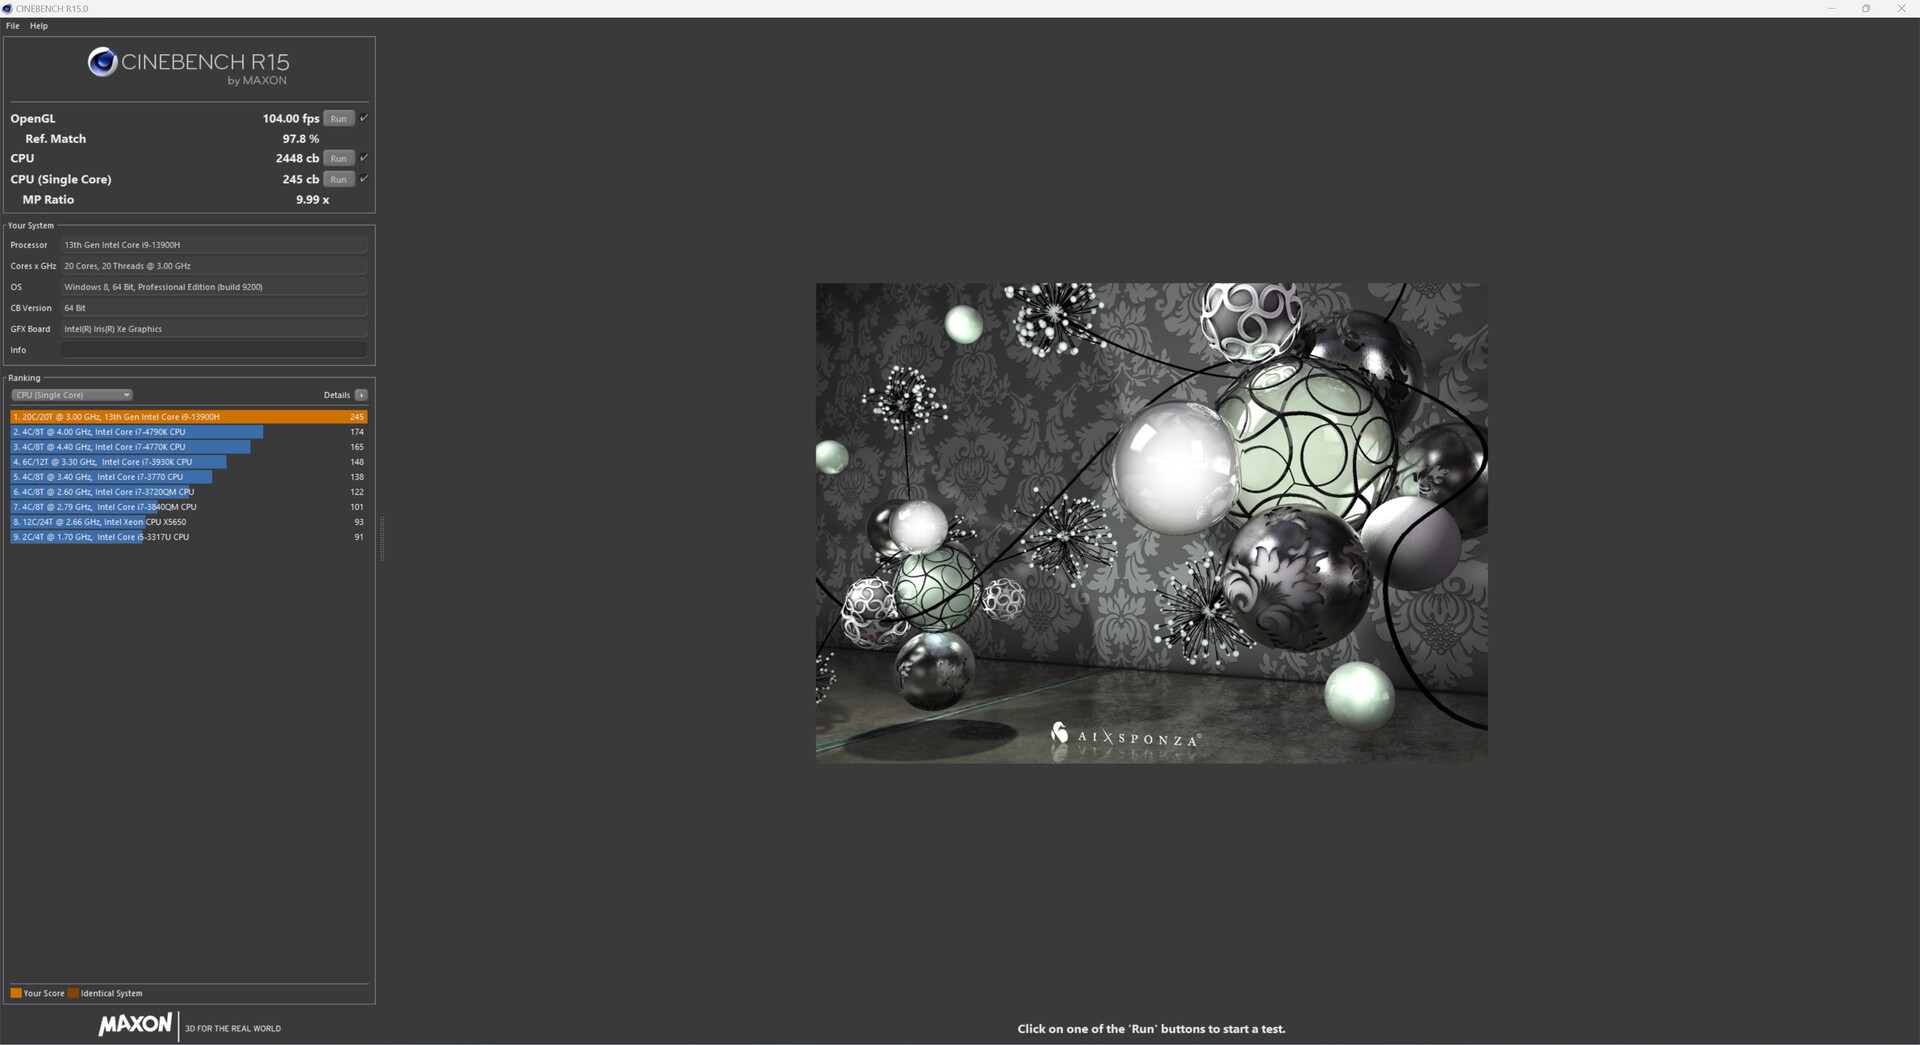
Procesor Intel Core i9-13900H bazuje na architekturze Raptor Lake i łączy w sobie rdzenie 6P i 8E. Technicznie rzecz biorąc, są to Intel Core i9-12900H jak możemy zobaczyć w naszych wynikach testów porównawczych w porównaniu do Geekom XT12 Pro. W szczegółach widzimy jednak niewielką przewagę na korzyść Intel Core i9-13900H, który może zwrócić na siebie uwagę nieco lepszą wydajnością wielordzeniową. Jeden AMD Ryzen 9 7940HS lub nowsze modele Intela z serii Meteor Lake. Przepaść względem nieco szybszych modeli konkurencji nie jest jednak zbyt duża. Nie ma mowy o zauważalnej różnicy w wydajności w codziennym użytkowaniu ze względu na niewielkie różnice.
Więcej testów porównawczych procesorów znajdą Państwo tutaj.
| Performance Rating - Percent | |
| Geekom A7 | |
| Aoostar GEM12 | |
| Minisforum AtomMan X7 Ti | |
| Acemagic F2A | |
| Geekom XT13 Pro | |
| Geekom XT12 Pro | |
| Cinebench 2024 | |
| CPU Multi Core | |
| Minisforum AtomMan X7 Ti | |
| Acemagic F2A | |
| Aoostar GEM12 | |
| Geekom A7 | |
| Geekom XT13 Pro | |
| Geekom XT12 Pro | |
| CPU Single Core | |
| Minisforum AtomMan X7 Ti | |
| Geekom A7 | |
| Geekom XT12 Pro | |
| Aoostar GEM12 | |
| Acemagic F2A | |
| Geekom XT13 Pro | |
| Cinebench R15 | |
| CPU Single 64Bit | |
| Aoostar GEM12 | |
| Geekom A7 | |
| Minisforum AtomMan X7 Ti | |
| Acemagic F2A | |
| Geekom XT12 Pro | |
| Geekom XT13 Pro | |
| CPU Multi 64Bit | |
| Minisforum AtomMan X7 Ti | |
| Acemagic F2A | |
| Aoostar GEM12 | |
| Geekom A7 | |
| Geekom XT13 Pro | |
| Geekom XT12 Pro | |
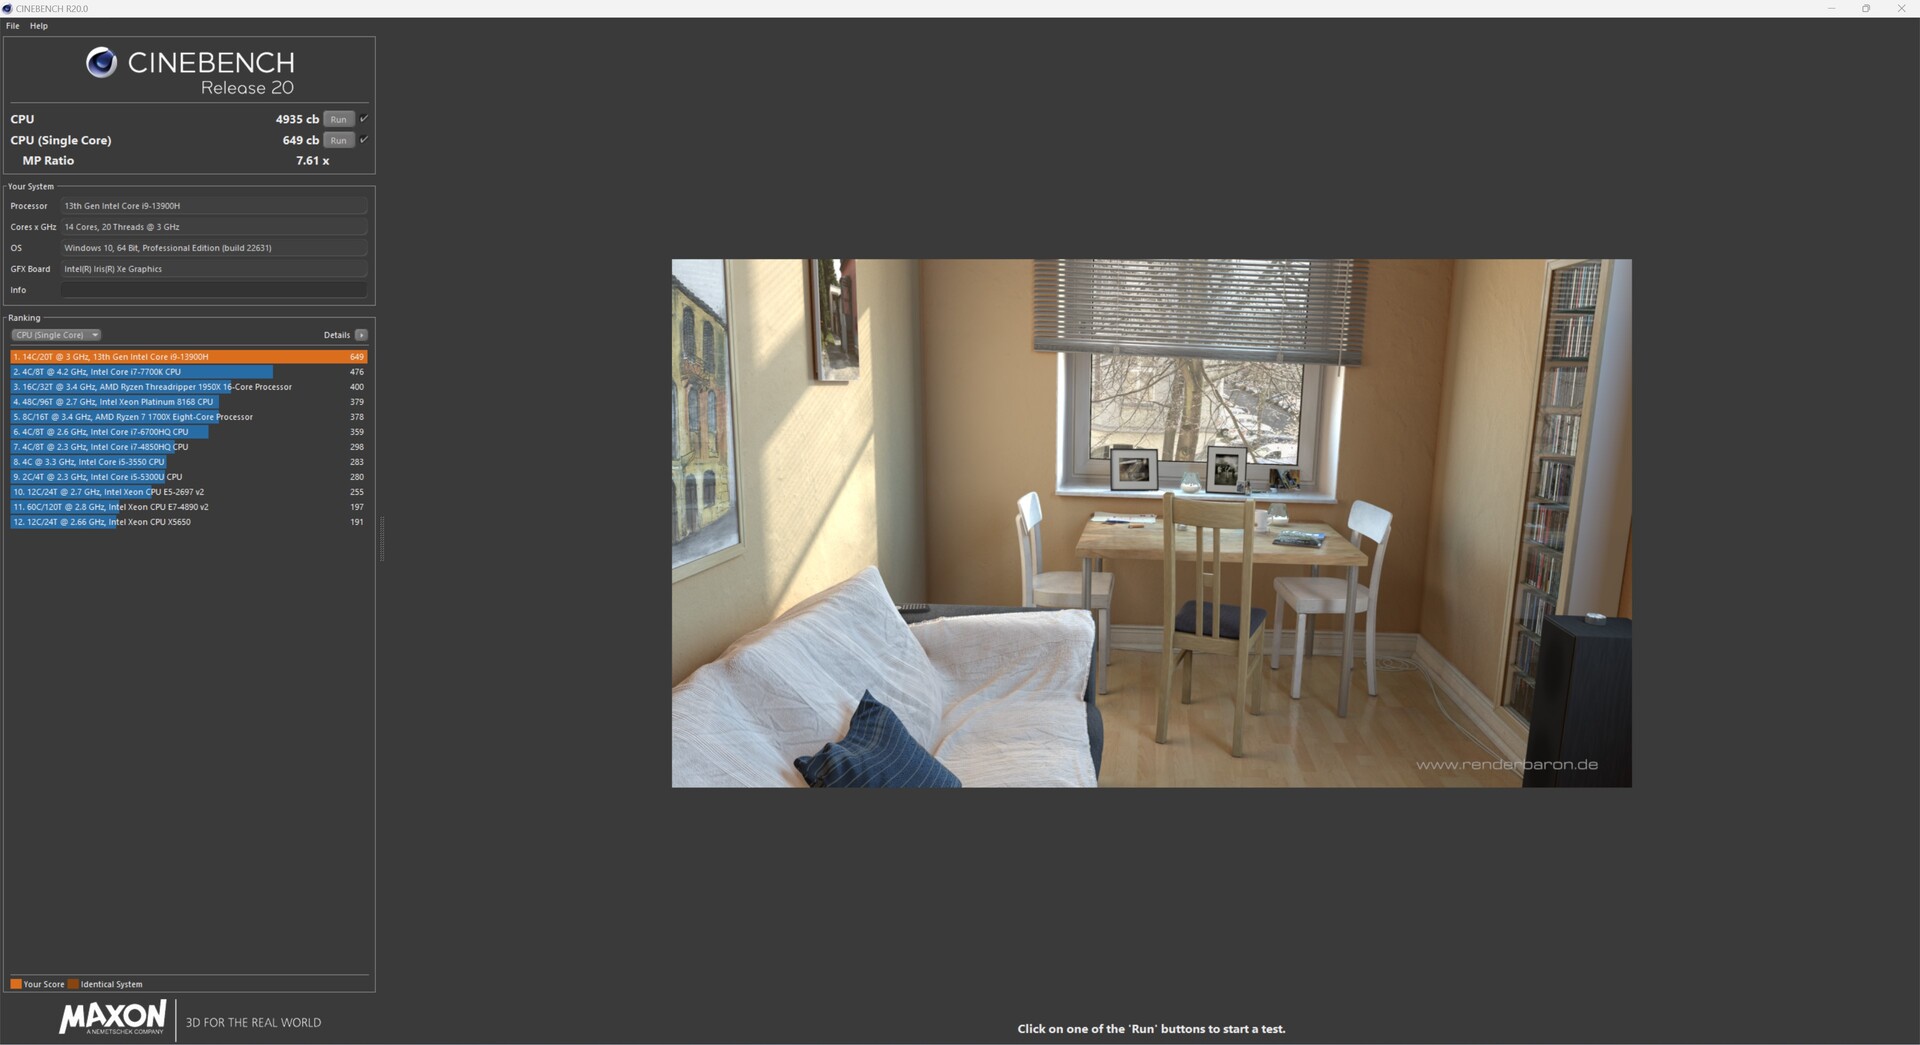
| Cinebench R20 | |
| CPU (Single Core) | |
| Minisforum AtomMan X7 Ti | |
| Geekom XT12 Pro | |
| Geekom A7 | |
| Aoostar GEM12 | |
| Acemagic F2A | |
| Geekom XT13 Pro | |
| CPU (Multi Core) | |
| Minisforum AtomMan X7 Ti | |
| Acemagic F2A | |
| Aoostar GEM12 | |
| Geekom A7 | |
| Geekom XT13 Pro | |
| Geekom XT12 Pro | |
| Cinebench R11.5 | |
| CPU Single 64Bit | |
| Geekom A7 | |
| Aoostar GEM12 | |
| Minisforum AtomMan X7 Ti | |
| Acemagic F2A | |
| Geekom XT12 Pro | |
| Geekom XT13 Pro | |
| CPU Multi 64Bit | |
| Minisforum AtomMan X7 Ti | |
| Acemagic F2A | |
| Geekom A7 | |
| Aoostar GEM12 | |
| Geekom XT13 Pro | |
| Geekom XT12 Pro | |
| Cinebench R10 | |
| Rendering Single CPUs 64Bit | |
| Minisforum AtomMan X7 Ti | |
| Geekom A7 | |
| Aoostar GEM12 | |
| Acemagic F2A | |
| Geekom XT13 Pro | |
| Geekom XT12 Pro | |
| Rendering Multiple CPUs 64Bit | |
| Acemagic F2A | |
| Minisforum AtomMan X7 Ti | |
| Aoostar GEM12 | |
| Geekom A7 | |
| Geekom XT13 Pro | |
| Geekom XT12 Pro | |
| Blender - v2.79 BMW27 CPU | |
| Geekom XT12 Pro | |
| Geekom XT13 Pro | |
| Geekom A7 | |
| Aoostar GEM12 | |
| Acemagic F2A | |
| Minisforum AtomMan X7 Ti | |
| wPrime 2.10 | |
| 32m | |
| Geekom XT12 Pro | |
| Acemagic F2A | |
| Geekom XT13 Pro | |
| Minisforum AtomMan X7 Ti | |
| Aoostar GEM12 | |
| Geekom A7 | |
| 1024m | |
| Minisforum AtomMan X7 Ti | |
| Geekom XT13 Pro | |
| Geekom XT12 Pro | |
| Acemagic F2A | |
| Aoostar GEM12 | |
| Geekom A7 | |
| WinRAR - Result | |
| Geekom XT12 Pro | |
| Minisforum AtomMan X7 Ti | |
| Acemagic F2A | |
| Geekom A7 | |
| Aoostar GEM12 | |
| Geekom XT13 Pro | |
| Geekbench 5.0 | |
| 5.0 Multi-Core | |
| Minisforum AtomMan X7 Ti | |
| Acemagic F2A | |
| Geekom A7 | |
| Aoostar GEM12 | |
| Geekom XT13 Pro | |
| Geekom XT12 Pro | |
| 5.0 Single-Core | |
| Geekom A7 | |
| Aoostar GEM12 | |
| Minisforum AtomMan X7 Ti | |
| Geekom XT12 Pro | |
| Acemagic F2A | |
| Geekom XT13 Pro | |
| Geekbench 4.4 | |
| 64 Bit Single-Core Score | |
| Geekom A7 | |
| Aoostar GEM12 | |
| Geekom XT12 Pro | |
| Minisforum AtomMan X7 Ti | |
| Geekom XT13 Pro | |
| Acemagic F2A | |
| 64 Bit Multi-Core Score | |
| Geekom A7 | |
| Minisforum AtomMan X7 Ti | |
| Aoostar GEM12 | |
| Acemagic F2A | |
| Geekom XT13 Pro | |
| Geekom XT12 Pro | |
| 3DMark 11 - 1280x720 Performance Physics | |
| Geekom A7 | |
| Minisforum AtomMan X7 Ti | |
| Aoostar GEM12 | |
| Acemagic F2A | |
| Geekom XT13 Pro | |
| Geekom XT12 Pro | |
| HWBOT x265 Benchmark v2.2 - 4k Preset | |
| Minisforum AtomMan X7 Ti | |
| Geekom A7 | |
| Aoostar GEM12 | |
| Acemagic F2A | |
| Geekom XT13 Pro | |
| Geekom XT12 Pro | |
| R Benchmark 2.5 - Overall mean | |
| Geekom XT13 Pro | |
| Acemagic F2A | |
| Geekom XT12 Pro | |
| Minisforum AtomMan X7 Ti | |
| Aoostar GEM12 | |
| Geekom A7 | |
| LibreOffice - 20 Documents To PDF | |
| Geekom A7 | |
| Minisforum AtomMan X7 Ti | |
| Aoostar GEM12 | |
| Geekom XT13 Pro | |
| Acemagic F2A | |
| Geekom XT12 Pro | |
| WebXPRT 3 - Overall | |
| Geekom A7 | |
| Aoostar GEM12 | |
| Geekom XT12 Pro | |
| Acemagic F2A | |
| Geekom XT13 Pro | |
| Minisforum AtomMan X7 Ti | |
| Mozilla Kraken 1.1 - Total | |
| Geekom XT13 Pro | |
| Acemagic F2A | |
| Minisforum AtomMan X7 Ti | |
| Aoostar GEM12 | |
| Geekom XT12 Pro | |
| Geekom A7 | |
| 3DMark | |
| 1920x1080 Fire Strike Physics | |
| Aoostar GEM12 | |
| Minisforum AtomMan X7 Ti | |
| Geekom A7 | |
| Acemagic F2A | |
| Geekom XT13 Pro | |
| Geekom XT12 Pro | |
| 2560x1440 Time Spy CPU | |
| Minisforum AtomMan X7 Ti | |
| Aoostar GEM12 | |
| Geekom A7 | |
| Acemagic F2A | |
| Geekom XT13 Pro | |
| Geekom XT12 Pro | |
| Super Pi mod 1.5 XS 1M - 1M | |
| Geekom XT13 Pro | |
| Geekom XT12 Pro | |
| Geekom A7 | |
| Aoostar GEM12 | |
| Acemagic F2A | |
| Minisforum AtomMan X7 Ti | |
| Super Pi mod 1.5 XS 2M - 2M | |
| Geekom A7 | |
| Aoostar GEM12 | |
| Geekom XT13 Pro | |
| Geekom XT12 Pro | |
| Acemagic F2A | |
| Minisforum AtomMan X7 Ti | |
| Super Pi Mod 1.5 XS 32M - 32M | |
| Aoostar GEM12 | |
| Geekom A7 | |
| Geekom XT13 Pro | |
| Geekom XT12 Pro | |
| Acemagic F2A | |
| Minisforum AtomMan X7 Ti | |
* ... im mniej tym lepiej
AIDA64: FP32 Ray-Trace | FPU Julia | CPU SHA3 | CPU Queen | FPU SinJulia | FPU Mandel | CPU AES | CPU ZLib | FP64 Ray-Trace | CPU PhotoWorxx
| Performance Rating | |
| Geekom A7 | |
| Aoostar GEM12 | |
| Minisforum AtomMan X7 Ti | |
| Acemagic F2A | |
| Średnia w klasie Mini PC | |
| Geekom XT13 Pro | |
| Geekom XT12 Pro | |
| AIDA64 / FP32 Ray-Trace | |
| Aoostar GEM12 | |
| Geekom A7 | |
| Acemagic F2A | |
| Minisforum AtomMan X7 Ti | |
| Średnia w klasie Mini PC (764 - 51004, n=114, ostatnie 2 lata) | |
| Geekom XT13 Pro | |
| Geekom XT12 Pro | |
| AIDA64 / FPU Julia | |
| Aoostar GEM12 | |
| Geekom A7 | |
| Minisforum AtomMan X7 Ti | |
| Acemagic F2A | |
| Średnia w klasie Mini PC (4140 - 214250, n=114, ostatnie 2 lata) | |
| Geekom XT13 Pro | |
| Geekom XT12 Pro | |
| AIDA64 / CPU SHA3 | |
| Geekom A7 | |
| Aoostar GEM12 | |
| Minisforum AtomMan X7 Ti | |
| Acemagic F2A | |
| Średnia w klasie Mini PC (290 - 9399, n=114, ostatnie 2 lata) | |
| Geekom XT13 Pro | |
| Geekom XT12 Pro | |
| AIDA64 / CPU Queen | |
| Geekom A7 | |
| Aoostar GEM12 | |
| Geekom XT13 Pro | |
| Acemagic F2A | |
| Minisforum AtomMan X7 Ti | |
| Geekom XT12 Pro | |
| Średnia w klasie Mini PC (8172 - 184747, n=114, ostatnie 2 lata) | |
| AIDA64 / FPU SinJulia | |
| Aoostar GEM12 | |
| Geekom A7 | |
| Minisforum AtomMan X7 Ti | |
| Acemagic F2A | |
| Średnia w klasie Mini PC (408 - 29064, n=114, ostatnie 2 lata) | |
| Geekom XT13 Pro | |
| Geekom XT12 Pro | |
| AIDA64 / FPU Mandel | |
| Aoostar GEM12 | |
| Geekom A7 | |
| Acemagic F2A | |
| Minisforum AtomMan X7 Ti | |
| Średnia w klasie Mini PC (2088 - 113499, n=114, ostatnie 2 lata) | |
| Geekom XT13 Pro | |
| Geekom XT12 Pro | |
| AIDA64 / CPU AES | |
| Geekom A7 | |
| Minisforum AtomMan X7 Ti | |
| Acemagic F2A | |
| Geekom XT13 Pro | |
| Geekom XT12 Pro | |
| Średnia w klasie Mini PC (3691 - 325960, n=114, ostatnie 2 lata) | |
| Aoostar GEM12 | |
| AIDA64 / CPU ZLib | |
| Minisforum AtomMan X7 Ti | |
| Acemagic F2A | |
| Aoostar GEM12 | |
| Geekom A7 | |
| Geekom XT13 Pro | |
| Średnia w klasie Mini PC (76.7 - 2039, n=114, ostatnie 2 lata) | |
| Geekom XT12 Pro | |
| AIDA64 / FP64 Ray-Trace | |
| Aoostar GEM12 | |
| Geekom A7 | |
| Acemagic F2A | |
| Minisforum AtomMan X7 Ti | |
| Średnia w klasie Mini PC (432 - 26952, n=114, ostatnie 2 lata) | |
| Geekom XT13 Pro | |
| Geekom XT12 Pro | |
| AIDA64 / CPU PhotoWorxx | |
| Minisforum AtomMan X7 Ti | |
| Geekom A7 | |
| Aoostar GEM12 | |
| Acemagic F2A | |
| Średnia w klasie Mini PC (5296 - 51727, n=114, ostatnie 2 lata) | |
| Geekom XT13 Pro | |
| Geekom XT12 Pro | |
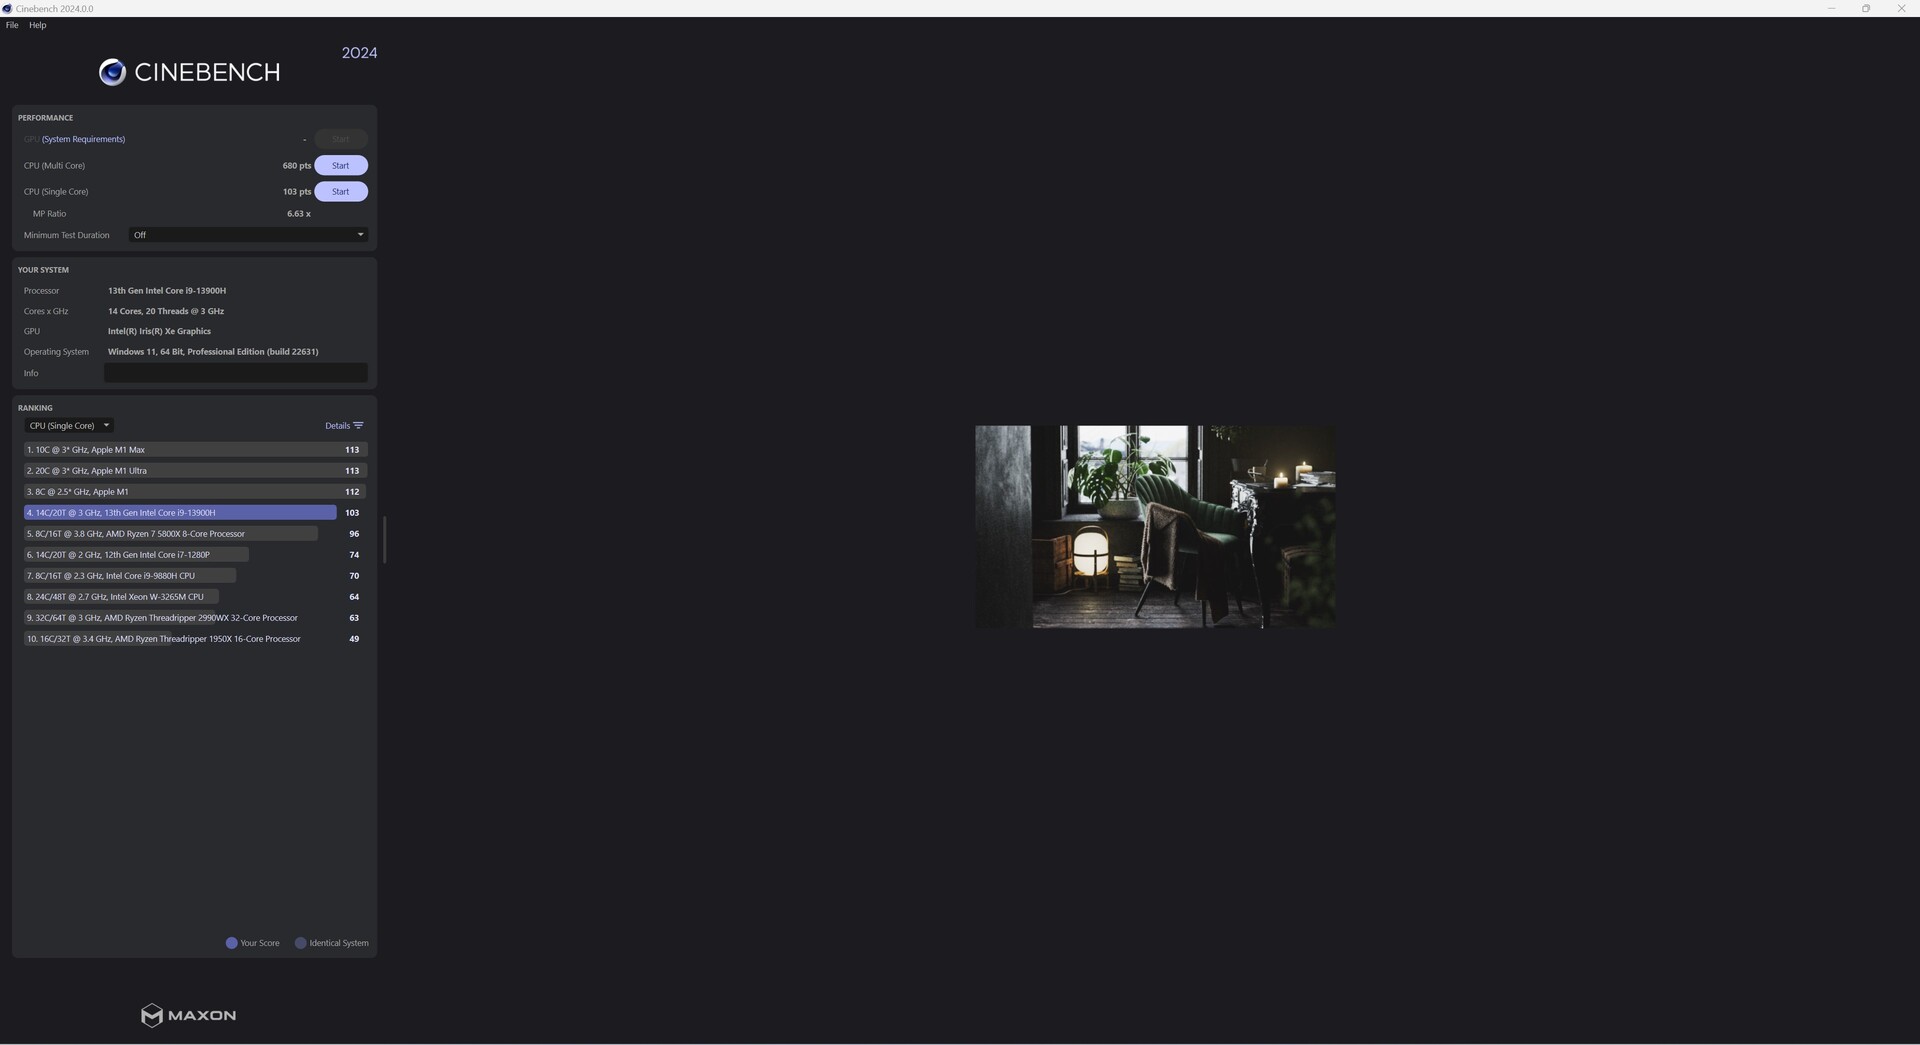
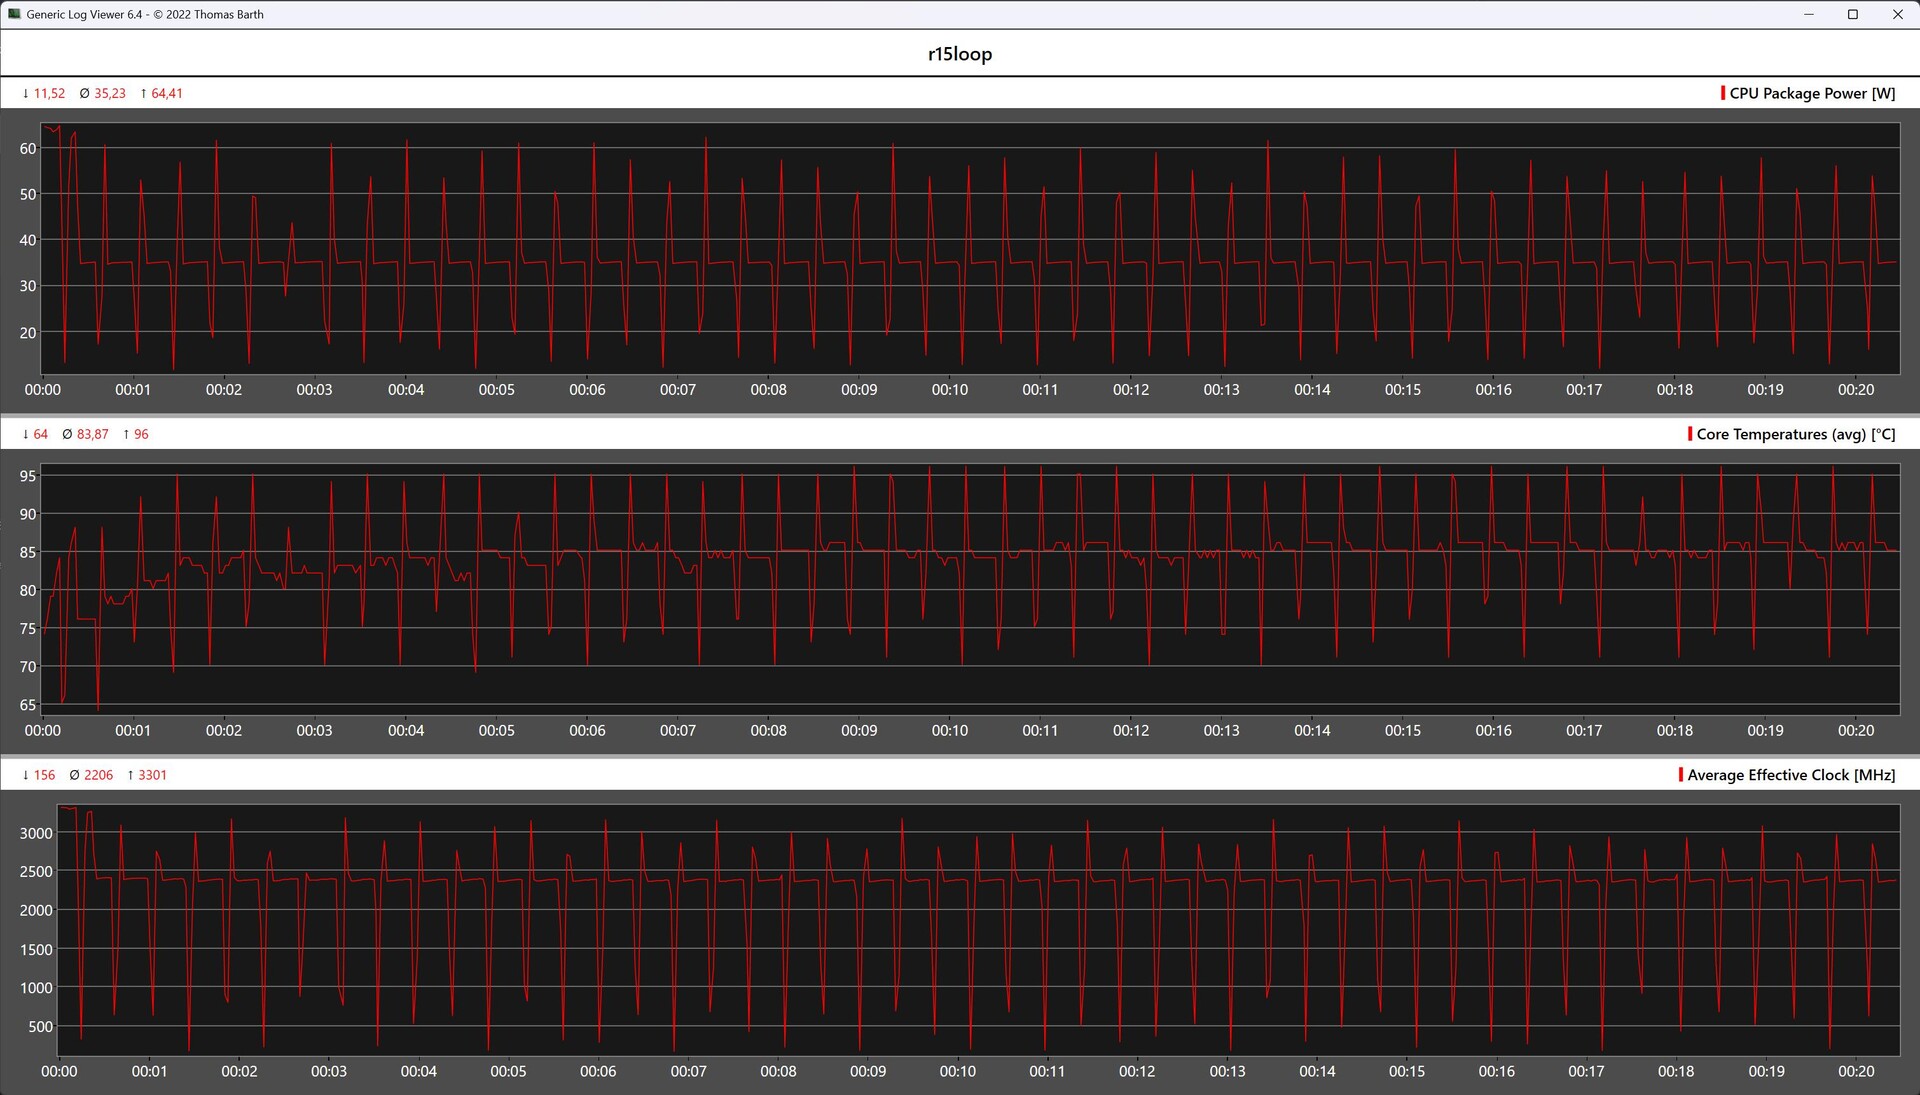
Cinebench R15 Multi loop
Ciągła pętla Cinebench R15 naszej próbki testowej przebiega niemal równolegle do tej z Geekom XT12 Pro. Ostatecznie jednak nowszy model XT13 Pro jest w stanie wysunąć się na wyraźne prowadzenie. Można również zauważyć, że mały system chłodzenia nie jest w stanie utrzymać Turbo SoC przez dłuższy czas. Maksymalny limit mocy wynoszący 64 W jest osiągany tylko przez krótki czas, ponieważ pobór mocy musi być ograniczany ze względu na wysokie temperatury.
Wydajność systemu
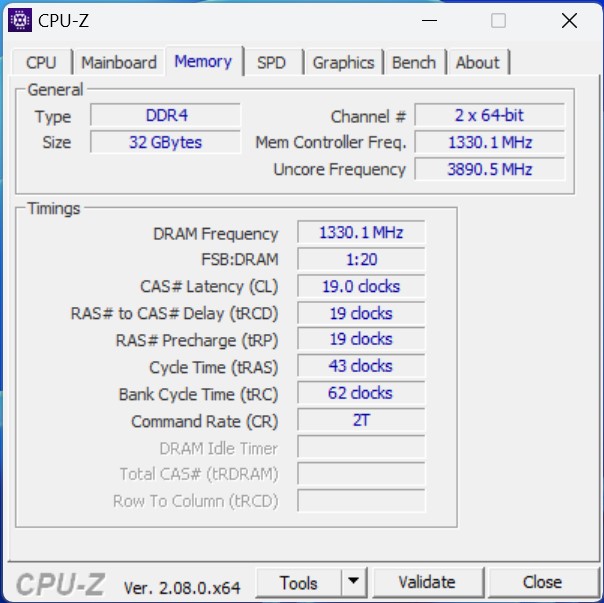
W testach wydajności systemu udokumentowana wydajność Geekom XT13 Pro jest wystarczająco dobra, aby zająć miejsce w dolnej części rankingu. Subiektywnie możemy jednak powiedzieć, że Geekom XT13 Pro oferuje przyzwoitą wydajność. Nie udało nam się zaobserwować żadnych zauważalnych opóźnień podczas pracy z urządzeniem w fazie testowej. Jeśli chodzi o wybór pamięci RAM, wolniejszy standard DDR4 mści się, co widać w benchmarkach AIDA64. Z technicznego punktu widzenia Intel Core i9-13900H może być połączony z DDR5 (5200 MT/s).
| AIDA64 / Memory Copy | |
| Minisforum AtomMan X7 Ti | |
| Aoostar GEM12 | |
| Geekom A7 | |
| Acemagic F2A | |
| Średnia w klasie Mini PC (8377 - 89287, n=114, ostatnie 2 lata) | |
| Geekom XT13 Pro | |
| Geekom XT12 Pro | |
| AIDA64 / Memory Read | |
| Minisforum AtomMan X7 Ti | |
| Acemagic F2A | |
| Geekom A7 | |
| Aoostar GEM12 | |
| Średnia w klasie Mini PC (8974 - 100086, n=114, ostatnie 2 lata) | |
| Geekom XT12 Pro | |
| Geekom XT13 Pro | |
| AIDA64 / Memory Write | |
| Geekom A7 | |
| Aoostar GEM12 | |
| Minisforum AtomMan X7 Ti | |
| Acemagic F2A | |
| Średnia w klasie Mini PC (8762 - 100538, n=114, ostatnie 2 lata) | |
| Geekom XT13 Pro | |
| Geekom XT12 Pro | |
| AIDA64 / Memory Latency | |
| Acemagic F2A | |
| Minisforum AtomMan X7 Ti | |
| Średnia w klasie Mini PC (44.9 - 184.8, n=114, ostatnie 2 lata) | |
| Geekom A7 | |
| Aoostar GEM12 | |
| Geekom XT13 Pro | |
| Geekom XT12 Pro | |
* ... im mniej tym lepiej
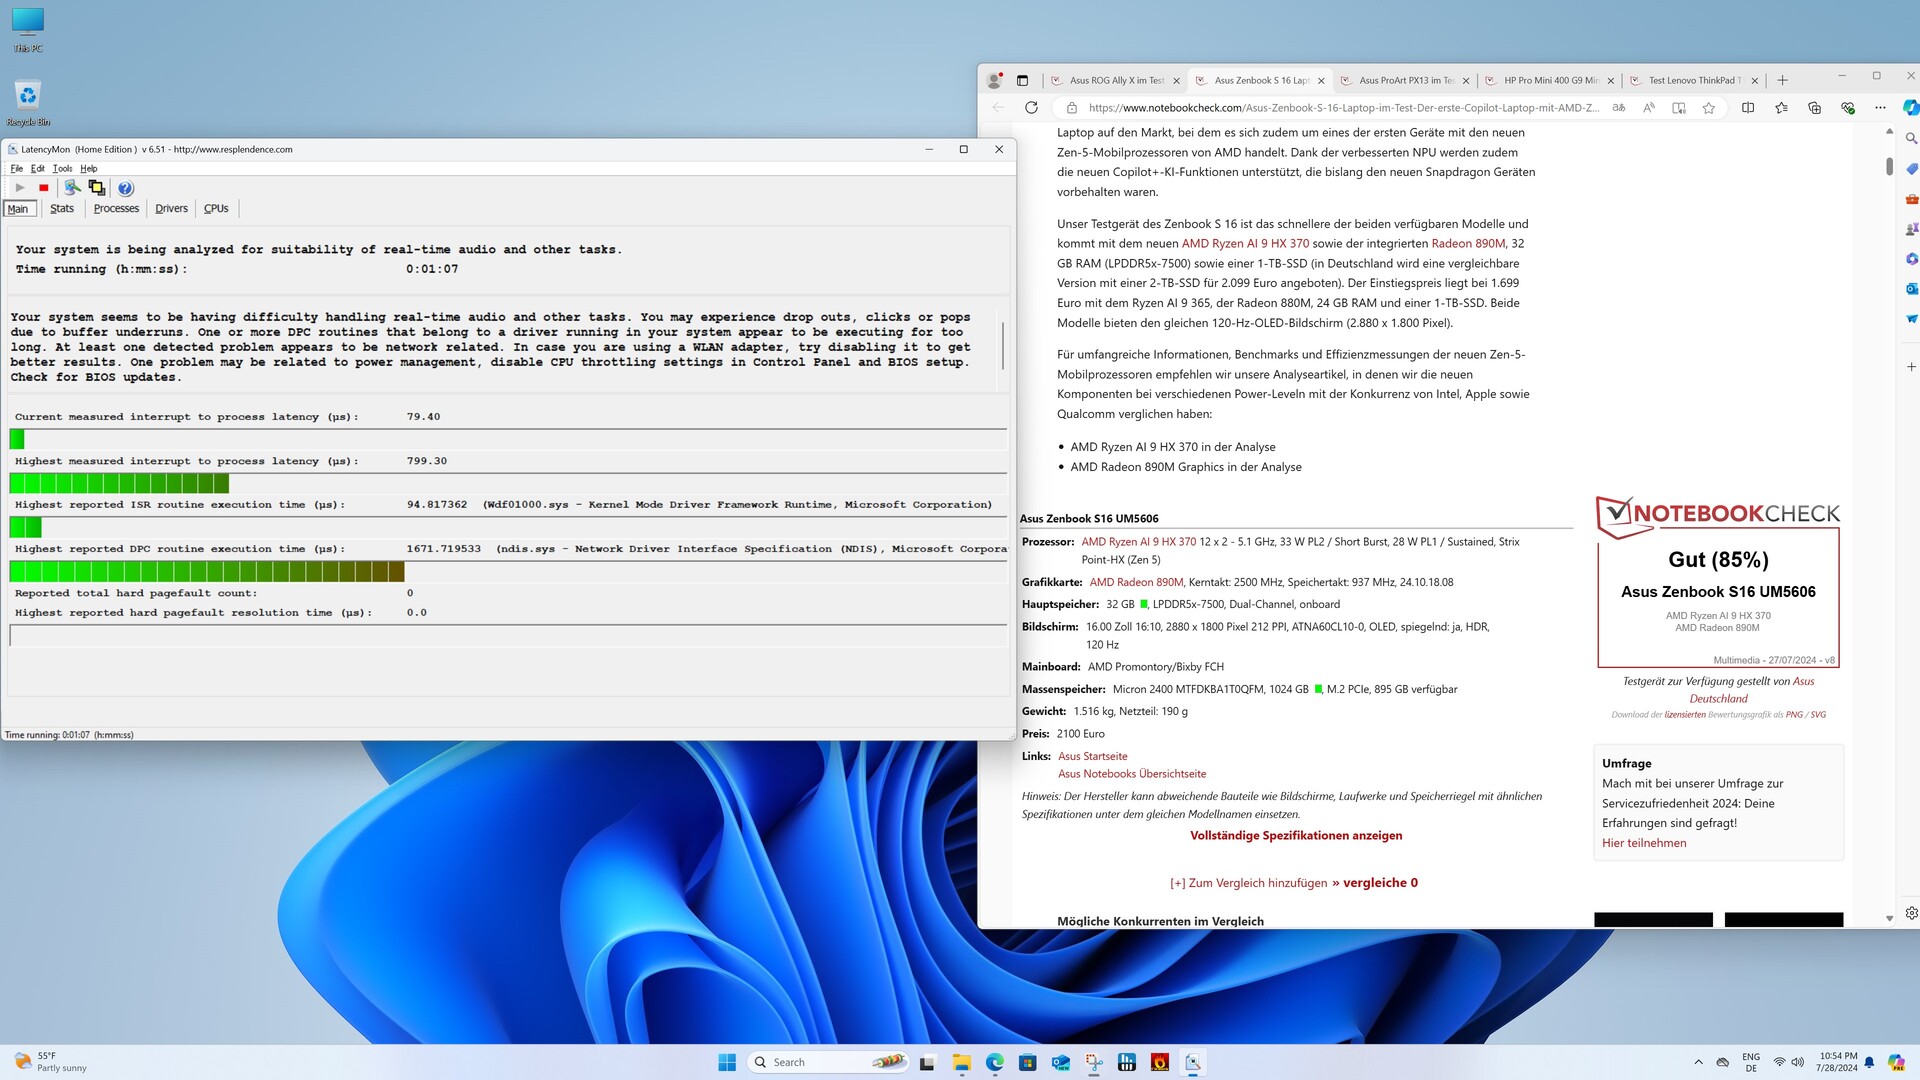
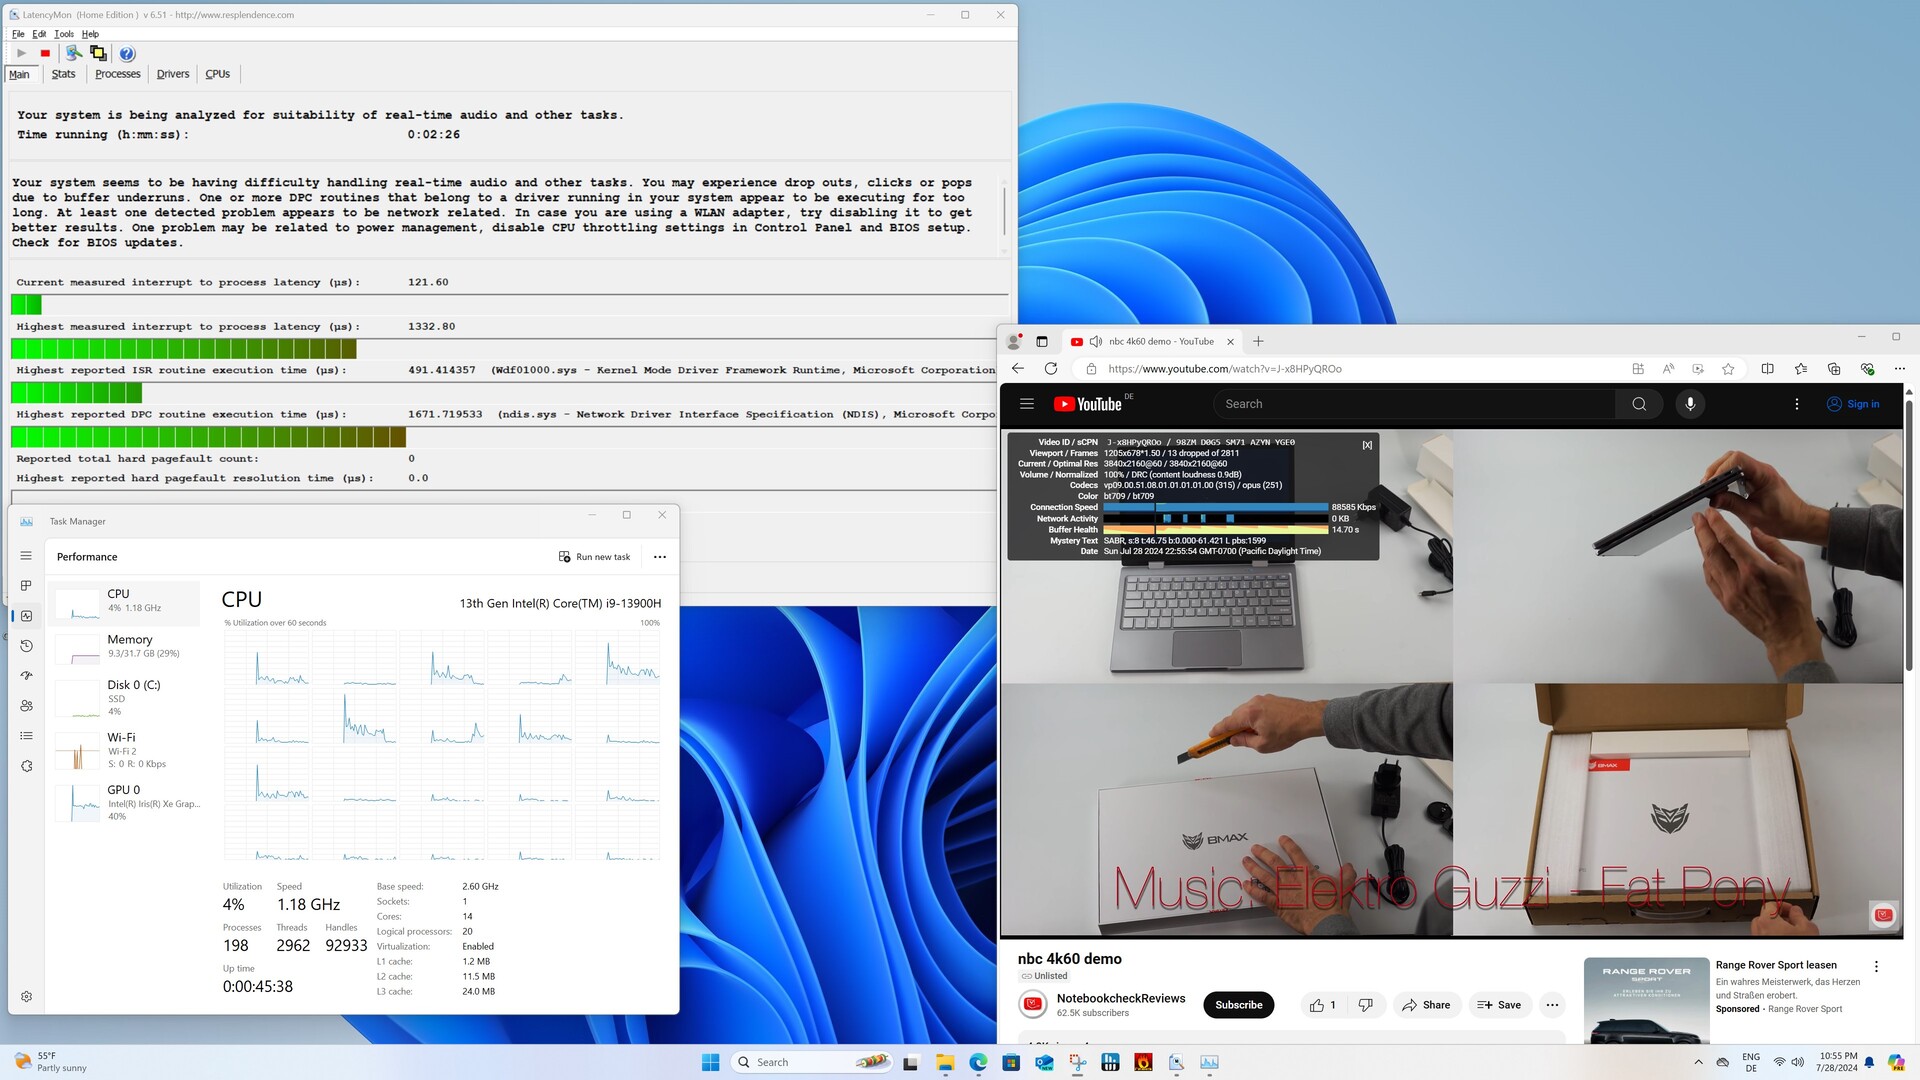
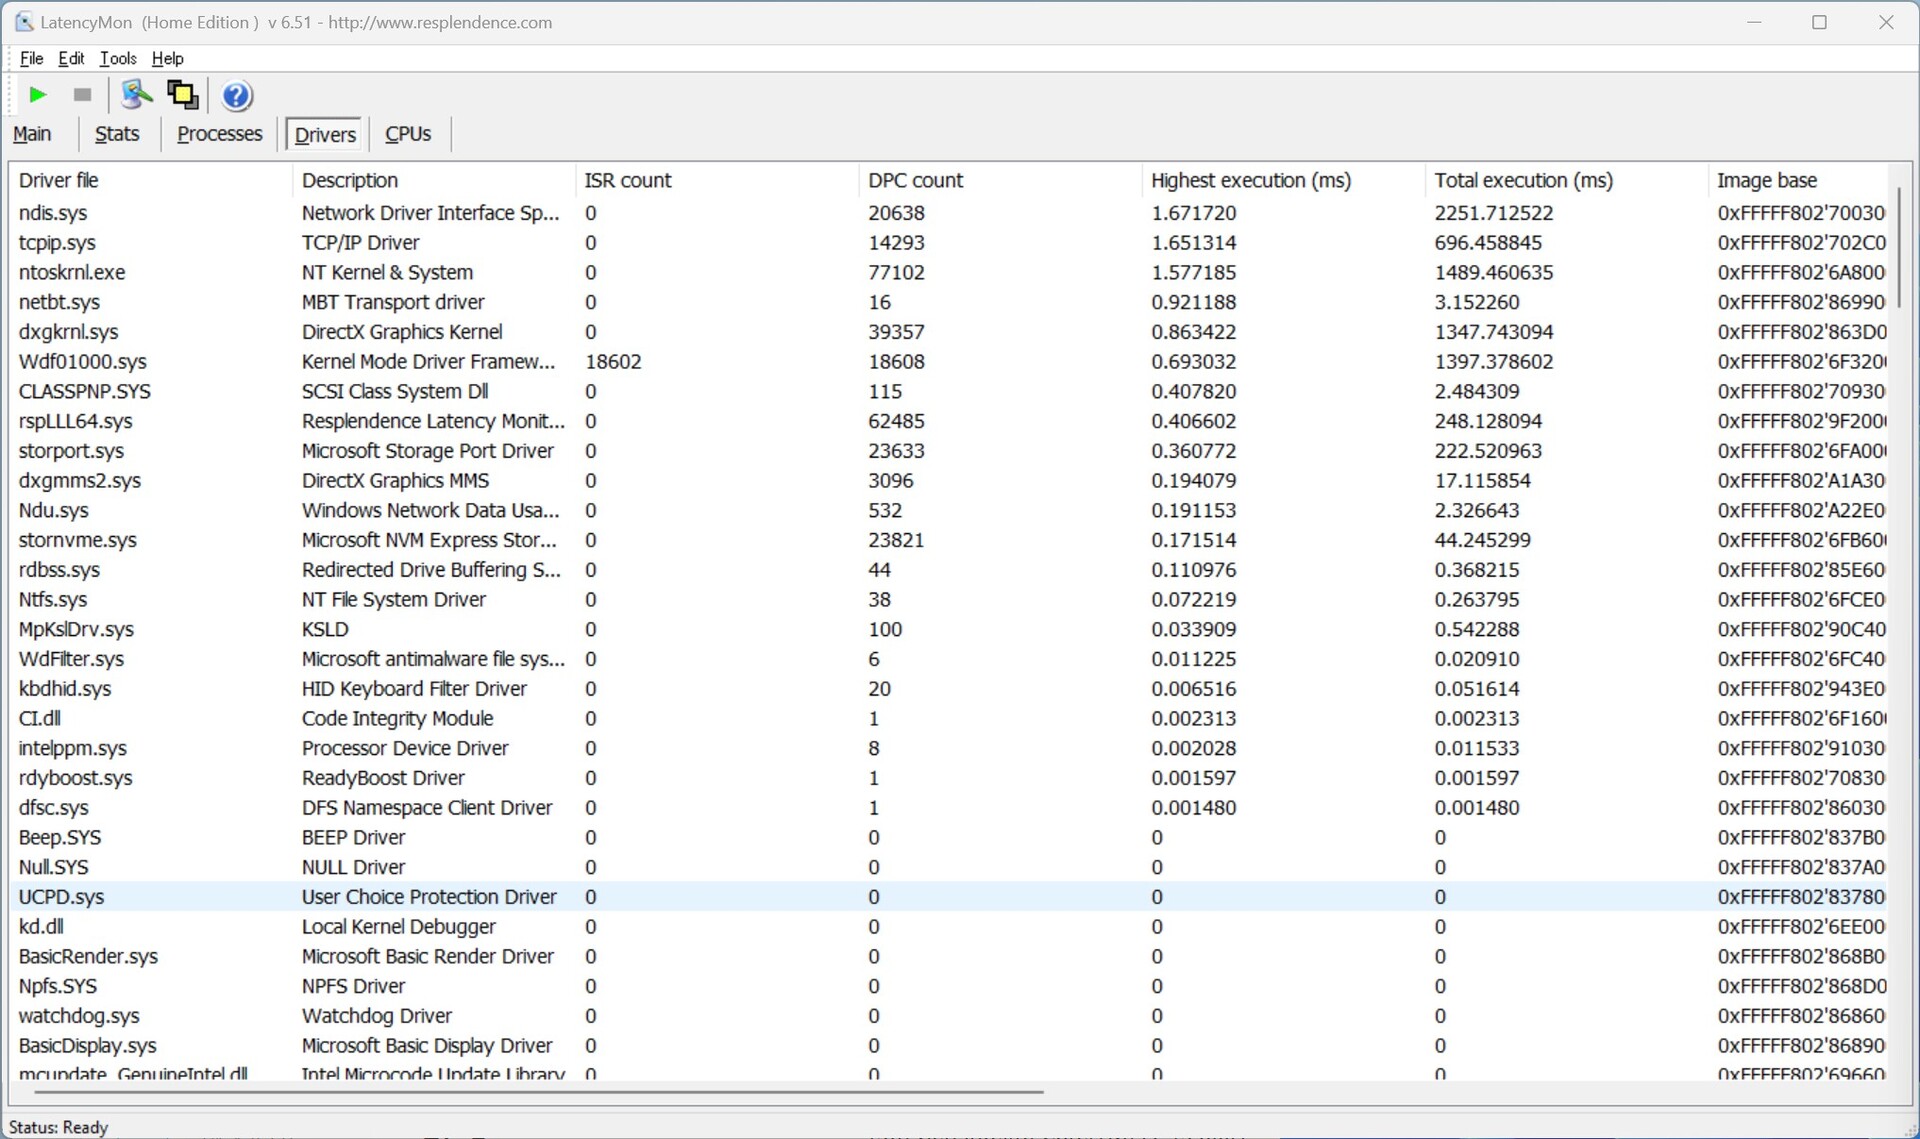
Opóźnienia DPC
W przypadku Geekom XT13 Pro nie zaobserwowaliśmy ekstremalnie wysokich opóźnień DPC. Tak było w przypadku Geekom XT12 Pro. Niemniej jednak nasza próbka testowa jest daleka od wybitnych wyników. Osiągnęliśmy maksymalną wartość nawet podczas zwykłego surfowania w przeglądarce Edge.

| DPC Latencies / LatencyMon - interrupt to process latency (max), Web, Youtube, Prime95 | |
| Acemagic F2A | |
| Geekom XT12 Pro | |
| Minisforum AtomMan X7 Ti | |
| Geekom XT13 Pro | |
| Geekom A7 | |
| Aoostar GEM12 | |
* ... im mniej tym lepiej
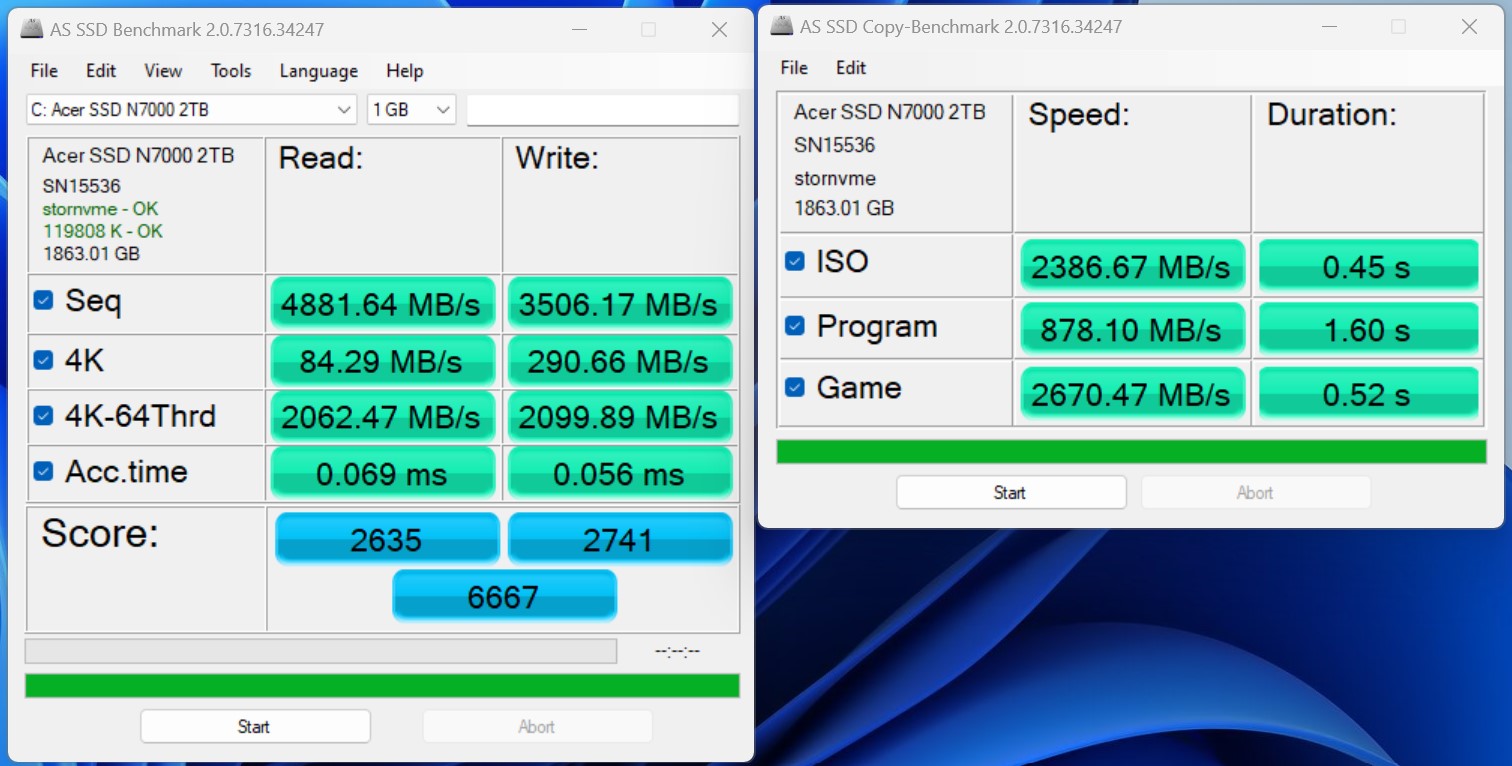
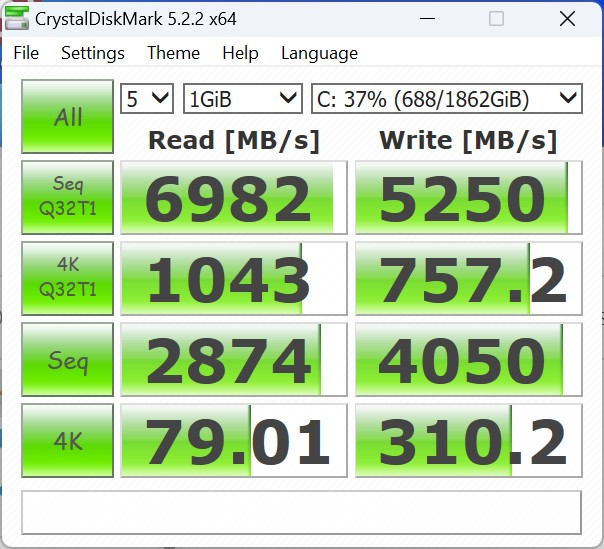
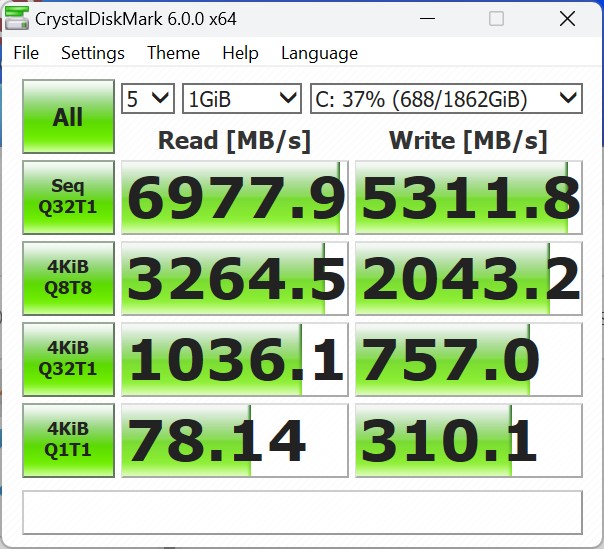
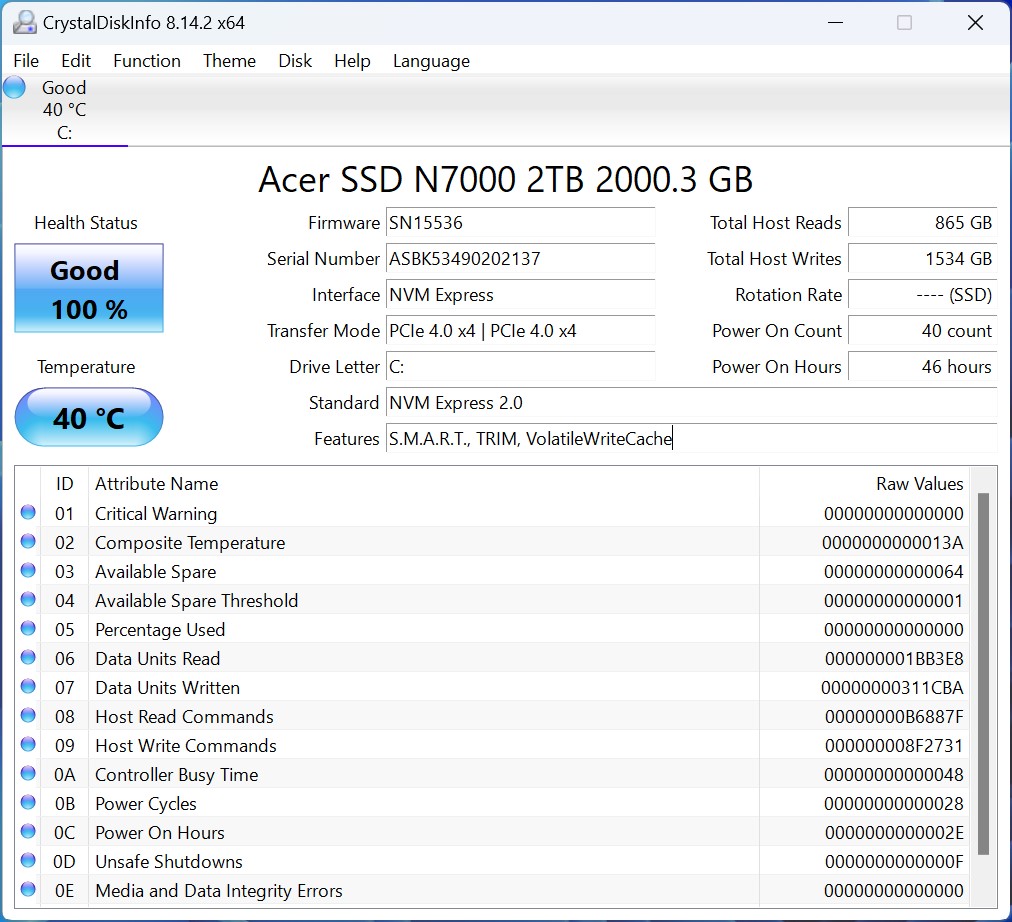
Pamięć masowa
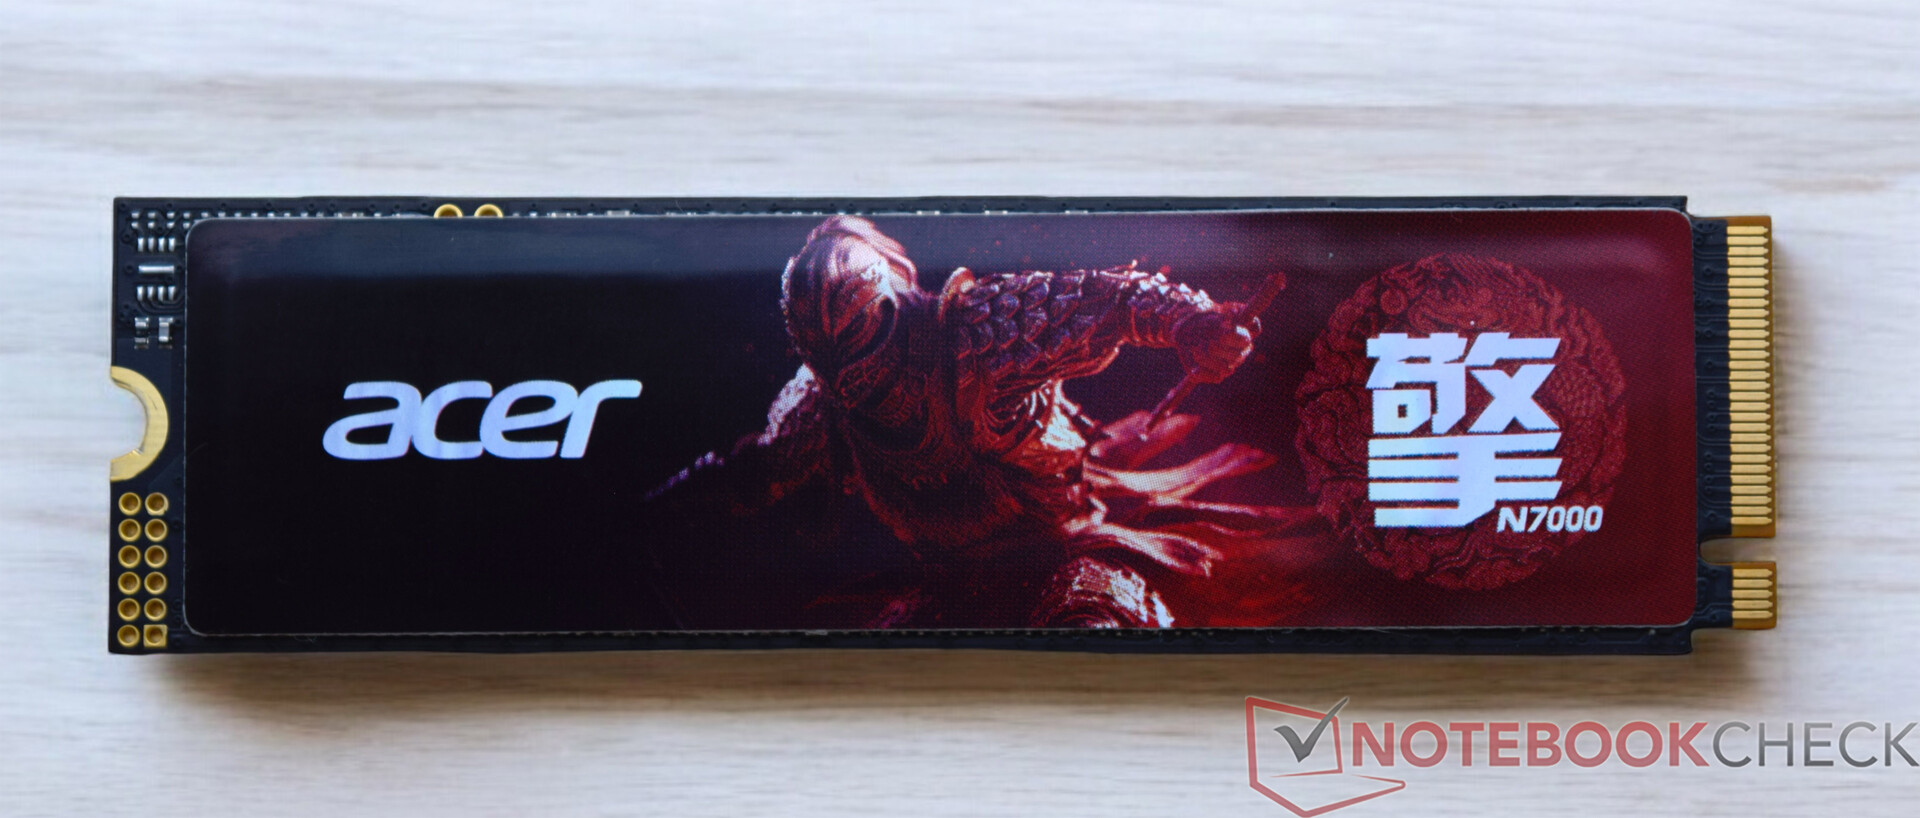
Geekom XT13 Pro jest wyposażony w dysk SSD o pojemności 2 TB od firmy Acer. Ten sam model znajdował się już w Geekom GT13 i zapewnił świetną wydajność we wszystkich testach. Połączenie techniczne jest optymalne, a uzyskane prędkości transferu są bardzo wysokie. Pod ciągłym obciążeniem Acer N7000 ma niewielkie problemy z utrzymaniem stabilnej wydajności odczytu. Na szczęście nie jest to ekstremalna wada. Jak widać na wykresie, Acer N7000 może nadal osiągać znacznie lepsze wyniki przy zmniejszonej wydajności odczytu niż Geekom XT12 Pro lub Acemagic F2A. Test Geekom XT12 Pro ujawnił problem z położeniem podkładki termicznej, co nie ma miejsca w przypadku Geekom XT13 Pro. Podkładki termiczne znajdują się w prawidłowej pozycji. Jak już wspomnieliśmy w sekcji konserwacji, w Geekom XT13 Pro można zainstalować dodatkowy dysk SSD. Jednak drugie gniazdo M.2 obsługuje tylko dyski SSD SATA o długości 42 milimetrów (M.2-2242).
W celu uzyskania dalszych porównań i testów porównawczych, proszę odnieść się do naszej Tabela porównawcza.

| Drive Performance Rating - Percent | |
| Aoostar GEM12 | |
| Geekom XT13 Pro | |
| Geekom XT12 Pro | |
| Minisforum AtomMan X7 Ti | |
| Geekom A7 | |
| Średnia w klasie Mini PC | |
| Acemagic F2A | |
* ... im mniej tym lepiej
Continuous read: DiskSpd Read Loop, Queue Depth 8
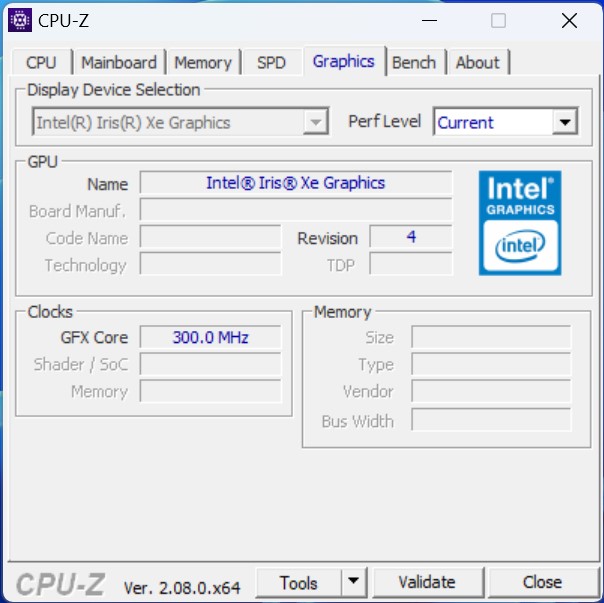
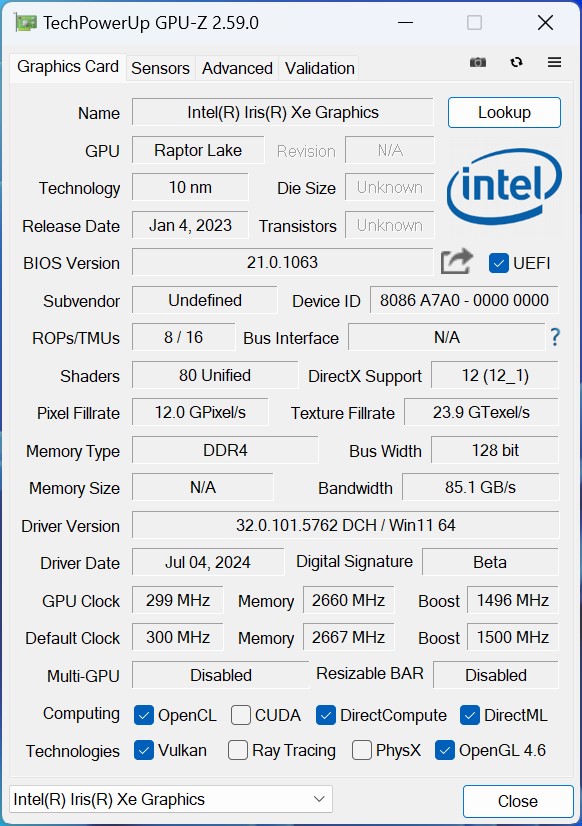
Grafika
Karta graficzna Intel Iris Xe Graphics G7 obsługuje obliczenia 3D i odpowiada za wyświetlanie obrazu. Z 96 jednostkami EU, procesor Intel Core i9-13900H jest najszybszym modelem z tej serii. Jednak ten przestarzały model ma trudności w walce z nowoczesnymi przedstawicielami. Gdyby Geekom już wcześniej odważył się na krok instalacji SoC Meteor Lake w XT13 Pro, można by oczekiwać wyraźnie zauważalnego wzrostu wydajności 3D. Wydajność 8-rdzeniowego iGPU Intel Arc doskonale widać w danych porównawczych. Tymczasem jeszcze większą wydajność 3D można uzyskać po zainstalowaniu w systemie karty AMD Radeon 780M. Sam Geekom oferuje obecnie kilka urządzeń z tym iGPU, co oznacza, że producent utrudnia sobie życie w tej dyscyplinie. Jednym z przykładów jest Geekom A7, Geekom Geekom A8lub Geekom AE7.
Dalsze porównania i testy porównawcze można znaleźć w naszej Tabela porównawcza GPU.
| 3DMark Performance Rating - Percent | |
| Geekom A7 | |
| Aoostar GEM12 | |
| Acemagic F2A | |
| Minisforum AtomMan X7 Ti | |
| Geekom XT13 Pro | |
| Geekom XT12 Pro | |
| 3DMark 11 - 1280x720 Performance GPU | |
| Geekom A7 | |
| Aoostar GEM12 | |
| Acemagic F2A | |
| Minisforum AtomMan X7 Ti | |
| Geekom XT13 Pro | |
| Geekom XT12 Pro | |
| 3DMark | |
| 2560x1440 Time Spy Graphics | |
| Acemagic F2A | |
| Minisforum AtomMan X7 Ti | |
| Geekom A7 | |
| Aoostar GEM12 | |
| Geekom XT13 Pro | |
| Geekom XT12 Pro | |
| 1920x1080 Fire Strike Graphics | |
| Geekom A7 | |
| Aoostar GEM12 | |
| Acemagic F2A | |
| Minisforum AtomMan X7 Ti | |
| Geekom XT13 Pro | |
| Geekom XT12 Pro | |
| Unigine Heaven 4.0 | |
| Extreme Preset OpenGL | |
| Aoostar GEM12 | |
| Acemagic F2A | |
| Minisforum AtomMan X7 Ti | |
| Geekom A7 | |
| Geekom XT13 Pro | |
| Geekom XT12 Pro | |
| Extreme Preset DX11 | |
| Aoostar GEM12 | |
| Minisforum AtomMan X7 Ti | |
| Acemagic F2A | |
| Geekom A7 | |
| Geekom XT13 Pro | |
| Geekom XT12 Pro | |
| Unigine Valley 1.0 | |
| 1920x1080 Extreme HD DirectX AA:x8 | |
| Aoostar GEM12 | |
| Minisforum AtomMan X7 Ti | |
| Geekom A7 | |
| Acemagic F2A | |
| Geekom XT13 Pro | |
| Geekom XT12 Pro | |
| 1920x1080 Extreme HD Preset OpenGL AA:x8 | |
| Minisforum AtomMan X7 Ti | |
| Aoostar GEM12 | |
| Acemagic F2A | |
| Geekom XT13 Pro | |
| Geekom XT12 Pro | |
| Geekom A7 | |
| Unigine Superposition | |
| 1280x720 720p Low | |
| Aoostar GEM12 | |
| Acemagic F2A | |
| Minisforum AtomMan X7 Ti | |
| Geekom A7 | |
| Geekom XT13 Pro | |
| Geekom XT12 Pro | |
| 1920x1080 1080p High | |
| Aoostar GEM12 | |
| Acemagic F2A | |
| Minisforum AtomMan X7 Ti | |
| Geekom A7 | |
| Geekom XT13 Pro | |
| Geekom XT12 Pro | |
| 1920x1080 1080p Extreme | |
| Acemagic F2A | |
| Minisforum AtomMan X7 Ti | |
| Aoostar GEM12 | |
| Geekom A7 | |
| Geekom XT13 Pro | |
| Geekom XT12 Pro | |
| ComputeMark v2.1 | |
| 1024x600 Normal, Score | |
| Geekom A7 | |
| Aoostar GEM12 | |
| Acemagic F2A | |
| Minisforum AtomMan X7 Ti | |
| Geekom XT13 Pro | |
| Geekom XT12 Pro | |
| 1024x600 Normal, Fluid 3DTex | |
| Aoostar GEM12 | |
| Geekom A7 | |
| Minisforum AtomMan X7 Ti | |
| Acemagic F2A | |
| Geekom XT13 Pro | |
| Geekom XT12 Pro | |
| 1024x600 Normal, Fluid 2DTexArr | |
| Geekom A7 | |
| Aoostar GEM12 | |
| Minisforum AtomMan X7 Ti | |
| Acemagic F2A | |
| Geekom XT13 Pro | |
| Geekom XT12 Pro | |
| 1024x600 Normal, Mandel Vector | |
| Geekom A7 | |
| Aoostar GEM12 | |
| Acemagic F2A | |
| Minisforum AtomMan X7 Ti | |
| Geekom XT12 Pro | |
| Geekom XT13 Pro | |
| 1024x600 Normal, Mandel Scalar | |
| Geekom A7 | |
| Aoostar GEM12 | |
| Acemagic F2A | |
| Minisforum AtomMan X7 Ti | |
| Geekom XT12 Pro | |
| Geekom XT13 Pro | |
| 1024x600 Normal, QJuliaRayTrace | |
| Geekom A7 | |
| Aoostar GEM12 | |
| Acemagic F2A | |
| Minisforum AtomMan X7 Ti | |
| Geekom XT13 Pro | |
| Geekom XT12 Pro | |
| LuxMark v2.0 64Bit | |
| Room GPUs-only | |
| Geekom A7 | |
| Aoostar GEM12 | |
| Minisforum AtomMan X7 Ti | |
| Geekom XT13 Pro | |
| Acemagic F2A | |
| Sala GPUs-only | |
| Minisforum AtomMan X7 Ti | |
| Acemagic F2A | |
| Geekom XT13 Pro | |
| Geekom A7 | |
| Aoostar GEM12 | |
| Affinity Photo 2 - Combined (Single / Multi GPU) | |
| Minisforum AtomMan X7 Ti | |
| Acemagic F2A | |
| Geekom XT13 Pro | |
| Geekom XT12 Pro | |
| Aoostar GEM12 | |
| Geekom A7 | |
| Geekom XT13 Pro, Intel Iris Xe Graphics G7 96EUs i9-13900H | Aoostar GEM12, AMD Radeon 780M R7 8845HS | Minisforum AtomMan X7 Ti, Intel Arc 8-Core iGPU Ultra 9 185H | Acemagic F2A, Intel Arc 8-Core iGPU Ultra 7 155H | Geekom XT12 Pro, Intel Iris Xe Graphics G7 96EUs i9-12900H | Geekom A7, AMD Radeon 780M R9 7940HS | Średnia w klasie Mini PC | |
|---|---|---|---|---|---|---|---|
| SPECviewperf 2020 | 309% | 36% | 25% | -4% | 278% | 197% | |
| 3840x2160 Medical (medical-03) | 3.63 | 11.2 209% | 4.23 17% | 5.05 39% | 3.49 -4% | 11.1 206% | 8.21 ? 126% |
| 3840x2160 Energy (energy-03) | 3.15 | 19.9 532% | 6.03 91% | 4.61 46% | 3.05 -3% | 14.1 348% | 11.8 ? 275% |
| 3840x2160 Creo (creo-03) | 16 | 33.4 109% | 18.5 16% | 17.9 12% | 14.8 -7% | 31.4 96% | 30.8 ? 93% |
| 3840x2160 CATIA (catia-06) | 7.9 | 23.2 194% | 11.1 41% | 10 27% | 7.78 -2% | 24.8 214% | 18.7 ? 137% |
| 3840x2160 3ds Max (3dsmax-07) | 10.3 | 20.4 98% | 14.9 45% | 12.9 25% | 9.69 -6% | 20.9 103% | 22.6 ? 119% |
| 3840x2160 Siemens NX (snx-04) | 6.13 | 64.1 946% | 6.24 2% | 5.7 -7% | 6.29 3% | 61.4 902% | 37.7 ? 515% |
| 3840x2160 Maya (maya-06) | 26.8 | 47.7 78% | 37.7 41% | 35.4 32% | 23.9 -11% | 47 75% | 57.7 ? 115% |
| 3DMark 05 Standard | 29045 pkt. | |
| 3DMark 06 Score 1366x768 | 30156 pkt. | |
| 3DMark Vantage P Result | 28599 pkt. | |
| 3DMark 11 Performance | 8024 pkt. | |
| 3DMark Ice Storm Standard Score | 155640 pkt. | |
| 3DMark Cloud Gate Standard Score | 28112 pkt. | |
| 3DMark Fire Strike Score | 5448 pkt. | |
| 3DMark Fire Strike Extreme Score | 2570 pkt. | |
| 3DMark Time Spy Score | 1920 pkt. | |
| 3DMark Steel Nomad Score | 183 pkt. | |
| 3DMark Steel Nomad Light Score | 1276 pkt. | |
Pomoc | ||
Wydajność w grach
Procesor graficzny Intel Iris Xe nie radzi sobie z większością gier. Starzejący się iGPU osiąga odpowiednią liczbę klatek na sekundę, jeśli w ogóle, w niskich rozdzielczościach i niskim lub średnim presecie graficznym. Jeśli nadal chcą Państwo używać Geekom XT13 Pro do gier, muszą Państwo skorzystać z zewnętrznej karty graficznej. Różne modele mogą być używane z urządzeniem przez USB4.
| Dota 2 Reborn | |
| 1280x720 min (0/3) fastest | |
| Geekom A7 | |
| Aoostar GEM12 | |
| Geekom XT13 Pro | |
| Minisforum AtomMan X7 Ti | |
| Geekom XT12 Pro | |
| Acemagic F2A | |
| 1920x1080 high (2/3) | |
| Geekom A7 | |
| Aoostar GEM12 | |
| Minisforum AtomMan X7 Ti | |
| Acemagic F2A | |
| Geekom XT13 Pro | |
| Geekom XT12 Pro | |
| GTA V | |
| 1024x768 Lowest Settings possible | |
| Geekom A7 | |
| Aoostar GEM12 | |
| Minisforum AtomMan X7 Ti | |
| Acemagic F2A | |
| Geekom XT13 Pro | |
| 1920x1080 High/On (Advanced Graphics Off) AA:2xMSAA + FX AF:8x | |
| Geekom A7 | |
| Aoostar GEM12 | |
| Minisforum AtomMan X7 Ti | |
| Acemagic F2A | |
| Geekom XT13 Pro | |
| Cyberpunk 2077 2.2 Phantom Liberty | |
| 1920x1080 Low Preset (FSR off) | |
| Aoostar GEM12 | |
| Minisforum AtomMan X7 Ti | |
| Acemagic F2A | |
| Geekom XT13 Pro | |
| Geekom XT12 Pro | |
| 1920x1080 High Preset (FSR off) | |
| Aoostar GEM12 | |
| Minisforum AtomMan X7 Ti | |
| Acemagic F2A | |
| Geekom XT13 Pro | |
| Geekom XT12 Pro | |
| Baldur's Gate 3 | |
| 1280x720 Low Preset | |
| Aoostar GEM12 | |
| Minisforum AtomMan X7 Ti | |
| Geekom XT13 Pro | |
| 1920x1080 High Preset | |
| Aoostar GEM12 | |
| Minisforum AtomMan X7 Ti | |
| Geekom XT13 Pro | |
| F1 24 | |
| 1920x1080 Low Preset AA:T AF:16x | |
| Minisforum AtomMan X7 Ti | |
| Geekom XT13 Pro | |
| 1920x1080 High Preset AA:T AF:16x | |
| Minisforum AtomMan X7 Ti | |
| Geekom XT13 Pro | |
FPS chart
| low | med. | high | ultra | |
|---|---|---|---|---|
| GTA V (2015) | 123.5 | 105.9 | 22.1 | 9 |
| Dota 2 Reborn (2015) | 117.2 | 82.9 | 72.5 | 66.5 |
| Final Fantasy XV Benchmark (2018) | 46 | 25.7 | 18.2 | |
| Baldur's Gate 3 (2023) | 19.9 | 15.4 | 13.5 | 13 |
| Cyberpunk 2077 2.2 Phantom Liberty (2023) | 18.6 | 15 | 13 | 11.4 |
| F1 24 (2024) | 43.1 | 37.3 | 26.7 |
Test wydajności Geekom XT13 Pro z kartą graficzną Nvidia GeForce RTX 3060 Ti
Geekom XT13 Pro posiada dwa porty USB4, które obsługują korzystanie z zewnętrznych kart graficznych. Bez wpływu na ogólny wynik, przeprowadziliśmy kilka testów z Razer Core X i Nvidia GeForce RTX 3060 Ti. W porównaniu do starszego iGPU Intel Core i9-13900H, wydajność 3D może zostać znacznie zwiększona. Porównanie z innymi urządzeniami testowymi pokazuje niemal identyczny wynik w testach syntetycznych. Wydajność w grach można również znacznie zwiększyć dzięki tej kombinacji, co widać w testowanych grach. Czasami nawet najnowocześniejsze gry mogą cieszyć się pełną szczegółowością.
| Performance Rating - Percent | |
| Geekom AE7 (Nvidia GeForce RTX 3060 Ti FE) | |
| Geekom A8 (Nvidia GeForce RTX 3060 Ti FE) | |
| Geekom GT13 Pro (Nvidia GeForce RTX 3060 Ti FE) | |
| Geekom XT13 Pro (Nvidia GeForce RTX 3060 Ti FE) | |
| Geekom XT12 Pro (Nvidia GeForce RTX 3060 Ti FE) | |
| Minisforum UH125 Pro (Nvidia GeForce RTX 3060 Ti FE) | |
| 3DMark 11 - 1280x720 Performance GPU | |
| Geekom A8 (Nvidia GeForce RTX 3060 Ti FE) | |
| Geekom AE7 (Nvidia GeForce RTX 3060 Ti FE) | |
| Geekom XT13 Pro (Nvidia GeForce RTX 3060 Ti FE) | |
| Geekom GT13 Pro (Nvidia GeForce RTX 3060 Ti FE) | |
| Geekom XT12 Pro (Nvidia GeForce RTX 3060 Ti FE) | |
| Minisforum UH125 Pro (Nvidia GeForce RTX 3060 Ti FE) | |
| 3DMark | |
| 2560x1440 Time Spy Graphics | |
| Geekom A8 (Nvidia GeForce RTX 3060 Ti FE) | |
| Geekom AE7 (Nvidia GeForce RTX 3060 Ti FE) | |
| Geekom XT13 Pro (Nvidia GeForce RTX 3060 Ti FE) | |
| Geekom GT13 Pro (Nvidia GeForce RTX 3060 Ti FE) | |
| Geekom XT12 Pro (Nvidia GeForce RTX 3060 Ti FE) | |
| Minisforum UH125 Pro (Nvidia GeForce RTX 3060 Ti FE) | |
| 1920x1080 Fire Strike Graphics | |
| Geekom AE7 (Nvidia GeForce RTX 3060 Ti FE) | |
| Geekom GT13 Pro (Nvidia GeForce RTX 3060 Ti FE) | |
| Geekom A8 (Nvidia GeForce RTX 3060 Ti FE) | |
| Geekom XT13 Pro (Nvidia GeForce RTX 3060 Ti FE) | |
| Minisforum UH125 Pro (Nvidia GeForce RTX 3060 Ti FE) | |
| Geekom XT12 Pro (Nvidia GeForce RTX 3060 Ti FE) | |
| 3840x2160 Fire Strike Ultra Graphics | |
| Geekom GT13 Pro (Nvidia GeForce RTX 3060 Ti FE) | |
| Geekom AE7 (Nvidia GeForce RTX 3060 Ti FE) | |
| Geekom XT12 Pro (Nvidia GeForce RTX 3060 Ti FE) | |
| Geekom XT13 Pro (Nvidia GeForce RTX 3060 Ti FE) | |
| Geekom A8 (Nvidia GeForce RTX 3060 Ti FE) | |
| Minisforum UH125 Pro (Nvidia GeForce RTX 3060 Ti FE) | |
| Unigine Superposition | |
| 1280x720 720p Low | |
| Geekom AE7 (Nvidia GeForce RTX 3060 Ti FE) | |
| Geekom GT13 Pro (Nvidia GeForce RTX 3060 Ti FE) | |
| Geekom A8 (Nvidia GeForce RTX 3060 Ti FE) | |
| Geekom XT13 Pro (Nvidia GeForce RTX 3060 Ti FE) | |
| Geekom XT12 Pro (Nvidia GeForce RTX 3060 Ti FE) | |
| Minisforum UH125 Pro (Nvidia GeForce RTX 3060 Ti FE) | |
| 1920x1080 1080p High | |
| Geekom GT13 Pro (Nvidia GeForce RTX 3060 Ti FE) | |
| Geekom A8 (Nvidia GeForce RTX 3060 Ti FE) | |
| Geekom AE7 (Nvidia GeForce RTX 3060 Ti FE) | |
| Geekom XT13 Pro (Nvidia GeForce RTX 3060 Ti FE) | |
| Minisforum UH125 Pro (Nvidia GeForce RTX 3060 Ti FE) | |
| Geekom XT12 Pro (Nvidia GeForce RTX 3060 Ti FE) | |
| 1920x1080 1080p Extreme | |
| Geekom GT13 Pro (Nvidia GeForce RTX 3060 Ti FE) | |
| Geekom XT13 Pro (Nvidia GeForce RTX 3060 Ti FE) | |
| Geekom XT12 Pro (Nvidia GeForce RTX 3060 Ti FE) | |
| Minisforum UH125 Pro (Nvidia GeForce RTX 3060 Ti FE) | |
| Geekom A8 (Nvidia GeForce RTX 3060 Ti FE) | |
| Geekom AE7 (Nvidia GeForce RTX 3060 Ti FE) | |
| 3840x2160 4k Optimized | |
| Geekom GT13 Pro (Nvidia GeForce RTX 3060 Ti FE) | |
| Geekom XT13 Pro (Nvidia GeForce RTX 3060 Ti FE) | |
| Geekom XT12 Pro (Nvidia GeForce RTX 3060 Ti FE) | |
| Geekom A8 (Nvidia GeForce RTX 3060 Ti FE) | |
| Minisforum UH125 Pro (Nvidia GeForce RTX 3060 Ti FE) | |
| Geekom AE7 (Nvidia GeForce RTX 3060 Ti FE) | |
| 7680x4320 8k Optimized | |
| Geekom GT13 Pro (Nvidia GeForce RTX 3060 Ti FE) | |
| Geekom XT13 Pro (Nvidia GeForce RTX 3060 Ti FE) | |
| Geekom XT12 Pro (Nvidia GeForce RTX 3060 Ti FE) | |
| Minisforum UH125 Pro (Nvidia GeForce RTX 3060 Ti FE) | |
| Geekom A8 (Nvidia GeForce RTX 3060 Ti FE) | |
| Geekom AE7 (Nvidia GeForce RTX 3060 Ti FE) | |
| Unigine Valley 1.0 | |
| 1920x1080 Extreme HD DirectX AA:x8 | |
| Geekom XT12 Pro (Nvidia GeForce RTX 3060 Ti FE) | |
| Geekom GT13 Pro (Nvidia GeForce RTX 3060 Ti FE) | |
| Geekom XT13 Pro (Nvidia GeForce RTX 3060 Ti FE) | |
| Geekom A8 (Nvidia GeForce RTX 3060 Ti FE) | |
| Geekom AE7 (Nvidia GeForce RTX 3060 Ti FE) | |
| Minisforum UH125 Pro (Nvidia GeForce RTX 3060 Ti FE) | |
| 1920x1080 Extreme HD Preset OpenGL AA:x8 | |
| Geekom GT13 Pro (Nvidia GeForce RTX 3060 Ti FE) | |
| Geekom XT12 Pro (Nvidia GeForce RTX 3060 Ti FE) | |
| Geekom XT13 Pro (Nvidia GeForce RTX 3060 Ti FE) | |
| Geekom A8 (Nvidia GeForce RTX 3060 Ti FE) | |
| Geekom AE7 (Nvidia GeForce RTX 3060 Ti FE) | |
| Minisforum UH125 Pro (Nvidia GeForce RTX 3060 Ti FE) | |
| Unigine Heaven 4.0 | |
| Extreme Preset OpenGL | |
| Geekom A8 (Nvidia GeForce RTX 3060 Ti FE) | |
| Geekom AE7 (Nvidia GeForce RTX 3060 Ti FE) | |
| Geekom GT13 Pro (Nvidia GeForce RTX 3060 Ti FE) | |
| Geekom XT13 Pro (Nvidia GeForce RTX 3060 Ti FE) | |
| Minisforum UH125 Pro (Nvidia GeForce RTX 3060 Ti FE) | |
| Geekom XT12 Pro (Nvidia GeForce RTX 3060 Ti FE) | |
| Extreme Preset DX11 | |
| Geekom XT13 Pro (Nvidia GeForce RTX 3060 Ti FE) | |
| Geekom GT13 Pro (Nvidia GeForce RTX 3060 Ti FE) | |
| Geekom A8 (Nvidia GeForce RTX 3060 Ti FE) | |
| Geekom XT12 Pro (Nvidia GeForce RTX 3060 Ti FE) | |
| Geekom AE7 (Nvidia GeForce RTX 3060 Ti FE) | |
| Minisforum UH125 Pro (Nvidia GeForce RTX 3060 Ti FE) | |
| ComputeMark v2.1 | |
| 1024x600 Normal, Score | |
| Geekom GT13 Pro (Nvidia GeForce RTX 3060 Ti FE) | |
| Geekom AE7 (Nvidia GeForce RTX 3060 Ti FE) | |
| Geekom A8 (Nvidia GeForce RTX 3060 Ti FE) | |
| Geekom XT13 Pro (Nvidia GeForce RTX 3060 Ti FE) | |
| Minisforum UH125 Pro (Nvidia GeForce RTX 3060 Ti FE) | |
| Geekom XT12 Pro (Nvidia GeForce RTX 3060 Ti FE) | |
| 1024x600 Normal, Fluid 3DTex | |
| Geekom GT13 Pro (Nvidia GeForce RTX 3060 Ti FE) | |
| Geekom AE7 (Nvidia GeForce RTX 3060 Ti FE) | |
| Minisforum UH125 Pro (Nvidia GeForce RTX 3060 Ti FE) | |
| Geekom A8 (Nvidia GeForce RTX 3060 Ti FE) | |
| Geekom XT13 Pro (Nvidia GeForce RTX 3060 Ti FE) | |
| Geekom XT12 Pro (Nvidia GeForce RTX 3060 Ti FE) | |
| 1024x600 Normal, Fluid 2DTexArr | |
| Geekom GT13 Pro (Nvidia GeForce RTX 3060 Ti FE) | |
| Geekom AE7 (Nvidia GeForce RTX 3060 Ti FE) | |
| Minisforum UH125 Pro (Nvidia GeForce RTX 3060 Ti FE) | |
| Geekom A8 (Nvidia GeForce RTX 3060 Ti FE) | |
| Geekom XT13 Pro (Nvidia GeForce RTX 3060 Ti FE) | |
| Geekom XT12 Pro (Nvidia GeForce RTX 3060 Ti FE) | |
| 1024x600 Normal, Mandel Vector | |
| Geekom GT13 Pro (Nvidia GeForce RTX 3060 Ti FE) | |
| Geekom AE7 (Nvidia GeForce RTX 3060 Ti FE) | |
| Geekom A8 (Nvidia GeForce RTX 3060 Ti FE) | |
| Geekom XT13 Pro (Nvidia GeForce RTX 3060 Ti FE) | |
| Minisforum UH125 Pro (Nvidia GeForce RTX 3060 Ti FE) | |
| Geekom XT12 Pro (Nvidia GeForce RTX 3060 Ti FE) | |
| 1024x600 Normal, Mandel Scalar | |
| Geekom GT13 Pro (Nvidia GeForce RTX 3060 Ti FE) | |
| Geekom AE7 (Nvidia GeForce RTX 3060 Ti FE) | |
| Geekom A8 (Nvidia GeForce RTX 3060 Ti FE) | |
| Geekom XT13 Pro (Nvidia GeForce RTX 3060 Ti FE) | |
| Minisforum UH125 Pro (Nvidia GeForce RTX 3060 Ti FE) | |
| Geekom XT12 Pro (Nvidia GeForce RTX 3060 Ti FE) | |
| 1024x600 Normal, QJuliaRayTrace | |
| Geekom GT13 Pro (Nvidia GeForce RTX 3060 Ti FE) | |
| Geekom AE7 (Nvidia GeForce RTX 3060 Ti FE) | |
| Geekom A8 (Nvidia GeForce RTX 3060 Ti FE) | |
| Geekom XT13 Pro (Nvidia GeForce RTX 3060 Ti FE) | |
| Minisforum UH125 Pro (Nvidia GeForce RTX 3060 Ti FE) | |
| Geekom XT12 Pro (Nvidia GeForce RTX 3060 Ti FE) | |
| Photoshop PugetBench - GPU Score | |
| Geekom A8 (Nvidia GeForce RTX 3060 Ti FE) | |
| Geekom AE7 (Nvidia GeForce RTX 3060 Ti FE) | |
| Geekom XT12 Pro (Nvidia GeForce RTX 3060 Ti FE) | |
| Geekom GT13 Pro (Nvidia GeForce RTX 3060 Ti FE) | |
| Minisforum UH125 Pro (Nvidia GeForce RTX 3060 Ti FE) | |
| Geekom XT13 Pro (Nvidia GeForce RTX 3060 Ti FE) | |
| Premiere Pro PugetBench - GPU 0.9 | |
| Geekom A8 (Nvidia GeForce RTX 3060 Ti FE) | |
| Geekom AE7 (Nvidia GeForce RTX 3060 Ti FE) | |
| Geekom GT13 Pro (Nvidia GeForce RTX 3060 Ti FE) | |
| Minisforum UH125 Pro (Nvidia GeForce RTX 3060 Ti FE) | |
| Geekom XT13 Pro (Nvidia GeForce RTX 3060 Ti FE) | |
| Geekom XT12 Pro (Nvidia GeForce RTX 3060 Ti FE) | |
| Cyberpunk 2077 2.2 Phantom Liberty | |
| 1280x720 Low Preset (FSR off) | |
| Geekom AE7 (Nvidia GeForce RTX 3060 Ti FE) | |
| Geekom A8 (Nvidia GeForce RTX 3060 Ti FE) | |
| Geekom XT13 Pro (Nvidia GeForce RTX 3060 Ti FE) | |
| Geekom GT13 Pro (Nvidia GeForce RTX 3060 Ti FE) | |
| Geekom XT12 Pro (Nvidia GeForce RTX 3060 Ti FE) | |
| Minisforum UH125 Pro (Nvidia GeForce RTX 3060 Ti FE) | |
| Geekom XT13 Pro | |
| 1920x1080 Medium Preset (FSR off) | |
| Geekom AE7 (Nvidia GeForce RTX 3060 Ti FE) | |
| Geekom XT13 Pro (Nvidia GeForce RTX 3060 Ti FE) | |
| Geekom A8 (Nvidia GeForce RTX 3060 Ti FE) | |
| Geekom GT13 Pro (Nvidia GeForce RTX 3060 Ti FE) | |
| Geekom XT12 Pro (Nvidia GeForce RTX 3060 Ti FE) | |
| Minisforum UH125 Pro (Nvidia GeForce RTX 3060 Ti FE) | |
| Geekom XT13 Pro | |
| 1920x1080 Ultra Preset (FSR off) | |
| Geekom AE7 (Nvidia GeForce RTX 3060 Ti FE) | |
| Geekom XT13 Pro (Nvidia GeForce RTX 3060 Ti FE) | |
| Geekom GT13 Pro (Nvidia GeForce RTX 3060 Ti FE) | |
| Geekom A8 (Nvidia GeForce RTX 3060 Ti FE) | |
| Geekom XT12 Pro (Nvidia GeForce RTX 3060 Ti FE) | |
| Minisforum UH125 Pro (Nvidia GeForce RTX 3060 Ti FE) | |
| Geekom XT13 Pro | |
| Baldur's Gate 3 | |
| 1920x1080 Low Preset | |
| Geekom GT13 Pro (Nvidia GeForce RTX 3060 Ti FE) | |
| Geekom XT12 Pro (Nvidia GeForce RTX 3060 Ti FE) | |
| Geekom XT13 Pro (Nvidia GeForce RTX 3060 Ti FE) | |
| Geekom AE7 (Nvidia GeForce RTX 3060 Ti FE) | |
| Geekom A8 (Nvidia GeForce RTX 3060 Ti FE) | |
| Minisforum UH125 Pro (Nvidia GeForce RTX 3060 Ti FE) | |
| Geekom XT13 Pro | |
| 1920x1080 Medium Preset | |
| Geekom XT13 Pro (Nvidia GeForce RTX 3060 Ti FE) | |
| Geekom GT13 Pro (Nvidia GeForce RTX 3060 Ti FE) | |
| Geekom A8 (Nvidia GeForce RTX 3060 Ti FE) | |
| Geekom XT12 Pro (Nvidia GeForce RTX 3060 Ti FE) | |
| Geekom AE7 (Nvidia GeForce RTX 3060 Ti FE) | |
| Minisforum UH125 Pro (Nvidia GeForce RTX 3060 Ti FE) | |
| Geekom XT13 Pro | |
| 1920x1080 Ultra Preset | |
| Geekom GT13 Pro (Nvidia GeForce RTX 3060 Ti FE) | |
| Geekom XT13 Pro (Nvidia GeForce RTX 3060 Ti FE) | |
| Geekom A8 (Nvidia GeForce RTX 3060 Ti FE) | |
| Geekom XT12 Pro (Nvidia GeForce RTX 3060 Ti FE) | |
| Geekom AE7 (Nvidia GeForce RTX 3060 Ti FE) | |
| Minisforum UH125 Pro (Nvidia GeForce RTX 3060 Ti FE) | |
| Geekom XT13 Pro | |
| F1 24 | |
| 1920x1080 Low Preset AA:T AF:16x | |
| Geekom AE7 (Nvidia GeForce RTX 3060 Ti FE) | |
| Geekom A8 (Nvidia GeForce RTX 3060 Ti FE) | |
| Geekom GT13 Pro (Nvidia GeForce RTX 3060 Ti FE) | |
| Geekom XT13 Pro (Nvidia GeForce RTX 3060 Ti FE) | |
| Geekom XT12 Pro (Nvidia GeForce RTX 3060 Ti FE) | |
| Minisforum UH125 Pro (Nvidia GeForce RTX 3060 Ti FE) | |
| Geekom XT13 Pro | |
| 1920x1080 Medium Preset AA:T AF:16x | |
| Geekom A8 (Nvidia GeForce RTX 3060 Ti FE) | |
| Geekom AE7 (Nvidia GeForce RTX 3060 Ti FE) | |
| Geekom XT12 Pro (Nvidia GeForce RTX 3060 Ti FE) | |
| Geekom XT13 Pro (Nvidia GeForce RTX 3060 Ti FE) | |
| Geekom GT13 Pro (Nvidia GeForce RTX 3060 Ti FE) | |
| Minisforum UH125 Pro (Nvidia GeForce RTX 3060 Ti FE) | |
| Geekom XT13 Pro | |
| 1920x1080 Ultra High Preset AA:T AF:16x | |
| Geekom AE7 (Nvidia GeForce RTX 3060 Ti FE) | |
| Geekom A8 (Nvidia GeForce RTX 3060 Ti FE) | |
| Geekom XT13 Pro (Nvidia GeForce RTX 3060 Ti FE) | |
| Geekom GT13 Pro (Nvidia GeForce RTX 3060 Ti FE) | |
| Geekom XT12 Pro (Nvidia GeForce RTX 3060 Ti FE) | |
| Minisforum UH125 Pro (Nvidia GeForce RTX 3060 Ti FE) | |
| Geekom XT13 Pro, Intel Iris Xe Graphics G7 96EUs i9-13900H | Geekom XT13 Pro (Nvidia GeForce RTX 3060 Ti FE), i9-13900H | Geekom GT13 Pro (Nvidia GeForce RTX 3060 Ti FE), i9-13900H | Geekom XT12 Pro (Nvidia GeForce RTX 3060 Ti FE), i9-12900H | Minisforum UH125 Pro (Nvidia GeForce RTX 3060 Ti FE), Ultra 5 125H | Geekom AE7 (Nvidia GeForce RTX 3060 Ti FE), R9 7940HS | Geekom A8 (Nvidia GeForce RTX 3060 Ti FE), R9 8945HS | Średnia w klasie Mini PC | |
|---|---|---|---|---|---|---|---|---|
| SPECviewperf 2020 | 391% | 387% | 321% | 182% | 395% | 516% | 197% | |
| 3840x2160 Medical (medical-03) | 3.63 | 13 258% | 10.8 198% | 11.8 225% | 10.9 200% | 13 258% | 10.8 198% | 8.21 ? 126% |
| 3840x2160 Energy (energy-03) | 3.15 | 20.9 563% | 21 567% | 18.9 500% | 17.8 465% | 20.9 563% | 50.3 1497% | 11.8 ? 275% |
| 3840x2160 Creo (creo-03) | 16 | 74.2 364% | 76.4 378% | 62.7 292% | 26.6 66% | 76.8 380% | 76.6 379% | 30.8 ? 93% |
| 3840x2160 CATIA (catia-06) | 7.9 | 39.4 399% | 40.1 408% | 32.8 315% | 23.6 199% | 39.2 396% | 38.8 391% | 18.7 ? 137% |
| 3840x2160 3ds Max (3dsmax-07) | 10.3 | 47.2 358% | 47.3 359% | 40 288% | 28.7 179% | 46.5 351% | 45.9 346% | 22.6 ? 119% |
| 3840x2160 Siemens NX (snx-04) | 6.13 | 16.5 169% | 16.5 169% | 15.2 148% | 11.4 86% | 16.6 171% | 16.6 171% | 37.7 ? 515% |
| 3840x2160 Maya (maya-06) | 26.8 | 194 624% | 196 631% | 155 478% | 47.5 77% | 199 643% | 195 628% | 57.7 ? 115% |
| low | med. | high | ultra | QHD | 4K | |
|---|---|---|---|---|---|---|
| GTA V (2015) | 182.2 | 178.4 | 170.3 | 104.2 | 92.7 | 103.4 |
| Dota 2 Reborn (2015) | 165.8 | 138.3 | 132 | 121.9 | 104.6 | |
| Final Fantasy XV Benchmark (2018) | 183.7 | 142.2 | 98.8 | 77.6 | 48.6 | |
| X-Plane 11.11 (2018) | 146.4 | 137.9 | 106.3 | 92.1 | ||
| Baldur's Gate 3 (2023) | 113 | 91.3 | 79 | 78.5 | 61.6 | 37.1 |
| Cyberpunk 2077 2.2 Phantom Liberty (2023) | 88.2 | 81.4 | 71.7 | 64.4 | 44.5 | 22.2 |
| F1 24 (2024) | 76.9 | 73.1 | 60.5 | 42.2 | 36.9 | 19.2 |
Emisje - Słabe chłodzenie i niskie zużycie energii
Emisja hałasu
Nawet urządzenia o tej samej konstrukcji nie były w stanie zaimponować najwyższymi wartościami w zakresie emisji hałasu. Dotyczy to również Geekom XT13 Pro, przynajmniej pod obciążeniem. W stanie spoczynku mini-PC jest bardzo cichy i ledwo słyszalny. Jednak wentylator zawsze pracuje, co oznacza, że półpasywna praca nie jest możliwa. Pod obciążeniem wentylator czasami znacznie się rozkręca, a my byliśmy w stanie zmierzyć szczytowy poziom ciśnienia akustycznego 49,5 dB(A). Jednak maksymalna głośność nie zawsze jest obecna. Podczas testu obciążeniowego prędkość wentylatora zmieniała się raz po raz, tak że Geekom XT13 Pro osiągnął tylko 38 dB(A) pod obciążeniem. To samo zjawisko zaobserwowaliśmy przy średnim obciążeniu. Tutaj mierzalna głośność waha się między 38 a 42,2 dB(A)
Niestety Geekom XT12 Pro nie należy do najcichszych urządzeń. Urządzenie pracuje niemal bezgłośnie tylko na biegu jałowym, słyszalny jest jedynie cichy szum wentylatora. Zmienia się to pod obciążeniem, gdyż mini-PC jest wyraźnie słyszalny na poziomie do 44,2 dB(A). Byliśmy nawet w stanie zmierzyć do 47,2 dB(A) podczas grania. Nie byliśmy jednak w stanie wykryć stale wysokiego poziomu ciśnienia akustycznego podczas grania. Tutaj wynik wahał się między 39 a 47,2 dB(A).
Hałas
| luz |
| 27.6 / 27.8 / 27.9 dB |
| obciążenie |
| 42.2 / 49.5 dB |
 | ||
30 dB cichy 40 dB(A) słyszalny 50 dB(A) irytujący |
||
min: | ||
| Geekom XT13 Pro i9-13900H, Iris Xe G7 96EUs | Aoostar GEM12 R7 8845HS, Radeon 780M | Minisforum AtomMan X7 Ti Ultra 9 185H, Arc 8-Core | Acemagic F2A Ultra 7 155H, Arc 8-Core | Geekom XT12 Pro i9-12900H, Iris Xe G7 96EUs | Geekom A7 R9 7940HS, Radeon 780M | |
|---|---|---|---|---|---|---|
| Noise | 10% | 1% | 2% | 2% | -9% | |
| wyłączone / środowisko * | 25 | 24.3 3% | 24.1 4% | 24.9 -0% | 25.4 -2% | 25.4 -2% |
| Idle Minimum * | 27.6 | 27.5 -0% | 29.8 -8% | 25.4 8% | 28 -1% | 33.3 -21% |
| Idle Average * | 27.8 | 27.6 1% | 29.9 -8% | 25.7 8% | 28.1 -1% | 33.6 -21% |
| Idle Maximum * | 27.9 | 27.6 1% | 30 -8% | 25.7 8% | 28.5 -2% | 33.7 -21% |
| Load Average * | 42.2 | 36 15% | 37.3 12% | 47.8 -13% | 39.6 6% | 43.3 -3% |
| Cyberpunk 2077 ultra * | 46.6 | 35.4 24% | ||||
| Load Maximum * | 49.5 | 38.2 23% | 43.5 12% | 49 1% | 44.2 11% | 43.3 13% |
| Witcher 3 ultra * | 35.4 | 40.2 | 45.23 | 47.2 | 43.2 |
* ... im mniej tym lepiej
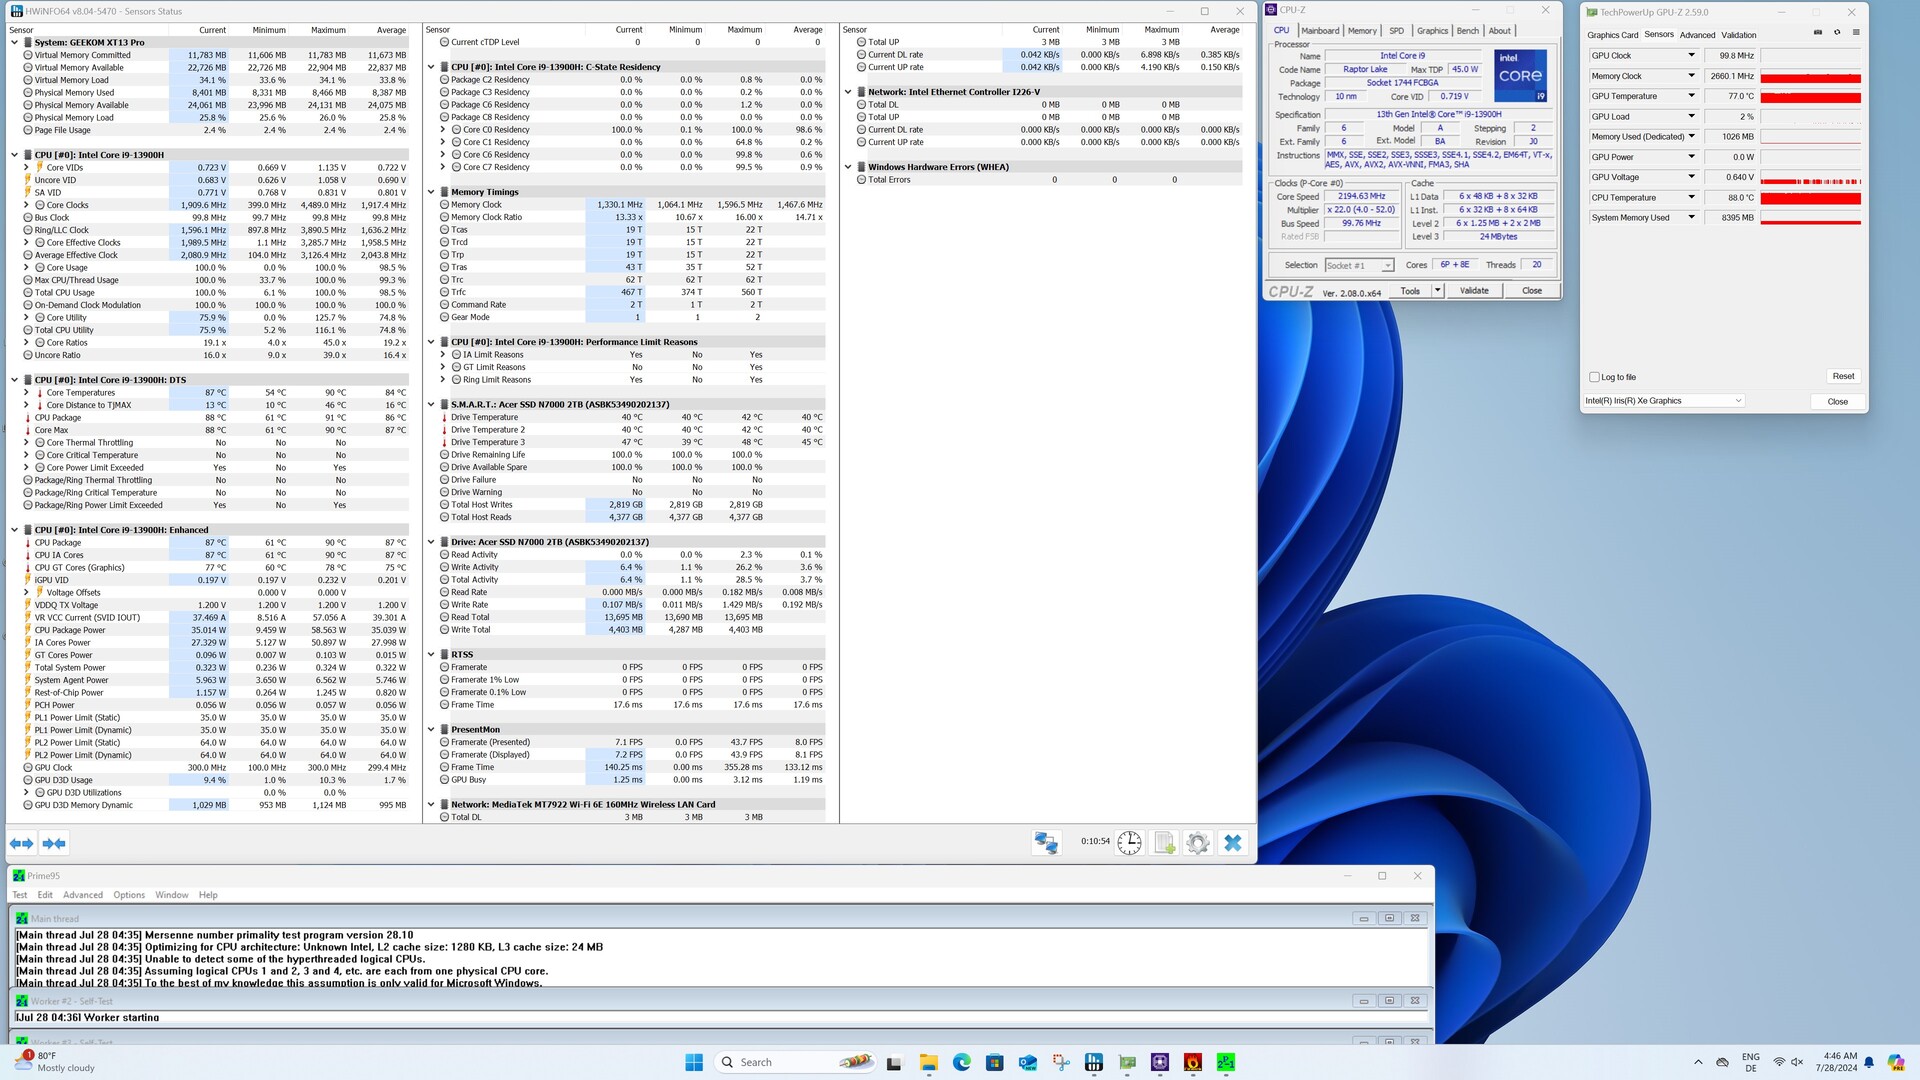
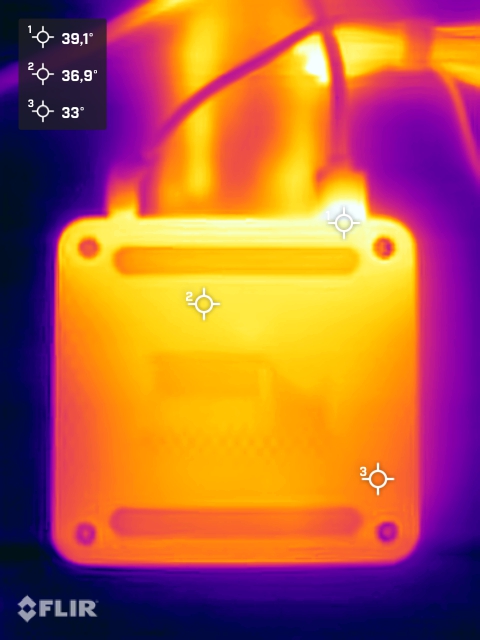
Temperatura
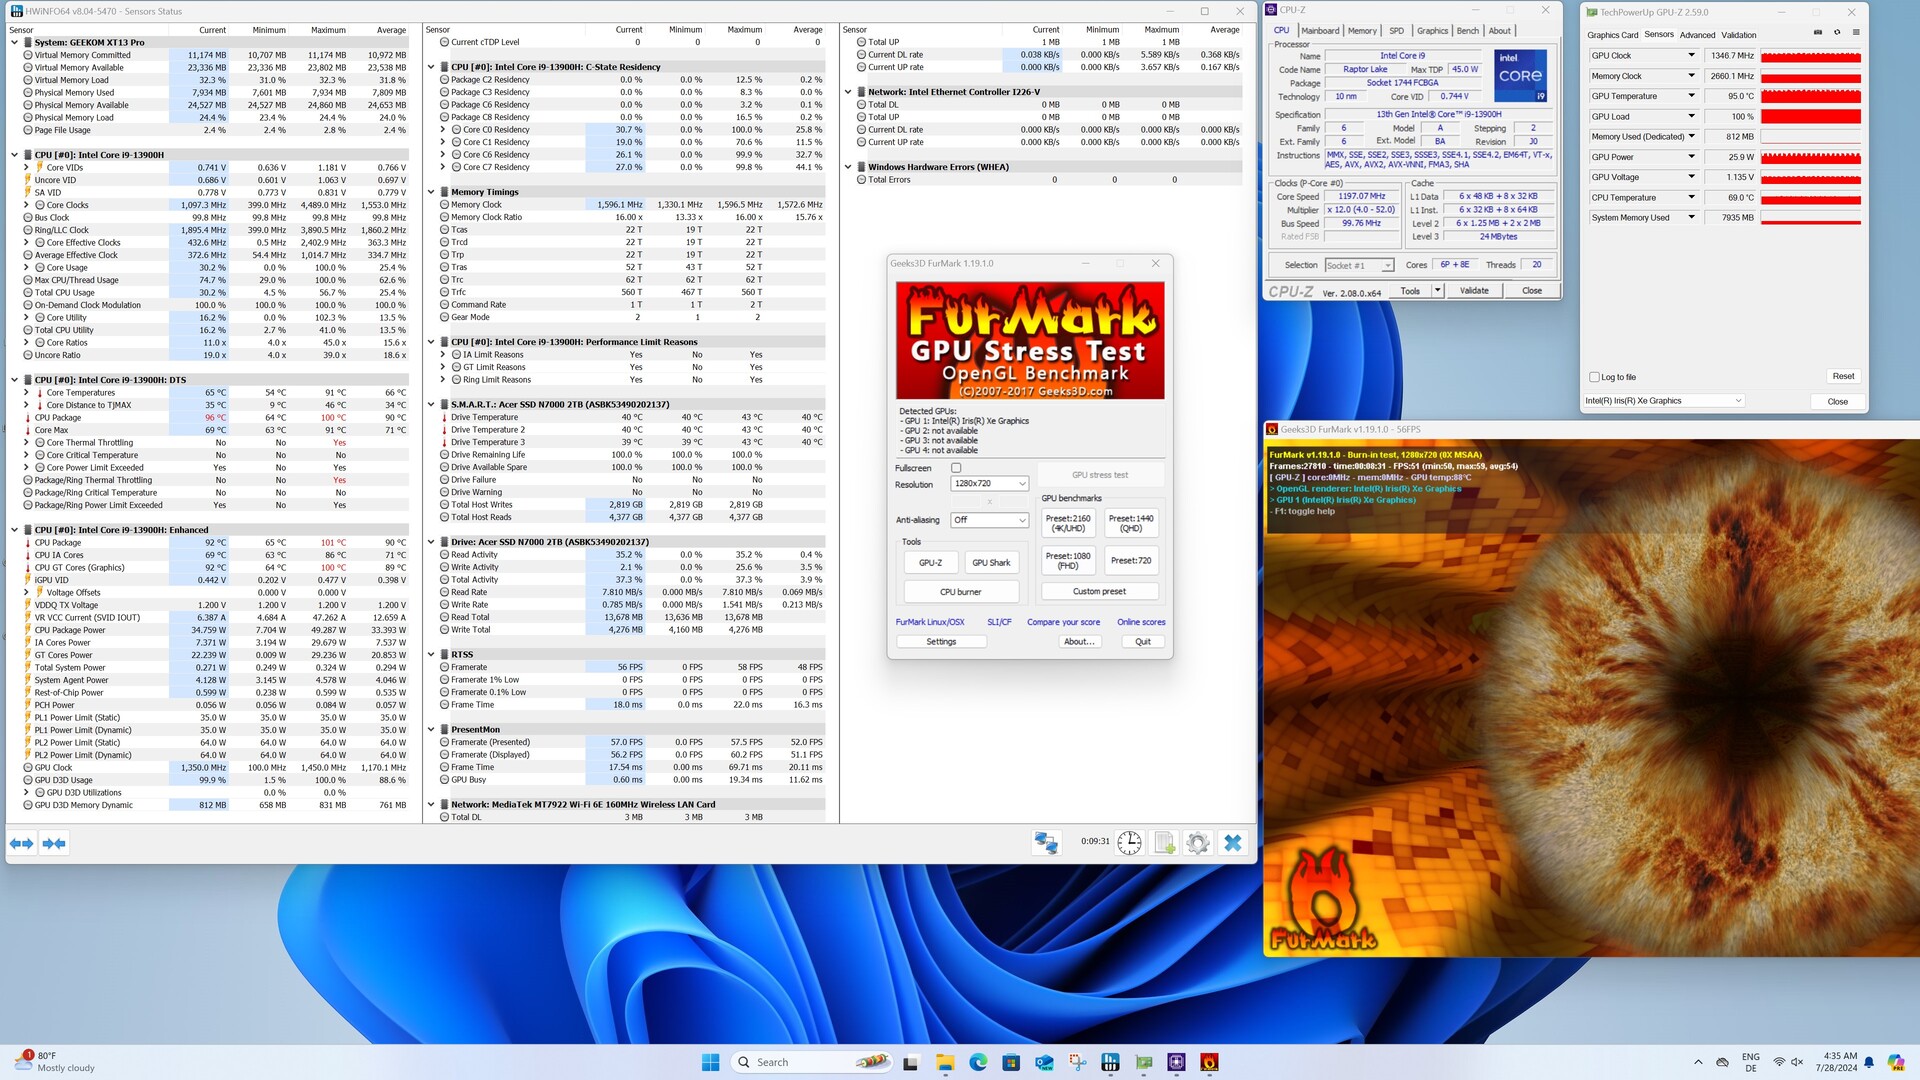
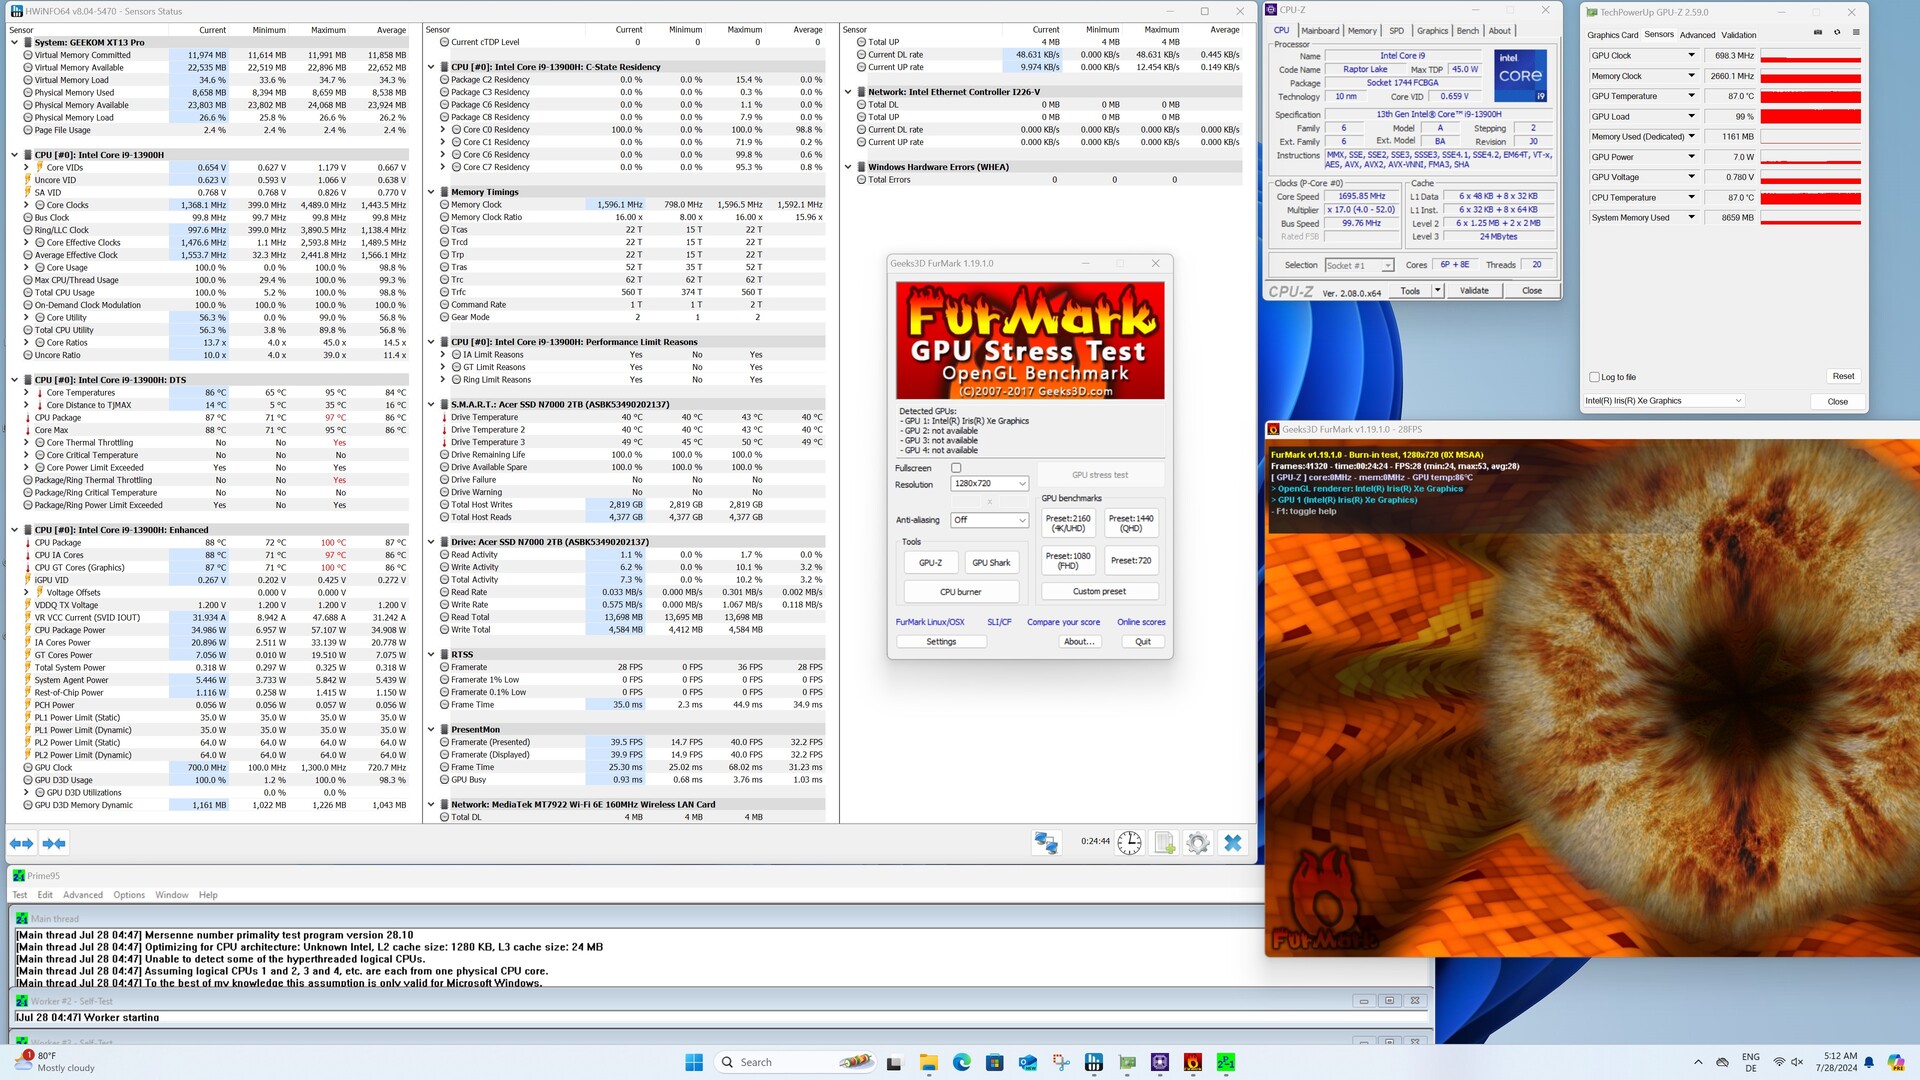
Obudowa wyraźnie nagrzewa się pod obciążeniem. Nie znajdziemy jednak żadnych wartości krytycznych. SoC wygląda nieco inaczej, gdyż Geekom nie ogranicza maksymalnej temperatury, która pod obciążeniem szybko osiąga 100 °C. W przeciwieństwie do multi-loopa Cinebench R15, Intel Core i9-13900H nie przekracza 64-watowego limitu w teście obciążeniowym. SoC nagrzewa się zbyt szybko i wydajność musi zostać obniżona. Po dłuższym czasie temperatura stabilizuje się na poziomie około 90 °C, co nie stanowi problemu dla procesora. Niezwykle kompaktowa konstrukcja po prostu uniemożliwia zainstalowanie wydajniejszego systemu chłodzenia.
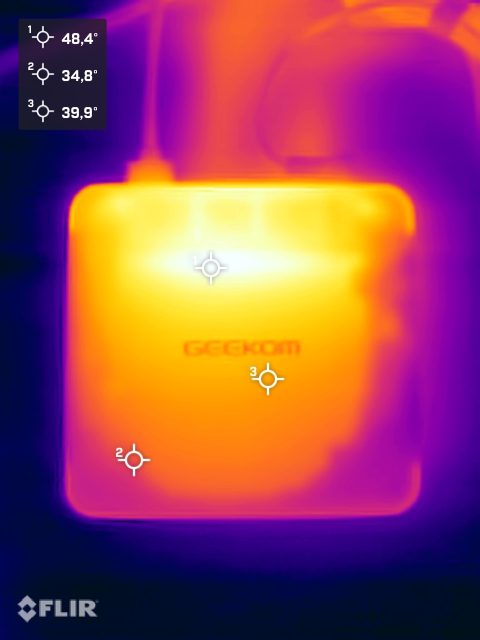
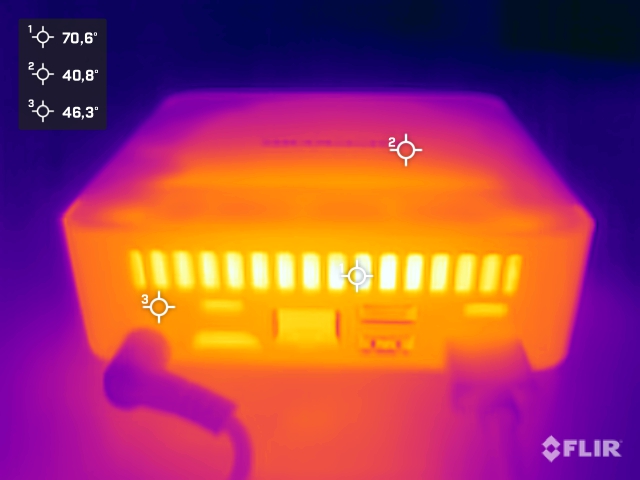
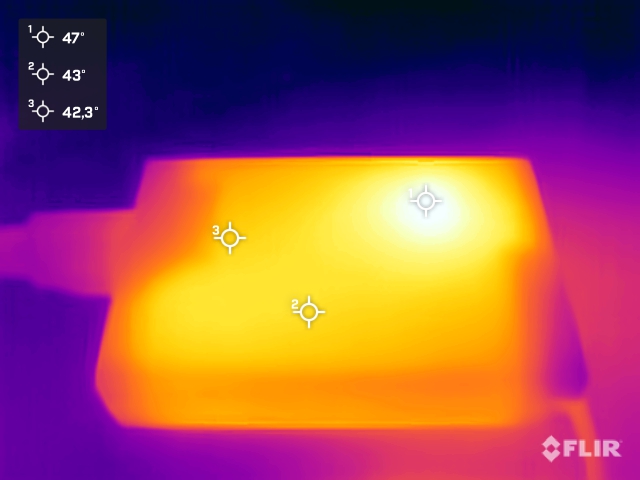
(-) Maksymalna temperatura w górnej części wynosi 45.7 °C / 114 F, w porównaniu do średniej 35.7 °C / 96 F , począwszy od 21.6 do 69.5 °C dla klasy Mini PC.
(±) Dno nagrzewa się maksymalnie do 40.3 °C / 105 F, w porównaniu do średniej 36.1 °C / 97 F
(+) W stanie bezczynności średnia temperatura górnej części wynosi 27.9 °C / 82 F, w porównaniu ze średnią temperaturą urządzenia wynoszącą 32.3 °C / ### class_avg_f### F.
Zużycie energii
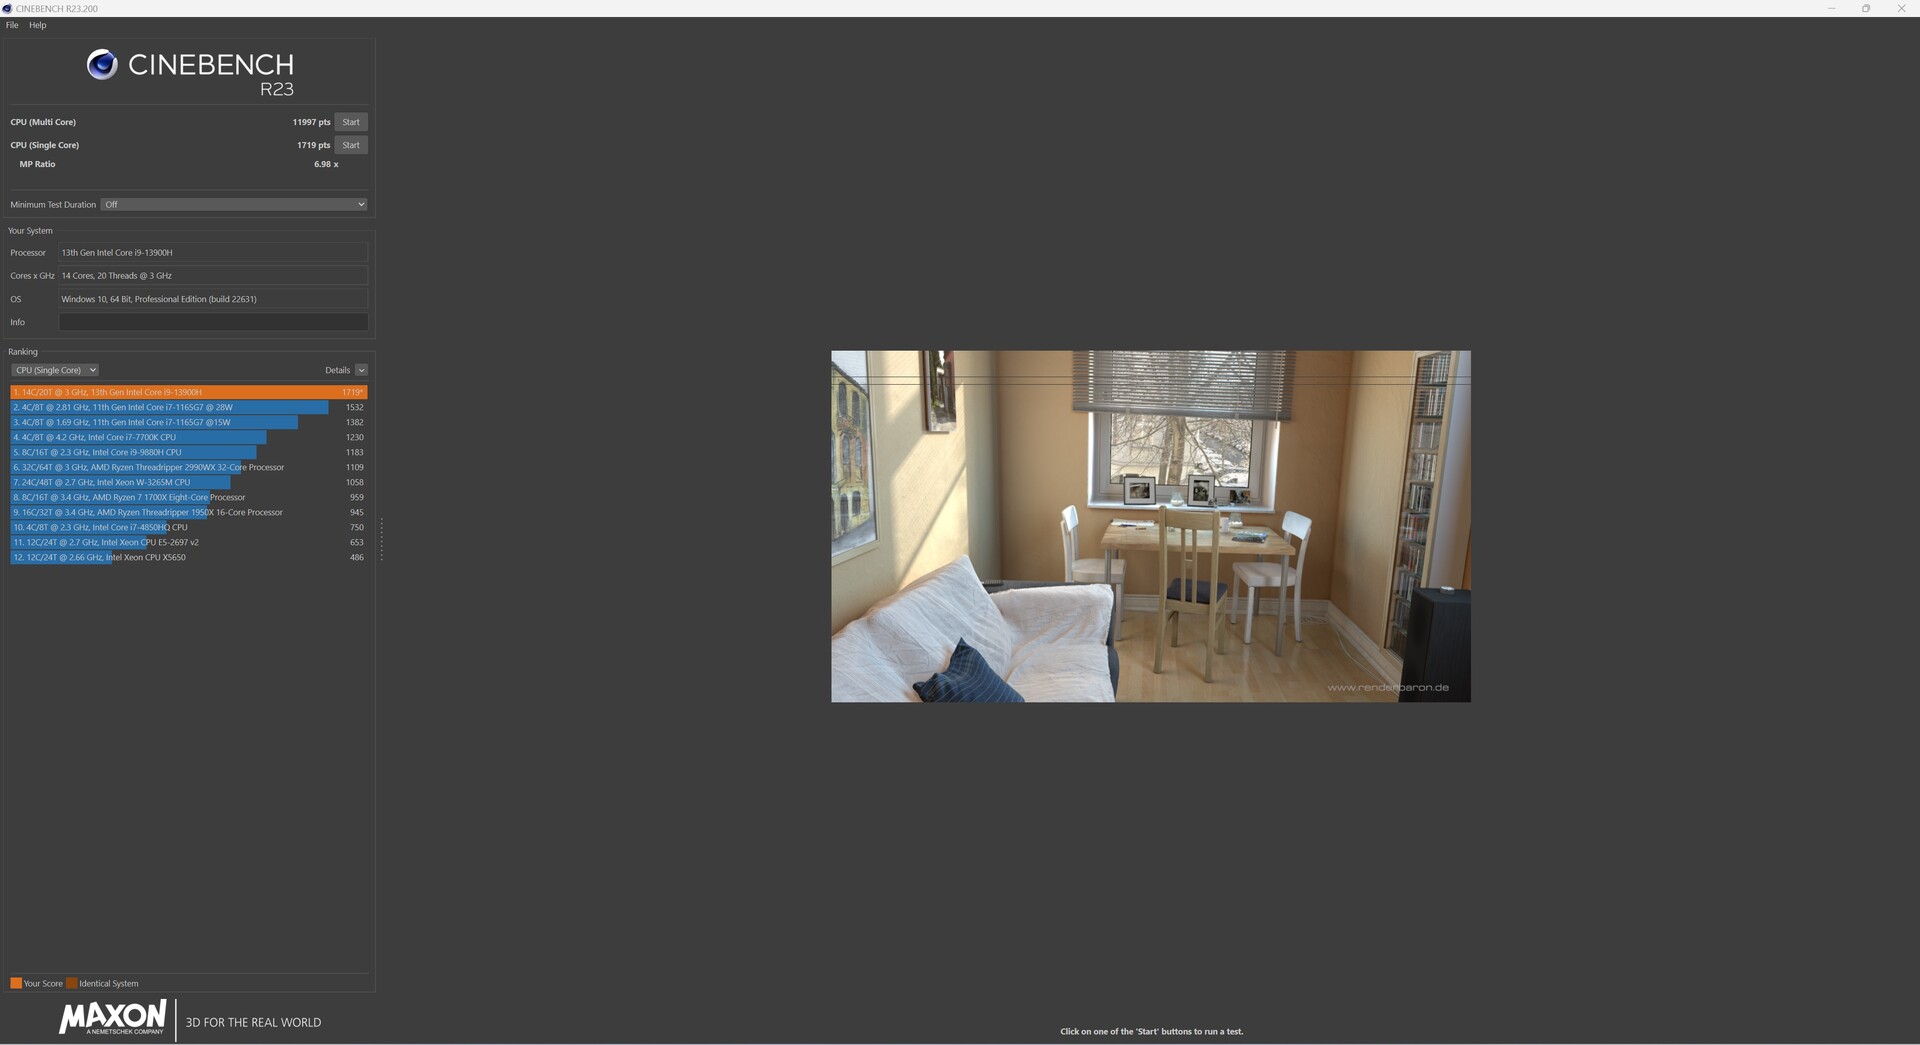
Zużycie energii przez Geekom XT13 Pro wypada bardzo korzystnie na tle konkurencji. Zmierzyliśmy tylko niskie wartości nawet w trybie bezczynności. Niskie limity mocy (PL1 i PL2) procesora Intel Core i9-13900H zapewniają stosunkowo niskie zapotrzebowanie na energię pod obciążeniem. Pod średnim obciążeniem system radzi sobie z nieco mniej niż 50 watów. Pod obciążeniem widzimy 94,5 wata tylko przez krótki czas, kiedy system może nadal korzystać z Turbo. Udało nam się zaobserwować nieco osobliwe zachowanie. W teście Cinebench R23 Sigle udokumentowaliśmy wiele skoków, których nigdy nie widzieliśmy w innych urządzeniach testowych. Powtórzyliśmy test kilka razy - z tym samym wynikiem. Rozsądne jest założenie, że SoC wielokrotnie pracuje w tym przypadku na granicy temperatury, co pozwala mu na krótkotrwałe pobieranie większej mocy. Za zasilanie odpowiada niewielki zasilacz o mocy 120 W. Ten sam zasilacz jest dołączany do wielu urządzeń Geekom.
| wyłączony / stan wstrzymania | |
| luz | |
| obciążenie |
|
Legenda:
min: | |
| Geekom XT13 Pro i9-13900H, Iris Xe G7 96EUs | Aoostar GEM12 R7 8845HS, Radeon 780M | Minisforum AtomMan X7 Ti Ultra 9 185H, Arc 8-Core | Acemagic F2A Ultra 7 155H, Arc 8-Core | Geekom XT12 Pro i9-12900H, Iris Xe G7 96EUs | Geekom A7 R9 7940HS, Radeon 780M | Przeciętny Intel Iris Xe Graphics G7 96EUs | Średnia w klasie Mini PC | |
|---|---|---|---|---|---|---|---|---|
| Power Consumption | -38% | -34% | -35% | -21% | 11% | 2% | -42% | |
| Idle Minimum * | 6.3 | 8.2 -30% | 8.2 -30% | 9.1 -44% | 5.7 10% | 3.8 40% | 5.41 ? 14% | 9.54 ? -51% |
| Idle Average * | 7.1 | 10 -41% | 12.1 -70% | 10.3 -45% | 9.5 -34% | 4.8 32% | 8.6 ? -21% | 11.7 ? -65% |
| Idle Maximum * | 9 | 14.6 -62% | 14 -56% | 14.4 -60% | 16.5 -83% | 6.5 28% | 10.9 ? -21% | 15 ? -67% |
| Load Average * | 49.8 | 73.9 -48% | 53.1 -7% | 54.9 -10% | 53.3 -7% | 71.9 -44% | 45.4 ? 9% | 59.1 ? -19% |
| Cyberpunk 2077 ultra external monitor * | 54 | 79.9 -48% | ||||||
| Load Maximum * | 94.5 | 95.3 -1% | 100.4 -6% | 110.4 -17% | 87.8 7% | 94.7 -0% | 67.6 ? 28% | 100.1 ? -6% |
* ... im mniej tym lepiej
Efficiency
| Performance Rating - Percent | |
| Geekom A8 | |
| Minisforum AtomMan X7 Ti | |
| Acemagic F2A | |
| Geekom XT13 Pro | |
| Geekom XT12 Pro | |
| Power Consumption | |
| Cinebench R23 Multi Power Efficiency - external Monitor | |
| Geekom A8 | |
| Minisforum AtomMan X7 Ti | |
| Geekom XT13 Pro | |
| Acemagic F2A | |
| Geekom XT12 Pro | |
| Cinebench R23 Single Power Efficiency - external Monitor | |
| Geekom A8 | |
| Minisforum AtomMan X7 Ti | |
| Acemagic F2A | |
| Geekom XT13 Pro | |
| Geekom XT12 Pro | |
| Cinebench R15 Multi Efficiency (external Monitor) | |
| Geekom A8 | |
| Minisforum AtomMan X7 Ti | |
| Geekom XT13 Pro | |
| Acemagic F2A | |
| Geekom XT12 Pro | |
Power consumption with external monitor
Power consumption with external monitor
Za
Przeciw
Werdykt - cena premium bez wydajności premium
Geekom XT13 Pro to potężny mini-PC. Mogliśmy to już jednak potwierdzić w przypadku Geekom XT12 Pro. Jeśli tylko porównamy te dwa modele ze sobą, mogą Państwo zdecydować się na starsze urządzenie bez zauważalnej utraty wydajności. Procesor Intel Core i9-13900H w Geekom XT13 Pro nie jest w stanie zapewnić zauważalnego wzrostu wydajności. Różnice techniczne w porównaniu do Intel Core i9-12900H są zbyt małe. Geekom nie odważy się na odważny krok w postaci mini-PC opartego na serii Meteor Lake. Oznacza to, że Geekom zostaje w tyle, gdyż wielu innych producentów wyposażyło już swoje serie modelowe w najnowsze procesory od Intela. Największą wadą Geekom XT13 Pro jest iGPU, które we wszystkich testach ustępuje nowoczesnym przedstawicielom. Jednak Geekom jest tutaj gorszy nie tylko od swoich konkurentów, ale także od siebie. Własne portfolio Geekom obejmuje mini-PC z najnowszymi SoC AMD, które technicznie nie są dużo gorsze, ale zapewniają ogólnie lepszy wynik. Nawet nie spojrzeliśmy jeszcze na cenę. Niestety, Geekom XT13 Pro jest tutaj całkowicie poza linią. 999 euro jest obecnie na rachunku, jeśli ma to być topowy model. Inne mini-PC kosztują nieco mniej, ale oferują większą wydajność.
Geekom XT13 Pro zapewnia odpowiednią wydajność dzięki procesorowi Intel Core i9-13900H i imponuje wszechstronnymi funkcjami. Jednak stosunek ceny do wydajności Geekom XT13 Pro w ogóle nie pasuje.
Pozytywnie należy podkreślić dobrą łączność, dzięki której Geekom wielokrotnie zdobywał punkty w przeszłości. Liczne złącza obejmują dwa porty USB4, co może wpłynąć na decyzję o zakupie pod kątem przyszłości. Na korzyść urządzenia od Geekom przemawia również trzyletnia gwarancja producenta. Oczywiście jest ona dostępna również dla innych urządzeń tego producenta. Wydajność można zwiększyć tylko nieznacznie w porównaniu do Geekom XT12 Pro. W tej dyscyplinie Intel Core i9-13900H wyraźnie ustępuje nowocześniejszym procesorom Meteor Lake. Z tego powodu nie możemy udzielić Geekom XT13 Pro rekomendacji zakupu, nawet w odniesieniu do wysokiej ceny zakupu. Jeśli Geekom XT13 Pro nie ma stać się wygrzewaczem półek, Geekom musi pilnie zrewidować swoje obecne ceny.
Uwaga: Niedawno zaktualizowaliśmy nasz system oceny i wyniki wersji 8 nie są porównywalne z wynikami wersji 7. Więcej informacji można znaleźć tutaj.
Geekom XT13 Pro
- 30/07/2024 v8
Sebastian Bade
 Total Sustainability Score:
 Przezroczystość
Wyboru urządzeń do recenzji dokonuje nasza redakcja. Próbka testowa została udostępniona autorowi przez producenta bezpłatnie do celów recenzji. Na tę recenzję nie miały wpływu osoby trzecie, a producent nie otrzymał kopii tej recenzji przed publikacją. Nie było obowiązku publikowania tej recenzji. Nigdy nie przyjmujemy rekompensaty ani płatności w zamian za nasze recenzje. Jako niezależna firma medialna, Notebookcheck nie podlega władzy producentów, sprzedawców detalicznych ani wydawców.
Tak testuje Notebookcheck
Każdego roku Notebookcheck niezależnie sprawdza setki laptopów i smartfonów, stosując standardowe procedury, aby zapewnić porównywalność wszystkich wyników. Od około 20 lat stale rozwijamy nasze metody badawcze, ustanawiając przy tym standardy branżowe. W naszych laboratoriach testowych doświadczeni technicy i redaktorzy korzystają z wysokiej jakości sprzętu pomiarowego. Testy te obejmują wieloetapowy proces walidacji. Nasz kompleksowy system ocen opiera się na setkach uzasadnionych pomiarów i benchmarków, co pozwala zachować obiektywizm.Price comparison
