

Recenzja Intel Core Ultra 9 285K Arrow Lake-S: procesor za 589 USD poświęca gamingową koronę, aby dorównać AMD Zen 5 Ryzen 9000 pod względem wydajności energetycznej
Energooszczędny, ale niedostateczny pod względem gier.
Nowy procesor Intela Arrow Lake-S Core Ultra 9 285 wprowadza nowy układ kafelków obliczeniowych, który poświęca hiperwątkowość i ma na celu pozyskanie entuzjastów dzięki znacznej poprawie wydajności. Chociaż Core Ultra 9 285K rzeczywiście zapewnia surową wydajność i efektywność procesora, to w grach mocno przegrywa z ofertą Intel Raptor Lake-S Refresh i AMD Zen 5 Ryzen 9000.Vaidyanathan Subramaniam (tłumaczenie DeepL / Ninh Duy) Opublikowany 🇺🇸 🇩🇪 ...
Werdykt: Wydajna gra Intela trafia na przeszkodę w grach
Układy Intela dla komputerów stacjonarnych nie są znane ze swojej wydajności, ale firma ma nadzieję zmienić narrację dzięki dzisiejszej premierze Arrow Lake-S.
Nowa linia Arrow Lake-S Intela, na czele z Core Ultra 9 285K, oznacza znaczącą zmianę poprzez usunięcie hiperwątkowości we wszystkich modelach - po raz pierwszy od ery Pentium 4. W zbiorczych testach porównawczych procesorów, Core Ultra 9 285K dorównuje Core i9-14900K i prawie osiąga poziom wydajności Ryzen 9 9950X.
Biorąc to pod uwagę, widzimy, że Core Ultra 9 285K przyćmiewa oba te procesory w indywidualnych jedno- i wielordzeniowych testach porównawczych.
To, co szczególnie nam się spodobało, to zdolność Arrow Lake-S do osiągania wydajności na równi lub nawet nieco lepszej niż Raptor Lake-S Refresh, przy jednoczesnym osiągnięciu efektywności energetycznej porównywalnej z procesorami AMD Zen 5.
Jednak pomimo tych postępów, Core Ultra 9 285K zmaga się z wydajnością w grach, pozostając w tyle zarówno za Core i9-14900K, jak i procesorami Zen 5 we wszystkich testowanych rozdzielczościach.
Core Ultra 9 285K jest ograniczony do konkurowania tylko z Core i7-14700K w grach. Jest to zaskakujące, biorąc pod uwagę wbudowane optymalizacje APO Arrow Lake-S i brak hiperwątkowości, które teoretycznie powinny pomóc procesorowi osiągnąć lepsze wyniki w grach.
Nowa platforma wymaga również dodatkowych inwestycji w nowe płyty główne z serii 800 i pamięci DDR5, co należy wziąć pod uwagę przed modernizacją.
Za
Przeciw
Cena i dostępność
Procesor Intel Core Ultra 9 285K będzie dostępny od dziś w sklepach detalicznych na całym świecie w sugerowanej cenie detalicznej 589 USD. Zdyskontowany teraz Core i9-14900K nadal pozostaje opłacalny, jeśli priorytetem są zarówno obliczenia, jak i gry, pomimo niewielkich spadków wydajności wynikających z nowszych BIOS-ów.
Procesor AMD Ryzen 9 9950X(obecnie 709 USD na Amazon) i Ryzen 9 9900X(429 USD na Amazon) nadal są doskonałymi alternatywami bez czkawki Core Ultra 9 285K w grach.
Price comparison
Spis treści
- Werdykt: Wydajna gra Intela trafia na przeszkodę w grach
- Stanowisko testowe: GeForce RTX 4090 świetnie współgra z Core Ultra 9 285K
- Wydajność procesora: Ogólnie na równi z Core i9-14900K z niewielkim wzrostem w stosunku do Ryzen 9 9950X
- Wydajność systemu: W tej samej lidze co Core i9-14900K i AMD Zen 5
- 3D i wydajność w grach: Arrow Lake-S rozczarowuje
- Pobór mocy: Intel w końcu osiąga właściwą wydajność energetyczną
- Ogólne wrażenie Notebookcheck na temat Core Ultra 9 285K
Flagowe procesory Intela do komputerów stacjonarnych 13. i 14. generacji pojawiły się w wiadomościach z niewłaściwych powodów złych powodów ale miejmy nadzieję, że dzisiaj wszystko zmieni się na lepsze. Po dobrym starcie z Lunar Lake dla laptopów, Intel kieruje teraz swoją uwagę w stronę Arrow Lake-S dla komputerów stacjonarnych.
Arrow Lake-S, lub seria Core Ultra 200S, jak z jakiegoś powodu chce tego marketing, oznacza zmianę paradygmatu w strategii procesorów Intela dla komputerów stacjonarnych.
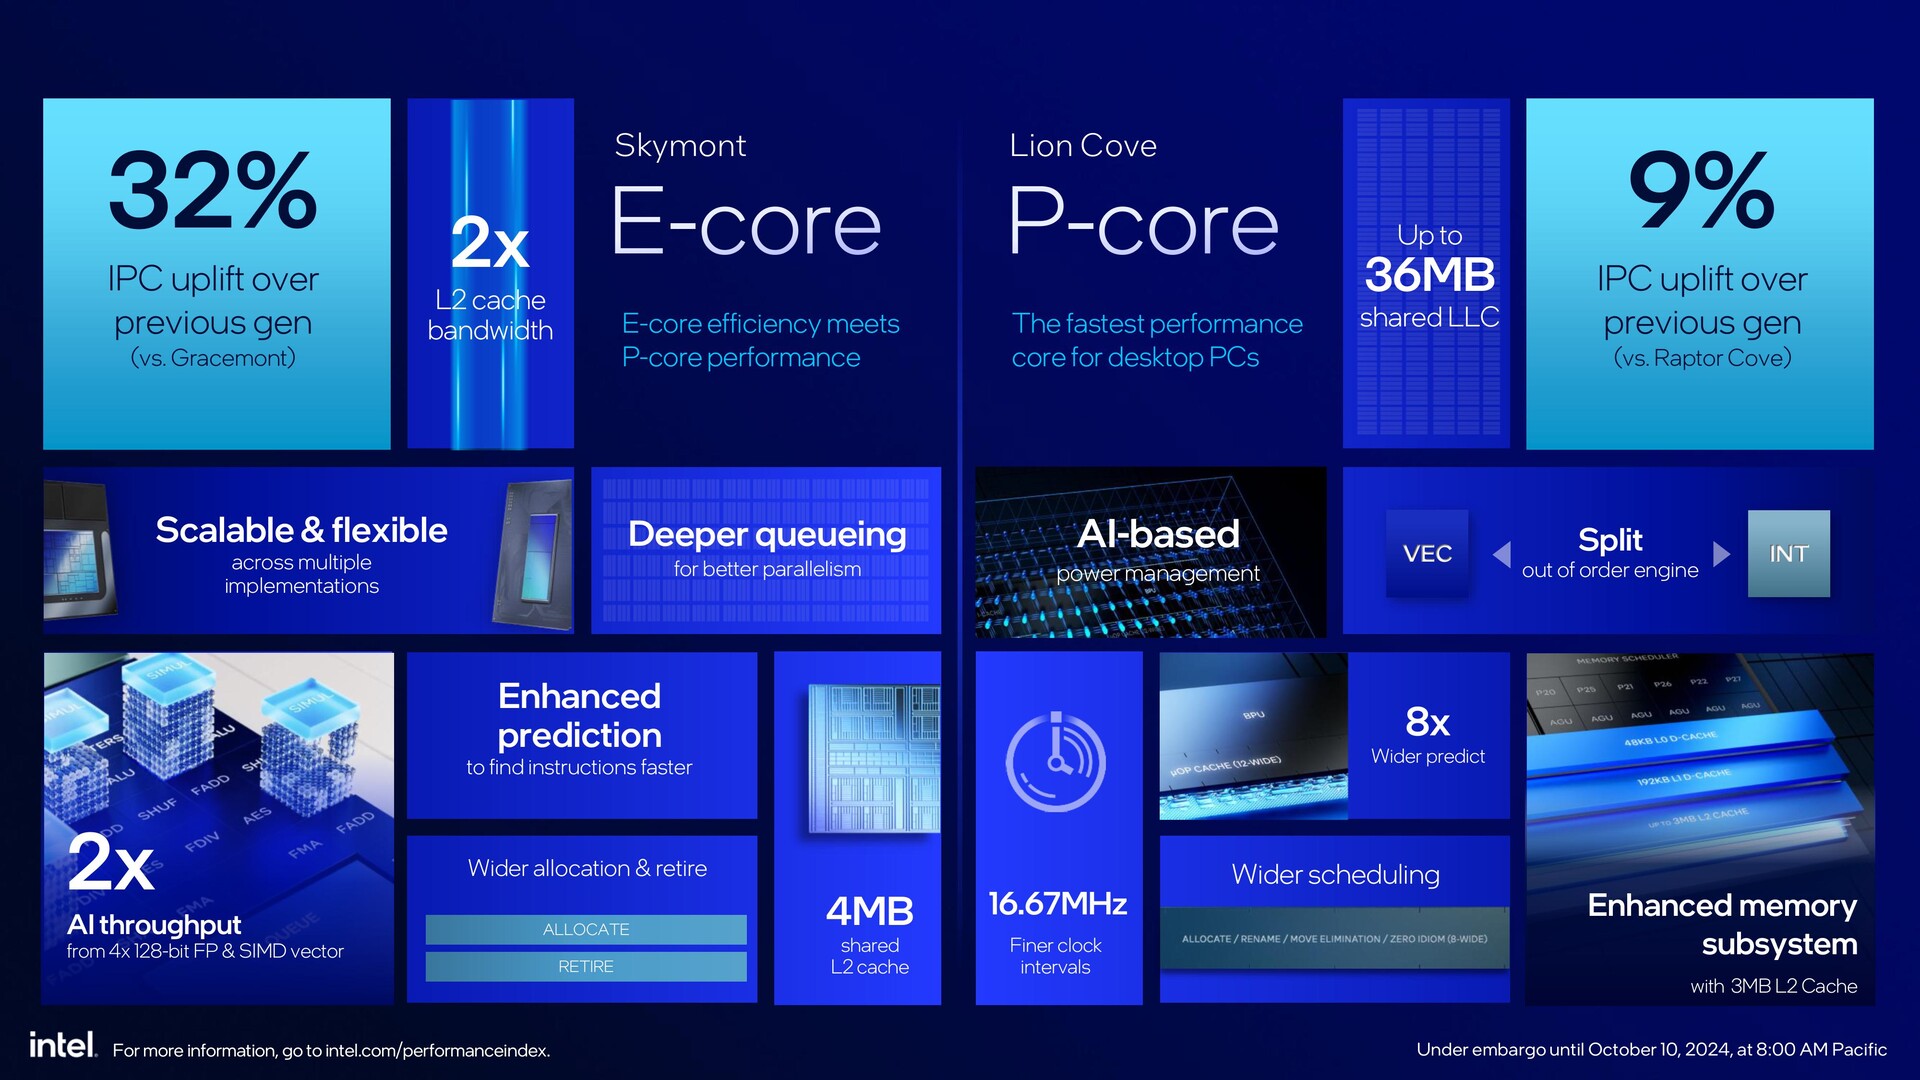
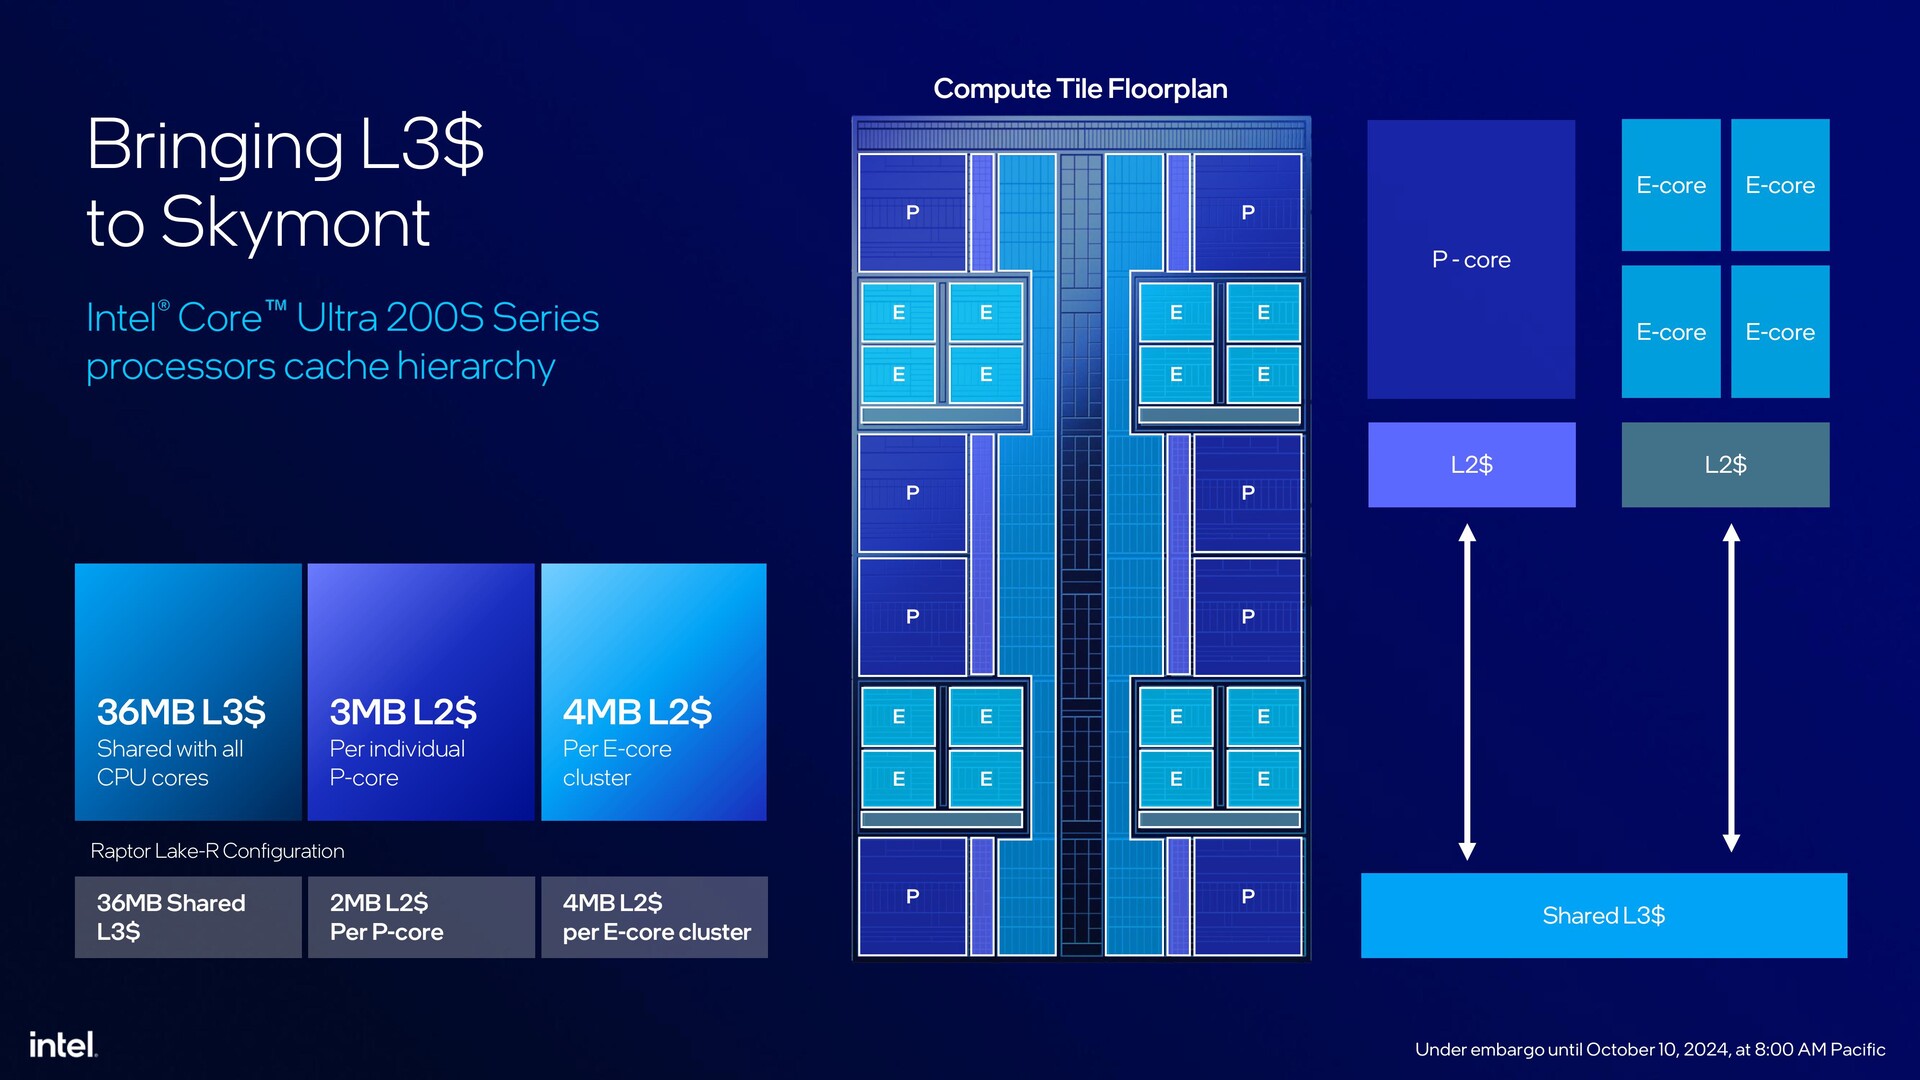
W tej generacji po raz pierwszy w komputerach stacjonarnych pojawi się opakowanie Intel Foveros 3D, wykorzystanie linii produkcyjnych TSMC 3 nm zamiast linii Intela, nowa płytka obliczeniowa ze zmienioną aranżacją rdzeni Lion Cove P i rdzeni Skymont E bez hiperwątkowości, większa pamięć podręczna L2 na rdzeniach P oraz pojawienie się iGPU Alchemist Xe i NPU - oba są ponownie wykorzystywane z Meteor Lake.
Opakowanie Foveros Arrow Lake-S zawiera łącznie sześć kafelków, z których cztery są oparte na węzłach TSMC. Obejmują one Compute (N3B), Xe-LPG Alchemist iGPU (N5P), SoC (N6), I/O (N6), kafelek wypełniający dla stabilności oraz kafelek Base (Intel 1227.1 22 nm FinFET).
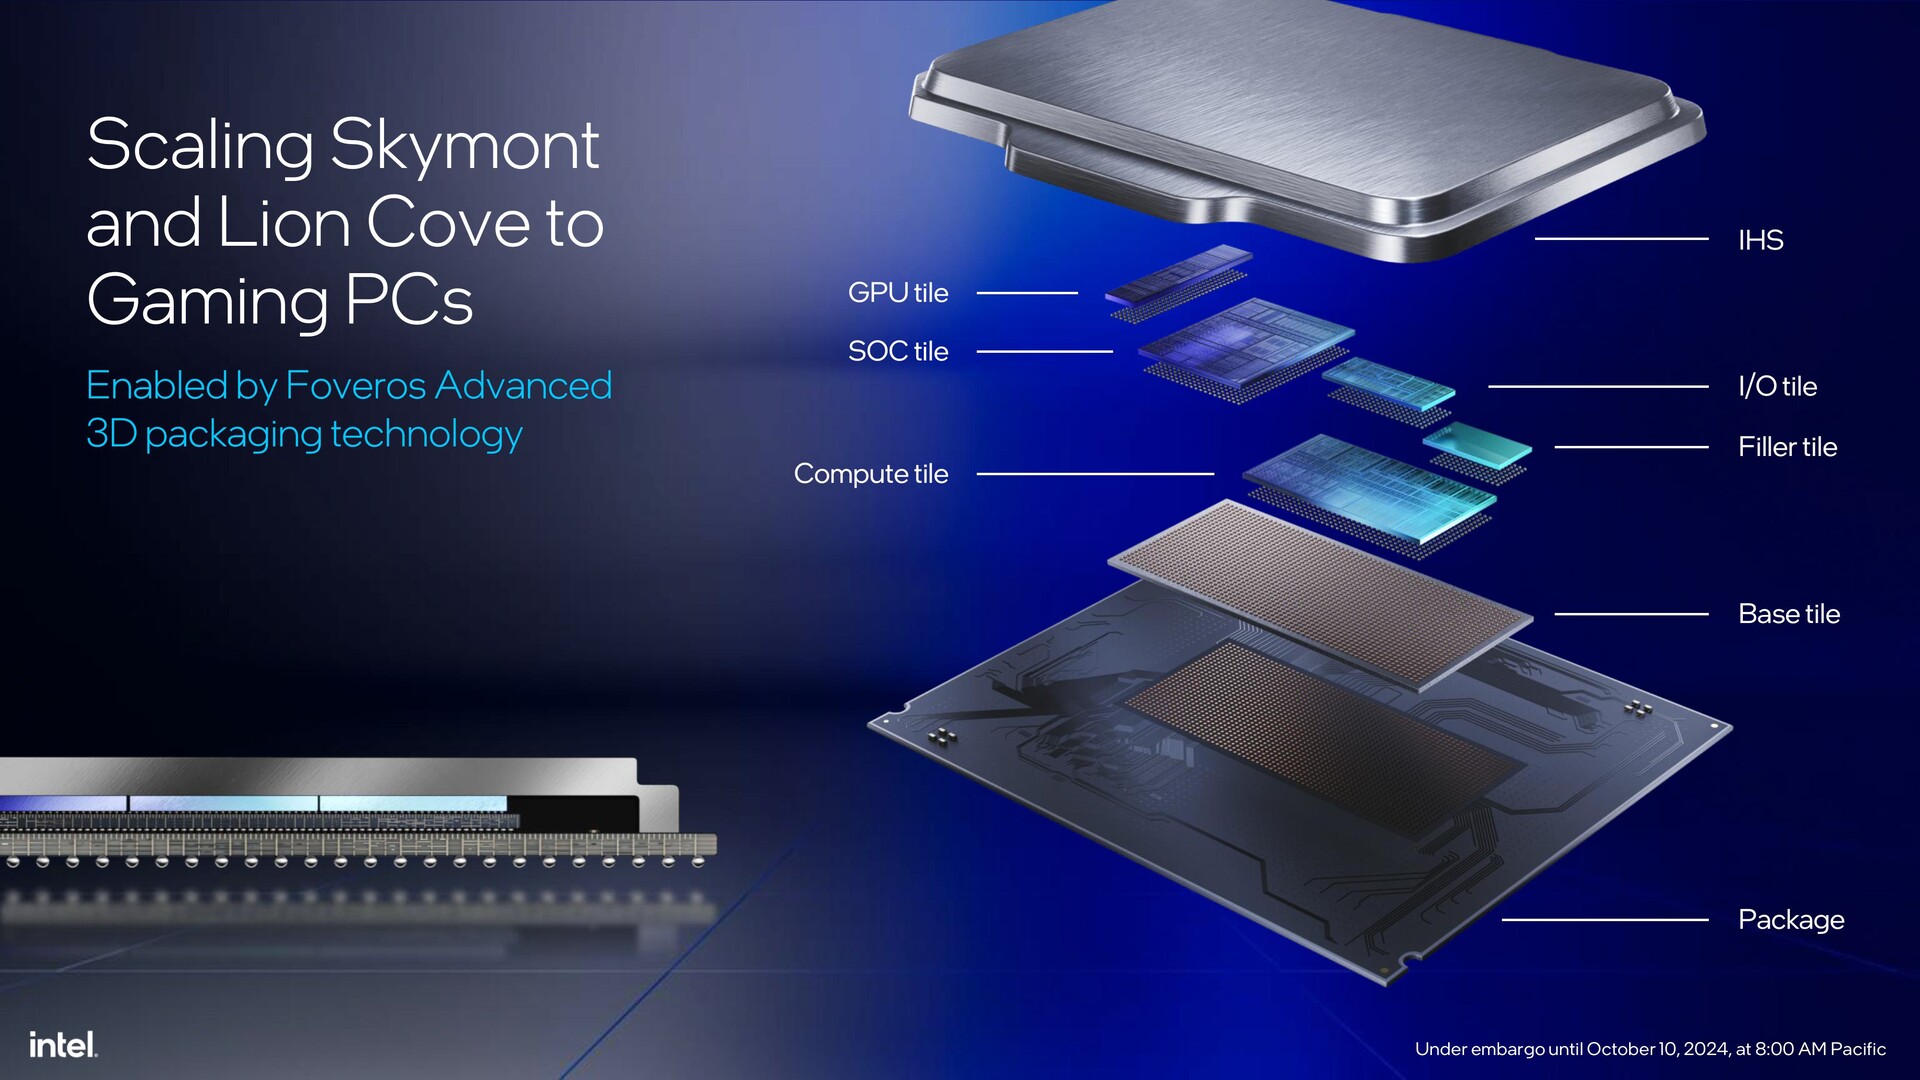
Posiadanie wszystkich tych komponentów w zestawie nieuchronnie wymaga nowych wymagań dotyczących zasilania, a tym samym nowego gniazda. Procesory Arrow Lake-S wymagają nowych płyt głównych z serii 800 wyposażonych w nowe gniazdo LGA 1851. Niestety, Intel wciąż milczy na temat tego, czy nadchodzące generacje procesorów będą wykorzystywać ten nowy układ pinów.
Wraz z tym pojawia się również konieczność pełnego przejścia na pamięci DDR5, jako że procesory te nie posiadają hybrydowego kontrolera pamięci obecnego w Raptor Lake-S i Alder Lake-S.
W niniejszej recenzji przyjrzymy się nowym procesorom Intel Core Ultra 9 285K i sprawdzimy, czy decyzje Intela dotyczące komputerów stacjonarnych mogą stanowić wystarczające wyzwanie dla najnowszej oferty AMD Ryzen 9000 i własnych układów Intela 14. generacji.
Przegląd procesorów Intel Core Ultra 200S z serii Arrow Lake-S do komputerów stacjonarnych
| SKU | Rdzenie / Wątki | Taktowanie P-Core / Turbo | Taktowanie E-Core / Turbo | Turbo Boost Max 3.0 | Total L2 Cache | L3 Cache | Zintegrowana grafika | NPU Peak TOPS | PBP (PL1) | MTP (PL2) | MSRP |
|---|---|---|---|---|---|---|---|---|---|---|---|
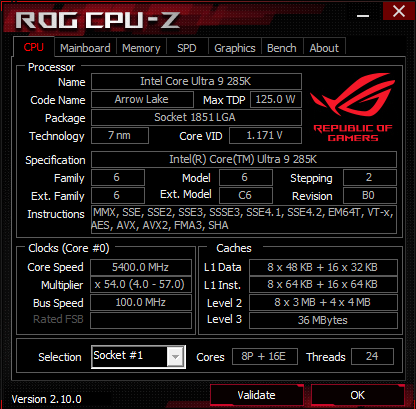
| Intel Core Ultra 9 285K | 24 (8P + 16E) /24 | 3,7 GHz / 5,5 GHz | 3,2 GHz / 4,6 GHz | 5,6 GHz | 40 MB | 36 MB | 4rdzenie Xe, 2,0 GHz | 13 TOPS | 125 W | 250 W | 589 USD |
| Intel Core Ultra 7 265K | 20 (8P + 12E) /20 | 3,9 GHz / 5,4 GHz | 3,3 GHz / 4,6 GHz | 5,6 GHz | 36 MB | 30 MB | 4 rdzenie Xe, 2,0 GHz | 13 TOPS | 125 W | 250 W | $394 |
| Intel Core Ultra 7 265KF | 20 (8P + 12E) /20 | 3,9 GHz / 5,4 GHz | 3,3 GHz / 4,6 GHz | 5,6 GHz | 36 MB | 30 MB | - | 13 TOPS | 125 W | 250 W | $379 |
| Intel Core Ultra 5 245K | 14 (6P + 8E) /14 | 3,9 GHz / 5,4 GHz | 4,2 GHz / 5,2 GHz | 5,2 GHz | 26 MB | 24 MB | 4 rdzenie Xe, 1,9 GHz | 13 TOPS | 125 W | 159 W | $309 |
| Intel Core Ultra 5 245KF | 14 (6P + 8E) /14 | 3,9 GHz / 5,4 GHz | 4,2 GHz / 5,2 GHz | 5,2 GHz | 26 MB | 24 MB | - | 13 TOPS | 125 W | 159 W | $294 |
Stanowisko testowe: GeForce RTX 4090 świetnie współgra z Core Ultra 9 285K
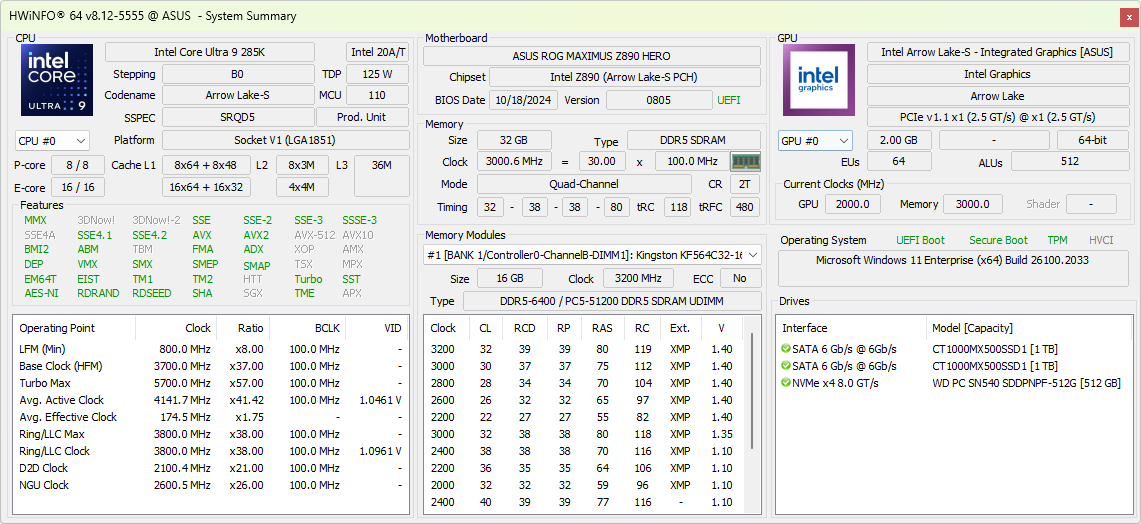
Do testów wykorzystaliśmy następujące podzespoły Core Ultra 9 285K:
- Cooler Master MasterFrame 700 open test bench
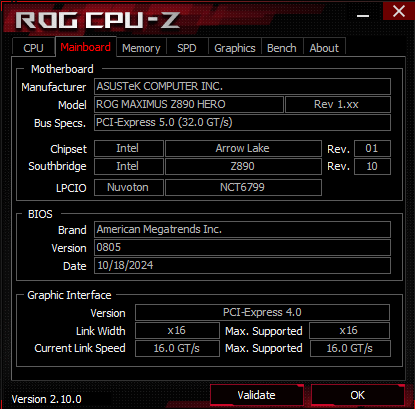
- Płyta główna Asus ROG Maximus Z890 Hero z BIOS-em w wersji 0805
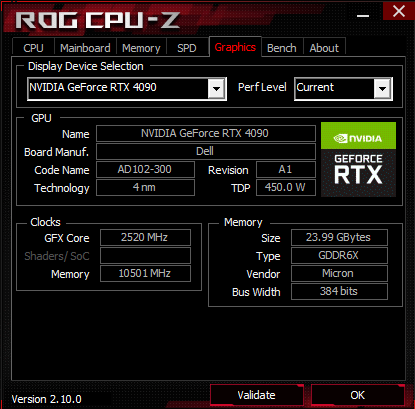
- Karta graficzna Nvidia GeForce RTX 4090 Founders Edition GPU
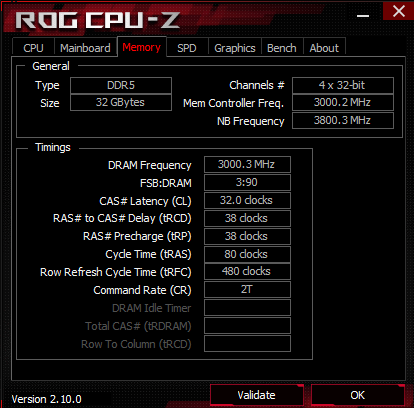
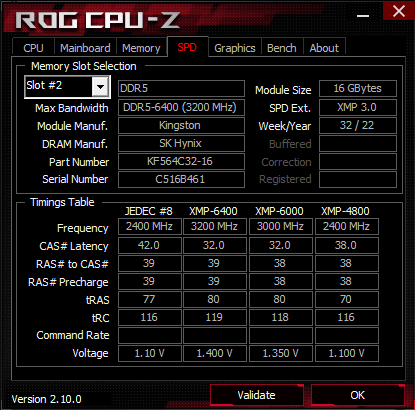
- 2x 16 GB pamięci RAM Kingston Fury Beast DDR5-6400 pracującej w trybie DDR5-6000 z timingami 32-38-38-80 przy napięciu 1,35 V
- Western Digital PC SN540 512 GB NVMe SSD i 2x Crucial MX500 1 TB SATA SSD dla systemu operacyjnego, testów porównawczych i gier
- Monitor Alienware AW3225QF 4K 240 Hz QD-OLED
- Thermaltake TH420 V2 Ultra EX ARGB Chłodnica AiO
- W pełni modularny zasilacz Cooler Master MVE Gold V2 1250 ATX 3.0
Chcielibyśmy podziękować firmie Intel za dostarczenie próbki testowej Core Ultra 9 285K, firmie Nvidia za kartę graficzną RTX 4090 Founders Edition, firmie Asus za płytę główną ROG Maximus Z890 Hero, firmie Dell za monitor AW3225QF, firmie Kingston za zestaw pamięci DDR5, firmie Thermaltake za chłodzenie TH420 V2 Ultra EX AIO oraz firmie Cooler Master za stanowisko testowe i zasilacz.
Wszystkie testy zostały przeprowadzone na świeżo zainstalowanym systemie Windows 11 24H2 (kompilacja 26100.2033) wraz z najnowszymi sterownikami platformy i sterownikiem Nvidia Game Ready Driver 566.03.
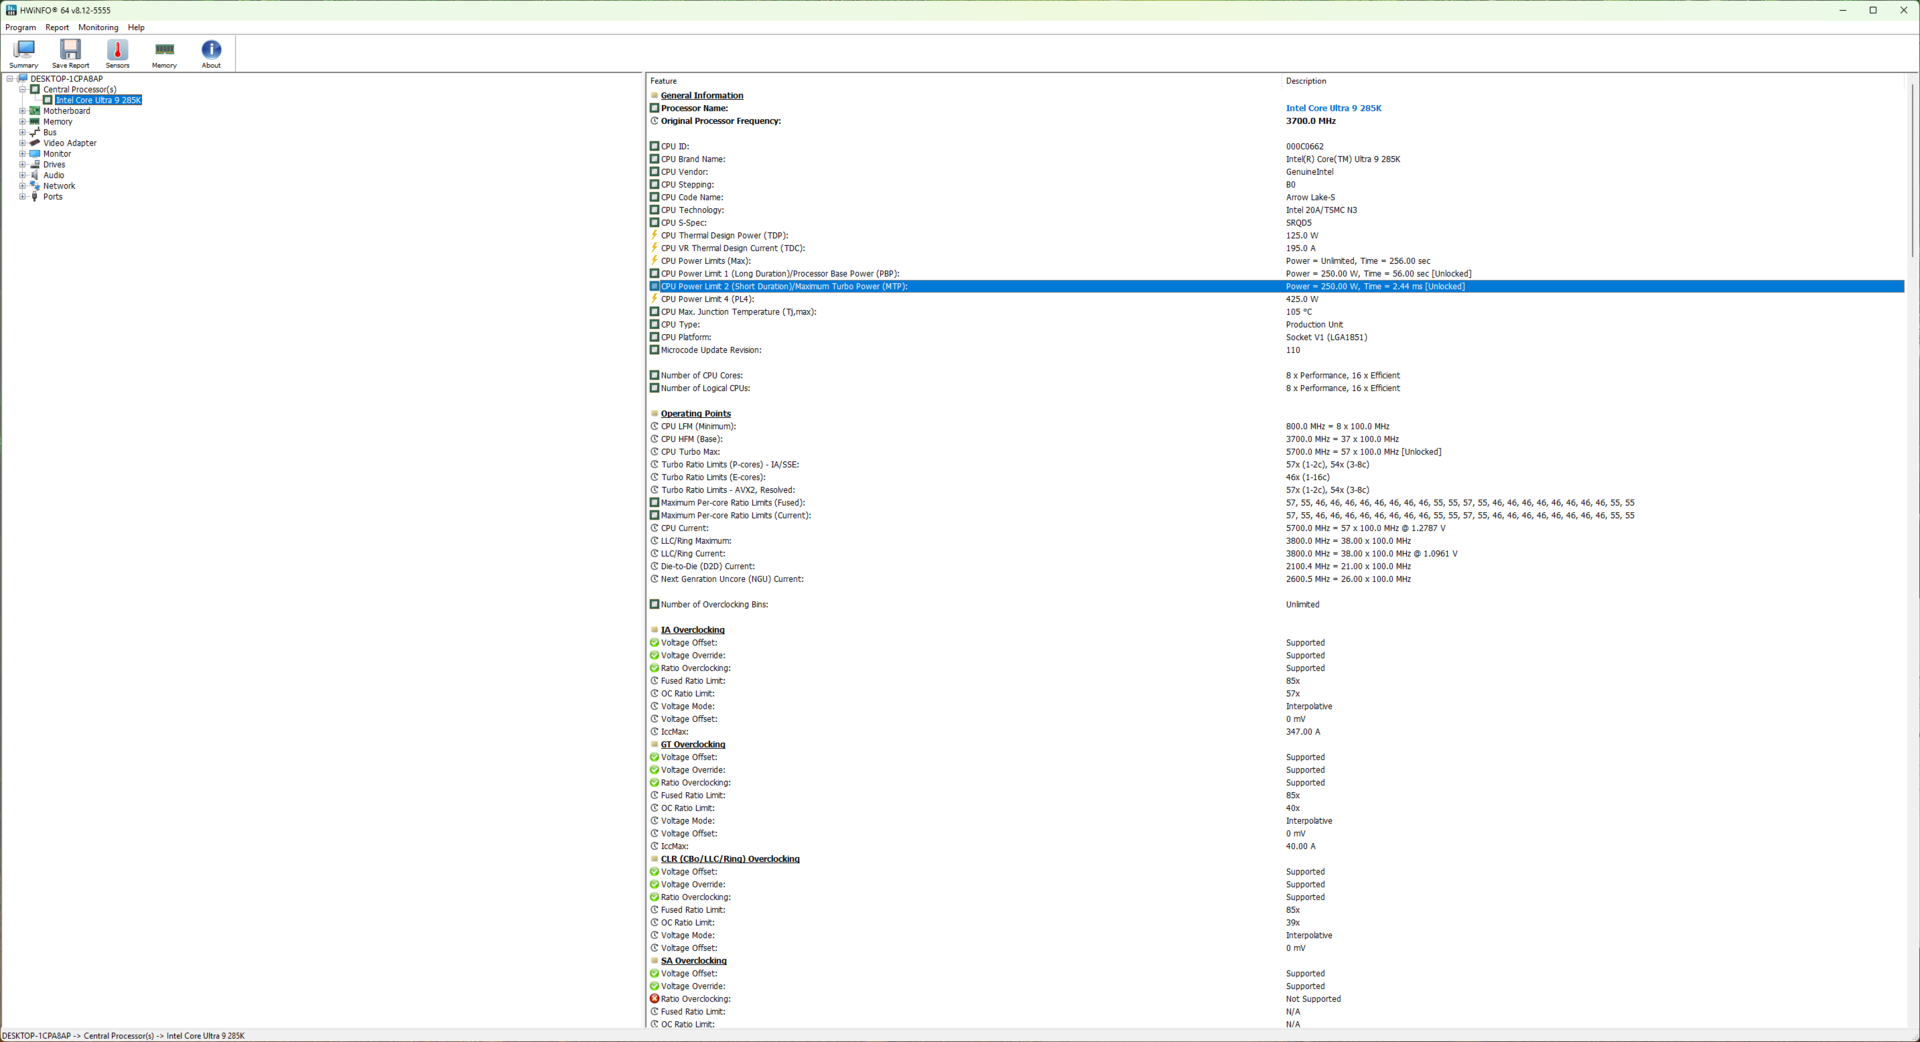
Użyliśmy domyślnych ustawień wydajności Intela w BIOS-ie i ustawiliśmy plan zasilania Windows na Ultimate Performance, który ustawia PL1=PL2=250 W.
Wydajność procesora: Ogólnie na równi z Core i9-14900K z niewielkim wzrostem w stosunku do Ryzen 9 9950X
W zbiorczych testach procesorów Core Ultra 9 285K wypada na równi z Core i9-14900K i tylko nieznacznie ustępuje AMD Ryzen 9 9950X. Wynika to w dużej mierze z faktu, że Core Ultra 9 285K wypada gorzej niż Ryzen 9 9950X w konkretnych testach, takich jak Blender 2.79 BMW27 CPU, testy V-Ray, wPrime 2.1 i benchmark R, choć różnice nie są aż tak znaczące.
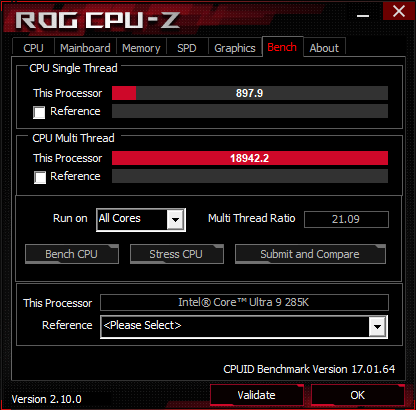
W testach jednordzeniowych Cinebench, Ultra 9 285K zdołał nieznacznie wyprzedzić Core i9-14900K, przy czym
Ryzen 9 9900X i Ryzen 9 9950X depczą mu po piętach. Sytuacja wygląda jednak inaczej w Geekbench, gdzie układy Zen 5 zdołały nieznacznie wygrać z Arrow Lake-S.Zyski w przypadku wielu rdzeni są bardziej namacalne, a Core Ultra 9 285K 24C/24T wykazuje 4-6% wzrost w stosunku do Ryzena 9 9950X 16C/32T w testach wielordzeniowych Cinebench, pomimo braku hiperwątkowości. Core Ultra 9 285K, Core i9-14900K i Ryzen 9 9950X osiągają porównywalne wyniki w wielordzeniowym Geekbench 6.3.
| CPU Performance Rating - Percent | |
| AMD Ryzen 9 9950X | |
| Intel Core i9-14900K -1! | |
| Intel Core Ultra 9 285K | |
| AMD Ryzen 9 7950X -2! | |
| Intel Core i9-13900K | |
| AMD Ryzen 9 7950X3D | |
| AMD Ryzen 9 9900X -9! | |
| Intel Core i7-14700K | |
| AMD Ryzen 9 7900X -2! | |
| AMD Ryzen 7 9700X | |
| Intel Core i5-14600K | |
| Intel Core Ultra 5 245K | |
| Intel Core i9-12900K -1! | |
| Intel Core i5-13600K -2! | |
| AMD Ryzen 5 9600X -2! | |
| AMD Ryzen 7 7800X3D -3! | |
| Intel Core i5-12600K -3! | |
| Cinebench R15 | |
| CPU Single 64Bit | |
| Intel Core Ultra 9 285K | |
| AMD Ryzen 9 9900X | |
| AMD Ryzen 7 9700X | |
| AMD Ryzen 9 9950X | |
| AMD Ryzen 5 9600X | |
| Intel Core i9-14900K | |
| AMD Ryzen 9 7950X | |
| Intel Core i9-13900K | |
| AMD Ryzen 9 7950X3D | |
| AMD Ryzen 9 7900X | |
| Intel Core Ultra 5 245K | |
| Intel Core i7-14700K | |
| Intel Core i5-14600K | |
| AMD Ryzen 7 7800X3D | |
| Intel Core i5-13600K | |
| Intel Core i9-12900K | |
| Intel Core i5-12600K | |
| CPU Multi 64Bit | |
| Intel Core Ultra 9 285K | |
| AMD Ryzen 9 9950X | |
| Intel Core i9-14900K | |
| AMD Ryzen 9 7950X | |
| Intel Core i9-13900K | |
| AMD Ryzen 9 7950X3D | |
| Intel Core i7-14700K | |
| AMD Ryzen 9 9900X | |
| AMD Ryzen 9 7900X | |
| Intel Core i9-12900K | |
| Intel Core Ultra 5 245K | |
| Intel Core i5-13600K | |
| Intel Core i5-14600K | |
| AMD Ryzen 7 9700X | |
| AMD Ryzen 7 7800X3D | |
| AMD Ryzen 5 9600X | |
| Intel Core i5-12600K | |
| Cinebench R20 | |
| CPU (Single Core) | |
| Intel Core Ultra 9 285K | |
| Intel Core i9-14900K | |
| AMD Ryzen 9 9900X | |
| AMD Ryzen 9 9950X | |
| AMD Ryzen 7 9700X | |
| AMD Ryzen 5 9600X | |
| Intel Core i7-14700K | |
| Intel Core i9-13900K | |
| Intel Core Ultra 5 245K | |
| AMD Ryzen 9 7950X | |
| AMD Ryzen 9 7950X3D | |
| Intel Core i5-14600K | |
| AMD Ryzen 9 7900X | |
| Intel Core i5-13600K | |
| Intel Core i9-12900K | |
| Intel Core i5-12600K | |
| AMD Ryzen 7 7800X3D | |
| CPU (Multi Core) | |
| Intel Core Ultra 9 285K | |
| AMD Ryzen 9 9950X | |
| Intel Core i9-14900K | |
| Intel Core i9-13900K | |
| AMD Ryzen 9 7950X | |
| AMD Ryzen 9 7950X3D | |
| Intel Core i7-14700K | |
| AMD Ryzen 9 9900X | |
| AMD Ryzen 9 7900X | |
| Intel Core i9-12900K | |
| Intel Core Ultra 5 245K | |
| Intel Core i5-14600K | |
| Intel Core i5-13600K | |
| AMD Ryzen 7 9700X | |
| AMD Ryzen 7 7800X3D | |
| AMD Ryzen 5 9600X | |
| Intel Core i5-12600K | |
| Cinebench R23 | |
| Single Core | |
| Intel Core Ultra 9 285K | |
| Intel Core i9-14900K | |
| Intel Core i9-13900K | |
| AMD Ryzen 9 9900X | |
| AMD Ryzen 7 9700X | |
| AMD Ryzen 9 9950X | |
| AMD Ryzen 5 9600X | |
| Intel Core i7-14700K | |
| Intel Core Ultra 5 245K | |
| Intel Core i5-14600K | |
| AMD Ryzen 9 7950X3D | |
| AMD Ryzen 9 7950X | |
| AMD Ryzen 9 7900X | |
| Intel Core i5-13600K | |
| Intel Core i9-12900K | |
| Intel Core i5-12600K | |
| AMD Ryzen 7 7800X3D | |
| Multi Core | |
| Intel Core Ultra 9 285K | |
| Intel Core i9-14900K | |
| AMD Ryzen 9 9950X | |
| Intel Core i9-13900K | |
| AMD Ryzen 9 7950X | |
| AMD Ryzen 9 7950X3D | |
| Intel Core i7-14700K | |
| AMD Ryzen 9 9900X | |
| AMD Ryzen 9 7900X | |
| Intel Core i9-12900K | |
| Intel Core Ultra 5 245K | |
| Intel Core i5-14600K | |
| Intel Core i5-13600K | |
| AMD Ryzen 7 9700X | |
| AMD Ryzen 7 7800X3D | |
| Intel Core i5-12600K | |
| AMD Ryzen 5 9600X | |
| Blender - v2.79 BMW27 CPU | |
| Intel Core i5-12600K | |
| AMD Ryzen 5 9600X | |
| AMD Ryzen 7 7800X3D | |
| AMD Ryzen 7 9700X | |
| Intel Core Ultra 5 245K | |
| Intel Core i5-13600K | |
| Intel Core i5-14600K | |
| Intel Core i9-12900K | |
| AMD Ryzen 9 7900X | |
| AMD Ryzen 9 9900X | |
| Intel Core i7-14700K | |
| AMD Ryzen 9 7950X3D | |
| AMD Ryzen 9 7950X | |
| Intel Core i9-13900K | |
| Intel Core i9-14900K | |
| Intel Core Ultra 9 285K | |
| AMD Ryzen 9 9950X | |
| HWBOT x265 Benchmark v2.2 - 4k Preset | |
| Intel Core Ultra 9 285K | |
| AMD Ryzen 9 9950X | |
| AMD Ryzen 9 7950X | |
| Intel Core i9-14900K | |
| Intel Core i9-13900K | |
| AMD Ryzen 9 7950X3D | |
| AMD Ryzen 9 9900X | |
| Intel Core i7-14700K | |
| AMD Ryzen 9 7900X | |
| Intel Core i5-12600K | |
| Intel Core i9-12900K | |
| Intel Core Ultra 5 245K | |
| Intel Core i5-14600K | |
| Intel Core i5-13600K | |
| AMD Ryzen 7 9700X | |
| AMD Ryzen 7 7800X3D | |
| AMD Ryzen 5 9600X | |
| WinRAR - Result | |
| AMD Ryzen 9 7900X | |
| AMD Ryzen 7 7800X3D | |
| AMD Ryzen 9 7950X | |
| Intel Core i9-14900K | |
| AMD Ryzen 9 7950X3D | |
| Intel Core i9-13900K | |
| AMD Ryzen 5 9600X | |
| AMD Ryzen 9 9950X | |
| AMD Ryzen 7 9700X | |
| Intel Core Ultra 9 285K | |
| Intel Core i7-14700K | |
| Intel Core i5-14600K | |
| Intel Core i5-13600K | |
| Intel Core i9-12900K | |
| Intel Core Ultra 5 245K | |
| Intel Core i5-12600K | |
| TrueCrypt | |
| AES Mean 100MB | |
| AMD Ryzen 9 9950X | |
| AMD Ryzen 9 7950X | |
| Intel Core i9-13900K | |
| AMD Ryzen 9 7950X3D | |
| Intel Core i9-14900K | |
| Intel Core i7-14700K | |
| Intel Core i5-14600K | |
| Intel Core i5-13600K | |
| Intel Core i9-12900K | |
| Intel Core Ultra 9 285K | |
| Intel Core Ultra 5 245K | |
| AMD Ryzen 7 9700X | |
| AMD Ryzen 7 7800X3D | |
| AMD Ryzen 9 7900X | |
| AMD Ryzen 5 9600X | |
| Intel Core i5-12600K | |
| Twofish Mean 100MB | |
| Intel Core i9-14900K | |
| AMD Ryzen 9 9950X | |
| Intel Core i9-13900K | |
| Intel Core Ultra 9 285K | |
| Intel Core i7-14700K | |
| AMD Ryzen 9 7950X | |
| AMD Ryzen 9 7950X3D | |
| Intel Core i9-12900K | |
| Intel Core i5-14600K | |
| Intel Core i5-13600K | |
| Intel Core Ultra 5 245K | |
| AMD Ryzen 9 7900X | |
| AMD Ryzen 7 9700X | |
| Intel Core i5-12600K | |
| AMD Ryzen 5 9600X | |
| AMD Ryzen 7 7800X3D | |
| Serpent Mean 100MB | |
| AMD Ryzen 9 9950X | |
| Intel Core i9-13900K | |
| AMD Ryzen 9 7950X | |
| AMD Ryzen 9 7950X3D | |
| Intel Core i9-14900K | |
| Intel Core i7-14700K | |
| Intel Core Ultra 9 285K | |
| Intel Core i9-12900K | |
| Intel Core i5-14600K | |
| Intel Core i5-13600K | |
| AMD Ryzen 7 9700X | |
| AMD Ryzen 9 7900X | |
| Intel Core Ultra 5 245K | |
| AMD Ryzen 5 9600X | |
| Intel Core i5-12600K | |
| AMD Ryzen 7 7800X3D | |
| Geekbench 5.5 | |
| Single-Core | |
| AMD Ryzen 9 9950X | |
| AMD Ryzen 9 9900X | |
| AMD Ryzen 5 9600X | |
| AMD Ryzen 7 9700X | |
| Intel Core Ultra 9 285K | |
| AMD Ryzen 9 7950X | |
| AMD Ryzen 9 7950X3D | |
| Intel Core i9-13900K | |
| AMD Ryzen 9 7900X | |
| Intel Core i9-14900K | |
| Intel Core Ultra 5 245K | |
| Intel Core i7-14700K | |
| Intel Core i9-12900K | |
| AMD Ryzen 7 7800X3D | |
| Intel Core i5-14600K | |
| Intel Core i5-13600K | |
| Intel Core i5-12600K | |
| Multi-Core | |
| Intel Core Ultra 9 285K | |
| Intel Core i9-14900K | |
| AMD Ryzen 9 7950X | |
| AMD Ryzen 9 7950X3D | |
| Intel Core i9-13900K | |
| AMD Ryzen 9 9950X | |
| Intel Core i7-14700K | |
| AMD Ryzen 9 9900X | |
| AMD Ryzen 9 7900X | |
| Intel Core i9-12900K | |
| Intel Core Ultra 5 245K | |
| Intel Core i5-14600K | |
| Intel Core i5-13600K | |
| AMD Ryzen 7 9700X | |
| AMD Ryzen 7 7800X3D | |
| Intel Core i5-12600K | |
| AMD Ryzen 5 9600X | |
| Geekbench 6.4 | |
| Single-Core | |
| AMD Ryzen 9 9900X | |
| AMD Ryzen 9 9950X | |
| AMD Ryzen 7 9700X | |
| Intel Core Ultra 9 285K | |
| Intel Core i9-14900K | |
| Intel Core i9-13900K | |
| Intel Core Ultra 5 245K | |
| AMD Ryzen 9 7950X3D | |
| Intel Core i7-14700K | |
| Intel Core i5-14600K | |
| Intel Core i9-12900K | |
| Multi-Core | |
| Intel Core Ultra 9 285K | |
| Intel Core i9-14900K | |
| AMD Ryzen 9 9950X | |
| Intel Core i9-13900K | |
| AMD Ryzen 9 9900X | |
| AMD Ryzen 9 7950X3D | |
| Intel Core i7-14700K | |
| Intel Core Ultra 5 245K | |
| Intel Core i9-12900K | |
| Intel Core i5-14600K | |
| AMD Ryzen 7 9700X | |
| 7-Zip 18.03 | |
| 7z b 4 | |
| AMD Ryzen 9 7950X | |
| AMD Ryzen 9 9950X | |
| AMD Ryzen 9 7950X3D | |
| Intel Core i9-14900K | |
| Intel Core i9-13900K | |
| Intel Core i7-14700K | |
| Intel Core Ultra 9 285K | |
| AMD Ryzen 9 7900X | |
| AMD Ryzen 9 9900X | |
| Intel Core i9-12900K | |
| Intel Core i5-14600K | |
| Intel Core i5-13600K | |
| AMD Ryzen 7 7800X3D | |
| AMD Ryzen 7 9700X | |
| Intel Core Ultra 5 245K | |
| AMD Ryzen 5 9600X | |
| Intel Core i5-12600K | |
| 7z b 4 -mmt1 | |
| AMD Ryzen 9 7950X | |
| AMD Ryzen 9 7950X3D | |
| AMD Ryzen 9 7900X | |
| AMD Ryzen 7 7800X3D | |
| AMD Ryzen 9 9900X | |
| AMD Ryzen 7 9700X | |
| AMD Ryzen 9 9950X | |
| AMD Ryzen 5 9600X | |
| Intel Core i9-14900K | |
| Intel Core Ultra 9 285K | |
| Intel Core i7-14700K | |
| Intel Core i9-13900K | |
| Intel Core i5-14600K | |
| Intel Core i9-12900K | |
| Intel Core i5-13600K | |
| Intel Core Ultra 5 245K | |
| Intel Core i5-12600K | |
| R Benchmark 2.5 - Overall mean | |
| Intel Core i5-12600K | |
| Intel Core i9-12900K | |
| AMD Ryzen 7 7800X3D | |
| Intel Core Ultra 5 245K | |
| Intel Core Ultra 5 245K | |
| Intel Core i5-13600K | |
| Intel Core i5-14600K | |
| Intel Core i7-14700K | |
| Intel Core Ultra 9 285K | |
| AMD Ryzen 9 7900X | |
| AMD Ryzen 9 7950X3D | |
| AMD Ryzen 9 7950X | |
| Intel Core i9-13900K | |
| Intel Core i9-14900K | |
| AMD Ryzen 7 9700X | |
| AMD Ryzen 5 9600X | |
| AMD Ryzen 9 9900X | |
| AMD Ryzen 9 9950X | |
| LibreOffice - 20 Documents To PDF | |
| Intel Core i5-12600K | |
| AMD Ryzen 5 9600X | |
| AMD Ryzen 9 9950X | |
| AMD Ryzen 9 9900X | |
| AMD Ryzen 7 9700X | |
| Intel Core Ultra 5 245K | |
| Intel Core Ultra 5 245K | |
| AMD Ryzen 7 7800X3D | |
| Intel Core i9-12900K | |
| Intel Core i7-14700K | |
| AMD Ryzen 9 7950X3D | |
| Intel Core Ultra 9 285K | |
| Intel Core i9-13900K | |
| AMD Ryzen 9 7950X | |
| Intel Core i5-13600K | |
| AMD Ryzen 9 7900X | |
| Intel Core i9-14900K | |
| Intel Core i5-14600K | |
| WebXPRT 3 - Overall | |
| AMD Ryzen 9 9950X | |
| AMD Ryzen 7 9700X | |
| AMD Ryzen 9 9900X | |
| Intel Core Ultra 9 285K | |
| AMD Ryzen 9 7950X3D | |
| Intel Core i9-14900K | |
| AMD Ryzen 9 7900X | |
| AMD Ryzen 9 7950X | |
| AMD Ryzen 5 9600X | |
| Intel Core i9-13900K | |
| Intel Core i5-14600K | |
| AMD Ryzen 7 7800X3D | |
| Intel Core Ultra 5 245K | |
| Intel Core i7-14700K | |
| Intel Core i5-13600K | |
| Intel Core i9-12900K | |
| Intel Core i5-12600K | |
| Mozilla Kraken 1.1 - Total | |
| Intel Core i5-12600K | |
| AMD Ryzen 7 7800X3D | |
| Intel Core i9-12900K | |
| Intel Core i5-13600K | |
| Intel Core i5-14600K | |
| Intel Core i7-14700K | |
| AMD Ryzen 9 7950X3D | |
| AMD Ryzen 9 7950X | |
| Intel Core i9-13900K | |
| AMD Ryzen 9 7900X | |
| Intel Core Ultra 5 245K | |
| Intel Core i9-14900K | |
| Intel Core Ultra 9 285K | |
| AMD Ryzen 5 9600X | |
| AMD Ryzen 7 9700X | |
| AMD Ryzen 9 9900X | |
| AMD Ryzen 9 9950X | |
| V-Ray Benchmark Next 4.10 - CPU | |
| AMD Ryzen 9 9950X | |
| Intel Core Ultra 9 285K | |
| AMD Ryzen 9 7950X | |
| AMD Ryzen 9 7950X3D | |
| Intel Core i9-14900K | |
| Intel Core i9-13900K | |
| AMD Ryzen 9 9900X | |
| Intel Core i7-14700K | |
| AMD Ryzen 9 7900X | |
| Intel Core i9-12900K | |
| Intel Core Ultra 5 245K | |
| Intel Core i5-14600K | |
| Intel Core i5-13600K | |
| AMD Ryzen 7 9700X | |
| AMD Ryzen 5 9600X | |
| Intel Core i5-12600K | |
| V-Ray 5 Benchmark - CPU | |
| AMD Ryzen 9 9950X | |
| Intel Core Ultra 9 285K | |
| AMD Ryzen 9 7950X | |
| AMD Ryzen 9 7950X3D | |
| Intel Core i9-13900K | |
| Intel Core i9-14900K | |
| Intel Core i7-14700K | |
| AMD Ryzen 9 7900X | |
| Intel Core i9-12900K | |
| Intel Core Ultra 5 245K | |
| Intel Core i5-14600K | |
| Intel Core i5-13600K | |
| AMD Ryzen 7 9700X | |
| AMD Ryzen 7 7800X3D | |
| AMD Ryzen 5 9600X | |
| Intel Core i5-12600K | |
| wPrime 2.10 | |
| 32m | |
| Intel Core i9-12900K | |
| Intel Core i5-12600K | |
| Intel Core Ultra 5 245K | |
| AMD Ryzen 5 9600X | |
| Intel Core i5-13600K | |
| AMD Ryzen 7 7800X3D | |
| Intel Core i5-14600K | |
| AMD Ryzen 7 9700X | |
| Intel Core i7-14700K | |
| Intel Core Ultra 9 285K | |
| AMD Ryzen 9 9950X | |
| Intel Core i9-14900K | |
| AMD Ryzen 9 7950X3D | |
| Intel Core i9-13900K | |
| AMD Ryzen 9 7900X | |
| AMD Ryzen 9 7950X | |
| 1024m | |
| Intel Core i5-12600K | |
| Intel Core i9-12900K | |
| Intel Core i5-13600K | |
| Intel Core i5-14600K | |
| Intel Core i7-14700K | |
| Intel Core i9-13900K | |
| Intel Core Ultra 5 245K | |
| Intel Core i9-14900K | |
| AMD Ryzen 5 9600X | |
| AMD Ryzen 7 7800X3D | |
| AMD Ryzen 7 9700X | |
| Intel Core Ultra 9 285K | |
| AMD Ryzen 9 7900X | |
| AMD Ryzen 9 7950X3D | |
| AMD Ryzen 9 7950X | |
| AMD Ryzen 9 9950X | |
| Super Pi mod 1.5 XS 1M - 1M | |
| AMD Ryzen 5 9600X | |
| AMD Ryzen 7 9700X | |
| Intel Core i5-12600K | |
| AMD Ryzen 9 9950X | |
| Intel Core Ultra 5 245K | |
| AMD Ryzen 7 7800X3D | |
| Intel Core i9-12900K | |
| Intel Core Ultra 9 285K | |
| Intel Core i5-13600K | |
| Intel Core i5-14600K | |
| AMD Ryzen 9 7900X | |
| AMD Ryzen 9 7950X3D | |
| AMD Ryzen 9 7950X | |
| Intel Core i7-14700K | |
| Intel Core i9-13900K | |
| Intel Core i9-14900K | |
| Super Pi mod 1.5 XS 2M - 2M | |
| Intel Core i5-12600K | |
| AMD Ryzen 5 9600X | |
| AMD Ryzen 7 9700X | |
| Intel Core Ultra 5 245K | |
| AMD Ryzen 9 9950X | |
| Intel Core i9-12900K | |
| AMD Ryzen 7 7800X3D | |
| Intel Core Ultra 9 285K | |
| Intel Core i5-13600K | |
| Intel Core i5-14600K | |
| AMD Ryzen 9 7950X | |
| AMD Ryzen 9 7900X | |
| Intel Core i9-13900K | |
| AMD Ryzen 9 7950X3D | |
| Intel Core i7-14700K | |
| Intel Core i9-14900K | |
* ... im mniej tym lepiej
Cinebench R15 Multi Loop
Podobnie jak jego poprzednicy, Core Ultra 9 285K nie jest dostarczany z coolerem CPU w pudełku. Intel twierdzi, że coolery zaprojektowane dla LGA 1700 powinny być kompatybilne z LGA 1851. Nie mieliśmy żadnych problemów z montażem naszego coolera all-in-one Thermaltake TH420 V2 Ultra EX ARGB przy użyciu tych samych wsporników montażowych przeznaczonych dla gniazda LGA 1700.
Biorąc to pod uwagę, proszę spodziewać się nowych coolerów przeznaczonych dla LGA 1851, które uwzględniają obecność płytki Compute w południowo-zachodniej części obudowy. Chłodnice zaprojektowane dla Arrow Lake-S mogą oferować nieco lepszą wydajność chłodzenia, ale istniejące rozwiązanie LGA 1700 będzie działać dobrze.
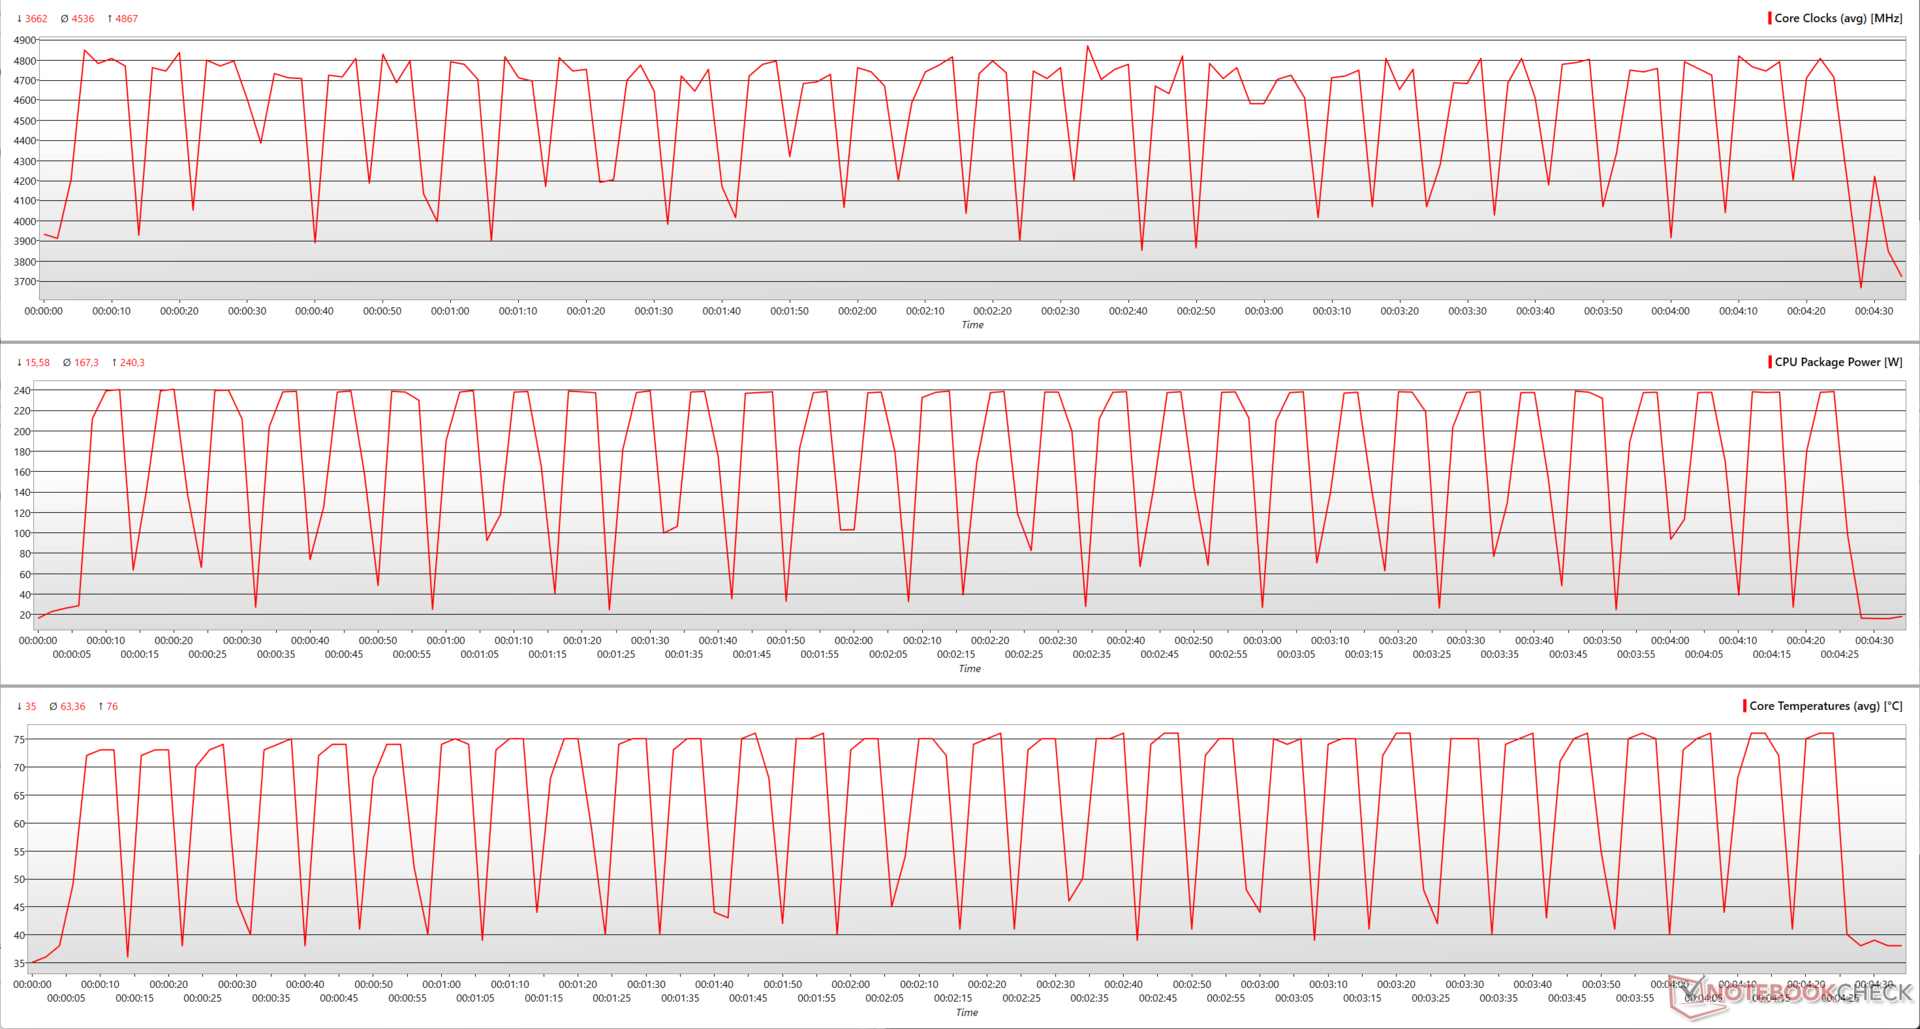
Zdolność TH420 V2 Ultra EX do wydajnego chłodzenia Core Ultra 9 285K jest widoczna po stałej wydajności w poniższej pętli wielordzeniowej Cinebench R15.
Widzimy, że Core Ultra 9 285K może przyspieszyć do 4,86 GHz podczas wielordzeniowej pętli Cinebench R15, przy średnich zegarach na poziomie 4,53 GHz.
Wydajność ta została osiągnięta przy poborze mocy na poziomie 240 W i maksymalnej temperaturze rdzenia wynoszącej 76 °C, które są znacznie niższe niż w przypadku Core i9-14900K z odczytami 349 W i 87 °C. W rzeczywistości nawet Core i7-14700K wykazuje wyższe wartości z mocą pakietu 313 W i temperaturą rdzenia 92 °C.
Średnio, Core Ultra 9 285K utrzymuje moc pakietu na poziomie 167 W i temperaturę rdzenia 63 °C, które są niższe niż odpowiednie wartości Core i7-14700K wynoszące 195 W i 76 °C.
Wydajność systemu: W tej samej lidze co Core i9-14900K i AMD Zen 5
Ogólna wydajność systemu Core Ultra 9 285K jest porównywalna z Core i9-14900K i Ryzen 9 9950X i nie różni się zbytnio od tego, co widzimy w przypadku Ryzen 9 7950X, Core i9-13900Ki Ryzen 9 9900X.
Poszczególne benchmarki pokazują jednak nieco lepsze wyniki Core i9-14900K w 3DMark Time Spy CPU, 3DMark 11 Performance Physics i CrossMark. PCMark 10 ogólnie stawia Core Ultra 9 285K nieco przed Core i9-14900K, ale głównie na równi z AMD Zen 5.
Procesory AMD mają szczególną przewagę w testach CPU AIDA64, z wyjątkiem CPU PhotoWorxx, gdzie Core Ultra 9 285K osiąga zauważalną przewagę.
Niemniej jednak, regularne zadania związane z produktywnością nie napotykają żadnych problemów w codziennym użytkowaniu.
3DMark 11: 1280x720 Performance Physics
3DMark: 1920x1080 Fire Strike Physics | 2560x1440 Time Spy CPU
CrossMark: Overall | Responsiveness | Creativity | Productivity
PCMark 10: Score | Essentials | Productivity | Digital Content Creation
AIDA64: FP32 Ray-Trace | FPU Julia | CPU SHA3 | CPU Queen | FPU SinJulia | FPU Mandel | CPU AES | CPU ZLib | FP64 Ray-Trace | CPU PhotoWorxx
| System Performance Rating | |
| AMD Ryzen 9 9950X | |
| Intel Core i9-14900K | |
| Intel Core Ultra 9 285K | |
| AMD Ryzen 9 7950X | |
| AMD Ryzen 9 9900X | |
| Intel Core i9-13900K | |
| AMD Ryzen 9 7950X3D -2! | |
| Intel Core i7-14700K | |
| AMD Ryzen 9 7900X | |
| AMD Ryzen 7 9700X | |
| Intel Core i5-14600K | |
| AMD Ryzen 7 7800X3D | |
| Intel Core i5-13600K | |
| AMD Ryzen 5 9600X | |
| Intel Core Ultra 5 245K | |
| Intel Core i9-12900K -4! | |
| Intel Core i5-12600K -4! | |
| 3DMark 11 / Performance Physics | |
| AMD Ryzen 9 9950X | |
| AMD Ryzen 9 7950X3D | |
| AMD Ryzen 7 7800X3D | |
| Intel Core i7-14700K | |
| Intel Core i9-13900K | |
| Intel Core i9-14900K | |
| Intel Core i5-14600K | |
| Intel Core Ultra 9 285K | |
| AMD Ryzen 7 9700X | |
| Intel Core i5-13600K | |
| AMD Ryzen 9 9900X | |
| AMD Ryzen 9 7900X | |
| AMD Ryzen 9 7950X | |
| Intel Core i9-12900K | |
| Intel Core Ultra 5 245K | |
| AMD Ryzen 5 9600X | |
| Intel Core i5-12600K | |
| 3DMark / Fire Strike Physics | |
| Intel Core i9-14900K | |
| Intel Core i9-13900K | |
| Intel Core Ultra 9 285K | |
| AMD Ryzen 9 9950X | |
| Intel Core i7-14700K | |
| AMD Ryzen 9 7950X3D | |
| AMD Ryzen 9 9900X | |
| AMD Ryzen 9 7900X | |
| AMD Ryzen 9 7950X | |
| Intel Core i5-14600K | |
| Intel Core i9-12900K | |
| Intel Core Ultra 5 245K | |
| AMD Ryzen 7 9700X | |
| Intel Core i5-13600K | |
| AMD Ryzen 5 9600X | |
| AMD Ryzen 7 7800X3D | |
| Intel Core i5-12600K | |
| 3DMark / Time Spy CPU | |
| Intel Core i9-14900K | |
| Intel Core i7-14700K | |
| Intel Core i9-13900K | |
| Intel Core i5-14600K | |
| Intel Core i9-12900K | |
| Intel Core Ultra 9 285K | |
| AMD Ryzen 9 7950X3D | |
| Intel Core i5-13600K | |
| AMD Ryzen 9 7900X | |
| AMD Ryzen 9 7950X | |
| AMD Ryzen 9 9950X | |
| AMD Ryzen 9 9900X | |
| Intel Core Ultra 5 245K | |
| AMD Ryzen 7 9700X | |
| AMD Ryzen 7 7800X3D | |
| Intel Core i5-12600K | |
| AMD Ryzen 5 9600X | |
| PCMark 10 / Score | |
| AMD Ryzen 7 9700X | |
| AMD Ryzen 9 9950X | |
| AMD Ryzen 9 9900X | |
| Intel Core Ultra 9 285K | |
| Intel Core i9-14900K | |
| AMD Ryzen 5 9600X | |
| AMD Ryzen 9 7900X | |
| AMD Ryzen 9 7950X | |
| Intel Core i9-13900K | |
| Intel Core i7-14700K | |
| Intel Core i5-14600K | |
| AMD Ryzen 7 7800X3D | |
| Intel Core Ultra 5 245K | |
| Intel Core i5-13600K | |
| Intel Core i9-12900K | |
| Intel Core i5-12600K | |
| PCMark 10 / Essentials | |
| Intel Core i9-13900K | |
| AMD Ryzen 9 7900X | |
| AMD Ryzen 9 7950X | |
| AMD Ryzen 7 9700X | |
| Intel Core i9-14900K | |
| Intel Core i5-13600K | |
| AMD Ryzen 9 9900X | |
| AMD Ryzen 9 7950X3D | |
| AMD Ryzen 5 9600X | |
| AMD Ryzen 9 9950X | |
| Intel Core i7-14700K | |
| Intel Core Ultra 9 285K | |
| Intel Core i5-14600K | |
| AMD Ryzen 7 7800X3D | |
| Intel Core Ultra 5 245K | |
| Intel Core i9-12900K | |
| Intel Core i5-12600K | |
| PCMark 10 / Productivity | |
| AMD Ryzen 9 9900X | |
| AMD Ryzen 5 9600X | |
| AMD Ryzen 9 9950X | |
| AMD Ryzen 7 9700X | |
| AMD Ryzen 9 7950X3D | |
| Intel Core Ultra 9 285K | |
| AMD Ryzen 7 7800X3D | |
| Intel Core i5-14600K | |
| Intel Core i7-14700K | |
| AMD Ryzen 9 7900X | |
| AMD Ryzen 9 7950X | |
| Intel Core i9-14900K | |
| Intel Core i5-13600K | |
| Intel Core i9-13900K | |
| Intel Core Ultra 5 245K | |
| Intel Core i5-12600K | |
| Intel Core i9-12900K | |
| PCMark 10 / Digital Content Creation | |
| Intel Core Ultra 9 285K | |
| AMD Ryzen 9 9950X | |
| AMD Ryzen 9 9900X | |
| AMD Ryzen 7 9700X | |
| Intel Core i9-14900K | |
| Intel Core Ultra 5 245K | |
| AMD Ryzen 5 9600X | |
| Intel Core i7-14700K | |
| AMD Ryzen 9 7900X | |
| AMD Ryzen 9 7950X | |
| Intel Core i9-13900K | |
| Intel Core i5-14600K | |
| AMD Ryzen 7 7800X3D | |
| Intel Core i5-13600K | |
| Intel Core i9-12900K | |
| Intel Core i5-12600K | |
| AIDA64 / FP32 Ray-Trace | |
| AMD Ryzen 9 9950X | |
| AMD Ryzen 9 9900X | |
| AMD Ryzen 9 7950X | |
| AMD Ryzen 9 7950X3D | |
| Intel Core Ultra 9 285K | |
| AMD Ryzen 7 9700X | |
| Intel Core i9-14900K | |
| Intel Core i9-13900K | |
| AMD Ryzen 5 9600X | |
| AMD Ryzen 9 7900X | |
| Intel Core i7-14700K | |
| AMD Ryzen 7 7800X3D | |
| Intel Core i5-14600K | |
| Intel Core i5-13600K | |
| Intel Core Ultra 5 245K | |
| Intel Core i9-12900K | |
| Intel Core i5-12600K | |
| AIDA64 / FPU Julia | |
| AMD Ryzen 9 7950X3D | |
| AMD Ryzen 9 9950X | |
| AMD Ryzen 9 7950X | |
| Intel Core Ultra 9 285K | |
| AMD Ryzen 9 7900X | |
| AMD Ryzen 9 9900X | |
| Intel Core i9-14900K | |
| Intel Core i9-13900K | |
| Intel Core i7-14700K | |
| AMD Ryzen 7 7800X3D | |
| AMD Ryzen 7 9700X | |
| Intel Core i5-14600K | |
| Intel Core i5-13600K | |
| AMD Ryzen 5 9600X | |
| Intel Core Ultra 5 245K | |
| Intel Core i9-12900K | |
| Intel Core i5-12600K | |
| AIDA64 / CPU SHA3 | |
| AMD Ryzen 9 7950X3D | |
| Intel Core Ultra 9 285K | |
| AMD Ryzen 9 9950X | |
| AMD Ryzen 9 7950X | |
| Intel Core i9-13900K | |
| Intel Core i9-14900K | |
| AMD Ryzen 9 9900X | |
| Intel Core i7-14700K | |
| AMD Ryzen 9 7900X | |
| Intel Core i5-14600K | |
| AMD Ryzen 7 9700X | |
| AMD Ryzen 7 7800X3D | |
| Intel Core i5-13600K | |
| Intel Core i9-12900K | |
| Intel Core Ultra 5 245K | |
| AMD Ryzen 5 9600X | |
| Intel Core i5-12600K | |
| AIDA64 / CPU Queen | |
| AMD Ryzen 9 7950X | |
| AMD Ryzen 9 7950X3D | |
| AMD Ryzen 9 9950X | |
| AMD Ryzen 9 7900X | |
| Intel Core i7-14700K | |
| Intel Core i9-14900K | |
| Intel Core i9-13900K | |
| AMD Ryzen 9 9900X | |
| Intel Core Ultra 9 285K | |
| Intel Core i5-14600K | |
| AMD Ryzen 7 7800X3D | |
| Intel Core i5-13600K | |
| AMD Ryzen 7 9700X | |
| Intel Core i9-12900K | |
| AMD Ryzen 5 9600X | |
| Intel Core i5-12600K | |
| Intel Core Ultra 5 245K | |
| AIDA64 / FPU SinJulia | |
| AMD Ryzen 9 9950X | |
| AMD Ryzen 9 7950X | |
| AMD Ryzen 9 7950X3D | |
| AMD Ryzen 9 9900X | |
| AMD Ryzen 9 7900X | |
| Intel Core i9-14900K | |
| Intel Core i9-13900K | |
| Intel Core i7-14700K | |
| AMD Ryzen 7 9700X | |
| AMD Ryzen 7 7800X3D | |
| Intel Core Ultra 9 285K | |
| Intel Core i9-12900K | |
| AMD Ryzen 5 9600X | |
| Intel Core i5-14600K | |
| Intel Core i5-13600K | |
| Intel Core i5-12600K | |
| Intel Core Ultra 5 245K | |
| AIDA64 / FPU Mandel | |
| AMD Ryzen 9 7950X3D | |
| AMD Ryzen 9 9950X | |
| AMD Ryzen 9 7950X | |
| Intel Core Ultra 9 285K | |
| AMD Ryzen 9 7900X | |
| AMD Ryzen 9 9900X | |
| Intel Core i9-14900K | |
| Intel Core i9-13900K | |
| Intel Core i7-14700K | |
| AMD Ryzen 7 7800X3D | |
| AMD Ryzen 7 9700X | |
| Intel Core i5-14600K | |
| Intel Core i5-13600K | |
| AMD Ryzen 5 9600X | |
| Intel Core Ultra 5 245K | |
| Intel Core i9-12900K | |
| Intel Core i5-12600K | |
| AIDA64 / CPU AES | |
| AMD Ryzen 9 9900X | |
| AMD Ryzen 9 7950X | |
| AMD Ryzen 9 7950X3D | |
| AMD Ryzen 7 9700X | |
| Intel Core i9-14900K | |
| Intel Core i9-13900K | |
| AMD Ryzen 9 7900X | |
| AMD Ryzen 5 9600X | |
| Intel Core Ultra 9 285K | |
| Intel Core i5-14600K | |
| AMD Ryzen 7 7800X3D | |
| Intel Core i5-13600K | |
| AMD Ryzen 9 9950X | |
| Intel Core i7-14700K | |
| Intel Core i9-12900K | |
| Intel Core Ultra 5 245K | |
| Intel Core i5-12600K | |
| AIDA64 / CPU ZLib | |
| AMD Ryzen 9 9950X | |
| Intel Core i9-14900K | |
| Intel Core i9-13900K | |
| AMD Ryzen 9 7950X | |
| Intel Core Ultra 9 285K | |
| AMD Ryzen 9 7950X3D | |
| Intel Core i7-14700K | |
| AMD Ryzen 9 9900X | |
| AMD Ryzen 9 7900X | |
| Intel Core i9-12900K | |
| Intel Core i5-14600K | |
| Intel Core i5-13600K | |
| AMD Ryzen 7 9700X | |
| AMD Ryzen 7 7800X3D | |
| AMD Ryzen 5 9600X | |
| Intel Core i5-12600K | |
| Intel Core Ultra 5 245K | |
| AIDA64 / FP64 Ray-Trace | |
| AMD Ryzen 9 9950X | |
| AMD Ryzen 9 9900X | |
| AMD Ryzen 9 7950X | |
| AMD Ryzen 9 7950X3D | |
| Intel Core Ultra 9 285K | |
| AMD Ryzen 7 9700X | |
| Intel Core i9-14900K | |
| Intel Core i9-13900K | |
| AMD Ryzen 5 9600X | |
| AMD Ryzen 9 7900X | |
| Intel Core i7-14700K | |
| AMD Ryzen 7 7800X3D | |
| Intel Core i5-14600K | |
| Intel Core i5-13600K | |
| Intel Core Ultra 5 245K | |
| Intel Core i9-12900K | |
| Intel Core i5-12600K | |
| AIDA64 / CPU PhotoWorxx | |
| Intel Core i9-14900K | |
| Intel Core i5-14600K | |
| Intel Core Ultra 9 285K | |
| Intel Core i7-14700K | |
| AMD Ryzen 9 7950X3D | |
| Intel Core i9-13900K | |
| Intel Core i5-12600K | |
| Intel Core i5-13600K | |
| AMD Ryzen 9 9900X | |
| Intel Core i9-12900K | |
| AMD Ryzen 9 9950X | |
| AMD Ryzen 7 7800X3D | |
| AMD Ryzen 9 7950X | |
| AMD Ryzen 9 7900X | |
| AMD Ryzen 7 9700X | |
| AMD Ryzen 5 9600X | |
| Intel Core Ultra 5 245K | |
3DMark 11: 1280x720 Performance Physics
3DMark: 1920x1080 Fire Strike Physics | 2560x1440 Time Spy CPU
CrossMark: Overall | Responsiveness | Creativity | Productivity
PCMark 10: Score | Essentials | Productivity | Digital Content Creation
AIDA64: FP32 Ray-Trace | FPU Julia | CPU SHA3 | CPU Queen | FPU SinJulia | FPU Mandel | CPU AES | CPU ZLib | FP64 Ray-Trace | CPU PhotoWorxx
| PCMark 10 Score | 10514 pkt. | |
Pomoc | ||
Intel zdecydował się na radykalnie nowy projekt kafelków obliczeniowych w Arrow Lake-S. Rdzenie P i E nie znajdują się już w oddzielnych blokach z własnymi pamięciami podręcznymi. Zamiast tego, rdzenie E są rozmieszczone w klastrach po cztery pomiędzy rdzeniami P w rogach kafelka.
Wszystkie rdzenie współdzielą teraz ujednoliconą pamięć podręczną L3, która biegnie przez środek kafelka i ujednoliconą magistralę pierścieniową. Taka konstrukcja teoretycznie powinna pomóc w szybszym przenoszeniu danych między rdzeniami, a także w zapobieganiu koncentracji ciepła wokół jednego lub grupy rdzeni.
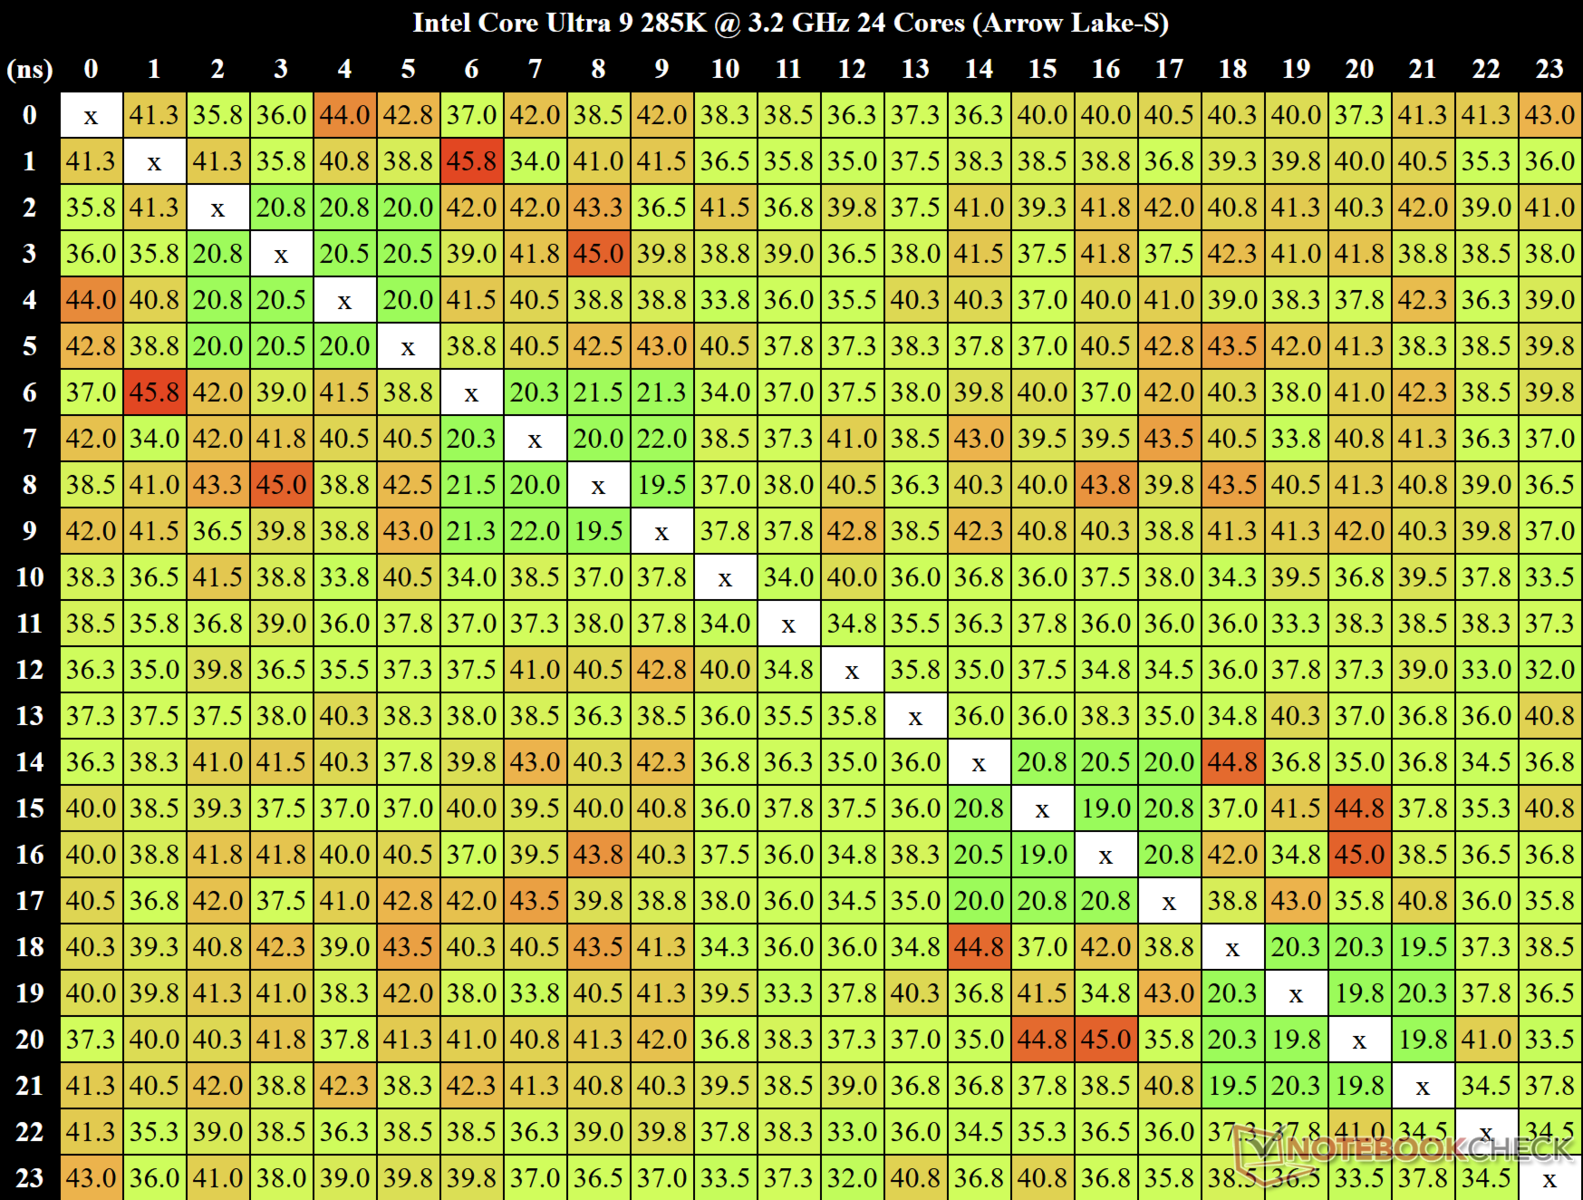
Użyliśmy MicrobenchX do obliczenia opóźnień międzyrdzeniowych. Opóźnienia między rdzeniami sięgają nawet 45,8 ns między rdzeniem 2 a rdzeniem 7, co wskazuje na możliwe duże opóźnienia podczas przenoszenia danych z rdzenia E do rdzenia E.
Jednak cztery klastry z rdzeniem E wydają się wykazywać minimalne opóźnienia w zakresie od 19 ns do 21,3 ns dla transferu danych w obrębie tych klastrów.
Zmierzyliśmy ogólną medianę opóźnień między rdzeniami na poziomie 38,25 ns.
| AIDA64 Memory Performance Rating - Percent | |
| Intel Core i9-12900K -1! | |
| Intel Core i9-14900K | |
| Intel Core i7-14700K | |
| Intel Core i5-12600K -1! | |
| Intel Core i5-14600K | |
| Intel Core Ultra 9 285K | |
| AMD Ryzen 9 7950X3D | |
| AMD Ryzen 9 7950X | |
| AMD Ryzen 9 9950X | |
| Intel Core i9-13900K | |
| AMD Ryzen 9 9900X | |
| AMD Ryzen 9 7900X | |
| AMD Ryzen 7 7800X3D | |
| Intel Core i5-13600K | |
| AMD Ryzen 7 9700X | |
| AMD Ryzen 5 9600X | |
| Intel Core Ultra 5 245K | |
* ... im mniej tym lepiej
3D i wydajność w grach: Arrow Lake-S rozczarowuje
Można by oczekiwać, że korzyści płynące z braku hiperwątkowości, Intel APO i zwiększonego IPC, zwłaszcza na rdzeniach Skymont, przełożą się na dobre wyniki w grach. Proszę być przygotowanym na rozczarowanie.
Podczas gdy Core Ultra 9 285K wykazał się godną pochwały wydajnością procesora przy relatywnie mniejszym zapotrzebowaniu na energię, to w przypadku zadań 3D i gier sytuacja się odwraca.
Core Ultra 9 285K w połączeniu z procesorem graficznym Nvidia GeForce RTX 4090 zdołał uzyskać 13% przewagi nad Ryzenem 9 9900X w 3DMark 11 Performance GPU i 6% przewagi nad Ryzenem 9 9950X w 3DMark Time Spy Graphics.
W 3DMark Fire Strike Graphics system ten przegrywa jednak znacząco z innymi układami Raptor Lake-S Refresh i Zen 5, co stawia go w ogólnie niekorzystnej sytuacji.
| 3DMark Performance Rating - Percent | |
| Intel Core i5-14600K | |
| AMD Ryzen 7 7800X3D | |
| AMD Ryzen 5 9600X | |
| Intel Core Ultra 5 245K | |
| AMD Ryzen 7 9700X | |
| AMD Ryzen 9 7950X3D | |
| Intel Core i9-14900K | |
| Intel Core i7-14700K | |
| AMD Ryzen 9 9950X | |
| AMD Ryzen 9 9900X | |
| Intel Core Ultra 9 285K | |
| 3DMark 11 - 1280x720 Performance GPU | |
| AMD Ryzen 7 7800X3D | |
| Intel Core i5-14600K | |
| AMD Ryzen 9 7950X3D | |
| Intel Core i9-14900K | |
| Intel Core Ultra 5 245K | |
| AMD Ryzen 5 9600X | |
| Intel Core i7-14700K | |
| AMD Ryzen 9 9950X | |
| AMD Ryzen 7 9700X | |
| Intel Core Ultra 9 285K | |
| AMD Ryzen 9 9900X | |
| 3DMark | |
| 2560x1440 Time Spy Graphics | |
| Intel Core i5-14600K | |
| Intel Core i9-14900K | |
| AMD Ryzen 7 7800X3D | |
| Intel Core i7-14700K | |
| AMD Ryzen 5 9600X | |
| Intel Core Ultra 5 245K | |
| AMD Ryzen 9 7950X3D | |
| AMD Ryzen 7 9700X | |
| AMD Ryzen 9 9900X | |
| Intel Core Ultra 9 285K | |
| AMD Ryzen 9 9950X | |
| 1920x1080 Fire Strike Graphics | |
| Intel Core i5-14600K | |
| AMD Ryzen 7 9700X | |
| AMD Ryzen 5 9600X | |
| Intel Core Ultra 5 245K | |
| AMD Ryzen 9 9950X | |
| AMD Ryzen 9 9900X | |
| AMD Ryzen 7 7800X3D | |
| AMD Ryzen 9 7950X3D | |
| Intel Core i9-14900K | |
| Intel Core i7-14700K | |
| Intel Core Ultra 9 285K | |
| 3DMark 11 Performance | 62846 pkt. | |
| 3DMark Fire Strike Score | 44363 pkt. | |
| 3DMark Time Spy Score | 30904 pkt. | |
Pomoc | ||
Podobne trendy widoczne są również w grach. Wbrew zapewnieniom Intela w momencie premiery, Core Ultra 9 285K w połączeniu z RTX 4090 plasuje się na samym dole naszej tabeli porównawczej w grach, dorównując jedynie Core i7-14700K i pozostając znacznie w tyle za ofertą Zen 5 (do 12%) w skumulowanych testach gier w rozdzielczości 720p Low i 1080p Ultra.
Core Ultra 9 285K wydaje się wykazywać niewielką przewagę nad Core i7-14700K w Far Cry 5, Dota 2 Reborn i Metro Exodus (bez Enhanced Edition), ale różnice są znikome, a ogólna wydajność wciąż pozostaje w tyle za Core i9-14700K i Core i9-14900K.
Nawet Core i5-14600K wydaje się być lepszym procesorem do gier z przyzwoitym 7% wzrostem w porównaniu do Core Ultra 9 285K
| Gaming Performance Rating - Percent | |
| AMD Ryzen 7 7800X3D | |
| AMD Ryzen 9 7950X3D | |
| Intel Core i9-14900K | |
| AMD Ryzen 7 9700X | |
| AMD Ryzen 9 9900X | |
| AMD Ryzen 5 9600X | |
| AMD Ryzen 9 9950X | |
| Intel Core i5-14600K | |
| Intel Core i7-14700K | |
| Intel Core Ultra 9 285K | |
| Intel Core Ultra 5 245K | |
| F1 22 | |
| 1280x720 Ultra Low Preset AA:T AF:16x | |
| AMD Ryzen 7 7800X3D | |
| Intel Core i9-14900K | |
| AMD Ryzen 9 7950X3D | |
| AMD Ryzen 9 9950X | |
| AMD Ryzen 5 9600X | |
| AMD Ryzen 7 9700X | |
| AMD Ryzen 9 9900X | |
| Intel Core i5-14600K | |
| Intel Core i7-14700K | |
| Intel Core Ultra 9 285K | |
| Intel Core Ultra 5 245K | |
| 1920x1080 Low Preset AA:T AF:16x | |
| AMD Ryzen 7 7800X3D | |
| AMD Ryzen 9 7950X3D | |
| Intel Core i9-14900K | |
| AMD Ryzen 5 9600X | |
| AMD Ryzen 9 9950X | |
| AMD Ryzen 7 9700X | |
| AMD Ryzen 9 9900X | |
| Intel Core i5-14600K | |
| Intel Core i7-14700K | |
| Intel Core Ultra 9 285K | |
| Intel Core Ultra 5 245K | |
| 1920x1080 Ultra High Preset AA:T AF:16x | |
| AMD Ryzen 7 7800X3D | |
| Intel Core i9-14900K | |
| AMD Ryzen 7 9700X | |
| Intel Core i5-14600K | |
| AMD Ryzen 9 7950X3D | |
| AMD Ryzen 5 9600X | |
| AMD Ryzen 9 9900X | |
| AMD Ryzen 9 9950X | |
| Intel Core i7-14700K | |
| Intel Core Ultra 9 285K | |
| Intel Core Ultra 5 245K | |
| X-Plane 11.11 | |
| 1280x720 low (fps_test=1) | |
| AMD Ryzen 7 9700X | |
| AMD Ryzen 9 9900X | |
| AMD Ryzen 5 9600X | |
| Intel Core i9-14900K | |
| Intel Core i5-14600K | |
| Intel Core i7-14700K | |
| AMD Ryzen 9 7950X3D | |
| AMD Ryzen 7 7800X3D | |
| AMD Ryzen 9 9950X | |
| Intel Core Ultra 9 285K | |
| Intel Core Ultra 5 245K | |
| 1920x1080 high (fps_test=3) | |
| AMD Ryzen 7 7800X3D | |
| AMD Ryzen 9 7950X3D | |
| AMD Ryzen 7 9700X | |
| AMD Ryzen 9 9900X | |
| AMD Ryzen 5 9600X | |
| Intel Core i9-14900K | |
| AMD Ryzen 9 9950X | |
| Intel Core i7-14700K | |
| Intel Core i5-14600K | |
| Intel Core Ultra 9 285K | |
| Intel Core Ultra 5 245K | |
| Final Fantasy XV Benchmark | |
| 1280x720 Lite Quality | |
| AMD Ryzen 5 9600X | |
| AMD Ryzen 7 7800X3D | |
| Intel Core i5-14600K | |
| AMD Ryzen 9 9950X | |
| Intel Core i9-14900K | |
| Intel Core i7-14700K | |
| AMD Ryzen 7 9700X | |
| Intel Core Ultra 5 245K | |
| AMD Ryzen 9 9900X | |
| AMD Ryzen 9 7950X3D | |
| Intel Core Ultra 9 285K | |
| 1920x1080 High Quality | |
| Intel Core i9-14900K | |
| AMD Ryzen 7 7800X3D | |
| Intel Core i5-14600K | |
| AMD Ryzen 9 7950X3D | |
| AMD Ryzen 9 9900X | |
| AMD Ryzen 5 9600X | |
| Intel Core i7-14700K | |
| Intel Core Ultra 9 285K | |
| AMD Ryzen 7 9700X | |
| AMD Ryzen 9 9950X | |
| Intel Core Ultra 5 245K | |
| Dota 2 Reborn | |
| 1280x720 min (0/3) fastest | |
| AMD Ryzen 7 7800X3D | |
| AMD Ryzen 7 9700X | |
| AMD Ryzen 9 7950X3D | |
| AMD Ryzen 9 9900X | |
| AMD Ryzen 9 9950X | |
| Intel Core i9-14900K | |
| AMD Ryzen 5 9600X | |
| Intel Core i5-14600K | |
| Intel Core Ultra 9 285K | |
| Intel Core i7-14700K | |
| Intel Core Ultra 5 245K | |
| 1920x1080 ultra (3/3) best looking | |
| AMD Ryzen 7 7800X3D | |
| AMD Ryzen 9 7950X3D | |
| AMD Ryzen 9 9900X | |
| AMD Ryzen 9 9950X | |
| AMD Ryzen 7 9700X | |
| AMD Ryzen 5 9600X | |
| Intel Core i9-14900K | |
| Intel Core i5-14600K | |
| Intel Core Ultra 9 285K | |
| Intel Core i7-14700K | |
| Intel Core Ultra 5 245K | |
| The Witcher 3 | |
| 1024x768 Low Graphics & Postprocessing | |
| AMD Ryzen 9 7950X3D | |
| AMD Ryzen 7 7800X3D | |
| Intel Core i9-14900K | |
| AMD Ryzen 9 9950X | |
| AMD Ryzen 5 9600X | |
| AMD Ryzen 7 9700X | |
| AMD Ryzen 9 9900X | |
| Intel Core i7-14700K | |
| Intel Core i5-14600K | |
| Intel Core Ultra 9 285K | |
| Intel Core Ultra 5 245K | |
| 1920x1080 Ultra Graphics & Postprocessing (HBAO+) | |
| Intel Core i5-14600K | |
| AMD Ryzen 7 7800X3D | |
| Intel Core i9-14900K | |
| Intel Core Ultra 5 245K | |
| AMD Ryzen 9 7950X3D | |
| Intel Core Ultra 9 285K | |
| Intel Core i7-14700K | |
| AMD Ryzen 5 9600X | |
| AMD Ryzen 9 9950X | |
| AMD Ryzen 7 9700X | |
| AMD Ryzen 9 9900X | |
| GTA V | |
| 1024x768 Lowest Settings possible | |
| AMD Ryzen 7 7800X3D | |
| AMD Ryzen 5 9600X | |
| AMD Ryzen 9 7950X3D | |
| Intel Core i9-14900K | |
| AMD Ryzen 7 9700X | |
| AMD Ryzen 9 9900X | |
| Intel Core i5-14600K | |
| Intel Core Ultra 5 245K | |
| Intel Core i7-14700K | |
| AMD Ryzen 9 9950X | |
| Intel Core Ultra 9 285K | |
| 1920x1080 Highest Settings possible AA:4xMSAA + FX AF:16x | |
| AMD Ryzen 7 7800X3D | |
| Intel Core i9-14900K | |
| AMD Ryzen 9 9900X | |
| AMD Ryzen 7 9700X | |
| AMD Ryzen 5 9600X | |
| AMD Ryzen 9 9950X | |
| Intel Core i5-14600K | |
| Intel Core Ultra 9 285K | |
| AMD Ryzen 9 7950X3D | |
| Intel Core i7-14700K | |
| Intel Core Ultra 5 245K | |
| Borderlands 3 | |
| 1280x720 Very Low Overall Quality (DX11) | |
| AMD Ryzen 7 7800X3D | |
| AMD Ryzen 9 7950X3D | |
| Intel Core i9-14900K | |
| AMD Ryzen 7 9700X | |
| AMD Ryzen 9 9900X | |
| AMD Ryzen 9 9950X | |
| Intel Core i5-14600K | |
| AMD Ryzen 5 9600X | |
| Intel Core i7-14700K | |
| Intel Core Ultra 9 285K | |
| Intel Core Ultra 5 245K | |
| 1920x1080 Very Low Overall Quality (DX11) | |
| AMD Ryzen 9 7950X3D | |
| AMD Ryzen 7 7800X3D | |
| Intel Core i9-14900K | |
| AMD Ryzen 9 9900X | |
| AMD Ryzen 7 9700X | |
| AMD Ryzen 9 9950X | |
| Intel Core i5-14600K | |
| AMD Ryzen 5 9600X | |
| Intel Core i7-14700K | |
| Intel Core Ultra 9 285K | |
| Intel Core Ultra 5 245K | |
| 1920x1080 Badass Overall Quality (DX11) | |
| AMD Ryzen 9 7950X3D | |
| AMD Ryzen 7 7800X3D | |
| Intel Core i9-14900K | |
| AMD Ryzen 7 9700X | |
| AMD Ryzen 9 9900X | |
| Intel Core i5-14600K | |
| AMD Ryzen 9 9950X | |
| AMD Ryzen 5 9600X | |
| Intel Core i7-14700K | |
| Intel Core Ultra 9 285K | |
| Intel Core Ultra 5 245K | |
| Shadow of the Tomb Raider | |
| 1280x720 Lowest Preset | |
| AMD Ryzen 7 7800X3D | |
| AMD Ryzen 9 7950X3D | |
| AMD Ryzen 7 9700X | |
| AMD Ryzen 9 9950X | |
| Intel Core i9-14900K | |
| AMD Ryzen 9 9900X | |
| AMD Ryzen 5 9600X | |
| Intel Core Ultra 9 285K | |
| Intel Core i5-14600K | |
| Intel Core i7-14700K | |
| Intel Core Ultra 5 245K | |
| 1920x1080 Highest Preset AA:T | |
| AMD Ryzen 7 7800X3D | |
| AMD Ryzen 9 7950X3D | |
| Intel Core i9-14900K | |
| AMD Ryzen 9 9900X | |
| AMD Ryzen 7 9700X | |
| AMD Ryzen 9 9950X | |
| AMD Ryzen 5 9600X | |
| Intel Core i5-14600K | |
| Intel Core Ultra 9 285K | |
| Intel Core i7-14700K | |
| Intel Core Ultra 5 245K | |
| Metro Exodus | |
| 1280x720 Low Quality AF:4x | |
| AMD Ryzen 7 7800X3D | |
| AMD Ryzen 7 9700X | |
| AMD Ryzen 5 9600X | |
| AMD Ryzen 9 9950X | |
| AMD Ryzen 9 9900X | |
| Intel Core i9-14900K | |
| Intel Core Ultra 9 285K | |
| Intel Core i5-14600K | |
| AMD Ryzen 9 7950X3D | |
| Intel Core i7-14700K | |
| Intel Core Ultra 5 245K | |
| 1920x1080 Ultra Quality AF:16x | |
| AMD Ryzen 7 7800X3D | |
| AMD Ryzen 5 9600X | |
| Intel Core i9-14900K | |
| AMD Ryzen 7 9700X | |
| AMD Ryzen 9 9900X | |
| AMD Ryzen 9 9950X | |
| Intel Core i5-14600K | |
| Intel Core i7-14700K | |
| Intel Core Ultra 9 285K | |
| AMD Ryzen 9 7950X3D | |
| Intel Core Ultra 5 245K | |
| F1 2021 | |
| 1280x720 Ultra Low Preset | |
| AMD Ryzen 7 7800X3D | |
| Intel Core i9-14900K | |
| AMD Ryzen 9 7950X3D | |
| AMD Ryzen 5 9600X | |
| AMD Ryzen 9 9950X | |
| AMD Ryzen 7 9700X | |
| AMD Ryzen 9 9900X | |
| Intel Core i5-14600K | |
| Intel Core i7-14700K | |
| Intel Core Ultra 9 285K | |
| Intel Core Ultra 5 245K | |
| 1920x1080 Ultra High Preset + Raytracing AA:T AF:16x | |
| AMD Ryzen 7 7800X3D | |
| Intel Core i9-14900K | |
| AMD Ryzen 7 9700X | |
| AMD Ryzen 5 9600X | |
| Intel Core i5-14600K | |
| AMD Ryzen 9 7950X3D | |
| AMD Ryzen 9 9900X | |
| AMD Ryzen 9 9950X | |
| Intel Core i7-14700K | |
| Intel Core Ultra 9 285K | |
| Intel Core Ultra 5 245K | |
Wydaje się, że nawet ustawienia związane z GPU, takie jak QHD Ultra i UHD Ultra, straciły miłość do Core Ultra 9 285K. Jednak skumulowana różnica w wydajności w porównaniu do Core i9-14900K wynosi obecnie 10% przy tych ustawieniach, w porównaniu do 15% przy rozdzielczościach bardziej obciążających procesor.
Chociaż stwierdzenie, że Core Ultra 9 285K jest wąskim gardłem dla RTX 4090 byłoby nieco naciągane, mają Państwo lepsze (i tańsze) opcje, jeśli gry są Państwa głównym zastosowaniem.
| Gaming Performance Rating - Percent | |
| AMD Ryzen 7 7800X3D | |
| AMD Ryzen 9 7950X3D | |
| Intel Core i9-14900K | |
| AMD Ryzen 7 9700X | |
| AMD Ryzen 9 9900X | |
| Intel Core i5-14600K | |
| AMD Ryzen 5 9600X | |
| AMD Ryzen 9 9950X | |
| Intel Core i7-14700K | |
| Intel Core Ultra 9 285K | |
| Intel Core Ultra 5 245K | |
| F1 22 | |
| 2560x1440 Ultra High Preset AA:T AF:16x | |
| AMD Ryzen 7 7800X3D | |
| AMD Ryzen 5 9600X | |
| Intel Core i9-14900K | |
| AMD Ryzen 9 9900X | |
| Intel Core i5-14600K | |
| AMD Ryzen 7 9700X | |
| AMD Ryzen 9 7950X3D | |
| AMD Ryzen 9 9950X | |
| Intel Core Ultra 5 245K | |
| Intel Core i7-14700K | |
| Intel Core Ultra 9 285K | |
| 3840x2160 Ultra High Preset AA:T AF:16x | |
| AMD Ryzen 9 9900X | |
| Intel Core Ultra 5 245K | |
| AMD Ryzen 5 9600X | |
| AMD Ryzen 7 9700X | |
| AMD Ryzen 7 7800X3D | |
| AMD Ryzen 9 9950X | |
| Intel Core i5-14600K | |
| Intel Core i9-14900K | |
| Intel Core Ultra 9 285K | |
| AMD Ryzen 9 7950X3D | |
| Intel Core i7-14700K | |
| Far Cry 5 | |
| 2560x1440 Ultra Preset AA:T | |
| AMD Ryzen 7 7800X3D | |
| AMD Ryzen 9 7950X3D | |
| AMD Ryzen 9 9900X | |
| Intel Core i9-14900K | |
| AMD Ryzen 5 9600X | |
| AMD Ryzen 7 9700X | |
| Intel Core i5-14600K | |
| AMD Ryzen 9 9950X | |
| Intel Core Ultra 9 285K | |
| Intel Core i7-14700K | |
| Intel Core Ultra 5 245K | |
| 3840x2160 Ultra Preset AA:T | |
| AMD Ryzen 7 7800X3D | |
| Intel Core i9-14900K | |
| AMD Ryzen 9 7950X3D | |
| Intel Core i5-14600K | |
| AMD Ryzen 5 9600X | |
| AMD Ryzen 9 9900X | |
| AMD Ryzen 9 9950X | |
| AMD Ryzen 7 9700X | |
| Intel Core Ultra 9 285K | |
| Intel Core Ultra 5 245K | |
| Intel Core i7-14700K | |
| X-Plane 11.11 - 3840x2160 high (fps_test=3) | |
| AMD Ryzen 7 7800X3D | |
| AMD Ryzen 9 7950X3D | |
| AMD Ryzen 7 9700X | |
| AMD Ryzen 5 9600X | |
| Intel Core i9-14900K | |
| AMD Ryzen 9 9900X | |
| Intel Core i7-14700K | |
| Intel Core i5-14600K | |
| AMD Ryzen 9 9950X | |
| Intel Core Ultra 9 285K | |
| Intel Core Ultra 5 245K | |
| Final Fantasy XV Benchmark | |
| 2560x1440 High Quality | |
| AMD Ryzen 7 7800X3D | |
| Intel Core i9-14900K | |
| Intel Core i5-14600K | |
| AMD Ryzen 9 7950X3D | |
| AMD Ryzen 9 9950X | |
| Intel Core Ultra 9 285K | |
| Intel Core i7-14700K | |
| AMD Ryzen 5 9600X | |
| Intel Core Ultra 5 245K | |
| AMD Ryzen 7 9700X | |
| AMD Ryzen 9 9900X | |
| 3840x2160 High Quality | |
| Intel Core Ultra 5 245K | |
| Intel Core i9-14900K | |
| Intel Core i5-14600K | |
| Intel Core i7-14700K | |
| AMD Ryzen 7 7800X3D | |
| AMD Ryzen 9 7950X3D | |
| Intel Core Ultra 9 285K | |
| AMD Ryzen 9 9950X | |
| AMD Ryzen 9 9900X | |
| AMD Ryzen 5 9600X | |
| AMD Ryzen 7 9700X | |
| Dota 2 Reborn - 3840x2160 ultra (3/3) best looking | |
| AMD Ryzen 7 7800X3D | |
| AMD Ryzen 9 7950X3D | |
| AMD Ryzen 9 9950X | |
| AMD Ryzen 7 9700X | |
| AMD Ryzen 9 9900X | |
| Intel Core i9-14900K | |
| AMD Ryzen 5 9600X | |
| Intel Core i5-14600K | |
| Intel Core i7-14700K | |
| Intel Core Ultra 9 285K | |
| Intel Core Ultra 5 245K | |
| The Witcher 3 - 3840x2160 Ultra Graphics & Postprocessing (HBAO+) | |
| Intel Core i9-14900K | |
| Intel Core Ultra 5 245K | |
| AMD Ryzen 7 7800X3D | |
| Intel Core i5-14600K | |
| AMD Ryzen 9 7950X3D | |
| AMD Ryzen 5 9600X | |
| Intel Core i7-14700K | |
| Intel Core Ultra 9 285K | |
| AMD Ryzen 7 9700X | |
| AMD Ryzen 9 9900X | |
| AMD Ryzen 9 9950X | |
| GTA V | |
| 2560x1440 Highest Settings possible AA:4xMSAA + FX AF:16x | |
| AMD Ryzen 7 7800X3D | |
| Intel Core i9-14900K | |
| AMD Ryzen 9 9900X | |
| AMD Ryzen 7 9700X | |
| AMD Ryzen 5 9600X | |
| AMD Ryzen 9 9950X | |
| Intel Core i5-14600K | |
| AMD Ryzen 9 7950X3D | |
| Intel Core Ultra 9 285K | |
| Intel Core Ultra 5 245K | |
| Intel Core i7-14700K | |
| 3840x2160 Highest Settings possible AA:4xMSAA + FX AF:16x | |
| AMD Ryzen 7 7800X3D | |
| Intel Core i9-14900K | |
| Intel Core i5-14600K | |
| AMD Ryzen 9 9900X | |
| AMD Ryzen 5 9600X | |
| AMD Ryzen 7 9700X | |
| AMD Ryzen 9 7950X3D | |
| Intel Core Ultra 9 285K | |
| Intel Core Ultra 5 245K | |
| Intel Core i7-14700K | |
| AMD Ryzen 9 9950X | |
| Borderlands 3 | |
| 2560x1440 Badass Overall Quality (DX11) | |
| AMD Ryzen 7 7800X3D | |
| AMD Ryzen 9 7950X3D | |
| Intel Core i9-14900K | |
| AMD Ryzen 7 9700X | |
| AMD Ryzen 9 9900X | |
| Intel Core i5-14600K | |
| AMD Ryzen 9 9950X | |
| Intel Core i7-14700K | |
| AMD Ryzen 5 9600X | |
| Intel Core Ultra 9 285K | |
| Intel Core Ultra 5 245K | |
| 3840x2160 Badass Overall Quality (DX11) | |
| Intel Core i9-14900K | |
| AMD Ryzen 7 7800X3D | |
| AMD Ryzen 9 7950X3D | |
| Intel Core i5-14600K | |
| Intel Core i7-14700K | |
| AMD Ryzen 9 9900X | |
| AMD Ryzen 5 9600X | |
| AMD Ryzen 7 9700X | |
| AMD Ryzen 9 9950X | |
| Intel Core Ultra 9 285K | |
| Intel Core Ultra 5 245K | |
| Shadow of the Tomb Raider | |
| 2560x1440 Highest Preset AA:T | |
| AMD Ryzen 7 7800X3D | |
| AMD Ryzen 9 7950X3D | |
| Intel Core i9-14900K | |
| AMD Ryzen 9 9900X | |
| AMD Ryzen 9 9950X | |
| AMD Ryzen 7 9700X | |
| AMD Ryzen 5 9600X | |
| Intel Core i5-14600K | |
| Intel Core i7-14700K | |
| Intel Core Ultra 9 285K | |
| Intel Core Ultra 5 245K | |
| 3840x2160 Highest Preset AA:T | |
| Intel Core i9-14900K | |
| Intel Core i5-14600K | |
| AMD Ryzen 5 9600X | |
| AMD Ryzen 7 7800X3D | |
| AMD Ryzen 9 7950X3D | |
| Intel Core Ultra 5 245K | |
| AMD Ryzen 9 9900X | |
| AMD Ryzen 7 9700X | |
| Intel Core i7-14700K | |
| Intel Core Ultra 9 285K | |
| AMD Ryzen 9 9950X | |
| Metro Exodus | |
| 2560x1440 Ultra Quality AF:16x | |
| AMD Ryzen 7 7800X3D | |
| Intel Core i9-14900K | |
| AMD Ryzen 5 9600X | |
| AMD Ryzen 7 9700X | |
| Intel Core i5-14600K | |
| AMD Ryzen 9 9900X | |
| Intel Core i7-14700K | |
| AMD Ryzen 9 9950X | |
| AMD Ryzen 9 7950X3D | |
| Intel Core Ultra 9 285K | |
| Intel Core Ultra 5 245K | |
| 3840x2160 Ultra Quality AF:16x | |
| Intel Core i9-14900K | |
| Intel Core i5-14600K | |
| AMD Ryzen 7 7800X3D | |
| AMD Ryzen 9 7950X3D | |
| AMD Ryzen 7 9700X | |
| Intel Core i7-14700K | |
| AMD Ryzen 9 9900X | |
| AMD Ryzen 5 9600X | |
| Intel Core Ultra 5 245K | |
| Intel Core Ultra 9 285K | |
| AMD Ryzen 9 9950X | |
| F1 2021 | |
| 2560x1440 Ultra High Preset + Raytracing AA:T AF:16x | |
| AMD Ryzen 7 7800X3D | |
| AMD Ryzen 7 9700X | |
| Intel Core i9-14900K | |
| AMD Ryzen 5 9600X | |
| AMD Ryzen 9 7950X3D | |
| Intel Core i5-14600K | |
| AMD Ryzen 9 9950X | |
| Intel Core i7-14700K | |
| AMD Ryzen 9 9900X | |
| Intel Core Ultra 9 285K | |
| Intel Core Ultra 5 245K | |
| 3840x2160 Ultra High Preset + Raytracing AA:T AF:16x | |
| AMD Ryzen 7 7800X3D | |
| AMD Ryzen 9 9950X | |
| AMD Ryzen 5 9600X | |
| AMD Ryzen 9 7950X3D | |
| Intel Core i9-14900K | |
| AMD Ryzen 7 9700X | |
| AMD Ryzen 9 9900X | |
| Intel Core i5-14600K | |
| Intel Core Ultra 9 285K | |
| Intel Core Ultra 5 245K | |
| Intel Core i7-14700K | |
| low | med. | high | ultra | QHD DLSS | QHD FSR | QHD | 4K DLSS | 4K FSR | 4K | |
|---|---|---|---|---|---|---|---|---|---|---|
| GTA V (2015) | 186.9 | 185.6 | 183.2 | 161.3 | 154.2 | 182.4 | ||||
| The Witcher 3 (2015) | 626 | 584 | 545 | 294 | 251 | 276 | ||||
| Dota 2 Reborn (2015) | 256 | 230 | 218 | 204 | 196.3 | |||||
| Final Fantasy XV Benchmark (2018) | 234 | 237 | 228 | 221 | 154.3 | |||||
| X-Plane 11.11 (2018) | 189.1 | 172.5 | 140.5 | 117.3 | ||||||
| Far Cry 5 (2018) | 225 | 194 | 186 | 171 | 172 | 162 | ||||
| Strange Brigade (2018) | 705 | 557 | 552 | 547 | 501 | 276 | ||||
| Shadow of the Tomb Raider (2018) | 282 | 273 | 275 | 270 | 255 | 178.4 | ||||
| Metro Exodus (2019) | 299 | 271 | 230 | 193.8 | 177.7 | 131.3 | ||||
| Borderlands 3 (2019) | 209 | 183 | 166.8 | 159.1 | 158.2 | 127.3 | ||||
| F1 2021 (2021) | 530 | 510 | 486 | 232 | 229 | 198.2 | ||||
| F1 22 (2022) | 357 | 388 | 373 | 174.6 | 149.9 | 83 | ||||
| F1 23 (2023) | 376 | 394 | 393 | 182.9 | 145.7 | 127 | 78.5 | |||
| Baldur's Gate 3 (2023) | 304 | 293 | 271 | 269 | 225 | 193.2 | 131.7 | |||
| Cyberpunk 2077 2.2 Phantom Liberty (2023) | 212 | 214 | 195.1 | 180.3 | 145.2 | 73.2 | ||||
| Assassin's Creed Mirage (2023) | 287 | 268 | 255 | 198 | 178 | 156 | 125 | |||
| F1 24 (2024) | 373 | 394 | 365 | 184.8 | 186.3 | 192.8 | 139.9 | 121 | 137.2 | 77 |
| Black Myth: Wukong (2024) | 214 | 162 | 128 | 81 | 89 | 65 | 68 | 42 |
Pobór mocy: Intel w końcu osiąga właściwą wydajność energetyczną
Intel przedstawia wydajność energetyczną jako główną zaletę Arrow Lake-S i mogliśmy zobaczyć, że Core Ultra 9 285K rzeczywiście spełnia oczekiwania w tym zakresie.
Core Ultra 9 285K pobiera o 37% mniej energii ze źródła zasilania podczas uruchamiania wielordzeniowego Cinebench R23 w porównaniu do Core i9-14900K, przy czym pobór mocy jednordzeniowego Cinebench R23 jest o około 27% niższy.
Pobór mocy podczas uruchamiania dużych FFT w Prime95 jest również o 29% niższy niż w przypadku Core i9-14900K, a Core Ultra 9 285K zbliżył się do poziomu Core i5-14600K.
Zyski te są również widoczne w grach, gdzie system Core Ultra 9 285K pobiera o 18% mniej mocy w porównaniu do Core i9-14900K w The Witcher 3 przy 1080p Ultra i o 22% mniej niż Ryzen 9 9950X w Cyberpunk 2077: Phantom Liberty w rozdzielczości 1080p Ultra.
Power Consumption: External monitor
: Cyberpunk 2077 ultra external monitor
| Power Consumption / Cinebench R15 Multi (external Monitor) | |
| Intel Core i9-14900K, NVIDIA GeForce RTX 4090 | |
| Intel Core i9-13900K, NVIDIA GeForce RTX 3090 | |
| Intel Core i7-14700K, NVIDIA GeForce RTX 4090 | |
| Intel Core Ultra 9 285K, NVIDIA GeForce RTX 4090 (Idle: 76.2 W) | |
| Intel Core i5-14600K, NVIDIA GeForce RTX 4090 | |
| Intel Core i9-12900K, NVIDIA Titan RTX (Idle: 70.5 W) | |
| AMD Ryzen 9 7950X, NVIDIA GeForce RTX 3090 | |
| AMD Ryzen 9 7900X, NVIDIA GeForce RTX 3090 | |
| AMD Ryzen 9 9950X, NVIDIA GeForce RTX 4090 (Idle: 100 W) | |
| Intel Core i5-13600K, NVIDIA GeForce RTX 3090 | |
| AMD Ryzen 9 9900X, NVIDIA GeForce RTX 4090 (Idle: 85.1 W) | |
| AMD Ryzen 9 7950X3D, NVIDIA GeForce RTX 4090 | |
| Intel Core Ultra 5 245K, NVIDIA GeForce RTX 4090 | |
| AMD Ryzen 5 9600X, NVIDIA GeForce RTX 4090 | |
| AMD Ryzen 7 7800X3D, NVIDIA GeForce RTX 4090 | |
| Intel Core i5-12600K, NVIDIA Titan RTX (Idle: 70.45 W) | |
| AMD Ryzen 7 9700X, NVIDIA GeForce RTX 4090 (Idle: 83 W) | |
| Power Consumption / Cinebench R23 Single (external Monitor) | |
| AMD Ryzen 7 7800X3D, NVIDIA GeForce RTX 4090 | |
| Intel Core i7-14700K, NVIDIA GeForce RTX 4090 | |
| Intel Core i9-14900K, NVIDIA GeForce RTX 4090 | |
| Intel Core i5-14600K, NVIDIA GeForce RTX 4090 | |
| AMD Ryzen 5 9600X, NVIDIA GeForce RTX 4090 | |
| AMD Ryzen 9 9950X, NVIDIA GeForce RTX 4090 (100) | |
| AMD Ryzen 9 9900X, NVIDIA GeForce RTX 4090 (85.1) | |
| Intel Core Ultra 5 245K, NVIDIA GeForce RTX 4090 | |
| AMD Ryzen 7 9700X, NVIDIA GeForce RTX 4090 (83) | |
| Intel Core Ultra 9 285K, NVIDIA GeForce RTX 4090 (76.2) | |
| Power Consumption / Cinebench R23 Multi (external Monitor) | |
| Intel Core i9-14900K, NVIDIA GeForce RTX 4090 | |
| Intel Core i7-14700K, NVIDIA GeForce RTX 4090 | |
| Intel Core Ultra 9 285K, NVIDIA GeForce RTX 4090 (76.2) | |
| Intel Core i5-14600K, NVIDIA GeForce RTX 4090 | |
| AMD Ryzen 9 9950X, NVIDIA GeForce RTX 4090 (100) | |
| AMD Ryzen 9 7950X3D, NVIDIA GeForce RTX 4090 | |
| AMD Ryzen 9 9900X, NVIDIA GeForce RTX 4090 (85.1) | |
| Intel Core Ultra 5 245K, NVIDIA GeForce RTX 4090 | |
| AMD Ryzen 5 9600X, NVIDIA GeForce RTX 4090 | |
| AMD Ryzen 7 7800X3D, NVIDIA GeForce RTX 4090 | |
| AMD Ryzen 7 9700X, NVIDIA GeForce RTX 4090 (83) | |
| Power Consumption / Prime95 V2810 Stress (external Monitor) | |
| Intel Core i9-14900K, NVIDIA GeForce RTX 4090 | |
| Intel Core i9-13900K, NVIDIA GeForce RTX 3090 | |
| Intel Core i7-14700K, NVIDIA GeForce RTX 4090 | |
| Intel Core Ultra 9 285K, NVIDIA GeForce RTX 4090 (Idle: 76.2 W) | |
| Intel Core i5-14600K, NVIDIA GeForce RTX 4090 | |
| Intel Core i5-13600K, NVIDIA GeForce RTX 3090 | |
| AMD Ryzen 9 7950X, NVIDIA GeForce RTX 3090 | |
| AMD Ryzen 9 7900X, NVIDIA GeForce RTX 3090 | |
| AMD Ryzen 9 9950X, NVIDIA GeForce RTX 4090 (Idle: 100 W) | |
| Intel Core i9-12900K, NVIDIA Titan RTX (Idle: 70.5 W) | |
| AMD Ryzen 9 9900X, NVIDIA GeForce RTX 4090 (Idle: 85.1 W) | |
| AMD Ryzen 9 7950X3D, NVIDIA GeForce RTX 4090 | |
| Intel Core Ultra 5 245K, NVIDIA GeForce RTX 4090 | |
| Intel Core i5-12600K, NVIDIA Titan RTX (Idle: 70.45 W) | |
| AMD Ryzen 7 7800X3D, NVIDIA GeForce RTX 4090 | |
| AMD Ryzen 5 9600X, NVIDIA GeForce RTX 4090 | |
| AMD Ryzen 7 9700X, NVIDIA GeForce RTX 4090 (Idle: 83 W) | |
| Power Consumption / The Witcher 3 ultra (external Monitor) | |
| Intel Core i5-14600K, NVIDIA GeForce RTX 4090 | |
| Intel Core i9-14900K, NVIDIA GeForce RTX 4090 | |
| AMD Ryzen 9 7900X, NVIDIA GeForce RTX 3090 | |
| AMD Ryzen 9 7950X, NVIDIA GeForce RTX 3090 | |
| Intel Core i9-13900K, NVIDIA GeForce RTX 3090 | |
| Intel Core i7-14700K, NVIDIA GeForce RTX 4090 | |
| AMD Ryzen 9 7950X3D, NVIDIA GeForce RTX 4090 | |
| Intel Core i5-13600K, NVIDIA GeForce RTX 3090 | |
| AMD Ryzen 7 7800X3D, NVIDIA GeForce RTX 4090 | |
| Intel Core Ultra 5 245K, NVIDIA GeForce RTX 4090 | |
| AMD Ryzen 9 9950X, NVIDIA GeForce RTX 4090 (Idle: 100 W) | |
| AMD Ryzen 9 9900X, NVIDIA GeForce RTX 4090 (Idle: 85.1 W) | |
| Intel Core i9-12900K, NVIDIA Titan RTX (Idle: 70.5 W) | |
| Intel Core Ultra 9 285K, NVIDIA GeForce RTX 4090 (Idle: 76.2 W) | |
| AMD Ryzen 7 9700X, NVIDIA GeForce RTX 4090 (Idle: 83 W) | |
| Intel Core i5-12600K, NVIDIA Titan RTX (Idle: 70.45 W) | |
| Power Consumption | |
| Intel Core Ultra 9 285K, NVIDIA GeForce RTX 4090 | |
| AMD Ryzen 5 9600X, NVIDIA GeForce RTX 4090 | |
| AMD Ryzen 9 9900X, NVIDIA GeForce RTX 4090 | |
| AMD Ryzen 9 9950X, NVIDIA GeForce RTX 4090 | |
| AMD Ryzen 7 9700X, NVIDIA GeForce RTX 4090 | |
| Intel Core Ultra 5 245K, NVIDIA GeForce RTX 4090 | |
: Cyberpunk 2077 ultra external monitor
* ... im mniej tym lepiej
Niższy pobór mocy naturalnie przekłada się na wysoki wzrost wydajności. W wielordzeniowym Cinebench R15 Core Ultra 9 285K jest aż o 61% wydajniejszy niż Core i9-14900K, a w wielordzeniowym Cinebench R23 jest o 64% lepszy.
W Cinebench R23 single-core Core Ultra 9 285K jest o 37% wydajniejszy z 21,2 punktami na W w porównaniu do 15,51 punktów na W Core i9-14900K.
Nawet w porównaniu do Ryzena 9 9950X, Core Ultra 9 285K utrzymuje dobrą przewagę od 32% do 34% w zakresie efektywności energetycznej pojedynczego rdzenia w testach jednordzeniowych Cinebench.
Procesor Arrow Lake-S wykazuje również 14% wzrost wydajności w porównaniu do Core i9-14900K podczas grania w The Witcher 3 w rozdzielczości 1080p Ultra i jest nawet nieznacznie lepszy niż Ryzen 7 7800X3D system.
| Power Consumption / Cinebench R15 Multi Efficiency (external Monitor) | |
| AMD Ryzen 9 7950X3D, NVIDIA GeForce RTX 4090 | |
| AMD Ryzen 9 9950X, NVIDIA GeForce RTX 4090 | |
| Intel Core Ultra 9 285K, NVIDIA GeForce RTX 4090 | |
| AMD Ryzen 9 9900X, NVIDIA GeForce RTX 4090 | |
| Intel Core Ultra 5 245K, NVIDIA GeForce RTX 4090 | |
| AMD Ryzen 7 7800X3D, NVIDIA GeForce RTX 4090 | |
| Intel Core i7-14700K, NVIDIA GeForce RTX 4090 | |
| AMD Ryzen 5 9600X, NVIDIA GeForce RTX 4090 | |
| Intel Core i9-14900K, NVIDIA GeForce RTX 4090 | |
| Intel Core i5-14600K, NVIDIA GeForce RTX 4090 | |
| Power Consumption / Cinebench R23 Single Power Efficiency - external Monitor | |
| Intel Core Ultra 9 285K, NVIDIA GeForce RTX 4090 | |
| Intel Core Ultra 5 245K, NVIDIA GeForce RTX 4090 | |
| AMD Ryzen 9 9900X, NVIDIA GeForce RTX 4090 | |
| AMD Ryzen 9 9950X, NVIDIA GeForce RTX 4090 | |
| Intel Core i9-14900K, NVIDIA GeForce RTX 4090 | |
| AMD Ryzen 5 9600X, NVIDIA GeForce RTX 4090 | |
| Intel Core i7-14700K, NVIDIA GeForce RTX 4090 | |
| Intel Core i5-14600K, NVIDIA GeForce RTX 4090 | |
| AMD Ryzen 7 7800X3D, NVIDIA GeForce RTX 4090 | |
| Power Consumption / Cinebench R23 Multi Power Efficiency - external Monitor | |
| AMD Ryzen 9 9950X, NVIDIA GeForce RTX 4090 | |
| Intel Core Ultra 9 285K, NVIDIA GeForce RTX 4090 | |
| AMD Ryzen 9 7950X3D, NVIDIA GeForce RTX 4090 | |
| AMD Ryzen 9 9900X, NVIDIA GeForce RTX 4090 | |
| Intel Core Ultra 5 245K, NVIDIA GeForce RTX 4090 | |
| AMD Ryzen 7 7800X3D, NVIDIA GeForce RTX 4090 | |
| Intel Core i7-14700K, NVIDIA GeForce RTX 4090 | |
| AMD Ryzen 5 9600X, NVIDIA GeForce RTX 4090 | |
| Intel Core i9-14900K, NVIDIA GeForce RTX 4090 | |
| Intel Core i5-14600K, NVIDIA GeForce RTX 4090 | |
| Power Consumption / Cinebench 2024 Single Power Efficiency - external Monitor | |
| Intel Core Ultra 9 285K, NVIDIA GeForce RTX 4090 | |
| AMD Ryzen 9 9900X, NVIDIA GeForce RTX 4090 | |
| AMD Ryzen 9 9950X, NVIDIA GeForce RTX 4090 | |
| Power Consumption / Cinebench 2024 Multi Power Efficiency - external Monitor | |
| Intel Core Ultra 9 285K, NVIDIA GeForce RTX 4090 | |
| AMD Ryzen 9 9950X, NVIDIA GeForce RTX 4090 | |
| AMD Ryzen 9 9900X, NVIDIA GeForce RTX 4090 | |
| Power Consumption / Witcher 3 ultra Efficiency (external Monitor) | |
| Intel Core Ultra 9 285K, NVIDIA GeForce RTX 4090 | |
| AMD Ryzen 7 7800X3D, NVIDIA GeForce RTX 4090 | |
| Intel Core i5-12400F, NVIDIA GeForce RTX 4090 | |
| Intel Core Ultra 5 245K, NVIDIA GeForce RTX 4090 | |
| AMD Ryzen 9 7950X3D, NVIDIA GeForce RTX 4090 | |
| AMD Ryzen 9 9900X, NVIDIA GeForce RTX 4090 | |
| AMD Ryzen 9 9950X, NVIDIA GeForce RTX 4090 | |
| AMD Ryzen 9 7950X, NVIDIA GeForce RTX 4090 | |
| Intel Core i9-14900K, NVIDIA GeForce RTX 4090 | |
| Intel Core i5-14600K, NVIDIA GeForce RTX 4090 | |
| Intel Core i5-13400, NVIDIA GeForce RTX 4090 | |
| Intel Core i7-14700K, NVIDIA GeForce RTX 4090 | |
| Intel Core i9-14900K, NVIDIA GeForce RTX 4090 | |
Ogólne wrażenie Notebookcheck na temat Core Ultra 9 285K
Intel Core Ultra 9 285K z powodzeniem oferuje poziom wydajności procesora Core i9-14900K przy niższych poziomach mocy.
Wydajność w grach nie jest jednak na najwyższym poziomie, co stawia pod dużym znakiem zapytania cenę wywoławczą 589 USD.
Zatwardziali gracze mogą poczekać do premiery układów Ryzen 9000X3D na początku listopada, zanim zdecydują się wydać swoje pieniądze.
Przezroczystość
Wyboru urządzeń do recenzji dokonuje nasza redakcja. Próbka testowa została udostępniona autorowi jako pożyczka od producenta lub sprzedawcy detalicznego na potrzeby tej recenzji. Pożyczkodawca nie miał wpływu na tę recenzję, producent nie otrzymał też kopii tej recenzji przed publikacją. Nie było obowiązku publikowania tej recenzji. Nigdy nie przyjmujemy rekompensaty ani płatności w zamian za nasze recenzje. Jako niezależna firma medialna, Notebookcheck nie podlega władzy producentów, sprzedawców detalicznych ani wydawców.
Tak testuje Notebookcheck
Każdego roku Notebookcheck niezależnie sprawdza setki laptopów i smartfonów, stosując standardowe procedury, aby zapewnić porównywalność wszystkich wyników. Od około 20 lat stale rozwijamy nasze metody badawcze, ustanawiając przy tym standardy branżowe. W naszych laboratoriach testowych doświadczeni technicy i redaktorzy korzystają z wysokiej jakości sprzętu pomiarowego. Testy te obejmują wieloetapowy proces walidacji. Nasz kompleksowy system ocen opiera się na setkach uzasadnionych pomiarów i benchmarków, co pozwala zachować obiektywizm.
