

Recenzja MSI Prestige 16 AI Evo - multimedialny laptop z szybkim procesorem Arrow Lake i imponującym czasem pracy
Debiut Core Ultra 9 285H.
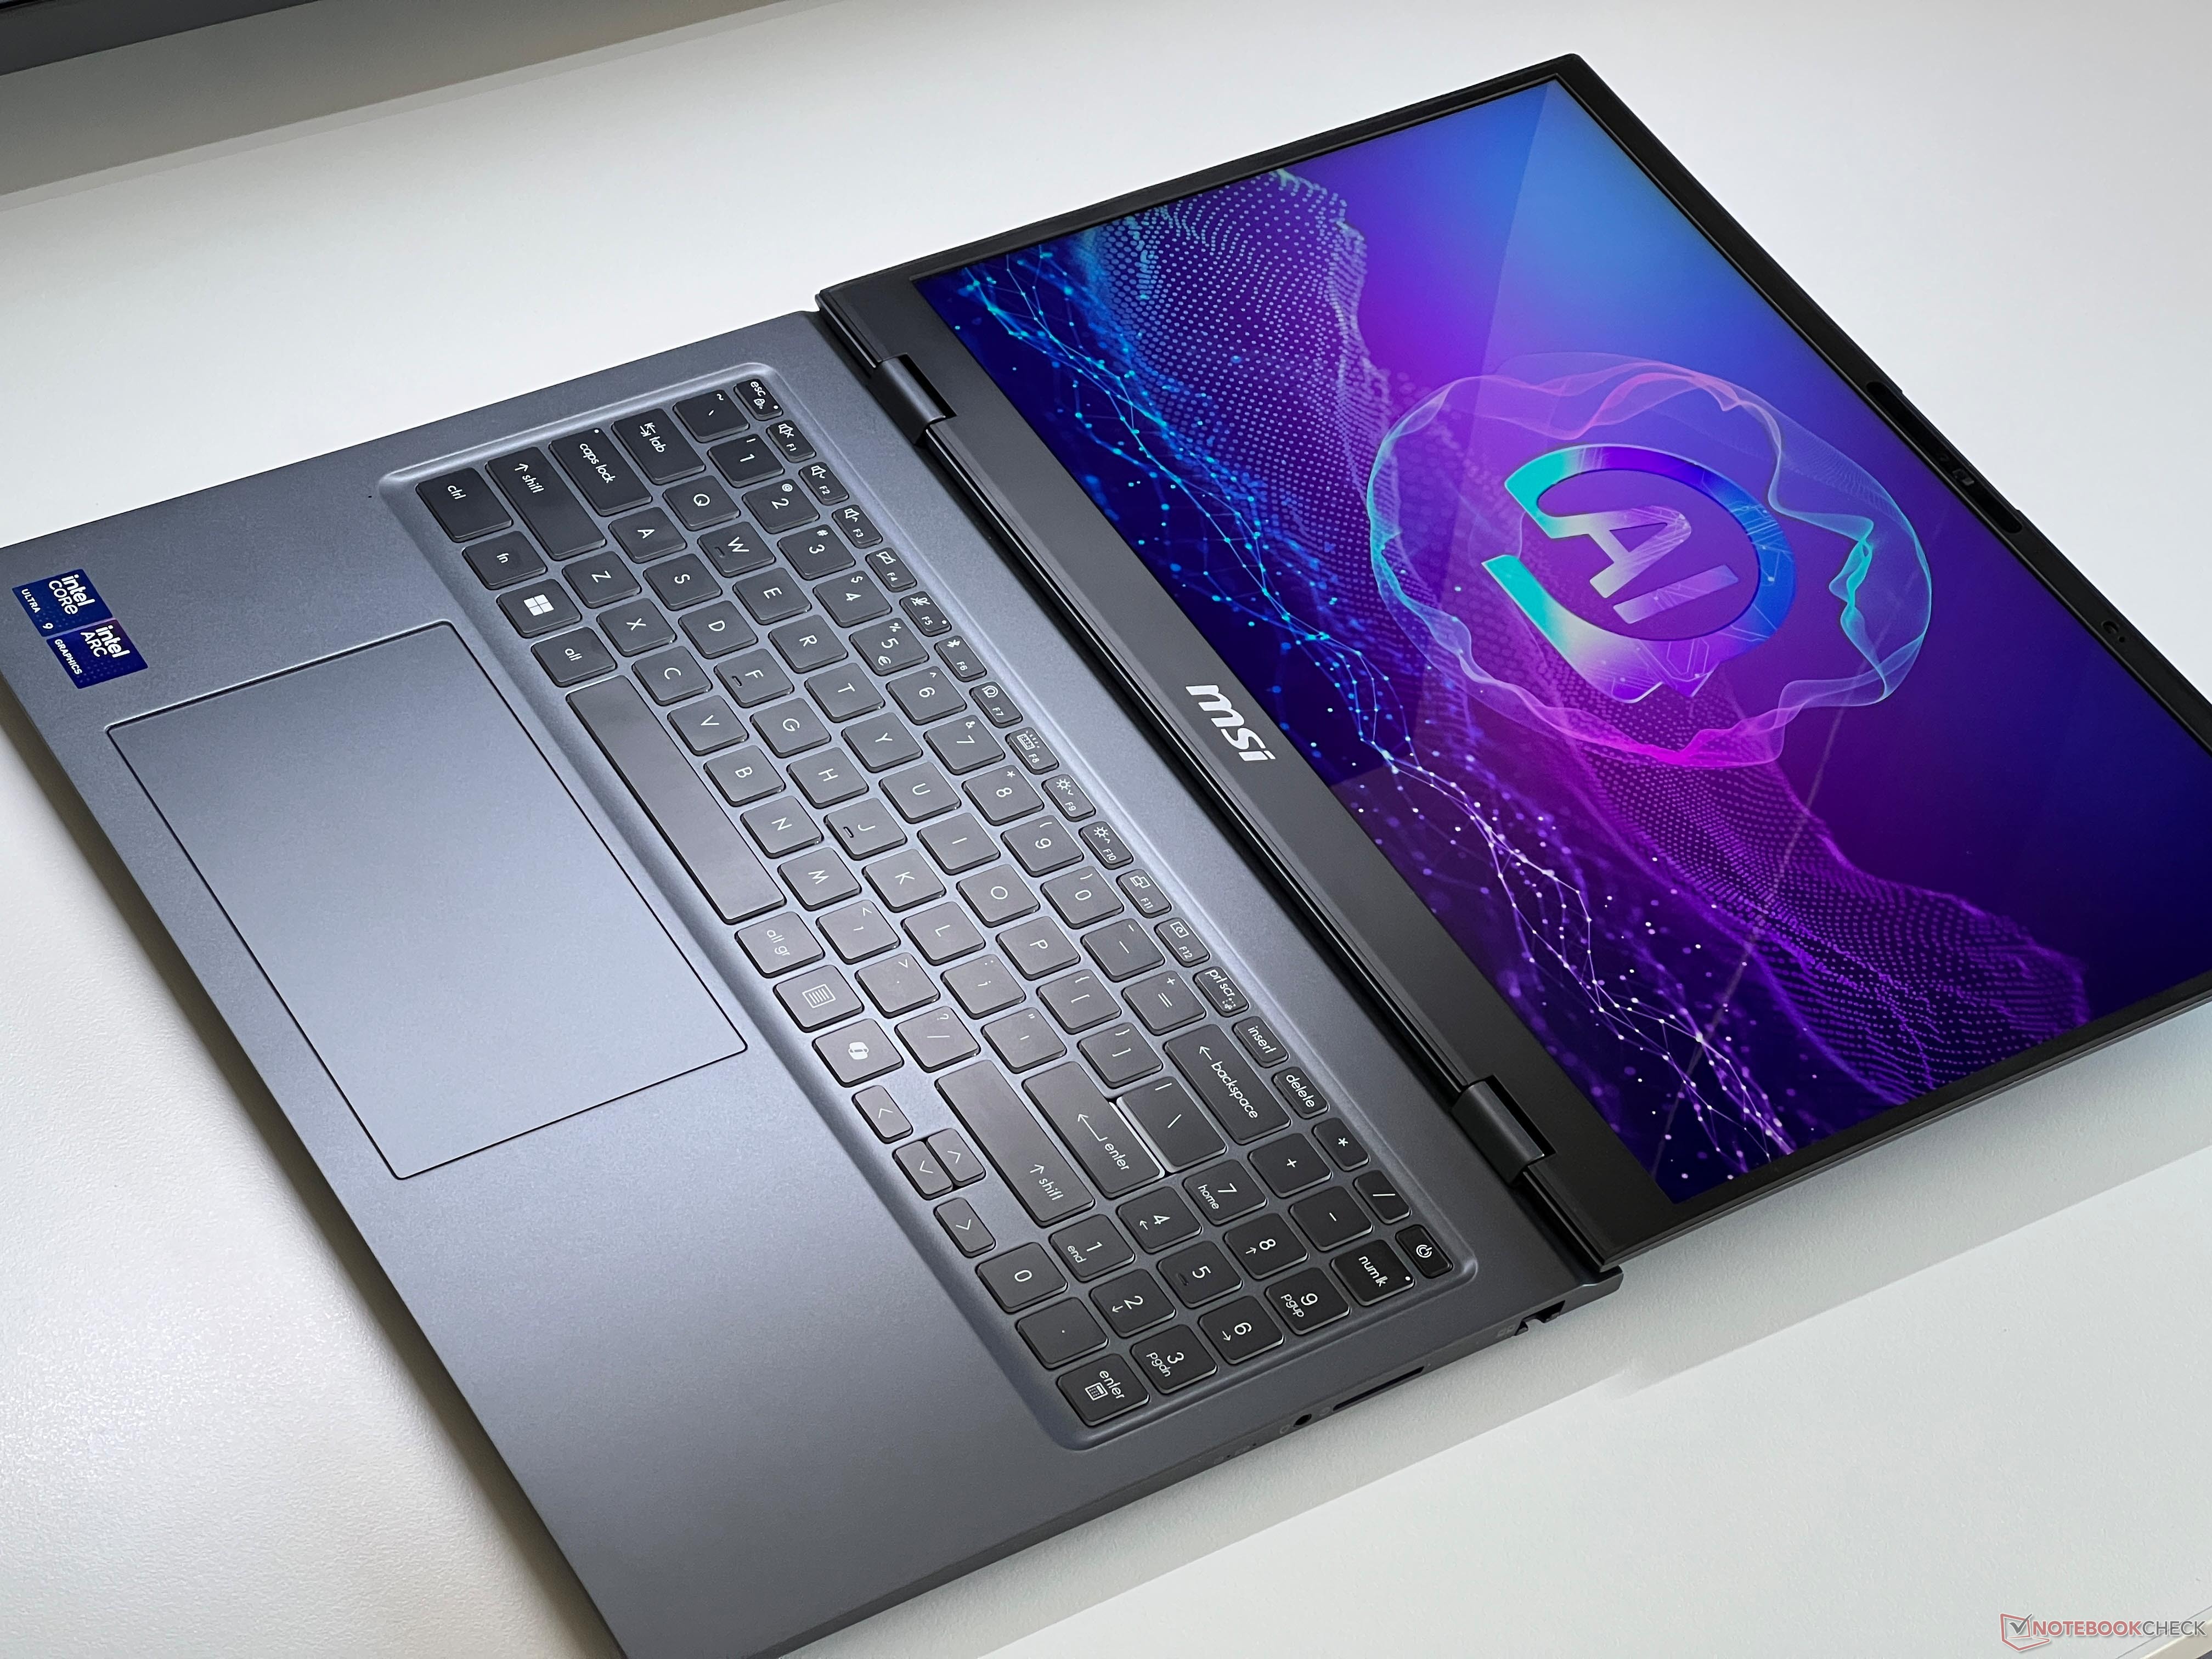
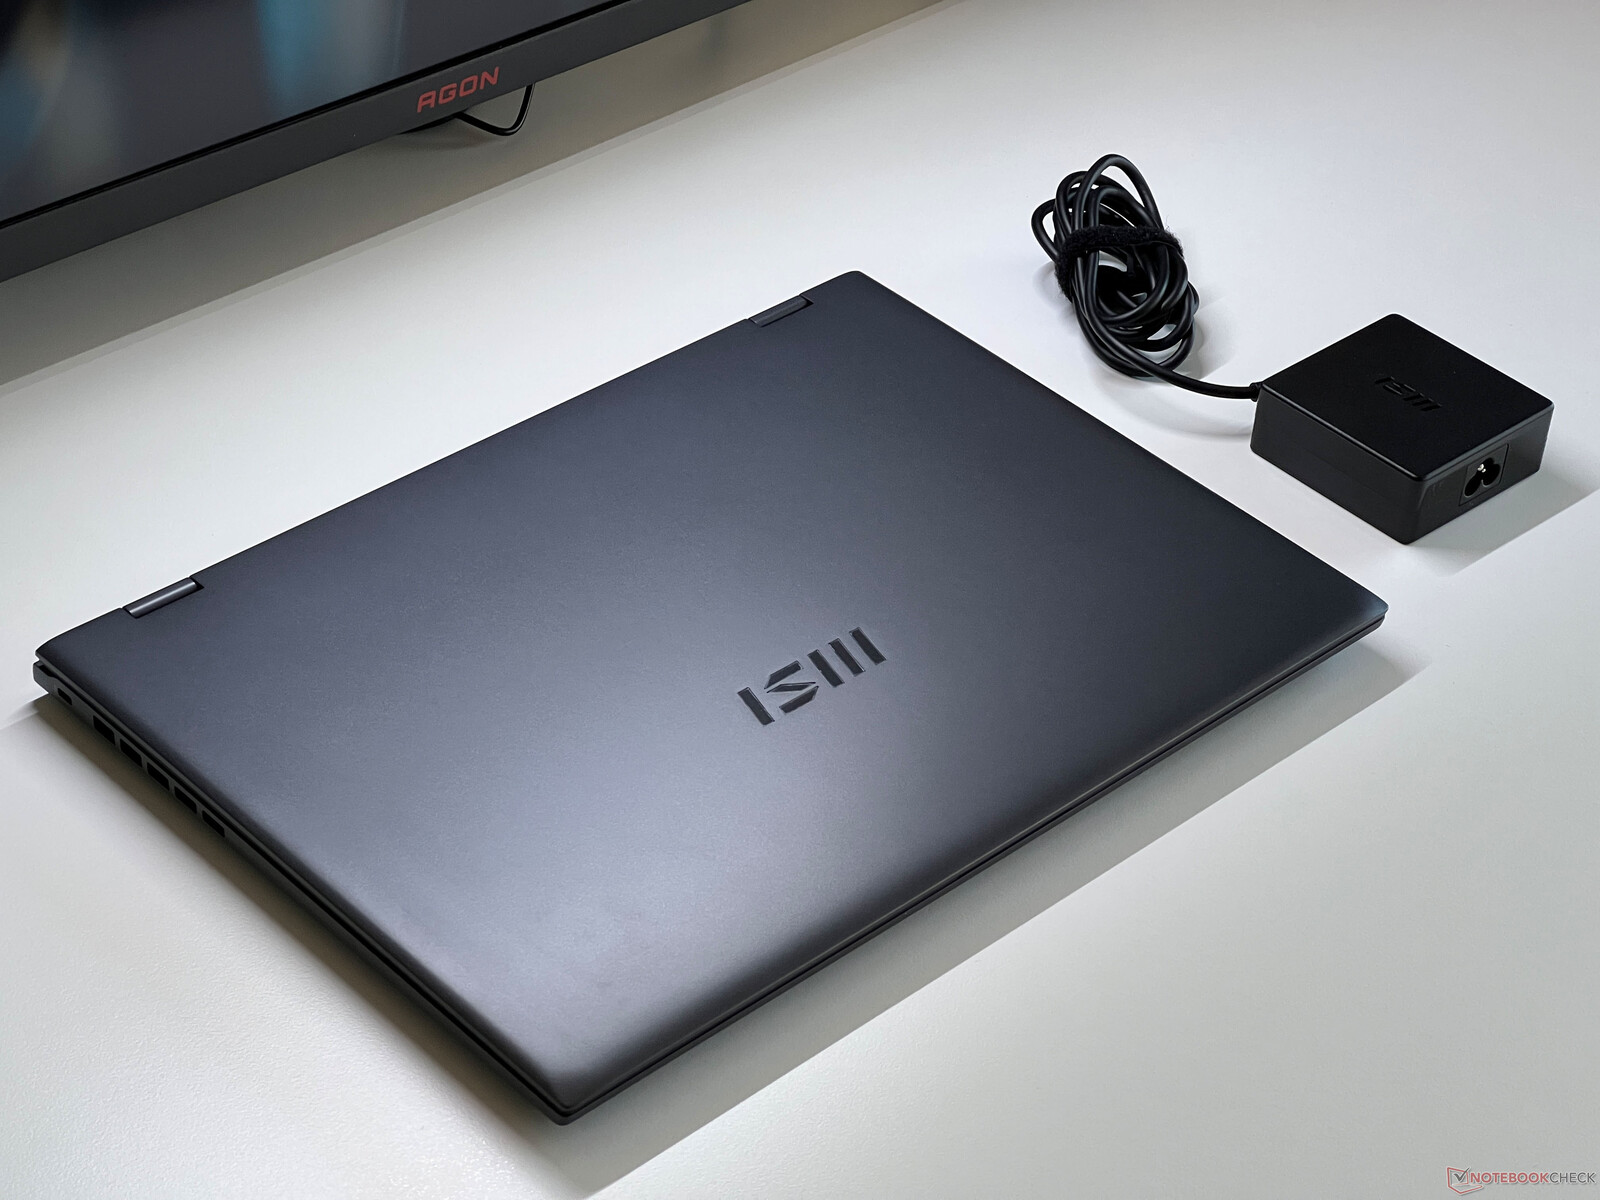
MSI Prestige 16 AI Evo to smukły i lekki 16-calowy laptop napędzany nowym procesorem Intel Arrow Lake, Core Ultra 9 285H. Ponadto bateria o pojemności 99 Wh zapewnia wyjątkowo długi czas pracy.Andreas Osthoff, 👁 Andreas Osthoff (tłumaczenie DeepL / Ninh Duy) Opublikowany 🇺🇸 🇩🇪 ...
Werdykt - MSI Prestige 16 Evo ma duży potencjał, ale słabe punkty w jego implementacji
MSI Prestige 16 AI Evo to 16-calowy laptop multimedialny z wysokiej jakości, ale lekką metalową obudową, wygodnymi urządzeniami wejściowymi i bardzo długim czasem pracy na baterii. Nowy procesor generacji Arrow-Lake Intel Core Ultra 9 285H zapewnia o około 20% wyższą wydajność niż stare układy Meteor Lake, ale jego problemy z wysokimi limitami mocy pozostają. Jest to również zauważalne w jego chłodzeniu, ponieważ MSI zdecydowało się zainstalować tylko jeden wentylator. Jest to wystarczające dla bardziej oszczędnych konfiguracji Lunar Lake, ale model Arrow Lake znacznie zyskałby na wydajniejszym chłodzeniu. MSI zaprzepaściło bardzo dobrą okazję do stworzenia cichego laptopa multimedialnego.
Jego wyświetlacz oferuje przyzwoitą jakość, ale jego niska częstotliwość 60 Hz, wysoce odblaskowa powierzchnia i powolny czas reakcji są wadami. Nie wiemy jeszcze dokładnie, z jakim panelem Prestige zostanie wprowadzony na rynek w Niemczech, gdzie przeprowadzono ten test; na przykład wersja Lunar Lake jest sprzedawana z panelem 4K IPS, a jest też wersja 4K OLED - ale częstotliwość zawsze wynosi 60 Hz.
Ponadto rozmieszczenie portów okazało się mniej niż idealne podczas naszego testu, ponieważ wszystkie porty USB znajdują się z tyłu urządzenia, co jest po prostu niepraktyczne. Kolejne wady obejmują przylutowaną pamięć RAM, kamerę internetową 1080p (identyczny model Lunar Lake jest już wyposażony w czujnik 5 MP) oraz 100-watowy zasilacz, który nie wystarcza do pokrycia zapotrzebowania procesora na energię podczas szczytowego obciążenia. Podsumowując, Prestige 16 AI Evo ma potencjał, aby być niesamowitym laptopem multimedialnym, ale niektóre niepotrzebne decyzje projektowe uniemożliwiają to.
Za
Przeciw
Cena i dostępność
MSI Prestige 16 AI z nowym procesorem Arrow Lake nie jest jeszcze dostępny w sklepach.
Porównanie możliwych alternatyw
Obraz | Model / recenzja | Cena | Waga | Wysokość | Ekran |
|---|---|---|---|---|---|
1. 82.8%  | MSI Prestige 16 AI Evo B2HMG Intel Core Ultra 9 285H ⎘ Intel Arc Graphics 140T ⎘ 32 GB Pamięć, 1024 GB SSD | Amazon: 1. $18.99 Vaxson 2-Pack Protector Film... 2. $1,599.99 MSI Prestige 16 AI EVO Busin... 3. $1,299.99 MSI Prestige 16 AI Studio B1... | 1.6 kg | 18.95 mm | 16.00" 2560x1600 189 PPI IPS |
2. 86.6%  | Lenovo ThinkBook 16 G7+ AMD AMD Ryzen AI 9 365 ⎘ AMD Radeon 880M ⎘ 32 GB Pamięć, 1024 GB SSD | Amazon: 1. $784.28 Lenovo ThinkBook 16 G7 ARP 2... 2. $899.00 Lenovo ThinkBook 16 G7 ARP 2... 3. $609.95 Lenovo ThinkBook 16 G7 ARP 2... Cena katalogowa: 1399€ | 1.9 kg | 16.9 mm | 16.00" 3200x2000 236 PPI IPS |
3. 81.9%  | MSI Prestige A16 AI+ A3HMG-036 AMD Ryzen AI 9 365 ⎘ AMD Radeon 880M ⎘ 32 GB Pamięć, 1024 GB SSD | Cena katalogowa: 1599 Euro | 2 kg | 17.35 mm | 16.00" 2560x1600 189 PPI IPS |
4. 93%  | Apple MacBook Pro 16 2024 M4 Pro Apple M4 Pro (14 cores) ⎘ Apple M4 Pro 20-Core GPU ⎘ 48 GB Pamięć, 2048 GB SSD | Amazon: $2,723.00 Cena katalogowa: 4219€ | 2.1 kg | 16.8 mm | 16.20" 3456x2234 254 PPI Mini-LED |
5. 84.7%  | Asus Zenbook S 16 UM5606-RK333W AMD Ryzen AI 9 HX 370 ⎘ AMD Radeon 890M ⎘ 32 GB Pamięć, 1024 GB SSD | Amazon: 1. $1,649.99 ASUS Zenbook S 16 Laptop, AM... 2. $1,859.00 HIDevolution [2024] ASUS Zen... 3. $1,079.00 ASUS Vivobook S 16 OLED Lapt... Cena katalogowa: 2100€ | 1.5 kg | 12.9 mm | 16.00" 2880x1800 212 PPI OLED |
6. 88.9% v7 (old)  | Samsung Galaxy Book4 Pro 16 Intel Core Ultra 7 155H ⎘ Intel Arc 8-Core iGPU ⎘ 16 GB Pamięć, 512 GB SSD | Amazon: $1,719.00 Cena katalogowa: 1999€ | 1.5 kg | 12.5 mm | 16.00" 2880x1800 212 PPI OLED |
Spis treści
- Werdykt - MSI Prestige 16 Evo ma duży potencjał, ale słabe punkty w jego implementacji
- Specyfikacje
- Obudowa - stop magnezu i aluminium
- Łączność - Thunderbolt i Wi-Fi 7
- Urządzenia wejściowe - Wygodna klawiatura
- Wyświetlacz - WQHD IPS przy 60 Hz
- Wydajność - Arrow Lake-H przy 115 watach
- Emisje - MSI Prestige z tylko jednym wentylatorem
- Zarządzanie energią - imponująca żywotność baterii
- Łączna ocena Notebookcheck
MSI Prestige 16 AI Evo to smukły i lekki 16-calowy laptop multimedialny z magnezową obudową i zupełnie nowym mobilnym procesorem Arrow Lake, czyli Intel Core Ultra 9 285H. Nasze urządzenie testowe posiada wyświetlacz IPS o rozdzielczości 2560 x 1600 pikseli. Model Arrow Lake nie jest jeszcze dostępny w sklepach; na razie dostępny jest tylko identyczny model Lunar Lake z wyświetlaczem 4K IPS. Obecnie zakładamy, że jego cena wyniesie nieco ponad 2000 dolarów.
Specyfikacje
Obudowa - stop magnezu i aluminium
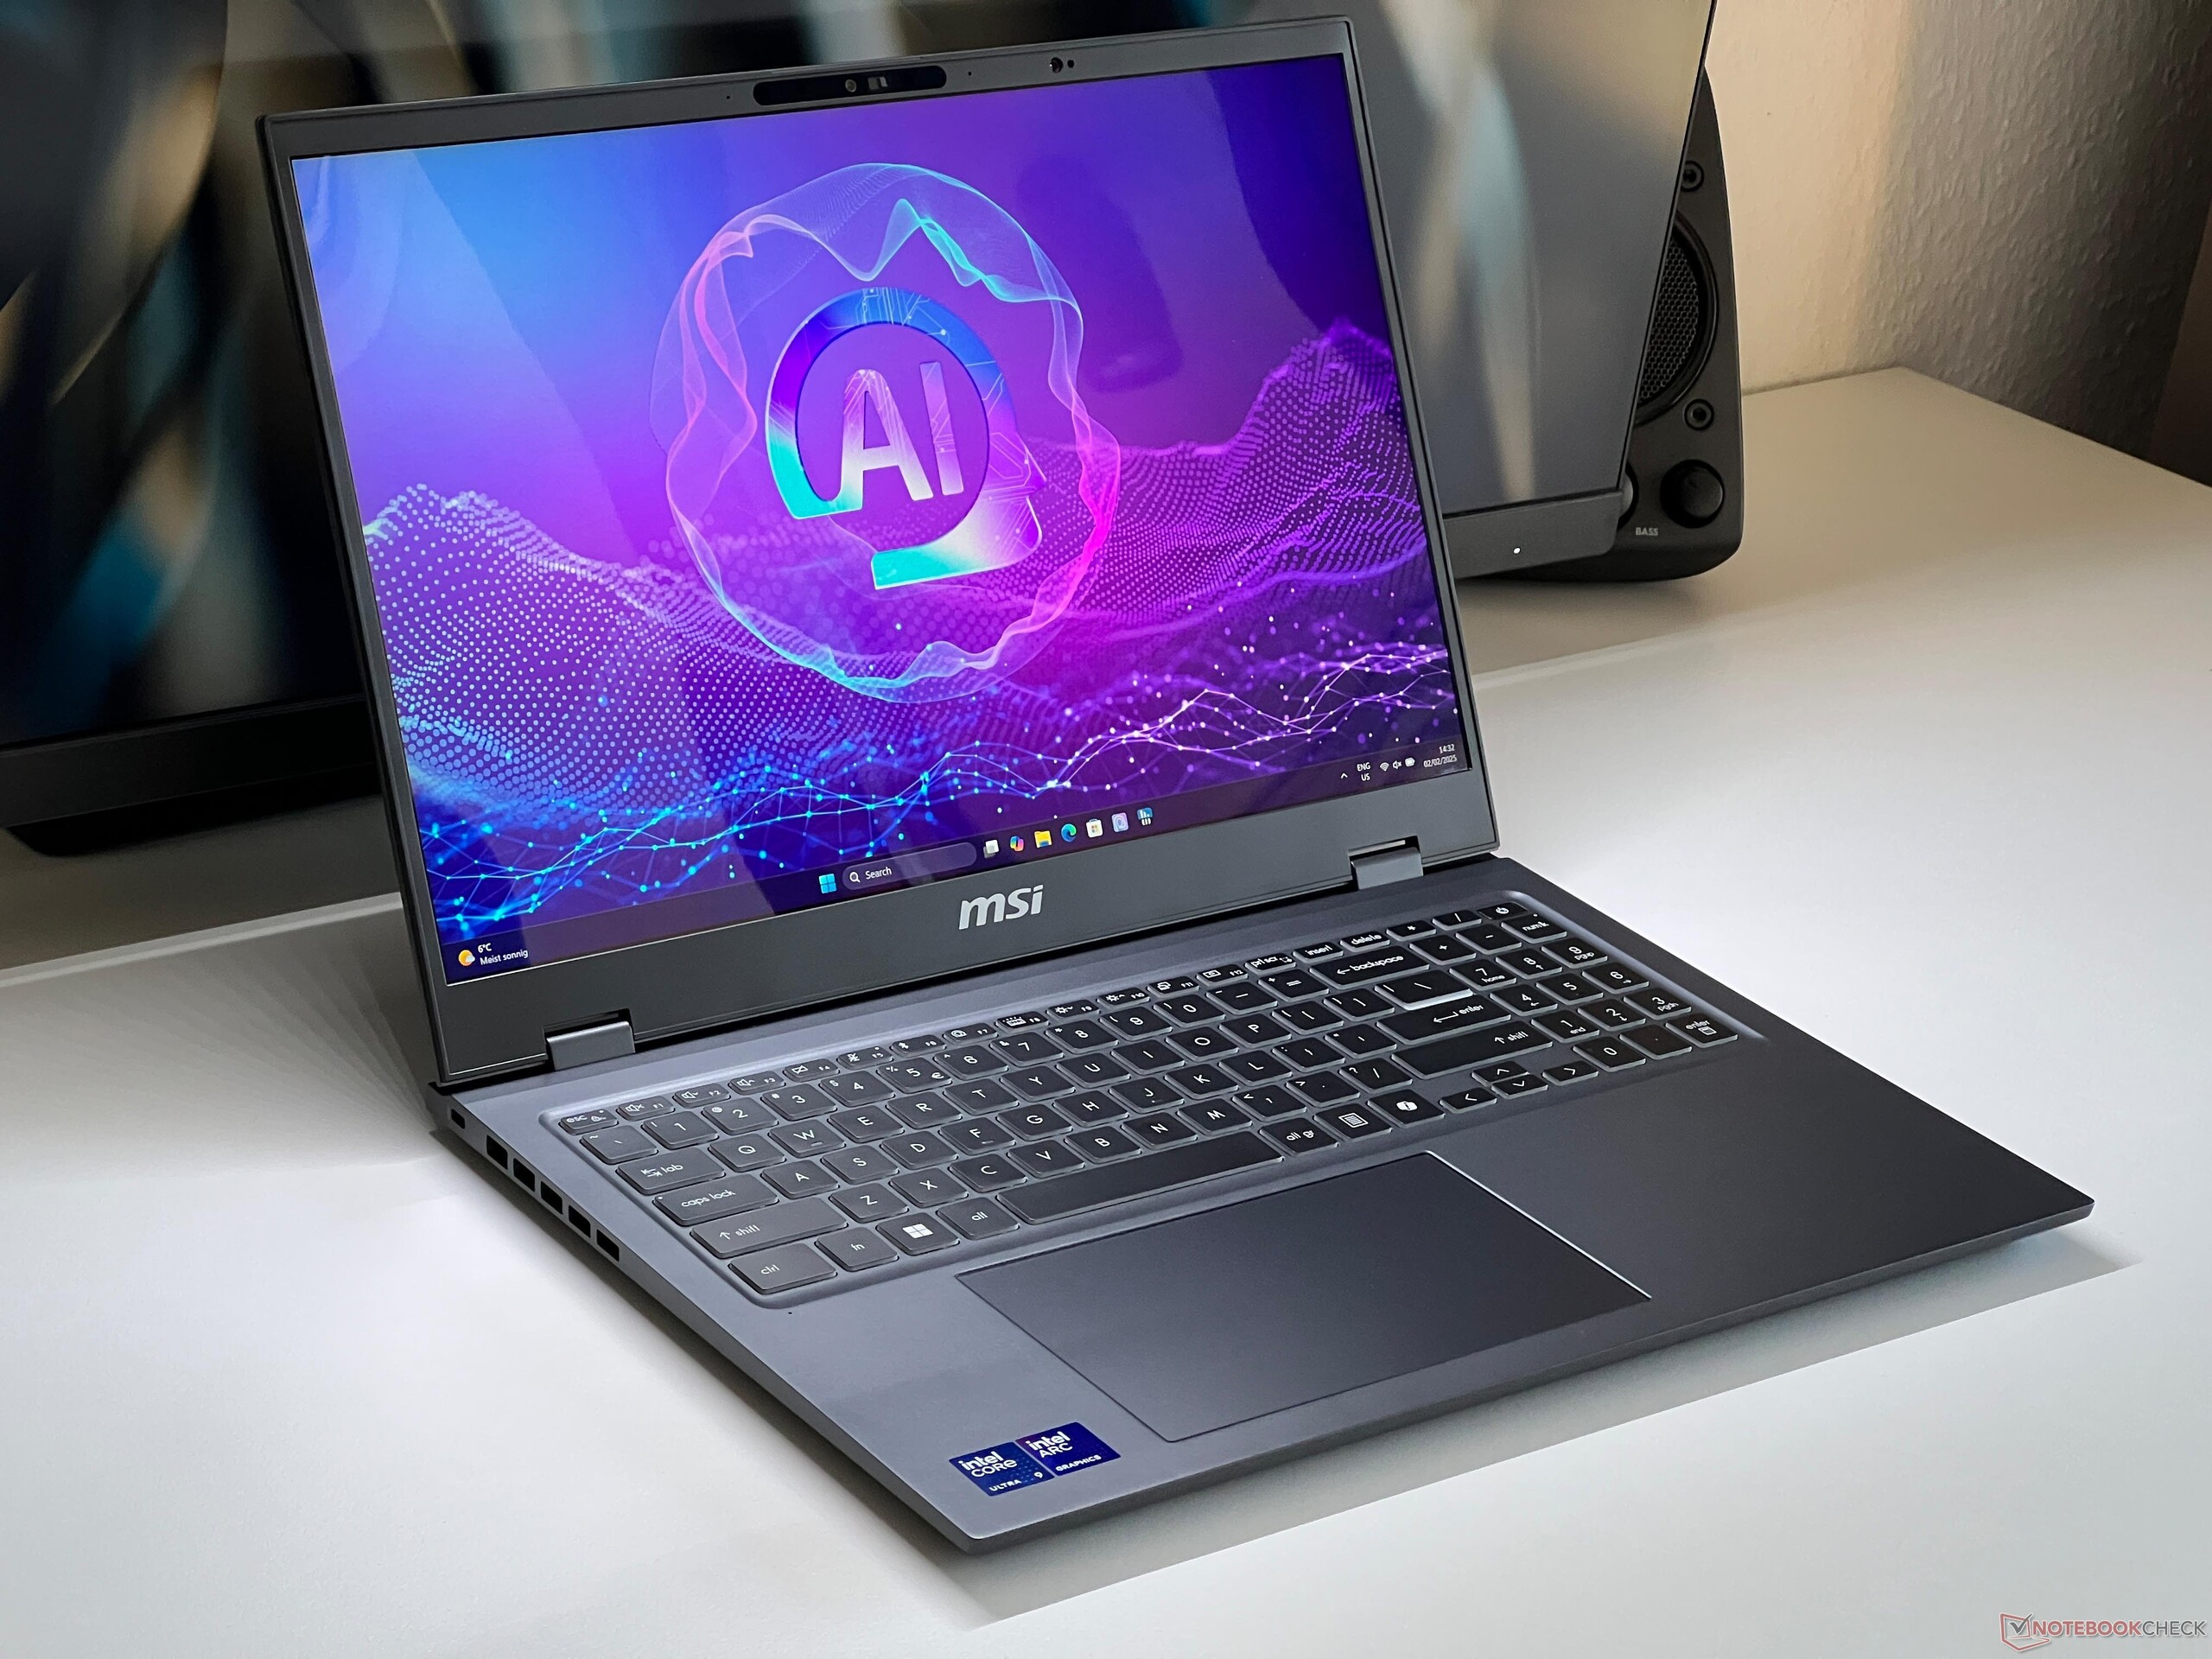
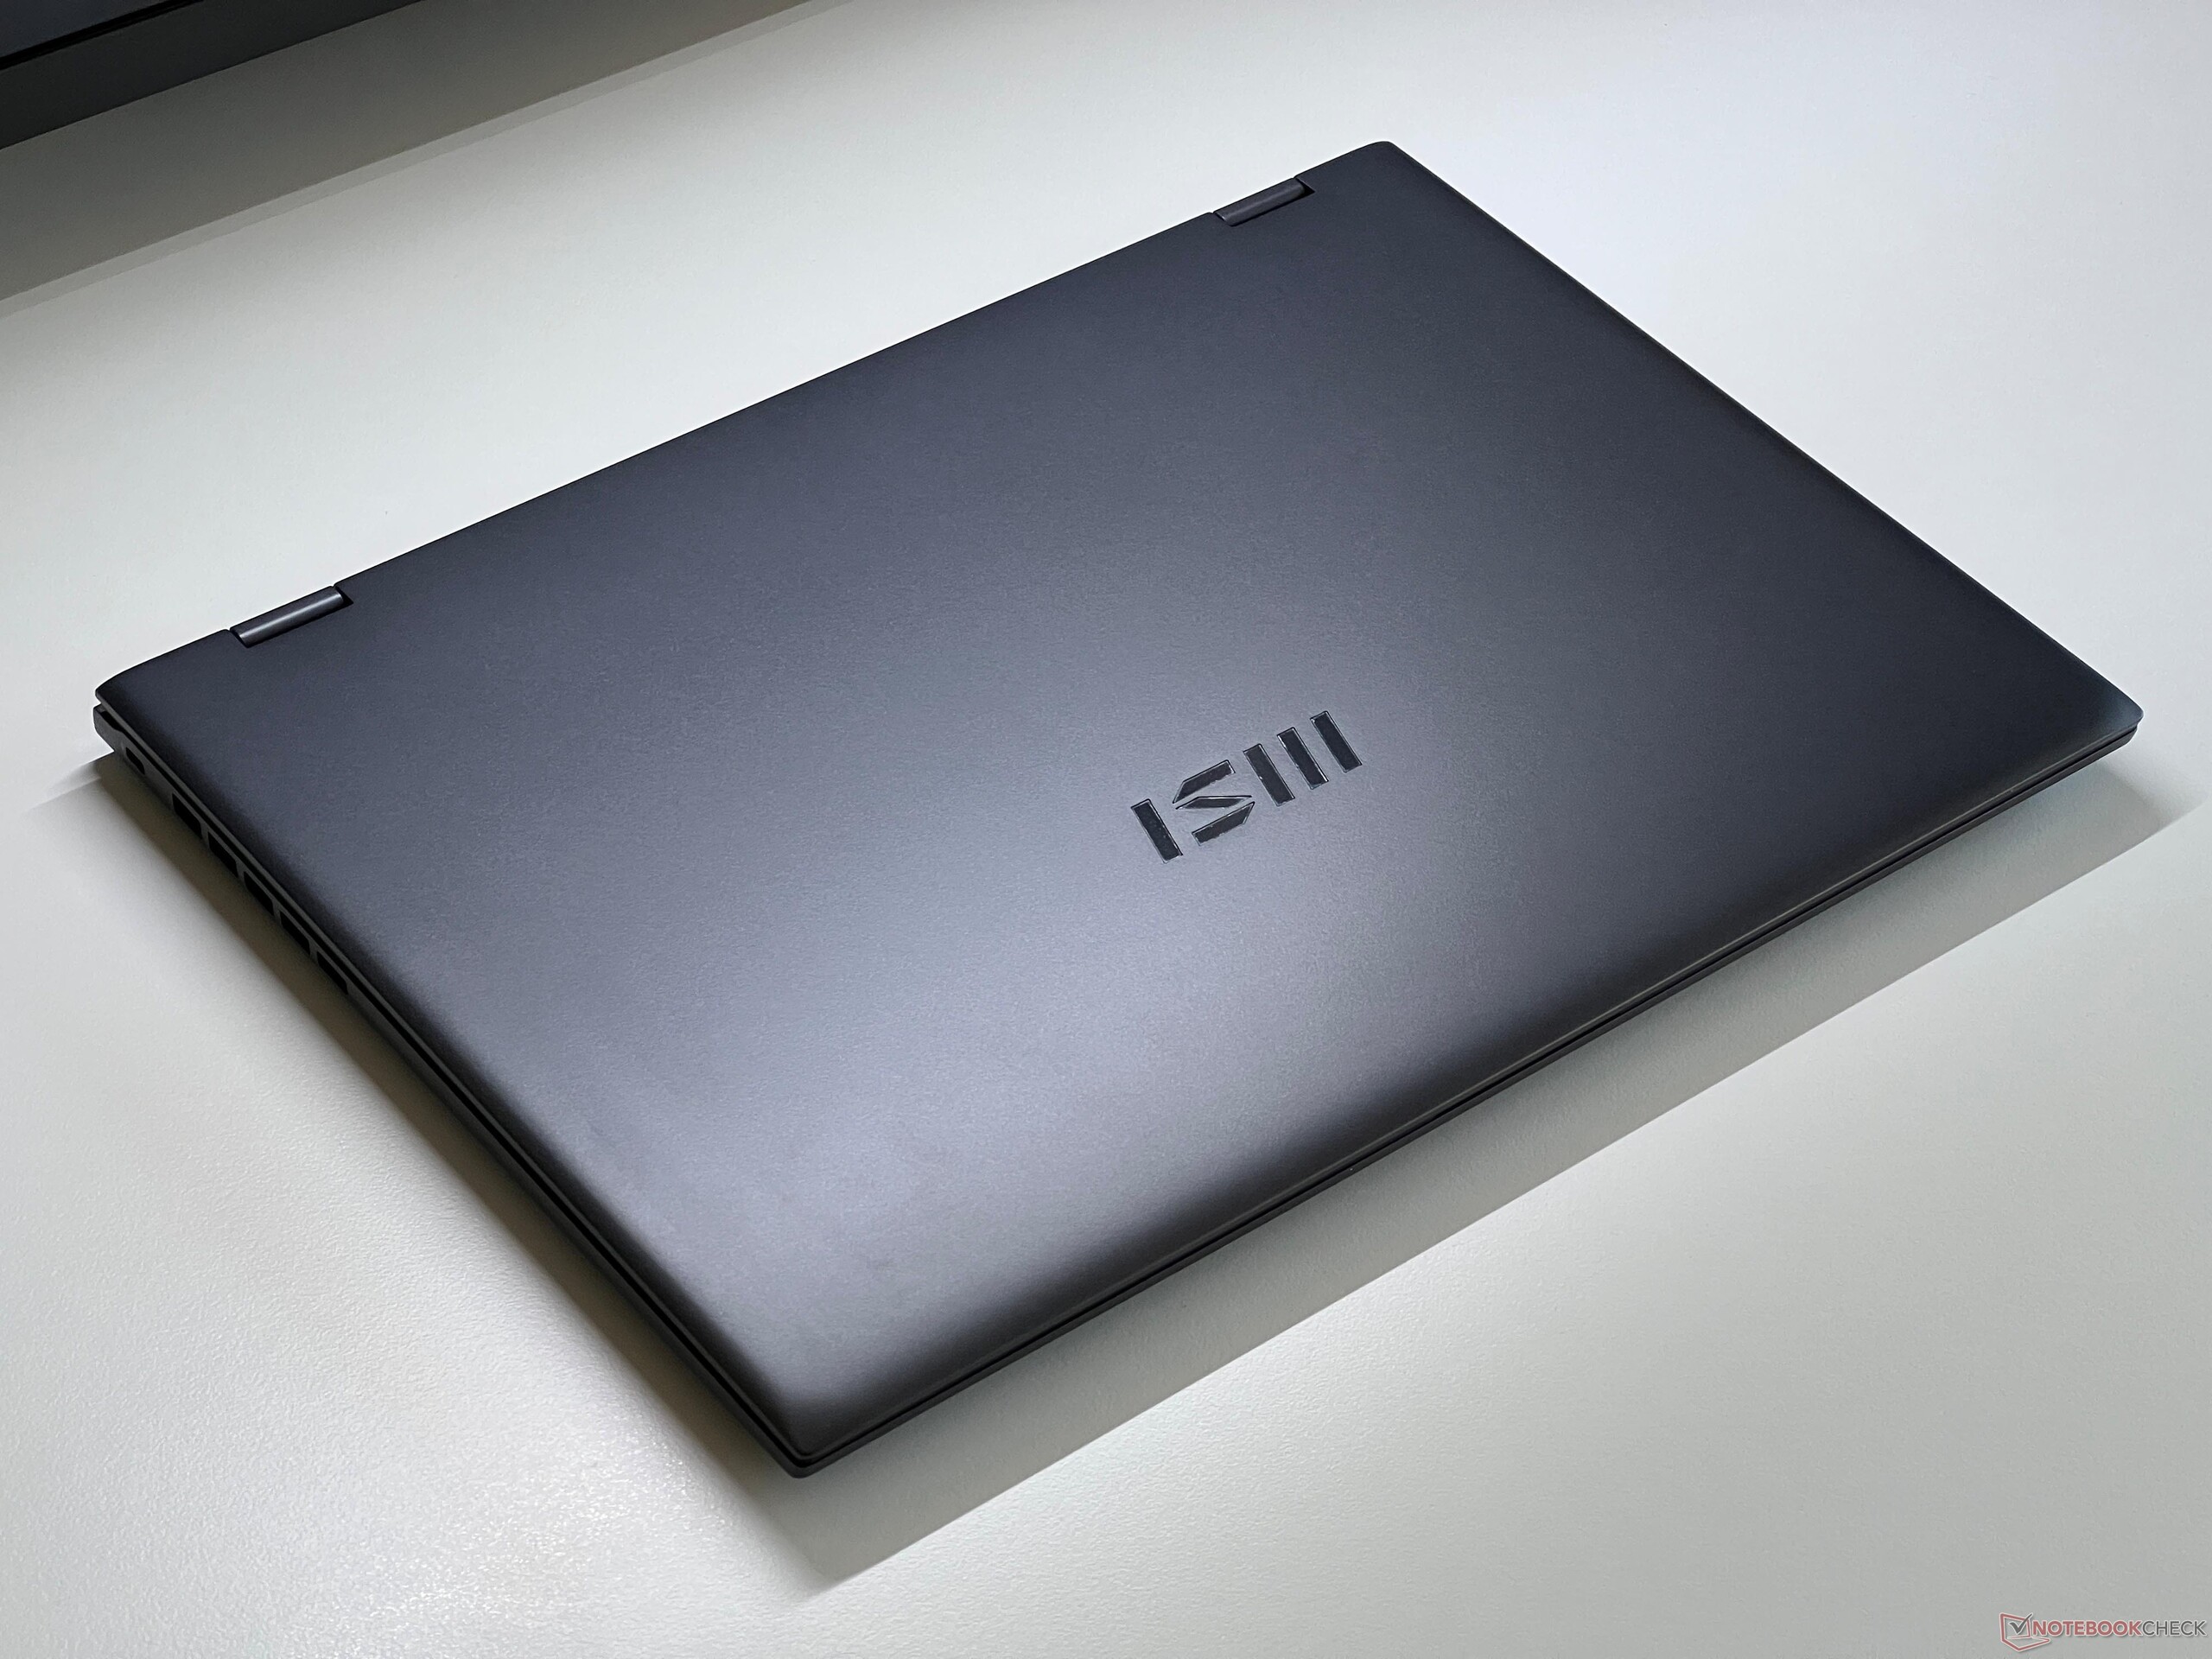
W przypadku obudowy Prestige 16 AI Evo, MSI postawiło na konstrukcję unibody składającą się ze stopu magnezu i aluminium w ciemnoszarym kolorze (Stellar Gray). Wykończenie i jakość wykonania wydają się być bardzo dobre, a stabilność obudowy jest również imponująca. Jednostkę bazową trudno jest wcisnąć lub przekręcić, a podczas naszych testów nie mogliśmy wydobyć z niej żadnych skrzypiących dźwięków. Jej powierzchnie nie są również zbyt podatne na zbieranie odcisków palców.
Co więcej, pokrywa ekranu jest podobnie stabilna i nie udało nam się sprowokować żadnych błędów obrazu podczas wywierania selektywnego nacisku. Zawiasy są bardzo ciasne, ale pokrywa nadal lekko się chwieje, gdy reguluje się jej kąt. Można ją otworzyć jedną ręką, a maksymalny kąt otwarcia wynosi 180 stopni.

Nasze urządzenie testowe waży 1,561 kg i w rezultacie jest jednym z lżejszych modeli w naszej grupie porównawczej (porównywalnym do Zenbook S 16 & Galaxy Book4 Pro 16), podczas gdy pozostałe modele są znacznie cięższe i ważą około 2 kg. Mając niecałe 17-19 mm, MSI jest w rzeczywistości najgrubszym urządzeniem, a jeśli chodzi o ich powierzchnię, wszyscy konkurenci są dość podobni. 100-watowy zasilacz waży 365 gramów z dołączonym kablem zasilającym.
Łączność - Thunderbolt i Wi-Fi 7
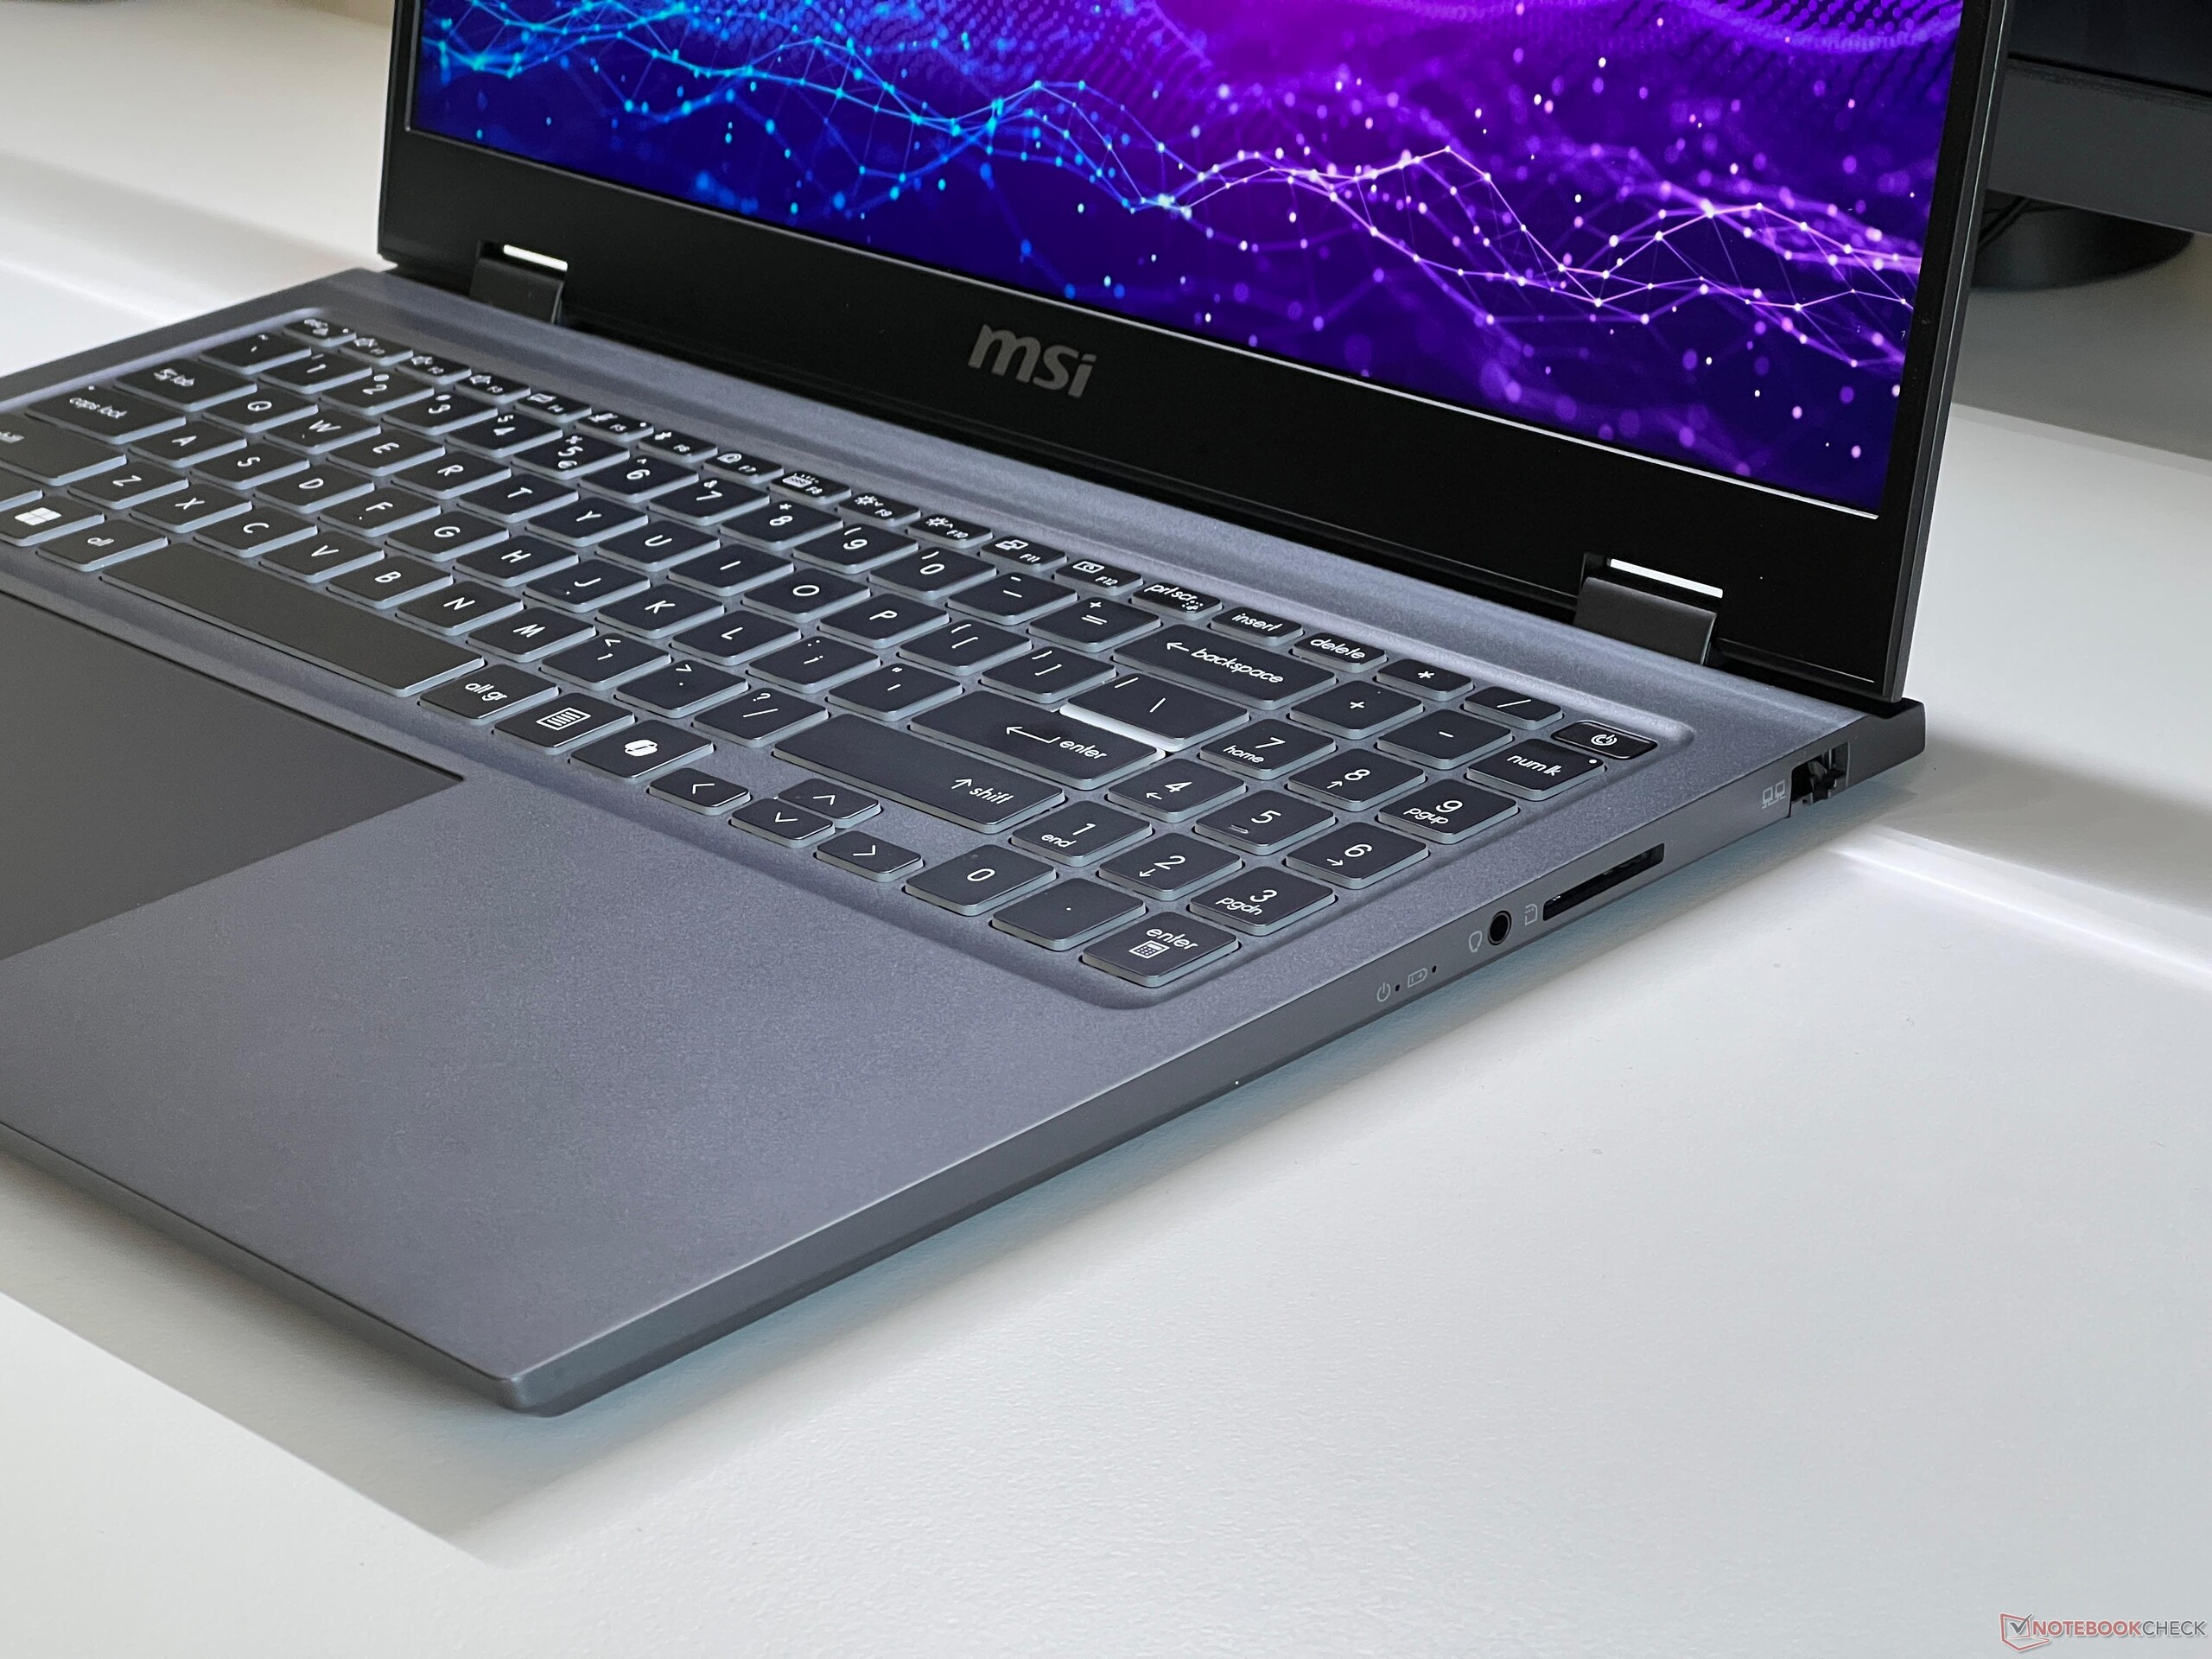
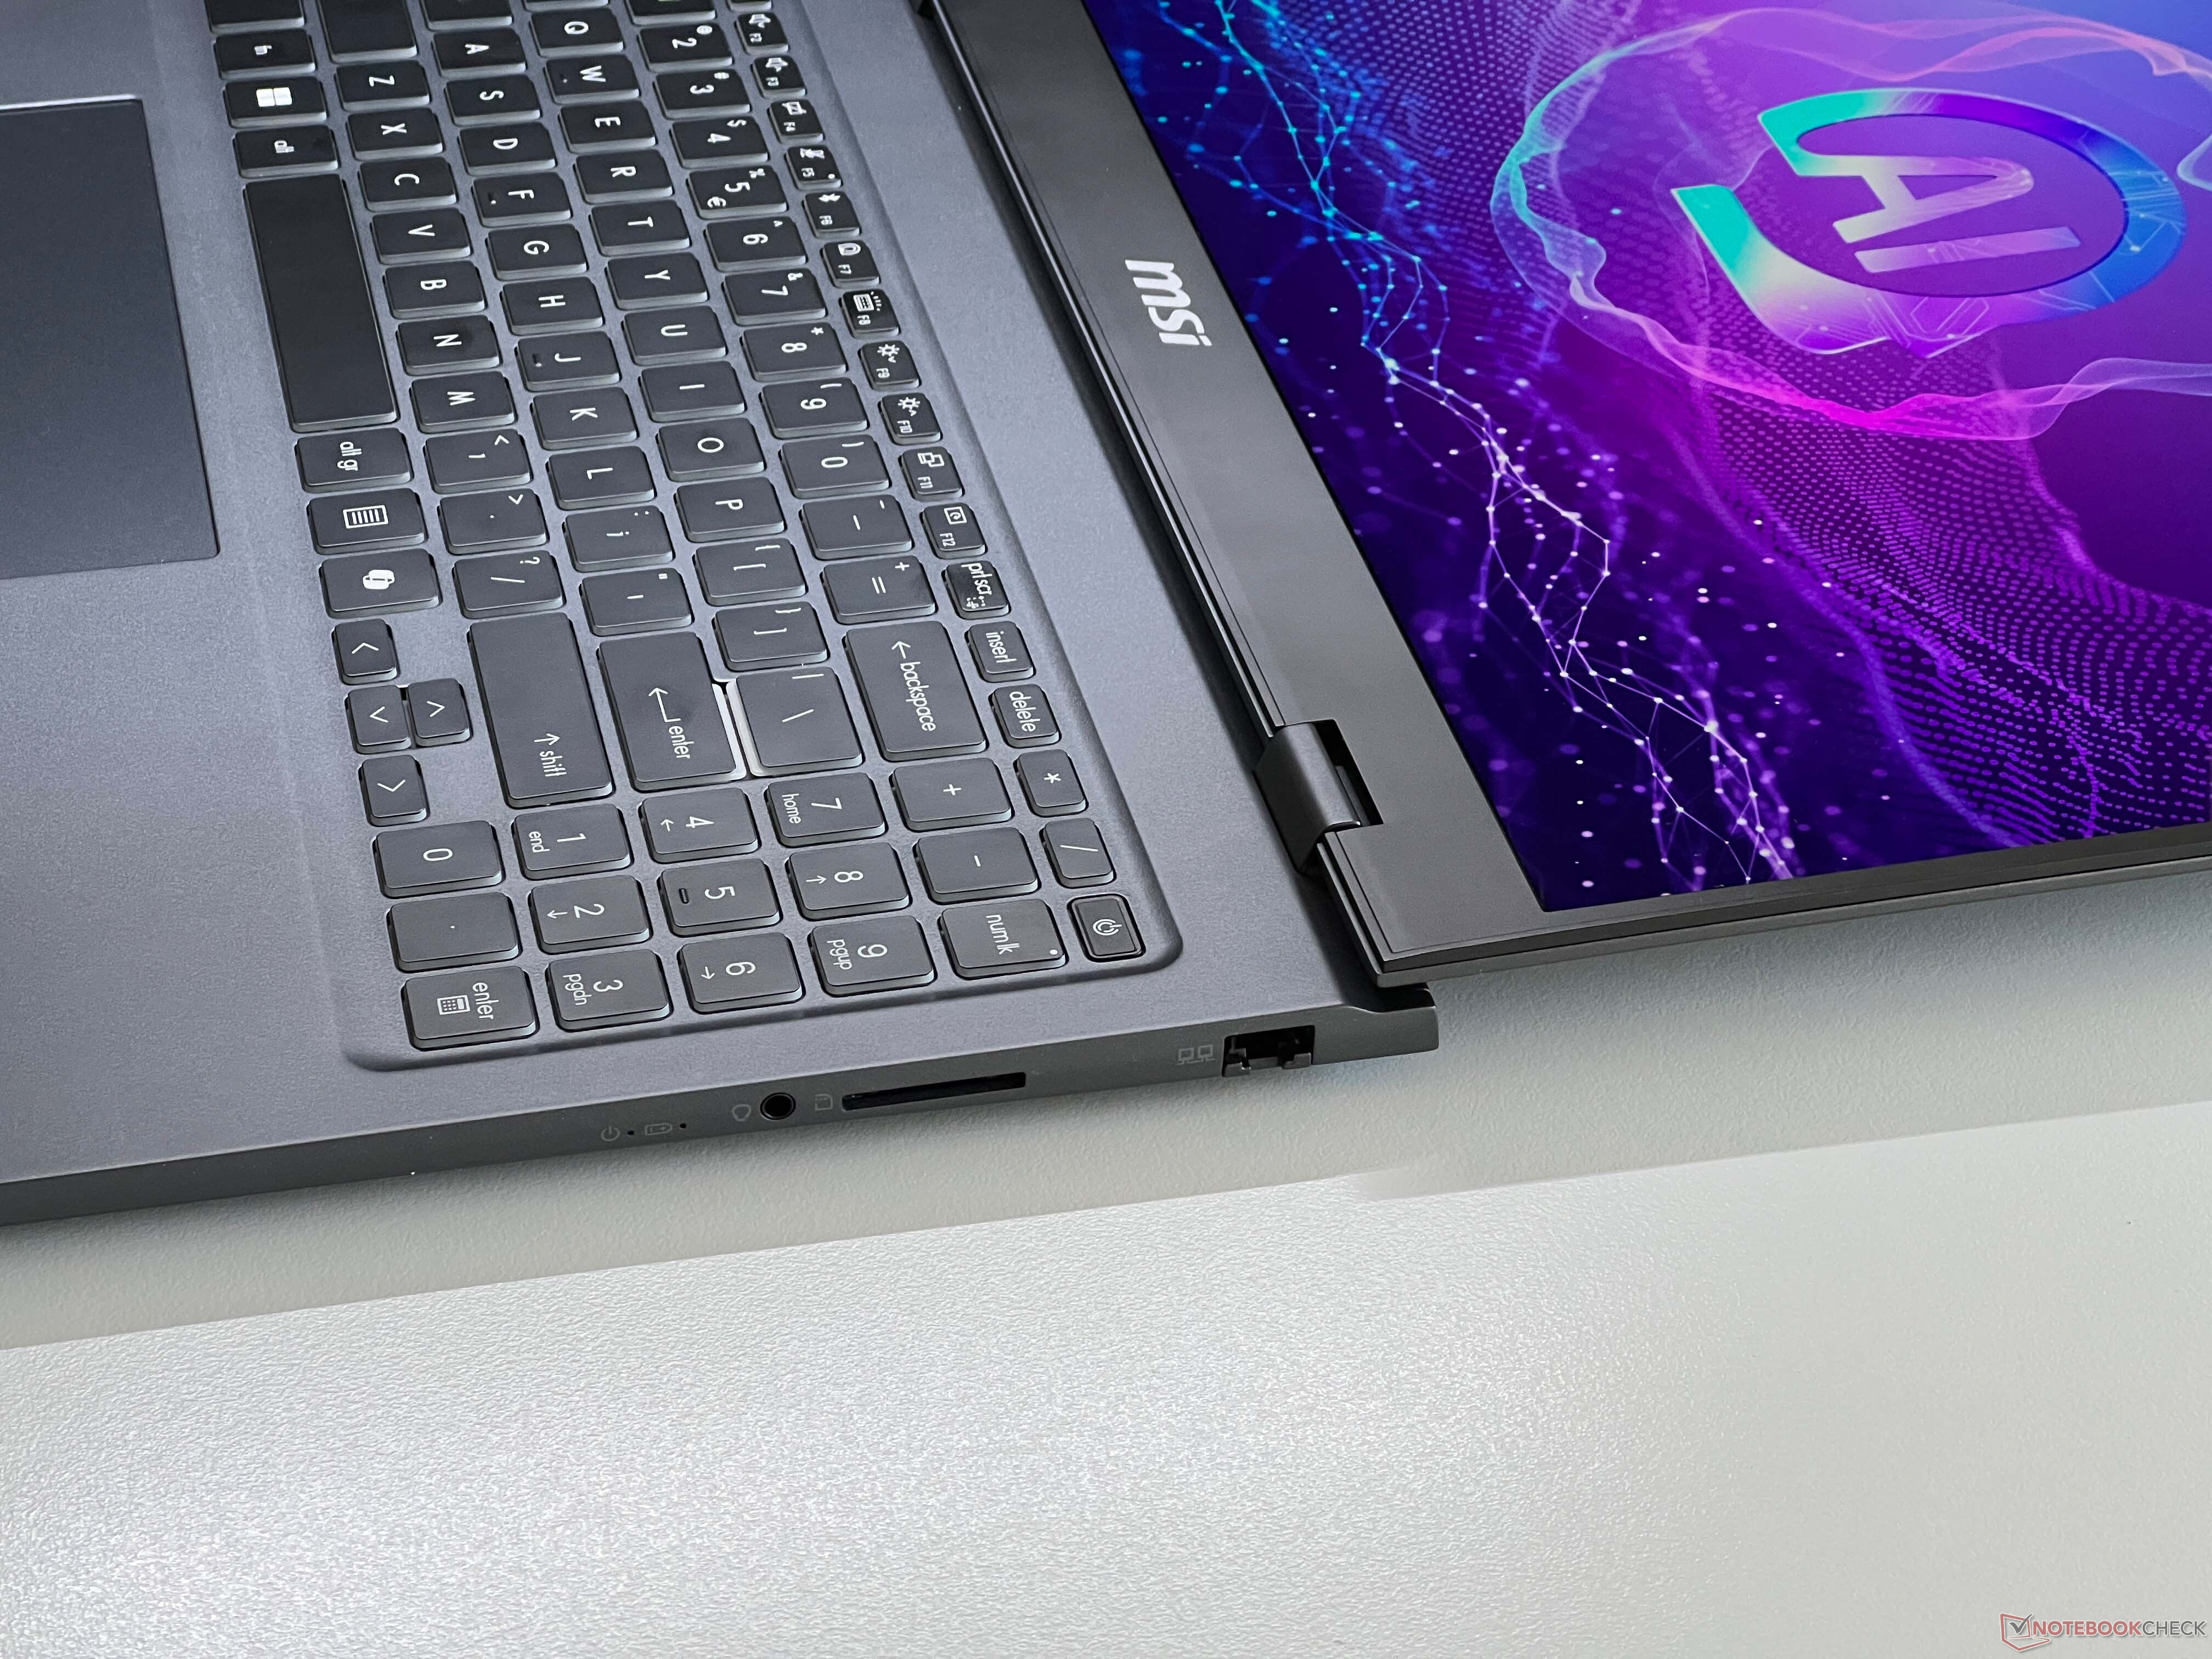
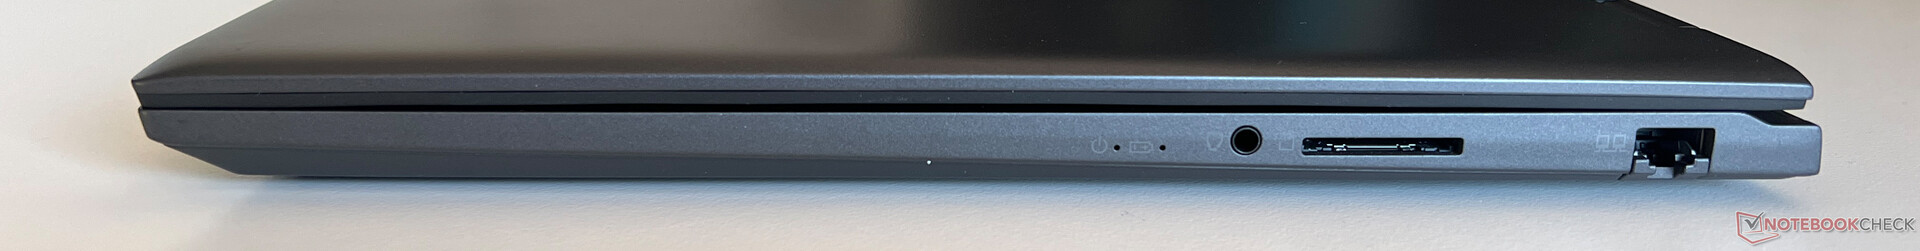
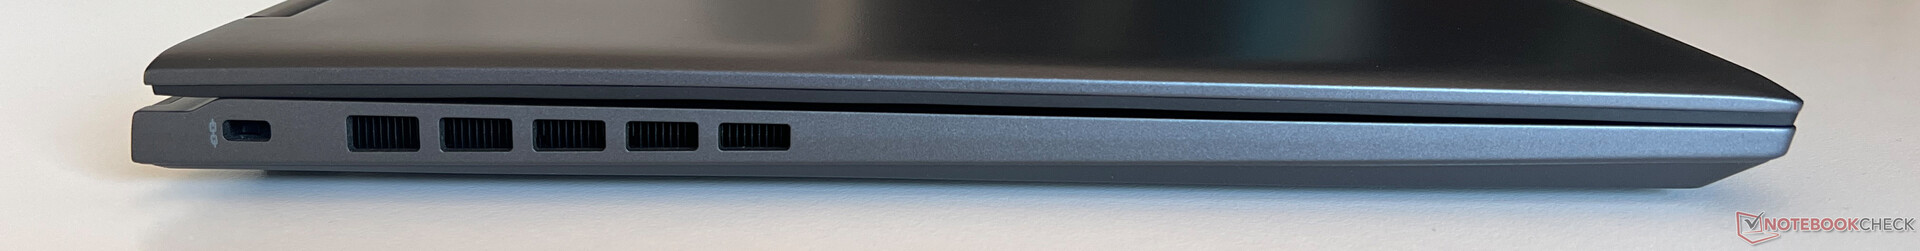
Ogólnie rzecz biorąc, Prestige posiada wszystkie najważniejsze porty, w tym USB-C, USB-A, Gigabit Ethernet i czytnik kart SD. Nie jesteśmy jednak zadowoleni z ich rozmieszczenia, ponieważ wszystkie porty USB znajdują się z tyłu urządzenia. Po lewej stronie nie ma ani jednego portu, co wynika z wewnętrznego układu laptopa. Jest to po prostu niesamowicie niepraktyczne podczas codziennego użytkowania i nie rozumiemy tej decyzji. NPU nowych procesorów Arrow Lake nie spełnia minimalnych wymagań dla komputera Copilot+, ale funkcje takie jak Studio Effects lub napisy na żywo są nadal obsługiwane.

Czytnik kart SD
Po prawej stronie laptopa znajduje się pełnoprawny czytnik kart z mechanizmem sprężynowym. Włożone karty tylko minimalnie wystają z obudowy. W połączeniu z naszą kartą referencyjną (Angelbird AV Pro V60), zmierzyliśmy prędkości transferu w zakresie 80-90 MB/s. Wyniki te są w porządku, ale wiele urządzeń porównawczych wypadło lepiej.
| SD Card Reader | |
| average JPG Copy Test (av. of 3 runs) | |
| Apple MacBook Pro 16 2024 M4 Pro (Angelbird AV Pro V60) | |
| Asus Zenbook S 16 UM5606-RK333W (Angelbird AV Pro V60) | |
| MSI Prestige A16 AI+ A3HMG-036 | |
| Średnia w klasie Multimedia (18.4 - 201, n=57, ostatnie 2 lata) | |
| Lenovo ThinkBook 16 G7+ AMD (Angelbird AV Pro V60) | |
| MSI Prestige 16 AI Evo B2HMG (Angelbird AV Pro V60) | |
| Samsung Galaxy Book4 Pro 16 (Angelbird AV Pro V60) | |
| maximum AS SSD Seq Read Test (1GB) | |
| Asus Zenbook S 16 UM5606-RK333W (Angelbird AV Pro V60) | |
| Apple MacBook Pro 16 2024 M4 Pro (Angelbird AV Pro V60) | |
| MSI Prestige A16 AI+ A3HMG-036 | |
| Średnia w klasie Multimedia (25.8 - 266, n=57, ostatnie 2 lata) | |
| Samsung Galaxy Book4 Pro 16 (Angelbird AV Pro V60) | |
| Lenovo ThinkBook 16 G7+ AMD (Angelbird AV Pro V60) | |
| MSI Prestige 16 AI Evo B2HMG (Angelbird AV Pro V60) | |
Komunikacja

Prestige posiada gigabitowy port Ethernet po prawej stronie. Oczywiście zainstalowano również moduł WLAN, a mianowicie nowoczesny moduł Intel Killer BE1750 Wi-Fi 7. W połączeniu z naszym referencyjnym routerem od Asusa, odnotowaliśmy bardzo dobre i stabilne prędkości transferu. Moduł obsługuje również Bluetooth 5.4.
| Networking | |
| MSI Prestige 16 AI Evo B2HMG | |
| iperf3 transmit AXE11000 | |
| iperf3 receive AXE11000 | |
| Lenovo ThinkBook 16 G7+ AMD | |
| iperf3 transmit AXE11000 | |
| iperf3 receive AXE11000 | |
| MSI Prestige A16 AI+ A3HMG-036 | |
| iperf3 transmit AXE11000 | |
| iperf3 receive AXE11000 | |
| iperf3 transmit AXE11000 6GHz | |
| iperf3 receive AXE11000 6GHz | |
| Apple MacBook Pro 16 2024 M4 Pro | |
| iperf3 transmit AXE11000 | |
| iperf3 receive AXE11000 | |
| Asus Zenbook S 16 UM5606-RK333W | |
| iperf3 transmit AXE11000 | |
| iperf3 receive AXE11000 | |
| Samsung Galaxy Book4 Pro 16 | |
| iperf3 transmit AXE11000 | |
| iperf3 receive AXE11000 | |
Kamera internetowa
Kamera internetowa FHD z mechaniczną przysłoną jest wbudowana w górną ramkę wyświetlacza urządzenia. Obsługuje ona zaawansowane efekty Studio systemu Windows, a jej ogólna jakość obrazu jest w porządku, ale model Lunar Lake jest wyposażony w lepszą kamerę 5 MP. Posiada również kamerę na podczerwień do rozpoznawania twarzy za pomocą Windows Hello.


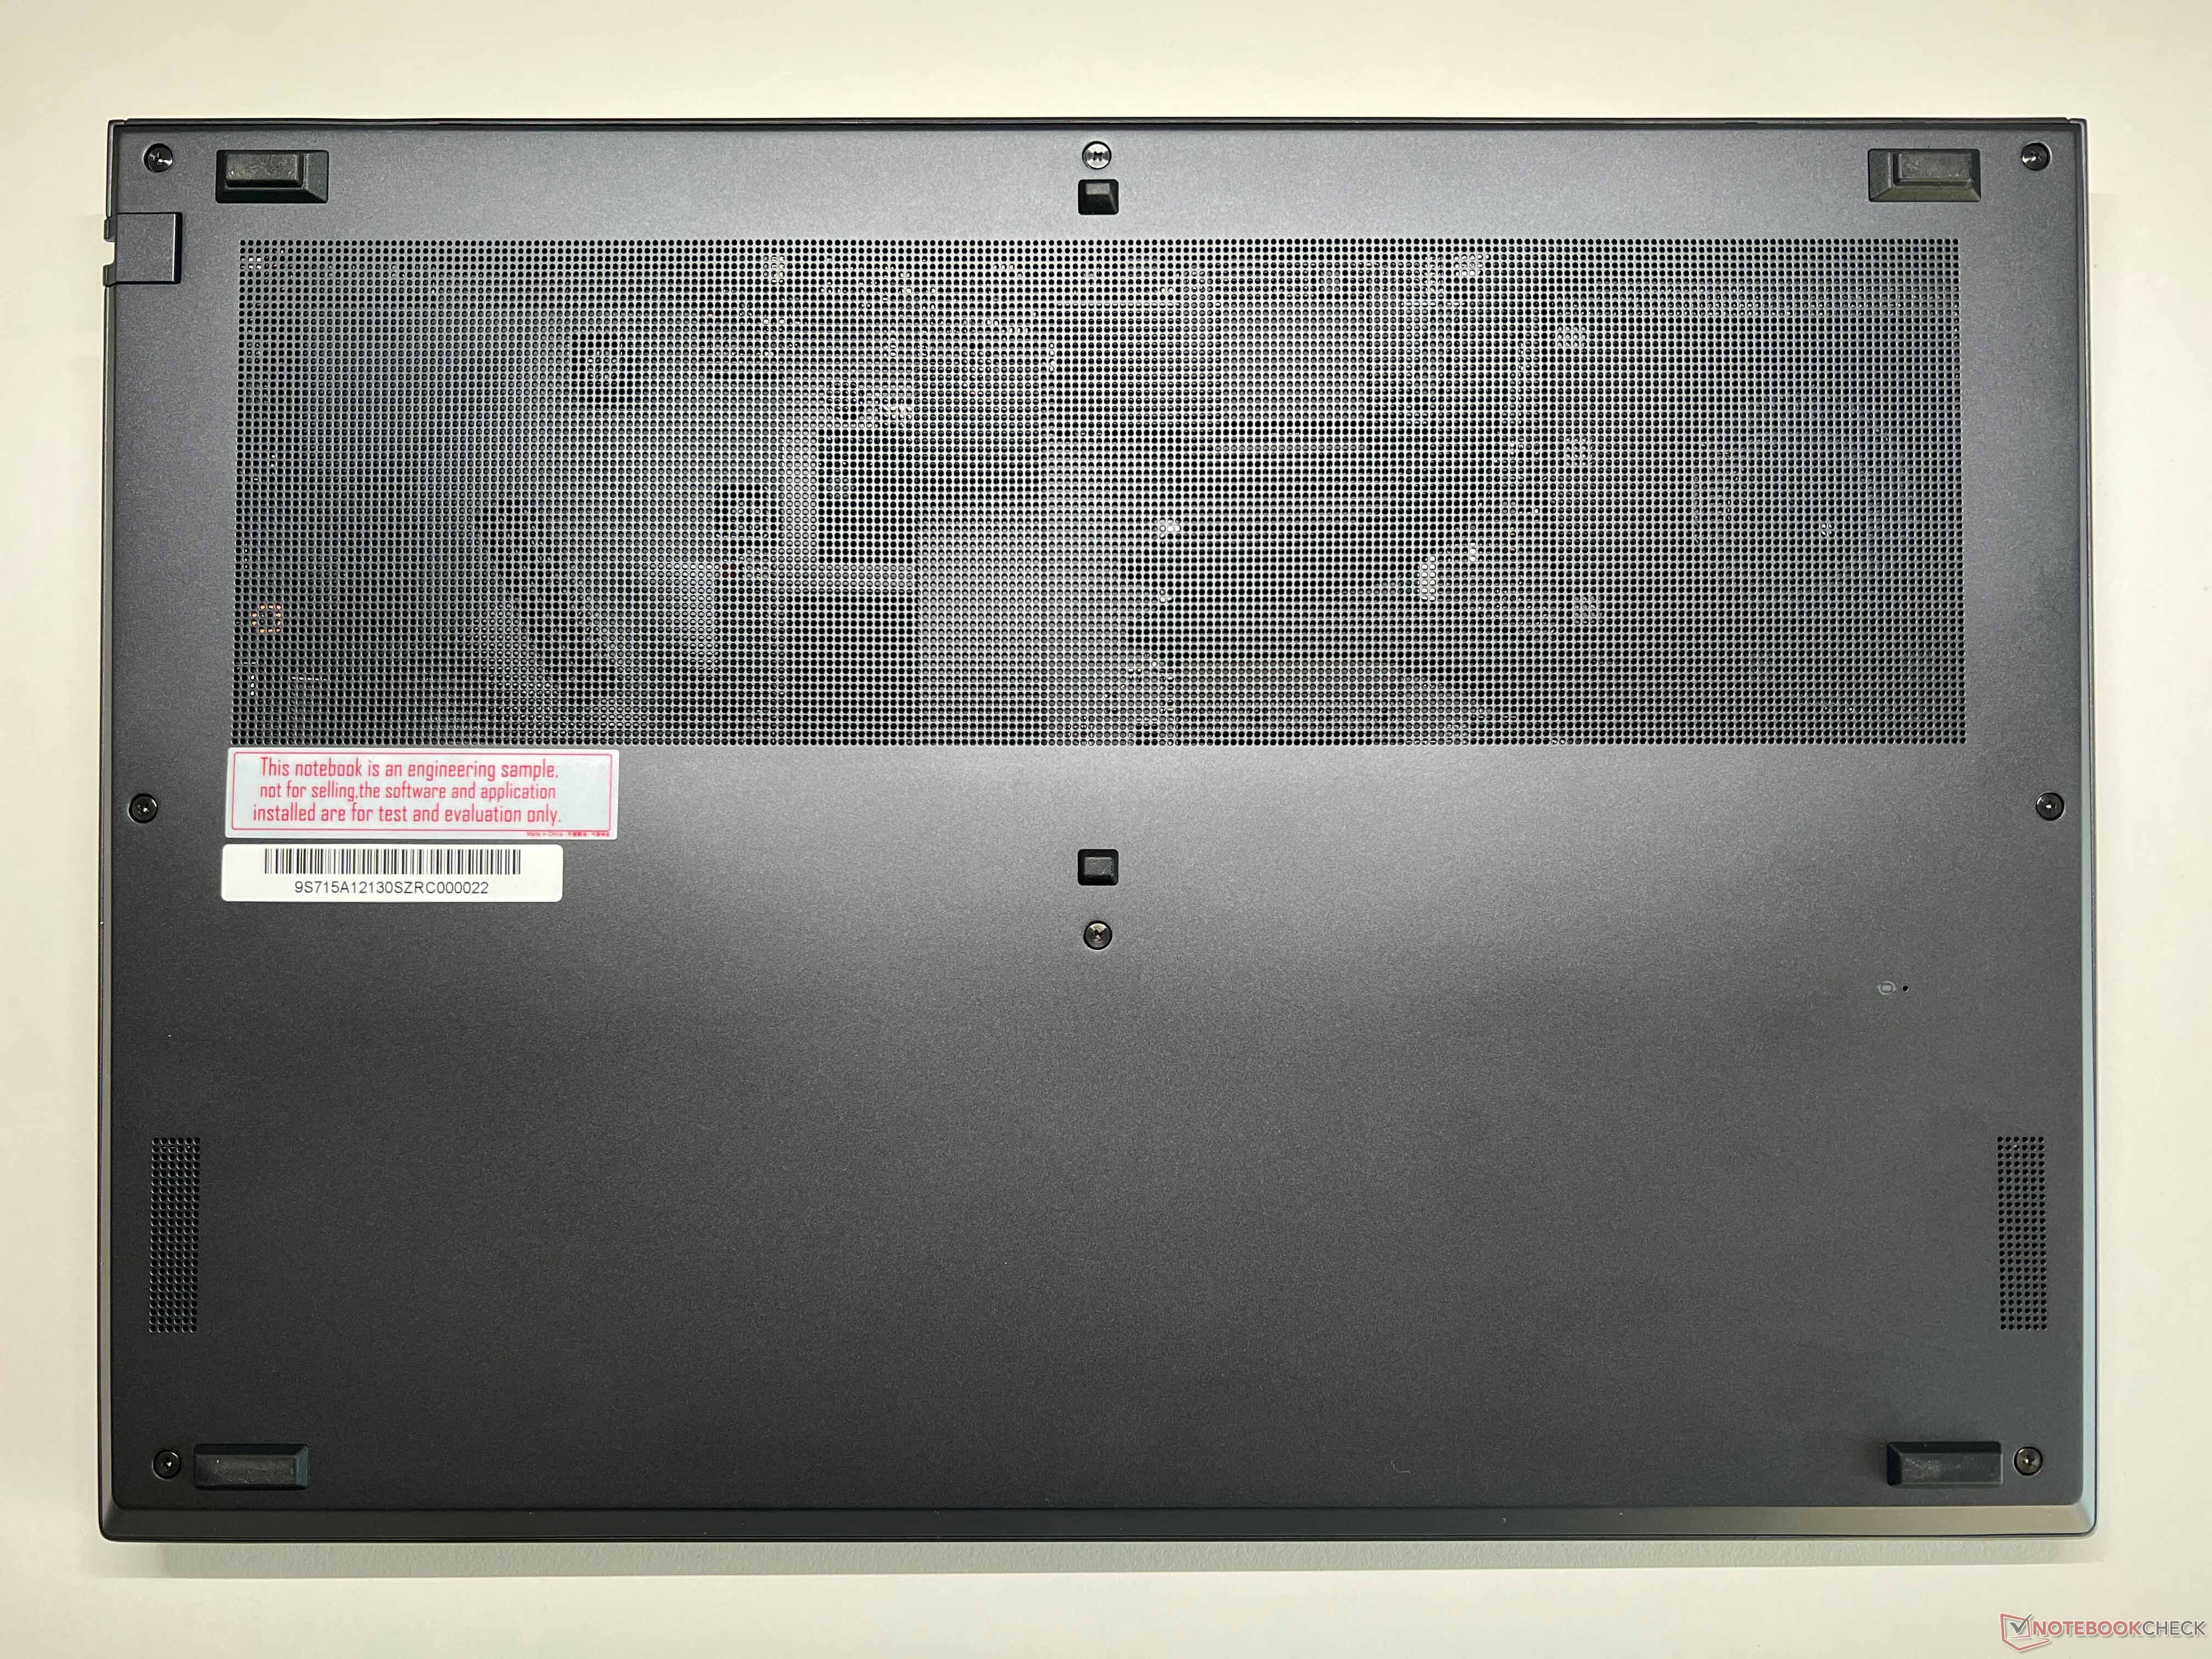
Konserwacja
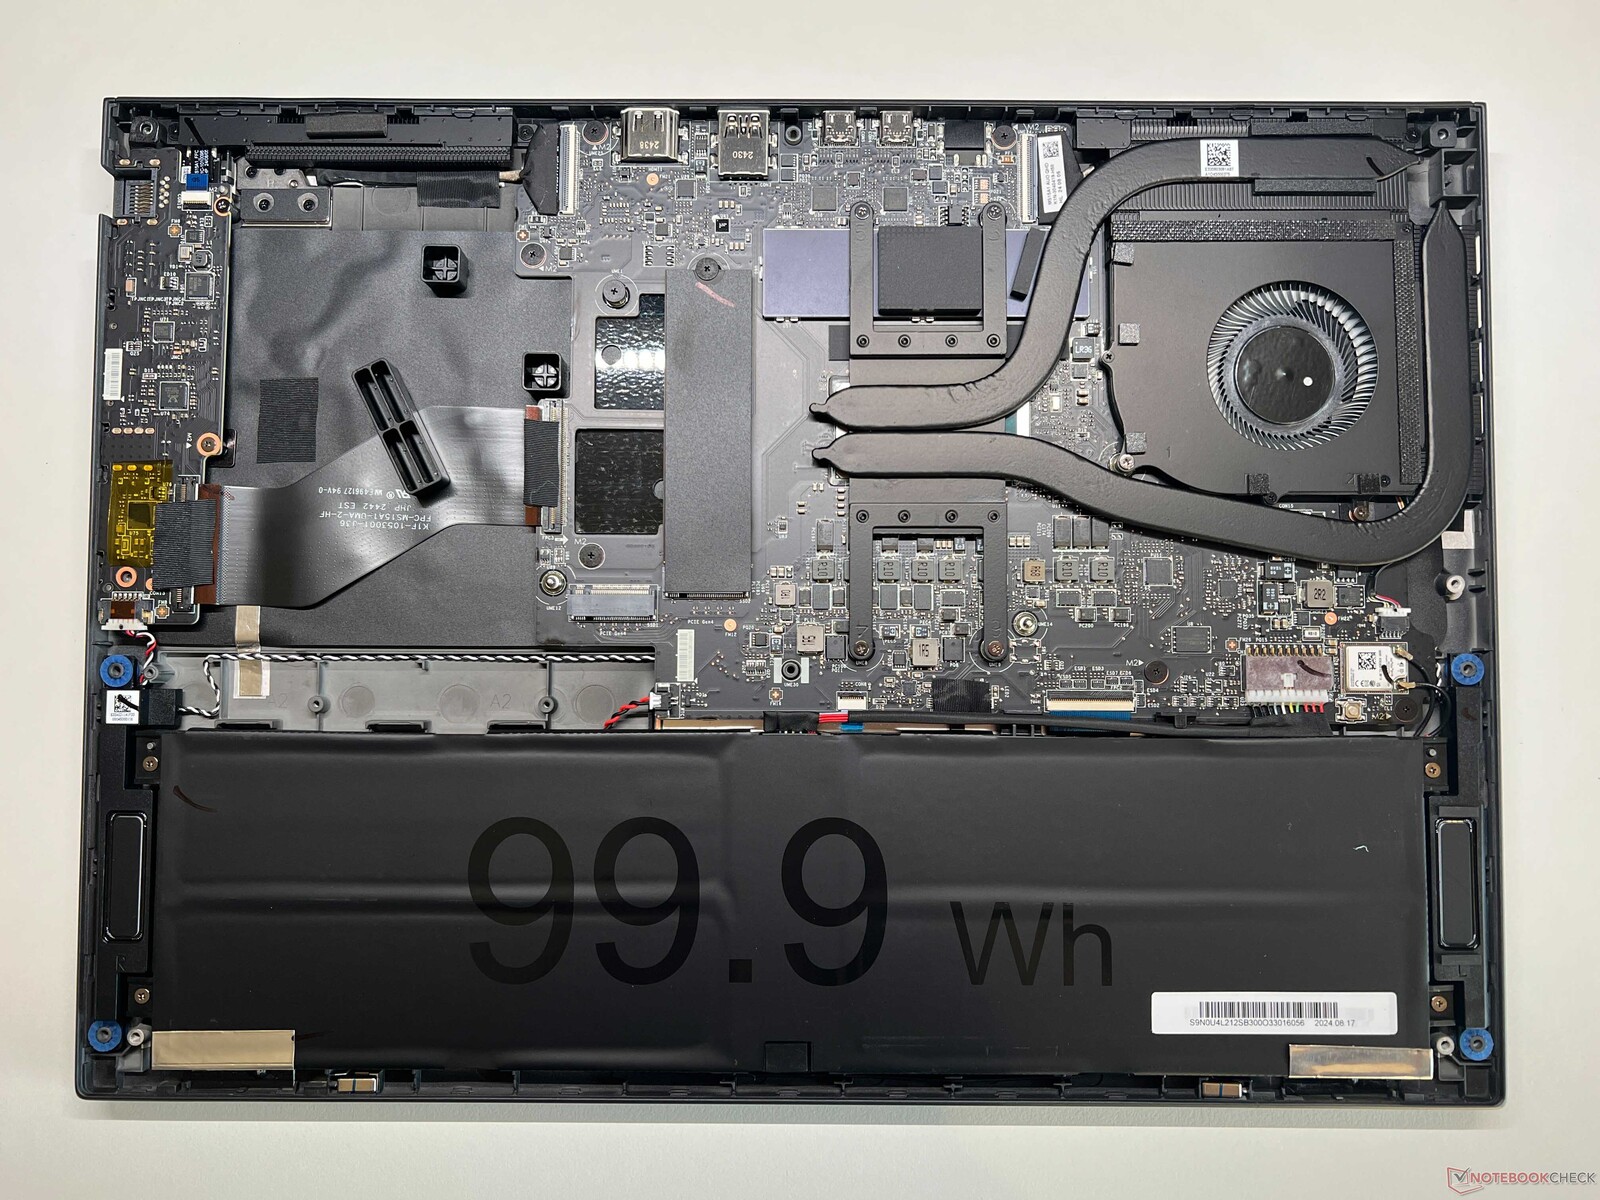
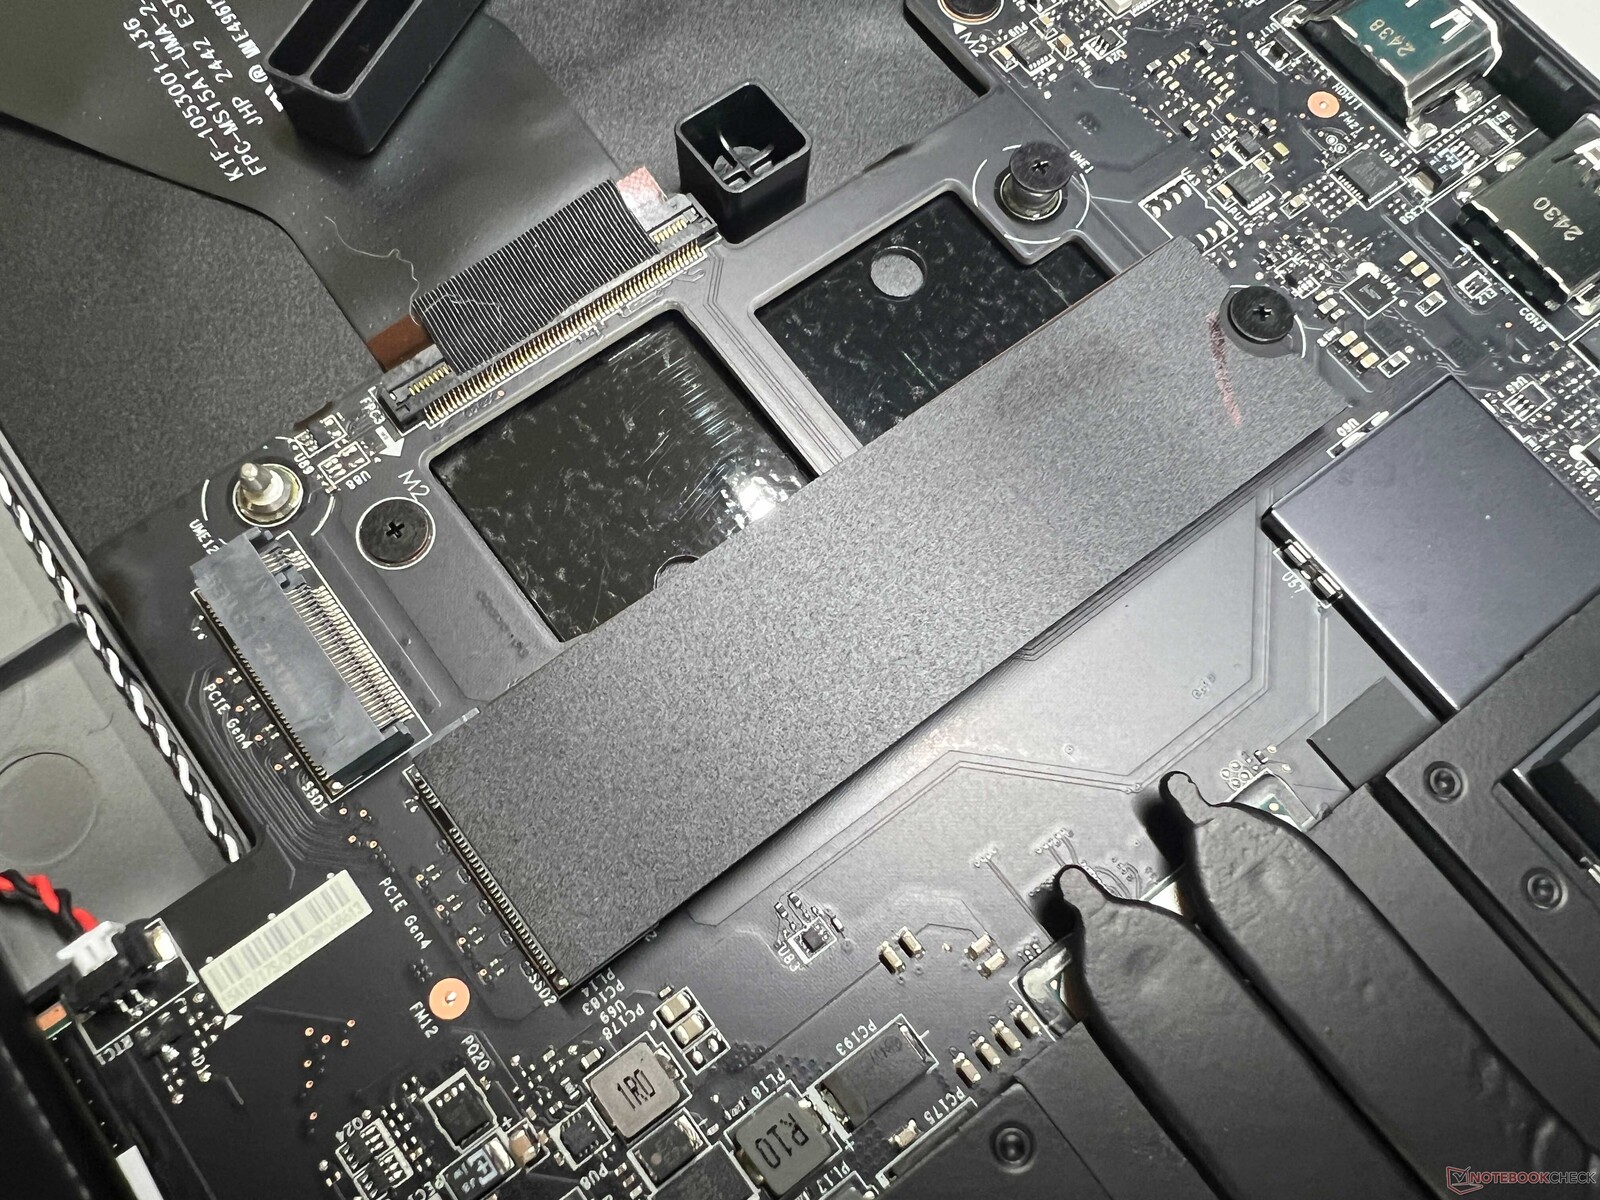
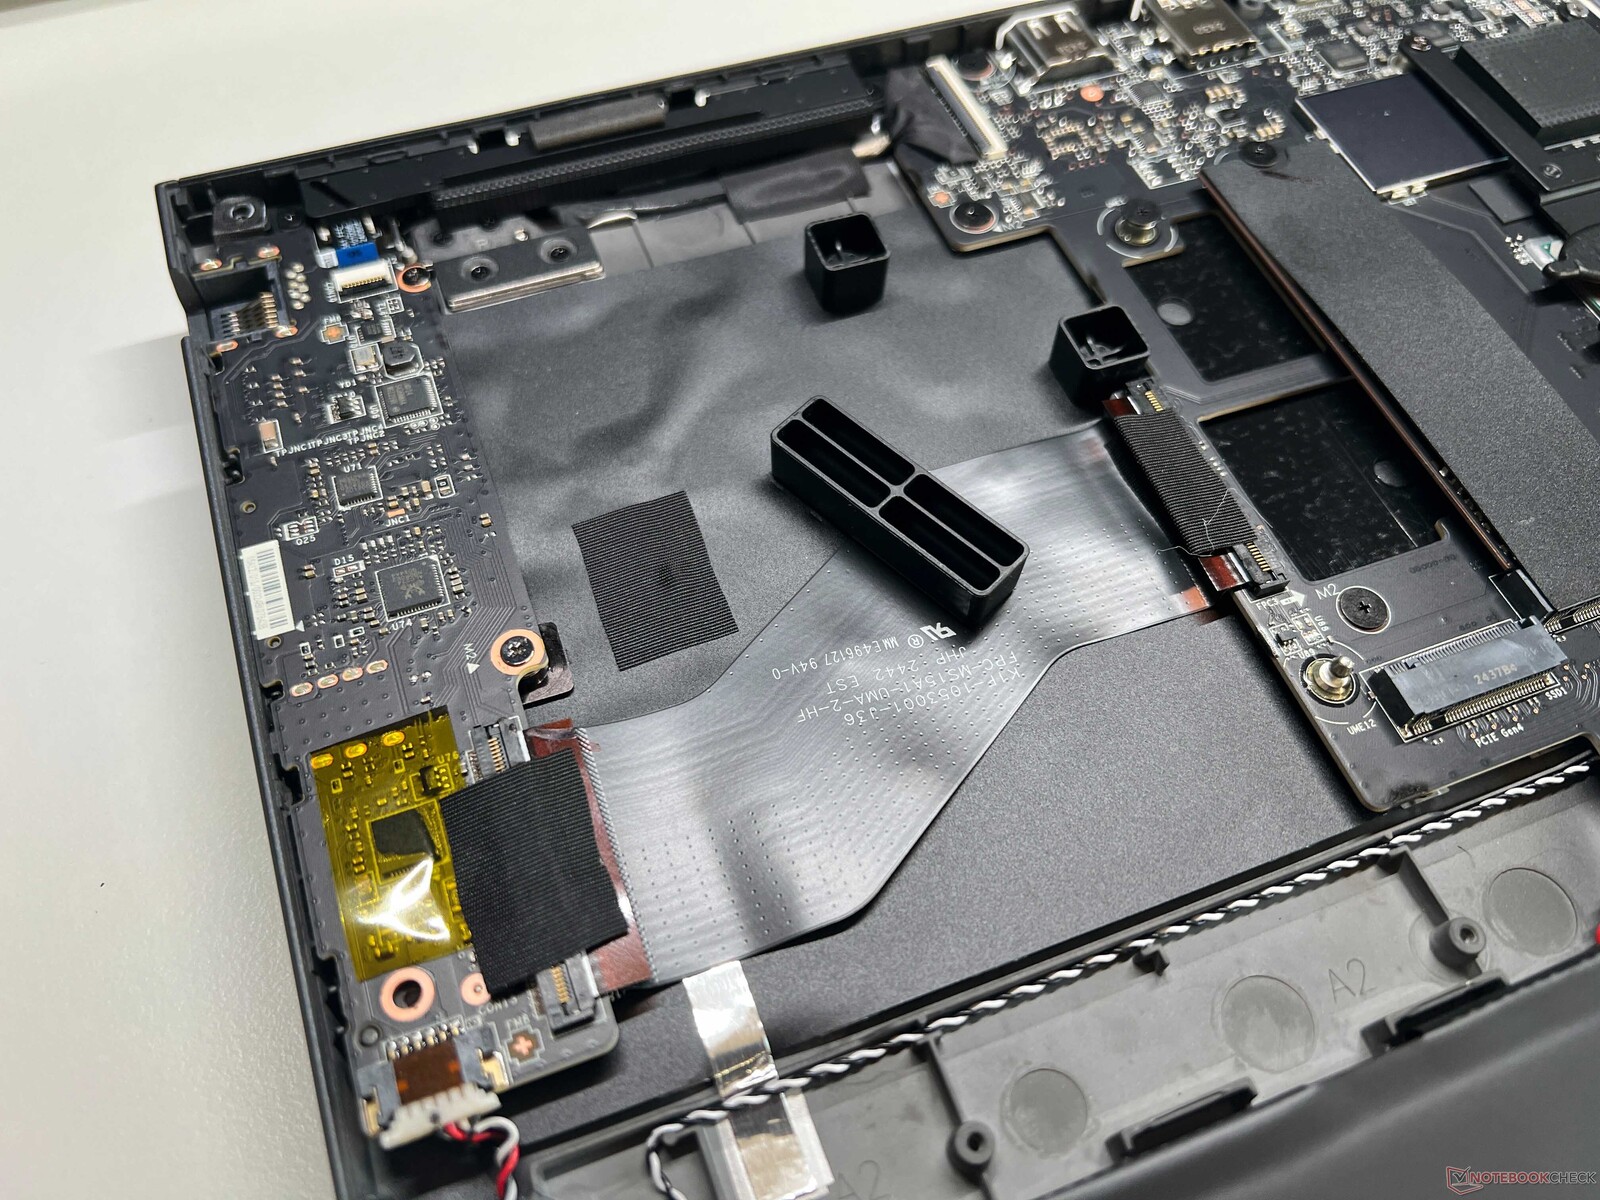
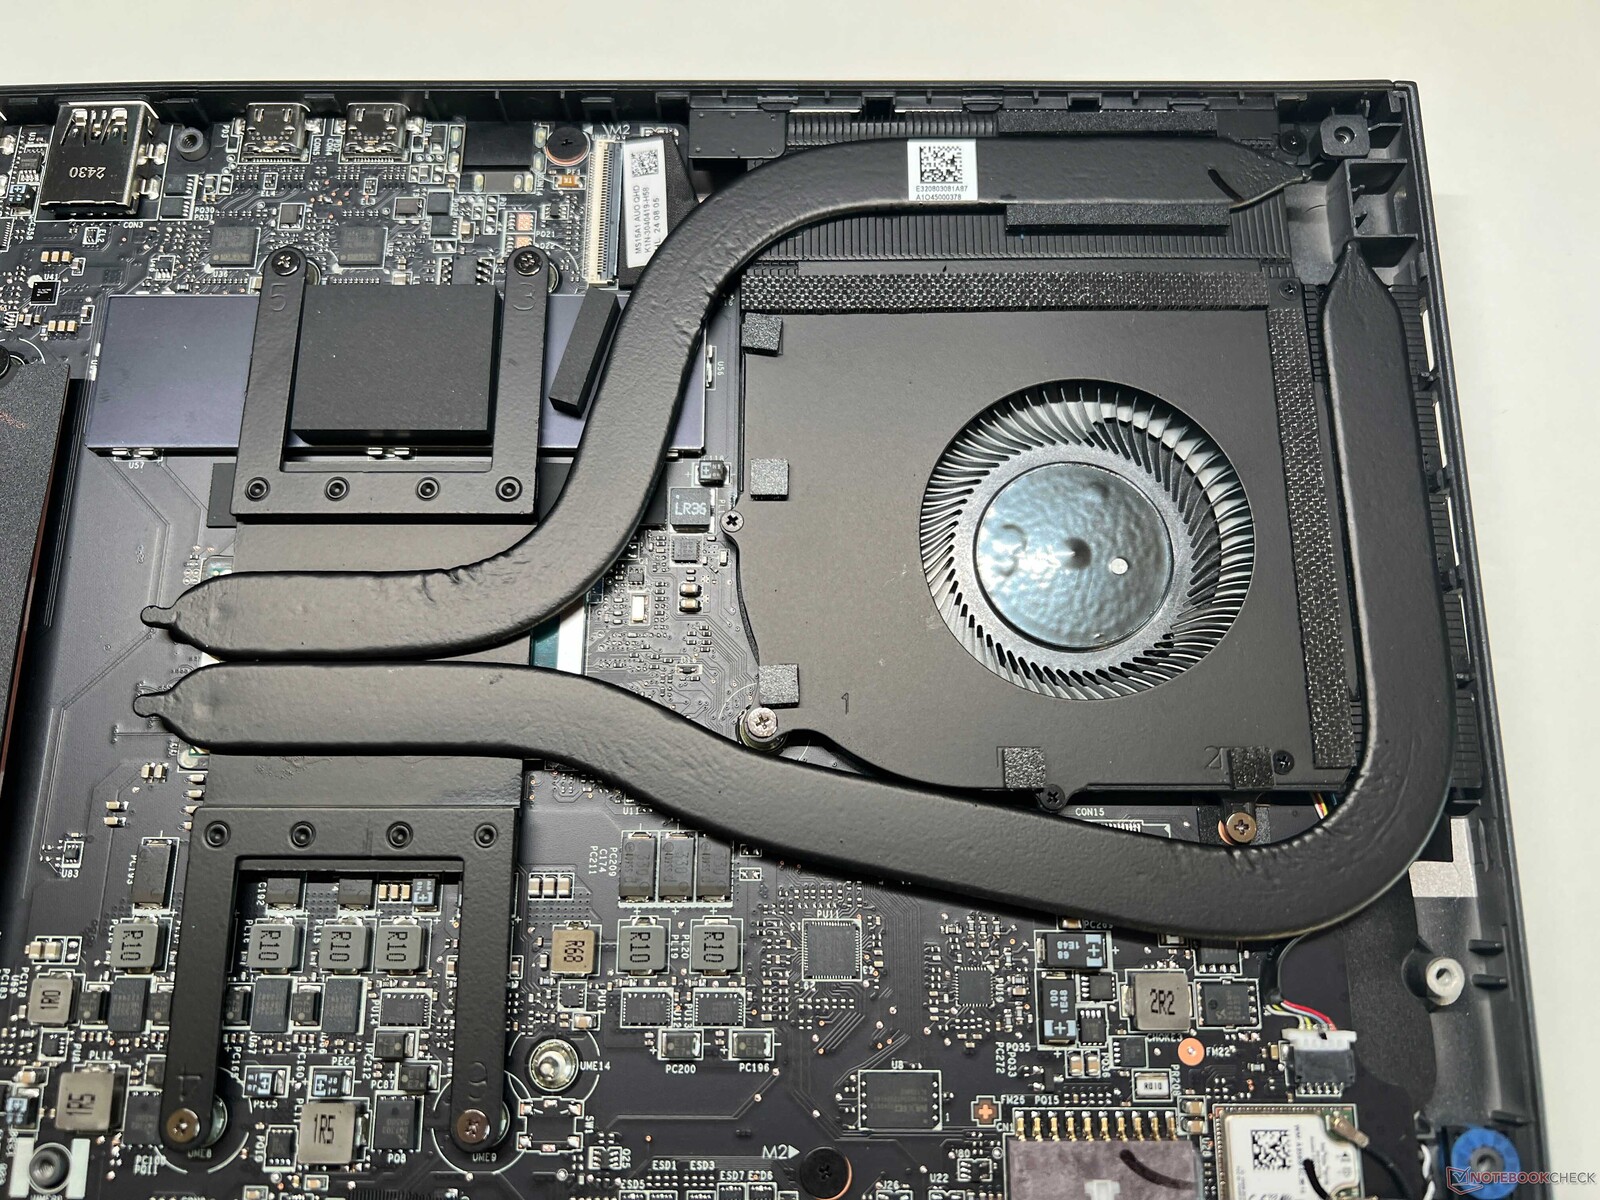
Dolna pokrywa obudowy jest przykręcana i można ją łatwo zdjąć. Wewnątrz mamy dostęp do wentylatora, baterii i dwóch dysków SSD M.2 2280, ale pozostałe komponenty są przylutowane. Oprócz dużej baterii (99,9 Wh), wyróżnia się niewykorzystany obszar po prawej stronie obudowy.
Zrównoważony rozwój
Producent nie podał żadnych informacji na temat śladuCO2 powstałego podczas produkcji laptopa ani proporcji użytych materiałów pochodzących z recyklingu. Mimo to jego opakowanie jest wykonane głównie z papieru. Przewodniki naprawcze nie są dostępne.
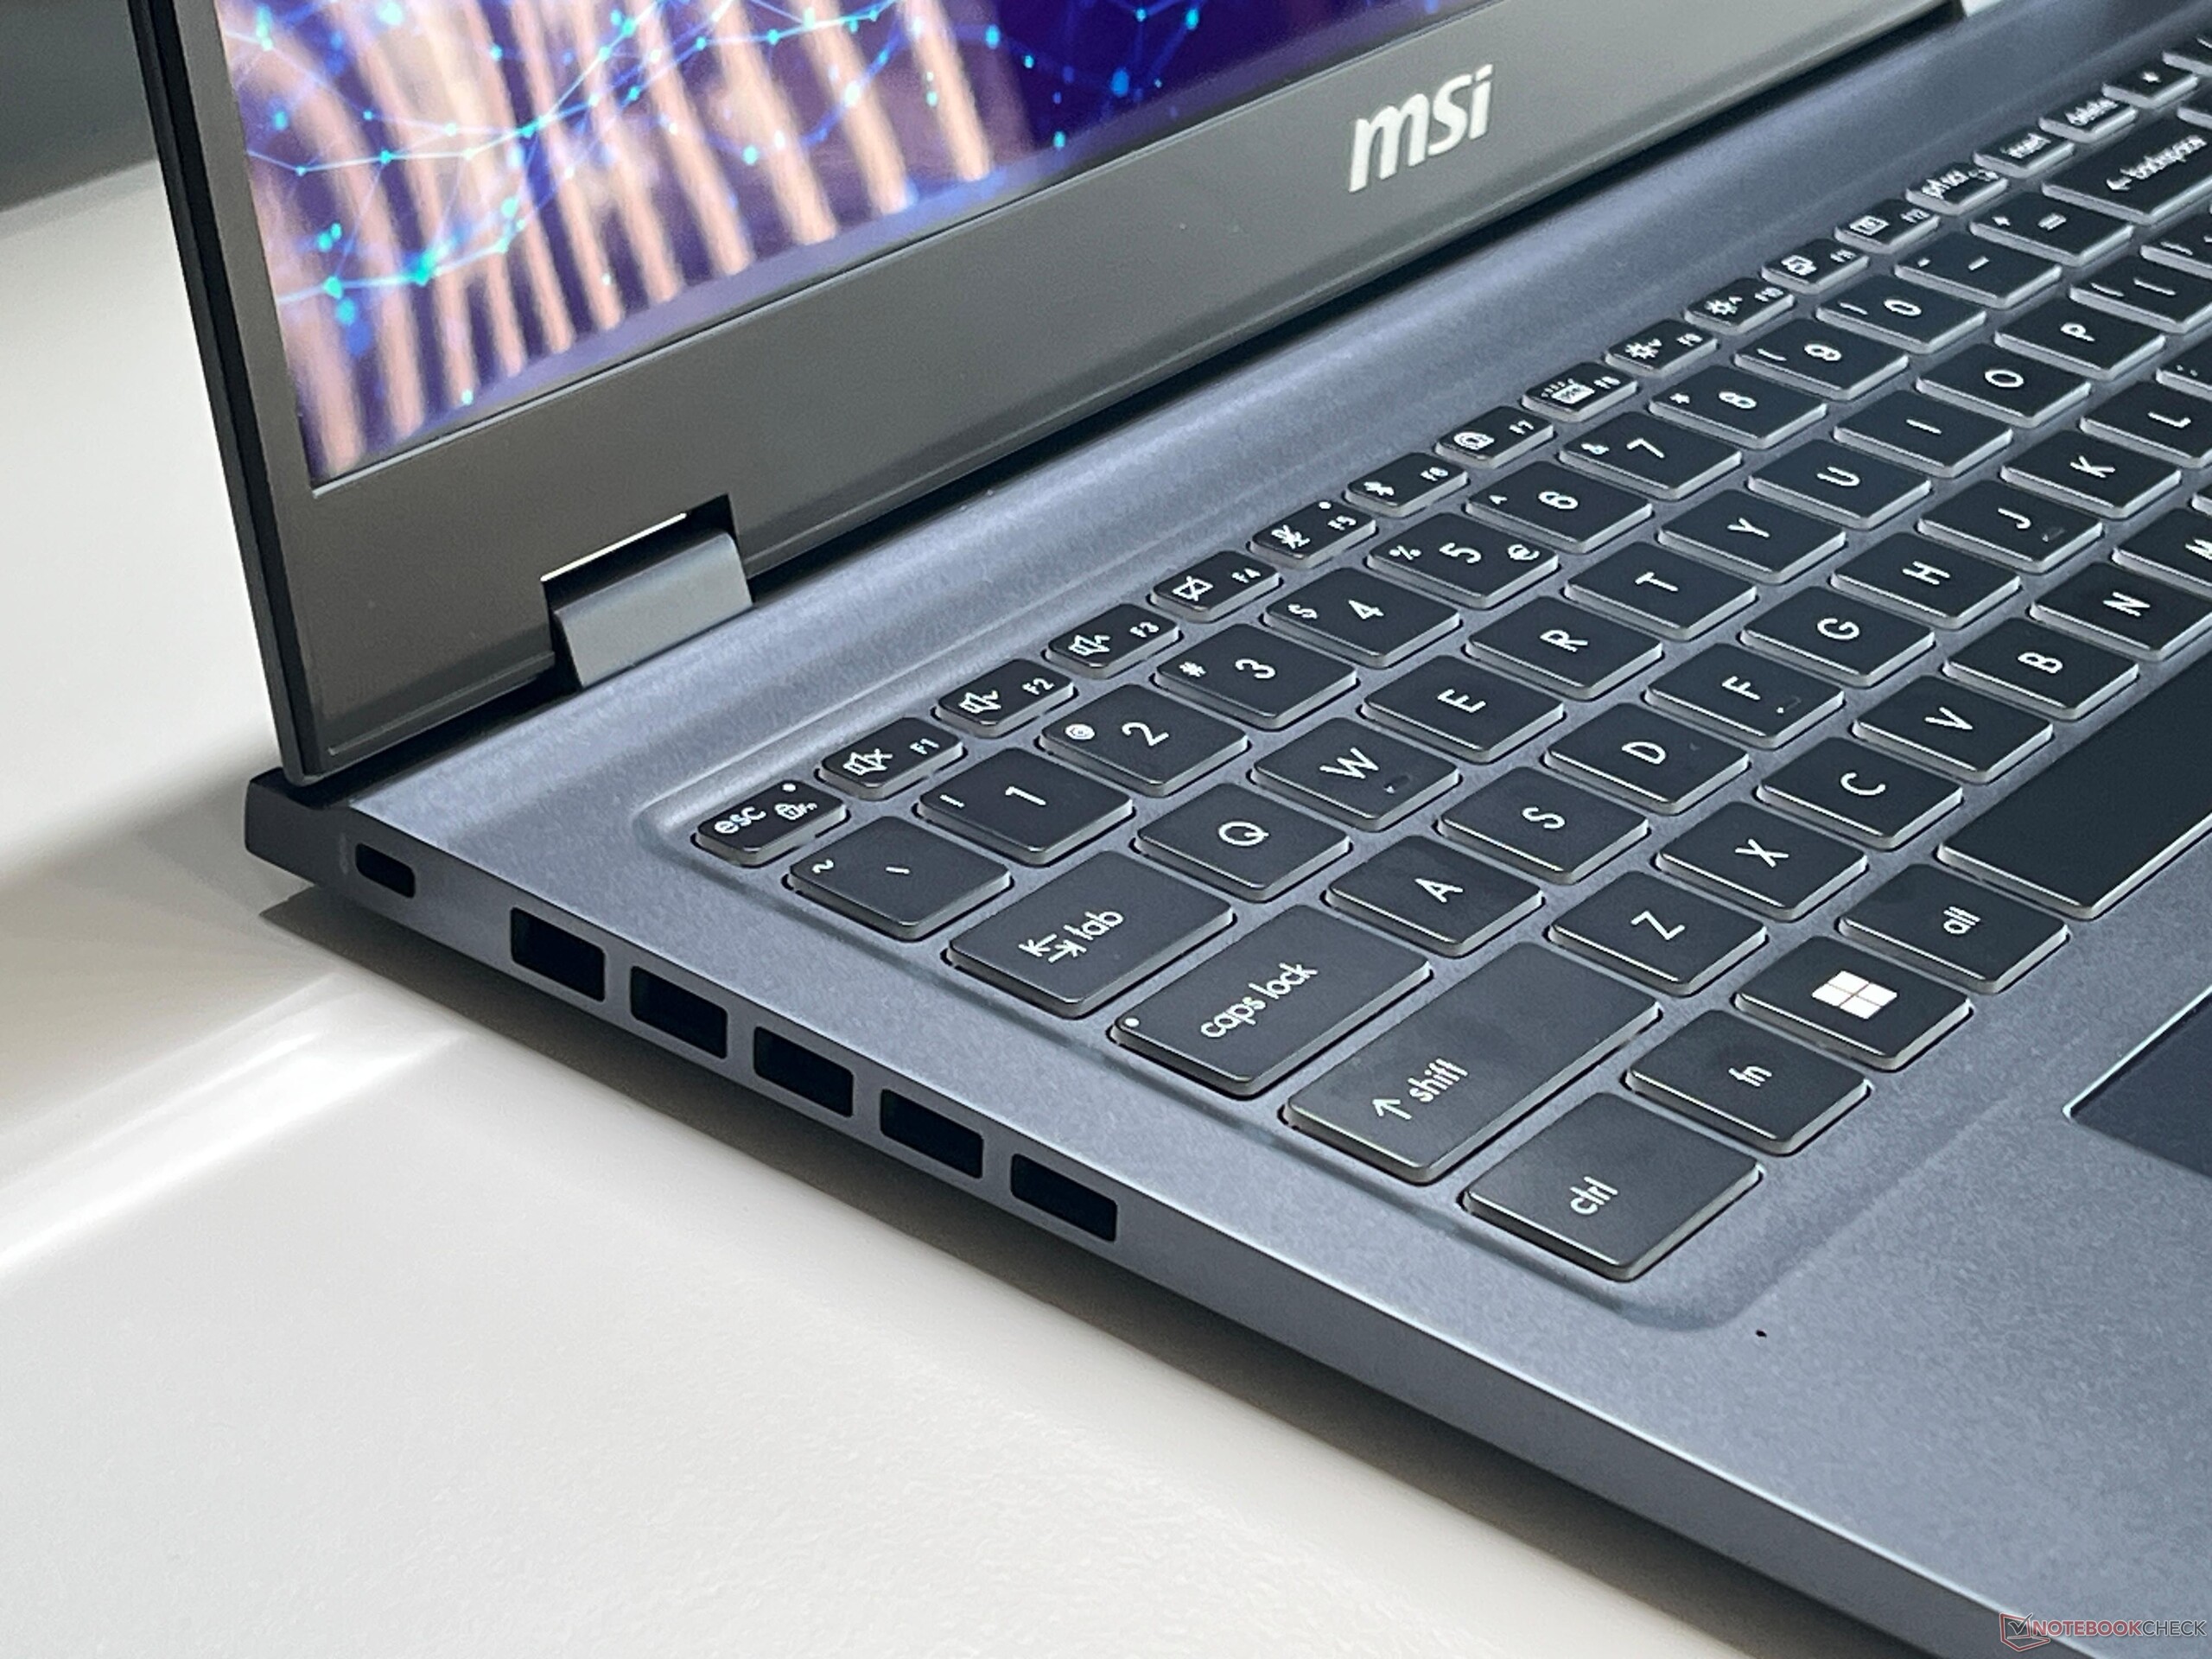
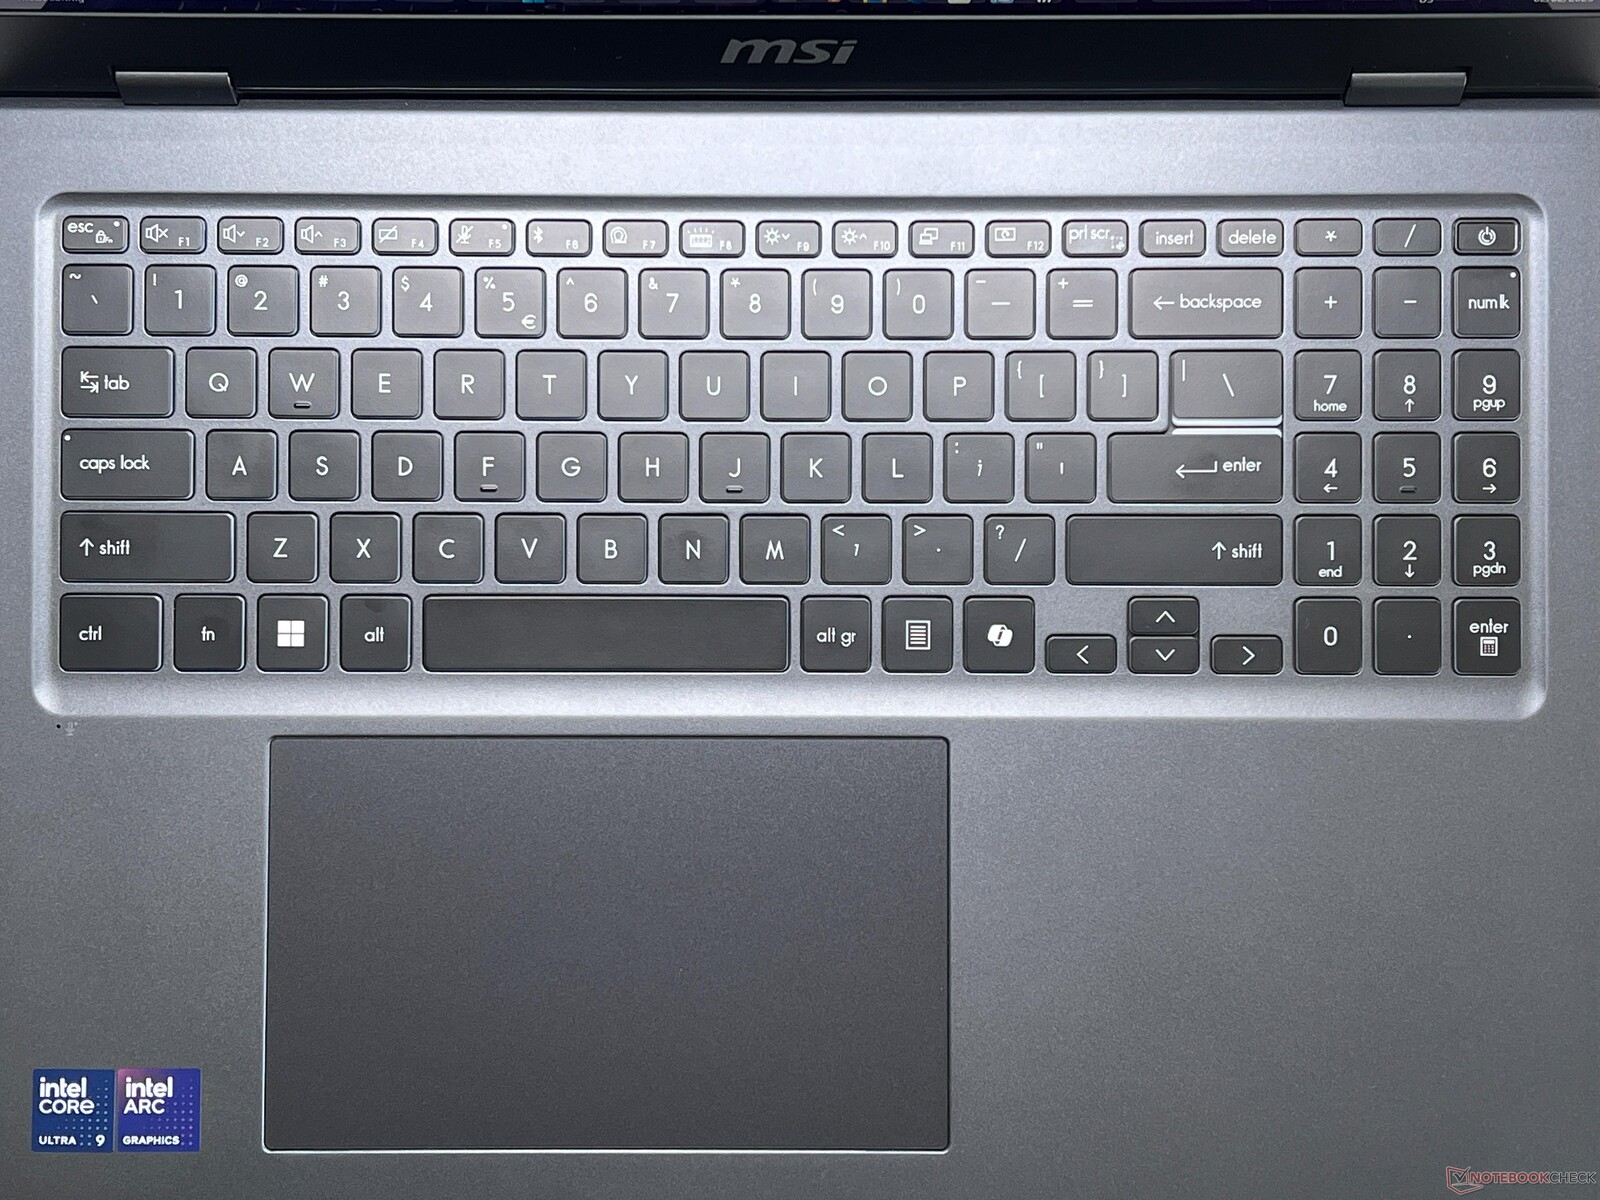
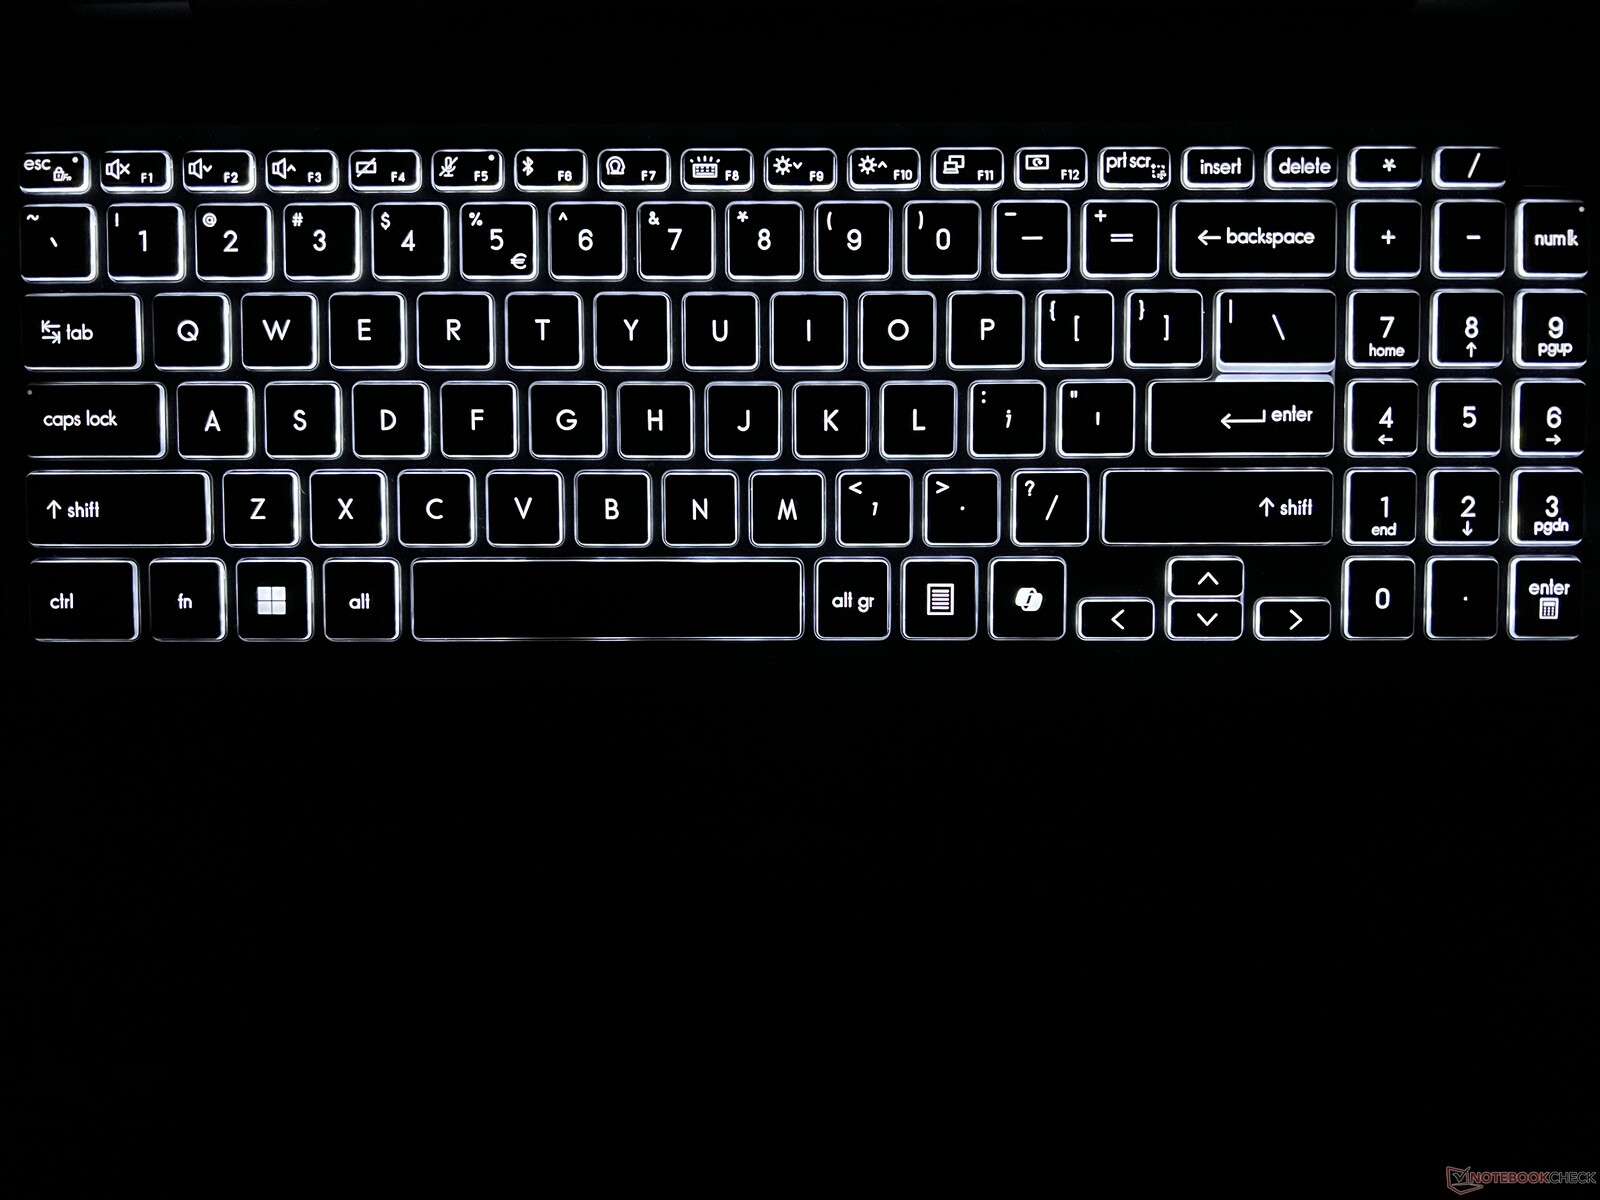
Urządzenia wejściowe - Wygodna klawiatura
Prestige wyposażony jest w wygodną klawiaturę z białym podświetleniem, które może być aktywowane automatycznie za pomocą czujnika. Skok klawiszy jest wystarczający, a naciśnięcia klawiszy nie są zbyt głośne. Bez problemu można pisać dłuższe teksty, a klawiatura posiada nawet dedykowaną klawiaturę numeryczną. Przycisk zasilania w prawym górnym rogu działa również jako skaner linii papilarnych.
ClickPad działa płynnie, a palce przyjemnie ślizgają się po jego powierzchni. Przy wymiarach 15 x 9 cm jest bardzo duży i ma wystarczająco dużo miejsca na gesty. Dolną część podkładki można nacisnąć, ale spotyka się to z głośnymi odgłosami klikania. Cały ClickPad nie jest wyśrodkowany w jednostce bazowej, ale raczej przesunięty w lewo.
Wyświetlacz - WQHD IPS przy 60 Hz

Nasze urządzenie testowe zostało wyposażone w 16-calowy wyświetlacz IPS o rozdzielczości 2560 x 1600 pikseli, proporcjach 16:10 i częstotliwości 60 Hz. Subiektywnie, jakość obrazu panelu refleksyjnego jest dobra, ponieważ wszystkie treści wyglądają ostro, a kolory wydają się żywe. Nie wykorzystuje on migotania PWM, ale jego czas reakcji jest dość wolny i widoczne są efekty smużenia. Jednak podświetlenie nie wydaje się być poważnym problemem na tym urządzeniu i jest widoczne tylko przy wysokich poziomach jasności na ciemnym tle. Jasność może być regulowana automatycznie, ale temperatura barwowa nie.
Maksymalna jasność wynosi średnio ~450 cd/m², a w połączeniu z niskim poziomem czerni wynoszącym 0,2 cd/m², daje to bardzo wysoki maksymalny współczynnik kontrastu wynoszący ponad 2000:1.
| |||||||||||||||||||||||||
rozświetlenie: 92 %
na akumulatorze: 471 cd/m²
kontrast: 2355:1 (czerń: 0.2 cd/m²)
ΔE Color 5.8 | 0.5-29.43 Ø4.87, calibrated: 1.9
ΔE Greyscale 7.8 | 0.5-98 Ø5.1
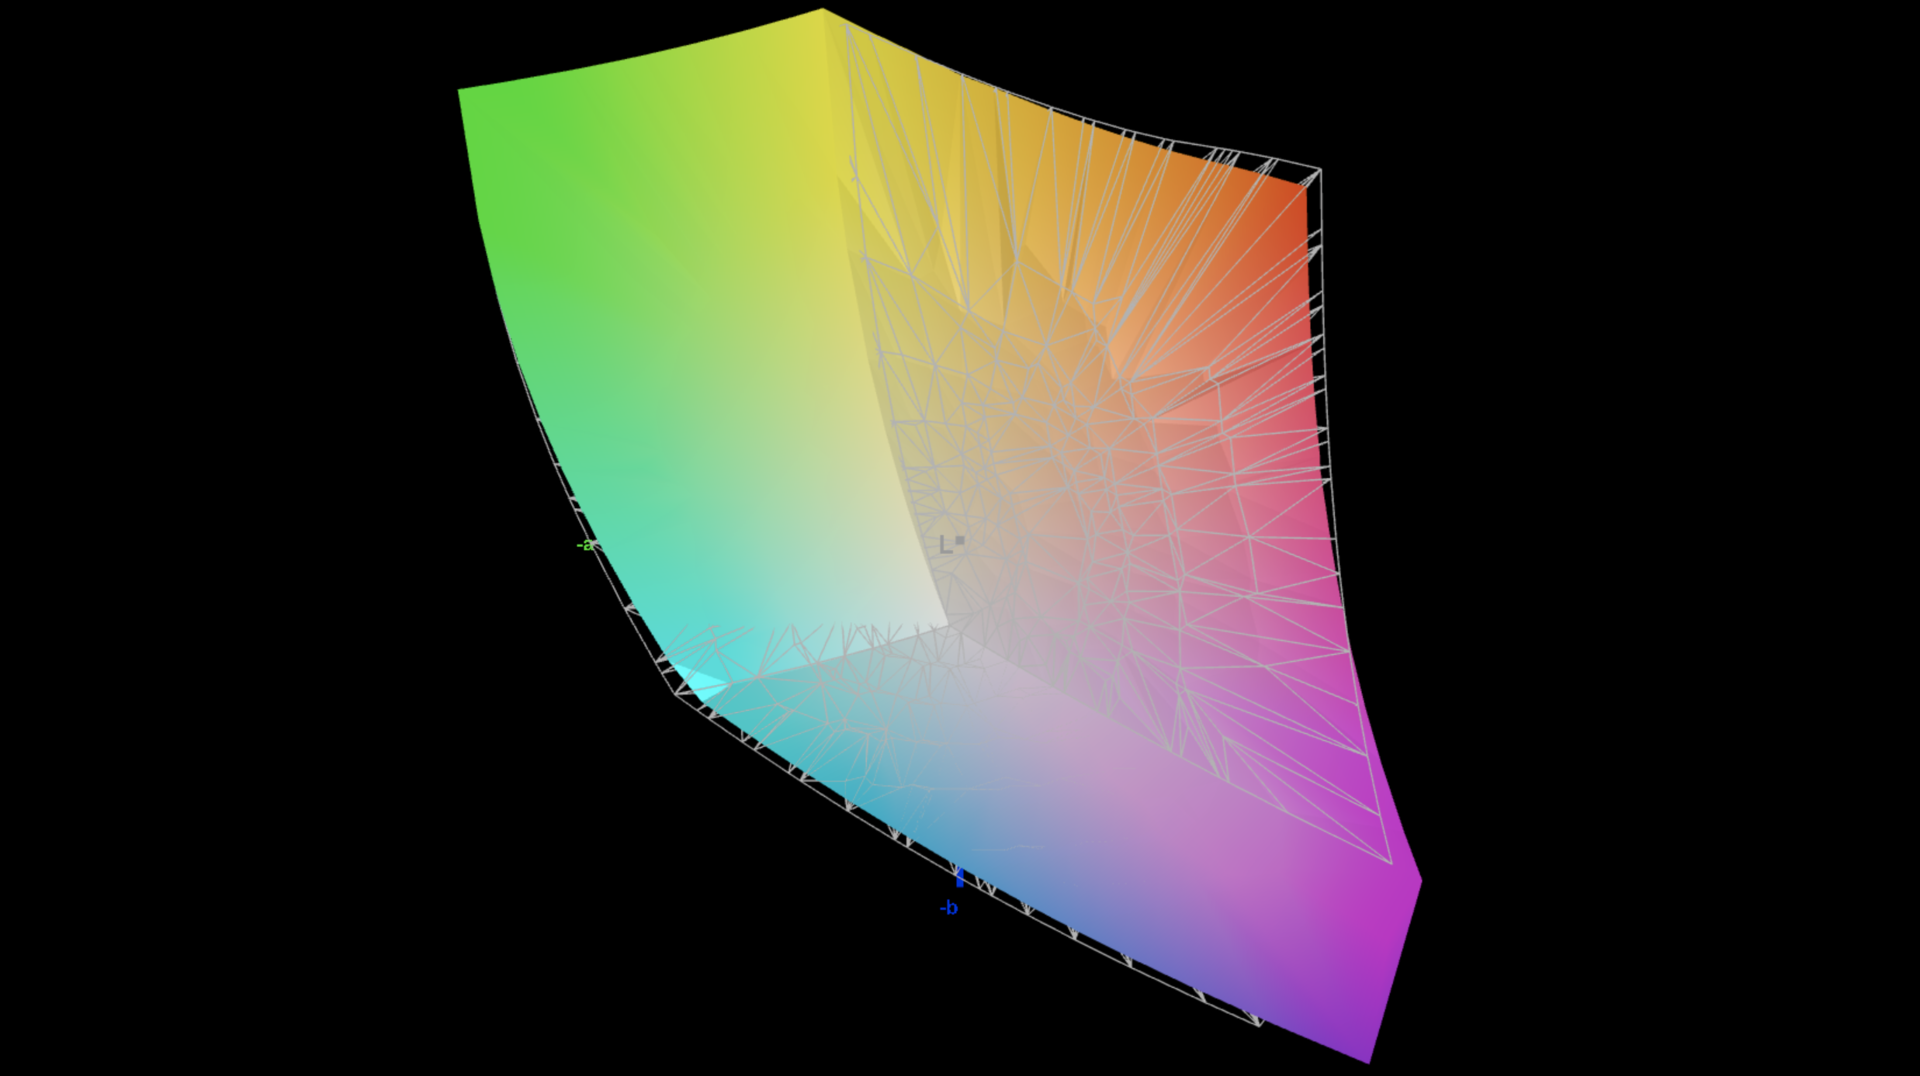
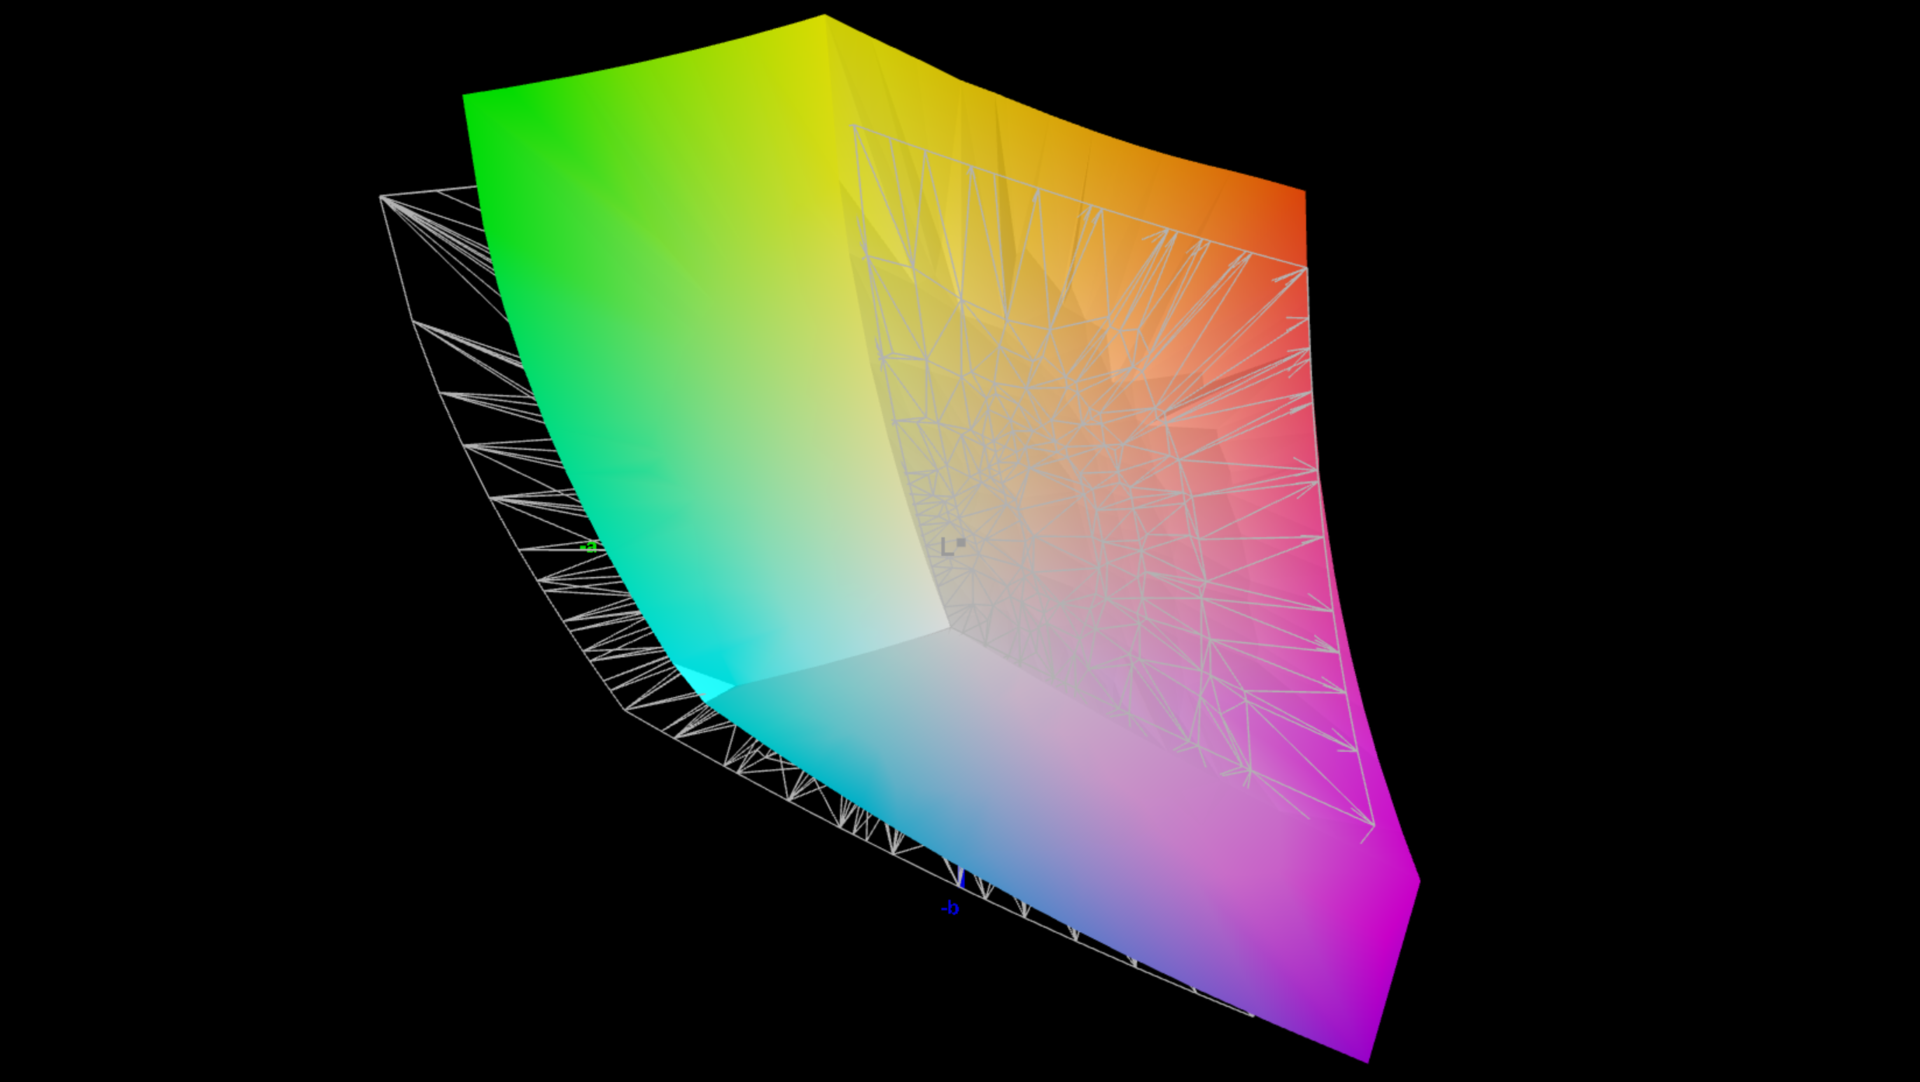
84.3% AdobeRGB 1998 (Argyll 2.2.0 3D)
99.7% sRGB (Argyll 2.2.0 3D)
96.4% Display P3 (Argyll 2.2.0 3D)
Gamma: 2.07
| MSI Prestige 16 AI Evo B2HMG B160QAN03_R, IPS, 2560x1600, 16", 60 Hz | Lenovo ThinkBook 16 G7+ AMD LEN160-3.2K, IPS, 3200x2000, 16", 165 Hz | MSI Prestige A16 AI+ A3HMG-036 AUO28B2 (B160QAN02.N), IPS, 2560x1600, 16", 165 Hz | Apple MacBook Pro 16 2024 M4 Pro Mini-LED, 3456x2234, 16.2", 120 Hz | Asus Zenbook S 16 UM5606-RK333W ATNA60CL10-0, OLED, 2880x1800, 16", 120 Hz | Samsung Galaxy Book4 Pro 16 ATNA60CL07-0, OLED, 2880x1800, 16", 120 Hz | |
|---|---|---|---|---|---|---|
| Display | 1% | -1% | 3% | 6% | 6% | |
| Display P3 Coverage | 96.4 | 96.3 0% | 94.6 -2% | 99.7 3% | 99.9 4% | 99.5 3% |
| sRGB Coverage | 99.7 | 100 0% | 99.7 0% | 100 0% | 100 0% | 100 0% |
| AdobeRGB 1998 Coverage | 84.3 | 86.9 3% | 83.4 -1% | 88.8 5% | 95.6 13% | 97.5 16% |
| Response Times | 74% | 72% | -27% | 98% | 98% | |
| Response Time Grey 50% / Grey 80% * | 51.5 ? | 13.9 ? 73% | 5.6 ? 89% | 43 ? 17% | 0.56 ? 99% | 0.64 ? 99% |
| Response Time Black / White * | 24.3 ? | 6.3 ? 74% | 11.2 ? 54% | 41.2 ? -70% | 0.65 ? 97% | 0.68 ? 97% |
| PWM Frequency | 14880 | 480 | 240 ? | |||
| Screen | 18% | 3% | 57% | 138% | 37% | |
| Brightness middle | 471 | 422 -10% | 488 4% | 632 34% | 407 -14% | 385 -18% |
| Brightness | 455 | 403 -11% | 444 -2% | 616 35% | 405 -11% | 391 -14% |
| Brightness Distribution | 92 | 93 1% | 86 -7% | 95 3% | 97 5% | 97 5% |
| Black Level * | 0.2 | 0.3 -50% | 0.36 -80% | 0.02 90% | ||
| Contrast | 2355 | 1407 -40% | 1356 -42% | 20350 764% | ||
| Colorchecker dE 2000 * | 5.8 | 1.7 71% | 3.45 41% | 0.6 90% | 0.6 90% | 1.1 81% |
| Colorchecker dE 2000 max. * | 10.8 | 3.4 69% | 6.77 37% | 1.2 89% | 1.2 89% | 1.8 83% |
| Colorchecker dE 2000 calibrated * | 1.9 | 0.7 63% | 1.35 29% | |||
| Greyscale dE 2000 * | 7.8 | 2.4 69% | 4.16 47% | 0.8 90% | 0.5 94% | 1.4 82% |
| Gamma | 2.07 106% | 2.19 100% | 2.52 87% | 2.21 100% | 2.2 100% | 2.24 98% |
| CCT | 7262 90% | 6989 93% | 6832 95% | 6450 101% | 6453 101% | 6444 101% |
| Całkowita średnia (program / ustawienia) | 31% /
22% | 25% /
12% | 11% /
27% | 81% /
102% | 47% /
39% |
* ... im mniej tym lepiej

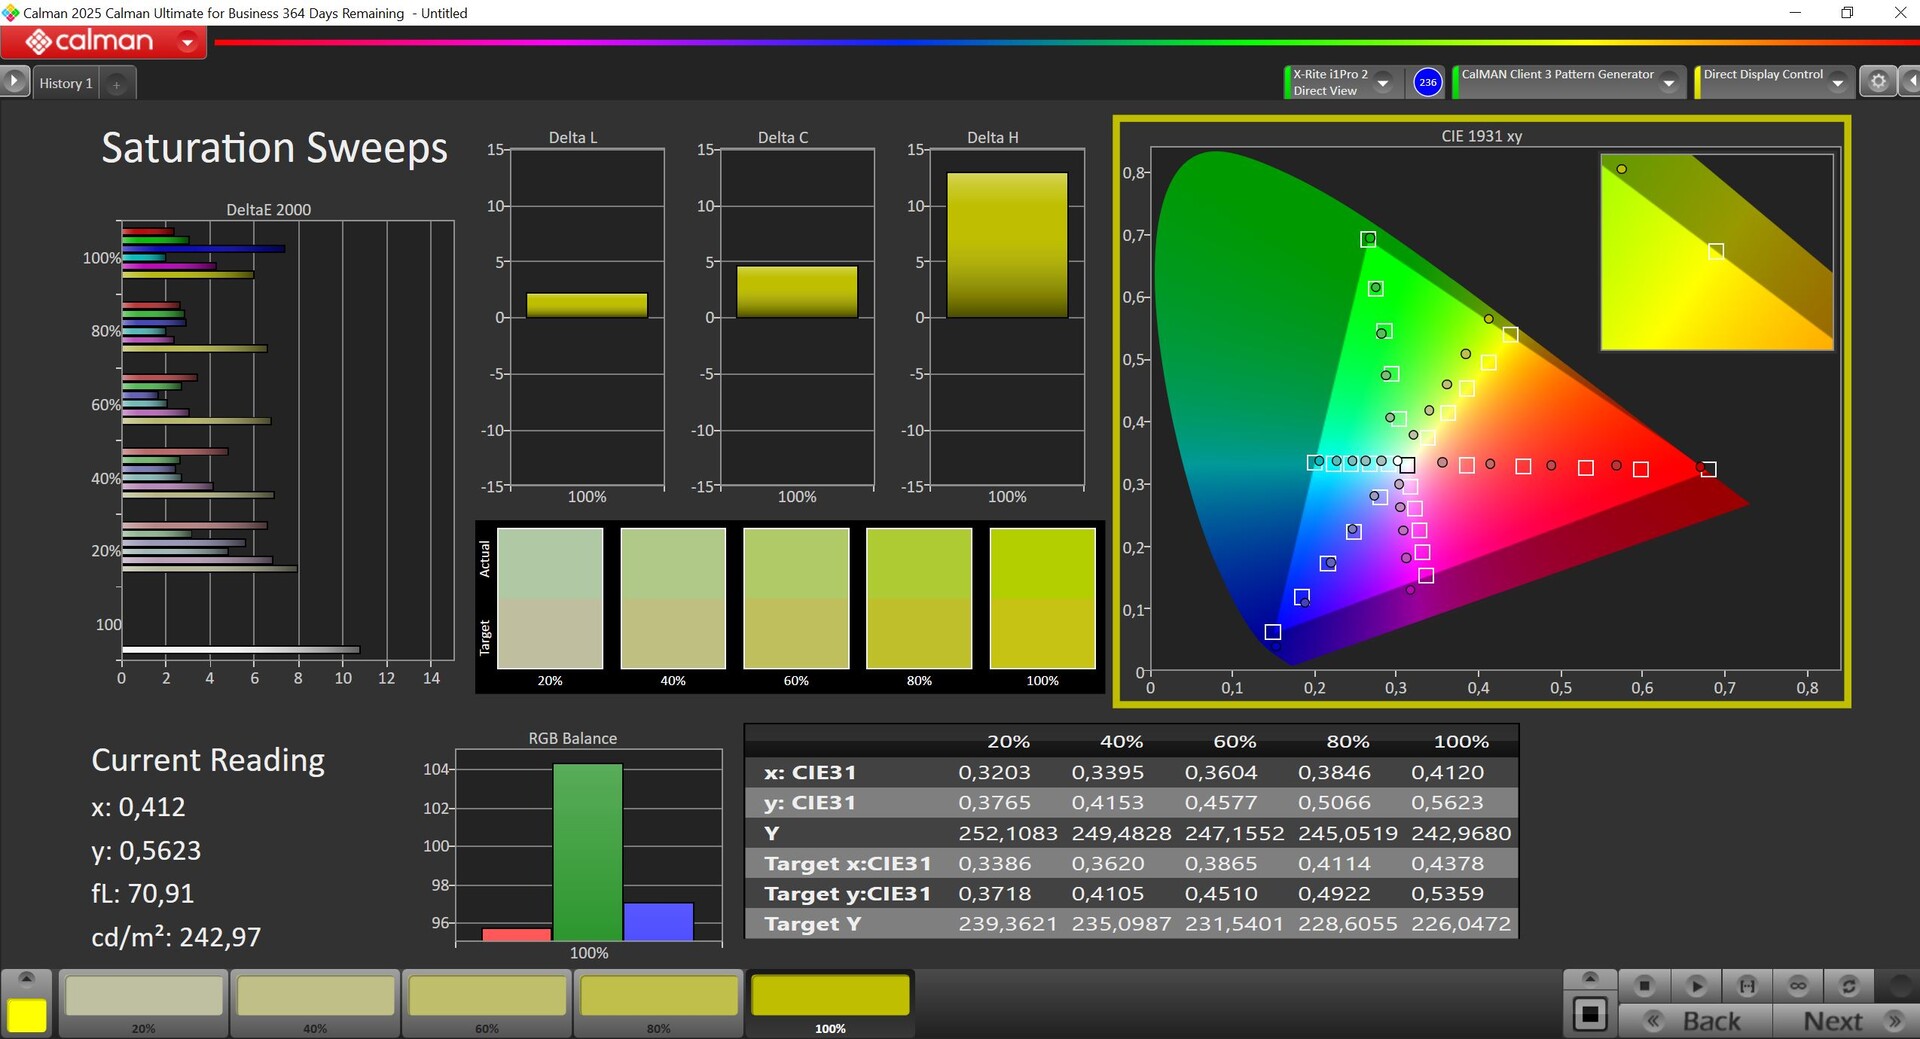


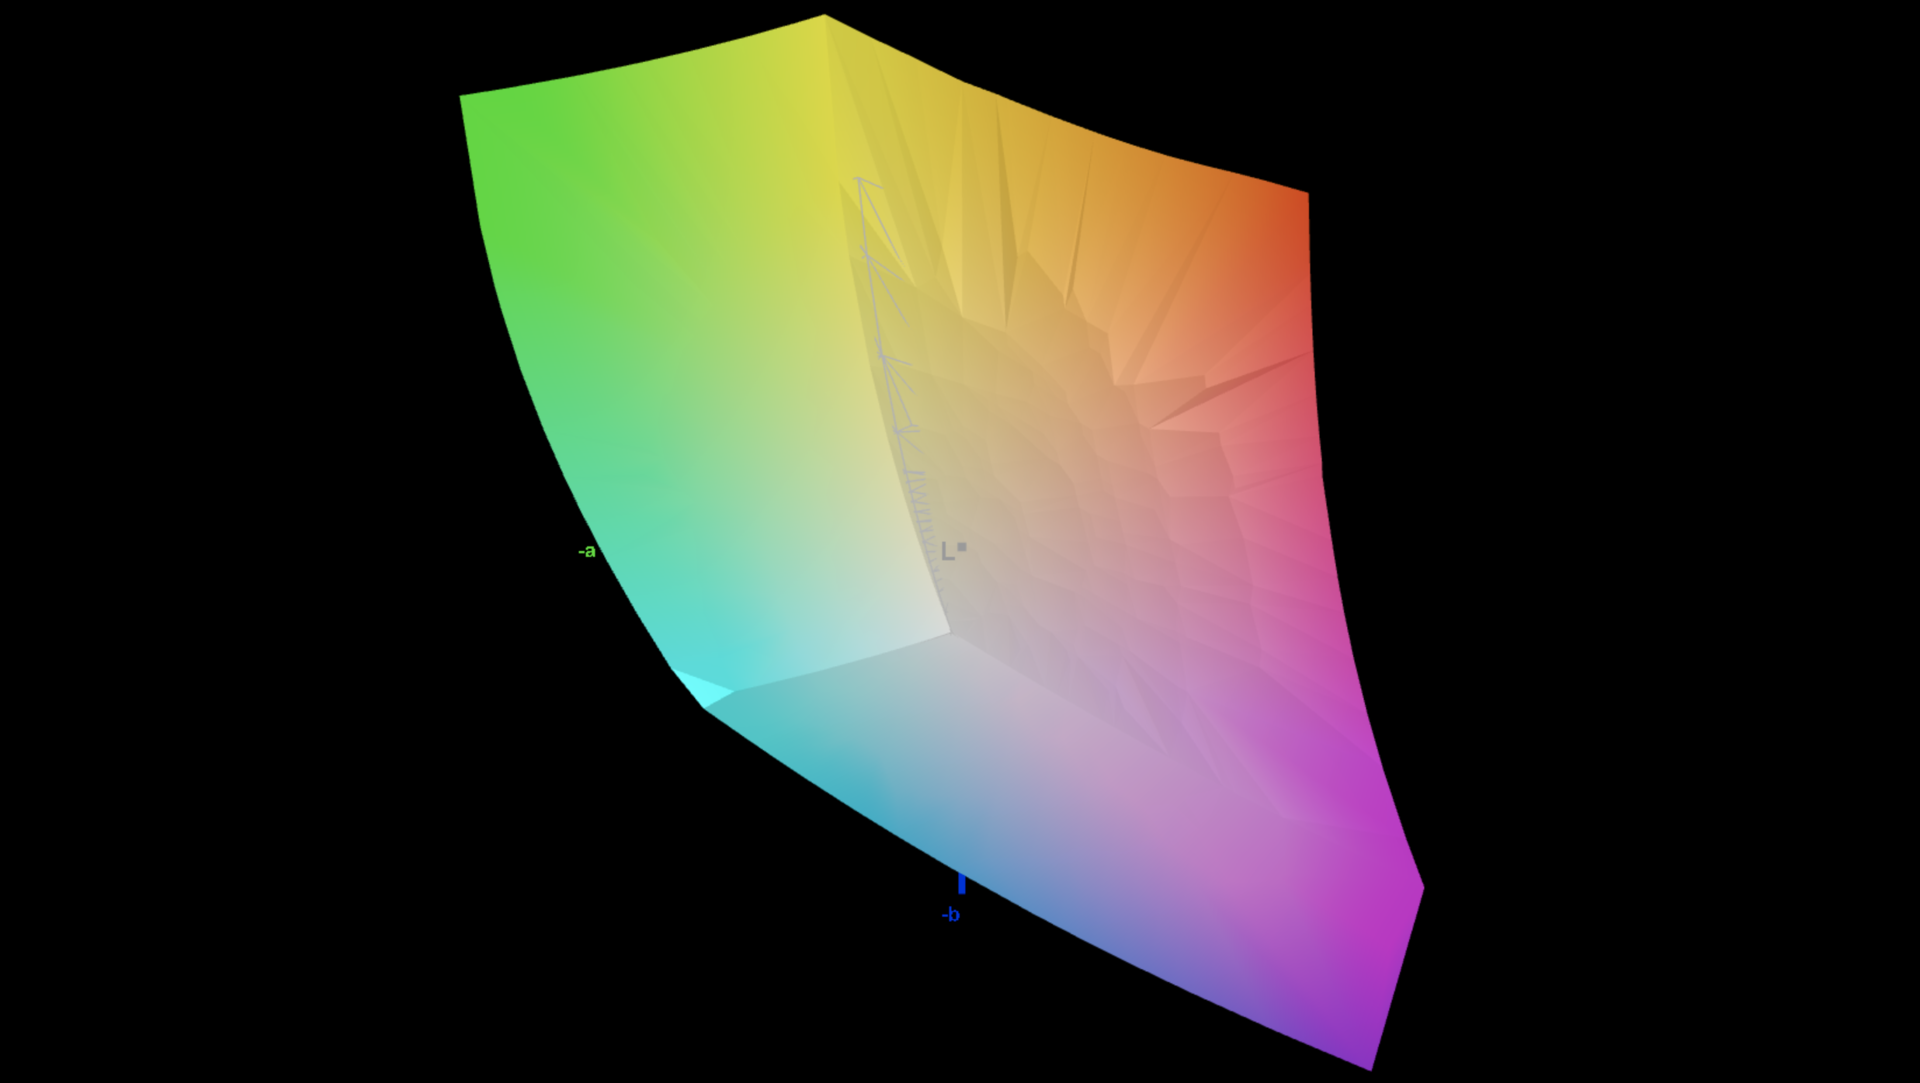
Przetestowaliśmy wyświetlacz przy użyciu profesjonalnego oprogramowania CalMAN, a jego fabryczny profil nie jest szczególnie dokładny; zauważyliśmy wyraźny niebieski odcień w połączeniu ze zbyt niską temperaturą barwową. Istnieje jednak możliwość, że urządzenia będą dostarczane ze zoptymalizowanym profilem, ponieważ byliśmy w stanie znacznie poprawić wyświetlacz za pomocą własnej kalibracji. Mimo to nadal występowały pewne wartości odstające kolorów. Przestrzeń kolorów P3 jest prawie całkowicie pokryta.
Wyświetl czasy reakcji
| ↔ Czas reakcji od czerni do bieli | ||
|---|---|---|
| 24.3 ms ... wzrost ↗ i spadek ↘ łącznie | ↗ 8.7 ms wzrost | 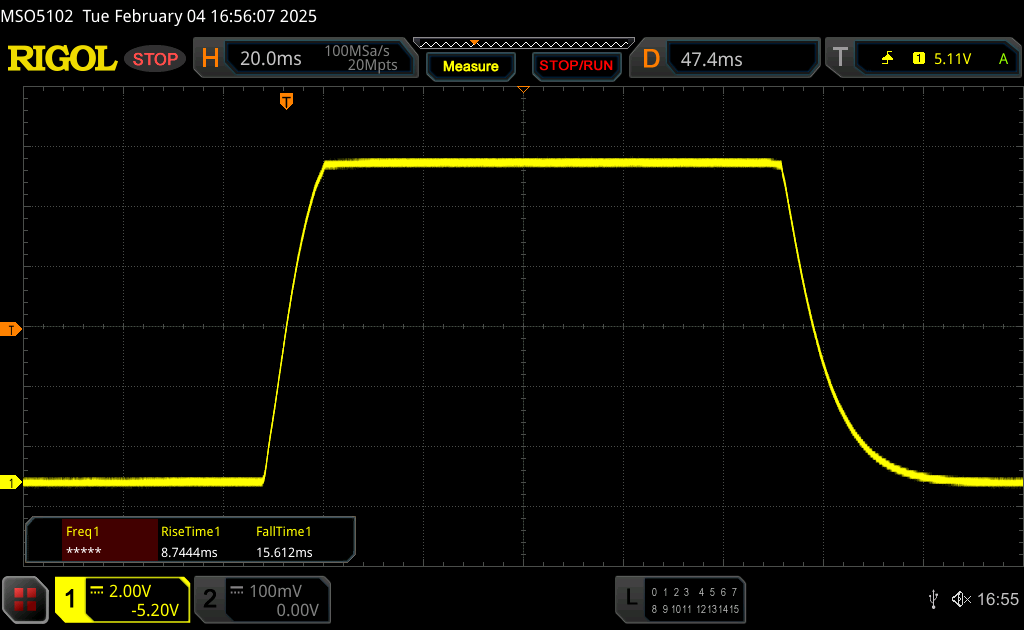 |
| ↘ 15.6 ms upadek | ||
| W naszych testach ekran wykazuje dobry współczynnik reakcji, ale może być zbyt wolny dla graczy rywalizujących ze sobą. Dla porównania, wszystkie testowane urządzenia wahają się od 0.1 (minimum) do 240 (maksimum) ms. » 54 % wszystkich urządzeń jest lepszych. Oznacza to, że zmierzony czas reakcji jest gorszy od średniej wszystkich testowanych urządzeń (20.8 ms). | ||
| ↔ Czas reakcji 50% szarości do 80% szarości | ||
| 51.5 ms ... wzrost ↗ i spadek ↘ łącznie | ↗ 23.1 ms wzrost | 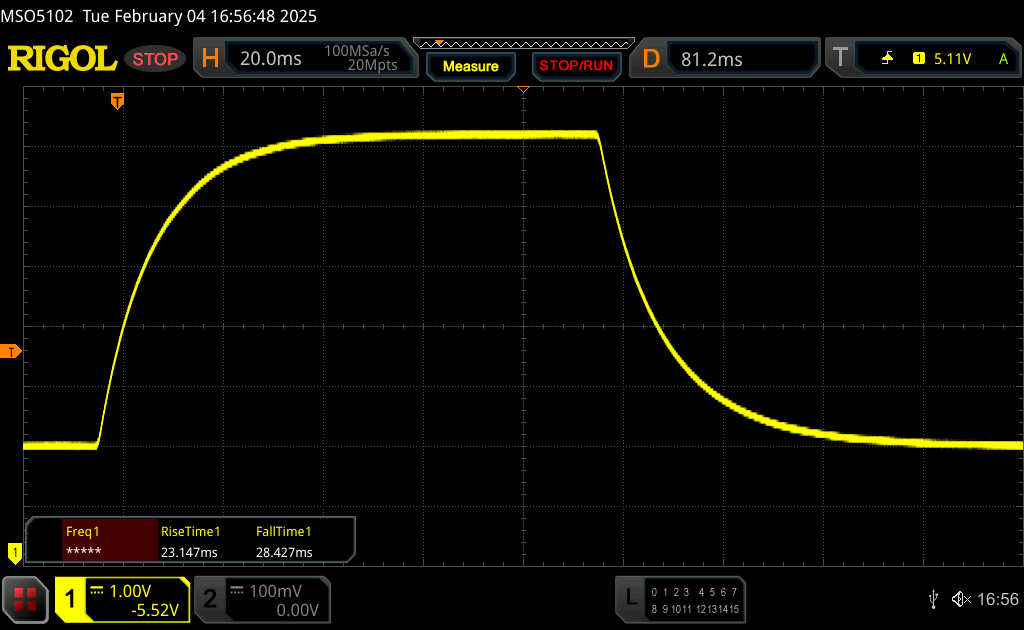 |
| ↘ 28.4 ms upadek | ||
| W naszych testach ekran wykazuje powolne tempo reakcji, co będzie niezadowalające dla graczy. Dla porównania, wszystkie testowane urządzenia wahają się od 0.165 (minimum) do 636 (maksimum) ms. » 87 % wszystkich urządzeń jest lepszych. Oznacza to, że zmierzony czas reakcji jest gorszy od średniej wszystkich testowanych urządzeń (32.5 ms). | ||
Migotanie ekranu / PWM (modulacja szerokości impulsu)
| Migotanie ekranu/nie wykryto PWM |  | ||
Dla porównania: 53 % wszystkich testowanych urządzeń nie używa PWM do przyciemniania wyświetlacza. Jeśli wykryto PWM, zmierzono średnio 8519 (minimum: 5 - maksimum: 343500) Hz. | |||


Wysoce odblaskowy wyświetlacz staje się problemem na zewnątrz; można rozsądnie pracować tylko wtedy, gdy siedzisz w cieniu. Z drugiej strony, w jasnym otoczeniu odbicia są po prostu zbyt silne. Stabilność kąta widzenia panelu IPS jest dobra.

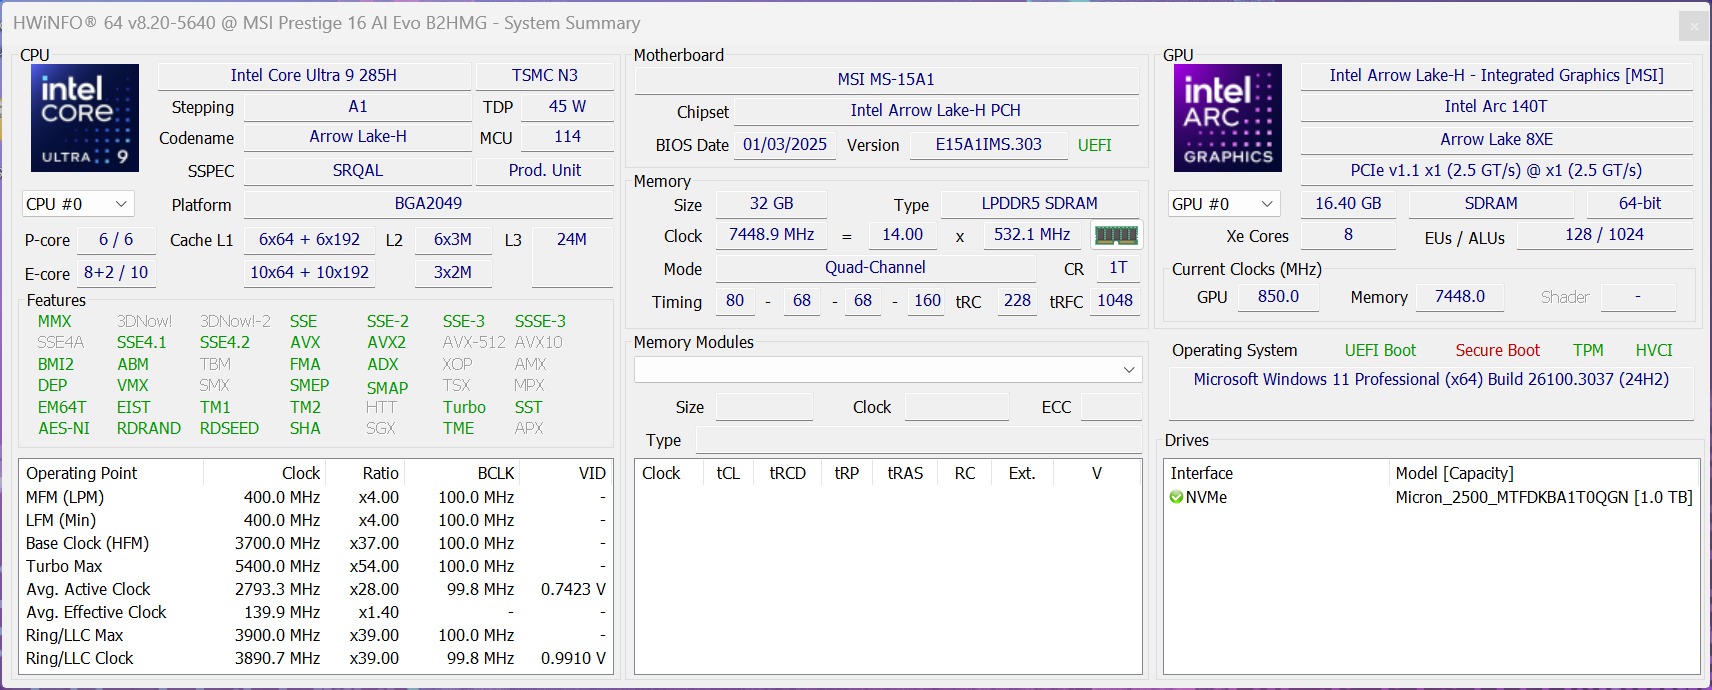
Wydajność - Arrow Lake-H przy 115 watach
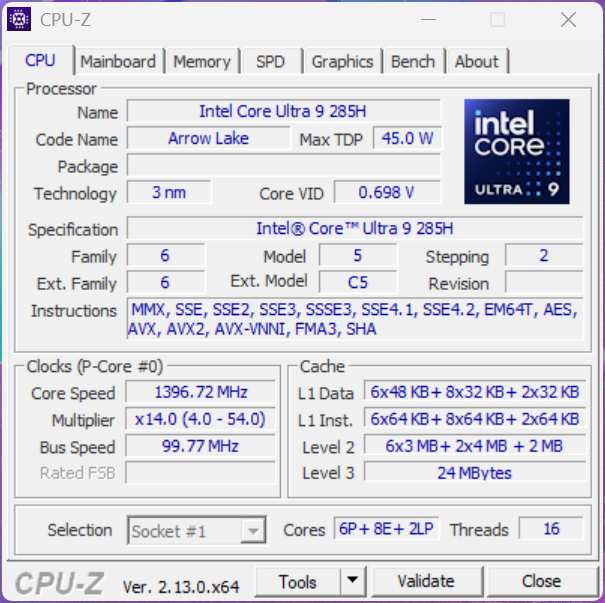
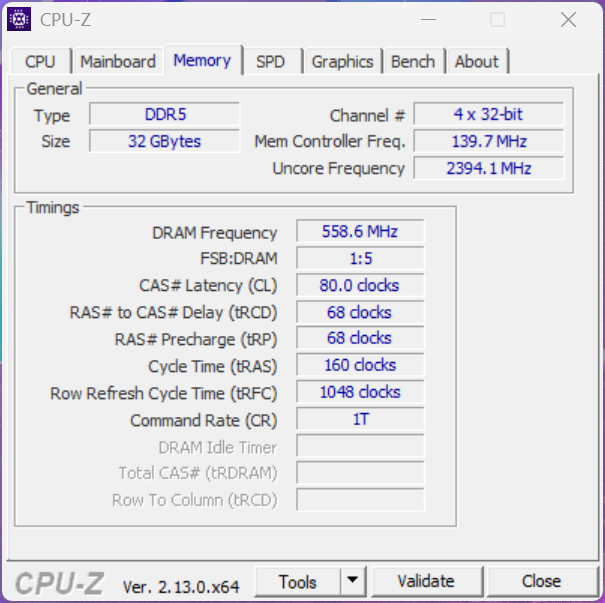
MSI Prestige 16 AI Evo został wyposażony w nowe mobilne procesory Arrow Lake H (Core Ultra 200). Nasze urządzenie testowe jest wyposażone w 32 GB pamięci RAM (LPDDR5x-7500), której nie można rozszerzyć. Dedykowane karty graficzne nie są oferowane przez MSI.
Warunki testowania
Wiele profili energetycznych jest dostępnych do wyboru w preinstalowanym MSI Center (Eco Silent, Balanced i Extreme Performance). Dostępny jest również tryb AI, ale daje on zmienne wyniki. Dezaktywowaliśmy silnik AI i przeprowadziliśmy następujące testy porównawcze i pomiary w trybie zrównoważonym, który jest domyślnie aktywowany.
| Profil energetyczny | TDP procesora | Cinebench 2024 Multi | Time Spy Grafika | maks. emisja hałasu wentylatora |
|---|---|---|---|---|
| Eco Silent | 20/15 watów | 449 punktów | 2,595 punktów | 31 dB(A) |
| Balanced | 115/45 watów | 991 punktów | 4,194 punktów | 42.1 dB(A) |
| Ekstremalna wydajność | 115/55 watów | 1,075 punktów | 4,094 punktów | 46.4 dB(A) |
Procesor - Core Ultra 9 285H
Procesor Core Ultra 9 285H to nowy, topowy model Intela z serii Arrow Lake H (Core Ultra 200) i bezpośredni następca generacji Meteor Lake. Posiada on łącznie 16 rdzeni CPU (22 wątki), przy czym sześć szybkich rdzeni o wysokiej wydajności (w tym hiperwątkowość) osiąga taktowanie do 5,4 GHz. Więcej szczegółów technicznych i porównań wydajności można znaleźć w naszym artykule analitycznym.
Wewnątrz Prestige 16 procesor zużywał maksymalnie 115 watów przez krótki czas, ale jego pobór mocy powoli spadał pod ciągłym obciążeniem, a następnie ustabilizował się na poziomie 45 watów podczas naszego testu. Jego wielordzeniowa wydajność naturalnie na tym skorzystała, zwłaszcza podczas krótkich faz obciążenia, ale jego wydajność spadła o 30% przy ciągłym obciążeniu. Ogólnie rzecz biorąc, urządzenie testowe nadal było w stanie wyprzedzić konkurentów z Core Ultra 9 185H w naszych testach wielordzeniowych, choć limity mocy były tam wyższe. W testach jednordzeniowych jego wydajność była o 12-14% wyższa, ale Core Ultra 9 285H nie mógł zbliżyć się do obecnych układów M4 z Apple. Procesor zużywa maksymalnie 42 waty w trybie bateryjnym. Dalsze testy porównawcze są dostępne w w naszej sekcji technicznej.
Cinebench R15 Multi continuous test
Cinebench R23: Multi Core | Single Core
Cinebench R20: CPU (Multi Core) | CPU (Single Core)
Cinebench R15: CPU Multi 64Bit | CPU Single 64Bit
Blender: v2.79 BMW27 CPU
7-Zip 18.03: 7z b 4 | 7z b 4 -mmt1
Geekbench 6.4: Multi-Core | Single-Core
Geekbench 5.5: Multi-Core | Single-Core
HWBOT x265 Benchmark v2.2: 4k Preset
LibreOffice : 20 Documents To PDF
R Benchmark 2.5: Overall mean
| CPU Performance Rating | |
| Apple MacBook Pro 16 2024 M4 Pro -12! | |
| MSI Prestige 16 AI Evo B2HMG | |
| Przeciętny Intel Core Ultra 9 285H | |
| Lenovo Yoga Pro 9 16IMH9 | |
| Lenovo ThinkBook 16 G7+ AMD | |
| Dell Precision 5690 | |
| MSI Prestige A16 AI+ A3HMG-036 | |
| Asus Zenbook S 16 UM5606-RK333W | |
| Średnia w klasie Multimedia | |
| Samsung Galaxy Book4 Pro 16 | |
| Cinebench R23 / Multi Core | |
| Apple MacBook Pro 16 2024 M4 Pro | |
| MSI Prestige 16 AI Evo B2HMG | |
| Lenovo Yoga Pro 9 16IMH9 | |
| Przeciętny Intel Core Ultra 9 285H (16632 - 22080, n=3) | |
| Dell Precision 5690 | |
| MSI Prestige A16 AI+ A3HMG-036 | |
| Lenovo ThinkBook 16 G7+ AMD | |
| Asus Zenbook S 16 UM5606-RK333W | |
| Średnia w klasie Multimedia (4861 - 30789, n=100, ostatnie 2 lata) | |
| Samsung Galaxy Book4 Pro 16 | |
| Cinebench R23 / Single Core | |
| Apple MacBook Pro 16 2024 M4 Pro | |
| Przeciętny Intel Core Ultra 9 285H (2126 - 2163, n=3) | |
| MSI Prestige 16 AI Evo B2HMG | |
| Lenovo ThinkBook 16 G7+ AMD | |
| MSI Prestige A16 AI+ A3HMG-036 | |
| Asus Zenbook S 16 UM5606-RK333W | |
| Lenovo Yoga Pro 9 16IMH9 | |
| Dell Precision 5690 | |
| Średnia w klasie Multimedia (878 - 2290, n=91, ostatnie 2 lata) | |
| Samsung Galaxy Book4 Pro 16 | |
| Cinebench R20 / CPU (Multi Core) | |
| MSI Prestige 16 AI Evo B2HMG | |
| Lenovo Yoga Pro 9 16IMH9 | |
| Przeciętny Intel Core Ultra 9 285H (6517 - 8251, n=3) | |
| Dell Precision 5690 | |
| Lenovo ThinkBook 16 G7+ AMD | |
| MSI Prestige A16 AI+ A3HMG-036 | |
| Asus Zenbook S 16 UM5606-RK333W | |
| Średnia w klasie Multimedia (1887 - 11924, n=84, ostatnie 2 lata) | |
| Samsung Galaxy Book4 Pro 16 | |
| Cinebench R20 / CPU (Single Core) | |
| Przeciętny Intel Core Ultra 9 285H (810 - 827, n=3) | |
| MSI Prestige 16 AI Evo B2HMG | |
| Lenovo ThinkBook 16 G7+ AMD | |
| MSI Prestige A16 AI+ A3HMG-036 | |
| Asus Zenbook S 16 UM5606-RK333W | |
| Lenovo Yoga Pro 9 16IMH9 | |
| Dell Precision 5690 | |
| Samsung Galaxy Book4 Pro 16 | |
| Średnia w klasie Multimedia (341 - 853, n=84, ostatnie 2 lata) | |
| Cinebench R15 / CPU Multi 64Bit | |
| MSI Prestige 16 AI Evo B2HMG | |
| Dell Precision 5690 | |
| Przeciętny Intel Core Ultra 9 285H (2797 - 3333, n=3) | |
| Lenovo Yoga Pro 9 16IMH9 | |
| Lenovo ThinkBook 16 G7+ AMD | |
| MSI Prestige A16 AI+ A3HMG-036 | |
| Samsung Galaxy Book4 Pro 16 | |
| Średnia w klasie Multimedia (856 - 5224, n=91, ostatnie 2 lata) | |
| Asus Zenbook S 16 UM5606-RK333W | |
| Cinebench R15 / CPU Single 64Bit | |
| Przeciętny Intel Core Ultra 9 285H (313 - 318, n=3) | |
| MSI Prestige 16 AI Evo B2HMG | |
| Lenovo ThinkBook 16 G7+ AMD | |
| MSI Prestige A16 AI+ A3HMG-036 | |
| Asus Zenbook S 16 UM5606-RK333W | |
| Lenovo Yoga Pro 9 16IMH9 | |
| Dell Precision 5690 | |
| Średnia w klasie Multimedia (99.6 - 323, n=86, ostatnie 2 lata) | |
| Samsung Galaxy Book4 Pro 16 | |
| Blender / v2.79 BMW27 CPU | |
| Średnia w klasie Multimedia (100 - 557, n=84, ostatnie 2 lata) | |
| Samsung Galaxy Book4 Pro 16 | |
| Dell Precision 5690 | |
| MSI Prestige A16 AI+ A3HMG-036 | |
| MSI Prestige 16 AI Evo B2HMG | |
| Przeciętny Intel Core Ultra 9 285H (159 - 235, n=3) | |
| Asus Zenbook S 16 UM5606-RK333W | |
| Lenovo ThinkBook 16 G7+ AMD | |
| Lenovo Yoga Pro 9 16IMH9 | |
| 7-Zip 18.03 / 7z b 4 | |
| Lenovo Yoga Pro 9 16IMH9 | |
| Dell Precision 5690 | |
| Lenovo ThinkBook 16 G7+ AMD | |
| Asus Zenbook S 16 UM5606-RK333W | |
| Średnia w klasie Multimedia (29095 - 130368, n=79, ostatnie 2 lata) | |
| Przeciętny Intel Core Ultra 9 285H (53335 - 69676, n=3) | |
| Samsung Galaxy Book4 Pro 16 | |
| MSI Prestige 16 AI Evo B2HMG | |
| MSI Prestige A16 AI+ A3HMG-036 | |
| 7-Zip 18.03 / 7z b 4 -mmt1 | |
| Przeciętny Intel Core Ultra 9 285H (5999 - 6138, n=3) | |
| Asus Zenbook S 16 UM5606-RK333W | |
| MSI Prestige A16 AI+ A3HMG-036 | |
| Lenovo ThinkBook 16 G7+ AMD | |
| MSI Prestige 16 AI Evo B2HMG | |
| Lenovo Yoga Pro 9 16IMH9 | |
| Średnia w klasie Multimedia (3398 - 7545, n=79, ostatnie 2 lata) | |
| Samsung Galaxy Book4 Pro 16 | |
| Dell Precision 5690 | |
| Geekbench 6.4 / Multi-Core | |
| Apple MacBook Pro 16 2024 M4 Pro | |
| MSI Prestige 16 AI Evo B2HMG | |
| Przeciętny Intel Core Ultra 9 285H (15330 - 17992, n=5) | |
| Lenovo ThinkBook 16 G7+ AMD | |
| MSI Prestige A16 AI+ A3HMG-036 | |
| Dell Precision 5690 | |
| Lenovo Yoga Pro 9 16IMH9 | |
| Asus Zenbook S 16 UM5606-RK333W | |
| Średnia w klasie Multimedia (4983 - 25760, n=77, ostatnie 2 lata) | |
| Samsung Galaxy Book4 Pro 16 | |
| Geekbench 6.4 / Single-Core | |
| Apple MacBook Pro 16 2024 M4 Pro | |
| MSI Prestige 16 AI Evo B2HMG | |
| Przeciętny Intel Core Ultra 9 285H (2665 - 3110, n=5) | |
| MSI Prestige A16 AI+ A3HMG-036 | |
| Asus Zenbook S 16 UM5606-RK333W | |
| Lenovo ThinkBook 16 G7+ AMD | |
| Średnia w klasie Multimedia (1534 - 3927, n=73, ostatnie 2 lata) | |
| Lenovo Yoga Pro 9 16IMH9 | |
| Dell Precision 5690 | |
| Samsung Galaxy Book4 Pro 16 | |
| Geekbench 5.5 / Multi-Core | |
| MSI Prestige 16 AI Evo B2HMG | |
| Przeciętny Intel Core Ultra 9 285H (14243 - 16626, n=3) | |
| Dell Precision 5690 | |
| Lenovo Yoga Pro 9 16IMH9 | |
| Lenovo ThinkBook 16 G7+ AMD | |
| MSI Prestige A16 AI+ A3HMG-036 | |
| Asus Zenbook S 16 UM5606-RK333W | |
| Średnia w klasie Multimedia (4652 - 23059, n=83, ostatnie 2 lata) | |
| Samsung Galaxy Book4 Pro 16 | |
| Geekbench 5.5 / Single-Core | |
| MSI Prestige 16 AI Evo B2HMG | |
| Asus Zenbook S 16 UM5606-RK333W | |
| Lenovo ThinkBook 16 G7+ AMD | |
| MSI Prestige A16 AI+ A3HMG-036 | |
| Przeciętny Intel Core Ultra 9 285H (1982 - 2108, n=3) | |
| Lenovo Yoga Pro 9 16IMH9 | |
| Dell Precision 5690 | |
| Średnia w klasie Multimedia (891 - 2555, n=83, ostatnie 2 lata) | |
| Samsung Galaxy Book4 Pro 16 | |
| HWBOT x265 Benchmark v2.2 / 4k Preset | |
| MSI Prestige 16 AI Evo B2HMG | |
| Przeciętny Intel Core Ultra 9 285H (18.8 - 25.9, n=3) | |
| Lenovo Yoga Pro 9 16IMH9 | |
| Lenovo ThinkBook 16 G7+ AMD | |
| Dell Precision 5690 | |
| Asus Zenbook S 16 UM5606-RK333W | |
| MSI Prestige A16 AI+ A3HMG-036 | |
| Średnia w klasie Multimedia (5.26 - 34.3, n=78, ostatnie 2 lata) | |
| Samsung Galaxy Book4 Pro 16 | |
| LibreOffice / 20 Documents To PDF | |
| MSI Prestige A16 AI+ A3HMG-036 | |
| Lenovo ThinkBook 16 G7+ AMD | |
| Średnia w klasie Multimedia (23.9 - 146.7, n=80, ostatnie 2 lata) | |
| Asus Zenbook S 16 UM5606-RK333W | |
| Przeciętny Intel Core Ultra 9 285H (42.8 - 52.1, n=3) | |
| MSI Prestige 16 AI Evo B2HMG | |
| Dell Precision 5690 | |
| Samsung Galaxy Book4 Pro 16 | |
| Lenovo Yoga Pro 9 16IMH9 | |
| R Benchmark 2.5 / Overall mean | |
| Średnia w klasie Multimedia (0.3604 - 0.947, n=78, ostatnie 2 lata) | |
| Samsung Galaxy Book4 Pro 16 | |
| Dell Precision 5690 | |
| Lenovo Yoga Pro 9 16IMH9 | |
| MSI Prestige 16 AI Evo B2HMG | |
| Przeciętny Intel Core Ultra 9 285H (0.427 - 0.4343, n=3) | |
| Asus Zenbook S 16 UM5606-RK333W | |
| Lenovo ThinkBook 16 G7+ AMD | |
| MSI Prestige A16 AI+ A3HMG-036 | |
* ... im mniej tym lepiej
AIDA64: FP32 Ray-Trace | FPU Julia | CPU SHA3 | CPU Queen | FPU SinJulia | FPU Mandel | CPU AES | CPU ZLib | FP64 Ray-Trace | CPU PhotoWorxx
| Performance Rating | |
| Lenovo ThinkBook 16 G7+ AMD | |
| MSI Prestige A16 AI+ A3HMG-036 | |
| Asus Zenbook S 16 UM5606-RK333W | |
| Przeciętny Intel Core Ultra 9 285H | |
| MSI Prestige 16 AI Evo B2HMG | |
| Średnia w klasie Multimedia | |
| Samsung Galaxy Book4 Pro 16 | |
| AIDA64 / FP32 Ray-Trace | |
| Lenovo ThinkBook 16 G7+ AMD | |
| MSI Prestige A16 AI+ A3HMG-036 | |
| Asus Zenbook S 16 UM5606-RK333W | |
| Przeciętny Intel Core Ultra 9 285H (15160 - 23492, n=3) | |
| MSI Prestige 16 AI Evo B2HMG | |
| Średnia w klasie Multimedia (5121 - 50388, n=77, ostatnie 2 lata) | |
| Samsung Galaxy Book4 Pro 16 | |
| AIDA64 / FPU Julia | |
| Lenovo ThinkBook 16 G7+ AMD | |
| MSI Prestige A16 AI+ A3HMG-036 | |
| Asus Zenbook S 16 UM5606-RK333W | |
| Przeciętny Intel Core Ultra 9 285H (78572 - 116017, n=3) | |
| MSI Prestige 16 AI Evo B2HMG | |
| Średnia w klasie Multimedia (14528 - 201874, n=78, ostatnie 2 lata) | |
| Samsung Galaxy Book4 Pro 16 | |
| AIDA64 / CPU SHA3 | |
| Lenovo ThinkBook 16 G7+ AMD | |
| MSI Prestige A16 AI+ A3HMG-036 | |
| Asus Zenbook S 16 UM5606-RK333W | |
| Przeciętny Intel Core Ultra 9 285H (3695 - 5206, n=3) | |
| MSI Prestige 16 AI Evo B2HMG | |
| Średnia w klasie Multimedia (1188 - 8623, n=78, ostatnie 2 lata) | |
| Samsung Galaxy Book4 Pro 16 | |
| AIDA64 / CPU Queen | |
| Średnia w klasie Multimedia (21547 - 181505, n=78, ostatnie 2 lata) | |
| MSI Prestige A16 AI+ A3HMG-036 | |
| Lenovo ThinkBook 16 G7+ AMD | |
| Asus Zenbook S 16 UM5606-RK333W | |
| Samsung Galaxy Book4 Pro 16 | |
| MSI Prestige 16 AI Evo B2HMG | |
| Przeciętny Intel Core Ultra 9 285H (61461 - 66818, n=3) | |
| AIDA64 / FPU SinJulia | |
| Asus Zenbook S 16 UM5606-RK333W | |
| Lenovo ThinkBook 16 G7+ AMD | |
| MSI Prestige A16 AI+ A3HMG-036 | |
| Średnia w klasie Multimedia (1240 - 28794, n=78, ostatnie 2 lata) | |
| Samsung Galaxy Book4 Pro 16 | |
| Przeciętny Intel Core Ultra 9 285H (7275 - 9089, n=3) | |
| MSI Prestige 16 AI Evo B2HMG | |
| AIDA64 / FPU Mandel | |
| Lenovo ThinkBook 16 G7+ AMD | |
| MSI Prestige A16 AI+ A3HMG-036 | |
| Asus Zenbook S 16 UM5606-RK333W | |
| Przeciętny Intel Core Ultra 9 285H (40946 - 61884, n=3) | |
| MSI Prestige 16 AI Evo B2HMG | |
| Średnia w klasie Multimedia (9903 - 105740, n=77, ostatnie 2 lata) | |
| Samsung Galaxy Book4 Pro 16 | |
| AIDA64 / CPU AES | |
| Średnia w klasie Multimedia (26066 - 169946, n=78, ostatnie 2 lata) | |
| Samsung Galaxy Book4 Pro 16 | |
| Przeciętny Intel Core Ultra 9 285H (58110 - 79949, n=3) | |
| Lenovo ThinkBook 16 G7+ AMD | |
| Asus Zenbook S 16 UM5606-RK333W | |
| MSI Prestige 16 AI Evo B2HMG | |
| MSI Prestige A16 AI+ A3HMG-036 | |
| AIDA64 / CPU ZLib | |
| Lenovo ThinkBook 16 G7+ AMD | |
| MSI Prestige A16 AI+ A3HMG-036 | |
| Asus Zenbook S 16 UM5606-RK333W | |
| Przeciętny Intel Core Ultra 9 285H (886 - 1233, n=3) | |
| MSI Prestige 16 AI Evo B2HMG | |
| Samsung Galaxy Book4 Pro 16 | |
| Średnia w klasie Multimedia (440 - 2022, n=78, ostatnie 2 lata) | |
| AIDA64 / FP64 Ray-Trace | |
| Lenovo ThinkBook 16 G7+ AMD | |
| MSI Prestige A16 AI+ A3HMG-036 | |
| Asus Zenbook S 16 UM5606-RK333W | |
| Przeciętny Intel Core Ultra 9 285H (7741 - 12887, n=3) | |
| MSI Prestige 16 AI Evo B2HMG | |
| Średnia w klasie Multimedia (2759 - 26875, n=78, ostatnie 2 lata) | |
| Samsung Galaxy Book4 Pro 16 | |
| AIDA64 / CPU PhotoWorxx | |
| MSI Prestige 16 AI Evo B2HMG | |
| Przeciętny Intel Core Ultra 9 285H (58622 - 58848, n=3) | |
| Samsung Galaxy Book4 Pro 16 | |
| MSI Prestige A16 AI+ A3HMG-036 | |
| Lenovo ThinkBook 16 G7+ AMD | |
| Asus Zenbook S 16 UM5606-RK333W | |
| Średnia w klasie Multimedia (12860 - 58844, n=78, ostatnie 2 lata) | |
Wydajność systemu
Nasze urządzenie testowe wypadło bardzo dobrze w testach systemowych i okazało się bardzo responsywnym laptopem, ale dotyczyło to również innych porównywanych urządzeń.
CrossMark: Overall | Productivity | Creativity | Responsiveness
WebXPRT 3: Overall
WebXPRT 4: Overall
Mozilla Kraken 1.1: Total
| PCMark 10 / Score | |
| MSI Prestige 16 AI Evo B2HMG | |
| Przeciętny Intel Core Ultra 9 285H, Intel Arc Graphics 140T (7514 - 7838, n=2) | |
| MSI Prestige A16 AI+ A3HMG-036 | |
| Lenovo ThinkBook 16 G7+ AMD | |
| Asus Zenbook S 16 UM5606-RK333W | |
| Średnia w klasie Multimedia (4325 - 8670, n=72, ostatnie 2 lata) | |
| Samsung Galaxy Book4 Pro 16 | |
| PCMark 10 / Essentials | |
| MSI Prestige 16 AI Evo B2HMG | |
| Samsung Galaxy Book4 Pro 16 | |
| Przeciętny Intel Core Ultra 9 285H, Intel Arc Graphics 140T (10931 - 11171, n=2) | |
| MSI Prestige A16 AI+ A3HMG-036 | |
| Asus Zenbook S 16 UM5606-RK333W | |
| Lenovo ThinkBook 16 G7+ AMD | |
| Średnia w klasie Multimedia (8025 - 12420, n=72, ostatnie 2 lata) | |
| PCMark 10 / Productivity | |
| Asus Zenbook S 16 UM5606-RK333W | |
| MSI Prestige A16 AI+ A3HMG-036 | |
| Lenovo ThinkBook 16 G7+ AMD | |
| MSI Prestige 16 AI Evo B2HMG | |
| Przeciętny Intel Core Ultra 9 285H, Intel Arc Graphics 140T (8818 - 9594, n=2) | |
| Średnia w klasie Multimedia (6089 - 10615, n=72, ostatnie 2 lata) | |
| Samsung Galaxy Book4 Pro 16 | |
| PCMark 10 / Digital Content Creation | |
| MSI Prestige 16 AI Evo B2HMG | |
| Przeciętny Intel Core Ultra 9 285H, Intel Arc Graphics 140T (11948 - 12193, n=2) | |
| Lenovo ThinkBook 16 G7+ AMD | |
| MSI Prestige A16 AI+ A3HMG-036 | |
| Asus Zenbook S 16 UM5606-RK333W | |
| Średnia w klasie Multimedia (3651 - 13548, n=72, ostatnie 2 lata) | |
| Samsung Galaxy Book4 Pro 16 | |
| CrossMark / Overall | |
| MSI Prestige 16 AI Evo B2HMG | |
| Apple MacBook Pro 16 2024 M4 Pro | |
| Przeciętny Intel Core Ultra 9 285H, Intel Arc Graphics 140T (1812 - 2173, n=2) | |
| Samsung Galaxy Book4 Pro 16 | |
| Asus Zenbook S 16 UM5606-RK333W | |
| Lenovo ThinkBook 16 G7+ AMD | |
| MSI Prestige A16 AI+ A3HMG-036 | |
| Średnia w klasie Multimedia (866 - 2255, n=85, ostatnie 2 lata) | |
| CrossMark / Productivity | |
| MSI Prestige 16 AI Evo B2HMG | |
| Apple MacBook Pro 16 2024 M4 Pro | |
| Przeciętny Intel Core Ultra 9 285H, Intel Arc Graphics 140T (1693 - 2050, n=2) | |
| Samsung Galaxy Book4 Pro 16 | |
| Średnia w klasie Multimedia (913 - 2050, n=85, ostatnie 2 lata) | |
| Asus Zenbook S 16 UM5606-RK333W | |
| Lenovo ThinkBook 16 G7+ AMD | |
| MSI Prestige A16 AI+ A3HMG-036 | |
| CrossMark / Creativity | |
| Apple MacBook Pro 16 2024 M4 Pro | |
| MSI Prestige 16 AI Evo B2HMG | |
| Przeciętny Intel Core Ultra 9 285H, Intel Arc Graphics 140T (2125 - 2377, n=2) | |
| MSI Prestige A16 AI+ A3HMG-036 | |
| Lenovo ThinkBook 16 G7+ AMD | |
| Asus Zenbook S 16 UM5606-RK333W | |
| Średnia w klasie Multimedia (907 - 2795, n=85, ostatnie 2 lata) | |
| Samsung Galaxy Book4 Pro 16 | |
| CrossMark / Responsiveness | |
| MSI Prestige 16 AI Evo B2HMG | |
| Przeciętny Intel Core Ultra 9 285H, Intel Arc Graphics 140T (1375 - 1981, n=2) | |
| Apple MacBook Pro 16 2024 M4 Pro | |
| Samsung Galaxy Book4 Pro 16 | |
| Średnia w klasie Multimedia (605 - 2094, n=85, ostatnie 2 lata) | |
| Asus Zenbook S 16 UM5606-RK333W | |
| Lenovo ThinkBook 16 G7+ AMD | |
| MSI Prestige A16 AI+ A3HMG-036 | |
| WebXPRT 3 / Overall | |
| Apple MacBook Pro 16 2024 M4 Pro | |
| MSI Prestige 16 AI Evo B2HMG | |
| Asus Zenbook S 16 UM5606-RK333W | |
| Średnia w klasie Multimedia (136.4 - 545, n=83, ostatnie 2 lata) | |
| Przeciętny Intel Core Ultra 9 285H, Intel Arc Graphics 140T (280 - 358, n=2) | |
| Lenovo ThinkBook 16 G7+ AMD | |
| MSI Prestige A16 AI+ A3HMG-036 | |
| Samsung Galaxy Book4 Pro 16 | |
| WebXPRT 4 / Overall | |
| Apple MacBook Pro 16 2024 M4 Pro | |
| MSI Prestige A16 AI+ A3HMG-036 | |
| MSI Prestige 16 AI Evo B2HMG | |
| Przeciętny Intel Core Ultra 9 285H, Intel Arc Graphics 140T (254 - 324, n=2) | |
| Średnia w klasie Multimedia (133.2 - 353, n=77, ostatnie 2 lata) | |
| Asus Zenbook S 16 UM5606-RK333W | |
| Samsung Galaxy Book4 Pro 16 | |
| Lenovo ThinkBook 16 G7+ AMD | |
| Mozilla Kraken 1.1 / Total | |
| Samsung Galaxy Book4 Pro 16 | |
| Średnia w klasie Multimedia (254 - 1016, n=88, ostatnie 2 lata) | |
| Przeciętny Intel Core Ultra 9 285H, Intel Arc Graphics 140T (422 - 464, n=2) | |
| Asus Zenbook S 16 UM5606-RK333W | |
| MSI Prestige A16 AI+ A3HMG-036 | |
| Lenovo ThinkBook 16 G7+ AMD | |
| MSI Prestige 16 AI Evo B2HMG | |
| Apple MacBook Pro 16 2024 M4 Pro | |
* ... im mniej tym lepiej
| PCMark 10 Score | 7838 pkt. | |
Pomoc | ||
| AIDA64 / Memory Copy | |
| MSI Prestige 16 AI Evo B2HMG | |
| Przeciętny Intel Core Ultra 9 285H (88278 - 97612, n=3) | |
| Samsung Galaxy Book4 Pro 16 | |
| Asus Zenbook S 16 UM5606-RK333W | |
| MSI Prestige A16 AI+ A3HMG-036 | |
| Lenovo ThinkBook 16 G7+ AMD | |
| Średnia w klasie Multimedia (21158 - 104459, n=78, ostatnie 2 lata) | |
| AIDA64 / Memory Read | |
| Asus Zenbook S 16 UM5606-RK333W | |
| Lenovo ThinkBook 16 G7+ AMD | |
| MSI Prestige A16 AI+ A3HMG-036 | |
| Samsung Galaxy Book4 Pro 16 | |
| MSI Prestige 16 AI Evo B2HMG | |
| Przeciętny Intel Core Ultra 9 285H (78309 - 80277, n=3) | |
| Średnia w klasie Multimedia (24312 - 125604, n=78, ostatnie 2 lata) | |
| AIDA64 / Memory Write | |
| Asus Zenbook S 16 UM5606-RK333W | |
| Lenovo ThinkBook 16 G7+ AMD | |
| MSI Prestige A16 AI+ A3HMG-036 | |
| Samsung Galaxy Book4 Pro 16 | |
| Średnia w klasie Multimedia (23679 - 117933, n=78, ostatnie 2 lata) | |
| Przeciętny Intel Core Ultra 9 285H (62446 - 75619, n=3) | |
| MSI Prestige 16 AI Evo B2HMG | |
| AIDA64 / Memory Latency | |
| MSI Prestige 16 AI Evo B2HMG | |
| Przeciętny Intel Core Ultra 9 285H (128.7 - 133.1, n=3) | |
| MSI Prestige A16 AI+ A3HMG-036 | |
| Samsung Galaxy Book4 Pro 16 | |
| Lenovo ThinkBook 16 G7+ AMD | |
| Asus Zenbook S 16 UM5606-RK333W | |
| Średnia w klasie Multimedia (7 - 346, n=78, ostatnie 2 lata) | |
* ... im mniej tym lepiej
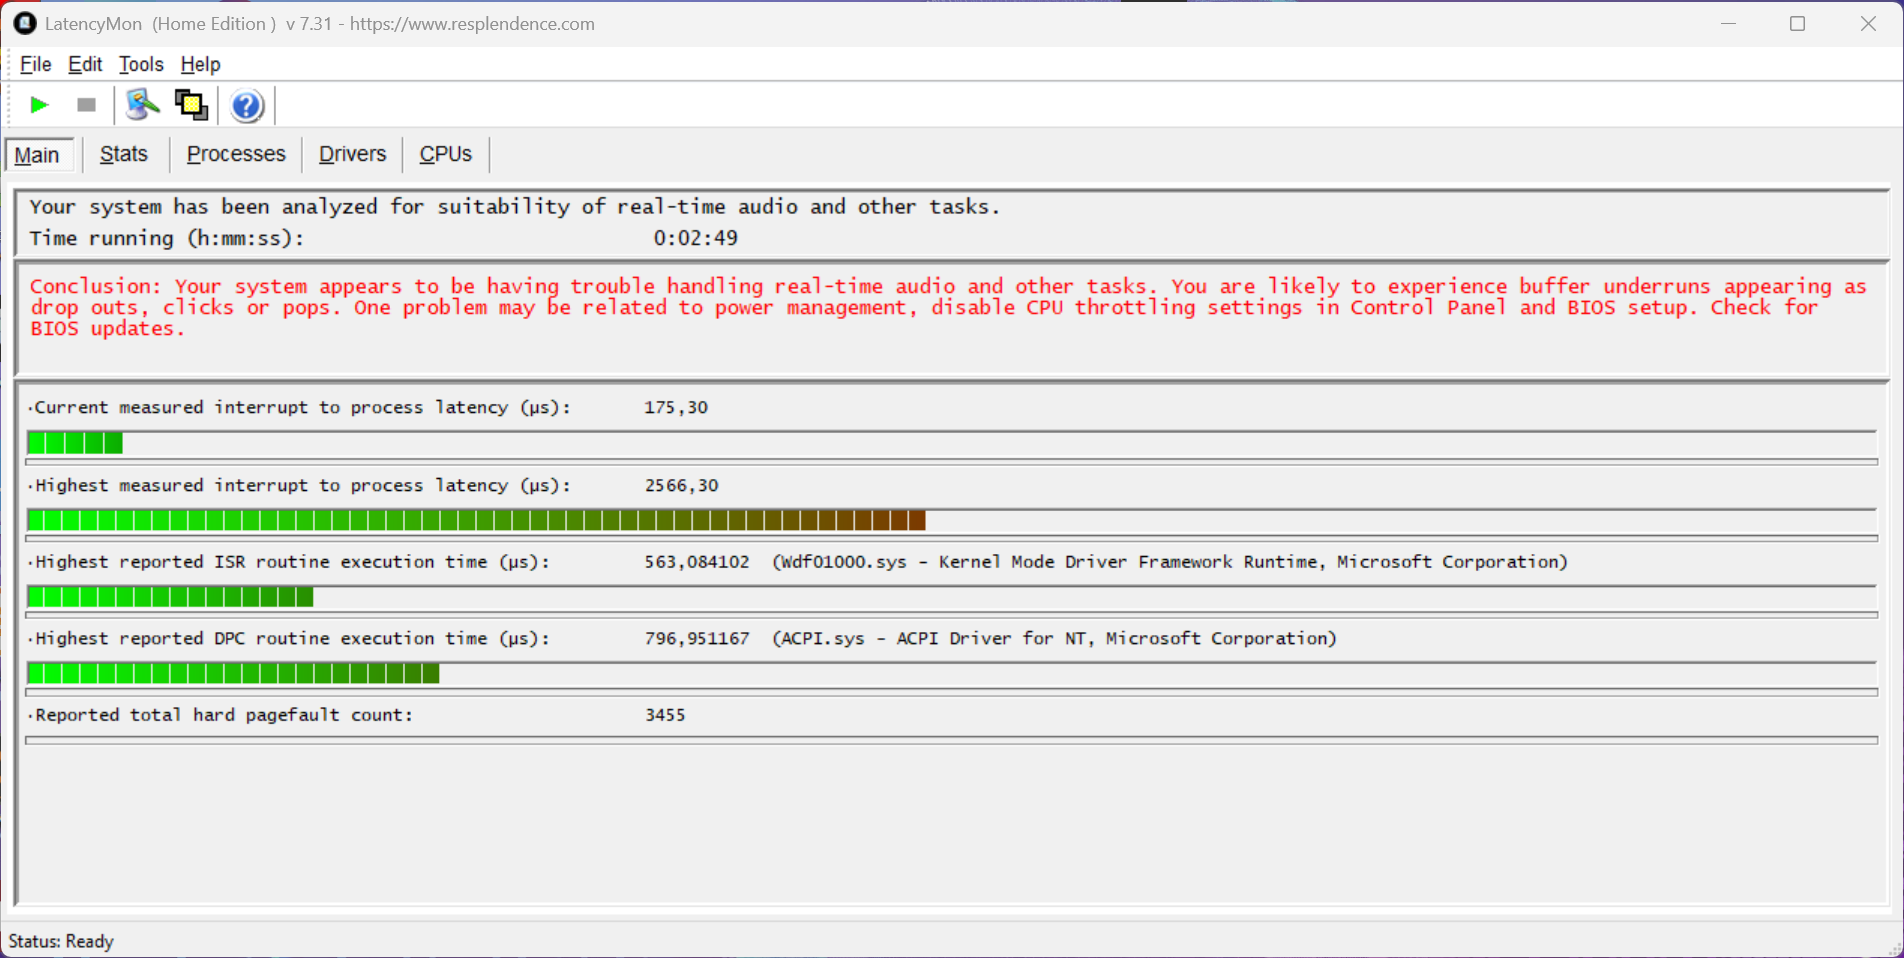
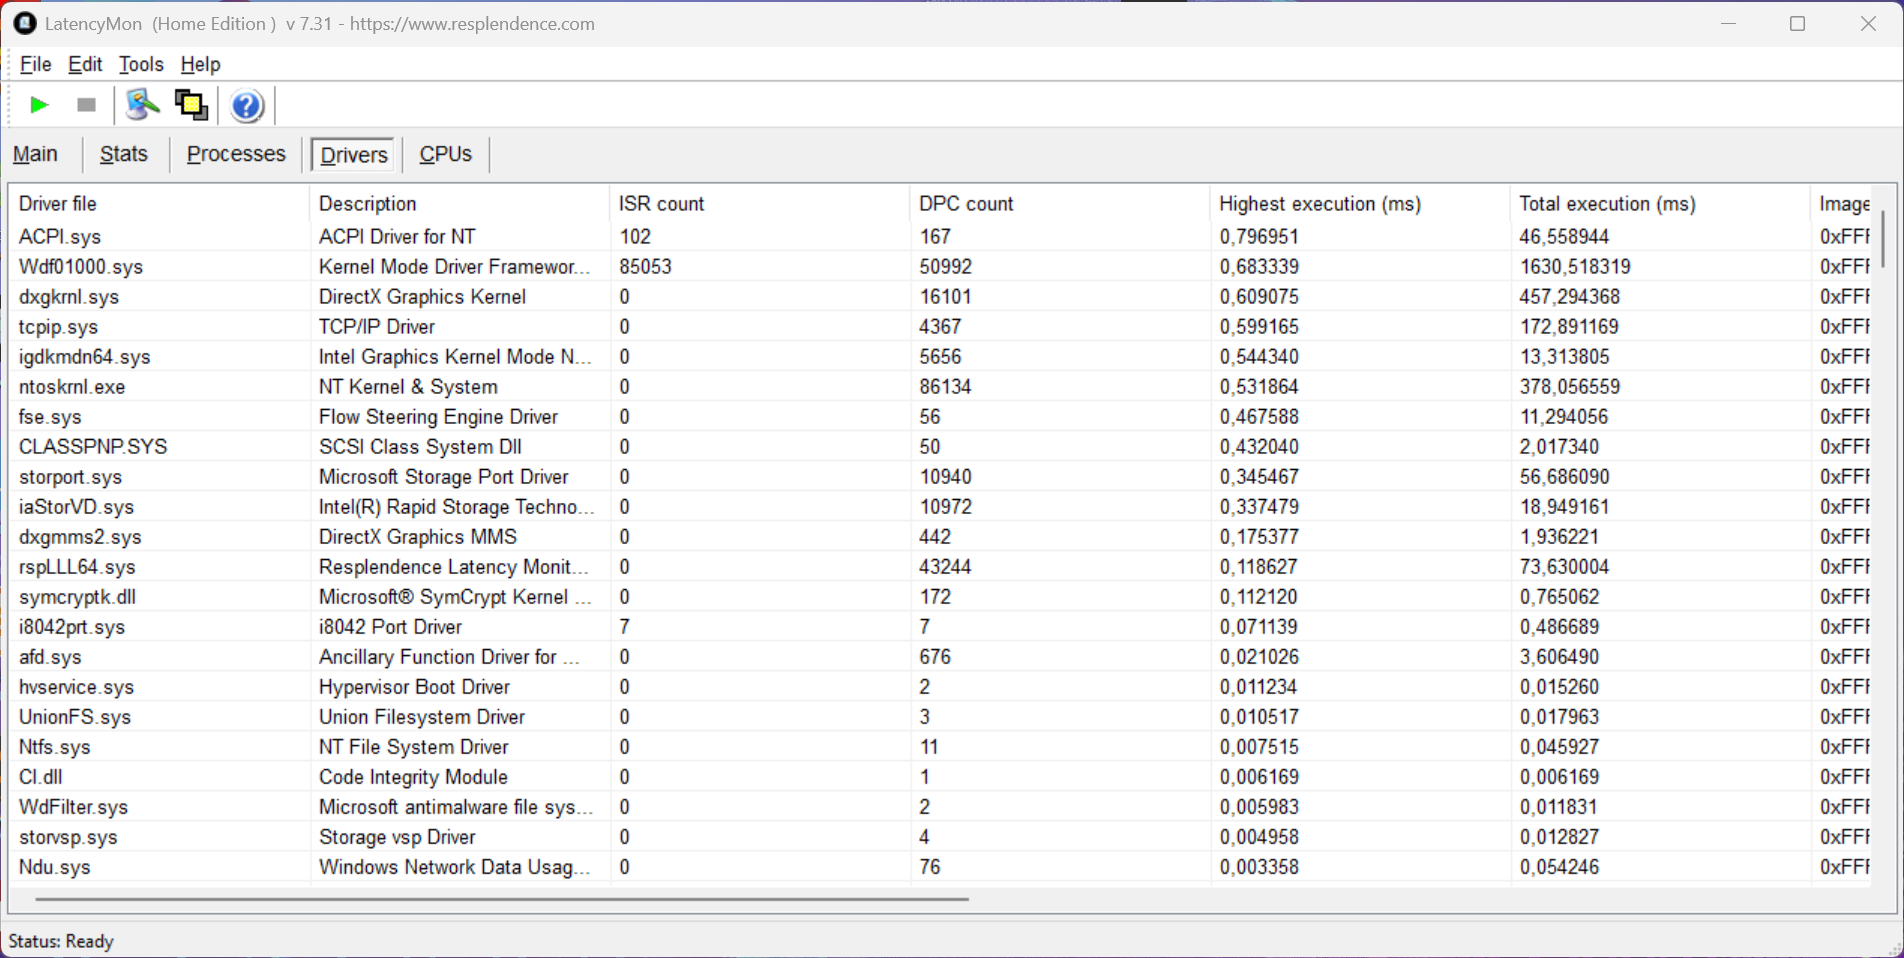
Opóźnienia DPC
W naszym standardowym teście opóźnień (surfowanie po sieci, odtwarzanie w 4K na YouTube, obciążenie procesora), nasze urządzenie testowe z aktualną wersją BIOS-u wykazało ograniczenia podczas korzystania z aplikacji audio w czasie rzeczywistym.
| DPC Latencies / LatencyMon - interrupt to process latency (max), Web, Youtube, Prime95 | |
| MSI Prestige 16 AI Evo B2HMG | |
| Samsung Galaxy Book4 Pro 16 | |
| Lenovo ThinkBook 16 G7+ AMD | |
| MSI Prestige A16 AI+ A3HMG-036 | |
* ... im mniej tym lepiej
Urządzenie pamięci masowej
Laptop MSI został wyposażony w dwa pełnoprawne sloty na dyski SSD M.2 2280, a w naszym urządzeniu testowym zainstalowano wersję Micron 2500 o pojemności 1 TB. Po pierwszym uruchomieniu urządzenia użytkownicy mają do dyspozycji 884 GB. Wydajność dysku SSD PCIe 4.0 była bardzo dobra podczas naszych testów, pozostając całkowicie stabilna nawet przy stałym obciążeniu. Więcej testów porównawczych dysków SSD można znaleźć tutaj.

* ... im mniej tym lepiej
Reading continuous performance: DiskSpd Read Loop, Queue Depth 8
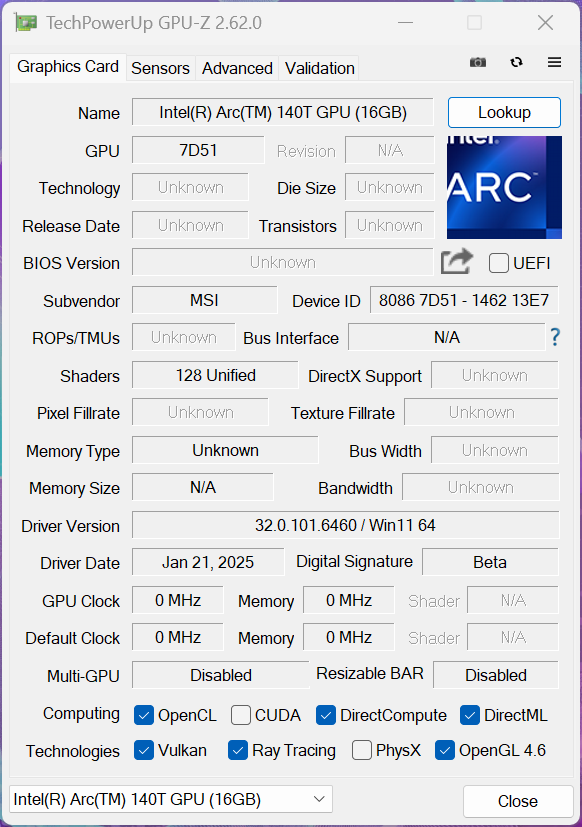
Karta graficzna
Nowy Core Ultra 9 285H jest wyposażony w Arc Graphics 140Tktóry zasadniczo różni się od Arc Graphics 140V z procesorów Lunar Lake. Podczas gdy 140V wykorzystuje rdzenie Xe drugiej generacji, 140T jest ulepszoną wersją Arc Graphics z 8 rdzeniami Xe pierwszej generacji, która była używana w układach Meteor Lake. Układy Lunar Lake pracują ze znacznie niższymi limitami mocy, ale jeśli spojrzeć na najszybsze warianty, to nie ma większych różnic w wydajności pomiędzy 140T/140V. Wydajność GPU pozostaje stabilna przy ciągłym obciążeniu, a wydajność spada tylko minimalnie (około 5%) w trybie bateryjnym.
Sterowniki również nie wydają się być jeszcze w pełni dopracowane, gdyż zauważyliśmy znaczące różnice w zależności od benchmarku. W niektórych przypadkach nowy 140T był ledwie szybszy od starego Arc Graphics, ale w niektórych testach był nawet o ponad 20% szybszy. Dotyczyło to również porównań z obecnymi kartami AMD Radeon 880M/890M iGPU. Obraz ten powtórzył się w naszych standardowych testach gier, ze średnim wzrostem wydajności o około 20%. Oprócz znanego już skalowania XeSS, nowe układy GPU obsługują teraz także funkcję Frame Generation w wybranych grach. Wypróbowaliśmy tę funkcję w grze F1 2024 i udało nam się odnotować ogromny wzrost wydajności, który udokumentowaliśmy w poniższej tabeli. Warto zauważyć, że funkcja Frame Generation może być również używana bez skalowania XeSS. Więcej szczegółów na temat tej technologii i wydajności można znaleźć w naszym artykule analitycznym.
| Natywny | Generowanie klatek | Jakość XeSS | Jakość XeSS + Generowanie klatek | |
|---|---|---|---|---|
| F1 24 1080p High | 59 FPS | 87 FPS | 73 FPS | 105 FPS |
| F1 24 1080p Ultra | 20 FPS | 36 FPS | 32 FPS | 56 FPS |
| 3DMark 11 - 1280x720 Performance GPU | |
| Średnia w klasie Multimedia (3765 - 60250, n=78, ostatnie 2 lata) | |
| Lenovo ThinkBook 16 G7+ AMD | |
| MSI Prestige A16 AI+ A3HMG-036 | |
| Asus Zenbook S 16 UM5606-RK333W | |
| Przeciętny Intel Arc Graphics 140T (12445 - 14932, n=3) | |
| MSI Prestige 16 AI Evo B2HMG | |
| Samsung Galaxy Book4 Pro 16 | |
| Asus Zenbook S 14 UX5406 Core Ultra 9 | |
| 3DMark | |
| 1920x1080 Fire Strike Graphics | |
| Średnia w klasie Multimedia (2328 - 46022, n=81, ostatnie 2 lata) | |
| Asus Zenbook S 14 UX5406 Core Ultra 9 | |
| Lenovo ThinkBook 16 G7+ AMD | |
| Przeciętny Intel Arc Graphics 140T (9173 - 10299, n=3) | |
| MSI Prestige A16 AI+ A3HMG-036 | |
| MSI Prestige 16 AI Evo B2HMG | |
| Samsung Galaxy Book4 Pro 16 | |
| Asus Zenbook S 16 UM5606-RK333W | |
| 2560x1440 Time Spy Graphics | |
| Średnia w klasie Multimedia (696 - 17620, n=82, ostatnie 2 lata) | |
| Asus Zenbook S 14 UX5406 Core Ultra 9 | |
| MSI Prestige 16 AI Evo B2HMG | |
| Przeciętny Intel Arc Graphics 140T (4074 - 4212, n=3) | |
| MSI Prestige A16 AI+ A3HMG-036 | |
| Lenovo ThinkBook 16 G7+ AMD | |
| Samsung Galaxy Book4 Pro 16 | |
| Asus Zenbook S 16 UM5606-RK333W | |
| Steel Nomad Light Score | |
| Apple MacBook Pro 16 2024 M4 Pro | |
| Średnia w klasie Multimedia (1147 - 13989, n=30, ostatnie 2 lata) | |
| MSI Prestige 16 AI Evo B2HMG | |
| Przeciętny Intel Arc Graphics 140T (3620 - 3692, n=3) | |
| Asus Zenbook S 14 UX5406 Core Ultra 9 | |
| Lenovo ThinkBook 16 G7+ AMD | |
| Asus Zenbook S 16 UM5606-RK333W | |
| 3DMark 06 Standard Score | 48766 pkt. | |
| 3DMark Vantage P Result | 58039 pkt. | |
| 3DMark 11 Performance | 13286 pkt. | |
| 3DMark Ice Storm Standard Score | 227616 pkt. | |
| 3DMark Cloud Gate Standard Score | 40950 pkt. | |
| 3DMark Fire Strike Score | 8721 pkt. | |
| 3DMark Time Spy Score | 4639 pkt. | |
| 3DMark Steel Nomad Score | 919 pkt. | |
| 3DMark Steel Nomad Light Score | 3692 pkt. | |
Pomoc | ||
| Blender / v3.3 Classroom CPU | |
| Średnia w klasie Multimedia (160 - 1042, n=84, ostatnie 2 lata) | |
| Samsung Galaxy Book4 Pro 16 | |
| Przeciętny Intel Arc Graphics 140T (295 - 417, n=3) | |
| MSI Prestige 16 AI Evo B2HMG | |
| MSI Prestige A16 AI+ A3HMG-036 | |
| Asus Zenbook S 16 UM5606-RK333W | |
| Lenovo ThinkBook 16 G7+ AMD | |
* ... im mniej tym lepiej
| Performance Rating - Percent | |
| Średnia w klasie Multimedia | |
| Lenovo ThinkBook 16 G7+ AMD | |
| Asus Zenbook S 14 UX5406 Core Ultra 9 | |
| MSI Prestige 16 AI Evo B2HMG | |
| MSI Prestige A16 AI+ A3HMG-036 | |
| Asus Zenbook S 16 UM5606-RK333W | |
| Samsung Galaxy Book4 Pro 16 -1! | |
| Cyberpunk 2077 2.2 Phantom Liberty - 1920x1080 Ultra Preset (FSR off) | |
| Średnia w klasie Multimedia (8.26 - 86, n=63, ostatnie 2 lata) | |
| Asus Zenbook S 14 UX5406 Core Ultra 9 | |
| MSI Prestige 16 AI Evo B2HMG | |
| Lenovo ThinkBook 16 G7+ AMD | |
| MSI Prestige A16 AI+ A3HMG-036 | |
| Asus Zenbook S 16 UM5606-RK333W | |
| Samsung Galaxy Book4 Pro 16 | |
| Baldur's Gate 3 - 1920x1080 Ultra Preset | |
| Średnia w klasie Multimedia (9.1 - 117.7, n=51, ostatnie 2 lata) | |
| Lenovo ThinkBook 16 G7+ AMD | |
| Asus Zenbook S 14 UX5406 Core Ultra 9 | |
| MSI Prestige A16 AI+ A3HMG-036 | |
| MSI Prestige 16 AI Evo B2HMG | |
| Asus Zenbook S 16 UM5606-RK333W | |
| GTA V - 1920x1080 Highest Settings possible AA:4xMSAA + FX AF:16x | |
| Średnia w klasie Multimedia (9.38 - 141.6, n=81, ostatnie 2 lata) | |
| Lenovo ThinkBook 16 G7+ AMD | |
| MSI Prestige A16 AI+ A3HMG-036 | |
| Asus Zenbook S 16 UM5606-RK333W | |
| Asus Zenbook S 14 UX5406 Core Ultra 9 | |
| MSI Prestige 16 AI Evo B2HMG | |
| Samsung Galaxy Book4 Pro 16 | |
| Final Fantasy XV Benchmark - 1920x1080 High Quality | |
| Średnia w klasie Multimedia (7.61 - 141.8, n=82, ostatnie 2 lata) | |
| Asus Zenbook S 14 UX5406 Core Ultra 9 | |
| Lenovo ThinkBook 16 G7+ AMD | |
| MSI Prestige 16 AI Evo B2HMG | |
| MSI Prestige A16 AI+ A3HMG-036 | |
| Asus Zenbook S 16 UM5606-RK333W | |
| Samsung Galaxy Book4 Pro 16 | |
| Strange Brigade - 1920x1080 ultra AA:ultra AF:16 | |
| Średnia w klasie Multimedia (13.3 - 233, n=81, ostatnie 2 lata) | |
| MSI Prestige 16 AI Evo B2HMG | |
| Asus Zenbook S 14 UX5406 Core Ultra 9 | |
| Lenovo ThinkBook 16 G7+ AMD | |
| MSI Prestige A16 AI+ A3HMG-036 | |
| Asus Zenbook S 16 UM5606-RK333W | |
| Samsung Galaxy Book4 Pro 16 | |
| Dota 2 Reborn - 1920x1080 ultra (3/3) best looking | |
| Średnia w klasie Multimedia (29 - 179.9, n=83, ostatnie 2 lata) | |
| Lenovo ThinkBook 16 G7+ AMD | |
| MSI Prestige 16 AI Evo B2HMG | |
| Asus Zenbook S 14 UX5406 Core Ultra 9 | |
| Samsung Galaxy Book4 Pro 16 | |
| MSI Prestige A16 AI+ A3HMG-036 | |
| Asus Zenbook S 16 UM5606-RK333W | |
| X-Plane 11.11 - 1920x1080 high (fps_test=3) | |
| Średnia w klasie Multimedia (16.9 - 141.1, n=80, ostatnie 2 lata) | |
| Lenovo ThinkBook 16 G7+ AMD | |
| Asus Zenbook S 16 UM5606-RK333W | |
| MSI Prestige A16 AI+ A3HMG-036 | |
| MSI Prestige 16 AI Evo B2HMG | |
| Asus Zenbook S 14 UX5406 Core Ultra 9 | |
| Samsung Galaxy Book4 Pro 16 | |
Cyberpunk 2077 ultra FPS diagram
| low | med. | high | ultra | |
|---|---|---|---|---|
| GTA V (2015) | 156.4 | 152.3 | 43.2 | 17 |
| Dota 2 Reborn (2015) | 107.7 | 84.7 | 76.8 | 83.8 |
| Final Fantasy XV Benchmark (2018) | 90.1 | 47.9 | 30.6 | |
| X-Plane 11.11 (2018) | 55.7 | 45.1 | 38.4 | |
| Far Cry 5 (2018) | 87 | 48 | 44 | 42 |
| Strange Brigade (2018) | 216 | 90.9 | 75.1 | 61.6 |
| Baldur's Gate 3 (2023) | 40.9 | 31.4 | 26.9 | 26.4 |
| Cyberpunk 2077 2.2 Phantom Liberty (2023) | 41.7 | 34.7 | 29.7 | 27.3 |
| F1 24 (2024) | 82.3 | 74.1 | 58.9 | 19.9 |
Emisje - MSI Prestige z tylko jednym wentylatorem
Emisja hałasu
Prestige jest wyposażony tylko w jeden wentylator, co oczywiście nie jest idealnym rozwiązaniem, biorąc pod uwagę jego wysokie limity mocy. Podczas codziennego użytkowania wentylator uruchamia się stosunkowo szybko, ale pozostaje dość cichy w trybie zrównoważonym podczas prostych zadań. Zmierzyliśmy tylko 42 dB(A) przy wyższych obciążeniach. W trybie Extreme Performance odnotowaliśmy do 46 dB(A), a ze względu na wysoką prędkość obrotową, staje się on znacznie bardziej irytujący niż w trybie zrównoważonym. W trybie Eco-Silent maksimum, jakie zmierzyliśmy, wyniosło 31 dB(A), ale jego wydajność była również znacznie niższa. W naszym urządzeniu testowym nie było żadnych innych odgłosów elektronicznych.
Wentylator w modelu Lunar Lake powinien działać znacznie lepiej ze względu na niższe limity mocy, ale naszym zdaniem MSI straciło okazję do zaoferowania znacznie cichszego urządzenia, instalując drugi wentylator w modelach Arrow Lake.
Hałas
| luz |
| 23.6 / 23.6 / 26.2 dB |
| obciążenie |
| 37.1 / 42.1 dB |
 | ||
30 dB cichy 40 dB(A) słyszalny 50 dB(A) irytujący |
||
min: | ||
| MSI Prestige 16 AI Evo B2HMG Arc 140T, Ultra 9 285H, Micron 2500 1TB MTFDKBA1T0QGN | Lenovo ThinkBook 16 G7+ AMD Radeon 880M, Ryzen AI 9 365, Samsung PM9C1a MZAL81T0HDLB | MSI Prestige A16 AI+ A3HMG-036 Radeon 880M, Ryzen AI 9 365, Samsung PM9C1 MZVL81T0HELB-00BTW | Apple MacBook Pro 16 2024 M4 Pro M4 Pro 20-Core GPU, M4 Pro (14 cores), Apple SSD AP2048Z | Asus Zenbook S 16 UM5606-RK333W Radeon 890M, Ryzen AI 9 HX 370, Micron 2400 MTFDKBA1T0QFM | Samsung Galaxy Book4 Pro 16 Arc 8-Core, Ultra 7 155H, Samsung PM9B1 512GB MZVL4512HBLU | |
|---|---|---|---|---|---|---|
| Noise | 0% | 1% | 8% | 2% | -3% | |
| wyłączone / środowisko * | 23.6 | 24.5 -4% | 23 3% | 24 -2% | 24.7 -5% | 24.6 -4% |
| Idle Minimum * | 23.6 | 24.5 -4% | 23 3% | 24 -2% | 24.7 -5% | 24.6 -4% |
| Idle Average * | 23.6 | 24.5 -4% | 23 3% | 24 -2% | 24.7 -5% | 24.6 -4% |
| Idle Maximum * | 26.2 | 25.9 1% | 25.02 5% | 24 8% | 26.4 -1% | 26.4 -1% |
| Load Average * | 37.1 | 36.2 2% | 41.88 -13% | 25.3 32% | 35.7 4% | 40 -8% |
| Cyberpunk 2077 ultra * | 42.1 | 40.1 5% | 39.79 5% | 33.9 19% | 36.8 13% | |
| Load Maximum * | 42.1 | 40.1 5% | 41.88 1% | 42.3 -0% | 36.8 13% | 40 5% |
| Witcher 3 ultra * | 40 |
* ... im mniej tym lepiej
Temperatura
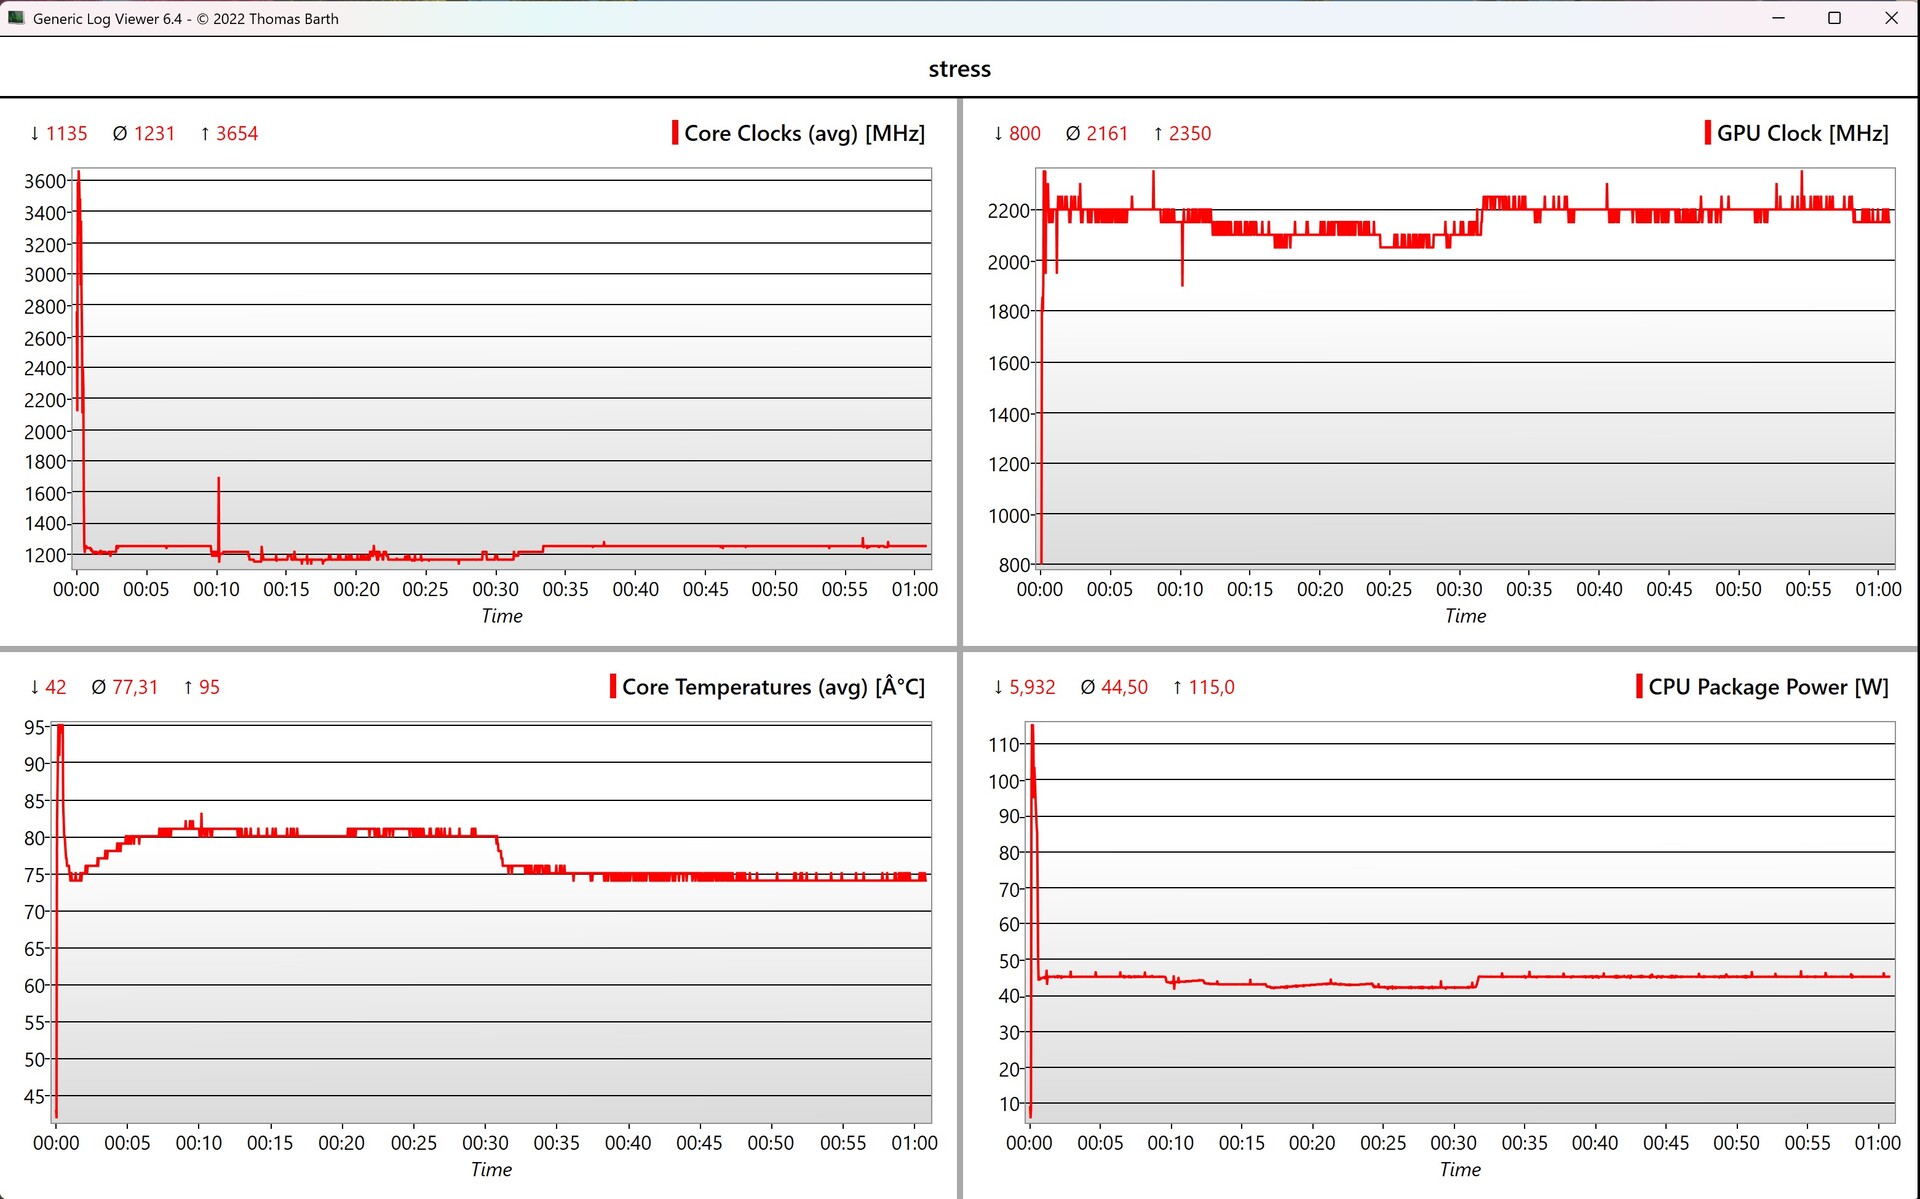
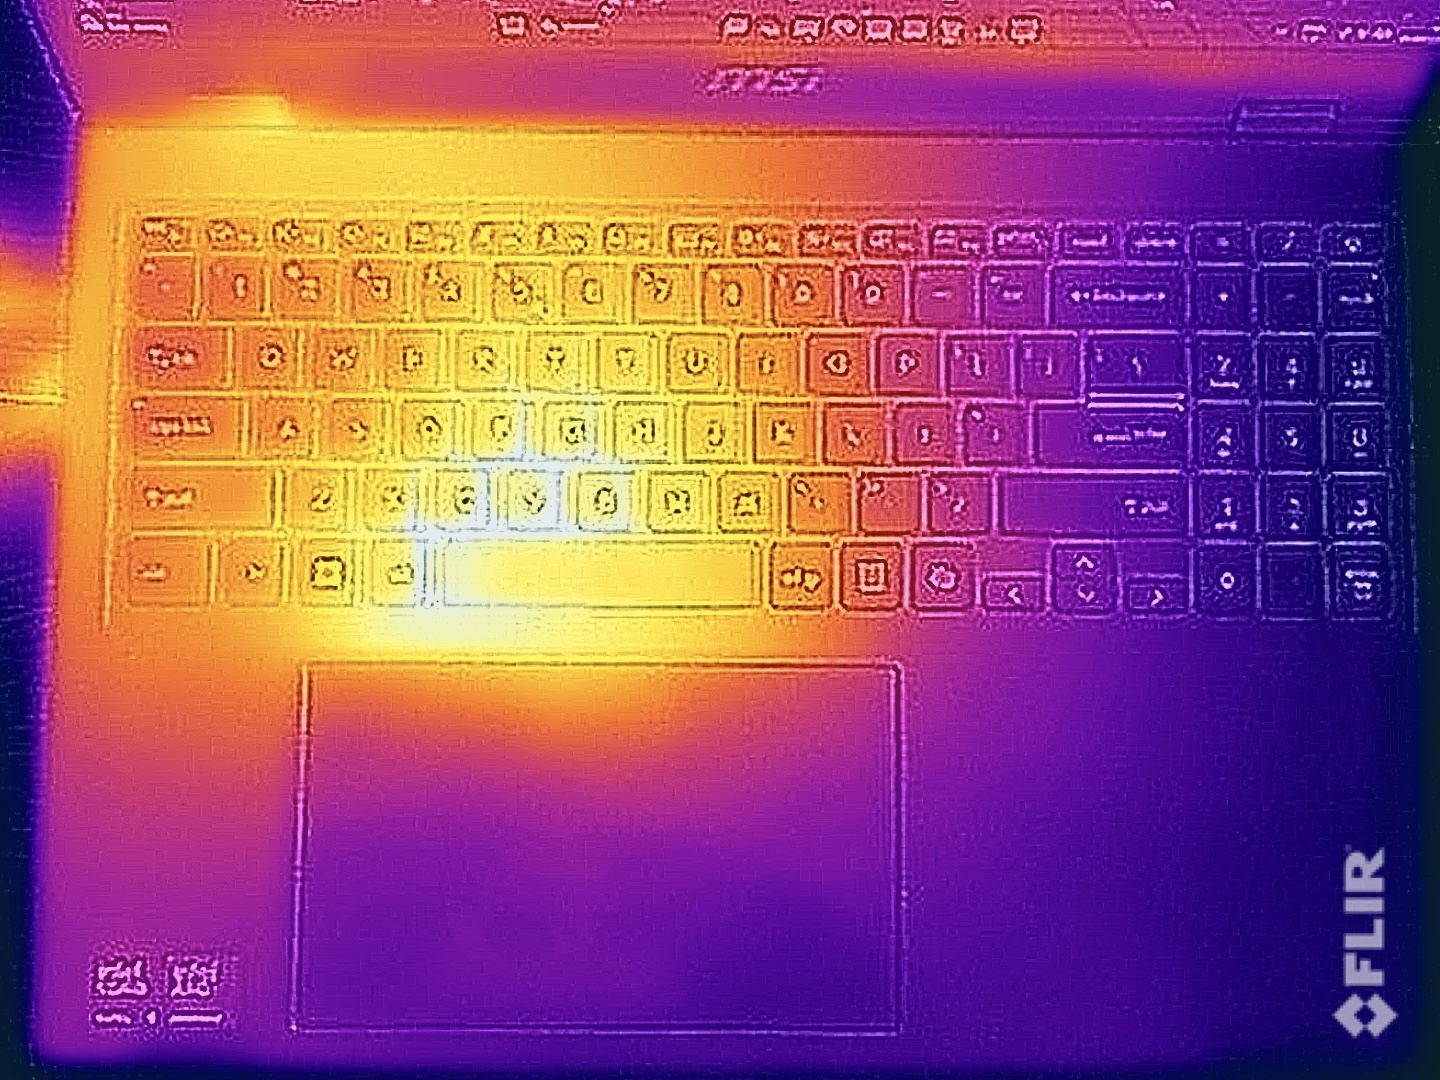
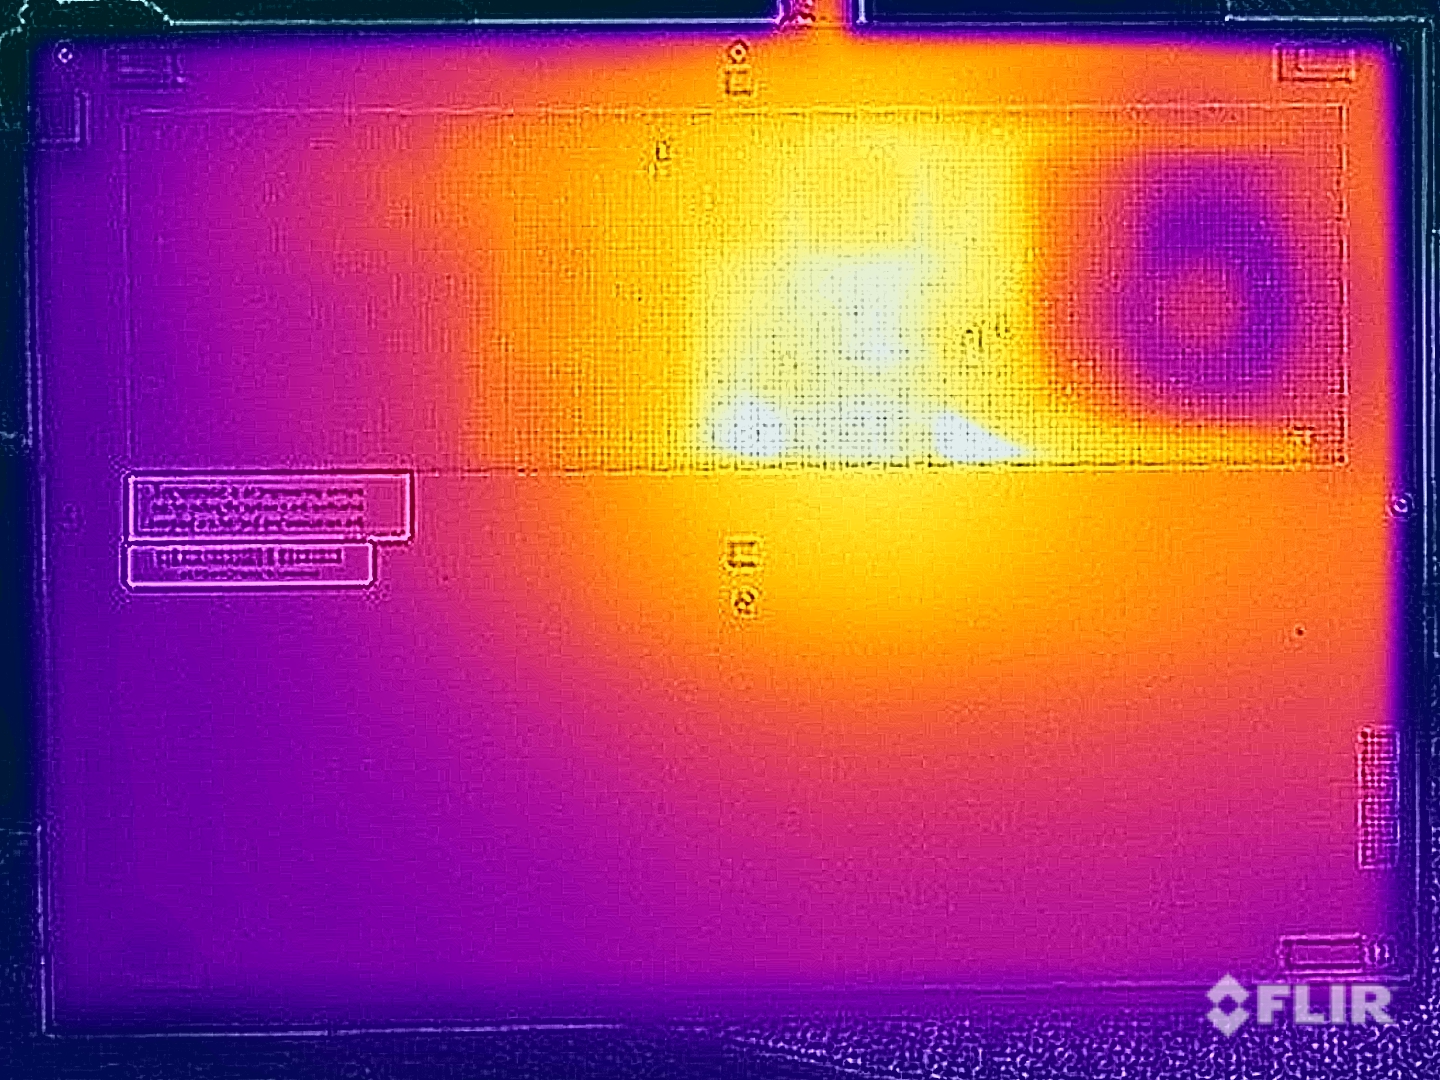
Obudowa laptopa pozostaje bardzo chłodna w trybie bezczynności i podczas prostych zadań, ale jednostronne chłodzenie staje się zauważalne pod obciążeniem. Tylko lewa połowa staje się ciepła, z temperaturą do 48 °C na górze i nawet do 51 °C na dole. Prowadzi to do bardzo ciepłych palców podczas pisania i w tym scenariuszu nie należy umieszczać komputera na udzie. Pokazuje to również, że pojedynczy wentylator ma pewne trudności z układem Arrow Lake. Podczas testu obciążeniowego 115 watów było obecne tylko przez krótki czas, ale w przeciwieństwie do czystego obciążenia procesora, wartość ta spadła bardzo szybko do 45 watów i pozostała na tym poziomie.
(-) Maksymalna temperatura w górnej części wynosi 48.1 °C / 119 F, w porównaniu do średniej 36.9 °C / 98 F , począwszy od 21.1 do 71 °C dla klasy Multimedia.
(-) Dno nagrzewa się maksymalnie do 51.6 °C / 125 F, w porównaniu do średniej 39.2 °C / 103 F
(+) W stanie bezczynności średnia temperatura górnej części wynosi 24.3 °C / 76 F, w porównaniu ze średnią temperaturą urządzenia wynoszącą 31.3 °C / ### class_avg_f### F.
(±) 3: The average temperature for the upper side is 37.1 °C / 99 F, compared to the average of 31.3 °C / 88 F for the class Multimedia.
(+) Podparcia dłoni i touchpad osiągają maksymalną temperaturę skóry (33.1 °C / 91.6 F) i dlatego nie są gorące.
(-) Średnia temperatura obszaru podparcia dłoni w podobnych urządzeniach wynosiła 28.8 °C / 83.8 F (-4.3 °C / -7.8 F).
| MSI Prestige 16 AI Evo B2HMG Intel Core Ultra 9 285H, Intel Arc Graphics 140T | Lenovo ThinkBook 16 G7+ AMD AMD Ryzen AI 9 365, AMD Radeon 880M | MSI Prestige A16 AI+ A3HMG-036 AMD Ryzen AI 9 365, AMD Radeon 880M | Apple MacBook Pro 16 2024 M4 Pro Apple M4 Pro (14 cores), Apple M4 Pro 20-Core GPU | Asus Zenbook S 16 UM5606-RK333W AMD Ryzen AI 9 HX 370, AMD Radeon 890M | Samsung Galaxy Book4 Pro 16 Intel Core Ultra 7 155H, Intel Arc 8-Core iGPU | |
|---|---|---|---|---|---|---|
| Heat | 12% | -3% | 15% | -9% | 10% | |
| Maximum Upper Side * | 48.1 | 38.2 21% | 52 -8% | 42.7 11% | 46.9 2% | 40.9 15% |
| Maximum Bottom * | 51.6 | 37.9 27% | 44 15% | 43.1 16% | 53.5 -4% | 42.6 17% |
| Idle Upper Side * | 25.9 | 25.4 2% | 28 -8% | 21.5 17% | 29.5 -14% | 24.5 5% |
| Idle Bottom * | 25.2 | 25.7 -2% | 28 -11% | 21.5 15% | 30.2 -20% | 24.8 2% |
* ... im mniej tym lepiej
Głośniki
Dwa głośniki stereo Prestige 16 mogą być bardzo głośne, ale ich ogólny dźwięk jest nieco niedostateczny. Odtwarzanie głosów korzysta z wyraźnych wysokich tonów, ale muzyce lub filmom w szczególności brakuje trochę mocy.
MSI Prestige 16 AI Evo B2HMG analiza dźwięku
(+) | głośniki mogą odtwarzać stosunkowo głośno (86.6 dB)
Bas 100 - 315 Hz
(-) | prawie brak basu - średnio 18.4% niższa od mediany
(±) | liniowość basu jest średnia (7.9% delta do poprzedniej częstotliwości)
Średnie 400 - 2000 Hz
(+) | zbalansowane środki średnie - tylko 4.3% od mediany
(+) | średnie są liniowe (4.6% delta do poprzedniej częstotliwości)
Wysokie 2–16 kHz
(+) | zrównoważone maksima - tylko 3.8% od mediany
(+) | wzloty są liniowe (3% delta do poprzedniej częstotliwości)
Ogólnie 100 - 16.000 Hz
(+) | ogólny dźwięk jest liniowy (13% różnicy w stosunku do mediany)
W porównaniu do tej samej klasy
» 22% wszystkich testowanych urządzeń w tej klasie było lepszych, 5% podobnych, 74% gorszych
» Najlepszy miał deltę 5%, średnia wynosiła ###średnia###%, najgorsza wynosiła 45%
W porównaniu do wszystkich testowanych urządzeń
» 11% wszystkich testowanych urządzeń było lepszych, 2% podobnych, 86% gorszych
» Najlepszy miał deltę 4%, średnia wynosiła ###średnia###%, najgorsza wynosiła 134%
Lenovo ThinkBook 16 G7+ AMD analiza dźwięku
(±) | głośność głośnika jest średnia, ale dobra (74.8 dB)
Bas 100 - 315 Hz
(-) | prawie brak basu - średnio 16.5% niższa od mediany
(±) | liniowość basu jest średnia (13.1% delta do poprzedniej częstotliwości)
Średnie 400 - 2000 Hz
(+) | zbalansowane środki średnie - tylko 3.5% od mediany
(+) | średnie są liniowe (5.9% delta do poprzedniej częstotliwości)
Wysokie 2–16 kHz
(+) | zrównoważone maksima - tylko 1.6% od mediany
(+) | wzloty są liniowe (5% delta do poprzedniej częstotliwości)
Ogólnie 100 - 16.000 Hz
(±) | liniowość ogólnego dźwięku jest średnia (16% różnicy w stosunku do mediany)
W porównaniu do tej samej klasy
» 37% wszystkich testowanych urządzeń w tej klasie było lepszych, 6% podobnych, 57% gorszych
» Najlepszy miał deltę 5%, średnia wynosiła ###średnia###%, najgorsza wynosiła 45%
W porównaniu do wszystkich testowanych urządzeń
» 23% wszystkich testowanych urządzeń było lepszych, 5% podobnych, 72% gorszych
» Najlepszy miał deltę 4%, średnia wynosiła ###średnia###%, najgorsza wynosiła 134%
MSI Prestige A16 AI+ A3HMG-036 analiza dźwięku
(+) | głośniki mogą odtwarzać stosunkowo głośno (82.02 dB)
Bas 100 - 315 Hz
(-) | prawie brak basu - średnio 23.7% niższa od mediany
(±) | liniowość basu jest średnia (12.3% delta do poprzedniej częstotliwości)
Średnie 400 - 2000 Hz
(±) | wyższe średnie - średnio 6.2% wyższe niż mediana
(±) | liniowość środka jest średnia (7.5% delta do poprzedniej częstotliwości)
Wysokie 2–16 kHz
(±) | wyższe maksima - średnio 5.6% wyższe od mediany
(+) | wzloty są liniowe (5.1% delta do poprzedniej częstotliwości)
Ogólnie 100 - 16.000 Hz
(±) | liniowość ogólnego dźwięku jest średnia (21.7% różnicy w stosunku do mediany)
W porównaniu do tej samej klasy
» 75% wszystkich testowanych urządzeń w tej klasie było lepszych, 4% podobnych, 20% gorszych
» Najlepszy miał deltę 5%, średnia wynosiła ###średnia###%, najgorsza wynosiła 45%
W porównaniu do wszystkich testowanych urządzeń
» 59% wszystkich testowanych urządzeń było lepszych, 7% podobnych, 34% gorszych
» Najlepszy miał deltę 4%, średnia wynosiła ###średnia###%, najgorsza wynosiła 134%
Apple MacBook Pro 16 2024 M4 Pro analiza dźwięku
(+) | głośniki mogą odtwarzać stosunkowo głośno (84.6 dB)
Bas 100 - 315 Hz
(±) | zredukowany bas - średnio 5.1% niższy od mediany
(+) | bas jest liniowy (5.6% delta do poprzedniej częstotliwości)
Średnie 400 - 2000 Hz
(+) | zbalansowane środki średnie - tylko 1.4% od mediany
(+) | średnie są liniowe (2.4% delta do poprzedniej częstotliwości)
Wysokie 2–16 kHz
(+) | zrównoważone maksima - tylko 1.7% od mediany
(+) | wzloty są liniowe (3% delta do poprzedniej częstotliwości)
Ogólnie 100 - 16.000 Hz
(+) | ogólny dźwięk jest liniowy (4.8% różnicy w stosunku do mediany)
W porównaniu do tej samej klasy
» 0% wszystkich testowanych urządzeń w tej klasie było lepszych, 1% podobnych, 99% gorszych
» Najlepszy miał deltę 5%, średnia wynosiła ###średnia###%, najgorsza wynosiła 45%
W porównaniu do wszystkich testowanych urządzeń
» 0% wszystkich testowanych urządzeń było lepszych, 0% podobnych, 100% gorszych
» Najlepszy miał deltę 4%, średnia wynosiła ###średnia###%, najgorsza wynosiła 134%
Asus Zenbook S 16 UM5606-RK333W analiza dźwięku
(±) | głośność głośnika jest średnia, ale dobra (79.7 dB)
Bas 100 - 315 Hz
(±) | zredukowany bas - średnio 9.7% niższy od mediany
(±) | liniowość basu jest średnia (8.3% delta do poprzedniej częstotliwości)
Średnie 400 - 2000 Hz
(+) | zbalansowane środki średnie - tylko 2.7% od mediany
(+) | średnie są liniowe (4.8% delta do poprzedniej częstotliwości)
Wysokie 2–16 kHz
(+) | zrównoważone maksima - tylko 3.7% od mediany
(+) | wzloty są liniowe (4.6% delta do poprzedniej częstotliwości)
Ogólnie 100 - 16.000 Hz
(+) | ogólny dźwięk jest liniowy (12.2% różnicy w stosunku do mediany)
W porównaniu do tej samej klasy
» 18% wszystkich testowanych urządzeń w tej klasie było lepszych, 4% podobnych, 79% gorszych
» Najlepszy miał deltę 5%, średnia wynosiła ###średnia###%, najgorsza wynosiła 45%
W porównaniu do wszystkich testowanych urządzeń
» 8% wszystkich testowanych urządzeń było lepszych, 2% podobnych, 89% gorszych
» Najlepszy miał deltę 4%, średnia wynosiła ###średnia###%, najgorsza wynosiła 134%
Samsung Galaxy Book4 Pro 16 analiza dźwięku
(+) | głośniki mogą odtwarzać stosunkowo głośno (83.4 dB)
Bas 100 - 315 Hz
(±) | zredukowany bas - średnio 12.4% niższy od mediany
(±) | liniowość basu jest średnia (11.4% delta do poprzedniej częstotliwości)
Średnie 400 - 2000 Hz
(+) | zbalansowane środki średnie - tylko 4.7% od mediany
(+) | średnie są liniowe (4.7% delta do poprzedniej częstotliwości)
Wysokie 2–16 kHz
(+) | zrównoważone maksima - tylko 3.1% od mediany
(+) | wzloty są liniowe (5.4% delta do poprzedniej częstotliwości)
Ogólnie 100 - 16.000 Hz
(+) | ogólny dźwięk jest liniowy (12.5% różnicy w stosunku do mediany)
W porównaniu do tej samej klasy
» 19% wszystkich testowanych urządzeń w tej klasie było lepszych, 3% podobnych, 77% gorszych
» Najlepszy miał deltę 5%, średnia wynosiła ###średnia###%, najgorsza wynosiła 45%
W porównaniu do wszystkich testowanych urządzeń
» 9% wszystkich testowanych urządzeń było lepszych, 2% podobnych, 88% gorszych
» Najlepszy miał deltę 4%, średnia wynosiła ###średnia###%, najgorsza wynosiła 134%
Zarządzanie energią - imponująca żywotność baterii
Zużycie energii
Jego pomiary w stanie spoczynku są bardzo niskie jak na 16-calowego laptopa, co jest oczywiście po części zasługą 60 Hz wyświetlacza. Pod obciążeniem wydaje się jednak, że istnieje problem dotyczący jego wysokich limitów mocy, ponieważ, co nie jest zaskoczeniem, 100-watowy zasilacz nie wystarcza, gdy sam procesor zużywa 115 watów pod obciążeniem wielordzeniowym. Oznacza to, że bateria zawsze musi być podłączona na krótki czas, aby pokryć zużycie energii, co z pewnością jest idealne dla baterii. Po około 20 sekundach zużycie energii spada do 88 watów, a następnie do około 70 watów.
| wyłączony / stan wstrzymania | |
| luz | |
| obciążenie |
|
Legenda:
min: | |
| MSI Prestige 16 AI Evo B2HMG Ultra 9 285H, Arc 140T, Micron 2500 1TB MTFDKBA1T0QGN, IPS, 2560x1600, 16" | Lenovo ThinkBook 16 G7+ AMD Ryzen AI 9 365, Radeon 880M, Samsung PM9C1a MZAL81T0HDLB, IPS, 3200x2000, 16" | MSI Prestige A16 AI+ A3HMG-036 Ryzen AI 9 365, Radeon 880M, Samsung PM9C1 MZVL81T0HELB-00BTW, IPS, 2560x1600, 16" | Apple MacBook Pro 16 2024 M4 Pro M4 Pro (14 cores), M4 Pro 20-Core GPU, Apple SSD AP2048Z, Mini-LED, 3456x2234, 16.2" | Asus Zenbook S 16 UM5606-RK333W Ryzen AI 9 HX 370, Radeon 890M, Micron 2400 MTFDKBA1T0QFM, OLED, 2880x1800, 16" | Samsung Galaxy Book4 Pro 16 Ultra 7 155H, Arc 8-Core, Samsung PM9B1 512GB MZVL4512HBLU, OLED, 2880x1800, 16" | Przeciętny Intel Arc Graphics 140T | Średnia w klasie Multimedia | |
|---|---|---|---|---|---|---|---|---|
| Power Consumption | -29% | -19% | -36% | 11% | 30% | 4% | -28% | |
| Idle Minimum * | 4.4 | 6.4 -45% | 6.9 -57% | 4.6 -5% | 5.4 -23% | 3.6 18% | 4.57 ? -4% | 6.83 ? -55% |
| Idle Average * | 9.2 | 14.1 -53% | 12 -30% | 16.8 -83% | 10.5 -14% | 5.7 38% | 8.9 ? 3% | 11.5 ? -25% |
| Idle Maximum * | 9.5 | 14.3 -51% | 12.5 -32% | 17.1 -80% | 10.9 -15% | 6.1 36% | 9.5 ? -0% | 13.4 ? -41% |
| Load Average * | 66.9 | 83.4 -25% | 79.8 -19% | 76.4 -14% | 47.8 29% | 52.5 22% | 60 ? 10% | 71.4 ? -7% |
| Cyberpunk 2077 ultra * | 68.8 | 79.8 -16% | 62.5 9% | 83.4 -21% | 49.2 28% | |||
| Cyberpunk 2077 ultra external monitor * | 67.4 | 77.5 -15% | 74.5 -11% | 79.3 -18% | 46.7 31% | |||
| Load Maximum * | 102.9 | 102.9 -0% | 96 7% | 138.1 -34% | 58.6 43% | 64.7 37% | 89.9 ? 13% | 116.7 ? -13% |
| Witcher 3 ultra * | 46.6 |
* ... im mniej tym lepiej
Power consumption Cyberpunk / stress test
Power consumption with external monitor
Czas trwania
Przy pojemności 99,9 Wh, MSI zainstalowało największą możliwą baterię w Prestige 16. W połączeniu z dość niskim zużyciem energii, zmierzyliśmy bardzo dobre czasy pracy na baterii. W teście WLAN przy jasności 150 cd/m² (co odpowiada 32% maksymalnej jasności naszego urządzenia testowego) odnotowaliśmy imponujące 16,5 godziny i ponad 11,5 godziny przy pełnej jasności. Test wideo trwał nawet prawie 21 godzin. To pokonało urządzenia porównawcze z systemem Windows; tylko MacBook Pro 16 zapewnił jeszcze dłuższy czas pracy na baterii. Pełne naładowanie przy włączonym urządzeniu zajmuje około dwóch godzin, a 80% jego pojemności jest ponownie dostępne po około godzinie.
| MSI Prestige 16 AI Evo B2HMG Ultra 9 285H, Arc 140T, 99.9 Wh | Lenovo ThinkBook 16 G7+ AMD Ryzen AI 9 365, Radeon 880M, 85 Wh | MSI Prestige A16 AI+ A3HMG-036 Ryzen AI 9 365, Radeon 880M, 82 Wh | Apple MacBook Pro 16 2024 M4 Pro M4 Pro (14 cores), M4 Pro 20-Core GPU, 99.6 Wh | Asus Zenbook S 16 UM5606-RK333W Ryzen AI 9 HX 370, Radeon 890M, 78 Wh | Samsung Galaxy Book4 Pro 16 Ultra 7 155H, Arc 8-Core, 76 Wh | Średnia w klasie Multimedia | |
|---|---|---|---|---|---|---|---|
| Czasy pracy | -34% | -31% | 19% | -22% | -25% | -33% | |
| H.264 | 1250 | 832 -33% | 609 -51% | 1474 18% | 1204 -4% | 1144 -8% | 863 ? -31% |
| WiFi v1.3 | 992 | 649 -35% | 683 -31% | 1178 19% | 640 -35% | 644 -35% | 644 ? -35% |
| Load | 145 | 127 -12% | 107 -26% | 100 -31% | 99.1 ? -32% |
Łączna ocena Notebookcheck
MSI Prestige 16 AI Evo to lekki i wysokiej jakości 16-calowy laptop z szybkim procesorem Arrow Lake, wygodną klawiaturą i długim czasem pracy na baterii. Urządzenie cierpi jednak na pewne słabości w niektórych obszarach, takich jak chłodzenie (przydałby się drugi wentylator), a rozmieszczenie jego portów jest dodatkowo niepraktyczne podczas codziennego użytkowania. Jego wyświetlacz również mógłby być lepszy (tylko 60 Hz i wolne czasy reakcji) i jest bardzo odblaskowy.
MSI Prestige 16 AI Evo B2HMG
- 09/02/2025 v8
Andreas Osthoff
 Total Sustainability Score:
 Przezroczystość
Wyboru urządzeń do recenzji dokonuje nasza redakcja. Próbka testowa została udostępniona autorowi jako pożyczka od producenta lub sprzedawcy detalicznego na potrzeby tej recenzji. Pożyczkodawca nie miał wpływu na tę recenzję, producent nie otrzymał też kopii tej recenzji przed publikacją. Nie było obowiązku publikowania tej recenzji. Nigdy nie przyjmujemy rekompensaty ani płatności w zamian za nasze recenzje. Jako niezależna firma medialna, Notebookcheck nie podlega władzy producentów, sprzedawców detalicznych ani wydawców.
Tak testuje Notebookcheck
Każdego roku Notebookcheck niezależnie sprawdza setki laptopów i smartfonów, stosując standardowe procedury, aby zapewnić porównywalność wszystkich wyników. Od około 20 lat stale rozwijamy nasze metody badawcze, ustanawiając przy tym standardy branżowe. W naszych laboratoriach testowych doświadczeni technicy i redaktorzy korzystają z wysokiej jakości sprzętu pomiarowego. Testy te obejmują wieloetapowy proces walidacji. Nasz kompleksowy system ocen opiera się na setkach uzasadnionych pomiarów i benchmarków, co pozwala zachować obiektywizm.
