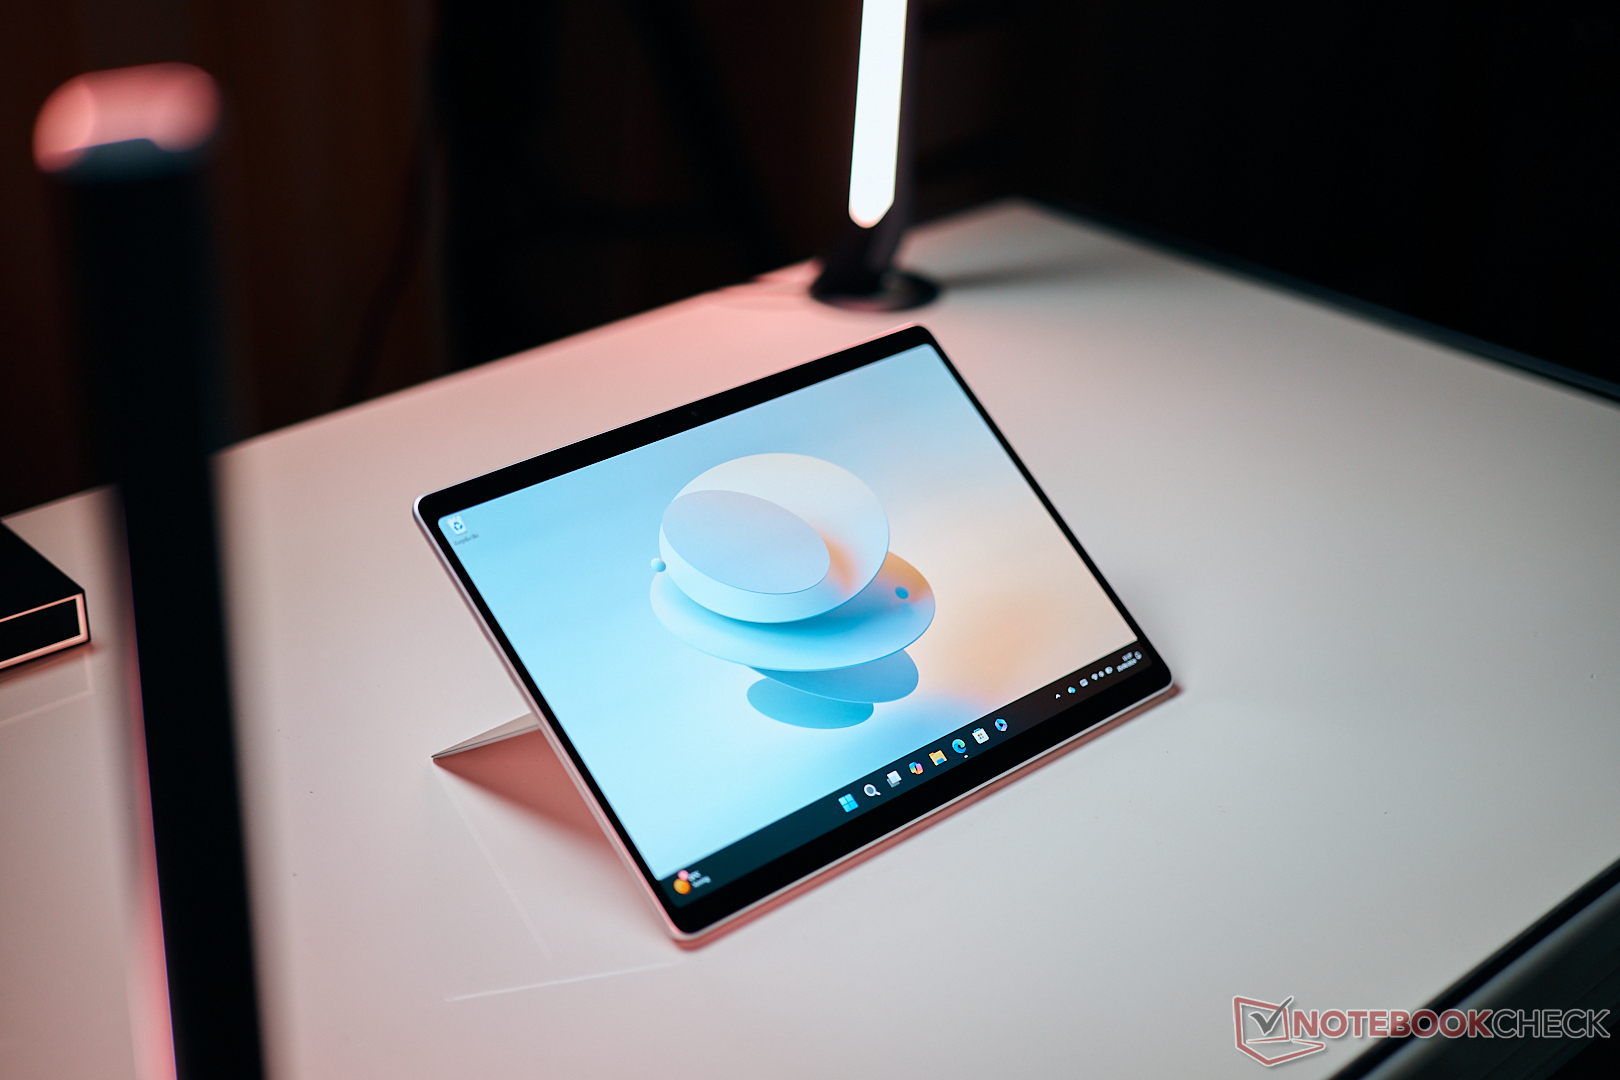
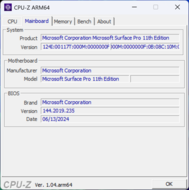
Dokonaliśmy już obszernej recenzji nowego Surface Pro 11 z panelem OLED, a teraz przyglądamy się wariantowi podstawowemu z wolniejszym procesorem Qualcomm Snapdragon X Plus i ekranem dotykowym IPS. Microsoft pobiera około 1000 USD za model podstawowy i chociaż jest on wyposażony w 16 GB pamięci RAM, to ma tylko mały dysk SSD o pojemności 256 GB. Aktualizacja do 512 GB SSD będzie wymagała przekazania Microsoftowi kolejnych 250 USD, ale alternatywnie można łatwo samodzielnie zaktualizować dysk SSD.
Nie ma żadnych różnic, jeśli chodzi o obudowę, porty, wydajność Wi-Fi, kamerę internetową lub głośniki w porównaniu do już recenzowanego modelu high-end z procesorem Snapdragon X Elite i panelem OLED, dlatego też chcielibyśmy skierować Państwa w stronę naszej recenzji gdzie znajdą Państwo obszerne informacje na te tematy. W tym artykule skupimy się na wyświetlaczu IPS, a także słabszym Snapdragonie X Plus i jego wpływie na emisję.
Potencjalni konkurenci w porównaniu
Ocena | Wersja | Data | Model | Waga | Wysokość | Rozmiar | Rezolucja | Cena |
|---|---|---|---|---|---|---|---|---|
| 80.7 % | v8 | 08/2024 | Microsoft Surface Pro Copilot+ SD X Plus X1P-64-100, Adreno X1-85 3.8 TFLOPS | 872 g | 9.3 mm | 13.00" | 2880x1920 | |
| 82.5 % | v8 | 07/2024 | Microsoft Surface Pro OLED Copilot+ SD X Elite X1E-80-100, Adreno X1-85 3.8 TFLOPS | 870 g | 9.3 mm | 13.00" | 2880x1920 | |
| 85.7 % v7 (old) | v7 (old) | 04/2024 | Minisforum V3 R7 8840U, Radeon 780M | 928 g | 9.8 mm | 14.00" | 2560x1600 | |
| 80.1 % | v8 | 06/2024 | Dell Inspiron 14 7445 2-in-1 R7 8840HS, Radeon 780M | 1.7 kg | 18.9 mm | 14.00" | 1920x1200 | |
| 87 % v7 (old) | v7 (old) | 04/2024 | Lenovo Yoga Book 9 13IMU9 Ultra 7 155U, Graphics 4-Core | 1.4 kg | 15.95 mm | 13.30" | 2880x1800 | |
| 87.4 % v7 (old) | v7 (old) | 05/2024 | Lenovo ThinkBook 14 2-in-1 G4 IML Ultra 5 125U, Graphics 4-Core | 1.6 kg | 18.5 mm | 14.00" | 1920x1200 |
Uwaga: Niedawno zaktualizowaliśmy nasz system oceny i wyniki wersji 8 nie są porównywalne z wynikami wersji 7. Więcej informacji znajdą Państwo tutaj.
Obudowa i funkcje
Jak już wspomnieliśmy, nie ma zasadniczo żadnych różnic dotyczących obudowy lub zestawu funkcji między modelem podstawowym a wariantem Wariant OLED. Jednak przy 47 Wh, model IPS ma nieco mniejszą baterię (w porównaniu do 53 Wh w modelu OLED). Przy różnicy w wadze wynoszącej zaledwie 2 gramy oznacza to, że panel IPS musi być nieco cięższy.
Wyświetlacz - ekran dotykowy IPS o rozdzielczości 600 cd/m²
Największą różnicą pomiędzy modelami Surface Pro jest ekran. Zamiast panelu OLED, model podstawowy wyposażony jest w ekran dotykowy IPS. Rozdzielczość (2880 x 1920 pikseli), jasność SDR (600 nitów), a także częstotliwość odświeżania (120 Hz) są identyczne. Oczywiście istnieją różnice między tymi dwoma panelami, jeśli chodzi o subiektywną jakość obrazu. Niewątpliwie model OLED ma żywsze kolory i głębszą czerń (a w rezultacie wyższy współczynnik kontrastu), a także posiada większe rezerwy dla treści HDR. Panel IPS nie jest jednak złym wyborem i z subiektywnego punktu widzenia również oferuje dobrą jakość obrazu, a jedynie poziomy czerni są odrobinę za wysokie. Dużą zaletą jest jednak brak migotania PWM. Zarówno jasność, jak i temperatura barwowa mogą być automatycznie regulowane za pomocą czujnika.
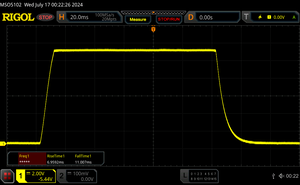
Możemy potwierdzić deklarowaną jasność 600 cd/m², jednak dotyczy to tylko jednego obszaru. Średnia wynosi 575 cd/m², a gdy połączymy to z wysokim poziomem czerni wynoszącym 0,56 cd/m², prowadzi to do współczynnika kontrastu wynoszącego tylko nieco ponad 1.000:1. To wciąż wystarczająco dobry wynik do codziennego użytku, ale trudno nazwać kontrast doskonałym. Przy pełnej jasności występuje niewielki wyciek światła i chociaż czasy reakcji nie są szczególnie szybkie, wysoka częstotliwość odświeżania oznacza, że ruch jest bardzo płynny, a ponadto mamy do czynienia z maszyną, która i tak nie jest przeznaczona do gier.
| |||||||||||||||||||||||||
rozświetlenie: 89 %
na akumulatorze: 585 cd/m²
kontrast: 1045:1 (czerń: 0.56 cd/m²)
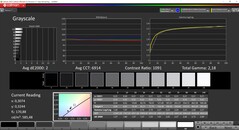
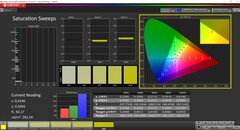
ΔE Color 1.3 | 0.5-29.43 Ø4.87
ΔE Greyscale 2 | 0.5-98 Ø5.1
79.4% AdobeRGB 1998 (Argyll 2.2.0 3D)
99.7% sRGB (Argyll 2.2.0 3D)
83.4% Display P3 (Argyll 2.2.0 3D)
Gamma: 2.18
| Microsoft Surface Pro Copilot+ LP129WT342166, IPS, 2880x1920, 13" | Microsoft Surface Pro OLED Copilot+ ATNA30DW01-1, OLED, 2880x1920, 13" | Minisforum V3 BOE, NE140QDM-NY1, IPS, 2560x1600, 14" | Dell Inspiron 14 7445 2-in-1 AU Optronics B14UAT, IPS, 1920x1200, 14" | Lenovo Yoga Book 9 13IMU9 SDC ATNA33AA02-0, OLED, 2880x1800, 13.3" | Lenovo ThinkBook 14 2-in-1 G4 IML LEN140WUXGA, IPS, 1920x1200, 14" | |
|---|---|---|---|---|---|---|
| Display | 11% | 8% | -52% | 14% | -7% | |
| Display P3 Coverage | 83.4 | 98.9 19% | 97.7 17% | 35.7 -57% | 99.7 20% | 71.6 -14% |
| sRGB Coverage | 99.7 | 99.4 0% | 99.8 0% | 53.6 -46% | 100 0% | 100 0% |
| AdobeRGB 1998 Coverage | 79.4 | 89.5 13% | 85.4 8% | 36.9 -54% | 97 22% | 73.4 -8% |
| Response Times | 98% | 66% | 27% | 92% | 14% | |
| Response Time Grey 50% / Grey 80% * | 39.6 ? | 0.32 ? 99% | 10 ? 75% | 23 ? 42% | 1.88 ? 95% | 28.8 ? 27% |
| Response Time Black / White * | 18 ? | 0.58 ? 97% | 8 ? 56% | 15.8 ? 12% | 2.1 ? 88% | 18 ? -0% |
| PWM Frequency | 480 ? | 60 ? | ||||
| Screen | 192% | -61% | -104% | -83% | -60% | |
| Brightness middle | 585 | 580 -1% | 512 -12% | 267.6 -54% | 362.6 -38% | 302.7 -48% |
| Brightness | 574 | 581 1% | 495 -14% | 240 -58% | 368 -36% | 293 -49% |
| Brightness Distribution | 89 | 99 11% | 91 2% | 84 -6% | 97 9% | 88 -1% |
| Black Level * | 0.56 | 0.04 93% | 0.48 14% | 0.31 45% | 0.35 37% | |
| Contrast | 1045 | 14500 1288% | 1067 2% | 863 -17% | 865 -17% | |
| Colorchecker dE 2000 * | 1.3 | 0.7 46% | 4.32 -232% | 4.67 -259% | 4.66 -258% | 3.45 -165% |
| Colorchecker dE 2000 max. * | 3 | 2.1 30% | 7.04 -135% | 17.52 -484% | 7.25 -142% | 6.04 -101% |
| Greyscale dE 2000 * | 2 | 0.6 70% | 4.22 -111% | 2 -0% | 2.6 -30% | 4.7 -135% |
| Gamma | 2.18 101% | 2.16 102% | 2.31 95% | 2.15 102% | 2.2 100% | 2.1 105% |
| CCT | 6914 94% | 6484 100% | 6770 96% | 6585 99% | 6055 107% | 5804 112% |
| Colorchecker dE 2000 calibrated * | 4.17 | 2.49 | 0.56 | 0.47 | ||
| Całkowita średnia (program / ustawienia) | 100% /
136% | 4% /
-25% | -43% /
-72% | 8% /
-25% | -18% /
-36% |
* ... im mniej tym lepiej
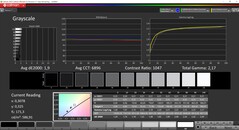
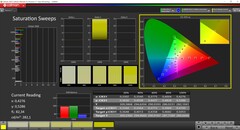
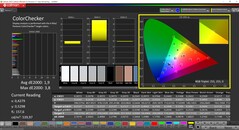
Dodatkową różnicą jest pokrycie przestrzeni barw. Microsoft nie podał żadnych szczegółów i chociaż oba typy wyświetlaczy mają te same profile kolorów sRGB i Vivid, panel IPS pokrywa całkowicie tylko przestrzeń kolorów sRGB, a P3 osiąga tylko 83%. W związku z tym nie można wiele zrobić z profilem Vivid, ponieważ występują bardzo duże odchylenia kolorów w porównaniu z odniesieniem sRGB. Jednak w naszej analizie za pomocą profesjonalnego oprogramowania CalMAN, profil sRGB wywarł dobre wrażenie, a jednym z wyróżników były niskie odchylenia kolorów. Pomimo tego, temperatura barwowa jest nieco chłodna. Nie byliśmy w stanie poprawnie skalibrować panelu, ponieważ nasze oprogramowanie (i1 Profiler) nie działa obecnie w wersji ARM systemu Windows.
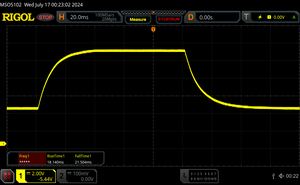
Wyświetl czasy reakcji
| ↔ Czas reakcji od czerni do bieli | ||
|---|---|---|
| 18 ms ... wzrost ↗ i spadek ↘ łącznie | ↗ 7 ms wzrost | |
| ↘ 11 ms upadek | ||
| W naszych testach ekran wykazuje dobry współczynnik reakcji, ale może być zbyt wolny dla graczy rywalizujących ze sobą. Dla porównania, wszystkie testowane urządzenia wahają się od 0.1 (minimum) do 240 (maksimum) ms. » 37 % wszystkich urządzeń jest lepszych. Oznacza to, że zmierzony czas reakcji jest lepszy od średniej wszystkich testowanych urządzeń (20.8 ms). | ||
| ↔ Czas reakcji 50% szarości do 80% szarości | ||
| 39.6 ms ... wzrost ↗ i spadek ↘ łącznie | ↗ 18.1 ms wzrost | |
| ↘ 21.5 ms upadek | ||
| W naszych testach ekran wykazuje powolne tempo reakcji, co będzie niezadowalające dla graczy. Dla porównania, wszystkie testowane urządzenia wahają się od 0.165 (minimum) do 636 (maksimum) ms. » 58 % wszystkich urządzeń jest lepszych. Oznacza to, że zmierzony czas reakcji jest gorszy od średniej wszystkich testowanych urządzeń (32.5 ms). | ||
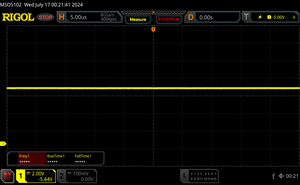
Migotanie ekranu / PWM (modulacja szerokości impulsu)
| Migotanie ekranu/nie wykryto PWM | |||
Dla porównania: 53 % wszystkich testowanych urządzeń nie używa PWM do przyciemniania wyświetlacza. Jeśli wykryto PWM, zmierzono średnio 8516 (minimum: 5 - maksimum: 343500) Hz. | |||
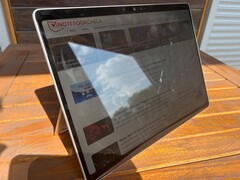
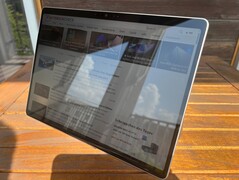
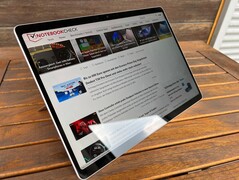
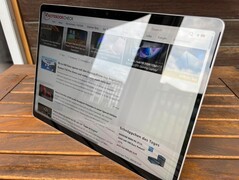
Ekran Surface Pro jest bardzo błyszczący i nawet w pomieszczeniach może szybko stać się podatny na irytujące odbicia. Wysoka jasność nieco pomaga, ale w słoneczne lub bardzo jasne dni nadal trudno jest wygodnie pracować na zewnątrz. Panel IPS ma doskonałą stabilność kąta widzenia.
Wydajność - Snapdragon X Plus i szybka pamięć RAM
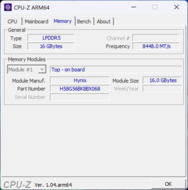
Podstawowy model Surface Pro Copilot+ jest wyposażony w procesor Snapdragon X Plus w połączeniu z 16 GB pamięci RAM (LPDDR5x 8448), jednak pamięci RAM nie można rozszerzyć.
Warunki testu
Microsoft nie oferuje żadnych dodatkowych profili energetycznych, zamiast tego można jedynie zmienić status energetyczny w ustawieniach. Jak to zwykle bywa w przypadku urządzeń Surface, istnieją niewielkie odchylenia, jeśli chodzi o nazewnictwo (w porównaniu do innych laptopów z systemem Windows), ale są one mniej więcej identyczne. Poniższe testy porównawcze i pomiary przeprowadziliśmy przy użyciu trybu Najlepsza wydajność , jednak dostępne są również tryby Lepsza wydajność i Zalecany (odpowiadają one trybom Zrównoważony i Najlepsza efektywność energetyczna w innych laptopach z systemem Windows). Nie ma oficjalnych danych TDP, ale wartości zużycia odpowiadają modelowi OLED ze Snapdragonem X Elite, który zakładamy na 23-30 watów.
Procesor - Snaprdragon X1P-64-100
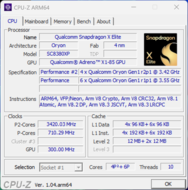
Snapdragon X Plus X1P-64-100 to obecnie najwolniejszy procesor Snapdragon X firmy Qualcomm. W przeciwieństwie do układów Elite, oferuje on tylko 10 zamiast 12 rdzeni CPU, które osiągają taktowanie 3,4 GHz. Podobnie Snapdragon X Plus musi radzić sobie bez dwurdzeniowego turbo. Oznacza to, że układ pozostaje w tyle za modelem OLED z X1E-80-100, szczególnie w testach jednordzeniowych. Ogólnie rzecz biorąc, wydajność jest jednak bardzo przyzwoita i nie zauważą Państwo żadnych różnic między modelami w codziennych sytuacjach. W poniższej tabeli tylko dwa pierwsze benchmarki (CB 2024 i Geekbench 6) działały natywnie na Surface Pro. Wszystkie pozostałe benchmarki działały poprzez emulację, co odbiło się na wydajności.
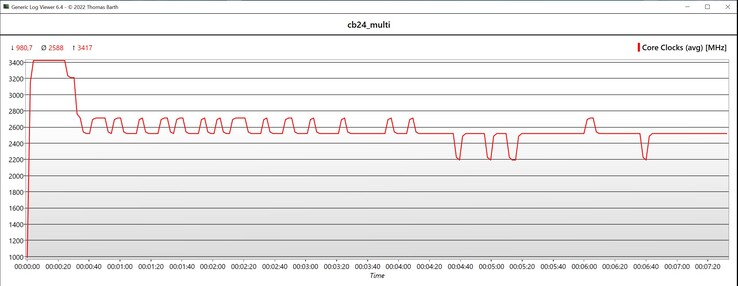
Wydajności wielordzeniowej nie da się jednak długo utrzymać. W pętli Cinebench R15 wyniki szybko spadły, a kiedy spojrzymy na prędkość procesora podczas uruchamiania CB24 Multi, widać, że układ osiągnął maksymalne taktowanie 3,4 GHz tylko przez około 20 sekund, a następnie ustabilizował się na poziomie 2,5-2,6 GHz. Aby osiągnąć pełną wydajność wielordzeniową, nawet Snapdragon X Plus wymagałby znacznie mocniejszego systemu chłodzenia. W trybie bateryjnym wydajność pozostała identyczna. Dodatkowe testy porównawcze procesora można znaleźć tutaj.
Cinebench R15 Multi Continuous Test
Cinebench 2024: CPU Multi Core | CPU Single Core
Geekbench 6.4: Multi-Core | Single-Core
Cinebench R23: Multi Core | Single Core
Cinebench R20: CPU (Multi Core) | CPU (Single Core)
Cinebench R15: CPU Multi 64Bit | CPU Single 64Bit
Blender: v2.79 BMW27 CPU
7-Zip 18.03: 7z b 4 | 7z b 4 -mmt1
HWBOT x265 Benchmark v2.2: 4k Preset
LibreOffice : 20 Documents To PDF
R Benchmark 2.5: Overall mean
| CPU Performance Rating | |
| Dell Inspiron 14 7445 2-in-1 -2! | |
| Minisforum V3 | |
| Microsoft Surface Pro OLED Copilot+ | |
| Lenovo Yoga Book 9 13IMU9 -2! | |
| Lenovo ThinkBook 14 2-in-1 G4 IML -2! | |
| Microsoft Surface Pro Copilot+ | |
| Przeciętny Qualcomm Snapdragon X Plus X1P-64-100 | |
| Średnia w klasie Tablet | |
| Cinebench 2024 / CPU Multi Core | |
| Microsoft Surface Pro OLED Copilot+ | |
| Średnia w klasie Tablet (795 - 893, n=2, ostatnie 2 lata) | |
| Microsoft Surface Pro Copilot+ | |
| Przeciętny Qualcomm Snapdragon X Plus X1P-64-100 (n=1) | |
| Minisforum V3 | |
| Cinebench 2024 / CPU Single Core | |
| Microsoft Surface Pro OLED Copilot+ | |
| Średnia w klasie Tablet (109 - 123, n=2, ostatnie 2 lata) | |
| Microsoft Surface Pro Copilot+ | |
| Przeciętny Qualcomm Snapdragon X Plus X1P-64-100 (n=1) | |
| Minisforum V3 | |
| Geekbench 6.4 / Multi-Core | |
| Microsoft Surface Pro OLED Copilot+ | |
| Microsoft Surface Pro Copilot+ | |
| Przeciętny Qualcomm Snapdragon X Plus X1P-64-100 (n=1) | |
| Dell Inspiron 14 7445 2-in-1 | |
| Minisforum V3 | |
| Lenovo Yoga Book 9 13IMU9 | |
| Lenovo ThinkBook 14 2-in-1 G4 IML | |
| Średnia w klasie Tablet (493 - 14690, n=81, ostatnie 2 lata) | |
| Geekbench 6.4 / Single-Core | |
| Microsoft Surface Pro OLED Copilot+ | |
| Dell Inspiron 14 7445 2-in-1 | |
| Minisforum V3 | |
| Microsoft Surface Pro Copilot+ | |
| Przeciętny Qualcomm Snapdragon X Plus X1P-64-100 (n=1) | |
| Lenovo Yoga Book 9 13IMU9 | |
| Lenovo ThinkBook 14 2-in-1 G4 IML | |
| Średnia w klasie Tablet (185 - 3715, n=81, ostatnie 2 lata) | |
| Cinebench R23 / Multi Core | |
| Minisforum V3 | |
| Dell Inspiron 14 7445 2-in-1 | |
| Microsoft Surface Pro OLED Copilot+ | |
| Lenovo ThinkBook 14 2-in-1 G4 IML | |
| Lenovo Yoga Book 9 13IMU9 | |
| Microsoft Surface Pro Copilot+ | |
| Przeciętny Qualcomm Snapdragon X Plus X1P-64-100 (n=1) | |
| Średnia w klasie Tablet (3066 - 9927, n=4, ostatnie 2 lata) | |
| Cinebench R23 / Single Core | |
| Dell Inspiron 14 7445 2-in-1 | |
| Minisforum V3 | |
| Lenovo Yoga Book 9 13IMU9 | |
| Lenovo ThinkBook 14 2-in-1 G4 IML | |
| Microsoft Surface Pro OLED Copilot+ | |
| Microsoft Surface Pro Copilot+ | |
| Przeciętny Qualcomm Snapdragon X Plus X1P-64-100 (n=1) | |
| Średnia w klasie Tablet (559 - 1321, n=4, ostatnie 2 lata) | |
| Cinebench R20 / CPU (Multi Core) | |
| Minisforum V3 | |
| Dell Inspiron 14 7445 2-in-1 | |
| Lenovo ThinkBook 14 2-in-1 G4 IML | |
| Microsoft Surface Pro OLED Copilot+ | |
| Lenovo Yoga Book 9 13IMU9 | |
| Microsoft Surface Pro Copilot+ | |
| Przeciętny Qualcomm Snapdragon X Plus X1P-64-100 (n=1) | |
| Średnia w klasie Tablet (1175 - 3640, n=4, ostatnie 2 lata) | |
| Cinebench R20 / CPU (Single Core) | |
| Dell Inspiron 14 7445 2-in-1 | |
| Minisforum V3 | |
| Lenovo Yoga Book 9 13IMU9 | |
| Lenovo ThinkBook 14 2-in-1 G4 IML | |
| Microsoft Surface Pro OLED Copilot+ | |
| Microsoft Surface Pro Copilot+ | |
| Przeciętny Qualcomm Snapdragon X Plus X1P-64-100 (n=1) | |
| Średnia w klasie Tablet (205 - 490, n=4, ostatnie 2 lata) | |
| Cinebench R15 / CPU Multi 64Bit | |
| Microsoft Surface Pro OLED Copilot+ | |
| Minisforum V3 | |
| Microsoft Surface Pro Copilot+ | |
| Przeciętny Qualcomm Snapdragon X Plus X1P-64-100 (n=1) | |
| Dell Inspiron 14 7445 2-in-1 | |
| Lenovo ThinkBook 14 2-in-1 G4 IML | |
| Lenovo Yoga Book 9 13IMU9 | |
| Średnia w klasie Tablet (433 - 2249, n=4, ostatnie 2 lata) | |
| Cinebench R15 / CPU Single 64Bit | |
| Dell Inspiron 14 7445 2-in-1 | |
| Minisforum V3 | |
| Microsoft Surface Pro OLED Copilot+ | |
| Lenovo Yoga Book 9 13IMU9 | |
| Lenovo ThinkBook 14 2-in-1 G4 IML | |
| Microsoft Surface Pro Copilot+ | |
| Przeciętny Qualcomm Snapdragon X Plus X1P-64-100 (n=1) | |
| Średnia w klasie Tablet (119 - 248, n=4, ostatnie 2 lata) | |
| Blender / v2.79 BMW27 CPU | |
| Średnia w klasie Tablet (351 - 1080, n=4, ostatnie 2 lata) | |
| Microsoft Surface Pro Copilot+ | |
| Przeciętny Qualcomm Snapdragon X Plus X1P-64-100 (n=1) | |
| Lenovo Yoga Book 9 13IMU9 | |
| Microsoft Surface Pro OLED Copilot+ | |
| Lenovo ThinkBook 14 2-in-1 G4 IML | |
| Minisforum V3 | |
| Dell Inspiron 14 7445 2-in-1 | |
| 7-Zip 18.03 / 7z b 4 | |
| Dell Inspiron 14 7445 2-in-1 | |
| Minisforum V3 | |
| Microsoft Surface Pro OLED Copilot+ | |
| Lenovo ThinkBook 14 2-in-1 G4 IML | |
| Lenovo Yoga Book 9 13IMU9 | |
| Microsoft Surface Pro Copilot+ | |
| Przeciętny Qualcomm Snapdragon X Plus X1P-64-100 (n=1) | |
| Średnia w klasie Tablet (12470 - 44404, n=4, ostatnie 2 lata) | |
| 7-Zip 18.03 / 7z b 4 -mmt1 | |
| Dell Inspiron 14 7445 2-in-1 | |
| Minisforum V3 | |
| Microsoft Surface Pro OLED Copilot+ | |
| Lenovo Yoga Book 9 13IMU9 | |
| Lenovo ThinkBook 14 2-in-1 G4 IML | |
| Microsoft Surface Pro Copilot+ | |
| Przeciętny Qualcomm Snapdragon X Plus X1P-64-100 (n=1) | |
| Średnia w klasie Tablet (3915 - 5359, n=4, ostatnie 2 lata) | |
| HWBOT x265 Benchmark v2.2 / 4k Preset | |
| Minisforum V3 | |
| Dell Inspiron 14 7445 2-in-1 | |
| Lenovo Yoga Book 9 13IMU9 | |
| Lenovo ThinkBook 14 2-in-1 G4 IML | |
| Microsoft Surface Pro OLED Copilot+ | |
| Microsoft Surface Pro Copilot+ | |
| Przeciętny Qualcomm Snapdragon X Plus X1P-64-100 (n=1) | |
| Średnia w klasie Tablet (2.68 - 6.84, n=4, ostatnie 2 lata) | |
| LibreOffice / 20 Documents To PDF | |
| Średnia w klasie Tablet (51.9 - 117.6, n=4, ostatnie 2 lata) | |
| Microsoft Surface Pro Copilot+ | |
| Przeciętny Qualcomm Snapdragon X Plus X1P-64-100 (n=1) | |
| Minisforum V3 | |
| Microsoft Surface Pro OLED Copilot+ | |
| Lenovo ThinkBook 14 2-in-1 G4 IML | |
| Dell Inspiron 14 7445 2-in-1 | |
| Lenovo Yoga Book 9 13IMU9 | |
| R Benchmark 2.5 / Overall mean | |
| Średnia w klasie Tablet (0.642 - 1.012, n=4, ostatnie 2 lata) | |
| Microsoft Surface Pro Copilot+ | |
| Przeciętny Qualcomm Snapdragon X Plus X1P-64-100 (n=1) | |
| Microsoft Surface Pro OLED Copilot+ | |
| Lenovo ThinkBook 14 2-in-1 G4 IML | |
| Lenovo Yoga Book 9 13IMU9 | |
| Minisforum V3 | |
| Dell Inspiron 14 7445 2-in-1 | |
* ... im mniej tym lepiej
AIDA64: FP32 Ray-Trace | FPU Julia | CPU SHA3 | CPU Queen | FPU SinJulia | FPU Mandel | CPU AES | CPU ZLib | FP64 Ray-Trace | CPU PhotoWorxx
| Performance Rating | |
| Dell Inspiron 14 7445 2-in-1 | |
| Minisforum V3 | |
| Lenovo Yoga Book 9 13IMU9 | |
| Lenovo ThinkBook 14 2-in-1 G4 IML | |
| Microsoft Surface Pro OLED Copilot+ | |
| Microsoft Surface Pro Copilot+ | |
| Przeciętny Qualcomm Snapdragon X Plus X1P-64-100 | |
| Średnia w klasie Tablet | |
| AIDA64 / FP32 Ray-Trace | |
| Dell Inspiron 14 7445 2-in-1 | |
| Minisforum V3 | |
| Lenovo Yoga Book 9 13IMU9 | |
| Lenovo ThinkBook 14 2-in-1 G4 IML | |
| Microsoft Surface Pro Copilot+ | |
| Przeciętny Qualcomm Snapdragon X Plus X1P-64-100 (n=1) | |
| Średnia w klasie Tablet (2184 - 7637, n=4, ostatnie 2 lata) | |
| Microsoft Surface Pro OLED Copilot+ | |
| AIDA64 / FPU Julia | |
| Dell Inspiron 14 7445 2-in-1 | |
| Minisforum V3 | |
| Lenovo Yoga Book 9 13IMU9 | |
| Lenovo ThinkBook 14 2-in-1 G4 IML | |
| Średnia w klasie Tablet (5315 - 14227, n=4, ostatnie 2 lata) | |
| Microsoft Surface Pro OLED Copilot+ | |
| Microsoft Surface Pro Copilot+ | |
| Przeciętny Qualcomm Snapdragon X Plus X1P-64-100 (n=1) | |
| AIDA64 / CPU SHA3 | |
| Dell Inspiron 14 7445 2-in-1 | |
| Minisforum V3 | |
| Microsoft Surface Pro OLED Copilot+ | |
| Lenovo Yoga Book 9 13IMU9 | |
| Lenovo ThinkBook 14 2-in-1 G4 IML | |
| Microsoft Surface Pro Copilot+ | |
| Przeciętny Qualcomm Snapdragon X Plus X1P-64-100 (n=1) | |
| Średnia w klasie Tablet (785 - 2607, n=4, ostatnie 2 lata) | |
| AIDA64 / CPU Queen | |
| Dell Inspiron 14 7445 2-in-1 | |
| Minisforum V3 | |
| Microsoft Surface Pro OLED Copilot+ | |
| Microsoft Surface Pro Copilot+ | |
| Przeciętny Qualcomm Snapdragon X Plus X1P-64-100 (n=1) | |
| Średnia w klasie Tablet (27210 - 69762, n=4, ostatnie 2 lata) | |
| Lenovo ThinkBook 14 2-in-1 G4 IML | |
| Lenovo Yoga Book 9 13IMU9 | |
| AIDA64 / FPU SinJulia | |
| Dell Inspiron 14 7445 2-in-1 | |
| Minisforum V3 | |
| Lenovo Yoga Book 9 13IMU9 | |
| Lenovo ThinkBook 14 2-in-1 G4 IML | |
| Microsoft Surface Pro OLED Copilot+ | |
| Microsoft Surface Pro Copilot+ | |
| Przeciętny Qualcomm Snapdragon X Plus X1P-64-100 (n=1) | |
| Średnia w klasie Tablet (1161 - 2357, n=4, ostatnie 2 lata) | |
| AIDA64 / FPU Mandel | |
| Dell Inspiron 14 7445 2-in-1 | |
| Minisforum V3 | |
| Lenovo Yoga Book 9 13IMU9 | |
| Lenovo ThinkBook 14 2-in-1 G4 IML | |
| Microsoft Surface Pro OLED Copilot+ | |
| Microsoft Surface Pro Copilot+ | |
| Przeciętny Qualcomm Snapdragon X Plus X1P-64-100 (n=1) | |
| Średnia w klasie Tablet (6842 - 15669, n=4, ostatnie 2 lata) | |
| AIDA64 / CPU AES | |
| Microsoft Surface Pro OLED Copilot+ | |
| Minisforum V3 | |
| Dell Inspiron 14 7445 2-in-1 | |
| Microsoft Surface Pro Copilot+ | |
| Przeciętny Qualcomm Snapdragon X Plus X1P-64-100 (n=1) | |
| Lenovo Yoga Book 9 13IMU9 | |
| Lenovo ThinkBook 14 2-in-1 G4 IML | |
| Średnia w klasie Tablet (1275 - 71089, n=4, ostatnie 2 lata) | |
| AIDA64 / CPU ZLib | |
| Dell Inspiron 14 7445 2-in-1 | |
| Minisforum V3 | |
| Microsoft Surface Pro OLED Copilot+ | |
| Lenovo ThinkBook 14 2-in-1 G4 IML | |
| Microsoft Surface Pro Copilot+ | |
| Przeciętny Qualcomm Snapdragon X Plus X1P-64-100 (n=1) | |
| Lenovo Yoga Book 9 13IMU9 | |
| Średnia w klasie Tablet (229 - 802, n=4, ostatnie 2 lata) | |
| AIDA64 / FP64 Ray-Trace | |
| Dell Inspiron 14 7445 2-in-1 | |
| Minisforum V3 | |
| Lenovo Yoga Book 9 13IMU9 | |
| Lenovo ThinkBook 14 2-in-1 G4 IML | |
| Microsoft Surface Pro OLED Copilot+ | |
| Microsoft Surface Pro Copilot+ | |
| Przeciętny Qualcomm Snapdragon X Plus X1P-64-100 (n=1) | |
| Średnia w klasie Tablet (1127 - 3392, n=4, ostatnie 2 lata) | |
| AIDA64 / CPU PhotoWorxx | |
| Lenovo Yoga Book 9 13IMU9 | |
| Microsoft Surface Pro OLED Copilot+ | |
| Minisforum V3 | |
| Microsoft Surface Pro Copilot+ | |
| Przeciętny Qualcomm Snapdragon X Plus X1P-64-100 (n=1) | |
| Dell Inspiron 14 7445 2-in-1 | |
| Średnia w klasie Tablet (14660 - 38707, n=4, ostatnie 2 lata) | |
| Lenovo ThinkBook 14 2-in-1 G4 IML | |
Wydajność systemu
Podobnie jak droższy model OLED Surface Pro, podstawowy wariant jest również bardzo responsywnym towarzyszem podczas wykonywania codziennych zadań. W rezultacie nie doświadczyliśmy żadnych problemów związanych ze stabilnością systemu, ale nie każda aplikacja działa. Jeśli planują Państwo korzystać nie tylko z codziennych aplikacji (biurowych, przeglądarek, streamingu wideo itp.), to warto wcześniej zrobić rozeznanie, aby uniknąć przykrych niespodzianek. Ponadto, urządzenia peryferyjne, które wymagają własnych sterowników, mogą mieć problemy z kompatybilnością.
WebXPRT 3: Overall
WebXPRT 4: Overall
Mozilla Kraken 1.1: Total
| CrossMark / Overall | |
| Dell Inspiron 14 7445 2-in-1 | |
| Minisforum V3 | |
| Lenovo Yoga Book 9 13IMU9 | |
| Microsoft Surface Pro OLED Copilot+ | |
| Lenovo ThinkBook 14 2-in-1 G4 IML | |
| Microsoft Surface Pro Copilot+ | |
| Przeciętny Qualcomm Snapdragon X Plus X1P-64-100, Qualcomm SD X Adreno X1-85 3.8 TFLOPS (n=1) | |
| Średnia w klasie Tablet (172 - 1944, n=62, ostatnie 2 lata) | |
| CrossMark / Productivity | |
| Dell Inspiron 14 7445 2-in-1 | |
| Minisforum V3 | |
| Lenovo Yoga Book 9 13IMU9 | |
| Microsoft Surface Pro OLED Copilot+ | |
| Lenovo ThinkBook 14 2-in-1 G4 IML | |
| Microsoft Surface Pro Copilot+ | |
| Przeciętny Qualcomm Snapdragon X Plus X1P-64-100, Qualcomm SD X Adreno X1-85 3.8 TFLOPS (n=1) | |
| Średnia w klasie Tablet (185 - 1797, n=62, ostatnie 2 lata) | |
| CrossMark / Creativity | |
| Dell Inspiron 14 7445 2-in-1 | |
| Minisforum V3 | |
| Lenovo Yoga Book 9 13IMU9 | |
| Microsoft Surface Pro OLED Copilot+ | |
| Lenovo ThinkBook 14 2-in-1 G4 IML | |
| Microsoft Surface Pro Copilot+ | |
| Przeciętny Qualcomm Snapdragon X Plus X1P-64-100, Qualcomm SD X Adreno X1-85 3.8 TFLOPS (n=1) | |
| Średnia w klasie Tablet (151 - 2350, n=62, ostatnie 2 lata) | |
| CrossMark / Responsiveness | |
| Microsoft Surface Pro OLED Copilot+ | |
| Dell Inspiron 14 7445 2-in-1 | |
| Minisforum V3 | |
| Lenovo Yoga Book 9 13IMU9 | |
| Lenovo ThinkBook 14 2-in-1 G4 IML | |
| Microsoft Surface Pro Copilot+ | |
| Przeciętny Qualcomm Snapdragon X Plus X1P-64-100, Qualcomm SD X Adreno X1-85 3.8 TFLOPS (n=1) | |
| Średnia w klasie Tablet (205 - 1462, n=62, ostatnie 2 lata) | |
| WebXPRT 3 / Overall | |
| Microsoft Surface Pro OLED Copilot+ | |
| Microsoft Surface Pro Copilot+ | |
| Przeciętny Qualcomm Snapdragon X Plus X1P-64-100, Qualcomm SD X Adreno X1-85 3.8 TFLOPS (n=1) | |
| Dell Inspiron 14 7445 2-in-1 | |
| Minisforum V3 | |
| Lenovo Yoga Book 9 13IMU9 | |
| Lenovo ThinkBook 14 2-in-1 G4 IML | |
| Średnia w klasie Tablet (36 - 435, n=39, ostatnie 2 lata) | |
| WebXPRT 4 / Overall | |
| Microsoft Surface Pro OLED Copilot+ | |
| Dell Inspiron 14 7445 2-in-1 | |
| Microsoft Surface Pro Copilot+ | |
| Przeciętny Qualcomm Snapdragon X Plus X1P-64-100, Qualcomm SD X Adreno X1-85 3.8 TFLOPS (n=1) | |
| Lenovo Yoga Book 9 13IMU9 | |
| Minisforum V3 | |
| Lenovo ThinkBook 14 2-in-1 G4 IML | |
| Średnia w klasie Tablet (21 - 315, n=67, ostatnie 2 lata) | |
| Mozilla Kraken 1.1 / Total | |
| Średnia w klasie Tablet (319 - 34733, n=76, ostatnie 2 lata) | |
| Lenovo ThinkBook 14 2-in-1 G4 IML | |
| Lenovo Yoga Book 9 13IMU9 | |
| Dell Inspiron 14 7445 2-in-1 | |
| Minisforum V3 | |
| Przeciętny Qualcomm Snapdragon X Plus X1P-64-100, Qualcomm SD X Adreno X1-85 3.8 TFLOPS (n=1) | |
| Microsoft Surface Pro Copilot+ | |
| Microsoft Surface Pro OLED Copilot+ | |
* ... im mniej tym lepiej
| AIDA64 / Memory Copy | |
| Lenovo Yoga Book 9 13IMU9 | |
| Minisforum V3 | |
| Microsoft Surface Pro Copilot+ | |
| Przeciętny Qualcomm Snapdragon X Plus X1P-64-100 (n=1) | |
| Dell Inspiron 14 7445 2-in-1 | |
| Microsoft Surface Pro OLED Copilot+ | |
| Średnia w klasie Tablet (32539 - 63769, n=4, ostatnie 2 lata) | |
| Lenovo ThinkBook 14 2-in-1 G4 IML | |
| AIDA64 / Memory Read | |
| Microsoft Surface Pro Copilot+ | |
| Przeciętny Qualcomm Snapdragon X Plus X1P-64-100 (n=1) | |
| Microsoft Surface Pro OLED Copilot+ | |
| Średnia w klasie Tablet (31342 - 124555, n=4, ostatnie 2 lata) | |
| Lenovo Yoga Book 9 13IMU9 | |
| Dell Inspiron 14 7445 2-in-1 | |
| Minisforum V3 | |
| Lenovo ThinkBook 14 2-in-1 G4 IML | |
| AIDA64 / Memory Write | |
| Minisforum V3 | |
| Dell Inspiron 14 7445 2-in-1 | |
| Lenovo Yoga Book 9 13IMU9 | |
| Microsoft Surface Pro Copilot+ | |
| Przeciętny Qualcomm Snapdragon X Plus X1P-64-100 (n=1) | |
| Microsoft Surface Pro OLED Copilot+ | |
| Średnia w klasie Tablet (33224 - 49785, n=4, ostatnie 2 lata) | |
| Lenovo ThinkBook 14 2-in-1 G4 IML | |
| AIDA64 / Memory Latency | |
| Lenovo Yoga Book 9 13IMU9 | |
| Lenovo ThinkBook 14 2-in-1 G4 IML | |
| Minisforum V3 | |
| Dell Inspiron 14 7445 2-in-1 | |
| Średnia w klasie Tablet (7.4 - 105.3, n=4, ostatnie 2 lata) | |
| Microsoft Surface Pro Copilot+ | |
| Przeciętny Qualcomm Snapdragon X Plus X1P-64-100 (n=1) | |
| Microsoft Surface Pro OLED Copilot+ | |
* ... im mniej tym lepiej
Opóźnienia DPC
Nie byliśmy w stanie przeprowadzić naszego standardowego testu opóźnień, ponieważ aplikacja LatencyMon nie uruchamia się na systemach ARM. Przynajmniej nie było żadnych problemów podczas odtwarzania filmu 4K z YouTube, jeśli chodzi o pomijanie klatek.
Pamięć masowa
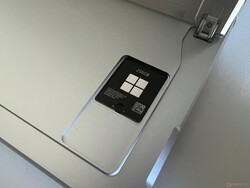
Nasz podstawowy wariant recenzowanego urządzenia jest wyposażony tylko w 256 GB dysk SSD firmy Samsung (PM981). Jest to kompaktowy dysk SSD M.2 2230, który jest łatwo dostępny dzięki magnetycznej pokrywie z tyłu urządzenia. Oznacza to, że bez trudu można wymienić dysk SSD na dysk o większej pojemności, a tym samym uniknąć konieczności ponoszenia wysokiej dopłaty Microsoftu (250 USD za aktualizację z 256 do 512 GB). W różnych sklepach internetowych dysk SSD o pojemności 1 TB kosztuje około 80-100 USD.
Dysk SSD Samsunga jest podłączony za pośrednictwem PCIe 4.0, a jego wydajność jest całkiem przyzwoita, pozostając stabilna przy długotrwałym obciążeniu. Po wstępnej instalacji użytkownik ma do dyspozycji 185 GB. Dodatkowe benchmarki SSD można znaleźć tutaj.
* ... im mniej tym lepiej
Continuous Performance Read: DiskSpd Read Loop, Queue Depth 8
Karta graficzna - Adreno X1-85
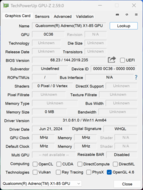
Jeśli chodzi o zintegrowany Adreno X1-85 nie ma żadnych różnic w porównaniu do Surface Pro ze Snapdragonem X Elite, ponieważ oba wykorzystują słabszy wariant 3,8 TFLOP, który ma maksymalną prędkość taktowania 1,2 GHz. W codziennym użytkowaniu procesor graficzny Adreno radzi sobie dobrze i nawet odtwarzanie filmów w wysokiej rozdzielczości przebiega bez zakłóceń. Co więcej, przy ciągłym obciążeniu, a także w trybie bateryjnym, wydajność graficzna pozostaje stabilna.
W porównaniu do OLED Surface Pro, wyniki benchmarków są nieco lepsze, co prawdopodobnie wynika ze zaktualizowanych sterowników GPU, które Qualcomm udostępnił naszym recenzentom w wersji beta. Poprawiło to na przykład kompatybilność z grami (np. wsparcie dla Far Cry 5, koniec z awariami w Cyberpunk 2077). Sam Qualcomm nie oferuje tego sterownika do pobrania dla ogółu społeczeństwa, ale zamiast tego będzie on dystrybuowany w pewnym momencie za pośrednictwem zwykłych aktualizacji systemu Windows i producenta. Jest to jednak coś, co do tej pory nie miało miejsca.
Zasadniczo wydajność w grach jest znacznie gorsza niż w przypadku iGPU AMD i Intela, a wiele gier również odmawia poprawnego działania (np. błędy graficzne w Total War Pharaoh) lub w ogóle się nie uruchamia(F1 23/F124). Dodatkowe testy porównawcze GPU można znaleźć tutaj.
| 3DMark 11 Performance | 6886 pkt. | |
| 3DMark Fire Strike Score | 6130 pkt. | |
| 3DMark Time Spy Score | 1894 pkt. | |
| 3DMark Steel Nomad Score | 524 pkt. | |
| 3DMark Steel Nomad Light Score | 2187 pkt. | |
Pomoc | ||
| Blender / v3.3 Classroom CPU | |
| Średnia w klasie Tablet (637 - 2098, n=4, ostatnie 2 lata) | |
| Microsoft Surface Pro Copilot+ | |
| Przeciętny Qualcomm SD X Adreno X1-85 3.8 TFLOPS (545 - 899, n=12) | |
| Lenovo Yoga Book 9 13IMU9 | |
| Lenovo ThinkBook 14 2-in-1 G4 IML | |
| Microsoft Surface Pro OLED Copilot+ | |
| Dell Inspiron 14 7445 2-in-1 | |
| Minisforum V3 | |
* ... im mniej tym lepiej
| Performance Rating - Percent | |
| Minisforum V3 | |
| Dell Inspiron 14 7445 2-in-1 -1! | |
| Microsoft Surface Pro Copilot+ | |
| Microsoft Surface Pro OLED Copilot+ -1! | |
| Lenovo Yoga Book 9 13IMU9 -1! | |
| Średnia w klasie Tablet | |
| Lenovo ThinkBook 14 2-in-1 G4 IML -1! | |
| The Witcher 3 - 1920x1080 Ultra Graphics & Postprocessing (HBAO+) | |
| Minisforum V3 | |
| Dell Inspiron 14 7445 2-in-1 | |
| Microsoft Surface Pro Copilot+ | |
| Microsoft Surface Pro OLED Copilot+ | |
| Lenovo Yoga Book 9 13IMU9 | |
| Średnia w klasie Tablet (8.5 - 20, n=3, ostatnie 2 lata) | |
| Lenovo ThinkBook 14 2-in-1 G4 IML | |
| GTA V - 1920x1080 Highest Settings possible AA:4xMSAA + FX AF:16x | |
| Minisforum V3 | |
| Microsoft Surface Pro Copilot+ | |
| Średnia w klasie Tablet (n=1ostatnie 2 lata) | |
| Final Fantasy XV Benchmark - 1920x1080 High Quality | |
| Minisforum V3 | |
| Dell Inspiron 14 7445 2-in-1 | |
| Lenovo Yoga Book 9 13IMU9 | |
| Lenovo ThinkBook 14 2-in-1 G4 IML | |
| Microsoft Surface Pro Copilot+ | |
| Microsoft Surface Pro OLED Copilot+ | |
| Średnia w klasie Tablet (7.29 - 15.7, n=3, ostatnie 2 lata) | |
| Cyberpunk 2077 2.2 Phantom Liberty - 1920x1080 Low Preset (FSR off) | |
| Minisforum V3 | |
| Dell Inspiron 14 7445 2-in-1 | |
| Przeciętny Qualcomm SD X Adreno X1-85 3.8 TFLOPS (16.3 - 28.1, n=14) | |
| Microsoft Surface Pro Copilot+ | |
| Średnia w klasie Tablet (21 - 23, n=2, ostatnie 2 lata) | |
| Lenovo Yoga Book 9 13IMU9 | |
| Microsoft Surface Pro OLED Copilot+ | |
| Lenovo ThinkBook 14 2-in-1 G4 IML | |
Cyberpunk 2077 FPS diagram
| low | med. | high | ultra | |
|---|---|---|---|---|
| GTA V (2015) | 104.2 | 97.7 | 49.2 | 20.8 |
| The Witcher 3 (2015) | 107 | 70 | 40 | 20 |
| Dota 2 Reborn (2015) | 61.4 | 46.3 | 46.1 | 45 |
| Final Fantasy XV Benchmark (2018) | 54.9 | 25.4 | 15.7 | |
| X-Plane 11.11 (2018) | 39 | |||
| Far Cry 5 (2018) | 32 | 25 | 23 | 22 |
| Strange Brigade (2018) | 140 | 52 | 43 | 37 |
| F1 22 (2022) | 61.7 | 55 | 37 | 28.1 |
| Baldur's Gate 3 (2023) | 23.6 | 19.5 | 16.9 | 16.6 |
| Cyberpunk 2077 2.2 Phantom Liberty (2023) | 23 | 18.2 | 16.4 | 14.3 |
Emisje i energia
Emisja hałasu
W codziennym użytkowaniu Surface Pro ze Snapdragonem X Plus często działa całkowicie bezgłośnie i nawet przy większym obciążeniu wentylatory nie zawsze się włączają. Jeśli jednak procesor jest wciśnięty lub podczas grania w gry, osiąga dokładnie taki sam poziom - do 44,7 dB(A) - jak model Model OLED. Co ciekawe, podczas grania model podstawowy był głośniejszy niż wersja OLED. W przypadku korzystania z jednego ze słabszych profili energetycznych maksymalna głośność spada do 40,1 dB(A)(Lepsza wydajność) i 37,7 dB(A)(Zalecane). Recenzowane urządzenie nie emitowało żadnych innych dźwięków elektrycznych
Hałas
| luz |
| 23.8 / 23.8 / 23.8 dB |
| obciążenie |
| 23.8 / 44.7 dB |
 | ||
30 dB cichy 40 dB(A) słyszalny 50 dB(A) irytujący |
||
min: | ||
| Microsoft Surface Pro Copilot+ Adreno X1-85 3.8 TFLOPS, SD X Plus X1P-64-100, Samsung PM9B1 256GB MZ9L4256HCJQ | Microsoft Surface Pro OLED Copilot+ Adreno X1-85 3.8 TFLOPS, SD X Elite X1E-80-100, Samsung PM9B1 1024GB MZVL41T0HBLB | Minisforum V3 Radeon 780M, R7 8840U, Kingston OM8PGP41024Q-A0 | Dell Inspiron 14 7445 2-in-1 Radeon 780M, R7 8840HS, Micron 2400 MTFDKBK1T0QFM | Lenovo Yoga Book 9 13IMU9 Graphics 4-Core, Ultra 7 155U | Lenovo ThinkBook 14 2-in-1 G4 IML Graphics 4-Core, Ultra 5 125U, SK hynix HFS512GEJ4X112N | |
|---|---|---|---|---|---|---|
| Noise | -8% | -17% | -8% | 5% | -4% | |
| wyłączone / środowisko * | 23.8 | 23.6 1% | 25.4 -7% | 23.6 1% | 23.3 2% | 23 3% |
| Idle Minimum * | 23.8 | 23.6 1% | 26.7 -12% | 24.3 -2% | 23.3 2% | 23.5 1% |
| Idle Average * | 23.8 | 23.6 1% | 31.6 -33% | 24.3 -2% | 23.3 2% | 24.2 -2% |
| Idle Maximum * | 23.8 | 25.2 -6% | 32.5 -37% | 24.8 -4% | 24.6 -3% | 24.2 -2% |
| Load Average * | 23.8 | 39 -64% | 32.7 -37% | 33.5 -41% | 26.2 -10% | 29.6 -24% |
| Cyberpunk 2077 ultra * | 44.7 | 39 13% | ||||
| Load Maximum * | 44.7 | 44.8 -0% | 34 24% | 43.8 2% | 27.3 39% | 44.9 -0% |
| Witcher 3 ultra * | 33.2 | 43.8 | 27.3 | 44.9 |
* ... im mniej tym lepiej
Temperatura
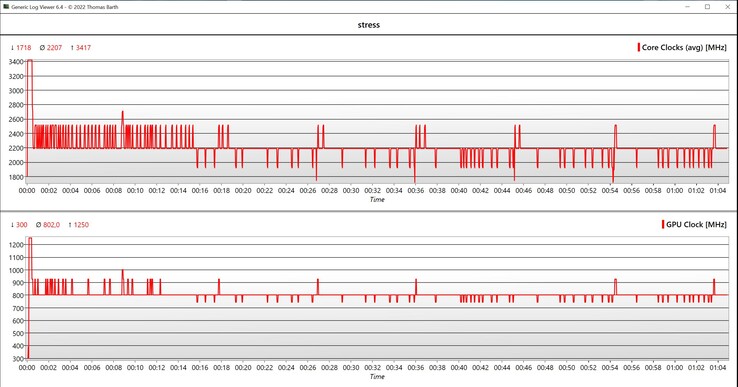
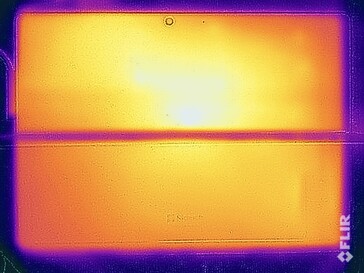
Sytuacja temperaturowa jest bardzo porównywalna do droższego Surface Pro OLED. Podczas bezczynnego użytkowania, a także wykonywania codziennych zadań, obudowa pozostaje przyjemnie chłodna, jednak gdy tylko obciążenie wzrośnie, metalowa obudowa szybko się nagrzewa. Ze względu na metalowe powierzchnie, obsługa urządzenia jest nieprzyjemna, chociaż nie zarejestrowaliśmy więcej niż 45 ° C na żadnym obszarze laptopa. Laptop 2 w 1 może być nadal używany z urządzeniem umieszczonym na kolanach użytkownika dzięki podpórce, która zapewnia brak bezpośredniego kontaktu z ciepłymi powierzchniami. W teście obciążeniowym z połączonym obciążeniem CPU/GPU, prędkość taktowania CPU szybko ustabilizowała się na poziomie ~2,2 GHz, a GPU na ~800 MHz.
(±) Maksymalna temperatura w górnej części wynosi 43.9 °C / 111 F, w porównaniu do średniej 33.7 °C / 93 F , począwszy od 20.7 do 53.2 °C dla klasy Tablet.
(±) Dno nagrzewa się maksymalnie do 44.9 °C / 113 F, w porównaniu do średniej 33.2 °C / 92 F
(+) W stanie bezczynności średnia temperatura górnej części wynosi 25.6 °C / 78 F, w porównaniu ze średnią temperaturą urządzenia wynoszącą 30 °C / ### class_avg_f### F.
(-) 3: The average temperature for the upper side is 42.1 °C / 108 F, compared to the average of 30 °C / 86 F for the class Tablet.
| Microsoft Surface Pro Copilot+ Qualcomm Snapdragon X Plus X1P-64-100, Qualcomm SD X Adreno X1-85 3.8 TFLOPS | Microsoft Surface Pro OLED Copilot+ Qualcomm Snapdragon X Elite X1E-80-100, Qualcomm SD X Adreno X1-85 3.8 TFLOPS | Minisforum V3 AMD Ryzen 7 8840U, AMD Radeon 780M | Dell Inspiron 14 7445 2-in-1 AMD Ryzen 7 8840HS, AMD Radeon 780M | Lenovo Yoga Book 9 13IMU9 Intel Core Ultra 7 155U, Intel Graphics 4-Core iGPU (Arc) | Lenovo ThinkBook 14 2-in-1 G4 IML Intel Core Ultra 5 125U, Intel Graphics 4-Core iGPU (Arc) | |
|---|---|---|---|---|---|---|
| Heat | -4% | -30% | -14% | -8% | -1% | |
| Maximum Upper Side * | 43.9 | 43.1 2% | 50.5 -15% | 41.2 6% | 39.2 11% | 37.4 15% |
| Maximum Bottom * | 44.9 | 46.3 -3% | 54.8 -22% | 48.4 -8% | 41 9% | 39 13% |
| Idle Upper Side * | 26.2 | 27.5 -5% | 34.9 -33% | 29.4 -12% | 32.2 -23% | 28.6 -9% |
| Idle Bottom * | 24.6 | 26.8 -9% | 36.3 -48% | 35.2 -43% | 31.6 -28% | 30.6 -24% |
* ... im mniej tym lepiej
Głośniki
Microsoft Surface Pro Copilot+ analiza dźwięku
(+) | głośniki mogą odtwarzać stosunkowo głośno (82.4 dB)
Bas 100 - 315 Hz
(±) | zredukowany bas - średnio 8.9% niższy od mediany
(±) | liniowość basu jest średnia (9.3% delta do poprzedniej częstotliwości)
Średnie 400 - 2000 Hz
(±) | wyższe średnie - średnio 6.4% wyższe niż mediana
(+) | średnie są liniowe (3.3% delta do poprzedniej częstotliwości)
Wysokie 2–16 kHz
(+) | zrównoważone maksima - tylko 3.9% od mediany
(+) | wzloty są liniowe (3.2% delta do poprzedniej częstotliwości)
Ogólnie 100 - 16.000 Hz
(+) | ogólny dźwięk jest liniowy (13.5% różnicy w stosunku do mediany)
W porównaniu do tej samej klasy
» 23% wszystkich testowanych urządzeń w tej klasie było lepszych, 4% podobnych, 74% gorszych
» Najlepszy miał deltę 7%, średnia wynosiła ###średnia###%, najgorsza wynosiła 129%
W porównaniu do wszystkich testowanych urządzeń
» 13% wszystkich testowanych urządzeń było lepszych, 4% podobnych, 84% gorszych
» Najlepszy miał deltę 4%, średnia wynosiła ###średnia###%, najgorsza wynosiła 134%
Minisforum V3 analiza dźwięku
(±) | głośność głośnika jest średnia, ale dobra (74.8 dB)
Bas 100 - 315 Hz
(±) | zredukowany bas - średnio 13.5% niższy od mediany
(±) | liniowość basu jest średnia (10.2% delta do poprzedniej częstotliwości)
Średnie 400 - 2000 Hz
(+) | zbalansowane środki średnie - tylko 3.2% od mediany
(±) | liniowość środka jest średnia (8.2% delta do poprzedniej częstotliwości)
Wysokie 2–16 kHz
(+) | zrównoważone maksima - tylko 4.6% od mediany
(±) | liniowość wysokich wartości jest średnia (7.8% delta do poprzedniej częstotliwości)
Ogólnie 100 - 16.000 Hz
(±) | liniowość ogólnego dźwięku jest średnia (21.3% różnicy w stosunku do mediany)
W porównaniu do tej samej klasy
» 55% wszystkich testowanych urządzeń w tej klasie było lepszych, 12% podobnych, 33% gorszych
» Najlepszy miał deltę 6%, średnia wynosiła ###średnia###%, najgorsza wynosiła 57%
W porównaniu do wszystkich testowanych urządzeń
» 57% wszystkich testowanych urządzeń było lepszych, 7% podobnych, 36% gorszych
» Najlepszy miał deltę 4%, średnia wynosiła ###średnia###%, najgorsza wynosiła 134%
Dell Inspiron 14 7445 2-in-1 analiza dźwięku
(+) | głośniki mogą odtwarzać stosunkowo głośno (85 dB)
Bas 100 - 315 Hz
(±) | zredukowany bas - średnio 13.2% niższy od mediany
(±) | liniowość basu jest średnia (8.2% delta do poprzedniej częstotliwości)
Średnie 400 - 2000 Hz
(+) | zbalansowane środki średnie - tylko 4.4% od mediany
(+) | średnie są liniowe (4% delta do poprzedniej częstotliwości)
Wysokie 2–16 kHz
(+) | zrównoważone maksima - tylko 2.2% od mediany
(+) | wzloty są liniowe (4.2% delta do poprzedniej częstotliwości)
Ogólnie 100 - 16.000 Hz
(+) | ogólny dźwięk jest liniowy (11.5% różnicy w stosunku do mediany)
W porównaniu do tej samej klasy
» 9% wszystkich testowanych urządzeń w tej klasie było lepszych, 3% podobnych, 88% gorszych
» Najlepszy miał deltę 6%, średnia wynosiła ###średnia###%, najgorsza wynosiła 57%
W porównaniu do wszystkich testowanych urządzeń
» 6% wszystkich testowanych urządzeń było lepszych, 2% podobnych, 92% gorszych
» Najlepszy miał deltę 4%, średnia wynosiła ###średnia###%, najgorsza wynosiła 134%
Lenovo Yoga Book 9 13IMU9 analiza dźwięku
(+) | głośniki mogą odtwarzać stosunkowo głośno (84.1 dB)
Bas 100 - 315 Hz
(±) | zredukowany bas - średnio 8.2% niższy od mediany
(±) | liniowość basu jest średnia (7.5% delta do poprzedniej częstotliwości)
Średnie 400 - 2000 Hz
(+) | zbalansowane środki średnie - tylko 2.3% od mediany
(+) | średnie są liniowe (3.4% delta do poprzedniej częstotliwości)
Wysokie 2–16 kHz
(+) | zrównoważone maksima - tylko 1.3% od mediany
(+) | wzloty są liniowe (2.4% delta do poprzedniej częstotliwości)
Ogólnie 100 - 16.000 Hz
(+) | ogólny dźwięk jest liniowy (7.4% różnicy w stosunku do mediany)
W porównaniu do tej samej klasy
» 2% wszystkich testowanych urządzeń w tej klasie było lepszych, 1% podobnych, 98% gorszych
» Najlepszy miał deltę 6%, średnia wynosiła ###średnia###%, najgorsza wynosiła 57%
W porównaniu do wszystkich testowanych urządzeń
» 1% wszystkich testowanych urządzeń było lepszych, 0% podobnych, 99% gorszych
» Najlepszy miał deltę 4%, średnia wynosiła ###średnia###%, najgorsza wynosiła 134%
Lenovo ThinkBook 14 2-in-1 G4 IML analiza dźwięku
(±) | głośność głośnika jest średnia, ale dobra (80.1 dB)
Bas 100 - 315 Hz
(-) | prawie brak basu - średnio 19.8% niższa od mediany
(±) | liniowość basu jest średnia (11.8% delta do poprzedniej częstotliwości)
Średnie 400 - 2000 Hz
(+) | zbalansowane środki średnie - tylko 3.6% od mediany
(+) | średnie są liniowe (5.9% delta do poprzedniej częstotliwości)
Wysokie 2–16 kHz
(+) | zrównoważone maksima - tylko 1.9% od mediany
(+) | wzloty są liniowe (3.9% delta do poprzedniej częstotliwości)
Ogólnie 100 - 16.000 Hz
(+) | ogólny dźwięk jest liniowy (14.6% różnicy w stosunku do mediany)
W porównaniu do tej samej klasy
» 22% wszystkich testowanych urządzeń w tej klasie było lepszych, 3% podobnych, 75% gorszych
» Najlepszy miał deltę 6%, średnia wynosiła ###średnia###%, najgorsza wynosiła 57%
W porównaniu do wszystkich testowanych urządzeń
» 17% wszystkich testowanych urządzeń było lepszych, 4% podobnych, 79% gorszych
» Najlepszy miał deltę 4%, średnia wynosiła ###średnia###%, najgorsza wynosiła 134%
Zużycie energii
Jeśli chodzi o minimalne zużycie energii, model IPS jest nieco bardziej ekonomiczny, ale z kolei zużywa więcej energii przy pełnej jasności (maksymalnie 9,5 wata) niż wariant OLED Wariant OLED. Warto jednak zauważyć, że wariant OLED korzysta z ciemnej standardowej tapety, a zużycie energii wzrasta, gdy używana jest jaśniejsza tapeta. Pod obciążeniem urządzenie początkowo działa w granicach 39-watowego zasilacza, a następnie osiąga ~ 40 watów. Jest to ten sam poziom, co w przypadku Model OLED.
| wyłączony / stan wstrzymania | |
| luz | |
| obciążenie |
|
Legenda:
min: | |
| Microsoft Surface Pro Copilot+ Adreno X1-85 3.8 TFLOPS, SD X Plus X1P-64-100, Samsung PM9B1 256GB MZ9L4256HCJQ | Microsoft Surface Pro OLED Copilot+ Adreno X1-85 3.8 TFLOPS, SD X Elite X1E-80-100, Samsung PM9B1 1024GB MZVL41T0HBLB | Minisforum V3 Radeon 780M, R7 8840U, Kingston OM8PGP41024Q-A0 | Dell Inspiron 14 7445 2-in-1 Radeon 780M, R7 8840HS, Micron 2400 MTFDKBK1T0QFM | Lenovo Yoga Book 9 13IMU9 Graphics 4-Core, Ultra 7 155U | Lenovo ThinkBook 14 2-in-1 G4 IML Graphics 4-Core, Ultra 5 125U, SK hynix HFS512GEJ4X112N | |
|---|---|---|---|---|---|---|
| Power Consumption | 8% | -152% | -49% | -100% | -9% | |
| Idle Minimum * | 1.9 | 2.8 -47% | 10.1 -432% | 4.5 -137% | 7.1 -274% | 2.3 -21% |
| Idle Average * | 9.2 | 3.9 58% | 16.9 -84% | 8.4 9% | 9.1 1% | 6.7 27% |
| Idle Maximum * | 9.5 | 4.9 48% | 20.6 -117% | 8.9 6% | 18.4 -94% | 6.8 28% |
| Load Average * | 29.6 | 34.3 -16% | 51.7 -75% | 50.7 -71% | 51.3 -73% | 34.1 -15% |
| Cyberpunk 2077 ultra * | 39.5 | 35.8 9% | ||||
| Cyberpunk 2077 ultra external monitor * | 37.4 | 36 4% | ||||
| Load Maximum * | 40.7 | 41.2 -1% | 61.2 -50% | 62.4 -53% | 65.5 -61% | 67 -65% |
| Witcher 3 ultra * | 55.4 | 50.8 | 41.5 | 27.4 |
* ... im mniej tym lepiej
Power consumption Cyberpunk 2077 / stress test
Power consumption with an external monitor
Żywotność baterii
Ogólnie rzecz biorąc, żywotność baterii modelu podstawowego jest nieco słabsza, jednak warto również wziąć pod uwagę mniejszą baterię, której pojemność jest o około 10% mniejsza (47 vs 53 Wh). Nie jesteśmy pewni, czy waga była decydującym czynnikiem, czy też model OLED nie miał działać gorzej. W teście Wi-Fi przy 150 cd/m² (co stanowi 56% maksymalnej jasności SDR recenzowanego urządzenia) oba modele są na równi ze sobą z czasem pracy nieco poniżej 11 godzin. Przy pełnej jasności SDR w teście Wi-Fi tracimy około godziny w porównaniu do modelu OLED. Pracując z częstotliwością 120 Hz, czas pracy skraca się o około 80 minut przy 150 cd/m², a przy pełnej jasności różnica wynosi zaledwie kilka minut. Przy 14 godzinach w teście wideo, wariant podstawowy również musi przyznać się do porażki z modelem OLED (prawie 16 godzin).
Ze względu na mniejszą pojemność akumulatora, pełny cykl ładowania trwa o 10 minut krócej, jednak 133 minuty przy włączonym urządzeniu to wciąż dość powolny wynik (80% po 78 minutach).
| Microsoft Surface Pro Copilot+ SD X Plus X1P-64-100, Adreno X1-85 3.8 TFLOPS, 47 Wh | Microsoft Surface Pro OLED Copilot+ SD X Elite X1E-80-100, Adreno X1-85 3.8 TFLOPS, 53 Wh | Minisforum V3 R7 8840U, Radeon 780M, 50.82 Wh | Dell Inspiron 14 7445 2-in-1 R7 8840HS, Radeon 780M, 54 Wh | Lenovo Yoga Book 9 13IMU9 Ultra 7 155U, Graphics 4-Core, 80 Wh | Lenovo ThinkBook 14 2-in-1 G4 IML Ultra 5 125U, Graphics 4-Core, 60 Wh | Średnia w klasie Tablet | |
|---|---|---|---|---|---|---|---|
| Czasy pracy | 10% | -7% | 35% | -8% | -28% | 79% | |
| H.264 | 841 | 953 13% | 930 ? 11% | ||||
| WiFi v1.3 | 662 | 665 0% | 352 -47% | 787 19% | 608 -8% | 651 -2% | 835 ? 26% |
| Load | 89 | 104 17% | 119 34% | 134 51% | 42 -53% | 266 ? 199% |
Za
Przeciw
Werdykt - Tańszy, ale nie wolniejszy Surface Pro w codziennym użytkowaniu
Z ceną początkową wynoszącą około 1000 USD, nowy podstawowy wariant Microsoft Surface Pro Copilot+ jest interesującym urządzeniem. Chociaż rzekomo wolniejszy Snapdragon X Plus oferuje nieco niższą wydajność procesora, wydajność GPU jest identyczna, a wydajność jest z łatwością wystarczająca do codziennych zadań. Ogólnie rzecz biorąc, system Windows, a w szczególności natywne aplikacje, działają bardzo dobrze. Potencjalni klienci będą jednak musieli mieć świadomość, że nowa wersja systemu Windows nie jest tak elastyczna, jak ta używana z układami Intela lub AMD, ponieważ wymagane są specjalne wersje ARM. Może to prowadzić do problemów z kompatybilnością z aplikacjami, grami lub urządzeniami peryferyjnymi, które mają własne sterowniki. Lepiej jest wcześniej sprawdzić, czy pożądane aplikacje/gry są kompatybilne.
Podobnie jak w przypadku prawie wszystkich droższych wariantów OLED, model podstawowy oferuje 16 GB pamięci RAM, ale tylko jeden dysk SSD o pojemności 256 GB. Microsoft oferuje również aktualizację do 512 GB, jednak będzie to kosztować dodatkowe 250 USD. Biorąc pod uwagę łatwość wymiany dysku SSD M.2 2230, lepszym rozwiązaniem może być samodzielna wymiana dysku. Poza tym nie są dostępne żadne inne opcje konserwacji, a dostęp do elementów wewnętrznych (w tym wentylatora) również nie jest możliwy. W codziennych sytuacjach Surface Pro Copilot+ jest przeważnie cichy i staje się zauważalnie głośny tylko przy długotrwałym obciążeniu (na przykład podczas grania). W takich przypadkach aluminiowa obudowa staje się nieprzyjemnie ciepła, gdy na przykład urządzenie jest obsługiwane.
Podstawowy model nowego Microsoft Surface Pro Copilot+ oferuje znacznie lepszy stosunek ceny do wydajności. W codziennym użytkowaniu procesor Snapdragon X Plus ma wystarczającą moc i choć jasny ekran dotykowy IPS nie cierpi z powodu PWM, brak możliwości pokrycia przestrzeni kolorów P3 oznacza, że wynikowa jakość obrazu jest gorsza od ekranu OLED. Wymiana małego dysku SSD o pojemności 256 GB jest łatwa, tania i może być wykonana przez użytkownika.
Dużą różnicą (oprócz procesora) jest wybór wyświetlacza, ponieważ model podstawowy jest wyposażony w ekran dotykowy IPS zamiast panelu OLED. Być może nie oferuje on tak subiektywnej jakości obrazu (żywe kolory i głęboka czerń), jaką można uzyskać dzięki OLED, ale z jasnością 600 cd/m², wysoką rozdzielczością i częstotliwością odświeżania 120 Hz, jest to również dobry wyświetlacz bez problemów związanych z PWM. Mimo to Microsoft nie wspomniał, że ekran IPS nie pokrywa w pełni przestrzeni barw P3. Dostępność dokładnego profilu sRGB oznacza jednak, że nie będzie to problemem dla większości użytkowników.
Dodatkową różnicą jest pojemność baterii. Przy 47 Wh, pojemność podstawowego modelu jest o około 10% mniejsza niż w wariancie OLED. Uważamy, że Microsoft kompensuje dodatkową wagę ekranu IPS, ponieważ oba warianty ważą prawie tyle samo. Rezultatem jest jednak nieco niższa żywotność baterii w niektórych scenariuszach.
Segment tabletów 2w1 z systemem Windows jest obecnie w dużej mierze zaniedbywany przez producentów. Chociaż nadal istnieje kilka urządzeń biznesowych, takich jak ThinkPad X12 lub modele gamingowe, takie jak Asus ROG Flow Z13jedynym bezpośrednim konkurentem Surface Pro Copilot+ jest model Minisforum V3jest droższy i musi zmagać się ze znacznie bardziej aktywnymi wentylatorami, a także krótszym czasem pracy na baterii.
Cena i dostępność
Podstawowy model Surface Pro 11 Copilot+ z wyświetlaczem IPS jest dostępny na Amazon za około 1069 USD.
Uwaga: Niedawno zaktualizowaliśmy nasz system oceny i wyniki wersji 8 nie są porównywalne z wynikami wersji 7. Więcej informacji znajdą Państwo tutaj.
Microsoft Surface Pro Copilot+
- 10/08/2024 v8
Andreas Osthoff
Przezroczystość
Wyboru urządzeń do recenzji dokonuje nasza redakcja. Próbka testowa została udostępniona autorowi jako pożyczka od producenta lub sprzedawcy detalicznego na potrzeby tej recenzji. Pożyczkodawca nie miał wpływu na tę recenzję, producent nie otrzymał też kopii tej recenzji przed publikacją. Nie było obowiązku publikowania tej recenzji. Nigdy nie przyjmujemy rekompensaty ani płatności w zamian za nasze recenzje. Jako niezależna firma medialna, Notebookcheck nie podlega władzy producentów, sprzedawców detalicznych ani wydawców.
Tak testuje Notebookcheck
Każdego roku Notebookcheck niezależnie sprawdza setki laptopów i smartfonów, stosując standardowe procedury, aby zapewnić porównywalność wszystkich wyników. Od około 20 lat stale rozwijamy nasze metody badawcze, ustanawiając przy tym standardy branżowe. W naszych laboratoriach testowych doświadczeni technicy i redaktorzy korzystają z wysokiej jakości sprzętu pomiarowego. Testy te obejmują wieloetapowy proces walidacji. Nasz kompleksowy system ocen opiera się na setkach uzasadnionych pomiarów i benchmarków, co pozwala zachować obiektywizm.













 Total Sustainability Score:


