

Recenzja laptopa Alienware x16 R2: Krok w bok od x16 R1

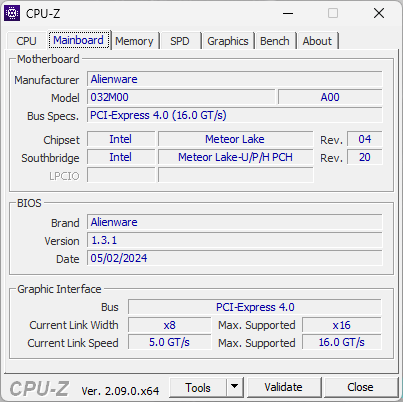
Ultracienka seria Alienware x16 pojawiła się pod koniec ubiegłego roku wraz z debiutem Alienware x16 R1. W 2024 roku seria została odświeżona o x16 R2. Nowszy model zastępuje starsze opcje procesorów Raptor Lake-H opcjami Meteor Lake-H gotowymi na sztuczną inteligencję, podczas gdy wszystko inne pozostaje zasadniczo takie samo, jak w oryginalnym projekcie x16 R1. Dlatego też zalecamy zapoznanie się z naszą recenzję modelu x16 R1 ponieważ większość naszych komentarzy nadal dotyczy wizualnie identycznego x16 R2. Wszelkie zauważalne różnice zostaną odnotowane w niniejszej recenzji.
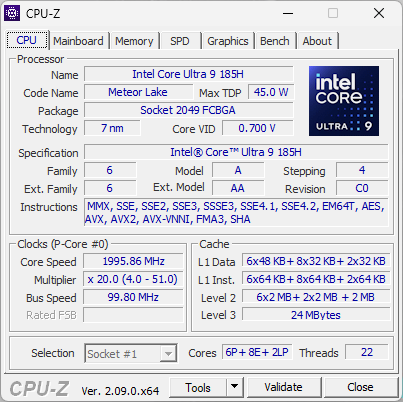
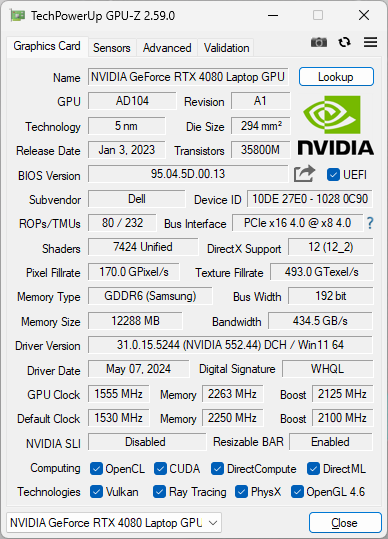
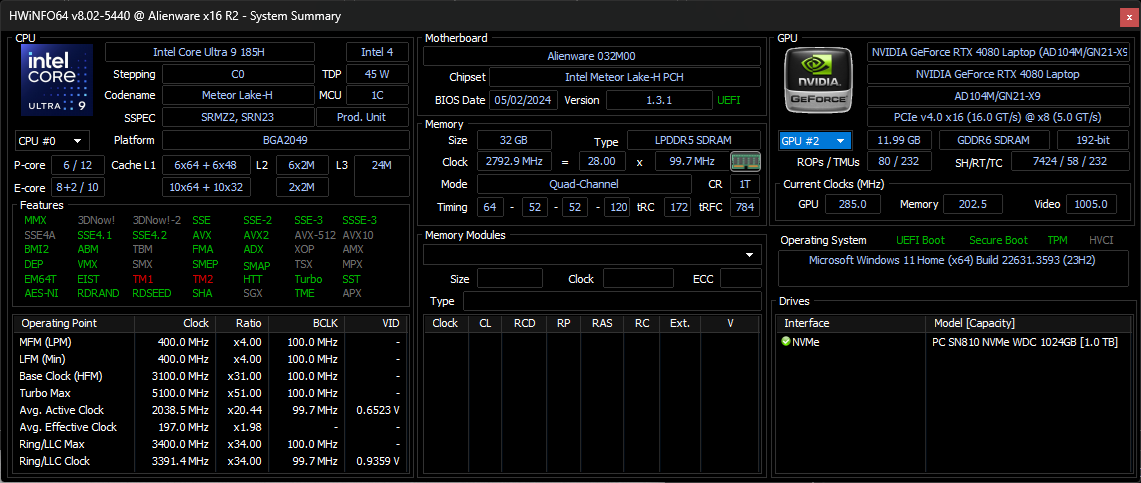
Nasza recenzowana jednostka to konfiguracja z wyższej półki z procesorem Core Ultra 9 185H, kartą graficzną RTX 4080 o mocy 175 W GeForce, wyświetlaczem 1600p 240 Hz i ultra-niskoprofilowymi klawiszami mechanicznymi CherryMX za około 3200 USD. Inne jednostki SKU obejmują zwykłe klawisze membranowe i Core Ultra 7 155H z grafiką GeForce RTX 4060, 4070 lub 4090 i wyświetlaczem IPS 1200p 480 Hz.
Alternatywy dla Alienware x16 R2 obejmują inne wysokiej klasy 16-calowe laptopy do gier, takie jak Razer Blade 16,Asus ROG Strix Scar 16,Lenovo Legion Pro 7 16lub MSI Vector 16 HX.
Więcej recenzji Dell:
Potencjalni konkurenci w porównaniu
Ocena | Data | Model | Waga | Wysokość | Rozmiar | Rezolucja | Cena |
|---|---|---|---|---|---|---|---|
| 88.4 % v7 (old) | 05/2024 | Alienware x16 R2 P120F Ultra 9 185H, NVIDIA GeForce RTX 4080 Laptop GPU | 2.7 kg | 18.57 mm | 16.00" | 2560x1600 | |
| 88.4 % v7 (old) | 06/2023 | Alienware x16 R1 i9-13900HK, NVIDIA GeForce RTX 4080 Laptop GPU | 2.6 kg | 18.57 mm | 16.00" | 2560x1600 | |
| 90.2 % v7 (old) | 03/2024 | Alienware m16 R2 Ultra 7 155H, NVIDIA GeForce RTX 4070 Laptop GPU | 2.5 kg | 23.5 mm | 16.00" | 2560x1600 | |
| 87.6 % v7 (old) | 04/2024 | Asus ROG Strix Scar 16 G634JZR i9-14900HX, NVIDIA GeForce RTX 4080 Laptop GPU | 2.7 kg | 30.4 mm | 16.00" | 2560x1600 | |
| 89.5 % v7 (old) | 03/2024 | Lenovo Legion Pro 7 16IRX9H i9-14900HX, NVIDIA GeForce RTX 4080 Laptop GPU | 2.7 kg | 21.95 mm | 16.00" | 2560x1600 | |
| 88 % v7 (old) | 02/2024 | MSI Vector 16 HX A14V i9-14900HX, NVIDIA GeForce RTX 4080 Laptop GPU | 2.7 kg | 28.55 mm | 16.00" | 2560x1600 |
Przypadek - brak zmian zewnętrznych

Łączność


Czytnik kart SD
Co ciekawe, czytnik MicroSD w naszym x16 R2 nie wykazywał żadnych problemów z szybkością transferu, których doświadczyliśmy w zeszłorocznym x16 R1.
| SD Card Reader | |
| average JPG Copy Test (av. of 3 runs) | |
| Alienware x16 R2 P120F (AV PRO microSD 128 GB V60) | |
| MSI Vector 16 HX A14V (Toshiba Exceria Pro SDXC 64 GB UHS-II) | |
| Alienware m16 R2 (AV PRO microSD 128 GB V60) | |
| Alienware x16 R1 (AV PRO microSD 128 GB V60) | |
| maximum AS SSD Seq Read Test (1GB) | |
| Alienware x16 R2 P120F (AV PRO microSD 128 GB V60) | |
| Alienware x16 R1 (AV PRO microSD 128 GB V60) | |
| Alienware m16 R2 (AV PRO microSD 128 GB V60) | |
| MSI Vector 16 HX A14V (Toshiba Exceria Pro SDXC 64 GB UHS-II) | |
Komunikacja
Dell zaktualizował moduł WLAN w tegorocznym odświeżeniu, aby obsługiwał Wi-Fi 7.
Kamera internetowa


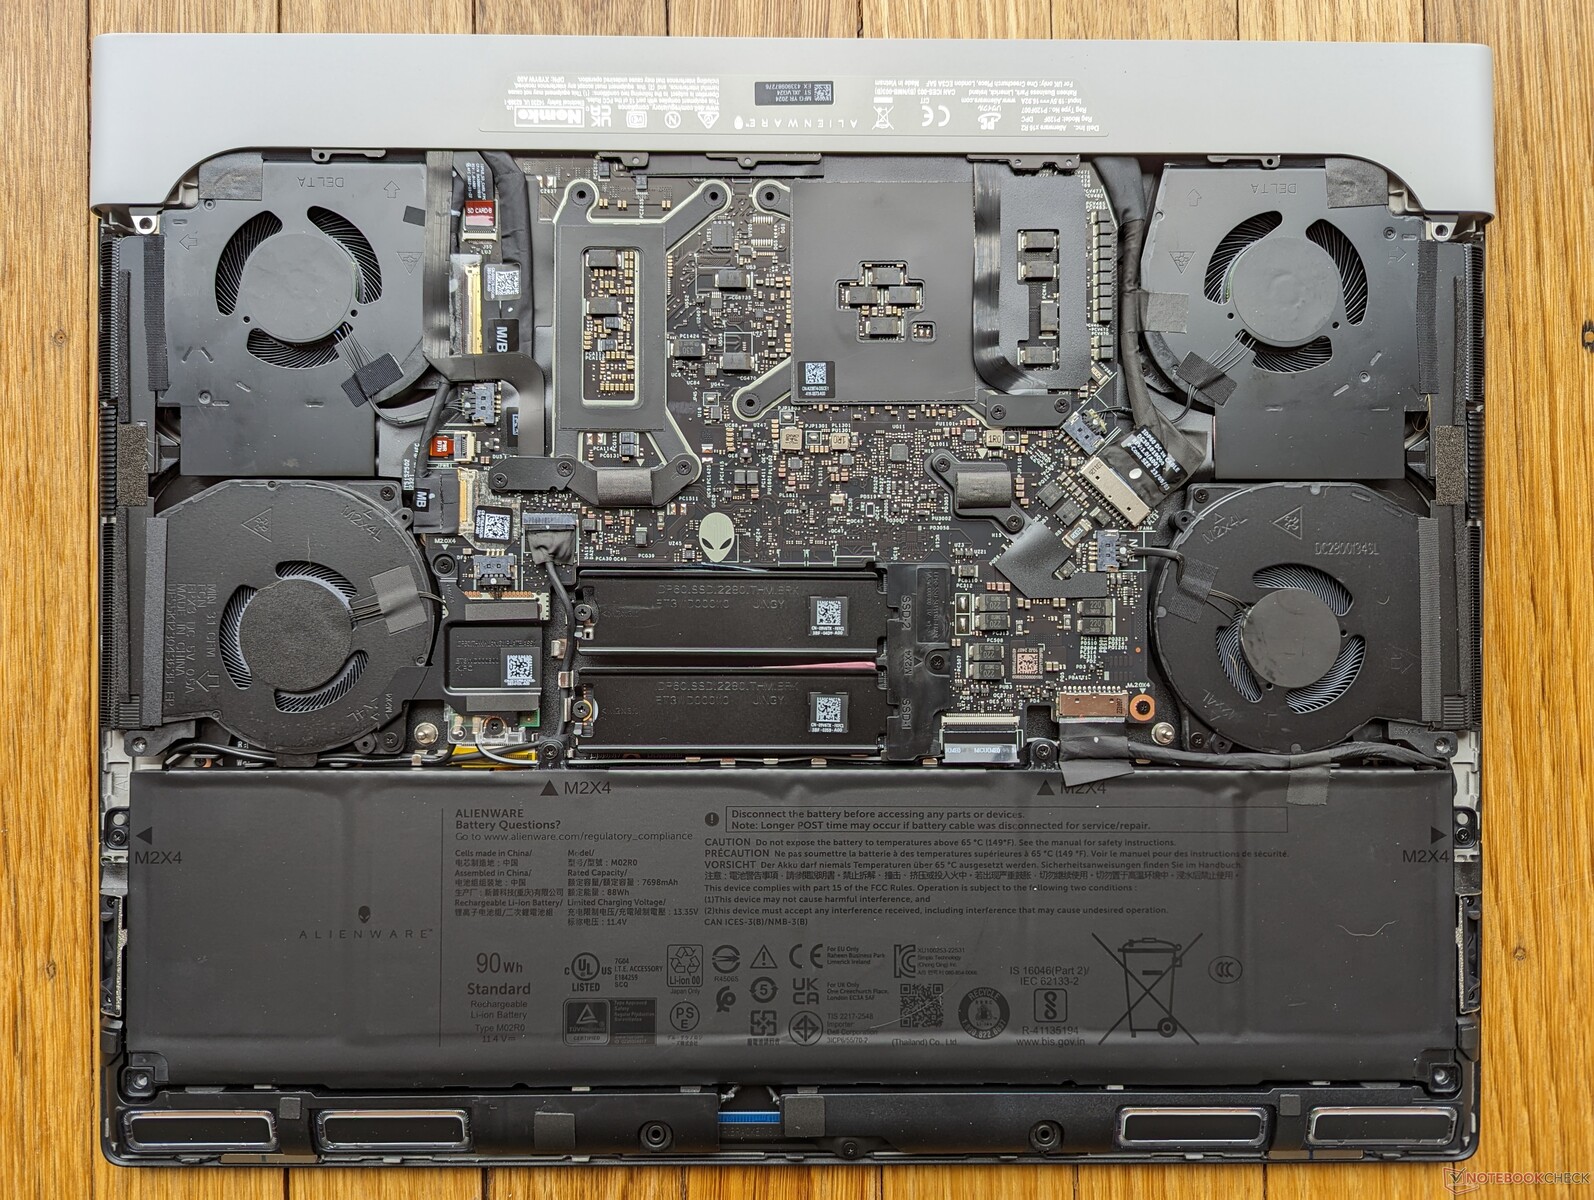
Konserwacja

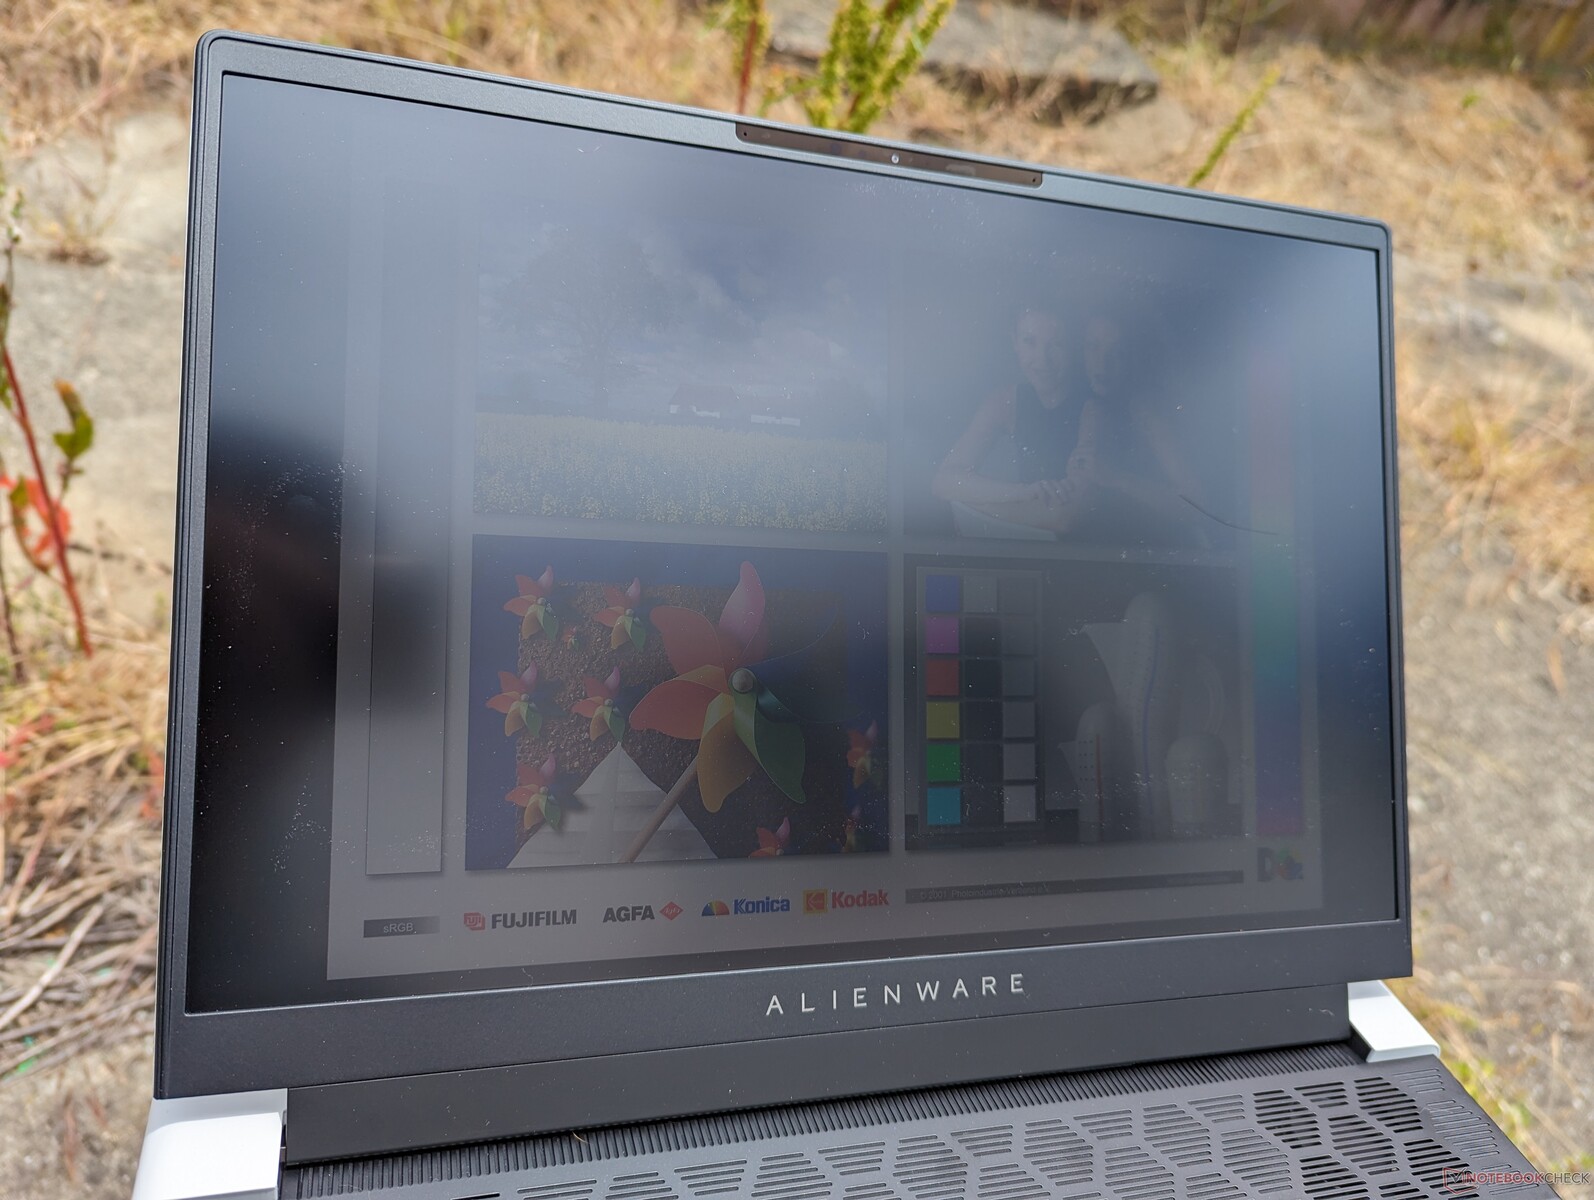
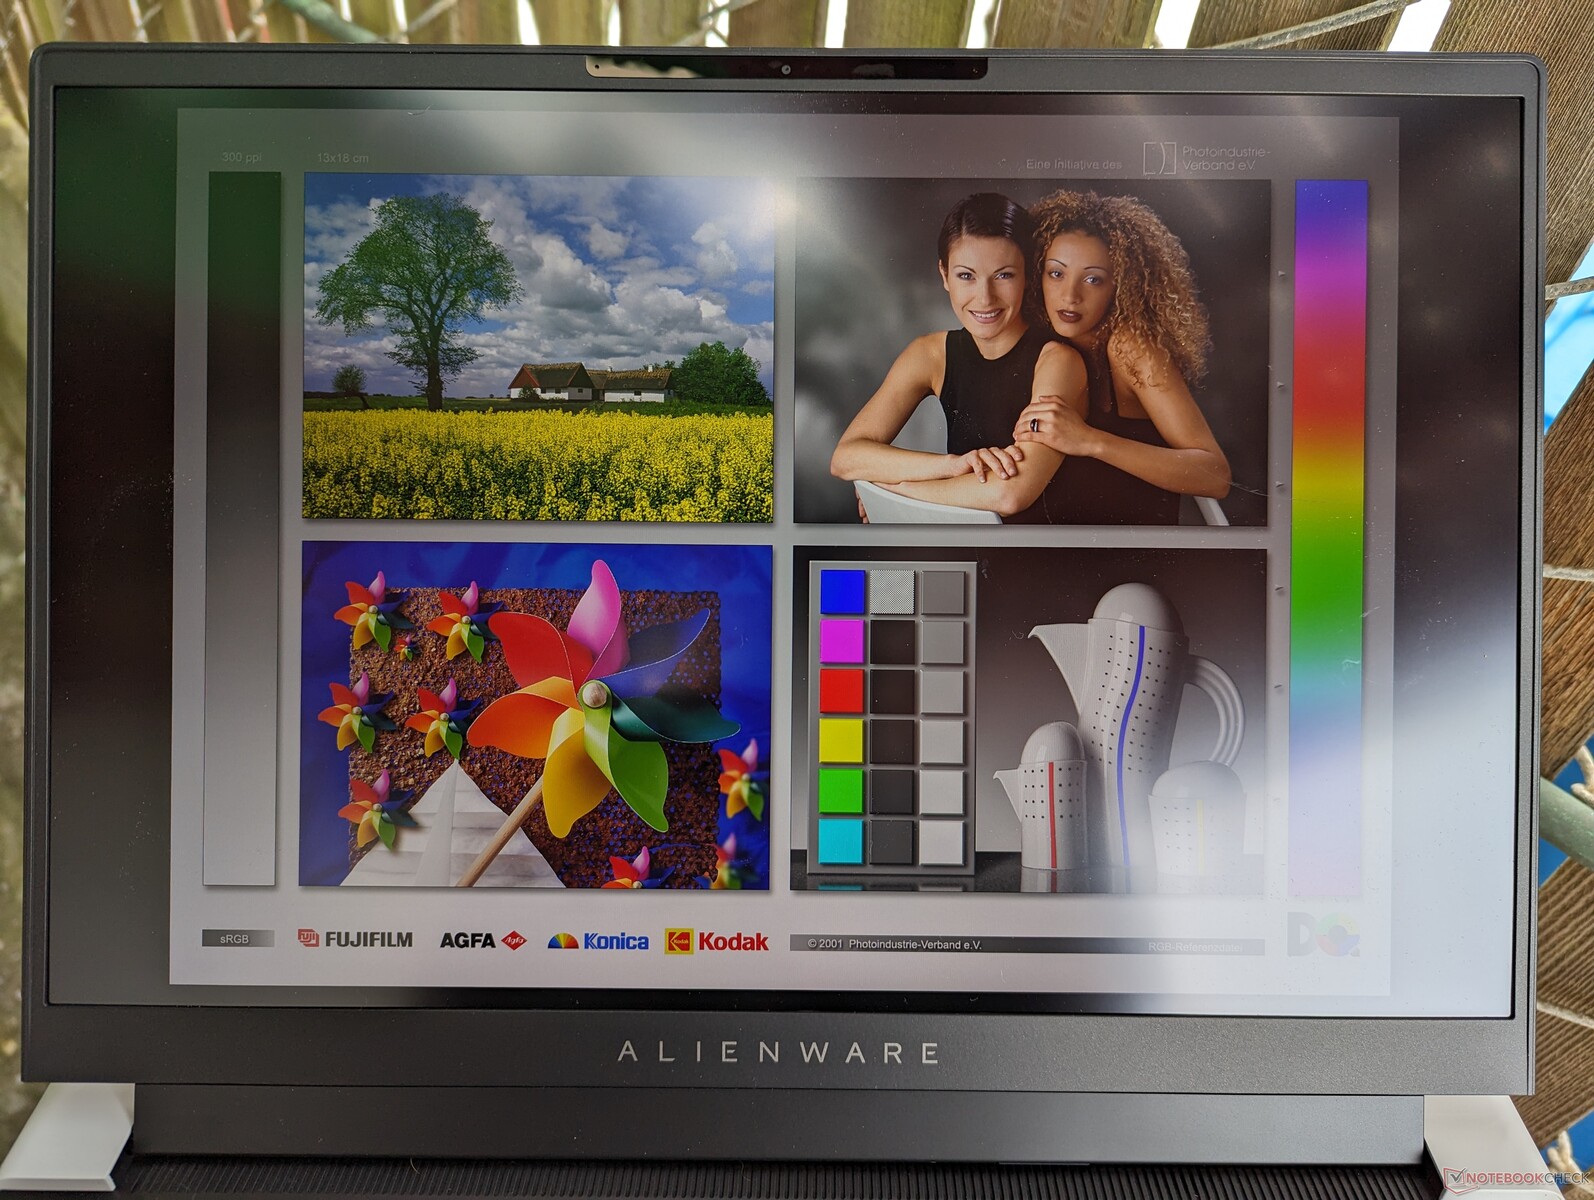
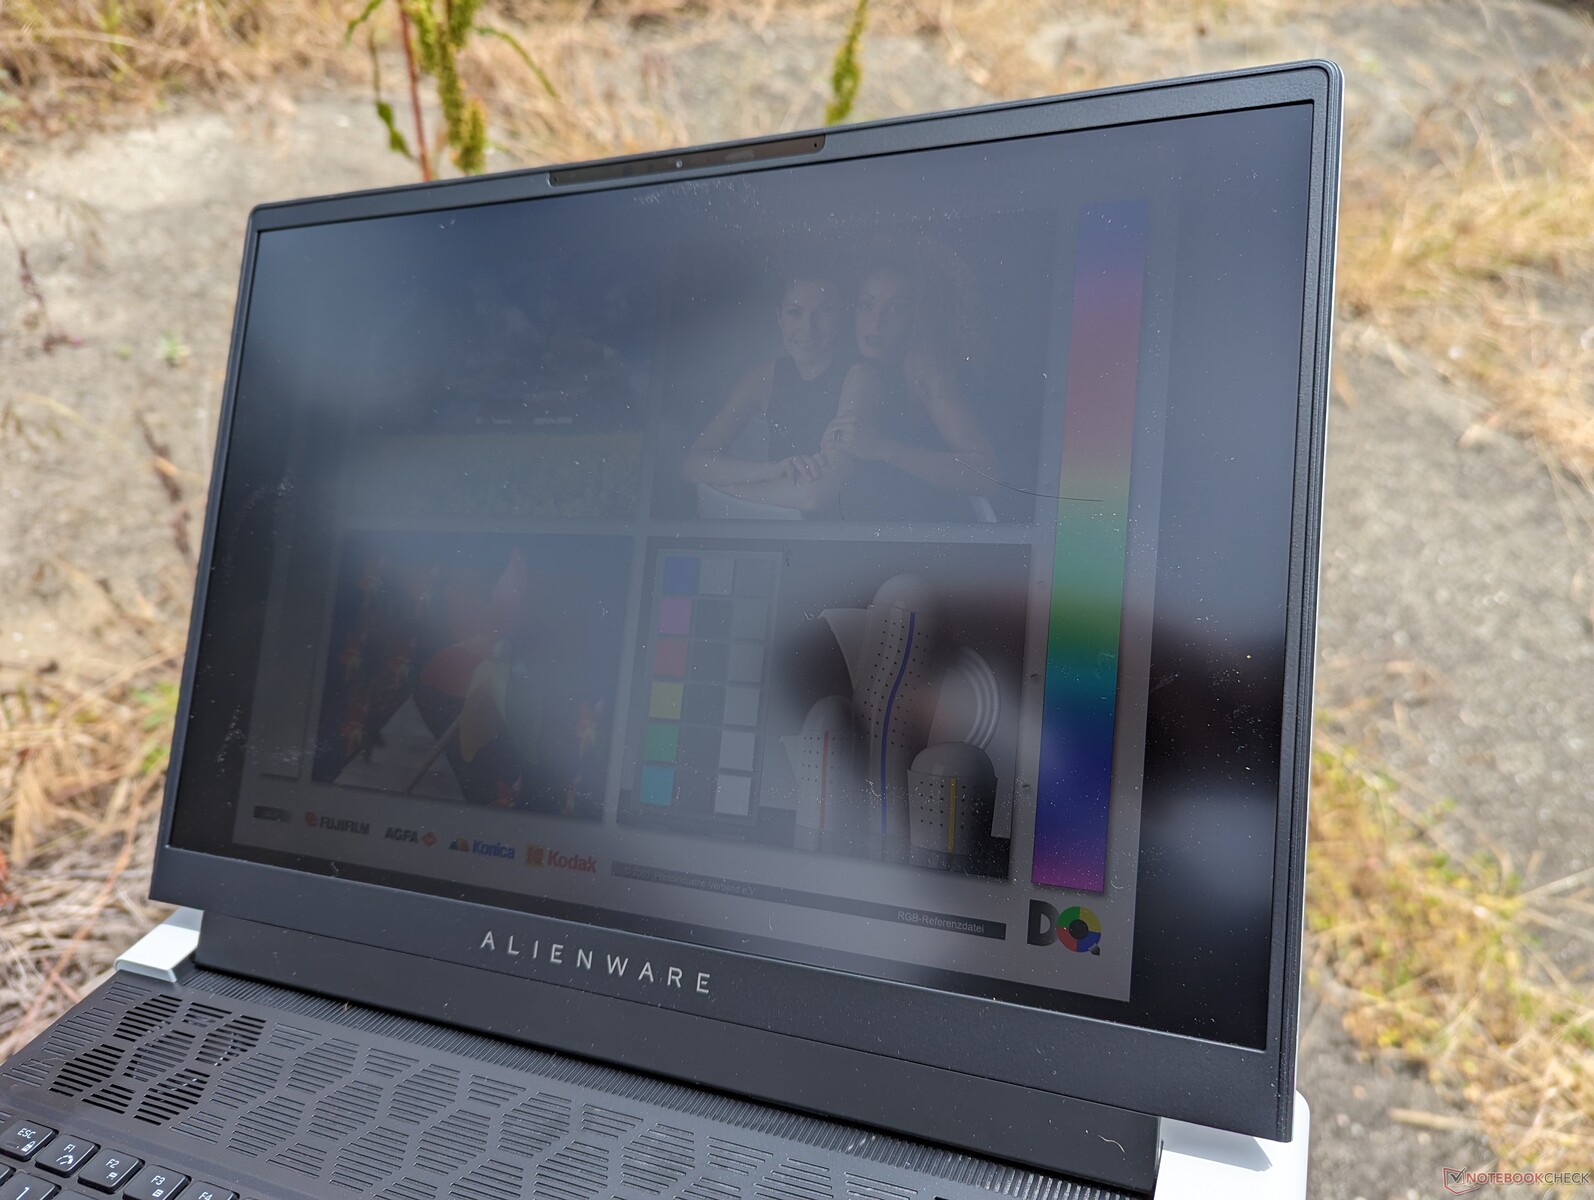
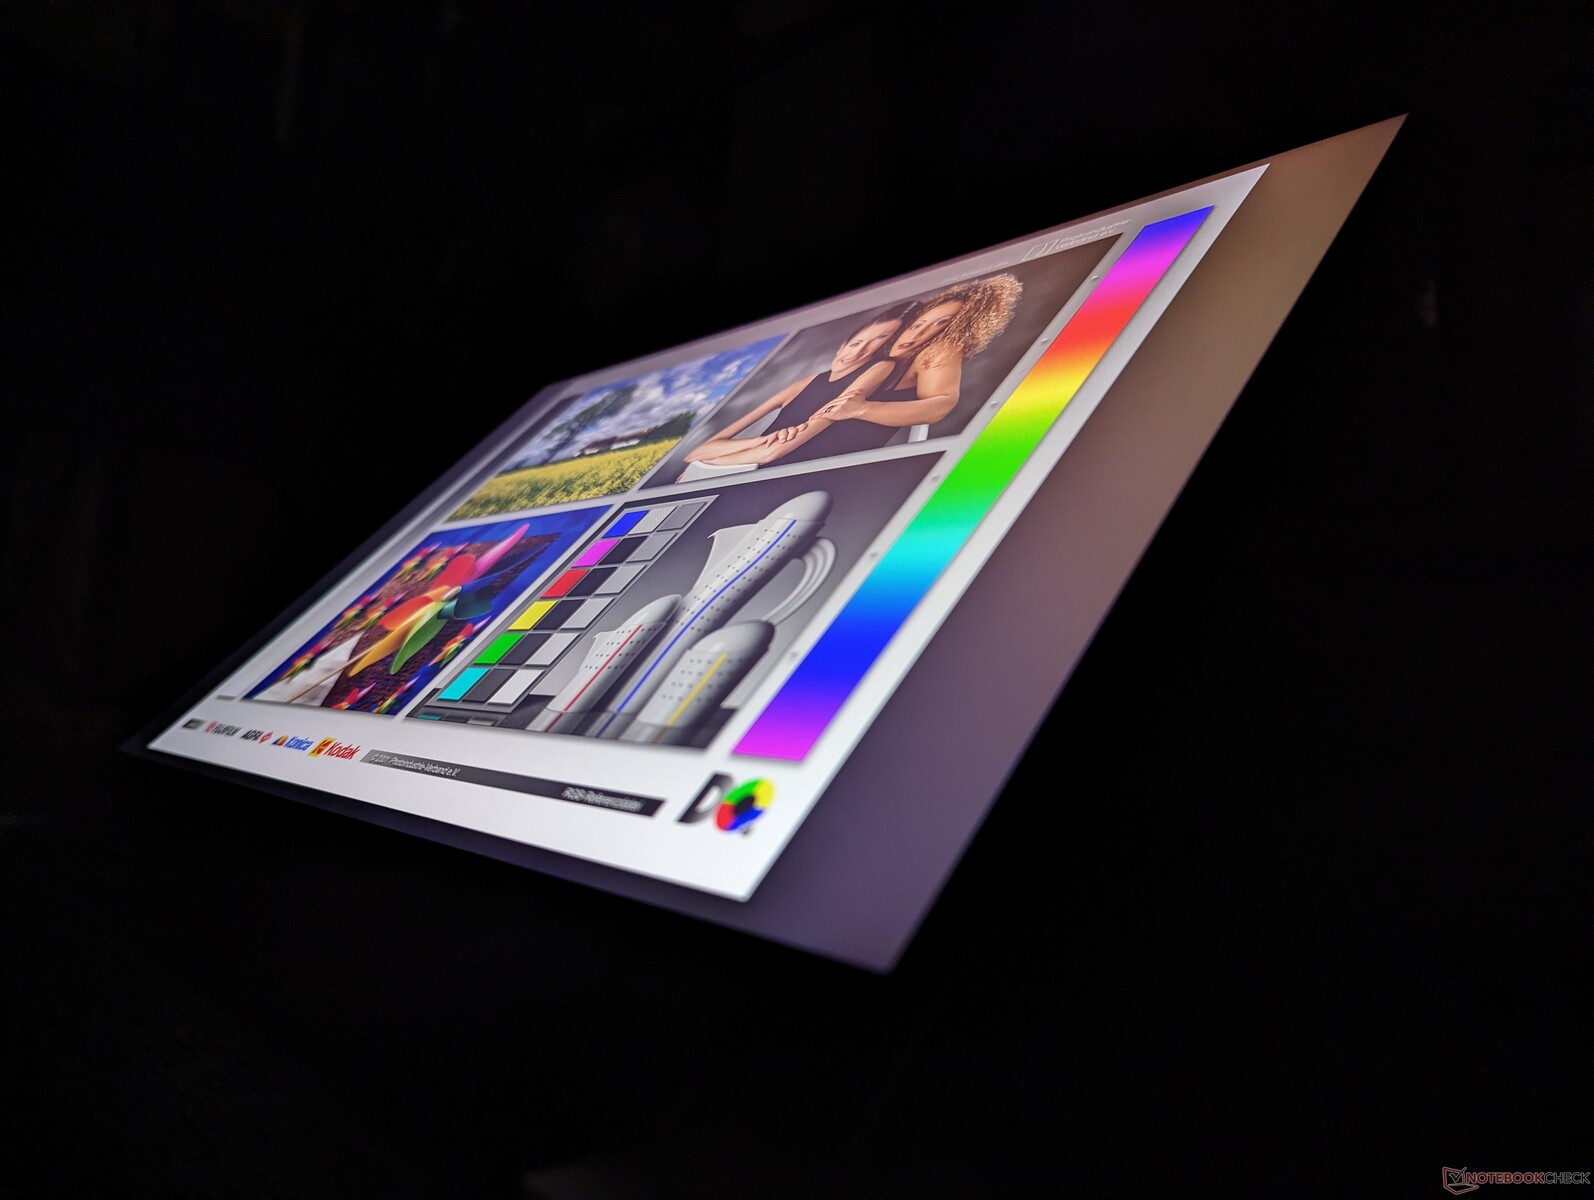
Wyświetlacz - koniec z opcją 165 Hz
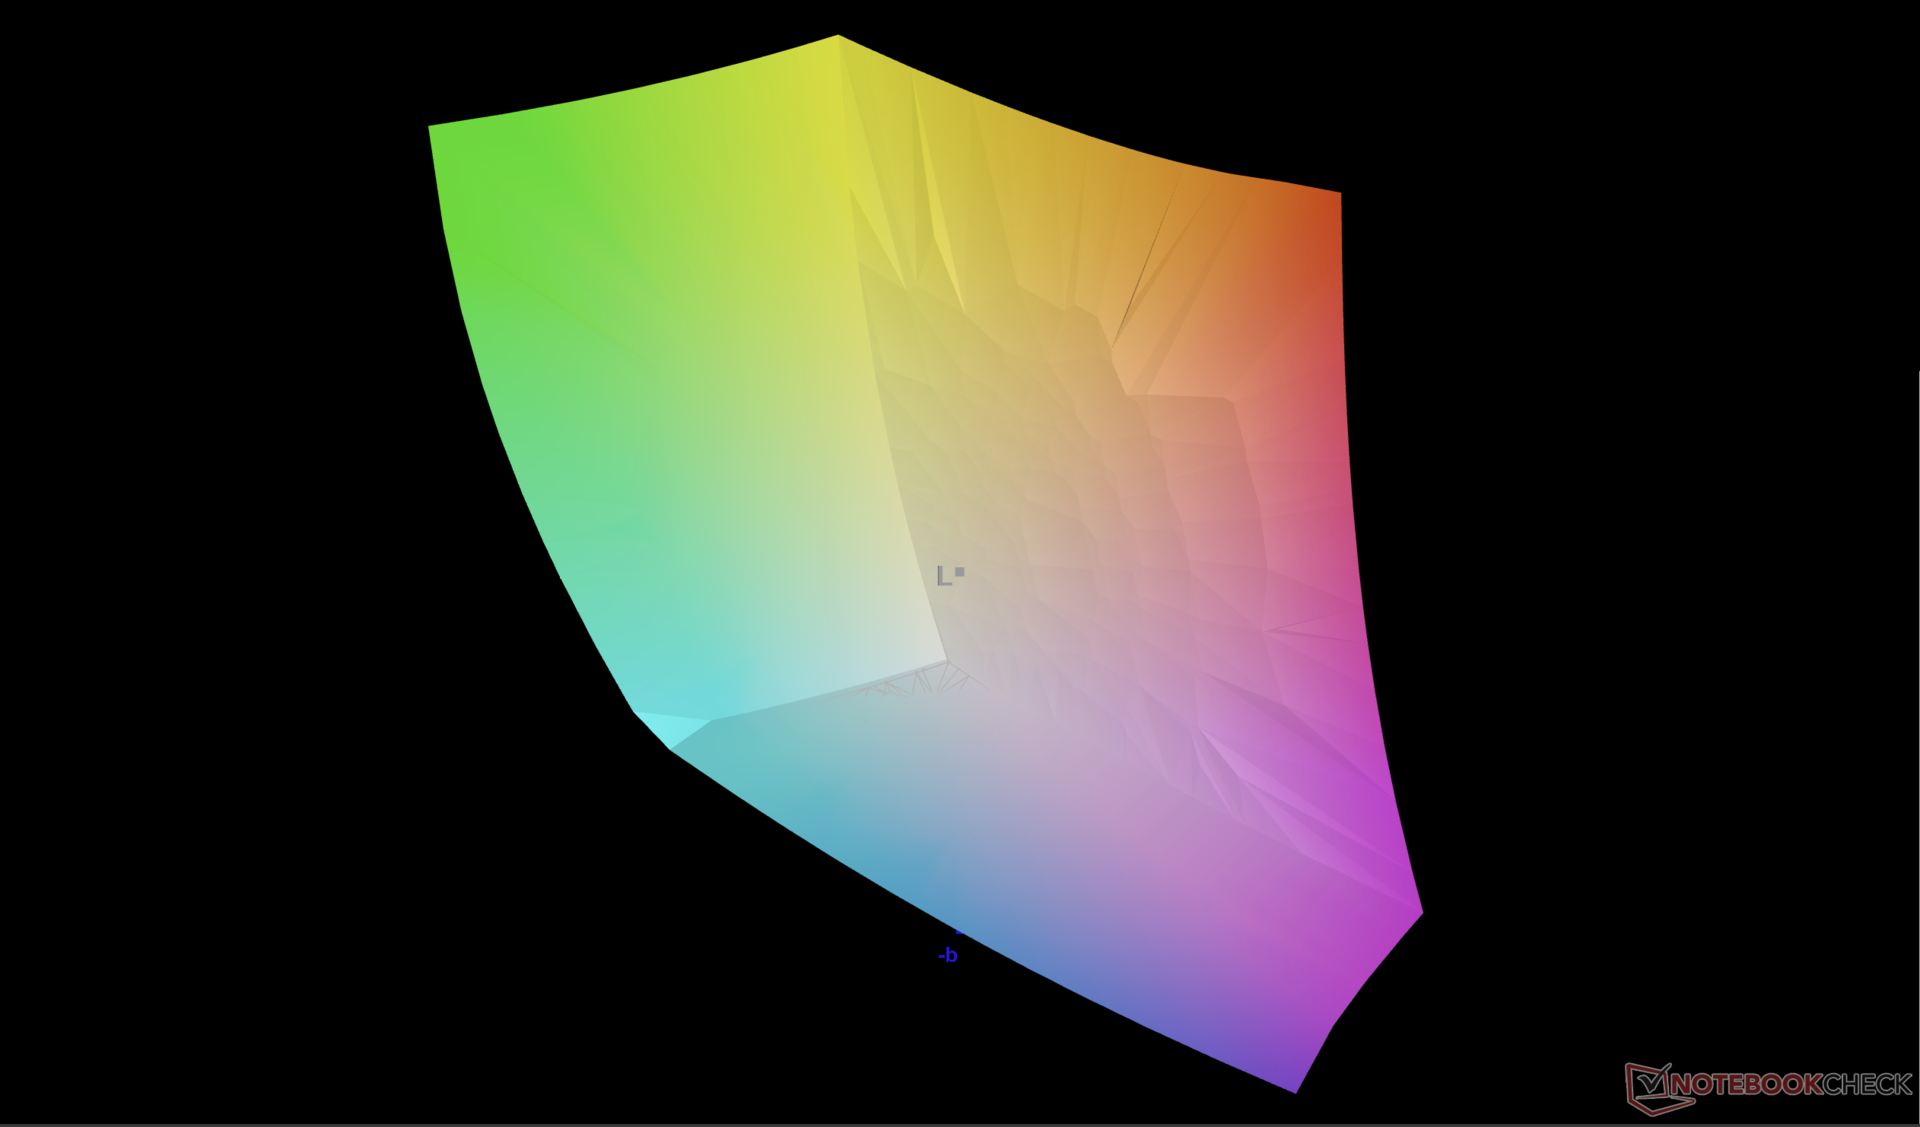
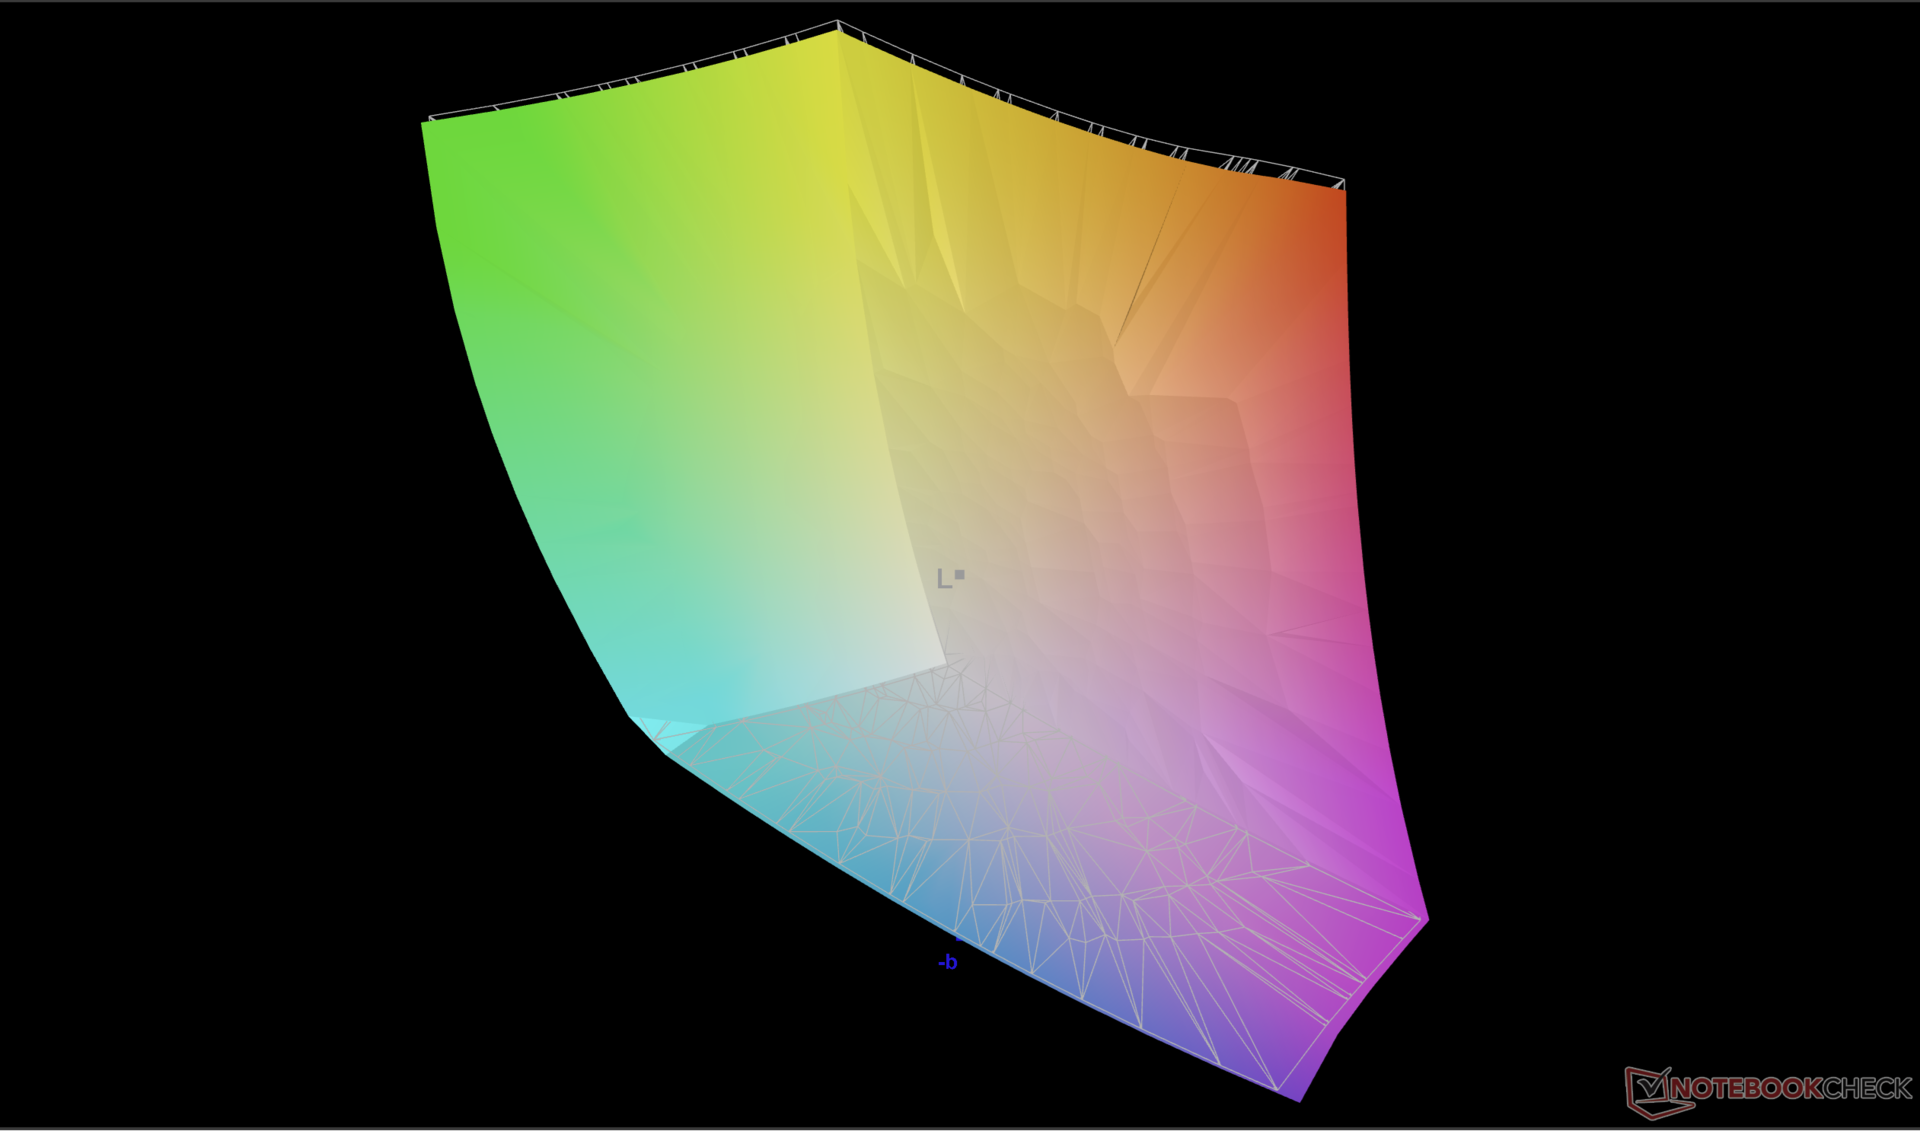
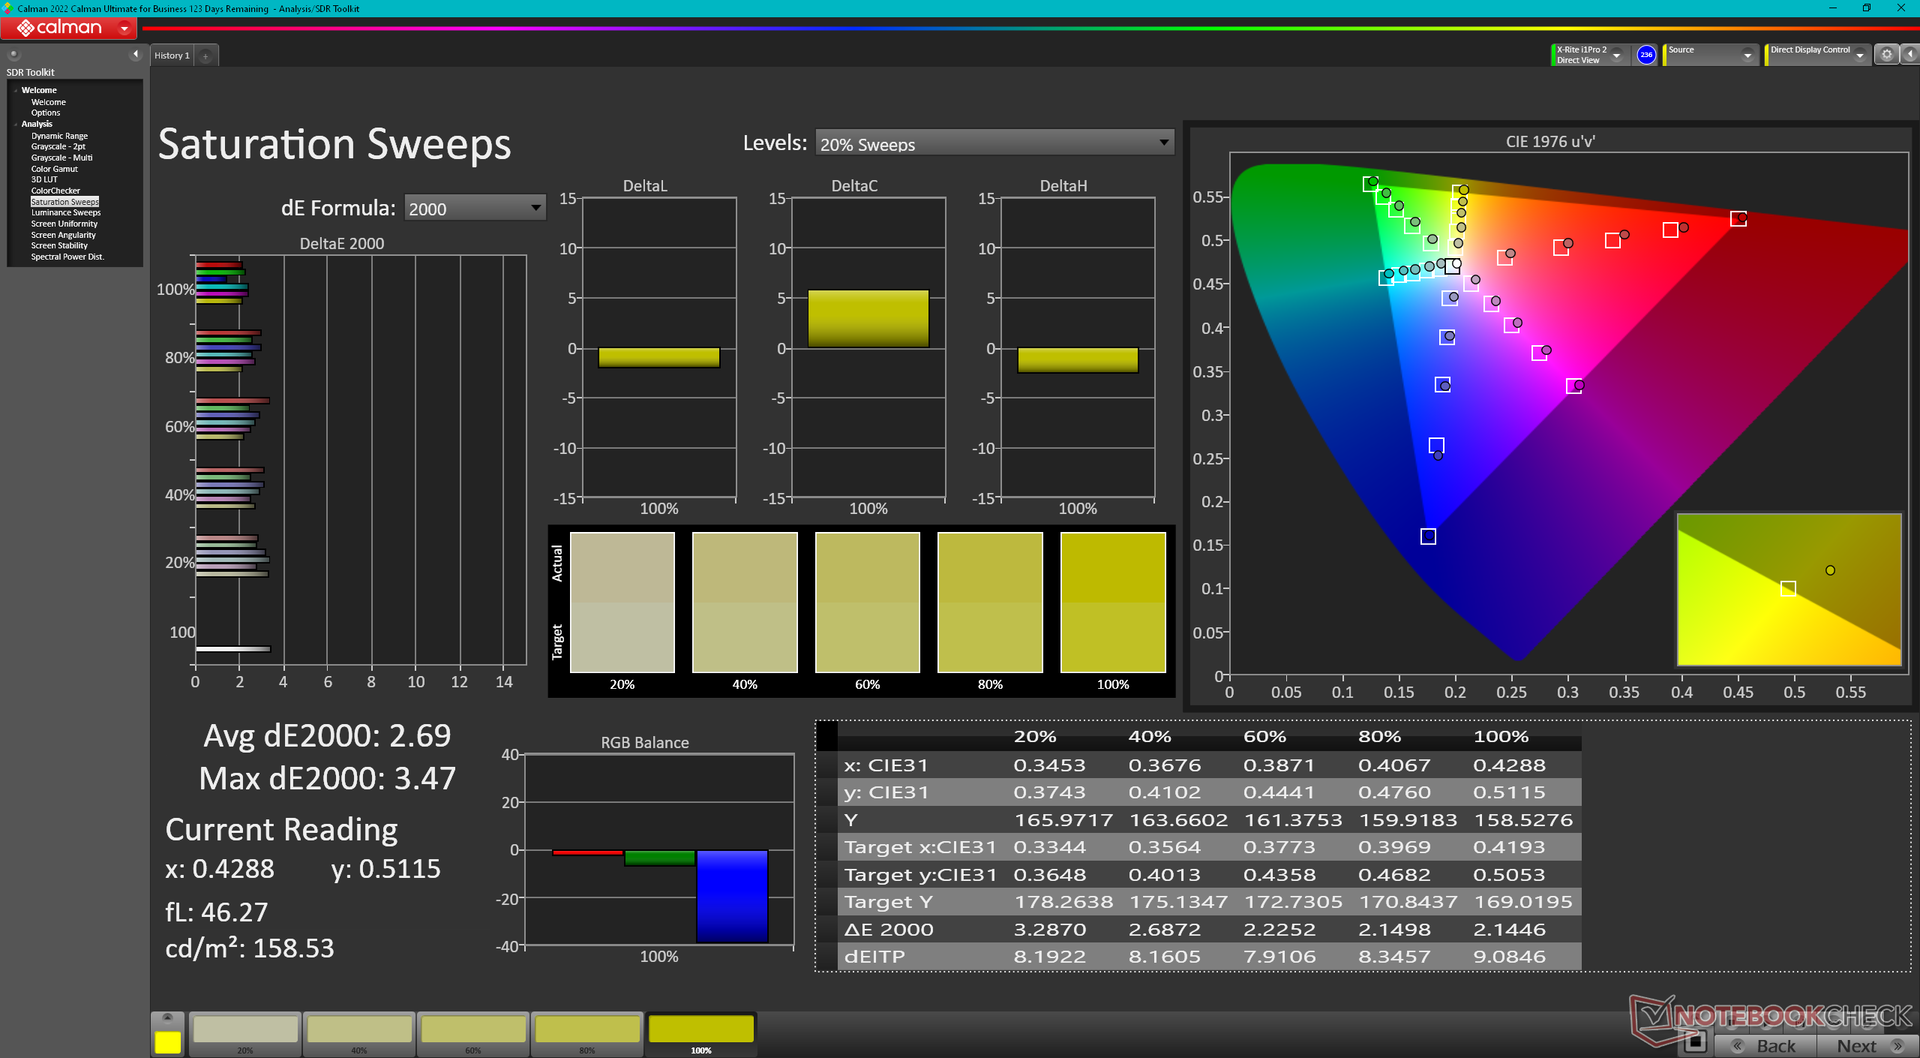
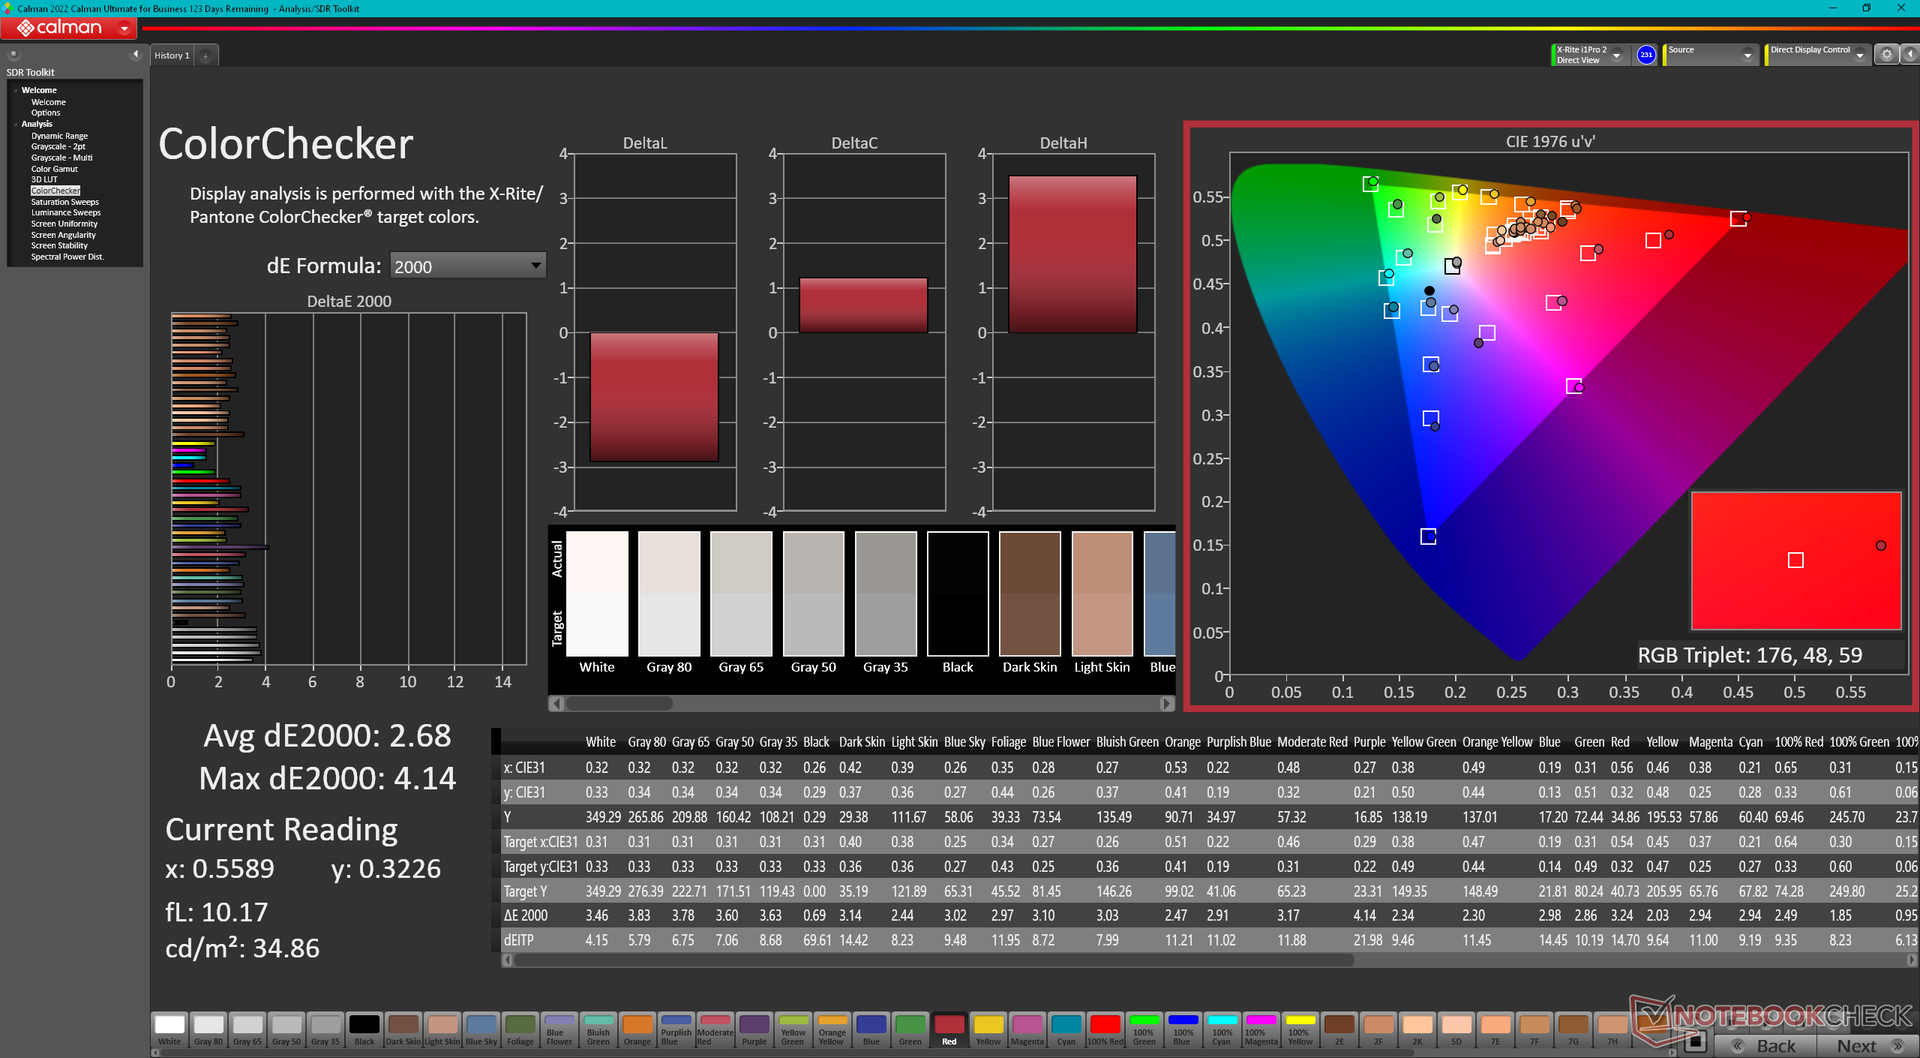
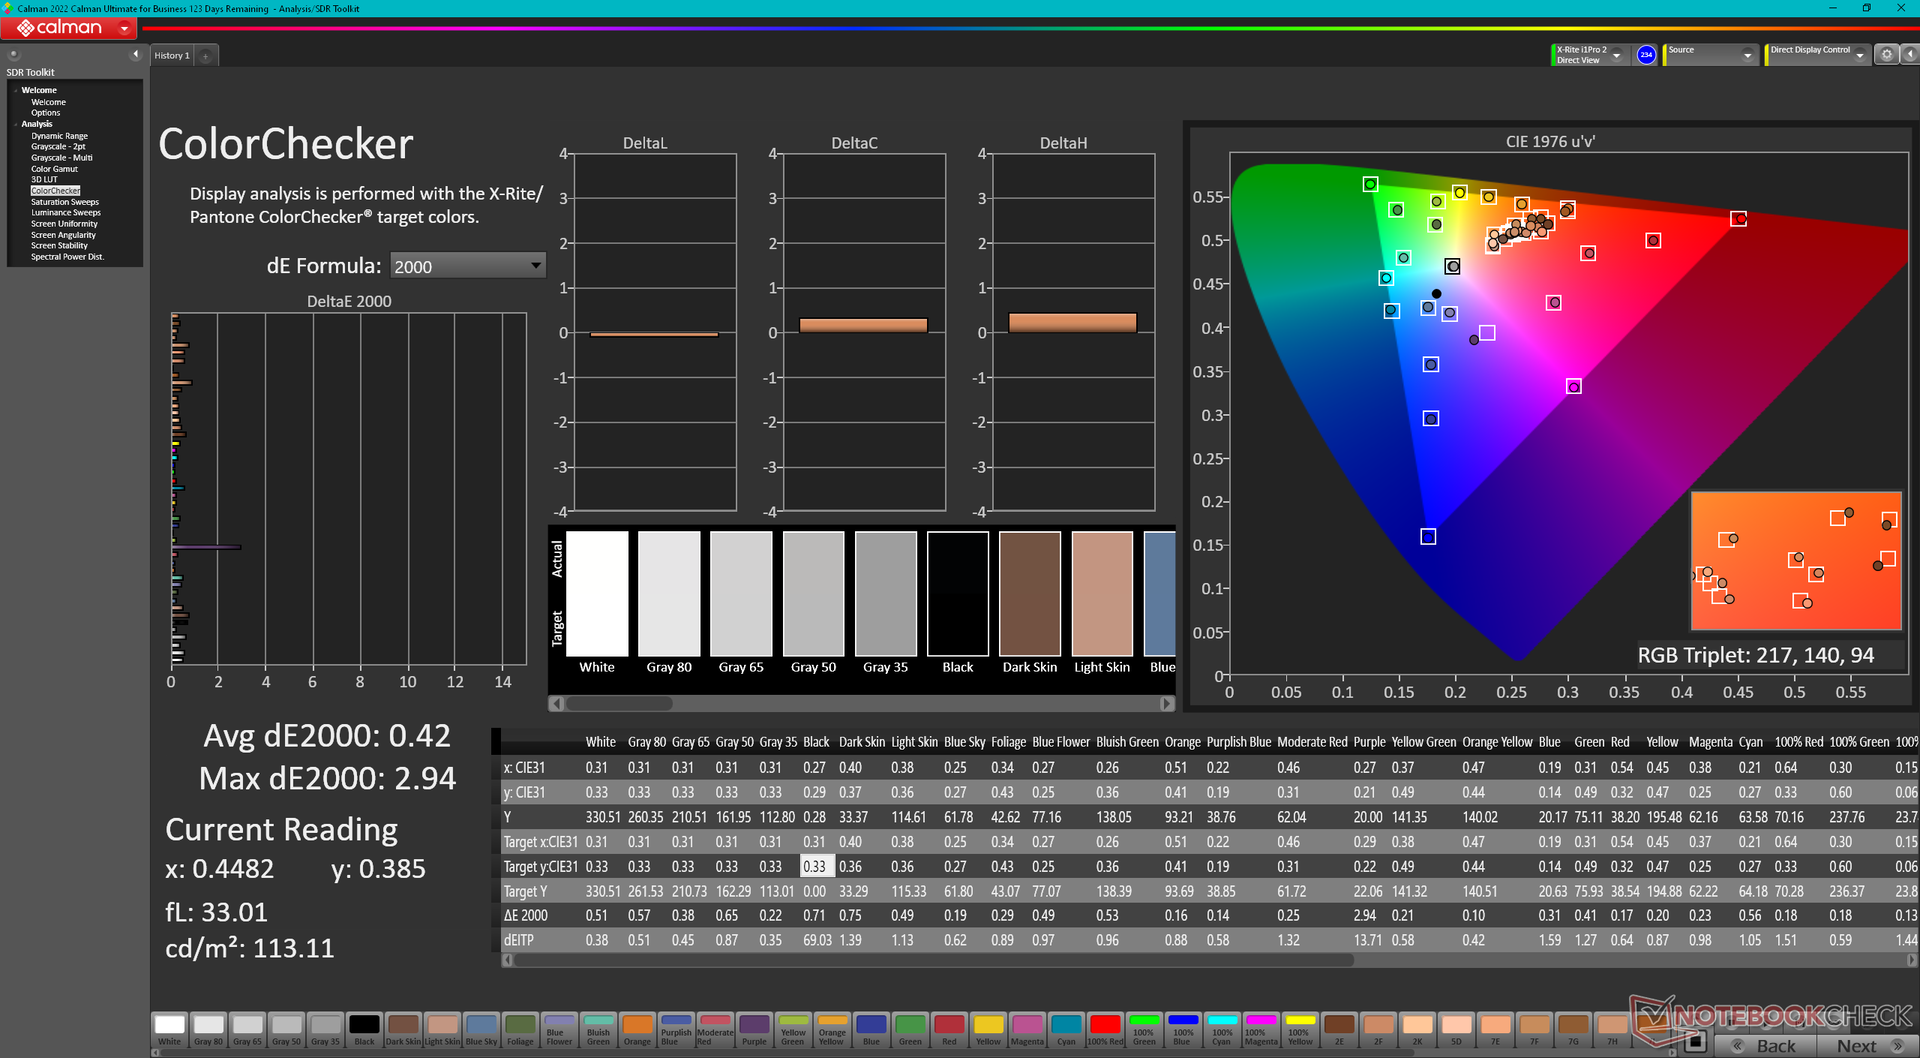
Dell wymienił panel BOE NE16NZ4 z zeszłorocznego x16 R1 na BOE B160QAN z tegorocznego x16 R2. Oba panele są jednak niemal identyczne pod względem odwzorowania kolorów, czasu reakcji, poziomów jasności i kontrastu, zapewniając zasadniczo identyczne wrażenia wizualne.
Natywną częstotliwość odświeżania można ustawić na 240 Hz lub 60 Hz bez zmiennych opcji. G-Sync jest obsługiwany tylko w trybie dGPU, a nie w trybie Optimus.
Użytkownicy mogą skonfigurować dwa wyświetlacze, jak pokazano poniżej, podczas gdy x16 R1 miał trzy:
- 2560 x 1600, 240 Hz, 100% DCI-P3, G-Sync, Advanced Optimus
- 1920 x 1200, 480 Hz, 100% DCI-P3, G-Sync, Advanced Optimus


| |||||||||||||||||||||||||
rozświetlenie: 90 %
na akumulatorze: 348.4 cd/m²
kontrast: 1056:1 (czerń: 0.33 cd/m²)
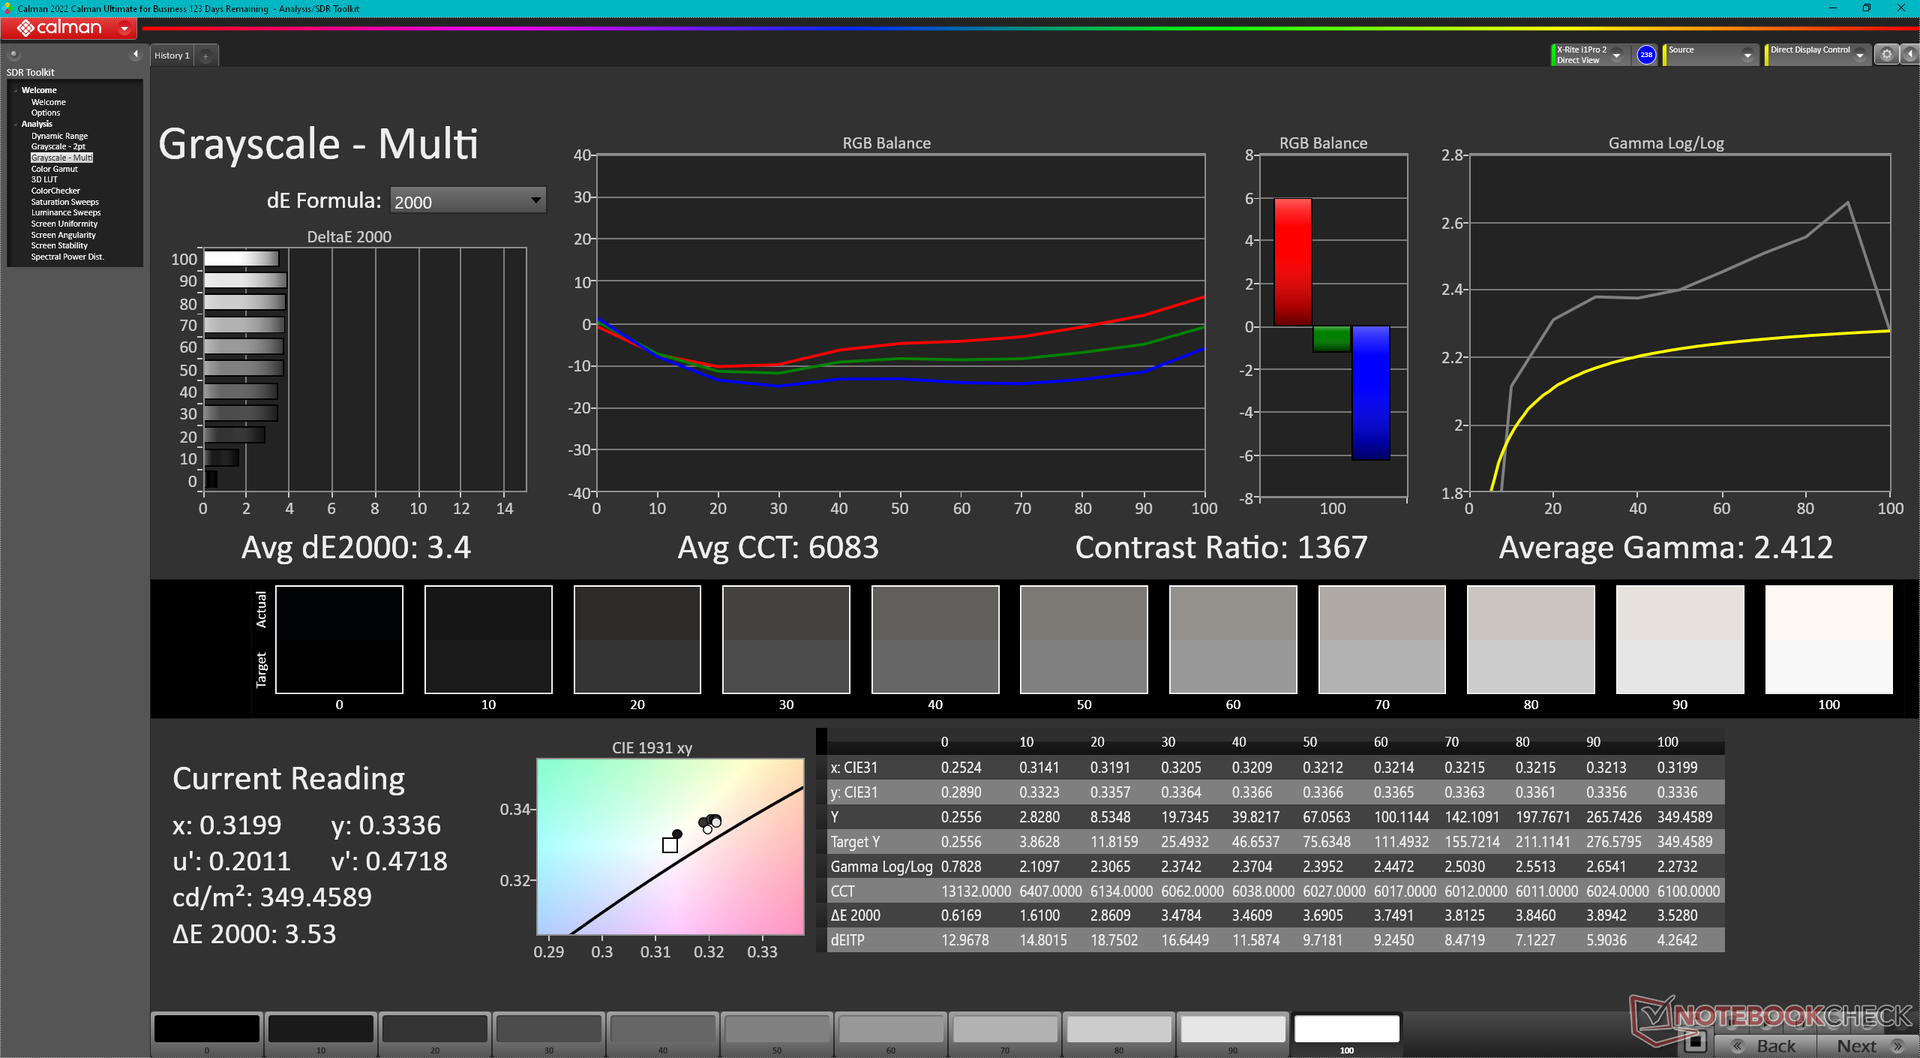
ΔE Color 2.68 | 0.5-29.43 Ø4.87, calibrated: 0.42
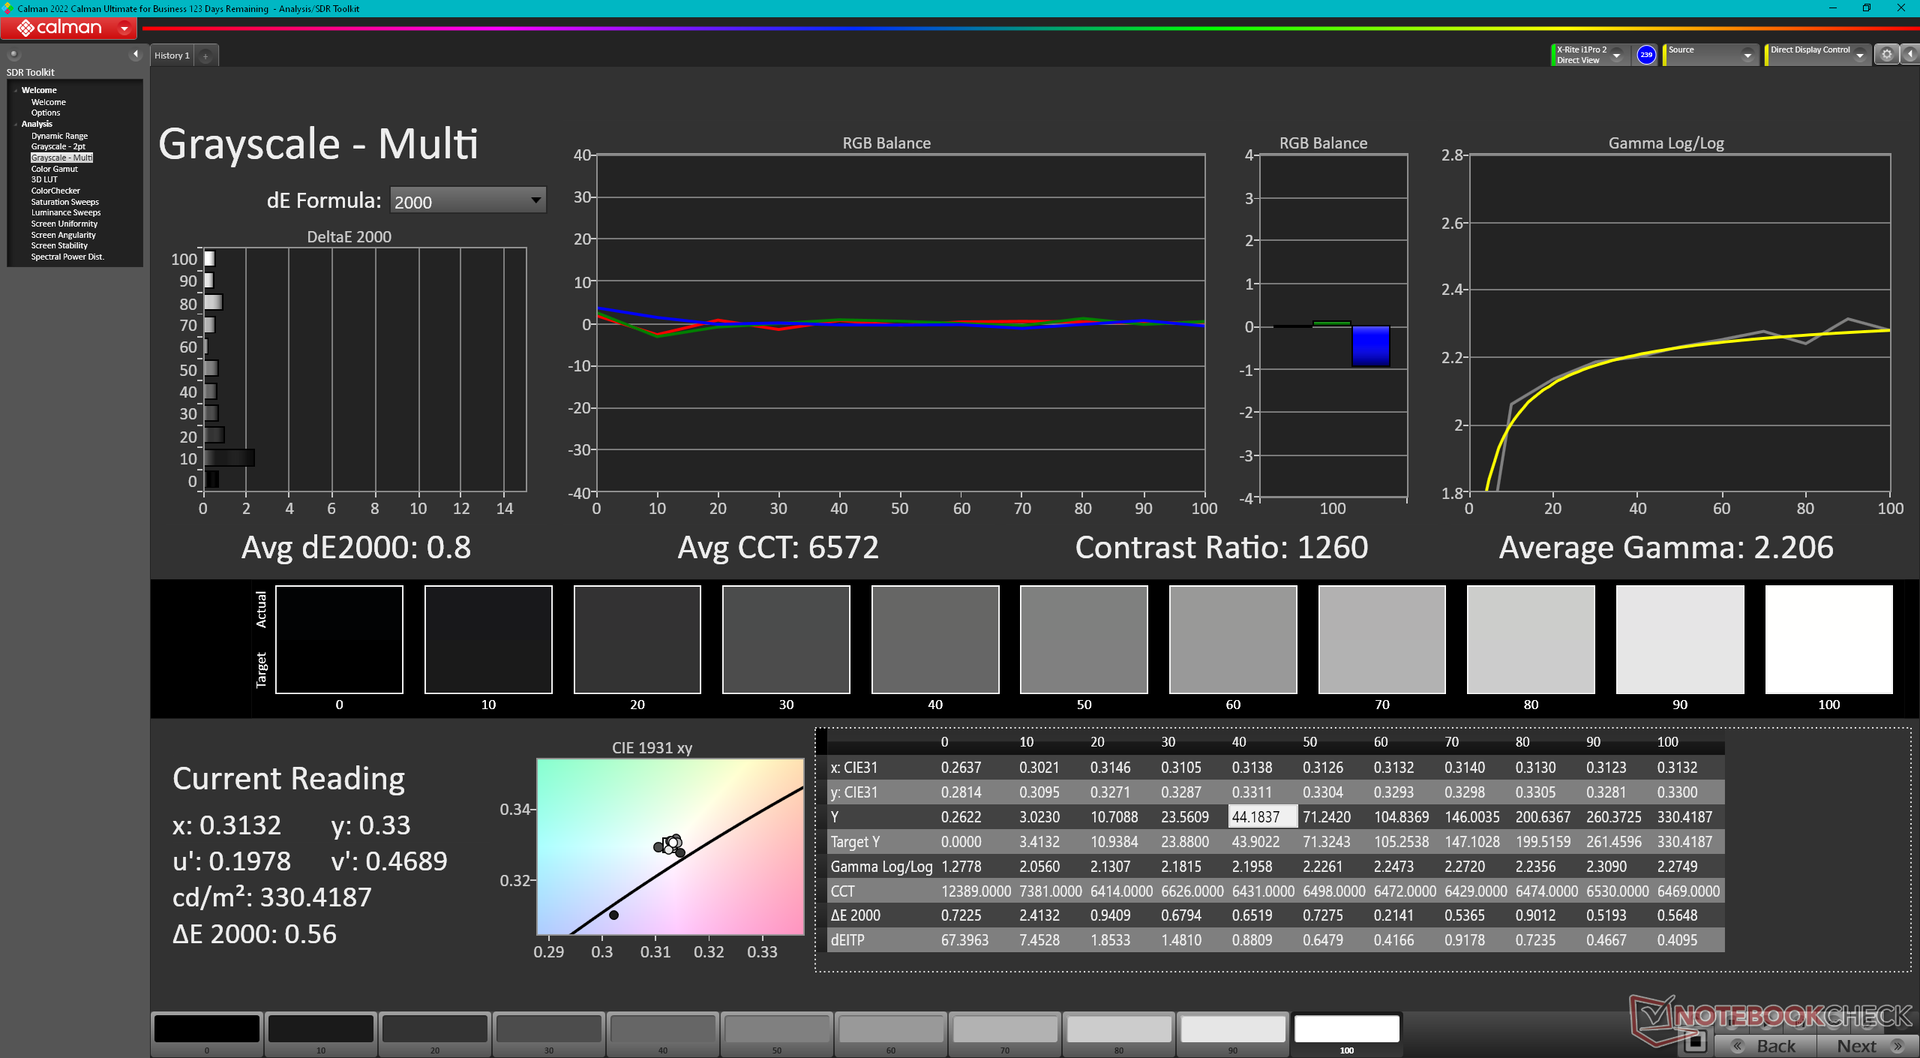
ΔE Greyscale 3.4 | 0.5-98 Ø5.1
88.8% AdobeRGB 1998 (Argyll 2.2.0 3D)
100% sRGB (Argyll 2.2.0 3D)
98.3% Display P3 (Argyll 2.2.0 3D)
Gamma: 2.41
| Alienware x16 R2 P120F BOE B160QAN, IPS, 2560x1600, 16" | Alienware x16 R1 BOE NE16NZ4, IPS, 2560x1600, 16" | Alienware m16 R2 BOE NE16NYH, IPS, 2560x1600, 16" | Asus ROG Strix Scar 16 G634JZR BOE NE160QDM-NM7, Mini LED, 2560x1600, 16" | Lenovo Legion Pro 7 16IRX9H BOE CQ NE16QDM-NZB, IPS, 2560x1600, 16" | MSI Vector 16 HX A14V Chi Mei N160GME-GTB, IPS, 2560x1600, 16" | |
|---|---|---|---|---|---|---|
| Display | 0% | -16% | 1% | -1% | -2% | |
| Display P3 Coverage | 98.3 | 99.2 1% | 71 -28% | 99.8 2% | 98.5 0% | 95.4 -3% |
| sRGB Coverage | 100 | 100 0% | 100 0% | 100 0% | 99.9 0% | 99.7 0% |
| AdobeRGB 1998 Coverage | 88.8 | 88.6 0% | 71.4 -20% | 90.8 2% | 86.7 -2% | 85.4 -4% |
| Response Times | -32% | -29% | -31% | -99% | -46% | |
| Response Time Grey 50% / Grey 80% * | 3.9 ? | 5.1 ? -31% | 5.7 ? -46% | 5 ? -28% | 12.6 ? -223% | 5.7 ? -46% |
| Response Time Black / White * | 7.8 ? | 10.3 ? -32% | 8.7 ? -12% | 10.4 ? -33% | 5.8 ? 26% | 11.4 ? -46% |
| PWM Frequency | 2040 ? | |||||
| Screen | -13% | 5% | 16% | 21% | -27% | |
| Brightness middle | 348.4 | 302.2 -13% | 345.8 -1% | 490 41% | 487 40% | 557.2 60% |
| Brightness | 340 | 285 -16% | 337 -1% | 487 43% | 460 35% | 506 49% |
| Brightness Distribution | 90 | 89 -1% | 87 -3% | 94 4% | 88 -2% | 83 -8% |
| Black Level * | 0.33 | 0.26 21% | 0.3 9% | 0.4 -21% | 0.42 -27% | 0.41 -24% |
| Contrast | 1056 | 1162 10% | 1153 9% | 1225 16% | 1160 10% | 1359 29% |
| Colorchecker dE 2000 * | 2.68 | 1.63 39% | 1.99 26% | 1.08 60% | 1.12 58% | 2.91 -9% |
| Colorchecker dE 2000 max. * | 4.14 | 4.13 -0% | 3.52 15% | 2.38 43% | 2.26 45% | 5.94 -43% |
| Colorchecker dE 2000 calibrated * | 0.42 | 1.17 -179% | 0.62 -48% | 0.9 -114% | 0.54 -29% | 1.63 -288% |
| Greyscale dE 2000 * | 3.4 | 2.5 26% | 2.1 38% | 1.1 68% | 1.4 59% | 3.8 -12% |
| Gamma | 2.41 91% | 2.23 99% | 2.32 95% | 2.13 103% | 2.242 98% | 2.23 99% |
| CCT | 6083 107% | 6590 99% | 6369 102% | 6724 97% | 6809 95% | 6408 101% |
| Całkowita średnia (program / ustawienia) | -15% /
-13% | -13% /
-4% | -5% /
6% | -26% /
-1% | -25% /
-25% |
* ... im mniej tym lepiej
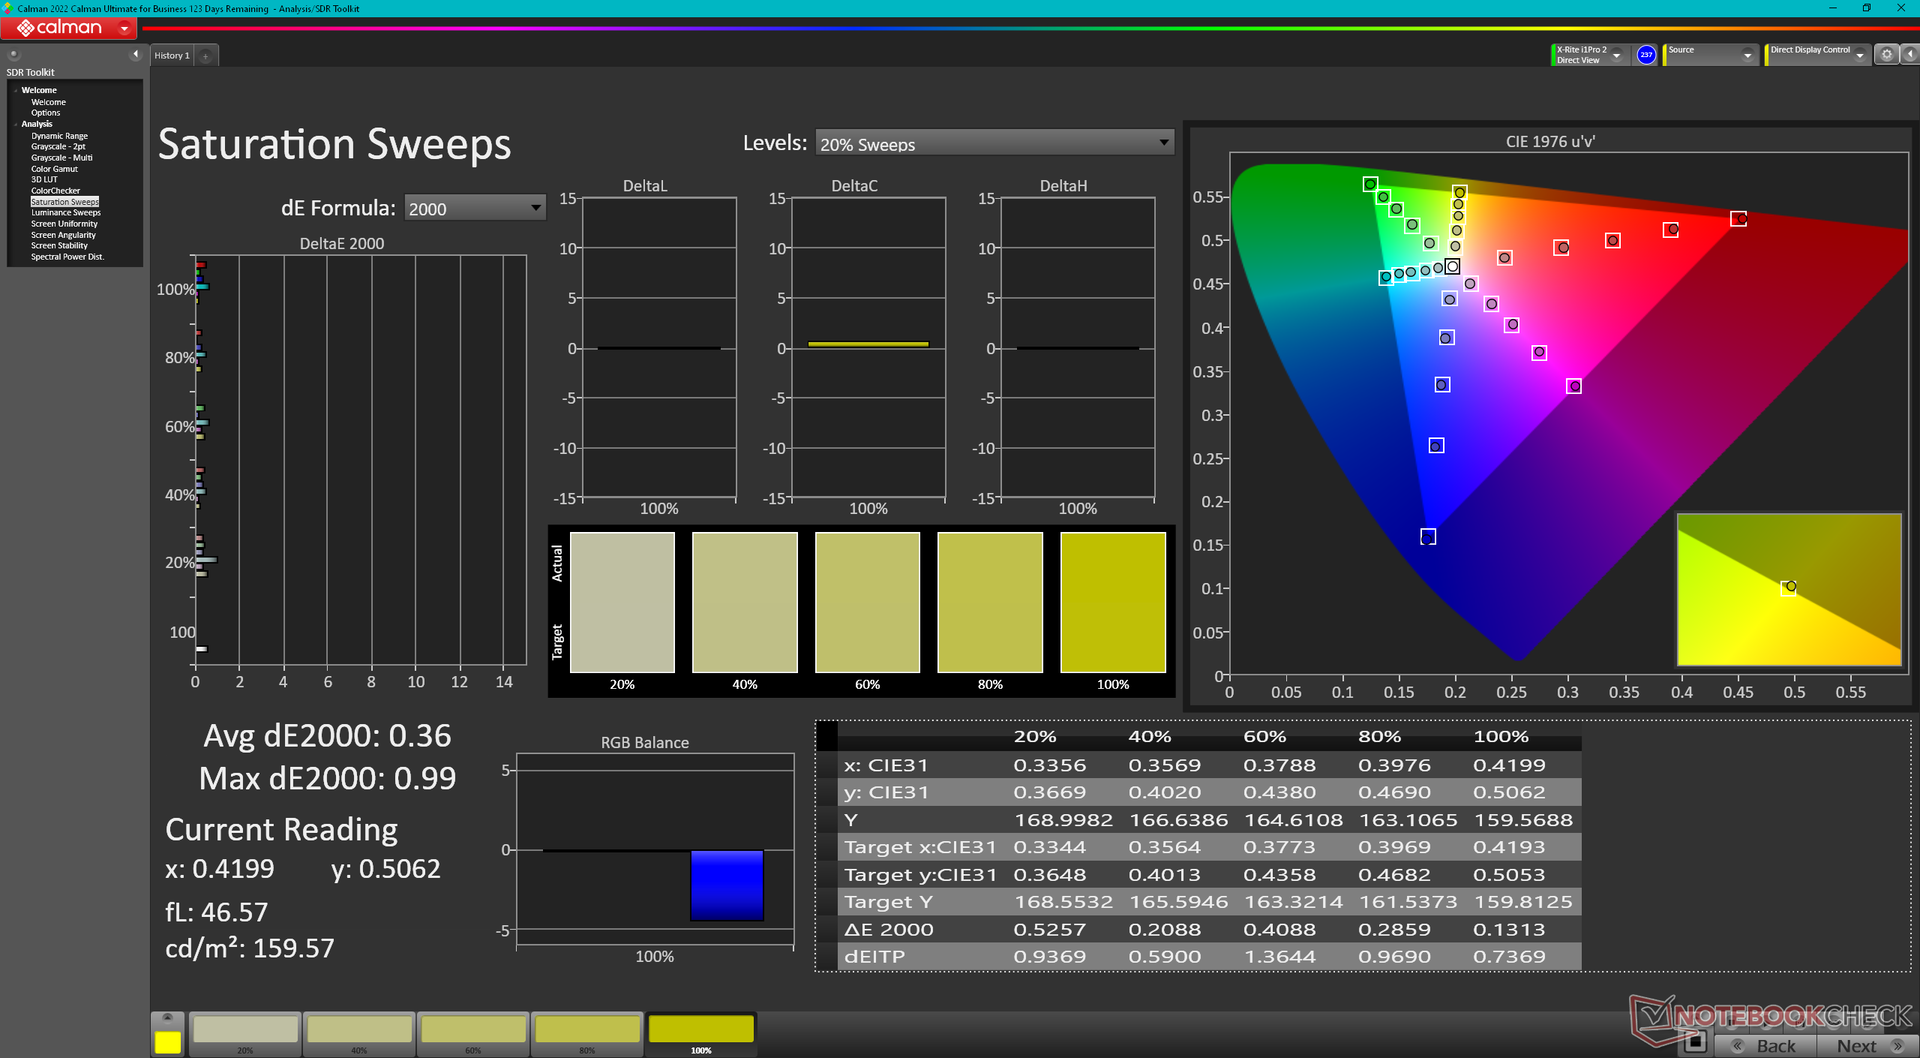
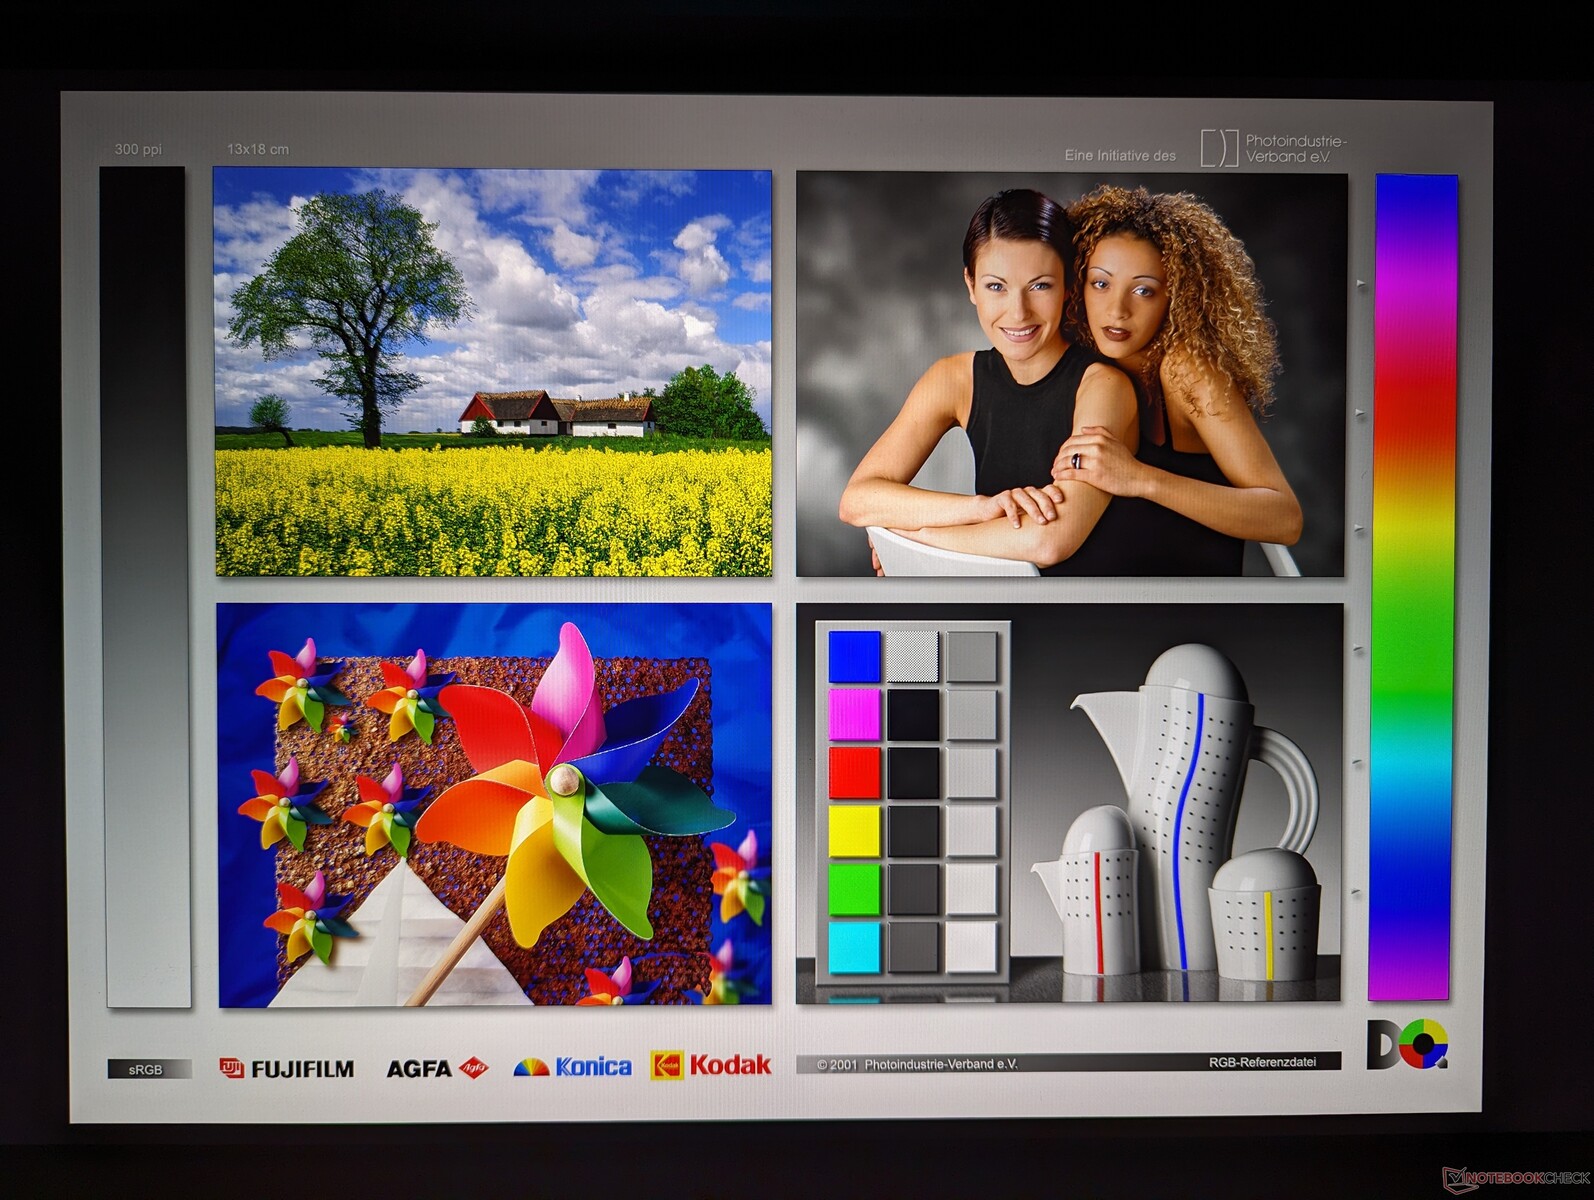
Wyświetlacz jest domyślnie ustawiony na sRGB, mimo że obsługuje pełne kolory P3. Niemniej jednak jest on przyzwoicie skalibrowany, choć temperatura barwowa jest nieco zbyt ciepła.
Wyświetl czasy reakcji
| ↔ Czas reakcji od czerni do bieli | ||
|---|---|---|
| 7.8 ms ... wzrost ↗ i spadek ↘ łącznie | ↗ 3.9 ms wzrost | 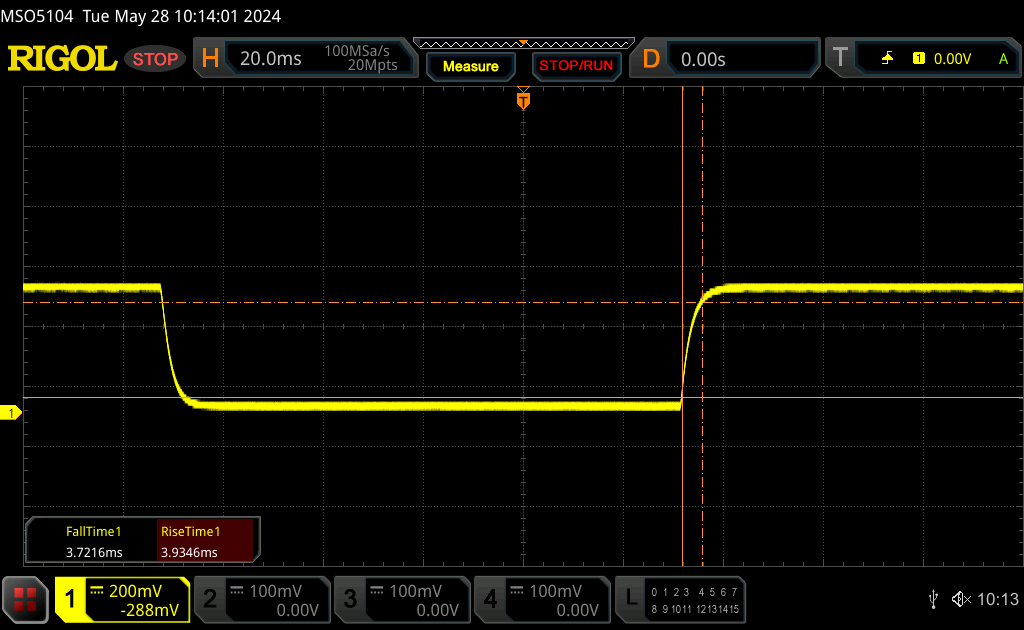 |
| ↘ 3.7 ms upadek | ||
| W naszych testach ekran wykazuje bardzo szybką reakcję i powinien bardzo dobrze nadawać się do szybkich gier. Dla porównania, wszystkie testowane urządzenia wahają się od 0.1 (minimum) do 240 (maksimum) ms. » 19 % wszystkich urządzeń jest lepszych. Oznacza to, że zmierzony czas reakcji jest lepszy od średniej wszystkich testowanych urządzeń (20.8 ms). | ||
| ↔ Czas reakcji 50% szarości do 80% szarości | ||
| 3.9 ms ... wzrost ↗ i spadek ↘ łącznie | ↗ 1.7 ms wzrost | 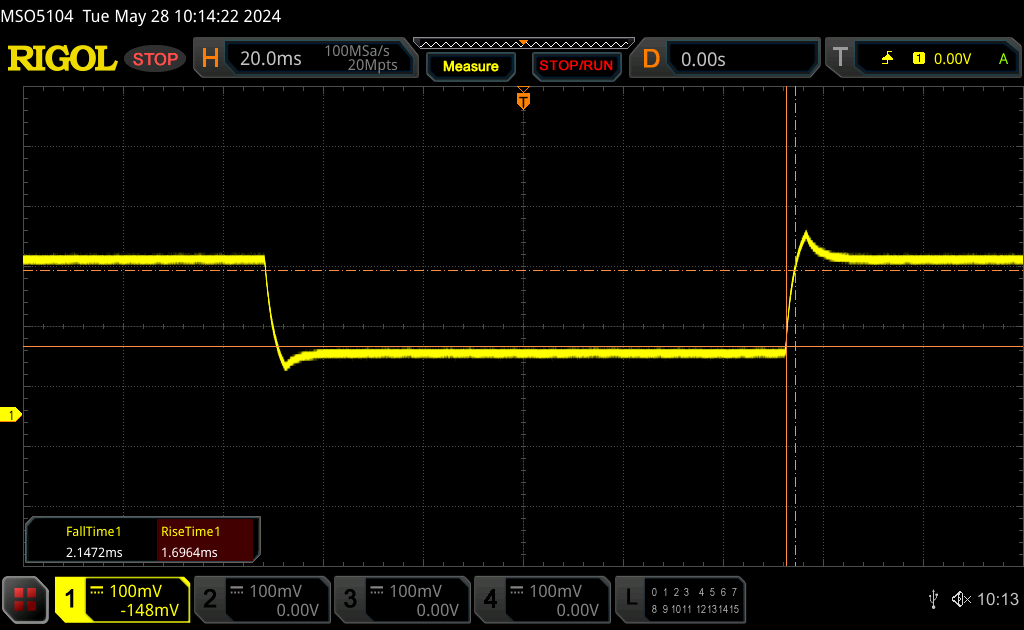 |
| ↘ 2.2 ms upadek | ||
| W naszych testach ekran wykazuje bardzo szybką reakcję i powinien bardzo dobrze nadawać się do szybkich gier. Dla porównania, wszystkie testowane urządzenia wahają się od 0.165 (minimum) do 636 (maksimum) ms. » 12 % wszystkich urządzeń jest lepszych. Oznacza to, że zmierzony czas reakcji jest lepszy od średniej wszystkich testowanych urządzeń (32.5 ms). | ||
Migotanie ekranu / PWM (modulacja szerokości impulsu)
| Migotanie ekranu/nie wykryto PWM | 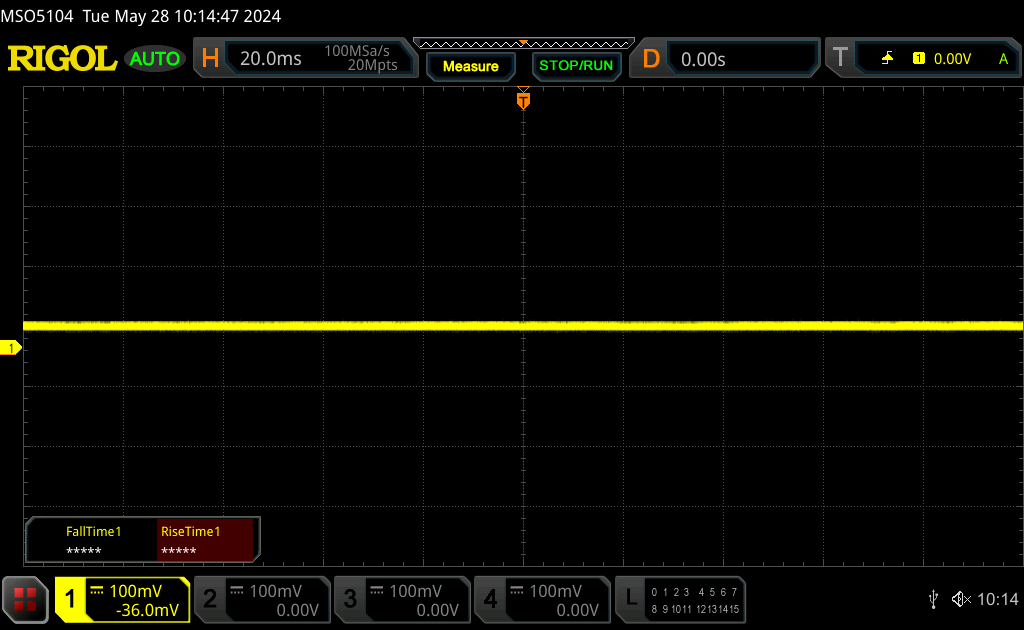 | ||
Dla porównania: 53 % wszystkich testowanych urządzeń nie używa PWM do przyciemniania wyświetlacza. Jeśli wykryto PWM, zmierzono średnio 8516 (minimum: 5 - maksimum: 343500) Hz. | |||

Wydajność - Core Ultra 9 185H vs. Core i9-13900HK
Warunki testowania
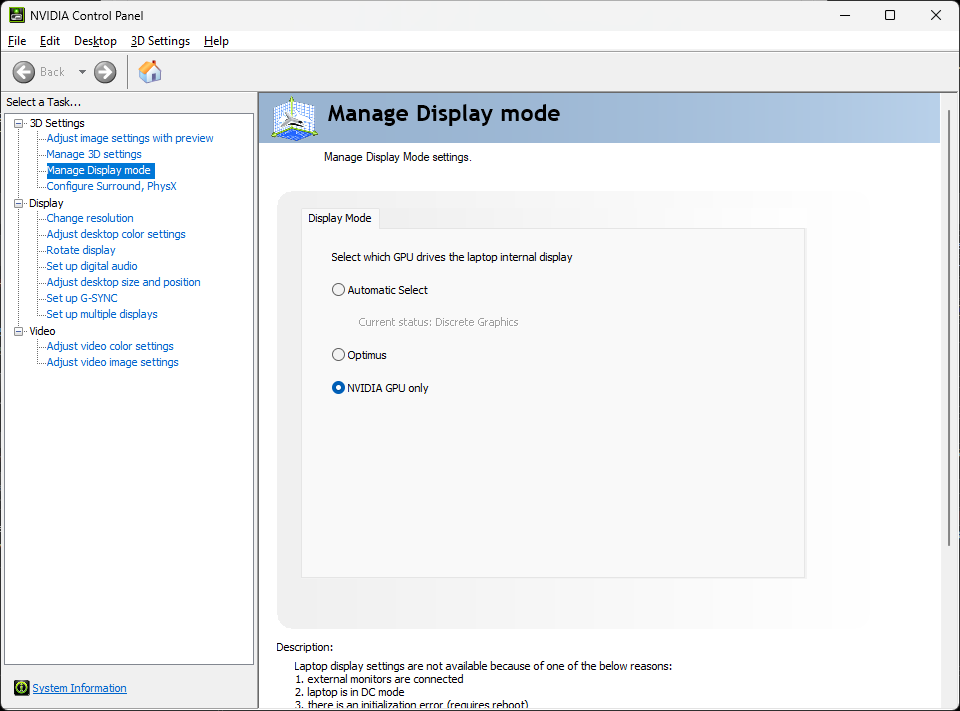
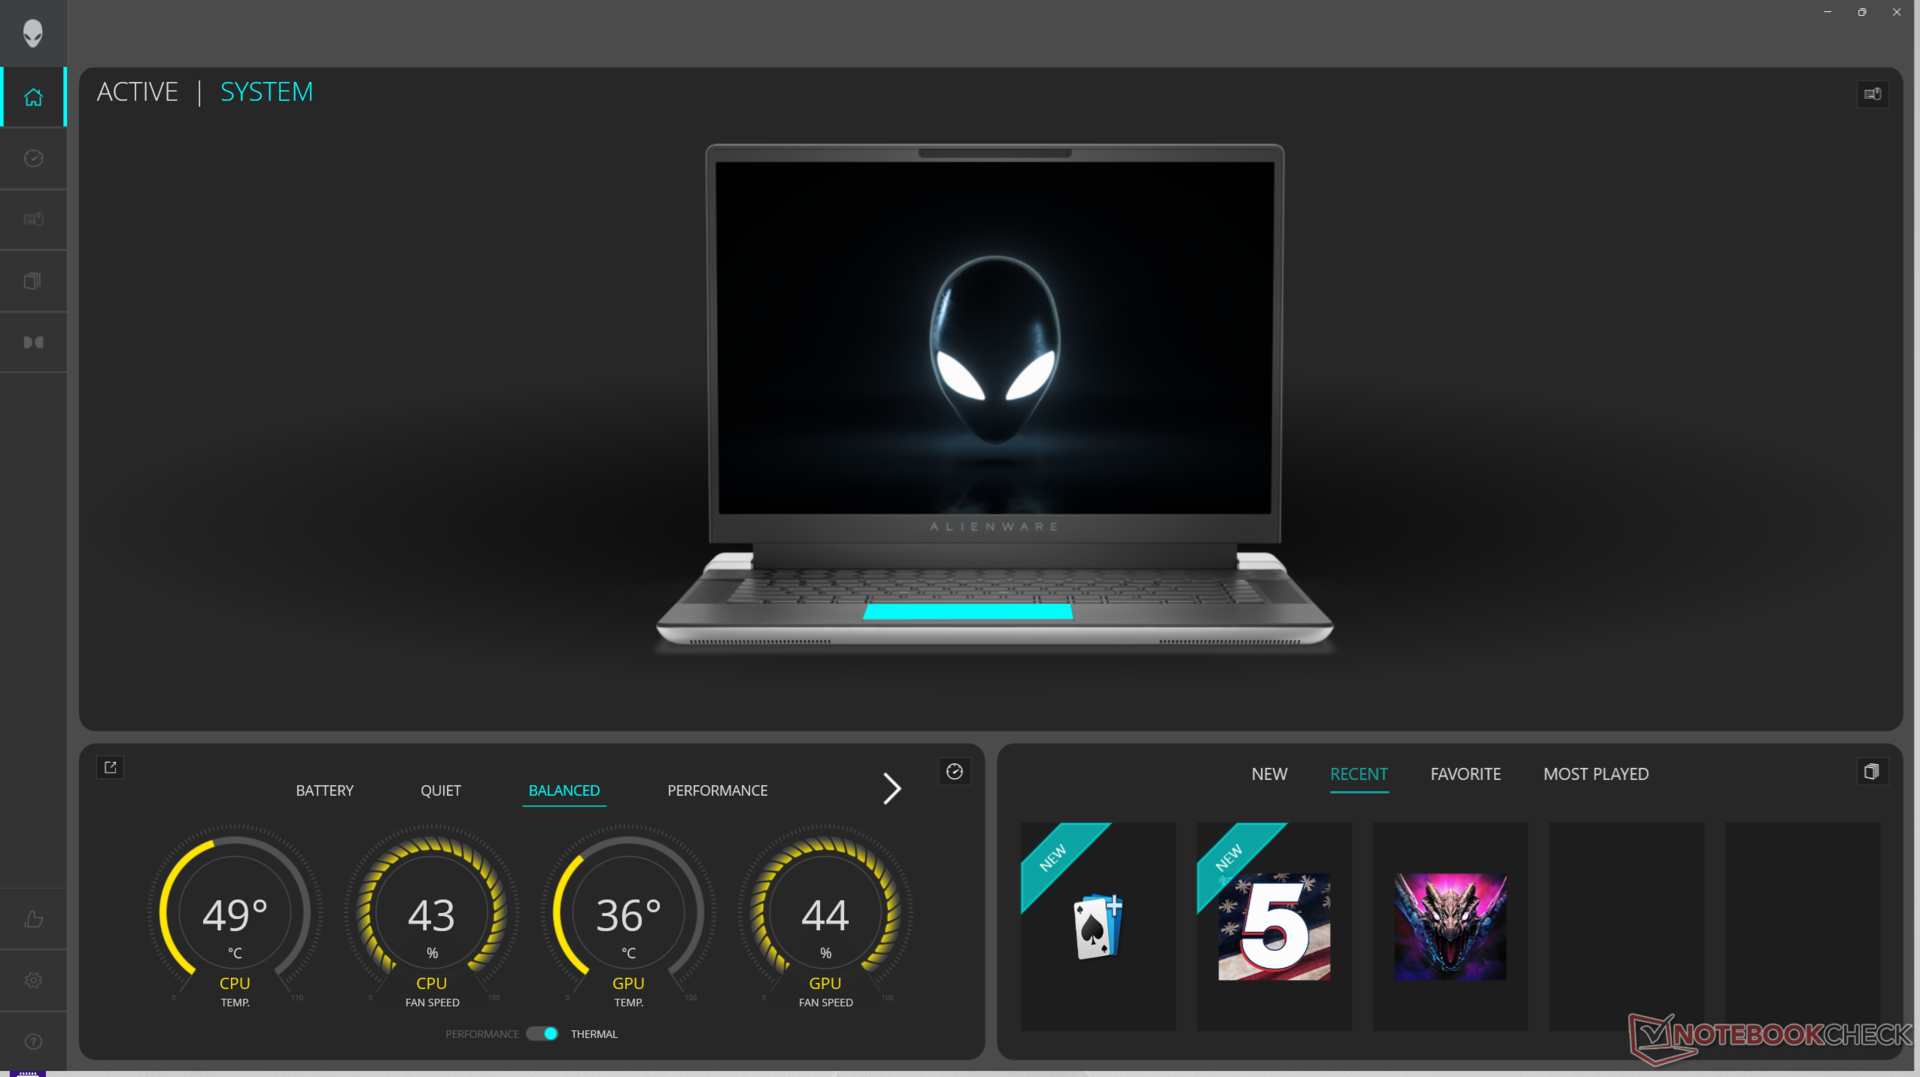
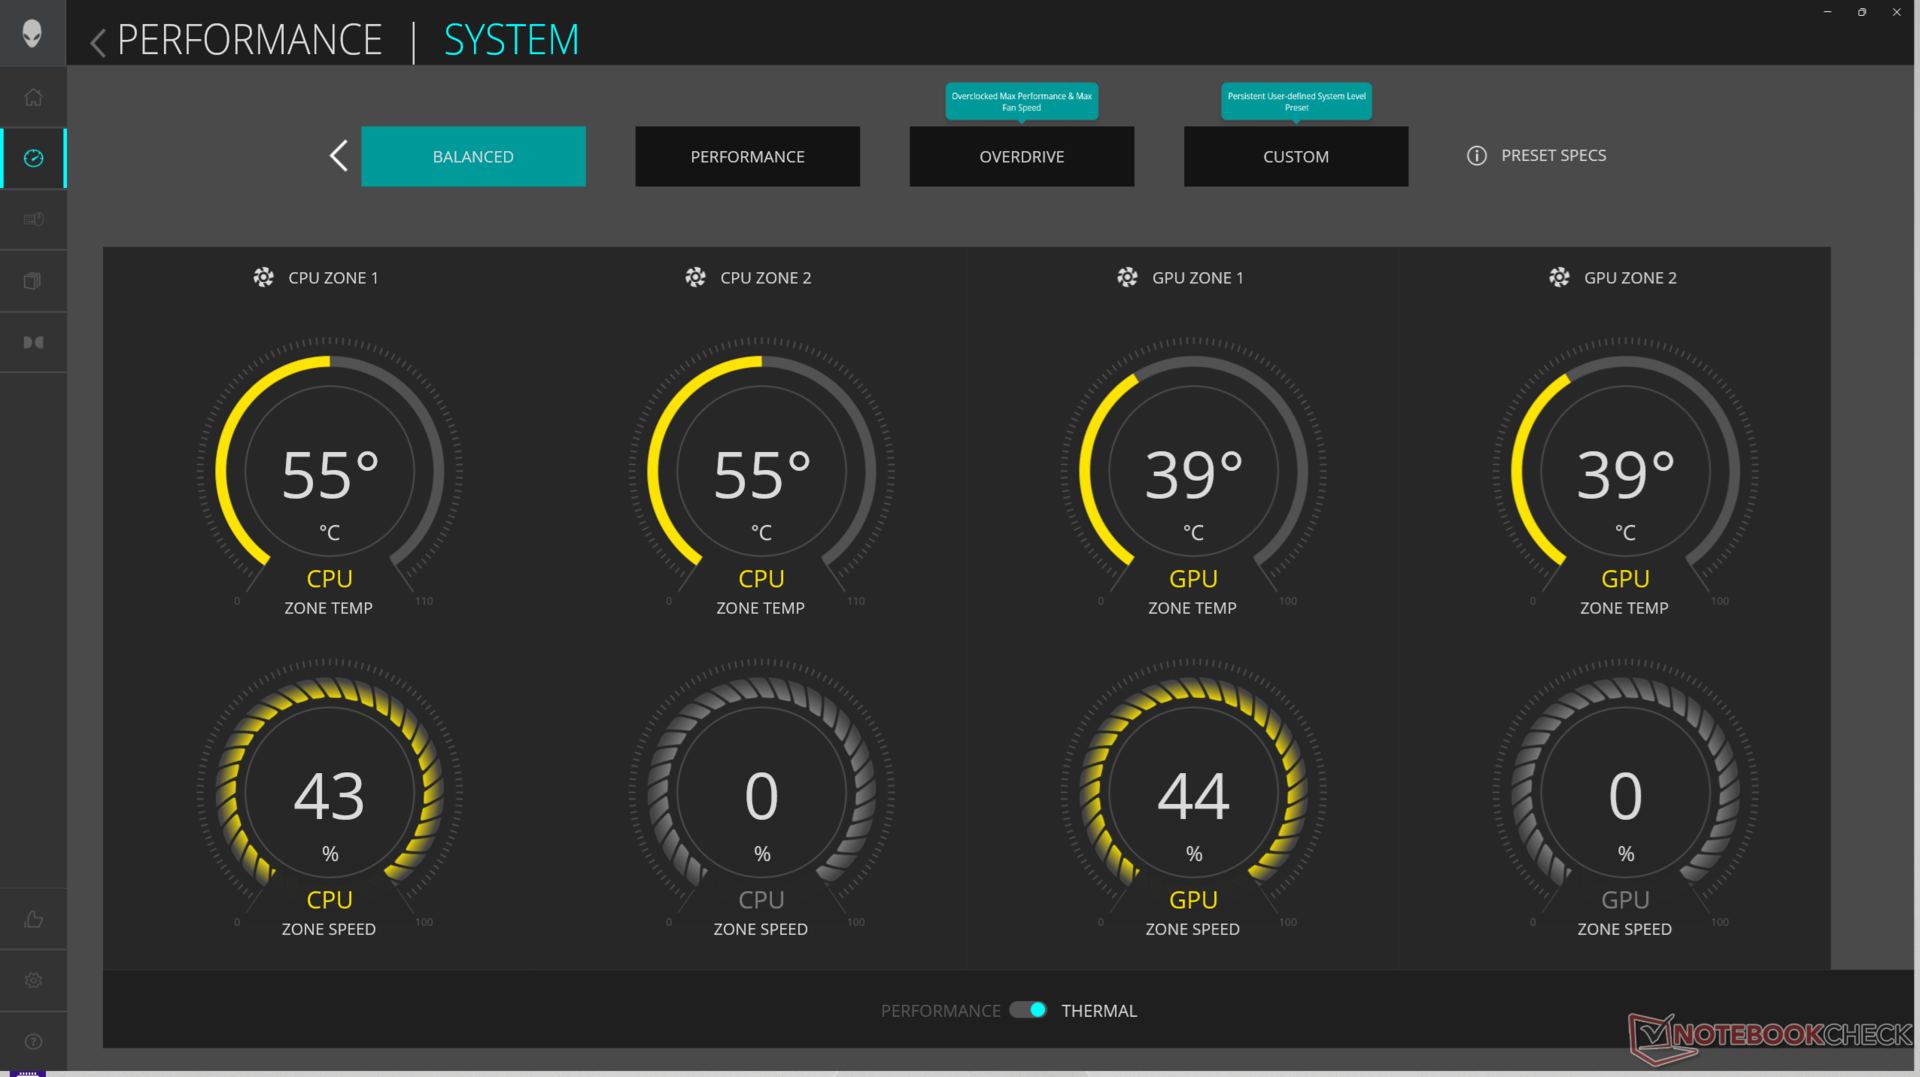
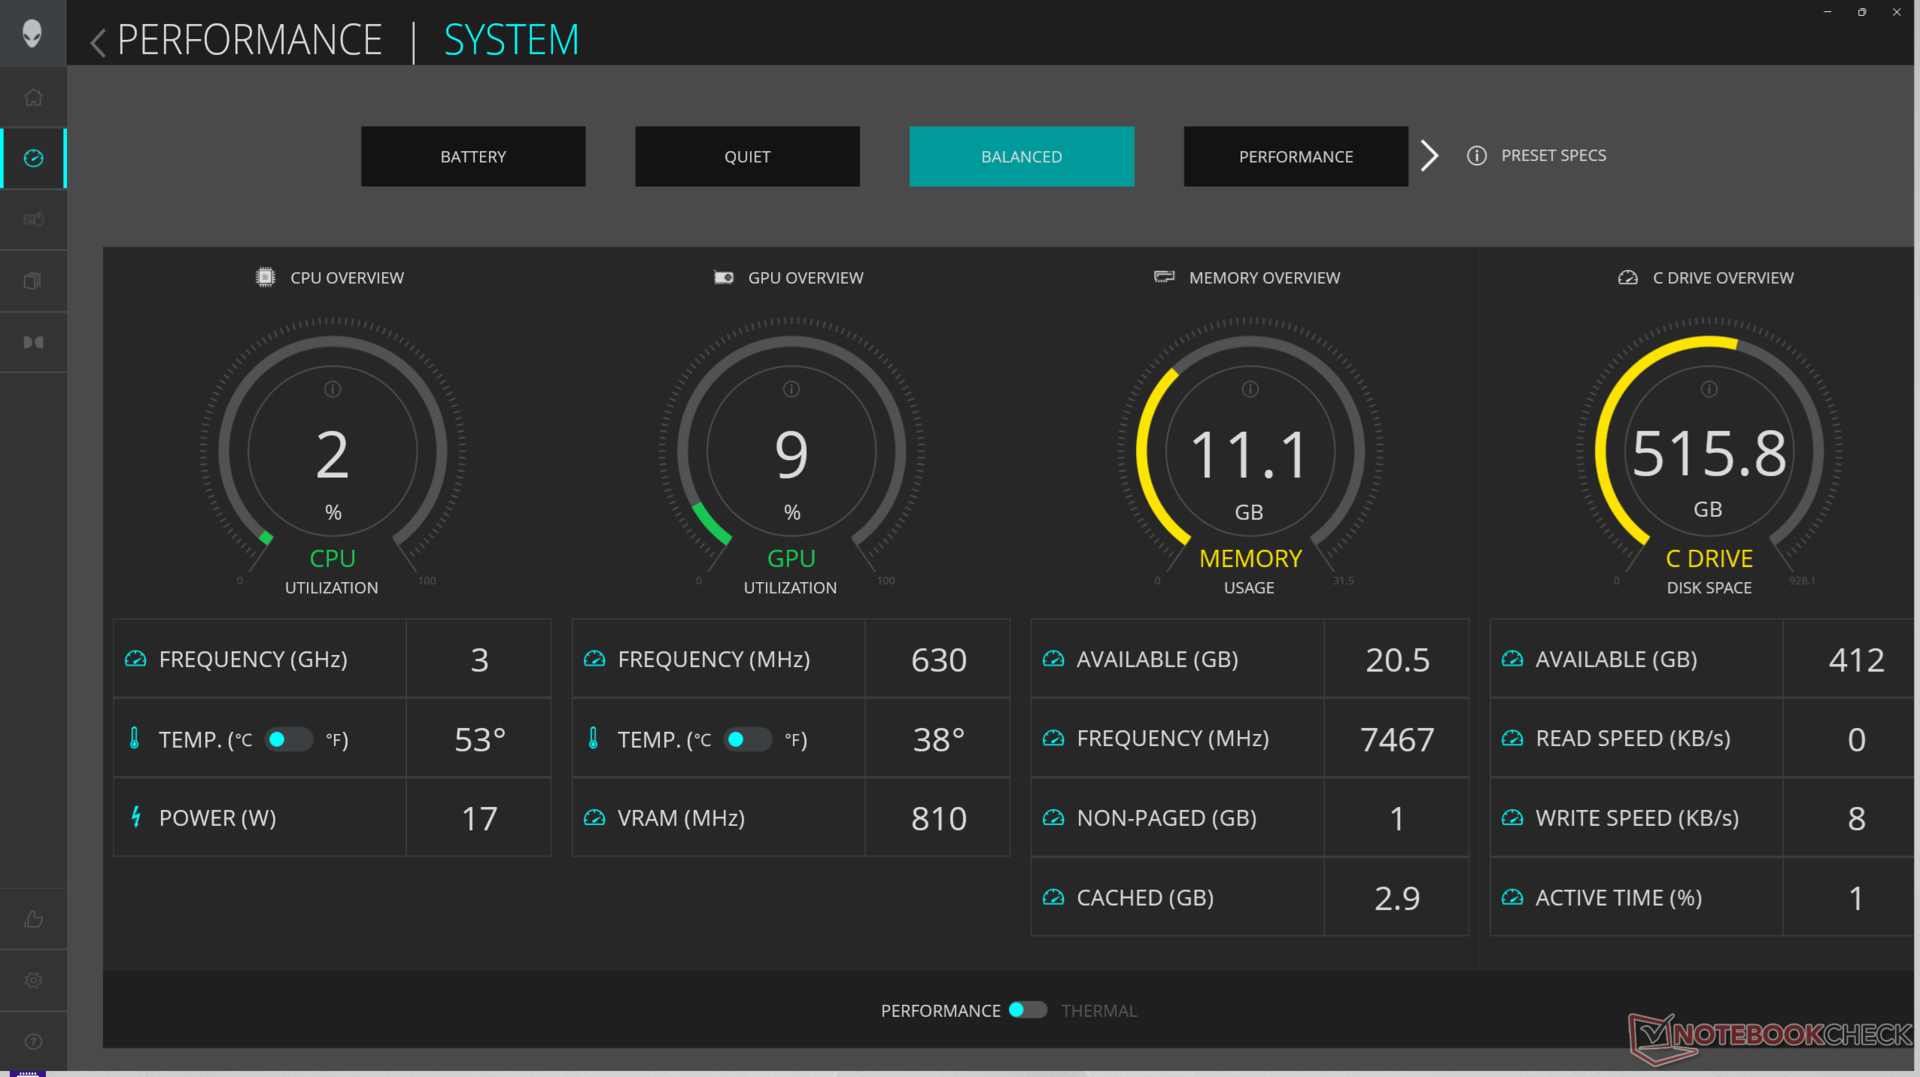
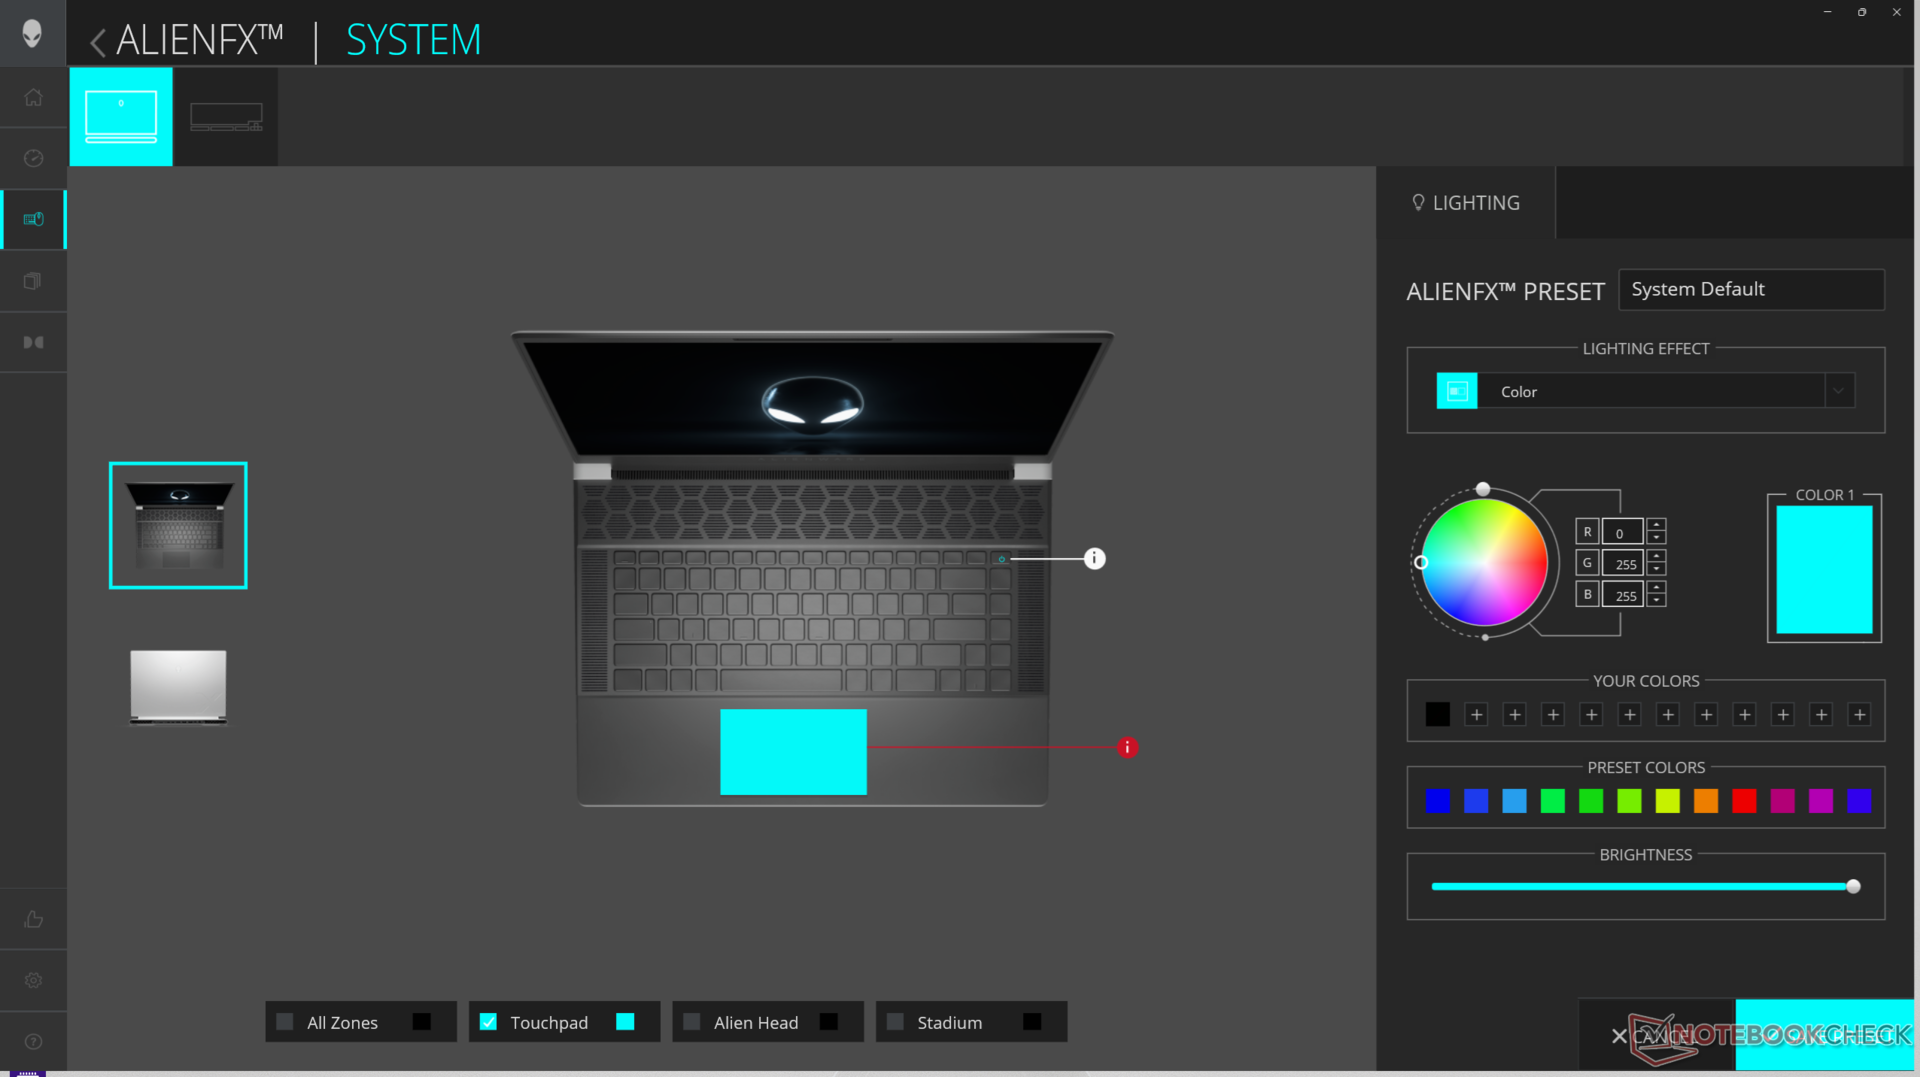
Ustawiliśmy Alienware Command Center na tryb Overdrive, a grafikę na tryb dGPU, aby uzyskać najlepsze możliwe wyniki testów porównawczych. Zachęcamy właścicieli do zapoznania się z Command Center, ponieważ jest to centrum regulacji efektów świetlnych RGB i profili wydajności.
Panel sterowania Nvidia nie oferuje trybu "tylko iGPU", jak pokazuje powyższy zrzut ekranu.
Procesor
The Core Ultra 9 185H jest około 5 do 10 procent i 15 do 20 procent wolniejszy niż Core i9-13900HK w zeszłorocznej wersji x16 R1, jeśli chodzi o aplikacje wielowątkowe i jednowątkowe. Co ciekawe, obniżenie wersji do Core Ultra 7 155H nie powinno wpłynąć na wydajność w żaden znaczący sposób w naszym czasie z Alienware m16 R2 jak pokazuje poniższy wykres porównawczy.
Opcje Raptor Lake-HX, takie jak Core i9-14900HX nie są dostępne w serii Alienware x16 prawdopodobnie z powodu ograniczeń termicznych, ponieważ procesory te wymagają więcej mocy niż seria Meteor Lake-H. Takie opcje oferowałyby znacznie wyższą wydajność niż zarówno Core i9-13900HK, jak i Core Ultra 9 185H.
Cinebench R15 Multi Loop
Cinebench R23: Multi Core | Single Core
Cinebench R20: CPU (Multi Core) | CPU (Single Core)
Cinebench R15: CPU Multi 64Bit | CPU Single 64Bit
Blender: v2.79 BMW27 CPU
7-Zip 18.03: 7z b 4 | 7z b 4 -mmt1
Geekbench 6.4: Multi-Core | Single-Core
Geekbench 5.5: Multi-Core | Single-Core
HWBOT x265 Benchmark v2.2: 4k Preset
LibreOffice : 20 Documents To PDF
R Benchmark 2.5: Overall mean
| CPU Performance Rating | |
| Lenovo Legion Pro 7 16IRX9H | |
| Asus ROG Strix Scar 16 G634JZR | |
| MSI Vector 16 HX A14V | |
| MSI Raider GE68HX 13VF | |
| Lenovo Legion Pro 7 RTX4090 -2! | |
| Alienware m16 R1 AMD | |
| Lenovo Legion 7 16IAX7-82TD004SGE -2! | |
| Alienware x16 R1 -3! | |
| Framework Laptop 16 | |
| Alienware m16 R2 -1! | |
| Lenovo Legion Slim 5 16APH8 -2! | |
| MSI Stealth 16 Mercedes-AMG Motorsport A13VG | |
| Przeciętny Intel Core Ultra 9 185H | |
| Lenovo Legion Slim 7 16APH8 | |
| Alienware x16 R2 P120F | |
| Lenovo Legion S7 16ARHA7 -2! | |
| Asus ROG Zephyrus M16 GU603H -4! | |
| Cinebench R20 / CPU (Multi Core) | |
| Lenovo Legion Pro 7 16IRX9H | |
| MSI Vector 16 HX A14V | |
| MSI Raider GE68HX 13VF | |
| Lenovo Legion Pro 7 RTX4090 | |
| Asus ROG Strix Scar 16 G634JZR | |
| Alienware m16 R1 AMD | |
| Lenovo Legion 7 16IAX7-82TD004SGE | |
| MSI Stealth 16 Mercedes-AMG Motorsport A13VG | |
| Alienware x16 R1 | |
| Alienware x16 R2 P120F | |
| Alienware m16 R2 | |
| Przeciętny Intel Core Ultra 9 185H (4843 - 7651, n=19) | |
| Lenovo Legion Slim 5 16APH8 | |
| Framework Laptop 16 | |
| Lenovo Legion Slim 7 16APH8 | |
| Lenovo Legion S7 16ARHA7 | |
| Asus ROG Zephyrus M16 GU603H | |
| Cinebench R20 / CPU (Single Core) | |
| Asus ROG Strix Scar 16 G634JZR | |
| MSI Vector 16 HX A14V | |
| Lenovo Legion Pro 7 16IRX9H | |
| MSI Raider GE68HX 13VF | |
| Lenovo Legion Pro 7 RTX4090 | |
| MSI Stealth 16 Mercedes-AMG Motorsport A13VG | |
| Alienware x16 R1 | |
| Lenovo Legion 7 16IAX7-82TD004SGE | |
| Alienware m16 R1 AMD | |
| Lenovo Legion Slim 5 16APH8 | |
| Przeciętny Intel Core Ultra 9 185H (442 - 735, n=19) | |
| Framework Laptop 16 | |
| Alienware m16 R2 | |
| Lenovo Legion Slim 7 16APH8 | |
| Lenovo Legion S7 16ARHA7 | |
| Alienware x16 R2 P120F | |
| Asus ROG Zephyrus M16 GU603H | |
| Cinebench R15 / CPU Multi 64Bit | |
| Asus ROG Strix Scar 16 G634JZR | |
| Lenovo Legion Pro 7 16IRX9H | |
| Lenovo Legion Pro 7 RTX4090 | |
| MSI Raider GE68HX 13VF | |
| MSI Vector 16 HX A14V | |
| Alienware m16 R1 AMD | |
| Lenovo Legion 7 16IAX7-82TD004SGE | |
| MSI Stealth 16 Mercedes-AMG Motorsport A13VG | |
| Alienware x16 R1 | |
| Alienware x16 R2 P120F | |
| Alienware m16 R2 | |
| Przeciętny Intel Core Ultra 9 185H (1582 - 3165, n=21) | |
| Lenovo Legion Slim 5 16APH8 | |
| Framework Laptop 16 | |
| Lenovo Legion Slim 7 16APH8 | |
| Lenovo Legion S7 16ARHA7 | |
| Asus ROG Zephyrus M16 GU603H | |
| Cinebench R15 / CPU Single 64Bit | |
| Asus ROG Strix Scar 16 G634JZR | |
| Lenovo Legion Pro 7 16IRX9H | |
| MSI Vector 16 HX A14V | |
| MSI Raider GE68HX 13VF | |
| Alienware m16 R1 AMD | |
| Lenovo Legion Pro 7 RTX4090 | |
| Lenovo Legion 7 16IAX7-82TD004SGE | |
| Lenovo Legion Slim 5 16APH8 | |
| MSI Stealth 16 Mercedes-AMG Motorsport A13VG | |
| Alienware x16 R1 | |
| Framework Laptop 16 | |
| Lenovo Legion Slim 7 16APH8 | |
| Przeciętny Intel Core Ultra 9 185H (191.9 - 281, n=19) | |
| Lenovo Legion S7 16ARHA7 | |
| Alienware m16 R2 | |
| Alienware x16 R2 P120F | |
| Asus ROG Zephyrus M16 GU603H | |
| Blender / v2.79 BMW27 CPU | |
| Asus ROG Zephyrus M16 GU603H | |
| MSI Stealth 16 Mercedes-AMG Motorsport A13VG | |
| Lenovo Legion S7 16ARHA7 | |
| Lenovo Legion Slim 7 16APH8 | |
| Framework Laptop 16 | |
| Przeciętny Intel Core Ultra 9 185H (163 - 285, n=19) | |
| Lenovo Legion Slim 5 16APH8 | |
| Alienware x16 R2 P120F | |
| Lenovo Legion 7 16IAX7-82TD004SGE | |
| Alienware m16 R1 AMD | |
| Asus ROG Strix Scar 16 G634JZR | |
| MSI Raider GE68HX 13VF | |
| Lenovo Legion Pro 7 RTX4090 | |
| Lenovo Legion Pro 7 16IRX9H | |
| MSI Vector 16 HX A14V | |
| 7-Zip 18.03 / 7z b 4 | |
| Lenovo Legion Pro 7 16IRX9H | |
| MSI Vector 16 HX A14V | |
| Lenovo Legion Pro 7 RTX4090 | |
| Asus ROG Strix Scar 16 G634JZR | |
| MSI Raider GE68HX 13VF | |
| Alienware m16 R1 AMD | |
| Lenovo Legion 7 16IAX7-82TD004SGE | |
| Alienware x16 R1 | |
| Framework Laptop 16 | |
| Lenovo Legion Slim 7 16APH8 | |
| Przeciętny Intel Core Ultra 9 185H (51738 - 76331, n=19) | |
| Lenovo Legion Slim 5 16APH8 | |
| Alienware m16 R2 | |
| Alienware x16 R2 P120F | |
| Lenovo Legion S7 16ARHA7 | |
| MSI Stealth 16 Mercedes-AMG Motorsport A13VG | |
| Asus ROG Zephyrus M16 GU603H | |
| 7-Zip 18.03 / 7z b 4 -mmt1 | |
| Asus ROG Strix Scar 16 G634JZR | |
| Lenovo Legion Pro 7 16IRX9H | |
| MSI Vector 16 HX A14V | |
| Alienware m16 R1 AMD | |
| Lenovo Legion Pro 7 RTX4090 | |
| MSI Raider GE68HX 13VF | |
| Lenovo Legion Slim 7 16APH8 | |
| Framework Laptop 16 | |
| Lenovo Legion Slim 5 16APH8 | |
| Lenovo Legion 7 16IAX7-82TD004SGE | |
| MSI Stealth 16 Mercedes-AMG Motorsport A13VG | |
| Lenovo Legion S7 16ARHA7 | |
| Alienware x16 R1 | |
| Asus ROG Zephyrus M16 GU603H | |
| Przeciętny Intel Core Ultra 9 185H (4199 - 5781, n=19) | |
| Alienware m16 R2 | |
| Alienware x16 R2 P120F | |
| Geekbench 5.5 / Multi-Core | |
| MSI Raider GE68HX 13VF | |
| Asus ROG Strix Scar 16 G634JZR | |
| MSI Vector 16 HX A14V | |
| Lenovo Legion Pro 7 16IRX9H | |
| Lenovo Legion Pro 7 RTX4090 | |
| Lenovo Legion 7 16IAX7-82TD004SGE | |
| Alienware m16 R1 AMD | |
| Alienware x16 R1 | |
| Przeciętny Intel Core Ultra 9 185H (9330 - 14230, n=19) | |
| Alienware x16 R2 P120F | |
| Framework Laptop 16 | |
| Alienware m16 R2 | |
| Lenovo Legion Slim 7 16APH8 | |
| Lenovo Legion Slim 5 16APH8 | |
| MSI Stealth 16 Mercedes-AMG Motorsport A13VG | |
| Lenovo Legion S7 16ARHA7 | |
| Asus ROG Zephyrus M16 GU603H | |
| Geekbench 5.5 / Single-Core | |
| Asus ROG Strix Scar 16 G634JZR | |
| MSI Vector 16 HX A14V | |
| Lenovo Legion Pro 7 16IRX9H | |
| MSI Raider GE68HX 13VF | |
| Lenovo Legion Pro 7 RTX4090 | |
| Alienware m16 R1 AMD | |
| Lenovo Legion Slim 5 16APH8 | |
| MSI Stealth 16 Mercedes-AMG Motorsport A13VG | |
| Framework Laptop 16 | |
| Lenovo Legion Slim 7 16APH8 | |
| Alienware x16 R1 | |
| Lenovo Legion 7 16IAX7-82TD004SGE | |
| Przeciętny Intel Core Ultra 9 185H (986 - 1902, n=19) | |
| Alienware m16 R2 | |
| Alienware x16 R2 P120F | |
| Lenovo Legion S7 16ARHA7 | |
| Asus ROG Zephyrus M16 GU603H | |
| HWBOT x265 Benchmark v2.2 / 4k Preset | |
| Lenovo Legion Pro 7 16IRX9H | |
| Lenovo Legion Pro 7 RTX4090 | |
| MSI Vector 16 HX A14V | |
| Asus ROG Strix Scar 16 G634JZR | |
| MSI Raider GE68HX 13VF | |
| Alienware m16 R1 AMD | |
| Lenovo Legion 7 16IAX7-82TD004SGE | |
| Alienware x16 R1 | |
| Lenovo Legion Slim 5 16APH8 | |
| Alienware m16 R2 | |
| Framework Laptop 16 | |
| Alienware x16 R2 P120F | |
| Lenovo Legion Slim 7 16APH8 | |
| Przeciętny Intel Core Ultra 9 185H (14.1 - 22.7, n=19) | |
| Lenovo Legion S7 16ARHA7 | |
| Asus ROG Zephyrus M16 GU603H | |
| MSI Stealth 16 Mercedes-AMG Motorsport A13VG | |
| LibreOffice / 20 Documents To PDF | |
| Lenovo Legion Slim 7 16APH8 | |
| MSI Stealth 16 Mercedes-AMG Motorsport A13VG | |
| Alienware m16 R2 | |
| Lenovo Legion S7 16ARHA7 | |
| Asus ROG Strix Scar 16 G634JZR | |
| MSI Vector 16 HX A14V | |
| Przeciętny Intel Core Ultra 9 185H (34.5 - 73.5, n=19) | |
| Alienware x16 R2 P120F | |
| Alienware x16 R1 | |
| Framework Laptop 16 | |
| Lenovo Legion Pro 7 RTX4090 | |
| Asus ROG Zephyrus M16 GU603H | |
| Alienware m16 R1 AMD | |
| Lenovo Legion Slim 5 16APH8 | |
| Lenovo Legion Pro 7 16IRX9H | |
| Lenovo Legion 7 16IAX7-82TD004SGE | |
| MSI Raider GE68HX 13VF | |
| R Benchmark 2.5 / Overall mean | |
| Asus ROG Zephyrus M16 GU603H | |
| Alienware x16 R2 P120F | |
| Alienware m16 R2 | |
| Przeciętny Intel Core Ultra 9 185H (0.4313 - 0.759, n=20) | |
| Lenovo Legion S7 16ARHA7 | |
| Framework Laptop 16 | |
| Lenovo Legion Slim 7 16APH8 | |
| Lenovo Legion Slim 5 16APH8 | |
| MSI Stealth 16 Mercedes-AMG Motorsport A13VG | |
| Alienware x16 R1 | |
| Alienware m16 R1 AMD | |
| Lenovo Legion 7 16IAX7-82TD004SGE | |
| Lenovo Legion Pro 7 RTX4090 | |
| MSI Raider GE68HX 13VF | |
| Lenovo Legion Pro 7 16IRX9H | |
| MSI Vector 16 HX A14V | |
| Asus ROG Strix Scar 16 G634JZR | |
Cinebench R23: Multi Core | Single Core
Cinebench R20: CPU (Multi Core) | CPU (Single Core)
Cinebench R15: CPU Multi 64Bit | CPU Single 64Bit
Blender: v2.79 BMW27 CPU
7-Zip 18.03: 7z b 4 | 7z b 4 -mmt1
Geekbench 6.4: Multi-Core | Single-Core
Geekbench 5.5: Multi-Core | Single-Core
HWBOT x265 Benchmark v2.2: 4k Preset
LibreOffice : 20 Documents To PDF
R Benchmark 2.5: Overall mean
* ... im mniej tym lepiej
AIDA64: FP32 Ray-Trace | FPU Julia | CPU SHA3 | CPU Queen | FPU SinJulia | FPU Mandel | CPU AES | CPU ZLib | FP64 Ray-Trace | CPU PhotoWorxx
| Performance Rating | |
| MSI Vector 16 HX A14V | |
| Lenovo Legion Pro 7 16IRX9H | |
| Asus ROG Strix Scar 16 G634JZR | |
| Alienware x16 R2 P120F | |
| Alienware x16 R1 | |
| Alienware m16 R2 | |
| Przeciętny Intel Core Ultra 9 185H | |
| AIDA64 / FP32 Ray-Trace | |
| MSI Vector 16 HX A14V | |
| Lenovo Legion Pro 7 16IRX9H | |
| Asus ROG Strix Scar 16 G634JZR | |
| Alienware x16 R2 P120F | |
| Alienware m16 R2 | |
| Alienware x16 R1 | |
| Przeciętny Intel Core Ultra 9 185H (9220 - 18676, n=19) | |
| AIDA64 / FPU Julia | |
| MSI Vector 16 HX A14V | |
| Lenovo Legion Pro 7 16IRX9H | |
| Asus ROG Strix Scar 16 G634JZR | |
| Alienware x16 R2 P120F | |
| Alienware m16 R2 | |
| Alienware x16 R1 | |
| Przeciętny Intel Core Ultra 9 185H (48865 - 96463, n=19) | |
| AIDA64 / CPU SHA3 | |
| Lenovo Legion Pro 7 16IRX9H | |
| MSI Vector 16 HX A14V | |
| Asus ROG Strix Scar 16 G634JZR | |
| Alienware x16 R2 P120F | |
| Alienware m16 R2 | |
| Alienware x16 R1 | |
| Przeciętny Intel Core Ultra 9 185H (2394 - 4534, n=19) | |
| AIDA64 / CPU Queen | |
| Asus ROG Strix Scar 16 G634JZR | |
| Lenovo Legion Pro 7 16IRX9H | |
| MSI Vector 16 HX A14V | |
| Alienware x16 R1 | |
| Alienware x16 R2 P120F | |
| Przeciętny Intel Core Ultra 9 185H (66785 - 95241, n=19) | |
| Alienware m16 R2 | |
| AIDA64 / FPU SinJulia | |
| Lenovo Legion Pro 7 16IRX9H | |
| MSI Vector 16 HX A14V | |
| Asus ROG Strix Scar 16 G634JZR | |
| Alienware x16 R1 | |
| Alienware x16 R2 P120F | |
| Alienware m16 R2 | |
| Przeciętny Intel Core Ultra 9 185H (7255 - 11392, n=19) | |
| AIDA64 / FPU Mandel | |
| MSI Vector 16 HX A14V | |
| Lenovo Legion Pro 7 16IRX9H | |
| Asus ROG Strix Scar 16 G634JZR | |
| Alienware x16 R2 P120F | |
| Alienware m16 R2 | |
| Alienware x16 R1 | |
| Przeciętny Intel Core Ultra 9 185H (24004 - 48020, n=19) | |
| AIDA64 / CPU AES | |
| Asus ROG Strix Scar 16 G634JZR | |
| Lenovo Legion Pro 7 16IRX9H | |
| MSI Vector 16 HX A14V | |
| Przeciętny Intel Core Ultra 9 185H (53116 - 154066, n=19) | |
| Alienware x16 R2 P120F | |
| Alienware m16 R2 | |
| Alienware x16 R1 | |
| AIDA64 / CPU ZLib | |
| Lenovo Legion Pro 7 16IRX9H | |
| MSI Vector 16 HX A14V | |
| Asus ROG Strix Scar 16 G634JZR | |
| Alienware x16 R2 P120F | |
| Alienware x16 R1 | |
| Alienware m16 R2 | |
| Przeciętny Intel Core Ultra 9 185H (678 - 1341, n=19) | |
| AIDA64 / FP64 Ray-Trace | |
| MSI Vector 16 HX A14V | |
| Lenovo Legion Pro 7 16IRX9H | |
| Asus ROG Strix Scar 16 G634JZR | |
| Alienware x16 R2 P120F | |
| Alienware x16 R1 | |
| Alienware m16 R2 | |
| Przeciętny Intel Core Ultra 9 185H (4428 - 10078, n=19) | |
| AIDA64 / CPU PhotoWorxx | |
| Alienware x16 R2 P120F | |
| Asus ROG Strix Scar 16 G634JZR | |
| Alienware x16 R1 | |
| MSI Vector 16 HX A14V | |
| Przeciętny Intel Core Ultra 9 185H (44547 - 53918, n=19) | |
| Lenovo Legion Pro 7 16IRX9H | |
| Alienware m16 R2 | |
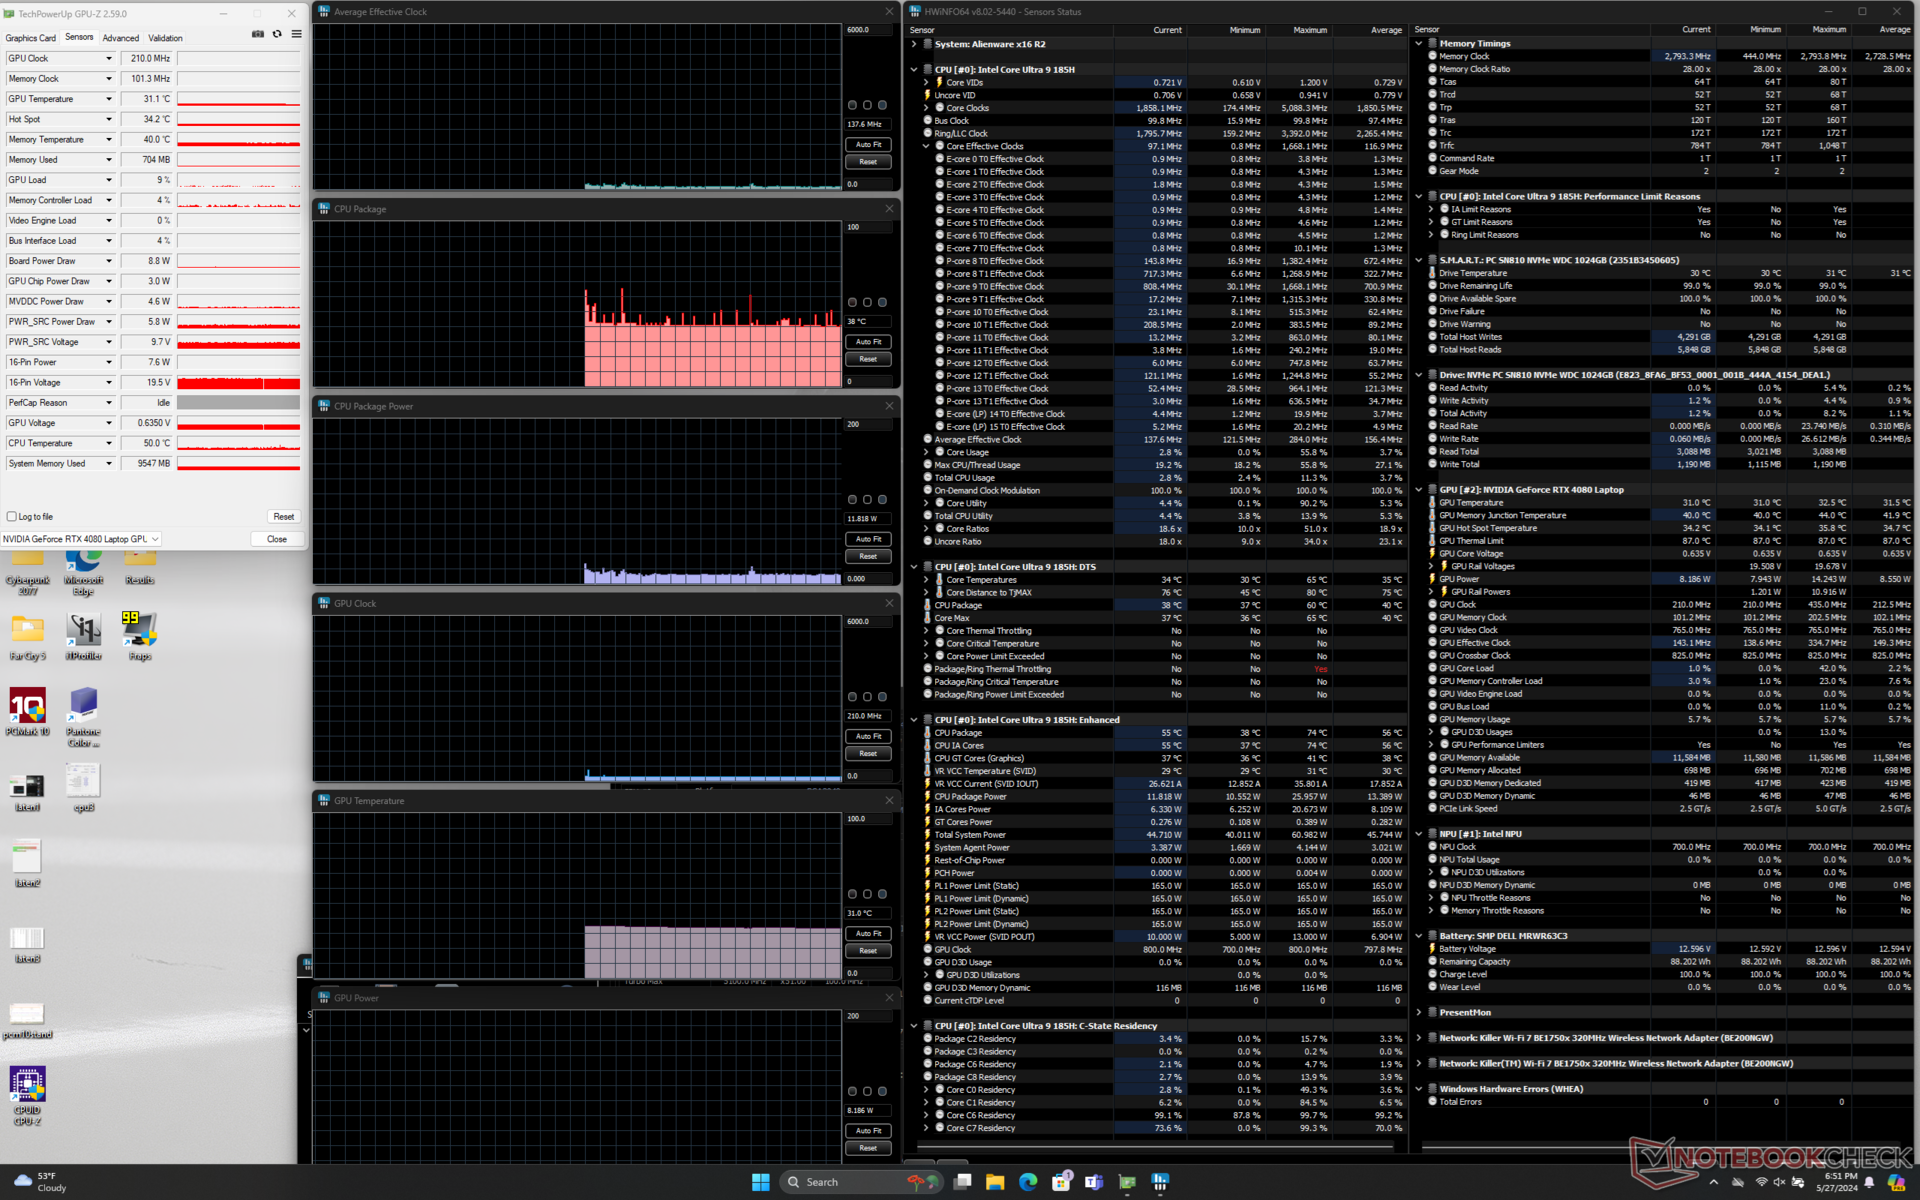
Test warunków skrajnych
Temperatury rdzenia CPU i GPU są tak samo wysokie jak te, które zarejestrowaliśmy na x16 R1. W szczególności CPU nadal stabilizuje się na poziomie prawie 100 C (!) podczas uruchamiania Prime95, podczas gdy GPU stabilizuje się w połowie zakresu 80 C podczas uruchamiania Prime95 Witcher 3. Co ciekawe, częstotliwość taktowania GPU spadła w porównaniu do x16 R1. Częstotliwość taktowania GPU waha się od 2100 do 2325 MHz w zależności od profilu zasilania, w porównaniu do 2460 MHz na oryginalnym x16 R1. Pobór mocy na płycie był również niższy w nowszym modelu x16 R2 (150 W w porównaniu do 165 W). Wyniki te korelują z ogólnie niższą wydajnością graficzną w sekcji Wydajność GPU poniżej.

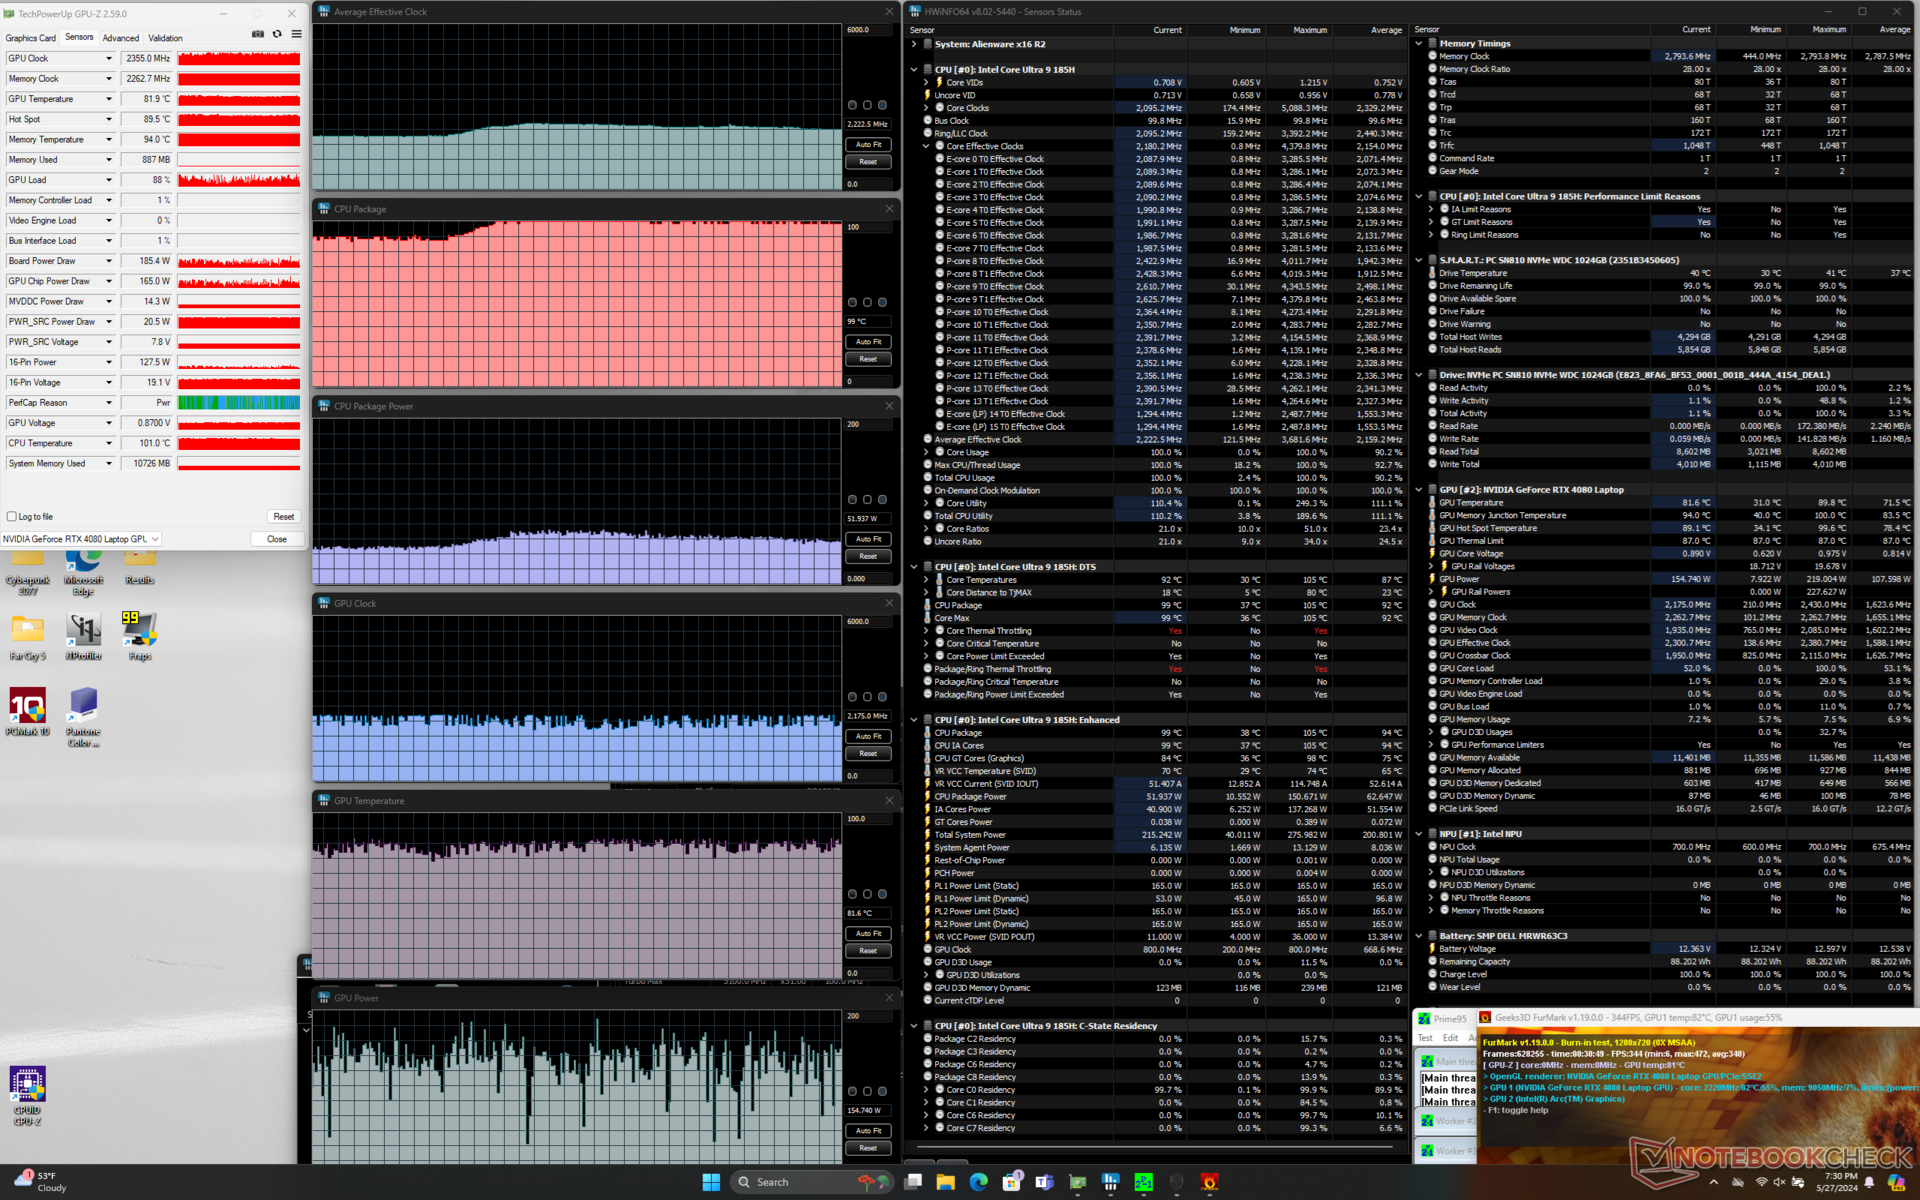
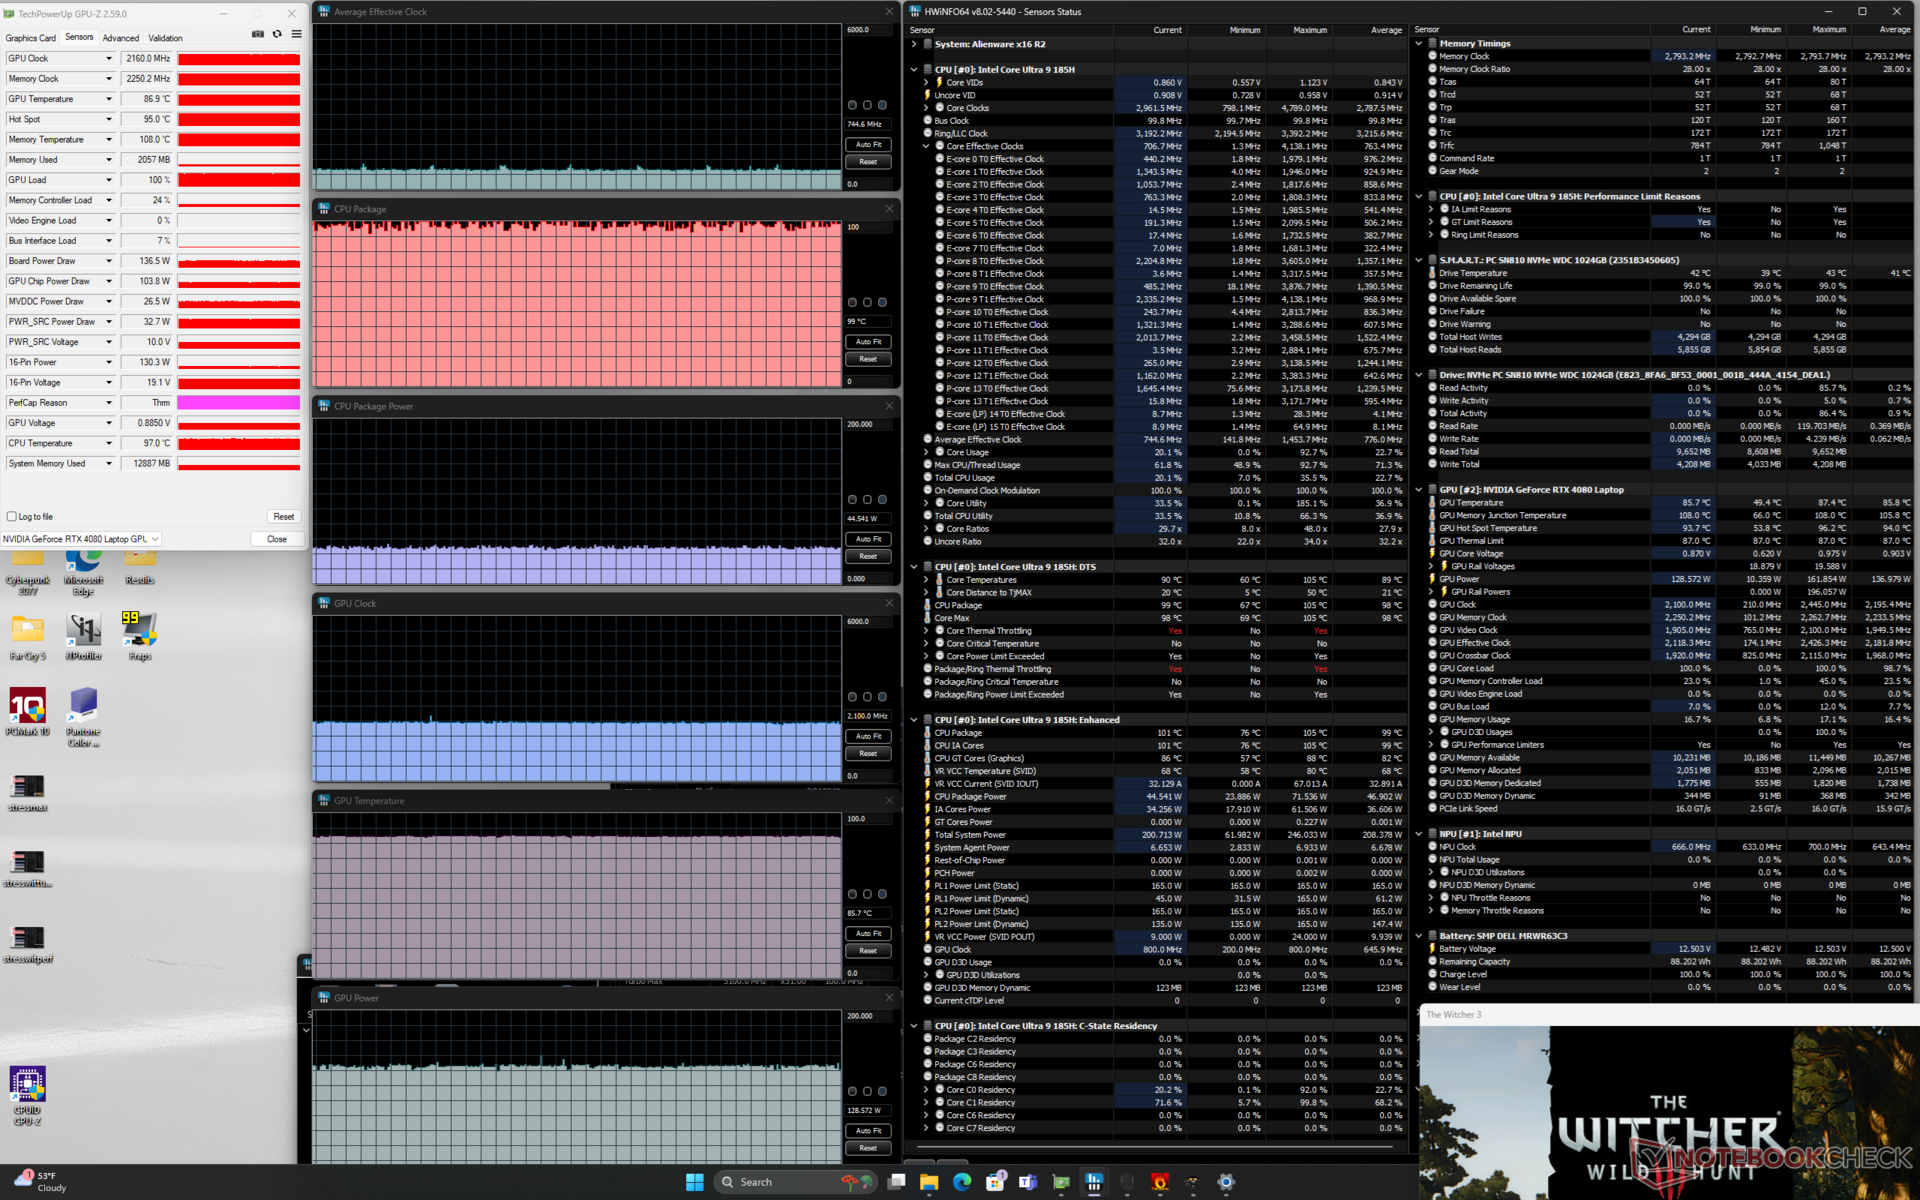
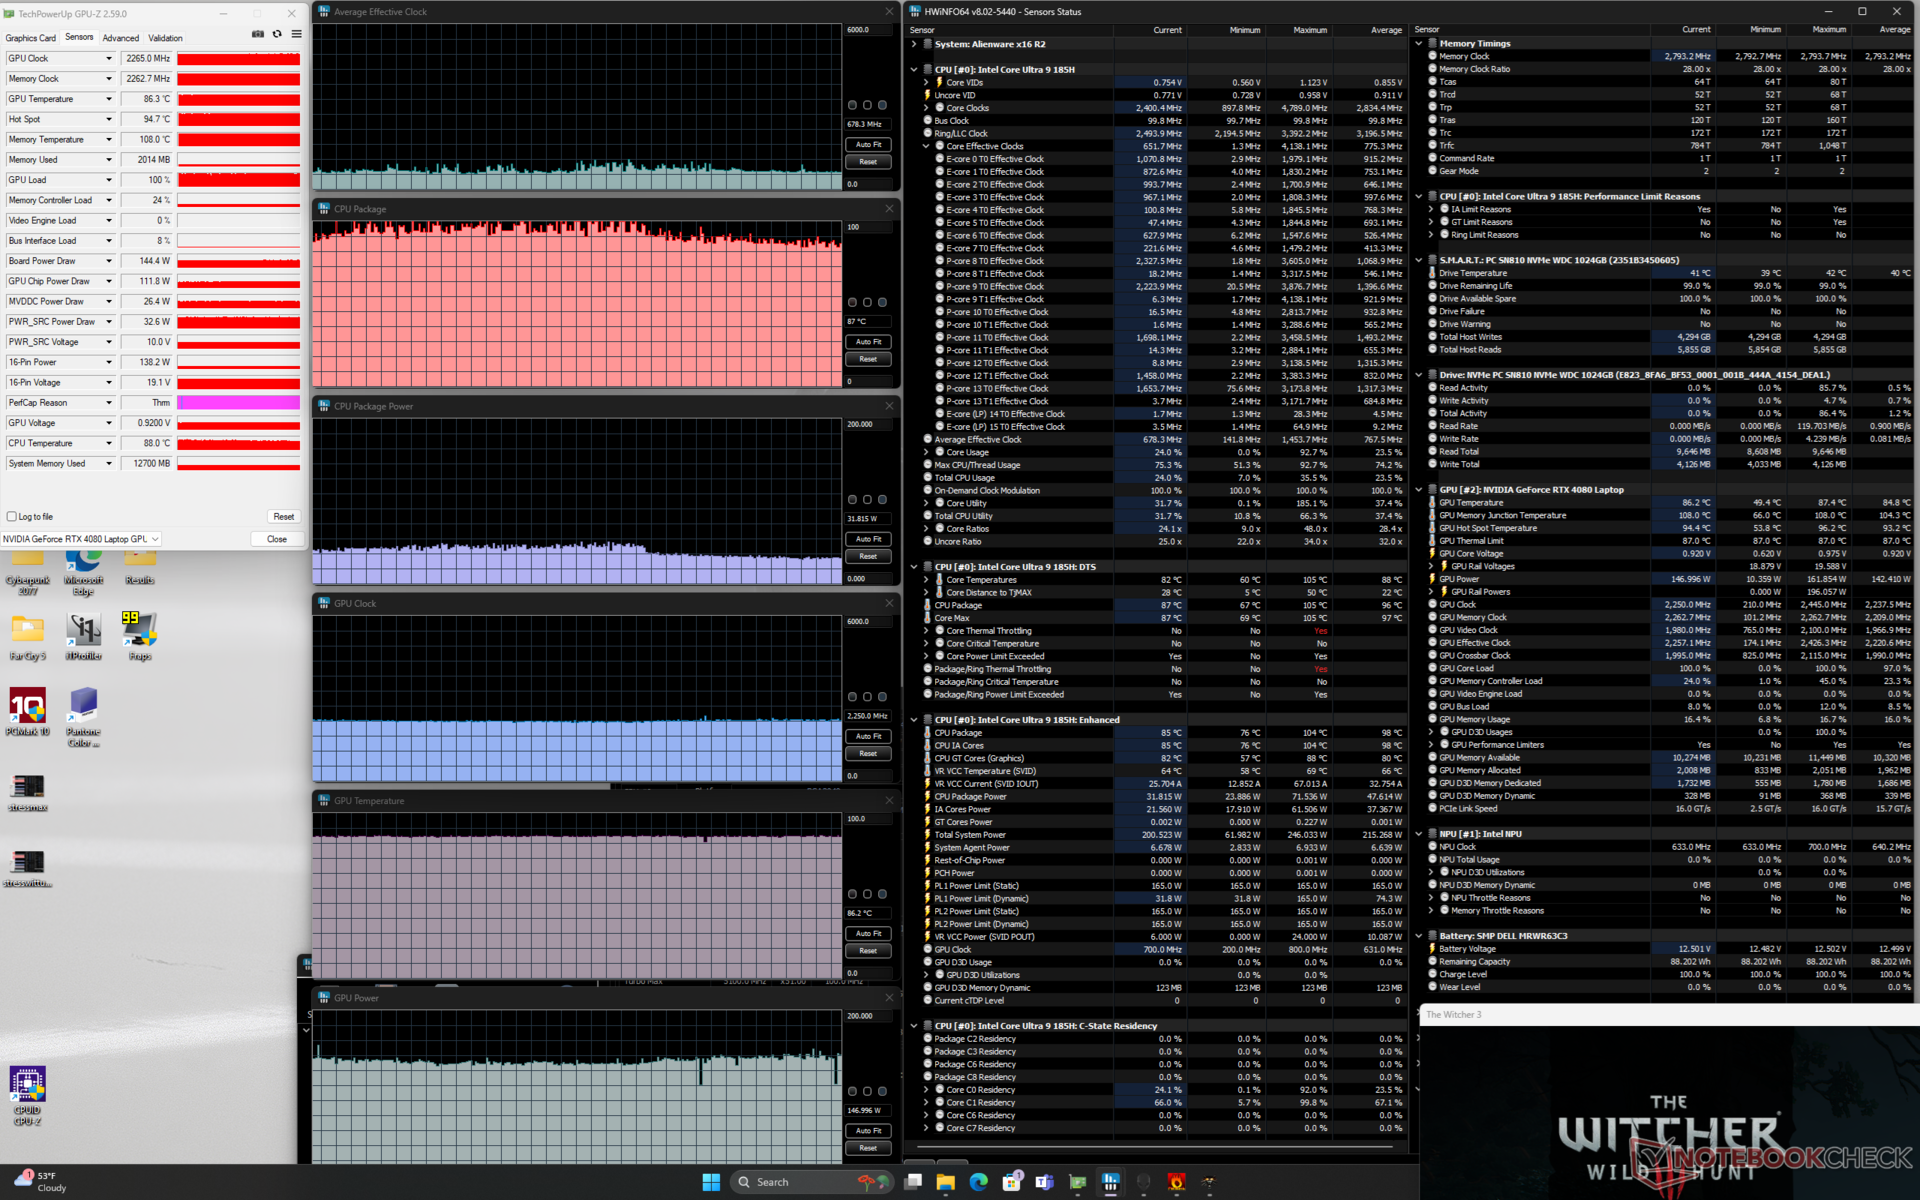
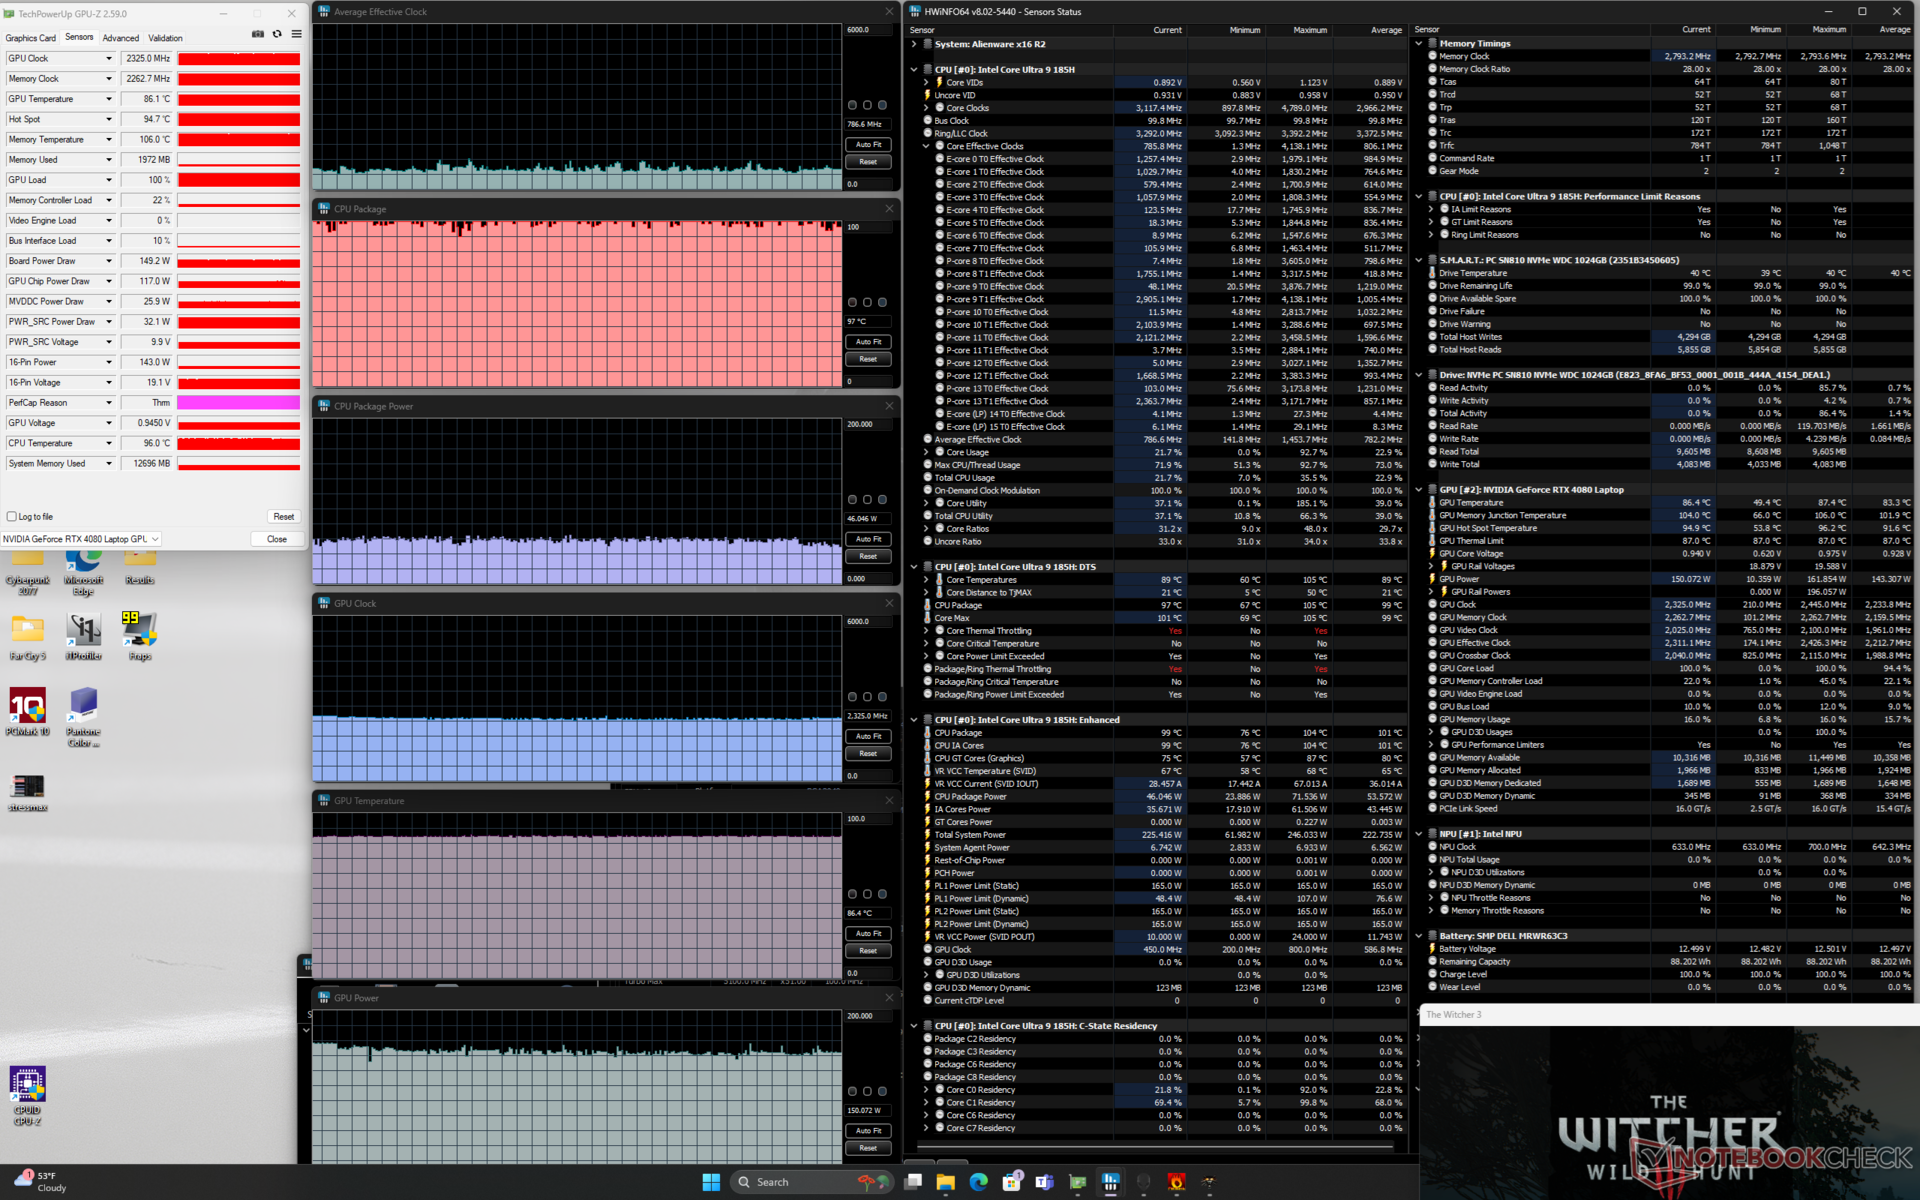
| Średnietaktowanie CPU (GHz) | Taktowanie GPU (MHz) | Średnia temperatura CPU (°C) | Średnia temperatura GPU (°C) | |
| System w stanie spoczynku | -- | -- | 38 | 31 |
| Prime95Stress | 3.2 | -- | 101 | 50 |
| Prime95+ FurMark Stress | 2.2 | 2175 | 99 | 82 |
| Witcher 3 Obciążenie (trybzrównoważony) | 0,7 | 2100 | 99 | 86 |
| Witcher 3 Obciążenie (trybwydajności) | 0.7 | 2250 | 87 | 86 |
| Witcher 3 Obciążenie (trybOverdrive) | 0.8 | 2325 | 97 | 86 |
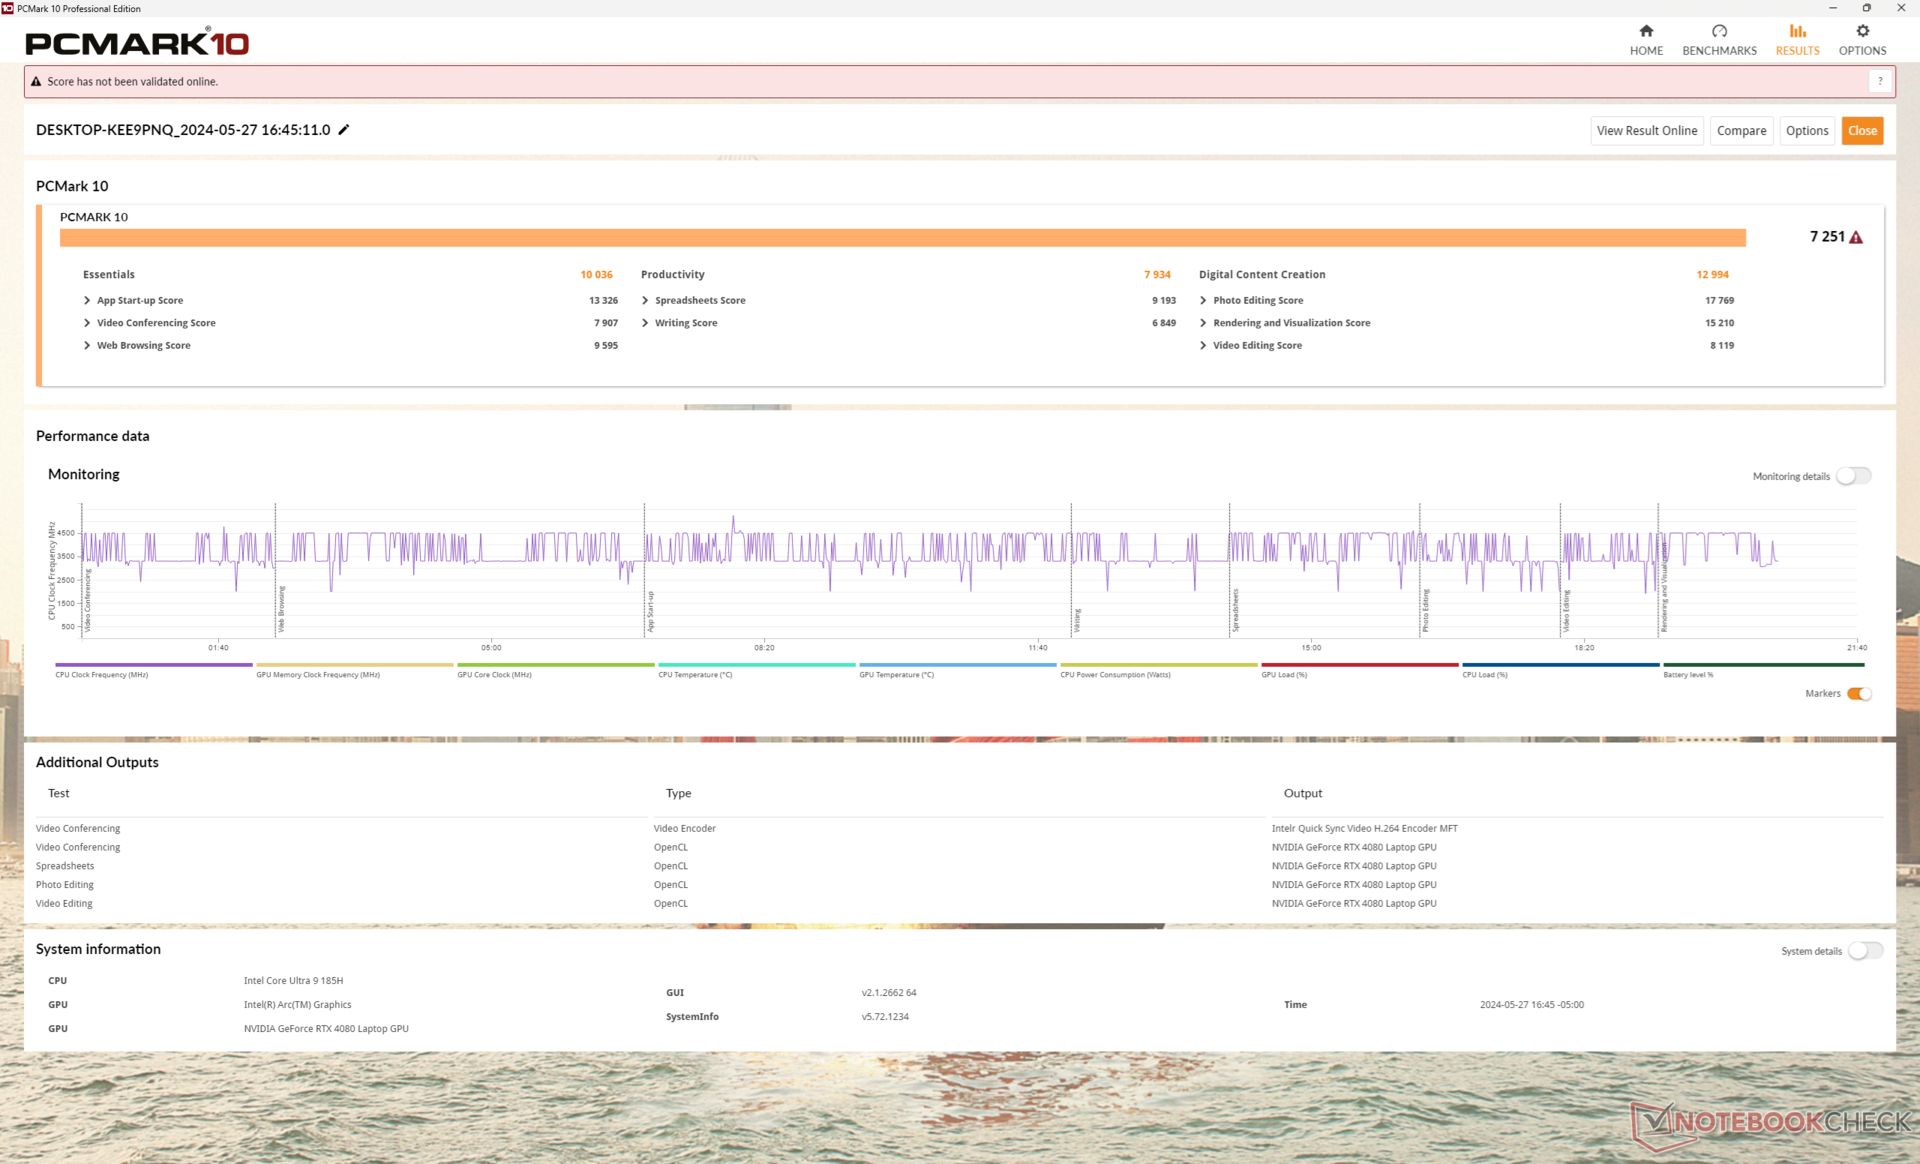
Wydajność systemu
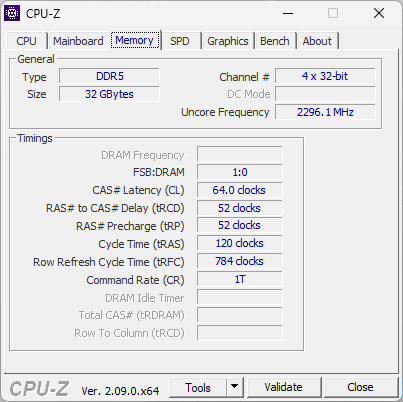
Wyniki PCMark są mniej więcej takie same, jeśli nie niższe niż poprzednio. Tymczasem pamięć RAM jest w tym roku nieco szybsza (7467 MT/s w porównaniu do 6000 MT/s), co przekłada się na nieco wyższe wyniki kopiowania/odczytu AIDA64, ale wolniejsze wyniki zapisu i opóźnień.
CrossMark: Overall | Productivity | Creativity | Responsiveness
WebXPRT 3: Overall
WebXPRT 4: Overall
Mozilla Kraken 1.1: Total
| PCMark 10 / Score | |
| Lenovo Legion Pro 7 16IRX9H | |
| MSI Vector 16 HX A14V | |
| Alienware x16 R1 | |
| Alienware m16 R2 | |
| Asus ROG Strix Scar 16 G634JZR | |
| Alienware x16 R2 P120F | |
| Przeciętny Intel Core Ultra 9 185H, NVIDIA GeForce RTX 4080 Laptop GPU (n=1) | |
| PCMark 10 / Essentials | |
| Lenovo Legion Pro 7 16IRX9H | |
| Asus ROG Strix Scar 16 G634JZR | |
| MSI Vector 16 HX A14V | |
| Alienware x16 R1 | |
| Alienware m16 R2 | |
| Alienware x16 R2 P120F | |
| Przeciętny Intel Core Ultra 9 185H, NVIDIA GeForce RTX 4080 Laptop GPU (n=1) | |
| PCMark 10 / Productivity | |
| Lenovo Legion Pro 7 16IRX9H | |
| Alienware x16 R1 | |
| MSI Vector 16 HX A14V | |
| Alienware m16 R2 | |
| Alienware x16 R2 P120F | |
| Przeciętny Intel Core Ultra 9 185H, NVIDIA GeForce RTX 4080 Laptop GPU (n=1) | |
| Asus ROG Strix Scar 16 G634JZR | |
| PCMark 10 / Digital Content Creation | |
| Asus ROG Strix Scar 16 G634JZR | |
| MSI Vector 16 HX A14V | |
| Lenovo Legion Pro 7 16IRX9H | |
| Alienware x16 R1 | |
| Alienware m16 R2 | |
| Alienware x16 R2 P120F | |
| Przeciętny Intel Core Ultra 9 185H, NVIDIA GeForce RTX 4080 Laptop GPU (n=1) | |
| CrossMark / Overall | |
| Lenovo Legion Pro 7 16IRX9H | |
| MSI Vector 16 HX A14V | |
| Asus ROG Strix Scar 16 G634JZR | |
| Alienware x16 R1 | |
| Alienware m16 R2 | |
| Alienware x16 R2 P120F | |
| Przeciętny Intel Core Ultra 9 185H, NVIDIA GeForce RTX 4080 Laptop GPU (n=1) | |
| CrossMark / Productivity | |
| Lenovo Legion Pro 7 16IRX9H | |
| MSI Vector 16 HX A14V | |
| Asus ROG Strix Scar 16 G634JZR | |
| Alienware x16 R1 | |
| Alienware m16 R2 | |
| Alienware x16 R2 P120F | |
| Przeciętny Intel Core Ultra 9 185H, NVIDIA GeForce RTX 4080 Laptop GPU (n=1) | |
| CrossMark / Creativity | |
| Lenovo Legion Pro 7 16IRX9H | |
| MSI Vector 16 HX A14V | |
| Asus ROG Strix Scar 16 G634JZR | |
| Alienware x16 R1 | |
| Alienware m16 R2 | |
| Alienware x16 R2 P120F | |
| Przeciętny Intel Core Ultra 9 185H, NVIDIA GeForce RTX 4080 Laptop GPU (n=1) | |
| CrossMark / Responsiveness | |
| Lenovo Legion Pro 7 16IRX9H | |
| MSI Vector 16 HX A14V | |
| Alienware x16 R1 | |
| Asus ROG Strix Scar 16 G634JZR | |
| Alienware x16 R2 P120F | |
| Przeciętny Intel Core Ultra 9 185H, NVIDIA GeForce RTX 4080 Laptop GPU (n=1) | |
| Alienware m16 R2 | |
| WebXPRT 3 / Overall | |
| Lenovo Legion Pro 7 16IRX9H | |
| MSI Vector 16 HX A14V | |
| Asus ROG Strix Scar 16 G634JZR | |
| Alienware x16 R1 | |
| Alienware m16 R2 | |
| Alienware x16 R2 P120F | |
| Przeciętny Intel Core Ultra 9 185H, NVIDIA GeForce RTX 4080 Laptop GPU (n=1) | |
| WebXPRT 4 / Overall | |
| Lenovo Legion Pro 7 16IRX9H | |
| Asus ROG Strix Scar 16 G634JZR | |
| MSI Vector 16 HX A14V | |
| Alienware x16 R1 | |
| Alienware m16 R2 | |
| Alienware x16 R2 P120F | |
| Przeciętny Intel Core Ultra 9 185H, NVIDIA GeForce RTX 4080 Laptop GPU (n=1) | |
| Mozilla Kraken 1.1 / Total | |
| Alienware x16 R2 P120F | |
| Przeciętny Intel Core Ultra 9 185H, NVIDIA GeForce RTX 4080 Laptop GPU (n=1) | |
| Alienware m16 R2 | |
| Alienware x16 R1 | |
| MSI Vector 16 HX A14V | |
| Asus ROG Strix Scar 16 G634JZR | |
| Lenovo Legion Pro 7 16IRX9H | |
* ... im mniej tym lepiej
| PCMark 10 Score | 7251 pkt. | |
Pomoc | ||
| AIDA64 / Memory Copy | |
| Alienware x16 R2 P120F | |
| Przeciętny Intel Core Ultra 9 185H (69929 - 95718, n=19) | |
| Asus ROG Strix Scar 16 G634JZR | |
| Lenovo Legion Pro 7 16IRX9H | |
| MSI Vector 16 HX A14V | |
| Alienware x16 R1 | |
| Alienware m16 R2 | |
| AIDA64 / Memory Read | |
| Asus ROG Strix Scar 16 G634JZR | |
| Lenovo Legion Pro 7 16IRX9H | |
| MSI Vector 16 HX A14V | |
| Alienware x16 R2 P120F | |
| Przeciętny Intel Core Ultra 9 185H (64619 - 87768, n=19) | |
| Alienware m16 R2 | |
| Alienware x16 R1 | |
| AIDA64 / Memory Write | |
| Alienware x16 R1 | |
| Asus ROG Strix Scar 16 G634JZR | |
| MSI Vector 16 HX A14V | |
| Alienware x16 R2 P120F | |
| Przeciętny Intel Core Ultra 9 185H (51114 - 93871, n=19) | |
| Lenovo Legion Pro 7 16IRX9H | |
| Alienware m16 R2 | |
| AIDA64 / Memory Latency | |
| Przeciętny Intel Core Ultra 9 185H (121.4 - 259, n=19) | |
| Alienware x16 R2 P120F | |
| Alienware m16 R2 | |
| Alienware x16 R1 | |
| MSI Vector 16 HX A14V | |
| Asus ROG Strix Scar 16 G634JZR | |
| Lenovo Legion Pro 7 16IRX9H | |
* ... im mniej tym lepiej
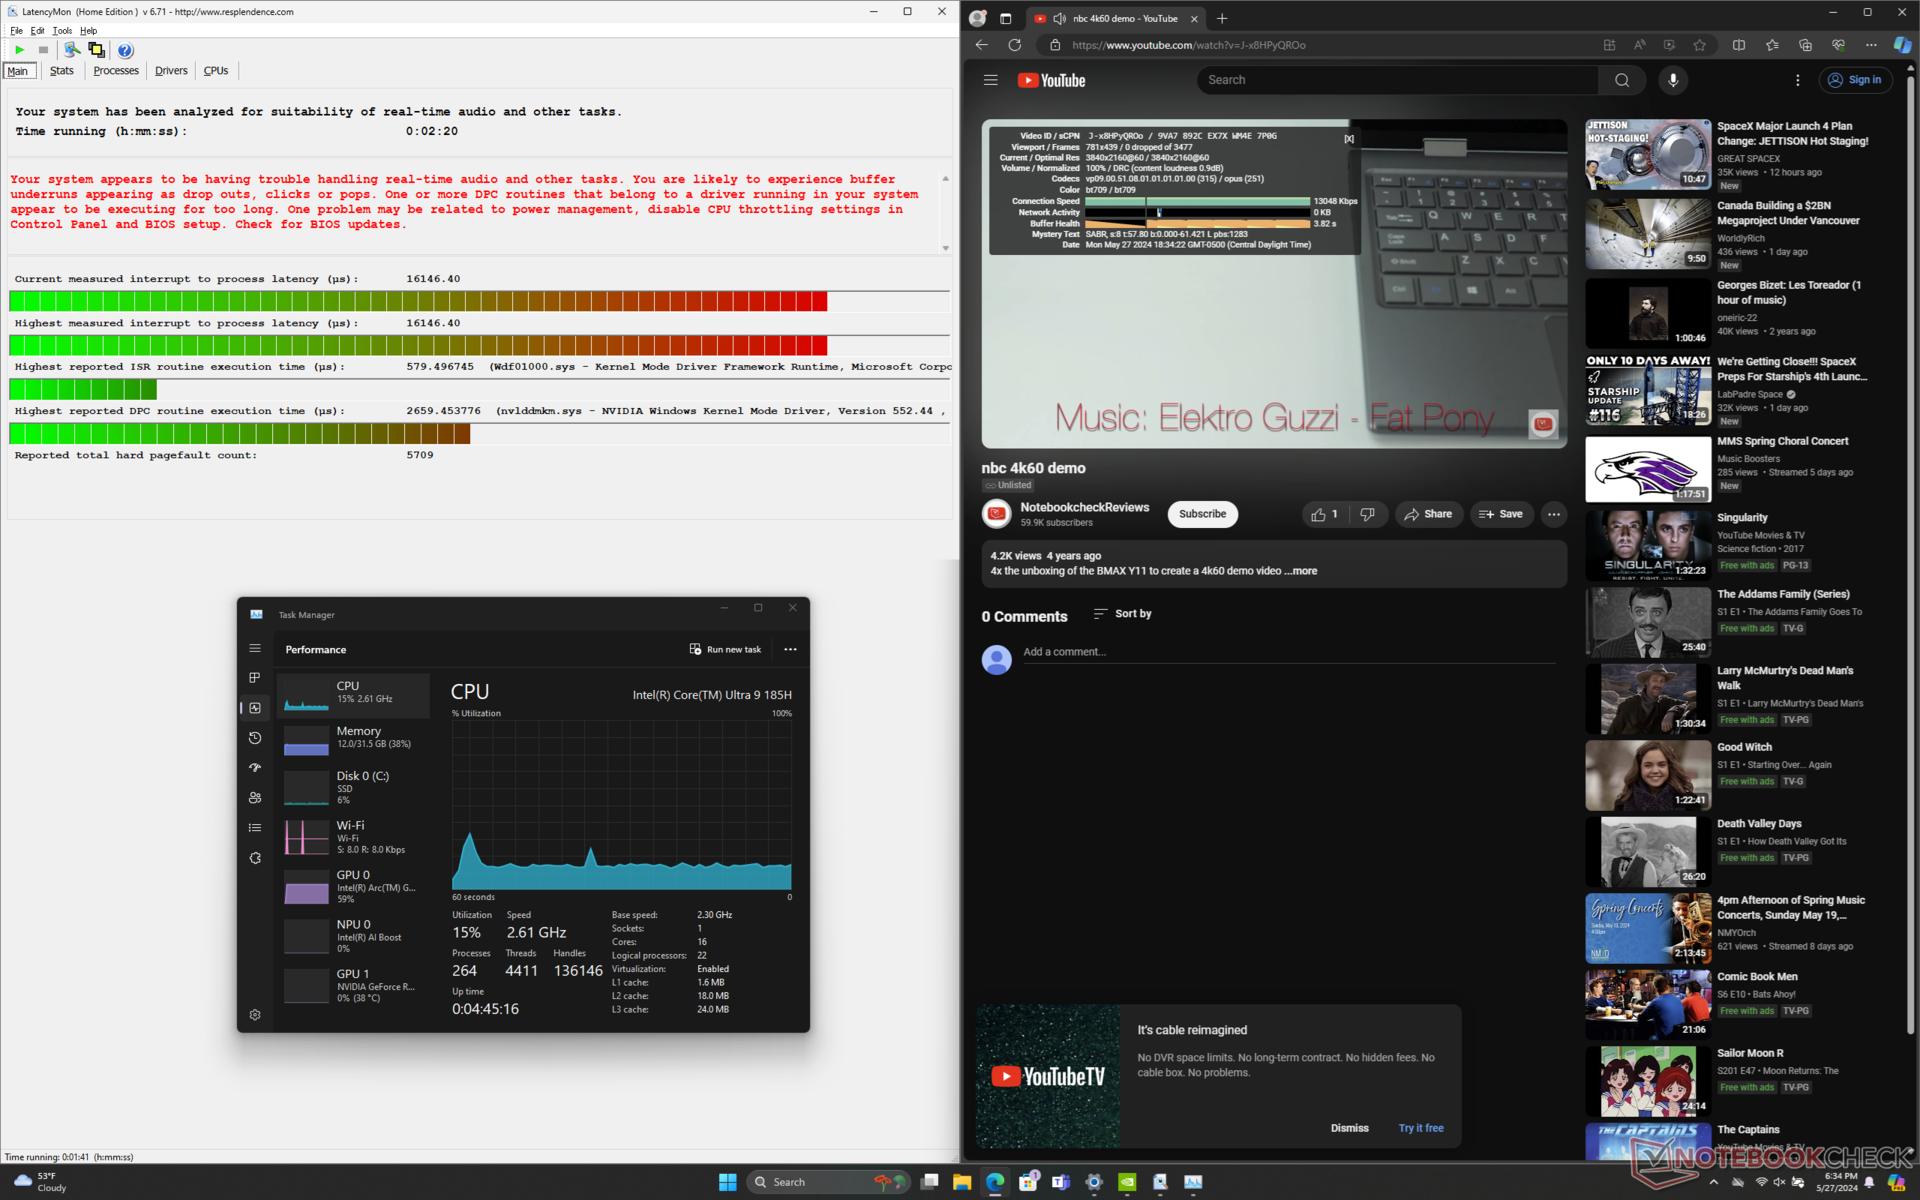
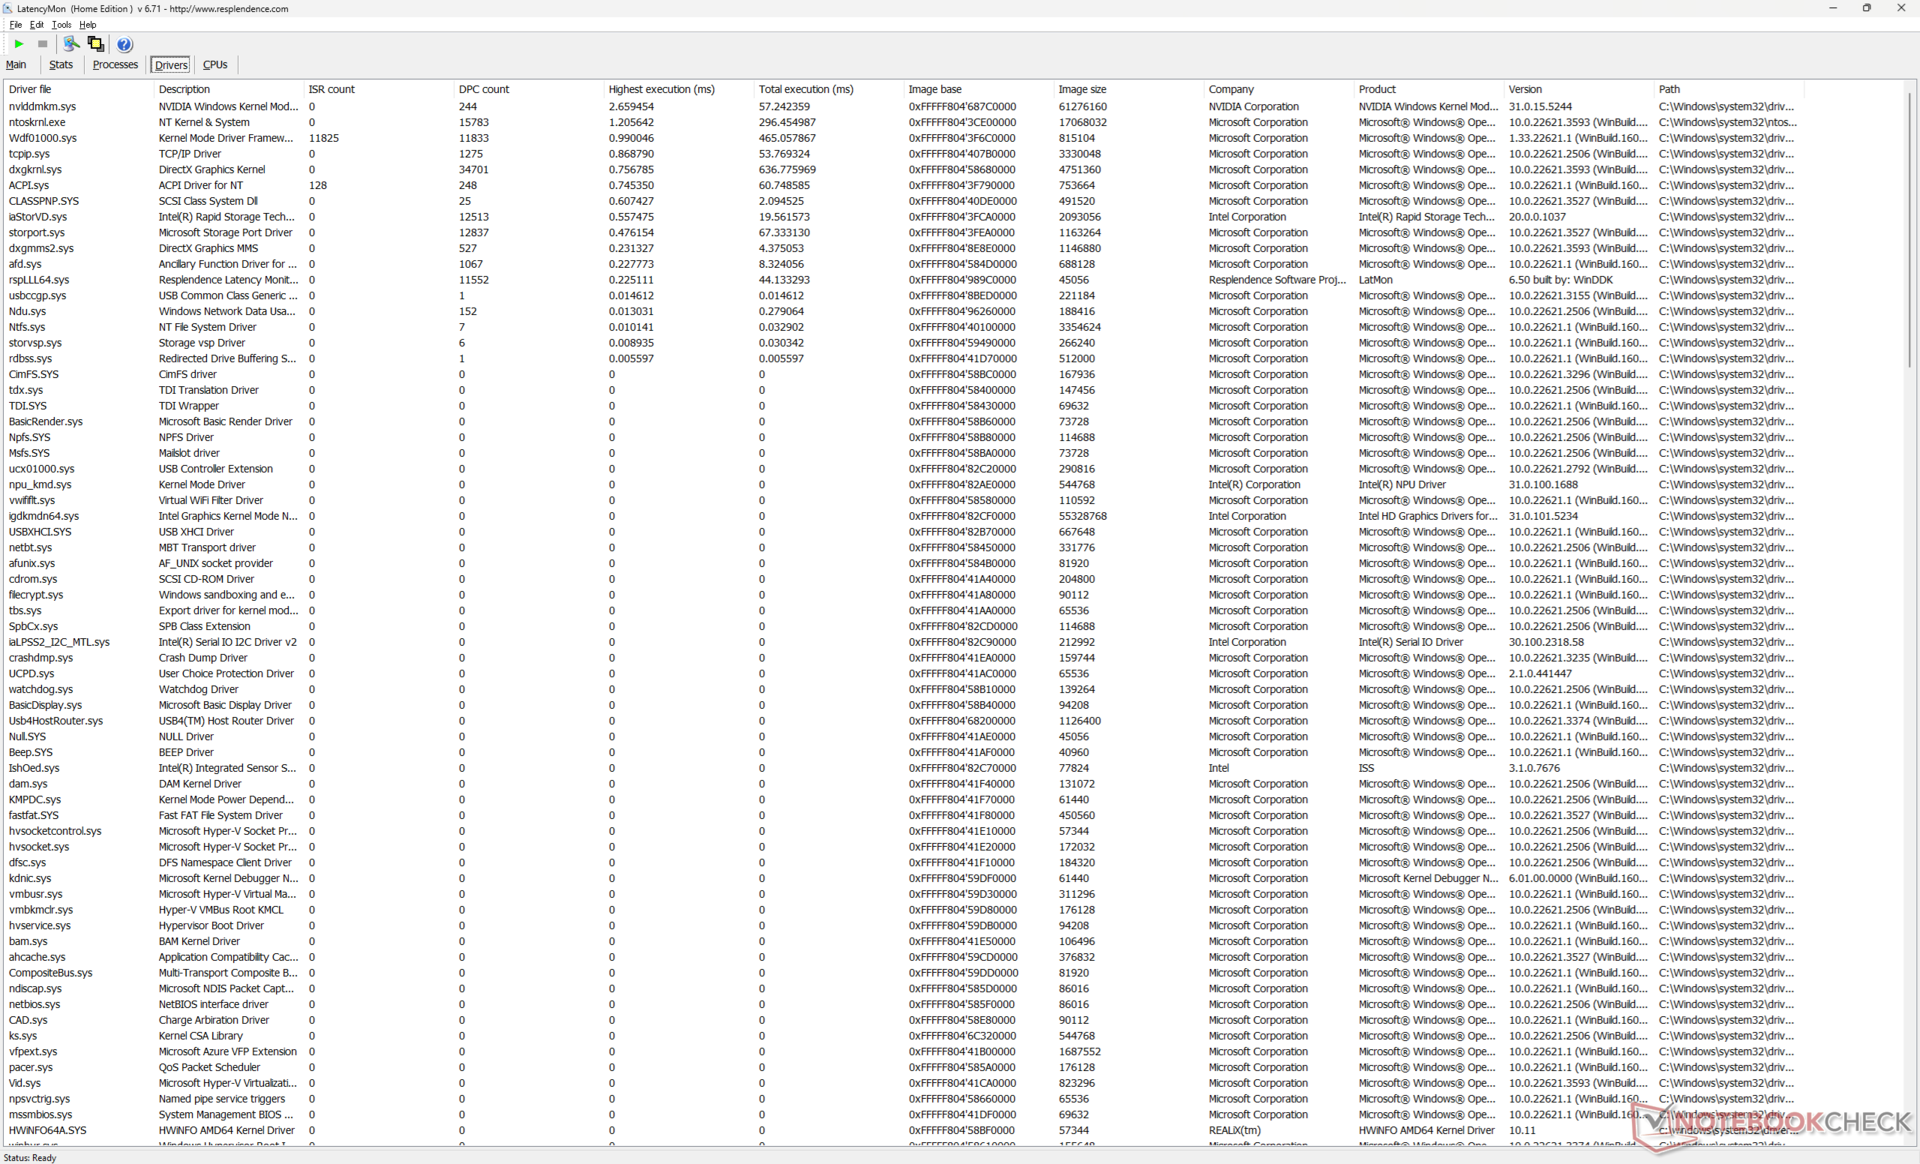
Opóźnienie DPC
LatencyMon ujawnia znaczące problemy z DPC podczas otwierania wielu kart przeglądarki na naszej stronie głównej, nawet po wielu próbach w trybie Optimus. Nie doświadczyliśmy takich problemów na oryginalnej karcie x16 R1. odtwarzanie wideo 4K przy 60 FPS jest poza tym idealne i nie odnotowaliśmy żadnych spadków klatek.
| DPC Latencies / LatencyMon - interrupt to process latency (max), Web, Youtube, Prime95 | |
| Alienware x16 R2 P120F | |
| Asus ROG Strix Scar 16 G634JZR | |
| Alienware m16 R2 | |
| MSI Vector 16 HX A14V | |
| Alienware x16 R1 | |
| Lenovo Legion Pro 7 16IRX9H | |
* ... im mniej tym lepiej
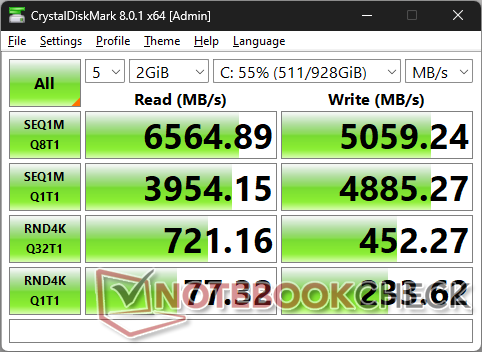
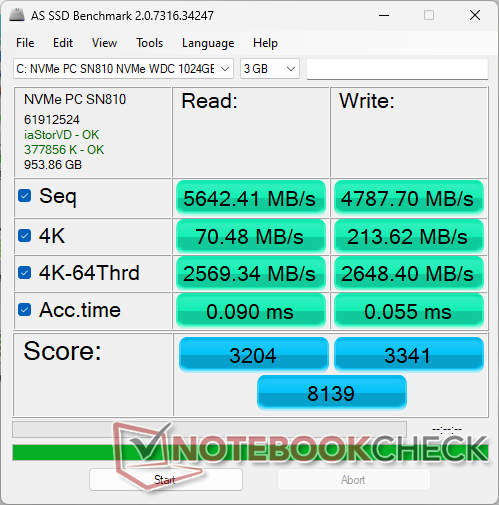
Urządzenia pamięci masowej
Nasza jednostka testowa jest dostarczana z WDC PC SN810 zamiast SK Hynix PC801 z zeszłorocznego modelu. Dysk Western Digital jest w stanie utrzymać maksymalne prędkości transferu dłużej niż SK Hynix, co pokazuje poniższy wykres pętli DiskSpd, ale prędkości zapisu są generalnie wolniejsze.

| Drive Performance Rating - Percent | |
| Lenovo Legion Pro 7 16IRX9H | |
| Alienware x16 R1 | |
| Alienware x16 R2 P120F | |
| Alienware m16 R2 | |
| Asus ROG Strix Scar 16 G634JZR | |
| MSI Vector 16 HX A14V | |
* ... im mniej tym lepiej
Disk Throttling: DiskSpd Read Loop, Queue Depth 8
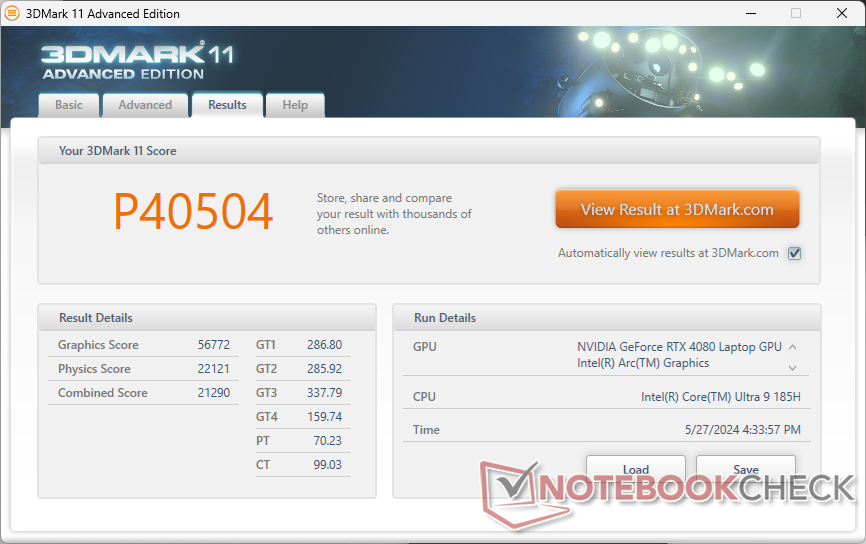
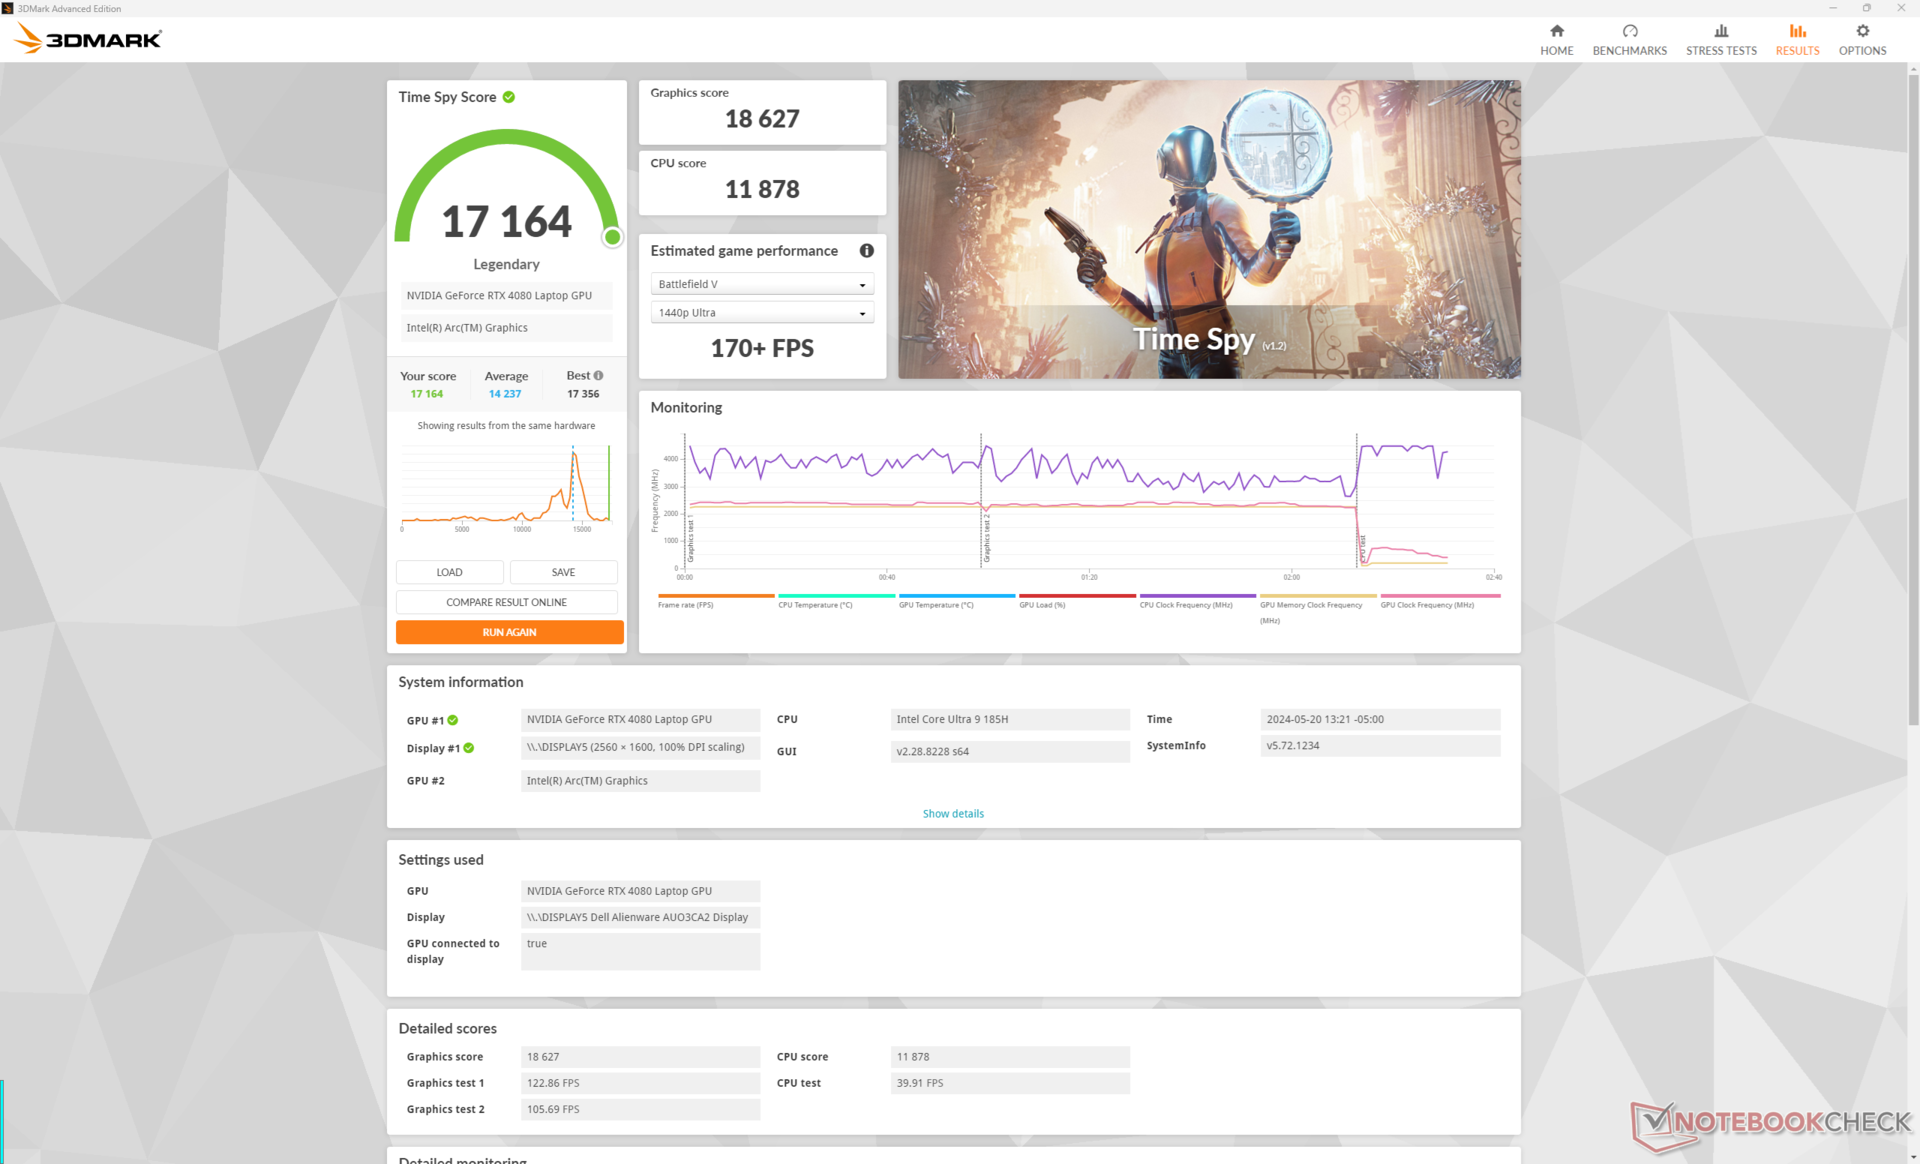
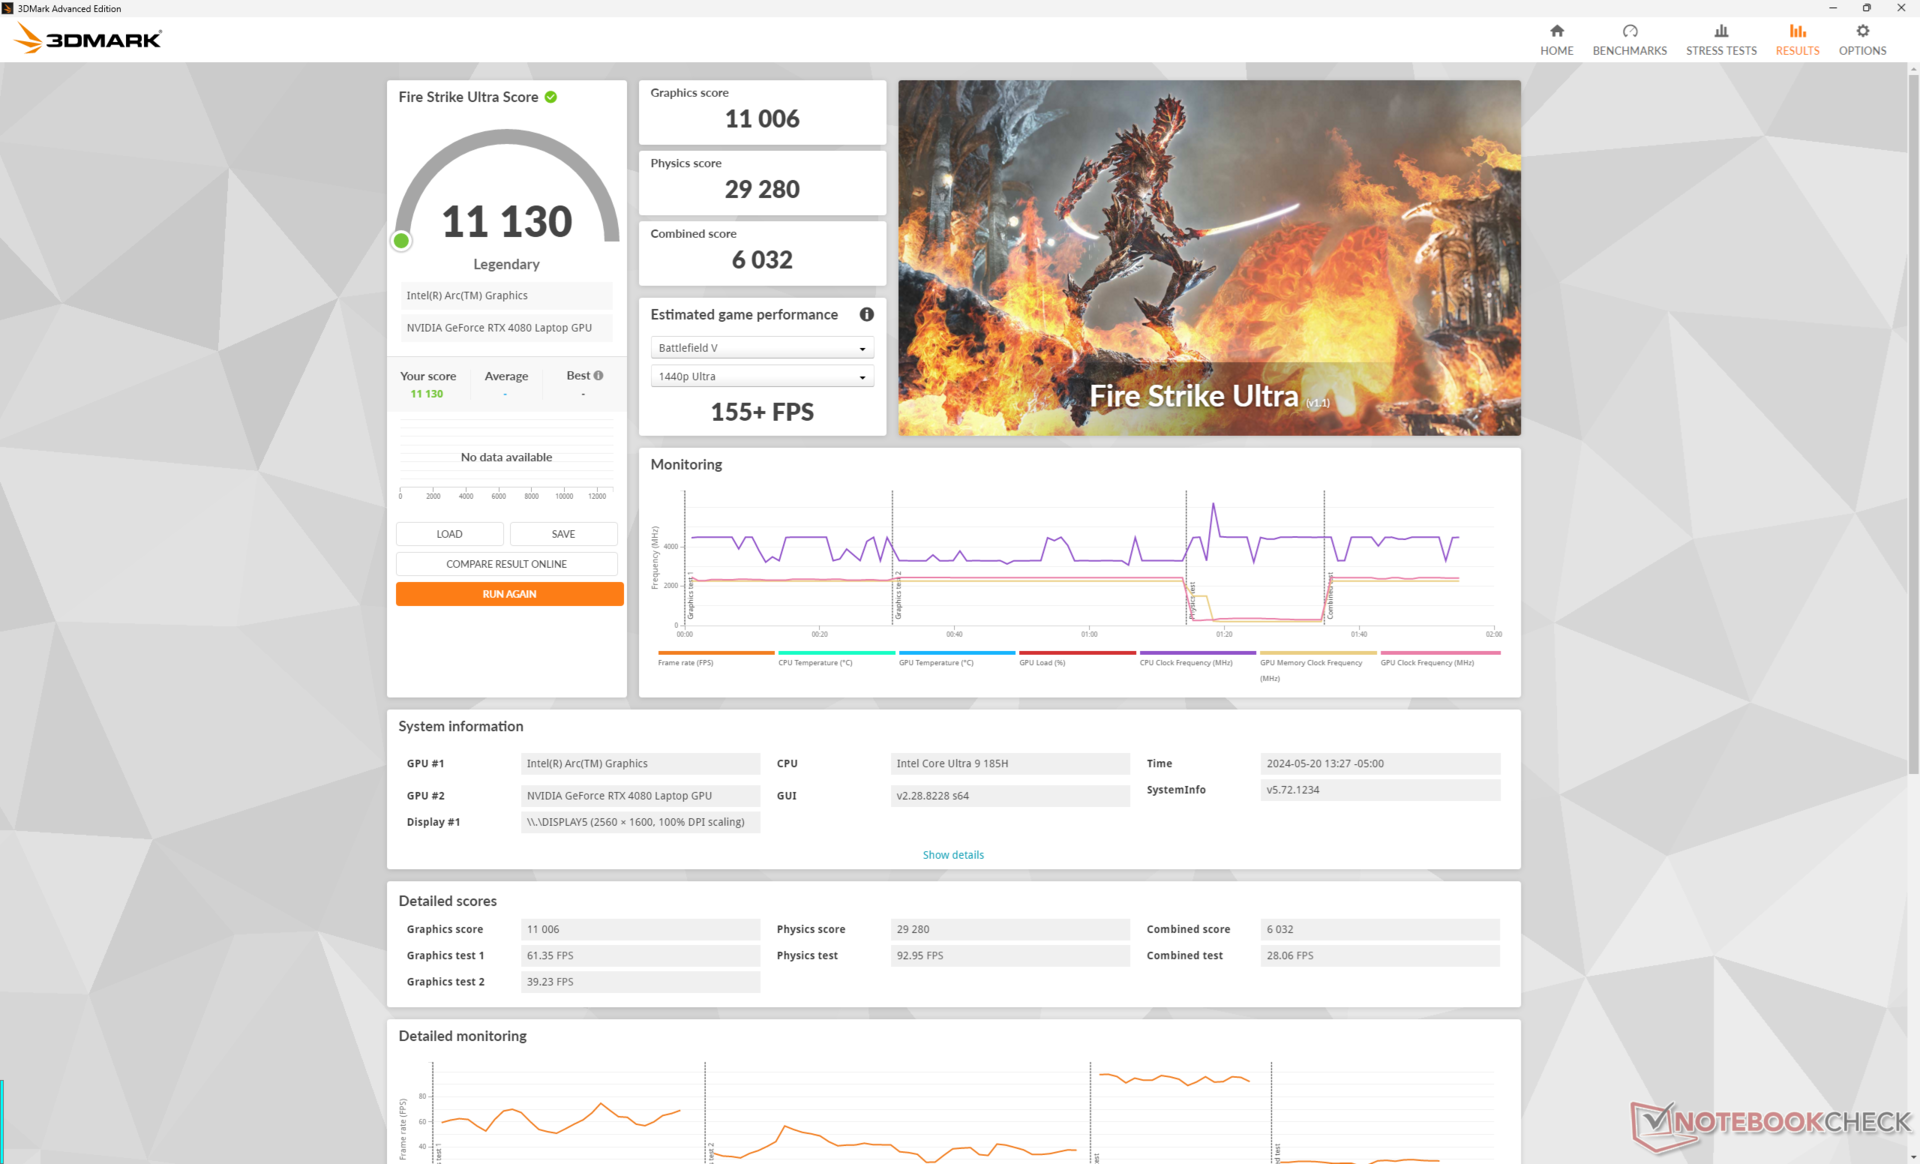
Wydajność GPU
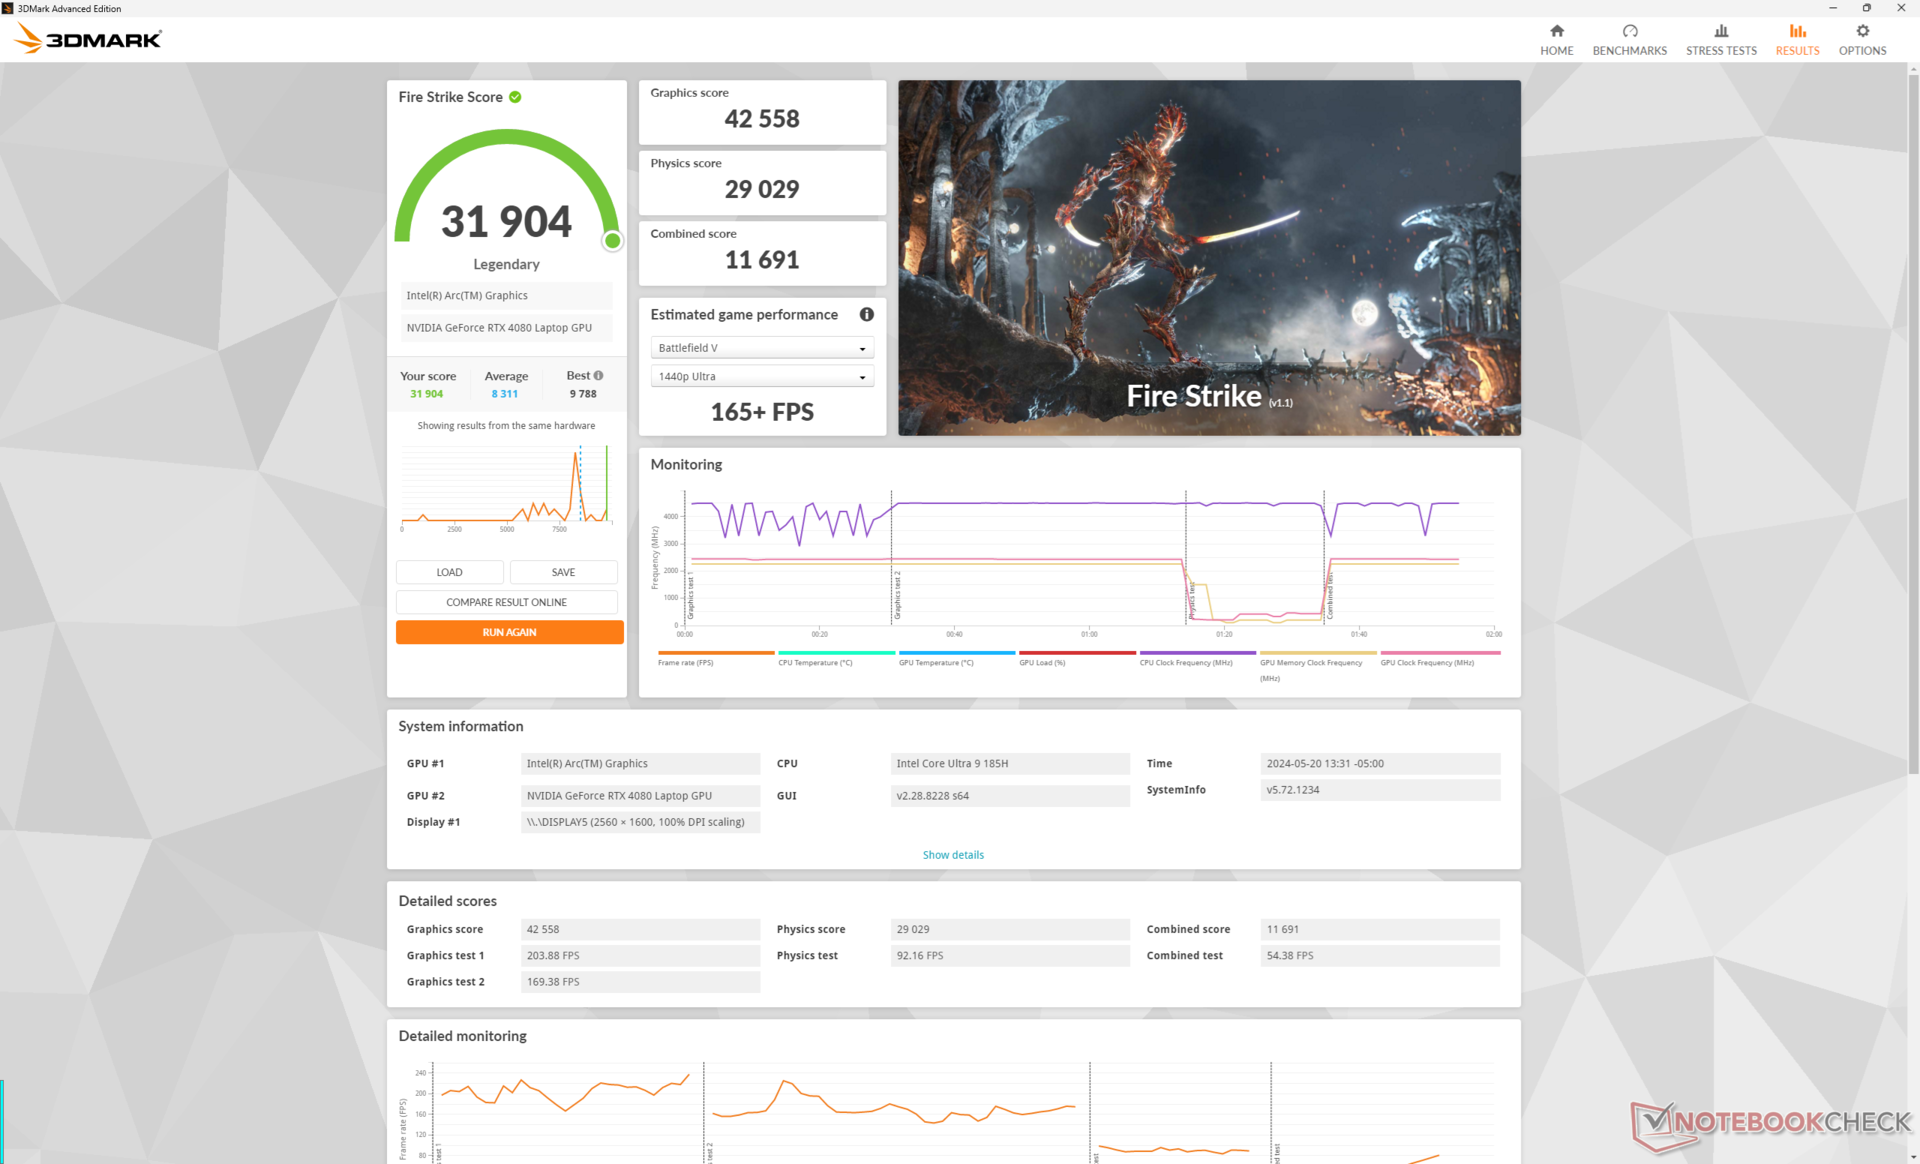
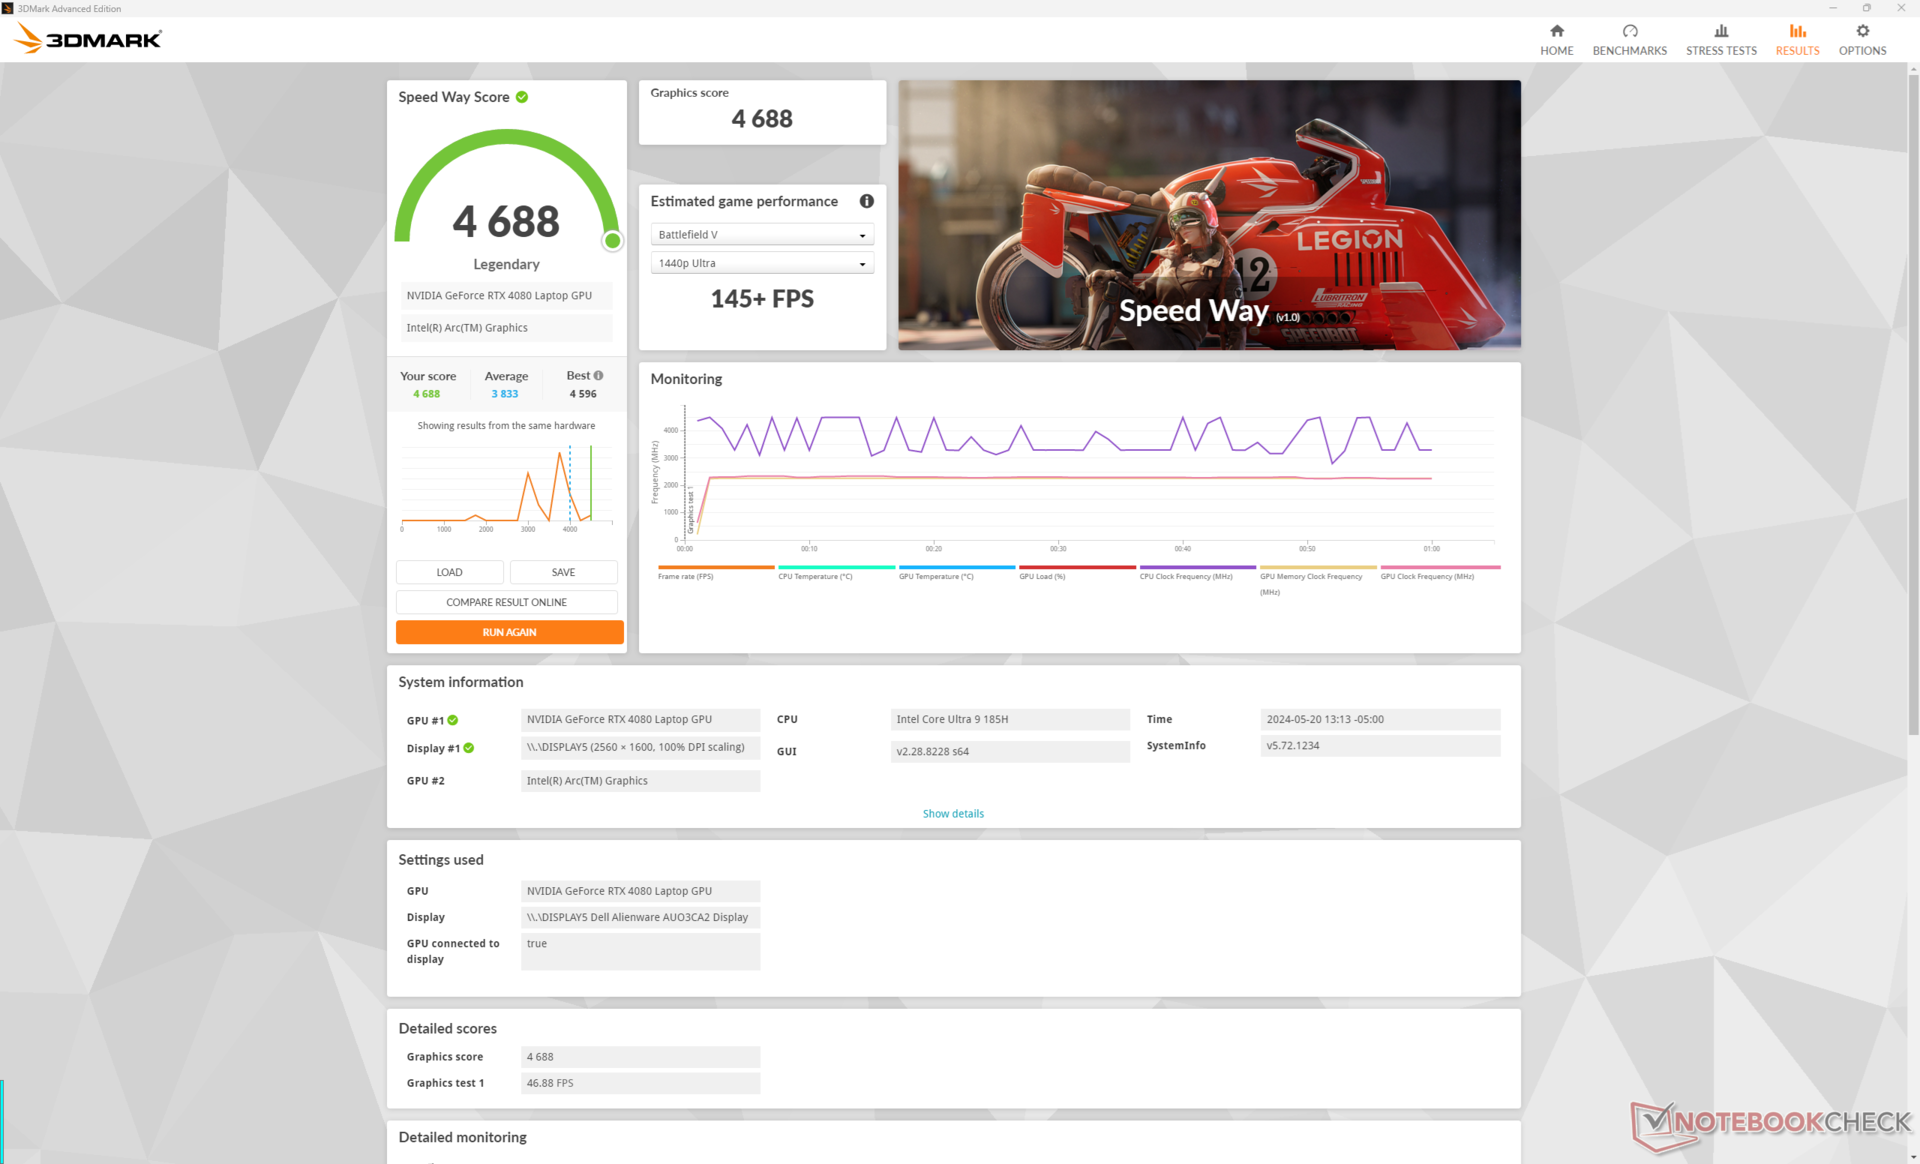
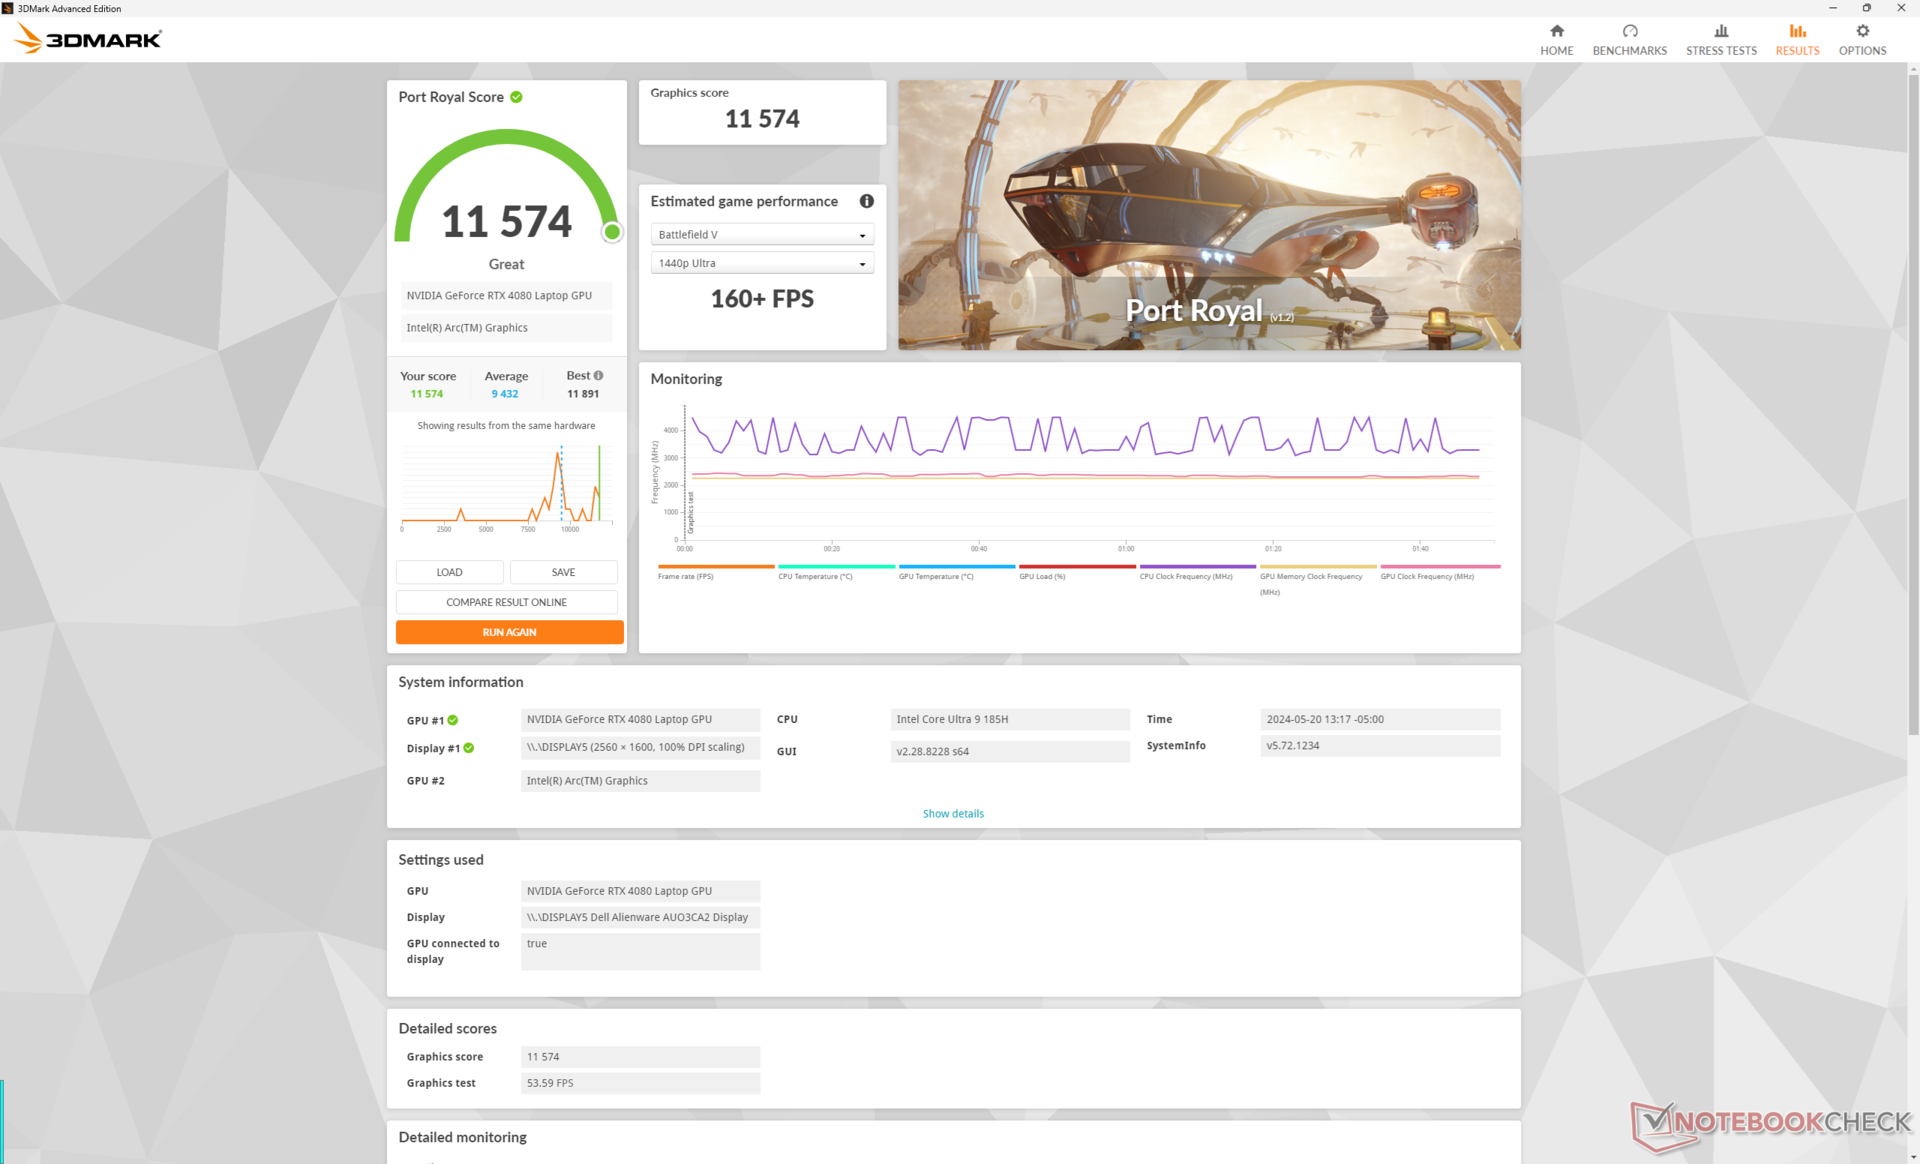
175 W mobilna karta graficzna GeForce RTX 4080 GPU pozostaje taki sam, choć wyniki 3DMark są o około 5 procent wolniejsze niż te, które odnotowaliśmy na x16 R1. Aktualizacja do RTX 4090 poprawi wydajność o zaledwie 5 do 15 procent, podczas gdy obniżenie do konfiguracji RTX 4070 lub 4060 zmniejszy wydajność odpowiednio o 30 i 45 procent.
| Profil zasilania | Wynik grafiki | Wynik fizyki | Wynik łączny |
| Tryb Overdrive | 42558 | 29029 | 11691 |
| Tryb wydajności | 40773 (-4%) | 26070 (-10%) | 12450 (-7%) |
| Tryb zrównoważony | 40593 (-5%) | 26746 (-8%) | 12237 (-5%) |
| Zasilanie bateryjne | 21754 (-49%) | 25880 (-11%) | 9863 (-16%) |
Uruchomienie systemu w trybie wydajności zamiast w trybie Overdrive nieznacznie wpłynie na ogólną wydajność, jak pokazuje nasza tabela wyników Fire Strike powyżej. Co ciekawe, różnica między trybami Performance i Balanced jest stosunkowo mniejsza.
| 3DMark Performance Rating - Percent | |
| KFA2 GeForce RTX 4080 SG | |
| Lenovo Legion Pro 7 RTX4090 -1! | |
| Alienware x16 R1 | |
| Alienware m16 R1 AMD | |
| Alienware x16 R2 P120F | |
| Przeciętny NVIDIA GeForce RTX 4080 Laptop GPU | |
| Lenovo Legion 7 16IAX7-82TD004SGE -2! | |
| Alienware m16 R2 | |
| MSI Stealth 16 Mercedes-AMG Motorsport A13VG -2! | |
| MSI Raider GE68HX 13VF | |
| Framework Laptop 16 | |
| Lenovo Legion S7 16ARHA7 -1! | |
| Asus ROG Zephyrus M16 GU603H -2! | |
| 3DMark 11 - 1280x720 Performance GPU | |
| KFA2 GeForce RTX 4080 SG | |
| Lenovo Legion Pro 7 RTX4090 | |
| Alienware x16 R1 | |
| Przeciętny NVIDIA GeForce RTX 4080 Laptop GPU (45199 - 63128, n=24) | |
| Alienware x16 R2 P120F | |
| Alienware m16 R1 AMD | |
| Lenovo Legion 7 16IAX7-82TD004SGE | |
| Alienware m16 R2 | |
| Framework Laptop 16 | |
| MSI Raider GE68HX 13VF | |
| Lenovo Legion S7 16ARHA7 | |
| Asus ROG Zephyrus M16 GU603H | |
| 3DMark 11 Performance | 40504 pkt. | |
| 3DMark Fire Strike Score | 31904 pkt. | |
| 3DMark Time Spy Score | 17164 pkt. | |
Pomoc | ||
* ... im mniej tym lepiej
Wydajność w grach
Co rozczarowujące, wydajność w grach była konsekwentnie wolniejsza niż ta, którą odnotowaliśmy na x16 R1 o około 5 do 15 procent. Większe delta występowały w niższych rozdzielczościach, podczas gdy mniejsze delta występowały w wyższych rozdzielczościach, co jest zgodne z wolniejszymi wynikami surowej wydajności procesora w porównaniu do Core i9-14900HK, o których wspomniano powyżej.
| Performance Rating - Percent | |
| KFA2 GeForce RTX 4080 SG | |
| Lenovo Legion Pro 7 RTX4090 -1! | |
| Alienware m16 R1 AMD | |
| Alienware x16 R1 -1! | |
| MSI Raider GE68HX 13VF | |
| Alienware x16 R2 P120F | |
| Lenovo Legion 7 16IAX7-82TD004SGE | |
| Alienware m16 R2 | |
| MSI Stealth 16 Mercedes-AMG Motorsport A13VG -1! | |
| Asus ROG Zephyrus M16 GU603H | |
| Framework Laptop 16 | |
| Lenovo Legion S7 16ARHA7 -1! | |
| The Witcher 3 - 1920x1080 Ultra Graphics & Postprocessing (HBAO+) | |
| KFA2 GeForce RTX 4080 SG | |
| Lenovo Legion Pro 7 RTX4090 | |
| Alienware m16 R1 AMD | |
| Alienware x16 R2 P120F | |
| Alienware x16 R1 | |
| Alienware m16 R2 | |
| Lenovo Legion 7 16IAX7-82TD004SGE | |
| MSI Stealth 16 Mercedes-AMG Motorsport A13VG | |
| MSI Raider GE68HX 13VF | |
| Lenovo Legion S7 16ARHA7 | |
| Asus ROG Zephyrus M16 GU603H | |
| Framework Laptop 16 | |
| Final Fantasy XV Benchmark - 1920x1080 High Quality | |
| KFA2 GeForce RTX 4080 SG | |
| Lenovo Legion Pro 7 RTX4090 | |
| Alienware m16 R1 AMD | |
| Alienware x16 R1 | |
| Alienware x16 R2 P120F | |
| Lenovo Legion 7 16IAX7-82TD004SGE | |
| Alienware m16 R2 | |
| MSI Raider GE68HX 13VF | |
| MSI Stealth 16 Mercedes-AMG Motorsport A13VG | |
| Lenovo Legion S7 16ARHA7 | |
| Framework Laptop 16 | |
| Asus ROG Zephyrus M16 GU603H | |
| Strange Brigade - 1920x1080 ultra AA:ultra AF:16 | |
| KFA2 GeForce RTX 4080 SG | |
| Alienware m16 R1 AMD | |
| Lenovo Legion Pro 7 RTX4090 | |
| Alienware x16 R1 | |
| Alienware x16 R2 P120F | |
| Alienware m16 R2 | |
| MSI Raider GE68HX 13VF | |
| MSI Stealth 16 Mercedes-AMG Motorsport A13VG | |
| Lenovo Legion S7 16ARHA7 | |
| Framework Laptop 16 | |
| Lenovo Legion 7 16IAX7-82TD004SGE | |
| Asus ROG Zephyrus M16 GU603H | |
| Dota 2 Reborn - 1920x1080 ultra (3/3) best looking | |
| KFA2 GeForce RTX 4080 SG | |
| MSI Raider GE68HX 13VF | |
| Lenovo Legion Pro 7 RTX4090 | |
| Lenovo Legion 7 16IAX7-82TD004SGE | |
| Alienware m16 R1 AMD | |
| Alienware x16 R1 | |
| Alienware m16 R2 | |
| Asus ROG Zephyrus M16 GU603H | |
| Framework Laptop 16 | |
| Alienware x16 R2 P120F | |
| MSI Stealth 16 Mercedes-AMG Motorsport A13VG | |
| Lenovo Legion S7 16ARHA7 | |
| X-Plane 11.11 - 1920x1080 high (fps_test=3) | |
| KFA2 GeForce RTX 4080 SG | |
| MSI Raider GE68HX 13VF | |
| Lenovo Legion Pro 7 RTX4090 | |
| Lenovo Legion 7 16IAX7-82TD004SGE | |
| Alienware m16 R1 AMD | |
| Alienware x16 R1 | |
| MSI Stealth 16 Mercedes-AMG Motorsport A13VG | |
| Alienware m16 R2 | |
| Alienware x16 R2 P120F | |
| Asus ROG Zephyrus M16 GU603H | |
| Framework Laptop 16 | |
| Lenovo Legion S7 16ARHA7 | |
| Far Cry 5 - 1920x1080 Ultra Preset AA:T | |
| KFA2 GeForce RTX 4080 SG | |
| Lenovo Legion 7 16IAX7-82TD004SGE | |
| MSI Raider GE68HX 13VF | |
| Alienware m16 R1 AMD | |
| Alienware m16 R2 | |
| Framework Laptop 16 | |
| Alienware x16 R2 P120F | |
| Asus ROG Zephyrus M16 GU603H | |
| Baldur's Gate 3 | |
| 1920x1080 Ultra Preset | |
| Alienware x16 R2 P120F | |
| Przeciętny NVIDIA GeForce RTX 4080 Laptop GPU (111.8 - 181.2, n=6) | |
| Alienware m16 R2 | |
| Framework Laptop 16 | |
| 2560x1440 Ultra Preset | |
| Alienware x16 R2 P120F | |
| Przeciętny NVIDIA GeForce RTX 4080 Laptop GPU (88.3 - 129.3, n=6) | |
| Alienware m16 R2 | |
| Framework Laptop 16 | |
| 3840x2160 Ultra Preset | |
| Alienware x16 R2 P120F | |
| Przeciętny NVIDIA GeForce RTX 4080 Laptop GPU (48.8 - 68.4, n=4) | |
| Alienware m16 R2 | |
| Framework Laptop 16 | |
| 3840x2160 Ultra Preset + Quality DLSS | |
| Alienware x16 R2 P120F | |
| Przeciętny NVIDIA GeForce RTX 4080 Laptop GPU (90.9 - 104.4, n=2) | |
| Dota 2 Reborn | |
| 1920x1080 ultra (3/3) best looking | |
| KFA2 GeForce RTX 4080 SG | |
| MSI Raider GE68HX 13VF | |
| Lenovo Legion Pro 7 RTX4090 | |
| Lenovo Legion 7 16IAX7-82TD004SGE | |
| Alienware m16 R1 AMD | |
| Przeciętny NVIDIA GeForce RTX 4080 Laptop GPU (133 - 194.7, n=23) | |
| Alienware x16 R1 | |
| Alienware m16 R2 | |
| Asus ROG Zephyrus M16 GU603H | |
| Framework Laptop 16 | |
| Alienware x16 R2 P120F | |
| MSI Stealth 16 Mercedes-AMG Motorsport A13VG | |
| Lenovo Legion S7 16ARHA7 | |
| 3840x2160 ultra (3/3) best looking | |
| KFA2 GeForce RTX 4080 SG | |
| Lenovo Legion Pro 7 RTX4090 | |
| Alienware m16 R1 AMD | |
| Przeciętny NVIDIA GeForce RTX 4080 Laptop GPU (116.7 - 182.6, n=14) | |
| Alienware m16 R2 | |
| Alienware x16 R1 | |
| Alienware x16 R2 P120F | |
| Framework Laptop 16 | |
| Final Fantasy XV Benchmark | |
| 1920x1080 High Quality | |
| KFA2 GeForce RTX 4080 SG | |
| Lenovo Legion Pro 7 RTX4090 | |
| Alienware m16 R1 AMD | |
| Alienware x16 R1 | |
| Przeciętny NVIDIA GeForce RTX 4080 Laptop GPU (129 - 182.1, n=23) | |
| Alienware x16 R2 P120F | |
| Lenovo Legion 7 16IAX7-82TD004SGE | |
| Alienware m16 R2 | |
| MSI Raider GE68HX 13VF | |
| MSI Stealth 16 Mercedes-AMG Motorsport A13VG | |
| Lenovo Legion S7 16ARHA7 | |
| Framework Laptop 16 | |
| Asus ROG Zephyrus M16 GU603H | |
| 2560x1440 High Quality | |
| KFA2 GeForce RTX 4080 SG | |
| Lenovo Legion Pro 7 RTX4090 | |
| Alienware x16 R1 | |
| Alienware m16 R1 AMD | |
| Przeciętny NVIDIA GeForce RTX 4080 Laptop GPU (98 - 142, n=22) | |
| Alienware x16 R2 P120F | |
| Lenovo Legion 7 16IAX7-82TD004SGE | |
| Alienware m16 R2 | |
| MSI Stealth 16 Mercedes-AMG Motorsport A13VG | |
| Lenovo Legion S7 16ARHA7 | |
| Framework Laptop 16 | |
| Asus ROG Zephyrus M16 GU603H | |
| 3840x2160 High Quality | |
| KFA2 GeForce RTX 4080 SG | |
| Lenovo Legion Pro 7 RTX4090 | |
| Alienware x16 R1 | |
| Alienware m16 R1 AMD | |
| Przeciętny NVIDIA GeForce RTX 4080 Laptop GPU (60.8 - 79.5, n=13) | |
| Alienware x16 R2 P120F | |
| Alienware m16 R2 | |
| Framework Laptop 16 | |
| Cyberpunk 2077 2.2 Phantom Liberty | |
| 1920x1080 Ultra Preset (FSR off) | |
| Przeciętny NVIDIA GeForce RTX 4080 Laptop GPU (83.9 - 127.1, n=13) | |
| Alienware x16 R2 P120F | |
| Alienware m16 R2 | |
| Framework Laptop 16 | |
| 2560x1440 Ultra Preset (FSR off) | |
| Przeciętny NVIDIA GeForce RTX 4080 Laptop GPU (56.2 - 86.3, n=17) | |
| Alienware x16 R2 P120F | |
| Alienware m16 R2 | |
| Framework Laptop 16 | |
| 3840x2160 Ultra Preset (FSR off) | |
| Przeciętny NVIDIA GeForce RTX 4080 Laptop GPU (25.8 - 39.8, n=7) | |
| Alienware x16 R2 P120F | |
| Alienware m16 R2 | |
| Framework Laptop 16 | |
| 1920x1080 Ray Tracing Ultra Preset (DLSS off) | |
| Alienware x16 R2 P120F | |
| Przeciętny NVIDIA GeForce RTX 4080 Laptop GPU (43.8 - 67.2, n=12) | |
| Alienware m16 R2 | |
| Framework Laptop 16 | |
| 3840x2160 Ray Tracing Ultra Preset (DLSS off, no Path Tracing) | |
| Przeciętny NVIDIA GeForce RTX 4080 Laptop GPU (16 - 20, n=4) | |
| Alienware x16 R2 P120F | |
| Alienware m16 R2 | |
| Far Cry 5 | |
| 1920x1080 Ultra Preset AA:T | |
| KFA2 GeForce RTX 4080 SG | |
| Lenovo Legion 7 16IAX7-82TD004SGE | |
| Przeciętny NVIDIA GeForce RTX 4080 Laptop GPU (114 - 162, n=11) | |
| MSI Raider GE68HX 13VF | |
| Alienware m16 R1 AMD | |
| Alienware m16 R2 | |
| Framework Laptop 16 | |
| Alienware x16 R2 P120F | |
| Asus ROG Zephyrus M16 GU603H | |
| 2560x1440 Ultra Preset AA:T | |
| KFA2 GeForce RTX 4080 SG | |
| Przeciętny NVIDIA GeForce RTX 4080 Laptop GPU (114 - 157, n=10) | |
| Alienware m16 R1 AMD | |
| Lenovo Legion 7 16IAX7-82TD004SGE | |
| Alienware m16 R2 | |
| Alienware x16 R2 P120F | |
| Asus ROG Zephyrus M16 GU603H | |
| Framework Laptop 16 | |
| 3840x2160 Ultra Preset AA:T | |
| KFA2 GeForce RTX 4080 SG | |
| Alienware m16 R1 AMD | |
| Alienware x16 R2 P120F | |
| Przeciętny NVIDIA GeForce RTX 4080 Laptop GPU (71 - 97, n=6) | |
| Alienware m16 R2 | |
| Framework Laptop 16 | |
Witcher 3 FPS Chart
| low | med. | high | ultra | QHD | 4K DLSS | 4K | |
|---|---|---|---|---|---|---|---|
| The Witcher 3 (2015) | 364.4 | 340.7 | 292.1 | 166.3 | 118.5 | ||
| Dota 2 Reborn (2015) | 155.7 | 142 | 139.2 | 133 | 127.9 | ||
| Final Fantasy XV Benchmark (2018) | 188 | 169.3 | 139.8 | 120.8 | 70.2 | ||
| X-Plane 11.11 (2018) | 134 | 117.4 | 89.3 | 78 | |||
| Far Cry 5 (2018) | 137 | 127 | 122 | 114 | 114 | 91 | |
| Strange Brigade (2018) | 427 | 336 | 317 | 293 | 226 | 112.9 | |
| Tiny Tina's Wonderlands (2022) | 220.8 | 199.6 | 166.7 | 144.5 | 99 | 50.1 | |
| F1 22 (2022) | 219 | 211 | 185.7 | 108.5 | 65.6 | 36.6 | |
| Baldur's Gate 3 (2023) | 186.8 | 172.9 | 161.2 | 159.4 | 124.3 | 104.4 | 65 |
| Cyberpunk 2077 2.2 Phantom Liberty (2023) | 121.5 | 118.7 | 109 | 99.7 | 75.4 | 32.5 |
Emisje
Hałas systemowy
Wentylatory w x16 R2 są w stanie pozostać cichsze przez dłuższy czas, zanim będą musiały zwiększyć prędkość i hałas. W przeciwnym razie, pułap hałasu jest podobny do tego, który zarejestrowaliśmy na x16 R1 na poziomie około 50 dB(A) i 54 dB(A) podczas grania odpowiednio w trybie Performance i Overdrive. Proszę zauważyć, że hałas wentylatora podczas grania w trybie zrównoważonym byłby dokładnie taki sam jak w trybie wydajności, co pokrywa się z naszymi wynikami 3DMark powyżej.
Hałas
| luz |
| 23.8 / 28.5 / 28.5 dB |
| obciążenie |
| 28.8 / 54.2 dB |
 | ||
30 dB cichy 40 dB(A) słyszalny 50 dB(A) irytujący |
||
min: | ||
| Alienware x16 R2 P120F NVIDIA GeForce RTX 4080 Laptop GPU, Ultra 9 185H, WDC PC SN810 1TB | Alienware x16 R1 NVIDIA GeForce RTX 4080 Laptop GPU, i9-13900HK, SK hynix PC801 HFS001TEJ9X101N | Alienware m16 R2 NVIDIA GeForce RTX 4070 Laptop GPU, Ultra 7 155H, Samsung PM9A1 MZVL21T0HCLR | Asus ROG Strix Scar 16 G634JZR NVIDIA GeForce RTX 4080 Laptop GPU, i9-14900HX, SK hynix PC801 HFS002TEJ9X101N | Lenovo Legion Pro 7 16IRX9H NVIDIA GeForce RTX 4080 Laptop GPU, i9-14900HX, SK Hynix HFS001TEJ9X115N | MSI Vector 16 HX A14V NVIDIA GeForce RTX 4080 Laptop GPU, i9-14900HX, WD PC SN560 SDDPNQE-1T00 | |
|---|---|---|---|---|---|---|
| Noise | -2% | -3% | -20% | -22% | -28% | |
| wyłączone / środowisko * | 23.4 | 22.7 3% | 24.7 -6% | 21.07 10% | 24 -3% | 23.2 1% |
| Idle Minimum * | 23.8 | 23.1 3% | 25.3 -6% | 29.75 -25% | 25 -5% | 33.5 -41% |
| Idle Average * | 28.5 | 25.8 9% | 25.3 11% | 29.75 -4% | 30 -5% | 33.5 -18% |
| Idle Maximum * | 28.5 | 25.8 9% | 25.3 11% | 29.75 -4% | 45 -58% | 33.5 -18% |
| Load Average * | 28.8 | 39.3 -36% | 31.7 -10% | 54.85 -90% | 50 -74% | 52.1 -81% |
| Witcher 3 ultra * | 49.5 | 49.9 -1% | 53.8 -9% | 57.8 -17% | 54 -9% | 62 -25% |
| Load Maximum * | 54.2 | 54.8 -1% | 62 -14% | 58 -7% | 56 -3% | 62 -14% |
* ... im mniej tym lepiej
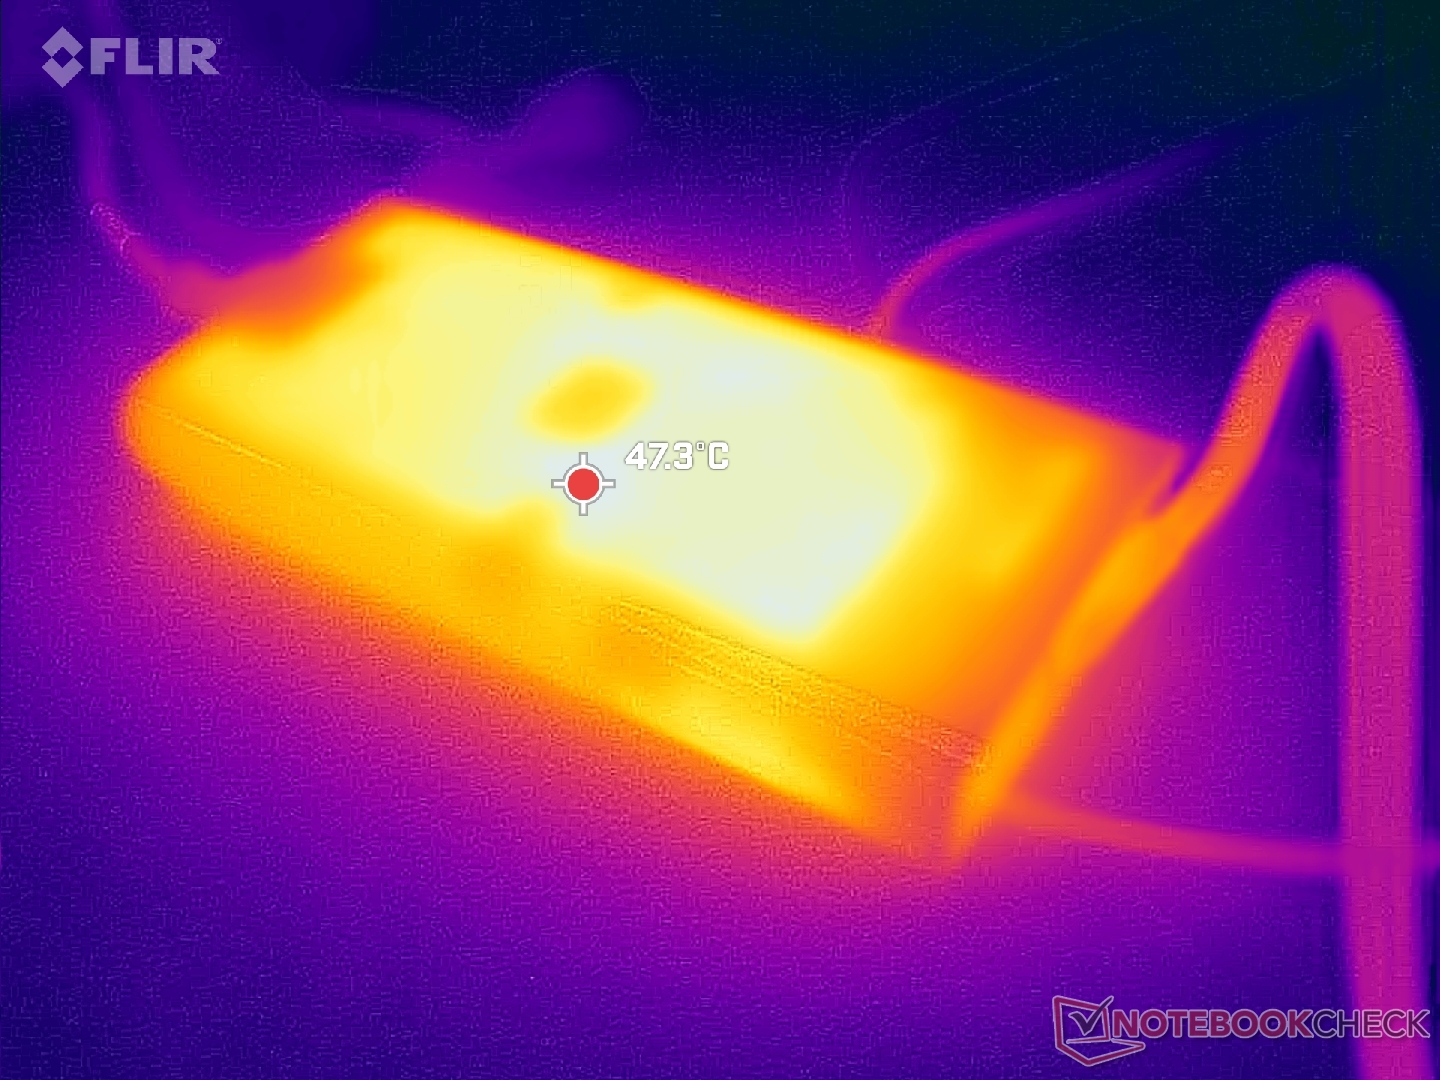
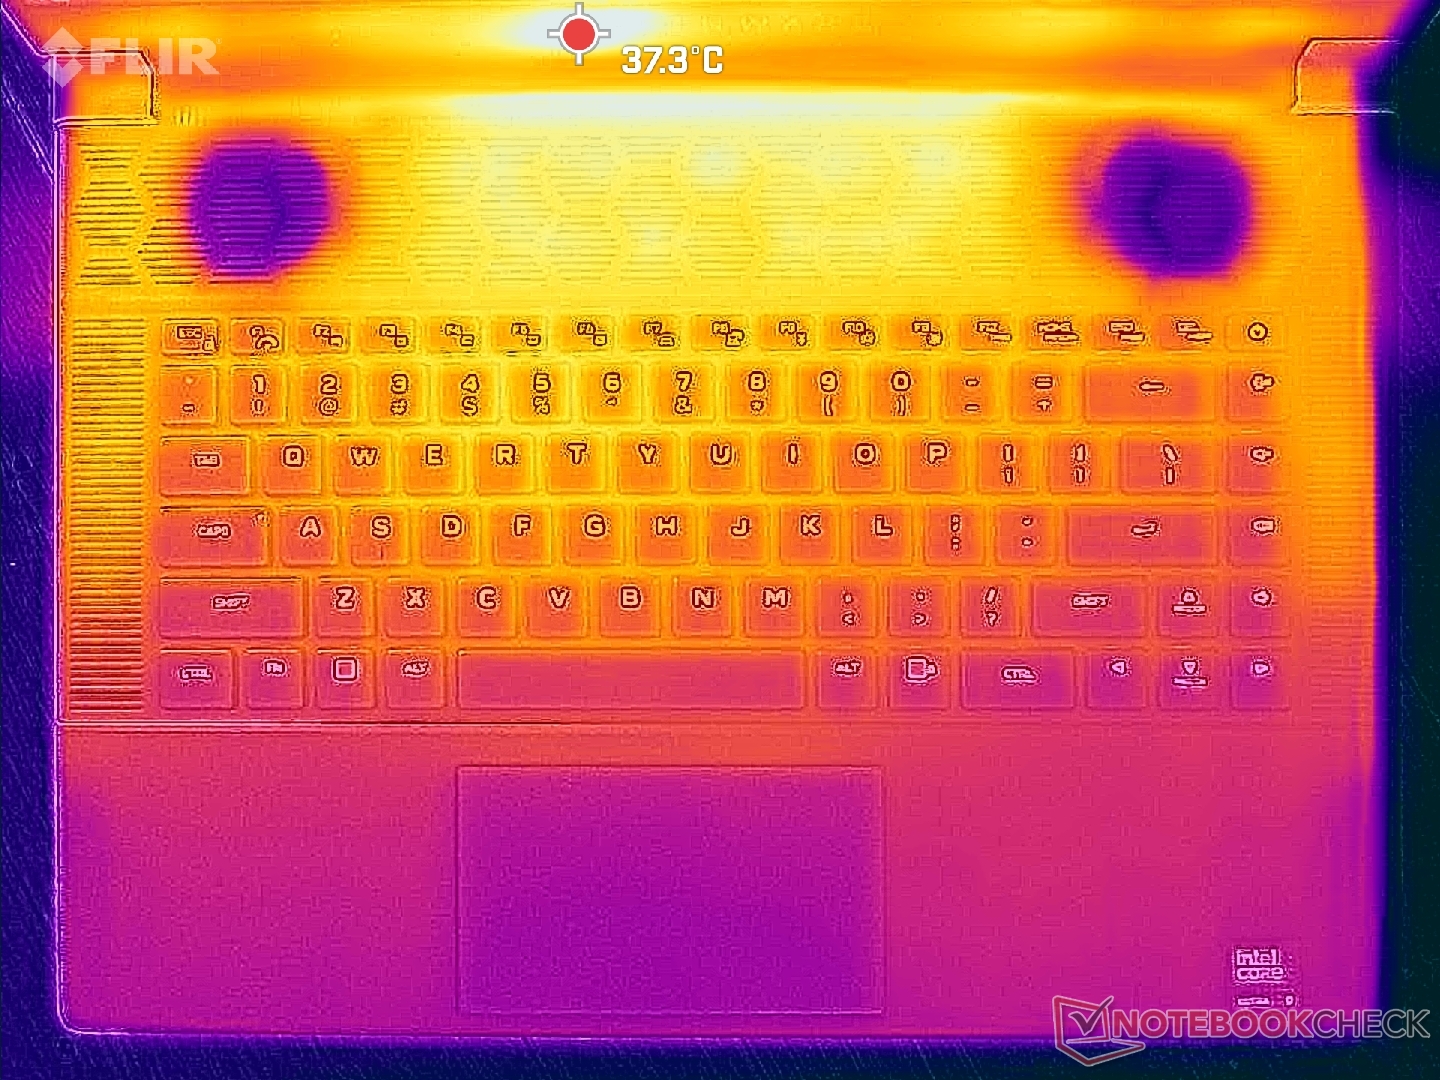
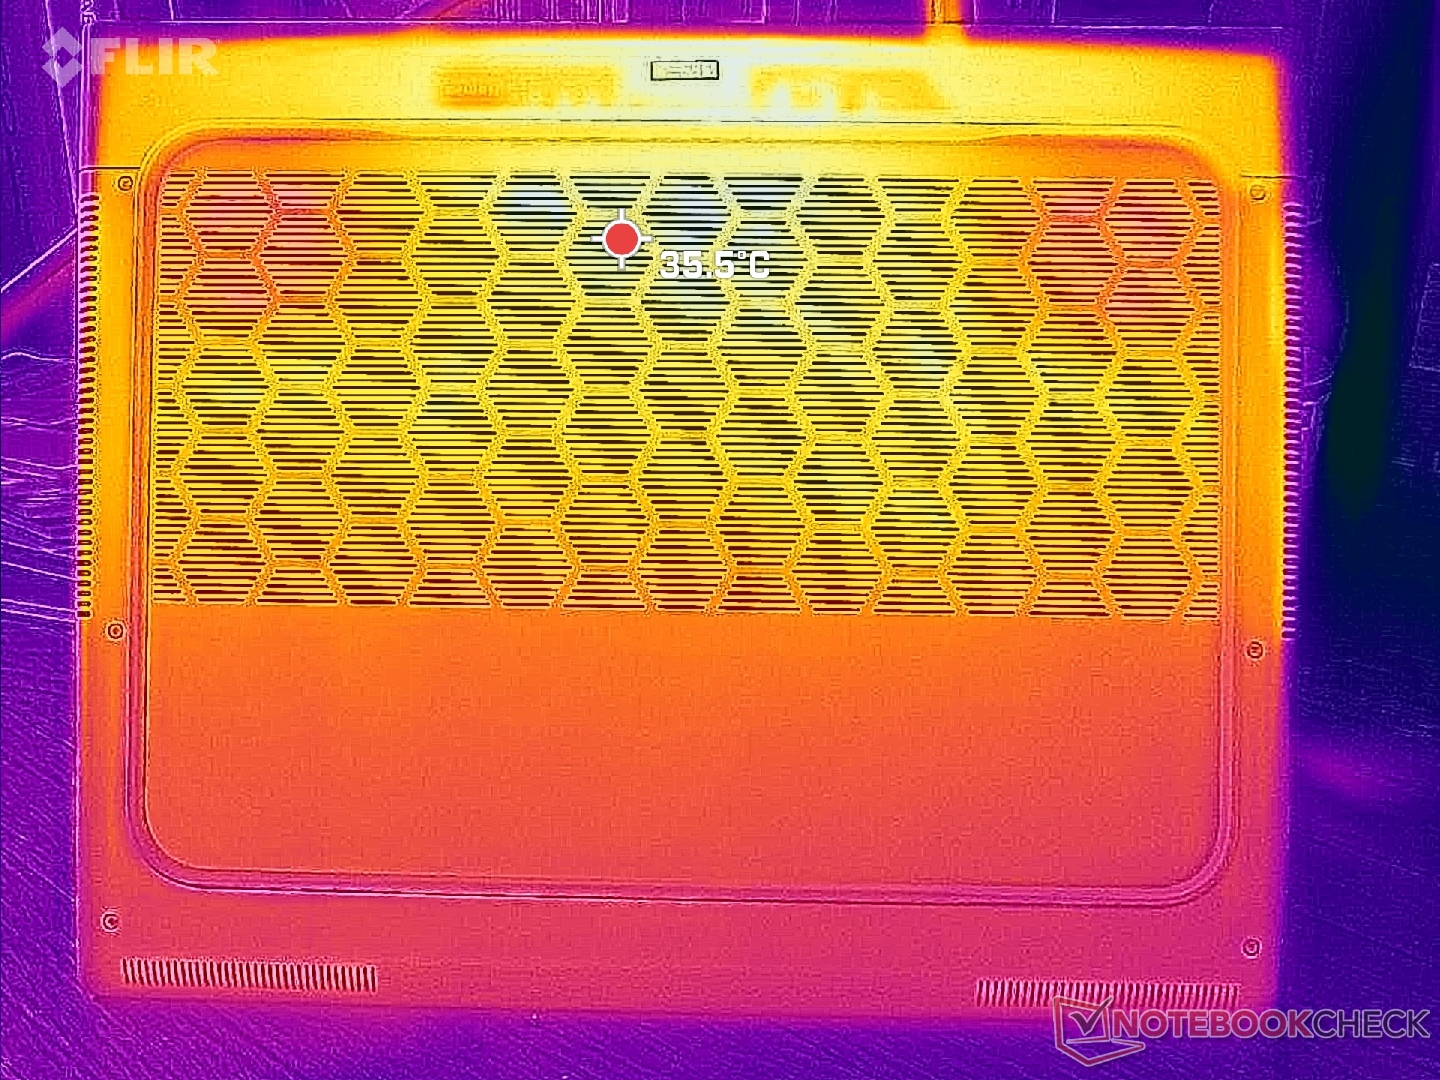
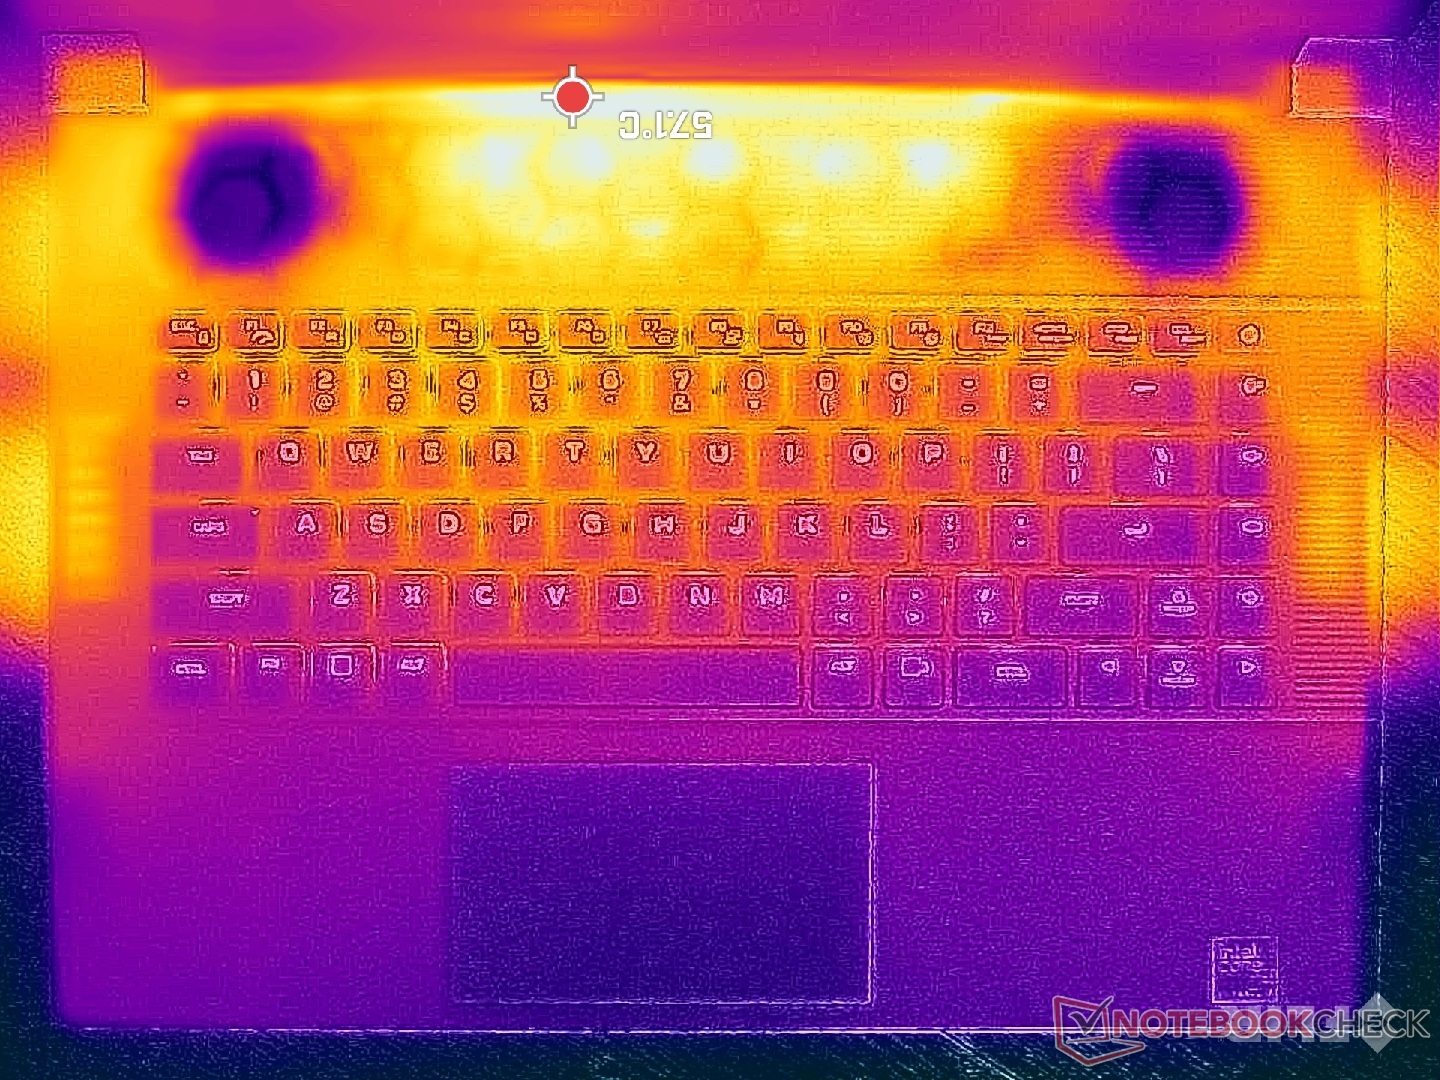
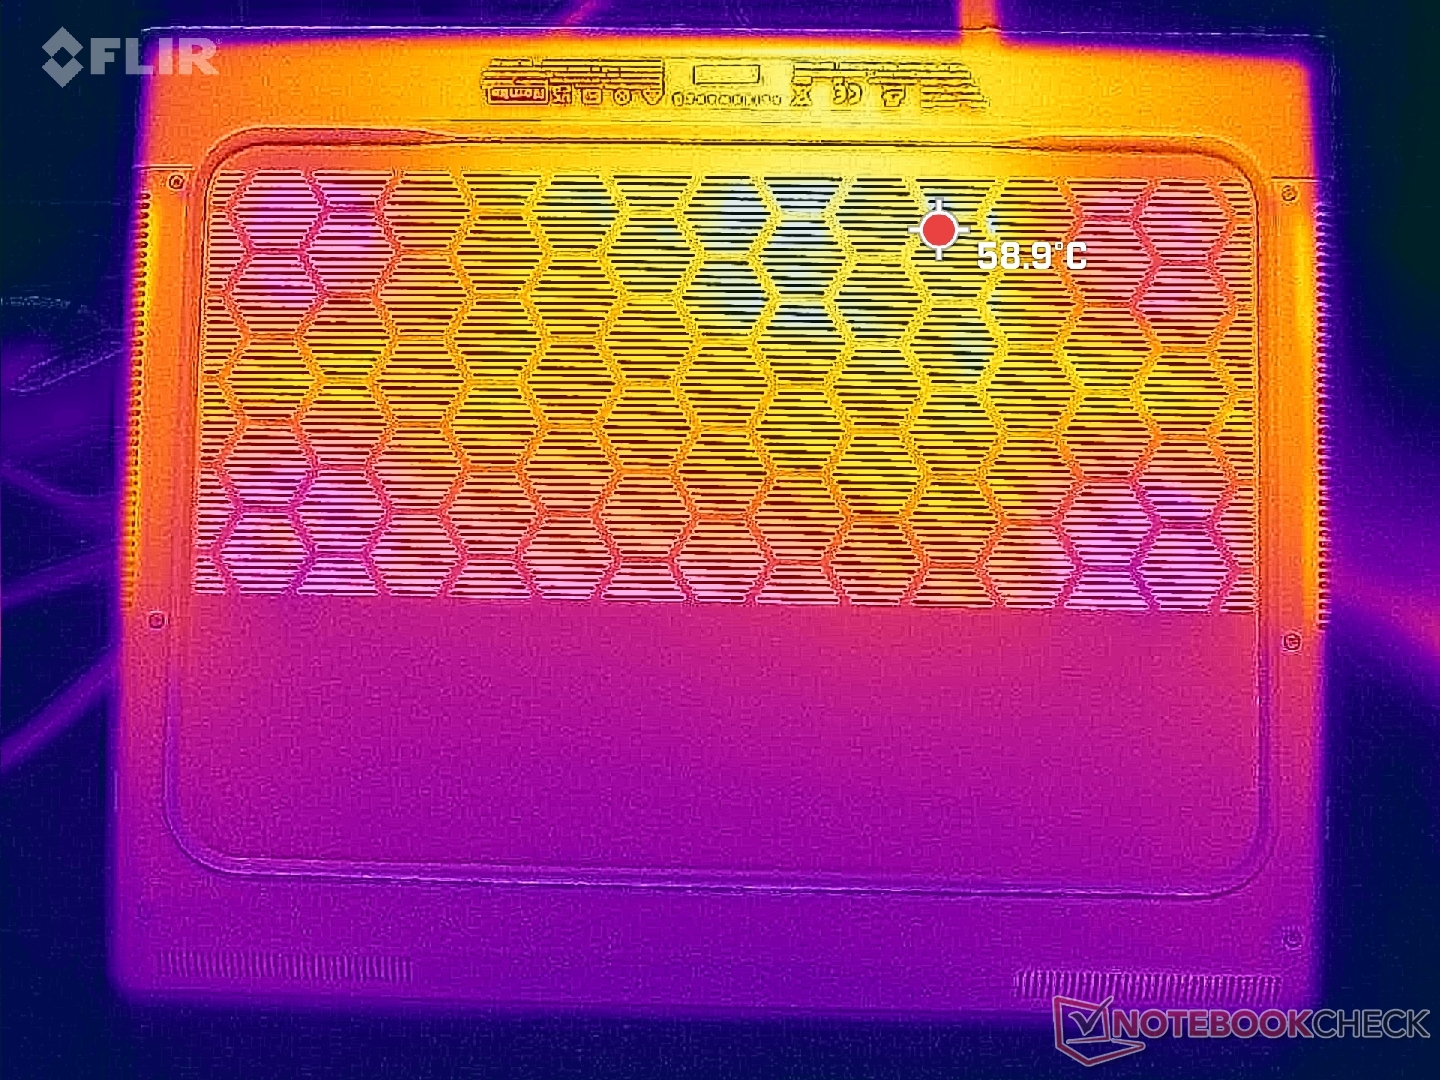
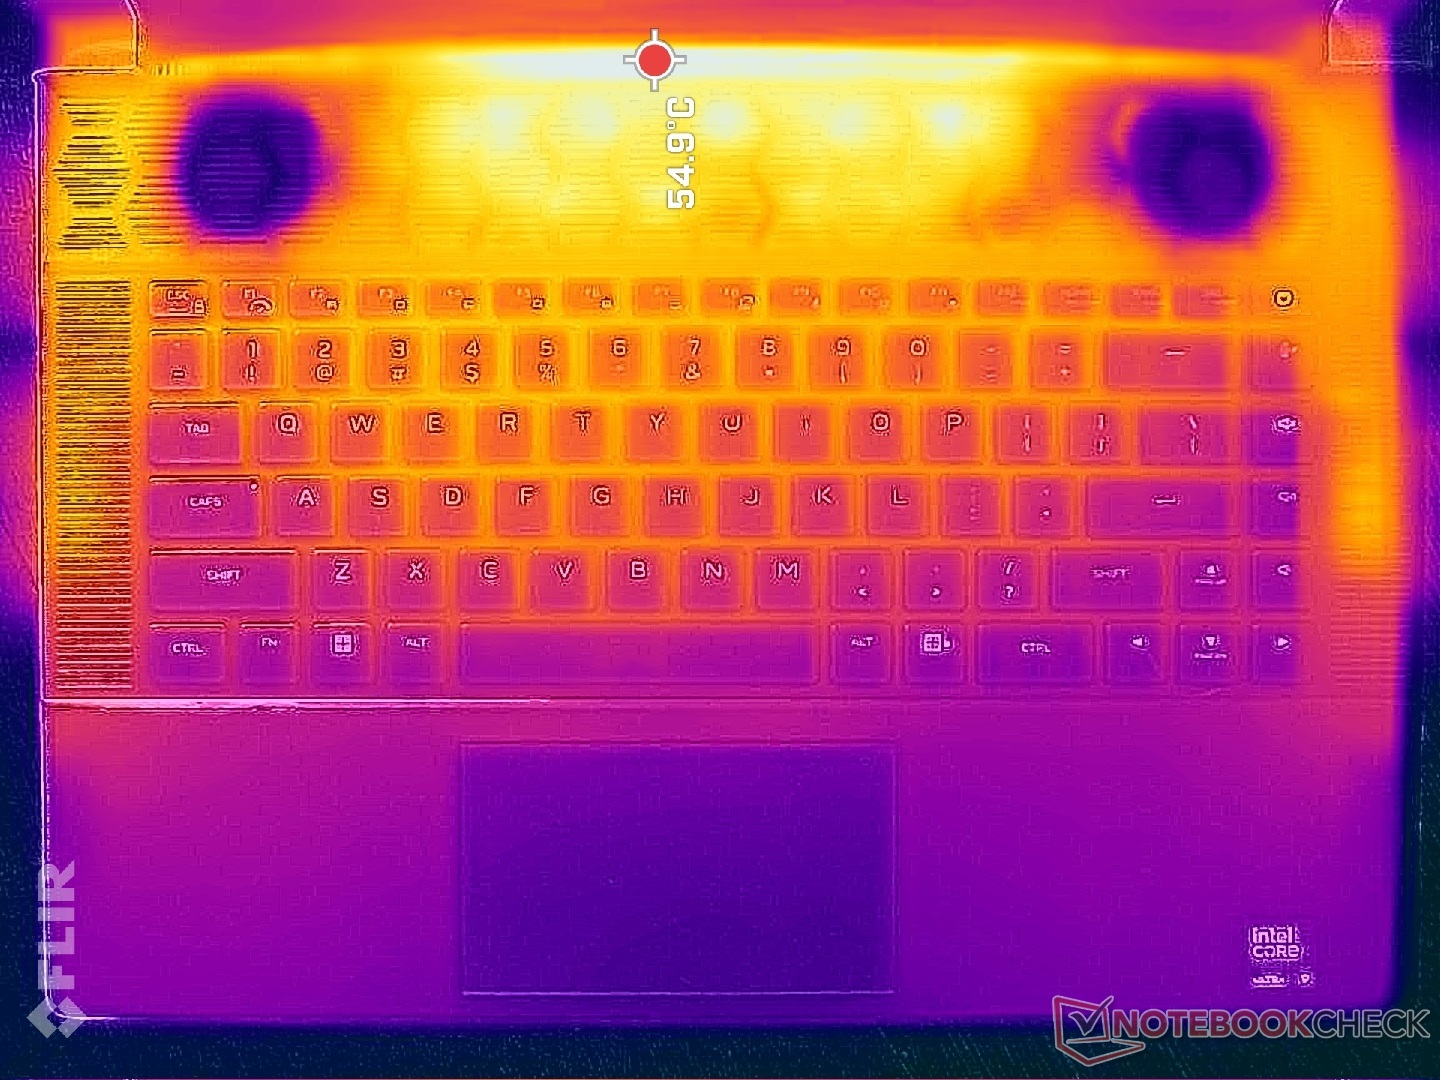
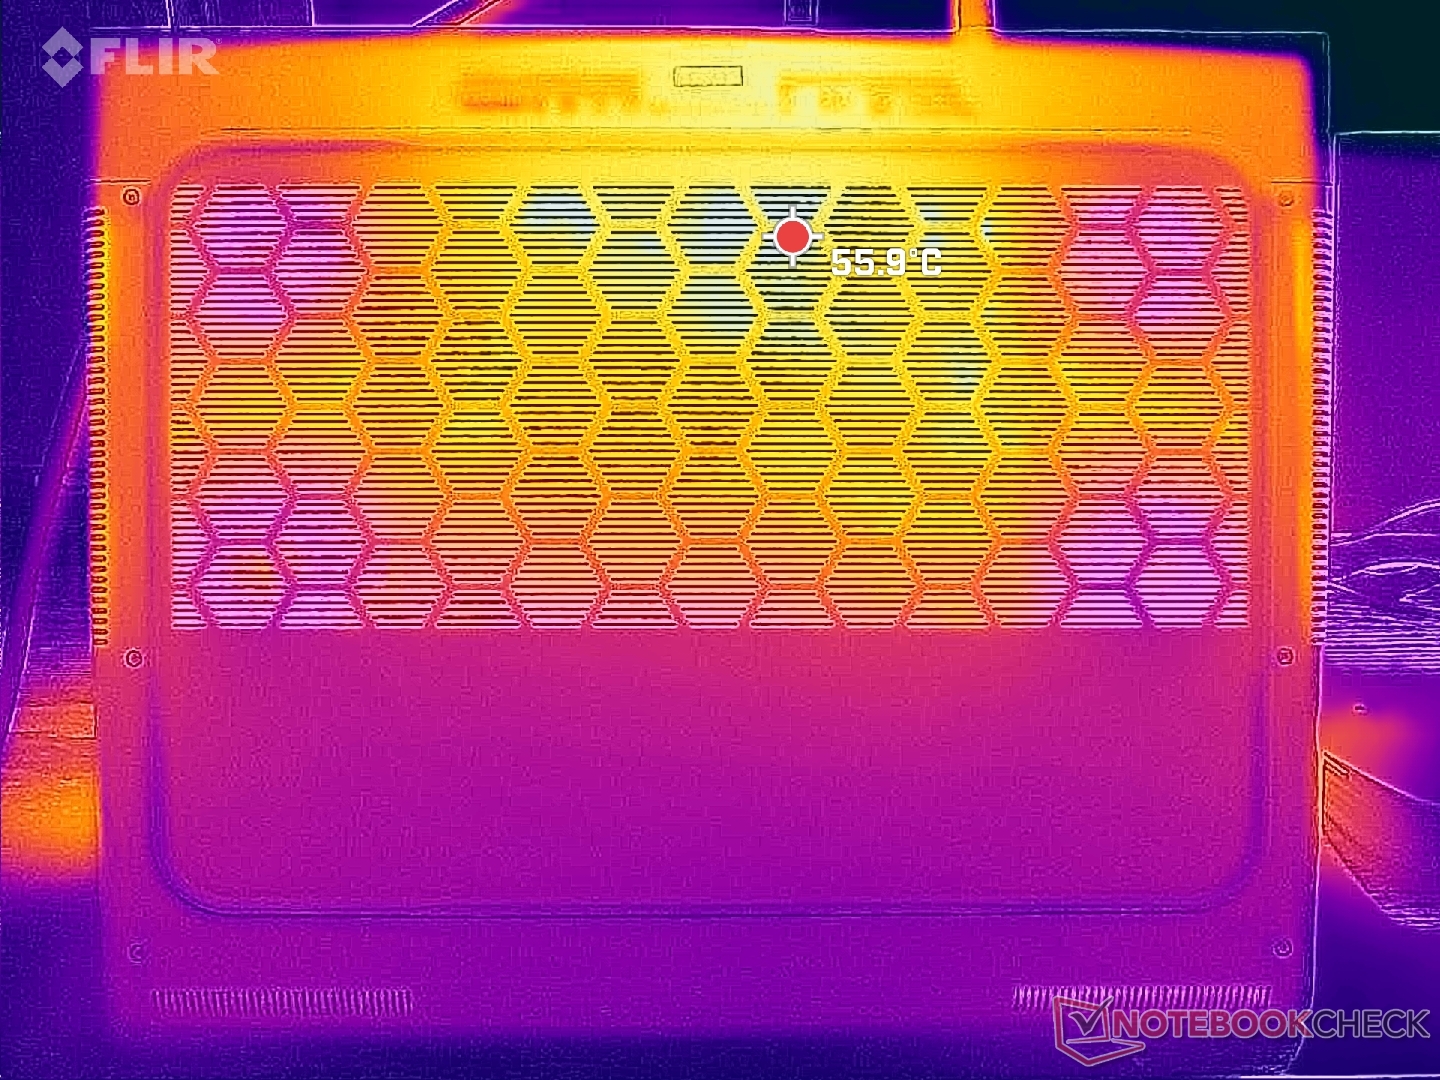
Temperatura
Temperatura powierzchni jest bardzo wysoka w tylnej części obudowy, podczas gdy przednia część jest zauważalnie chłodniejsza dla dłoni i palców. Seria Alienware x16 wykorzystuje więcej kratek wentylacyjnych niż seria m16 z konieczności, ponieważ konstrukcja x16 jest zdefiniowana przez jej cienkość.
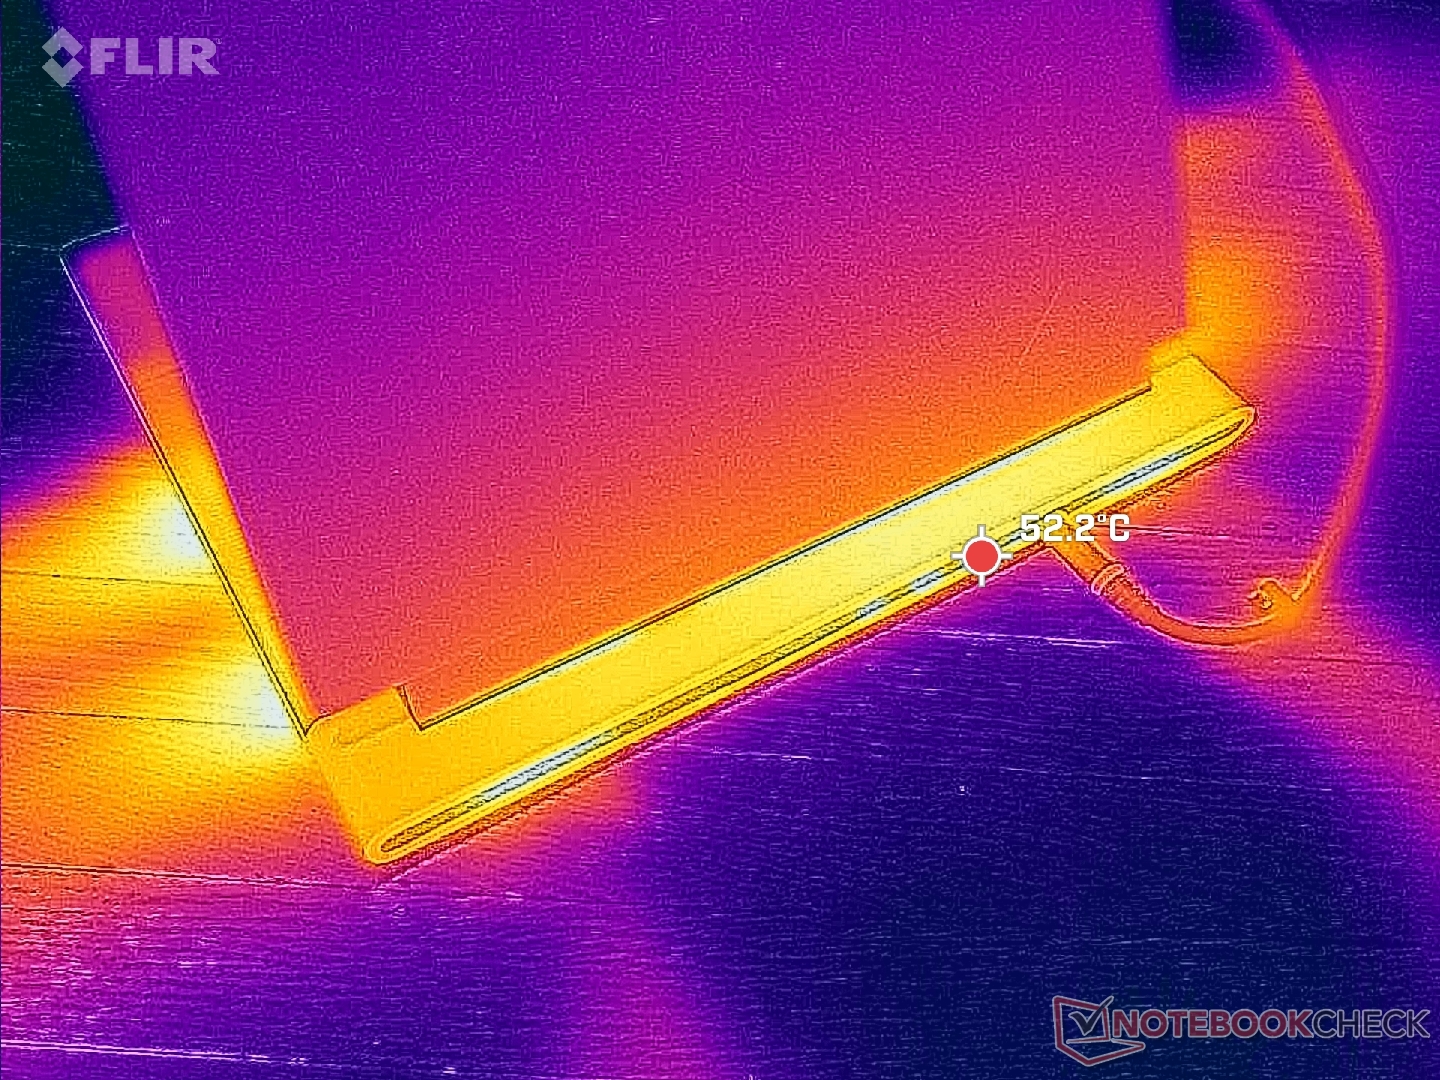
(-) Maksymalna temperatura w górnej części wynosi 51 °C / 124 F, w porównaniu do średniej 40.4 °C / 105 F , począwszy od 21.2 do 68.8 °C dla klasy Gaming.
(-) Dno nagrzewa się maksymalnie do 50.8 °C / 123 F, w porównaniu do średniej 43.2 °C / 110 F
(+) W stanie bezczynności średnia temperatura górnej części wynosi 31.3 °C / 88 F, w porównaniu ze średnią temperaturą urządzenia wynoszącą 33.9 °C / ### class_avg_f### F.
(-) Podczas gry w Wiedźmina 3 średnia temperatura górnej części wynosi 42.4 °C / 108 F, w porównaniu do średniej temperatury urządzenia wynoszącej 33.9 °C / ## #class_avg_f### F.
(+) Podparcia dłoni i touchpad osiągają maksymalną temperaturę skóry (33.2 °C / 91.8 F) i dlatego nie są gorące.
(-) Średnia temperatura obszaru podparcia dłoni w podobnych urządzeniach wynosiła 28.9 °C / 84 F (-4.3 °C / -7.8 F).
| Alienware x16 R2 P120F Intel Core Ultra 9 185H, NVIDIA GeForce RTX 4080 Laptop GPU | Alienware x16 R1 Intel Core i9-13900HK, NVIDIA GeForce RTX 4080 Laptop GPU | Alienware m16 R2 Intel Core Ultra 7 155H, NVIDIA GeForce RTX 4070 Laptop GPU | Asus ROG Strix Scar 16 G634JZR Intel Core i9-14900HX, NVIDIA GeForce RTX 4080 Laptop GPU | Lenovo Legion Pro 7 16IRX9H Intel Core i9-14900HX, NVIDIA GeForce RTX 4080 Laptop GPU | MSI Vector 16 HX A14V Intel Core i9-14900HX, NVIDIA GeForce RTX 4080 Laptop GPU | |
|---|---|---|---|---|---|---|
| Heat | 3% | -1% | 5% | 1% | 27% | |
| Maximum Upper Side * | 51 | 47.2 7% | 44.8 12% | 47.8 6% | 46 10% | 36.4 29% |
| Maximum Bottom * | 50.8 | 47.8 6% | 48 6% | 52.2 -3% | 49 4% | 35.6 30% |
| Idle Upper Side * | 36.6 | 36.8 -1% | 37.2 -2% | 32.4 11% | 38 -4% | 26.6 27% |
| Idle Bottom * | 35.2 | 35.8 -2% | 42 -19% | 33 6% | 37 -5% | 27 23% |
* ... im mniej tym lepiej
Głośniki
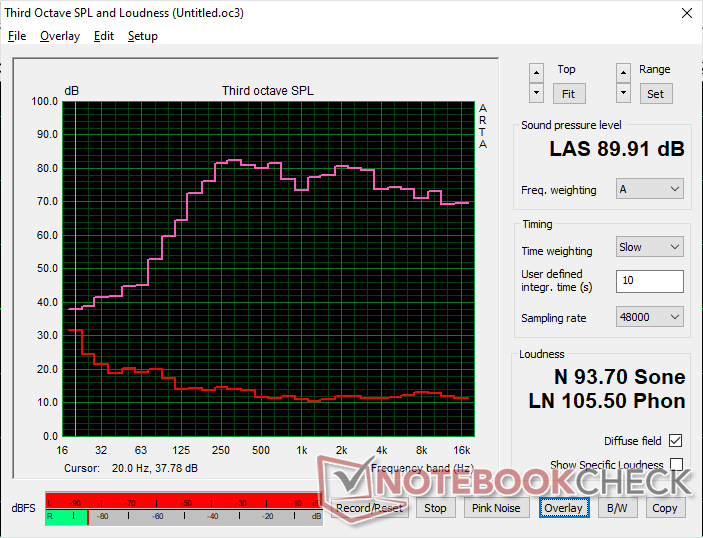
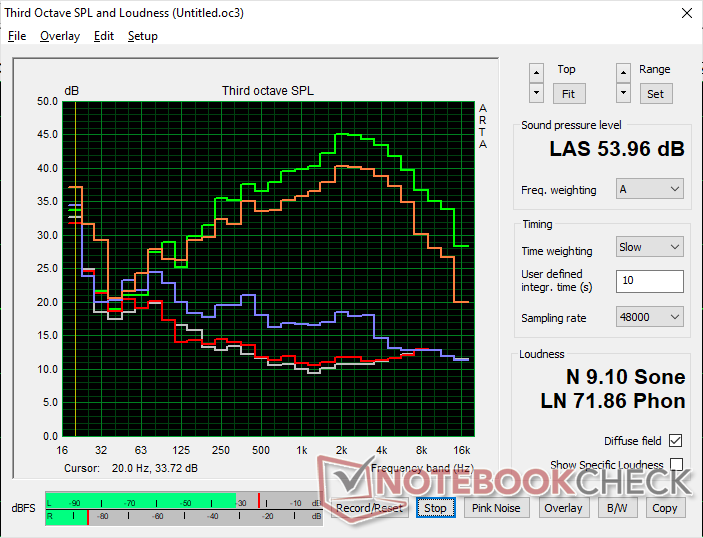
Alienware x16 R2 P120F analiza dźwięku
(+) | głośniki mogą odtwarzać stosunkowo głośno (89.9 dB)
Bas 100 - 315 Hz
(±) | zredukowany bas - średnio 7.4% niższy od mediany
(±) | liniowość basu jest średnia (7.6% delta do poprzedniej częstotliwości)
Średnie 400 - 2000 Hz
(+) | zbalansowane środki średnie - tylko 2.6% od mediany
(+) | średnie są liniowe (3.6% delta do poprzedniej częstotliwości)
Wysokie 2–16 kHz
(+) | zrównoważone maksima - tylko 3.4% od mediany
(+) | wzloty są liniowe (2.8% delta do poprzedniej częstotliwości)
Ogólnie 100 - 16.000 Hz
(+) | ogólny dźwięk jest liniowy (8.2% różnicy w stosunku do mediany)
W porównaniu do tej samej klasy
» 1% wszystkich testowanych urządzeń w tej klasie było lepszych, 1% podobnych, 98% gorszych
» Najlepszy miał deltę 6%, średnia wynosiła ###średnia###%, najgorsza wynosiła 132%
W porównaniu do wszystkich testowanych urządzeń
» 1% wszystkich testowanych urządzeń było lepszych, 1% podobnych, 98% gorszych
» Najlepszy miał deltę 4%, średnia wynosiła ###średnia###%, najgorsza wynosiła 134%
Apple MacBook Pro 16 2021 M1 Pro analiza dźwięku
(+) | głośniki mogą odtwarzać stosunkowo głośno (84.7 dB)
Bas 100 - 315 Hz
(+) | dobry bas - tylko 3.8% od mediany
(+) | bas jest liniowy (5.2% delta do poprzedniej częstotliwości)
Średnie 400 - 2000 Hz
(+) | zbalansowane środki średnie - tylko 1.3% od mediany
(+) | średnie są liniowe (2.1% delta do poprzedniej częstotliwości)
Wysokie 2–16 kHz
(+) | zrównoważone maksima - tylko 1.9% od mediany
(+) | wzloty są liniowe (2.7% delta do poprzedniej częstotliwości)
Ogólnie 100 - 16.000 Hz
(+) | ogólny dźwięk jest liniowy (4.6% różnicy w stosunku do mediany)
W porównaniu do tej samej klasy
» 0% wszystkich testowanych urządzeń w tej klasie było lepszych, 0% podobnych, 100% gorszych
» Najlepszy miał deltę 5%, średnia wynosiła ###średnia###%, najgorsza wynosiła 45%
W porównaniu do wszystkich testowanych urządzeń
» 0% wszystkich testowanych urządzeń było lepszych, 0% podobnych, 100% gorszych
» Najlepszy miał deltę 4%, średnia wynosiła ###średnia###%, najgorsza wynosiła 134%
Zarządzanie energią
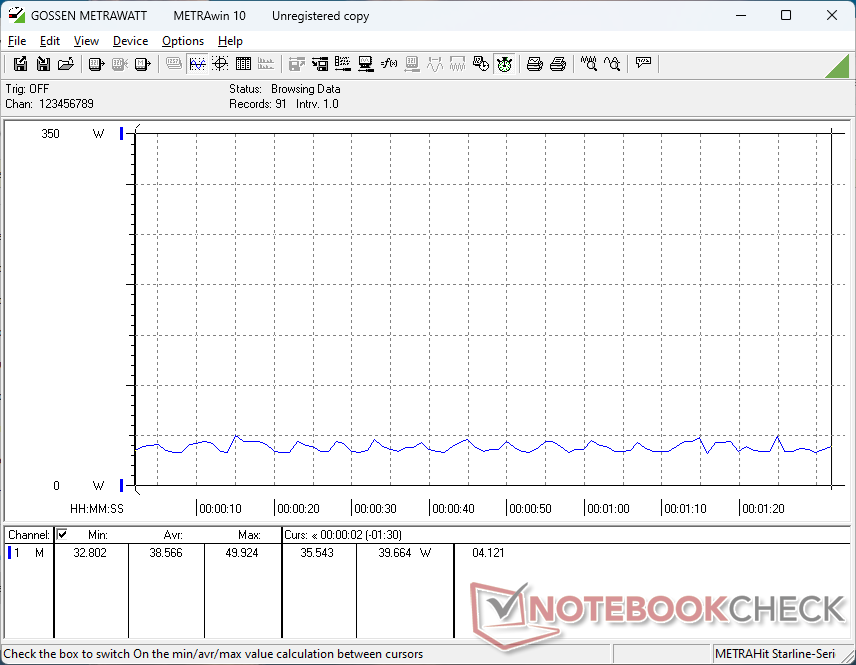
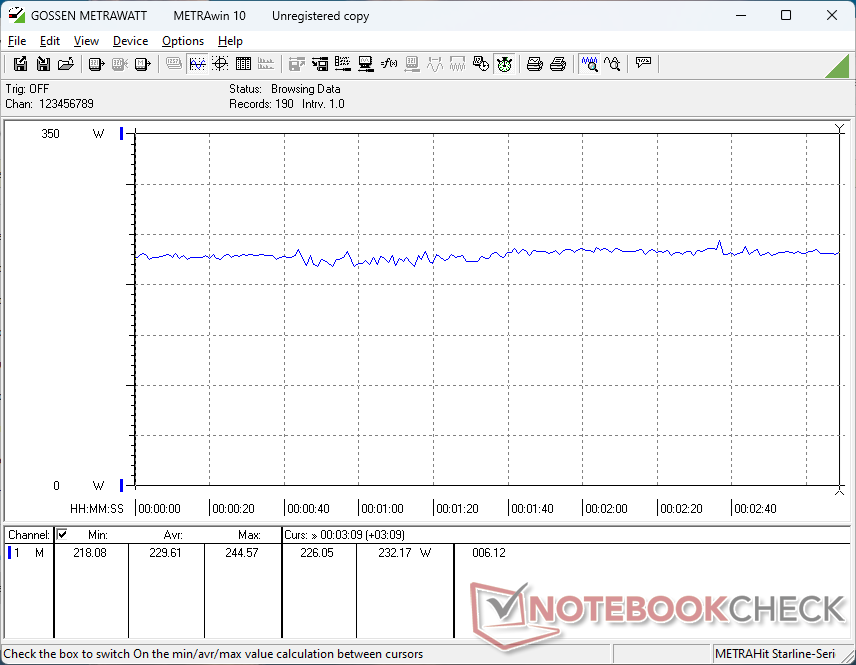
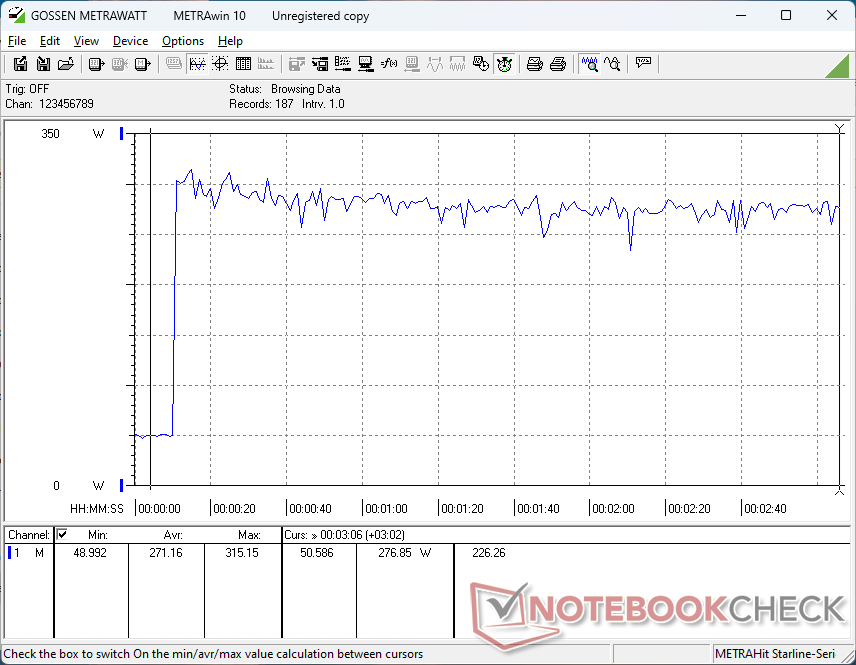
Zużycie energii
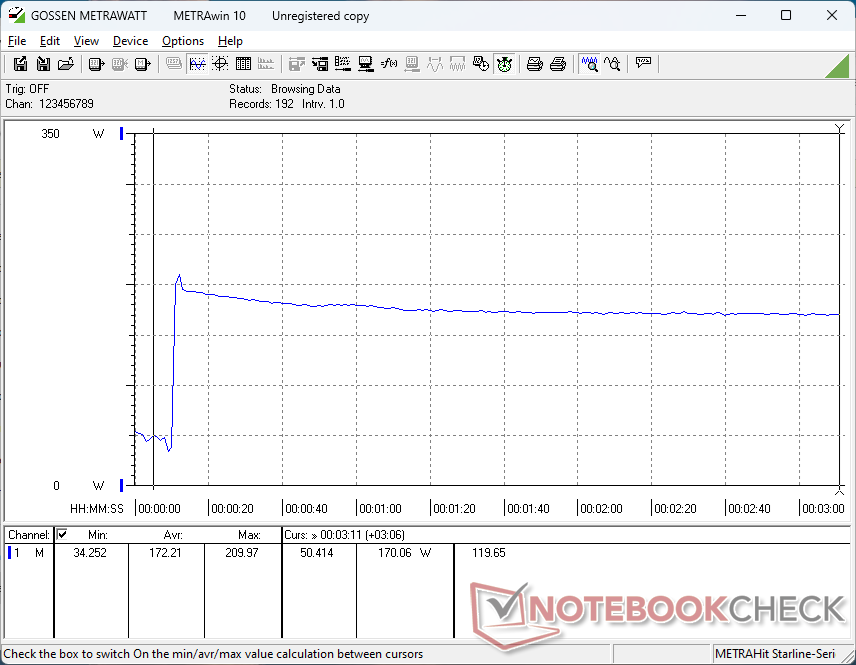
Ogólne zużycie energii jest generalnie niższe niż to, które odnotowaliśmy na x16 R1 o około 10 do 15 procent podczas uruchamiania wymagających obciążeń, takich jak gry lub obciążenie Prime95. Deficyt ten towarzyszy jednak wolniejszym wynikom CPU i GPU odnotowanym powyżej. Wydajność w przeliczeniu na wat jest zatem mniej więcej taka sama rok do roku, pomimo zmiany procesora.
Napotkaliśmy błąd w trybie czuwania. Przy ustawieniu Optimus, tryb czuwania działał normalnie z niskim poborem mocy <1 W. Jeśli jednak ustawiono tryb dGPU i Overdrive, tryb gotowości wymagał nawet 39 W, co powodowało niepotrzebne nagrzewanie się laptopa i wysokie zużycie baterii.
| wyłączony / stan wstrzymania | |
| luz | |
| obciążenie |
|
Legenda:
min: | |
| Alienware x16 R2 P120F Ultra 9 185H, NVIDIA GeForce RTX 4080 Laptop GPU, WDC PC SN810 1TB, IPS, 2560x1600, 16" | Alienware x16 R1 i9-13900HK, NVIDIA GeForce RTX 4080 Laptop GPU, SK hynix PC801 HFS001TEJ9X101N, IPS, 2560x1600, 16" | Alienware m16 R2 Ultra 7 155H, NVIDIA GeForce RTX 4070 Laptop GPU, Samsung PM9A1 MZVL21T0HCLR, IPS, 2560x1600, 16" | Asus ROG Strix Scar 16 G634JZR i9-14900HX, NVIDIA GeForce RTX 4080 Laptop GPU, SK hynix PC801 HFS002TEJ9X101N, Mini LED, 2560x1600, 16" | Lenovo Legion Pro 7 16IRX9H i9-14900HX, NVIDIA GeForce RTX 4080 Laptop GPU, SK Hynix HFS001TEJ9X115N, IPS, 2560x1600, 16" | MSI Vector 16 HX A14V i9-14900HX, NVIDIA GeForce RTX 4080 Laptop GPU, WD PC SN560 SDDPNQE-1T00, IPS, 2560x1600, 16" | |
|---|---|---|---|---|---|---|
| Power Consumption | -55% | 11% | -10% | -30% | -27% | |
| Idle Minimum * | 9.9 | 25.2 -155% | 8.1 18% | 10.71 -8% | 16 -62% | 15.8 -60% |
| Idle Average * | 14.5 | 29.9 -106% | 13 10% | 14.75 -2% | 21 -45% | 23.3 -61% |
| Idle Maximum * | 33.5 | 49.8 -49% | 40.3 -20% | 30 10% | 36 -7% | 30 10% |
| Load Average * | 97.5 | 105.4 -8% | 79 19% | 135 -38% | 132 -35% | 123.9 -27% |
| Witcher 3 ultra * | 230 | 263 -14% | 188.1 18% | 286 -24% | 267 -16% | 285 -24% |
| Load Maximum * | 315.2 | 313.8 -0% | 254.9 19% | 307 3% | 360 -14% | 306 3% |
* ... im mniej tym lepiej
Power Consumption Witcher 3 / Stresstest
Power Consumption external Monitor
Żywotność baterii
Czasy pracy są tym razem nieco dłuższe, prawdopodobnie ze względu na ogólnie niższe zużycie energii, o którym mowa powyżej. Jesteśmy w stanie nagrać czas pracy WLAN o ponad 40 minut dłużej niż na x16 R1, ale większość innych laptopów do gier nadal jest w stanie wytrzymać znacznie dłużej, w tym własny Dell Alienware m16 R2.
| Alienware x16 R2 P120F Ultra 9 185H, NVIDIA GeForce RTX 4080 Laptop GPU, 90 Wh | Alienware x16 R1 i9-13900HK, NVIDIA GeForce RTX 4080 Laptop GPU, 90 Wh | Alienware m16 R2 Ultra 7 155H, NVIDIA GeForce RTX 4070 Laptop GPU, 90 Wh | Asus ROG Strix Scar 16 G634JZR i9-14900HX, NVIDIA GeForce RTX 4080 Laptop GPU, 90 Wh | Lenovo Legion Pro 7 16IRX9H i9-14900HX, NVIDIA GeForce RTX 4080 Laptop GPU, 99.9 Wh | MSI Vector 16 HX A14V i9-14900HX, NVIDIA GeForce RTX 4080 Laptop GPU, 90 Wh | |
|---|---|---|---|---|---|---|
| Czasy pracy | -23% | 150% | 125% | 93% | 72% | |
| WiFi v1.3 | 193 | 149 -23% | 483 150% | 434 125% | 373 93% | 332 72% |
| Reader / Idle | 436 | 758 | 641 | |||
| Load | 44 | 60 | 51 | 84 | ||
| H.264 | 451 | |||||
| Witcher 3 ultra | 57 |
Za
Przeciw
Werdykt - Alienware x16 R1 jest szybszy dla czystego gamingu
Dużą zaletą Alienware x16 R2 w porównaniu do x16 R1 jest zintegrowany procesor NPU do przyspieszania zadań AI w systemie Windows. Oczekuje się, że takie funkcje staną się powszechne w przyszłym roku za pośrednictwem Microsoft Co-Pilot i innych nadchodzących aplikacji opartych na sztucznej inteligencji. Jednak do celów gamingowych, NPU nie wnosi nic, co mogłoby poprawić wrażenia od 2024 roku. Jeśli już, to jest to prawdopodobnie szkodliwe, ponieważ surowa wydajność procesora spadła w porównaniu do Core i9-13900HK w zeszłorocznym x16 R1, ponieważ cenna przestrzeń matrycy została zarezerwowana dla nowego procesora neuronowego.
Alienware x16 R2 wprowadza nowe procesory Meteor Lake-H ze zintegrowanym NPU dla kompatybilności z przyszłymi funkcjami Windows AI. Niestety, w rezultacie ucierpiała surowa wydajność w grach.
Ogólnie niższa wydajność doprowadziła również do niższego zużycia energii i dłuższego czasu pracy niż w przypadku oryginalnego modelu premierowego. Jednak docelowi entuzjaści gier, którzy lubią kupować Alienware, prawdopodobnie nie są zbyt podekscytowani zamianą wydajności na żywotność baterii. Takie posunięcie byłoby bardziej akceptowalne w przypadku niższej półki Dell serii G zamiast tego.
Zalecamy rozważenie oryginalnego Alienware x16 R1 ponieważ x16 R2 nie oferuje żadnych nowych opcji GPU, opcji wyświetlania, a nawet kolorów obudowy lub zmian zewnętrznych. Aktualizacja procesora jest pożądana tylko dla tych, którzy chcą "zabezpieczyć" swój obszar roboczy na przyszłość dzięki zintegrowanej jednostce NPU.
Cena i dostępność
Dell dostarcza obecnie Alienware x16 R2 w cenie od 2100 USD za konfigurację z Core Ultra 7, GeForce RTX 4060, standardową klawiaturą i 1600p240 IPS lub do 3500 USD w przypadku konfiguracji z Core Ultra 9, RTX 4090 i klawiaturą mechaniczną.
Alienware x16 R2 P120F
- 29/05/2024 v7 (old)
Allen Ngo
Przezroczystość
Wyboru urządzeń do recenzji dokonuje nasza redakcja. Próbka testowa została udostępniona autorowi jako pożyczka od producenta lub sprzedawcy detalicznego na potrzeby tej recenzji. Pożyczkodawca nie miał wpływu na tę recenzję, producent nie otrzymał też kopii tej recenzji przed publikacją. Nie było obowiązku publikowania tej recenzji. Nigdy nie przyjmujemy rekompensaty ani płatności w zamian za nasze recenzje. Jako niezależna firma medialna, Notebookcheck nie podlega władzy producentów, sprzedawców detalicznych ani wydawców.
Tak testuje Notebookcheck
Każdego roku Notebookcheck niezależnie sprawdza setki laptopów i smartfonów, stosując standardowe procedury, aby zapewnić porównywalność wszystkich wyników. Od około 20 lat stale rozwijamy nasze metody badawcze, ustanawiając przy tym standardy branżowe. W naszych laboratoriach testowych doświadczeni technicy i redaktorzy korzystają z wysokiej jakości sprzętu pomiarowego. Testy te obejmują wieloetapowy proces walidacji. Nasz kompleksowy system ocen opiera się na setkach uzasadnionych pomiarów i benchmarków, co pozwala zachować obiektywizm.Price comparison

