Notebookcheck Logo

Recenzja laptopa Asus ROG Zephyrus G16 - smukły gracz z RTX 4090 i niespełnionym potencjałem

Chłodzenie komory parowej. Asus wyposaża tylko najmocniejsze modele ROG Zephyrus G16 w chłodzenie komorą parową. Recenzujemy high-endowy model z procesorem Core Ultra 9 185H i laptopem GeForce RTX 4090. Czy jednak chłodzenie jest naprawdę lepsze od tego, które można było zobaczyć w RTX 4070 i na jakie kompromisy trzeba było pójść ze względu na kompaktową obudowę?
Gaming Geforce Laptop / Notebook Meteor Lake Thunderbolt Windows

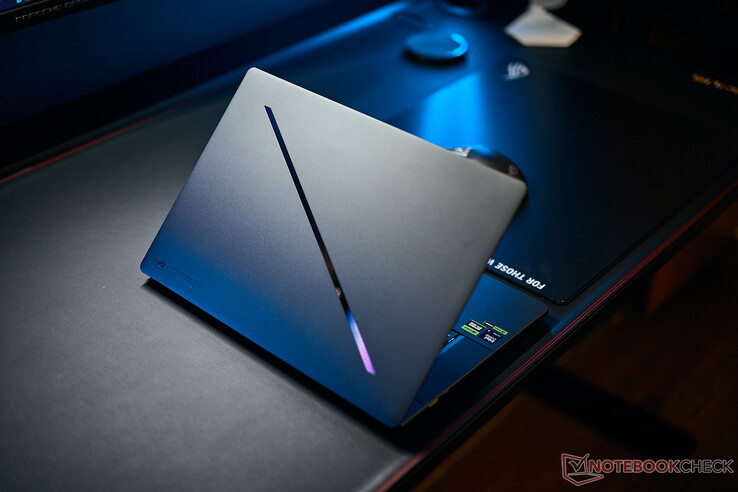
ROG Zephyrus G16 to obecnie spadająca gwiazda, jeśli chodzi o cienkie laptopy do gier Asusa. Kilka miesięcy temu recenzowaliśmy wariant z procesorem Core Ultra 7 155H i kartą graficzną Nvidia GeForce RTX 4070. Teraz przyglądamy się high-endowemu modelowi z Core Ultra 9 185H i laptopem GeForce RTX 4090. Oprócz mocniejszych podzespołów mamy do czynienia z innym chłodzeniem. Chociaż konfiguracje do laptopa RTX 4070 wykorzystują konwencjonalny układ chłodzenia składający się z trzech wentylatorów i rurek cieplnych, modele z wyższej półki (laptop RTX 4080/4090) wykorzystują chłodzenie komorą parową. Oczywiście chcemy wiedzieć, jak nowe chłodzenie wpływa zarówno na wydajność, jak i emisję spalin.

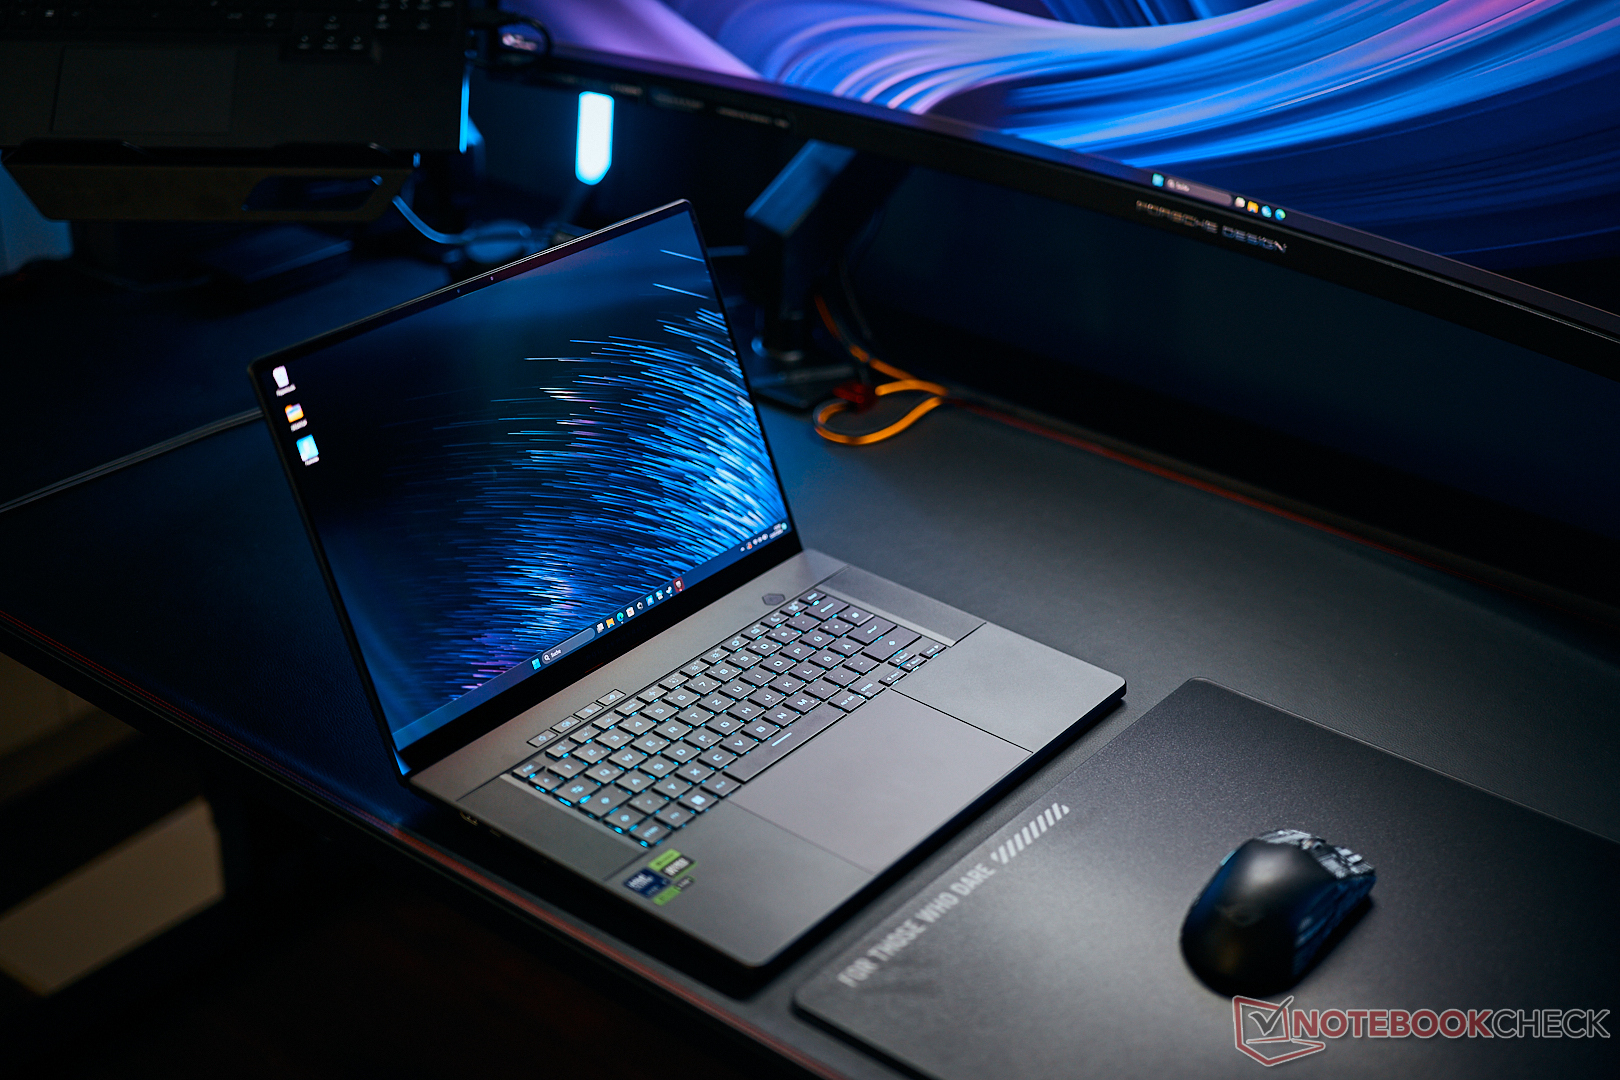
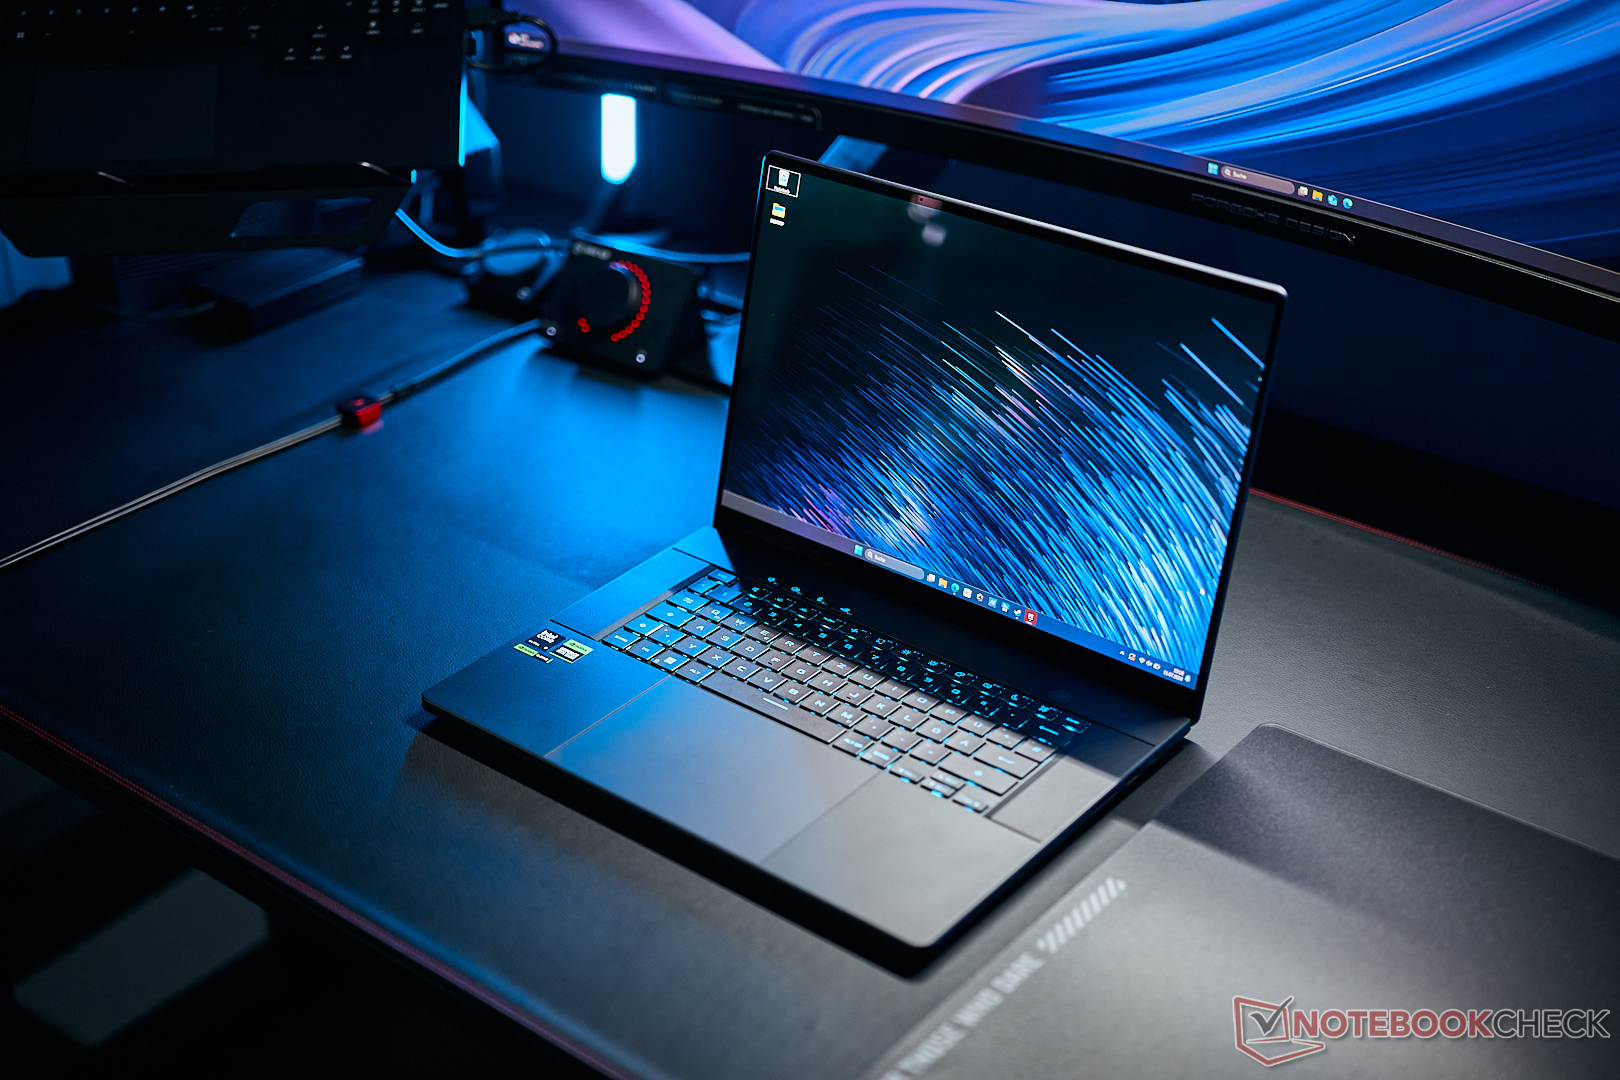
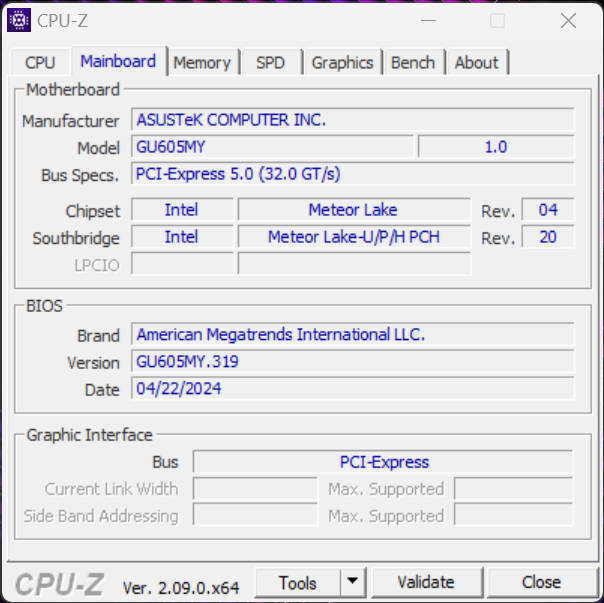
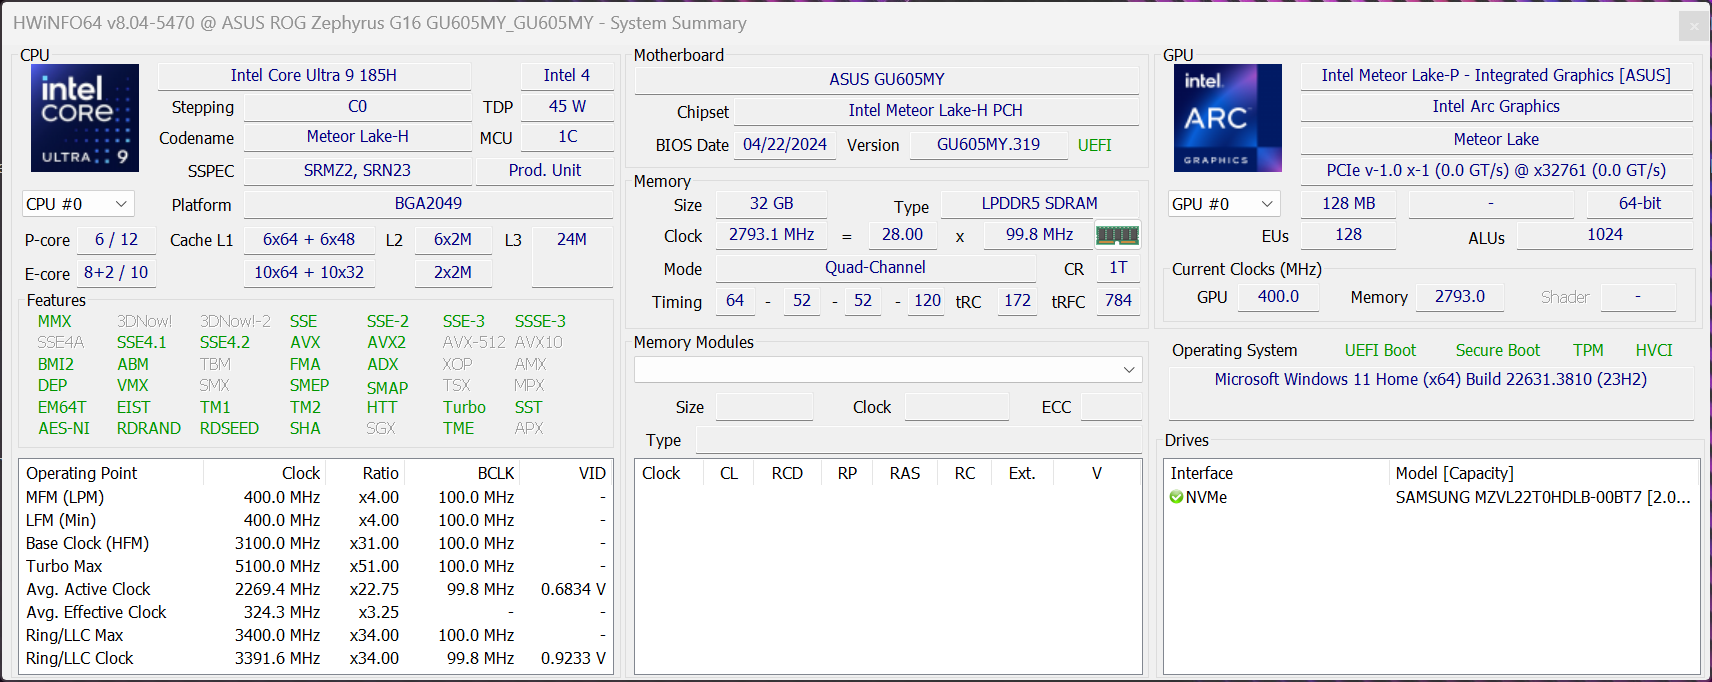
Nasze recenzowane urządzenie nosi numer GU605MY, kosztuje 3 649 USD i oprócz procesora Core Ultra 9 185H i laptopa GeForce RTX 4090 jest również wyposażone w 32 GB pamięci RAM i znany już ekran OLED 240 Hz. W tej recenzji zwrócimy szczególną uwagę na różnice między konfiguracją laptopa RTX 4070 a wydajnością, a także emisją wariantu high-end. Wszystkie dodatkowe informacje dotyczące obudowy, urządzeń wejściowych, wyświetlacza i głośników znajdą Państwo w naszej recenzji laptopa ROG Zephyrus G16 z RTX 4070.

Asus wkrótce wprowadzi aktualizację z nowymi procesorami AMD Strix Point (Zen5), jednak modele te będą wyposażone tylko w GeForce RTX 4070 laptop.

Asus ROG Zephyrus G16 GU605MY (ROG Zephyrus G16 2024 Rodzina)
Procesor
Intel Core Ultra 9 185H 16 x 3.8 - 5.1 GHz, Meteor Lake-H
Karta grafiki
NVIDIA GeForce RTX 4090 Laptop GPU - 16 GB VRAM, rdzeń: 1455 MHz, pamięć: 2250 MHz, GDDR6, 555.99
Pamięć
32 GB 
, LPDDR5x-7467, Dual-Channel, onboard
Matryca
16.00 cali 16:10, 2560 x 1600 pikseli 189 PPI, ATNA60DL01-0, OLED, refleksująca: tak, 240 Hz
Chipset
Intel Meteor Lake-U/P/H PCH
Dysk twardy
Samsung PM9A1a MZVL22T0HDLB, 2048 GB 
, M.2 PCIe
Karta dźwiękowa
Intel Meteor Lake-U/P/H PCH - cAVS (Audio, Voice, Speech)
Złącza
3 USB 3.1 Gen2, 1 Thunderbolt, USB-C Power Delivery (PD), 1 HDMI, gniazda audio: 3.5mm, czytnik kart: SD
Łączność
Intel Wi-Fi 6E AX211 (a/b/g/h/n = Wi-Fi 4/ac = Wi-Fi 5/ax = Wi-Fi 6/ Wi-Fi 6E 6 GHz), Bluetooth 5.3
Gabaryty
wysokość x szerokość x głębokość (mm): 16.4 x 354 x 246
Akumulator
90 Wh litowo-jonowy, 4-cell
System operacyjny
Microsoft Windows 11 Home
Camera
Primary Camera: 2 MPix
Inne
głośniki: -cell, klawiatura: Chiclet, podświetlanie klawiatury: tak, 24 miesiące(y) gwarancji
Waga
1.908 kg, zasilacz: 745 g
Cena
4300 PLN
Note: The manufacturer may use components from different suppliers including display panels, drives or memory sticks with similar specifications.


Potencjalni konkurenci w porównaniu

Rating
Version
Date
Model
Weight
Height
Size
Resolution
Best Price
86.1 %v8
07/2024
Asus ROG Zephyrus G16 GU605MY
Ultra 9 185H, NVIDIA GeForce RTX 4090 Laptop GPU
1.9 kg16.4 mm16.00"2560x1600
85.5 %v8
06/2024
SCHENKER XMG Neo 16 (Early 24)
i9-14900HX, NVIDIA GeForce RTX 4090 Laptop GPU
2.5 kg26.6 mm16.00"2560x1600
83.9 %v8
06/2024
Lenovo Legion 9 16IRX9, RTX 4090
i9-14900HX, NVIDIA GeForce RTX 4090 Laptop GPU
2.5 kg22.7 mm16.00"3200x2000
88.4 %v7 (old)
05/2024
Alienware x16 R2 P120F
Ultra 9 185H, NVIDIA GeForce RTX 4080 Laptop GPU
2.7 kg18.57 mm16.00"2560x1600
91.1 %v7 (old)
02/2024
Razer Blade 16 2024, RTX 4090
i9-14900HX, NVIDIA GeForce RTX 4090 Laptop GPU
2.5 kg22 mm16.00"2560x1600

Uwaga: Niedawno zaktualizowaliśmy nasz system oceny i wyniki wersji 8 nie są porównywalne z wynikami wersji 7. Więcej informacji znajdą Państwo tutaj .

Różnice w stosunku do laptopa G16 z RTX 4070

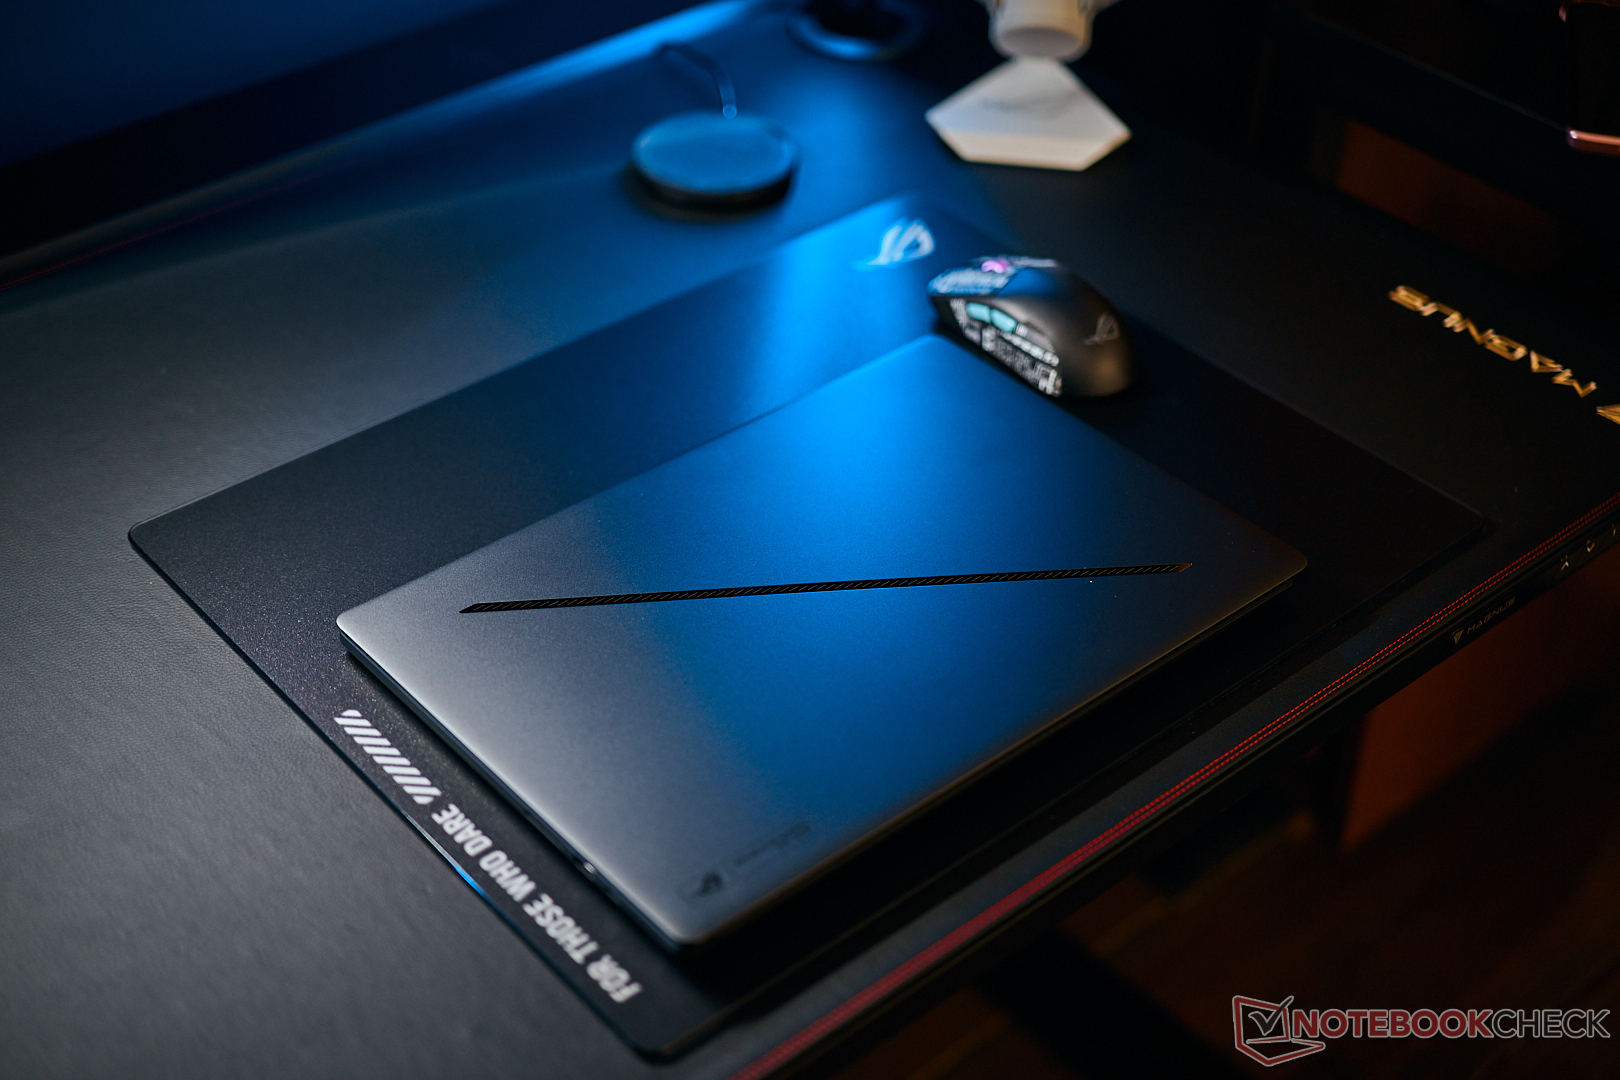
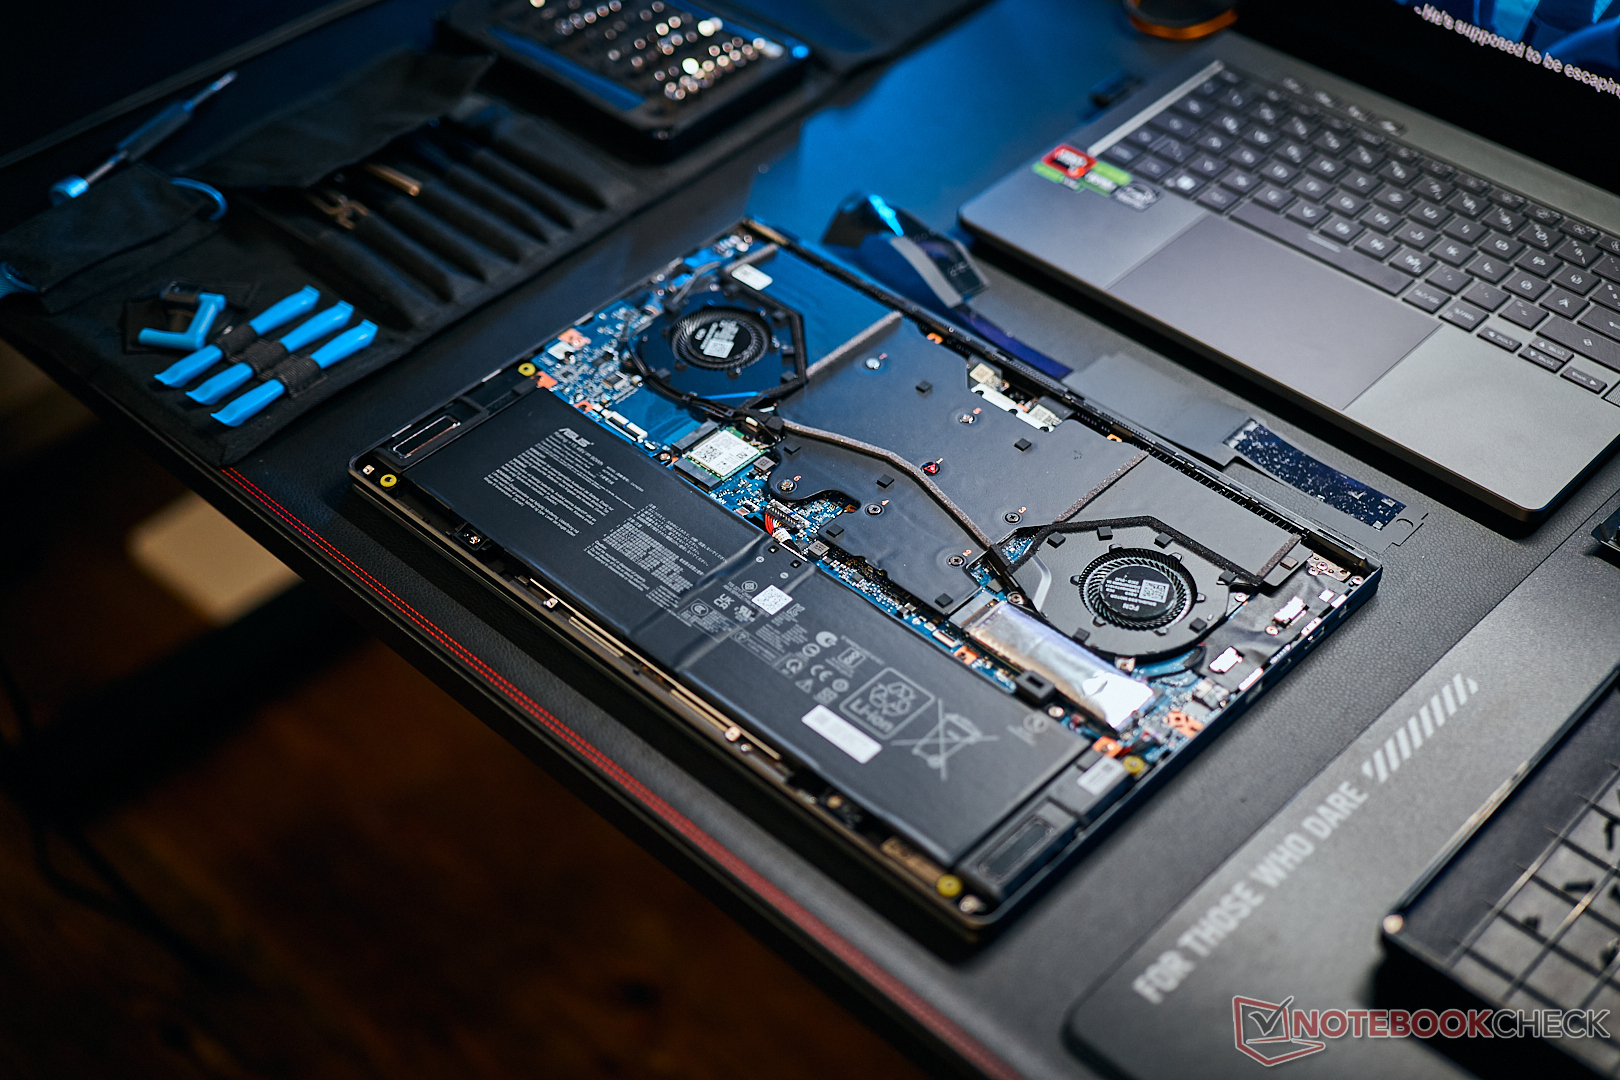
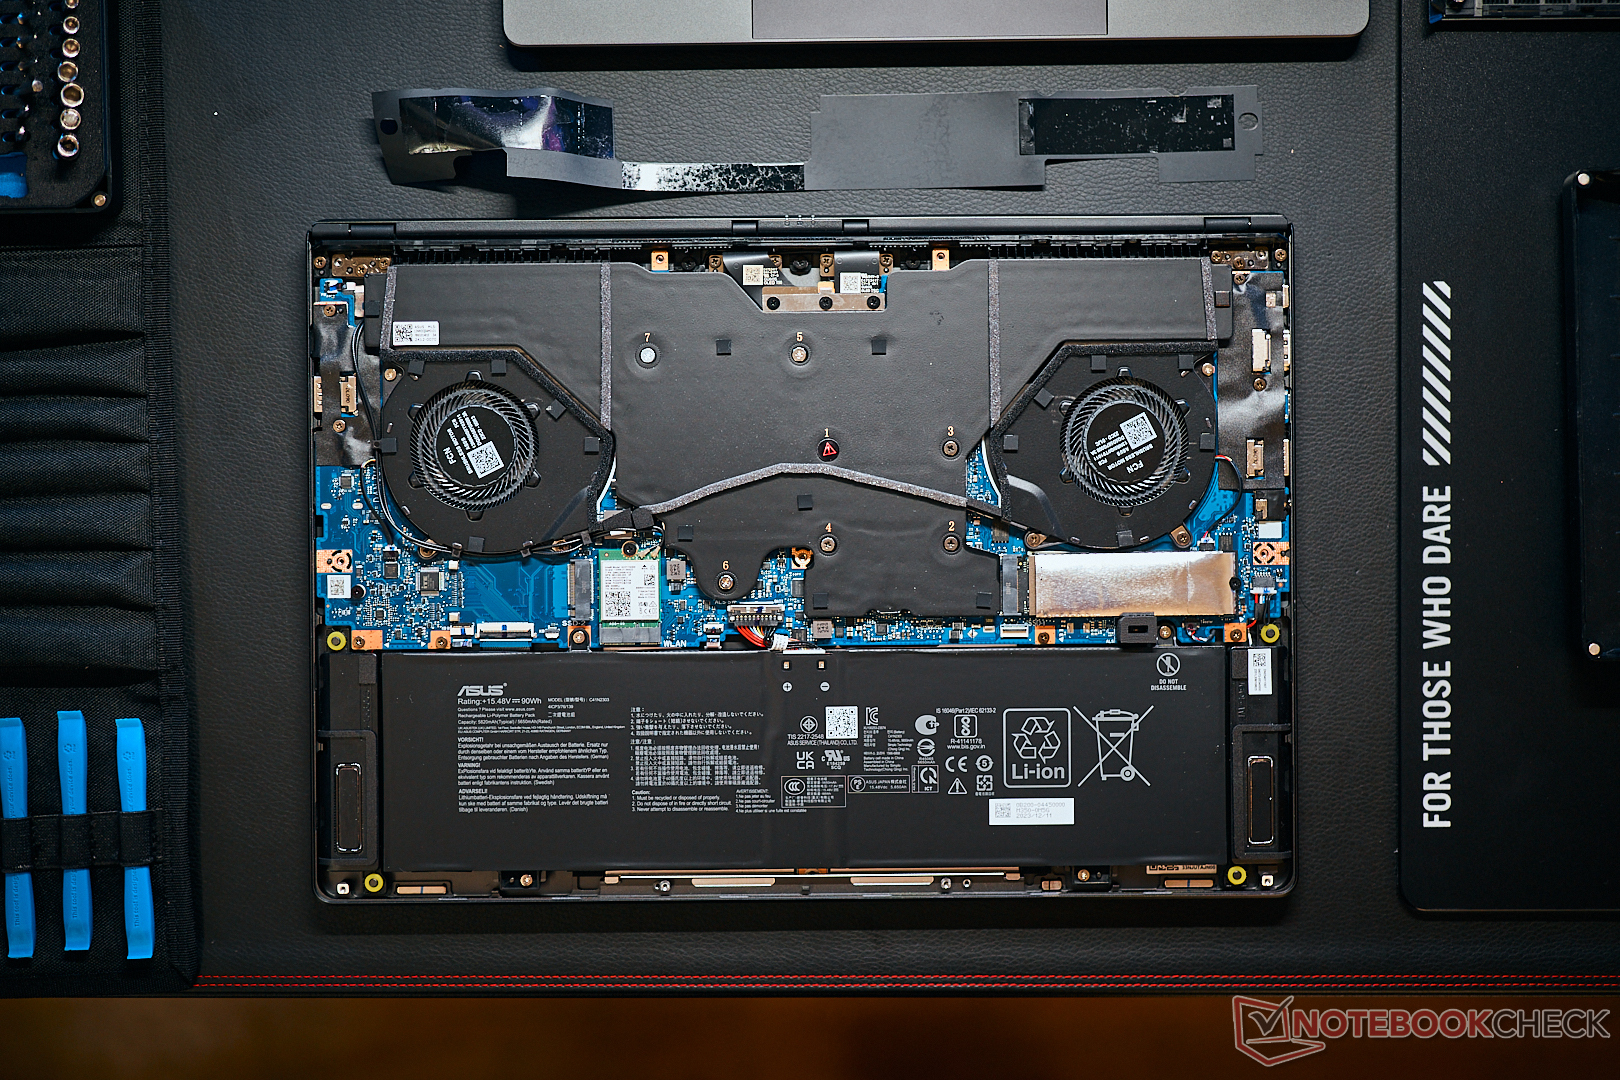
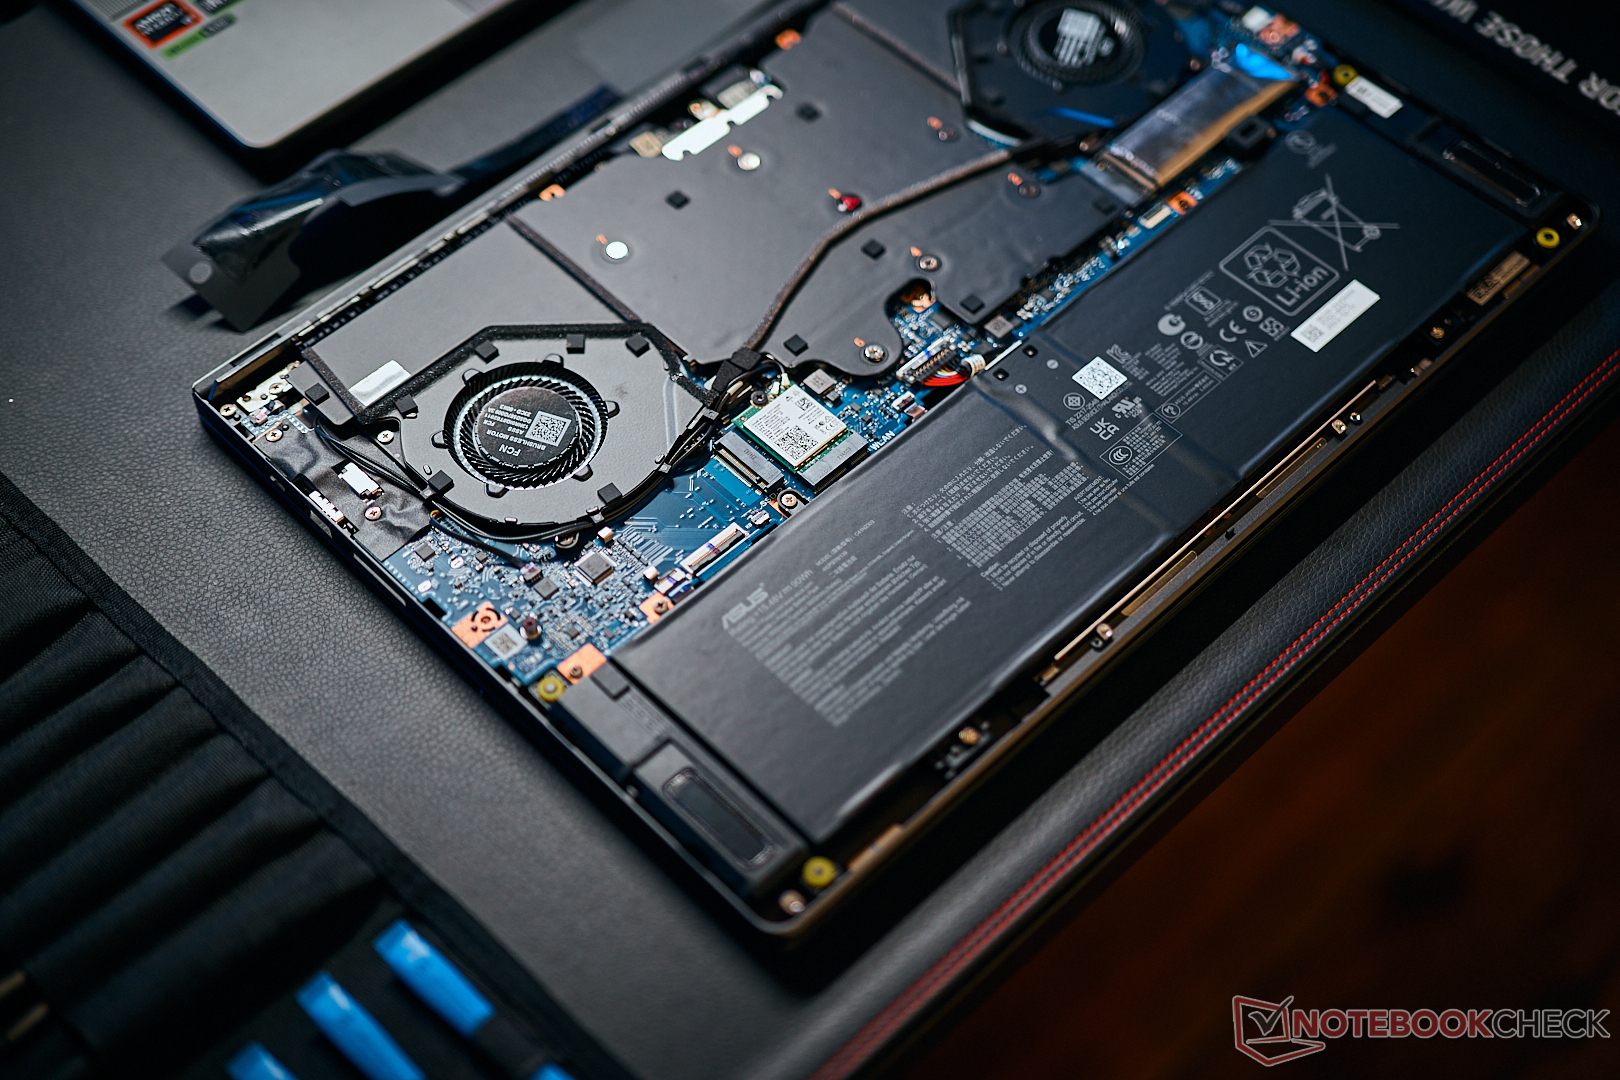
High-endowy model ROG Zephyrus G16 jest wizualnie nie do odróżnienia od słabszego, wyposażonego w RTX 4070/4060 laptopa. Wewnątrz widoczne są jednak różnice w układzie chłodzenia. Podczas gdy słabsze modele wykorzystują łącznie trzy wentylatory i zwykłe rurki cieplne, Asus zdecydował się na chłodzenie komorą parową z dwoma wentylatorami w droższych modelach.

Chłodzenie zwiększa wagę z 1,817 kg do 1,908 kg, co i tak jest niewielką wagą w porównaniu do innych laptopów z RTX 4090 w segmencie 16-calowym, ponieważ porównywane urządzenia są o co najmniej pół kilograma cięższe. Co więcej, Zephyrus jest jednocześnie jednym z najcieńszych i najbardziej kompaktowych modeli. Konfiguracje do laptopa RTX 4070 są wyposażone w 200-watowy zasilacz (583 gramy), a od laptopa RTX 4080 jest to mocniejszy 240-watowy zasilacz (745 gramów).

Laptop ROG Zephyrus G16 RTX 4090
Laptop ROG Zephyrus G16 RTX 4070

Porównanie rozmiarów

364.74 mm 289.81 mm 18.57 mm 2.7 kg356.7 mm 253 mm 26.6 mm 2.5 kg357.7 mm 277.7 mm 22.7 mm 2.5 kg355 mm 244 mm 22 mm 2.5 kg354 mm 246 mm 16.4 mm 1.9 kg354 mm 246 mm 16.4 mm 1.8 kg297 mm 210 mm 1 mm 5.7 g

Wydajność - laptop z Meteor Lake i RTX 4090

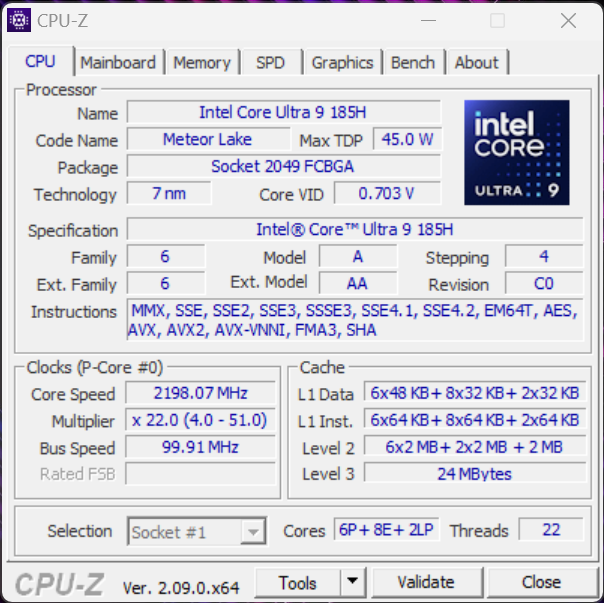
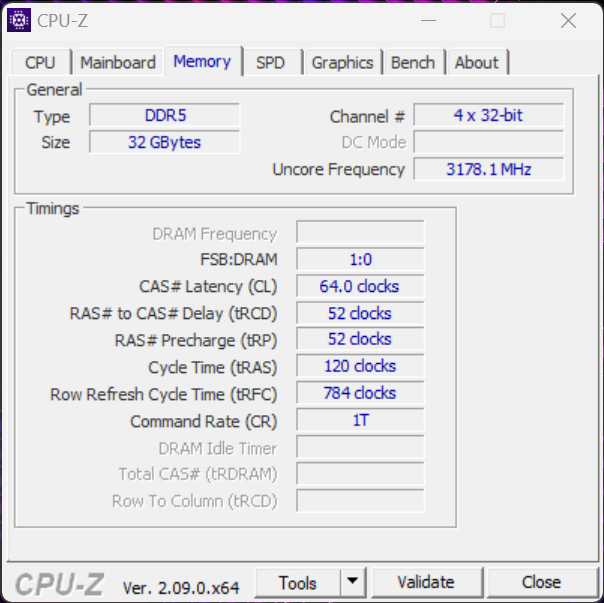
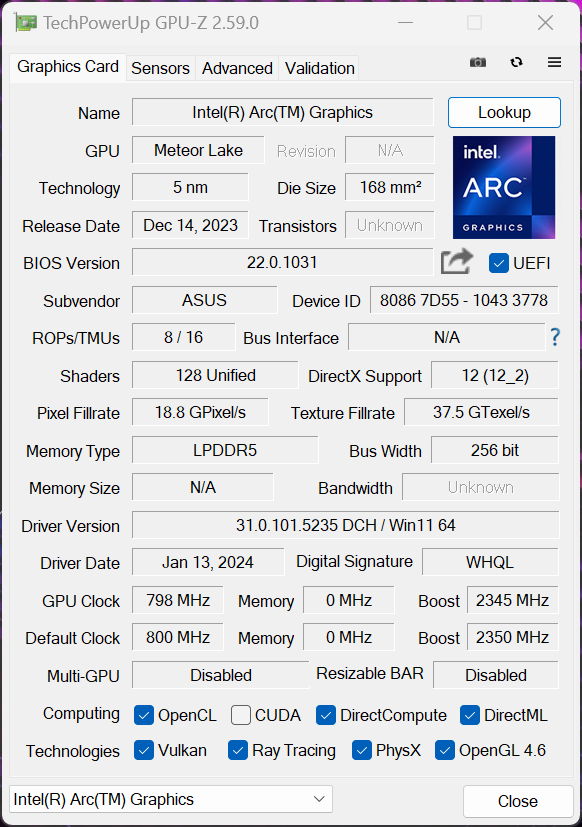
Wysokiej klasy wariant Zephyrus jest obecnie wyposażony w najszybszy procesor Meteor Lake, Core Ultra 9 185H. Jeśli chodzi o wydajność CPU, pozostaje on w tyle za procesorami Intel HX. W znalezionej tutaj 115-watowej wersji laptopa Nvidia GeForce RTX 4090 jest dość daleko od osiągnięcia maksymalnej wydajności. Zainstalowana pamięć RAM wynosi 32 GB (LPDDR5x 7467), ale ze względu na cenę i brak możliwości rozbudowy wolelibyśmy 64 GB.


Warunki testu

Podstawowe profile energetyczne pozostają identyczne, a mocniejszy model z laptopem RTX 4090 oferuje również profile Quiet, Performance i Turbo. W poniższej tabeli wymieniliśmy odpowiadające im wartości TDP/TGP, a także wpływ na wydajność. Poniżej dodaliśmy również wartości z modelu RTX 4070 Zephyrus G16, aby mogli Państwo zobaczyć bezpośrednie porównanie. Zasadniczo modele z wydajniejszym chłodzeniem komory parowej mogą zużywać nieco więcej energii, ale różnica jest dość niewielka, zwłaszcza jeśli chodzi o procesor. Zarówno w profilu Quiet, jak i Performance, chłodzenie komory parowej jest nawet nieco głośniejsze od słabszego wariantu RTX 4070. Standardowo przeprowadziliśmy testy porównawcze i pomiary przy użyciu trybu turbo, który jest jednak dostępny tylko po podłączeniu do sieci.

Asus ROG Zephyrus G16 RTX 4090 Laptop
Profil energetyczny Obciążenie CPU CB R23 Multi Obciążenie GPU Time Spy Grafika Cyberpunk 2077 QHD Ultra maks. głośność wentylatora
Cichy 60 watów 15 750 punktów 55 watów 9 731 punktów 40,2 klatek na sekundę 41,4 dB(A)
Wydajność 100->70 W 17,452 punktów 90 watów 15,205 punktów 60.2fps 48.1 dB(A)
Turbo 110->80 W 19,109 punktów 115 W 19,109 punktów 68.1fps 52.3 dB(A)
Asus ROG Zephyrus G16 RTX 4070 Laptop
Profil energetyczny Obciążenie CPU CB R23 Multi Obciążenie GPU Time Spy Grafika Cyberpunk 2077 QHD Ultra maks. głośność wentylatora
Cisza 60->45 watów 15,869 punktów 65 watów 9,042 punktów 32.6fps 41.5 dB(A)
Wydajność 70->50 watów 17,133 punktów 80 watów 10,989 punktów 43.7fps 46.4 dB(A)
Turbo 95->70 watów 18,372 punktów 105 watów 12,312 punktów 48.7fps 52.4 dB(A)

Procesor - Intel Core Ultra 9 185H

The Core Ultra 9 185H to najszybszy mobilny procesor z generacji Meteor Lake Intela, niemniej jednak plasuje się wyraźnie za procesorami HX (odświeżenie Raptor Lake). Jak właśnie zauważyliśmy w tabeli porównawczej, nie ma również namacalnych różnic między Core Ultra 9 i Core Ultra 7 w obu modelach Zephyrus G16 2024, a także Alienware x16 R2. Ten ostatni ma również Core Ultra 9 185H.

Jednak inni konkurenci RTX 4090 z Core i9 14900HX oferują znacznie wyższą wydajność procesora, zwłaszcza w testach wielordzeniowych. Wydajność wielordzeniowa ROG Zephyrus G16 nie zawsze pozostaje całkowicie stabilna, chociaż deficyt wynoszący około 10% przy stałym obciążeniu można uznać za dość niewielki. W trybie bateryjnym procesor może pobierać maksymalnie 75 watów, ale nie ma to prawie żadnego wpływu na wydajność wielordzeniową (~ 8%). Dodatkowe testy porównawcze procesora można znaleźć tutaj.

Cinebench R15 Multi Continuous Test

02655307951060132515901855212023852650291531803445371039754240450547705035Tooltip
Asus ROG Zephyrus G16 GU605MY Intel Core Ultra 9 185H: Ø2756 (2704.71-3019.32)
SCHENKER XMG Neo 16 (Early 24) Intel Core i9-14900HX: Ø5001 (4861.45-5267.14)
Lenovo Legion 9 16IRX9, RTX 4090 Intel Core i9-14900HX: Ø4648 (4505.52-4878.64)
Alienware x16 R2 P120F Intel Core Ultra 9 185H: Ø2753 (2708.56-2857.35)
Razer Blade 16 2024, RTX 4090 Intel Core i9-14900HX: Ø4396 (4349.72-4455.83)
Asus ROG Zephyrus G16 2024 GU605M Intel Core Ultra 7 155H: Ø2533 (2383.65-2679.17)
CPU Performance Rating: Percent
Cinebench R23: Multi Core | Single Core
Cinebench R20: CPU (Multi Core) | CPU (Single Core)
Cinebench R15: CPU Multi 64Bit | CPU Single 64Bit
Blender: v2.79 BMW27 CPU
7-Zip 18.03: 7z b 4 | 7z b 4 -mmt1
Geekbench 6.2: Multi-Core | Single-Core
Geekbench 5.5: Multi-Core | Single-Core
HWBOT x265 Benchmark v2.2: 4k Preset
LibreOffice : 20 Documents To PDF
R Benchmark 2.5: Overall mean
CPU Performance Rating
SCHENKER XMG Neo 16 (Early 24)
Intel Core i9-14900HX
88.6 pt
Razer Blade 16 2024, RTX 4090
Intel Core i9-14900HX
77.8 pt
Lenovo Legion 9 16IRX9, RTX 4090
Intel Core i9-14900HX
71.5 pt
Average of class Gaming
 
61.1 pt
Asus ROG Zephyrus G16 GU605MY
Intel Core Ultra 9 185H
59.8 pt
Average Intel Core Ultra 9 185H
 
54.9 pt
Asus ROG Zephyrus G16 2024 GU605M
Intel Core Ultra 7 155H
54.2 pt
Alienware x16 R2 P120F
Intel Core Ultra 9 185H
52.6 pt
Cinebench R23 / Multi Core
SCHENKER XMG Neo 16 (Early 24)
Intel Core i9-14900HX
36249 Points +90%
Lenovo Legion 9 16IRX9, RTX 4090
Intel Core i9-14900HX
31889 Points +67%
Razer Blade 16 2024, RTX 4090
Intel Core i9-14900HX
28867 Points +51%
Average of class Gaming
  (5668 - 36249, n=209, last 2 years)
20951 Points +10%
Asus ROG Zephyrus G16 GU605MY
Intel Core Ultra 9 185H
19110 Points
Alienware x16 R2 P120F
Intel Core Ultra 9 185H
18338 (17139.2min - 18337.8max) Points -4%
Average Intel Core Ultra 9 185H
  (12688 - 19851, n=14)
17475 Points -9%
Asus ROG Zephyrus G16 2024 GU605M
Intel Core Ultra 7 155H
17267 Points -10%
Cinebench R23 / Single Core
SCHENKER XMG Neo 16 (Early 24)
Intel Core i9-14900HX
2209 Points +18%
Razer Blade 16 2024, RTX 4090
Intel Core i9-14900HX
2117 Points +13%
Asus ROG Zephyrus G16 GU605MY
Intel Core Ultra 9 185H
1876 Points
Average of class Gaming
  (1136 - 2235, n=207, last 2 years)
1855 Points -1%
Average Intel Core Ultra 9 185H
  (1166 - 1912, n=14)
1783 Points -5%
Lenovo Legion 9 16IRX9, RTX 4090
Intel Core i9-14900HX
1720 Points -8%
Asus ROG Zephyrus G16 2024 GU605M
Intel Core Ultra 7 155H
1681 Points -10%
Alienware x16 R2 P120F
Intel Core Ultra 9 185H
1620 Points -14%
Cinebench R20 / CPU (Multi Core)
SCHENKER XMG Neo 16 (Early 24)
Intel Core i9-14900HX
13824 Points +89%
Lenovo Legion 9 16IRX9, RTX 4090
Intel Core i9-14900HX
11960 Points +64%
Razer Blade 16 2024, RTX 4090
Intel Core i9-14900HX
10968 Points +50%
Average of class Gaming
  (2179 - 13832, n=207, last 2 years)
7969 Points +9%
Asus ROG Zephyrus G16 GU605MY
Intel Core Ultra 9 185H
7299 Points
Alienware x16 R2 P120F
Intel Core Ultra 9 185H
7081 Points -3%
Average Intel Core Ultra 9 185H
  (4843 - 7651, n=14)
6734 Points -8%
Asus ROG Zephyrus G16 2024 GU605M
Intel Core Ultra 7 155H
6682 Points -8%
Cinebench R20 / CPU (Single Core)
SCHENKER XMG Neo 16 (Early 24)
Intel Core i9-14900HX
844 Points +18%
Razer Blade 16 2024, RTX 4090
Intel Core i9-14900HX
810 Points +13%
Asus ROG Zephyrus G16 GU605MY
Intel Core Ultra 9 185H
718 Points
Average of class Gaming
  (439 - 855, n=207, last 2 years)
714 Points -1%
Asus ROG Zephyrus G16 2024 GU605M
Intel Core Ultra 7 155H
693 Points -3%
Average Intel Core Ultra 9 185H
  (442 - 735, n=14)
686 Points -4%
Lenovo Legion 9 16IRX9, RTX 4090
Intel Core i9-14900HX
657 Points -8%
Alienware x16 R2 P120F
Intel Core Ultra 9 185H
622 Points -13%
Cinebench R15 / CPU Multi 64Bit
SCHENKER XMG Neo 16 (Early 24)
Intel Core i9-14900HX
5267 Points +74%
Lenovo Legion 9 16IRX9, RTX 4090
Intel Core i9-14900HX
4879 (4505.52min - 4878.64max) Points +62%
Razer Blade 16 2024, RTX 4090
Intel Core i9-14900HX
4456 (4349.72min - 4455.83max) Points +48%
Average of class Gaming
  (905 - 5663, n=213, last 2 years)
3294 Points +9%
Asus ROG Zephyrus G16 GU605MY
Intel Core Ultra 9 185H
3019 (2704.71min - 3019.32max) Points
Alienware x16 R2 P120F
Intel Core Ultra 9 185H
2857 (2708.56min - 2857.35max) Points -5%
Average Intel Core Ultra 9 185H
  (1582 - 3165, n=16)
2686 Points -11%
Asus ROG Zephyrus G16 2024 GU605M
Intel Core Ultra 7 155H
2679 (2383.65min - 2679.17max) Points -11%
Cinebench R15 / CPU Single 64Bit
Razer Blade 16 2024, RTX 4090
Intel Core i9-14900HX
311 Points +13%
SCHENKER XMG Neo 16 (Early 24)
Intel Core i9-14900HX
310 Points +13%
Asus ROG Zephyrus G16 GU605MY
Intel Core Ultra 9 185H
275 Points
Average of class Gaming
  (191.9 - 318, n=210, last 2 years)
274 Points 0%
Asus ROG Zephyrus G16 2024 GU605M
Intel Core Ultra 7 155H
264 Points -4%
Average Intel Core Ultra 9 185H
  (191.9 - 281, n=14)
262 Points -5%
Lenovo Legion 9 16IRX9, RTX 4090
Intel Core i9-14900HX
247 Points -10%
Alienware x16 R2 P120F
Intel Core Ultra 9 185H
238 Points -13%
Blender / v2.79 BMW27 CPU
Average Intel Core Ultra 9 185H
  (163 - 285, n=14)
195.1 Seconds * -10%
Asus ROG Zephyrus G16 2024 GU605M
Intel Core Ultra 7 155H
193 Seconds * -9%
Average of class Gaming
  (87 - 555, n=202, last 2 years)
178.4 Seconds * -1%
Alienware x16 R2 P120F
Intel Core Ultra 9 185H
178 Seconds * -1%
Asus ROG Zephyrus G16 GU605MY
Intel Core Ultra 9 185H
177 Seconds *
Razer Blade 16 2024, RTX 4090
Intel Core i9-14900HX
113 Seconds * +36%
Lenovo Legion 9 16IRX9, RTX 4090
Intel Core i9-14900HX
106 Seconds * +40%
SCHENKER XMG Neo 16 (Early 24)
Intel Core i9-14900HX
95 Seconds * +46%
7-Zip 18.03 / 7z b 4
SCHENKER XMG Neo 16 (Early 24)
Intel Core i9-14900HX
135229 MIPS +86%
Lenovo Legion 9 16IRX9, RTX 4090
Intel Core i9-14900HX
125676 MIPS +73%
Razer Blade 16 2024, RTX 4090
Intel Core i9-14900HX
115695 MIPS +59%
Average of class Gaming
  (23795 - 140932, n=206, last 2 years)
82035 MIPS +13%
Asus ROG Zephyrus G16 GU605MY
Intel Core Ultra 9 185H
72583 MIPS
Asus ROG Zephyrus G16 2024 GU605M
Intel Core Ultra 7 155H
68500 MIPS -6%
Average Intel Core Ultra 9 185H
  (51738 - 76331, n=14)
68216 MIPS -6%
Alienware x16 R2 P120F
Intel Core Ultra 9 185H
67227 MIPS -7%
7-Zip 18.03 / 7z b 4 -mmt1
SCHENKER XMG Neo 16 (Early 24)
Intel Core i9-14900HX
7406 MIPS +31%
Razer Blade 16 2024, RTX 4090
Intel Core i9-14900HX
7018 MIPS +24%
Average of class Gaming
  (4199 - 7581, n=206, last 2 years)
6228 MIPS +10%
Asus ROG Zephyrus G16 GU605MY
Intel Core Ultra 9 185H
5651 MIPS
Lenovo Legion 9 16IRX9, RTX 4090
Intel Core i9-14900HX
5452 MIPS -4%
Asus ROG Zephyrus G16 2024 GU605M
Intel Core Ultra 7 155H
5439 MIPS -4%
Average Intel Core Ultra 9 185H
  (4199 - 5781, n=14)
5353 MIPS -5%
Alienware x16 R2 P120F
Intel Core Ultra 9 185H
4502 MIPS -20%
Geekbench 6.2 / Multi-Core
SCHENKER XMG Neo 16 (Early 24)
Intel Core i9-14900HX
19451 Points +34%
Razer Blade 16 2024, RTX 4090
Intel Core i9-14900HX
17559 Points +21%
Lenovo Legion 9 16IRX9, RTX 4090
Intel Core i9-14900HX
17499 Points +20%
Asus ROG Zephyrus G16 GU605MY
Intel Core Ultra 9 185H
14540 Points
Average of class Gaming
  (5340 - 19665, n=104, last 2 years)
14172 Points -3%
Average Intel Core Ultra 9 185H
  (9140 - 14540, n=14)
13500 Points -7%
Asus ROG Zephyrus G16 2024 GU605M
Intel Core Ultra 7 155H
13323 Points -8%
Alienware x16 R2 P120F
Intel Core Ultra 9 185H
12825 Points -12%
Geekbench 6.2 / Single-Core
SCHENKER XMG Neo 16 (Early 24)
Intel Core i9-14900HX
3129 Points +22%
Razer Blade 16 2024, RTX 4090
Intel Core i9-14900HX
2964 Points +16%
Average of class Gaming
  (1490 - 3129, n=104, last 2 years)
2646 Points +3%
Asus ROG Zephyrus G16 GU605MY
Intel Core Ultra 9 185H
2559 Points
Lenovo Legion 9 16IRX9, RTX 4090
Intel Core i9-14900HX
2419 Points -5%
Asus ROG Zephyrus G16 2024 GU605M
Intel Core Ultra 7 155H
2410 Points -6%
Average Intel Core Ultra 9 185H
  (1490 - 2573, n=14)
2410 Points -6%
Alienware x16 R2 P120F
Intel Core Ultra 9 185H
2199 Points -14%
Geekbench 5.5 / Multi-Core
SCHENKER XMG Neo 16 (Early 24)
Intel Core i9-14900HX
23086 Points +63%
Lenovo Legion 9 16IRX9, RTX 4090
Intel Core i9-14900HX
21642 Points +53%
Razer Blade 16 2024, RTX 4090
Intel Core i9-14900HX
19372 Points +37%
Average of class Gaming
  (4557 - 23194, n=208, last 2 years)
14416 Points +2%
Asus ROG Zephyrus G16 GU605MY
Intel Core Ultra 9 185H
14137 Points
Average Intel Core Ultra 9 185H
  (9330 - 14230, n=14)
12975 Points -8%
Asus ROG Zephyrus G16 2024 GU605M
Intel Core Ultra 7 155H
12905 Points -9%
Alienware x16 R2 P120F
Intel Core Ultra 9 185H
12759 Points -10%
Geekbench 5.5 / Single-Core
SCHENKER XMG Neo 16 (Early 24)
Intel Core i9-14900HX
2195 Points +19%
Razer Blade 16 2024, RTX 4090
Intel Core i9-14900HX
2131 Points +15%
Average of class Gaming
  (986 - 2210, n=208, last 2 years)
1856 Points +1%
Asus ROG Zephyrus G16 GU605MY
Intel Core Ultra 9 185H
1846 Points
Average Intel Core Ultra 9 185H
  (986 - 1902, n=14)
1768 Points -4%
Asus ROG Zephyrus G16 2024 GU605M
Intel Core Ultra 7 155H
1755 Points -5%
Lenovo Legion 9 16IRX9, RTX 4090
Intel Core i9-14900HX
1729 Points -6%
Alienware x16 R2 P120F
Intel Core Ultra 9 185H
1700 Points -8%
HWBOT x265 Benchmark v2.2 / 4k Preset
SCHENKER XMG Neo 16 (Early 24)
Intel Core i9-14900HX
35.3 fps +66%
Lenovo Legion 9 16IRX9, RTX 4090
Intel Core i9-14900HX
30.7 fps +44%
Razer Blade 16 2024, RTX 4090
Intel Core i9-14900HX
30.1 fps +41%
Average of class Gaming
  (6.72 - 38.9, n=206, last 2 years)
22.7 fps +7%
Asus ROG Zephyrus G16 GU605MY
Intel Core Ultra 9 185H
21.3 fps
Alienware x16 R2 P120F
Intel Core Ultra 9 185H
20.7 fps -3%
Asus ROG Zephyrus G16 2024 GU605M
Intel Core Ultra 7 155H
19.9 fps -7%
Average Intel Core Ultra 9 185H
  (14.1 - 22.7, n=14)
19.7 fps -8%
LibreOffice / 20 Documents To PDF
Lenovo Legion 9 16IRX9, RTX 4090
Intel Core i9-14900HX
53.6 s * -25%
Asus ROG Zephyrus G16 2024 GU605M
Intel Core Ultra 7 155H
49.6 s * -16%
Average of class Gaming
  (31.4 - 96.6, n=203, last 2 years)
48.4 s * -13%
Razer Blade 16 2024, RTX 4090
Intel Core i9-14900HX
47.5 s * -11%
Alienware x16 R2 P120F
Intel Core Ultra 9 185H
45.9 s * -7%
Average Intel Core Ultra 9 185H
  (34.5 - 62, n=14)
44 s * -3%
Asus ROG Zephyrus G16 GU605MY
Intel Core Ultra 9 185H
42.9 s *
SCHENKER XMG Neo 16 (Early 24)
Intel Core i9-14900HX
32.9 s * +23%
R Benchmark 2.5 / Overall mean
Alienware x16 R2 P120F
Intel Core Ultra 9 185H
0.503 sec * -17%
Lenovo Legion 9 16IRX9, RTX 4090
Intel Core i9-14900HX
0.4859 sec * -13%
Average Intel Core Ultra 9 185H
  (0.4313 - 0.759, n=15)
0.4766 sec * -11%
Asus ROG Zephyrus G16 2024 GU605M
Intel Core Ultra 7 155H
0.4654 sec * -8%
Average of class Gaming
  (0.3609 - 0.759, n=207, last 2 years)
0.4442 sec * -3%
Asus ROG Zephyrus G16 GU605MY
Intel Core Ultra 9 185H
0.4313 sec *
Razer Blade 16 2024, RTX 4090
Intel Core i9-14900HX
0.3789 sec * +12%
SCHENKER XMG Neo 16 (Early 24)
Intel Core i9-14900HX
0.3658 sec * +15%

* ... im mniej tym lepiej

Cinebench R15 CPU Multi 64Bit
3019 Points
Cinebench R15 OpenGL 64Bit
192.9 fps
Cinebench R15 Ref. Match 64Bit
99.6 %
Cinebench R15 CPU Single 64Bit
275 Points
Pomoc
Performance Rating
SCHENKER XMG Neo 16 (Early 24)
Intel Core i9-14900HX, NVIDIA GeForce RTX 4090 Laptop GPU
99 pt
Lenovo Legion 9 16IRX9, RTX 4090
Intel Core i9-14900HX, NVIDIA GeForce RTX 4090 Laptop GPU
91.1 pt
Razer Blade 16 2024, RTX 4090
Intel Core i9-14900HX, NVIDIA GeForce RTX 4090 Laptop GPU
85.6 pt
Average of class Gaming
 
68.7 pt
Alienware x16 R2 P120F
Intel Core Ultra 9 185H, NVIDIA GeForce RTX 4080 Laptop GPU
64.9 pt
Asus ROG Zephyrus G16 GU605MY
Intel Core Ultra 9 185H, NVIDIA GeForce RTX 4090 Laptop GPU
61.8 pt
Average Intel Core Ultra 9 185H
 
58.5 pt
Asus ROG Zephyrus G16 2024 GU605M
Intel Core Ultra 7 155H, NVIDIA GeForce RTX 4070 Laptop GPU
58 pt
AIDA64 / FP32 Ray-Trace
SCHENKER XMG Neo 16 (Early 24)
Intel Core i9-14900HX, NVIDIA GeForce RTX 4090 Laptop GPU
30829 KRay/s +77%
Lenovo Legion 9 16IRX9, RTX 4090
Intel Core i9-14900HX, NVIDIA GeForce RTX 4090 Laptop GPU
27535 KRay/s +58%
Razer Blade 16 2024, RTX 4090
Intel Core i9-14900HX, NVIDIA GeForce RTX 4090 Laptop GPU
25682 KRay/s +47%
Average of class Gaming
  (4986 - 60169, n=203, last 2 years)
20905 KRay/s +20%
Alienware x16 R2 P120F
Intel Core Ultra 9 185H, NVIDIA GeForce RTX 4080 Laptop GPU
18676 KRay/s +7%
Asus ROG Zephyrus G16 GU605MY
Intel Core Ultra 9 185H, NVIDIA GeForce RTX 4090 Laptop GPU
17461 KRay/s
Asus ROG Zephyrus G16 2024 GU605M
Intel Core Ultra 7 155H, NVIDIA GeForce RTX 4070 Laptop GPU
16431 KRay/s -6%
Average Intel Core Ultra 9 185H
  (9220 - 18676, n=14)
16226 KRay/s -7%
AIDA64 / FPU Julia
SCHENKER XMG Neo 16 (Early 24)
Intel Core i9-14900HX, NVIDIA GeForce RTX 4090 Laptop GPU
150728 Points +66%
Lenovo Legion 9 16IRX9, RTX 4090
Intel Core i9-14900HX, NVIDIA GeForce RTX 4090 Laptop GPU
136486 Points +50%
Razer Blade 16 2024, RTX 4090
Intel Core i9-14900HX, NVIDIA GeForce RTX 4090 Laptop GPU
127908 Points +41%
Average of class Gaming
  (25360 - 252486, n=203, last 2 years)
103544 Points +14%
Alienware x16 R2 P120F
Intel Core Ultra 9 185H, NVIDIA GeForce RTX 4080 Laptop GPU
96463 Points +6%
Asus ROG Zephyrus G16 GU605MY
Intel Core Ultra 9 185H, NVIDIA GeForce RTX 4090 Laptop GPU
90983 Points
Asus ROG Zephyrus G16 2024 GU605M
Intel Core Ultra 7 155H, NVIDIA GeForce RTX 4070 Laptop GPU
85461 Points -6%
Average Intel Core Ultra 9 185H
  (48865 - 96463, n=14)
84200 Points -7%
AIDA64 / CPU SHA3
SCHENKER XMG Neo 16 (Early 24)
Intel Core i9-14900HX, NVIDIA GeForce RTX 4090 Laptop GPU
7588 MB/s +77%
Lenovo Legion 9 16IRX9, RTX 4090
Intel Core i9-14900HX, NVIDIA GeForce RTX 4090 Laptop GPU
7000 MB/s +64%
Razer Blade 16 2024, RTX 4090
Intel Core i9-14900HX, NVIDIA GeForce RTX 4090 Laptop GPU
6188 MB/s +45%
Average of class Gaming
  (1339 - 10389, n=203, last 2 years)
4701 MB/s +10%
Alienware x16 R2 P120F
Intel Core Ultra 9 185H, NVIDIA GeForce RTX 4080 Laptop GPU
4534 MB/s +6%
Asus ROG Zephyrus G16 GU605MY
Intel Core Ultra 9 185H, NVIDIA GeForce RTX 4090 Laptop GPU
4278 MB/s
Average Intel Core Ultra 9 185H
  (2394 - 4534, n=14)
3954 MB/s -8%
Asus ROG Zephyrus G16 2024 GU605M
Intel Core Ultra 7 155H, NVIDIA GeForce RTX 4070 Laptop GPU
3814 MB/s -11%
AIDA64 / CPU Queen
SCHENKER XMG Neo 16 (Early 24)
Intel Core i9-14900HX, NVIDIA GeForce RTX 4090 Laptop GPU
148966 Points +63%
Razer Blade 16 2024, RTX 4090
Intel Core i9-14900HX, NVIDIA GeForce RTX 4090 Laptop GPU
138473 Points +52%
Lenovo Legion 9 16IRX9, RTX 4090
Intel Core i9-14900HX, NVIDIA GeForce RTX 4090 Laptop GPU
130803 Points +43%
Average of class Gaming
  (41257 - 200651, n=203, last 2 years)
114303 Points +25%
Alienware x16 R2 P120F
Intel Core Ultra 9 185H, NVIDIA GeForce RTX 4080 Laptop GPU
94794 Points +4%
Asus ROG Zephyrus G16 GU605MY
Intel Core Ultra 9 185H, NVIDIA GeForce RTX 4090 Laptop GPU
91400 Points
Asus ROG Zephyrus G16 2024 GU605M
Intel Core Ultra 7 155H, NVIDIA GeForce RTX 4070 Laptop GPU
90347 Points -1%
Average Intel Core Ultra 9 185H
  (66785 - 95241, n=14)
89088 Points -3%
AIDA64 / FPU SinJulia
SCHENKER XMG Neo 16 (Early 24)
Intel Core i9-14900HX, NVIDIA GeForce RTX 4090 Laptop GPU
18114 Points +63%
Lenovo Legion 9 16IRX9, RTX 4090
Intel Core i9-14900HX, NVIDIA GeForce RTX 4090 Laptop GPU
16268 Points +47%
Razer Blade 16 2024, RTX 4090
Intel Core i9-14900HX, NVIDIA GeForce RTX 4090 Laptop GPU
15857 Points +43%
Average of class Gaming
  (3925 - 32988, n=203, last 2 years)
12910 Points +16%
Alienware x16 R2 P120F
Intel Core Ultra 9 185H, NVIDIA GeForce RTX 4080 Laptop GPU
11095 Points 0%
Asus ROG Zephyrus G16 GU605MY
Intel Core Ultra 9 185H, NVIDIA GeForce RTX 4090 Laptop GPU
11092 Points
Asus ROG Zephyrus G16 2024 GU605M
Intel Core Ultra 7 155H, NVIDIA GeForce RTX 4070 Laptop GPU
10641 Points -4%
Average Intel Core Ultra 9 185H
  (7255 - 11392, n=14)
10419 Points -6%
AIDA64 / FPU Mandel
SCHENKER XMG Neo 16 (Early 24)
Intel Core i9-14900HX, NVIDIA GeForce RTX 4090 Laptop GPU
76668 Points +70%
Lenovo Legion 9 16IRX9, RTX 4090
Intel Core i9-14900HX, NVIDIA GeForce RTX 4090 Laptop GPU
68467 Points +52%
Razer Blade 16 2024, RTX 4090
Intel Core i9-14900HX, NVIDIA GeForce RTX 4090 Laptop GPU
64134 Points +42%
Average of class Gaming
  (12321 - 134044, n=203, last 2 years)
52403 Points +16%
Alienware x16 R2 P120F
Intel Core Ultra 9 185H, NVIDIA GeForce RTX 4080 Laptop GPU
48020 Points +6%
Asus ROG Zephyrus G16 GU605MY
Intel Core Ultra 9 185H, NVIDIA GeForce RTX 4090 Laptop GPU
45127 Points
Asus ROG Zephyrus G16 2024 GU605M
Intel Core Ultra 7 155H, NVIDIA GeForce RTX 4070 Laptop GPU
41806 Points -7%
Average Intel Core Ultra 9 185H
  (24004 - 48020, n=14)
41298 Points -8%
AIDA64 / CPU AES
SCHENKER XMG Neo 16 (Early 24)
Intel Core i9-14900HX, NVIDIA GeForce RTX 4090 Laptop GPU
145389 MB/s +72%
Lenovo Legion 9 16IRX9, RTX 4090
Intel Core i9-14900HX, NVIDIA GeForce RTX 4090 Laptop GPU
133395 MB/s +57%
Razer Blade 16 2024, RTX 4090
Intel Core i9-14900HX, NVIDIA GeForce RTX 4090 Laptop GPU
122937 MB/s +45%
Average of class Gaming
  (19065 - 328679, n=203, last 2 years)
108740 MB/s +28%
Average Intel Core Ultra 9 185H
  (53116 - 154066, n=14)
89748 MB/s +6%
Alienware x16 R2 P120F
Intel Core Ultra 9 185H, NVIDIA GeForce RTX 4080 Laptop GPU
88763 MB/s +5%
Asus ROG Zephyrus G16 GU605MY
Intel Core Ultra 9 185H, NVIDIA GeForce RTX 4090 Laptop GPU
84774 MB/s
Asus ROG Zephyrus G16 2024 GU605M
Intel Core Ultra 7 155H, NVIDIA GeForce RTX 4070 Laptop GPU
79475 MB/s -6%
AIDA64 / CPU ZLib
SCHENKER XMG Neo 16 (Early 24)
Intel Core i9-14900HX, NVIDIA GeForce RTX 4090 Laptop GPU
2239 MB/s +86%
Lenovo Legion 9 16IRX9, RTX 4090
Intel Core i9-14900HX, NVIDIA GeForce RTX 4090 Laptop GPU
2043 MB/s +70%
Razer Blade 16 2024, RTX 4090
Intel Core i9-14900HX, NVIDIA GeForce RTX 4090 Laptop GPU
1863 MB/s +55%
Average of class Gaming
  (269 - 2409, n=203, last 2 years)
1302 MB/s +8%
Alienware x16 R2 P120F
Intel Core Ultra 9 185H, NVIDIA GeForce RTX 4080 Laptop GPU
1298 MB/s +8%
Asus ROG Zephyrus G16 GU605MY
Intel Core Ultra 9 185H, NVIDIA GeForce RTX 4090 Laptop GPU
1201 MB/s
Average Intel Core Ultra 9 185H
  (678 - 1341, n=14)
1142 MB/s -5%
Asus ROG Zephyrus G16 2024 GU605M
Intel Core Ultra 7 155H, NVIDIA GeForce RTX 4070 Laptop GPU
1128 MB/s -6%
AIDA64 / FP64 Ray-Trace
SCHENKER XMG Neo 16 (Early 24)
Intel Core i9-14900HX, NVIDIA GeForce RTX 4090 Laptop GPU
16655 KRay/s +79%
Lenovo Legion 9 16IRX9, RTX 4090
Intel Core i9-14900HX, NVIDIA GeForce RTX 4090 Laptop GPU
14791 KRay/s +59%
Razer Blade 16 2024, RTX 4090
Intel Core i9-14900HX, NVIDIA GeForce RTX 4090 Laptop GPU
13993 KRay/s +50%
Average of class Gaming
  (2540 - 31796, n=203, last 2 years)
11266 KRay/s +21%
Alienware x16 R2 P120F
Intel Core Ultra 9 185H, NVIDIA GeForce RTX 4080 Laptop GPU
10078 KRay/s +8%
Asus ROG Zephyrus G16 GU605MY
Intel Core Ultra 9 185H, NVIDIA GeForce RTX 4090 Laptop GPU
9329 KRay/s
Average Intel Core Ultra 9 185H
  (4428 - 10078, n=14)
8511 KRay/s -9%
Asus ROG Zephyrus G16 2024 GU605M
Intel Core Ultra 7 155H, NVIDIA GeForce RTX 4070 Laptop GPU
8449 KRay/s -9%
AIDA64 / CPU PhotoWorxx
Lenovo Legion 9 16IRX9, RTX 4090
Intel Core i9-14900HX, NVIDIA GeForce RTX 4090 Laptop GPU
54702 MPixel/s +5%
Alienware x16 R2 P120F
Intel Core Ultra 9 185H, NVIDIA GeForce RTX 4080 Laptop GPU
53242 MPixel/s +2%
Asus ROG Zephyrus G16 GU605MY
Intel Core Ultra 9 185H, NVIDIA GeForce RTX 4090 Laptop GPU
52181 MPixel/s
Razer Blade 16 2024, RTX 4090
Intel Core i9-14900HX, NVIDIA GeForce RTX 4090 Laptop GPU
49616 MPixel/s -5%
SCHENKER XMG Neo 16 (Early 24)
Intel Core i9-14900HX, NVIDIA GeForce RTX 4090 Laptop GPU
49305 MPixel/s -6%
Asus ROG Zephyrus G16 2024 GU605M
Intel Core Ultra 7 155H, NVIDIA GeForce RTX 4070 Laptop GPU
49238 MPixel/s -6%
Average Intel Core Ultra 9 185H
  (44809 - 53918, n=14)
49043 MPixel/s -6%
Average of class Gaming
  (10805 - 60161, n=204, last 2 years)
38928 MPixel/s -25%

Wydajność systemu

Nieco mniej zaskakujące jest to, że high-endowy wariant Zephyrusa G16 jest bardzo responsywnym laptopem. Choć wyniki benchmarków również są dobre, to po raz kolejny konkurencja wyposażona w procesor HX wypada lepiej. Nie jest to jednak zauważalne w codziennych sytuacjach. Ze względu na przełączanie grafiki Advanced Optimus, podczas uruchamiania gier występuje sporadyczne krótkie zawieszenie, gdy system przełącza się na dGPU, jednak jest to całkowicie normalne.

PCMark 10 / Score
SCHENKER XMG Neo 16 (Early 24)
NVIDIA GeForce RTX 4090 Laptop GPU, i9-14900HX, Samsung 990 Pro 1 TB
9017 Points +13%
Razer Blade 16 2024, RTX 4090
NVIDIA GeForce RTX 4090 Laptop GPU, i9-14900HX, Samsung PM9A1 MZVL22T0HBLB
8401 Points +5%
Lenovo Legion 9 16IRX9, RTX 4090
NVIDIA GeForce RTX 4090 Laptop GPU, i9-14900HX, Micron 3400 2TB MTFDKBA2T0TFH
8239 Points +3%
Asus ROG Zephyrus G16 GU605MY
NVIDIA GeForce RTX 4090 Laptop GPU, Ultra 9 185H, Samsung PM9A1a MZVL22T0HDLB
7993 Points
Average Intel Core Ultra 9 185H, NVIDIA GeForce RTX 4090 Laptop GPU
  ()
7993 Points 0%
Average of class Gaming
  (5442 - 9852, n=182, last 2 years)
7700 Points -4%
Alienware x16 R2 P120F
NVIDIA GeForce RTX 4080 Laptop GPU, Ultra 9 185H, WDC PC SN810 1TB
7251 Points -9%
Asus ROG Zephyrus G16 2024 GU605M
NVIDIA GeForce RTX 4070 Laptop GPU, Ultra 7 155H, WD PC SN560 SDDPNQE-1T00
7123 Points -11%
PCMark 10 / Essentials
SCHENKER XMG Neo 16 (Early 24)
NVIDIA GeForce RTX 4090 Laptop GPU, i9-14900HX, Samsung 990 Pro 1 TB
11065 Points +2%
Lenovo Legion 9 16IRX9, RTX 4090
NVIDIA GeForce RTX 4090 Laptop GPU, i9-14900HX, Micron 3400 2TB MTFDKBA2T0TFH
11007 Points +2%
Razer Blade 16 2024, RTX 4090
NVIDIA GeForce RTX 4090 Laptop GPU, i9-14900HX, Samsung PM9A1 MZVL22T0HBLB
10915 Points +1%
Asus ROG Zephyrus G16 GU605MY
NVIDIA GeForce RTX 4090 Laptop GPU, Ultra 9 185H, Samsung PM9A1a MZVL22T0HDLB
10835 Points
Average Intel Core Ultra 9 185H, NVIDIA GeForce RTX 4090 Laptop GPU
  ()
10835 Points 0%
Average of class Gaming
  (8829 - 12334, n=181, last 2 years)
10794 Points 0%
Asus ROG Zephyrus G16 2024 GU605M
NVIDIA GeForce RTX 4070 Laptop GPU, Ultra 7 155H, WD PC SN560 SDDPNQE-1T00
10038 Points -7%
Alienware x16 R2 P120F
NVIDIA GeForce RTX 4080 Laptop GPU, Ultra 9 185H, WDC PC SN810 1TB
10036 Points -7%
PCMark 10 / Productivity
SCHENKER XMG Neo 16 (Early 24)
NVIDIA GeForce RTX 4090 Laptop GPU, i9-14900HX, Samsung 990 Pro 1 TB
11681 Points +18%
Razer Blade 16 2024, RTX 4090
NVIDIA GeForce RTX 4090 Laptop GPU, i9-14900HX, Samsung PM9A1 MZVL22T0HBLB
11150 Points +12%
Lenovo Legion 9 16IRX9, RTX 4090
NVIDIA GeForce RTX 4090 Laptop GPU, i9-14900HX, Micron 3400 2TB MTFDKBA2T0TFH
10202 Points +3%
Asus ROG Zephyrus G16 GU605MY
NVIDIA GeForce RTX 4090 Laptop GPU, Ultra 9 185H, Samsung PM9A1a MZVL22T0HDLB
9937 Points
Average Intel Core Ultra 9 185H, NVIDIA GeForce RTX 4090 Laptop GPU
  ()
9937 Points 0%
Average of class Gaming
  (6662 - 14612, n=181, last 2 years)
9820 Points -1%
Asus ROG Zephyrus G16 2024 GU605M
NVIDIA GeForce RTX 4070 Laptop GPU, Ultra 7 155H, WD PC SN560 SDDPNQE-1T00
9208 Points -7%
Alienware x16 R2 P120F
NVIDIA GeForce RTX 4080 Laptop GPU, Ultra 9 185H, WDC PC SN810 1TB
7934 Points -20%
PCMark 10 / Digital Content Creation
SCHENKER XMG Neo 16 (Early 24)
NVIDIA GeForce RTX 4090 Laptop GPU, i9-14900HX, Samsung 990 Pro 1 TB
15394 Points +20%
Lenovo Legion 9 16IRX9, RTX 4090
NVIDIA GeForce RTX 4090 Laptop GPU, i9-14900HX, Micron 3400 2TB MTFDKBA2T0TFH
13516 Points +5%
Razer Blade 16 2024, RTX 4090
NVIDIA GeForce RTX 4090 Laptop GPU, i9-14900HX, Samsung PM9A1 MZVL22T0HBLB
13219 Points +3%
Alienware x16 R2 P120F
NVIDIA GeForce RTX 4080 Laptop GPU, Ultra 9 185H, WDC PC SN810 1TB
12994 Points +1%
Asus ROG Zephyrus G16 GU605MY
NVIDIA GeForce RTX 4090 Laptop GPU, Ultra 9 185H, Samsung PM9A1a MZVL22T0HDLB
12872 Points
Average Intel Core Ultra 9 185H, NVIDIA GeForce RTX 4090 Laptop GPU
  ()
12872 Points 0%
Average of class Gaming
  (6462 - 18475, n=181, last 2 years)
11807 Points -8%
Asus ROG Zephyrus G16 2024 GU605M
NVIDIA GeForce RTX 4070 Laptop GPU, Ultra 7 155H, WD PC SN560 SDDPNQE-1T00
10612 Points -18%
CrossMark / Overall
SCHENKER XMG Neo 16 (Early 24)
NVIDIA GeForce RTX 4090 Laptop GPU, i9-14900HX, Samsung 990 Pro 1 TB
2344 Points +29%
Razer Blade 16 2024, RTX 4090
NVIDIA GeForce RTX 4090 Laptop GPU, i9-14900HX, Samsung PM9A1 MZVL22T0HBLB
2149 Points +18%
Lenovo Legion 9 16IRX9, RTX 4090
NVIDIA GeForce RTX 4090 Laptop GPU, i9-14900HX, Micron 3400 2TB MTFDKBA2T0TFH
1939 Points +7%
Average of class Gaming
  (1247 - 2344, n=162, last 2 years)
1881 Points +4%
Asus ROG Zephyrus G16 GU605MY
NVIDIA GeForce RTX 4090 Laptop GPU, Ultra 9 185H, Samsung PM9A1a MZVL22T0HDLB
1815 Points
Average Intel Core Ultra 9 185H, NVIDIA GeForce RTX 4090 Laptop GPU
  ()
1815 Points 0%
Asus ROG Zephyrus G16 2024 GU605M
NVIDIA GeForce RTX 4070 Laptop GPU, Ultra 7 155H, WD PC SN560 SDDPNQE-1T00
1721 Points -5%
Alienware x16 R2 P120F
NVIDIA GeForce RTX 4080 Laptop GPU, Ultra 9 185H, WDC PC SN810 1TB
1589 Points -12%
CrossMark / Productivity
SCHENKER XMG Neo 16 (Early 24)
NVIDIA GeForce RTX 4090 Laptop GPU, i9-14900HX, Samsung 990 Pro 1 TB
2162 Points +27%
Razer Blade 16 2024, RTX 4090
NVIDIA GeForce RTX 4090 Laptop GPU, i9-14900HX, Samsung PM9A1 MZVL22T0HBLB
2007 Points +18%
Average of class Gaming
  (1299 - 2204, n=162, last 2 years)
1787 Points +5%
Lenovo Legion 9 16IRX9, RTX 4090
NVIDIA GeForce RTX 4090 Laptop GPU, i9-14900HX, Micron 3400 2TB MTFDKBA2T0TFH
1755 Points +3%
Asus ROG Zephyrus G16 GU605MY
NVIDIA GeForce RTX 4090 Laptop GPU, Ultra 9 185H, Samsung PM9A1a MZVL22T0HDLB
1700 Points
Average Intel Core Ultra 9 185H, NVIDIA GeForce RTX 4090 Laptop GPU
  ()
1700 Points 0%
Asus ROG Zephyrus G16 2024 GU605M
NVIDIA GeForce RTX 4070 Laptop GPU, Ultra 7 155H, WD PC SN560 SDDPNQE-1T00
1624 Points -4%
Alienware x16 R2 P120F
NVIDIA GeForce RTX 4080 Laptop GPU, Ultra 9 185H, WDC PC SN810 1TB
1584 Points -7%
CrossMark / Creativity
SCHENKER XMG Neo 16 (Early 24)
NVIDIA GeForce RTX 4090 Laptop GPU, i9-14900HX, Samsung 990 Pro 1 TB
2660 Points +29%
Razer Blade 16 2024, RTX 4090
NVIDIA GeForce RTX 4090 Laptop GPU, i9-14900HX, Samsung PM9A1 MZVL22T0HBLB
2418 Points +17%
Lenovo Legion 9 16IRX9, RTX 4090
NVIDIA GeForce RTX 4090 Laptop GPU, i9-14900HX, Micron 3400 2TB MTFDKBA2T0TFH
2207 Points +7%
Asus ROG Zephyrus G16 GU605MY
NVIDIA GeForce RTX 4090 Laptop GPU, Ultra 9 185H, Samsung PM9A1a MZVL22T0HDLB
2070 Points
Average Intel Core Ultra 9 185H, NVIDIA GeForce RTX 4090 Laptop GPU
  ()
2070 Points 0%
Average of class Gaming
  (1275 - 2660, n=162, last 2 years)
2059 Points -1%
Asus ROG Zephyrus G16 2024 GU605M
NVIDIA GeForce RTX 4070 Laptop GPU, Ultra 7 155H, WD PC SN560 SDDPNQE-1T00
1942 Points -6%
Alienware x16 R2 P120F
NVIDIA GeForce RTX 4080 Laptop GPU, Ultra 9 185H, WDC PC SN810 1TB
1583 Points -24%
CrossMark / Responsiveness
SCHENKER XMG Neo 16 (Early 24)
NVIDIA GeForce RTX 4090 Laptop GPU, i9-14900HX, Samsung 990 Pro 1 TB
2045 Points +37%
Razer Blade 16 2024, RTX 4090
NVIDIA GeForce RTX 4090 Laptop GPU, i9-14900HX, Samsung PM9A1 MZVL22T0HBLB
1851 Points +24%
Lenovo Legion 9 16IRX9, RTX 4090
NVIDIA GeForce RTX 4090 Laptop GPU, i9-14900HX, Micron 3400 2TB MTFDKBA2T0TFH
1769 Points +19%
Average of class Gaming
  (1030 - 2330, n=162, last 2 years)
1684 Points +13%
Alienware x16 R2 P120F
NVIDIA GeForce RTX 4080 Laptop GPU, Ultra 9 185H, WDC PC SN810 1TB
1621 Points +9%
Asus ROG Zephyrus G16 GU605MY
NVIDIA GeForce RTX 4090 Laptop GPU, Ultra 9 185H, Samsung PM9A1a MZVL22T0HDLB
1490 Points
Average Intel Core Ultra 9 185H, NVIDIA GeForce RTX 4090 Laptop GPU
  ()
1490 Points 0%
Asus ROG Zephyrus G16 2024 GU605M
NVIDIA GeForce RTX 4070 Laptop GPU, Ultra 7 155H, WD PC SN560 SDDPNQE-1T00
1424 Points -4%
WebXPRT 3 / Overall
SCHENKER XMG Neo 16 (Early 24)
NVIDIA GeForce RTX 4090 Laptop GPU, i9-14900HX, Samsung 990 Pro 1 TB
336 Points +20%
Razer Blade 16 2024, RTX 4090
NVIDIA GeForce RTX 4090 Laptop GPU, i9-14900HX, Samsung PM9A1 MZVL22T0HBLB
330 Points +17%
Average of class Gaming
  (215 - 480, n=183, last 2 years)
301 Points +7%
Asus ROG Zephyrus G16 2024 GU605M
NVIDIA GeForce RTX 4070 Laptop GPU, Ultra 7 155H, WD PC SN560 SDDPNQE-1T00
283 Points +1%
Asus ROG Zephyrus G16 GU605MY
NVIDIA GeForce RTX 4090 Laptop GPU, Ultra 9 185H, Samsung PM9A1a MZVL22T0HDLB
281 Points
Average Intel Core Ultra 9 185H, NVIDIA GeForce RTX 4090 Laptop GPU
  ()
281 Points 0%
Lenovo Legion 9 16IRX9, RTX 4090
NVIDIA GeForce RTX 4090 Laptop GPU, i9-14900HX, Micron 3400 2TB MTFDKBA2T0TFH
279 Points -1%
Alienware x16 R2 P120F
NVIDIA GeForce RTX 4080 Laptop GPU, Ultra 9 185H, WDC PC SN810 1TB
237 Points -16%
WebXPRT 4 / Overall
SCHENKER XMG Neo 16 (Early 24)
NVIDIA GeForce RTX 4090 Laptop GPU, i9-14900HX, Samsung 990 Pro 1 TB
306 Points +14%
Asus ROG Zephyrus G16 GU605MY
NVIDIA GeForce RTX 4090 Laptop GPU, Ultra 9 185H, Samsung PM9A1a MZVL22T0HDLB
269 Points
Average Intel Core Ultra 9 185H, NVIDIA GeForce RTX 4090 Laptop GPU
  ()
269 Points 0%
Average of class Gaming
  (157.9 - 328, n=167, last 2 years)
263 Points -2%
Asus ROG Zephyrus G16 2024 GU605M
NVIDIA GeForce RTX 4070 Laptop GPU, Ultra 7 155H, WD PC SN560 SDDPNQE-1T00
256 Points -5%
Lenovo Legion 9 16IRX9, RTX 4090
NVIDIA GeForce RTX 4090 Laptop GPU, i9-14900HX, Micron 3400 2TB MTFDKBA2T0TFH
246 Points -9%
Alienware x16 R2 P120F
NVIDIA GeForce RTX 4080 Laptop GPU, Ultra 9 185H, WDC PC SN810 1TB
237 Points -12%
Mozilla Kraken 1.1 / Total
Alienware x16 R2 P120F
NVIDIA GeForce RTX 4080 Laptop GPU, Ultra 9 185H, WDC PC SN810 1TB
594 ms * -14%
Asus ROG Zephyrus G16 2024 GU605M
NVIDIA GeForce RTX 4070 Laptop GPU, Ultra 7 155H, WD PC SN560 SDDPNQE-1T00
548 ms * -5%
Lenovo Legion 9 16IRX9, RTX 4090
NVIDIA GeForce RTX 4090 Laptop GPU, i9-14900HX, Micron 3400 2TB MTFDKBA2T0TFH
535 ms * -2%
Asus ROG Zephyrus G16 GU605MY
NVIDIA GeForce RTX 4090 Laptop GPU, Ultra 9 185H, Samsung PM9A1a MZVL22T0HDLB
522 ms *
Average Intel Core Ultra 9 185H, NVIDIA GeForce RTX 4090 Laptop GPU
  ()
522 ms * -0%
Average of class Gaming
  (421 - 737, n=195, last 2 years)
513 ms * +2%
Razer Blade 16 2024, RTX 4090
NVIDIA GeForce RTX 4090 Laptop GPU, i9-14900HX, Samsung PM9A1 MZVL22T0HBLB
450 ms * +14%
SCHENKER XMG Neo 16 (Early 24)
NVIDIA GeForce RTX 4090 Laptop GPU, i9-14900HX, Samsung 990 Pro 1 TB
428 ms * +18%

* ... im mniej tym lepiej

PCMark 10 Score
7993 pkt.
Pomoc
AIDA64 / Memory Copy
Asus ROG Zephyrus G16 GU605MY
Intel Core Ultra 9 185H, NVIDIA GeForce RTX 4090 Laptop GPU
93766 MB/s
Alienware x16 R2 P120F
Intel Core Ultra 9 185H, NVIDIA GeForce RTX 4080 Laptop GPU
89701 MB/s -4%
Asus ROG Zephyrus G16 2024 GU605M
Intel Core Ultra 7 155H, NVIDIA GeForce RTX 4070 Laptop GPU
89414 MB/s -5%
Average Intel Core Ultra 9 185H
  (71360 - 95718, n=14)
86274 MB/s -8%
Lenovo Legion 9 16IRX9, RTX 4090
Intel Core i9-14900HX, NVIDIA GeForce RTX 4090 Laptop GPU
81940 MB/s -13%
SCHENKER XMG Neo 16 (Early 24)
Intel Core i9-14900HX, NVIDIA GeForce RTX 4090 Laptop GPU
78897 MB/s -16%
Razer Blade 16 2024, RTX 4090
Intel Core i9-14900HX, NVIDIA GeForce RTX 4090 Laptop GPU
78799 MB/s -16%
Average of class Gaming
  (21842 - 94222, n=203, last 2 years)
63236 MB/s -33%
AIDA64 / Memory Read
SCHENKER XMG Neo 16 (Early 24)
Intel Core i9-14900HX, NVIDIA GeForce RTX 4090 Laptop GPU
86939 MB/s +1%
Asus ROG Zephyrus G16 2024 GU605M
Intel Core Ultra 7 155H, NVIDIA GeForce RTX 4070 Laptop GPU
86576 MB/s +1%
Razer Blade 16 2024, RTX 4090
Intel Core i9-14900HX, NVIDIA GeForce RTX 4090 Laptop GPU
86387 MB/s 0%
Asus ROG Zephyrus G16 GU605MY
Intel Core Ultra 9 185H, NVIDIA GeForce RTX 4090 Laptop GPU
86010 MB/s
Alienware x16 R2 P120F
Intel Core Ultra 9 185H, NVIDIA GeForce RTX 4080 Laptop GPU
85092 MB/s -1%
Lenovo Legion 9 16IRX9, RTX 4090
Intel Core i9-14900HX, NVIDIA GeForce RTX 4090 Laptop GPU
84192 MB/s -2%
Average Intel Core Ultra 9 185H
  (64619 - 87768, n=14)
79848 MB/s -7%
Average of class Gaming
  (23681 - 99713, n=203, last 2 years)
66934 MB/s -22%
AIDA64 / Memory Write
Lenovo Legion 9 16IRX9, RTX 4090
Intel Core i9-14900HX, NVIDIA GeForce RTX 4090 Laptop GPU
80589 MB/s +6%
SCHENKER XMG Neo 16 (Early 24)
Intel Core i9-14900HX, NVIDIA GeForce RTX 4090 Laptop GPU
77562 MB/s +2%
Asus ROG Zephyrus G16 GU605MY
Intel Core Ultra 9 185H, NVIDIA GeForce RTX 4090 Laptop GPU
75937 MB/s
Razer Blade 16 2024, RTX 4090
Intel Core i9-14900HX, NVIDIA GeForce RTX 4090 Laptop GPU
75421 MB/s -1%
Asus ROG Zephyrus G16 2024 GU605M
Intel Core Ultra 7 155H, NVIDIA GeForce RTX 4070 Laptop GPU
73337 MB/s -3%
Alienware x16 R2 P120F
Intel Core Ultra 9 185H, NVIDIA GeForce RTX 4080 Laptop GPU
73199 MB/s -4%
Average Intel Core Ultra 9 185H
  (51114 - 93871, n=14)
72187 MB/s -5%
Average of class Gaming
  (22986 - 108954, n=203, last 2 years)
65082 MB/s -14%
AIDA64 / Memory Latency
Average Intel Core Ultra 9 185H
  (129.6 - 259, n=14)
150.7 ns * -9%
Alienware x16 R2 P120F
Intel Core Ultra 9 185H, NVIDIA GeForce RTX 4080 Laptop GPU
142.3 ns * -3%
Asus ROG Zephyrus G16 2024 GU605M
Intel Core Ultra 7 155H, NVIDIA GeForce RTX 4070 Laptop GPU
140 ns * -2%
Asus ROG Zephyrus G16 GU605MY
Intel Core Ultra 9 185H, NVIDIA GeForce RTX 4090 Laptop GPU
137.9 ns *
Lenovo Legion 9 16IRX9, RTX 4090
Intel Core i9-14900HX, NVIDIA GeForce RTX 4090 Laptop GPU
96.2 ns * +30%
Average of class Gaming
  (59.5 - 259, n=202, last 2 years)
93.3 ns * +32%
Razer Blade 16 2024, RTX 4090
Intel Core i9-14900HX, NVIDIA GeForce RTX 4090 Laptop GPU
83.4 ns * +40%
SCHENKER XMG Neo 16 (Early 24)
Intel Core i9-14900HX, NVIDIA GeForce RTX 4090 Laptop GPU
76.1 ns * +45%

* ... im mniej tym lepiej

Opóźnienia DPC

W naszym standardowym teście opóźnień (surfowanie po Internecie, odtwarzanie YouTube 4K, obciążenie procesora), z obecnym BIOS-em, recenzowane urządzenie wykazywało ograniczenia, jeśli chodzi o korzystanie z aplikacji audio w czasie rzeczywistym. Jednak tak było już w przypadku RTX 4070.

LatencyMon - Przegląd
LatencyMon - Sterowniki
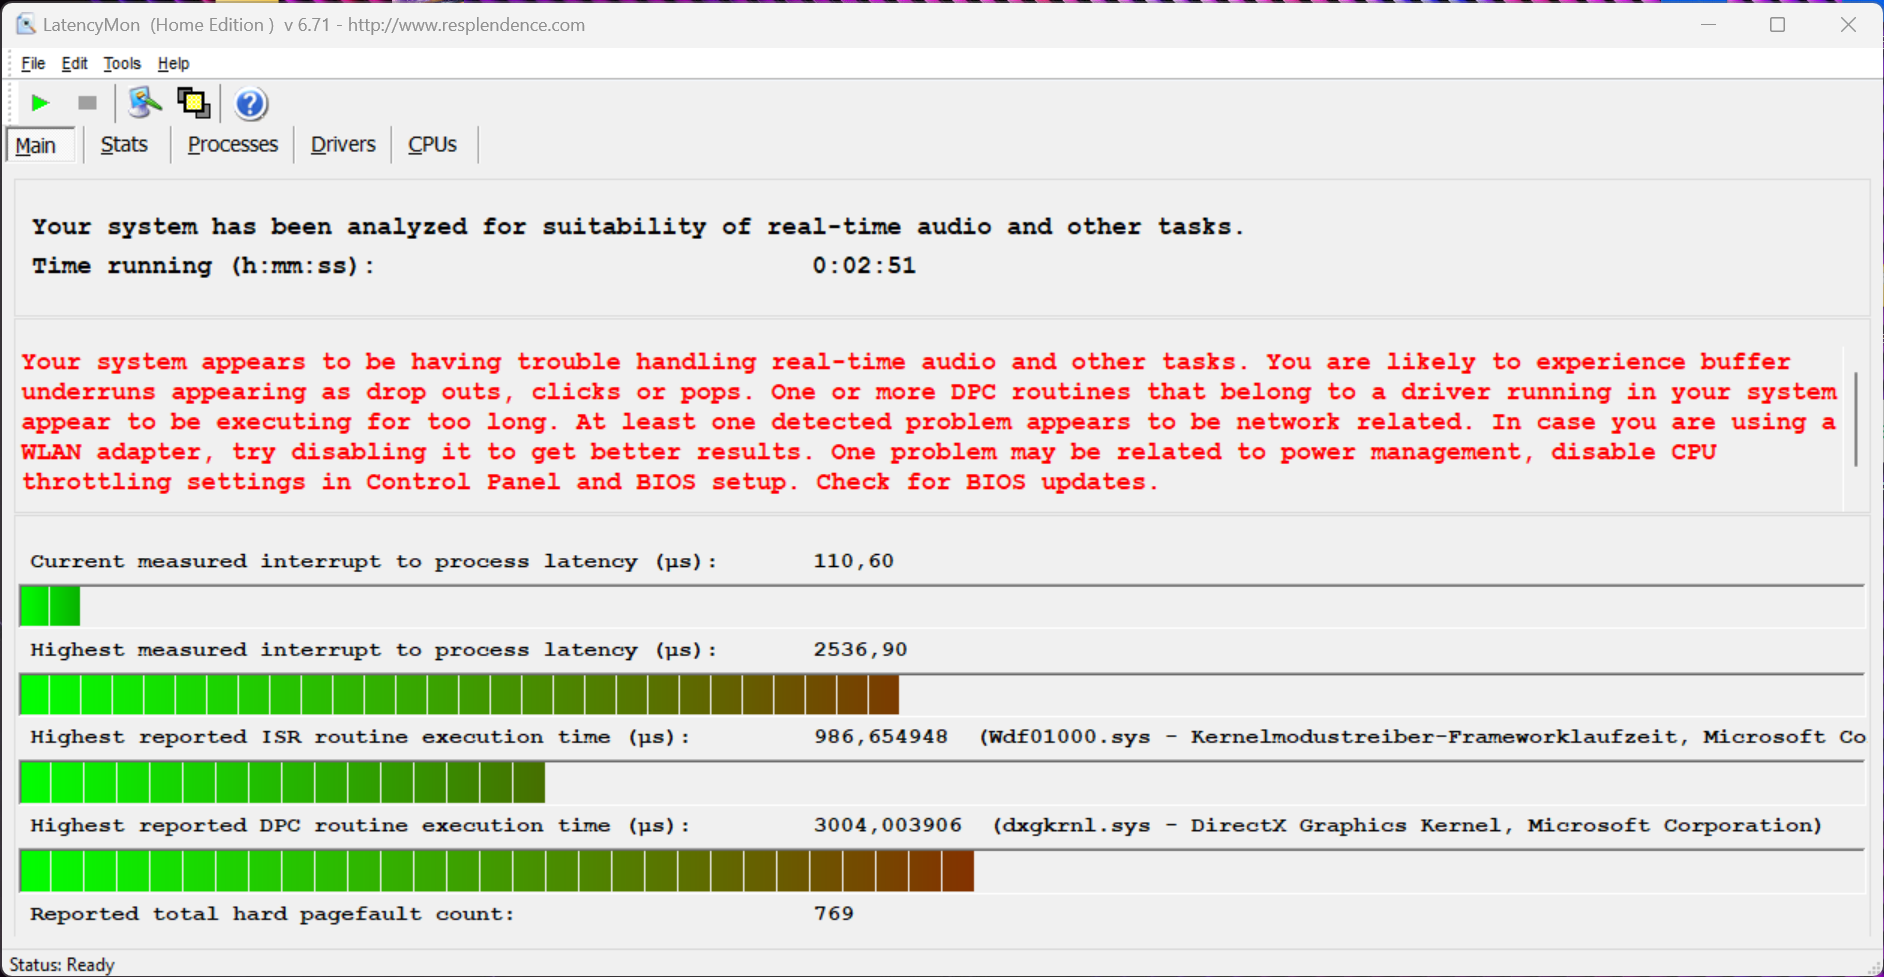
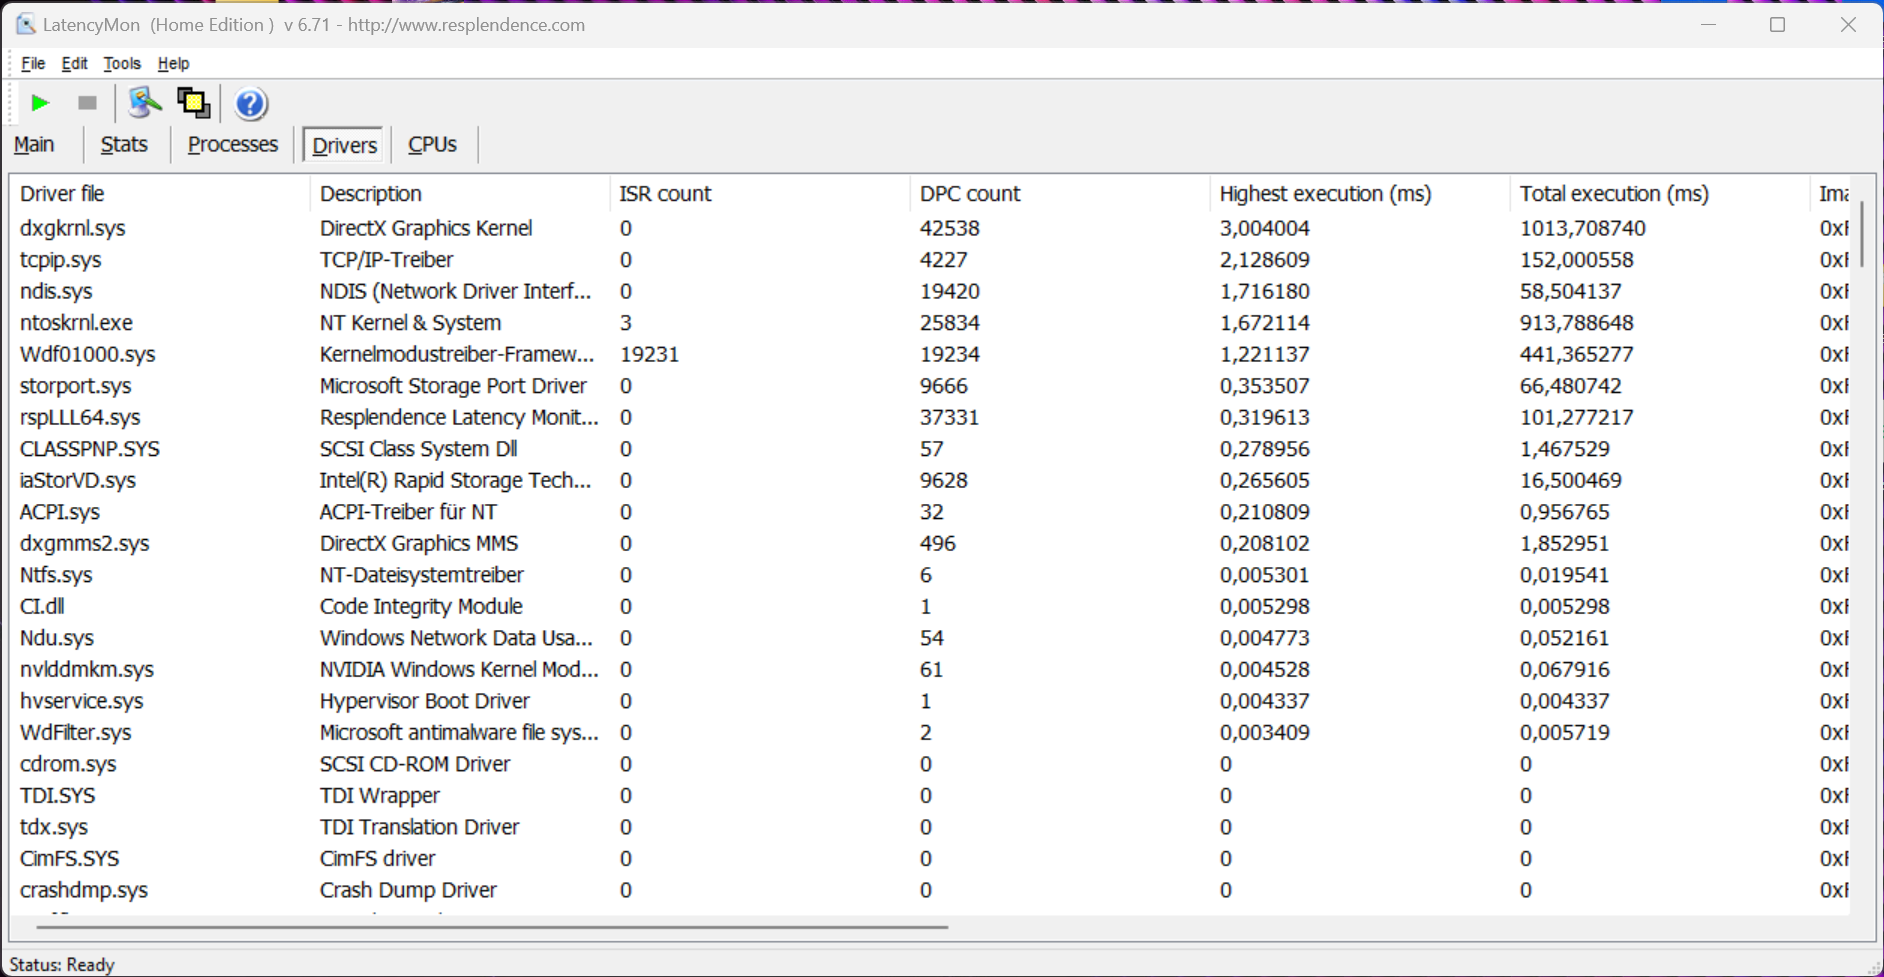
DPC Latencies / LatencyMon - interrupt to process latency (max), Web, Youtube, Prime95
Alienware x16 R2 P120F
NVIDIA GeForce RTX 4080 Laptop GPU, Ultra 9 185H, WDC PC SN810 1TB
16146 μs * -536%
Asus ROG Zephyrus G16 GU605MY
NVIDIA GeForce RTX 4090 Laptop GPU, Ultra 9 185H, Samsung PM9A1a MZVL22T0HDLB
2536.9 μs *
Asus ROG Zephyrus G16 2024 GU605M
NVIDIA GeForce RTX 4070 Laptop GPU, Ultra 7 155H, WD PC SN560 SDDPNQE-1T00
2484.4 μs * +2%
SCHENKER XMG Neo 16 (Early 24)
NVIDIA GeForce RTX 4090 Laptop GPU, i9-14900HX, Samsung 990 Pro 1 TB
2478.6 μs * +2%
Lenovo Legion 9 16IRX9, RTX 4090
NVIDIA GeForce RTX 4090 Laptop GPU, i9-14900HX, Micron 3400 2TB MTFDKBA2T0TFH
2448.1 μs * +4%
Razer Blade 16 2024, RTX 4090
NVIDIA GeForce RTX 4090 Laptop GPU, i9-14900HX, Samsung PM9A1 MZVL22T0HBLB
1389.7 μs * +45%

* ... im mniej tym lepiej

Pamięć masowa

Model RTX 4090 oferuje również dwa gniazda M.2 2280.

Zephyrus G16 oferuje dwa szybkie gniazda PCIe 4.0 dla dysków SSD M.2 2280, co oznacza, że pojemność pamięci masowej można szybko i niedrogo zwiększyć. Nasze recenzowane urządzenie zostało wyposażone w dysk Samsung PM9A1a o pojemności 2 TB, choć po pierwszej instalacji użytkownik ma do dyspozycji 1,76 TB. W testach syntetycznych dysk SSD nie do końca spełnił nasze oczekiwania, ale nadal mamy do czynienia z bardzo szybkim dyskiem, a prędkości transferu pozostają idealnie spójne nawet przy długotrwałym obciążeniu. Dodatkowe testy porównawcze SSD można znaleźć tutaj.

Samsung PM9A1a MZVL22T0HDLB
CDM 5/6 Read Seq Q32T1: 7104 MB/s
CDM 5/6 Write Seq Q32T1: 5141 MB/s
CDM 5/6 Read 4K Q32T1: 397 MB/s
CDM 5/6 Write 4K Q32T1: 415 MB/s
CDM 5/6 Read 4K: 70.1 MB/s
CDM 5/6 Write 4K: 130.1 MB/s
CDM 6 Write 4K Q8T8: 364 MB/s
CDM 6 Read 4K Q8T8: 1030 MB/s
Drive Performance Rating - Percent
SCHENKER XMG Neo 16 (Early 24)
Samsung 990 Pro 1 TB
91.7 pt
Alienware x16 R2 P120F
WDC PC SN810 1TB
79.9 pt
Razer Blade 16 2024, RTX 4090
Samsung PM9A1 MZVL22T0HBLB
76 pt
Average Samsung PM9A1a MZVL22T0HDLB
 
75.1 pt
Lenovo Legion 9 16IRX9, RTX 4090
Micron 3400 2TB MTFDKBA2T0TFH
70.5 pt
Average of class Gaming
 
69.7 pt
Asus ROG Zephyrus G16 GU605MY
Samsung PM9A1a MZVL22T0HDLB
65.4 pt
Asus ROG Zephyrus G16 2024 GU605M
WD PC SN560 SDDPNQE-1T00
47.4 pt
DiskSpd
seq read
Alienware x16 R2 P120F
WDC PC SN810 1TB
4224 (3741.6min - 4224.02max) MB/s +19%
Razer Blade 16 2024, RTX 4090
Samsung PM9A1 MZVL22T0HBLB
3795 (3693.04min - 3794.8max) MB/s +7%
Average Samsung PM9A1a MZVL22T0HDLB
  (3541 - 3908, n=2)
3725 MB/s +5%
Asus ROG Zephyrus G16 GU605MY
Samsung PM9A1a MZVL22T0HDLB
3541 (3501.11min - 3540.88max) MB/s
Average of class Gaming
  (1319 - 7045, n=184, last 2 years)
3494 MB/s -1%
Lenovo Legion 9 16IRX9, RTX 4090
Micron 3400 2TB MTFDKBA2T0TFH
3347 (3203.49min - 3347.47max) MB/s -5%
Asus ROG Zephyrus G16 2024 GU605M
WD PC SN560 SDDPNQE-1T00
3202 (3129.61min - 3201.93max) MB/s -10%
SCHENKER XMG Neo 16 (Early 24)
Samsung 990 Pro 1 TB
3015 (2943.98min - 3014.55max) MB/s -15%
seq write
Alienware x16 R2 P120F
WDC PC SN810 1TB
4899 (4625.25min - 4898.53max) MB/s +55%
SCHENKER XMG Neo 16 (Early 24)
Samsung 990 Pro 1 TB
4826 (4760.33min - 4825.54max) MB/s +53%
Razer Blade 16 2024, RTX 4090
Samsung PM9A1 MZVL22T0HBLB
3794 (3745.51min - 3793.5max) MB/s +20%
Average of class Gaming
  (535 - 9307, n=184, last 2 years)
3776 MB/s +19%
Lenovo Legion 9 16IRX9, RTX 4090
Micron 3400 2TB MTFDKBA2T0TFH
3750 (3377.21min - 3749.92max) MB/s +19%
Average Samsung PM9A1a MZVL22T0HDLB
  (3160 - 4335, n=2)
3748 MB/s +19%
Asus ROG Zephyrus G16 GU605MY
Samsung PM9A1a MZVL22T0HDLB
3160 (3033.95min - 3160.41max) MB/s
Asus ROG Zephyrus G16 2024 GU605M
WD PC SN560 SDDPNQE-1T00
2526 (2498.97min - 2525.81max) MB/s -20%
seq q8 t1 read
SCHENKER XMG Neo 16 (Early 24)
Samsung 990 Pro 1 TB
7140 (5903.9min - 7139.54max) MB/s 0%
Asus ROG Zephyrus G16 GU605MY
Samsung PM9A1a MZVL22T0HDLB
7106 (6065.83min - 7105.62max) MB/s
Average Samsung PM9A1a MZVL22T0HDLB
  (7084 - 7106, n=2)
7095 MB/s 0%
Alienware x16 R2 P120F
WDC PC SN810 1TB
6823 (5715.47min - 6822.87max) MB/s -4%
Razer Blade 16 2024, RTX 4090
Samsung PM9A1 MZVL22T0HBLB
6673 (5801.28min - 6672.72max) MB/s -6%
Lenovo Legion 9 16IRX9, RTX 4090
Micron 3400 2TB MTFDKBA2T0TFH
6523 (5649.96min - 6522.56max) MB/s -8%
Average of class Gaming
  (2594 - 16089, n=184, last 2 years)
6319 MB/s -11%
Asus ROG Zephyrus G16 2024 GU605M
WD PC SN560 SDDPNQE-1T00
5008 (4421.01min - 5007.74max) MB/s -30%
seq q8 t1 write
SCHENKER XMG Neo 16 (Early 24)
Samsung 990 Pro 1 TB
6860 (6824.33min - 6859.91max) MB/s +31%
Average Samsung PM9A1a MZVL22T0HDLB
  (5248 - 5255, n=2)
5252 MB/s 0%
Asus ROG Zephyrus G16 GU605MY
Samsung PM9A1a MZVL22T0HDLB
5248 (5141.58min - 5248.1max) MB/s
Alienware x16 R2 P120F
WDC PC SN810 1TB
5208 (5161.3min - 5208.07max) MB/s -1%
Lenovo Legion 9 16IRX9, RTX 4090
Micron 3400 2TB MTFDKBA2T0TFH
5092 (4641.78min - 5091.77max) MB/s -3%
Razer Blade 16 2024, RTX 4090
Samsung PM9A1 MZVL22T0HBLB
4936 (4909.47min - 4936.28max) MB/s -6%
Average of class Gaming
  (539 - 14571, n=184, last 2 years)
4786 MB/s -9%
Asus ROG Zephyrus G16 2024 GU605M
WD PC SN560 SDDPNQE-1T00
3230 (3169.22min - 3230.03max) MB/s -38%
4k q1 t1 read
Alienware x16 R2 P120F
WDC PC SN810 1TB
79.3 (64.25min - 79.25max) MB/s +13%
Average Samsung PM9A1a MZVL22T0HDLB
  (69.9 - 80.7, n=2)
75.3 MB/s +8%
Razer Blade 16 2024, RTX 4090
Samsung PM9A1 MZVL22T0HBLB
71.4 (66.19min - 71.35max) MB/s +2%
Asus ROG Zephyrus G16 GU605MY
Samsung PM9A1a MZVL22T0HDLB
69.9 (69.26min - 69.89max) MB/s
Average of class Gaming
  (30.6 - 95.9, n=184, last 2 years)
66.1 MB/s -5%
SCHENKER XMG Neo 16 (Early 24)
Samsung 990 Pro 1 TB
60.5 (49.54min - 60.46max) MB/s -13%
Lenovo Legion 9 16IRX9, RTX 4090
Micron 3400 2TB MTFDKBA2T0TFH
59.1 (58.3min - 59.06max) MB/s -15%
Asus ROG Zephyrus G16 2024 GU605M
WD PC SN560 SDDPNQE-1T00
52.9 (51.15min - 52.91max) MB/s -24%
4k q1 t1 write
Alienware x16 R2 P120F
WDC PC SN810 1TB
244 (238.59min - 244.13max) MB/s +87%
Average of class Gaming
  (66.6 - 397, n=184, last 2 years)
219 MB/s +68%
Lenovo Legion 9 16IRX9, RTX 4090
Micron 3400 2TB MTFDKBA2T0TFH
209 (203.44min - 208.84max) MB/s +60%
Razer Blade 16 2024, RTX 4090
Samsung PM9A1 MZVL22T0HBLB
205 (202.97min - 204.75max) MB/s +57%
Average Samsung PM9A1a MZVL22T0HDLB
  (130.3 - 230, n=2)
180.2 MB/s +38%
SCHENKER XMG Neo 16 (Early 24)
Samsung 990 Pro 1 TB
174.4 (160.08min - 174.38max) MB/s +34%
Asus ROG Zephyrus G16 GU605MY
Samsung PM9A1a MZVL22T0HDLB
130.3 (127.94min - 130.31max) MB/s
Asus ROG Zephyrus G16 2024 GU605M
WD PC SN560 SDDPNQE-1T00
128.4 (126.56min - 128.36max) MB/s -1%
4k q32 t16 read
SCHENKER XMG Neo 16 (Early 24)
Samsung 990 Pro 1 TB
4920 (4883.21min - 4920.02max) MB/s +724%
Alienware x16 R2 P120F
WDC PC SN810 1TB
4245 (4210.56min - 4245.12max) MB/s +611%
Razer Blade 16 2024, RTX 4090
Samsung PM9A1 MZVL22T0HBLB
3726 (3704.12min - 3725.6max) MB/s +524%
Lenovo Legion 9 16IRX9, RTX 4090
Micron 3400 2TB MTFDKBA2T0TFH
2997 (2834.64min - 2996.72max) MB/s +402%
Average of class Gaming
  (417 - 6172, n=184, last 2 years)
2560 MB/s +329%
Average Samsung PM9A1a MZVL22T0HDLB
  (597 - 3732, n=2)
2165 MB/s +263%
Asus ROG Zephyrus G16 2024 GU605M
WD PC SN560 SDDPNQE-1T00
604 (565.74min - 603.6max) MB/s +1%
Asus ROG Zephyrus G16 GU605MY
Samsung PM9A1a MZVL22T0HDLB
597 (590.16min - 596.69max) MB/s
4k q32 t16 write
SCHENKER XMG Neo 16 (Early 24)
Samsung 990 Pro 1 TB
4522 (4451.05min - 4521.93max) MB/s +1051%
Razer Blade 16 2024, RTX 4090
Samsung PM9A1 MZVL22T0HBLB
3548 (3533.85min - 3548.33max) MB/s +803%
Alienware x16 R2 P120F
WDC PC SN810 1TB
2907 (2737.8min - 2907.05max) MB/s +640%
Lenovo Legion 9 16IRX9, RTX 4090
Micron 3400 2TB MTFDKBA2T0TFH
2673 (2401.6min - 2673.33max) MB/s +580%
Average of class Gaming
  (162.3 - 4869, n=184, last 2 years)
2091 MB/s +432%
Average Samsung PM9A1a MZVL22T0HDLB
  (393 - 2900, n=2)
1647 MB/s +319%
Asus ROG Zephyrus G16 2024 GU605M
WD PC SN560 SDDPNQE-1T00
402 (389.17min - 402.07max) MB/s +2%
Asus ROG Zephyrus G16 GU605MY
Samsung PM9A1a MZVL22T0HDLB
393 (388.68min - 393.4max) MB/s
AS SSD
Score Total
SCHENKER XMG Neo 16 (Early 24)
Samsung 990 Pro 1 TB
9365 Points +67%
Alienware x16 R2 P120F
WDC PC SN810 1TB
8139 Points +45%
Razer Blade 16 2024, RTX 4090
Samsung PM9A1 MZVL22T0HBLB
7040 Points +26%
Average Samsung PM9A1a MZVL22T0HDLB
  (5595 - 8367, n=2)
6981 Points +25%
Lenovo Legion 9 16IRX9, RTX 4090
Micron 3400 2TB MTFDKBA2T0TFH
6847 Points +22%
Average of class Gaming
  (2271 - 13854, n=174, last 2 years)
6727 Points +20%
Asus ROG Zephyrus G16 GU605MY
Samsung PM9A1a MZVL22T0HDLB
5595 Points
Asus ROG Zephyrus G16 2024 GU605M
WD PC SN560 SDDPNQE-1T00
3272 Points -42%
Score Read
SCHENKER XMG Neo 16 (Early 24)
Samsung 990 Pro 1 TB
3496 Points +149%
Alienware x16 R2 P120F
WDC PC SN810 1TB
3204 Points +129%
Razer Blade 16 2024, RTX 4090
Samsung PM9A1 MZVL22T0HBLB
2848 Points +103%
Lenovo Legion 9 16IRX9, RTX 4090
Micron 3400 2TB MTFDKBA2T0TFH
2722 Points +94%
Average of class Gaming
  (760 - 4721, n=174, last 2 years)
2443 Points +74%
Average Samsung PM9A1a MZVL22T0HDLB
  (1402 - 3272, n=2)
2337 Points +67%
Asus ROG Zephyrus G16 GU605MY
Samsung PM9A1a MZVL22T0HDLB
1402 Points
Asus ROG Zephyrus G16 2024 GU605M
WD PC SN560 SDDPNQE-1T00
1020 Points -27%
Score Write
SCHENKER XMG Neo 16 (Early 24)
Samsung 990 Pro 1 TB
4062 Points +13%
Asus ROG Zephyrus G16 GU605MY
Samsung PM9A1a MZVL22T0HDLB
3588 Points
Average Samsung PM9A1a MZVL22T0HDLB
  (3490 - 3588, n=2)
3539 Points -1%
Alienware x16 R2 P120F
WDC PC SN810 1TB
3341 Points -7%
Average of class Gaming
  (515 - 7208, n=174, last 2 years)
3100 Points -14%
Razer Blade 16 2024, RTX 4090
Samsung PM9A1 MZVL22T0HBLB
2766 Points -23%
Lenovo Legion 9 16IRX9, RTX 4090
Micron 3400 2TB MTFDKBA2T0TFH
2686 Points -25%
Asus ROG Zephyrus G16 2024 GU605M
WD PC SN560 SDDPNQE-1T00
1808 Points -50%
Seq Read
SCHENKER XMG Neo 16 (Early 24)
Samsung 990 Pro 1 TB
5684.15 MB/s +6%
Alienware x16 R2 P120F
WDC PC SN810 1TB
5642.41 MB/s +5%
Average Samsung PM9A1a MZVL22T0HDLB
  (5351 - 5637, n=2)
5494 MB/s +3%
Asus ROG Zephyrus G16 GU605MY
Samsung PM9A1a MZVL22T0HDLB
5351 MB/s
Average of class Gaming
  (2260 - 12763, n=174, last 2 years)
4909 MB/s -8%
Razer Blade 16 2024, RTX 4090
Samsung PM9A1 MZVL22T0HBLB
4371 MB/s -18%
Asus ROG Zephyrus G16 2024 GU605M
WD PC SN560 SDDPNQE-1T00
3662 MB/s -32%
Lenovo Legion 9 16IRX9, RTX 4090
Micron 3400 2TB MTFDKBA2T0TFH
2272 MB/s -58%
Seq Write
SCHENKER XMG Neo 16 (Early 24)
Samsung 990 Pro 1 TB
5612.29 MB/s +107%
Alienware x16 R2 P120F
WDC PC SN810 1TB
4787.7 MB/s +76%
Razer Blade 16 2024, RTX 4090
Samsung PM9A1 MZVL22T0HBLB
3791 MB/s +40%
Average of class Gaming
  (495 - 11316, n=174, last 2 years)
3678 MB/s +36%
Average Samsung PM9A1a MZVL22T0HDLB
  (2713 - 4295, n=2)
3504 MB/s +29%
Lenovo Legion 9 16IRX9, RTX 4090
Micron 3400 2TB MTFDKBA2T0TFH
3289 MB/s +21%
Asus ROG Zephyrus G16 GU605MY
Samsung PM9A1a MZVL22T0HDLB
2713 MB/s
Asus ROG Zephyrus G16 2024 GU605M
WD PC SN560 SDDPNQE-1T00
1921 MB/s -29%
4K Read
Average Samsung PM9A1a MZVL22T0HDLB
  (72.9 - 75.6, n=2)
74.2 MB/s +2%
Asus ROG Zephyrus G16 GU605MY
Samsung PM9A1a MZVL22T0HDLB
72.9 MB/s
Alienware x16 R2 P120F
WDC PC SN810 1TB
70.48 MB/s -3%
Average of class Gaming
  (27.8 - 112.1, n=174, last 2 years)
65.2 MB/s -11%
Razer Blade 16 2024, RTX 4090
Samsung PM9A1 MZVL22T0HBLB
61.1 MB/s -16%
SCHENKER XMG Neo 16 (Early 24)
Samsung 990 Pro 1 TB
59.28 MB/s -19%
Lenovo Legion 9 16IRX9, RTX 4090
Micron 3400 2TB MTFDKBA2T0TFH
55.9 MB/s -23%
Asus ROG Zephyrus G16 2024 GU605M
WD PC SN560 SDDPNQE-1T00
42.2 MB/s -42%
4K Write
SCHENKER XMG Neo 16 (Early 24)
Samsung 990 Pro 1 TB
248.48 MB/s +38%
Alienware x16 R2 P120F
WDC PC SN810 1TB
213.62 MB/s +18%
Average of class Gaming
  (108.8 - 512, n=174, last 2 years)
208 MB/s +15%
Average Samsung PM9A1a MZVL22T0HDLB
  (180.5 - 207, n=2)
193.9 MB/s +7%
Lenovo Legion 9 16IRX9, RTX 4090
Micron 3400 2TB MTFDKBA2T0TFH
188.6 MB/s +4%
Asus ROG Zephyrus G16 GU605MY
Samsung PM9A1a MZVL22T0HDLB
180.5 MB/s
Razer Blade 16 2024, RTX 4090
Samsung PM9A1 MZVL22T0HBLB
160.6 MB/s -11%
Asus ROG Zephyrus G16 2024 GU605M
WD PC SN560 SDDPNQE-1T00
157.9 MB/s -13%
4K-64 Read
SCHENKER XMG Neo 16 (Early 24)
Samsung 990 Pro 1 TB
2933.61 MB/s +269%
Alienware x16 R2 P120F
WDC PC SN810 1TB
2569.34 MB/s +224%
Lenovo Legion 9 16IRX9, RTX 4090
Micron 3400 2TB MTFDKBA2T0TFH
2439 MB/s +207%
Razer Blade 16 2024, RTX 4090
Samsung PM9A1 MZVL22T0HBLB
2350 MB/s +196%
Average of class Gaming
  (442 - 3475, n=174, last 2 years)
1881 MB/s +137%
Average Samsung PM9A1a MZVL22T0HDLB
  (794 - 2637, n=2)
1715 MB/s +116%
Asus ROG Zephyrus G16 GU605MY
Samsung PM9A1a MZVL22T0HDLB
794 MB/s
Asus ROG Zephyrus G16 2024 GU605M
WD PC SN560 SDDPNQE-1T00
612 MB/s -23%
4K-64 Write
SCHENKER XMG Neo 16 (Early 24)
Samsung 990 Pro 1 TB
3252.43 MB/s +4%
Asus ROG Zephyrus G16 GU605MY
Samsung PM9A1a MZVL22T0HDLB
3136 MB/s
Average Samsung PM9A1a MZVL22T0HDLB
  (2867 - 3136, n=2)
3001 MB/s -4%
Alienware x16 R2 P120F
WDC PC SN810 1TB
2648.4 MB/s -16%
Average of class Gaming
  (277 - 5909, n=174, last 2 years)
2527 MB/s -19%
Razer Blade 16 2024, RTX 4090
Samsung PM9A1 MZVL22T0HBLB
2226 MB/s -29%
Lenovo Legion 9 16IRX9, RTX 4090
Micron 3400 2TB MTFDKBA2T0TFH
2168 MB/s -31%
Asus ROG Zephyrus G16 2024 GU605M
WD PC SN560 SDDPNQE-1T00
1458 MB/s -54%
Access Time Read
Alienware x16 R2 P120F
WDC PC SN810 1TB
0.09 ms * -275%
Average of class Gaming
  (0.016 - 0.379, n=173, last 2 years)
0.05397 ms * -125%
Average Samsung PM9A1a MZVL22T0HDLB
  (0.024 - 0.046, n=2)
0.035 ms * -46%
Lenovo Legion 9 16IRX9, RTX 4090
Micron 3400 2TB MTFDKBA2T0TFH
0.034 ms * -42%
Razer Blade 16 2024, RTX 4090
Samsung PM9A1 MZVL22T0HBLB
0.033 ms * -38%
Asus ROG Zephyrus G16 2024 GU605M
WD PC SN560 SDDPNQE-1T00
0.032 ms * -33%
Asus ROG Zephyrus G16 GU605MY
Samsung PM9A1a MZVL22T0HDLB
0.024 ms *
SCHENKER XMG Neo 16 (Early 24)
Samsung 990 Pro 1 TB
0.024 ms * -0%
Access Time Write
Alienware x16 R2 P120F
WDC PC SN810 1TB
0.055 ms * -139%
Average of class Gaming
  (0.011 - 1.028, n=174, last 2 years)
0.04855 ms * -111%
Razer Blade 16 2024, RTX 4090
Samsung PM9A1 MZVL22T0HBLB
0.025 ms * -9%
Asus ROG Zephyrus G16 2024 GU605M
WD PC SN560 SDDPNQE-1T00
0.023 ms * -0%
Asus ROG Zephyrus G16 GU605MY
Samsung PM9A1a MZVL22T0HDLB
0.023 ms *
Lenovo Legion 9 16IRX9, RTX 4090
Micron 3400 2TB MTFDKBA2T0TFH
0.023 ms * -0%
Average Samsung PM9A1a MZVL22T0HDLB
  (0.022 - 0.023, n=2)
0.0225 ms * +2%
SCHENKER XMG Neo 16 (Early 24)
Samsung 990 Pro 1 TB
0.016 ms * +30%

* ... im mniej tym lepiej

Continuous Performance Read: DiskSpd Read Loop, Queue Depth 8

036072010801440180021602520288032403600396043204680504054005760612064806840Tooltip
Asus ROG Zephyrus G16 GU605MY; diskspd 2.0.17 f: Ø7094 (6297.96-7117.29)

Karta graficzna - GeForce RTX 4090 laptop

Laptop GPU-Z GeForce RTX 4090

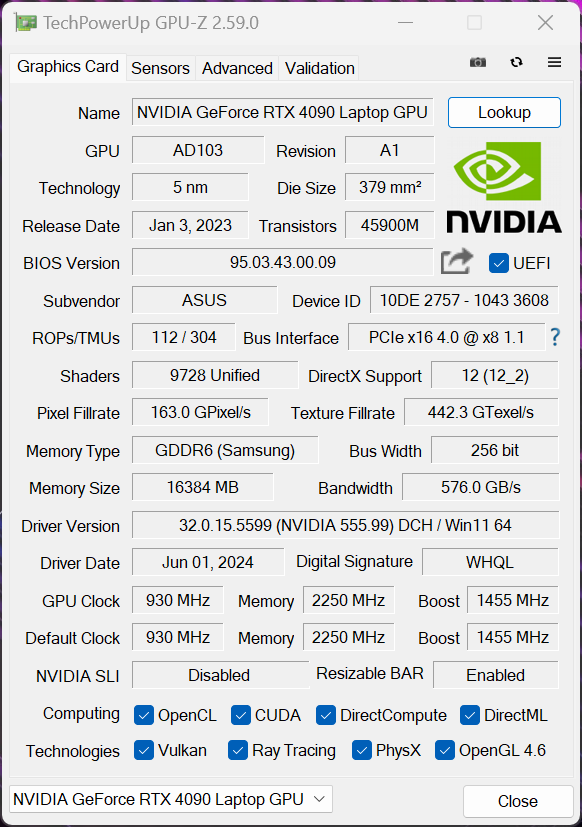
Zephyrus G16 jest dostępny z pełną gamą obecnych modeli laptopów GeForce RTX (4050-4090), jednak cienka konstrukcja daje o sobie znać w szybkich wariantach. W trybie turbo, laptop GeForce RTX 4090 laptop działa tylko z TGP wynoszącym 95 watów + 20 watów dynamicznego doładowania, co oznacza, że jest to sporo poza maksymalną konfiguracją 175 watów (150 TGP + 25 watów dynamicznego doładowania). Potencjalni nabywcy powinni o tym wiedzieć, aby uniknąć późniejszego rozczarowania. W testach porównawczych GPU wyraźnie widzimy wadę w porównaniu do innych modeli laptopów RTX 4090, które są o 15-26% szybsze. Nawet Laptop RTX 4080 znaleziony w Alienware x16 R2 (175 W) jest odrobinę szybszy niż RTX 4090 umieszczony w Zephyrus G16.

Przewaga w porównaniu do Zephyrus G16 z laptopem RTX 4070 wynosi 50%, co oczywiście nadal jest ogromnym wynikiem - zwłaszcza biorąc pod uwagę kompaktową obudowę. Zasadniczo laptop RTX 4070 (a także słabsze wersje) może lepiej wykorzystać swój potencjał w połączeniu z Zephyrus G16. W zależności od przypadku użycia, większa ilość pamięci wideo (16 GB) może być dodatkową zaletą, na przykład podczas edycji filmów.

Pod stałym obciążeniem wydajność GPU pozostaje stabilna, jednak w trybie bateryjnym GPU może pobierać maksymalnie 55 watów i dlatego wydajność GPU znacznie spada (-52%). Dodatkowe testy porównawcze GPU można znaleźć tutaj.

3DMark Performance Rating - Percent
SCHENKER XMG Neo 16 (Early 24)
NVIDIA GeForce RTX 4090 Laptop GPU, Intel Core i9-14900HX
100 pt
Average NVIDIA GeForce RTX 4090 Laptop GPU
 
93.9 pt
Lenovo Legion 9 16IRX9, RTX 4090
NVIDIA GeForce RTX 4090 Laptop GPU, Intel Core i9-14900HX
92.1 pt
Razer Blade 16 2024, RTX 4090
NVIDIA GeForce RTX 4090 Laptop GPU, Intel Core i9-14900HX
90.4 pt
Alienware x16 R2 P120F
NVIDIA GeForce RTX 4080 Laptop GPU, Intel Core Ultra 9 185H
82 pt
Asus ROG Zephyrus G16 GU605MY
NVIDIA GeForce RTX 4090 Laptop GPU, Intel Core Ultra 9 185H
79.1 pt
Average of class Gaming
 
59.6 pt
Asus ROG Zephyrus G16 2024 GU605M
NVIDIA GeForce RTX 4070 Laptop GPU, Intel Core Ultra 7 155H
52.7 pt
3DMark 11 - 1280x720 Performance GPU
SCHENKER XMG Neo 16 (Early 24)
NVIDIA GeForce RTX 4090 Laptop GPU, Intel Core i9-14900HX
69606 Points +29%
Razer Blade 16 2024, RTX 4090
NVIDIA GeForce RTX 4090 Laptop GPU, Intel Core i9-14900HX
65956 Points +22%
Average NVIDIA GeForce RTX 4090 Laptop GPU
  (54073 - 73027, n=41)
65171 Points +21%
Lenovo Legion 9 16IRX9, RTX 4090
NVIDIA GeForce RTX 4090 Laptop GPU, Intel Core i9-14900HX
64341 Points +19%
Alienware x16 R2 P120F
NVIDIA GeForce RTX 4080 Laptop GPU, Intel Core Ultra 9 185H
56772 Points +5%
Asus ROG Zephyrus G16 GU605MY
NVIDIA GeForce RTX 4090 Laptop GPU, Intel Core Ultra 9 185H
54073 Points
Average of class Gaming
  (1029 - 72178, n=202, last 2 years)
42617 Points -21%
Asus ROG Zephyrus G16 2024 GU605M
NVIDIA GeForce RTX 4070 Laptop GPU, Intel Core Ultra 7 155H
37313 Points -31%
3DMark
1920x1080 Fire Strike Graphics
SCHENKER XMG Neo 16 (Early 24)
NVIDIA GeForce RTX 4090 Laptop GPU, Intel Core i9-14900HX
51946 Points +29%
Razer Blade 16 2024, RTX 4090
NVIDIA GeForce RTX 4090 Laptop GPU, Intel Core i9-14900HX
46527 Points +16%
Average NVIDIA GeForce RTX 4090 Laptop GPU
  (40259 - 53059, n=39)
46366 Points +15%
Lenovo Legion 9 16IRX9, RTX 4090
NVIDIA GeForce RTX 4090 Laptop GPU, Intel Core i9-14900HX
43518 Points +8%
Alienware x16 R2 P120F
NVIDIA GeForce RTX 4080 Laptop GPU, Intel Core Ultra 9 185H
42558 Points +6%
Asus ROG Zephyrus G16 GU605MY
NVIDIA GeForce RTX 4090 Laptop GPU, Intel Core Ultra 9 185H
40259 Points
Average of class Gaming
  (781 - 53059, n=212, last 2 years)
30632 Points -24%
Asus ROG Zephyrus G16 2024 GU605M
NVIDIA GeForce RTX 4070 Laptop GPU, Intel Core Ultra 7 155H
26568 Points -34%
2560x1440 Time Spy Graphics
SCHENKER XMG Neo 16 (Early 24)
NVIDIA GeForce RTX 4090 Laptop GPU, Intel Core i9-14900HX
22134 Points +31%
Average NVIDIA GeForce RTX 4090 Laptop GPU
  (16950 - 23292, n=41)
20972 Points +24%
Lenovo Legion 9 16IRX9, RTX 4090
NVIDIA GeForce RTX 4090 Laptop GPU, Intel Core i9-14900HX
20416 Points +20%
Razer Blade 16 2024, RTX 4090
NVIDIA GeForce RTX 4090 Laptop GPU, Intel Core i9-14900HX
19878 Points +17%
Alienware x16 R2 P120F
NVIDIA GeForce RTX 4080 Laptop GPU, Intel Core Ultra 9 185H
18627 Points +10%
Asus ROG Zephyrus G16 GU605MY
NVIDIA GeForce RTX 4090 Laptop GPU, Intel Core Ultra 9 185H
16950 Points
Average of class Gaming
  (224 - 22717, n=208, last 2 years)
12672 Points -25%
Asus ROG Zephyrus G16 2024 GU605M
NVIDIA GeForce RTX 4070 Laptop GPU, Intel Core Ultra 7 155H
10989 Points -35%
Geekbench 6.2 - GPU OpenCL
SCHENKER XMG Neo 16 (Early 24)
NVIDIA GeForce RTX 4090 Laptop GPU, Intel Core i9-14900HX
190820 Points +18%
Lenovo Legion 9 16IRX9, RTX 4090
NVIDIA GeForce RTX 4090 Laptop GPU, Intel Core i9-14900HX
190540 Points +18%
Average NVIDIA GeForce RTX 4090 Laptop GPU
  (159127 - 209521, n=19)
187102 Points +16%
Razer Blade 16 2024, RTX 4090
NVIDIA GeForce RTX 4090 Laptop GPU, Intel Core i9-14900HX
167047 Points +3%
Asus ROG Zephyrus G16 GU605MY
NVIDIA GeForce RTX 4090 Laptop GPU, Intel Core Ultra 9 185H
161798 Points
Alienware x16 R2 P120F
NVIDIA GeForce RTX 4080 Laptop GPU, Intel Core Ultra 9 185H
153327 Points -5%
Average of class Gaming
  (4321 - 207373, n=103, last 2 years)
116138 Points -28%
Asus ROG Zephyrus G16 2024 GU605M
NVIDIA GeForce RTX 4070 Laptop GPU, Intel Core Ultra 7 155H
107953 Points -33%
3DMark 11 Performance
38012 pkt.
3DMark Fire Strike Score
30964 pkt.
3DMark Time Spy Score
15660 pkt.
3DMark Steel Nomad Score
3915 pkt.
Pomoc
Blender / v3.3 Classroom OPTIX/RTX
Asus ROG Zephyrus G16 2024 GU605M
NVIDIA GeForce RTX 4070 Laptop GPU, Intel Core Ultra 7 155H
22 Seconds * -69%
Average of class Gaming
  (9 - 95, n=188, last 2 years)
21.8 Seconds * -68%
Alienware x16 R2 P120F
NVIDIA GeForce RTX 4080 Laptop GPU, Intel Core Ultra 9 185H
15 Seconds * -15%
Asus ROG Zephyrus G16 GU605MY
NVIDIA GeForce RTX 4090 Laptop GPU, Intel Core Ultra 9 185H
13 Seconds *
Lenovo Legion 9 16IRX9, RTX 4090
NVIDIA GeForce RTX 4090 Laptop GPU, Intel Core i9-14900HX
13 Seconds * -0%
SCHENKER XMG Neo 16 (Early 24)
NVIDIA GeForce RTX 4090 Laptop GPU, Intel Core i9-14900HX
13 Seconds * -0%
Average NVIDIA GeForce RTX 4090 Laptop GPU
  (9 - 19, n=38)
12.1 Seconds * +7%
Razer Blade 16 2024, RTX 4090
NVIDIA GeForce RTX 4090 Laptop GPU, Intel Core i9-14900HX
12 Seconds * +8%
Blender / v3.3 Classroom CUDA
Average of class Gaming
  (16 - 175, n=194, last 2 years)
37.8 Seconds * -89%
Asus ROG Zephyrus G16 2024 GU605M
NVIDIA GeForce RTX 4070 Laptop GPU, Intel Core Ultra 7 155H
34 Seconds * -70%
Alienware x16 R2 P120F
NVIDIA GeForce RTX 4080 Laptop GPU, Intel Core Ultra 9 185H
22 Seconds * -10%
Asus ROG Zephyrus G16 GU605MY
NVIDIA GeForce RTX 4090 Laptop GPU, Intel Core Ultra 9 185H
20 Seconds *
Average NVIDIA GeForce RTX 4090 Laptop GPU
  (16 - 24, n=38)
18.3 Seconds * +8%
Razer Blade 16 2024, RTX 4090
NVIDIA GeForce RTX 4090 Laptop GPU, Intel Core i9-14900HX
18 Seconds * +10%
Lenovo Legion 9 16IRX9, RTX 4090
NVIDIA GeForce RTX 4090 Laptop GPU, Intel Core i9-14900HX
18 Seconds * +10%
SCHENKER XMG Neo 16 (Early 24)
NVIDIA GeForce RTX 4090 Laptop GPU, Intel Core i9-14900HX
17 Seconds * +15%
Blender / v3.3 Classroom CPU
Asus ROG Zephyrus G16 2024 GU605M
NVIDIA GeForce RTX 4070 Laptop GPU, Intel Core Ultra 7 155H
330 Seconds * -8%
Asus ROG Zephyrus G16 GU605MY
NVIDIA GeForce RTX 4090 Laptop GPU, Intel Core Ultra 9 185H
305 Seconds *
Alienware x16 R2 P120F
NVIDIA GeForce RTX 4080 Laptop GPU, Intel Core Ultra 9 185H
305 Seconds * -0%
Average of class Gaming
  (138 - 962, n=205, last 2 years)
304 Seconds * -0%
Razer Blade 16 2024, RTX 4090
NVIDIA GeForce RTX 4090 Laptop GPU, Intel Core i9-14900HX
202 Seconds * +34%
Average NVIDIA GeForce RTX 4090 Laptop GPU
  (144 - 305, n=38)
198.6 Seconds * +35%
Lenovo Legion 9 16IRX9, RTX 4090
NVIDIA GeForce RTX 4090 Laptop GPU, Intel Core i9-14900HX
193 Seconds * +37%
SCHENKER XMG Neo 16 (Early 24)
NVIDIA GeForce RTX 4090 Laptop GPU, Intel Core i9-14900HX
167 Seconds * +45%

* ... im mniej tym lepiej

Wydajność w grach

Obraz namalowany w testach GPU jest również kontynuowany w benchmarkach gamingowych, ponieważ laptop RTX 4090 znaleziony w Zephyrus G16 w połączeniu z Core Ultra 185H pozostaje zauważalnie w tyle za konkurencją wyposażoną zarówno w procesory HX, jak i laptopa RTX 4090. The Alienware x16 R2 w połączeniu z Core Ultra 9 i laptopem RTX 4080 również oferuje nieco lepszą wydajność w grach. Po raz kolejny Zephyrus G16 z laptopem RTX 4070 zostaje zdecydowanie pokonany, zwłaszcza w testach QHD.

Podsumowując, Zephyrus G16 z laptopem RTX 4090 i szybkim panelem OLED doskonale nadaje się do gier. W natywnej rozdzielczości QHD można bez wahania płynnie grać we wszystkie aktualne tytuły przy maksymalnych detalach. Jednak nasza pętla Cyberpunk 2077 pokazuje, że wydajność w grach podczas uruchamiania wymagających tytułów nie jest całkowicie stabilna i występują niewielkie spadki wydajności. Więcej testów porównawczych można znaleźć tutaj.

Performance Rating - Percent
SCHENKER XMG Neo 16 (Early 24)
Intel Core i9-14900HX, NVIDIA GeForce RTX 4090 Laptop GPU
99.8 pt
Razer Blade 16 2024, RTX 4090
Intel Core i9-14900HX, NVIDIA GeForce RTX 4090 Laptop GPU
85.8 pt
Lenovo Legion 9 16IRX9, RTX 4090
Intel Core i9-14900HX, NVIDIA GeForce RTX 4090 Laptop GPU
82.2 pt
Alienware x16 R2 P120F -1!
Intel Core Ultra 9 185H, NVIDIA GeForce RTX 4080 Laptop GPU
69.8 pt
Asus ROG Zephyrus G16 GU605MY
Intel Core Ultra 9 185H, NVIDIA GeForce RTX 4090 Laptop GPU
68.7 pt
Average of class Gaming
 
66 pt
Asus ROG Zephyrus G16 2024 GU605M
Intel Core Ultra 7 155H, NVIDIA GeForce RTX 4070 Laptop GPU
53.5 pt
GTA V - 1920x1080 Highest Settings possible AA:4xMSAA + FX AF:16x
SCHENKER XMG Neo 16 (Early 24)
Intel Core i9-14900HX, NVIDIA GeForce RTX 4090 Laptop GPU
159.3 (3.25min, 125P1) fps +49%
Razer Blade 16 2024, RTX 4090
Intel Core i9-14900HX, NVIDIA GeForce RTX 4090 Laptop GPU
138.1 (4.19min, 83.3P1) fps +29%
Lenovo Legion 9 16IRX9, RTX 4090
Intel Core i9-14900HX, NVIDIA GeForce RTX 4090 Laptop GPU
136.2 (0.938min, 111.1P1) fps +27%
Average of class Gaming
  (12.1 - 167.7, n=187, last 2 years)
111 fps +4%
Asus ROG Zephyrus G16 GU605MY
Intel Core Ultra 9 185H, NVIDIA GeForce RTX 4090 Laptop GPU
107.1 (3.03min, 66.7P1) fps
Asus ROG Zephyrus G16 2024 GU605M
Intel Core Ultra 7 155H, NVIDIA GeForce RTX 4070 Laptop GPU
98.8 (3.78min, 58.8P1) fps -8%
Cyberpunk 2077 2.1 Phantom Liberty - 1920x1080 Ultra Preset (FSR off)
SCHENKER XMG Neo 16 (Early 24)
Intel Core i9-14900HX, NVIDIA GeForce RTX 4090 Laptop GPU
131.5 (62.2min) fps +41%
Alienware x16 R2 P120F
Intel Core Ultra 9 185H, NVIDIA GeForce RTX 4080 Laptop GPU
99.7 (13.5min) fps +7%
Razer Blade 16 2024, RTX 4090
Intel Core i9-14900HX, NVIDIA GeForce RTX 4090 Laptop GPU
95.35 (70.51min) fps +2%
Asus ROG Zephyrus G16 GU605MY
Intel Core Ultra 9 185H, NVIDIA GeForce RTX 4090 Laptop GPU
93.1 (64.5min) fps
Average of class Gaming
  (6.76 - 144.7, n=71, last 2 years)
86.3 fps -7%
Lenovo Legion 9 16IRX9, RTX 4090
Intel Core i9-14900HX, NVIDIA GeForce RTX 4090 Laptop GPU
81 (70.6min) fps -13%
Asus ROG Zephyrus G16 2024 GU605M
Intel Core Ultra 7 155H, NVIDIA GeForce RTX 4070 Laptop GPU
69 fps -26%
Final Fantasy XV Benchmark - 1920x1080 High Quality
SCHENKER XMG Neo 16 (Early 24)
Intel Core i9-14900HX, NVIDIA GeForce RTX 4090 Laptop GPU
196.9 fps +43%
Lenovo Legion 9 16IRX9, RTX 4090
Intel Core i9-14900HX, NVIDIA GeForce RTX 4090 Laptop GPU
165.1 fps +20%
Alienware x16 R2 P120F
Intel Core Ultra 9 185H, NVIDIA GeForce RTX 4080 Laptop GPU
139.8 fps +1%
Asus ROG Zephyrus G16 GU605MY
Intel Core Ultra 9 185H, NVIDIA GeForce RTX 4090 Laptop GPU
138 fps
Razer Blade 16 2024, RTX 4090
Intel Core i9-14900HX, NVIDIA GeForce RTX 4090 Laptop GPU
137.5 fps 0%
Average of class Gaming
  (19.2 - 201, n=199, last 2 years)
116.6 fps -16%
Asus ROG Zephyrus G16 2024 GU605M
Intel Core Ultra 7 155H, NVIDIA GeForce RTX 4070 Laptop GPU
100.8 fps -27%
Strange Brigade - 1920x1080 ultra AA:ultra AF:16
SCHENKER XMG Neo 16 (Early 24)
Intel Core i9-14900HX, NVIDIA GeForce RTX 4090 Laptop GPU
403 (101.2min, 295P1) fps +40%
Lenovo Legion 9 16IRX9, RTX 4090
Intel Core i9-14900HX, NVIDIA GeForce RTX 4090 Laptop GPU
369 (5min, 269P1) fps +28%
Razer Blade 16 2024, RTX 4090
Intel Core i9-14900HX, NVIDIA GeForce RTX 4090 Laptop GPU
359.8 (30.2min, 253P1) fps +25%
Alienware x16 R2 P120F
Intel Core Ultra 9 185H, NVIDIA GeForce RTX 4080 Laptop GPU
293 (38.3min, 184.1P1) fps +2%
Asus ROG Zephyrus G16 GU605MY
Intel Core Ultra 9 185H, NVIDIA GeForce RTX 4090 Laptop GPU
288 fps
Average of class Gaming
  (38.9 - 421, n=198, last 2 years)
221 fps -23%
Asus ROG Zephyrus G16 2024 GU605M
Intel Core Ultra 7 155H, NVIDIA GeForce RTX 4070 Laptop GPU
129.3 (30.4min, 84.7P1) fps -55%
Dota 2 Reborn - 1920x1080 ultra (3/3) best looking
SCHENKER XMG Neo 16 (Early 24)
Intel Core i9-14900HX, NVIDIA GeForce RTX 4090 Laptop GPU
194.6 (165.7min) fps +40%
Razer Blade 16 2024, RTX 4090
Intel Core i9-14900HX, NVIDIA GeForce RTX 4090 Laptop GPU
188.1 (155.2min) fps +36%
Lenovo Legion 9 16IRX9, RTX 4090
Intel Core i9-14900HX, NVIDIA GeForce RTX 4090 Laptop GPU
164.5 (136min) fps +19%
Average of class Gaming
  (33.2 - 220, n=207, last 2 years)
146.6 fps +6%
Asus ROG Zephyrus G16 GU605MY
Intel Core Ultra 9 185H, NVIDIA GeForce RTX 4090 Laptop GPU
138.7 (119.5min) fps
Alienware x16 R2 P120F
Intel Core Ultra 9 185H, NVIDIA GeForce RTX 4080 Laptop GPU
133 (114.6min) fps -4%
Asus ROG Zephyrus G16 2024 GU605M
Intel Core Ultra 7 155H, NVIDIA GeForce RTX 4070 Laptop GPU
131.6 (114.5min) fps -5%
X-Plane 11.11 - 1920x1080 high (fps_test=3)
Razer Blade 16 2024, RTX 4090
Intel Core i9-14900HX, NVIDIA GeForce RTX 4090 Laptop GPU
146.2 fps +62%
SCHENKER XMG Neo 16 (Early 24)
Intel Core i9-14900HX, NVIDIA GeForce RTX 4090 Laptop GPU
144.5 fps +61%
Lenovo Legion 9 16IRX9, RTX 4090
Intel Core i9-14900HX, NVIDIA GeForce RTX 4090 Laptop GPU
125.6 fps +40%
Average of class Gaming
  (31.5 - 166.2, n=213, last 2 years)
104.3 fps +16%
Asus ROG Zephyrus G16 GU605MY
Intel Core Ultra 9 185H, NVIDIA GeForce RTX 4090 Laptop GPU
90 fps
Alienware x16 R2 P120F
Intel Core Ultra 9 185H, NVIDIA GeForce RTX 4080 Laptop GPU
89.3 fps -1%
Asus ROG Zephyrus G16 2024 GU605M
Intel Core Ultra 7 155H, NVIDIA GeForce RTX 4070 Laptop GPU
81.2 fps -10%
Cyberpunk 2077 2.1 Phantom Liberty
1920x1080 Ultra Preset (FSR off)
SCHENKER XMG Neo 16 (Early 24)
Intel Core i9-14900HX, NVIDIA GeForce RTX 4090 Laptop GPU
131.5 (62.2min) fps +41%
Average NVIDIA GeForce RTX 4090 Laptop GPU
  (81 - 144.7, n=17)
119.7 fps +29%
Alienware x16 R2 P120F
Intel Core Ultra 9 185H, NVIDIA GeForce RTX 4080 Laptop GPU
99.7 (13.5min) fps +7%
Razer Blade 16 2024, RTX 4090
Intel Core i9-14900HX, NVIDIA GeForce RTX 4090 Laptop GPU
95.35 (70.51min) fps +2%
Asus ROG Zephyrus G16 GU605MY
Intel Core Ultra 9 185H, NVIDIA GeForce RTX 4090 Laptop GPU
93.1 (64.5min) fps
Average of class Gaming
  (6.76 - 144.7, n=71, last 2 years)
86.3 fps -7%
Lenovo Legion 9 16IRX9, RTX 4090
Intel Core i9-14900HX, NVIDIA GeForce RTX 4090 Laptop GPU
81 (70.6min) fps -13%
Asus ROG Zephyrus G16 2024 GU605M
Intel Core Ultra 7 155H, NVIDIA GeForce RTX 4070 Laptop GPU
69 fps -26%
2560x1440 Ultra Preset (FSR off)
SCHENKER XMG Neo 16 (Early 24)
Intel Core i9-14900HX, NVIDIA GeForce RTX 4090 Laptop GPU
93.8 (53.7min) fps +38%
Average NVIDIA GeForce RTX 4090 Laptop GPU
  (68.1 - 103.9, n=17)
89.7 fps +32%
Razer Blade 16 2024, RTX 4090
Intel Core i9-14900HX, NVIDIA GeForce RTX 4090 Laptop GPU
83.39 (67.14min) fps +22%
Lenovo Legion 9 16IRX9, RTX 4090
Intel Core i9-14900HX, NVIDIA GeForce RTX 4090 Laptop GPU
79.2 (70.4min) fps +16%
Alienware x16 R2 P120F
Intel Core Ultra 9 185H, NVIDIA GeForce RTX 4080 Laptop GPU
75.4 (25.4min) fps +11%
Asus ROG Zephyrus G16 GU605MY
Intel Core Ultra 9 185H, NVIDIA GeForce RTX 4090 Laptop GPU
68.1 (55.3min) fps
Average of class Gaming
  (24.8 - 103.9, n=58, last 2 years)
61.8 fps -9%
Asus ROG Zephyrus G16 2024 GU605M
Intel Core Ultra 7 155H, NVIDIA GeForce RTX 4070 Laptop GPU
43.7 fps -36%
F1 23
1920x1080 Ultra High Preset AA:T AF:16x
Lenovo Legion 9 16IRX9, RTX 4090
Intel Core i9-14900HX, NVIDIA GeForce RTX 4090 Laptop GPU
149.2 (10min, 97P1) fps +73%
Average NVIDIA GeForce RTX 4090 Laptop GPU
  (86.2 - 149.2, n=9)
120.4 fps +40%
Razer Blade 16 2024, RTX 4090
Intel Core i9-14900HX, NVIDIA GeForce RTX 4090 Laptop GPU
113.2 (94min, 78P1) fps +31%
Asus ROG Zephyrus G16 GU605MY
Intel Core Ultra 9 185H, NVIDIA GeForce RTX 4090 Laptop GPU
86.2 (59min, 67P1) fps
Average of class Gaming
  (12.9 - 149.2, n=39, last 2 years)
69.8 fps -19%
Asus ROG Zephyrus G16 2024 GU605M
Intel Core Ultra 7 155H, NVIDIA GeForce RTX 4070 Laptop GPU
55.8 (45min, 43P1) fps -35%
2560x1440 Ultra High Preset AA:T AF:16x
Lenovo Legion 9 16IRX9, RTX 4090
Intel Core i9-14900HX, NVIDIA GeForce RTX 4090 Laptop GPU
144.6 (2min, 80P1) fps +149%
Average NVIDIA GeForce RTX 4090 Laptop GPU
  (58 - 144.6, n=9)
83.7 fps +44%
Razer Blade 16 2024, RTX 4090
Intel Core i9-14900HX, NVIDIA GeForce RTX 4090 Laptop GPU
72.4 (58min, 56P1) fps +25%
Asus ROG Zephyrus G16 GU605MY
Intel Core Ultra 9 185H, NVIDIA GeForce RTX 4090 Laptop GPU
58 (36min, 46P1) fps
Average of class Gaming
  (17 - 144.6, n=30, last 2 years)
49.8 fps -14%
Asus ROG Zephyrus G16 2024 GU605M
Intel Core Ultra 7 155H, NVIDIA GeForce RTX 4070 Laptop GPU
36 (22min, 28P1) fps -38%
F1 24
1920x1080 Ultra High Preset AA:T AF:16x
SCHENKER XMG Neo 16 (Early 24)
Intel Core i9-14900HX, NVIDIA GeForce RTX 4090 Laptop GPU
127 (78min, 90P1) fps +44%
Lenovo Legion 9 16IRX9, RTX 4090
Intel Core i9-14900HX, NVIDIA GeForce RTX 4090 Laptop GPU
113.6 (14min, 69P1) fps +29%
Average NVIDIA GeForce RTX 4090 Laptop GPU
  (88 - 127, n=4)
112.2 fps +28%
Asus ROG Zephyrus G16 GU605MY
Intel Core Ultra 9 185H, NVIDIA GeForce RTX 4090 Laptop GPU
88 (55min, 58P1) fps
Average of class Gaming
  (54.1 - 127, n=12, last 2 years)
76.2 fps -13%
2560x1440 Ultra High Preset AA:T AF:16x
SCHENKER XMG Neo 16 (Early 24)
Intel Core i9-14900HX, NVIDIA GeForce RTX 4090 Laptop GPU
84.7 (69min, 68P1) fps +45%
Average NVIDIA GeForce RTX 4090 Laptop GPU
  (58.5 - 84.7, n=4)
73.6 fps +26%
Lenovo Legion 9 16IRX9, RTX 4090
Intel Core i9-14900HX, NVIDIA GeForce RTX 4090 Laptop GPU
72.1 (2min, 56P1) fps +23%
Asus ROG Zephyrus G16 GU605MY
Intel Core Ultra 9 185H, NVIDIA GeForce RTX 4090 Laptop GPU
58.5 (49min, 47P1) fps
Average of class Gaming
  (36.7 - 84.7, n=9, last 2 years)
53.8 fps -8%
Baldur's Gate 3
1920x1080 Ultra Preset
Average NVIDIA GeForce RTX 4090 Laptop GPU
  (118 - 208, n=6)
177.6 fps +51%
Alienware x16 R2 P120F
Intel Core Ultra 9 185H, NVIDIA GeForce RTX 4080 Laptop GPU
159.4 fps +35%
Asus ROG Zephyrus G16 GU605MY
Intel Core Ultra 9 185H, NVIDIA GeForce RTX 4090 Laptop GPU
118 fps
Average of class Gaming
  (34.5 - 208, n=39, last 2 years)
104 fps -12%
2560x1440 Ultra Preset
Average NVIDIA GeForce RTX 4090 Laptop GPU
  (99 - 155.2, n=6)
134.6 fps +36%
Alienware x16 R2 P120F
Intel Core Ultra 9 185H, NVIDIA GeForce RTX 4080 Laptop GPU
124.3 fps +26%
Asus ROG Zephyrus G16 GU605MY
Intel Core Ultra 9 185H, NVIDIA GeForce RTX 4090 Laptop GPU
99 fps
Average of class Gaming
  (44 - 155.2, n=31, last 2 years)
82.2 fps -17%
Horizon Forbidden West
1920x1080 Very High Preset AA:T
SCHENKER XMG Neo 16 (Early 24)
Intel Core i9-14900HX, NVIDIA GeForce RTX 4090 Laptop GPU
125.2 (73.2min, 82.8P0.1, 91.6P1) fps +55%
Average NVIDIA GeForce RTX 4090 Laptop GPU
  (81 - 125.2, n=3)
100 fps +23%
Asus ROG Zephyrus G16 GU605MY
Intel Core Ultra 9 185H, NVIDIA GeForce RTX 4090 Laptop GPU
81 fps
Average of class Gaming
  (30.2 - 125.2, n=9, last 2 years)
72.5 fps -10%
2560x1440 Very High Preset AA:T
SCHENKER XMG Neo 16 (Early 24)
Intel Core i9-14900HX, NVIDIA GeForce RTX 4090 Laptop GPU
98 (65.7min, 67.6P0.1, 76.8P1) fps +48%
Average NVIDIA GeForce RTX 4090 Laptop GPU
  (66 - 98, n=3)
79.7 fps +21%
Asus ROG Zephyrus G16 GU605MY
Intel Core Ultra 9 185H, NVIDIA GeForce RTX 4090 Laptop GPU
66 fps
Average of class Gaming
  (24.1 - 98, n=9, last 2 years)
57.1 fps -13%
Call of Duty Modern Warfare 3 2023
1920x1080 Extreme Preset
Razer Blade 16 2024, RTX 4090
Intel Core i9-14900HX, NVIDIA GeForce RTX 4090 Laptop GPU
179 fps +21%
Average NVIDIA GeForce RTX 4090 Laptop GPU
  (148 - 205, n=7)
175.1 fps +18%
Asus ROG Zephyrus G16 GU605MY
Intel Core Ultra 9 185H, NVIDIA GeForce RTX 4090 Laptop GPU
148 fps
Average of class Gaming
  (27 - 205, n=17, last 2 years)
109.1 fps -26%
Asus ROG Zephyrus G16 2024 GU605M
Intel Core Ultra 7 155H, NVIDIA GeForce RTX 4070 Laptop GPU
94 fps -36%
2560x1440 Extreme Preset
Average NVIDIA GeForce RTX 4090 Laptop GPU
  (113 - 162, n=7)
138.6 fps +23%
Razer Blade 16 2024, RTX 4090
Intel Core i9-14900HX, NVIDIA GeForce RTX 4090 Laptop GPU
138 fps +22%
Asus ROG Zephyrus G16 GU605MY
Intel Core Ultra 9 185H, NVIDIA GeForce RTX 4090 Laptop GPU
113 fps
Average of class Gaming
  (48 - 162, n=14, last 2 years)
93.9 fps -17%
Asus ROG Zephyrus G16 2024 GU605M
Intel Core Ultra 7 155H, NVIDIA GeForce RTX 4070 Laptop GPU
64 fps -43%

Cyberpunk 2077 ultra FPS diagram

05101520253035404550556065707580Tooltip
Asus ROG Zephyrus G16 GU605MY Ultra 9 185H, NVIDIA GeForce RTX 4090 Laptop GPU: Ø70.9 (62.3-84.9)
low med. high ultraQHD2K DLSS4K DLSS4K
GTA V (2015) 172.6 107.1 103.4 139.9
Dota 2 Reborn (2015) 172.2 150.8 150.3 138.7 135.8
Final Fantasy XV Benchmark (2018) 183.5 168.4 138 113.3 68.9
X-Plane 11.11 (2018) 138.3 111.7 90 75.7
Far Cry 5 (2018) 138 128 117 115 80
Strange Brigade (2018) 431 340 314 288 225 120
Star Wars Jedi Survivor (2023) 173 166 154 148 114 59
F1 23 (2023) 215 217 211 86.2 58 50.1 30.2
Baldur's Gate 3 (2023) 144 126 123 118 99 57
Cyberpunk 2077 2.1 Phantom Liberty (2023) 119.8 106.6 109.6 93.1 68.1 32.9
Call of Duty Modern Warfare 3 2023 (2023) 204 189 155 148 113 73
Horizon Forbidden West (2024) 117 110 89 81 66 42.5
F1 24 (2024) 230 232 216 88 58.5 49.8 30.3
Black Myth: Wukong (2024) 67 40 39

Emisje - komora parowa jest często głośniejsza

Emisja hałasu

Głośność wentylatora zależy w dużej mierze od wybranego profilu energetycznego. W trybie bezczynności i przy niskim obciążeniu, Zephyrus G16 pozostaje bardzo cichy, nawet w szybszych profilach. Podczas grania i korzystania zarówno z profilu Quiet, jak i Performance, chłodzenie komory parowej staje się nieco głośniejsze niż w przypadku modelu RTX 4070, a bez słuchawek naprawdę możliwe jest prawidłowe granie tylko przy użyciu profilu Quiet . W trybie turbo osiąga on 52,3 dB(A), co odpowiada maksymalnej głośności wentylatora w wariancie RTX 4070. Jednak konkurencja jest nawet nieco głośniejsza, a jedynym wyjątkiem jest Blade 16 - choć tak naprawdę nie można nazwać 50 dB(A) cichym. Nasze recenzowane urządzenie nie emitowało żadnych innych odgłosów elektronicznych. Według Asusa problem, który napotkaliśmy z trzecim wentylatorem w naszej recenzji wariantu RTX 4070, powinien już zostać naprawiony poprzez aktualizację BIOS-u.

ROG Zephyrus G16 RTX 4070 Laptop
Profil energetyczny 3DMark 06 Cyberpunk 2077 stress test
Cisza 30,9 dB(A) 41,4 dB(A) 41,4 dB(A)
Wydajność 36,1 dB(A) 48,1 dB(A) 48,1 dB(A)
Turbo 49,2 dB(A) 52,3 dB(A) 52,3 dB(A)
ROG Zephyrus G16 RTX 4070 Laptop
Profil energetyczny 3DMark 06 Cyberpunk 2077 stress test
Cisza 30,4 dB(A) 41,5 dB(A) 41,5 dB(A)
Wydajność 34,2 dB(A) 46,4 dB(A) 46,4 dB(A)
Turbo 41,5 dB(A) 52,4 dB(A) 52,4 dB(A)

Hałas

luz
24.6 / 27.8 / 31.9 dB
obciążenie
49.2 / 52.3 dB
  red to green bar
 
 
30 dB
cichy
40 dB(A)
słyszalny
50 dB(A)
irytujący
 
min: dark, med: mid, max: light   Earthworks M23R, Arta (odległość 15 cm)   environment noise: 24.6 dB(A)
dB(A) 0102030405060708090Deep BassMiddle BassHigh BassLower RangeMidsHigher MidsLower HighsMid HighsUpper HighsSuper Highs2044.441.143.540.840.240.62538.538.432.435.430.637.3313434.627.129.128.332.74031.532.528.231.130.6315026.730.62425.724.8296327.62824.225.527.528.68027.228.621.421.824.9271002627.421.323.322.226.612528.22720.521.421.428.116026.929.219.420.920.128.12003331.321.421.719.131.725029.831.821.621.121.732.831530.333.118.719.515.632.140031.833.818.320.314.13350032.335.517.421.21234.663030.934.216.218.61233.480034.437.416.420.311.336.4100037.141.516.921.71139125038.342.417.723.610.940.9160039.342.116.424.2114220004043.915.520.711.142.7250038.643.914.819.811.441.8315035.540.213.616.211.939.4400032.338.113.414.512.236.2500031.837.1141412.535.5630031.738.513.913.712.536.5800026.535.213.413.412.732.61000021.729.913.213.212.927.11250019.427.313.213.512.624.6160001521.812.512.511.718.8SPL4852.327.831.924.651N5.8811.40.67.3median 31.8median 35.2median 16.4median 20.3median 12.5median 33.4Delta4.55.22.62.82.65hearing rangehide median Fan NoiseAsus ROG Zephyrus G16 GU605MY
Asus ROG Zephyrus G16 GU605MY
NVIDIA GeForce RTX 4090 Laptop GPU, Ultra 9 185H, Samsung PM9A1a MZVL22T0HDLB
SCHENKER XMG Neo 16 (Early 24)
NVIDIA GeForce RTX 4090 Laptop GPU, i9-14900HX, Samsung 990 Pro 1 TB
Lenovo Legion 9 16IRX9, RTX 4090
NVIDIA GeForce RTX 4090 Laptop GPU, i9-14900HX, Micron 3400 2TB MTFDKBA2T0TFH
Alienware x16 R2 P120F
NVIDIA GeForce RTX 4080 Laptop GPU, Ultra 9 185H, WDC PC SN810 1TB
Razer Blade 16 2024, RTX 4090
NVIDIA GeForce RTX 4090 Laptop GPU, i9-14900HX, Samsung PM9A1 MZVL22T0HBLB
Asus ROG Zephyrus G16 2024 GU605M
NVIDIA GeForce RTX 4070 Laptop GPU, Ultra 7 155H, WD PC SN560 SDDPNQE-1T00
Noise
-5%
12%
9%
10%
9%
off / environment *
24.6
26
-6%
23
7%
23.4
5%
23
7%
23.9
3%
Idle Minimum *
24.6
28
-14%
23
7%
23.8
3%
23
7%
23.9
3%
Idle Average *
27.8
29
-4%
23
17%
28.5
-3%
23
17%
27.8
-0%
Idle Maximum *
31.9
31
3%
23
28%
28.5
11%
27.66
13%
30.1
6%
Load Average *
49.2
51
-4%
39
21%
28.8
41%
43.76
11%
34.2
30%
Cyberpunk 2077 ultra *
52.3
Load Maximum *
52.3
56
-7%
55.56
-6%
54.2
-4%
50.37
4%
46.4
11%
Witcher 3 ultra *
54
55.32
49.5
46.81
46.4

* ... im mniej tym lepiej

Temperatura

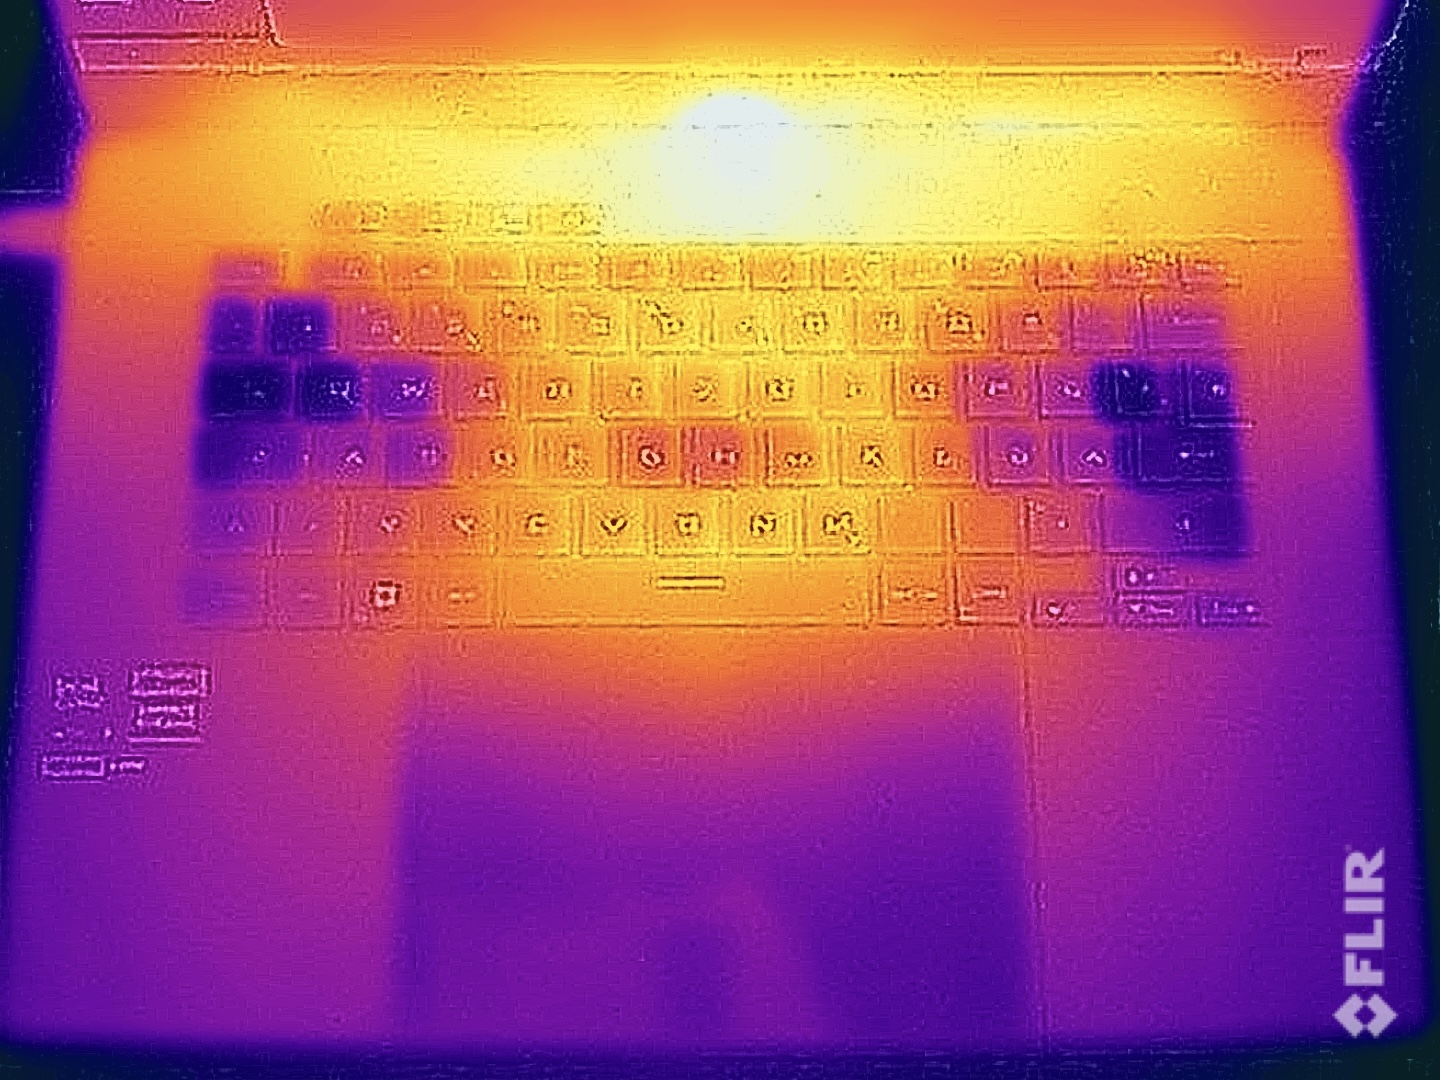
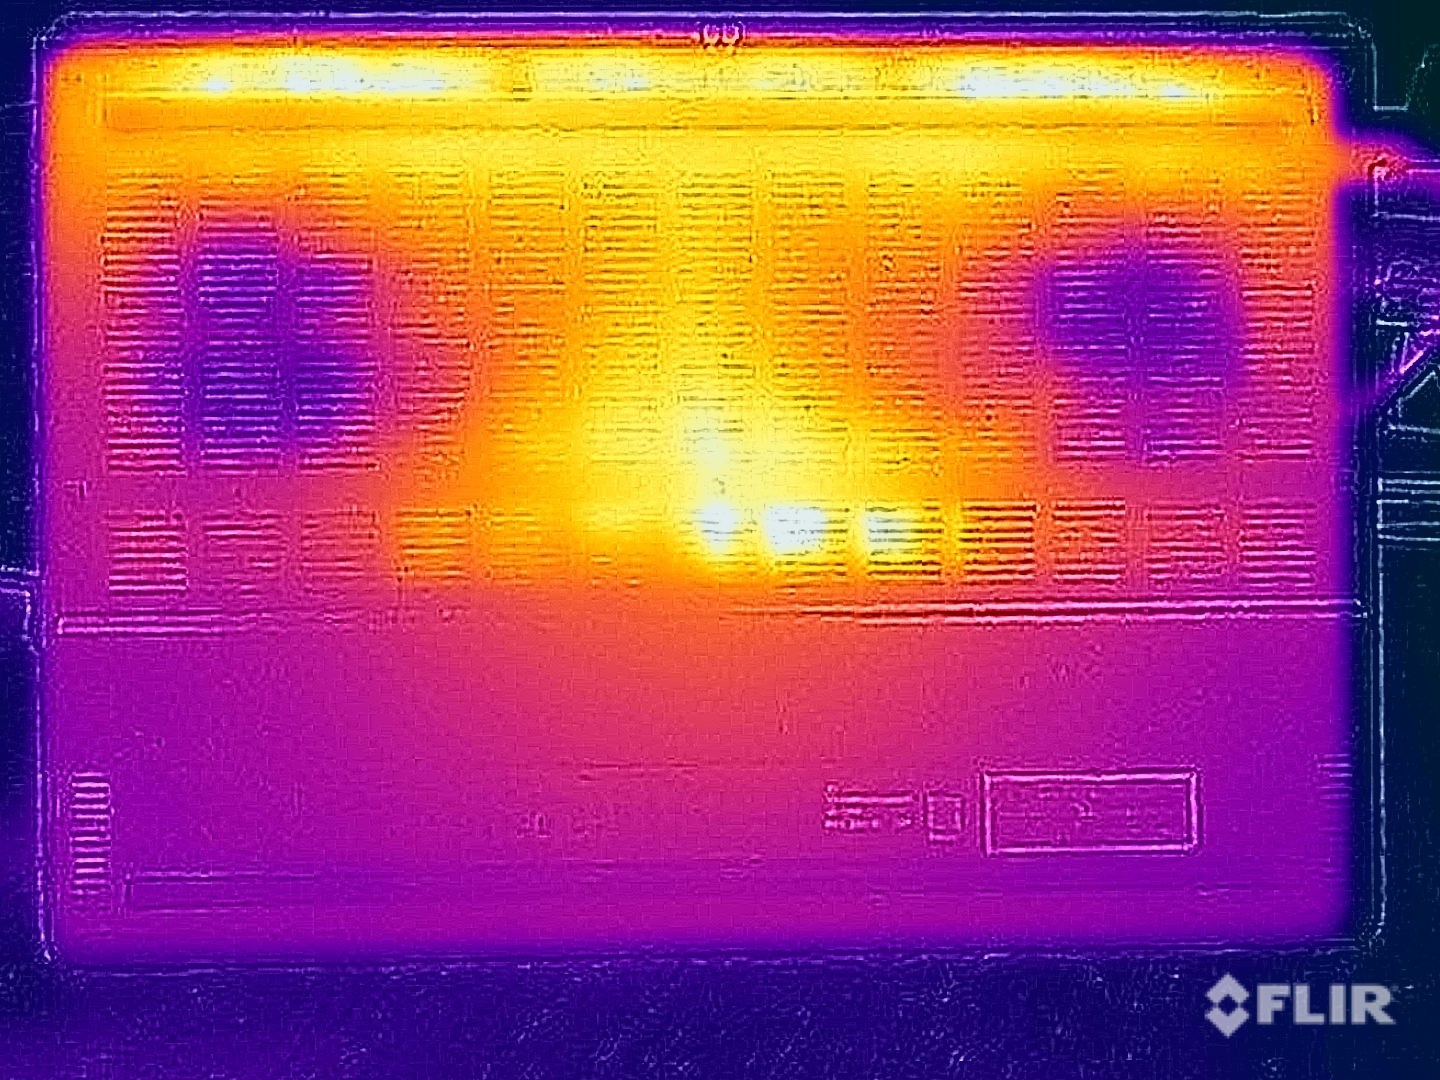
Podczas idealnego użytkowania i wykonywania prostych zadań, metalowe powierzchnie obudowy pozostają bardzo chłodne i można bez wahania umieścić urządzenie na kolanach. Podczas grania w gry i w teście obciążeniowym zmierzyliśmy temperatury jednostki bazowej do 47 °C w środkowej części tylnej części. Nie jest to powód do niepokoju, ale w takich sytuacjach nie należy używać urządzenia na kolanach. W górnej części jednostki bazowej, środkowy obszar nad klawiaturą jest podatny na nagrzewanie się, ale sama klawiatura pozostaje znacznie chłodniejsza z maksymalnymi temperaturami 40 °C na środku i około 36 °C po obu stronach. Oznacza to, że pisanie na klawiaturze przebiega bezproblemowo, a granie jest również nieograniczonym doświadczeniem.

 43.1 °C45.9 °C44.5 °C 
 34.9 °C39.9 °C36.9 °C 
 30.8 °C29.2 °C30.5 °C 
maks. w ogóle: 45.9 °C
średnia: 37.3 °C
47.5 °C46.1 °C47.2 °C
32.8 °C44.5 °C39.5 °C
30.4 °C32.1 °C31.2 °C
maks. w ogóle: 47.5 °C
średnia: 39 °C
zasilacz  45.9 °C | temperatura otoczenia 21.8 °C | Fluke t3000FC (calibrated), Voltcraft IR-900
(±) The average temperature for the upper side under maximal load is 37.3 °C / 99 F, compared to the average of 33.9 °C / 93 F for the devices in the class Gaming.
(-) The maximum temperature on the upper side is 45.9 °C / 115 F, compared to the average of 40.4 °C / 105 F, ranging from 21.2 to 68.8 °C for the class Gaming.
(-) The bottom heats up to a maximum of 47.5 °C / 118 F, compared to the average of 43.2 °C / 110 F
(+) In idle usage, the average temperature for the upper side is 25.3 °C / 78 F, compared to the device average of 33.9 °C / 93 F.
(±) 3: The average temperature for the upper side is 36.7 °C / 98 F, compared to the average of 33.9 °C / 93 F for the class Gaming.
(+) The palmrests and touchpad are cooler than skin temperature with a maximum of 30.8 °C / 87.4 F and are therefore cool to the touch.
(±) The average temperature of the palmrest area of similar devices was 28.9 °C / 84 F (-1.9 °C / -3.4 F).
Temperatury powierzchni w teście obciążeniowym (góra)
Temperatura powierzchni w teście obciążeniowym (na dole)
Asus ROG Zephyrus G16 GU605MY
Intel Core Ultra 9 185H, NVIDIA GeForce RTX 4090 Laptop GPU
SCHENKER XMG Neo 16 (Early 24)
Intel Core i9-14900HX, NVIDIA GeForce RTX 4090 Laptop GPU
Lenovo Legion 9 16IRX9, RTX 4090
Intel Core i9-14900HX, NVIDIA GeForce RTX 4090 Laptop GPU
Alienware x16 R2 P120F
Intel Core Ultra 9 185H, NVIDIA GeForce RTX 4080 Laptop GPU
Razer Blade 16 2024, RTX 4090
Intel Core i9-14900HX, NVIDIA GeForce RTX 4090 Laptop GPU
Asus ROG Zephyrus G16 2024 GU605M
Intel Core Ultra 7 155H, NVIDIA GeForce RTX 4070 Laptop GPU
Heat
-6%
-32%
-23%
-4%
-8%
Maximum Upper Side *
45.9
47
-2%
56
-22%
51
-11%
45
2%
50.3
-10%
Maximum Bottom *
47.5
56
-18%
53
-12%
50.8
-7%
45
5%
48
-1%
Idle Upper Side *
26.1
27
-3%
38
-46%
36.6
-40%
29
-11%
28.8
-10%
Idle Bottom *
26.6
27
-2%
39
-47%
35.2
-32%
30
-13%
29.8
-12%

* ... im mniej tym lepiej

Test warunków skrajnych

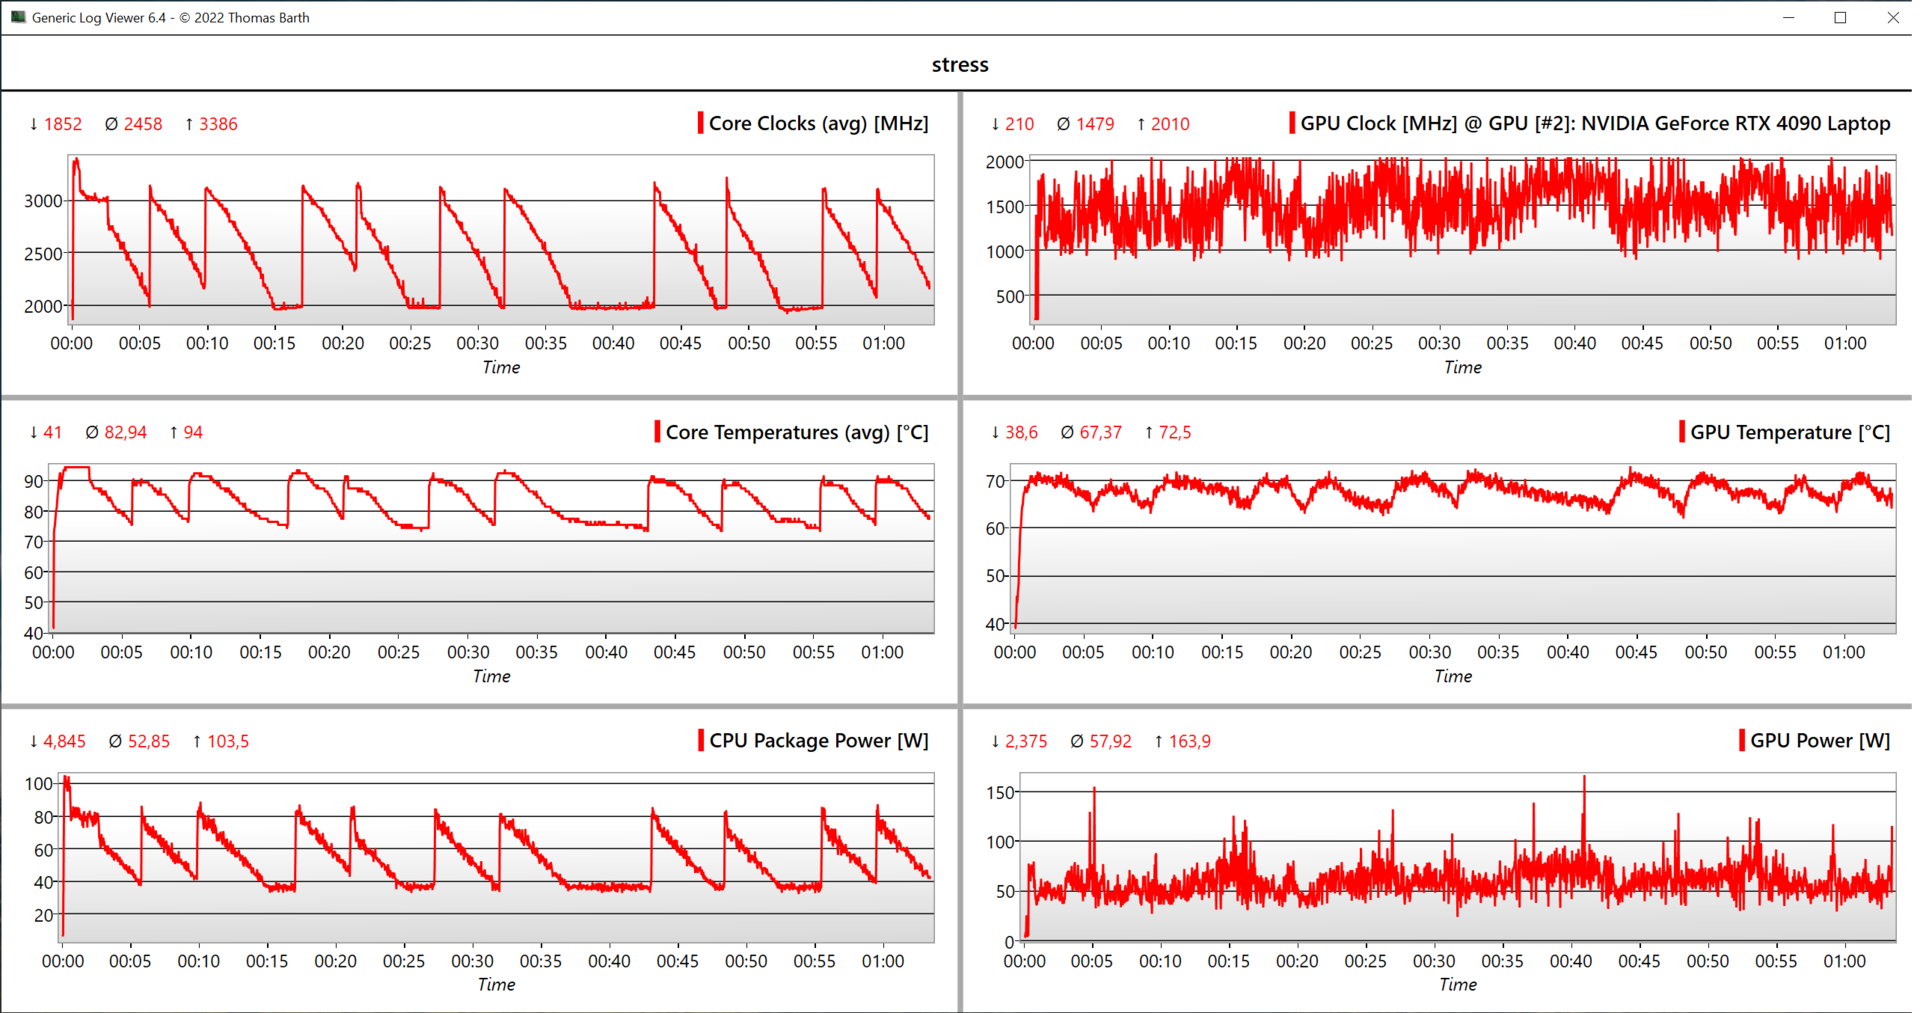
W teście obciążeniowym z połączonym obciążeniem CPU/GPU, topowy model Zephyrus nie był w stanie osiągnąć stałej wydajności. Pobór mocy procesora okresowo wahał się w przedziale 40-80 watów, a po godzinie wynosił średnio 53 waty. Karta graficzna nie podlega tak dużym wahaniom, ale nadal działa "tylko" z mocą około 58 watów. Według Asusa, w tym scenariuszu wartości te powinny wynosić 35 watów dla procesora i 95 watów dla karty graficznej, jednak nie byliśmy w stanie odtworzyć tych wartości.

Dane z testów obciążeniowych CPU/GPU

Głośniki

dB(A) 0102030405060708090Deep BassMiddle BassHigh BassLower RangeMidsHigher MidsLower HighsMid HighsUpper HighsSuper Highs2040.246.32530.637.43128.3364030.637.25024.839.26327.543.98024.951.810022.263.112521.468.116020.165.820019.17125021.772.731515.673.140014.173.95001272.86301274.980011.37610001172.4125010.97316001169.7200011.168250011.469315011.968400012.270.6500012.568.5630012.564.8800012.769.51000012.966.61250012.663.31600011.761.6SPL24.683N0.663.4median 12.5median 69.5Delta2.6338.136.532.836.844.146.527.830.520.533.626.43217.438.721.549.818.447.619.255.422.260.819.163.217.561.71664.515.570.913.475.21275.113.275.612.875.91475.613.373.212.873.113.174.713.273.21377.813.574.913.972.714.465.31360.612.555.525.986.40.871.1median 13.5median 72.727.132.124.832.128.423.428.429.728.229.725.716.525.729.222.129.232.123.832.135.412.335.441.319.741.344.314.944.350.61150.654.616.554.655.414.755.46412.46466.110.966.165.89.265.8667.86670.78.770.768.88.668.867.8967.867.59.867.571.210.171.266.31166.366.811.266.861.111.761.161.511.861.563.21263.264.212.164.264.812.164.864.812.564.865.711.165.779237945.80.445.8median 64.8median 11.2median 64.84.81.94.837.831.737.838.824.638.841.621.341.641.718.741.744.720.444.745.119.245.152.820.152.859.717.359.764.414.164.472.614.472.676.213.876.281.514.581.582.414.182.480.813.680.879.911.779.981.411.481.476.71276.773.51173.577.310.577.37811.17880.511.880.58011.88079.511.379.573.711.473.774.311.774.373.912.173.971137173.212.873.269.311.969.369.611.469.689.923.989.993.70.593.7median 76.7median 11.9median 76.73.81.33.83032.83030.931.430.935.742.935.723.728.123.726.219.726.231.216.431.245.113.845.145.919.845.951.414.551.45913.95964.117.864.168.614.368.667.19.667.167.68.567.672.97.572.977.47.477.4717.77164.88.164.865.88.265.867.58.867.568.89.868.868.710.568.77010.67066.410.966.467.311.267.36411.56464.711.664.767126763.211.863.25510.75581.222.581.254.70.454.7median 67median 10.7median 673.62.53.6hearing rangehide median Pink NoiseAsus ROG Zephyrus G16 GU605MYSCHENKER XMG Neo 16 (Early 24)Lenovo Legion 9 16IRX9, RTX 4090Alienware x16 R2 P120FRazer Blade 16 2024, RTX 4090
Frequency diagram (checkboxes can be checked and unchecked to compare devices)
Asus ROG Zephyrus G16 GU605MY audio analysis

(+) | speakers can play relatively loud (83 dB)
Bass 100 - 315 Hz
(+) | good bass - only 3.3% away from median
(±) | linearity of bass is average (7.6% delta to prev. frequency)
Mids 400 - 2000 Hz
(+) | balanced mids - only 3.4% away from median
(+) | mids are linear (3.1% delta to prev. frequency)
Highs 2 - 16 kHz
(+) | balanced highs - only 1.7% away from median
(+) | highs are linear (4.6% delta to prev. frequency)
Overall 100 - 16.000 Hz
(+) | overall sound is linear (6.5% difference to median)
Compared to same class
» 0% of all tested devices in this class were better, 0% similar, 100% worse
» The best had a delta of 6%, average was 18%, worst was 132%
Compared to all devices tested
» 0% of all tested devices were better, 0% similar, 99% worse
» The best had a delta of 4%, average was 25%, worst was 134%

SCHENKER XMG Neo 16 (Early 24) audio analysis

(+) | speakers can play relatively loud (86 dB)
Bass 100 - 315 Hz
(-) | nearly no bass - on average 16.3% lower than median
(±) | linearity of bass is average (8.6% delta to prev. frequency)
Mids 400 - 2000 Hz
(+) | balanced mids - only 3% away from median
(+) | mids are linear (3.6% delta to prev. frequency)
Highs 2 - 16 kHz
(+) | balanced highs - only 2.5% away from median
(+) | highs are linear (4.9% delta to prev. frequency)
Overall 100 - 16.000 Hz
(+) | overall sound is linear (12.4% difference to median)
Compared to same class
» 14% of all tested devices in this class were better, 4% similar, 83% worse
» The best had a delta of 6%, average was 18%, worst was 132%
Compared to all devices tested
» 8% of all tested devices were better, 2% similar, 89% worse
» The best had a delta of 4%, average was 25%, worst was 134%

Lenovo Legion 9 16IRX9, RTX 4090 audio analysis

(±) | speaker loudness is average but good (78.96 dB)
Bass 100 - 315 Hz
(±) | reduced bass - on average 13.2% lower than median
(±) | linearity of bass is average (8.9% delta to prev. frequency)
Mids 400 - 2000 Hz
(+) | balanced mids - only 3.2% away from median
(+) | mids are linear (3.4% delta to prev. frequency)
Highs 2 - 16 kHz
(+) | balanced highs - only 1.8% away from median
(+) | highs are linear (4% delta to prev. frequency)
Overall 100 - 16.000 Hz
(+) | overall sound is linear (11.3% difference to median)
Compared to same class
» 8% of all tested devices in this class were better, 3% similar, 89% worse
» The best had a delta of 6%, average was 18%, worst was 132%
Compared to all devices tested
» 5% of all tested devices were better, 2% similar, 93% worse
» The best had a delta of 4%, average was 25%, worst was 134%

Alienware x16 R2 P120F audio analysis

(+) | speakers can play relatively loud (89.9 dB)
Bass 100 - 315 Hz
(±) | reduced bass - on average 7.4% lower than median
(±) | linearity of bass is average (7.6% delta to prev. frequency)
Mids 400 - 2000 Hz
(+) | balanced mids - only 2.6% away from median
(+) | mids are linear (3.6% delta to prev. frequency)
Highs 2 - 16 kHz
(+) | balanced highs - only 3.4% away from median
(+) | highs are linear (2.8% delta to prev. frequency)
Overall 100 - 16.000 Hz
(+) | overall sound is linear (8.2% difference to median)
Compared to same class
» 1% of all tested devices in this class were better, 1% similar, 98% worse
» The best had a delta of 6%, average was 18%, worst was 132%
Compared to all devices tested
» 1% of all tested devices were better, 1% similar, 98% worse
» The best had a delta of 4%, average was 25%, worst was 134%

Razer Blade 16 2024, RTX 4090 audio analysis

(±) | speaker loudness is average but good (81.16 dB)
Bass 100 - 315 Hz
(±) | reduced bass - on average 8.2% lower than median
(±) | linearity of bass is average (7.4% delta to prev. frequency)
Mids 400 - 2000 Hz
(+) | balanced mids - only 3.3% away from median
(+) | mids are linear (5.9% delta to prev. frequency)
Highs 2 - 16 kHz
(+) | balanced highs - only 1.6% away from median
(+) | highs are linear (3.1% delta to prev. frequency)
Overall 100 - 16.000 Hz
(+) | overall sound is linear (9.2% difference to median)
Compared to same class
» 3% of all tested devices in this class were better, 1% similar, 96% worse
» The best had a delta of 6%, average was 18%, worst was 132%
Compared to all devices tested
» 2% of all tested devices were better, 1% similar, 97% worse
» The best had a delta of 4%, average was 25%, worst was 134%

Zarządzanie energią - większa wytrzymałość niż u konkurencji

Zużycie energii

W trybie bezczynności wartości zużycia energii reprezentują słabszy wariant ROG Zephyrus G16 i nie jest to również zaskakujące, biorąc pod uwagę identyczne panele OLED. Podczas grania, przy około 170 watach, Zephyrus G16 jest znacznie bardziej wydajny niż konkurencja RTX 4090, która zużywa co najmniej 230 watów podczas grania. W teście obciążeniowym na krótko zaobserwowaliśmy maksymalne zużycie energii na poziomie 232 W, które następnie szybko ustabilizowało się na poziomie około 160 W. Oznacza to, że dostarczony 240-watowy zasilacz jest odpowiednio dobrany.

Pobór mocy
wyłączony / stan wstrzymaniadarklight 0.43 / 1.7 W
luzdarkmidlight 7.8 / 10.9 / 11.6 W
obciążenie midlight 98.7 / 232 W
 color bar
Legenda: min: dark, med: mid, max: light        Metrahit Energy
Currently we use the Metrahit Energy, a professional single phase power quality and energy measurement digital multimeter, for our measurements. Find out more about it here. All of our test methods can be found here.
Asus ROG Zephyrus G16 GU605MY
Ultra 9 185H, NVIDIA GeForce RTX 4090 Laptop GPU, Samsung PM9A1a MZVL22T0HDLB, OLED, 2560x1600, 16"
SCHENKER XMG Neo 16 (Early 24)
i9-14900HX, NVIDIA GeForce RTX 4090 Laptop GPU, Samsung 990 Pro 1 TB, IPS, 2560x1600, 16"
Lenovo Legion 9 16IRX9, RTX 4090
i9-14900HX, NVIDIA GeForce RTX 4090 Laptop GPU, Micron 3400 2TB MTFDKBA2T0TFH, MiniLED, 3200x2000, 16"
Alienware x16 R2 P120F
Ultra 9 185H, NVIDIA GeForce RTX 4080 Laptop GPU, WDC PC SN810 1TB, IPS, 2560x1600, 16"
Razer Blade 16 2024, RTX 4090
i9-14900HX, NVIDIA GeForce RTX 4090 Laptop GPU, Samsung PM9A1 MZVL22T0HBLB, OLED, 2560x1600, 16"
Asus ROG Zephyrus G16 2024 GU605M
Ultra 7 155H, NVIDIA GeForce RTX 4070 Laptop GPU, WD PC SN560 SDDPNQE-1T00, OLED, 2560x1600, 16"
Average NVIDIA GeForce RTX 4090 Laptop GPU
 
Average of class Gaming
 
Power Consumption
-51%
-108%
-57%
-64%
5%
-99%
-58%
Idle Minimum *
7.8
6
23%
20.5
-163%
9.9
-27%
16.9
-117%
8.3
-6%
16.3 ?(6 - 32.3, n=28)
-109%
Idle Average *
10.9
16
-47%
27.7
-154%
14.5
-33%
17.8
-63%
12.5
-15%
23.4 ?(10.9 - 42.6, n=28)
-115%
Idle Maximum *
11.6
28
-141%
32.1
-177%
33.5
-189%
19.6
-69%
12.8
-10%
34.6 ?(11.6 - 57.9, n=28)
-198%
Load Average *
98.7
130
-32%
105
-6%
97.5
1%
128
-30%
71.3
28%
131.1 ?(79 - 201, n=28)
-33%
Cyberpunk 2077 ultra *
157.3
Cyberpunk 2077 ultra external monitor *
165.5
Load Maximum *
232
361
-56%
323
-39%
315.2
-36%
328
-41%
169.1
27%
325 ?(221 - 418, n=28)
-40%
Witcher 3 ultra *
302
246
230
243
127.5

* ... im mniej tym lepiej

Power consumption Cyberpunk / stress test

0153045607590105120135150165180195210225Tooltip
Asus ROG Zephyrus G16 GU605MY; 1280x720 Prime95 28.10 and Furmark 1.25: Ø162.6 (146.8-232)
Asus ROG Zephyrus G16 GU605MY; Idle 150cd/m2: Ø9.99 (4.38-19)
Asus ROG Zephyrus G16 GU605MY; Cyberpunk 2077 FHD ultra no FSR 150cd: Ø157.3 (139.6-164.6)

Power consumption with an external monitor

0102030405060708090100110120130140150160170180190Tooltip
Asus ROG Zephyrus G16 GU605MY; Prime95 V2810 Stress (external Monitor): Ø137.1 (124.9-148.9)
Asus ROG Zephyrus G16 GU605MY; Cinebench R15 Multi (external Monitor): Ø146.2 (145.5-147.1)
Asus ROG Zephyrus G16 GU605MY; Cinebench R23 Single (external Monitor): Ø51 (42.9-59.3)
Asus ROG Zephyrus G16 GU605MY; Cinebench R23 Multi (external Monitor): Ø142.4 (133.8-147.6)
Asus ROG Zephyrus G16 GU605MY; 1280x720 FurMark 1.19 GPU Stress Test (external Monitor): Ø148.5 (143.7-157)
Asus ROG Zephyrus G16 GU605MY; Idle 1min (external Monitor): Ø21.4 (20.1-23.4)
Asus ROG Zephyrus G16 GU605MY; Cyberpunk 2077 FHD ultra no FSR - external Monitor: Ø165.5 (143.1-192.6)

Żywotność baterii

90-watogodzinna bateria jest identyczna w każdej wersji Zephyrusa G16 2024, ale w teście Wi-Fi czas pracy na baterii jest o około 30 minut krótszy niż w przypadku wariantu RTX 4070. W bezpośredniej rywalizacji gamingowej z RTX 4090 laptop nadal wypada lepiej. W teście Wi-Fi przy 150 cd/m² i 60 Hz można uzyskać 6,5 godziny (5,5 godziny przy 120 Hz) i 5 godzin (60 Hz) przy pełnej jasności (4,5 godziny przy 120 Hz). Przy włączonym urządzeniu pełny cykl ładowania trwa 104 minuty; 80% pojemności jest dostępne po 47 minutach.

Wydajność akumulatora
WiFi Websurfing
6h 31min
WiFi Websurfing max. Brightness
5h 03min
Battery Runtime
WiFi Websurfing
Asus ROG Zephyrus G16 2024 GU605M
Ultra 7 155H, NVIDIA GeForce RTX 4070 Laptop GPU, 90 Wh
435 min +11%
Asus ROG Zephyrus G16 GU605MY
Ultra 9 185H, NVIDIA GeForce RTX 4090 Laptop GPU, 90 Wh
391 min
Average of class Gaming
  (85 - 889, n=172, last 2 years)
377 min -4%
SCHENKER XMG Neo 16 (Early 24)
i9-14900HX, NVIDIA GeForce RTX 4090 Laptop GPU, 99.8 Wh
350 min -10%
Razer Blade 16 2024, RTX 4090
i9-14900HX, NVIDIA GeForce RTX 4090 Laptop GPU, 95.2 Wh
329 min -16%
Lenovo Legion 9 16IRX9, RTX 4090
i9-14900HX, NVIDIA GeForce RTX 4090 Laptop GPU, 99.99 Wh
290 min -26%
Alienware x16 R2 P120F
Ultra 9 185H, NVIDIA GeForce RTX 4080 Laptop GPU, 90 Wh
193 min -51%
WiFi Websurfing max. Brightness
Asus ROG Zephyrus G16 2024 GU605M
Ultra 7 155H, NVIDIA GeForce RTX 4070 Laptop GPU, 90 Wh
345 min +14%
Asus ROG Zephyrus G16 GU605MY
Ultra 9 185H, NVIDIA GeForce RTX 4090 Laptop GPU, 90 Wh
303 min
Average of class Gaming
  (85 - 578, n=53, last 2 years)
298 min -2%
Razer Blade 16 2024, RTX 4090
i9-14900HX, NVIDIA GeForce RTX 4090 Laptop GPU, 95.2 Wh
265 min -13%
Lenovo Legion 9 16IRX9, RTX 4090
i9-14900HX, NVIDIA GeForce RTX 4090 Laptop GPU, 99.99 Wh
197 min -35%

Za

+ Kompaktowa obudowa klasy premium
+ Doskonały wyświetlacz OLED 240 Hz, G-Sync
+ Bardzo dobra wydajność w grach
+ Doskonałe głośniki
+ Wspaniałe urządzenia wejściowe
+ 2x gniazda SSD
+ Dobra wydajność systemu

Przeciw

- Laptop z RTX 4090 nie wykorzystuje swojego potencjału
- Przylutowana pamięć RAM, maksymalnie 32 GB
- Ograniczona maksymalna jasność HDR
- Brak Wi-Fi 7

Werdykt - Laptop RTX 4090 nie wykorzystuje swojego potencjału

Recenzja: Asus ROG Zephyrus G16 2024. Urządzenie do recenzji dostarczone przez Asus Germany.

Asus Zephyrus G16 2024 to cienki i stosunkowo lekki laptop do gier, który nadaje się również dla innych grup docelowych, takich jak twórcy treści i użytkownicy multimediów. Wybór laptopa z RTX 4090 oznacza oczywiście, że wydajność graficzna jest głównym celem, ale właśnie w tym tkwi problem. Zasadniczo dobrze, że Asus oferuje najszybsze modele GPU, ale cienka obudowa wymaga kompromisów pomimo ulepszonego chłodzenia komory parowej. Przy maksymalnym poborze mocy wynoszącym 115 W w trybie Turbo , laptop RTX 4090 po prostu nie jest w stanie wykorzystać swojego potencjału, generalnie pozostając 20-25% w tyle za konkurencją (nawet laptop RTX 4080 znajdujący się w Alienware x16 jest nieco szybszy). Pomimo tego, laptop RTX 4090 będzie kosztował pełną cenę wywoławczą. Jest to po prostu kompromis, który trzeba zaakceptować dla bardziej kompaktowej obudowy, ale jest to coś, czego potencjalni nabywcy powinni być świadomi.

Komora parowa zwiększa wagę w porównaniu do konwencjonalnego chłodzenia (modele do laptopa RTX 4070) o około 100 gramów i jest nieco głośniejsza zarówno w profilu energetycznym Quiet, jak i Performance. Obie konfiguracje są od siebie nie do odróżnienia tylko w trybie Turbo. W praktyce oznacza to, że podczas grania należy nosić słuchawki.

Dzięki ROG Zephyrus G16, Asus oferuje bardzo kompaktowy, 16-calowy laptop z GeForce RTX 4090. Jednak dobra mobilność wymaga kompromisów w zakresie wydajności, a inne modele RTX 4090 mają przewagę, jeśli chodzi o wydajność w grach.

Inne zalety i wady Zephyrusa G16 odnoszą się również do konfiguracji high-end, w tym wspaniałych głośników i genialnego panelu OLED 240 Hz. Dużą wadą jest jednak przylutowana pamięć RAM, a w wariancie high-end za 3649 USD nie otrzymają Państwo nawet 64 GB pamięci RAM.

Każdy, kto szuka maksymalnej wydajności graficznej w potencjalnie kompaktowym, 16-calowym laptopie, będzie dobrze obsługiwany przez ROG Zephyrus G16. Nie należy jednak oczekiwać takiej samej wydajności, jaką można znaleźć u cięższych/większych konkurentów. Jeśli chodzi o czystą wydajność w grach, modele takie jak XMG Neo 16 lub Alienware x16 R2 oferują po prostu więcej mocy.

Cena i dostępność

Cena detaliczna laptopa ROG Zephyrus G16 z procesorem Intel Core Ultra 9 185H i kartą graficzną Nvidia GeForce RTX 4090 wynosi 3 649 USD, a urządzenie można obecnie kupić na Amazon.

Uwaga: Niedawno zaktualizowaliśmy nasz system oceny i wyniki wersji 8 nie są porównywalne z wynikami wersji 7. Więcej informacji znajdą Państwo tutaj .

Asus ROG Zephyrus G16 GU605MY - 12/07/2024 v8
Andreas Osthoff

Wykonanie
90 / 98 → 92%
Klawiatura
92%
Myszka
100%
Komunikacja
63 / 80 → 79%
Waga
64 / 10-68 → 93%
Akumulator
69 / 95 → 73%
Wyświetlacz
87%
Wydajność w grach
86%
Wydajność w programach użytkowych
86%
Temperatura
87 / 95 → 91%
Hałas
67 / 90 → 75%
Głośniki
91%
Kamerka
38 / 75 → 51%
Średnio
65%
86%
Gaming - Ważona średnia
CO2 Emissions
No Data
Materials
50%
Packaging
50%
Power Use
73.2%
Repairability
40%
Software Updates
22.3%
Total Sustainability Score: 39.3%

Transparency

The present review sample was made available to the author as a loan by the manufacturer or a shop for the purposes of review. The lender had no influence on this review, nor did the manufacturer receive a copy of this review before publication. There was no obligation to publish this review.

Price comparison

Please share our article, every link counts!
> laptopy testy i recenzje notebooki > Laptopy > Recenzja laptopa Asus ROG Zephyrus G16 - smukły gracz z RTX 4090 i niespełnionym potencjałem
Andreas Osthoff, 2024-07-16 (Update: 2024-07-16)