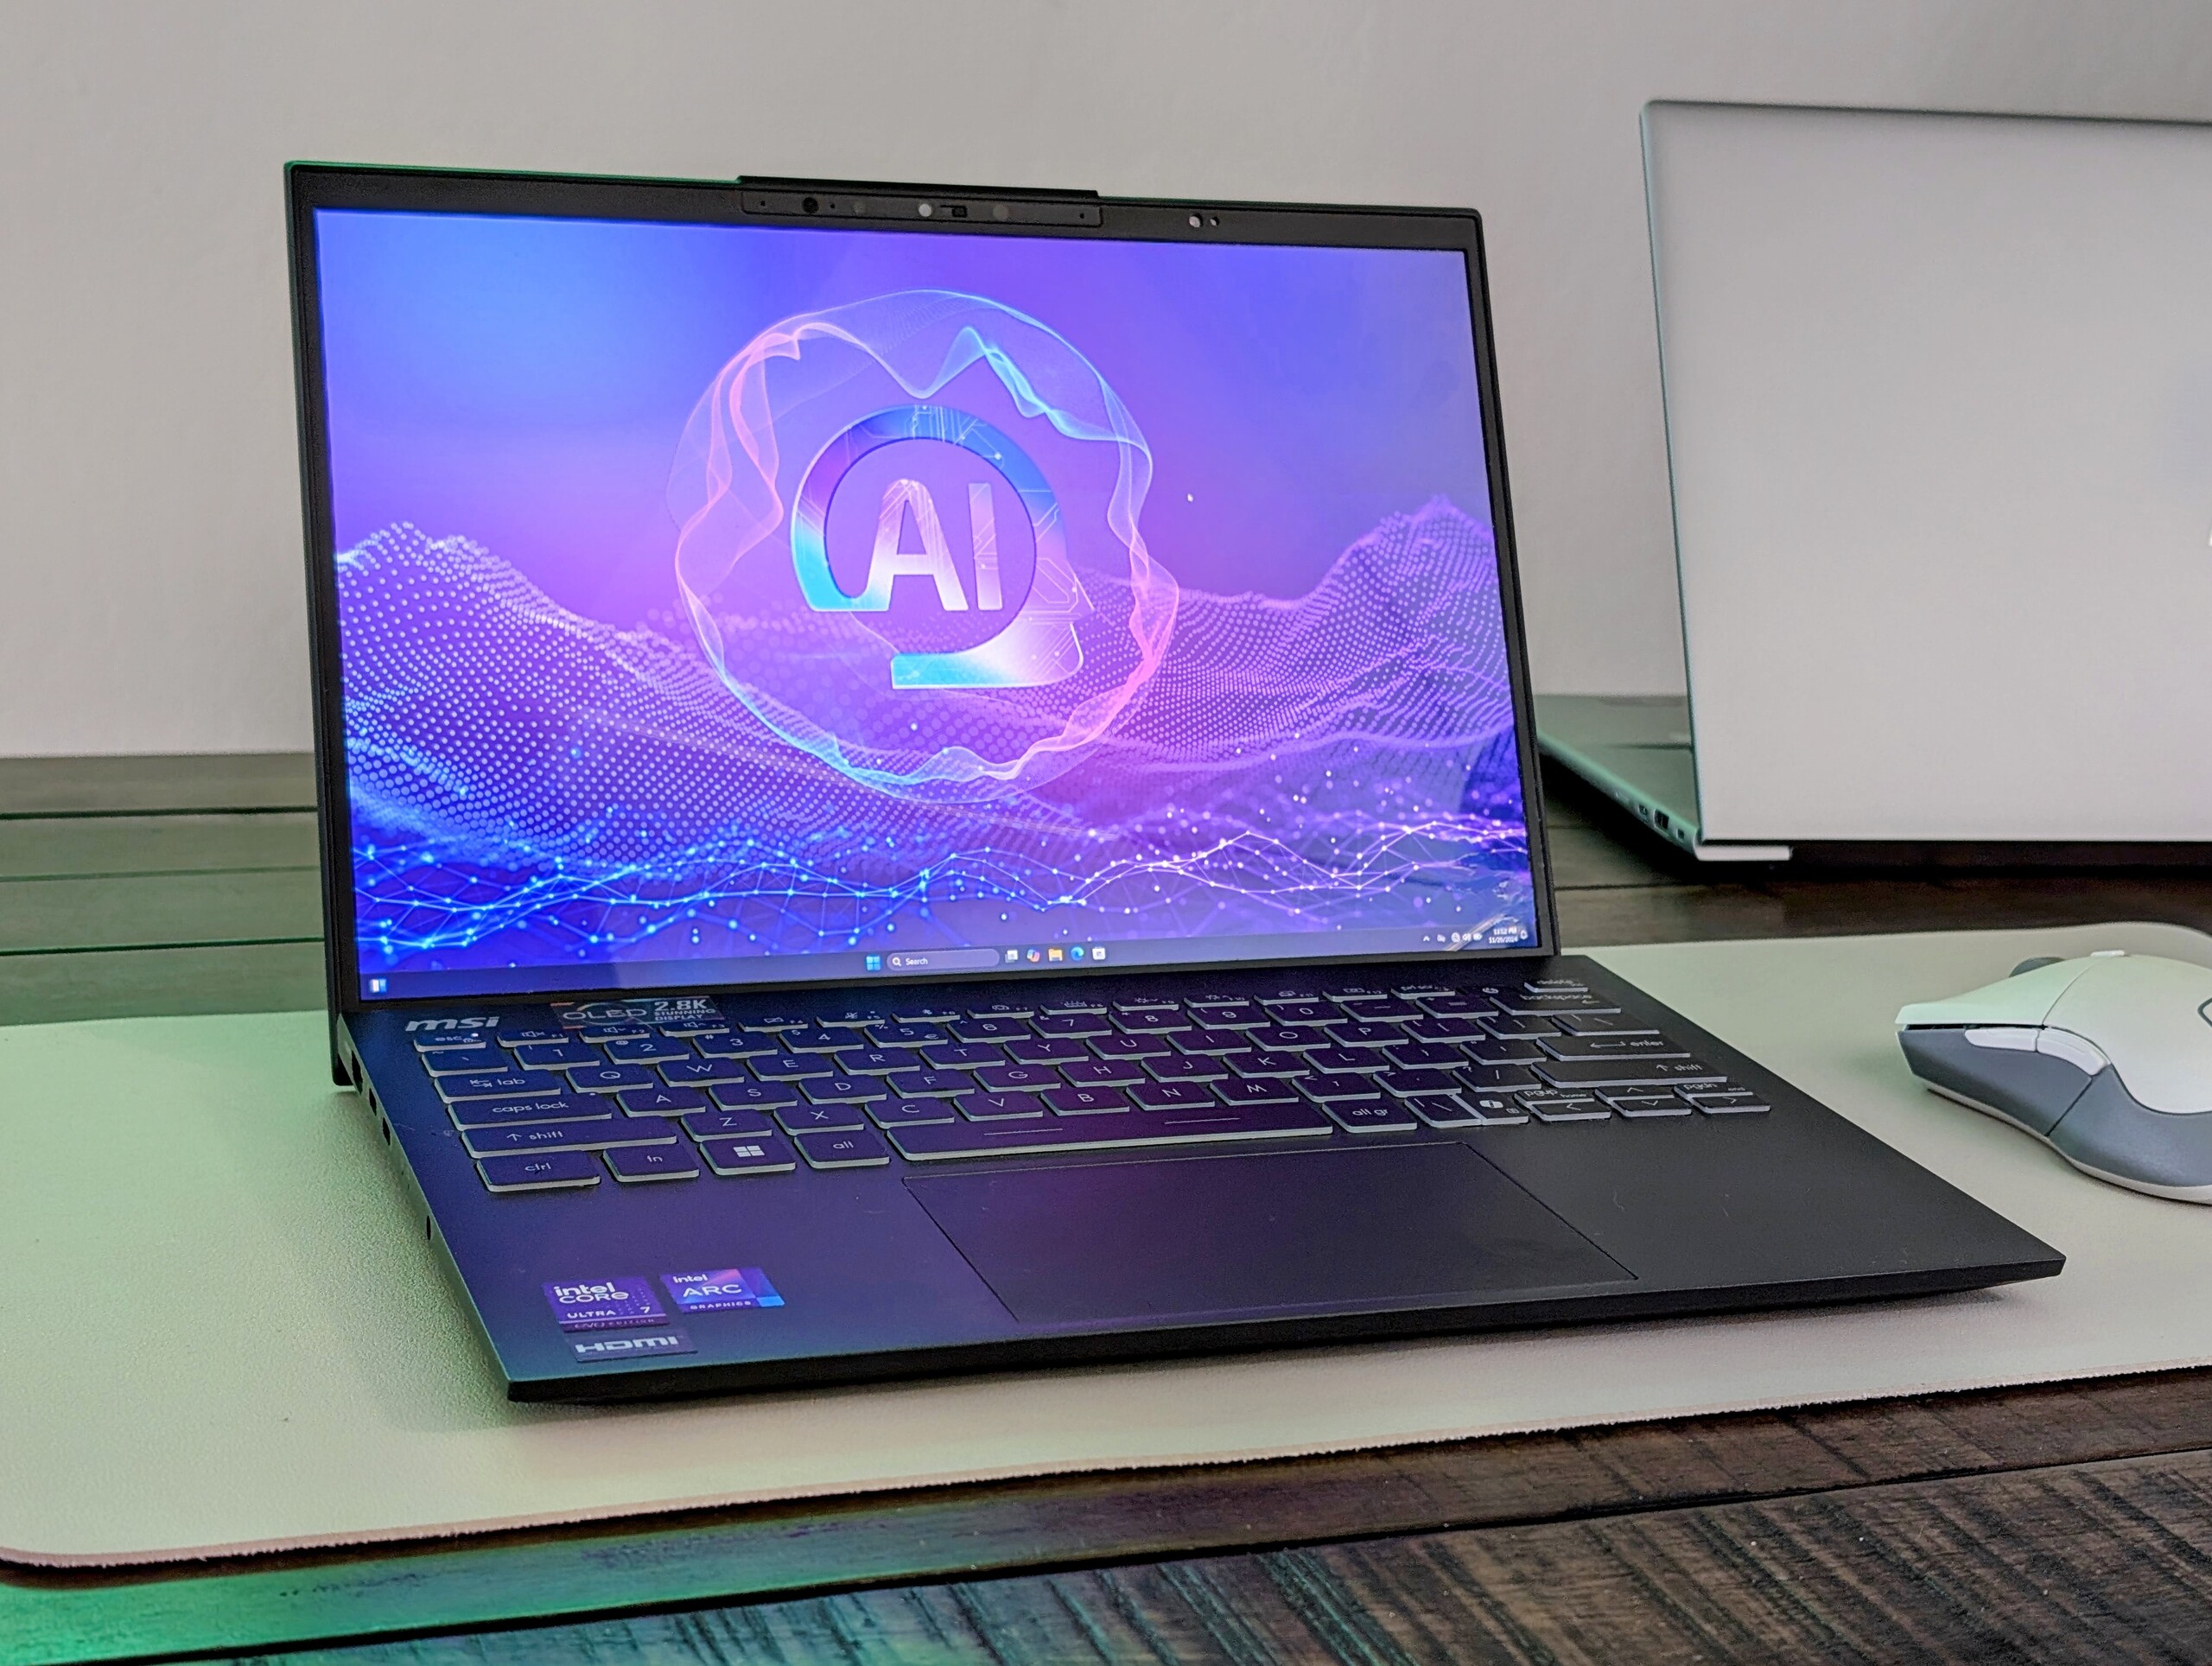
Recenzja laptopa MSI Prestige 13 AI Plus Evo: Świetna wydajność graficzna za mniej niż 1 kg
Core Ultra 7 258V vs Core Ultra 7 155H.
MSI odświeżyło swoje najlżejsze 13-calowe laptopy o procesory Lunar Lake, które zastąpiły starsze opcje Meteor Lake. Zmiany te wydłużyły zarówno czas pracy na baterii, jak i zwiększyły potencjał graficzny bez zwiększania hałasu wentylatora lub wagi.Allen Ngo, 👁 Allen Ngo (tłumaczenie DeepL / Ninh Duy) Opublikowany 🇺🇸 🇫🇷 ...
Werdykt - Imponująca wydajność i porty w stosunku do wagi
Jedną z naszych głównych skarg dotyczących oryginalnego Prestige 13 AI Evo był jego bardziej stromy niż oczekiwano throttling procesora podczas uruchamiania intensywnych obciążeń CPU. Nowy procesor Lunar Lake rozwiązuje tę kwestię poprzez obniżenie maksymalnego potencjału Turbo Boost przy jednoczesnym podniesieniu minimalnego poziomu wydajności podczas uruchamiania takich obciążeń. Pozwoliło to uzyskać stabilniejszą i szybszą wydajność w czasie, co powinno spodobać się twórcom treści lub edytorom, którzy muszą przetwarzać lub kodować większe pliki lub filmy. Dodatkowo, korzyści te nie wydają się wpływać na żywotność baterii, temperaturę lub hałas wentylatora w zauważalnym stopniu między Prestige 13 AI Evo i nowszym Prestige 13 AI Plus Evo.
Wydajność graficzna znacznie wzrosła, od 1,5x do 2x w zależności od aplikacji. Choć nie jest to maszyna do gier, Arc 140V jest imponujący, biorąc pod uwagę, jak lekki jest laptop MSI.
Podczas gdy wydajność odnotowała niemal powszechny wzrost, wszystkie inne wady, o których wspomnieliśmy w naszej recenzji Prestige 13 AI Evo, pozostają niezmienione. Wyświetlacz OLED 1800p, choć ostry i żywy, jest ograniczony do zaledwie 60 Hz bez opcji VRR lub ekranu dotykowego. Jakość kamery internetowej i sztywność obudowy są również o kilka stopni niższe w porównaniu do cięższych alternatyw od Dell lub HP. Mimo to MSI oferuje dużą wydajność i porty, biorąc pod uwagę jego niewielką wagę.
Za
Przeciw
Potencjalni konkurenci w porównaniu
Obraz | Model / recenzja | Cena | Waga | Wysokość | Ekran |
|---|---|---|---|---|---|
| MSI Prestige 13 AI Plus Evo A2VMG Intel Core Ultra 7 258V ⎘ Intel Arc Graphics 140V ⎘ 32 GB Pamięć | Amazon: $1,349.99 Cena katalogowa: 1400 USD | 970 g | 16.9 mm | 13.30" 2880x1800 255 PPI OLED | |
| MSI Prestige 13 AI Evo Intel Core Ultra 7 155H ⎘ Intel Arc 8-Core iGPU ⎘ 32 GB Pamięć, 1024 GB SSD | Amazon: $1,349.99 Cena katalogowa: 1599€ | 967 g | 16.9 mm | 13.30" 2880x1800 OLED | |
| Dell XPS 13 9350 Intel Core Ultra 7 256V ⎘ Intel Arc Graphics 140V ⎘ 16 GB Pamięć, 512 GB SSD | Amazon: 1. $1,499.99 2025 Latest Dell XPS 13 9350... 2. $1,699.00 NewDell XPS 13 9350 Powerful... 3. $1,599.99 Dell XPS 13 9340 Business La... Cena katalogowa: 1400 USD | 1.2 kg | 15.3 mm | 13.40" 1920x1200 169 PPI IPS | |
| Framework Laptop 13.5 Core Ultra 7 155H Intel Core Ultra 7 155H ⎘ Intel Arc 8-Core iGPU ⎘ 32 GB Pamięć | Cena katalogowa: 1500 USD | 1.4 kg | 15.85 mm | 13.50" 2880x1920 256 PPI IPS | |
| Lenovo Yoga Book 9 13IMU9 Intel Core Ultra 7 155U ⎘ Intel Graphics 4-Core iGPU (Arc) ⎘ 16 GB Pamięć | Amazon: $2,500.00 Cena katalogowa: 2000 USD | 1.4 kg | 15.95 mm | 13.30" 2880x1800 255 PPI OLED | |
| HP Dragonfly G4 Intel Core i7-1365U ⎘ Intel Iris Xe Graphics G7 96EUs ⎘ 16 GB Pamięć, 512 GB SSD | Amazon: $1,286.93 Cena katalogowa: 1700 USD | 1.1 kg | 16.3 mm | 13.50" 1920x1280 171 PPI IPS |
Minęło zaledwie sześć miesięcy od premiery oryginalnego Prestige 13 AI Evo, a MSI już odświeżyło ten model o nowsze procesory Intela. Nazwany Prestige 13 AI Plus Evo, najnowsza iteracja jest dostarczana z procesorami Lunar Lake zamiast Meteor Lake.
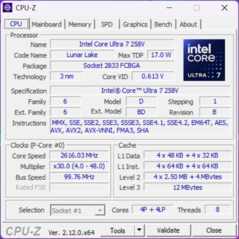
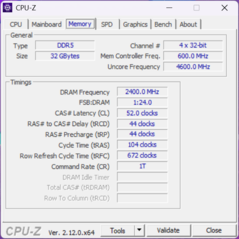
Nasza jednostka testowa to środkowa konfiguracja z Core Ultra 7 258V, 32 GB LPDDR5x-8533 RAM i wyświetlaczem OLED 1800p za około 1400 USD. Inne jednostki SKU mogą być dostarczane z Core Ultra 9 288V lub Core Ultra 7 256V zamiast tego z połową pamięci RAM.
Konkurenci obejmują inne wysokiej klasy subnotebooki, takie jak Dell XPS 13 9350, Framework Laptop 13.5lub HP Dragonfly 14.
Więcej recenzji MSI:
Specyfikacje
Sprawa
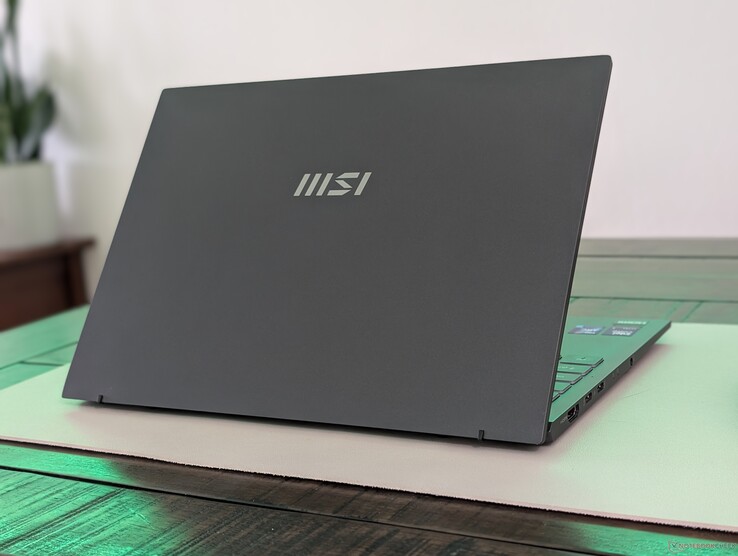
Zalecamy zapoznanie się z naszą recenzją Prestige 13 AI Evo, ponieważ nie ma zewnętrznych różnic między nim a naszym Prestige 13 AI Plus Evo. System jest jednym z najlżejszych 13-calowych subnotebooków na rynku o wadze poniżej 1 kg, ale obudowa ma tendencję do zginania się i skrzypienia łatwiej w porównaniu do cięższych modeli, takich jak XPS 13.
Łączność
Prestige 13 AI jest jednym z niewielu pozostałych subnotebooków ze zintegrowanymi portami HDMI i USB-A. Doceniamy fakt, że system nie polega w pełni wyłącznie na portach USB-C.
Czytnik kart SD
| SD Card Reader | |
| average JPG Copy Test (av. of 3 runs) | |
| Framework Laptop 13.5 Core Ultra 7 155H (Toshiba Exceria Pro SDXC 64 GB UHS-II) | |
| MSI Prestige 13 AI Evo (Angelbird AV Pro V60) | |
| MSI Prestige 13 AI Plus Evo A2VMG (Angelbird AV Pro V60) | |
| maximum AS SSD Seq Read Test (1GB) | |
| Framework Laptop 13.5 Core Ultra 7 155H (Toshiba Exceria Pro SDXC 64 GB UHS-II) | |
| MSI Prestige 13 AI Evo (Angelbird AV Pro V60) | |
| MSI Prestige 13 AI Plus Evo A2VMG (Angelbird AV Pro V60) | |
Komunikacja
Co ciekawe, nasza jednostka jest dostarczana z układem Intel Killer AX1775s zamiast BE1750W, który można znaleźć w konfiguracji Core Ultra 7 155H. AX1775s nie obsługuje Wi-Fi 7 w przeciwieństwie do BE1750W.
Kamera internetowa
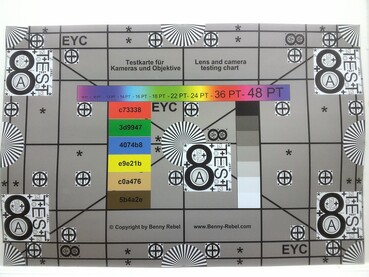
Jakość kamery internetowej została poprawiona z 2 MP w oryginalnym modelu do 5 MP, co zapewnia ostrzejszy obraz.
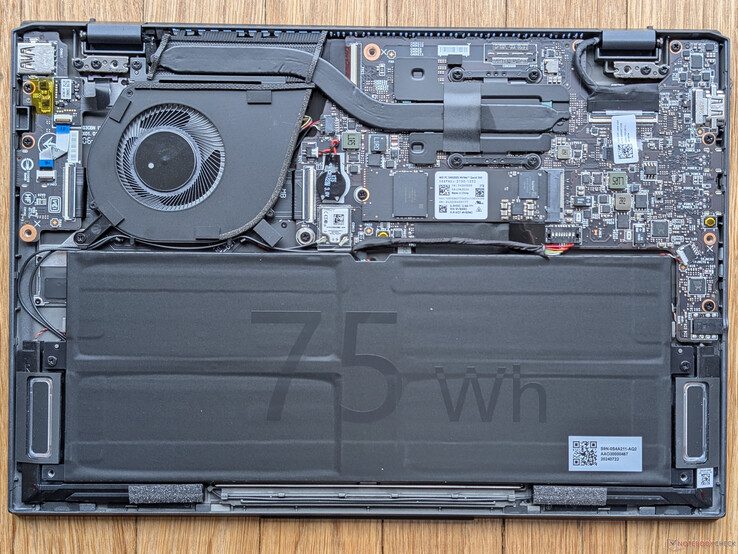
Konserwacja
Zrównoważony rozwój
Model ten jest zgodny z wytycznymi EPEAT Silver dotyczącymi zrównoważonego rozwoju, podczas gdy opakowanie składa się głównie z tektury i papieru, z kilkoma plastikowymi opakowaniami wokół laptopa i zasilacza sieciowego.
Wyświetlacz
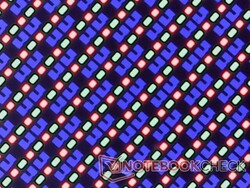
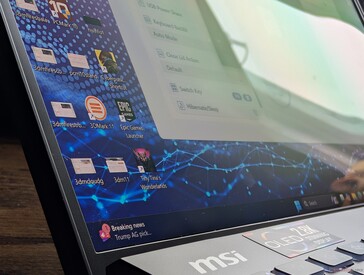
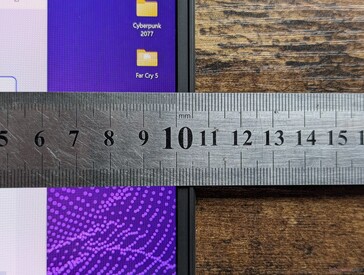
Wyświetlacz Samsung OLED o rozdzielczości 1800p pozostał taki sam jak poprzednio. Chociaż jakość obrazu jest doskonała i nie ma żadnych problemów z ziarnistością, wolelibyśmy, aby częstotliwość odświeżania wzrosła do 90 Hz lub 120 Hz, ponieważ 60 Hz zaczyna wyglądać na przestarzałe dla subnotebooka z wyższej półki.
Maksymalna jasność może osiągnąć nawet 598 nitów w trybie HDR. W przeciwnym razie osiąga 382 nitów w trybie SDR.
| |||||||||||||||||||||||||
rozświetlenie: 99 %
na akumulatorze: 382.4 cd/m²
kontrast: ∞:1 (czerń: 0 cd/m²)
ΔE Color 3.84 | 0.5-29.43 Ø4.87, calibrated: 0.41
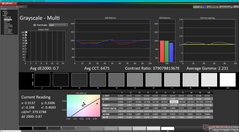
ΔE Greyscale 0.7 | 0.5-98 Ø5.1
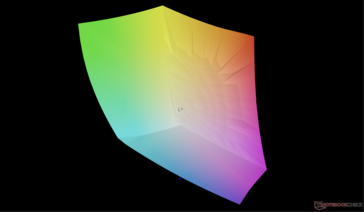
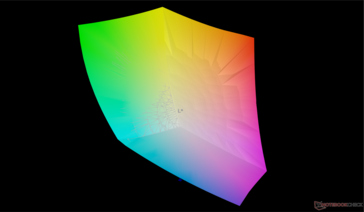
95.8% AdobeRGB 1998 (Argyll 2.2.0 3D)
100% sRGB (Argyll 2.2.0 3D)
99.9% Display P3 (Argyll 2.2.0 3D)
Gamma: 2.23
| MSI Prestige 13 AI Plus Evo A2VMG ATNA33AA07-0, OLED, 2880x1800, 13.3", 60 Hz | MSI Prestige 13 AI Evo ATNA33AA07-0, OLED, 2880x1800, 13.3", 60 Hz | Dell XPS 13 9350 LG Philips 134WU2, IPS, 1920x1200, 13.4", 120 Hz | Framework Laptop 13.5 Core Ultra 7 155H BOE NE135A1M-NY1, IPS, 2880x1920, 13.5", 120 Hz | Lenovo Yoga Book 9 13IMU9 SDC ATNA33AA02-0, OLED, 2880x1800, 13.3", 60 Hz | HP Dragonfly G4 Chi Mei CMN13C0, IPS, 1920x1280, 13.5", 60 Hz | |
|---|---|---|---|---|---|---|
| Display | 1% | -21% | -17% | 0% | -20% | |
| Display P3 Coverage | 99.9 | 99.9 0% | 67.3 -33% | 72.8 -27% | 99.7 0% | 68.4 -32% |
| sRGB Coverage | 100 | 100 0% | 99 -1% | 98.6 -1% | 100 0% | 98.3 -2% |
| AdobeRGB 1998 Coverage | 95.8 | 97.8 2% | 68.6 -28% | 72.9 -24% | 97 1% | 70.4 -27% |
| Response Times | 117% | -1503% | -1567% | -0% | -1933% | |
| Response Time Grey 50% / Grey 80% * | 1.94 ? | 1.54 ? 21% | 37.3 ? -1823% | 41.9 ? -2060% | 1.88 ? 3% | 48.8 ? -2415% |
| Response Time Black / White * | 2.02 ? | 1.44 ? 29% | 25.9 ? -1182% | 23.7 ? -1073% | 2.1 ? -4% | 31.3 ? -1450% |
| PWM Frequency | 60 ? | 240 ? 300% | 60 ? 0% | |||
| Screen | 3% | 17% | -108% | -50% | -27% | |
| Brightness middle | 382.4 | 404 6% | 462.8 21% | 498.5 30% | 362.6 -5% | 408.8 7% |
| Brightness | 383 | 407 6% | 435 14% | 464 21% | 368 -4% | 399 4% |
| Brightness Distribution | 99 | 98 -1% | 87 -12% | 86 -13% | 97 -2% | 90 -9% |
| Black Level * | 0.19 | 0.36 | 0.32 | |||
| Colorchecker dE 2000 * | 3.84 | 2.1 45% | 1.92 50% | 4.27 -11% | 4.66 -21% | 2.02 47% |
| Colorchecker dE 2000 max. * | 6.66 | 4.3 35% | 3.45 48% | 7.08 -6% | 7.25 -9% | 3.84 42% |
| Colorchecker dE 2000 calibrated * | 0.41 | 0.48 -17% | 1.26 -207% | 0.56 -37% | 0.61 -49% | |
| Greyscale dE 2000 * | 0.7 | 1.2 -71% | 0.6 14% | 4.7 -571% | 2.6 -271% | 2.3 -229% |
| Gamma | 2.23 99% | 2.16 102% | 2.19 100% | 2.09 105% | 2.2 100% | 2.2 100% |
| CCT | 6475 100% | 6465 101% | 6539 99% | 7417 88% | 6055 107% | 6203 105% |
| Contrast | 2436 | 1385 | 1278 | |||
| Całkowita średnia (program / ustawienia) | 40% /
31% | -502% /
-246% | -564% /
-329% | -17% /
-27% | -660% /
-343% |
* ... im mniej tym lepiej
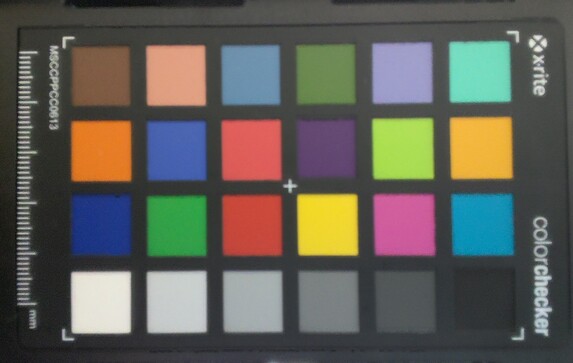
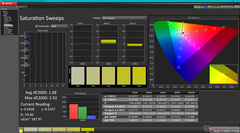
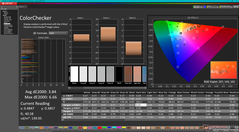
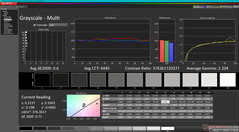
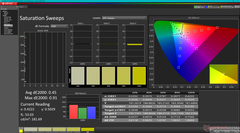
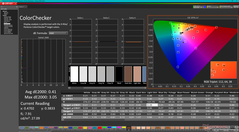
Wyświetlacz jest dobrze skalibrowany w stosunku do standardu P3 ze średnimi wartościami deltaE w skali szarości i ColorChecker wynoszącymi odpowiednio zaledwie 0,7 i 3,84.
Wyświetl czasy reakcji
| ↔ Czas reakcji od czerni do bieli | ||
|---|---|---|
| 2.02 ms ... wzrost ↗ i spadek ↘ łącznie | ↗ 0.92 ms wzrost | |
| ↘ 1.1 ms upadek | ||
| W naszych testach ekran wykazuje bardzo szybką reakcję i powinien bardzo dobrze nadawać się do szybkich gier. Dla porównania, wszystkie testowane urządzenia wahają się od 0.1 (minimum) do 240 (maksimum) ms. » 9 % wszystkich urządzeń jest lepszych. Oznacza to, że zmierzony czas reakcji jest lepszy od średniej wszystkich testowanych urządzeń (20.7 ms). | ||
| ↔ Czas reakcji 50% szarości do 80% szarości | ||
| 1.94 ms ... wzrost ↗ i spadek ↘ łącznie | ↗ 1 ms wzrost | |
| ↘ 0.94 ms upadek | ||
| W naszych testach ekran wykazuje bardzo szybką reakcję i powinien bardzo dobrze nadawać się do szybkich gier. Dla porównania, wszystkie testowane urządzenia wahają się od 0.165 (minimum) do 636 (maksimum) ms. » 7 % wszystkich urządzeń jest lepszych. Oznacza to, że zmierzony czas reakcji jest lepszy od średniej wszystkich testowanych urządzeń (32.5 ms). | ||
Migotanie ekranu / PWM (modulacja szerokości impulsu)
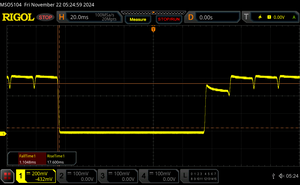
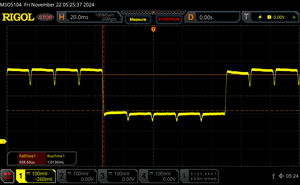
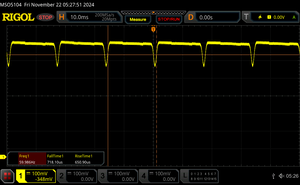
| Wykryto migotanie ekranu/wykryto PWM | 60 Hz Amplitude: 21.9 % | ≤ 100 % ustawienia jasności | |
Podświetlenie wyświetlacza miga z częstotliwością 60 Hz (najgorszy przypadek, np. przy użyciu PWM) Wykryto migotanie przy ustawieniu jasności 100 % i poniżej. Powyżej tego ustawienia jasności nie powinno być żadnego migotania ani PWM. Częstotliwość 60 Hz jest bardzo niska, więc migotanie może powodować zmęczenie oczu i bóle głowy po dłuższym użytkowaniu. Dla porównania: 53 % wszystkich testowanych urządzeń nie używa PWM do przyciemniania wyświetlacza. Jeśli wykryto PWM, zmierzono średnio 8500 (minimum: 5 - maksimum: 343500) Hz. | |||
Wydajność
Warunki testowania
Przed przeprowadzeniem poniższych testów ustawiliśmy zarówno system Windows, jak i MSI Center na tryb wydajności. Tryb Cooler Boost (inaczej tryb maksymalnego wentylatora) jest również dostępny, ale nie ma on znaczącego wpływu na wydajność, co pokażą poniższe testy porównawcze.
Procesor
W porównaniu do Core Ultra 7 155H, nasz Core Ultra 7 258V ma wolniejszy potencjał Turbo Boost, ale stabilniejszą i szybszą wydajność w dłuższych okresach czasu. Jest to widoczne podczas uruchamiania CineBench R15 xT w pętli, co pokazuje poniższy wykres, na którym konfiguracja Core Ultra 7 155H przewyższa naszą konfigurację Core Ultra 7 258V tylko na początku testu, po czym ostatecznie dławi się mocniej już po pierwszej pętli.
Cinebench R15 Multi Loop
Cinebench R23: Multi Core | Single Core
Cinebench R20: CPU (Multi Core) | CPU (Single Core)
Cinebench R15: CPU Multi 64Bit | CPU Single 64Bit
Blender: v2.79 BMW27 CPU
7-Zip 18.03: 7z b 4 | 7z b 4 -mmt1
Geekbench 6.4: Multi-Core | Single-Core
Geekbench 5.5: Multi-Core | Single-Core
HWBOT x265 Benchmark v2.2: 4k Preset
LibreOffice : 20 Documents To PDF
R Benchmark 2.5: Overall mean
| CPU Performance Rating | |
| Asus ProArt PX13 HN7306 | |
| Lenovo ThinkPad Z13 Gen 2 | |
| Framework Laptop 13.5 Core Ultra 7 155H | |
| MSI Prestige 13 AI Plus Evo A2VMG | |
| Dell XPS 13 9350 | |
| Przeciętny Intel Core Ultra 7 258V | |
| Lenovo ThinkPad X13 Gen 4 21J3001VGE | |
| MSI Prestige 13 AI Evo | |
| HP Dragonfly G4 -2! | |
| Dell Latitude 13 7350 | |
| Asus ZenBook S13 OLED UX5304 -2! | |
| Lenovo ThinkPad X13 2-in-1 Gen 5 | |
| Dell Latitude 7350 Detachable | |
| Dell XPS 13 Plus 9320 i5-1240p -2! | |
| Lenovo ThinkPad X13 G3 21CM002UGE -2! | |
| HP Elite Dragonfly G3 -2! | |
| Lenovo Yoga 6 13ALC6 -4! | |
| Cinebench R23 / Multi Core | |
| Asus ProArt PX13 HN7306 | |
| Lenovo ThinkPad Z13 Gen 2 | |
| Framework Laptop 13.5 Core Ultra 7 155H | |
| MSI Prestige 13 AI Plus Evo A2VMG | |
| Lenovo ThinkPad X13 Gen 4 21J3001VGE | |
| Dell XPS 13 9350 | |
| Przeciętny Intel Core Ultra 7 258V (9114 - 11097, n=14) | |
| MSI Prestige 13 AI Evo | |
| Dell XPS 13 Plus 9320 i5-1240p | |
| Dell Latitude 13 7350 | |
| Dell Latitude 7350 Detachable | |
| Lenovo ThinkPad X13 2-in-1 Gen 5 | |
| Lenovo ThinkPad X13 G3 21CM002UGE | |
| HP Dragonfly G4 | |
| Lenovo Yoga 6 13ALC6 | |
| Asus ZenBook S13 OLED UX5304 | |
| HP Elite Dragonfly G3 | |
| Cinebench R23 / Single Core | |
| Asus ProArt PX13 HN7306 | |
| HP Dragonfly G4 | |
| Dell XPS 13 9350 | |
| Przeciętny Intel Core Ultra 7 258V (1664 - 1947, n=14) | |
| MSI Prestige 13 AI Plus Evo A2VMG | |
| Framework Laptop 13.5 Core Ultra 7 155H | |
| Asus ZenBook S13 OLED UX5304 | |
| Lenovo ThinkPad X13 Gen 4 21J3001VGE | |
| Lenovo ThinkPad Z13 Gen 2 | |
| MSI Prestige 13 AI Evo | |
| Dell XPS 13 Plus 9320 i5-1240p | |
| Dell Latitude 7350 Detachable | |
| Dell Latitude 13 7350 | |
| HP Elite Dragonfly G3 | |
| Lenovo ThinkPad X13 2-in-1 Gen 5 | |
| Lenovo ThinkPad X13 G3 21CM002UGE | |
| Lenovo Yoga 6 13ALC6 | |
| Cinebench R20 / CPU (Multi Core) | |
| Asus ProArt PX13 HN7306 | |
| Lenovo ThinkPad Z13 Gen 2 | |
| Framework Laptop 13.5 Core Ultra 7 155H | |
| MSI Prestige 13 AI Plus Evo A2VMG | |
| Lenovo ThinkPad X13 Gen 4 21J3001VGE | |
| Dell XPS 13 9350 | |
| Przeciętny Intel Core Ultra 7 258V (3530 - 4314, n=14) | |
| MSI Prestige 13 AI Evo | |
| Dell Latitude 13 7350 | |
| Dell XPS 13 Plus 9320 i5-1240p | |
| Lenovo ThinkPad X13 2-in-1 Gen 5 | |
| Dell Latitude 7350 Detachable | |
| Lenovo ThinkPad X13 G3 21CM002UGE | |
| Lenovo Yoga 6 13ALC6 | |
| HP Dragonfly G4 | |
| Asus ZenBook S13 OLED UX5304 | |
| HP Elite Dragonfly G3 | |
| Cinebench R20 / CPU (Single Core) | |
| Asus ProArt PX13 HN7306 | |
| Dell XPS 13 9350 | |
| MSI Prestige 13 AI Plus Evo A2VMG | |
| Przeciętny Intel Core Ultra 7 258V (643 - 749, n=14) | |
| HP Dragonfly G4 | |
| Asus ZenBook S13 OLED UX5304 | |
| Lenovo ThinkPad Z13 Gen 2 | |
| Framework Laptop 13.5 Core Ultra 7 155H | |
| Lenovo ThinkPad X13 Gen 4 21J3001VGE | |
| MSI Prestige 13 AI Evo | |
| Dell XPS 13 Plus 9320 i5-1240p | |
| Dell Latitude 13 7350 | |
| Lenovo ThinkPad X13 2-in-1 Gen 5 | |
| Dell Latitude 7350 Detachable | |
| HP Elite Dragonfly G3 | |
| Lenovo ThinkPad X13 G3 21CM002UGE | |
| Lenovo Yoga 6 13ALC6 | |
| Cinebench R15 / CPU Multi 64Bit | |
| Asus ProArt PX13 HN7306 | |
| Framework Laptop 13.5 Core Ultra 7 155H | |
| Lenovo ThinkPad Z13 Gen 2 | |
| MSI Prestige 13 AI Evo | |
| Dell Latitude 13 7350 | |
| MSI Prestige 13 AI Plus Evo A2VMG | |
| Przeciętny Intel Core Ultra 7 258V (1504 - 1656, n=14) | |
| Dell XPS 13 Plus 9320 i5-1240p | |
| Lenovo ThinkPad X13 Gen 4 21J3001VGE | |
| Dell XPS 13 9350 | |
| Lenovo ThinkPad X13 2-in-1 Gen 5 | |
| Asus ZenBook S13 OLED UX5304 | |
| HP Dragonfly G4 | |
| Dell Latitude 7350 Detachable | |
| Lenovo ThinkPad X13 G3 21CM002UGE | |
| HP Elite Dragonfly G3 | |
| Lenovo Yoga 6 13ALC6 | |
| Cinebench R15 / CPU Single 64Bit | |
| Asus ProArt PX13 HN7306 | |
| Dell XPS 13 9350 | |
| Przeciętny Intel Core Ultra 7 258V (258 - 298, n=14) | |
| MSI Prestige 13 AI Plus Evo A2VMG | |
| Lenovo ThinkPad Z13 Gen 2 | |
| HP Dragonfly G4 | |
| Framework Laptop 13.5 Core Ultra 7 155H | |
| Lenovo ThinkPad X13 Gen 4 21J3001VGE | |
| Asus ZenBook S13 OLED UX5304 | |
| MSI Prestige 13 AI Evo | |
| Lenovo ThinkPad X13 G3 21CM002UGE | |
| Dell Latitude 13 7350 | |
| Dell XPS 13 Plus 9320 i5-1240p | |
| Dell Latitude 7350 Detachable | |
| HP Elite Dragonfly G3 | |
| Lenovo ThinkPad X13 2-in-1 Gen 5 | |
| Lenovo Yoga 6 13ALC6 | |
| Blender / v2.79 BMW27 CPU | |
| Lenovo ThinkPad X13 G3 21CM002UGE | |
| Lenovo ThinkPad X13 G3 21CM002UGE | |
| HP Elite Dragonfly G3 | |
| Asus ZenBook S13 OLED UX5304 | |
| Asus ZenBook S13 OLED UX5304 | |
| HP Dragonfly G4 | |
| Dell Latitude 7350 Detachable | |
| Lenovo ThinkPad X13 Gen 4 21J3001VGE | |
| Lenovo ThinkPad X13 2-in-1 Gen 5 | |
| Lenovo Yoga 6 13ALC6 | |
| Dell XPS 13 Plus 9320 i5-1240p | |
| Dell Latitude 13 7350 | |
| MSI Prestige 13 AI Evo | |
| Przeciętny Intel Core Ultra 7 258V (315 - 414, n=14) | |
| Dell XPS 13 9350 | |
| MSI Prestige 13 AI Plus Evo A2VMG | |
| Framework Laptop 13.5 Core Ultra 7 155H | |
| Lenovo ThinkPad Z13 Gen 2 | |
| Asus ProArt PX13 HN7306 | |
| 7-Zip 18.03 / 7z b 4 | |
| Asus ProArt PX13 HN7306 | |
| Lenovo ThinkPad Z13 Gen 2 | |
| Framework Laptop 13.5 Core Ultra 7 155H | |
| MSI Prestige 13 AI Evo | |
| Dell XPS 13 Plus 9320 i5-1240p | |
| Lenovo Yoga 6 13ALC6 | |
| Dell Latitude 13 7350 | |
| Lenovo ThinkPad X13 G3 21CM002UGE | |
| Dell XPS 13 9350 | |
| MSI Prestige 13 AI Plus Evo A2VMG | |
| Przeciętny Intel Core Ultra 7 258V (32198 - 36724, n=14) | |
| Lenovo ThinkPad X13 Gen 4 21J3001VGE | |
| HP Dragonfly G4 | |
| Asus ZenBook S13 OLED UX5304 | |
| Lenovo ThinkPad X13 2-in-1 Gen 5 | |
| HP Elite Dragonfly G3 | |
| Dell Latitude 7350 Detachable | |
| 7-Zip 18.03 / 7z b 4 -mmt1 | |
| Asus ProArt PX13 HN7306 | |
| Lenovo ThinkPad X13 Gen 4 21J3001VGE | |
| HP Dragonfly G4 | |
| Dell XPS 13 9350 | |
| Przeciętny Intel Core Ultra 7 258V (5265 - 5869, n=14) | |
| Asus ZenBook S13 OLED UX5304 | |
| Lenovo ThinkPad Z13 Gen 2 | |
| MSI Prestige 13 AI Plus Evo A2VMG | |
| MSI Prestige 13 AI Evo | |
| Framework Laptop 13.5 Core Ultra 7 155H | |
| Lenovo ThinkPad X13 G3 21CM002UGE | |
| HP Elite Dragonfly G3 | |
| Dell XPS 13 Plus 9320 i5-1240p | |
| Dell Latitude 13 7350 | |
| Lenovo ThinkPad X13 2-in-1 Gen 5 | |
| Dell Latitude 7350 Detachable | |
| Lenovo Yoga 6 13ALC6 | |
| Geekbench 5.5 / Multi-Core | |
| Asus ProArt PX13 HN7306 | |
| Framework Laptop 13.5 Core Ultra 7 155H | |
| Lenovo ThinkPad Z13 Gen 2 | |
| MSI Prestige 13 AI Evo | |
| Lenovo ThinkPad X13 Gen 4 21J3001VGE | |
| MSI Prestige 13 AI Plus Evo A2VMG | |
| Przeciętny Intel Core Ultra 7 258V (7717 - 9864, n=14) | |
| Dell XPS 13 9350 | |
| HP Dragonfly G4 | |
| Dell Latitude 13 7350 | |
| Asus ZenBook S13 OLED UX5304 | |
| HP Elite Dragonfly G3 | |
| Lenovo ThinkPad X13 2-in-1 Gen 5 | |
| Dell Latitude 7350 Detachable | |
| Lenovo ThinkPad X13 G3 21CM002UGE | |
| Dell XPS 13 Plus 9320 i5-1240p | |
| Geekbench 5.5 / Single-Core | |
| Asus ProArt PX13 HN7306 | |
| Dell XPS 13 9350 | |
| Przeciętny Intel Core Ultra 7 258V (1891 - 2046, n=14) | |
| MSI Prestige 13 AI Plus Evo A2VMG | |
| HP Dragonfly G4 | |
| Lenovo ThinkPad X13 Gen 4 21J3001VGE | |
| Lenovo ThinkPad Z13 Gen 2 | |
| Asus ZenBook S13 OLED UX5304 | |
| MSI Prestige 13 AI Evo | |
| Framework Laptop 13.5 Core Ultra 7 155H | |
| Lenovo ThinkPad X13 2-in-1 Gen 5 | |
| Dell XPS 13 Plus 9320 i5-1240p | |
| Dell Latitude 13 7350 | |
| Dell Latitude 7350 Detachable | |
| HP Elite Dragonfly G3 | |
| Lenovo ThinkPad X13 G3 21CM002UGE | |
| HWBOT x265 Benchmark v2.2 / 4k Preset | |
| Asus ProArt PX13 HN7306 | |
| Lenovo ThinkPad Z13 Gen 2 | |
| MSI Prestige 13 AI Plus Evo A2VMG | |
| Framework Laptop 13.5 Core Ultra 7 155H | |
| Lenovo ThinkPad X13 Gen 4 21J3001VGE | |
| Dell XPS 13 9350 | |
| Przeciętny Intel Core Ultra 7 258V (10.5 - 14.2, n=14) | |
| Dell XPS 13 Plus 9320 i5-1240p | |
| MSI Prestige 13 AI Evo | |
| Dell Latitude 13 7350 | |
| Lenovo ThinkPad X13 G3 21CM002UGE | |
| Lenovo Yoga 6 13ALC6 | |
| Lenovo ThinkPad X13 2-in-1 Gen 5 | |
| Dell Latitude 7350 Detachable | |
| HP Dragonfly G4 | |
| Asus ZenBook S13 OLED UX5304 | |
| HP Elite Dragonfly G3 | |
| LibreOffice / 20 Documents To PDF | |
| Lenovo ThinkPad X13 G3 21CM002UGE | |
| Dell XPS 13 Plus 9320 i5-1240p | |
| Lenovo Yoga 6 13ALC6 | |
| HP Elite Dragonfly G3 | |
| Asus ProArt PX13 HN7306 | |
| Lenovo ThinkPad X13 2-in-1 Gen 5 | |
| Dell XPS 13 9350 | |
| Dell Latitude 13 7350 | |
| MSI Prestige 13 AI Plus Evo A2VMG | |
| Przeciętny Intel Core Ultra 7 258V (41.1 - 59.3, n=14) | |
| Lenovo ThinkPad Z13 Gen 2 | |
| Dell Latitude 7350 Detachable | |
| Framework Laptop 13.5 Core Ultra 7 155H | |
| Asus ZenBook S13 OLED UX5304 | |
| Lenovo ThinkPad X13 Gen 4 21J3001VGE | |
| HP Dragonfly G4 | |
| MSI Prestige 13 AI Evo | |
| R Benchmark 2.5 / Overall mean | |
| Lenovo ThinkPad X13 G3 21CM002UGE | |
| Lenovo Yoga 6 13ALC6 | |
| Lenovo ThinkPad X13 2-in-1 Gen 5 | |
| Dell Latitude 13 7350 | |
| HP Elite Dragonfly G3 | |
| Dell Latitude 7350 Detachable | |
| Dell XPS 13 Plus 9320 i5-1240p | |
| Lenovo ThinkPad Z13 Gen 2 | |
| Framework Laptop 13.5 Core Ultra 7 155H | |
| Asus ZenBook S13 OLED UX5304 | |
| Lenovo ThinkPad X13 Gen 4 21J3001VGE | |
| MSI Prestige 13 AI Evo | |
| MSI Prestige 13 AI Plus Evo A2VMG | |
| HP Dragonfly G4 | |
| Dell XPS 13 9350 | |
| Przeciętny Intel Core Ultra 7 258V (0.4457 - 0.4852, n=14) | |
| Asus ProArt PX13 HN7306 | |
Cinebench R23: Multi Core | Single Core
Cinebench R20: CPU (Multi Core) | CPU (Single Core)
Cinebench R15: CPU Multi 64Bit | CPU Single 64Bit
Blender: v2.79 BMW27 CPU
7-Zip 18.03: 7z b 4 | 7z b 4 -mmt1
Geekbench 6.4: Multi-Core | Single-Core
Geekbench 5.5: Multi-Core | Single-Core
HWBOT x265 Benchmark v2.2: 4k Preset
LibreOffice : 20 Documents To PDF
R Benchmark 2.5: Overall mean
* ... im mniej tym lepiej
AIDA64: FP32 Ray-Trace | FPU Julia | CPU SHA3 | CPU Queen | FPU SinJulia | FPU Mandel | CPU AES | CPU ZLib | FP64 Ray-Trace | CPU PhotoWorxx
| Performance Rating | |
| Framework Laptop 13.5 Core Ultra 7 155H | |
| MSI Prestige 13 AI Plus Evo A2VMG | |
| Dell XPS 13 9350 | |
| Przeciętny Intel Core Ultra 7 258V | |
| Lenovo Yoga Book 9 13IMU9 | |
| MSI Prestige 13 AI Evo | |
| HP Dragonfly G4 | |
| AIDA64 / FP32 Ray-Trace | |
| MSI Prestige 13 AI Plus Evo A2VMG | |
| Dell XPS 13 9350 | |
| Przeciętny Intel Core Ultra 7 258V (9215 - 12781, n=14) | |
| Framework Laptop 13.5 Core Ultra 7 155H | |
| Lenovo Yoga Book 9 13IMU9 | |
| HP Dragonfly G4 | |
| MSI Prestige 13 AI Evo | |
| AIDA64 / FPU Julia | |
| MSI Prestige 13 AI Plus Evo A2VMG | |
| Dell XPS 13 9350 | |
| Framework Laptop 13.5 Core Ultra 7 155H | |
| Przeciętny Intel Core Ultra 7 258V (48758 - 63401, n=14) | |
| MSI Prestige 13 AI Evo | |
| Lenovo Yoga Book 9 13IMU9 | |
| HP Dragonfly G4 | |
| AIDA64 / CPU SHA3 | |
| MSI Prestige 13 AI Plus Evo A2VMG | |
| Framework Laptop 13.5 Core Ultra 7 155H | |
| Dell XPS 13 9350 | |
| Przeciętny Intel Core Ultra 7 258V (2271 - 2817, n=14) | |
| Lenovo Yoga Book 9 13IMU9 | |
| MSI Prestige 13 AI Evo | |
| HP Dragonfly G4 | |
| AIDA64 / CPU Queen | |
| Framework Laptop 13.5 Core Ultra 7 155H | |
| HP Dragonfly G4 | |
| MSI Prestige 13 AI Evo | |
| MSI Prestige 13 AI Plus Evo A2VMG | |
| Przeciętny Intel Core Ultra 7 258V (49510 - 49818, n=14) | |
| Dell XPS 13 9350 | |
| Lenovo Yoga Book 9 13IMU9 | |
| AIDA64 / FPU SinJulia | |
| Framework Laptop 13.5 Core Ultra 7 155H | |
| MSI Prestige 13 AI Evo | |
| Lenovo Yoga Book 9 13IMU9 | |
| HP Dragonfly G4 | |
| Dell XPS 13 9350 | |
| MSI Prestige 13 AI Plus Evo A2VMG | |
| Przeciętny Intel Core Ultra 7 258V (4103 - 4440, n=14) | |
| AIDA64 / FPU Mandel | |
| MSI Prestige 13 AI Plus Evo A2VMG | |
| Dell XPS 13 9350 | |
| Przeciętny Intel Core Ultra 7 258V (25361 - 33565, n=14) | |
| Framework Laptop 13.5 Core Ultra 7 155H | |
| MSI Prestige 13 AI Evo | |
| Lenovo Yoga Book 9 13IMU9 | |
| HP Dragonfly G4 | |
| AIDA64 / CPU AES | |
| Framework Laptop 13.5 Core Ultra 7 155H | |
| MSI Prestige 13 AI Evo | |
| Lenovo Yoga Book 9 13IMU9 | |
| Dell XPS 13 9350 | |
| MSI Prestige 13 AI Plus Evo A2VMG | |
| Przeciętny Intel Core Ultra 7 258V (37728 - 40753, n=14) | |
| HP Dragonfly G4 | |
| AIDA64 / CPU ZLib | |
| Framework Laptop 13.5 Core Ultra 7 155H | |
| Lenovo Yoga Book 9 13IMU9 | |
| MSI Prestige 13 AI Plus Evo A2VMG | |
| Przeciętny Intel Core Ultra 7 258V (499 - 632, n=14) | |
| MSI Prestige 13 AI Evo | |
| Dell XPS 13 9350 | |
| HP Dragonfly G4 | |
| AIDA64 / FP64 Ray-Trace | |
| MSI Prestige 13 AI Plus Evo A2VMG | |
| Dell XPS 13 9350 | |
| Przeciętny Intel Core Ultra 7 258V (4891 - 6930, n=14) | |
| Framework Laptop 13.5 Core Ultra 7 155H | |
| Lenovo Yoga Book 9 13IMU9 | |
| MSI Prestige 13 AI Evo | |
| HP Dragonfly G4 | |
| AIDA64 / CPU PhotoWorxx | |
| MSI Prestige 13 AI Plus Evo A2VMG | |
| Przeciętny Intel Core Ultra 7 258V (51323 - 54971, n=14) | |
| Dell XPS 13 9350 | |
| Framework Laptop 13.5 Core Ultra 7 155H | |
| Lenovo Yoga Book 9 13IMU9 | |
| MSI Prestige 13 AI Evo | |
| HP Dragonfly G4 | |
Wydajność systemu
CrossMark: Overall | Productivity | Creativity | Responsiveness
WebXPRT 3: Overall
WebXPRT 4: Overall
Mozilla Kraken 1.1: Total
| PCMark 10 / Score | |
| Dell XPS 13 9350 | |
| Przeciętny Intel Core Ultra 7 258V, Intel Arc Graphics 140V (6265 - 7314, n=14) | |
| Framework Laptop 13.5 Core Ultra 7 155H | |
| MSI Prestige 13 AI Plus Evo A2VMG | |
| Lenovo Yoga Book 9 13IMU9 | |
| MSI Prestige 13 AI Evo | |
| HP Dragonfly G4 | |
| PCMark 10 / Essentials | |
| Lenovo Yoga Book 9 13IMU9 | |
| HP Dragonfly G4 | |
| Framework Laptop 13.5 Core Ultra 7 155H | |
| Przeciętny Intel Core Ultra 7 258V, Intel Arc Graphics 140V (9295 - 11467, n=14) | |
| MSI Prestige 13 AI Plus Evo A2VMG | |
| Dell XPS 13 9350 | |
| MSI Prestige 13 AI Evo | |
| PCMark 10 / Productivity | |
| Dell XPS 13 9350 | |
| Przeciętny Intel Core Ultra 7 258V, Intel Arc Graphics 140V (7357 - 9619, n=14) | |
| MSI Prestige 13 AI Evo | |
| Framework Laptop 13.5 Core Ultra 7 155H | |
| MSI Prestige 13 AI Plus Evo A2VMG | |
| Lenovo Yoga Book 9 13IMU9 | |
| HP Dragonfly G4 | |
| PCMark 10 / Digital Content Creation | |
| MSI Prestige 13 AI Plus Evo A2VMG | |
| Dell XPS 13 9350 | |
| Przeciętny Intel Core Ultra 7 258V, Intel Arc Graphics 140V (9333 - 10048, n=14) | |
| Framework Laptop 13.5 Core Ultra 7 155H | |
| Lenovo Yoga Book 9 13IMU9 | |
| MSI Prestige 13 AI Evo | |
| HP Dragonfly G4 | |
| CrossMark / Overall | |
| Dell XPS 13 9350 | |
| MSI Prestige 13 AI Plus Evo A2VMG | |
| Przeciętny Intel Core Ultra 7 258V, Intel Arc Graphics 140V (1590 - 1742, n=13) | |
| Framework Laptop 13.5 Core Ultra 7 155H | |
| HP Dragonfly G4 | |
| Lenovo Yoga Book 9 13IMU9 | |
| MSI Prestige 13 AI Evo | |
| CrossMark / Productivity | |
| Dell XPS 13 9350 | |
| MSI Prestige 13 AI Plus Evo A2VMG | |
| Przeciętny Intel Core Ultra 7 258V, Intel Arc Graphics 140V (1558 - 1684, n=13) | |
| HP Dragonfly G4 | |
| Framework Laptop 13.5 Core Ultra 7 155H | |
| MSI Prestige 13 AI Evo | |
| Lenovo Yoga Book 9 13IMU9 | |
| CrossMark / Creativity | |
| MSI Prestige 13 AI Plus Evo A2VMG | |
| Dell XPS 13 9350 | |
| Przeciętny Intel Core Ultra 7 258V, Intel Arc Graphics 140V (1727 - 1977, n=13) | |
| Framework Laptop 13.5 Core Ultra 7 155H | |
| HP Dragonfly G4 | |
| Lenovo Yoga Book 9 13IMU9 | |
| MSI Prestige 13 AI Evo | |
| CrossMark / Responsiveness | |
| HP Dragonfly G4 | |
| Framework Laptop 13.5 Core Ultra 7 155H | |
| Dell XPS 13 9350 | |
| MSI Prestige 13 AI Plus Evo A2VMG | |
| Przeciętny Intel Core Ultra 7 258V, Intel Arc Graphics 140V (1251 - 1411, n=13) | |
| MSI Prestige 13 AI Evo | |
| Lenovo Yoga Book 9 13IMU9 | |
| WebXPRT 3 / Overall | |
| Dell XPS 13 9350 | |
| HP Dragonfly G4 | |
| MSI Prestige 13 AI Plus Evo A2VMG | |
| Framework Laptop 13.5 Core Ultra 7 155H | |
| Przeciętny Intel Core Ultra 7 258V, Intel Arc Graphics 140V (219 - 314, n=12) | |
| Lenovo Yoga Book 9 13IMU9 | |
| MSI Prestige 13 AI Evo | |
| WebXPRT 4 / Overall | |
| MSI Prestige 13 AI Plus Evo A2VMG | |
| Dell XPS 13 9350 | |
| Przeciętny Intel Core Ultra 7 258V, Intel Arc Graphics 140V (199.5 - 291, n=14) | |
| HP Dragonfly G4 | |
| Framework Laptop 13.5 Core Ultra 7 155H | |
| Lenovo Yoga Book 9 13IMU9 | |
| MSI Prestige 13 AI Evo | |
| Mozilla Kraken 1.1 / Total | |
| Lenovo Yoga Book 9 13IMU9 | |
| MSI Prestige 13 AI Evo | |
| Framework Laptop 13.5 Core Ultra 7 155H | |
| HP Dragonfly G4 | |
| Przeciętny Intel Core Ultra 7 258V, Intel Arc Graphics 140V (468 - 559, n=14) | |
| MSI Prestige 13 AI Plus Evo A2VMG | |
| Dell XPS 13 9350 | |
* ... im mniej tym lepiej
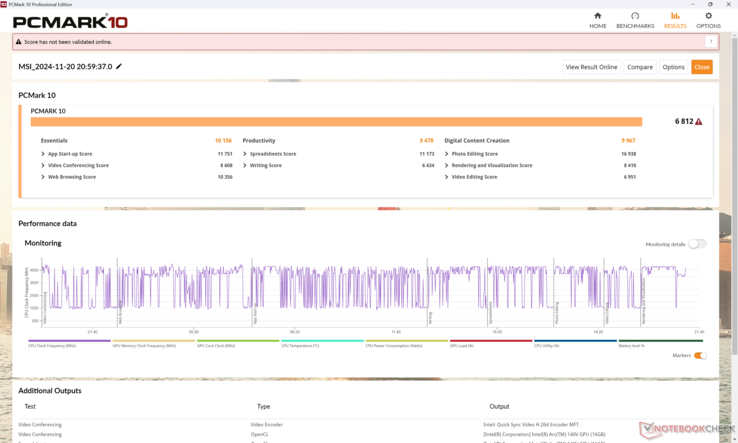
| PCMark 10 Score | 6812 pkt. | |
Pomoc | ||
| AIDA64 / Memory Copy | |
| Przeciętny Intel Core Ultra 7 258V (107682 - 114336, n=14) | |
| MSI Prestige 13 AI Plus Evo A2VMG | |
| Dell XPS 13 9350 | |
| MSI Prestige 13 AI Evo | |
| Lenovo Yoga Book 9 13IMU9 | |
| Framework Laptop 13.5 Core Ultra 7 155H | |
| HP Dragonfly G4 | |
| AIDA64 / Memory Read | |
| Dell XPS 13 9350 | |
| Przeciętny Intel Core Ultra 7 258V (82846 - 89417, n=14) | |
| MSI Prestige 13 AI Plus Evo A2VMG | |
| Framework Laptop 13.5 Core Ultra 7 155H | |
| MSI Prestige 13 AI Evo | |
| Lenovo Yoga Book 9 13IMU9 | |
| HP Dragonfly G4 | |
| AIDA64 / Memory Write | |
| MSI Prestige 13 AI Plus Evo A2VMG | |
| Przeciętny Intel Core Ultra 7 258V (109734 - 117935, n=14) | |
| Dell XPS 13 9350 | |
| MSI Prestige 13 AI Evo | |
| Framework Laptop 13.5 Core Ultra 7 155H | |
| HP Dragonfly G4 | |
| Lenovo Yoga Book 9 13IMU9 | |
| AIDA64 / Memory Latency | |
| MSI Prestige 13 AI Evo | |
| Lenovo Yoga Book 9 13IMU9 | |
| Framework Laptop 13.5 Core Ultra 7 155H | |
| MSI Prestige 13 AI Plus Evo A2VMG | |
| Dell XPS 13 9350 | |
| Przeciętny Intel Core Ultra 7 258V (95 - 101.1, n=14) | |
| HP Dragonfly G4 | |
* ... im mniej tym lepiej
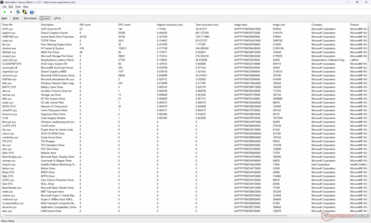
Opóźnienie DPC
| DPC Latencies / LatencyMon - interrupt to process latency (max), Web, Youtube, Prime95 | |
| MSI Prestige 13 AI Evo | |
| Lenovo Yoga Book 9 13IMU9 | |
| HP Dragonfly G4 | |
| MSI Prestige 13 AI Plus Evo A2VMG | |
| Framework Laptop 13.5 Core Ultra 7 155H | |
* ... im mniej tym lepiej
Urządzenia pamięci masowej
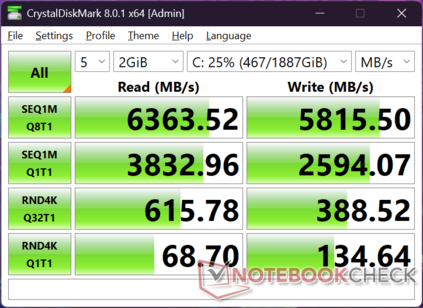
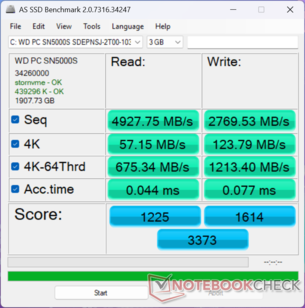
Nasze urządzenie jest dostarczane z WD SN5000S zamiast Samsung PM9A1, który znalazł się w naszej konfiguracji Core Ultra 7 155H. Dysk nie wykazuje żadnych problemów z dławieniem, których doświadczyliśmy w oryginalnym Prestige 13 AI.
| Drive Performance Rating - Percent | |
| MSI Prestige 13 AI Evo | |
| Framework Laptop 13.5 Core Ultra 7 155H | |
| HP Dragonfly G4 | |
| MSI Prestige 13 AI Plus Evo A2VMG | |
| Lenovo Yoga Book 9 13IMU9 | |
| Dell XPS 13 9350 | |
* ... im mniej tym lepiej
Disk Throttling: DiskSpd Read Loop, Queue Depth 8
Wydajność GPU
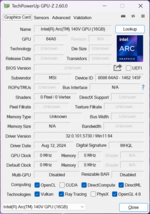
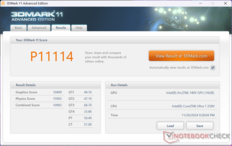
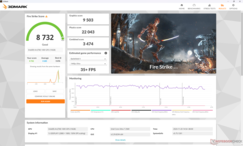
Nowy zintegrowany GPU Arc 140V jest prawdopodobnie jednym z największych ulepszeń w stosunku do Arc 8 w konfiguracji Core Ultra 7 155H. wyniki 3DMark są od 1,5x do 2x szybsze, co przekłada się całkiem dobrze na scenariusze gier, takie jak GTA V lub nawet Cyberpunk 2077 , gdzie konfiguracja Core Ultra 7 155H ma tendencję do osiągania gorszych wyników.
| Profil zasilania | Wynik grafiki | Wynik fizyki | Łączny wynik |
| Tryb wydajności (Cooler Boost włączony) | 9513 | 21842 | 3426 |
| Tryb wydajności (Cooler Boost wyłączony) | 9503 | 22043 | 3474 |
| Tryb zrównoważony | 9376 | 21037 | 3019 |
| Zasilanie bateryjne | 9471 | 21837 | 3440 |
Uruchamianie systemu z włączoną funkcją Cooler Boost lub w trybie zrównoważonym, a nawet tylko na zasilaniu bateryjnym, nie wpłynie znacząco na wydajność, jak pokazuje nasza tabela wyników Fire Strike powyżej.
| 3DMark Performance Rating - Percent | |
| Asus ProArt PX13 HN7306 -1! | |
| Przeciętny Intel Arc Graphics 140V | |
| Dell XPS 13 9350 | |
| MSI Prestige 13 AI Plus Evo A2VMG | |
| Framework Laptop 13.5 Core Ultra 7 155H | |
| Lenovo ThinkPad X13 2-in-1 Gen 5 | |
| Dell Latitude 13 7350 | |
| Lenovo ThinkPad Z13 Gen 2 -1! | |
| Lenovo ThinkPad X13 G3 21CM002UGE | |
| HP Elite Dragonfly G3 | |
| Lenovo ThinkPad X13 Gen 4 21J3001VGE -2! | |
| Dell Latitude 7350 Detachable | |
| Lenovo Yoga 6 13ALC6 | |
| MSI Prestige 13 AI Evo -1! | |
| HP Dragonfly G4 -1! | |
| Dell XPS 13 Plus 9320 i5-1240p | |
| Asus ZenBook S13 OLED UX5304 -1! | |
| 3DMark 11 - 1280x720 Performance GPU | |
| Asus ProArt PX13 HN7306 | |
| Framework Laptop 13.5 Core Ultra 7 155H | |
| Lenovo ThinkPad Z13 Gen 2 | |
| Przeciętny Intel Arc Graphics 140V (10499 - 12772, n=21) | |
| Dell XPS 13 9350 | |
| MSI Prestige 13 AI Plus Evo A2VMG | |
| MSI Prestige 13 AI Evo | |
| Dell Latitude 13 7350 | |
| Lenovo ThinkPad X13 G3 21CM002UGE | |
| Lenovo ThinkPad X13 2-in-1 Gen 5 | |
| HP Dragonfly G4 | |
| Asus ZenBook S13 OLED UX5304 | |
| Dell Latitude 7350 Detachable | |
| HP Elite Dragonfly G3 | |
| Lenovo Yoga 6 13ALC6 | |
| Dell XPS 13 Plus 9320 i5-1240p | |
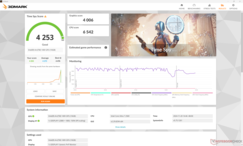
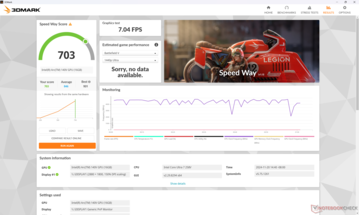
| 3DMark 11 Performance | 11114 pkt. | |
| 3DMark Cloud Gate Standard Score | 33012 pkt. | |
| 3DMark Fire Strike Score | 8732 pkt. | |
| 3DMark Time Spy Score | 4253 pkt. | |
| 3DMark Steel Nomad Score | 681 pkt. | |
Pomoc | ||
* ... im mniej tym lepiej
| Performance Rating - Percent | |
| MSI Prestige 13 AI Plus Evo A2VMG | |
| Dell XPS 13 9350 | |
| Framework Laptop 13.5 Core Ultra 7 155H | |
| MSI Prestige 13 AI Evo -2! | |
| Lenovo Yoga Book 9 13IMU9 -2! | |
| HP Dragonfly G4 -2! | |
| Cyberpunk 2077 2.2 Phantom Liberty - 1920x1080 Ultra Preset (FSR off) | |
| MSI Prestige 13 AI Plus Evo A2VMG | |
| Framework Laptop 13.5 Core Ultra 7 155H | |
| Dell XPS 13 9350 | |
| Lenovo Yoga Book 9 13IMU9 | |
| Baldur's Gate 3 - 1920x1080 Ultra Preset | |
| MSI Prestige 13 AI Plus Evo A2VMG | |
| Framework Laptop 13.5 Core Ultra 7 155H | |
| Dell XPS 13 9350 | |
| GTA V - 1920x1080 Highest Settings possible AA:4xMSAA + FX AF:16x | |
| MSI Prestige 13 AI Plus Evo A2VMG | |
| Dell XPS 13 9350 | |
| Framework Laptop 13.5 Core Ultra 7 155H | |
| HP Dragonfly G4 | |
| MSI Prestige 13 AI Evo | |
| Final Fantasy XV Benchmark - 1920x1080 High Quality | |
| MSI Prestige 13 AI Plus Evo A2VMG | |
| Dell XPS 13 9350 | |
| Framework Laptop 13.5 Core Ultra 7 155H | |
| MSI Prestige 13 AI Evo | |
| HP Dragonfly G4 | |
| Lenovo Yoga Book 9 13IMU9 | |
| Strange Brigade - 1920x1080 ultra AA:ultra AF:16 | |
| Dell XPS 13 9350 | |
| MSI Prestige 13 AI Plus Evo A2VMG | |
| Framework Laptop 13.5 Core Ultra 7 155H | |
| MSI Prestige 13 AI Evo | |
| Lenovo Yoga Book 9 13IMU9 | |
| HP Dragonfly G4 | |
| Dota 2 Reborn - 1920x1080 ultra (3/3) best looking | |
| MSI Prestige 13 AI Plus Evo A2VMG | |
| Dell XPS 13 9350 | |
| Framework Laptop 13.5 Core Ultra 7 155H | |
| Lenovo Yoga Book 9 13IMU9 | |
| HP Dragonfly G4 | |
| MSI Prestige 13 AI Evo | |
| X-Plane 11.11 - 1920x1080 high (fps_test=3) | |
| MSI Prestige 13 AI Plus Evo A2VMG | |
| Framework Laptop 13.5 Core Ultra 7 155H | |
| MSI Prestige 13 AI Evo | |
| Dell XPS 13 9350 | |
| HP Dragonfly G4 | |
| Lenovo Yoga Book 9 13IMU9 | |
Cyberpunk 2077 ultra FPS Chart
| low | med. | high | ultra | |
|---|---|---|---|---|
| GTA V (2015) | 161.6 | 155.6 | 67.4 | 26.7 |
| Dota 2 Reborn (2015) | 97.2 | 87.8 | 72.1 | 83 |
| Final Fantasy XV Benchmark (2018) | 84 | 46.2 | 31.7 | |
| X-Plane 11.11 (2018) | 56.6 | 42.6 | 36.9 | |
| Far Cry 5 (2018) | 92 | 57 | 49 | 45 |
| Strange Brigade (2018) | 216 | 74.6 | 63 | 55.4 |
| Tiny Tina's Wonderlands (2022) | 72.1 | 53.3 | 36 | 28 |
| F1 22 (2022) | 96.2 | 88.5 | 63.9 | 19.9 |
| Baldur's Gate 3 (2023) | 39.6 | 33.5 | 29.8 | 29.1 |
| Cyberpunk 2077 2.2 Phantom Liberty (2023) | 46.6 | 37.4 | 32.5 | 28.5 |
Emisje
Hałas systemowy
Hałas wentylatora jest generalnie głośniejszy niż wcześniej podczas uruchamiania bardziej wymagających obciążeń, takich jak gry. Uruchomienie Cyberpunk 2077 w trybie Performance spowodowałoby hałas wentylatora na poziomie 45 dB(A) w porównaniu do prawie 51 dB(A) w trybie Cooler Boost.
Hałas
| luz |
| 24.8 / 24.8 / 26.7 dB |
| obciążenie |
| 36.8 / 50.8 dB |
 | ||
30 dB cichy 40 dB(A) słyszalny 50 dB(A) irytujący |
||
min: | ||
| MSI Prestige 13 AI Plus Evo A2VMG Arc 140V, Core Ultra 7 258V | MSI Prestige 13 AI Evo Arc 8-Core, Ultra 7 155H, Samsung PM9A1 MZVL21T0HCLR | Dell XPS 13 9350 Arc 140V, Core Ultra 7 256V, Micron 2550 512GB | Framework Laptop 13.5 Core Ultra 7 155H Arc 8-Core, Ultra 7 155H | Lenovo Yoga Book 9 13IMU9 Graphics 4-Core, Ultra 7 155U | HP Dragonfly G4 Iris Xe G7 96EUs, i7-1365U, Micron 3400 MTFDKBA512TFH 512GB | |
|---|---|---|---|---|---|---|
| Noise | 6% | 11% | 1% | 16% | 12% | |
| wyłączone / środowisko * | 24.1 | 23.4 3% | 24.1 -0% | 24 -0% | 23.3 3% | 23.3 3% |
| Idle Minimum * | 24.8 | 23.4 6% | 24.4 2% | 24.1 3% | 23.3 6% | 23.5 5% |
| Idle Average * | 24.8 | 26.9 -8% | 24.4 2% | 25.1 -1% | 23.3 6% | 23.5 5% |
| Idle Maximum * | 26.7 | 26.9 -1% | 24.4 9% | 27 -1% | 24.6 8% | 26.8 -0% |
| Load Average * | 36.8 | 32 13% | 26.2 29% | 38.4 -4% | 26.2 29% | 27.2 26% |
| Cyberpunk 2077 ultra * | 44.5 | 34.2 23% | 43.7 2% | |||
| Load Maximum * | 50.8 | 40.3 21% | 45.2 11% | 45.8 10% | 27.3 46% | 35 31% |
| Witcher 3 ultra * | 32 | 27.3 | 32.7 |
* ... im mniej tym lepiej
Temperatura
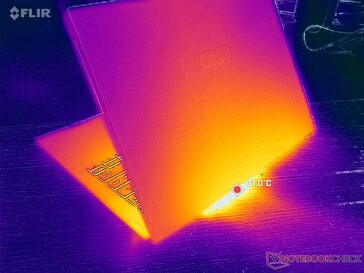
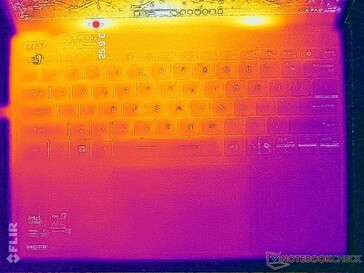
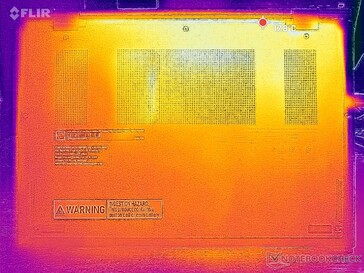
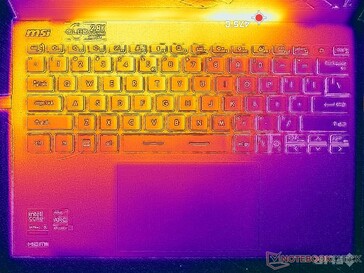
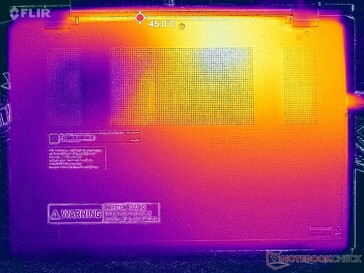
(±) Maksymalna temperatura w górnej części wynosi 43.4 °C / 110 F, w porównaniu do średniej 35.9 °C / 97 F , począwszy od 21.4 do 59 °C dla klasy Subnotebook.
(±) Dno nagrzewa się maksymalnie do 42.4 °C / 108 F, w porównaniu do średniej 39.3 °C / 103 F
(+) W stanie bezczynności średnia temperatura górnej części wynosi 23.4 °C / 74 F, w porównaniu ze średnią temperaturą urządzenia wynoszącą 30.8 °C / ### class_avg_f### F.
(+) Podpórki pod nadgarstki i touchpad są chłodniejsze niż temperatura skóry i maksymalnie 29.8 °C / 85.6 F i dlatego są chłodne w dotyku.
(±) Średnia temperatura obszaru podparcia dłoni w podobnych urządzeniach wynosiła 28.2 °C / 82.8 F (-1.6 °C / -2.8 F).
| MSI Prestige 13 AI Plus Evo A2VMG Intel Core Ultra 7 258V, Intel Arc Graphics 140V | MSI Prestige 13 AI Evo Intel Core Ultra 7 155H, Intel Arc 8-Core iGPU | Dell XPS 13 9350 Intel Core Ultra 7 256V, Intel Arc Graphics 140V | Framework Laptop 13.5 Core Ultra 7 155H Intel Core Ultra 7 155H, Intel Arc 8-Core iGPU | Lenovo Yoga Book 9 13IMU9 Intel Core Ultra 7 155U, Intel Graphics 4-Core iGPU (Arc) | HP Dragonfly G4 Intel Core i7-1365U, Intel Iris Xe Graphics G7 96EUs | |
|---|---|---|---|---|---|---|
| Heat | 3% | 8% | -6% | -9% | -2% | |
| Maximum Upper Side * | 43.4 | 40.9 6% | 34.8 20% | 42.8 1% | 39.2 10% | 38.6 11% |
| Maximum Bottom * | 42.4 | 40.4 5% | 37.4 12% | 45.2 -7% | 41 3% | 40.4 5% |
| Idle Upper Side * | 25.4 | 25 2% | 25.4 -0% | 27.2 -7% | 32.2 -27% | 28.2 -11% |
| Idle Bottom * | 25.6 | 25.5 -0% | 26.2 -2% | 28.6 -12% | 31.6 -23% | 29 -13% |
* ... im mniej tym lepiej
Test warunków skrajnych
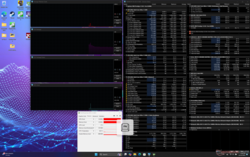
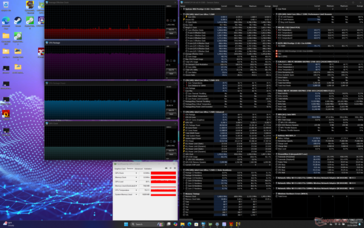
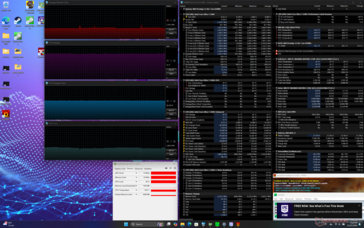
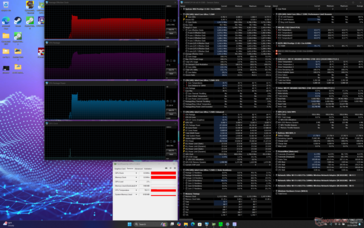
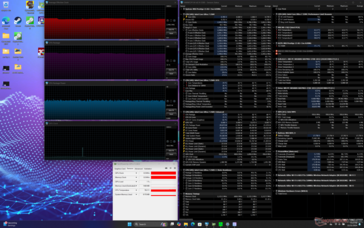
Po uruchomieniu stresu Prime95, procesor zwiększyłby taktowanie do 3,6 GHz, 40 W i 82 C przez około 30 sekund. Po tym czasie taktowanie szybko spadło i ustabilizowało się na poziomie 2,9 GHz i 27 W, aby utrzymać niższą temperaturę rdzenia na poziomie 77 C. Po włączeniu funkcji Cooler Boost, temperatura rdzenia nieznacznie spadła, podczas gdy częstotliwości taktowania pozostały prawie takie same.
W przypadku gier, temperatura rdzenia ustabilizowałaby się na poziomie 75 C w porównaniu do 71 C w Dell XPS 13 z podobnym procesorem Lunar Lake.
| Średnie taktowanie CPU (GHz) | Taktowanie GPU (MHz) | Średnia temperatura CPU (°C) | |
| System bezczynności | -- | 400 | 32 |
| Prime95 Stress (Cooler Boost wyłączony) | 2.9 | -- | 77 |
| Prime95 Stress (Cooler Boost włączony) | 3.0 | -- | 75 |
| Prime95 + FurMark Stress | 1.6 | 1800 | 76 |
| Cyberpunk 2077 Stress | 1.5 | 1950 | 75 |
MSI Prestige 13 AI Plus Evo A2VMG analiza dźwięku
(+) | głośniki mogą odtwarzać stosunkowo głośno (84.5 dB)
Bas 100 - 315 Hz
(-) | prawie brak basu - średnio 19.4% niższa od mediany
(±) | liniowość basu jest średnia (9.6% delta do poprzedniej częstotliwości)
Średnie 400 - 2000 Hz
(±) | wyższe średnie - średnio 6.4% wyższe niż mediana
(+) | średnie są liniowe (5.1% delta do poprzedniej częstotliwości)
Wysokie 2–16 kHz
(±) | wyższe maksima - średnio 6.1% wyższe od mediany
(+) | wzloty są liniowe (4.6% delta do poprzedniej częstotliwości)
Ogólnie 100 - 16.000 Hz
(±) | liniowość ogólnego dźwięku jest średnia (18.2% różnicy w stosunku do mediany)
W porównaniu do tej samej klasy
» 51% wszystkich testowanych urządzeń w tej klasie było lepszych, 7% podobnych, 43% gorszych
» Najlepszy miał deltę 5%, średnia wynosiła ###średnia###%, najgorsza wynosiła 53%
W porównaniu do wszystkich testowanych urządzeń
» 36% wszystkich testowanych urządzeń było lepszych, 8% podobnych, 56% gorszych
» Najlepszy miał deltę 4%, średnia wynosiła ###średnia###%, najgorsza wynosiła 134%
Apple MacBook Pro 16 2021 M1 Pro analiza dźwięku
(+) | głośniki mogą odtwarzać stosunkowo głośno (84.7 dB)
Bas 100 - 315 Hz
(+) | dobry bas - tylko 3.8% od mediany
(+) | bas jest liniowy (5.2% delta do poprzedniej częstotliwości)
Średnie 400 - 2000 Hz
(+) | zbalansowane środki średnie - tylko 1.3% od mediany
(+) | średnie są liniowe (2.1% delta do poprzedniej częstotliwości)
Wysokie 2–16 kHz
(+) | zrównoważone maksima - tylko 1.9% od mediany
(+) | wzloty są liniowe (2.7% delta do poprzedniej częstotliwości)
Ogólnie 100 - 16.000 Hz
(+) | ogólny dźwięk jest liniowy (4.6% różnicy w stosunku do mediany)
W porównaniu do tej samej klasy
» 0% wszystkich testowanych urządzeń w tej klasie było lepszych, 0% podobnych, 100% gorszych
» Najlepszy miał deltę 5%, średnia wynosiła ###średnia###%, najgorsza wynosiła 45%
W porównaniu do wszystkich testowanych urządzeń
» 0% wszystkich testowanych urządzeń było lepszych, 0% podobnych, 100% gorszych
» Najlepszy miał deltę 4%, średnia wynosiła ###średnia###%, najgorsza wynosiła 134%
Zarządzanie energią
Zużycie energii
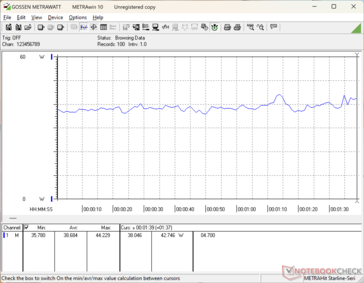
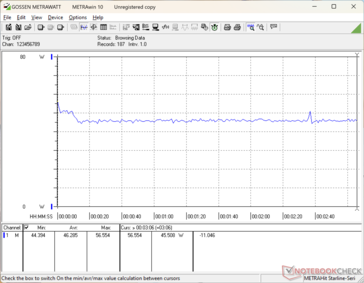
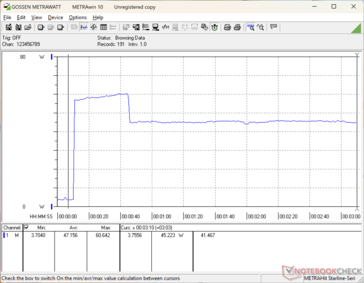
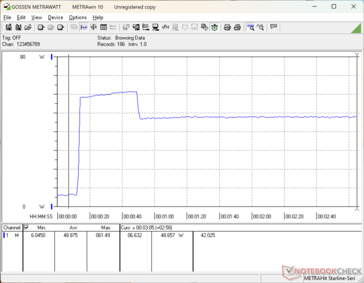
System staje się bardziej wymagający niż konfiguracja Core Ultra 7 155H podczas wykonywania zadań obciążających procesor przez dłuższy czas, ponieważ nie dławi się tak mocno. Zużycie energii jest również wyższe o około 50 procent podczas grania, co jest zgodne ze znacznie szybszą wydajnością grafiki.
| wyłączony / stan wstrzymania | |
| luz | |
| obciążenie |
|
Legenda:
min: | |
| MSI Prestige 13 AI Plus Evo A2VMG Core Ultra 7 258V, Arc 140V, , OLED, 2880x1800, 13.3" | MSI Prestige 13 AI Evo Ultra 7 155H, Arc 8-Core, Samsung PM9A1 MZVL21T0HCLR, OLED, 2880x1800, 13.3" | Dell XPS 13 9350 Core Ultra 7 256V, Arc 140V, Micron 2550 512GB, IPS, 1920x1200, 13.4" | Framework Laptop 13.5 Core Ultra 7 155H Ultra 7 155H, Arc 8-Core, , IPS, 2880x1920, 13.5" | Lenovo Yoga Book 9 13IMU9 Ultra 7 155U, Graphics 4-Core, , OLED, 2880x1800, 13.3" | HP Dragonfly G4 i7-1365U, Iris Xe G7 96EUs, Micron 3400 MTFDKBA512TFH 512GB, IPS, 1920x1280, 13.5" | |
|---|---|---|---|---|---|---|
| Power Consumption | -10% | 27% | 4% | -56% | -5% | |
| Idle Minimum * | 3.5 | 4.5 -29% | 1.3 63% | 2.5 29% | 7.1 -103% | 4.1 -17% |
| Idle Average * | 5.9 | 8 -36% | 2.5 58% | 5.2 12% | 9.1 -54% | 7.5 -27% |
| Idle Maximum * | 10 | 8.7 13% | 4.1 59% | 5.8 42% | 18.4 -84% | 8.2 18% |
| Load Average * | 38.7 | 36.1 7% | 40.1 -4% | 47.5 -23% | 51.3 -33% | 35.5 8% |
| Cyberpunk 2077 ultra external monitor * | 45.6 | 43.1 5% | 52.4 -15% | |||
| Cyberpunk 2077 ultra * | 46.3 | 46.1 -0% | 54.5 -18% | |||
| Load Maximum * | 61.5 | 65 -6% | 57.3 7% | 61.5 -0% | 65.5 -7% | 66.5 -8% |
| Witcher 3 ultra * | 29.7 | 41.5 | 37.5 |
* ... im mniej tym lepiej
Power Consumption Cyberpunk / Stress Test
Power Consumption external Monitor
Żywotność baterii
Dzięki wydajniejszemu procesorowi Lunar Lake, czas pracy jest o prawie dwie godziny dłuższy niż w przypadku konfiguracji Core Ultra 7 155H.
| MSI Prestige 13 AI Plus Evo A2VMG Core Ultra 7 258V, Arc 140V, 75 Wh | MSI Prestige 13 AI Evo Ultra 7 155H, Arc 8-Core, 75 Wh | Dell XPS 13 9350 Core Ultra 7 256V, Arc 140V, 55 Wh | Framework Laptop 13.5 Core Ultra 7 155H Ultra 7 155H, Arc 8-Core, 61 Wh | Lenovo Yoga Book 9 13IMU9 Ultra 7 155U, Graphics 4-Core, 80 Wh | HP Dragonfly G4 i7-1365U, Iris Xe G7 96EUs, 68 Wh | |
|---|---|---|---|---|---|---|
| Czasy pracy | -14% | 54% | -22% | -24% | 19% | |
| WiFi v1.3 | 804 | 694 -14% | 1236 54% | 630 -22% | 608 -24% | 954 19% |
| H.264 | 1002 | |||||
| Load | 169 | 142 | 90 | 192 | ||
| Reader / Idle | 3407 | 2296 | 2550 |
Ocena Notebookcheck
MSI Prestige 13 AI Plus Evo A2VMG
- 26/11/2024 v8
Allen Ngo
Przezroczystość
Wyboru urządzeń do recenzji dokonuje nasza redakcja. Próbka testowa została udostępniona autorowi jako pożyczka od producenta lub sprzedawcy detalicznego na potrzeby tej recenzji. Pożyczkodawca nie miał wpływu na tę recenzję, producent nie otrzymał też kopii tej recenzji przed publikacją. Nie było obowiązku publikowania tej recenzji. Nigdy nie przyjmujemy rekompensaty ani płatności w zamian za nasze recenzje. Jako niezależna firma medialna, Notebookcheck nie podlega władzy producentów, sprzedawców detalicznych ani wydawców.
Tak testuje Notebookcheck
Każdego roku Notebookcheck niezależnie sprawdza setki laptopów i smartfonów, stosując standardowe procedury, aby zapewnić porównywalność wszystkich wyników. Od około 20 lat stale rozwijamy nasze metody badawcze, ustanawiając przy tym standardy branżowe. W naszych laboratoriach testowych doświadczeni technicy i redaktorzy korzystają z wysokiej jakości sprzętu pomiarowego. Testy te obejmują wieloetapowy proces walidacji. Nasz kompleksowy system ocen opiera się na setkach uzasadnionych pomiarów i benchmarków, co pozwala zachować obiektywizm.












 Total Sustainability Score:


