Notebookcheck Logo
Teaser

Recenzja Acer Nitro V 16 ANV16-41: Niedrogi laptop do gier z zaczepem

Potrzebują Państwo Nitro?

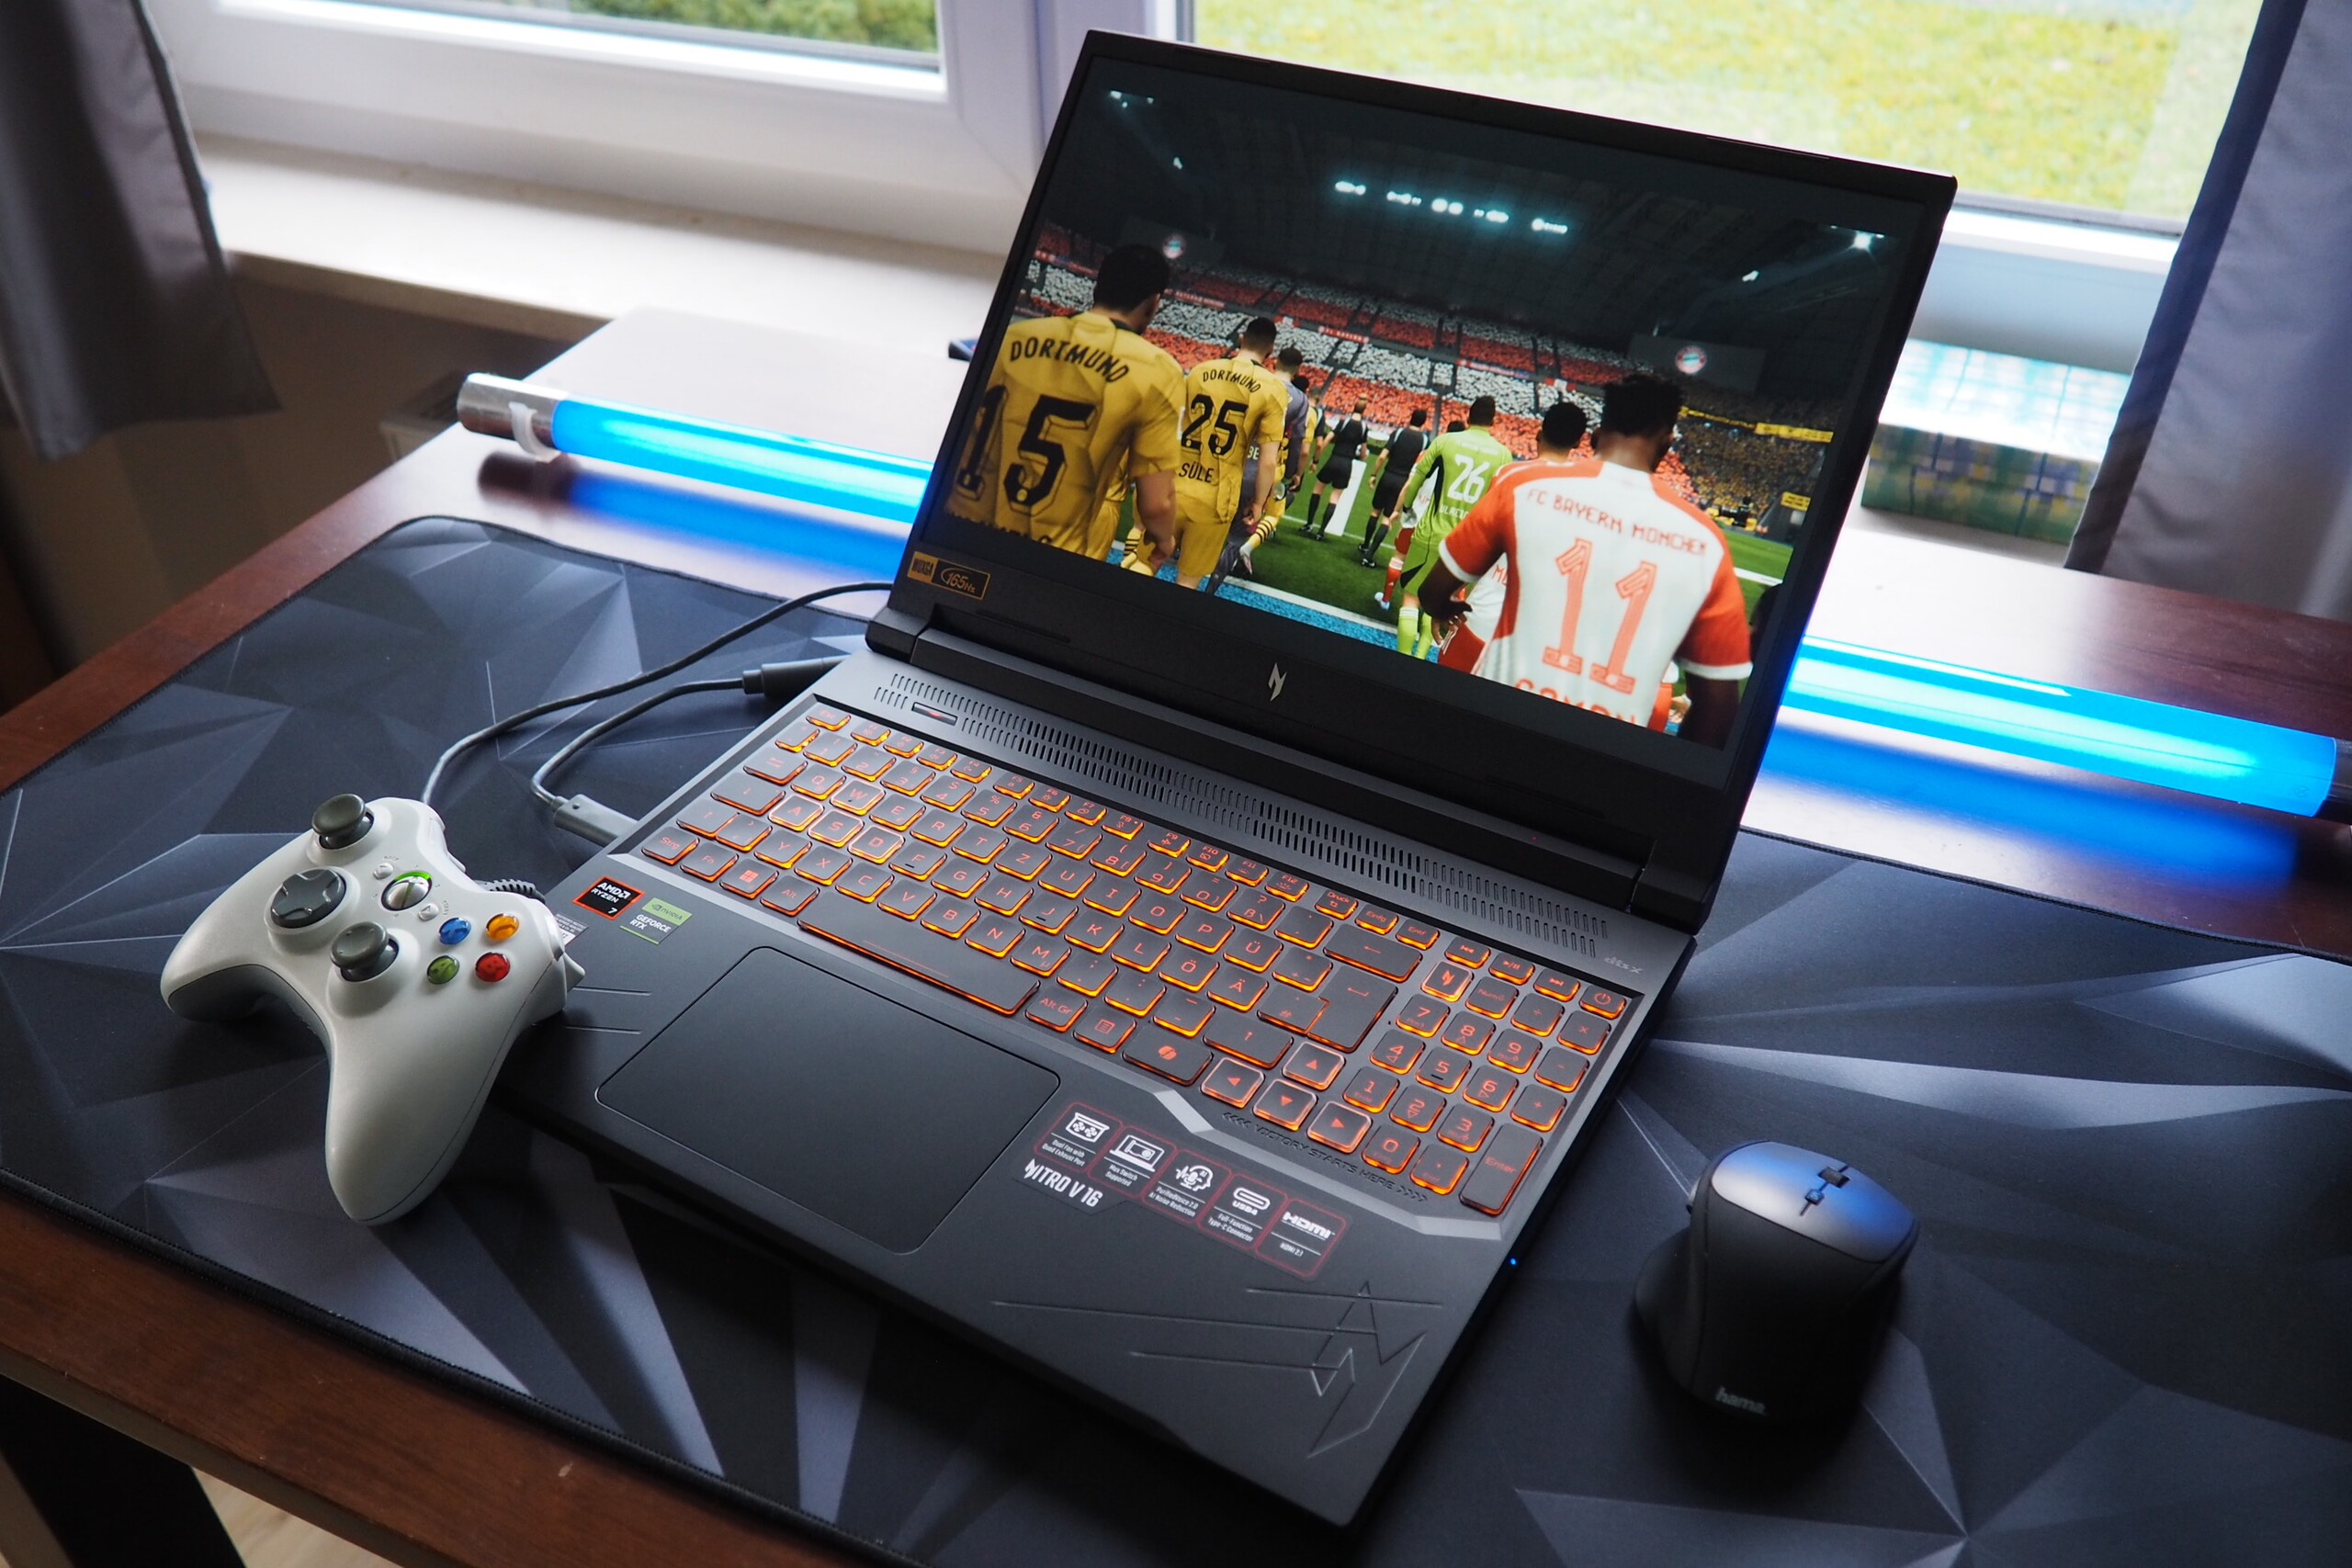
Nitro V16 to gamingowy laptop w okolicach 1000 dolarów, który oferuje więcej niż przyzwoitą wydajność w swojej cenie (Ryzen 8000 i RTX 4060). Tutaj dowiedzą się Państwo, czy 16-calowe urządzenie poradziło sobie równie dobrze we wszystkich innych kategoriach. Po pierwsze: Acer niestety zawiódł w jednym ważnym aspekcie.
Florian Glaser, 👁 Florian Glaser (tłumaczenie DeepL / Ninh Duy) Published 🇺🇸 🇩🇪 ...
Ryzen (Zen) AMD Radeon Nvidia Geforce Gaming Laptop / Notebook

Werdykt - Acer zaniedbał jakość obrazu

To, czy laptop zasługuje na naszą rekomendację, często zależy od jednego punktu. Na papierze, Nitro V 16 ANV16-41 robi bardzo dobre wrażenie. Procesory AMD Ryzen generacji 8000 znane są z dobrego stosunku mocy do prędkości. Podobnie jest z kartą GeForce RTX 4060 od Nvidii, która została zainstalowana w naszej konfiguracji testowej. 16 GB pamięci RAM DDR5 i dysk SSD o pojemności 1 TB to również (wciąż) odpowiednie parametry w segmencie cenowym wynoszącym nieco ponad 1000 dolarów.

Jego ekran IPS ma popularne obecnie proporcje 16:10, częstotliwość odświeżania 165 Hz i rozdzielczość 1920 x 1200 pikseli. Jednak na pierwszy rzut oka nie zdają sobie Państwo sprawy, że Acer wybrał raczej gorszy wyświetlacz, co wyjaśnimy bardziej szczegółowo wkrótce. Podsumowując, w szczególności brakuje pokrycia przestrzeni kolorów, przez co treści wydają się raczej blade i matowe. W innych dziedzinach wystarczyło to tylko do osiągnięcia przeciętnych wyników - czy to urządzeń wejściowych, głośników, kamery internetowej czy pojemności baterii. W międzyczasie zdobył punkty za opcje aktualizacji i konserwacji: Zarówno pamięć RAM (dwa banki RAM), jak i pamięć masową (dwa gniazda M.2) można łatwo wymienić lub rozszerzyć w razie potrzeby.

Ogólnie rzecz biorąc, nadal trudno jest polecić Nitro V 16, patrząc na niektórych jego konkurentów. W podobnej lub nieco wyższej cenie dostępne są laptopy do gier ze znacznie lepszymi wyświetlaczami, takie jak Lenovo Legion 5 16IRX G9, który ma Core i7-14650HX i RTX 4060. Wymieniliśmy również HP Victus 16, Nubia RedMagic Titan 16 i Asus ROG Zephyrus G16 - wszystkie 16-calowe modele - jako kolejnych przeciwników w naszym teście.

Za

+ solidny stosunek ceny do wydajności
+ umiarkowane zużycie energii
+ Możliwość wymiany pamięci RAM
+ dwa gniazda M.2
+ USB 4

Przeciw

- obudowa jest trochę chwiejna i nie sprawia wrażenia wysokiej jakości
- słaba kontrola wentylatora, zbyt głośny pod obciążeniem
- rozczarowujący wyświetlacz (szczególnie pod względem pokrycia przestrzeni kolorów)
- skromna pojemność baterii
- brak czytnika kart pamięci
- słaba kamera internetowa

Cena i dostępność

W chwili pisania tego tekstu, Acer Nitro V 16 ANV16-41-R5AT można nabyć za pośrednictwem sklepów internetowych, takich jak Amazon, gdzie kosztuje on obecnie 959 USD.

Porównanie możliwych alternatyw

Image
Model / Review
Price
Weight
Height
Display
1.
76.3%
Acer Nitro V 16 ANV16-41-R5AT
AMD Ryzen 7 8845HS ⎘
NVIDIA GeForce RTX 4060 Laptop GPU ⎘
16 GB Pamięć, 1024 GB SSD
List Price: 1100 EUR2.5 kg25.5 mm16.00"
1920x1200
142 PPI
IPS
2.
89.1% v7 (old)
Lenovo Legion 5 16IRX G9
Intel Core i7-14650HX ⎘
NVIDIA GeForce RTX 4060 Laptop GPU ⎘
16 GB Pamięć, 1024 GB SSD
List Price: 1599€2.4 kg25.2 mm16.00"
2560x1600
189 PPI
IPS
3.
84.3% v7 (old)
HP Victus 16 (2024)
HP Victus 16 (2024)
Intel Core i7-14700HX ⎘
NVIDIA GeForce RTX 4060 Laptop GPU ⎘
16 GB Pamięć, 512 GB SSD
Amazon: $1,549.00
List Price: 1499 Euro
2.4 kg23.9 mm16.10"
1920x1080
137 PPI
IPS
4.
81.2%
Nubia RedMagic Titan 16 Pro
Intel Core i9-14900HX ⎘
NVIDIA GeForce RTX 4060 Laptop GPU ⎘
16 GB Pamięć, 1024 GB SSD
Amazon:
1. $62.99
atFoliX Screen Protector com...
2. $62.19
atFoliX Screen Protection Fi...
3. $59.69
atFoliX Plastic Glass Protec...
List Price: 1759 Euro
2.4 kg23.9 mm16.00"
2560x1600
189 PPI
IPS
5.
85.9%
Asus ROG Zephyrus G16 GA605WV
AMD Ryzen AI 9 HX 370 ⎘
NVIDIA GeForce RTX 4060 Laptop GPU ⎘
32 GB Pamięć, 1024 GB SSD
Amazon: $2,199.00
List Price: 2599€
1.8 kg17.2 mm16.00"
2560x1600
189 PPI
OLED

Nitro V 16 jest dostępny w kilku wariantach. W zależności od konfiguracji, posiada on Ryzen 5 8645HS lub Ryzen 7 8845HS wewnątrz. Pamięć RAM wynosi od 16 do 32 GB, a dysk SSD NVMe ma pojemność 1 TB we wszystkich przypadkach. Albo GeForce RTX 4050 lub RTX 4060 zajmuje się przetwarzaniem obrazu. Ceny tych modeli mieszczą się w przedziale od 1000 do 1400 dolarów.

Specyfikacje

Acer Nitro V 16 ANV16-41-R5AT
Procesor
AMD Ryzen 7 8845HS 8 x 3.8 - 5.1 GHz, 65 W PL2 / Short Burst, 54 W PL1 / Sustained, Hawk Point-HS (Zen 4)
Karta grafiki
NVIDIA GeForce RTX 4060 Laptop GPU - 8 GB VRAM, rdzeń: 1890 MHz, pamięć: 2000 MHz, 85 W TDP, GDDR6, ForceWare 566.14, Optimus
Pamięć
16 GB 
, 2x 8 GB SO-DIMM DDR5-5600, two slots (both in use)
Matryca
16.00 cali 16:10, 1920 x 1200 pikseli 142 PPI, AUO B160UAN05.B (AUOD8B1), IPS, refleksująca: nie, 165 Hz
Chipset
AMD Promontory/Bixby FCH
Dysk twardy
Micron 2550 1TB, 1024 GB 
, NVMe-SSD, two M.2-slots (one empty)
Karta dźwiękowa
Realtek ALC245 @ AMD K19.7 - Audio Processor - High Definition Audio Controller
Złącza
2 USB 3.1 Gen2, 1 USB 4.0 40 Gbps, 1 Thunderbolt, USB-C Power Delivery (PD), 1 HDMI, 1 DisplayPort, 1 blokada Kensingtona, gniazda audio: Combined (Headset/Mic)
Łączność
Realtek PCIe GBE Family Controller (10/100/1000MBit/s), MediaTek RZ616 (a/b/g/n = Wi-Fi 4/ac = Wi-Fi 5/ax = Wi-Fi 6/ Wi-Fi 6E 6 GHz), Bluetooth 5.3
Gabaryty
wysokość x szerokość x głębokość (mm): 25.5 x 362 x 278
Akumulator
57 Wh litowo-jonowy
System operacyjny
Microsoft Windows 11 Home
Camera
kamerka: 0.9 MP
Inne
głośniki: 2.0, klawiatura: Chiclet, podświetlanie klawiatury: tak, 135 W Power Supply, NitroSense, 24 miesiące(y) gwarancji
Waga
2.5 kg, zasilacz: 476 g
Cena
1100 EUR
Note: The manufacturer may use components from different suppliers including display panels, drives or memory sticks with similar specifications.


Przypadek

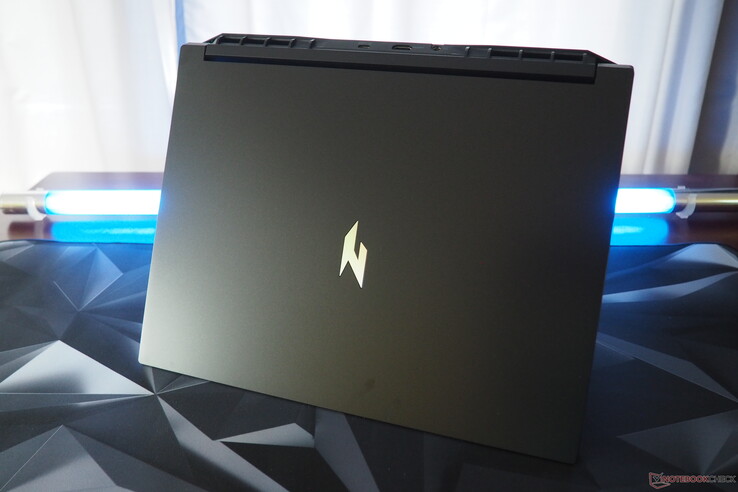
Obudowa Acer Nitro V 16 wykonana jest w całości z tworzywa sztucznego, które na pierwszy rzut oka wygląda schludnie, ale przy bliższym przyjrzeniu się nie sprawia wrażenia wysokiej jakości i ma tendencję do grzechotania tu i ówdzie. Nie mamy jednak nic do zarzucenia pod względem jakości wykonania, która jest bez zarzutu. Jego zawiasy wykonują dobrą robotę, a ekran można łatwo otworzyć jedną ręką (maksymalny kąt ok. 145°). Niestety, powierzchnie laptopa są podatne na zbieranie widocznych odcisków palców, nie tylko ze względu na jego ciemny kolor.

Acer Nitro V 16
Acer Nitro V 16
Acer Nitro V 16
Acer Nitro V 16
Acer Nitro V 16
Acer Nitro V 16

Z wagą 2,5 kg, Nitro V 16 jest najcięższym 16-calowym modelem w porównaniu - choć większość jego konkurentów jest tylko nieznacznie lżejsza. Tylko Zephyrus G16 wyróżnia się wagą 1,8 kg. Obraz wygląda prawie tak samo, jeśli chodzi o wysokość konstrukcji. Mierząc 2,55 cm, urządzenie Acer jest ponownie zgodne z konkurencją, a tylko laptop Asus jest poniżej granicy 2 cm.

Porównanie rozmiarów

369 mm 259.4 mm 23.9 mm 2.4 kg362 mm 278 mm 25.5 mm 2.5 kg359.7 mm 262.3 mm 25.2 mm 2.4 kg358 mm 262 mm 23.9 mm 2.4 kg354 mm 246 mm 17.2 mm 1.8 kg297 mm 210 mm 1 mm 5.7 g

Łączność

Porty

Jeśli pominąć brakujący czytnik kart, wybór portów w laptopie jest całkiem imponujący. Chociaż chcielibyśmy jeszcze jeden port USB-C, istniejący port USB to model w wersji 4 (w tym DisplayPort). Z drugiej strony, dwa porty USB-A wykorzystują standard 3.2 Gen 2. Jest też port HDMI 2.1, port Gigabit LAN, gniazdo audio i otwór na blokady Kensington. Acer umieścił niektóre porty z tyłu urządzenia, co jest korzystne w przypadku korzystania z zewnętrznej myszy (słowo kluczowe: miejsce).

Lewa strona: Kensington Lock, RJ45 Gigabit LAN, USB-A 3.2 Gen 2, audio combo
Tył: zasilacz, HDMI 2.1, USB-C 4 (w tym DisplayPort)
Prawa strona: USB-A 3.2 Gen 2

Komunikacja

Zainstalowany układ MediaTek (RZ616) zapewnił solidną (nadawanie) do bardzo dobrej (odbiór) wydajność podczas naszego testu zasięgu z odległości jednego metra od routera referencyjnego.

Networking
iperf3 transmit AXE11000
Asus ROG Zephyrus G16 GA605WV
Mediatek Wi-Fi 7 MT7925 Wireless LAN Card
1843 (1712min - 1964max) MBit/s +119%
Lenovo Legion 5 16IRX G9
Intel Wi-Fi 6E AX211
1489 (1329min, 1338.28P1 - 1686max) MBit/s +77%
Average of class Gaming
  (469 - 1843, n=148, last 2 years)
1235 MBit/s +47%
Average MediaTek RZ616
  (593 - 1793, n=15)
1171 MBit/s +39%
Nubia RedMagic Titan 16 Pro
Intel Wi-Fi 6E AX211
1058 (543min - 1423max) MBit/s +26%
Acer Nitro V 16 ANV16-41-R5AT
MediaTek RZ616
843 (470min - 976max) MBit/s
HP Victus 16 (2024)
Realtek RTL8852BE
776 (487min - 929max) MBit/s -8%
iperf3 receive AXE11000
Acer Nitro V 16 ANV16-41-R5AT
MediaTek RZ616
1735 (1720min - 1751max) MBit/s
Asus ROG Zephyrus G16 GA605WV
Mediatek Wi-Fi 7 MT7925 Wireless LAN Card
1712 (1678min - 1737max) MBit/s -1%
Nubia RedMagic Titan 16 Pro
Intel Wi-Fi 6E AX211
1658 (1631min - 1690max) MBit/s -4%
Average MediaTek RZ616
  (750 - 1752, n=15)
1514 MBit/s -13%
Lenovo Legion 5 16IRX G9
Intel Wi-Fi 6E AX211
1398 (1327min, 1333.09P1 - 1464max) MBit/s -19%
Average of class Gaming
  (680 - 1890, n=148, last 2 years)
1392 MBit/s -20%
HP Victus 16 (2024)
Realtek RTL8852BE
978 (960min - 990max) MBit/s -44%
05010015020025030035040045050055060065070075080085090095010001050110011501200125013001350140014501500155016001650170017501800185019001950Tooltip
Acer Nitro V 16 ANV16-41-R5AT MediaTek RZ616; iperf3 transmit AXE11000; iperf 3.1.3: Ø843 (470-976)
Lenovo Legion 5 16IRX G9 Intel Wi-Fi 6E AX211; iperf3 transmit AXE11000: Ø1489 (1329-1686)
HP Victus 16 (2024) Realtek RTL8852BE; iperf3 transmit AXE11000; iperf 3.1.3: Ø776 (487-929)
Nubia RedMagic Titan 16 Pro Intel Wi-Fi 6E AX211; iperf3 transmit AXE11000; iperf 3.1.3: Ø1040 (543-1423)
Asus ROG Zephyrus G16 GA605WV Mediatek Wi-Fi 7 MT7925 Wireless LAN Card; iperf3 transmit AXE11000; iperf 3.1.3: Ø1844 (1712-1964)
Acer Nitro V 16 ANV16-41-R5AT MediaTek RZ616; iperf3 receive AXE11000; iperf 3.1.3: Ø1734 (1720-1751)
Lenovo Legion 5 16IRX G9 Intel Wi-Fi 6E AX211; iperf3 receive AXE11000: Ø1398 (1327-1464)
HP Victus 16 (2024) Realtek RTL8852BE; iperf3 receive AXE11000; iperf 3.1.3: Ø978 (960-990)
Nubia RedMagic Titan 16 Pro Intel Wi-Fi 6E AX211; iperf3 receive AXE11000; iperf 3.1.3: Ø1658 (1631-1690)
Asus ROG Zephyrus G16 GA605WV Mediatek Wi-Fi 7 MT7925 Wireless LAN Card; iperf3 receive AXE11000; iperf 3.1.3: Ø1711 (1678-1737)

Kamera internetowa

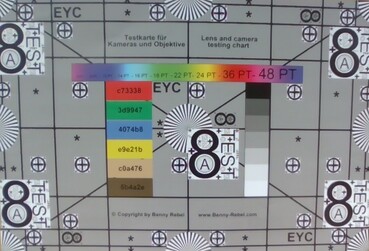
Kupujący mogą oczekiwać jedynie niskiej jakości standardowej kamery internetowej. Model 0,9 MP nie jest ani ostry, ani szczególnie wierny kolorom (proszę zobaczyć zdjęcia).

ColorChecker
15.6 ∆E
15 ∆E
19.5 ∆E
17.3 ∆E
17.9 ∆E
15.9 ∆E
12.5 ∆E
23.9 ∆E
15.4 ∆E
16.2 ∆E
15 ∆E
12 ∆E
18.3 ∆E
17.6 ∆E
15.6 ∆E
9.2 ∆E
18.2 ∆E
22 ∆E
2.3 ∆E
11.8 ∆E
18.2 ∆E
19 ∆E
18 ∆E
6.3 ∆E
ColorChecker Acer Nitro V 16 ANV16-41-R5AT: 15.52 ∆E min: 2.33 - max: 23.87 ∆E

Akcesoria

Acer dostarcza laptopa z kilkoma ulotkami informacyjnymi i półkompaktowym 135-watowym zasilaczem.

Konserwacja

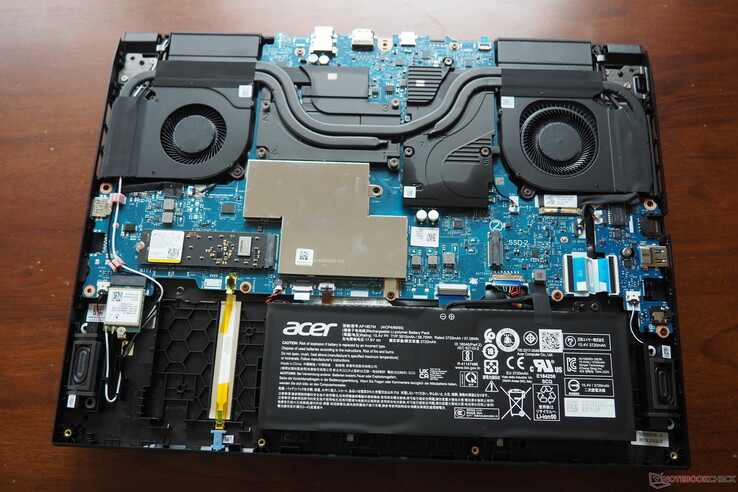
Płyta bazowa jest przymocowana łącznie 11 śrubami krzyżakowymi. Jak wspomnieliśmy na początku, pod maską laptopa znajdują się dwa sloty M.2 (jeden z nich jest pusty) oraz dwa banki pamięci RAM, aczkolwiek są one ukryte za osłoną. Dostępna jest również bateria, moduł WLAN i układ chłodzenia.
Acer Nitro V 16
Acer Nitro V 16
Acer Nitro V 16
Acer Nitro V 16
Acer Nitro V 16
Acer Nitro V 16

Zrównoważony rozwój

Producent do pakowania urządzenia wykorzystuje głównie tekturę. Jedynie zasilacz i sam laptop owinięte są w folię lub rękaw z tworzywa sztucznego.

Gwarancja

Laptop jest objęty standardową 12-miesięczną gwarancją w Stanach Zjednoczonych.

Urządzenia wejściowe

Klawiatura

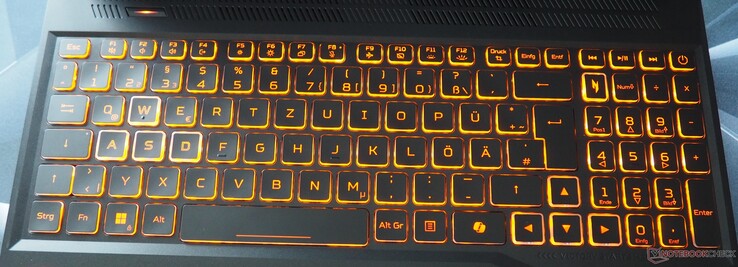
Podobny do Nitro V 15klawiaturę tego modelu określilibyśmy jako przeciętną. Jej nieco gąbczasty charakter pisania prawdopodobnie zadowoli tylko osoby często piszące na klawiaturze w ograniczonym zakresie. Acer zdecydował się na pomarańczowe podświetlenie i napisy jako akcent kolorystyczny. To ostatnie nie jest szczególnie łatwe do zauważenia pod niektórymi kątami. Układ klawiatury ma zarówno dobre, jak i złe strony. Po stronie pozytywów musimy wspomnieć o dużych strzałkach kierunkowych. Z drugiej strony byliśmy mniej zadowoleni z przycisku zasilania, który nie jest oddzielony od reszty klawiszy.

Acer Nitro V 16

Panel dotykowy

Touchpad jest mniej więcej na tym samym poziomie co klawiatura pod względem jakości, co oznacza, że jest użyteczny, ale nie jest prawdziwą atrakcją. Acer mógłby popracować nad jego precyzją i właściwościami ślizgowymi. Obszary kliknięć również brzmią dość chwiejnie, tj. tanio. Jednak jego rozmiar 12,6 x 8,2 cm nie daje powodów do krytyki.

Wyświetlacz

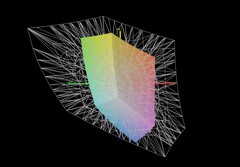
To prowadzi nas do największej słabości Nitro V 16, a mianowicie jego bladego wyświetlacza. 57% pokrycia palety sRGB, 40% pokrycia palety AdobeRGB i 38% pokrycia palety DCI-P3 to dość słaby wynik, który w 2024 roku naprawdę powinien należeć już do przeszłości. Wśród porównywanych urządzeń tak słaby wyświetlacz znajdziemy tylko w HP Victus 16.

307
cd/m²
307
cd/m²
309
cd/m²
307
cd/m²
303
cd/m²
289
cd/m²
303
cd/m²
310
cd/m²
310
cd/m²
podświetlenie ekranu
AUO B160UAN05.B (AUOD8B1) tested with X-Rite i1Pro 2
maksimum: 310 cd/m² (Nits) średnia: 305 cd/m² Minimum: 19 cd/m²
rozświetlenie: 93 %
na akumulatorze: 303 cd/m²
kontrast: 947:1 (czerń: 0.32 cd/m²)
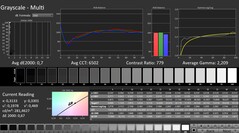
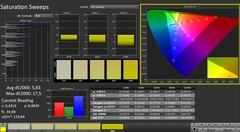
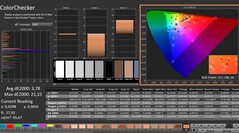
ΔE Color 5.74 | 0.5-29.43 Ø4.91, calibrated: 3.78
ΔE Greyscale 4 | 0.5-98 Ø5.2
39.6% AdobeRGB 1998 (Argyll 2.2.0 3D)
57.4% sRGB (Argyll 2.2.0 3D)
38.3% Display P3 (Argyll 2.2.0 3D)
Gamma: 2.372
Acer Nitro V 16 ANV16-41-R5AT
AUO B160UAN05.B (AUOD8B1), IPS, 1920x1200, 16", 165 Hz
Lenovo Legion 5 16IRX G9
NE160QDM-NZ3, IPS, 2560x1600, 16", 240 Hz
HP Victus 16 (2024)
Chi Mei CMN163E, IPS, 1920x1080, 16.1", 144 Hz
Nubia RedMagic Titan 16 Pro
BOE CQ NE160QDM-NZ2, IPS, 2560x1600, 16", 240 Hz
Asus ROG Zephyrus G16 GA605WV
ATNA60DL04-0, OLED, 2560x1600, 16", 240 Hz
Display
83%
8%
112%
127%
Display P3 Coverage
38.3
72.4
89%
41.3
8%
96.3
151%
99.9
161%
sRGB Coverage
57.4
100
74%
61.7
7%
100
74%
100
74%
AdobeRGB 1998 Coverage
39.6
74.1
87%
42.7
8%
84.1
112%
96.9
145%
Response Times
55%
-2%
80%
99%
Response Time Grey 50% / Grey 80% *
26.5 ?(13.1, 13.4)
12.5 ?(6.1, 6.4)
53%
28.6 ?(13.3, 15.3)
-8%
3.9 ?(1.7, 2.2)
85%
0.22 ?(0.11, 0.11)
99%
Response Time Black / White *
19.6 ?(11.6, 8)
8.7 ?(4.6, 4.1)
56%
18.7 ?(9.6, 9.1)
5%
5 ?(1.2, 3.8)
74%
0.25 ?(0.13, 0.12)
99%
PWM Frequency
960
Screen
56%
9%
31%
45%
Brightness middle
303
526
74%
287
-5%
543
79%
416
37%
Brightness
305
500
64%
288
-6%
516
69%
418
37%
Brightness Distribution
93
87
-6%
86
-8%
86
-8%
96
3%
Black Level *
0.32
0.33
-3%
0.19
41%
0.51
-59%
Contrast
947
1594
68%
1511
60%
1065
12%
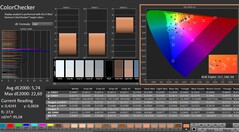
Colorchecker dE 2000 *
5.74
1.2
79%
5.46
5%
3.19
44%
1.6
72%
Colorchecker dE 2000 max. *
22.69
2.1
91%
20.36
10%
7.09
69%
2.1
91%
Colorchecker dE 2000 calibrated *
3.78
1
74%
3.52
7%
0.69
82%
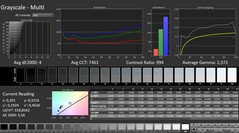
Greyscale dE 2000 *
4
1.3
67%
4.8
-20%
4.2
-5%
2.7
32%
Gamma
2.372 93%
2.23 99%
2.108 104%
1.999 110%
2.16 102%
CCT
7461 87%
6391 102%
6442 101%
7431 87%
6331 103%
Total Average (Program / Settings)
65% / 62%
5% / 7%
74% / 56%
90% / 77%

* ... im mniej tym lepiej

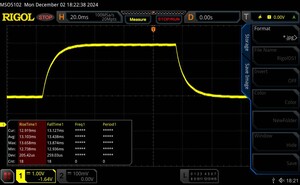
Jego czas reakcji również spełnia wymagania multimediów i gier tylko w ograniczonym zakresie, z około 20 ms dla czerni do bieli i 27 ms dla szarości do szarości. Większość konkurentów wypada pod tym względem lepiej.

CalMAN: skala szarości
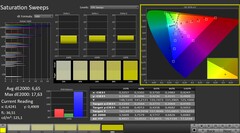
CalMAN: nasycenie kolorów
CalMAN: ColorChecker
CalMAN: skala szarości (skalibrowana)
CalMAN: nasycenie kolorów (skalibrowane)
CalMAN: ColorChecker (skalibrowany)

Fani spędzający czas na świeżym powietrzu również nie będą zadowoleni. Średnia na poziomie 303 cd/m² jest raczej przeznaczona do użytku w pomieszczeniach.

Acer Nitro V 16 vs sRGB
Acer Nitro V 16 vs AdobeRGB
Acer Nitro V 16 vs DCI-P3

Według standardów IPS, poziom czerni (0,32 cd/m²) i kontrast (947:1) są w porządku, ale Nitro V 16 nie ma szans z panelami OLED. Stabilność kąta widzenia ekranu jest podobna. Z drugiej strony, 16-calowy panel radzi sobie bez migotania obrazu na wszystkich poziomach jasności.

Światło dzienne
Światło dzienne
Subpiksele
Subpiksele
Kąty widzenia
Kąty widzenia

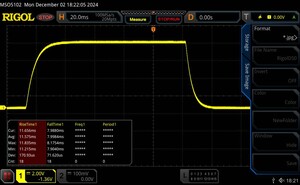
Display Response Times

Display response times show how fast the screen is able to change from one color to the next. Slow response times can lead to afterimages and can cause moving objects to appear blurry (ghosting). Gamers of fast-paced 3D titles should pay special attention to fast response times.
       Response Time Black to White
19.6 ms ... rise ↗ and fall ↘ combined↗ 11.6 ms rise
↘ 8 ms fall
The screen shows good response rates in our tests, but may be too slow for competitive gamers.
In comparison, all tested devices range from 0.1 (minimum) to 240 (maximum) ms. » 39 % of all devices are better.
This means that the measured response time is similar to the average of all tested devices (20.9 ms).
       Response Time 50% Grey to 80% Grey
26.5 ms ... rise ↗ and fall ↘ combined↗ 13.1 ms rise
↘ 13.4 ms fall
The screen shows relatively slow response rates in our tests and may be too slow for gamers.
In comparison, all tested devices range from 0.165 (minimum) to 636 (maximum) ms. » 33 % of all devices are better.
This means that the measured response time is better than the average of all tested devices (32.8 ms).

Screen Flickering / PWM (Pulse-Width Modulation)

To dim the screen, some notebooks will simply cycle the backlight on and off in rapid succession - a method called Pulse Width Modulation (PWM) . This cycling frequency should ideally be undetectable to the human eye. If said frequency is too low, users with sensitive eyes may experience strain or headaches or even notice the flickering altogether.
Screen flickering / PWM not detected

In comparison: 53 % of all tested devices do not use PWM to dim the display. If PWM was detected, an average of 8705 (minimum: 5 - maximum: 343500) Hz was measured.

100 % jasności
100 % jasności
75 % jasności
75 % jasności
50 % jasności
50 % jasności
25 % jasności
25 % jasności
0 % jasności
0 % jasności

Wydajność

Niezależnie od zainstalowanego GPU (RTX 4050 lub RTX 4060), Nitro V 16 plasuje się gdzieś w średnim przedziale laptopów gamingowych. Procesor Ryzen (8645HS lub 8845HS) powinien generalnie mieć wystarczające rezerwy na najbliższe lata.

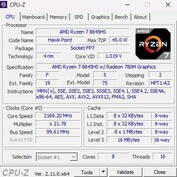
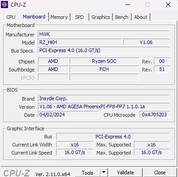
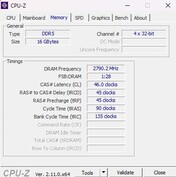
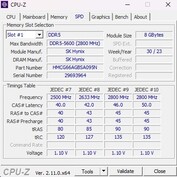
CPU-Z
CPU-Z
CPU-Z
CPU-Z
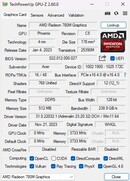
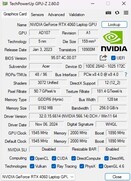
GPU-Z
GPU-Z
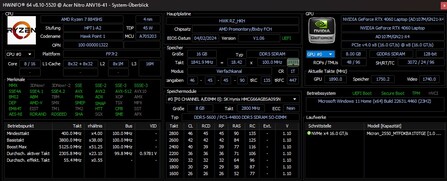
HWiNFO
 

Warunki testowania

Można przełączać się między różnymi profilami za pomocą specjalnego przycisku (lub w oprogramowaniu NitroSense). Te wahają się od Eco do Turbo, ale według naszych pomiarów różnią się bardzo nieznacznie, jeśli chodzi o wydajność i emisję hałasu. W naszym teście korzystaliśmy z trybu Performance. Tylko czas pracy laptopa na baterii został zmierzony przy użyciu profilu Balanced.

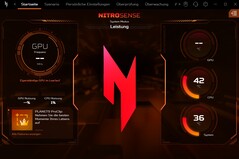
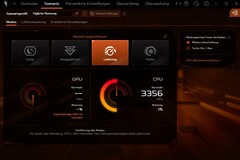
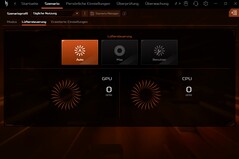
NitroSense
NitroSense
NitroSense
Cyberpunk 2077 Sekwencja pętli (FHD/Ultra) Cichy Zrównoważony Wydajność Turbo
Hałas 52 dB(A) 53 dB(A) 54 dB(A) 55 dB(A)
Wydajność 59 fps 63 fps 64 fps 68 fps
CPU PL1 (HWiNFO) 45 W 45 W 54 W 54 W
CPU PL2 (HWiNFO) 65 watów 65 watów 65 watów 65 watów

Procesor

Ryzen 7 8845HS to ośmiordzeniowy model z generacji Zen 4, który może przetwarzać do 16 wątków równolegle za pośrednictwem SMT i zawiera dość szybkie iGPU w postaci Radeon 780M. Podczas testów porównawczych i pętli Cinebench układ 4 nm był mniej więcej na równi z Intel Core i7-14700HX. Jednak 8845HS nie miał szans w starciu z nowszym Ryzen AI 9 HX 370.

Cinebench R15 Multi continuous test

019539058578097511701365156017551950214523402535273029253120331535103705Tooltip
Acer Nitro V 16 ANV16-41-R5AT AMD Ryzen 7 8845HS: Ø2572 (2557.38-2602.64)
Lenovo Legion 5 16IRX G9 Intel Core i7-14650HX: Ø3471 (3409.19-3799.39)
HP Victus 16 (2024) Intel Core i7-14700HX: Ø2658 (2509.88-3812.18)
Nubia RedMagic Titan 16 Pro Intel Core i9-14900HX: Ø2240 (2071.36-3453.93)
Asus ROG Zephyrus G16 GA605WV AMD Ryzen AI 9 HX 370: Ø3338 (3327.79-3370.98)
CPU Performance Rating - Percent
Lenovo Legion 5 16IRX G9
Intel Core i7-14650HX
81.9 pt
Asus ROG Zephyrus G16 GA605WV
AMD Ryzen AI 9 HX 370
78.4 pt
Nubia RedMagic Titan 16 Pro
Intel Core i9-14900HX
74.7 pt
Average of class Gaming
 
74.6 pt
HP Victus 16 (2024)
Intel Core i7-14700HX
71.7 pt
Acer Nitro V 16 ANV16-41-R5AT
AMD Ryzen 7 8845HS
65.3 pt
Average AMD Ryzen 7 8845HS
 
64.4 pt
Cinebench R23
Multi Core
Lenovo Legion 5 16IRX G9
Intel Core i7-14650HX
24455 Points +48%
HP Victus 16 (2024)
Intel Core i7-14700HX
23887 Points +45%
Asus ROG Zephyrus G16 GA605WV
AMD Ryzen AI 9 HX 370
22724 Points +38%
Average of class Gaming
  (5668 - 36249, n=189, last 2 years)
21812 Points +32%
Nubia RedMagic Titan 16 Pro
Intel Core i9-14900HX
17078 Points +3%
Acer Nitro V 16 ANV16-41-R5AT
AMD Ryzen 7 8845HS
16501 Points
Average AMD Ryzen 7 8845HS
  (14895 - 18037, n=11)
16146 Points -2%
Single Core
Nubia RedMagic Titan 16 Pro
Intel Core i9-14900HX
2165 Points +23%
Asus ROG Zephyrus G16 GA605WV
AMD Ryzen AI 9 HX 370
1973 Points +12%
Lenovo Legion 5 16IRX G9
Intel Core i7-14650HX
1963 Points +11%
Average of class Gaming
  (1136 - 2235, n=187, last 2 years)
1887 Points +7%
Acer Nitro V 16 ANV16-41-R5AT
AMD Ryzen 7 8845HS
1762 Points
Average AMD Ryzen 7 8845HS
  (1623 - 1783, n=11)
1747 Points -1%
HP Victus 16 (2024)
Intel Core i7-14700HX
1702 Points -3%
Cinebench R20
CPU (Multi Core)
Lenovo Legion 5 16IRX G9
Intel Core i7-14650HX
9349 Points +47%
HP Victus 16 (2024)
Intel Core i7-14700HX
9244 Points +45%
Asus ROG Zephyrus G16 GA605WV
AMD Ryzen AI 9 HX 370
8843 Points +39%
Average of class Gaming
  (2179 - 13832, n=187, last 2 years)
8300 Points +30%
Nubia RedMagic Titan 16 Pro
Intel Core i9-14900HX
6579 Points +3%
Acer Nitro V 16 ANV16-41-R5AT
AMD Ryzen 7 8845HS
6362 Points
Average AMD Ryzen 7 8845HS
  (5808 - 7026, n=11)
6309 Points -1%
CPU (Single Core)
Nubia RedMagic Titan 16 Pro
Intel Core i9-14900HX
826 Points +21%
Asus ROG Zephyrus G16 GA605WV
AMD Ryzen AI 9 HX 370
777 Points +13%
Lenovo Legion 5 16IRX G9
Intel Core i7-14650HX
754 Points +10%
Average of class Gaming
  (439 - 856, n=187, last 2 years)
725 Points +6%
Acer Nitro V 16 ANV16-41-R5AT
AMD Ryzen 7 8845HS
685 Points
Average AMD Ryzen 7 8845HS
  (673 - 698, n=11)
685 Points 0%
HP Victus 16 (2024)
Intel Core i7-14700HX
651 Points -5%
Cinebench R15
CPU Multi 64Bit
HP Victus 16 (2024)
Intel Core i7-14700HX
3812 Points +46%
Lenovo Legion 5 16IRX G9
Intel Core i7-14650HX
3799 (3409.19min - 3799.39max) Points +46%
Nubia RedMagic Titan 16 Pro
Intel Core i9-14900HX
3454 Points +33%
Average of class Gaming
  (905 - 5663, n=194, last 2 years)
3417 Points +31%
Asus ROG Zephyrus G16 GA605WV
AMD Ryzen AI 9 HX 370
3371 (3327.79min - 3370.98max) Points +30%
Acer Nitro V 16 ANV16-41-R5AT
AMD Ryzen 7 8845HS
2603 (2557.38min - 2602.64max) Points
Average AMD Ryzen 7 8845HS
  (2342 - 2908, n=11)
2556 Points -2%
CPU Single 64Bit
Nubia RedMagic Titan 16 Pro
Intel Core i9-14900HX
314 Points +14%
Asus ROG Zephyrus G16 GA605WV
AMD Ryzen AI 9 HX 370
303 Points +10%
Lenovo Legion 5 16IRX G9
Intel Core i7-14650HX
287 Points +4%
Average of class Gaming
  (191.9 - 318, n=191, last 2 years)
278 Points +1%
Average AMD Ryzen 7 8845HS
  (269 - 283, n=11)
276 Points 0%
Acer Nitro V 16 ANV16-41-R5AT
AMD Ryzen 7 8845HS
275 Points
HP Victus 16 (2024)
Intel Core i7-14700HX
238 Points -13%
Blender - v2.79 BMW27 CPU
Nubia RedMagic Titan 16 Pro
Intel Core i9-14900HX
206 Seconds * -7%
Average AMD Ryzen 7 8845HS
  (179 - 216, n=11)
202 Seconds * -5%
Acer Nitro V 16 ANV16-41-R5AT
AMD Ryzen 7 8845HS
193 Seconds *
HP Victus 16 (2024)
Intel Core i7-14700HX
173 Seconds * +10%
Average of class Gaming
  (87 - 555, n=182, last 2 years)
170.8 Seconds * +12%
Asus ROG Zephyrus G16 GA605WV
AMD Ryzen AI 9 HX 370
145 Seconds * +25%
Lenovo Legion 5 16IRX G9
Intel Core i7-14650HX
141 Seconds * +27%
7-Zip 18.03
7z b 4
Lenovo Legion 5 16IRX G9
Intel Core i7-14650HX
93686 MIPS +33%
Average of class Gaming
  (23795 - 140932, n=186, last 2 years)
85207 MIPS +21%
HP Victus 16 (2024)
Intel Core i7-14700HX
84799 MIPS +21%
Asus ROG Zephyrus G16 GA605WV
AMD Ryzen AI 9 HX 370
82463 MIPS +17%
Acer Nitro V 16 ANV16-41-R5AT
AMD Ryzen 7 8845HS
70193 MIPS
Average AMD Ryzen 7 8845HS
  (62669 - 74664, n=11)
67906 MIPS -3%
Nubia RedMagic Titan 16 Pro
Intel Core i9-14900HX
66769 MIPS -5%
7z b 4 -mmt1
Nubia RedMagic Titan 16 Pro
Intel Core i9-14900HX
7161 MIPS +8%
Lenovo Legion 5 16IRX G9
Intel Core i7-14650HX
6695 MIPS +1%
Acer Nitro V 16 ANV16-41-R5AT
AMD Ryzen 7 8845HS
6608 MIPS
Average of class Gaming
  (4199 - 7581, n=186, last 2 years)
6305 MIPS -5%
Average AMD Ryzen 7 8845HS
  (5197 - 6714, n=11)
6288 MIPS -5%
Asus ROG Zephyrus G16 GA605WV
AMD Ryzen AI 9 HX 370
6127 MIPS -7%
HP Victus 16 (2024)
Intel Core i7-14700HX
5641 MIPS -15%
Geekbench 6.3
Multi-Core
Lenovo Legion 5 16IRX G9
Intel Core i7-14650HX
16010 Points +30%
Asus ROG Zephyrus G16 GA605WV
AMD Ryzen AI 9 HX 370
15230 Points +24%
HP Victus 16 (2024)
Intel Core i7-14700HX
14807 Points +21%
Average of class Gaming
  (5340 - 19665, n=110, last 2 years)
14195 Points +16%
Nubia RedMagic Titan 16 Pro
Intel Core i9-14900HX
13158 Points +7%
Average AMD Ryzen 7 8845HS
  (11073 - 14014, n=15)
12791 Points +4%
Acer Nitro V 16 ANV16-41-R5AT
AMD Ryzen 7 8845HS
12277 Points
Single-Core
Nubia RedMagic Titan 16 Pro
Intel Core i9-14900HX
3036 Points +14%
Asus ROG Zephyrus G16 GA605WV
AMD Ryzen AI 9 HX 370
2875 Points +8%
Lenovo Legion 5 16IRX G9
Intel Core i7-14650HX
2761 Points +4%
Acer Nitro V 16 ANV16-41-R5AT
AMD Ryzen 7 8845HS
2654 Points
Average of class Gaming
  (1490 - 3129, n=110, last 2 years)
2650 Points 0%
Average AMD Ryzen 7 8845HS
  (2510 - 2698, n=13)
2617 Points -1%
HP Victus 16 (2024)
Intel Core i7-14700HX
2378 Points -10%
Geekbench 5.5
Multi-Core
Lenovo Legion 5 16IRX G9
Intel Core i7-14650HX
16810 Points +46%
HP Victus 16 (2024)
Intel Core i7-14700HX
16732 Points +45%
Average of class Gaming
  (4557 - 23194, n=187, last 2 years)
14993 Points +30%
Asus ROG Zephyrus G16 GA605WV
AMD Ryzen AI 9 HX 370
14774 Points +28%
Nubia RedMagic Titan 16 Pro
Intel Core i9-14900HX
14270 Points +24%
Average AMD Ryzen 7 8845HS
  (11256 - 12726, n=12)
11855 Points +3%
Acer Nitro V 16 ANV16-41-R5AT
AMD Ryzen 7 8845HS
11536 Points
Single-Core
Nubia RedMagic Titan 16 Pro
Intel Core i9-14900HX
2160 Points +9%
Asus ROG Zephyrus G16 GA605WV
AMD Ryzen AI 9 HX 370
2104 Points +6%
Acer Nitro V 16 ANV16-41-R5AT
AMD Ryzen 7 8845HS
1977 Points
Lenovo Legion 5 16IRX G9
Intel Core i7-14650HX
1933 Points -2%
Average AMD Ryzen 7 8845HS
  (1765 - 2004, n=12)
1924 Points -3%
Average of class Gaming
  (986 - 2210, n=187, last 2 years)
1892 Points -4%
HP Victus 16 (2024)
Intel Core i7-14700HX
1700 Points -14%
HWBOT x265 Benchmark v2.2 - 4k Preset
Asus ROG Zephyrus G16 GA605WV
AMD Ryzen AI 9 HX 370
26.5 fps +30%
Lenovo Legion 5 16IRX G9
Intel Core i7-14650HX
25.6 fps +25%
Average of class Gaming
  (6.72 - 38.9, n=186, last 2 years)
23.5 fps +15%
HP Victus 16 (2024)
Intel Core i7-14700HX
22 fps +8%
Acer Nitro V 16 ANV16-41-R5AT
AMD Ryzen 7 8845HS
20.4 fps
Average AMD Ryzen 7 8845HS
  (18.6 - 22.7, n=11)
20 fps -2%
Nubia RedMagic Titan 16 Pro
Intel Core i9-14900HX
16.8 fps -18%
LibreOffice - 20 Documents To PDF
HP Victus 16 (2024)
Intel Core i7-14700HX
55.3 s * -2%
Acer Nitro V 16 ANV16-41-R5AT
AMD Ryzen 7 8845HS
54.1 s *
Asus ROG Zephyrus G16 GA605WV
AMD Ryzen AI 9 HX 370
53.8 s * +1%
Average AMD Ryzen 7 8845HS
  (44.4 - 77, n=11)
51 s * +6%
Average of class Gaming
  (31.4 - 96.6, n=183, last 2 years)
47.3 s * +13%
Lenovo Legion 5 16IRX G9
Intel Core i7-14650HX
43.8 s * +19%
Nubia RedMagic Titan 16 Pro
Intel Core i9-14900HX
34 s * +37%
R Benchmark 2.5 - Overall mean
HP Victus 16 (2024)
Intel Core i7-14700HX
0.4896 sec * -14%
Average AMD Ryzen 7 8845HS
  (0.4304 - 0.4935, n=11)
0.4528 sec * -5%
Average of class Gaming
  (0.3609 - 0.759, n=187, last 2 years)
0.438 sec * -2%
Acer Nitro V 16 ANV16-41-R5AT
AMD Ryzen 7 8845HS
0.4304 sec *
Lenovo Legion 5 16IRX G9
Intel Core i7-14650HX
0.4195 sec * +3%
Asus ROG Zephyrus G16 GA605WV
AMD Ryzen AI 9 HX 370
0.4111 sec * +4%
Nubia RedMagic Titan 16 Pro
Intel Core i9-14900HX
0.3699 sec * +14%

* ... im mniej tym lepiej

Cinebench R15 CPU Multi 64Bit
2603 Points
Cinebench R15 OpenGL 64Bit
140.6 fps
Cinebench R15 Ref. Match 64Bit
99.6 %
Cinebench R15 CPU Single 64Bit
275 Points
Cinebench R20 CPU (Multi Core)
6362 Points
Cinebench R20 CPU (Single Core)
685 Points
Cinebench R23 Single Core
1762 Points
Cinebench R23 Multi Core
16501 Points
Pomoc
Performance Rating - Percent
Asus ROG Zephyrus G16 GA605WV
AMD Ryzen AI 9 HX 370, NVIDIA GeForce RTX 4060 Laptop GPU
93.1 pt
Average of class Gaming
 
76.7 pt
Average AMD Ryzen 7 8845HS
 
76.4 pt
Acer Nitro V 16 ANV16-41-R5AT
AMD Ryzen 7 8845HS, NVIDIA GeForce RTX 4060 Laptop GPU
75.1 pt
Lenovo Legion 5 16IRX G9
Intel Core i7-14650HX, NVIDIA GeForce RTX 4060 Laptop GPU
67.1 pt
HP Victus 16 (2024)
Intel Core i7-14700HX, NVIDIA GeForce RTX 4060 Laptop GPU
66.3 pt
Nubia RedMagic Titan 16 Pro
Intel Core i9-14900HX, NVIDIA GeForce RTX 4060 Laptop GPU
59.7 pt
AIDA64
FP32 Ray-Trace
Asus ROG Zephyrus G16 GA605WV
AMD Ryzen AI 9 HX 370, NVIDIA GeForce RTX 4060 Laptop GPU
36304 KRay/s +37%
Acer Nitro V 16 ANV16-41-R5AT
AMD Ryzen 7 8845HS, NVIDIA GeForce RTX 4060 Laptop GPU
26479 KRay/s
Average AMD Ryzen 7 8845HS
  (23708 - 29544, n=11)
25839 KRay/s -2%
Average of class Gaming
  (4986 - 60169, n=183, last 2 years)
21786 KRay/s -18%
Lenovo Legion 5 16IRX G9
Intel Core i7-14650HX, NVIDIA GeForce RTX 4060 Laptop GPU
19044 KRay/s -28%
HP Victus 16 (2024)
Intel Core i7-14700HX, NVIDIA GeForce RTX 4060 Laptop GPU
16932 KRay/s -36%
Nubia RedMagic Titan 16 Pro
Intel Core i9-14900HX, NVIDIA GeForce RTX 4060 Laptop GPU
13098 KRay/s -51%
FPU Julia
Asus ROG Zephyrus G16 GA605WV
AMD Ryzen AI 9 HX 370, NVIDIA GeForce RTX 4060 Laptop GPU
138436 Points +23%
Acer Nitro V 16 ANV16-41-R5AT
AMD Ryzen 7 8845HS, NVIDIA GeForce RTX 4060 Laptop GPU
112213 Points
Average AMD Ryzen 7 8845HS
  (99659 - 125873, n=11)
109203 Points -3%
Average of class Gaming
  (25360 - 252486, n=183, last 2 years)
106398 Points -5%
Lenovo Legion 5 16IRX G9
Intel Core i7-14650HX, NVIDIA GeForce RTX 4060 Laptop GPU
95271 Points -15%
HP Victus 16 (2024)
Intel Core i7-14700HX, NVIDIA GeForce RTX 4060 Laptop GPU
86338 Points -23%
Nubia RedMagic Titan 16 Pro
Intel Core i9-14900HX, NVIDIA GeForce RTX 4060 Laptop GPU
67573 Points -40%
CPU SHA3
Asus ROG Zephyrus G16 GA605WV
AMD Ryzen AI 9 HX 370, NVIDIA GeForce RTX 4060 Laptop GPU
5696 MB/s +21%
Average of class Gaming
  (1339 - 10389, n=183, last 2 years)
4884 MB/s +4%
Average AMD Ryzen 7 8845HS
  (4332 - 5180, n=11)
4708 MB/s 0%
Acer Nitro V 16 ANV16-41-R5AT
AMD Ryzen 7 8845HS, NVIDIA GeForce RTX 4060 Laptop GPU
4701 MB/s
Lenovo Legion 5 16IRX G9
Intel Core i7-14650HX, NVIDIA GeForce RTX 4060 Laptop GPU
4214 MB/s -10%
HP Victus 16 (2024)
Intel Core i7-14700HX, NVIDIA GeForce RTX 4060 Laptop GPU
4008 MB/s -15%
Nubia RedMagic Titan 16 Pro
Intel Core i9-14900HX, NVIDIA GeForce RTX 4060 Laptop GPU
3589 MB/s -24%
CPU Queen
HP Victus 16 (2024)
Intel Core i7-14700HX, NVIDIA GeForce RTX 4060 Laptop GPU
129836 Points +9%
Nubia RedMagic Titan 16 Pro
Intel Core i9-14900HX, NVIDIA GeForce RTX 4060 Laptop GPU
123488 Points +4%
Acer Nitro V 16 ANV16-41-R5AT
AMD Ryzen 7 8845HS, NVIDIA GeForce RTX 4060 Laptop GPU
118943 Points
Average of class Gaming
  (50699 - 200651, n=183, last 2 years)
116767 Points -2%
Average AMD Ryzen 7 8845HS
  (109458 - 124695, n=11)
116188 Points -2%
Lenovo Legion 5 16IRX G9
Intel Core i7-14650HX, NVIDIA GeForce RTX 4060 Laptop GPU
101500 Points -15%
Asus ROG Zephyrus G16 GA605WV
AMD Ryzen AI 9 HX 370, NVIDIA GeForce RTX 4060 Laptop GPU
94289 Points -21%
FPU SinJulia
Asus ROG Zephyrus G16 GA605WV
AMD Ryzen AI 9 HX 370, NVIDIA GeForce RTX 4060 Laptop GPU
18867 Points +25%
Acer Nitro V 16 ANV16-41-R5AT
AMD Ryzen 7 8845HS, NVIDIA GeForce RTX 4060 Laptop GPU
15106 Points
Average AMD Ryzen 7 8845HS
  (14062 - 15519, n=11)
14859 Points -2%
Average of class Gaming
  (4800 - 32988, n=183, last 2 years)
13223 Points -12%
Lenovo Legion 5 16IRX G9
Intel Core i7-14650HX, NVIDIA GeForce RTX 4060 Laptop GPU
11913 Points -21%
HP Victus 16 (2024)
Intel Core i7-14700HX, NVIDIA GeForce RTX 4060 Laptop GPU
11704 Points -23%
Nubia RedMagic Titan 16 Pro
Intel Core i9-14900HX, NVIDIA GeForce RTX 4060 Laptop GPU
10475 Points -31%
FPU Mandel
Asus ROG Zephyrus G16 GA605WV
AMD Ryzen AI 9 HX 370, NVIDIA GeForce RTX 4060 Laptop GPU
74066 Points +23%
Acer Nitro V 16 ANV16-41-R5AT
AMD Ryzen 7 8845HS, NVIDIA GeForce RTX 4060 Laptop GPU
60105 Points
Average AMD Ryzen 7 8845HS
  (53436 - 67367, n=11)
58328 Points -3%
Average of class Gaming
  (12321 - 134044, n=183, last 2 years)
53561 Points -11%
Lenovo Legion 5 16IRX G9
Intel Core i7-14650HX, NVIDIA GeForce RTX 4060 Laptop GPU
47097 Points -22%
HP Victus 16 (2024)
Intel Core i7-14700HX, NVIDIA GeForce RTX 4060 Laptop GPU
42125 Points -30%
Nubia RedMagic Titan 16 Pro
Intel Core i9-14900HX, NVIDIA GeForce RTX 4060 Laptop GPU
32543 Points -46%
CPU AES
Nubia RedMagic Titan 16 Pro
Intel Core i9-14900HX, NVIDIA GeForce RTX 4060 Laptop GPU
136951 MB/s +101%
Average of class Gaming
  (19065 - 328679, n=183, last 2 years)
109083 MB/s +60%
Average AMD Ryzen 7 8845HS
  (64515 - 172642, n=11)
95038 MB/s +40%
Lenovo Legion 5 16IRX G9
Intel Core i7-14650HX, NVIDIA GeForce RTX 4060 Laptop GPU
86485 MB/s +27%
HP Victus 16 (2024)
Intel Core i7-14700HX, NVIDIA GeForce RTX 4060 Laptop GPU
82161 MB/s +21%
Asus ROG Zephyrus G16 GA605WV
AMD Ryzen AI 9 HX 370, NVIDIA GeForce RTX 4060 Laptop GPU
80186 MB/s +18%
Acer Nitro V 16 ANV16-41-R5AT
AMD Ryzen 7 8845HS, NVIDIA GeForce RTX 4060 Laptop GPU
68109 MB/s
CPU ZLib
Asus ROG Zephyrus G16 GA605WV
AMD Ryzen AI 9 HX 370, NVIDIA GeForce RTX 4060 Laptop GPU
1489 MB/s +39%
Average of class Gaming
  (373 - 2409, n=183, last 2 years)
1359 MB/s +26%
Lenovo Legion 5 16IRX G9
Intel Core i7-14650HX, NVIDIA GeForce RTX 4060 Laptop GPU
1289 MB/s +20%
HP Victus 16 (2024)
Intel Core i7-14700HX, NVIDIA GeForce RTX 4060 Laptop GPU
1177 MB/s +9%
Acer Nitro V 16 ANV16-41-R5AT
AMD Ryzen 7 8845HS, NVIDIA GeForce RTX 4060 Laptop GPU
1075 MB/s
Nubia RedMagic Titan 16 Pro
Intel Core i9-14900HX, NVIDIA GeForce RTX 4060 Laptop GPU
1054 MB/s -2%
Average AMD Ryzen 7 8845HS
  (627 - 1080, n=11)
979 MB/s -9%
FP64 Ray-Trace
Asus ROG Zephyrus G16 GA605WV
AMD Ryzen AI 9 HX 370, NVIDIA GeForce RTX 4060 Laptop GPU
19629 KRay/s +39%
Acer Nitro V 16 ANV16-41-R5AT
AMD Ryzen 7 8845HS, NVIDIA GeForce RTX 4060 Laptop GPU
14146 KRay/s
Average AMD Ryzen 7 8845HS
  (12361 - 15911, n=11)
13740 KRay/s -3%
Average of class Gaming
  (2540 - 31796, n=183, last 2 years)
11734 KRay/s -17%
Lenovo Legion 5 16IRX G9
Intel Core i7-14650HX, NVIDIA GeForce RTX 4060 Laptop GPU
10316 KRay/s -27%
HP Victus 16 (2024)
Intel Core i7-14700HX, NVIDIA GeForce RTX 4060 Laptop GPU
9029 KRay/s -36%
Nubia RedMagic Titan 16 Pro
Intel Core i9-14900HX, NVIDIA GeForce RTX 4060 Laptop GPU
6809 KRay/s -52%
CPU PhotoWorxx
Asus ROG Zephyrus G16 GA605WV
AMD Ryzen AI 9 HX 370, NVIDIA GeForce RTX 4060 Laptop GPU
49354 MPixel/s +49%
Average of class Gaming
  (10805 - 60161, n=184, last 2 years)
40082 MPixel/s +21%
HP Victus 16 (2024)
Intel Core i7-14700HX, NVIDIA GeForce RTX 4060 Laptop GPU
39448 MPixel/s +19%
Average AMD Ryzen 7 8845HS
  (33192 - 41668, n=11)
38987 MPixel/s +17%
Lenovo Legion 5 16IRX G9
Intel Core i7-14650HX, NVIDIA GeForce RTX 4060 Laptop GPU
33763 MPixel/s +2%
Acer Nitro V 16 ANV16-41-R5AT
AMD Ryzen 7 8845HS, NVIDIA GeForce RTX 4060 Laptop GPU
33192 MPixel/s
Nubia RedMagic Titan 16 Pro
Intel Core i9-14900HX, NVIDIA GeForce RTX 4060 Laptop GPU
23970 MPixel/s -28%

Wydajność systemu

Pod względem wydajności systemowej Nitro V 16 wylądował na przedostatnim miejscu, tuż przed HP Victus 16 - choć różnice w stosunku do innych porównywanych urządzeń nie były zbyt duże. Subiektywnie rzecz biorąc, laptop działa i reaguje przyjemnie i szybko.

PCMark 10 / Score
Average AMD Ryzen 7 8845HS, NVIDIA GeForce RTX 4060 Laptop GPU
  (7538 - 8822, n=2)
8180 Points +9%
Asus ROG Zephyrus G16 GA605WV
NVIDIA GeForce RTX 4060 Laptop GPU, Ryzen AI 9 HX 370, Micron 2400 MTFDKBA1T0QFM
7915 Points +5%
Nubia RedMagic Titan 16 Pro
NVIDIA GeForce RTX 4060 Laptop GPU, i9-14900HX, Samsung PM9A1 MZVL21T0HCLR
7830 Points +4%
Average of class Gaming
  (5776 - 9852, n=165, last 2 years)
7791 Points +3%
Lenovo Legion 5 16IRX G9
NVIDIA GeForce RTX 4060 Laptop GPU, i7-14650HX, Samsung PM9A1 MZVL21T0HCLR
7645 Points +1%
Acer Nitro V 16 ANV16-41-R5AT
NVIDIA GeForce RTX 4060 Laptop GPU, R7 8845HS, Micron 2550 1TB
7538 Points
HP Victus 16 (2024)
NVIDIA GeForce RTX 4060 Laptop GPU, i7-14700HX, Kioxia XG8 KXG80ZNV512G
7528 Points 0%
PCMark 10 / Essentials
Nubia RedMagic Titan 16 Pro
NVIDIA GeForce RTX 4060 Laptop GPU, i9-14900HX, Samsung PM9A1 MZVL21T0HCLR
11022 Points +11%
Average of class Gaming
  (9057 - 12334, n=164, last 2 years)
10835 Points +9%
Lenovo Legion 5 16IRX G9
NVIDIA GeForce RTX 4060 Laptop GPU, i7-14650HX, Samsung PM9A1 MZVL21T0HCLR
10804 Points +9%
HP Victus 16 (2024)
NVIDIA GeForce RTX 4060 Laptop GPU, i7-14700HX, Kioxia XG8 KXG80ZNV512G
10778 Points +8%
Asus ROG Zephyrus G16 GA605WV
NVIDIA GeForce RTX 4060 Laptop GPU, Ryzen AI 9 HX 370, Micron 2400 MTFDKBA1T0QFM
10140 Points +2%
Average AMD Ryzen 7 8845HS, NVIDIA GeForce RTX 4060 Laptop GPU
  (9936 - 10061, n=2)
9999 Points +1%
Acer Nitro V 16 ANV16-41-R5AT
NVIDIA GeForce RTX 4060 Laptop GPU, R7 8845HS, Micron 2550 1TB
9936 Points
PCMark 10 / Productivity
Average AMD Ryzen 7 8845HS, NVIDIA GeForce RTX 4060 Laptop GPU
  (9789 - 14612, n=2)
12201 Points +25%
Asus ROG Zephyrus G16 GA605WV
NVIDIA GeForce RTX 4060 Laptop GPU, Ryzen AI 9 HX 370, Micron 2400 MTFDKBA1T0QFM
9971 Points +2%
HP Victus 16 (2024)
NVIDIA GeForce RTX 4060 Laptop GPU, i7-14700HX, Kioxia XG8 KXG80ZNV512G
9910 Points +1%
Average of class Gaming
  (6662 - 14612, n=164, last 2 years)
9899 Points +1%
Acer Nitro V 16 ANV16-41-R5AT
NVIDIA GeForce RTX 4060 Laptop GPU, R7 8845HS, Micron 2550 1TB
9789 Points
Nubia RedMagic Titan 16 Pro
NVIDIA GeForce RTX 4060 Laptop GPU, i9-14900HX, Samsung PM9A1 MZVL21T0HCLR
9776 Points 0%
Lenovo Legion 5 16IRX G9
NVIDIA GeForce RTX 4060 Laptop GPU, i7-14650HX, Samsung PM9A1 MZVL21T0HCLR
9241 Points -6%
PCMark 10 / Digital Content Creation
Asus ROG Zephyrus G16 GA605WV
NVIDIA GeForce RTX 4060 Laptop GPU, Ryzen AI 9 HX 370, Micron 2400 MTFDKBA1T0QFM
13309 Points +11%
Average AMD Ryzen 7 8845HS, NVIDIA GeForce RTX 4060 Laptop GPU
  (11953 - 12674, n=2)
12314 Points +3%
Lenovo Legion 5 16IRX G9
NVIDIA GeForce RTX 4060 Laptop GPU, i7-14650HX, Samsung PM9A1 MZVL21T0HCLR
12144 Points +2%
Nubia RedMagic Titan 16 Pro
NVIDIA GeForce RTX 4060 Laptop GPU, i9-14900HX, Samsung PM9A1 MZVL21T0HCLR
12091 Points +1%
Average of class Gaming
  (6703 - 18475, n=164, last 2 years)
12084 Points +1%
Acer Nitro V 16 ANV16-41-R5AT
NVIDIA GeForce RTX 4060 Laptop GPU, R7 8845HS, Micron 2550 1TB
11953 Points
HP Victus 16 (2024)
NVIDIA GeForce RTX 4060 Laptop GPU, i7-14700HX, Kioxia XG8 KXG80ZNV512G
10841 Points -9%
CrossMark / Overall
Nubia RedMagic Titan 16 Pro
NVIDIA GeForce RTX 4060 Laptop GPU, i9-14900HX, Samsung PM9A1 MZVL21T0HCLR
2103 Points
Lenovo Legion 5 16IRX G9
NVIDIA GeForce RTX 4060 Laptop GPU, i7-14650HX, Samsung PM9A1 MZVL21T0HCLR
2092 Points
HP Victus 16 (2024)
NVIDIA GeForce RTX 4060 Laptop GPU, i7-14700HX, Kioxia XG8 KXG80ZNV512G
1923 Points
Average of class Gaming
  (1247 - 2344, n=147, last 2 years)
1905 Points
Average AMD Ryzen 7 8845HS, NVIDIA GeForce RTX 4060 Laptop GPU
  ()
1889 Points
Asus ROG Zephyrus G16 GA605WV
NVIDIA GeForce RTX 4060 Laptop GPU, Ryzen AI 9 HX 370, Micron 2400 MTFDKBA1T0QFM
1819 Points
CrossMark / Productivity
Nubia RedMagic Titan 16 Pro
NVIDIA GeForce RTX 4060 Laptop GPU, i9-14900HX, Samsung PM9A1 MZVL21T0HCLR
2042 Points
Lenovo Legion 5 16IRX G9
NVIDIA GeForce RTX 4060 Laptop GPU, i7-14650HX, Samsung PM9A1 MZVL21T0HCLR
1938 Points
Average of class Gaming
  (1299 - 2204, n=147, last 2 years)
1805 Points
Average AMD Ryzen 7 8845HS, NVIDIA GeForce RTX 4060 Laptop GPU
  ()
1789 Points
HP Victus 16 (2024)
NVIDIA GeForce RTX 4060 Laptop GPU, i7-14700HX, Kioxia XG8 KXG80ZNV512G
1782 Points
Asus ROG Zephyrus G16 GA605WV
NVIDIA GeForce RTX 4060 Laptop GPU, Ryzen AI 9 HX 370, Micron 2400 MTFDKBA1T0QFM
1637 Points
CrossMark / Creativity
Lenovo Legion 5 16IRX G9
NVIDIA GeForce RTX 4060 Laptop GPU, i7-14650HX, Samsung PM9A1 MZVL21T0HCLR
2336 Points
Asus ROG Zephyrus G16 GA605WV
NVIDIA GeForce RTX 4060 Laptop GPU, Ryzen AI 9 HX 370, Micron 2400 MTFDKBA1T0QFM
2264 Points
Nubia RedMagic Titan 16 Pro
NVIDIA GeForce RTX 4060 Laptop GPU, i9-14900HX, Samsung PM9A1 MZVL21T0HCLR
2240 Points
HP Victus 16 (2024)
NVIDIA GeForce RTX 4060 Laptop GPU, i7-14700HX, Kioxia XG8 KXG80ZNV512G
2107 Points
Average AMD Ryzen 7 8845HS, NVIDIA GeForce RTX 4060 Laptop GPU
  ()
2102 Points
Average of class Gaming
  (1275 - 2660, n=147, last 2 years)
2090 Points
CrossMark / Responsiveness
Nubia RedMagic Titan 16 Pro
NVIDIA GeForce RTX 4060 Laptop GPU, i9-14900HX, Samsung PM9A1 MZVL21T0HCLR
1899 Points
Lenovo Legion 5 16IRX G9
NVIDIA GeForce RTX 4060 Laptop GPU, i7-14650HX, Samsung PM9A1 MZVL21T0HCLR
1889 Points
HP Victus 16 (2024)
NVIDIA GeForce RTX 4060 Laptop GPU, i7-14700HX, Kioxia XG8 KXG80ZNV512G
1835 Points
Average of class Gaming
  (1030 - 2330, n=147, last 2 years)
1704 Points
Average AMD Ryzen 7 8845HS, NVIDIA GeForce RTX 4060 Laptop GPU
  ()
1613 Points
Asus ROG Zephyrus G16 GA605WV
NVIDIA GeForce RTX 4060 Laptop GPU, Ryzen AI 9 HX 370, Micron 2400 MTFDKBA1T0QFM
1293 Points
WebXPRT 3 / Overall
Nubia RedMagic Titan 16 Pro
NVIDIA GeForce RTX 4060 Laptop GPU, i9-14900HX, Samsung PM9A1 MZVL21T0HCLR
329 Points +8%
Lenovo Legion 5 16IRX G9
NVIDIA GeForce RTX 4060 Laptop GPU, i7-14650HX, Samsung PM9A1 MZVL21T0HCLR
311 Points +2%
Acer Nitro V 16 ANV16-41-R5AT
NVIDIA GeForce RTX 4060 Laptop GPU, R7 8845HS, Micron 2550 1TB
305 Points
Average AMD Ryzen 7 8845HS, NVIDIA GeForce RTX 4060 Laptop GPU
  (305 - 305, n=2)
305 Points 0%
Average of class Gaming
  (215 - 480, n=161, last 2 years)
304 Points 0%
HP Victus 16 (2024)
NVIDIA GeForce RTX 4060 Laptop GPU, i7-14700HX, Kioxia XG8 KXG80ZNV512G
276 Points -10%
WebXPRT 4 / Overall
Nubia RedMagic Titan 16 Pro
NVIDIA GeForce RTX 4060 Laptop GPU, i9-14900HX, Samsung PM9A1 MZVL21T0HCLR
309 Points +75%
Lenovo Legion 5 16IRX G9
NVIDIA GeForce RTX 4060 Laptop GPU, i7-14650HX, Samsung PM9A1 MZVL21T0HCLR
283 Points +60%
Average of class Gaming
  (157.9 - 328, n=149, last 2 years)
267 Points +51%
Asus ROG Zephyrus G16 GA605WV
NVIDIA GeForce RTX 4060 Laptop GPU, Ryzen AI 9 HX 370, Micron 2400 MTFDKBA1T0QFM
259 Points +47%
HP Victus 16 (2024)
NVIDIA GeForce RTX 4060 Laptop GPU, i7-14700HX, Kioxia XG8 KXG80ZNV512G
251 Points +42%
Average AMD Ryzen 7 8845HS, NVIDIA GeForce RTX 4060 Laptop GPU
  (176.4 - 264, n=2)
220 Points +25%
Acer Nitro V 16 ANV16-41-R5AT
NVIDIA GeForce RTX 4060 Laptop GPU, R7 8845HS, Micron 2550 1TB
176.4 Points
Mozilla Kraken 1.1 / Total
HP Victus 16 (2024)
NVIDIA GeForce RTX 4060 Laptop GPU, i7-14700HX, Kioxia XG8 KXG80ZNV512G
542 ms * -4%
Acer Nitro V 16 ANV16-41-R5AT
NVIDIA GeForce RTX 4060 Laptop GPU, R7 8845HS, Micron 2550 1TB
523 ms *
Average AMD Ryzen 7 8845HS, NVIDIA GeForce RTX 4060 Laptop GPU
  (496 - 523, n=2)
510 ms * +2%
Average of class Gaming
  (421 - 674, n=175, last 2 years)
503 ms * +4%
Lenovo Legion 5 16IRX G9
NVIDIA GeForce RTX 4060 Laptop GPU, i7-14650HX, Samsung PM9A1 MZVL21T0HCLR
486 ms * +7%
Nubia RedMagic Titan 16 Pro
NVIDIA GeForce RTX 4060 Laptop GPU, i9-14900HX, Samsung PM9A1 MZVL21T0HCLR
439 ms * +16%
Asus ROG Zephyrus G16 GA605WV
NVIDIA GeForce RTX 4060 Laptop GPU, Ryzen AI 9 HX 370, Micron 2400 MTFDKBA1T0QFM
434 ms * +17%

* ... im mniej tym lepiej

PCMark 10 Score
7538 pkt.
Pomoc
AIDA64 / Memory Copy
Asus ROG Zephyrus G16 GA605WV
AMD Ryzen AI 9 HX 370, NVIDIA GeForce RTX 4060 Laptop GPU
89564 MB/s +44%
Average AMD Ryzen 7 8845HS
  (61459 - 71873, n=11)
67394 MB/s +8%
HP Victus 16 (2024)
Intel Core i7-14700HX, NVIDIA GeForce RTX 4060 Laptop GPU
66599 MB/s +7%
Average of class Gaming
  (21842 - 94222, n=183, last 2 years)
65188 MB/s +5%
Acer Nitro V 16 ANV16-41-R5AT
AMD Ryzen 7 8845HS, NVIDIA GeForce RTX 4060 Laptop GPU
62270 MB/s
Lenovo Legion 5 16IRX G9
Intel Core i7-14650HX, NVIDIA GeForce RTX 4060 Laptop GPU
59727 MB/s -4%
Nubia RedMagic Titan 16 Pro
Intel Core i9-14900HX, NVIDIA GeForce RTX 4060 Laptop GPU
43236 MB/s -31%
AIDA64 / Memory Read
Asus ROG Zephyrus G16 GA605WV
AMD Ryzen AI 9 HX 370, NVIDIA GeForce RTX 4060 Laptop GPU
99713 MB/s +64%
HP Victus 16 (2024)
Intel Core i7-14700HX, NVIDIA GeForce RTX 4060 Laptop GPU
81049 MB/s +33%
Lenovo Legion 5 16IRX G9
Intel Core i7-14650HX, NVIDIA GeForce RTX 4060 Laptop GPU
71455 MB/s +18%
Average of class Gaming
  (23681 - 99713, n=183, last 2 years)
69056 MB/s +14%
Acer Nitro V 16 ANV16-41-R5AT
AMD Ryzen 7 8845HS, NVIDIA GeForce RTX 4060 Laptop GPU
60784 MB/s
Average AMD Ryzen 7 8845HS
  (49866 - 61976, n=11)
58208 MB/s -4%
Nubia RedMagic Titan 16 Pro
Intel Core i9-14900HX, NVIDIA GeForce RTX 4060 Laptop GPU
47588 MB/s -22%
AIDA64 / Memory Write
Asus ROG Zephyrus G16 GA605WV
AMD Ryzen AI 9 HX 370, NVIDIA GeForce RTX 4060 Laptop GPU
98802 MB/s +27%
Average AMD Ryzen 7 8845HS
  (68425 - 93239, n=11)
85626 MB/s +10%
Acer Nitro V 16 ANV16-41-R5AT
AMD Ryzen 7 8845HS, NVIDIA GeForce RTX 4060 Laptop GPU
78054 MB/s
Average of class Gaming
  (22986 - 108954, n=183, last 2 years)
66928 MB/s -14%
HP Victus 16 (2024)
Intel Core i7-14700HX, NVIDIA GeForce RTX 4060 Laptop GPU
65204 MB/s -16%
Lenovo Legion 5 16IRX G9
Intel Core i7-14650HX, NVIDIA GeForce RTX 4060 Laptop GPU
51138 MB/s -34%
Nubia RedMagic Titan 16 Pro
Intel Core i9-14900HX, NVIDIA GeForce RTX 4060 Laptop GPU
39011 MB/s -50%
AIDA64 / Memory Latency
Asus ROG Zephyrus G16 GA605WV
AMD Ryzen AI 9 HX 370, NVIDIA GeForce RTX 4060 Laptop GPU
114.2 ns * -31%
Average AMD Ryzen 7 8845HS
  (82.5 - 117, n=11)
96.9 ns * -11%
HP Victus 16 (2024)
Intel Core i7-14700HX, NVIDIA GeForce RTX 4060 Laptop GPU
96.4 ns * -10%
Average of class Gaming
  (59.5 - 259, n=183, last 2 years)
94 ns * -7%
Lenovo Legion 5 16IRX G9
Intel Core i7-14650HX, NVIDIA GeForce RTX 4060 Laptop GPU
89.8 ns * -3%
Acer Nitro V 16 ANV16-41-R5AT
AMD Ryzen 7 8845HS, NVIDIA GeForce RTX 4060 Laptop GPU
87.5 ns *
Nubia RedMagic Titan 16 Pro
Intel Core i9-14900HX, NVIDIA GeForce RTX 4060 Laptop GPU
79.7 ns * +9%

* ... im mniej tym lepiej

Opóźnienia DPC

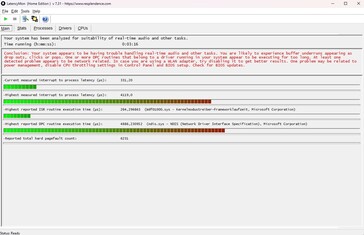
Opóźnienia nie są mocną stroną 16-calowego urządzenia. Narzędzie LatencyMon potwierdziło, że V 16 może mieć problemy z przetwarzaniem dźwięku w czasie rzeczywistym i w innych obszarach. Jedynie Zephyrus G16 wypadł dobrze w polu porównawczym.

LatencyMon
LatencyMon
DPC Latencies / LatencyMon - interrupt to process latency (max), Web, Youtube, Prime95
Acer Nitro V 16 ANV16-41-R5AT
NVIDIA GeForce RTX 4060 Laptop GPU, R7 8845HS, Micron 2550 1TB
4119 μs *
Nubia RedMagic Titan 16 Pro
NVIDIA GeForce RTX 4060 Laptop GPU, i9-14900HX, Samsung PM9A1 MZVL21T0HCLR
2500.7 μs * +39%
Lenovo Legion 5 16IRX G9
NVIDIA GeForce RTX 4060 Laptop GPU, i7-14650HX, Samsung PM9A1 MZVL21T0HCLR
2024.9 μs * +51%
HP Victus 16 (2024)
NVIDIA GeForce RTX 4060 Laptop GPU, i7-14700HX, Kioxia XG8 KXG80ZNV512G
853.9 μs * +79%
Asus ROG Zephyrus G16 GA605WV
NVIDIA GeForce RTX 4060 Laptop GPU, Ryzen AI 9 HX 370, Micron 2400 MTFDKBA1T0QFM
566.1 μs * +86%

* ... im mniej tym lepiej

Urządzenie pamięci masowej

Acer zdecydował się na solidny dysk SSD NVMe, a mianowicie Micron 2550. Nie jest on ani wolny, ani szczególnie szybki podczas odczytu i zapisu danych. W teście długoterminowym przy użyciu DiskSpd odnotowaliśmy niewielkie spadki w dłuższej perspektywie, ale wydajność SSD wahała się znacznie bardziej lub spadła znacznie bardziej w innych urządzeniach (np Lenovo Legion 5 i HP Victus 16).

Micron 2550 1TB
CDM 5/6 Read Seq Q32T1: 4809 MB/s
CDM 5/6 Write Seq Q32T1: 2218 MB/s
CDM 5/6 Read 4K Q32T1: 581.6 MB/s
CDM 5/6 Write 4K Q32T1: 339.6 MB/s
CDM 5 Read Seq: 2116 MB/s
CDM 5 Write Seq: 2312 MB/s
CDM 5/6 Read 4K: 51.26 MB/s
CDM 5/6 Write 4K: 270.2 MB/s
Drive Performance Rating - Percent
Lenovo Legion 5 16IRX G9
Samsung PM9A1 MZVL21T0HCLR
95 pt
Nubia RedMagic Titan 16 Pro
Samsung PM9A1 MZVL21T0HCLR
90 pt
HP Victus 16 (2024)
Kioxia XG8 KXG80ZNV512G
80.4 pt
Average of class Gaming
 
79.4 pt
Acer Nitro V 16 ANV16-41-R5AT
Micron 2550 1TB
64.1 pt
Average Micron 2550 1TB
 
58.7 pt
Asus ROG Zephyrus G16 GA605WV
Micron 2400 MTFDKBA1T0QFM
46.8 pt
DiskSpd
seq read
Lenovo Legion 5 16IRX G9
Samsung PM9A1 MZVL21T0HCLR
4182 (4112.68min - 4181.96max) MB/s +93%
Nubia RedMagic Titan 16 Pro
Samsung PM9A1 MZVL21T0HCLR
3795 (3728.41min - 3794.55max) MB/s +75%
Average of class Gaming
  (1319 - 7045, n=164, last 2 years)
3470 MB/s +60%
HP Victus 16 (2024)
Kioxia XG8 KXG80ZNV512G
3469 (3344.35min - 3469.11max) MB/s +60%
Average Micron 2550 1TB
  (2165 - 2799, n=4)
2631 MB/s +22%
Asus ROG Zephyrus G16 GA605WV
Micron 2400 MTFDKBA1T0QFM
2267 (2202.85min - 2267.15max) MB/s +5%
Acer Nitro V 16 ANV16-41-R5AT
Micron 2550 1TB
2165 (2154.82min - 2165.1max) MB/s
seq write
Lenovo Legion 5 16IRX G9
Samsung PM9A1 MZVL21T0HCLR
4064 (3527.07min - 4064.49max) MB/s +26%
HP Victus 16 (2024)
Kioxia XG8 KXG80ZNV512G
3895 (3747.67min - 3894.8max) MB/s +21%
Average of class Gaming
  (535 - 9307, n=164, last 2 years)
3807 MB/s +18%
Nubia RedMagic Titan 16 Pro
Samsung PM9A1 MZVL21T0HCLR
3625 (3598.44min - 3624.51max) MB/s +13%
Average Micron 2550 1TB
  (3150 - 3470, n=4)
3302 MB/s +3%
Acer Nitro V 16 ANV16-41-R5AT
Micron 2550 1TB
3219 (533.93min - 3218.71max) MB/s
Asus ROG Zephyrus G16 GA605WV
Micron 2400 MTFDKBA1T0QFM
2542 (2385.77min - 2541.75max) MB/s -21%
seq q8 t1 read
HP Victus 16 (2024)
Kioxia XG8 KXG80ZNV512G
6933 (6552.34min - 6933.16max) MB/s +41%
Nubia RedMagic Titan 16 Pro
Samsung PM9A1 MZVL21T0HCLR
6654 (5651.22min - 6654.47max) MB/s +35%
Lenovo Legion 5 16IRX G9
Samsung PM9A1 MZVL21T0HCLR
6651 (5971.64min - 6651.33max) MB/s +35%
Average of class Gaming
  (2594 - 16089, n=164, last 2 years)
6313 MB/s +29%
Average Micron 2550 1TB
  (4912 - 5200, n=4)
5122 MB/s +4%
Asus ROG Zephyrus G16 GA605WV
Micron 2400 MTFDKBA1T0QFM
4946 (3626.31min - 4945.75max) MB/s +1%
Acer Nitro V 16 ANV16-41-R5AT
Micron 2550 1TB
4912 (3899.82min - 4911.74max) MB/s
seq q8 t1 write
Nubia RedMagic Titan 16 Pro
Samsung PM9A1 MZVL21T0HCLR
4990 (4969.33min - 4989.54max) MB/s +124%
Lenovo Legion 5 16IRX G9
Samsung PM9A1 MZVL21T0HCLR
4952 (4919.08min - 4952.42max) MB/s +123%
Average of class Gaming
  (539 - 14571, n=164, last 2 years)
4851 MB/s +118%
HP Victus 16 (2024)
Kioxia XG8 KXG80ZNV512G
4392 (3922.93min - 4391.65max) MB/s +97%
Average Micron 2550 1TB
  (2225 - 4612, n=4)
3983 MB/s +79%
Asus ROG Zephyrus G16 GA605WV
Micron 2400 MTFDKBA1T0QFM
3387 (3154.75min - 3386.9max) MB/s +52%
Acer Nitro V 16 ANV16-41-R5AT
Micron 2550 1TB
2225 (711.19min - 2225.08max) MB/s
4k q1 t1 read
Lenovo Legion 5 16IRX G9
Samsung PM9A1 MZVL21T0HCLR
83.9 (83.66min - 83.86max) MB/s +64%
Nubia RedMagic Titan 16 Pro
Samsung PM9A1 MZVL21T0HCLR
66.2 (61.1min - 66.24max) MB/s +29%
Average of class Gaming
  (30.6 - 95.9, n=164, last 2 years)
65.9 MB/s +29%
Average Micron 2550 1TB
  (51.2 - 78.1, n=4)
63.5 MB/s +24%
Acer Nitro V 16 ANV16-41-R5AT
Micron 2550 1TB
51.2 (50.26min - 51.15max) MB/s
HP Victus 16 (2024)
Kioxia XG8 KXG80ZNV512G
46.2 (45.32min - 46.24max) MB/s -10%
Asus ROG Zephyrus G16 GA605WV
Micron 2400 MTFDKBA1T0QFM
40.3 (40.03min - 40.33max) MB/s -21%
4k q1 t1 write
Acer Nitro V 16 ANV16-41-R5AT
Micron 2550 1TB
273 (270.95min - 273.28max) MB/s
HP Victus 16 (2024)
Kioxia XG8 KXG80ZNV512G
251 (249.24min - 250.87max) MB/s -8%
Lenovo Legion 5 16IRX G9
Samsung PM9A1 MZVL21T0HCLR
246 (236.18min - 245.56max) MB/s -10%
Nubia RedMagic Titan 16 Pro
Samsung PM9A1 MZVL21T0HCLR
241 (231.88min - 240.59max) MB/s -12%
Average of class Gaming
  (66.6 - 397, n=164, last 2 years)
223 MB/s -18%
Average Micron 2550 1TB
  (141.2 - 273, n=4)
178.7 MB/s -35%
Asus ROG Zephyrus G16 GA605WV
Micron 2400 MTFDKBA1T0QFM
93.9 (77.46min - 93.94max) MB/s -66%
4k q32 t16 read
Lenovo Legion 5 16IRX G9
Samsung PM9A1 MZVL21T0HCLR
4010 (4002.81min - 4009.85max) MB/s +466%
Nubia RedMagic Titan 16 Pro
Samsung PM9A1 MZVL21T0HCLR
3822 (3797.23min - 3821.59max) MB/s +439%
HP Victus 16 (2024)
Kioxia XG8 KXG80ZNV512G
3330 (3310.23min - 3329.64max) MB/s +370%
Average of class Gaming
  (417 - 6172, n=164, last 2 years)
2568 MB/s +262%
Acer Nitro V 16 ANV16-41-R5AT
Micron 2550 1TB
709 (708.4min - 709.45max) MB/s
Asus ROG Zephyrus G16 GA605WV
Micron 2400 MTFDKBA1T0QFM
550 (536.5min - 549.61max) MB/s -22%
Average Micron 2550 1TB
  (416 - 709, n=4)
532 MB/s -25%
4k q32 t16 write
Nubia RedMagic Titan 16 Pro
Samsung PM9A1 MZVL21T0HCLR
3539 (3004.21min - 3539.13max) MB/s +94%
Lenovo Legion 5 16IRX G9
Samsung PM9A1 MZVL21T0HCLR
2646 (2422.02min - 2645.88max) MB/s +45%
HP Victus 16 (2024)
Kioxia XG8 KXG80ZNV512G
2405 (937.07min - 2405.2max) MB/s +32%
Average of class Gaming
  (162.3 - 4869, n=164, last 2 years)
2130 MB/s +17%
Acer Nitro V 16 ANV16-41-R5AT
Micron 2550 1TB
1824 (254.66min - 1823.53max) MB/s
Average Micron 2550 1TB
  (350 - 1824, n=4)
727 MB/s -60%
Asus ROG Zephyrus G16 GA605WV
Micron 2400 MTFDKBA1T0QFM
313 (297.37min - 312.94max) MB/s -83%
AS SSD
Score Total
Lenovo Legion 5 16IRX G9
Samsung PM9A1 MZVL21T0HCLR
8677 Points +95%
Nubia RedMagic Titan 16 Pro
Samsung PM9A1 MZVL21T0HCLR
8192 Points +84%
HP Victus 16 (2024)
Kioxia XG8 KXG80ZNV512G
7423 Points +67%
Average of class Gaming
  (2271 - 13854, n=156, last 2 years)
6745 Points +52%
Acer Nitro V 16 ANV16-41-R5AT
Micron 2550 1TB
4451 Points
Average Micron 2550 1TB
  (3379 - 4613, n=4)
3979 Points -11%
Asus ROG Zephyrus G16 GA605WV
Micron 2400 MTFDKBA1T0QFM
3564 Points -20%
Score Read
Lenovo Legion 5 16IRX G9
Samsung PM9A1 MZVL21T0HCLR
3242 Points +116%
Nubia RedMagic Titan 16 Pro
Samsung PM9A1 MZVL21T0HCLR
3136 Points +109%
HP Victus 16 (2024)
Kioxia XG8 KXG80ZNV512G
3007 Points +100%
Average of class Gaming
  (776 - 4721, n=156, last 2 years)
2446 Points +63%
Acer Nitro V 16 ANV16-41-R5AT
Micron 2550 1TB
1500 Points
Average Micron 2550 1TB
  (1001 - 1500, n=4)
1207 Points -20%
Asus ROG Zephyrus G16 GA605WV
Micron 2400 MTFDKBA1T0QFM
954 Points -36%
Score Write
Lenovo Legion 5 16IRX G9
Samsung PM9A1 MZVL21T0HCLR
3846 Points +77%
Nubia RedMagic Titan 16 Pro
Samsung PM9A1 MZVL21T0HCLR
3524 Points +62%
Average of class Gaming
  (515 - 7208, n=156, last 2 years)
3112 Points +43%
HP Victus 16 (2024)
Kioxia XG8 KXG80ZNV512G
2919 Points +34%
Average Micron 2550 1TB
  (1912 - 2763, n=4)
2194 Points +1%
Asus ROG Zephyrus G16 GA605WV
Micron 2400 MTFDKBA1T0QFM
2185 Points +1%
Acer Nitro V 16 ANV16-41-R5AT
Micron 2550 1TB
2171 Points
Seq Read
Lenovo Legion 5 16IRX G9
Samsung PM9A1 MZVL21T0HCLR
5413 MB/s +26%
HP Victus 16 (2024)
Kioxia XG8 KXG80ZNV512G
5247.63 MB/s +22%
Nubia RedMagic Titan 16 Pro
Samsung PM9A1 MZVL21T0HCLR
5097.01 MB/s +19%
Average of class Gaming
  (2260 - 12763, n=156, last 2 years)
4938 MB/s +15%
Acer Nitro V 16 ANV16-41-R5AT
Micron 2550 1TB
4290.67 MB/s
Average Micron 2550 1TB
  (4005 - 4291, n=4)
4095 MB/s -5%
Asus ROG Zephyrus G16 GA605WV
Micron 2400 MTFDKBA1T0QFM
3863 MB/s -10%
Seq Write
HP Victus 16 (2024)
Kioxia XG8 KXG80ZNV512G
4617.83 MB/s +12%
Acer Nitro V 16 ANV16-41-R5AT
Micron 2550 1TB
4126 MB/s
Lenovo Legion 5 16IRX G9
Samsung PM9A1 MZVL21T0HCLR
3979 MB/s -4%
Average of class Gaming
  (495 - 11316, n=156, last 2 years)
3759 MB/s -9%
Nubia RedMagic Titan 16 Pro
Samsung PM9A1 MZVL21T0HCLR
3690.18 MB/s -11%
Average Micron 2550 1TB
  (2090 - 4126, n=4)
2931 MB/s -29%
Asus ROG Zephyrus G16 GA605WV
Micron 2400 MTFDKBA1T0QFM
2555 MB/s -38%
4K Read
Lenovo Legion 5 16IRX G9
Samsung PM9A1 MZVL21T0HCLR
81.2 MB/s +7%
Acer Nitro V 16 ANV16-41-R5AT
Micron 2550 1TB
75.62 MB/s
Nubia RedMagic Titan 16 Pro
Samsung PM9A1 MZVL21T0HCLR
69.73 MB/s -8%
Average Micron 2550 1TB
  (59.3 - 75.6, n=4)
65.9 MB/s -13%
Average of class Gaming
  (27.8 - 112.1, n=156, last 2 years)
65.3 MB/s -14%
HP Victus 16 (2024)
Kioxia XG8 KXG80ZNV512G
51.41 MB/s -32%
Asus ROG Zephyrus G16 GA605WV
Micron 2400 MTFDKBA1T0QFM
27.8 MB/s -63%
4K Write
HP Victus 16 (2024)
Kioxia XG8 KXG80ZNV512G
218.1 MB/s +1%
Acer Nitro V 16 ANV16-41-R5AT
Micron 2550 1TB
216.65 MB/s
Average of class Gaming
  (108.8 - 512, n=156, last 2 years)
212 MB/s -2%
Average Micron 2550 1TB
  (176.9 - 218, n=4)
207 MB/s -4%
Nubia RedMagic Titan 16 Pro
Samsung PM9A1 MZVL21T0HCLR
204.43 MB/s -6%
Lenovo Legion 5 16IRX G9
Samsung PM9A1 MZVL21T0HCLR
194.6 MB/s -10%
Asus ROG Zephyrus G16 GA605WV
Micron 2400 MTFDKBA1T0QFM
185.4 MB/s -14%
4K-64 Read
Lenovo Legion 5 16IRX G9
Samsung PM9A1 MZVL21T0HCLR
2619 MB/s +163%
Nubia RedMagic Titan 16 Pro
Samsung PM9A1 MZVL21T0HCLR
2556.31 MB/s +157%
HP Victus 16 (2024)
Kioxia XG8 KXG80ZNV512G
2430.71 MB/s +144%
Average of class Gaming
  (451 - 3475, n=156, last 2 years)
1881 MB/s +89%
Acer Nitro V 16 ANV16-41-R5AT
Micron 2550 1TB
995.45 MB/s
Average Micron 2550 1TB
  (537 - 995, n=4)
731 MB/s -27%
Asus ROG Zephyrus G16 GA605WV
Micron 2400 MTFDKBA1T0QFM
539 MB/s -46%
4K-64 Write
Lenovo Legion 5 16IRX G9
Samsung PM9A1 MZVL21T0HCLR
3253 MB/s +111%
Nubia RedMagic Titan 16 Pro
Samsung PM9A1 MZVL21T0HCLR
2950.72 MB/s +91%
Average of class Gaming
  (277 - 5909, n=156, last 2 years)
2526 MB/s +64%
HP Victus 16 (2024)
Kioxia XG8 KXG80ZNV512G
2238.92 MB/s +45%
Asus ROG Zephyrus G16 GA605WV
Micron 2400 MTFDKBA1T0QFM
1744 MB/s +13%
Average Micron 2550 1TB
  (1424 - 2305, n=4)
1694 MB/s +10%
Acer Nitro V 16 ANV16-41-R5AT
Micron 2550 1TB
1542.24 MB/s
Access Time Read
HP Victus 16 (2024)
Kioxia XG8 KXG80ZNV512G
0.137 ms * -174%
Average Micron 2550 1TB
  (0.05 - 0.092, n=4)
0.0795 ms * -59%
Average of class Gaming
  (0.016 - 0.379, n=155, last 2 years)
0.05538 ms * -11%
Nubia RedMagic Titan 16 Pro
Samsung PM9A1 MZVL21T0HCLR
0.052 ms * -4%
Acer Nitro V 16 ANV16-41-R5AT
Micron 2550 1TB
0.05 ms *
Asus ROG Zephyrus G16 GA605WV
Micron 2400 MTFDKBA1T0QFM
0.027 ms * +46%
Lenovo Legion 5 16IRX G9
Samsung PM9A1 MZVL21T0HCLR
0.021 ms * +58%
Access Time Write
Asus ROG Zephyrus G16 GA605WV
Micron 2400 MTFDKBA1T0QFM
0.139 ms * -348%
Average Micron 2550 1TB
  (0.031 - 0.063, n=4)
0.0495 ms * -60%
Average of class Gaming
  (0.011 - 1.028, n=156, last 2 years)
0.04826 ms * -56%
Acer Nitro V 16 ANV16-41-R5AT
Micron 2550 1TB
0.031 ms *
Nubia RedMagic Titan 16 Pro
Samsung PM9A1 MZVL21T0HCLR
0.021 ms * +32%
Lenovo Legion 5 16IRX G9
Samsung PM9A1 MZVL21T0HCLR
0.02 ms * +35%
HP Victus 16 (2024)
Kioxia XG8 KXG80ZNV512G
0.019 ms * +39%

* ... im mniej tym lepiej

Reading continuous performance: DiskSpd Read Loop, Queue Depth 8

035070010501400175021002450280031503500385042004550490052505600595063006650Tooltip
Acer Nitro V 16 ANV16-41-R5AT Micron 2550 1TB; diskspd 2.0.17 f: Ø4582 (3749.76-4895.8)
Lenovo Legion 5 16IRX G9 Samsung PM9A1 MZVL21T0HCLR; diskspd 2.0.17 f: Ø4118 (3284.7-6662.02)
HP Victus 16 (2024) Kioxia XG8 KXG80ZNV512G; diskspd 2.0.17 f: Ø5625 (4912.19-6954.3)
Nubia RedMagic Titan 16 Pro Samsung PM9A1 MZVL21T0HCLR; diskspd 2.0.17 f: Ø6623 (5874.12-6660.14)
Asus ROG Zephyrus G16 GA605WV Micron 2400 MTFDKBA1T0QFM; diskspd 2.0.17 f: Ø4865 (4284.24-4950.91)

Karta graficzna

Karta graficzna GeForce RTX 4060 to zdecydowanie jedna z najbardziej udanych kart graficznych do laptopów ostatnich lat. Model średniej klasy z generacji Ada Lovelace firmy Nvidia jest wyposażony w 3072 jednostki cieniujące i 8 GB pamięci VRAM GDDR6. Podobnie jak w przypadku RTX 4070jego pamięć VRAM osiągnęła już swoje limity podczas uruchamiania niektórych gier, dlatego też zapaleni gracze powinni zdecydować się na laptopa z układem RTX 4080 (12 GB). Pomimo umiarkowanego TGP wynoszącego 85 watów wewnątrz Nitro V 16, 16-calowy model wypadł całkiem dobrze w syntetycznych testach graficznych w porównaniu z konkurencją, z których niektóre działają z TGP przekraczającym 100 watów.

3DMark Performance Rating - Percent
Average of class Gaming
 
100 pt
Lenovo Legion 5 16IRX G9
NVIDIA GeForce RTX 4060 Laptop GPU, Intel Core i7-14650HX
86.2 pt
Nubia RedMagic Titan 16 Pro
NVIDIA GeForce RTX 4060 Laptop GPU, Intel Core i9-14900HX
82.8 pt
HP Victus 16 (2024)
NVIDIA GeForce RTX 4060 Laptop GPU, Intel Core i7-14700HX
80.3 pt
Average NVIDIA GeForce RTX 4060 Laptop GPU
 
79 pt
Acer Nitro V 16 ANV16-41-R5AT
NVIDIA GeForce RTX 4060 Laptop GPU, AMD Ryzen 7 8845HS
76 pt
Asus ROG Zephyrus G16 GA605WV
NVIDIA GeForce RTX 4060 Laptop GPU, AMD Ryzen AI 9 HX 370
73.5 pt
3DMark 11 - 1280x720 Performance GPU
Average of class Gaming
  (1029 - 72178, n=182, last 2 years)
43857 Points +31%
Lenovo Legion 5 16IRX G9
NVIDIA GeForce RTX 4060 Laptop GPU, Intel Core i7-14650HX
37410 Points +12%
Nubia RedMagic Titan 16 Pro
NVIDIA GeForce RTX 4060 Laptop GPU, Intel Core i9-14900HX
36548 Points +9%
HP Victus 16 (2024)
NVIDIA GeForce RTX 4060 Laptop GPU, Intel Core i7-14700HX
35045 Points +5%
Average NVIDIA GeForce RTX 4060 Laptop GPU
  (28136 - 38912, n=56)
34832 Points +4%
Acer Nitro V 16 ANV16-41-R5AT
NVIDIA GeForce RTX 4060 Laptop GPU, AMD Ryzen 7 8845HS
33404 Points
Asus ROG Zephyrus G16 GA605WV
NVIDIA GeForce RTX 4060 Laptop GPU, AMD Ryzen AI 9 HX 370
32517 Points -3%
3DMark
1920x1080 Fire Strike Graphics
Average of class Gaming
  (781 - 53059, n=193, last 2 years)
31437 Points +23%
Lenovo Legion 5 16IRX G9
NVIDIA GeForce RTX 4060 Laptop GPU, Intel Core i7-14650HX
27474 Points +7%
HP Victus 16 (2024)
NVIDIA GeForce RTX 4060 Laptop GPU, Intel Core i7-14700HX
26844 Points +5%
Nubia RedMagic Titan 16 Pro
NVIDIA GeForce RTX 4060 Laptop GPU, Intel Core i9-14900HX
26573 Points +4%
Average NVIDIA GeForce RTX 4060 Laptop GPU
  (20533 - 29656, n=53)
25748 Points +1%
Acer Nitro V 16 ANV16-41-R5AT
NVIDIA GeForce RTX 4060 Laptop GPU, AMD Ryzen 7 8845HS
25565 Points
Asus ROG Zephyrus G16 GA605WV
NVIDIA GeForce RTX 4060 Laptop GPU, AMD Ryzen AI 9 HX 370
23753 Points -7%
2560x1440 Time Spy Graphics
Average of class Gaming
  (224 - 22717, n=188, last 2 years)
13135 Points +42%
Lenovo Legion 5 16IRX G9
NVIDIA GeForce RTX 4060 Laptop GPU, Intel Core i7-14650HX
11267 Points +22%
Nubia RedMagic Titan 16 Pro
NVIDIA GeForce RTX 4060 Laptop GPU, Intel Core i9-14900HX
10575 Points +14%
HP Victus 16 (2024)
NVIDIA GeForce RTX 4060 Laptop GPU, Intel Core i7-14700HX
9937 Points +7%
Average NVIDIA GeForce RTX 4060 Laptop GPU
  (7484 - 11451, n=55)
9936 Points +7%
Asus ROG Zephyrus G16 GA605WV
NVIDIA GeForce RTX 4060 Laptop GPU, AMD Ryzen AI 9 HX 370
9286 Points 0%
Acer Nitro V 16 ANV16-41-R5AT
NVIDIA GeForce RTX 4060 Laptop GPU, AMD Ryzen 7 8845HS
9254 Points
3DMark 11 Performance
29566 pkt.
3DMark Ice Storm Standard Score
166948 pkt.
3DMark Cloud Gate Standard Score
64085 pkt.
3DMark Fire Strike Score
23112 pkt.
3DMark Time Spy Score
9511 pkt.
Pomoc
Blender
v3.3 Classroom OPTIX/RTX
Acer Nitro V 16 ANV16-41-R5AT
NVIDIA GeForce RTX 4060 Laptop GPU, AMD Ryzen 7 8845HS
25 Seconds *
Lenovo Legion 5 16IRX G9
NVIDIA GeForce RTX 4060 Laptop GPU, Intel Core i7-14650HX
23 Seconds * +8%
Asus ROG Zephyrus G16 GA605WV
NVIDIA GeForce RTX 4060 Laptop GPU, AMD Ryzen AI 9 HX 370
23 Seconds * +8%
Average NVIDIA GeForce RTX 4060 Laptop GPU
  (19 - 28, n=52)
23 Seconds * +8%
HP Victus 16 (2024)
NVIDIA GeForce RTX 4060 Laptop GPU, Intel Core i7-14700HX
22 Seconds * +12%
Nubia RedMagic Titan 16 Pro
NVIDIA GeForce RTX 4060 Laptop GPU, Intel Core i9-14900HX
22 Seconds * +12%
Average of class Gaming
  (9 - 95, n=177, last 2 years)
20.9 Seconds * +16%
v3.3 Classroom CUDA
Asus ROG Zephyrus G16 GA605WV
NVIDIA GeForce RTX 4060 Laptop GPU, AMD Ryzen AI 9 HX 370
44 Seconds * -5%
Nubia RedMagic Titan 16 Pro
NVIDIA GeForce RTX 4060 Laptop GPU, Intel Core i9-14900HX
44 Seconds * -5%
Average NVIDIA GeForce RTX 4060 Laptop GPU
  (39 - 53, n=53)
43.2 Seconds * -3%
Acer Nitro V 16 ANV16-41-R5AT
NVIDIA GeForce RTX 4060 Laptop GPU, AMD Ryzen 7 8845HS
42 Seconds *
Lenovo Legion 5 16IRX G9
NVIDIA GeForce RTX 4060 Laptop GPU, Intel Core i7-14650HX
41 Seconds * +2%
HP Victus 16 (2024)
NVIDIA GeForce RTX 4060 Laptop GPU, Intel Core i7-14700HX
41 Seconds * +2%
Average of class Gaming
  (16 - 175, n=182, last 2 years)
36.5 Seconds * +13%
v3.3 Classroom CPU
Nubia RedMagic Titan 16 Pro
NVIDIA GeForce RTX 4060 Laptop GPU, Intel Core i9-14900HX
394 Seconds * -26%
HP Victus 16 (2024)
NVIDIA GeForce RTX 4060 Laptop GPU, Intel Core i7-14700HX
312 Seconds * -0%
Acer Nitro V 16 ANV16-41-R5AT
NVIDIA GeForce RTX 4060 Laptop GPU, AMD Ryzen 7 8845HS
312 Seconds *
Average NVIDIA GeForce RTX 4060 Laptop GPU
  (189 - 452, n=52)
311 Seconds * -0%
Average of class Gaming
  (138 - 962, n=187, last 2 years)
295 Seconds * +5%
Lenovo Legion 5 16IRX G9
NVIDIA GeForce RTX 4060 Laptop GPU, Intel Core i7-14650HX
247 Seconds * +21%
Asus ROG Zephyrus G16 GA605WV
NVIDIA GeForce RTX 4060 Laptop GPU, AMD Ryzen AI 9 HX 370
221 Seconds * +29%

* ... im mniej tym lepiej

Wydajność w grach

Podczas codziennej rozgrywki Nitro ma tendencję do słabnięcia - przynajmniej w porównaniu do pola porównawczego. Zmierzyliśmy, że inne laptopy z RTX 4060 są czasami o ponad 20% szybsze. Zasadniczo RTX 4060 jest wystarczająco wydajny, aby płynnie uruchamiać prawie wszystkie nowoczesne gry przy maksymalnych ustawieniach w natywnej rozdzielczości ekranu. Tylko podczas grania w wyjątkowo wymagające i/lub słabo zoptymalizowane gry, takie jak Star Wars Outlaws będą Państwo musieli zadowolić się obniżonymi detalami lub skorzystać z DLSS.

Performance Rating - Percent
Lenovo Legion 5 16IRX G9 -1!
Intel Core i7-14650HX, NVIDIA GeForce RTX 4060 Laptop GPU
95.8 pt
Average of class Gaming
 
95.2 pt
Nubia RedMagic Titan 16 Pro
Intel Core i9-14900HX, NVIDIA GeForce RTX 4060 Laptop GPU
89.3 pt
Average NVIDIA GeForce RTX 4060 Laptop GPU
 
82.6 pt
HP Victus 16 (2024) -1!
Intel Core i7-14700HX, NVIDIA GeForce RTX 4060 Laptop GPU
82.4 pt
Asus ROG Zephyrus G16 GA605WV
AMD Ryzen AI 9 HX 370, NVIDIA GeForce RTX 4060 Laptop GPU
75.1 pt
Acer Nitro V 16 ANV16-41-R5AT
AMD Ryzen 7 8845HS, NVIDIA GeForce RTX 4060 Laptop GPU
74.3 pt
Cyberpunk 2077 2.1 Phantom Liberty - 1920x1080 Ultra Preset (FSR off)
Average of class Gaming
  (6.76 - 144.7, n=79, last 2 years)
86.5 fps +30%
Lenovo Legion 5 16IRX G9
Intel Core i7-14650HX, NVIDIA GeForce RTX 4060 Laptop GPU
81.8 (19.5min) fps +23%
Nubia RedMagic Titan 16 Pro
Intel Core i9-14900HX, NVIDIA GeForce RTX 4060 Laptop GPU
74.7 (62min) fps +13%
Average NVIDIA GeForce RTX 4060 Laptop GPU
  (56.4 - 93.1, n=30)
71.5 fps +8%
HP Victus 16 (2024)
Intel Core i7-14700HX, NVIDIA GeForce RTX 4060 Laptop GPU
67.1 (20.8min) fps +1%
Asus ROG Zephyrus G16 GA605WV
AMD Ryzen AI 9 HX 370, NVIDIA GeForce RTX 4060 Laptop GPU
66.4 (55.7min) fps 0%
Acer Nitro V 16 ANV16-41-R5AT
AMD Ryzen 7 8845HS, NVIDIA GeForce RTX 4060 Laptop GPU
66.4 (56min) fps
Baldur's Gate 3 - 1920x1080 Ultra Preset
Average of class Gaming
  (34.5 - 208, n=44, last 2 years)
103.5 fps +28%
Nubia RedMagic Titan 16 Pro
Intel Core i9-14900HX, NVIDIA GeForce RTX 4060 Laptop GPU
96.5 (62.4min, 71.2P0.1, 81.3P1) fps +19%
Average NVIDIA GeForce RTX 4060 Laptop GPU
  (66.5 - 105.5, n=18)
84.6 fps +5%
Asus ROG Zephyrus G16 GA605WV
AMD Ryzen AI 9 HX 370, NVIDIA GeForce RTX 4060 Laptop GPU
82.9 fps +2%
Acer Nitro V 16 ANV16-41-R5AT
AMD Ryzen 7 8845HS, NVIDIA GeForce RTX 4060 Laptop GPU
80.9 (25.2min, 31.9P0.1, 55.1P1) fps
GTA V - 1920x1080 Highest Settings possible AA:4xMSAA + FX AF:16x
Lenovo Legion 5 16IRX G9
Intel Core i7-14650HX, NVIDIA GeForce RTX 4060 Laptop GPU
120.2 (4.33min, 76.9P1) fps +15%
Nubia RedMagic Titan 16 Pro
Intel Core i9-14900HX, NVIDIA GeForce RTX 4060 Laptop GPU
118.4 (4.07min, 83.3P1) fps +13%
Average of class Gaming
  (12.1 - 167.7, n=168, last 2 years)
113.7 fps +9%
HP Victus 16 (2024)
Intel Core i7-14700HX, NVIDIA GeForce RTX 4060 Laptop GPU
110.2 (8.03min, 76.9P1) fps +5%
Average NVIDIA GeForce RTX 4060 Laptop GPU
  (76.9 - 126.3, n=47)
107.6 fps +3%
Acer Nitro V 16 ANV16-41-R5AT
AMD Ryzen 7 8845HS, NVIDIA GeForce RTX 4060 Laptop GPU
104.6 (17.5min, 71.4P1) fps
Asus ROG Zephyrus G16 GA605WV
AMD Ryzen AI 9 HX 370, NVIDIA GeForce RTX 4060 Laptop GPU
100.1 (4.02min, 66.7P1) fps -4%
Final Fantasy XV Benchmark - 1920x1080 High Quality
Average of class Gaming
  (19.2 - 201, n=180, last 2 years)
119.9 fps +25%
Lenovo Legion 5 16IRX G9
Intel Core i7-14650HX, NVIDIA GeForce RTX 4060 Laptop GPU
106.3 fps +11%
Nubia RedMagic Titan 16 Pro
Intel Core i9-14900HX, NVIDIA GeForce RTX 4060 Laptop GPU
105.4 fps +10%
HP Victus 16 (2024)
Intel Core i7-14700HX, NVIDIA GeForce RTX 4060 Laptop GPU
98.1 fps +2%
Average NVIDIA GeForce RTX 4060 Laptop GPU
  (75.1 - 109.8, n=50)
97.3 fps +1%
Acer Nitro V 16 ANV16-41-R5AT
AMD Ryzen 7 8845HS, NVIDIA GeForce RTX 4060 Laptop GPU
96.1 fps
Asus ROG Zephyrus G16 GA605WV
AMD Ryzen AI 9 HX 370, NVIDIA GeForce RTX 4060 Laptop GPU
90.7 fps -6%
Strange Brigade - 1920x1080 ultra AA:ultra AF:16
Average of class Gaming
  (38.9 - 421, n=178, last 2 years)
229 fps +35%
Lenovo Legion 5 16IRX G9
Intel Core i7-14650HX, NVIDIA GeForce RTX 4060 Laptop GPU
210 fps +24%
Nubia RedMagic Titan 16 Pro
Intel Core i9-14900HX, NVIDIA GeForce RTX 4060 Laptop GPU
189.2 (10.3min, 139.1P1) fps +11%
Average NVIDIA GeForce RTX 4060 Laptop GPU
  (135.3 - 210, n=49)
181.3 fps +7%
HP Victus 16 (2024)
Intel Core i7-14700HX, NVIDIA GeForce RTX 4060 Laptop GPU
179 (76.4min, 130.3P1) fps +5%
Asus ROG Zephyrus G16 GA605WV
AMD Ryzen AI 9 HX 370, NVIDIA GeForce RTX 4060 Laptop GPU
174.9 (77.7min, 128P1) fps +3%
Acer Nitro V 16 ANV16-41-R5AT
AMD Ryzen 7 8845HS, NVIDIA GeForce RTX 4060 Laptop GPU
169.7 (30.6min, 122.4P1) fps
Dota 2 Reborn - 1920x1080 ultra (3/3) best looking
Lenovo Legion 5 16IRX G9
Intel Core i7-14650HX, NVIDIA GeForce RTX 4060 Laptop GPU
168.7 (146.8min) fps +29%
Average of class Gaming
  (33.2 - 220, n=186, last 2 years)
150.5 fps +15%
HP Victus 16 (2024)
Intel Core i7-14700HX, NVIDIA GeForce RTX 4060 Laptop GPU
149.7 (130.4min) fps +15%
Nubia RedMagic Titan 16 Pro
Intel Core i9-14900HX, NVIDIA GeForce RTX 4060 Laptop GPU
146.9 (123.2min) fps +13%
Average NVIDIA GeForce RTX 4060 Laptop GPU
  (115 - 183.8, n=52)
145 fps +11%
Asus ROG Zephyrus G16 GA605WV
AMD Ryzen AI 9 HX 370, NVIDIA GeForce RTX 4060 Laptop GPU
139.2 (118.4min) fps +7%
Acer Nitro V 16 ANV16-41-R5AT
AMD Ryzen 7 8845HS, NVIDIA GeForce RTX 4060 Laptop GPU
130.5 (112.8min) fps
X-Plane 11.11 - 1920x1080 high (fps_test=3)
Lenovo Legion 5 16IRX G9
Intel Core i7-14650HX, NVIDIA GeForce RTX 4060 Laptop GPU
130.9 fps +116%
Nubia RedMagic Titan 16 Pro
Intel Core i9-14900HX, NVIDIA GeForce RTX 4060 Laptop GPU
117.2 fps +93%
Average of class Gaming
  (31.5 - 166.2, n=192, last 2 years)
108.1 fps +78%
Average NVIDIA GeForce RTX 4060 Laptop GPU
  (60.7 - 141.1, n=53)
102.1 fps +68%
HP Victus 16 (2024)
Intel Core i7-14700HX, NVIDIA GeForce RTX 4060 Laptop GPU
100.3 fps +65%
Asus ROG Zephyrus G16 GA605WV
AMD Ryzen AI 9 HX 370, NVIDIA GeForce RTX 4060 Laptop GPU
66.5 fps +10%
Acer Nitro V 16 ANV16-41-R5AT
AMD Ryzen 7 8845HS, NVIDIA GeForce RTX 4060 Laptop GPU
60.7 fps
lowmed.highultra
GTA V (2015) 175.8 167.8 104.6
Dota 2 Reborn (2015) 161.6 156 138.3 130.5
Final Fantasy XV Benchmark (2018) 205 130.8 96.1
X-Plane 11.11 (2018) 87.1 87.7 60.7
Strange Brigade (2018) 251 200 169.7
Baldur's Gate 3 (2023) 98.3 83.1 80.9
Cyberpunk 2077 2.1 Phantom Liberty (2023) 90.6 77.2 66.4
Prince of Persia The Lost Crown (2024) 345 340 337
Star Wars Outlaws (2024) 42.6 35.6 29.1
Space Marine 2 (2024) 76.9 76 67.8
Final Fantasy XVI (2024) 64 54.8 50.4
God of War Ragnarök (2024) 102.8 88 80.2
Until Dawn (2024) 80.1 56.8 43.2
Call of Duty Black Ops 6 (2024) 116 80 76
Stalker 2 (2024) 54.1 48.1 40.2
Cyberpunk 2077 2.1 Phantom Liberty
1920x1080 Medium Preset (FSR off)
Lenovo Legion 5 16IRX G9
Intel Core i7-14650HX, NVIDIA GeForce RTX 4060 Laptop GPU
110.4 (18.7min) fps +22%
Nubia RedMagic Titan 16 Pro
Intel Core i9-14900HX, NVIDIA GeForce RTX 4060 Laptop GPU
101.1 (86.5min) fps +12%
Average of class Gaming
  (7.27 - 185.2, n=57, last 2 years)
101 fps +11%
Average NVIDIA GeForce RTX 4060 Laptop GPU
  (77.7 - 110.4, n=22)
93.8 fps +4%
Acer Nitro V 16 ANV16-41-R5AT
AMD Ryzen 7 8845HS, NVIDIA GeForce RTX 4060 Laptop GPU
90.6 (78min) fps
HP Victus 16 (2024)
Intel Core i7-14700HX, NVIDIA GeForce RTX 4060 Laptop GPU
90 (47.2min) fps -1%
Asus ROG Zephyrus G16 GA605WV
AMD Ryzen AI 9 HX 370, NVIDIA GeForce RTX 4060 Laptop GPU
90 (77.6min) fps -1%
1920x1080 High Preset (FSR off)
Lenovo Legion 5 16IRX G9
Intel Core i7-14650HX, NVIDIA GeForce RTX 4060 Laptop GPU
95.3 (18.5min) fps +23%
Average of class Gaming
  (7.4 - 164.5, n=59, last 2 years)
92.2 fps +19%
Nubia RedMagic Titan 16 Pro
Intel Core i9-14900HX, NVIDIA GeForce RTX 4060 Laptop GPU
86.2 (73min) fps +12%
Average NVIDIA GeForce RTX 4060 Laptop GPU
  (65.2 - 102, n=25)
80.6 fps +4%
Acer Nitro V 16 ANV16-41-R5AT
AMD Ryzen 7 8845HS, NVIDIA GeForce RTX 4060 Laptop GPU
77.2 (66min) fps
HP Victus 16 (2024)
Intel Core i7-14700HX, NVIDIA GeForce RTX 4060 Laptop GPU
76.9 (24min) fps 0%
Asus ROG Zephyrus G16 GA605WV
AMD Ryzen AI 9 HX 370, NVIDIA GeForce RTX 4060 Laptop GPU
75.2 (64min) fps -3%
1920x1080 Ultra Preset (FSR off)
Average of class Gaming
  (6.76 - 144.7, n=79, last 2 years)
86.5 fps +30%
Lenovo Legion 5 16IRX G9
Intel Core i7-14650HX, NVIDIA GeForce RTX 4060 Laptop GPU
81.8 (19.5min) fps +23%
Nubia RedMagic Titan 16 Pro
Intel Core i9-14900HX, NVIDIA GeForce RTX 4060 Laptop GPU
74.7 (62min) fps +13%
Average NVIDIA GeForce RTX 4060 Laptop GPU
  (56.4 - 93.1, n=30)
71.5 fps +8%
HP Victus 16 (2024)
Intel Core i7-14700HX, NVIDIA GeForce RTX 4060 Laptop GPU
67.1 (20.8min) fps +1%
Asus ROG Zephyrus G16 GA605WV
AMD Ryzen AI 9 HX 370, NVIDIA GeForce RTX 4060 Laptop GPU
66.4 (55.7min) fps 0%
Acer Nitro V 16 ANV16-41-R5AT
AMD Ryzen 7 8845HS, NVIDIA GeForce RTX 4060 Laptop GPU
66.4 (56min) fps

Przetestowaliśmy, czy wydajność GPU utrzymuje się na stałym poziomie przez dłuższy czas, używając Cyberpunk 2077. Nie odnotowaliśmy żadnych nieprawidłowości w tym zakresie.

Cyberpunk 2077 ultra FPS diagram

05101520253035404550556065Tooltip
Acer Nitro V 16 ANV16-41-R5AT R7 8845HS, NVIDIA GeForce RTX 4060 Laptop GPU: Ø64.2 (61.7-64.8)
Nubia RedMagic Titan 16 Pro i9-14900HX, NVIDIA GeForce RTX 4060 Laptop GPU: Ø67.6 (60.1-69.2)
Asus ROG Zephyrus G16 GA605WV Ryzen AI 9 HX 370, NVIDIA GeForce RTX 4060 Laptop GPU: Ø62.3 (54.5-62.9)

Emisje

Emisja hałasu

Obok wyświetlacza, jedną z największych słabości Nitro V 16 okazała się pomylona kontrola wentylatorów. Nawet w trybie zrównoważonym wentylatory mają tendencję do niepotrzebnego przyspieszania, gdy pojawiają się małe rzeczy, takie jak otwieranie przeglądarki. Skoki prędkości tam i z powrotem mogą być dość irytujące w praktyce, dlatego Acer zdecydowanie powinien wprowadzić ulepszenia w tym zakresie. 16-calowe urządzenie jest generalnie dość głośne pod obciążeniem. Powyżej 50 dB(A) zdecydowanie wymaga użycia zestawu słuchawkowego.

Hałas

luz
25 / 28 / 37 dB
obciążenie
51 / 52 dB
  red to green bar
 
 
30 dB
cichy
40 dB(A)
słyszalny
50 dB(A)
irytujący
 
min: dark, med: mid, max: light   Earthworks M23R, Arta (odległość 15 cm)   environment noise: 25 dB(A)
dB(A) 0102030405060708090Deep BassMiddle BassHigh BassLower RangeMidsHigher MidsLower HighsMid HighsUpper HighsSuper Highs2048.447.94346.140.241.12542.243.540.942.840.837.63148.84751.747.847.246.14034.830.232.132.231.228.55043.526.628.233.232.132.56331.330.52524.324.730.58025.119.217.316.815.522.910024.517.315.314.113.82312528.620.12014.214.826.816027.220.717.816.615.326.920030.124.220.620.819.230.725028.821.318.118.416.529.331529.320.918.814.513.630.340032.62416.713.213.733.950033.325.822.511.81234.763036.326.418.51111.537.580037.526.816.410.31338.8100039.327.616.711.111.640.1125041.429.21711.311.442.5160042.829.416.911.411.343.5200041.328.815.212.31241.9250039.924.213.812.812.240.8315039.220.213.713.812.739.2400038.220.61514.613.239.150003718.81413.913.837.3630034.116.213.914.414.634.7800029.814.91414.214.431.51000027.416.313.913.814.628.61250021.414.513.113.114.523.11600019.216.313.213.212.619.1SPL50.837.528.325.425.351.6N7.12.410.70.77.5median 33.3median 20.9median 16.4median 13.8median 13.6median 34.7Delta5.64.72.11.21.36.2hearing rangehide median Fan NoiseAcer Nitro V 16 ANV16-41-R5AT
Acer Nitro V 16 ANV16-41-R5AT
R7 8845HS, NVIDIA GeForce RTX 4060 Laptop GPU
Lenovo Legion 5 16IRX G9
i7-14650HX, NVIDIA GeForce RTX 4060 Laptop GPU
HP Victus 16 (2024)
i7-14700HX, NVIDIA GeForce RTX 4060 Laptop GPU
Nubia RedMagic Titan 16 Pro
i9-14900HX, NVIDIA GeForce RTX 4060 Laptop GPU
Asus ROG Zephyrus G16 GA605WV
Ryzen AI 9 HX 370, NVIDIA GeForce RTX 4060 Laptop GPU
Noise
4%
3%
-10%
6%
off / environment *
25
24
4%
25
-0%
26
-4%
24.6
2%
Idle Minimum *
25
24
4%
28
-12%
35
-40%
28.6
-14%
Idle Average *
28
28.8
-3%
29
-4%
36
-29%
28.6
-2%
Idle Maximum *
37
32
14%
33
11%
40
-8%
28.6
23%
Load Average *
51
45.5
11%
45
12%
49
4%
42.8
16%
Cyberpunk 2077 ultra *
54
50
7%
48.3
11%
Load Maximum *
52
55.7
-7%
48
8%
52
-0%
48.3
7%
Witcher 3 ultra *
53.1
43

* ... im mniej tym lepiej

Temperatura

Z drugiej strony, jej temperatury pozostawały w akceptowalnym zakresie podczas naszych testów. Choć spód obudowy nagrzewał się miejscami do prawie 50 °C pod obciążeniem, to góra nie nagrzewała się zbytnio, osiągając maksymalnie 42 °C. W trybie bezczynności sytuacja - tj. stosunek między górą a dołem - wyglądała podobnie.

 39 °C41 °C38 °C 
 35 °C37 °C34 °C 
 28 °C30 °C29 °C 
maks. w ogóle: 41 °C
średnia: 34.6 °C
49 °C47 °C44 °C
41 °C43 °C44 °C
29 °C29 °C28 °C
maks. w ogóle: 49 °C
średnia: 39.3 °C
zasilacz  46 °C | temperatura otoczenia 21 °C | Fluke t3000FC (calibrated), Voltcraft IR-900
(±) The average temperature for the upper side under maximal load is 34.6 °C / 94 F, compared to the average of 33.9 °C / 93 F for the devices in the class Gaming.
(±) The maximum temperature on the upper side is 41 °C / 106 F, compared to the average of 40.5 °C / 105 F, ranging from 21.2 to 68.8 °C for the class Gaming.
(-) The bottom heats up to a maximum of 49 °C / 120 F, compared to the average of 43.2 °C / 110 F
(+) In idle usage, the average temperature for the upper side is 30.1 °C / 86 F, compared to the device average of 33.9 °C / 93 F.
(±) 3: The average temperature for the upper side is 34.9 °C / 95 F, compared to the average of 33.9 °C / 93 F for the class Gaming.
(+) The palmrests and touchpad are cooler than skin temperature with a maximum of 30 °C / 86 F and are therefore cool to the touch.
(±) The average temperature of the palmrest area of similar devices was 28.9 °C / 84 F (-1.1 °C / -2 F).
Acer Nitro V 16 ANV16-41-R5AT
R7 8845HS, NVIDIA GeForce RTX 4060 Laptop GPU
Lenovo Legion 5 16IRX G9
i7-14650HX, NVIDIA GeForce RTX 4060 Laptop GPU
HP Victus 16 (2024)
i7-14700HX, NVIDIA GeForce RTX 4060 Laptop GPU
Nubia RedMagic Titan 16 Pro
i9-14900HX, NVIDIA GeForce RTX 4060 Laptop GPU
Asus ROG Zephyrus G16 GA605WV
Ryzen AI 9 HX 370, NVIDIA GeForce RTX 4060 Laptop GPU
Heat
6%
7%
-6%
3%
Maximum Upper Side *
41
40.4
1%
50
-22%
50
-22%
48.2
-18%
Maximum Bottom *
49
43.8
11%
50
-2%
58
-18%
51.3
-5%
Idle Upper Side *
32
30.3
5%
25
22%
31
3%
28
12%
Idle Bottom *
37
35.3
5%
26
30%
32
14%
28.8
22%

* ... im mniej tym lepiej

Test warunków skrajnych

Nie ma też powodów do obaw o podzespoły laptopa. Zarówno podczas uruchamiania gry Cyberpunk 2077, jak i podczas testu obciążeniowego z wykorzystaniem narzędzi Furmark i Prime95, temperatura CPU i GPU ustabilizowała się na poziomie nieco poniżej 70 °C, co jest całkowicie nieszkodliwe.

Furmark & Prime95
Furmark & Prime95
Furmark & Prime95
Furmark & Prime95
Furmark & Prime95
Furmark & Prime95
Cyberpunk 2077
Cyberpunk 2077
Cyberpunk 2077
Cyberpunk 2077
Cyberpunk 2077
Cyberpunk 2077

Głośniki

System 2.0 oferuje dobry maksymalny poziom 82 dB(A), ale - jak wiemy z większości laptopów - wykazuje słabości, jeśli chodzi o basy. Jego jakość dźwięku jest wystarczająca do okazjonalnego oglądania filmów na YouTube itp., ale do bardziej intensywnego korzystania z multimediów (filmy, muzyka, gry, ...) należy podłączyć zewnętrzne głośniki lub zestaw słuchawkowy, jeśli to możliwe.

dB(A) 0102030405060708090Deep BassMiddle BassHigh BassLower RangeMidsHigher MidsLower HighsMid HighsUpper HighsSuper Highs2040.242.62540.8383147.244.54031.233.15032.128.26324.729.98015.520.810013.818.912514.827.216015.336.120019.247.325016.560.531513.663.940013.769.65001270.563011.574.38001374.2100011.672.2125011.469.9160011.370.720001269.6250012.267315012.769.4400013.268.4500013.867.2630014.666.1800014.470.51000014.674.11250014.572.31600012.667.6SPL25.382.5N0.757.5median 13.6median 69.4Delta1.36.526.325.821.422.12624.925.127.622.532.523.448.72655.818.860.922.167.2267019.372.317.674.217.774.319.575.31571.711.871.311.27410.574.21072.710.17210.67210.97511.374.811.671.71269.71269.612.371.112.669.61270.111.269.824.784.70.666.6median 12median 71.73.42.2hearing rangehide median Pink NoiseAcer Nitro V 16 ANV16-41-R5ATApple MacBook Pro 16 2021 M1 Pro
Frequency diagram (checkboxes can be checked and unchecked to compare devices)
Acer Nitro V 16 ANV16-41-R5AT audio analysis

(+) | speakers can play relatively loud (82 dB)
Bass 100 - 315 Hz
(-) | nearly no bass - on average 27.1% lower than median
(±) | linearity of bass is average (14% delta to prev. frequency)
Mids 400 - 2000 Hz
(+) | balanced mids - only 2% away from median
(+) | mids are linear (3.8% delta to prev. frequency)
Highs 2 - 16 kHz
(+) | balanced highs - only 2.1% away from median
(+) | highs are linear (4.2% delta to prev. frequency)
Overall 100 - 16.000 Hz
(±) | linearity of overall sound is average (16% difference to median)
Compared to same class
» 37% of all tested devices in this class were better, 6% similar, 57% worse
» The best had a delta of 6%, average was 18%, worst was 132%
Compared to all devices tested
» 22% of all tested devices were better, 5% similar, 73% worse
» The best had a delta of 4%, average was 25%, worst was 134%

Apple MacBook Pro 16 2021 M1 Pro audio analysis

(+) | speakers can play relatively loud (84.7 dB)
Bass 100 - 315 Hz
(+) | good bass - only 3.8% away from median
(+) | bass is linear (5.2% delta to prev. frequency)
Mids 400 - 2000 Hz
(+) | balanced mids - only 1.3% away from median
(+) | mids are linear (2.1% delta to prev. frequency)
Highs 2 - 16 kHz
(+) | balanced highs - only 1.9% away from median
(+) | highs are linear (2.7% delta to prev. frequency)
Overall 100 - 16.000 Hz
(+) | overall sound is linear (4.6% difference to median)
Compared to same class
» 0% of all tested devices in this class were better, 0% similar, 100% worse
» The best had a delta of 5%, average was 18%, worst was 45%
Compared to all devices tested
» 0% of all tested devices were better, 0% similar, 100% worse
» The best had a delta of 4%, average was 25%, worst was 134%

Zarządzanie energią

Zużycie energii

Dzięki procesorowi Ryzen, Nitro V 16 jest najbardziej oszczędnym przedstawicielem w naszym polu testowym. od 9 do 13 watów w trybie bezczynności i od 61 do 134 watów pod obciążeniem w niektórych przypadkach wyraźnie przewyższały konkurencję Intela.

Pobór mocy
wyłączony / stan wstrzymaniadarklight 0.1 / 0.8 W
luzdarkmidlight 9 / 10 / 13 W
obciążenie midlight 61 / 134 W
 color bar
Legenda: min: dark, med: mid, max: light        Metrahit Energy
Acer Nitro V 16 ANV16-41-R5AT
R7 8845HS, NVIDIA GeForce RTX 4060 Laptop GPU
Lenovo Legion 5 16IRX G9
i7-14650HX, NVIDIA GeForce RTX 4060 Laptop GPU
HP Victus 16 (2024)
i7-14700HX, NVIDIA GeForce RTX 4060 Laptop GPU
Nubia RedMagic Titan 16 Pro
i9-14900HX, NVIDIA GeForce RTX 4060 Laptop GPU
Asus ROG Zephyrus G16 GA605WV
Ryzen AI 9 HX 370, NVIDIA GeForce RTX 4060 Laptop GPU
Average of class Gaming
 
Power Consumption
-76%
-62%
-80%
-13%
-81%
Idle Minimum *
9
15.4
-71%
9
-0%
16
-78%
6.9
23%
Idle Average *
10
19.7
-97%
15
-50%
19
-90%
12.6
-26%
Idle Maximum *
13
20.7
-59%
23
-77%
27
-108%
13
-0%
Load Average *
61
102.6
-68%
123
-102%
123
-102%
84.1
-38%
Cyberpunk 2077 ultra *
118.9
184.3
-55%
127.2
-7%
Cyberpunk 2077 ultra external monitor *
116.3
174.2
-50%
124.5
-7%
Load Maximum *
134
246.6
-84%
241
-80%
240
-79%
177.6
-33%
Witcher 3 ultra *
191.3
143.7

* ... im mniej tym lepiej

Power consumption Cyberpunk / stress test

0102030405060708090100110120130Tooltip
Acer Nitro V 16 ANV16-41-R5AT; 1280x720 Prime95 28.10 and Furmark 1.25: Ø121.9 (115.9-134)
Acer Nitro V 16 ANV16-41-R5AT; Idle 150cd/m2: Ø10 (9-13.3)
Acer Nitro V 16 ANV16-41-R5AT; Cyberpunk 2077 FHD ultra no FSR 150cd: Ø118.9 (115.6-122.8)

Power consumption with external monitor

0102030405060708090100110120Tooltip
Acer Nitro V 16 ANV16-41-R5AT; Prime95 V2810 Stress (external Monitor): Ø85.6 (84.8-99.4)
Acer Nitro V 16 ANV16-41-R5AT; Cinebench R23 Multi (external Monitor): Ø86.4 (84.1-99.1)
Acer Nitro V 16 ANV16-41-R5AT; 1280x720 FurMark 1.19 GPU Stress Test (external Monitor): Ø111.1 (103-119.7)
Acer Nitro V 16 ANV16-41-R5AT; Idle 1min (external Monitor): Ø16.5 (14.1-23.4)
Acer Nitro V 16 ANV16-41-R5AT; Cyberpunk 2077 FHD ultra no FSR (external Monitor): Ø116.3 (114-121.6)

Czas trwania

Fakt, że żywotność baterii nie jest najlepsza, wynika głównie ze skromnej pojemności. Chociaż w obudowie laptopa byłoby więcej miejsca, Acer dał V 16 pojemność tylko 57 Wh. Z drugiej strony konkurencja może pochwalić się pojemnością od 80 do 90 Wh. W rezultacie niecałe 6 godzin w naszym teście WLAN przy jasności zredukowanej do 150 cd/m² jest odpowiednio tylko przeciętne. Innymi słowy: Jest tu jeszcze wiele do zrobienia.

Wydajność akumulatora
WiFi Websurfing
5h 56min
Acer Nitro V 16 ANV16-41-R5AT
R7 8845HS, NVIDIA GeForce RTX 4060 Laptop GPU, 57 Wh
Lenovo Legion 5 16IRX G9
i7-14650HX, NVIDIA GeForce RTX 4060 Laptop GPU, 80 Wh
HP Victus 16 (2024)
i7-14700HX, NVIDIA GeForce RTX 4060 Laptop GPU, 83 Wh
Nubia RedMagic Titan 16 Pro
i9-14900HX, NVIDIA GeForce RTX 4060 Laptop GPU, 80.1 Wh
Asus ROG Zephyrus G16 GA605WV
Ryzen AI 9 HX 370, NVIDIA GeForce RTX 4060 Laptop GPU, 90 Wh
Average of class Gaming
 
Czasy pracy
25%
44%
-21%
34%
6%
WiFi v1.3
356
444
25%
511
44%
280
-21%
478
34%
H.264
576
316
824
Load
46
76
103
Reader / Idle
481

Łączna ocena Notebookcheck

Dzięki mocniejszemu wyświetlaczowi i lepszemu sterowaniu wentylatorem, Acer Nitro V 16 mógłby być imponującym laptopem do gier w tej cenie. Jednak w obecnej formie wielu konkurentów ma przewagę.

Acer Nitro V 16 ANV16-41-R5AT - 04/12/2024 v8
Florian Glaser

Wykonanie
73 / 98 → 74%
Klawiatura
74%
Myszka
72%
Komunikacja
64 / 80 → 81%
Waga
60 / 10-68 → 86%
Akumulator
68 / 95 → 72%
Wyświetlacz
74%
Wydajność w grach
78%
Wydajność w programach użytkowych
85%
AI Performance
88%
Temperatura
87 / 95 → 91%
Hałas
60 / 90 → 67%
Głośniki
76%
Kamerka
32 / 75 → 43%
Średnio
59%
76%
Gaming - Ważona średnia
CO2 Emissions
No Data
Materials
0%
Packaging
50%
Power Use
83.1%
Repairability
50%
Software Updates
22.3%
Recycle Logo Total Sustainability Score: 34.2%

Transparency

The selection of devices to be reviewed is made by our editorial team. The test sample was provided to the author as a loan by the manufacturer or retailer for the purpose of this review. The lender had no influence on this review, nor did the manufacturer receive a copy of this review before publication. There was no obligation to publish this review. We never accept compensation or payment in return for our reviews. As an independent media company, Notebookcheck is not subjected to the authority of manufacturers, retailers or publishers.

This is how Notebookcheck is testing

Every year, Notebookcheck independently reviews hundreds of laptops and smartphones using standardized procedures to ensure that all results are comparable. We have continuously developed our test methods for around 20 years and set industry standards in the process. In our test labs, high-quality measuring equipment is utilized by experienced technicians and editors. These tests involve a multi-stage validation process. Our complex rating system is based on hundreds of well-founded measurements and benchmarks, which maintains objectivity. Further information on our test methods can be found here.

Please share our article, every link counts!
Mail Logo
> laptopy testy i recenzje notebooki > Laptopy > Recenzja Acer Nitro V 16 ANV16-41: Niedrogi laptop do gier z zaczepem
Florian Glaser, 2024-12- 7 (Update: 2024-12- 7)