

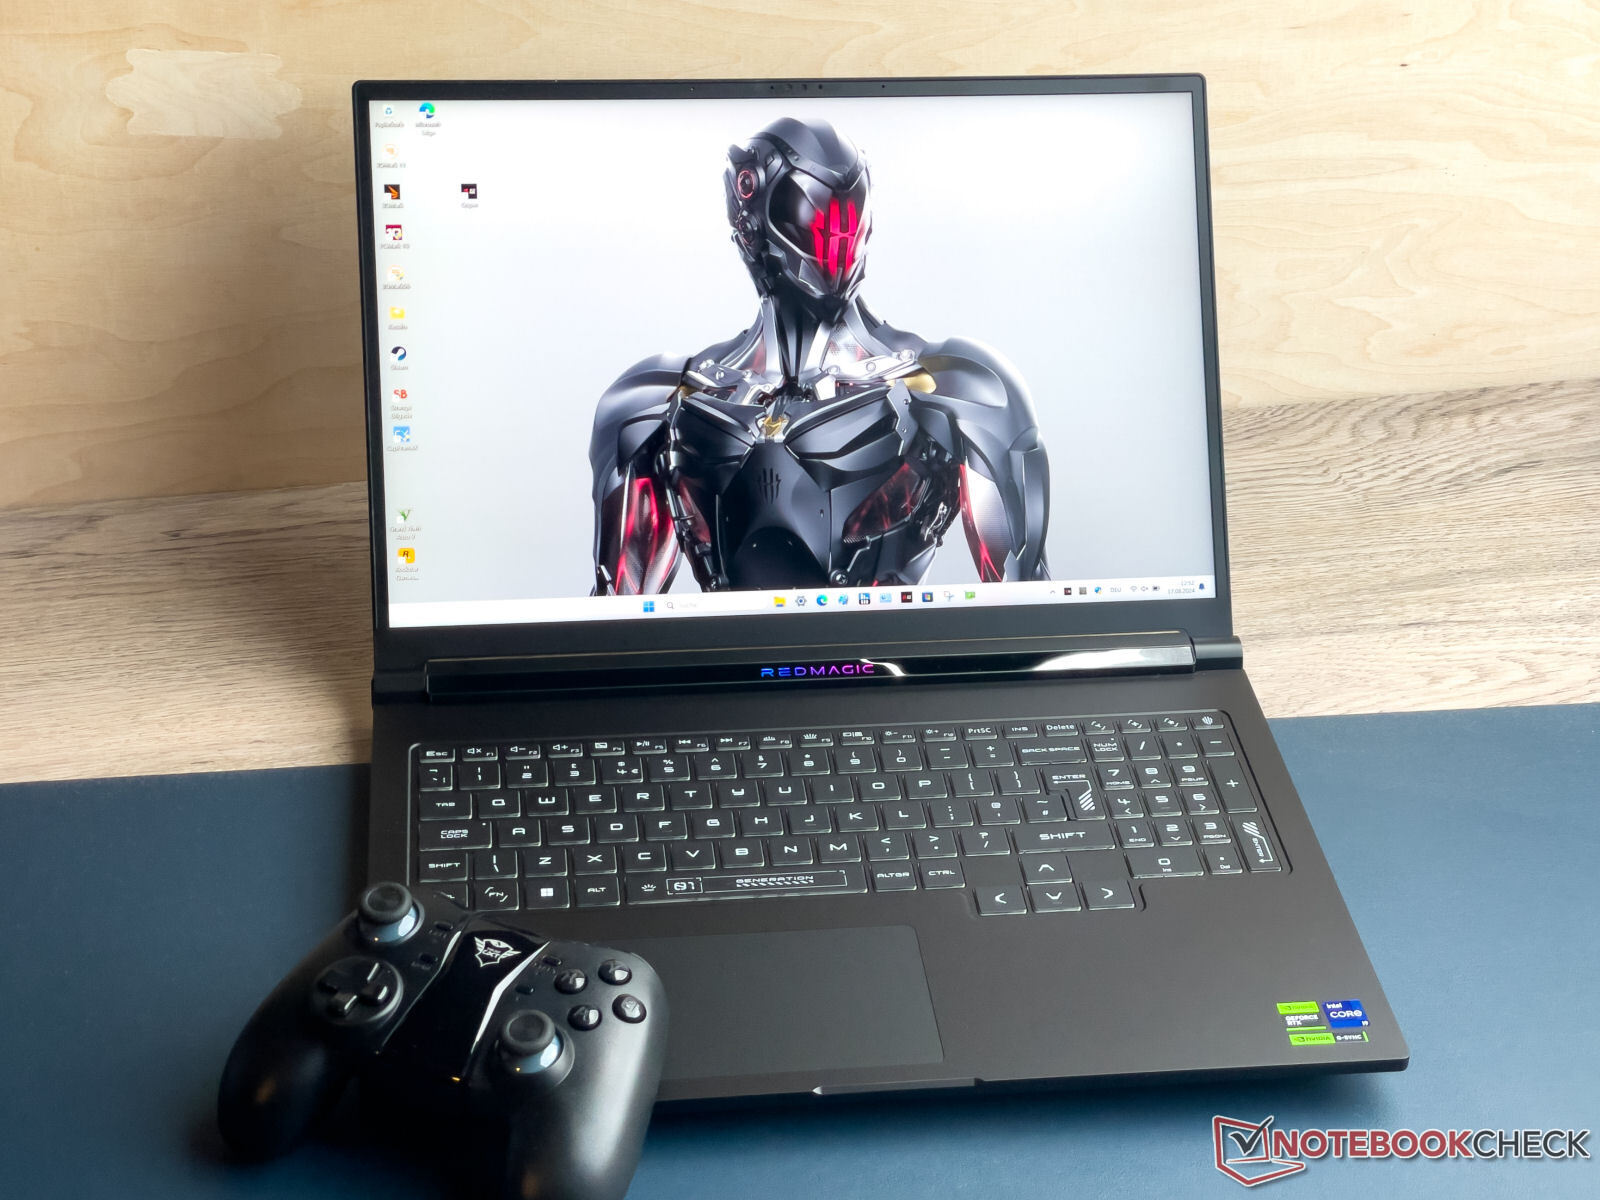
Recenzja RedMagic Titan 16 Pro: Laptop do gier stworzony przez producenta smartfonów

Stali bywalcy tej strony mogą już znać markę "RedMagic" z segmentu smartfonów do gier (na przykład Nubia RedMagic 9 Pro). RedMagic Titan 16 Pro to pierwszy krok Nubii w świecie laptopów do gier. Jego arkusz danych nie zawiera żadnych niespodzianek: A Core i9-14900HX jest sparowany z kartą graficzną GeForce RTX 4060. Do tego dochodzi 16-calowy ekran o proporcjach 16:10, Thunderbolt 4, pamięć RAM DDR5 i 2 gniazda SSD.
Czy Nubia będzie w stanie sprostać już ugruntowanej konkurencji, dopiero się okaże. Titan konkuruje z następującymi urządzeniami: Lenovo Legion Pro 5 16IRX9, HP Victus 16 (2024), Acer Predator Helios Neo 16 (2024), XMG Pro 16 Studio (Mid 24) oraz Gigabyte G6X 9KG (2024).
Potencjalni konkurenci w porównaniu
Ocena | Wersja | Data | Model | Waga | Wysokość | Rozmiar | Rezolucja | Cena |
|---|---|---|---|---|---|---|---|---|
| 81.2 % | v8 | 08/2024 | Nubia RedMagic Titan 16 Pro i9-14900HX, NVIDIA GeForce RTX 4060 Laptop GPU | 2.4 kg | 23.9 mm | 16.00" | 2560x1600 | |
| 82.3 % | v8 | 07/2024 | Lenovo Legion Pro 5 16IRX9 G9 i7-14700HX, NVIDIA GeForce RTX 4060 Laptop GPU | 2.5 kg | 26.55 mm | 16.00" | 2560x1600 | |
| 84.3 % v7 (old) | v7 (old) | 05/2024 | HP Victus 16 (2024) i7-14700HX, NVIDIA GeForce RTX 4060 Laptop GPU | 2.4 kg | 23.9 mm | 16.10" | 1920x1080 | |
| 86.8 % v7 (old) | v7 (old) | 05/2024 | Acer Predator Helios Neo 16 (2024) i7-14700HX, NVIDIA GeForce RTX 4070 Laptop GPU | 2.6 kg | 25.95 mm | 16.00" | 2560x1600 | |
| 81.2 % | v8 | 07/2024 | SCHENKER XMG Pro 16 Studio (Mid 24) i9-14900HX, NVIDIA GeForce RTX 4070 Laptop GPU | 2.3 kg | 19.9 mm | 16.00" | 2560x1600 | |
| 83.2 % v7 (old) | v7 (old) | 03/2024 | Gigabyte G6X 9KG (2024) i7-13650HX, NVIDIA GeForce RTX 4060 Laptop GPU | 2.6 kg | 25.1 mm | 16.00" | 1920x1200 |
Prosimy pamiętać: Niedawno zaktualizowaliśmy nasz system oceny i wyniki wersji 8 nie są porównywalne z wynikami wersji 7. Więcej informacji znajdą Państwo tutaj.
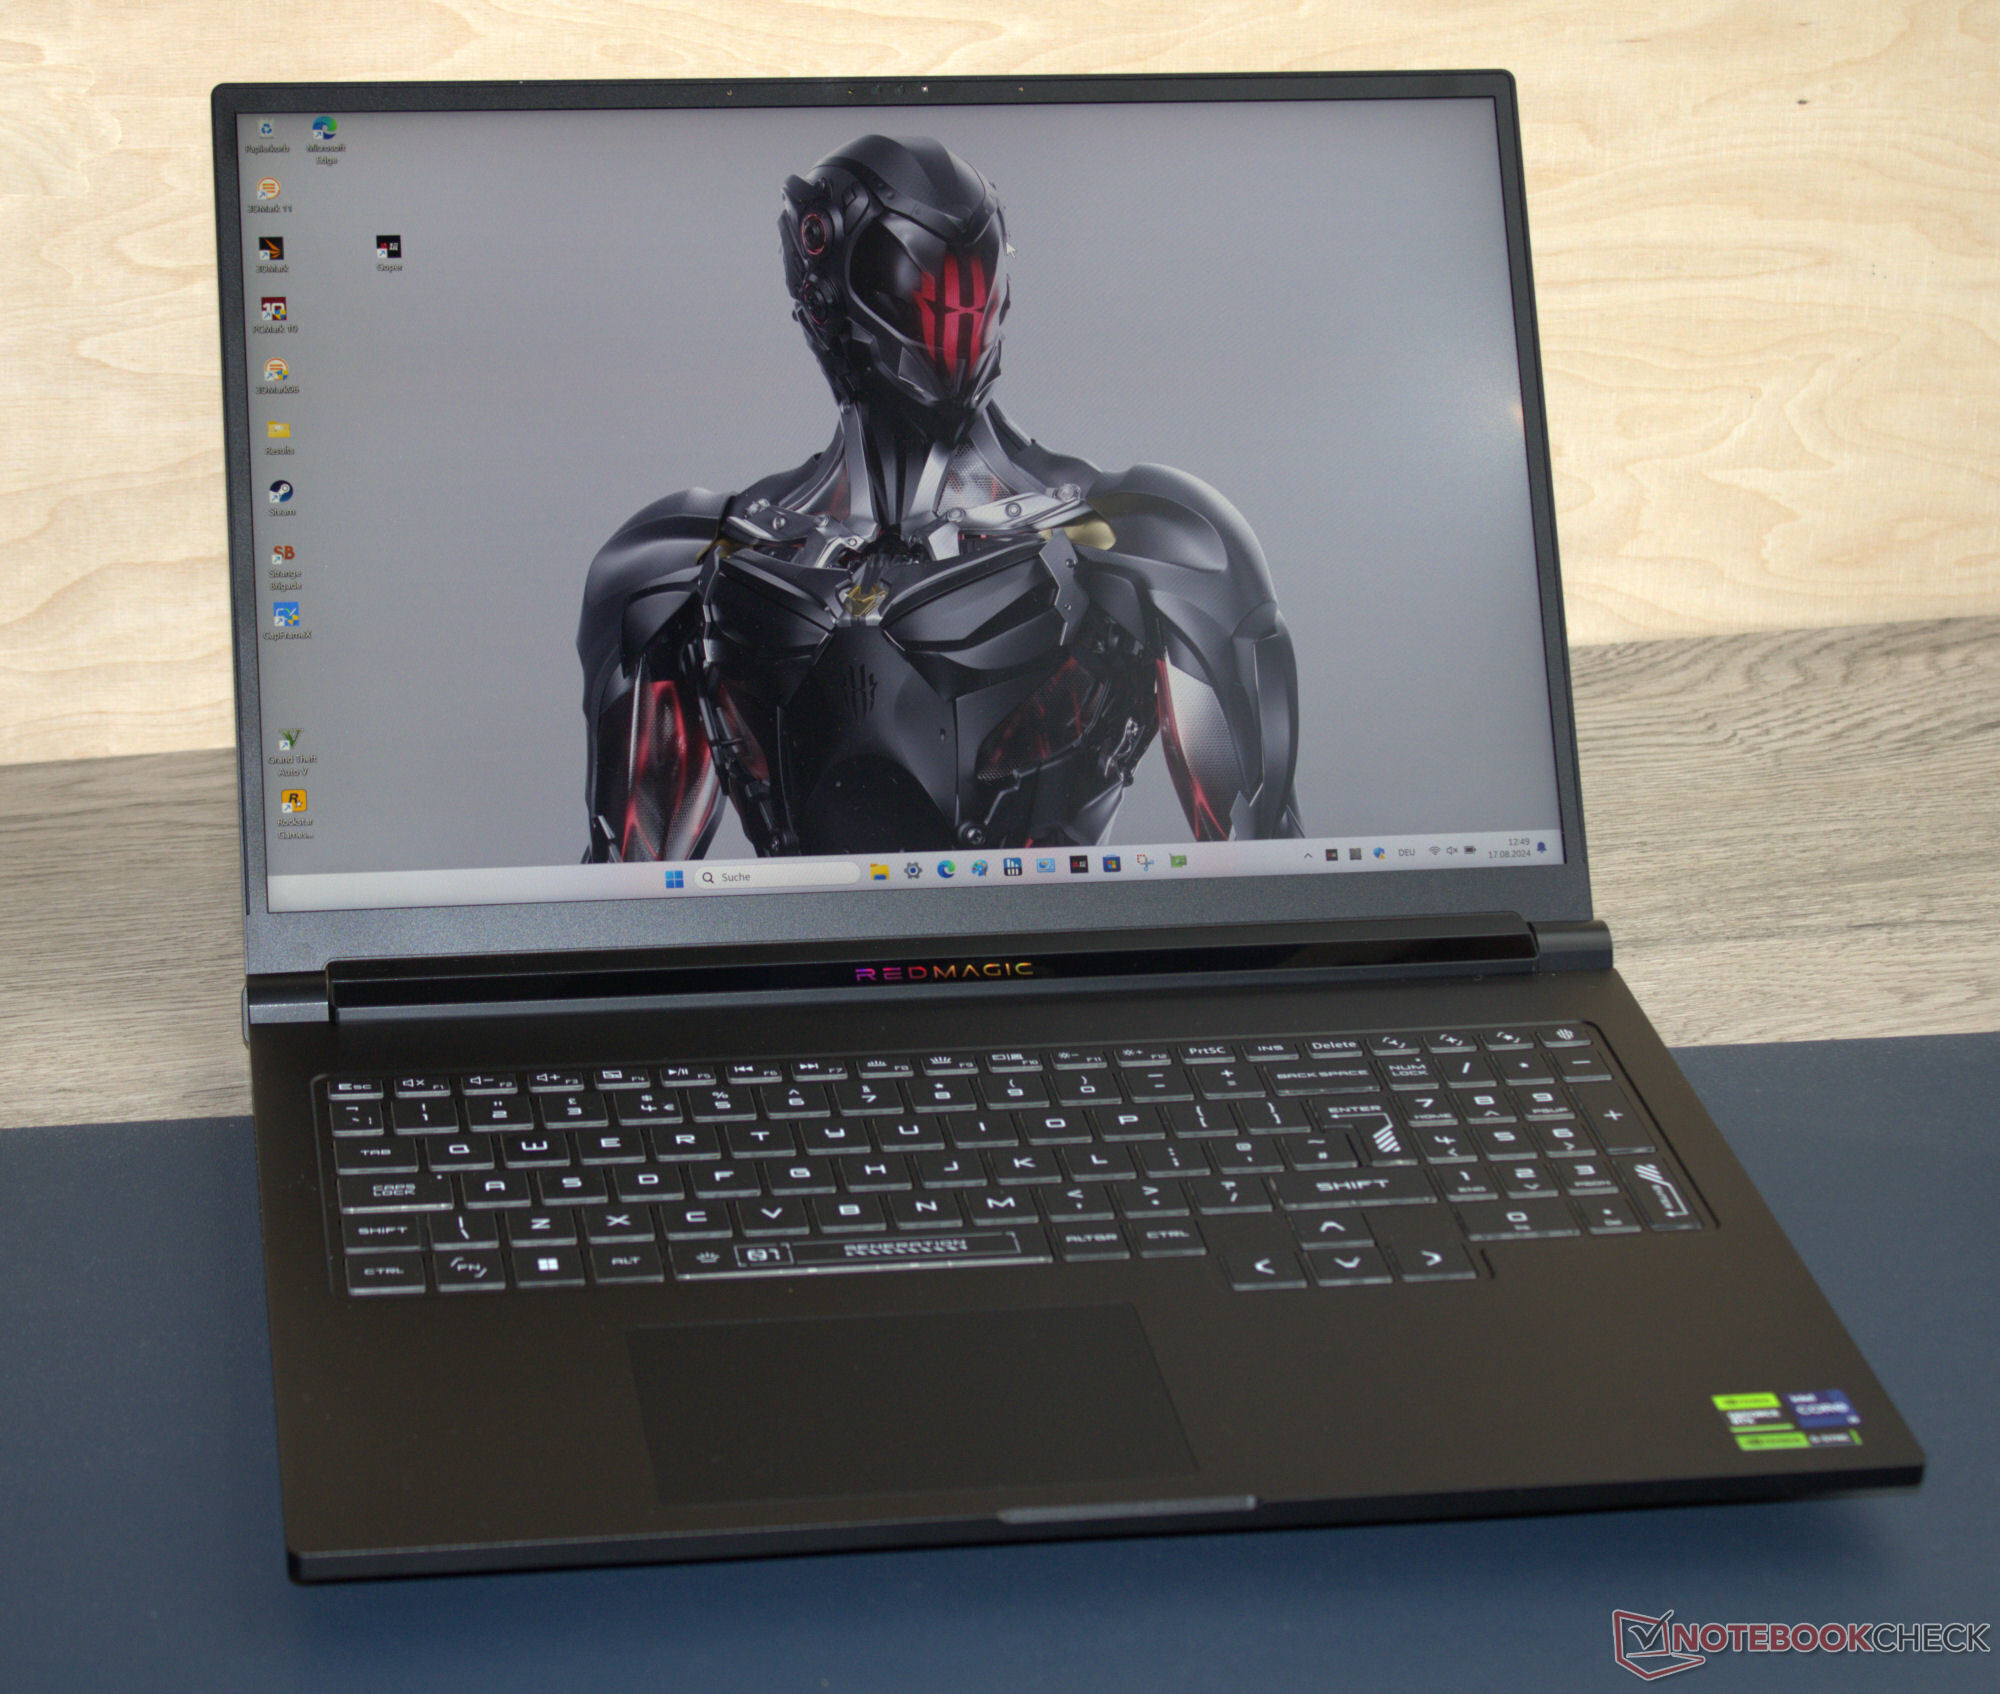
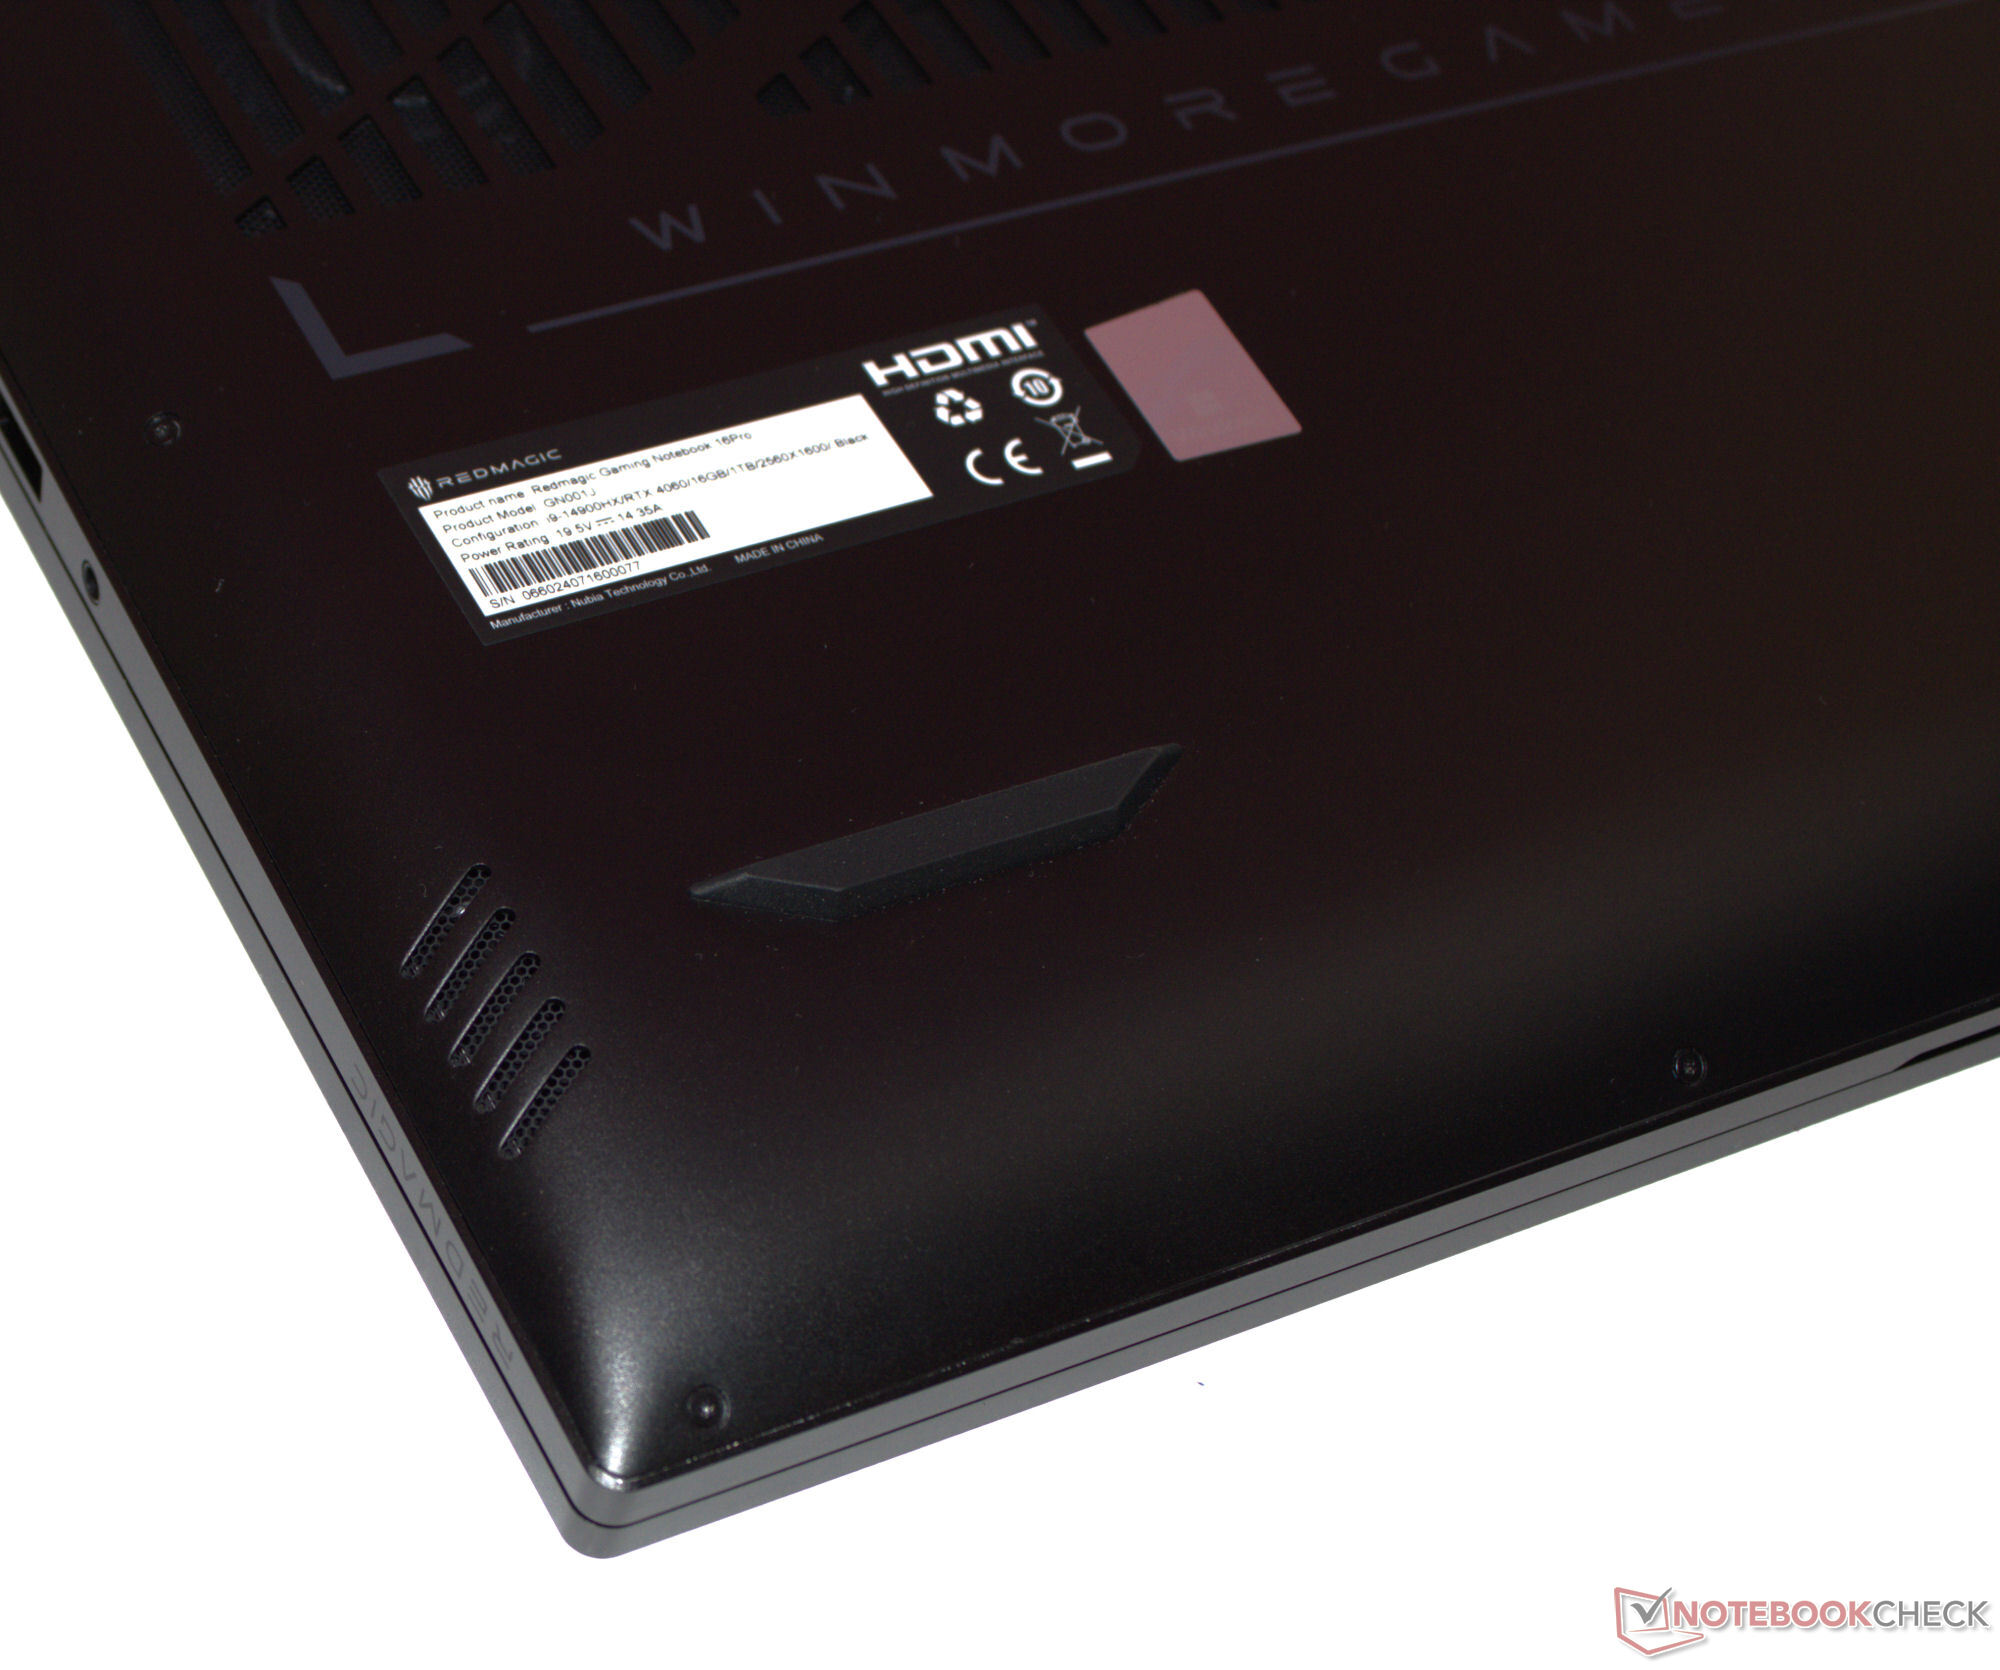
Obudowa - Nubia postawiła na aluminiową obudowę
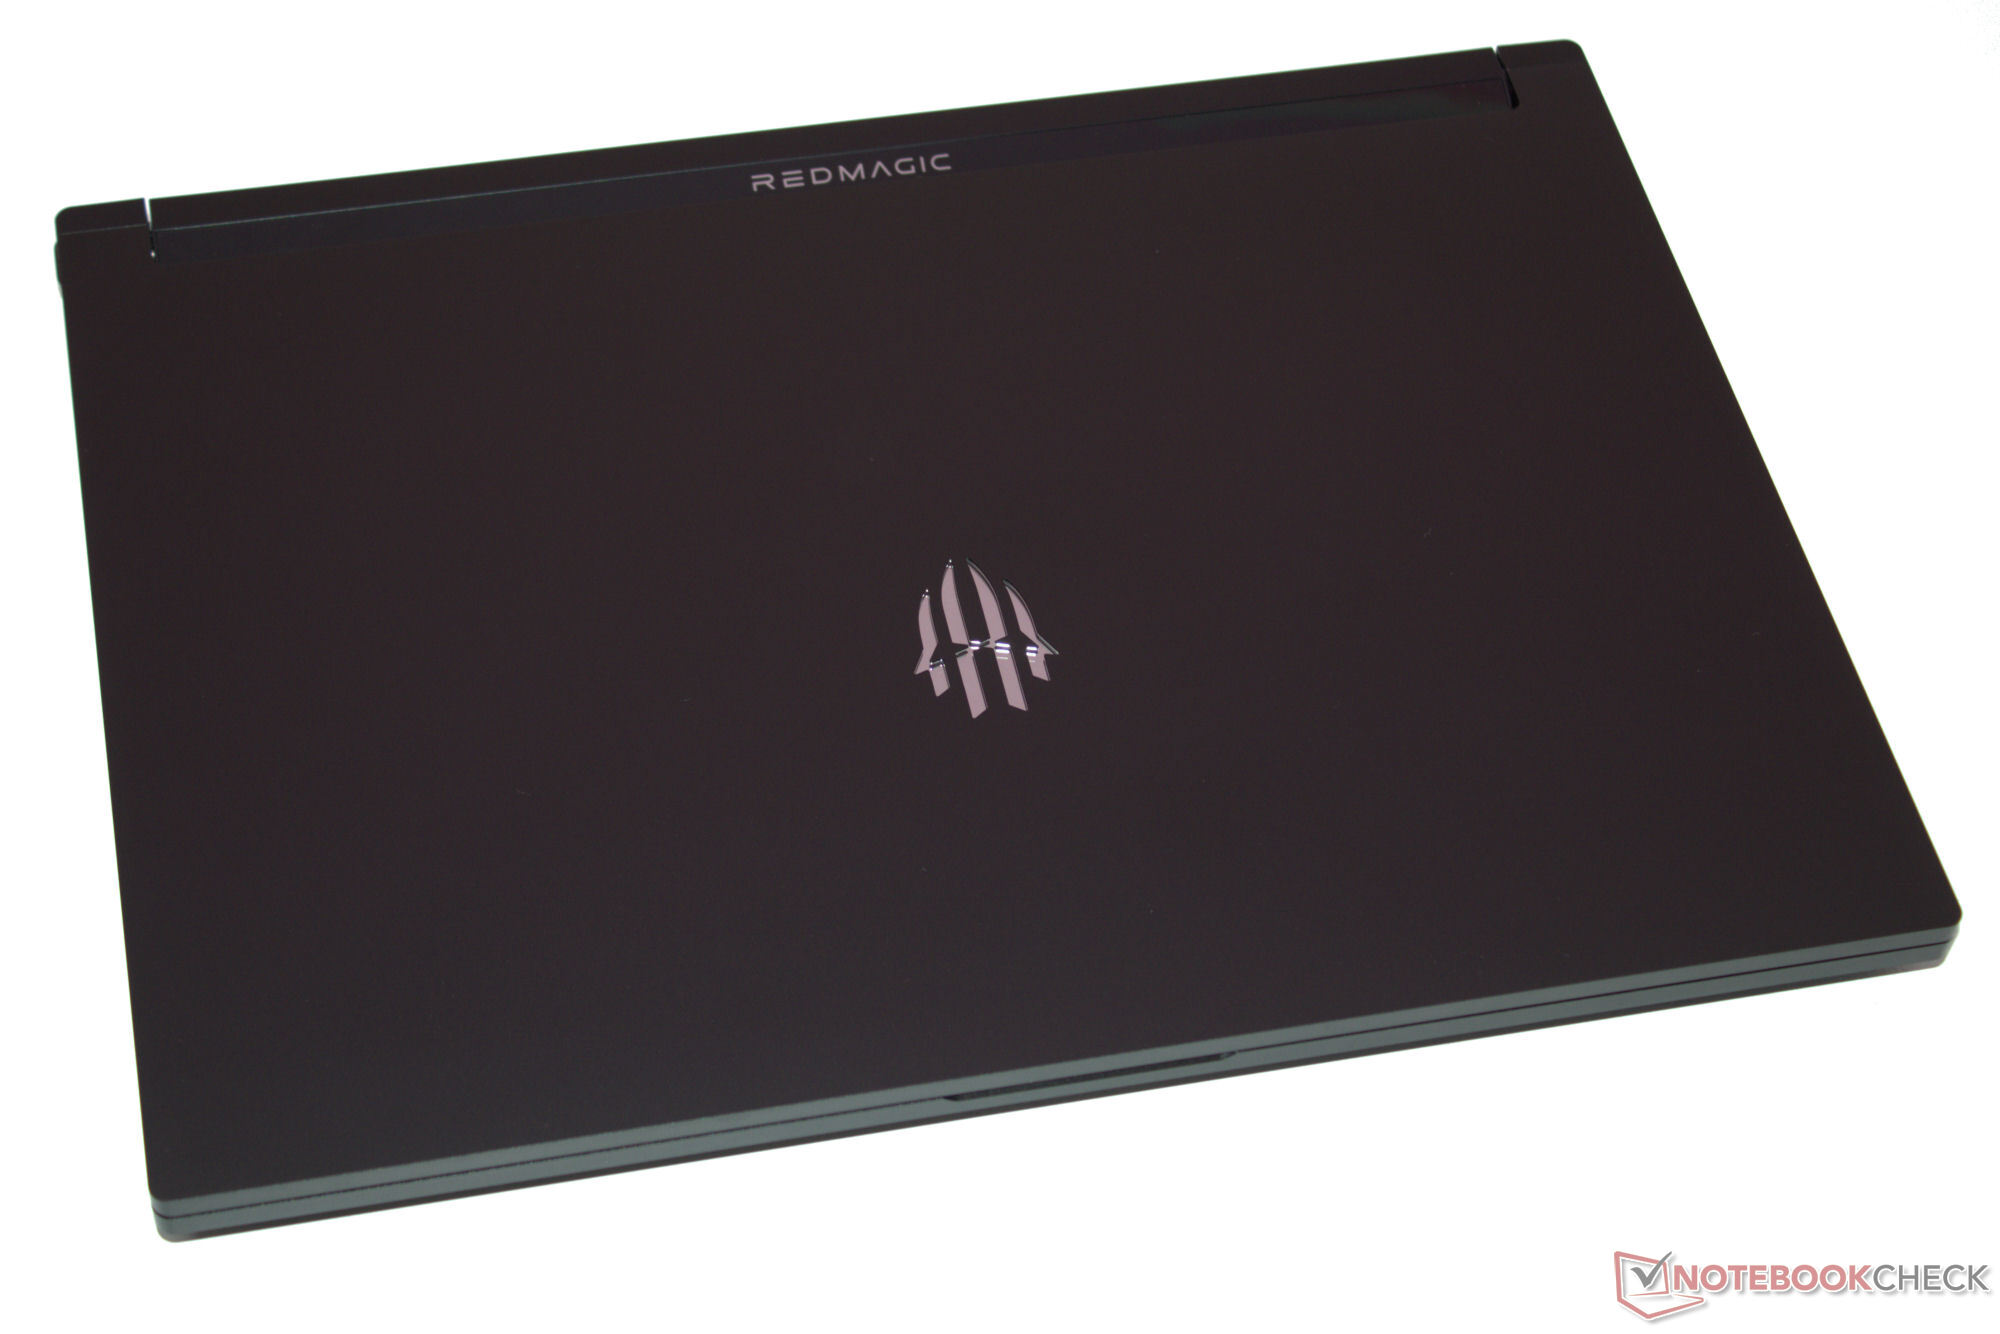
Proszę zawsze mieć w pobliżu ściereczkę do czyszczenia: Matowo-czarne powierzchnie obudowy są bardzo wrażliwe na zbieranie odcisków palców. Aluminiowa podstawa i pokrywa obudowy mogą być przekręcane tylko w niewielkim stopniu i nie napotkaliśmy żadnych błędów w budowie. Naciskanie tylnej części pokrywy nie powoduje żadnych zmian w obrazie. Bardzo ciasne zawiasy utrzymują pokrywę we właściwej pozycji i chwieje się ona tylko minimalnie. Maksymalny kąt otwarcia wynosi 130 stopni i można go otworzyć jedną ręką.
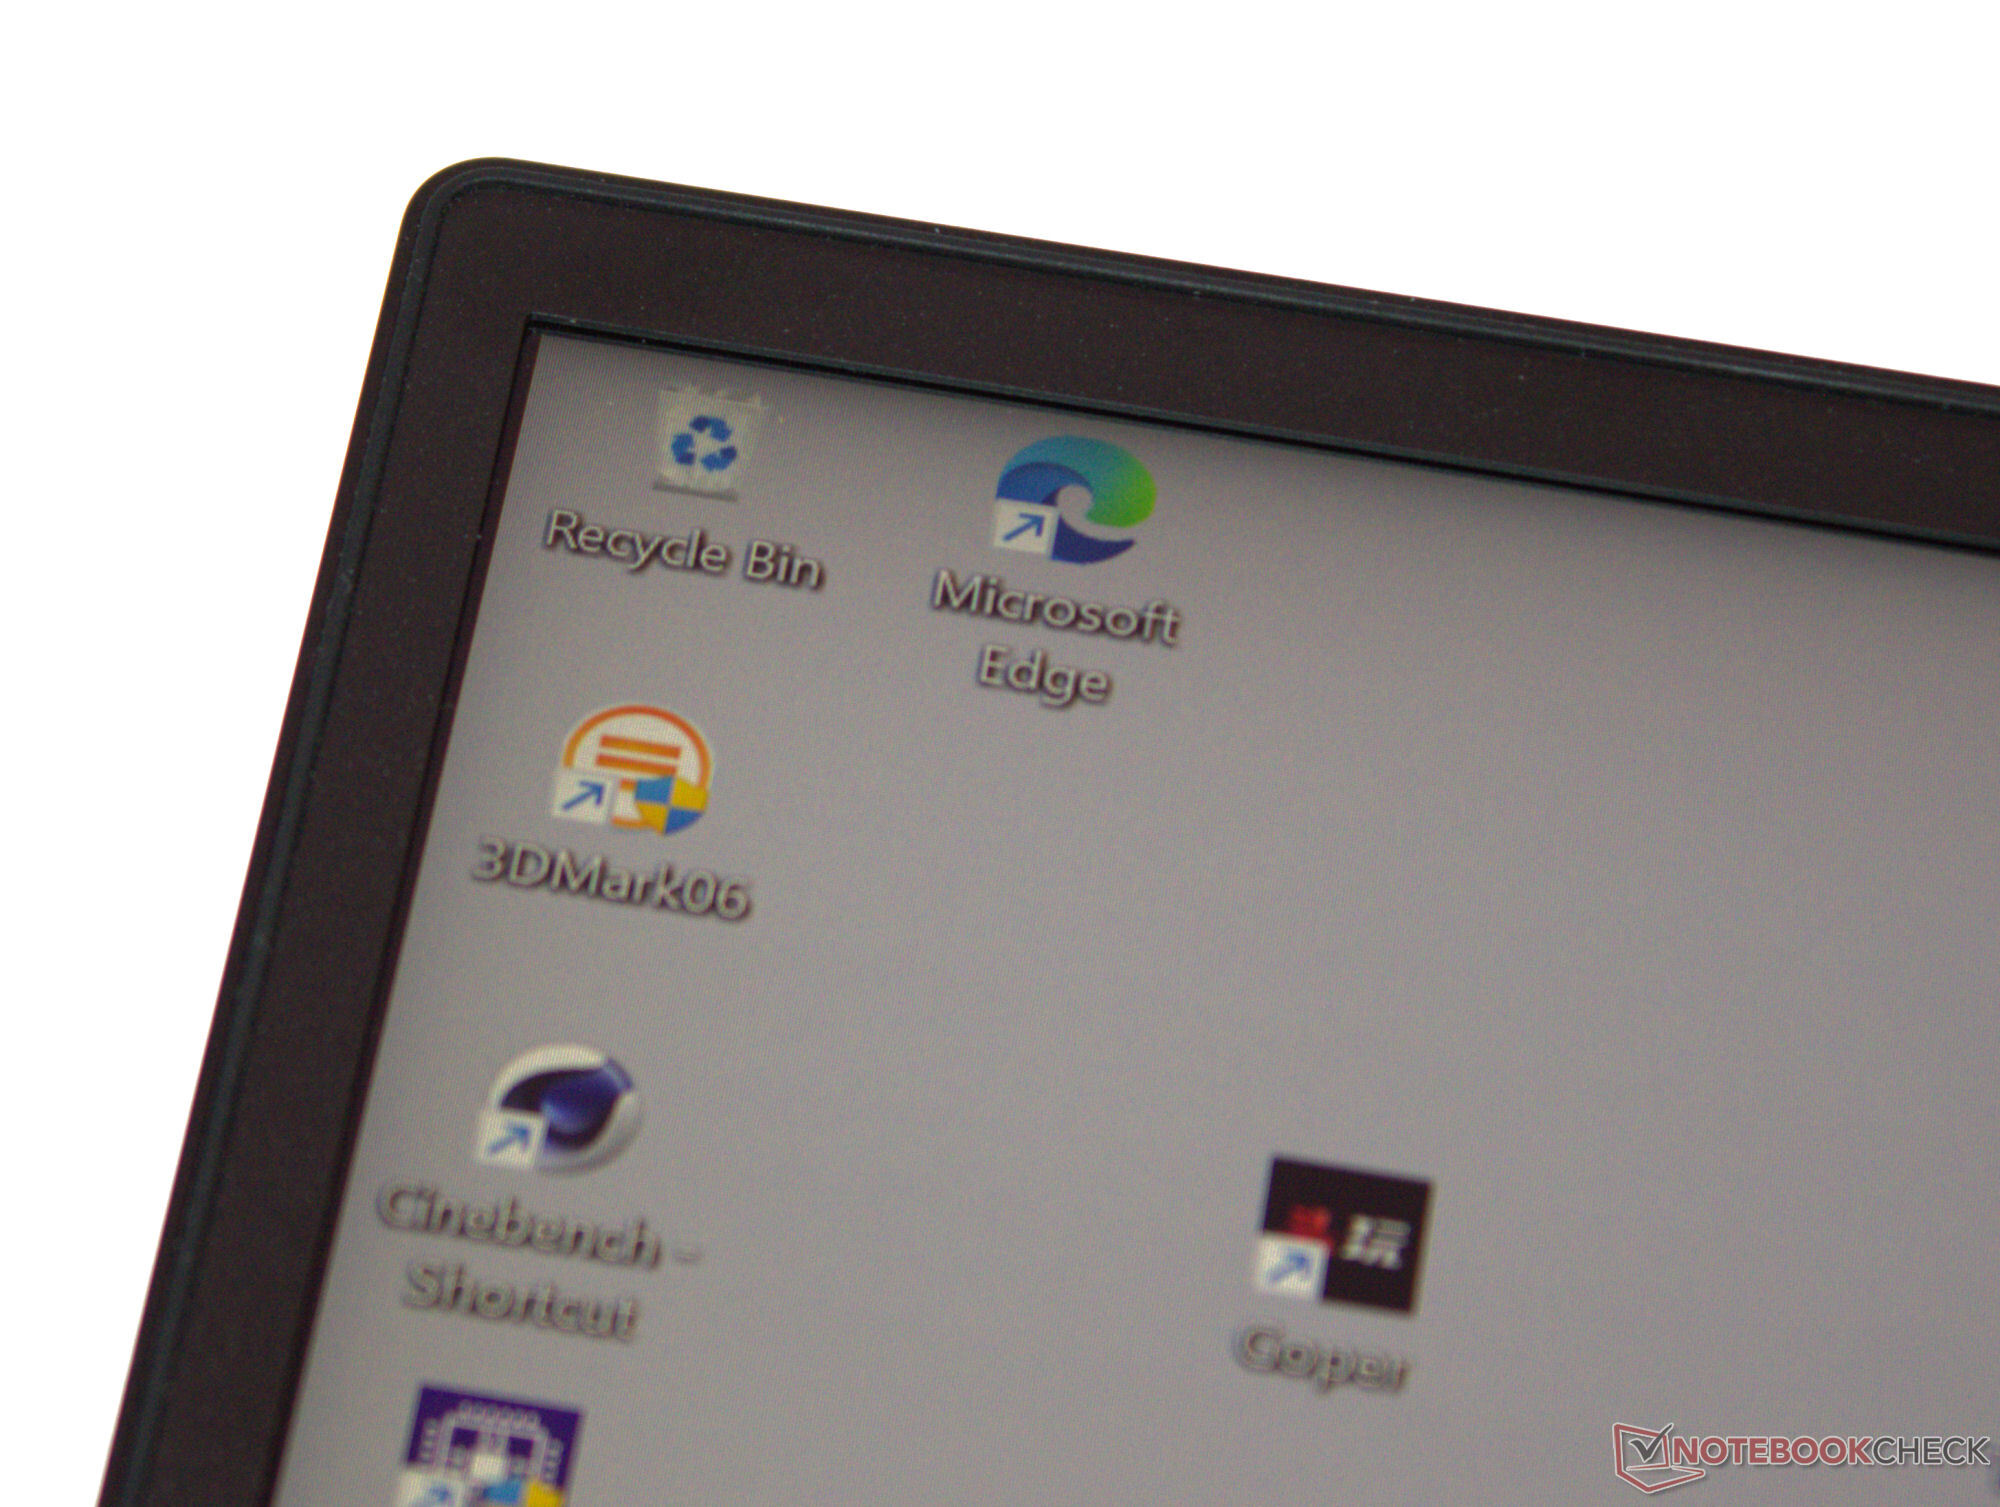
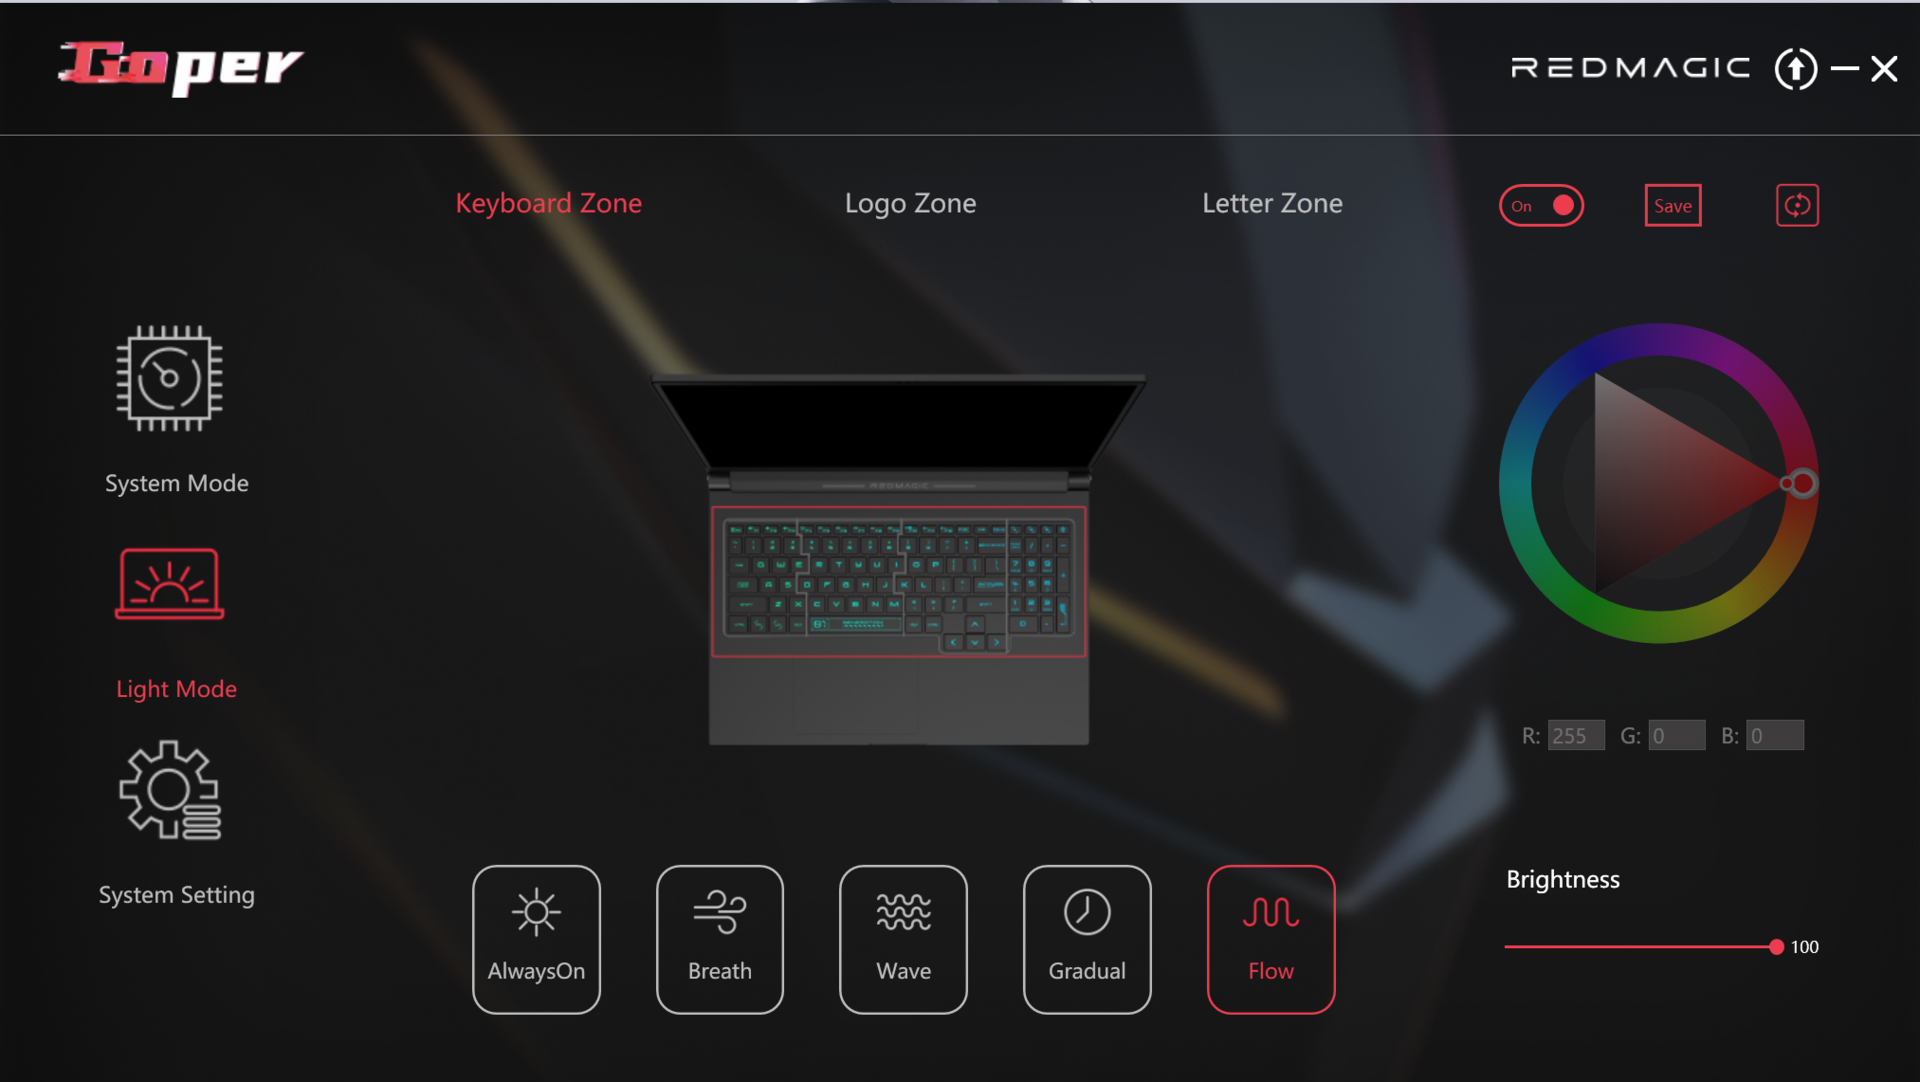
Wraz z podświetlaną klawiaturą laptopa, dwa elementy LED wprowadzają trochę koloru do miksu: Napis RedMagic na pokrywie zawiasu i logo na pokrywie świecą we wszystkich kolorach tęczy. Wszystkimi elementami można sterować indywidualnie. Napis służy również jako wskaźnik naładowania baterii: czerwone migające światło wskazuje niski poziom naładowania.
Na polu porównawczym Titan okazuje się być jednym z najbardziej kompaktowych i lekkich urządzeń. Mimo to, różnice w porównaniu do konkurencji są dość niewielkie.
Łączność - Titan jest wyposażony w Thunderbolt 4
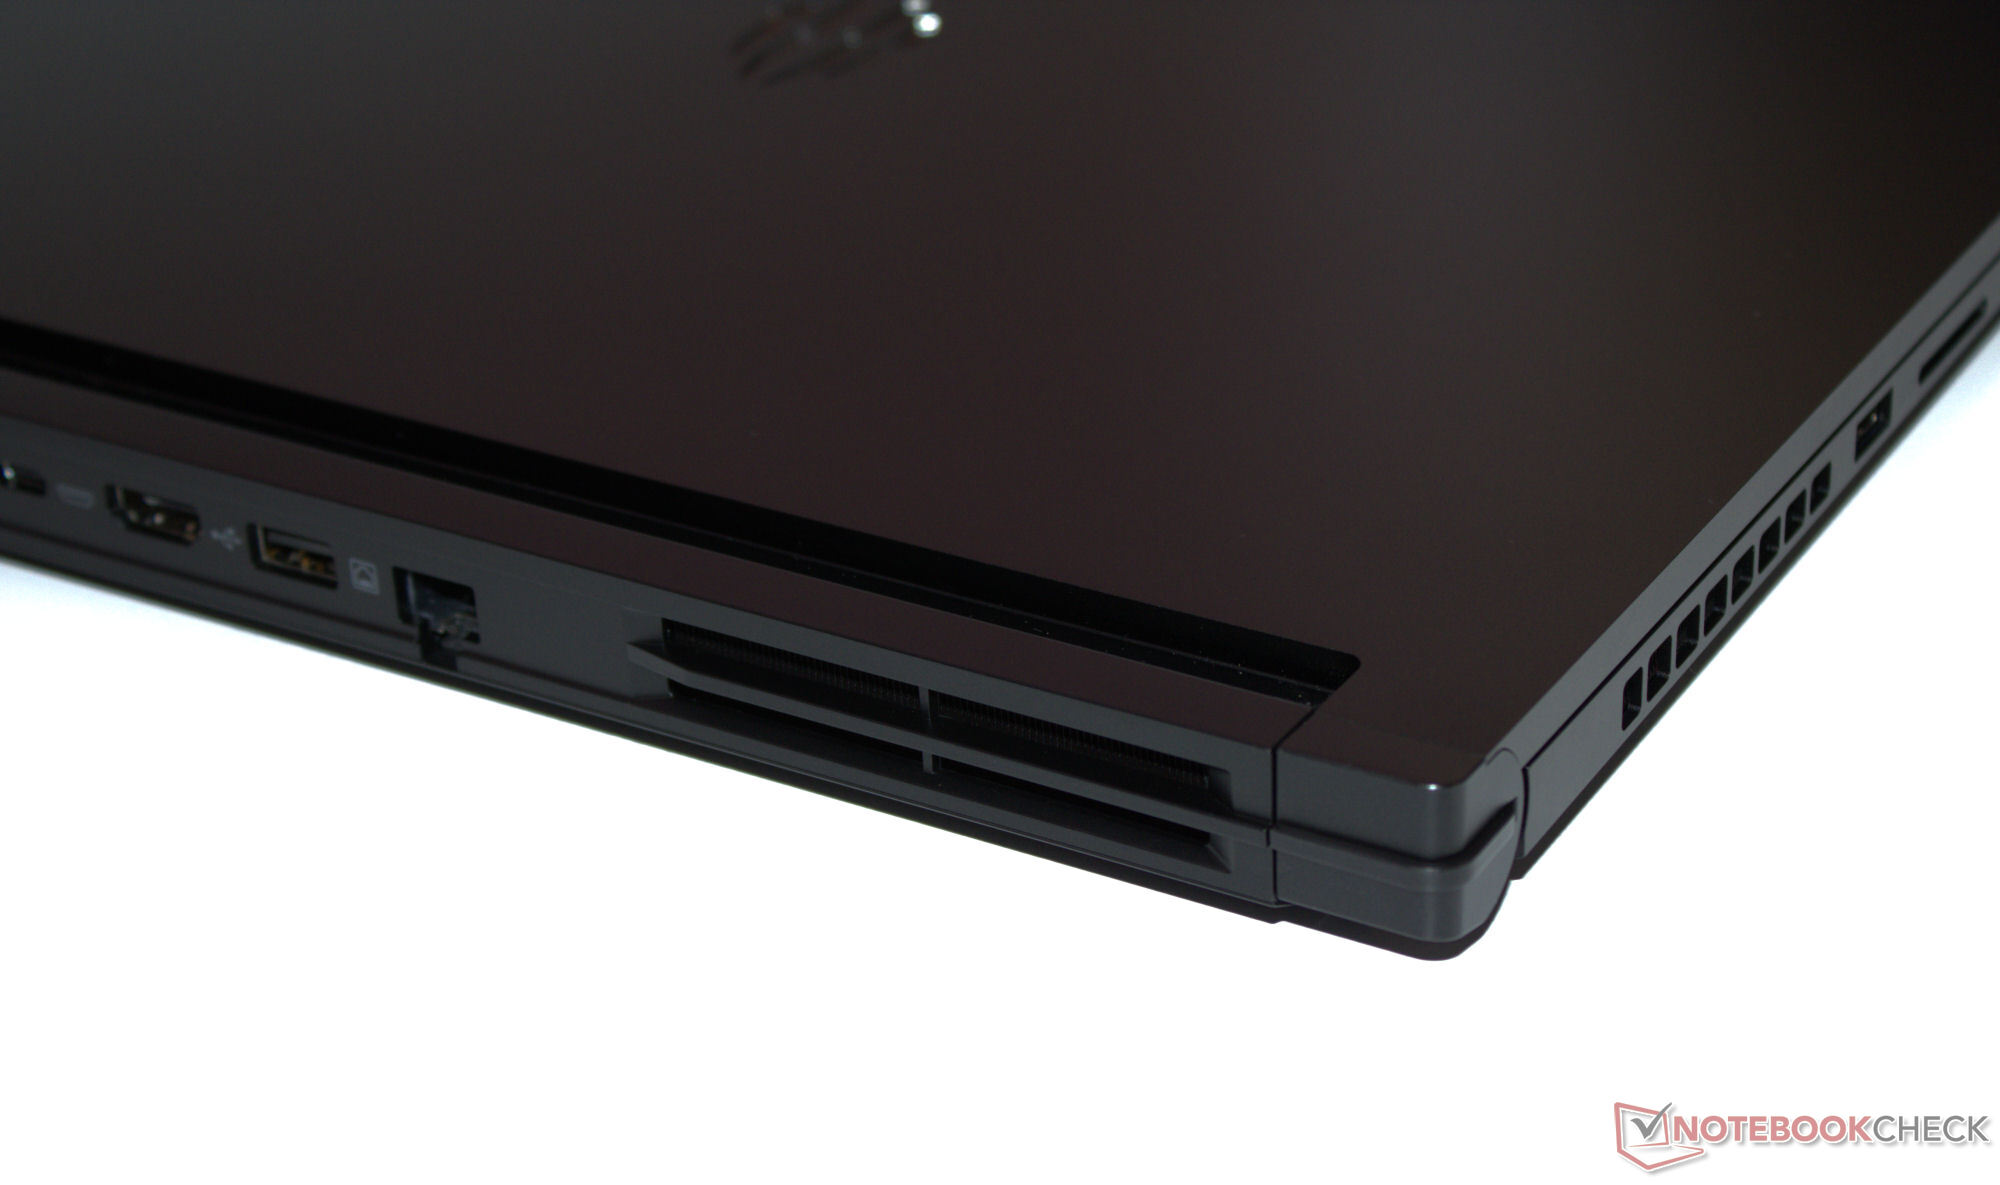
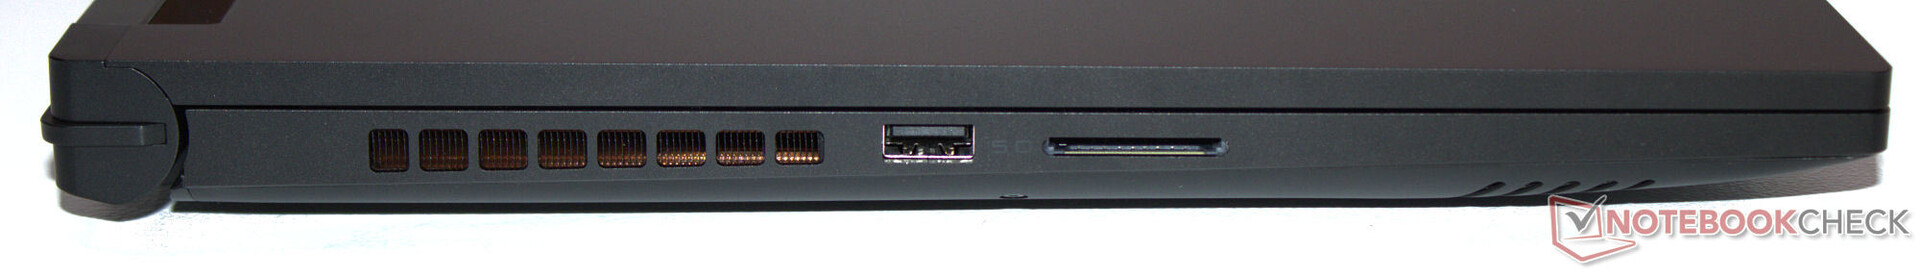
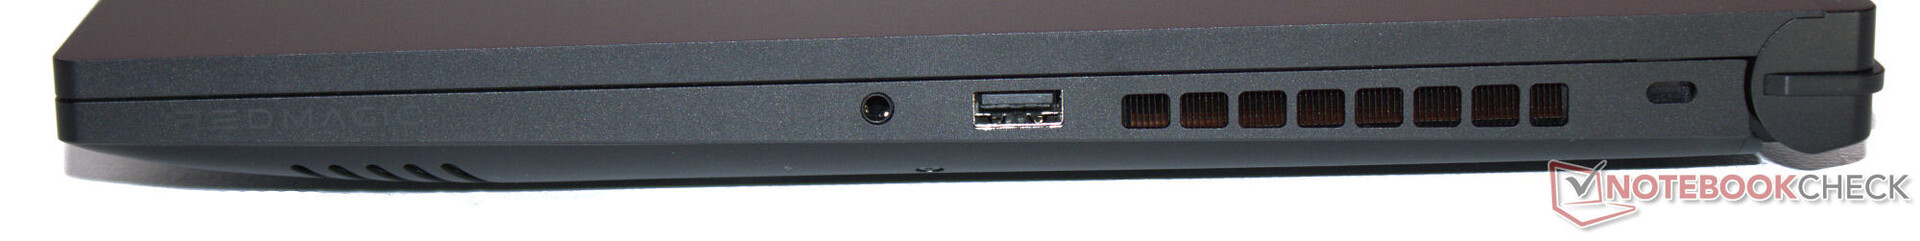
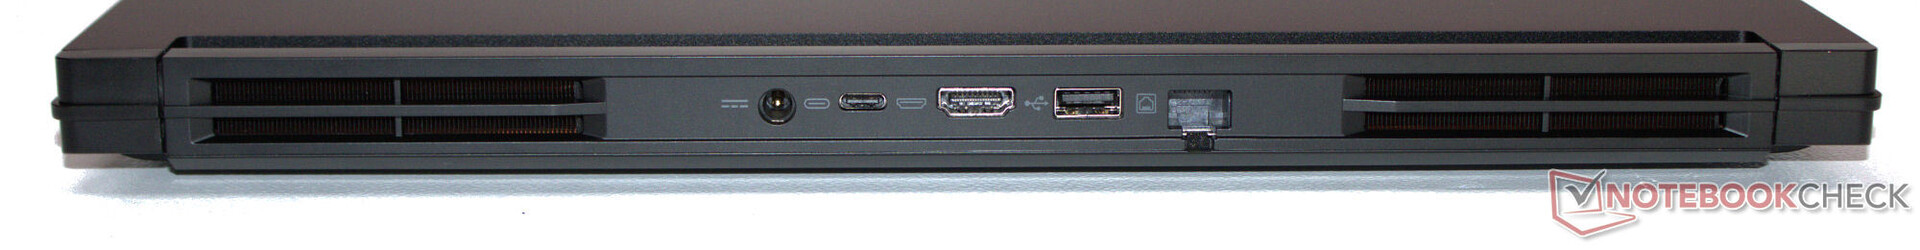
Titan został wyposażony w trzy porty USB-A (2x USB 3.2 Gen 2, 1x USB 3.2 Gen 1), a także jeden port USB-C (Thunderbolt 4). Ten ostatni obsługuje tryb Power Delivery i DP Alt. Posiada łącznie dwa wyjścia wideo (1x HDMI, 1x DP). Gniazdo audio i port Ethernet (1 GBit/s) dopełniają całości.
Wyjścia wideo, gniazdo sieciowe i złącze zasilania znajdują się z tyłu urządzenia, więc odpowiednie kable nie powinny przeszkadzać podczas użytkowania. Pozytywnym aspektem jest obecność portu USB-A po lewej i prawej stronie laptopa.
Czytnik kart SD
Czytnik kart SD (karta referencyjna: AV PRO microSD 128 GB V60) nie należy do najszybszych w swoim rodzaju, ale zapewnia solidne prędkości przesyłu danych w średnim zakresie. Porównując to z wartościami Blade 16 (2024) dowodzi, że możliwe jest osiągnięcie znacznie wyższych prędkości transferu.
| SD Card Reader | |
| average JPG Copy Test (av. of 3 runs) | |
| Razer Blade 16 2024, RTX 4090 | |
| Średnia w klasie Gaming (19 - 197.3, n=68, ostatnie 2 lata) | |
| SCHENKER XMG Pro 16 Studio (Mid 24) (AV PRO microSD 128 GB V60) | |
| Nubia RedMagic Titan 16 Pro (AV PRO microSD 128 GB V60) | |
| Acer Predator Helios Neo 16 (2024) (AV PRO microSD 128 GB V60) | |
| maximum AS SSD Seq Read Test (1GB) | |
| Razer Blade 16 2024, RTX 4090 | |
| Średnia w klasie Gaming (25.8 - 263, n=67, ostatnie 2 lata) | |
| SCHENKER XMG Pro 16 Studio (Mid 24) (AV PRO microSD 128 GB V60) | |
| Nubia RedMagic Titan 16 Pro (AV PRO microSD 128 GB V60) | |
| Acer Predator Helios Neo 16 (2024) (AV PRO microSD 128 GB V60) | |
Komunikacja
Jeśli chodzi o opcje sieciowe, nie ma żadnych niespodzianek: Połączenia przewodowe obsługiwane są przez kontroler Gigabit Ethernet (RTL8168/8111, 1 GBit/s) firmy Realtek. Układ WiFi 6E Intela (AX211) zapewnia dobrą lub bardzo dobrą szybkość transmisji danych w optymalnych warunkach (brak urządzeń WiFi w pobliżu, niewielka odległość między laptopem a serwerem).
Kamera internetowa
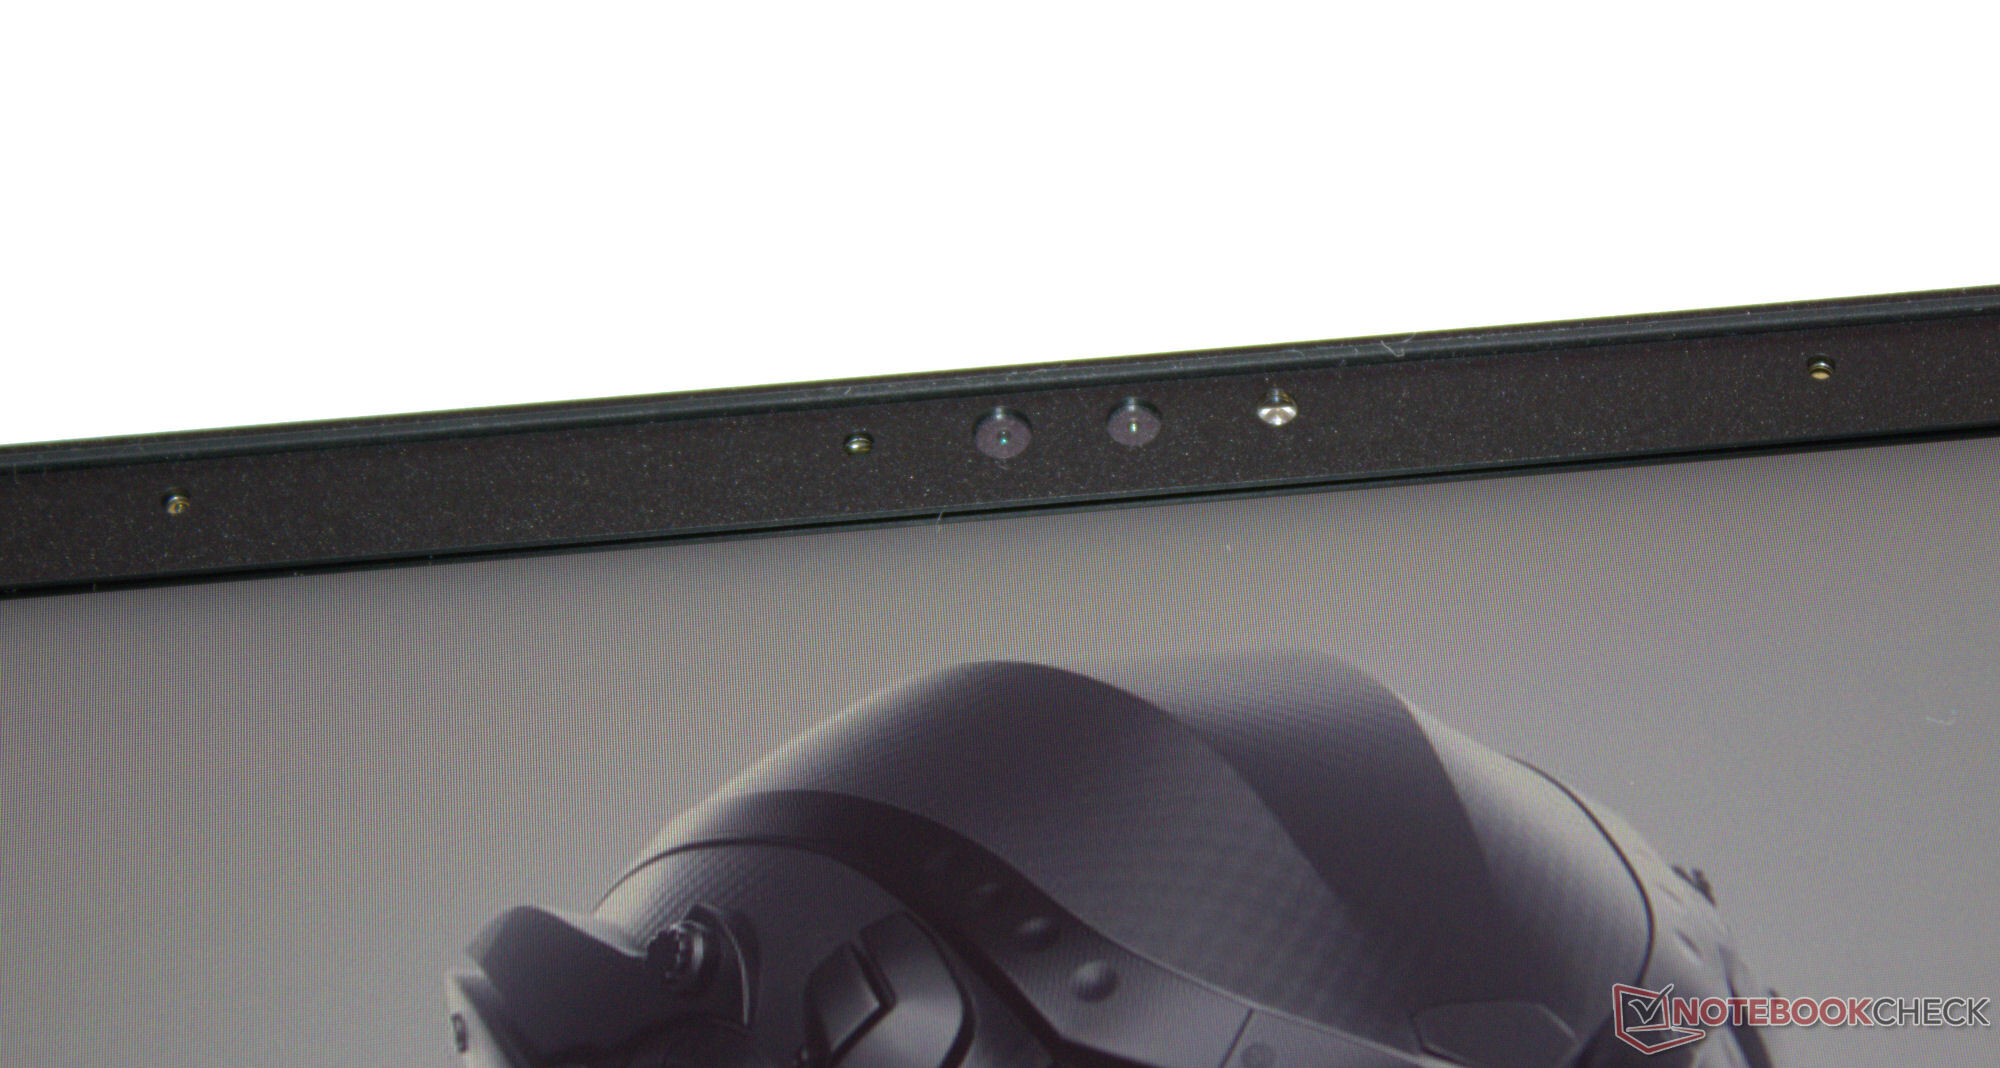
Kamera internetowa (2,1 MP) jest standardowa i obsługuje funkcję Windows Hello. Kamera nie ma mechanicznej pokrywy ani fizycznego włącznika/wyłącznika.


Akcesoria
Poza zwykłymi dokumentami (skrócona instrukcja obsługi i informacje o gwarancji), do laptopa nie dołączono żadnych dodatkowych akcesoriów.
Konserwacja
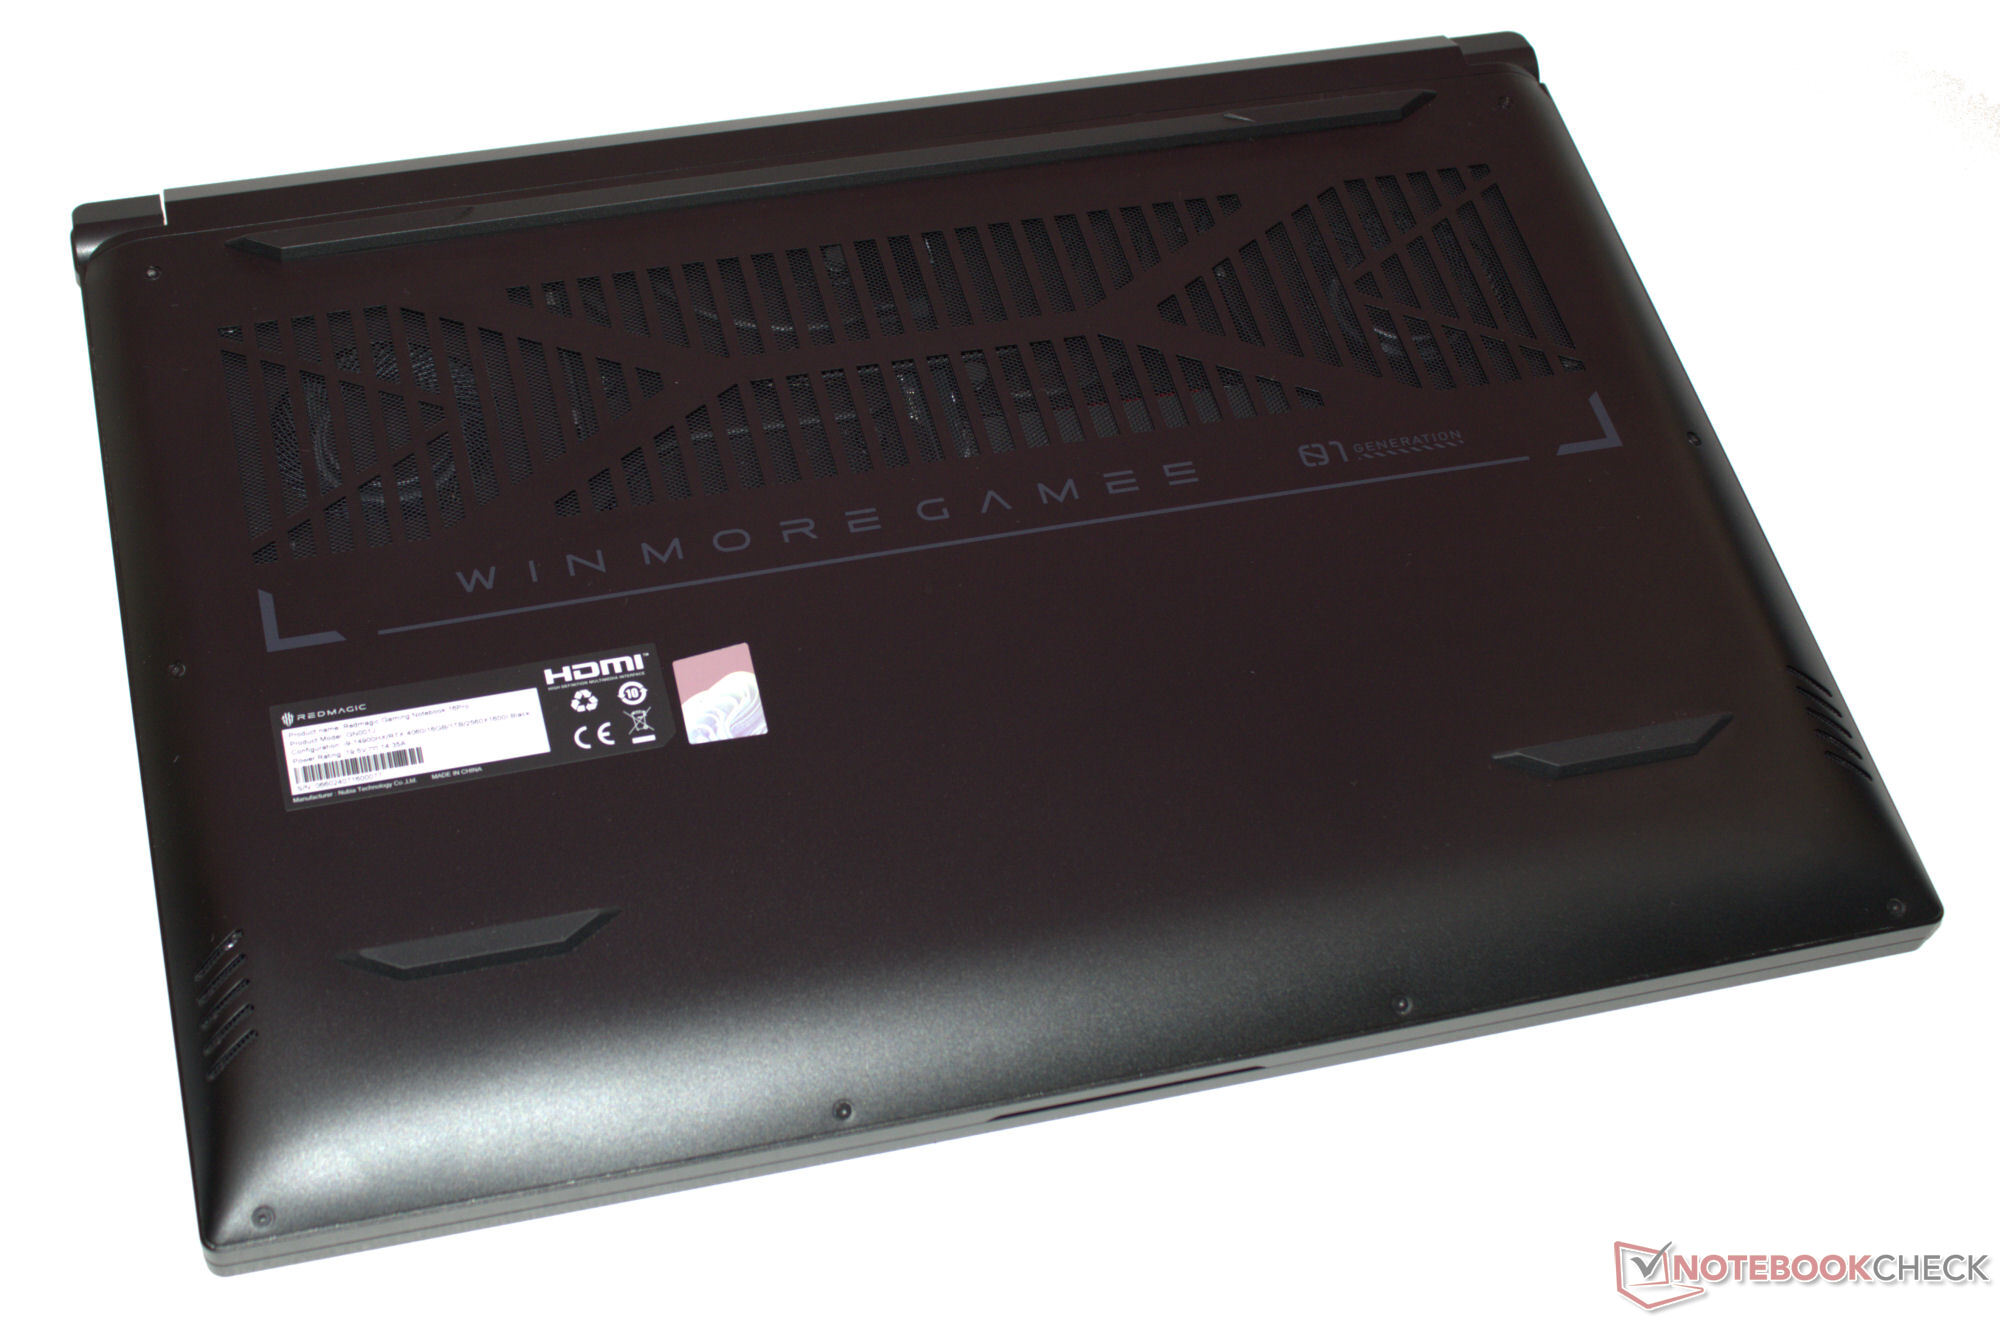
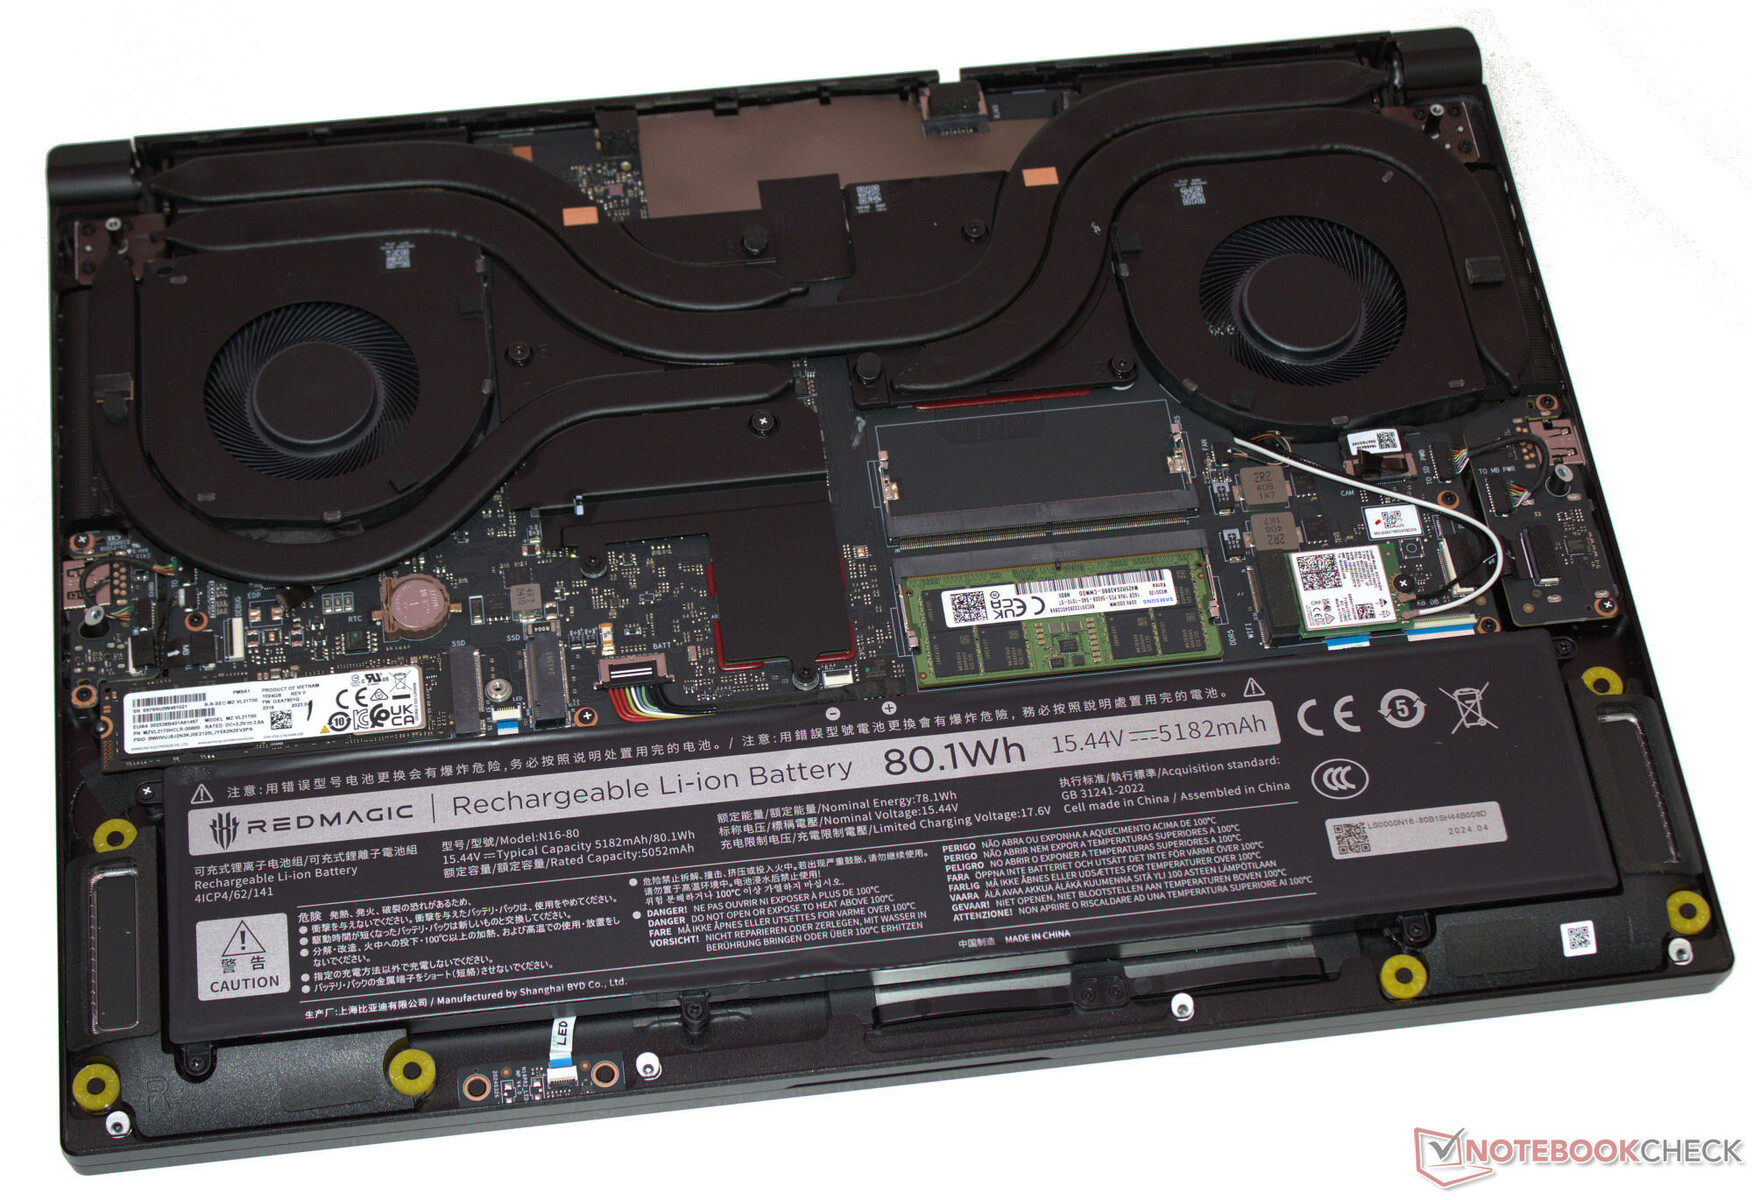
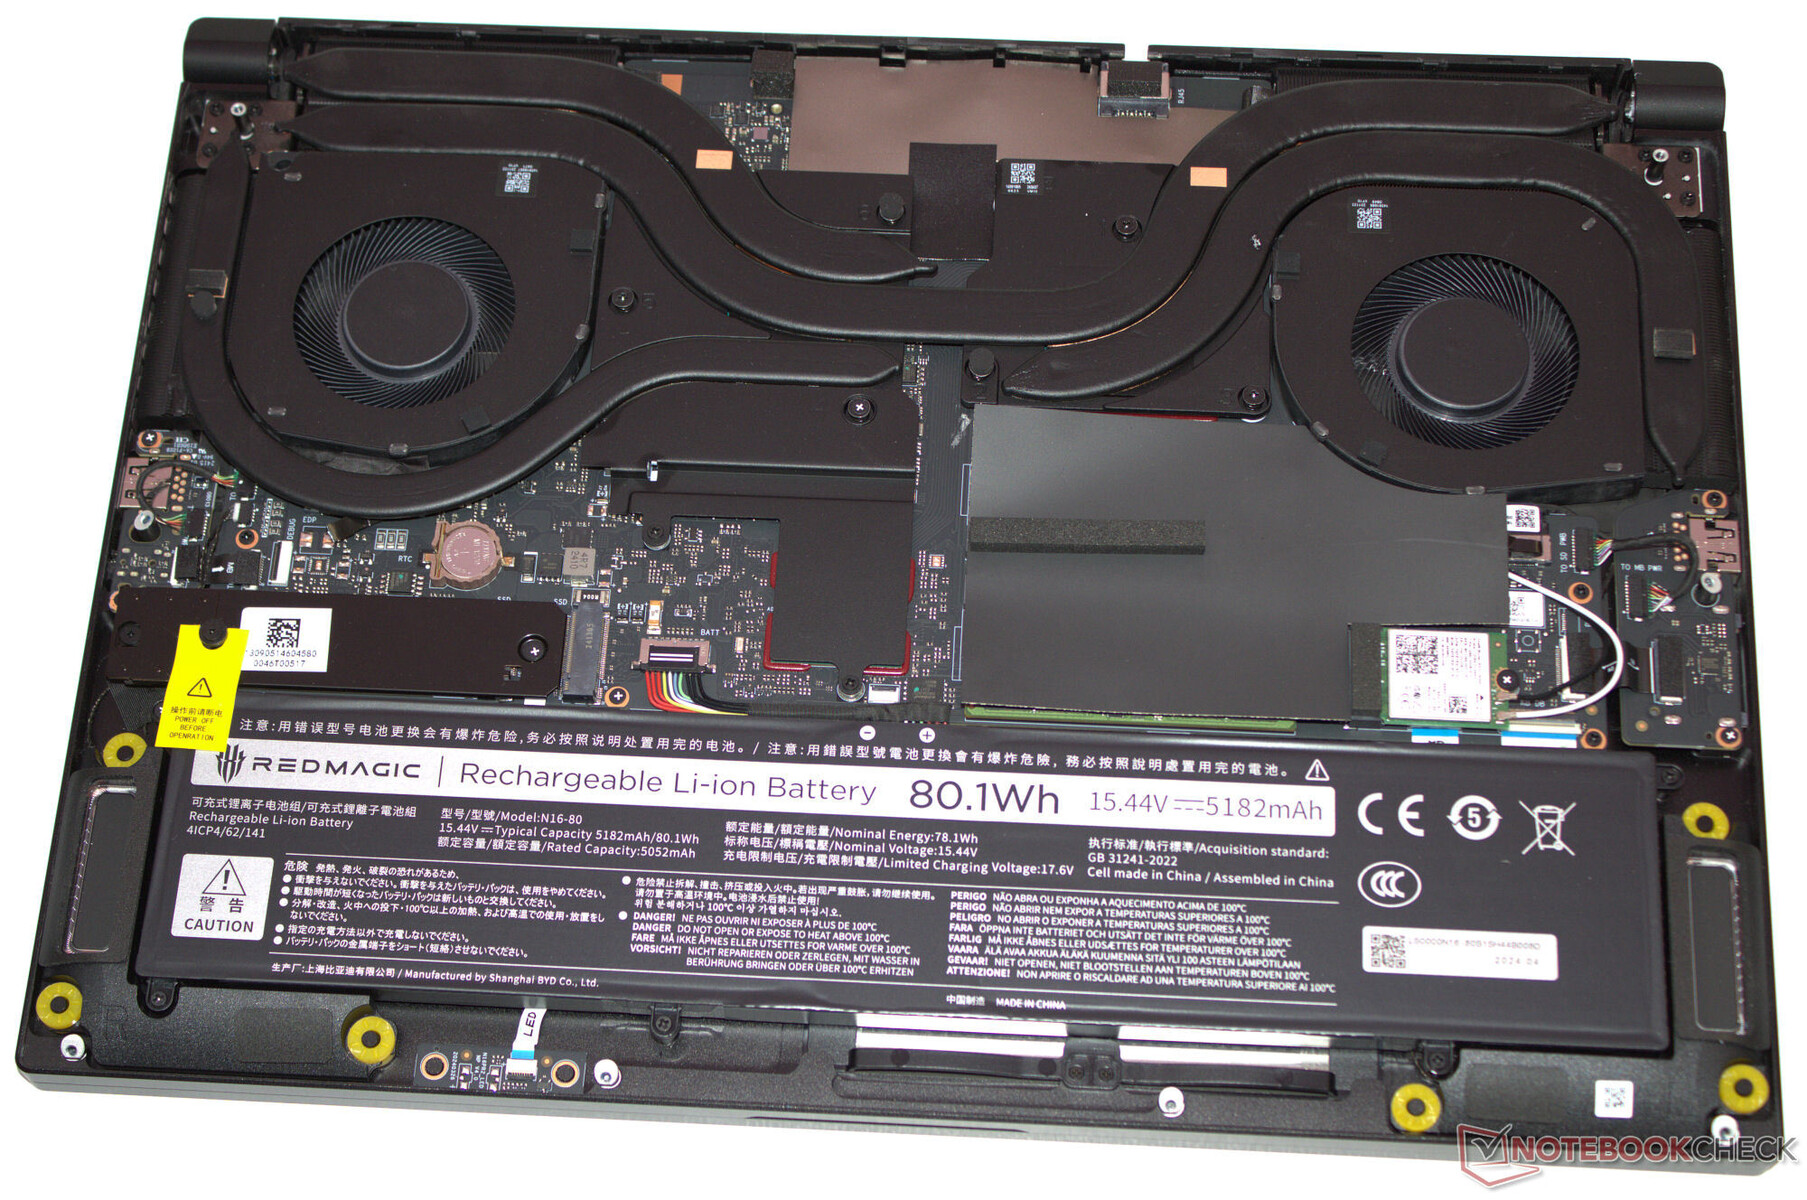
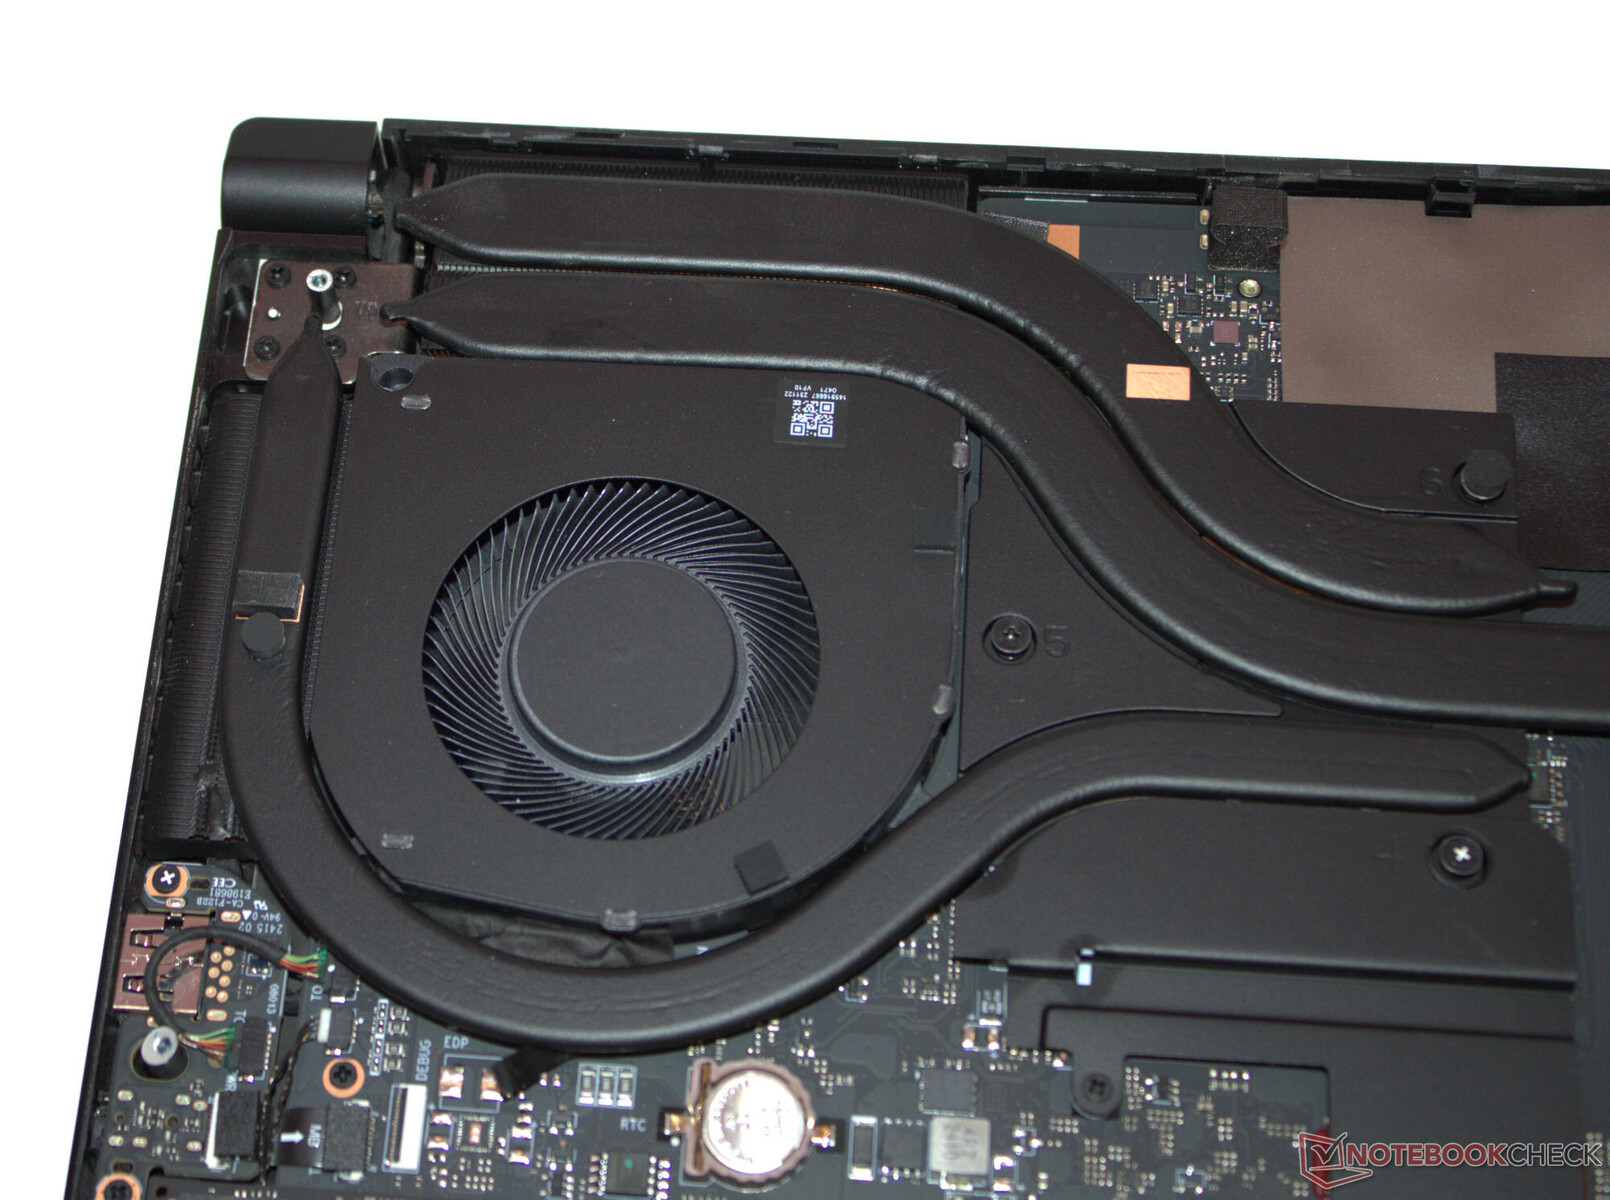
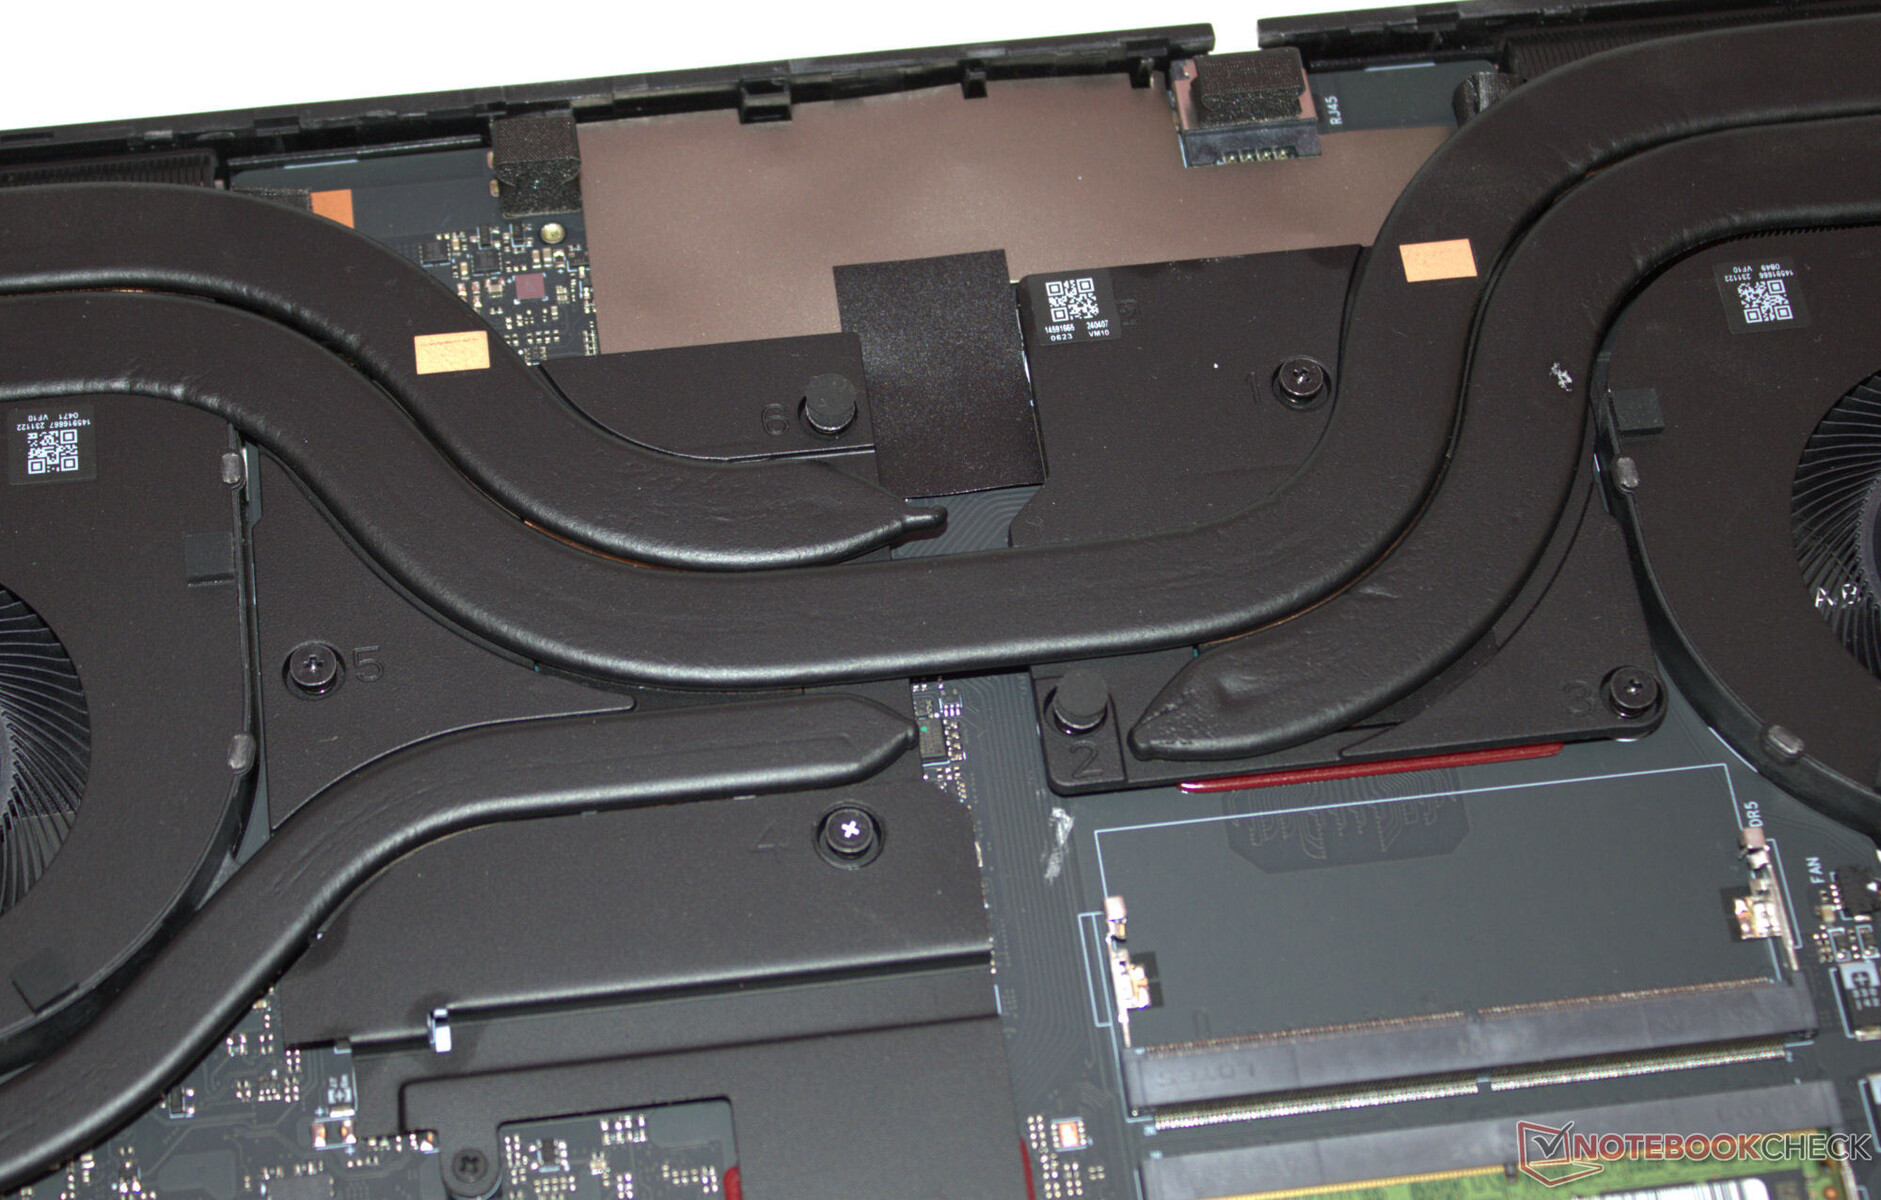
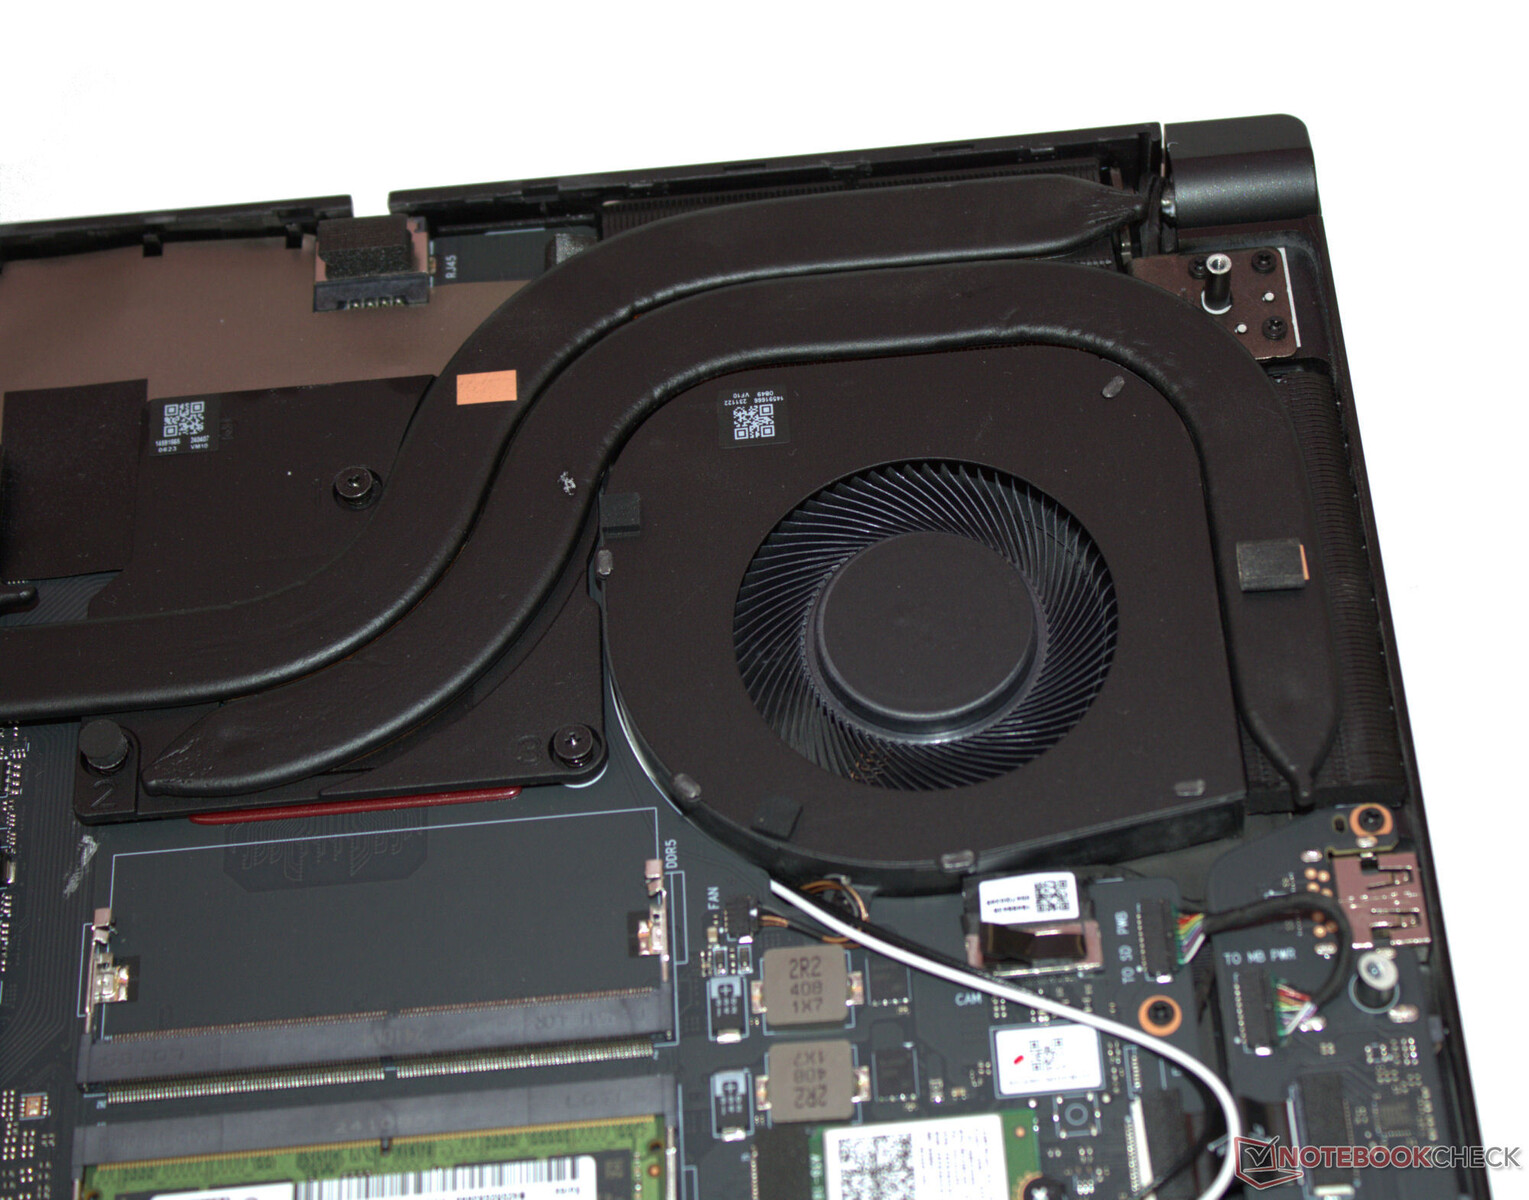
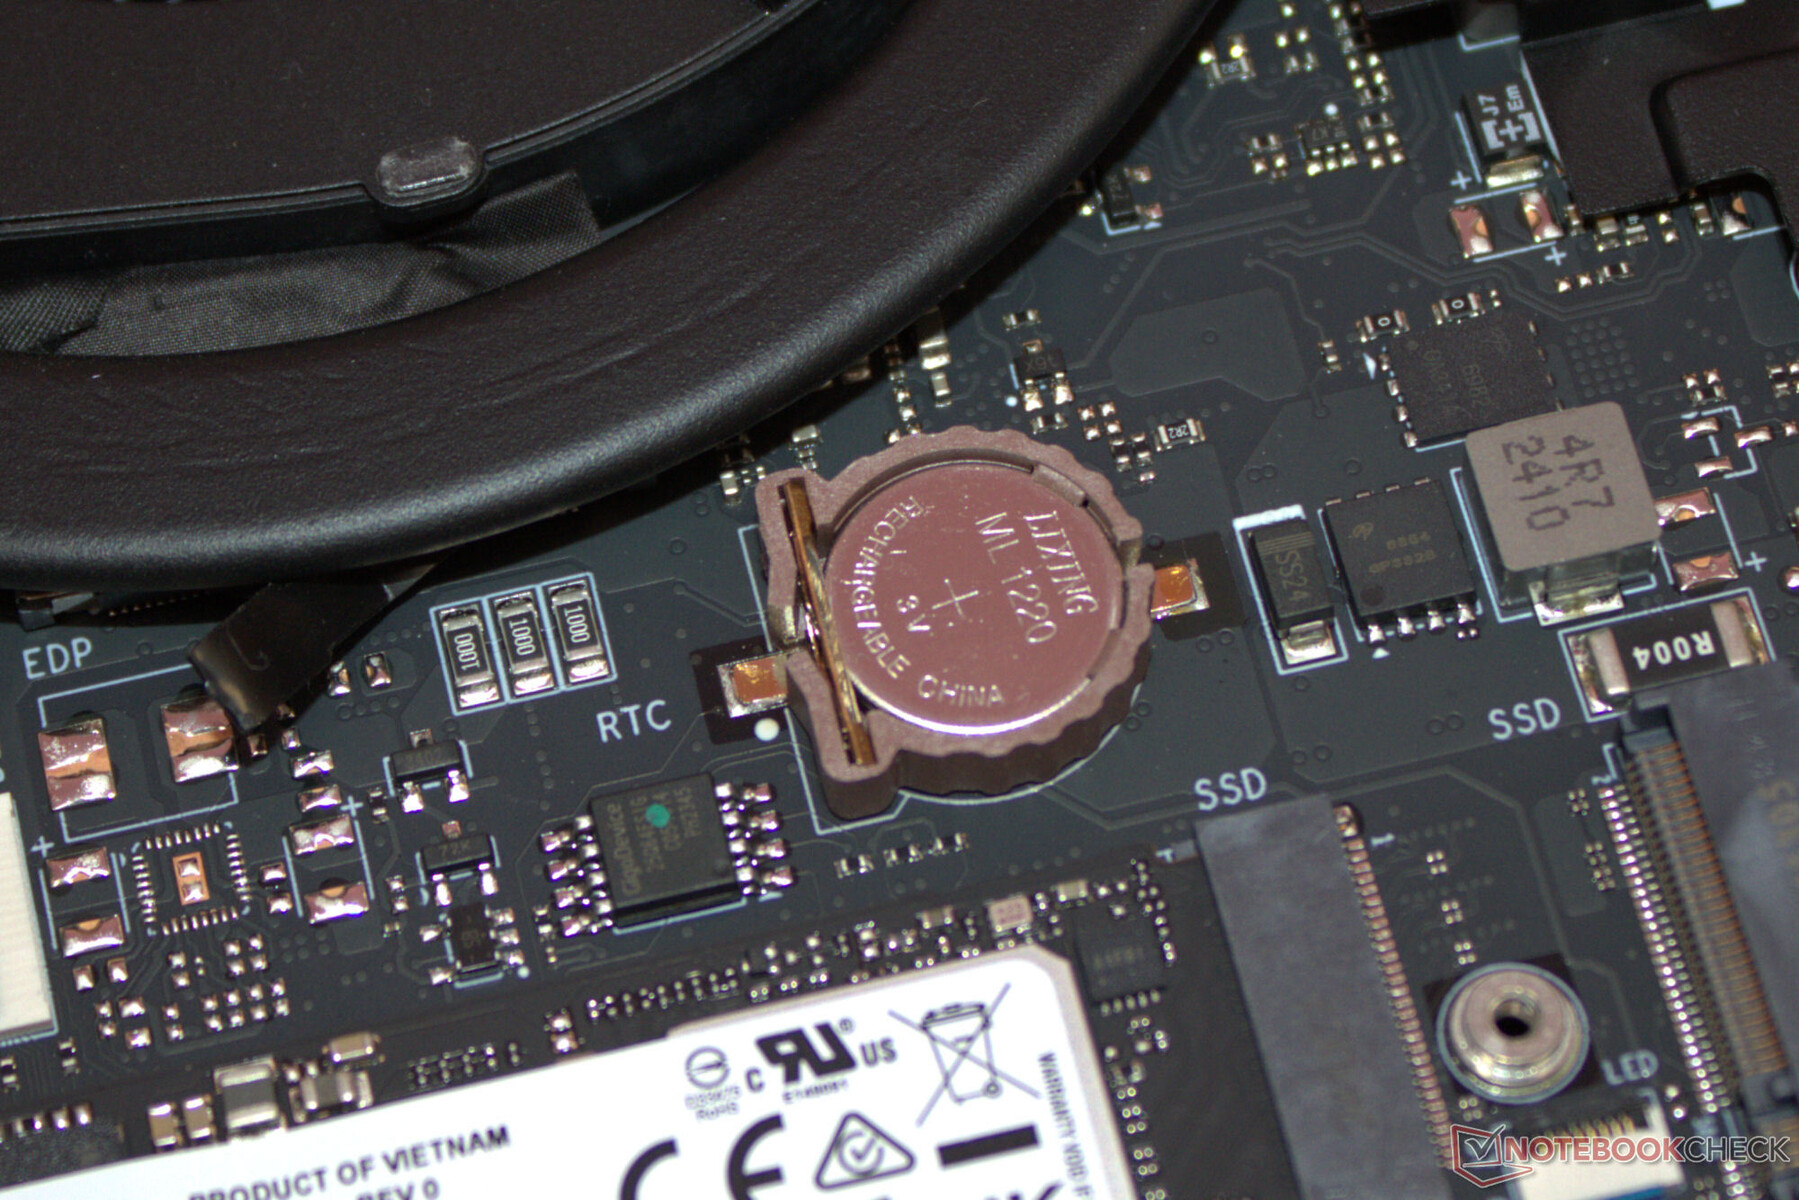
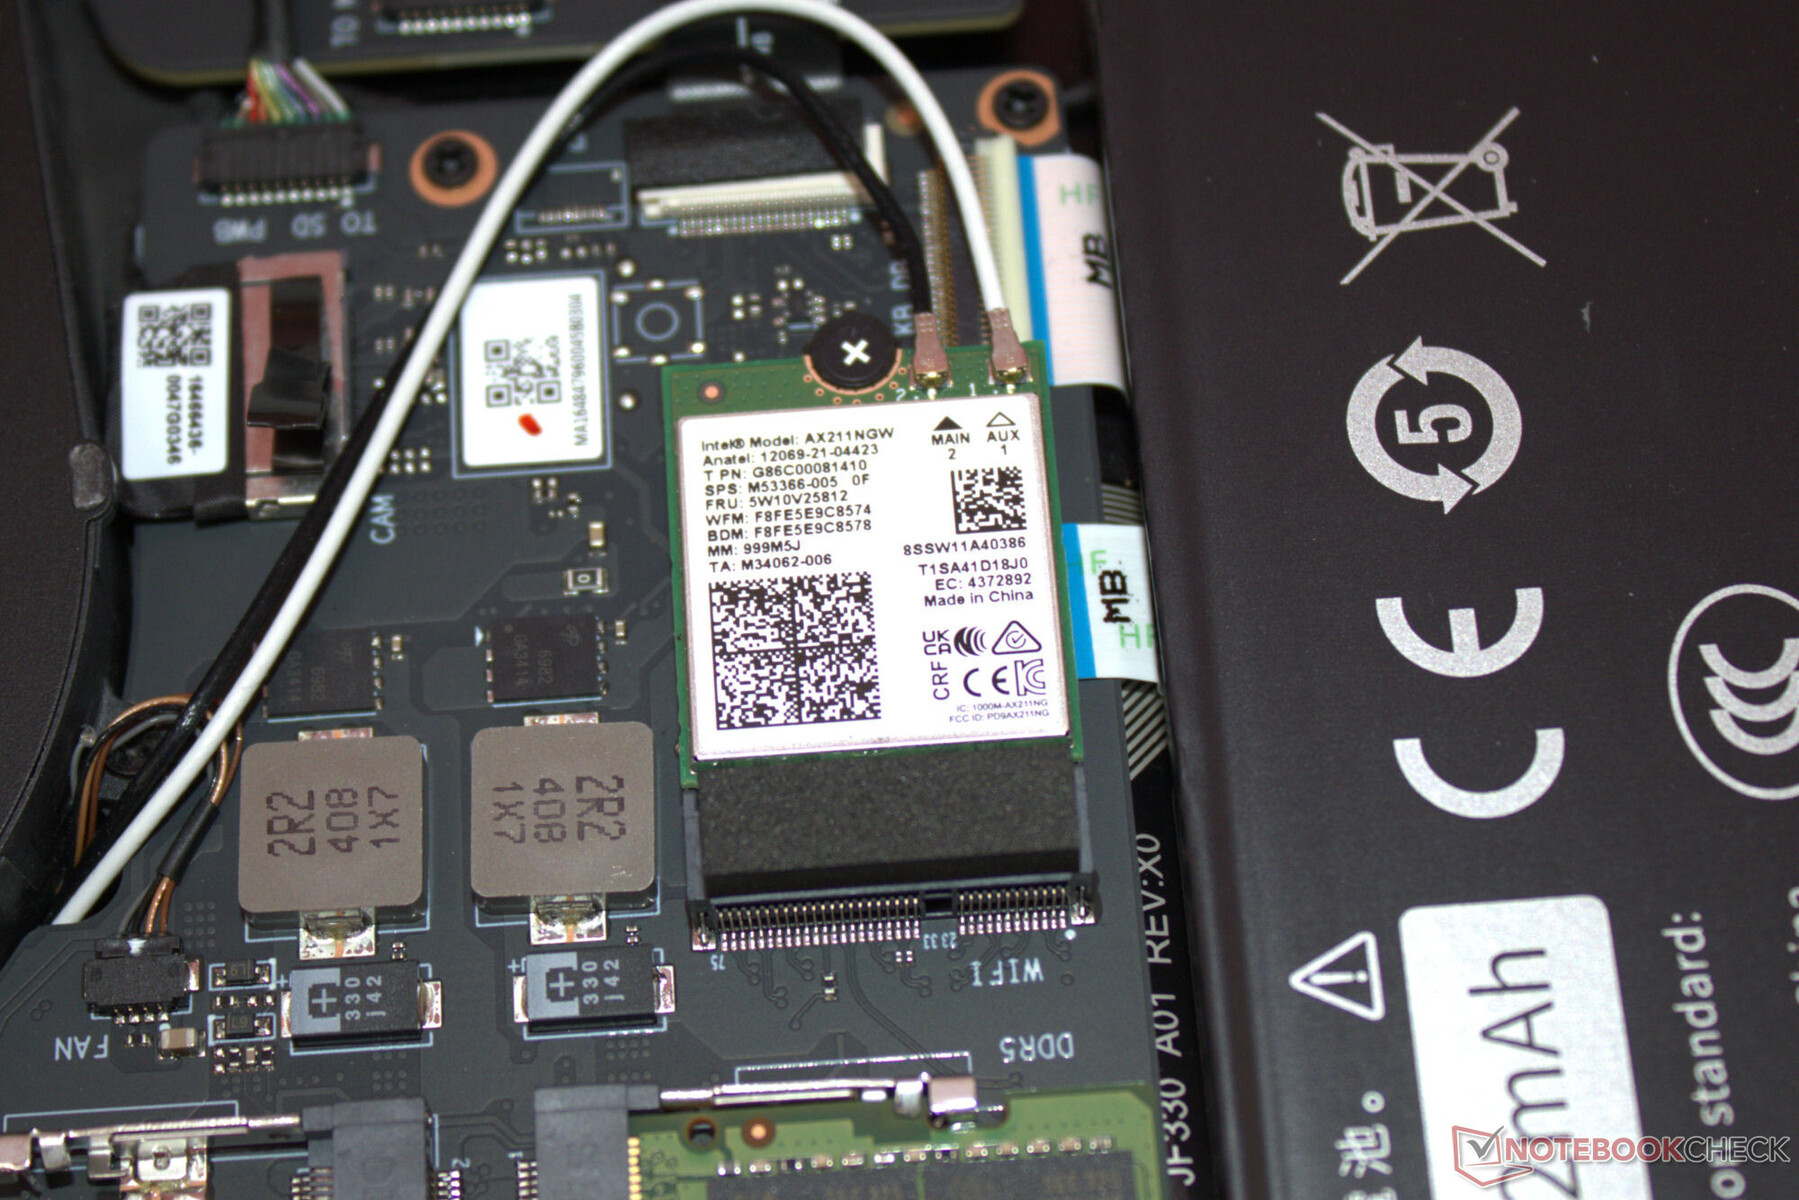
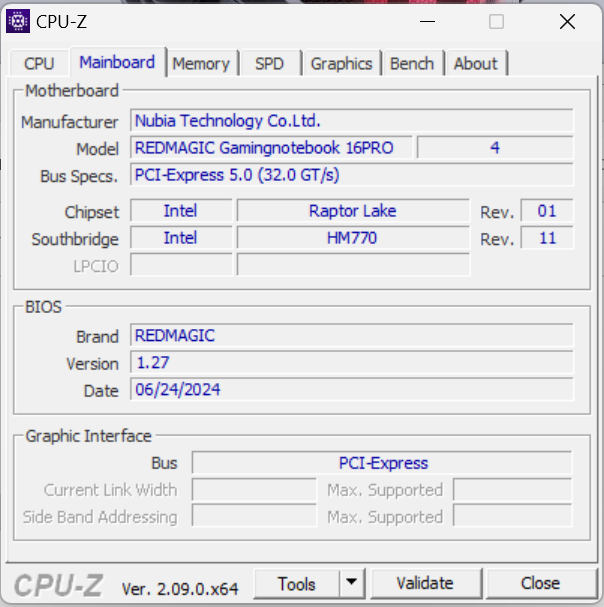
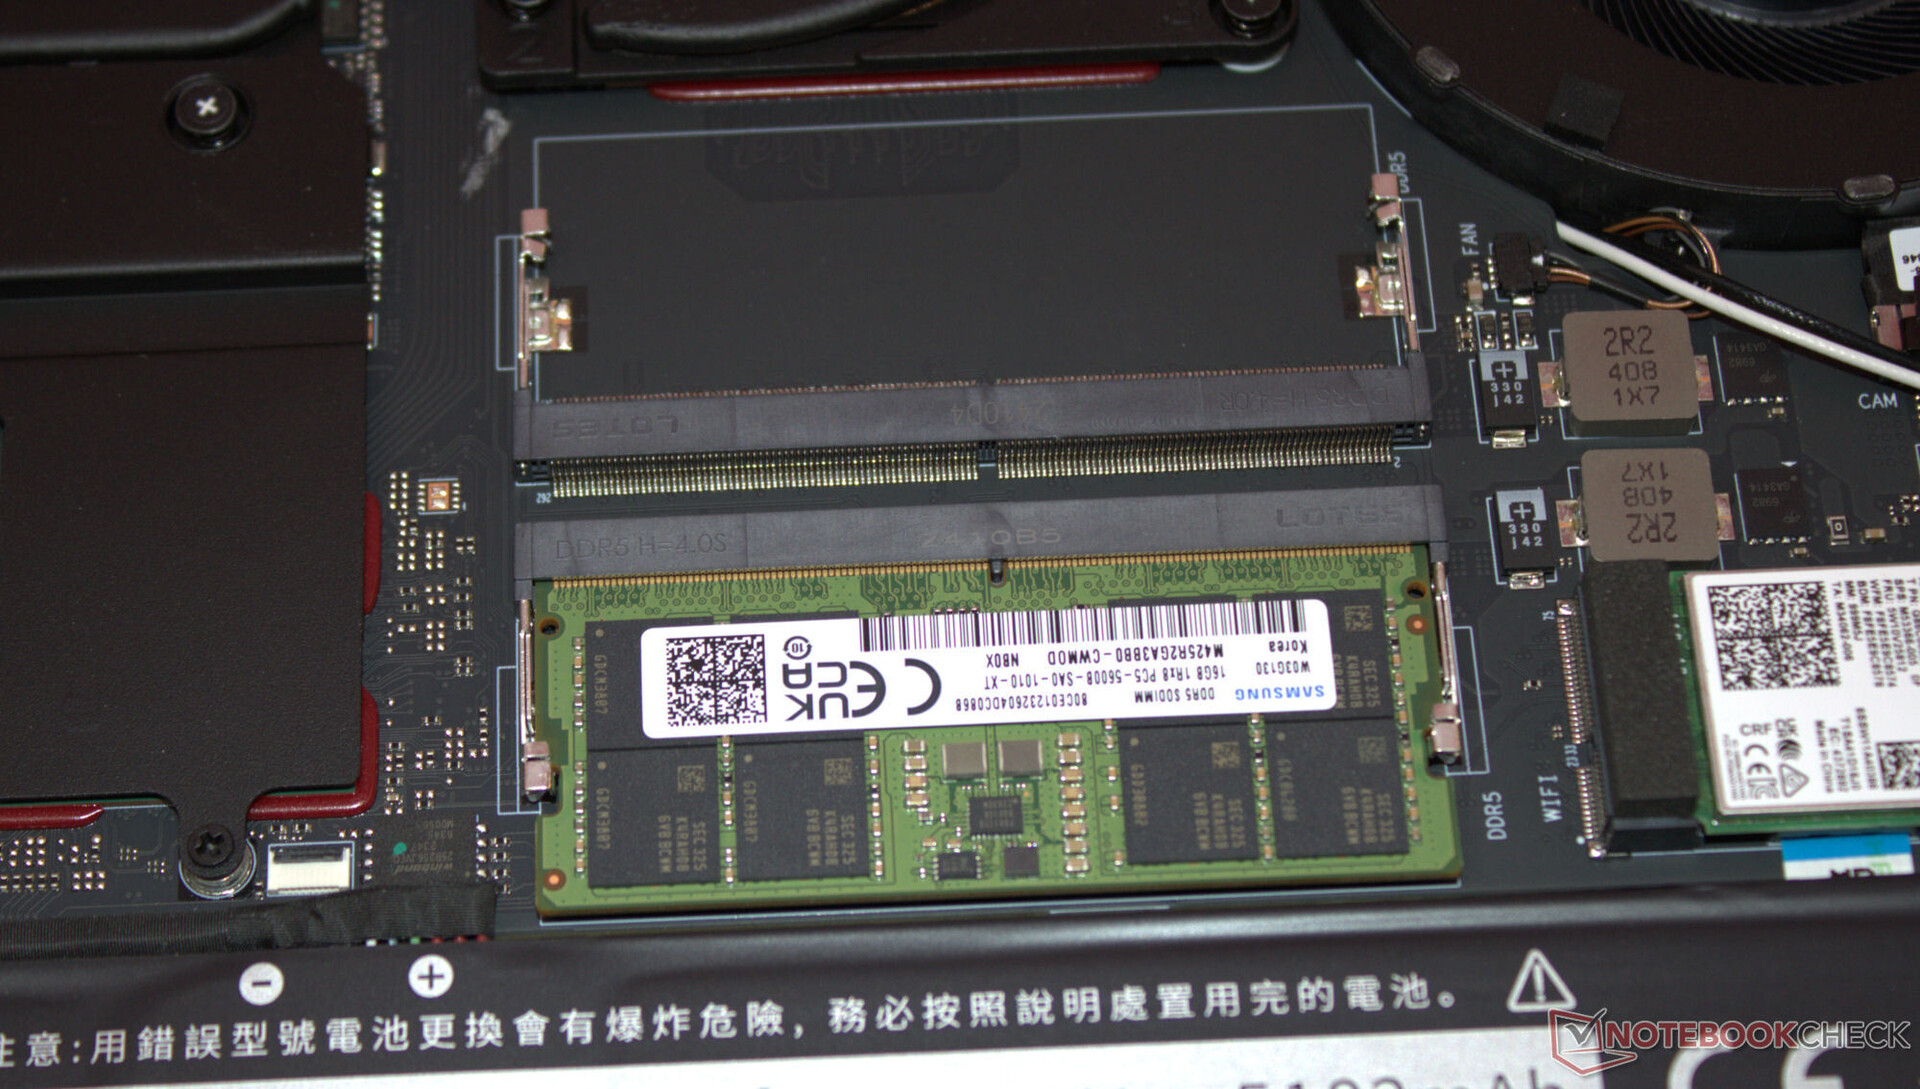
Po odkręceniu wszystkich śrubek na spodzie obudowy, dolną część obudowy można zdjąć za pomocą plektronu lub płaskiej szpatułki. Następnie można uzyskać dostęp do banków pamięci (z których jeden jest zajęty), dysku SSD (PCIe 4, M.2-2280), drugiego gniazda SSD (PCIe 4, M.2-2280) modułu WLAN, baterii BIOS, wentylatorów i baterii.
Zrównoważony rozwój
Dużo kartonu, mało plastiku: laptop jest zamknięty w folii, a cienka piankowa mata chroni górną część urządzenia. Wydrukowana skrócona instrukcja obsługi znajduje się w plastikowej torbie. Zdejmowana płyta bazowa umożliwia naprawę laptopa - cały sprzęt jest dostępny. Aktualizacje oprogramowania nie powinny stanowić problemu przez kilka następnych lat - w końcu Windows 11 jest używany jako system operacyjny.
Nie wiadomo jeszcze, jak Nubia poradzi sobie z dostawą części zamiennych i wsparciem dla własnego oprogramowania. W momencie testowania, na stronie internetowej Nubii wciąż nie ma obszaru pobierania dla Titan.
Gwarancja
Nie możemy udzielić żadnych informacji na temat gwarancji laptopa - prawdopodobnie wynosi ona około 12 miesięcy, co jest standardem w Stanach Zjednoczonych. Uważamy, że przedłużenie gwarancji jest mało prawdopodobne.
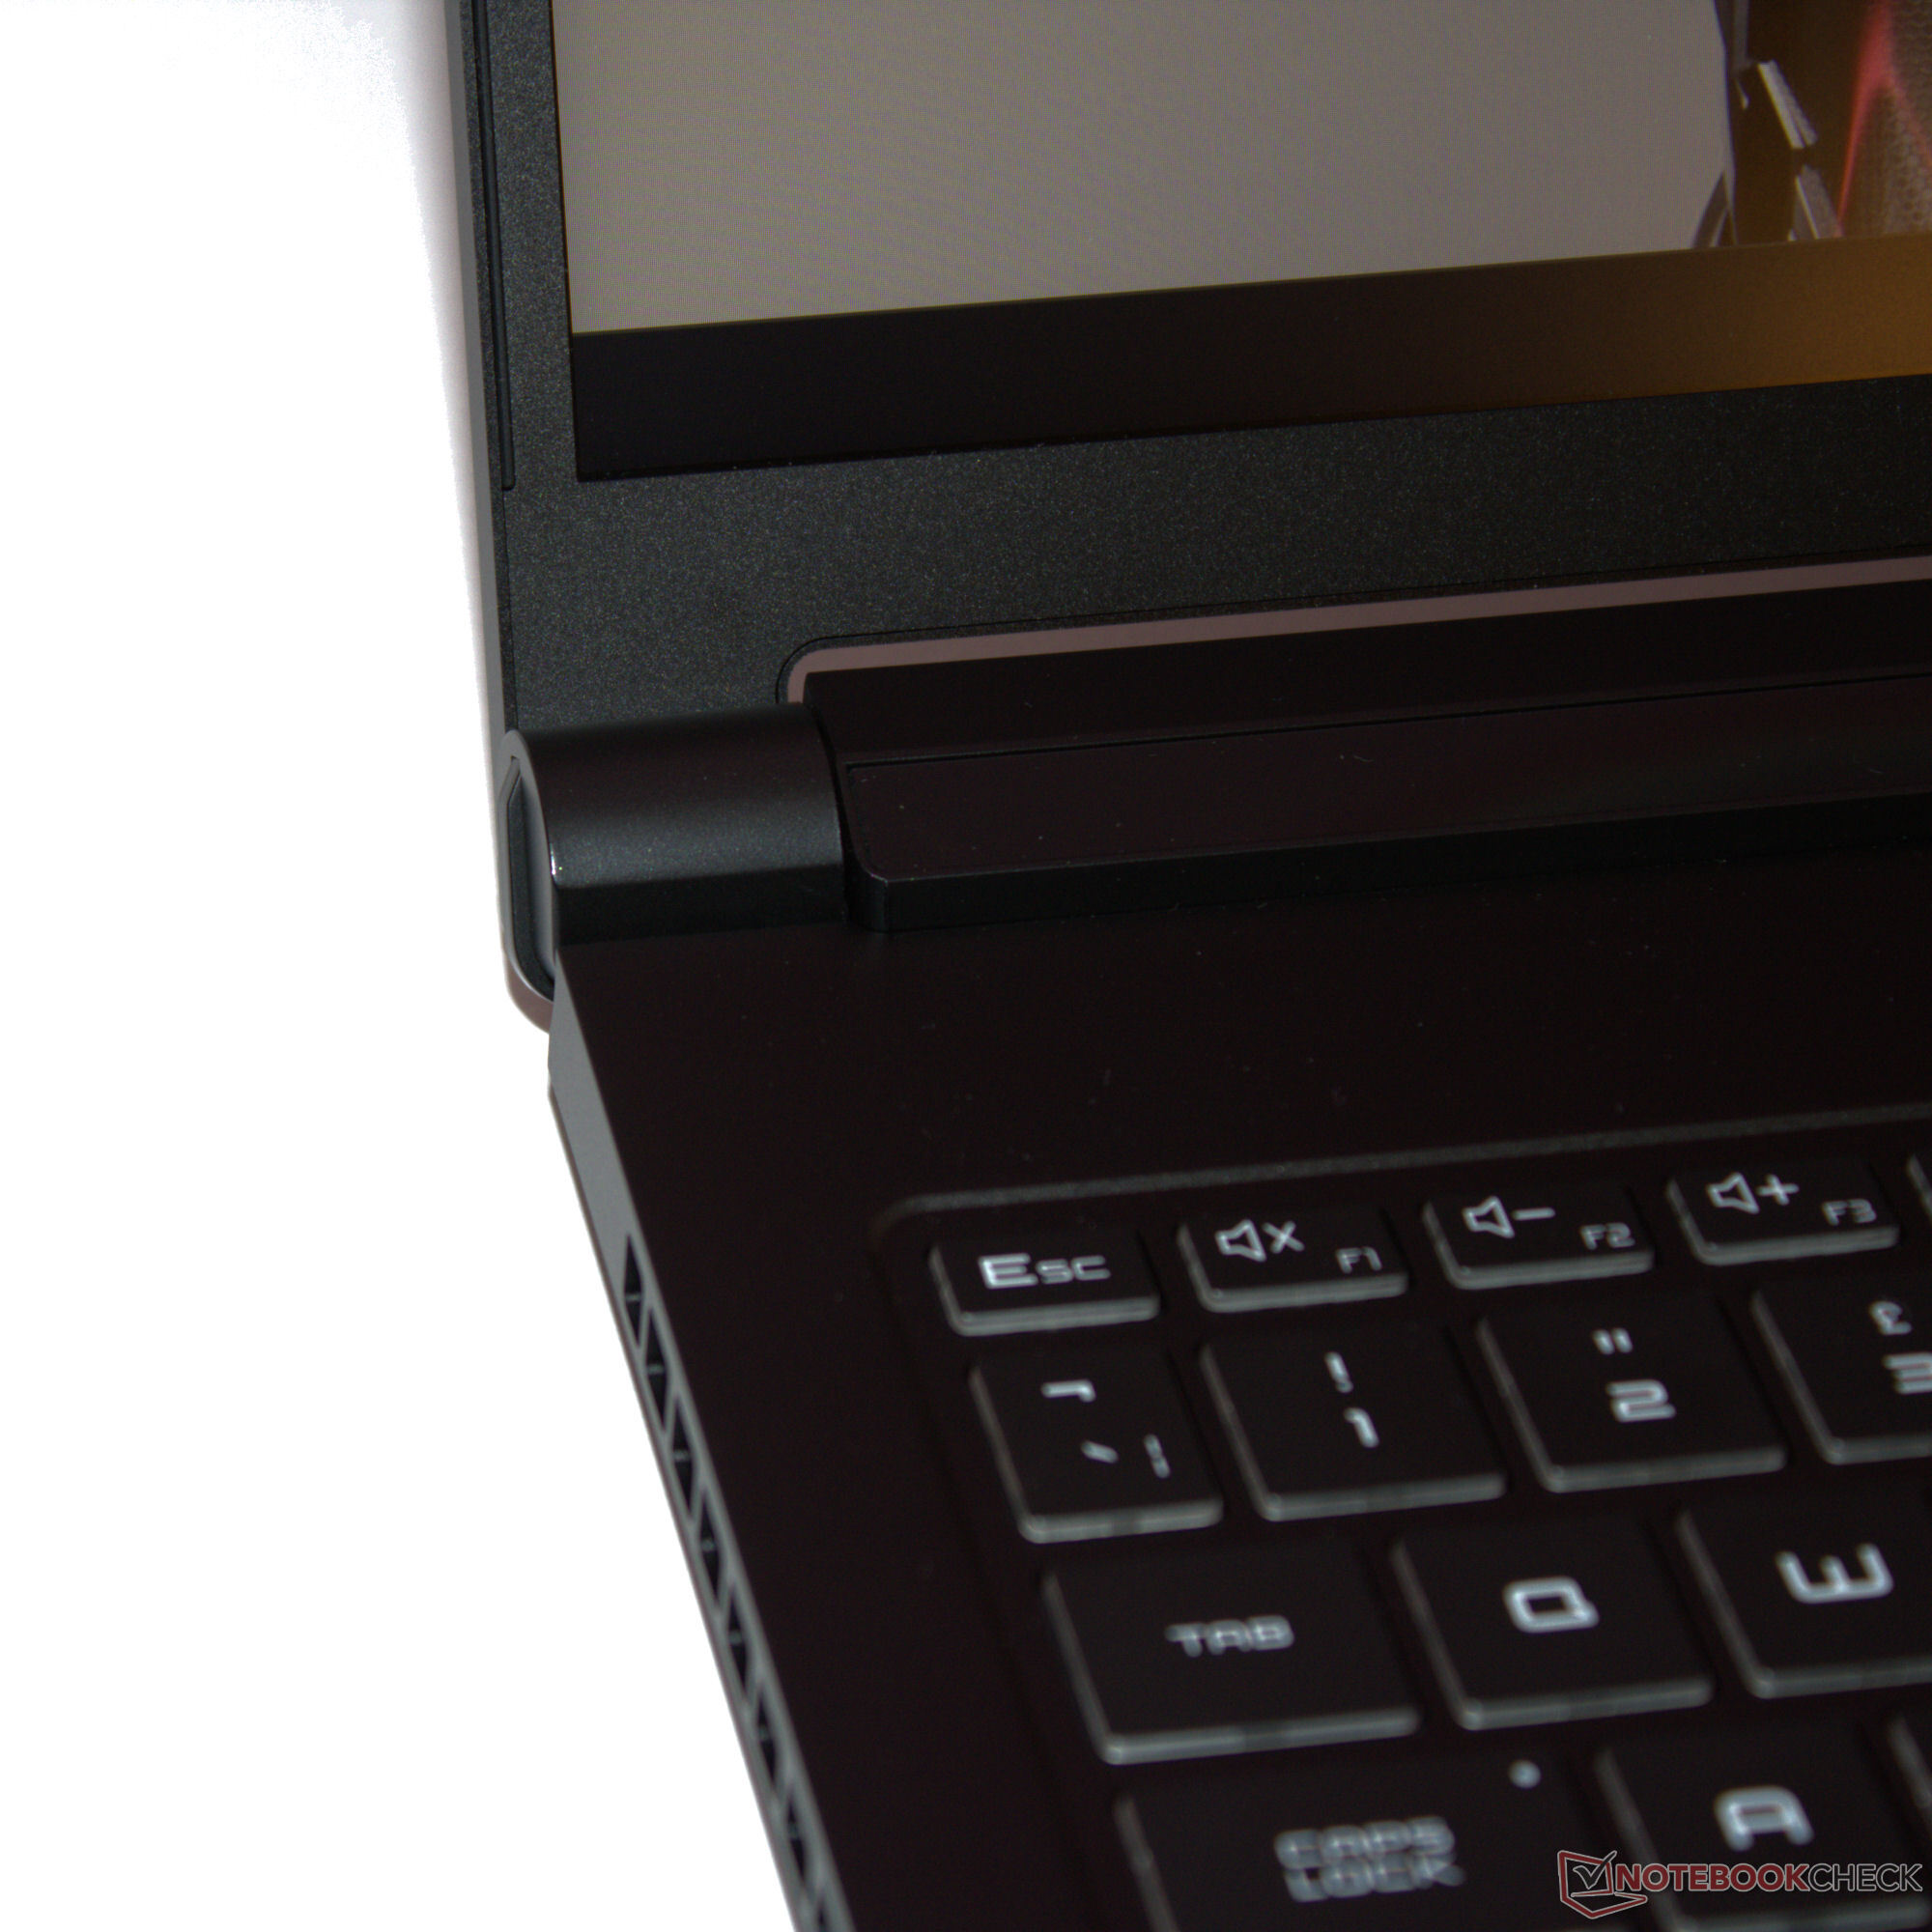
Urządzenia wejściowe - laptop RedMagic z oświetleniem RGB
Klawiatura
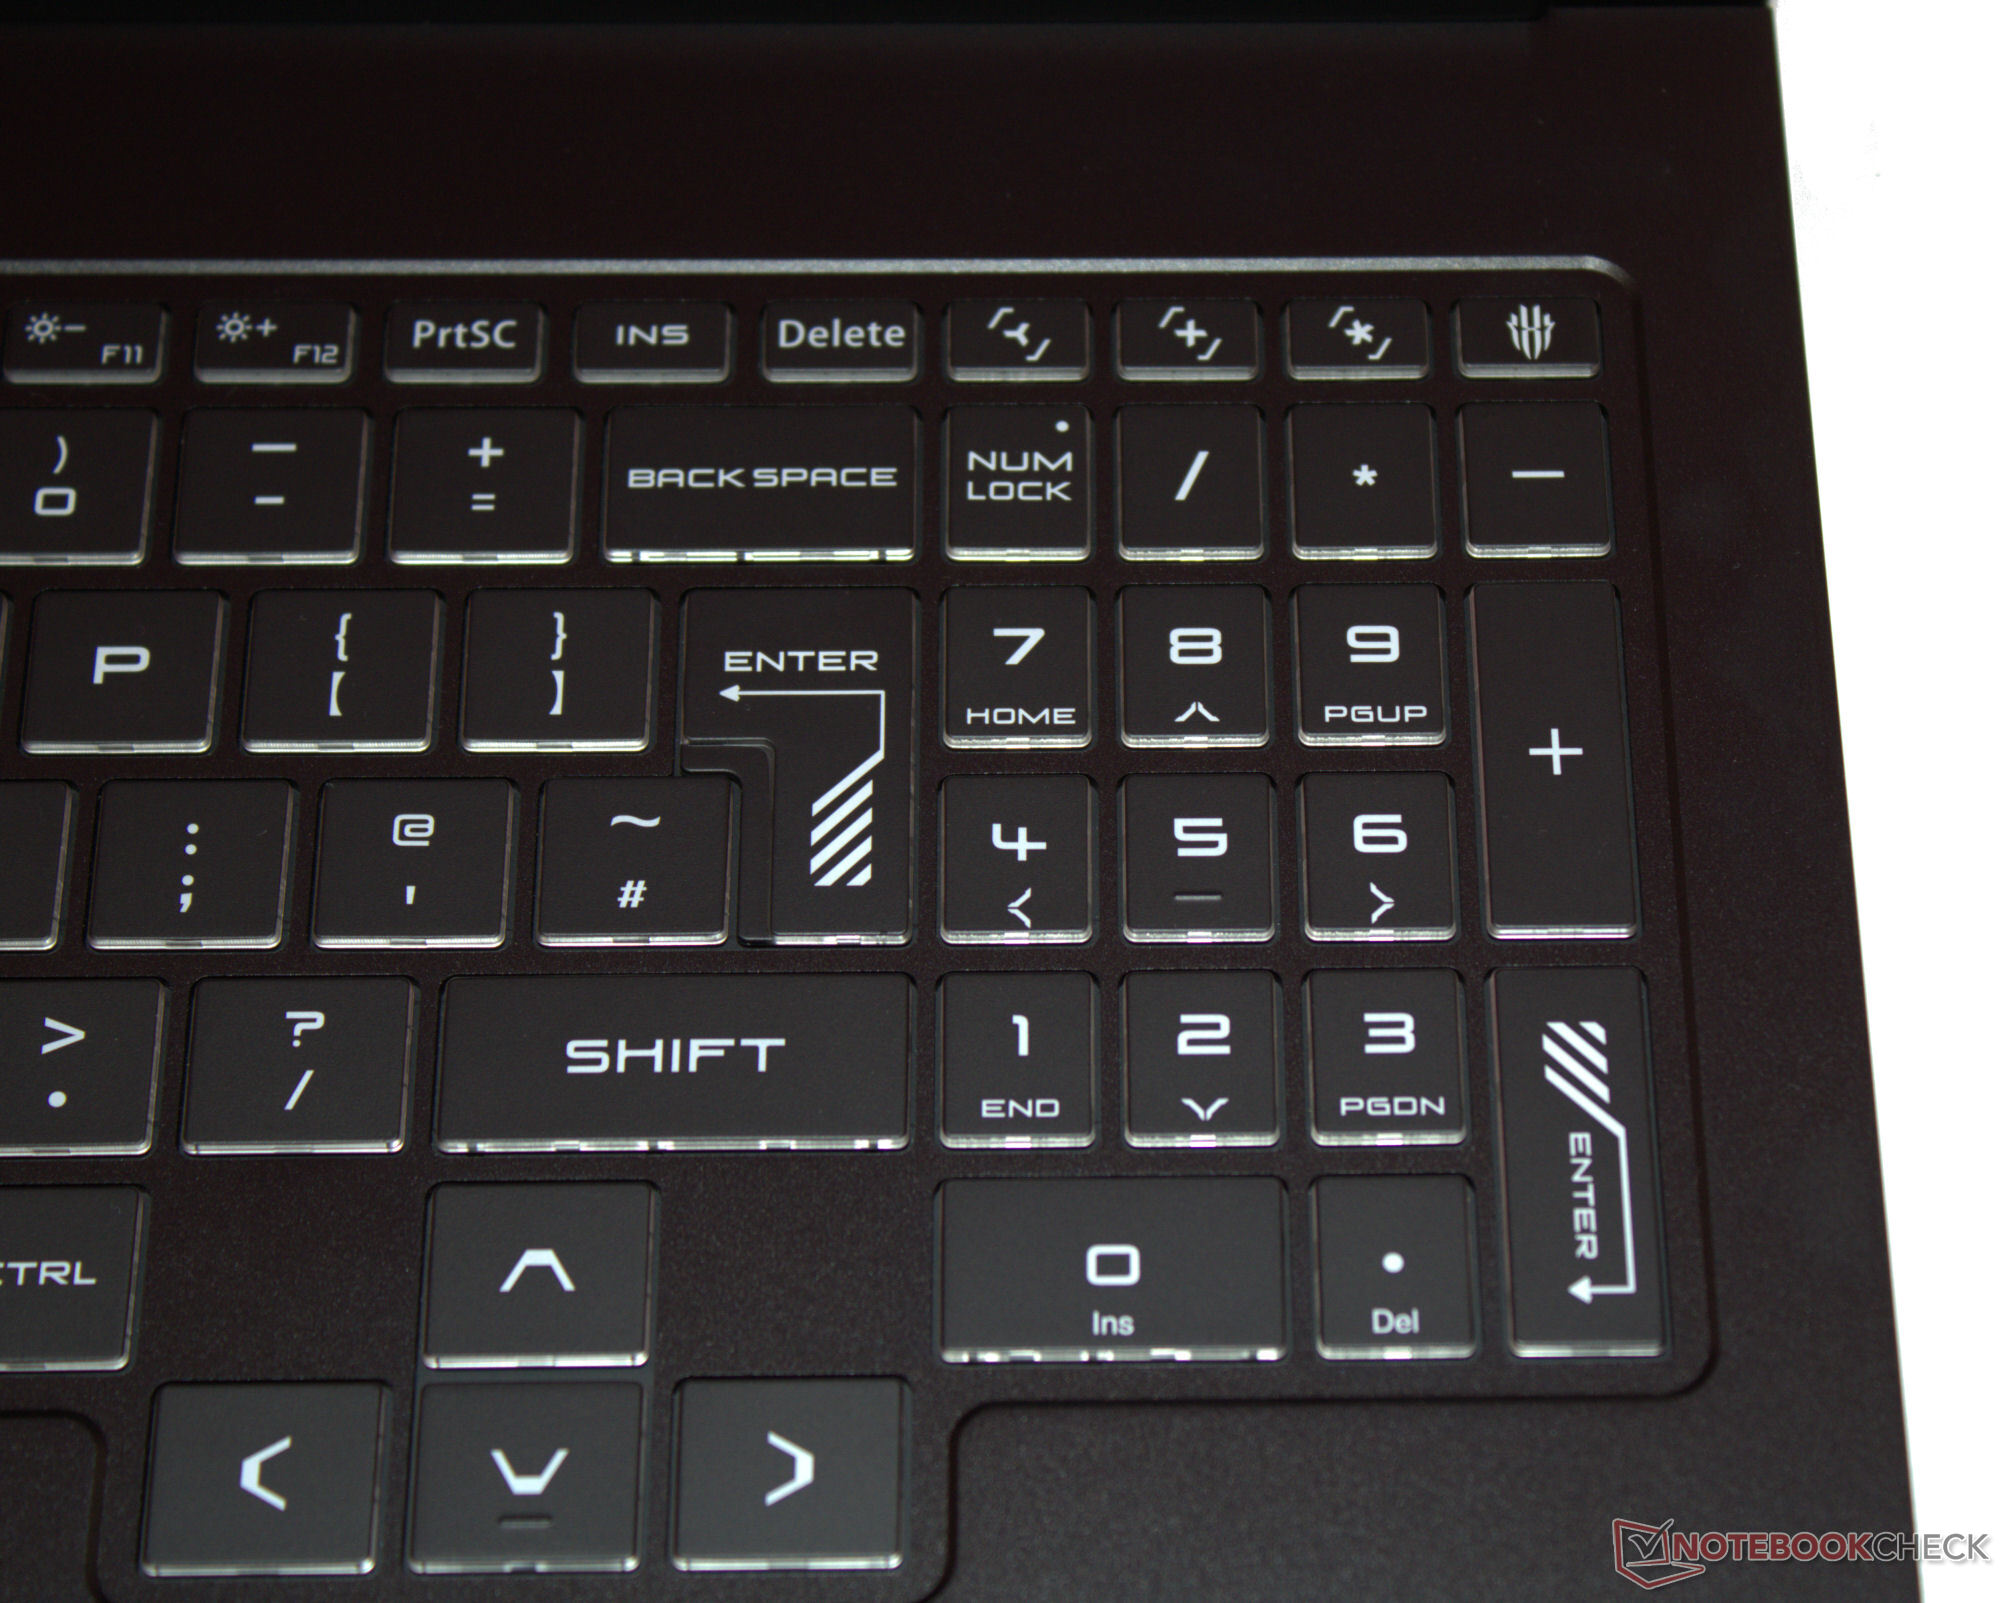
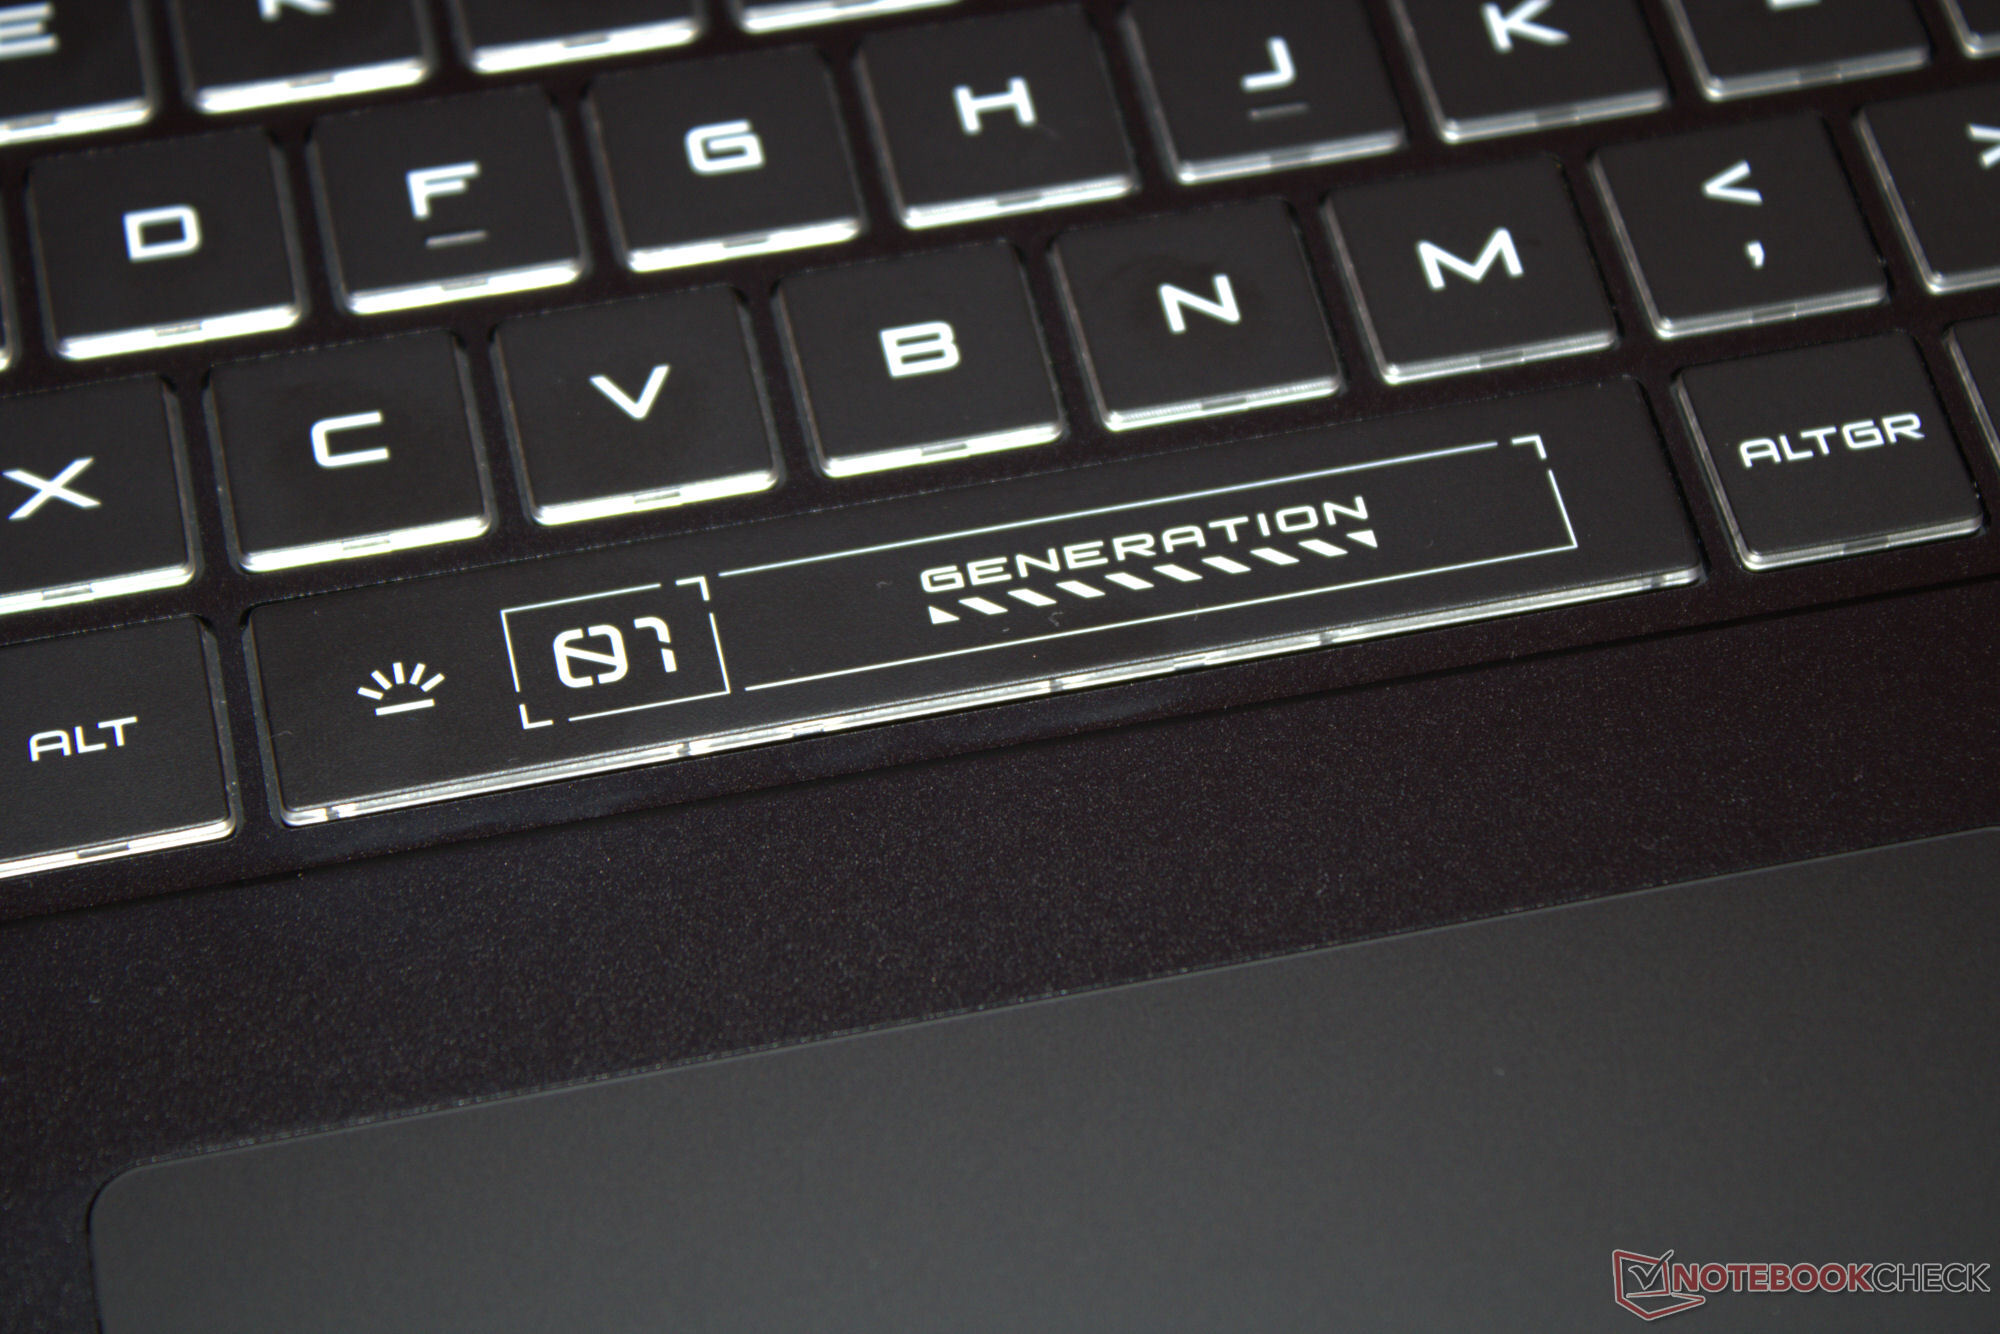
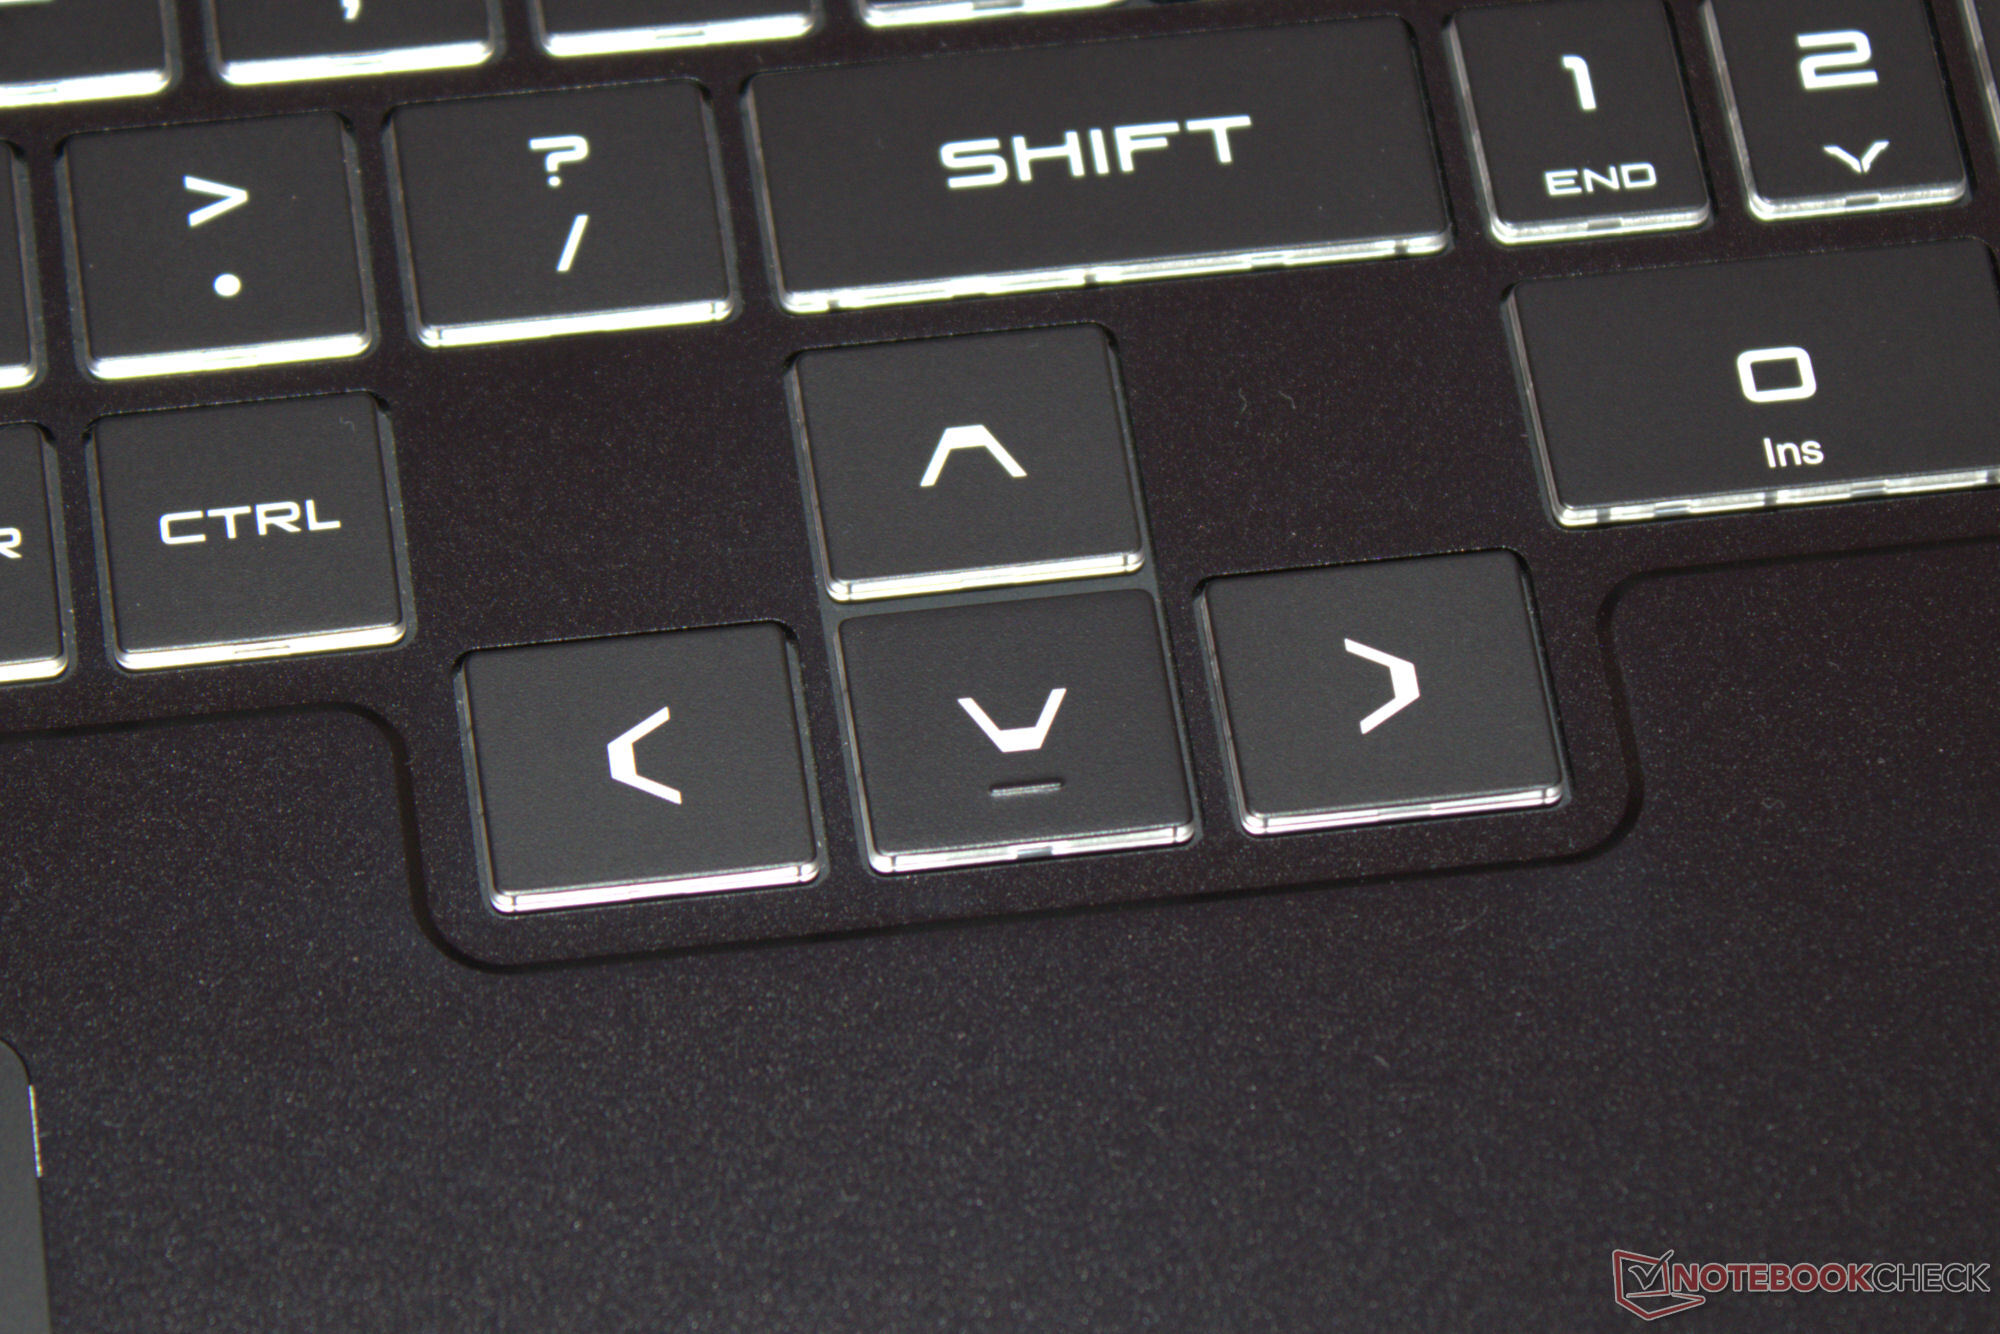
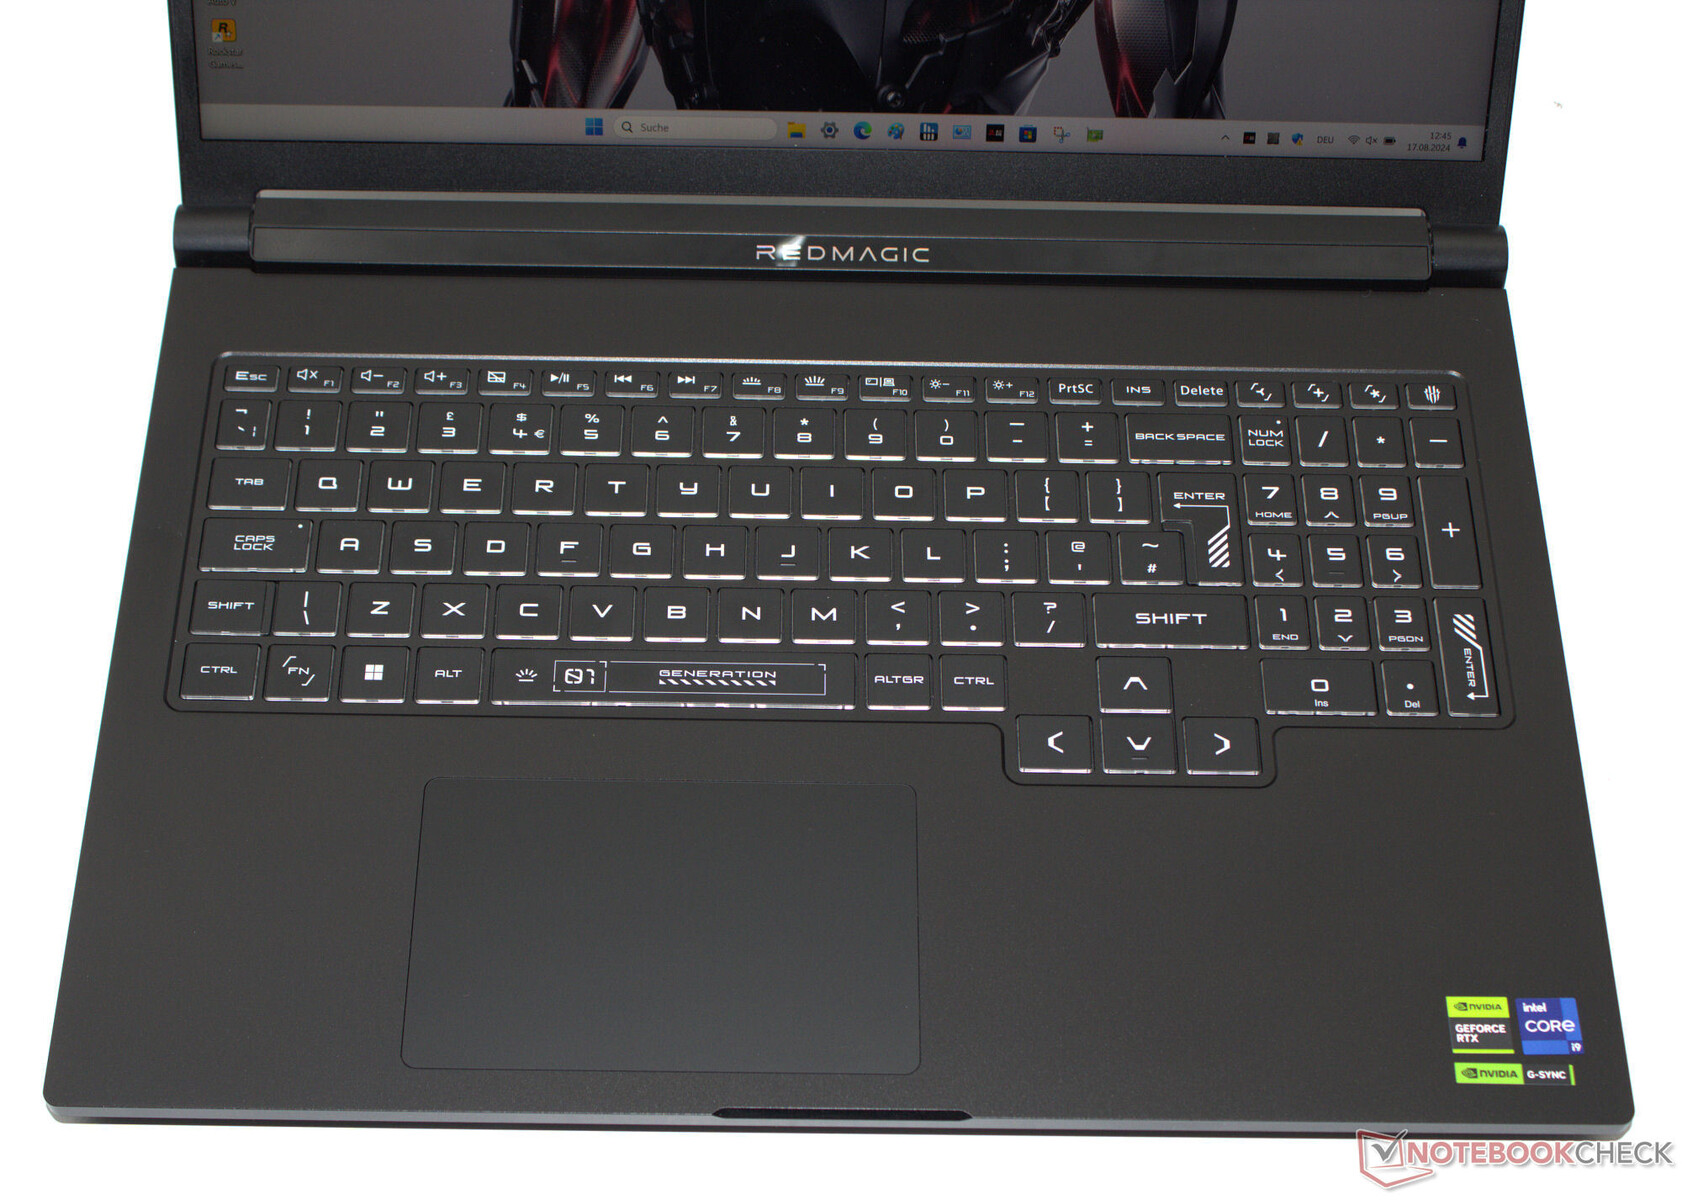
Nubia postawiła na klawiaturę typu chiclet, w tym klawiaturę numeryczną. Równomiernie podświetlone klawisze charakteryzują się krótkim skokiem i wyraźnym punktem nacisku. Klawiatura nie ugina się podczas pisania. Pozytywne jest to, że przesunięte klawisze strzałek są pełnowymiarowe. Podświetlenie RGB jest podzielone na cztery strefy, a nasze urządzenie testowe ma układ klawiatury QWERTY. Nie możemy powiedzieć, czy producent oferuje zlokalizowane układy.
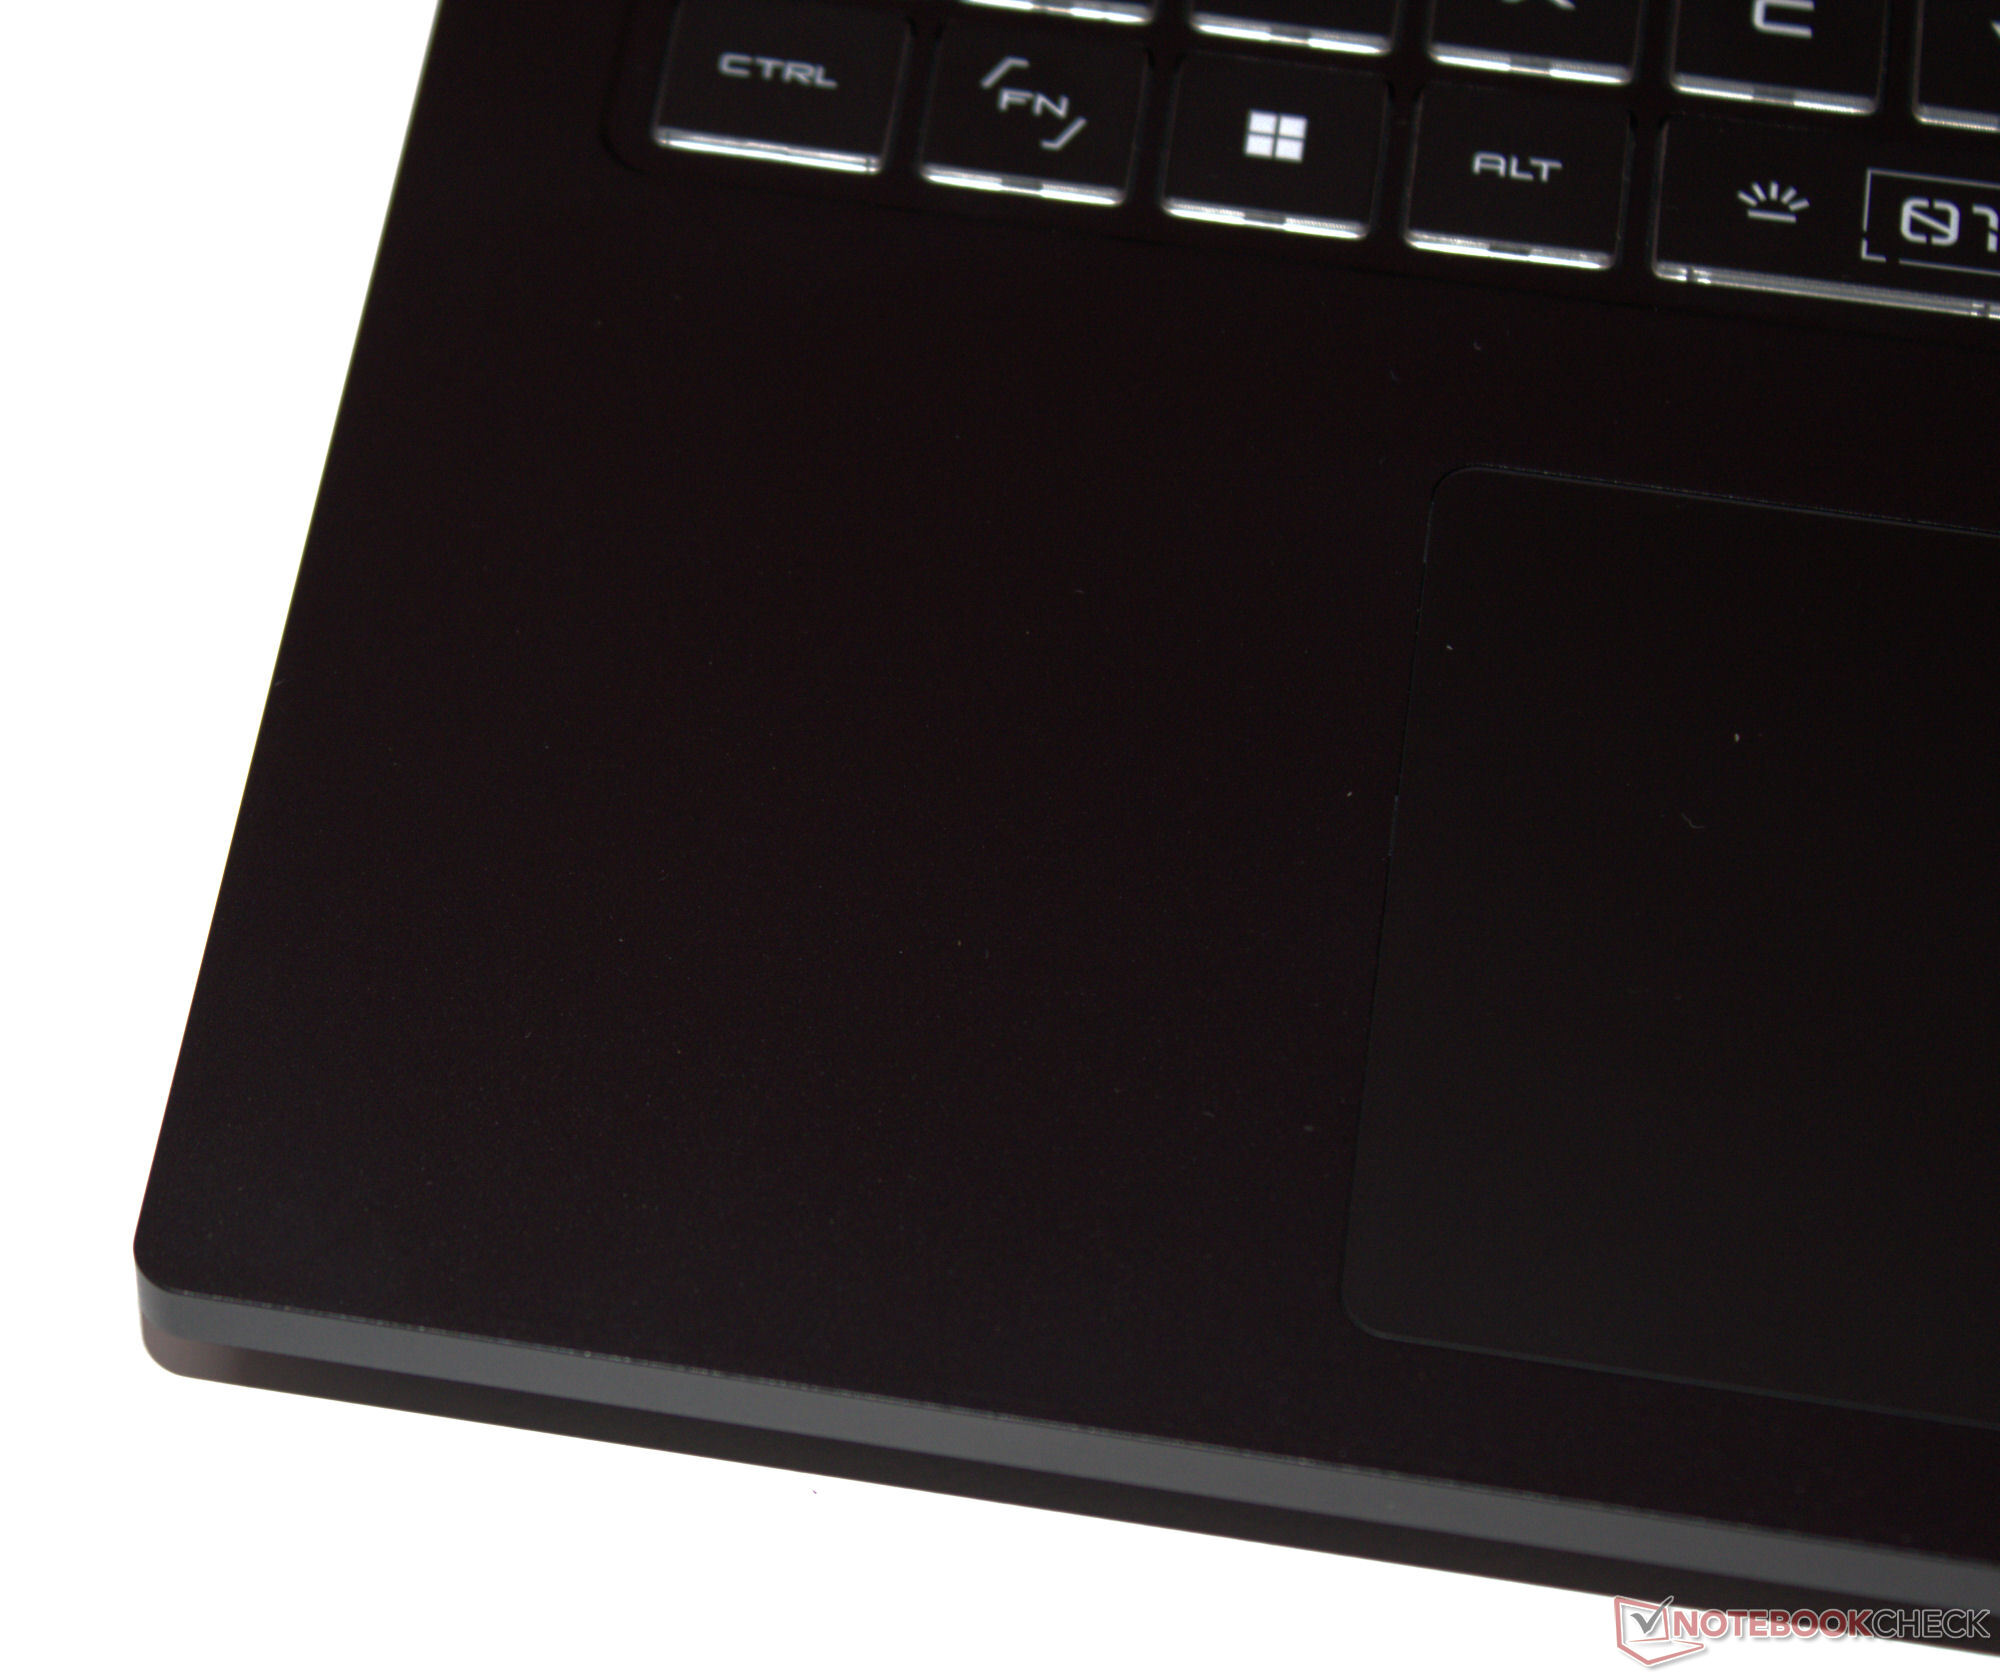
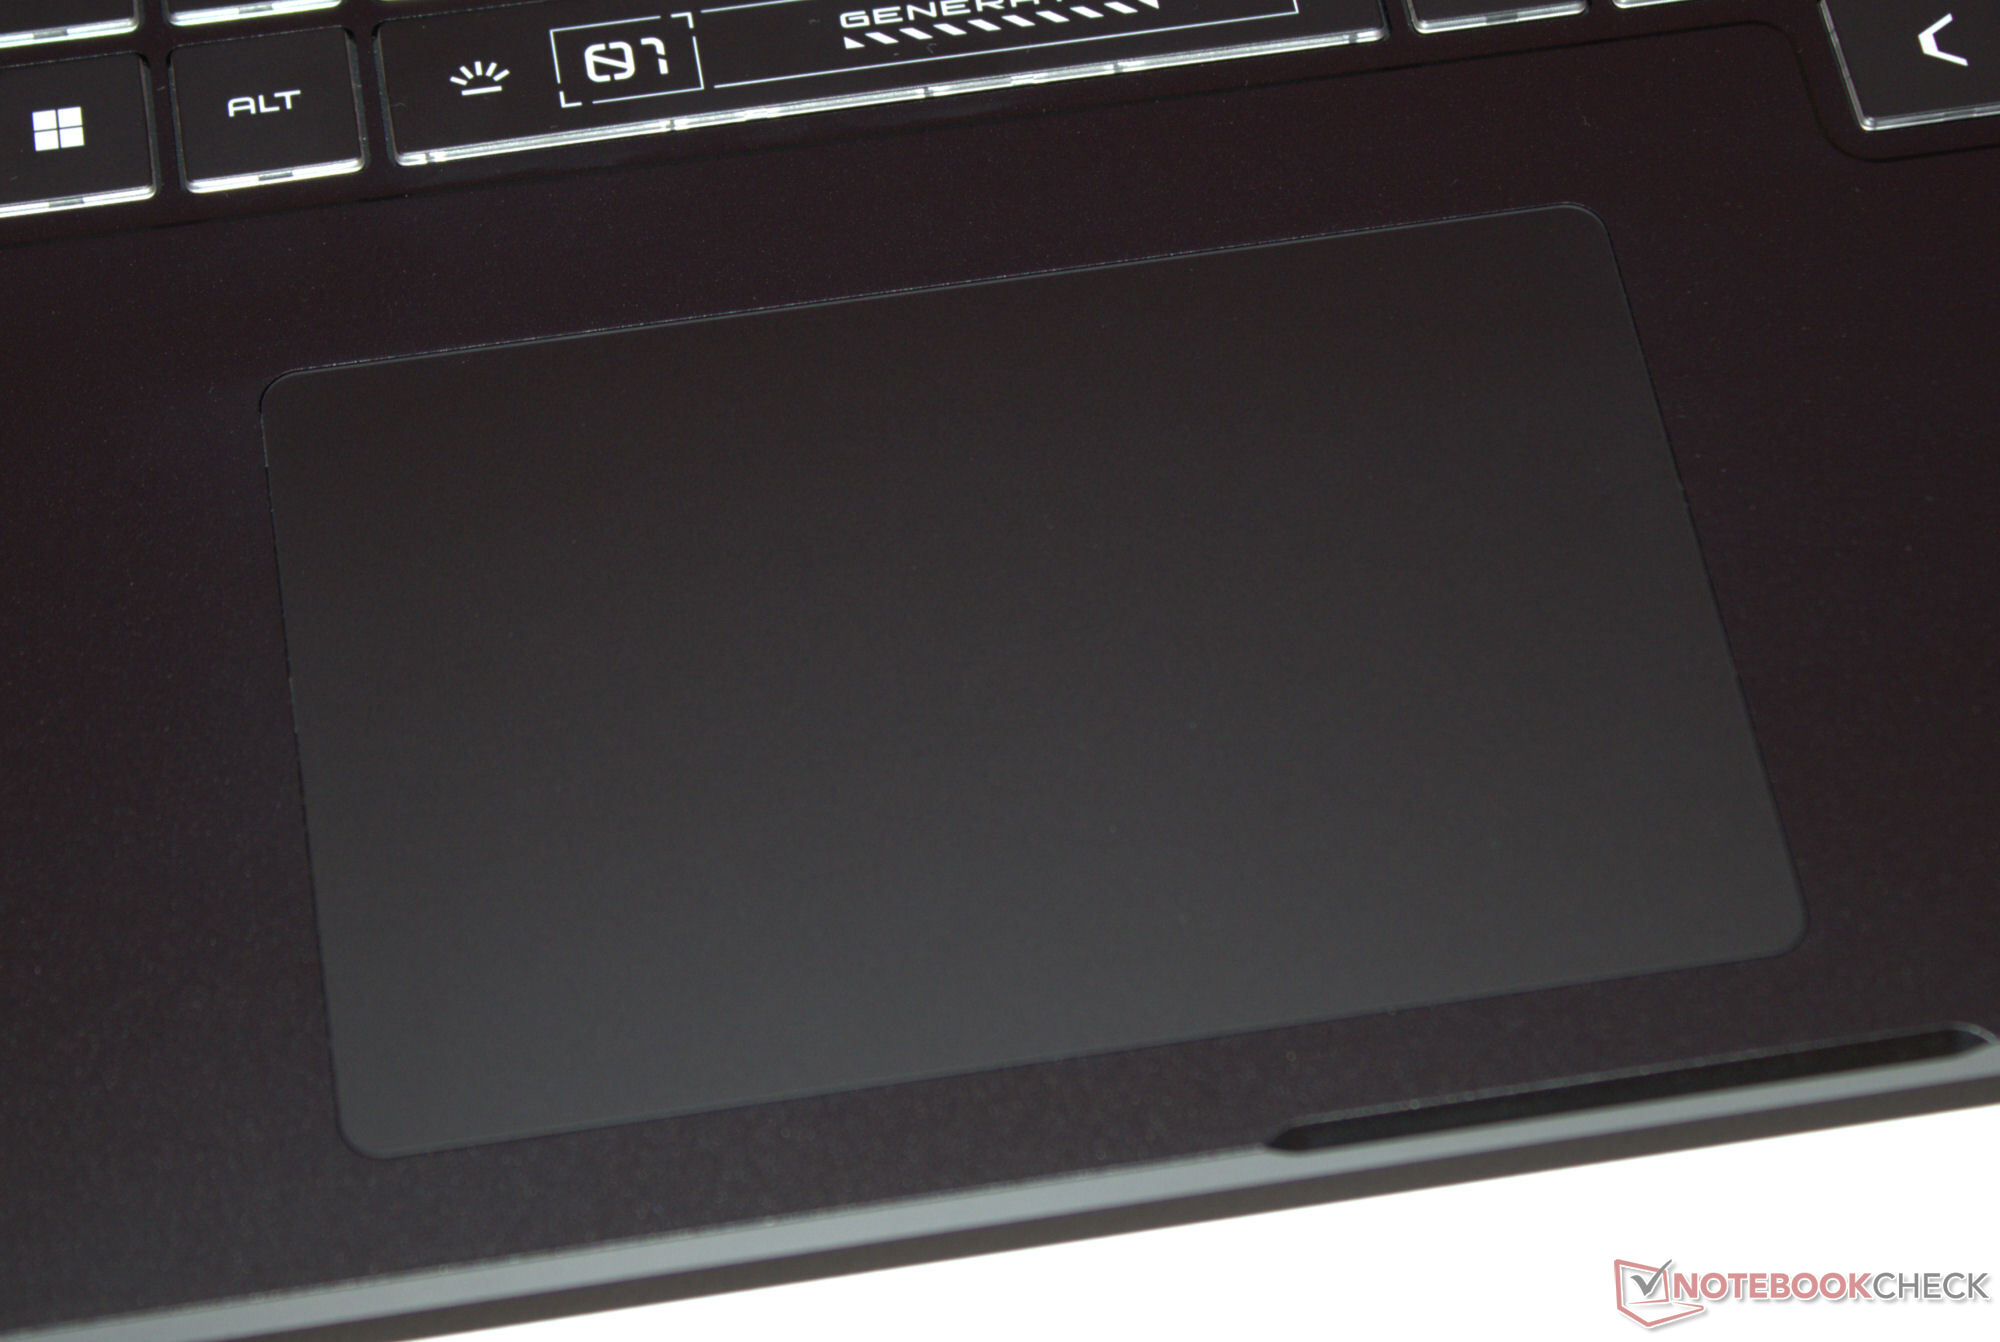
Panel dotykowy
Wielodotykowy clickpad (ok. 11,7 x 7,5 cm) ze szklaną powierzchnią służy jako zamiennik myszy. Ma krótki skok i wyraźny punkt nacisku. W razie potrzeby podkładkę można dezaktywować.
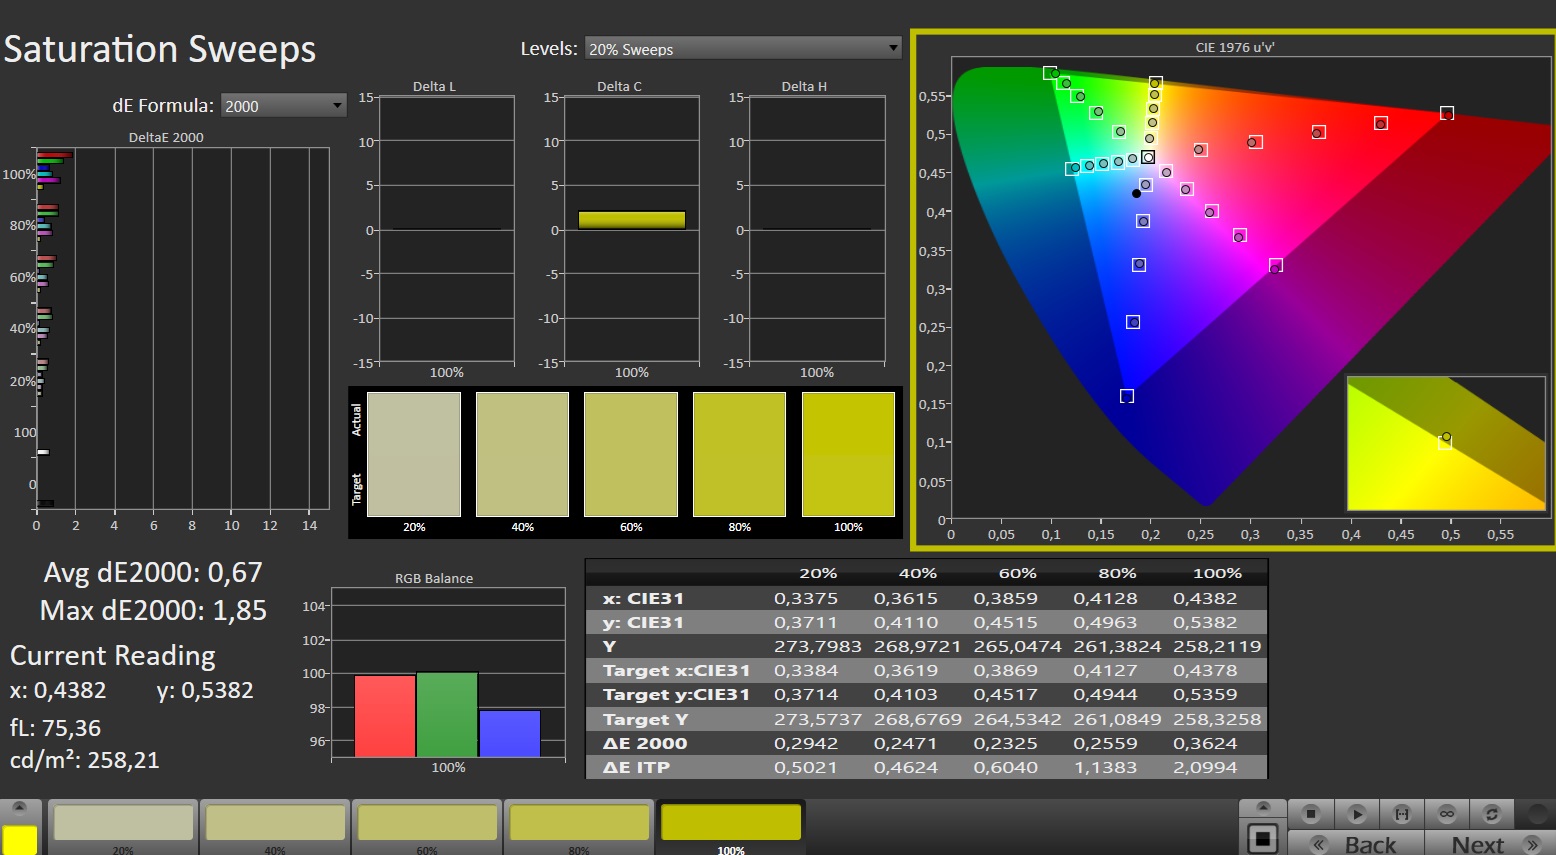
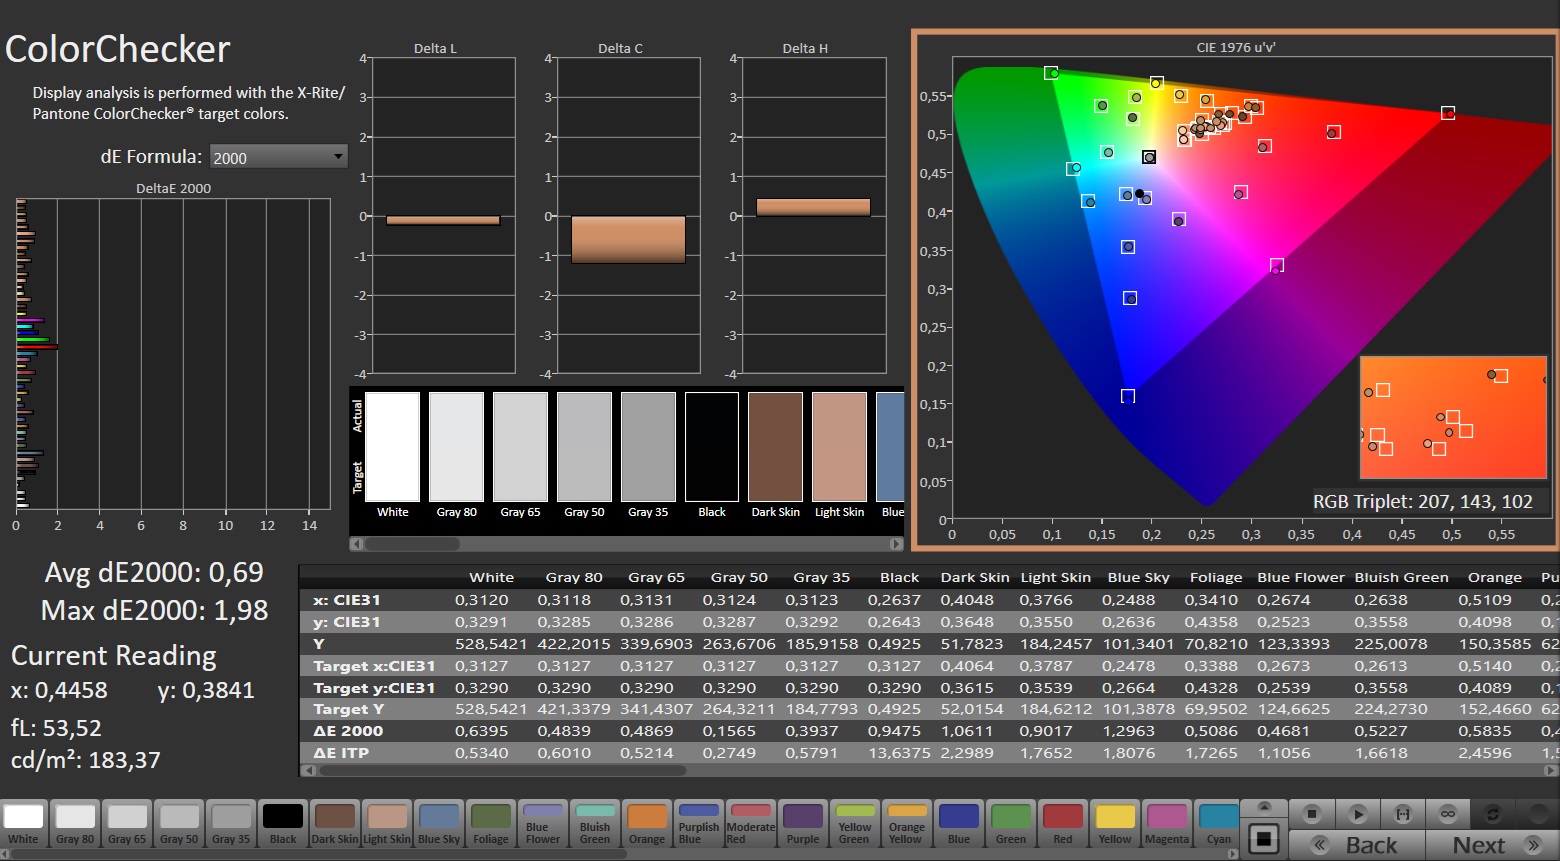
Wyświetlacz - panel IPS z pokryciem DCI-P3
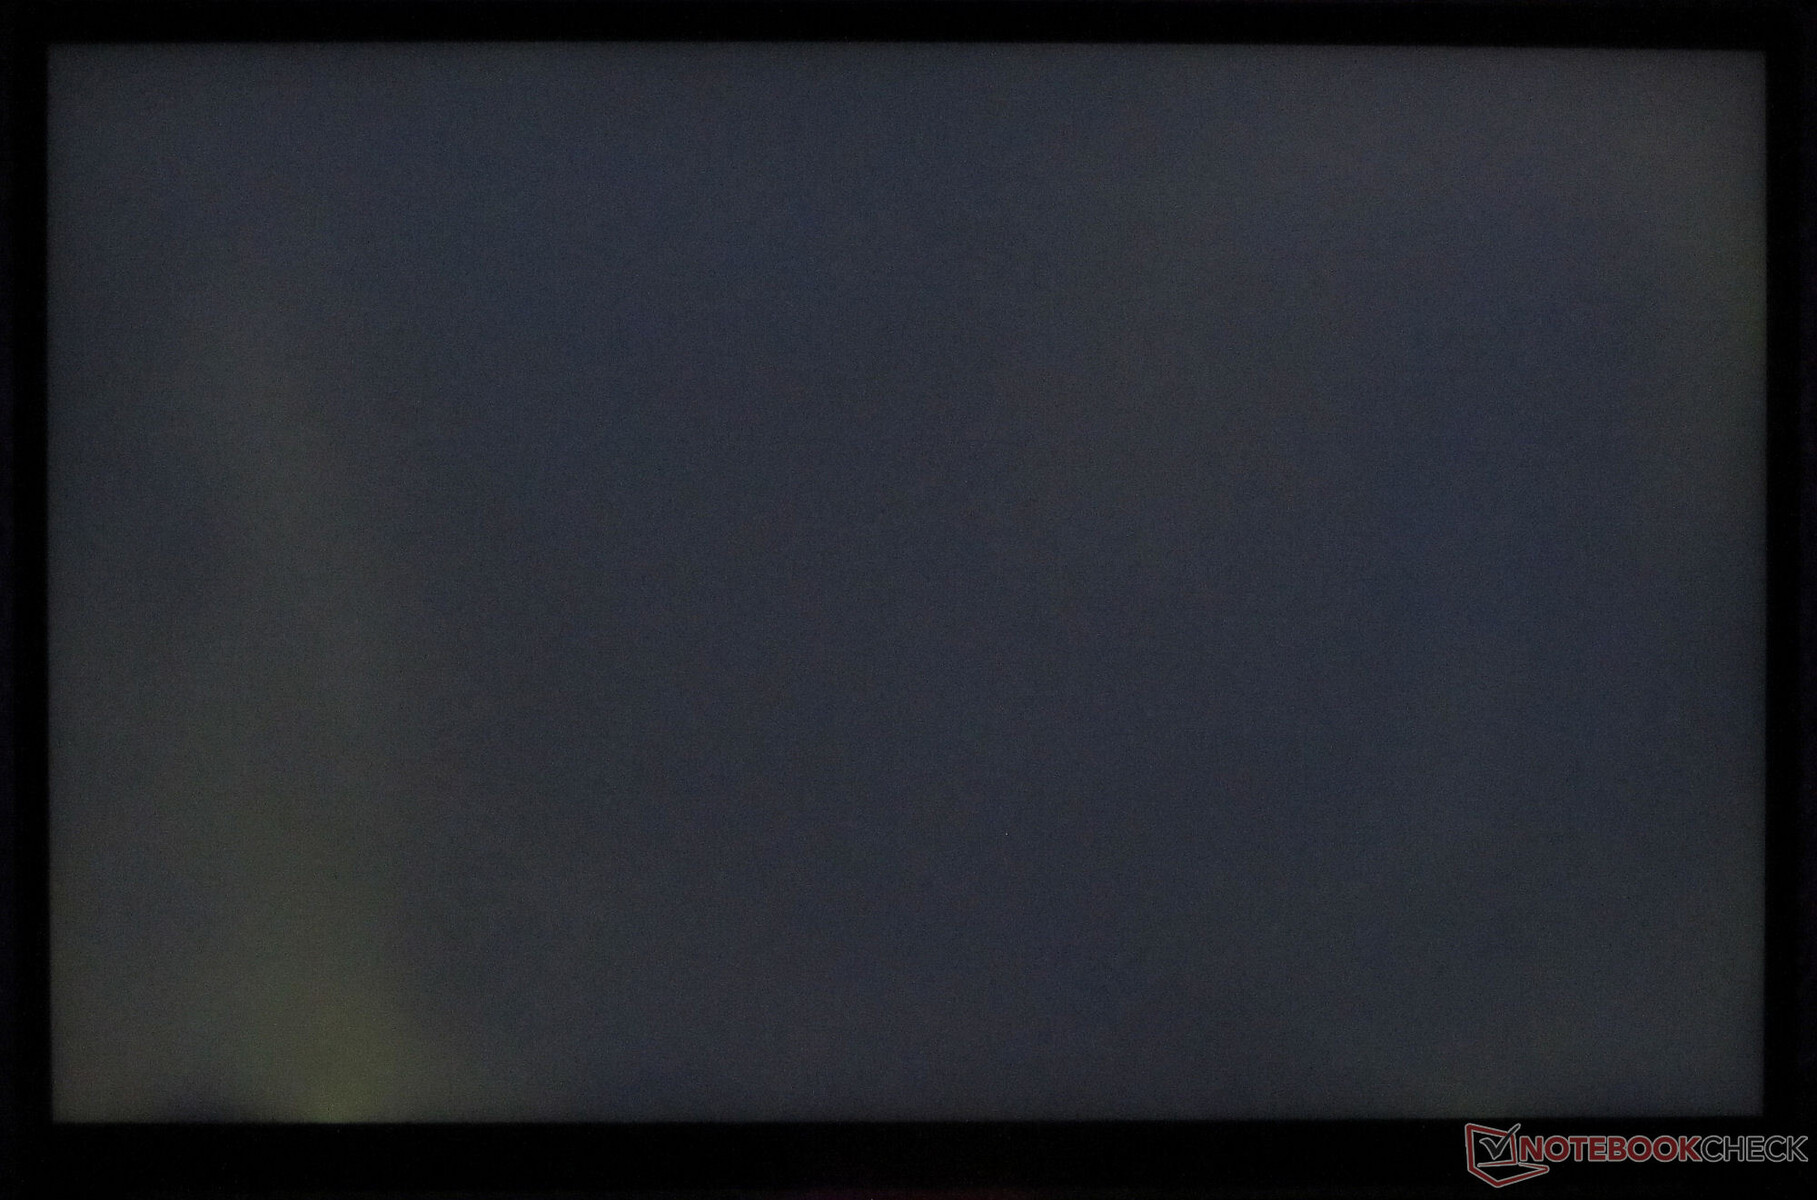
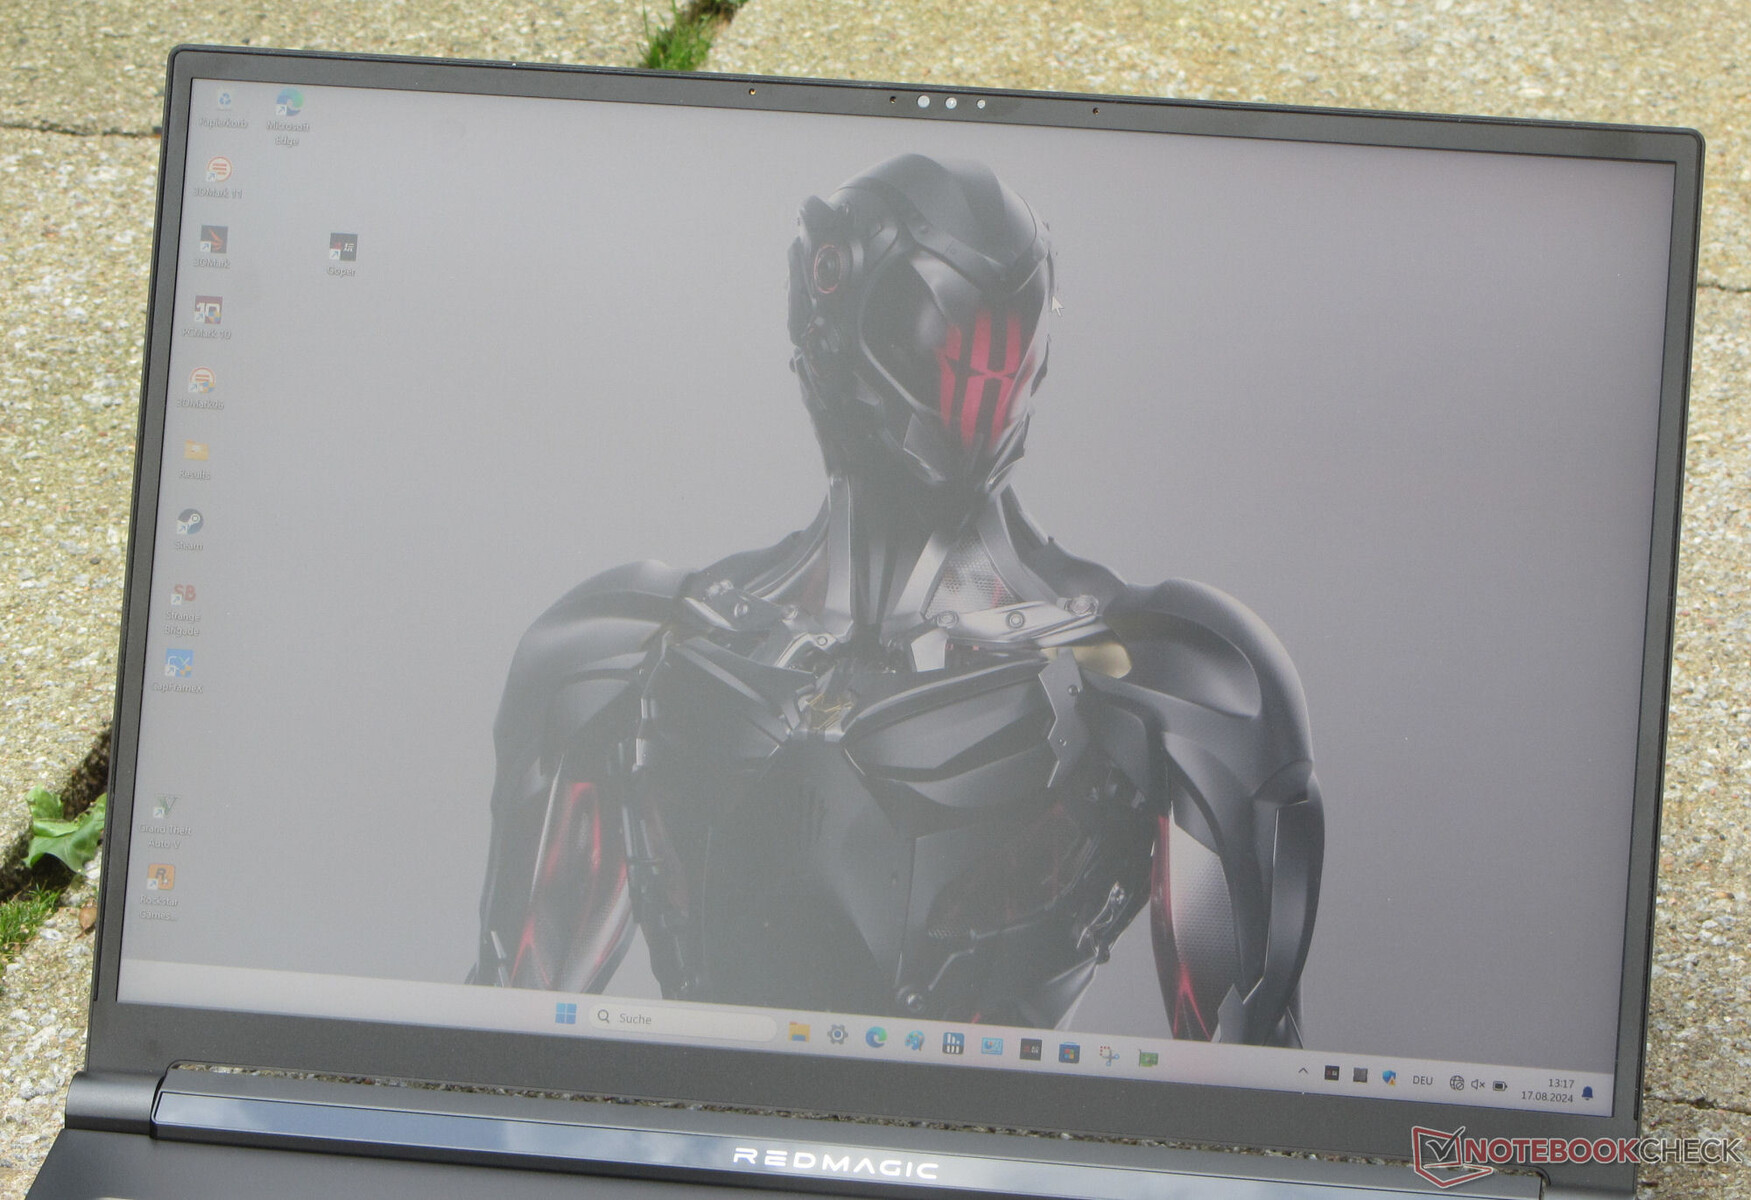
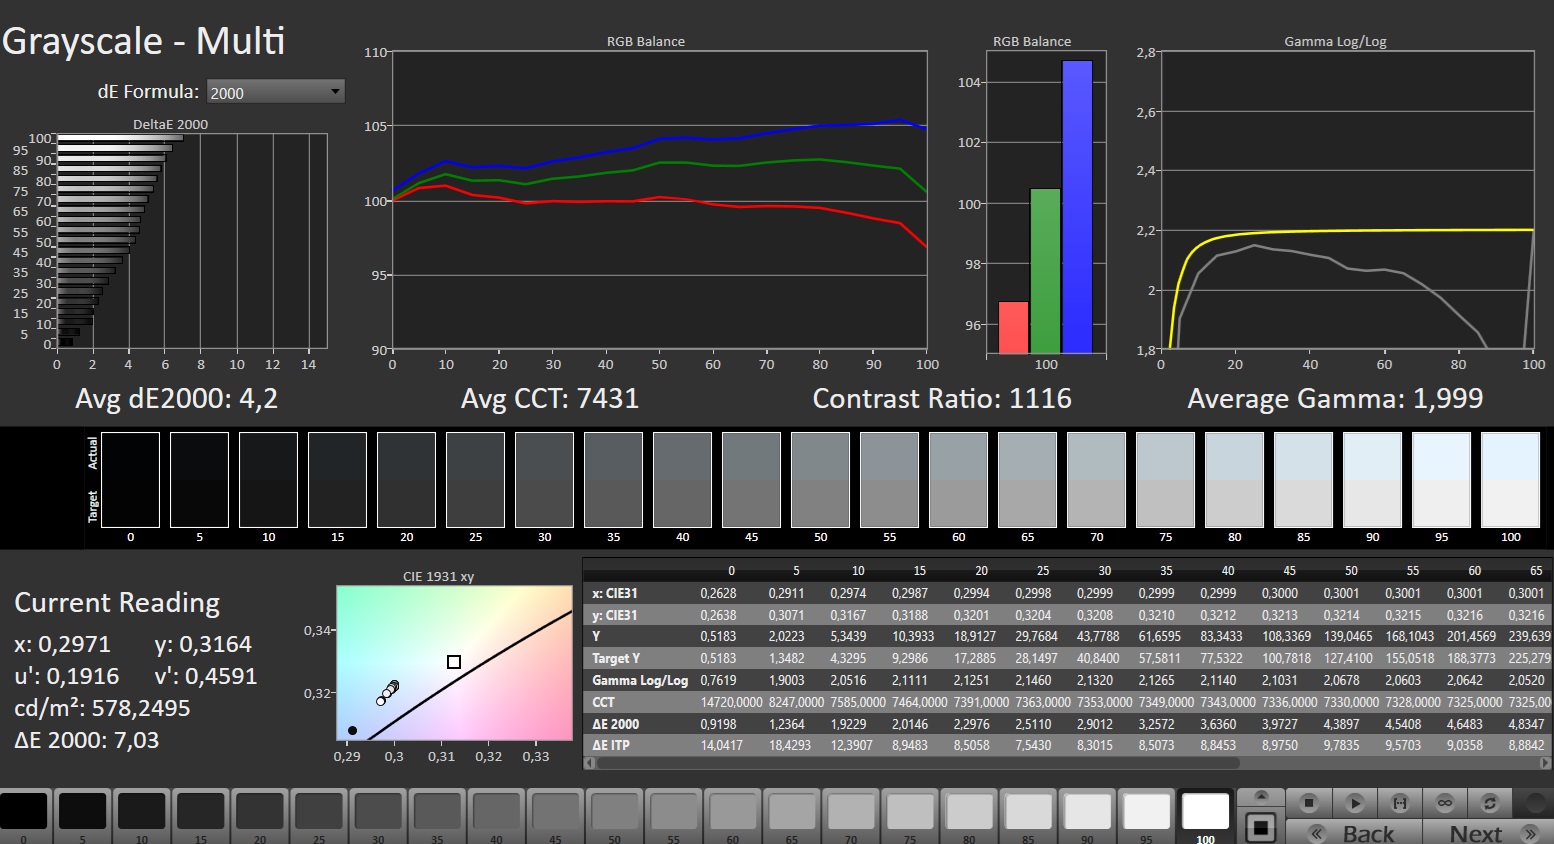
Wygląda na to, że przyjazne dla pracy proporcje 16:10 ugruntowały swoją pozycję, ponieważ większość laptopów w polu porównawczym ma ekrany o takich proporcjach - w tym Titan. Nubia wyposażyła swojego laptopa w matowy, stabilny pod kątem widzenia wyświetlacz IPS (2560 x 1600 pikseli) o przekątnej 16 cali. Panel jest bardzo jasny, a jego kontrast spełnia docelową wartość. Czytanie z ekranu na zewnątrz jest całkowicie możliwe. Pozytywne jest to, że panel 240 Hz nie wykazuje oznak migotania PWM i obsługuje G-Sync. Alternatywne wyświetlacze nie są dostępne.

| |||||||||||||||||||||||||
rozświetlenie: 86 %
na akumulatorze: 543 cd/m²
kontrast: 1065:1 (czerń: 0.51 cd/m²)
ΔE Color 3.19 | 0.5-29.43 Ø4.87, calibrated: 0.69
ΔE Greyscale 4.2 | 0.5-98 Ø5.1
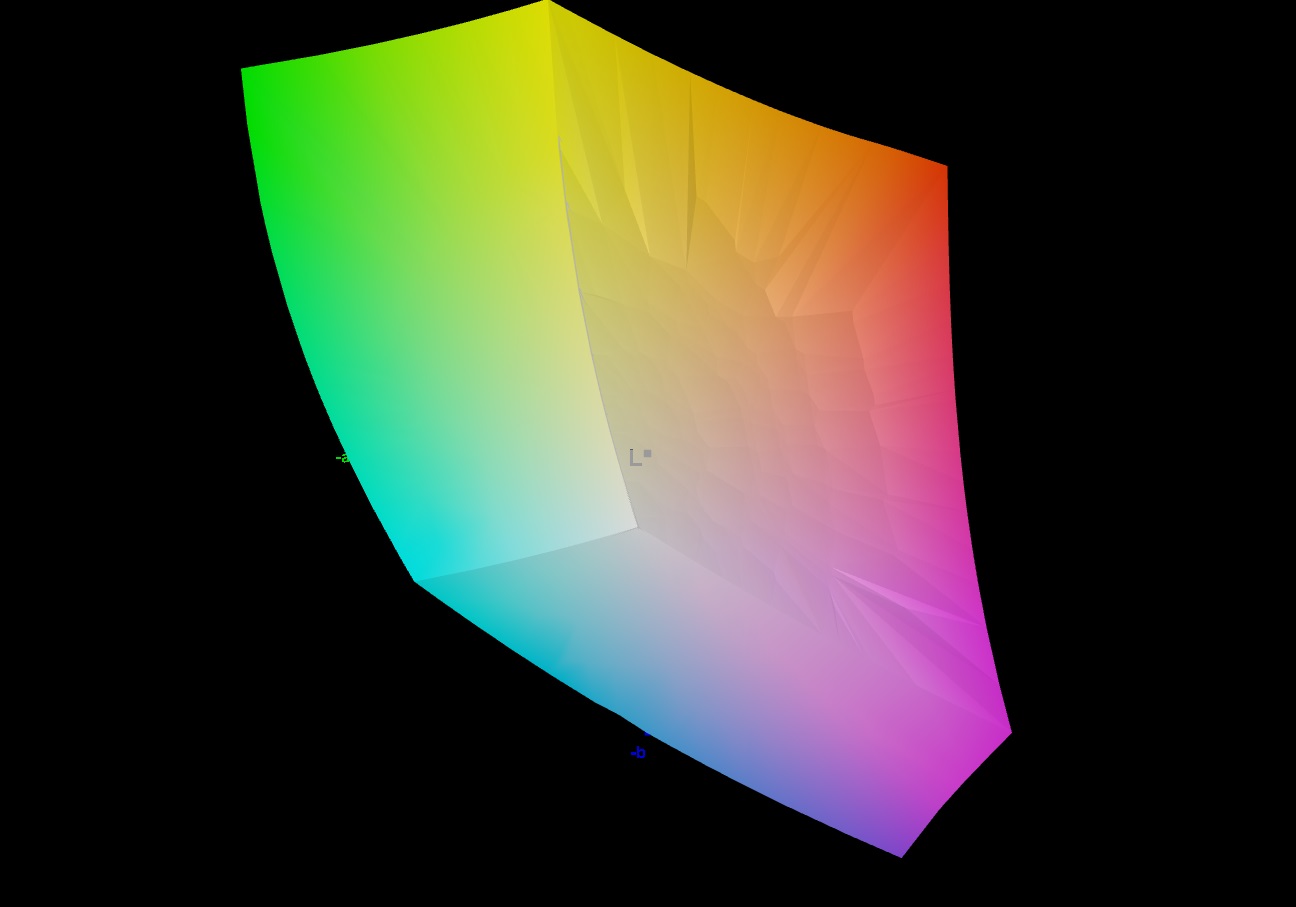
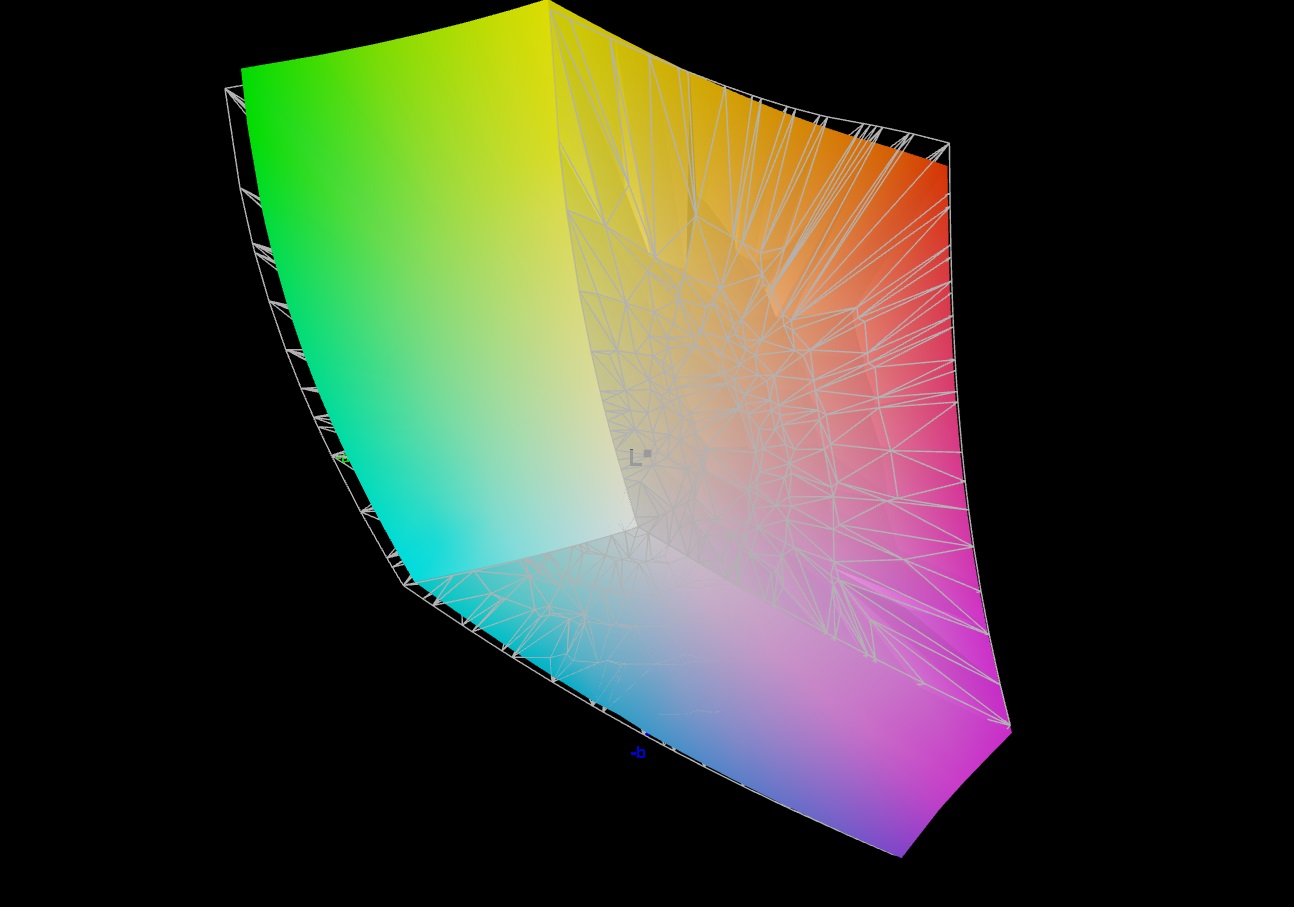
84.1% AdobeRGB 1998 (Argyll 2.2.0 3D)
100% sRGB (Argyll 2.2.0 3D)
96.3% Display P3 (Argyll 2.2.0 3D)
Gamma: 1.999
| Nubia RedMagic Titan 16 Pro BOE CQ NE160QDM-NZ2, IPS, 2560x1600, 16", 240 Hz | Lenovo Legion Pro 5 16IRX9 G9 BOE NE160QDM-NZB, IPS, 2560x1600, 16", 240 Hz | HP Victus 16 (2024) Chi Mei CMN163E, IPS, 1920x1080, 16.1", 144 Hz | Acer Predator Helios Neo 16 (2024) Chi Mei N160GME-GTB, LED, 2560x1600, 16", 240 Hz | SCHENKER XMG Pro 16 Studio (Mid 24) BOE CQ NE160QDM-NZ1, IPS, 2560x1600, 16", 240 Hz | Gigabyte G6X 9KG (2024) BOE NE160WUM-NX6, IPS, 1920x1200, 16", 165 Hz | |
|---|---|---|---|---|---|---|
| Display | 2% | -48% | 1% | -15% | -48% | |
| Display P3 Coverage | 96.3 | 99.22 3% | 41.3 -57% | 95.9 0% | 68.8 -29% | 41.8 -57% |
| sRGB Coverage | 100 | 99.93 0% | 61.7 -38% | 99.8 0% | 99.5 0% | 62.4 -38% |
| AdobeRGB 1998 Coverage | 84.1 | 87.81 4% | 42.7 -49% | 86.4 3% | 70.8 -16% | 43.3 -49% |
| Response Times | -54% | -454% | -52% | -126% | -635% | |
| Response Time Grey 50% / Grey 80% * | 3.9 ? | 4.8 ? -23% | 28.6 ? -633% | 5 ? -28% | 12.7 ? -226% | 40.5 ? -938% |
| Response Time Black / White * | 5 ? | 9.2 ? -84% | 18.7 ? -274% | 8.8 ? -76% | 6.3 ? -26% | 21.6 ? -332% |
| PWM Frequency | ||||||
| Screen | 4% | -74% | 18% | -2% | -68% | |
| Brightness middle | 543 | 518 -5% | 287 -47% | 521 -4% | 416 -23% | 353 -35% |
| Brightness | 516 | 491 -5% | 288 -44% | 506 -2% | 392 -24% | 318 -38% |
| Brightness Distribution | 86 | 90 5% | 86 0% | 85 -1% | 86 0% | 81 -6% |
| Black Level * | 0.51 | 0.36 29% | 0.19 63% | 0.44 14% | 0.38 25% | 0.21 59% |
| Contrast | 1065 | 1439 35% | 1511 42% | 1184 11% | 1095 3% | 1681 58% |
| Colorchecker dE 2000 * | 3.19 | 4.32 -35% | 5.46 -71% | 1.74 45% | 2.33 27% | 5.21 -63% |
| Colorchecker dE 2000 max. * | 7.09 | 6.37 10% | 20.36 -187% | 3.88 45% | 6.07 14% | 19.95 -181% |
| Colorchecker dE 2000 calibrated * | 0.69 | 0.75 -9% | 3.52 -410% | 0.52 25% | 1.02 -48% | 3.61 -423% |
| Greyscale dE 2000 * | 4.2 | 3.66 13% | 4.8 -14% | 3 29% | 3.7 12% | 3.6 14% |
| Gamma | 1.999 110% | 2.19 100% | 2.108 104% | 2.164 102% | 2.161 102% | 2.367 93% |
| CCT | 7431 87% | 6841 95% | 6442 101% | 6816 95% | 7102 92% | 7138 91% |
| Całkowita średnia (program / ustawienia) | -16% /
-4% | -192% /
-123% | -11% /
4% | -48% /
-22% | -250% /
-145% |
* ... im mniej tym lepiej
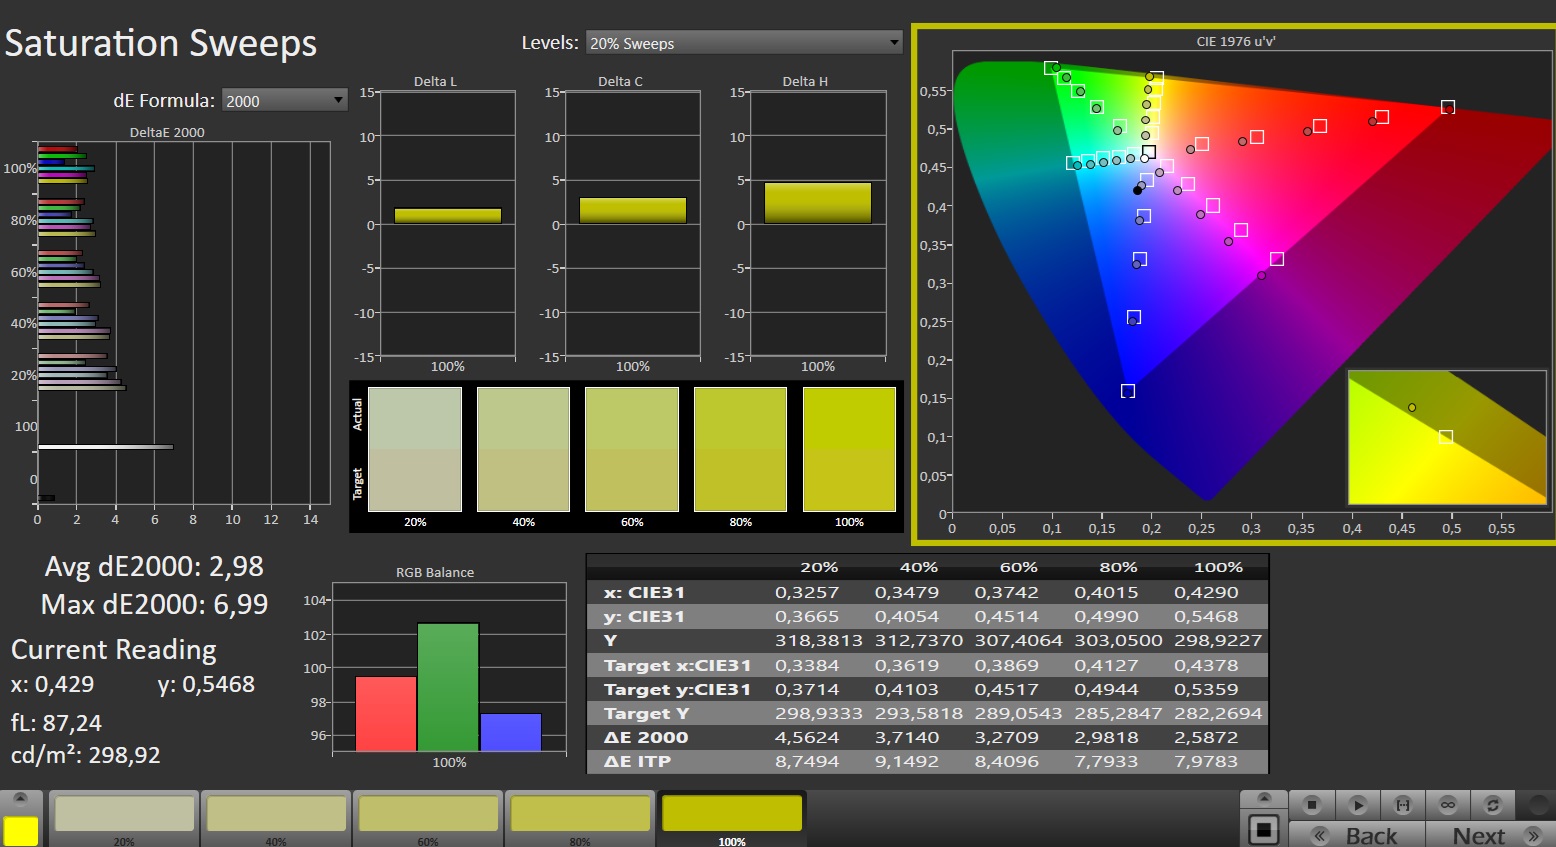
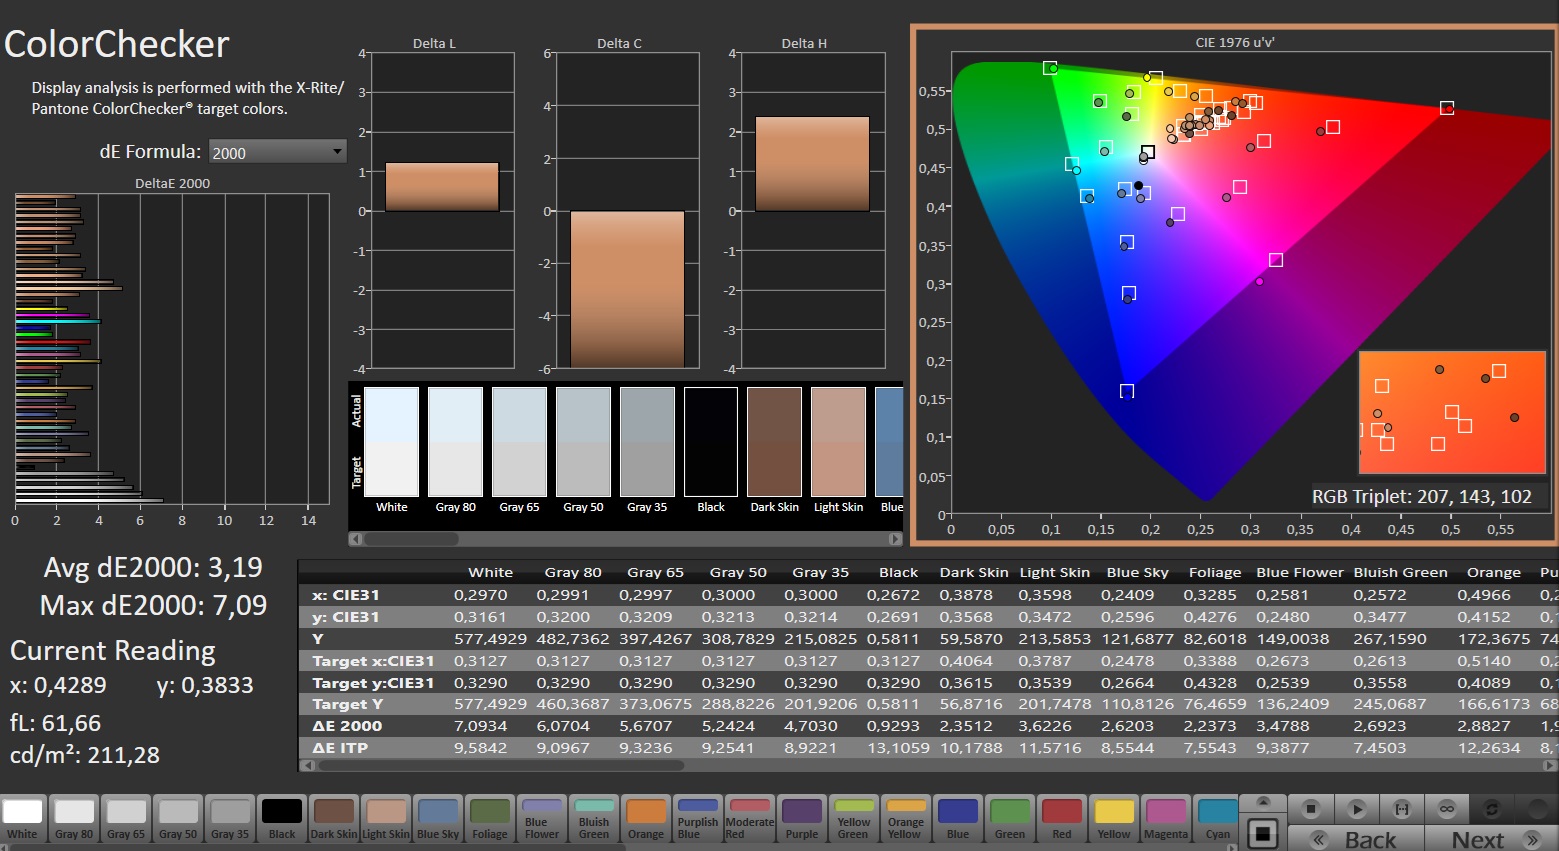
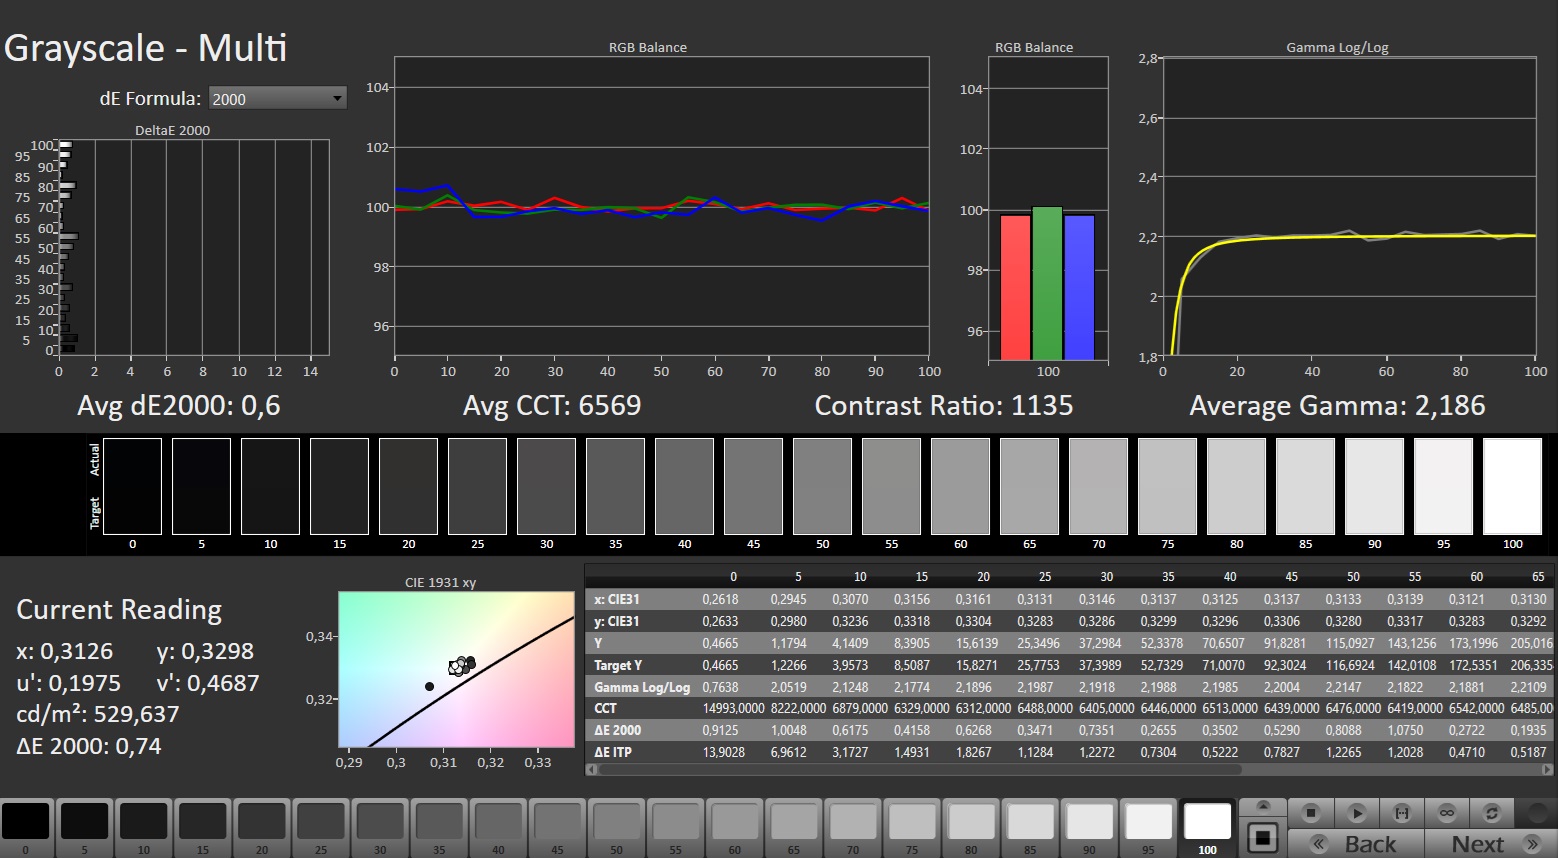
Panel pokrywa całkowicie lub prawie całkowicie przestrzenie kolorów sRGB i DCI-P3, ale nie przestrzeń AdobeRGB - jest to podobne do ekranów większości konkurentów. Jego przyzwoite odwzorowanie kolorów zaraz po wyjęciu z pudełka można zwiększyć do bardzo dobrego zakresu, wykonując kalibrację: Wówczas odchylenie kolorów spada z 3,19 do 0,69 (cel: DeltaE < 3). Jednocześnie odwzorowanie skali szarości wygląda na znacznie bardziej zrównoważone.
Nasz profil kolorów można pobrać i używać bezpłatnie. Link znajdą Państwo w polu informacyjnym wyświetlacza.

Wyświetl czasy reakcji
| ↔ Czas reakcji od czerni do bieli | ||
|---|---|---|
| 5 ms ... wzrost ↗ i spadek ↘ łącznie | ↗ 1.2 ms wzrost | 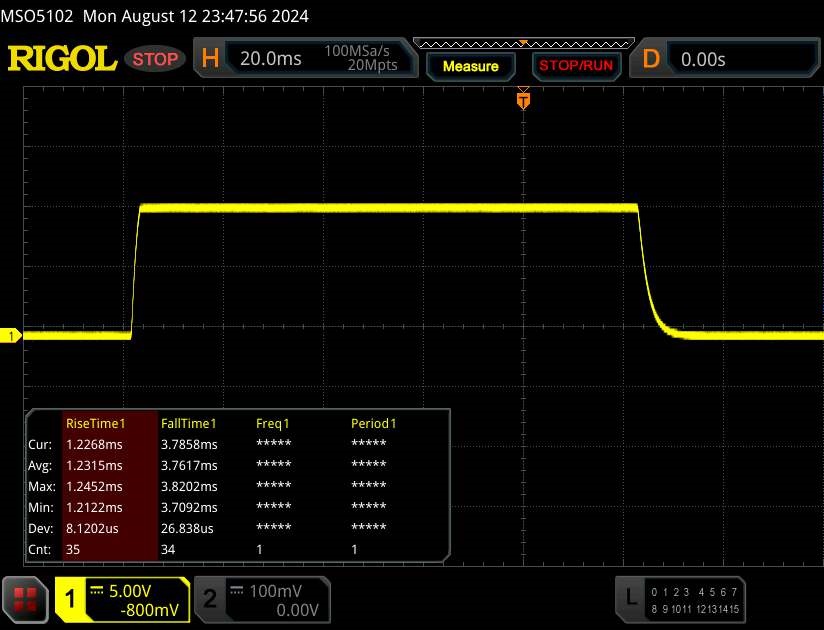 |
| ↘ 3.8 ms upadek | ||
| W naszych testach ekran wykazuje bardzo szybką reakcję i powinien bardzo dobrze nadawać się do szybkich gier. Dla porównania, wszystkie testowane urządzenia wahają się od 0.1 (minimum) do 240 (maksimum) ms. » 15 % wszystkich urządzeń jest lepszych. Oznacza to, że zmierzony czas reakcji jest lepszy od średniej wszystkich testowanych urządzeń (20.8 ms). | ||
| ↔ Czas reakcji 50% szarości do 80% szarości | ||
| 3.9 ms ... wzrost ↗ i spadek ↘ łącznie | ↗ 1.7 ms wzrost | 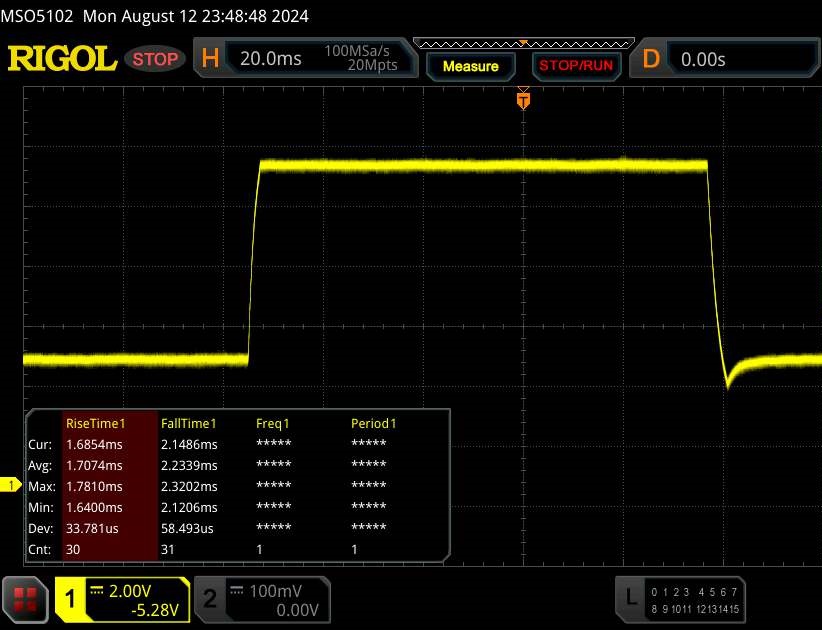 |
| ↘ 2.2 ms upadek | ||
| W naszych testach ekran wykazuje bardzo szybką reakcję i powinien bardzo dobrze nadawać się do szybkich gier. Dla porównania, wszystkie testowane urządzenia wahają się od 0.165 (minimum) do 636 (maksimum) ms. » 12 % wszystkich urządzeń jest lepszych. Oznacza to, że zmierzony czas reakcji jest lepszy od średniej wszystkich testowanych urządzeń (32.5 ms). | ||
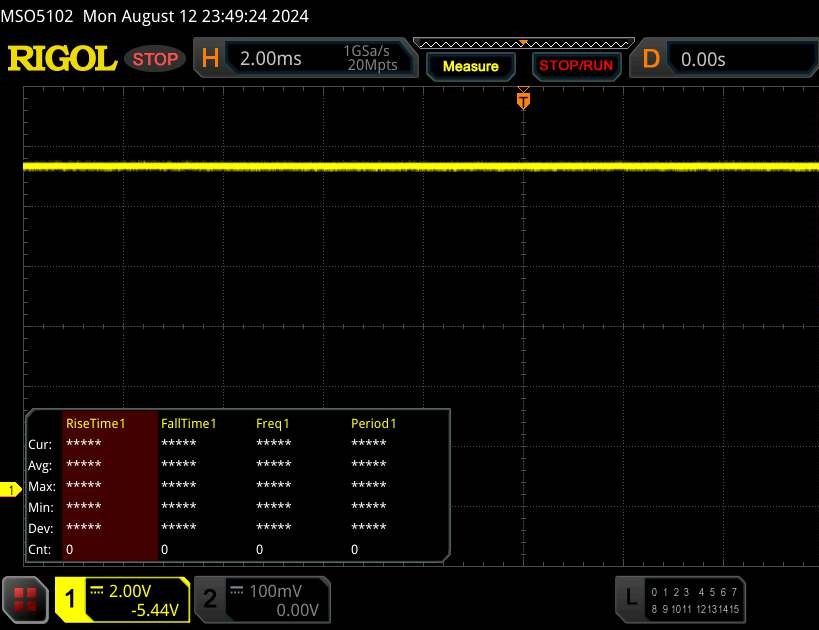
Migotanie ekranu / PWM (modulacja szerokości impulsu)
| Migotanie ekranu/nie wykryto PWM | 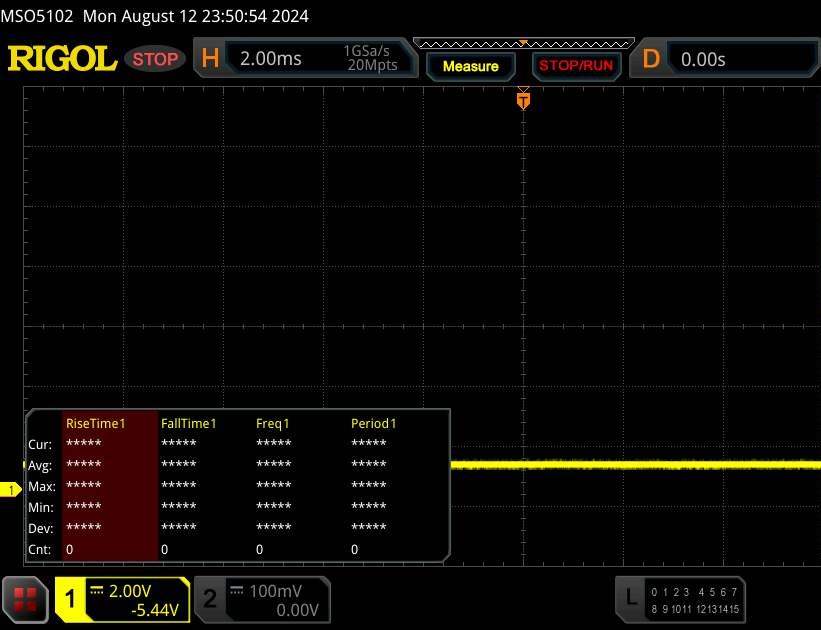 | ||
Dla porównania: 53 % wszystkich testowanych urządzeń nie używa PWM do przyciemniania wyświetlacza. Jeśli wykryto PWM, zmierzono średnio 8516 (minimum: 5 - maksimum: 343500) Hz. | |||
Wydajność - Raptor Lake i Ada Lovelace zasilają laptopa
Titan 16 Pro jest skierowany do graczy i twórców, przy czym prawdopodobnie koncentruje się na tych pierwszych. A Core i9-14900HX i kartę GeForce RTX 4060 napędzają ten laptop. Jego MRSP wynosi 1 699 USD. Nubia oferuje dodatkowe warianty tego urządzenia, ale nie można ich jeszcze znaleźć na całym świecie.
Warunki testowania
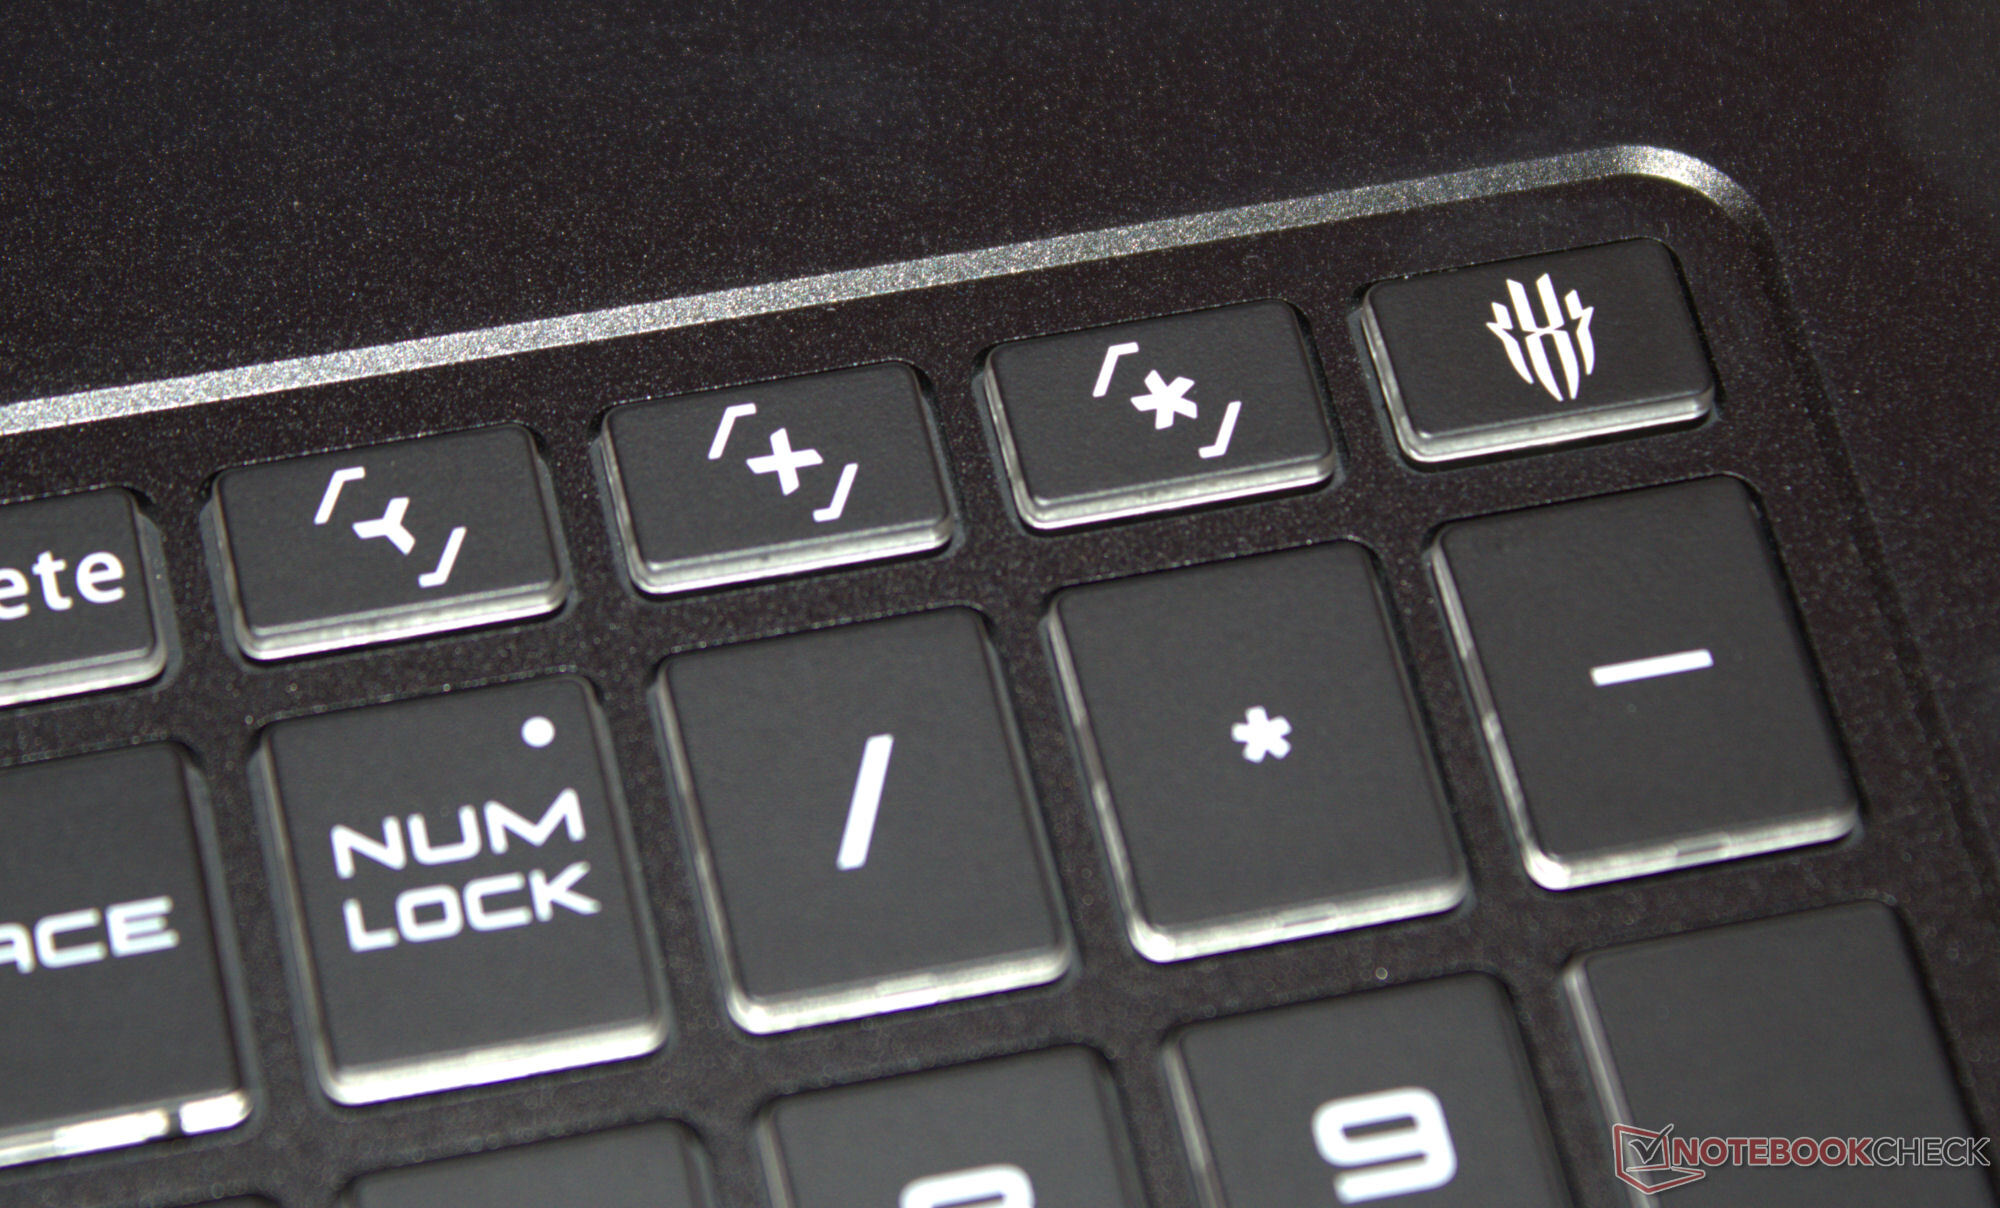
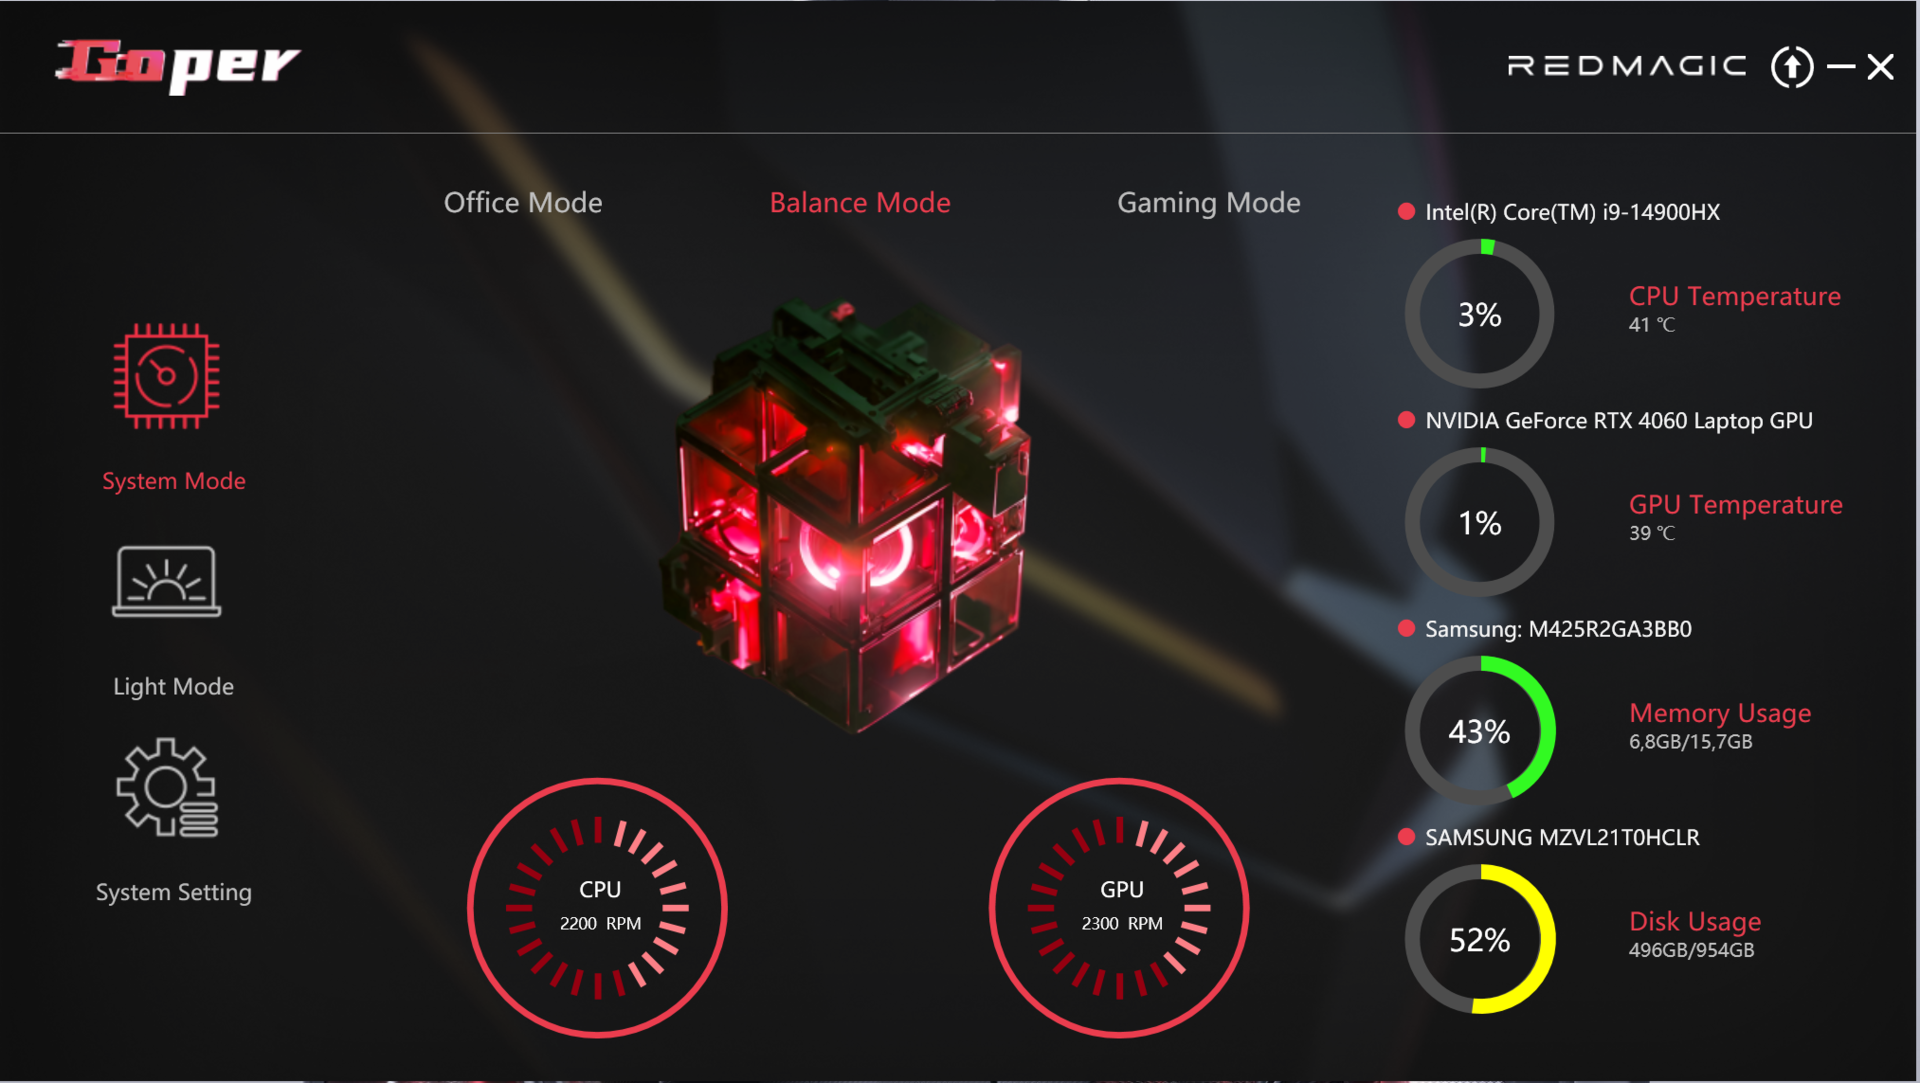
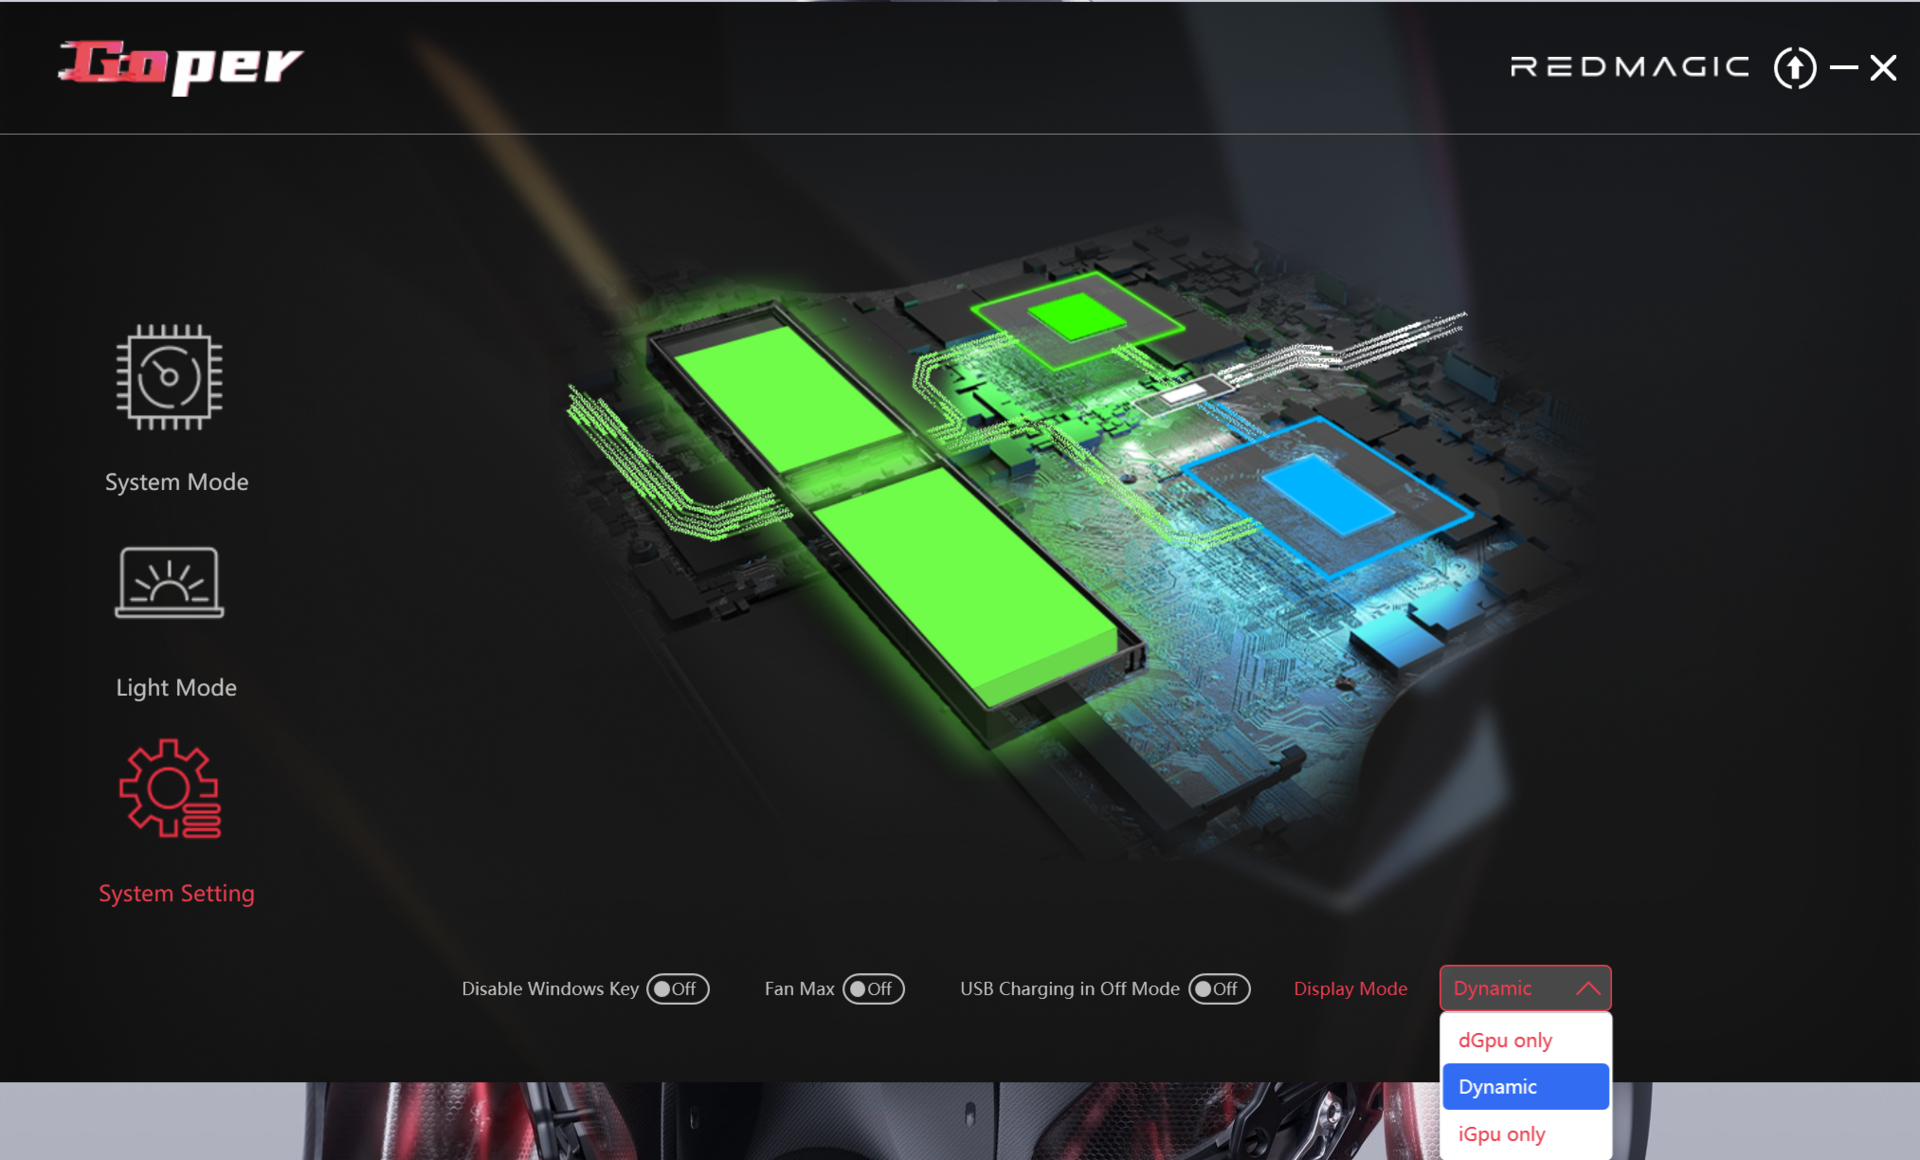
Do wyboru są trzy profile wydajności specyficzne dla producenta (patrz tabela). Podczas naszych testów korzystaliśmy z trybu zrównoważonego (benchmarki) i trybu biurowego (testy baterii). Tryb GPU był ustawiony na dynamiczny (= Optimus). Każdy profil można wywołać bezpośrednio za pomocą osobnego przycisku w górnym rzędzie klawiatury numerycznej. Alternatywnie, można je zmieniać za pośrednictwem aplikacji Goper (centrum sterowania laptopa).

| Tryb zrównoważony | Tryb gamingowy | Tryb biurowy | |
|---|---|---|---|
| Limit mocy 1 (HWInfo) | 45 watów | 100 watów | 35 watów |
| Limit mocy 2 (HWInfo) | 140 watów | 140 watów | 140 watów |
| Hałas (Cyberpunk 2077) | 50 dB(A) | 53 dB(A) | 47 dB(A) |
| Wydajność (Cyberpunk 2077) | 66 fps | 66 fps | 60 fps |
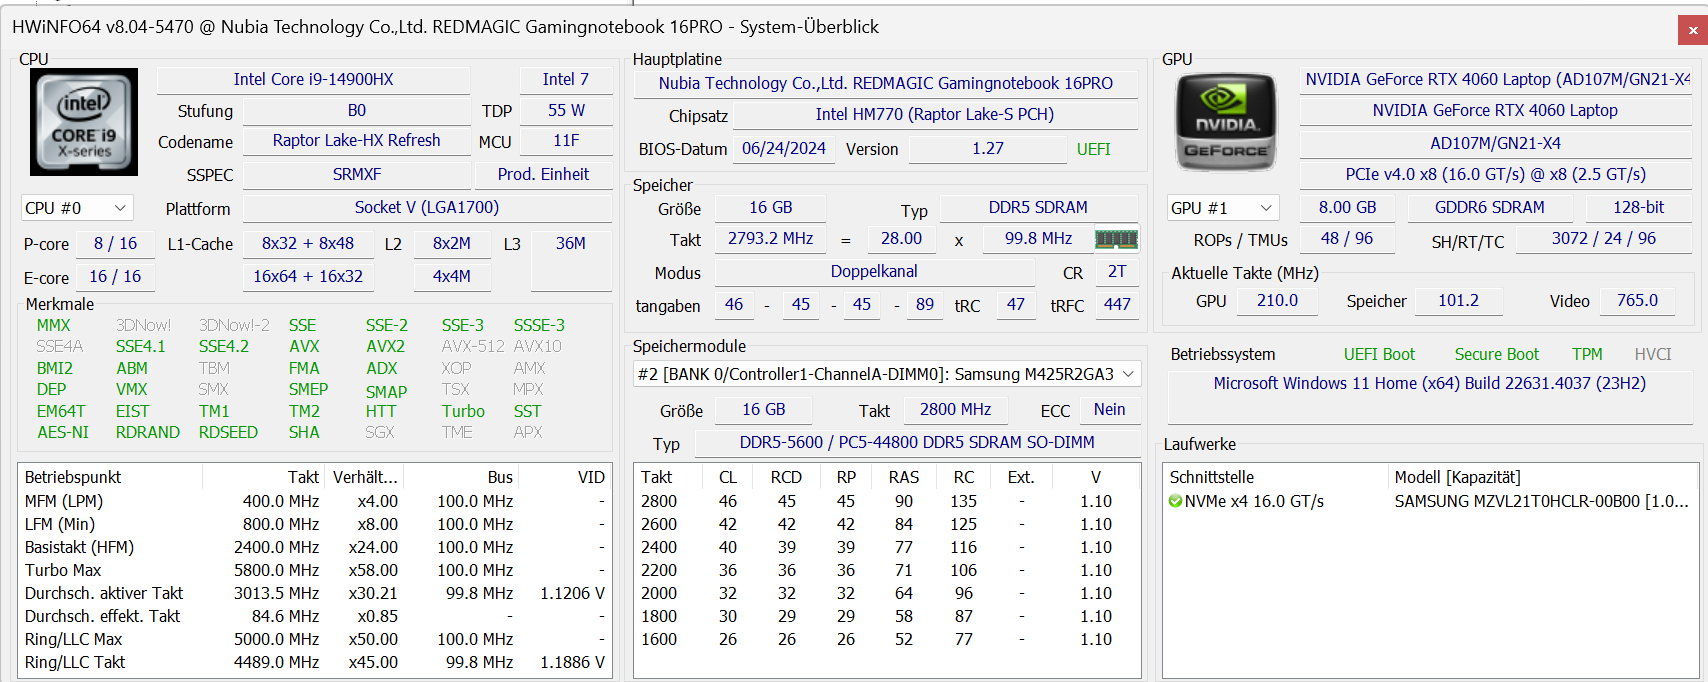
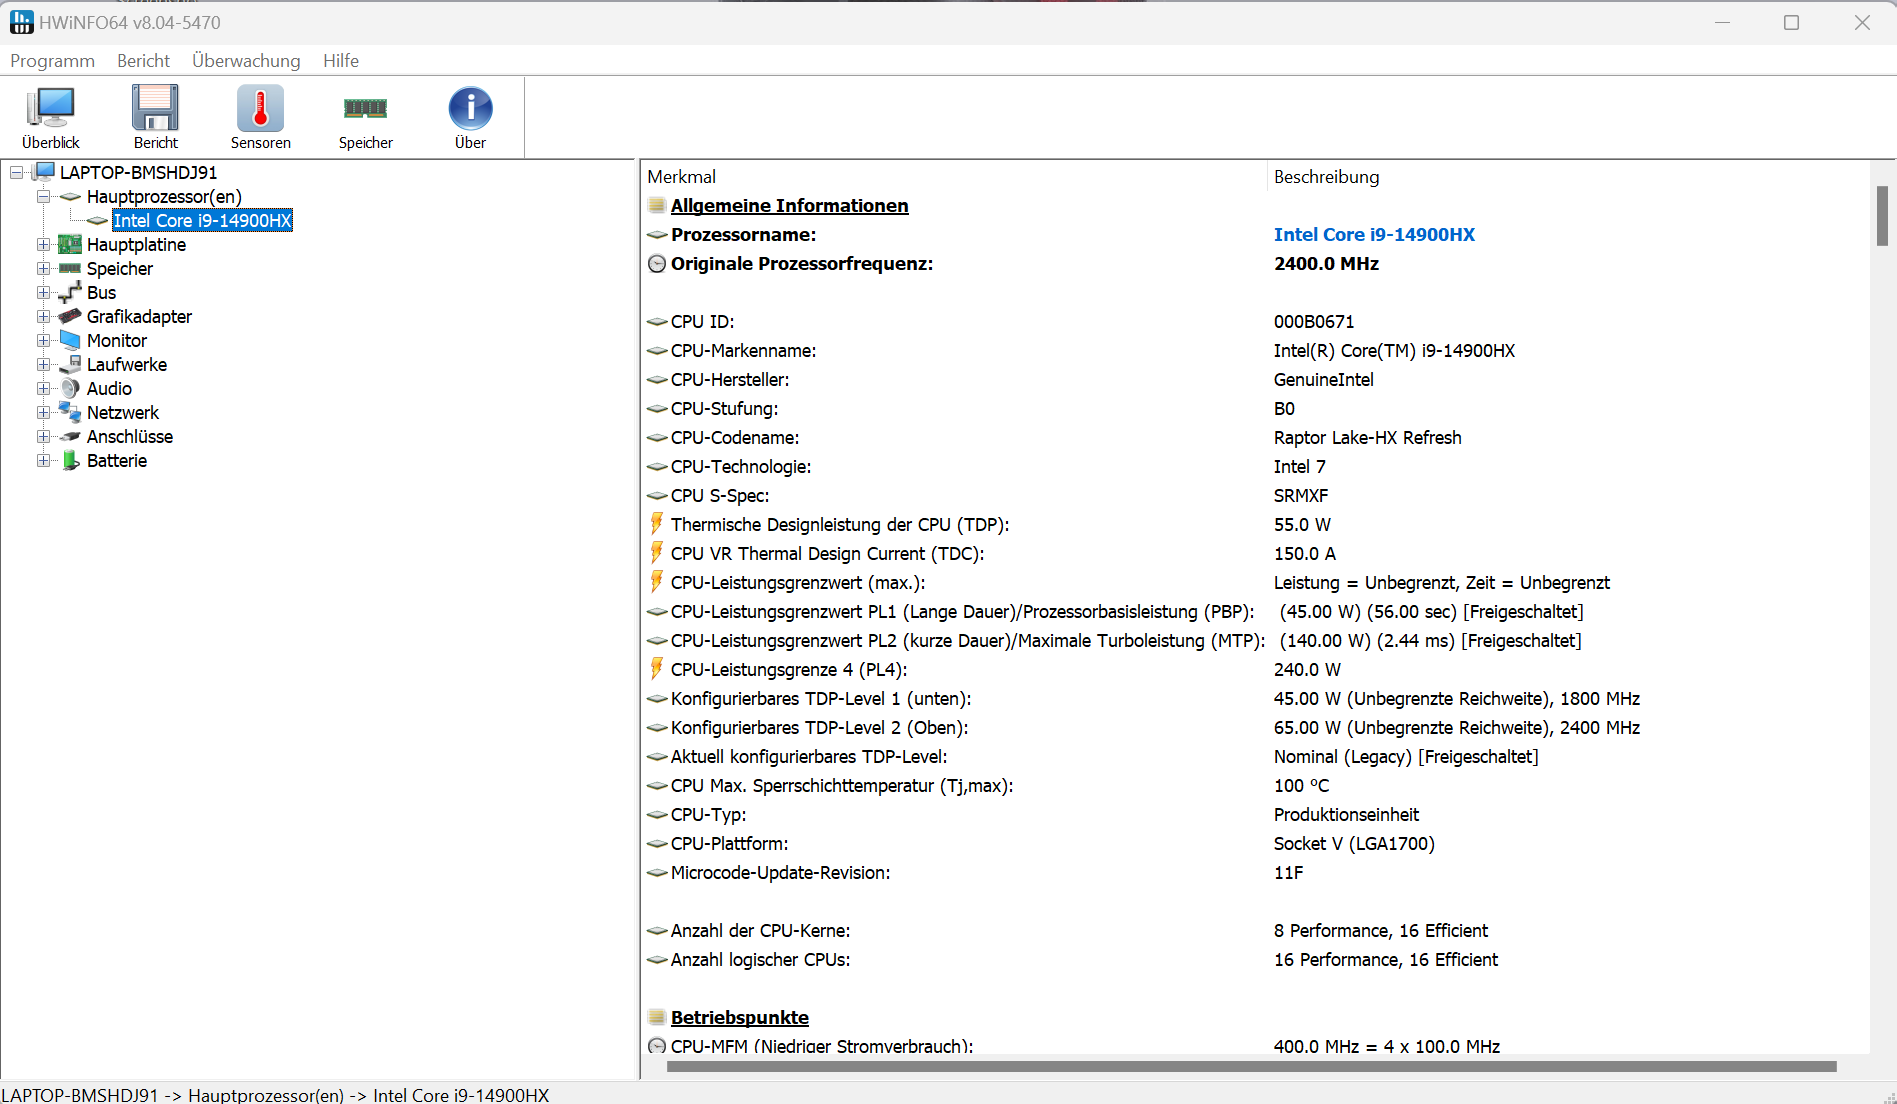
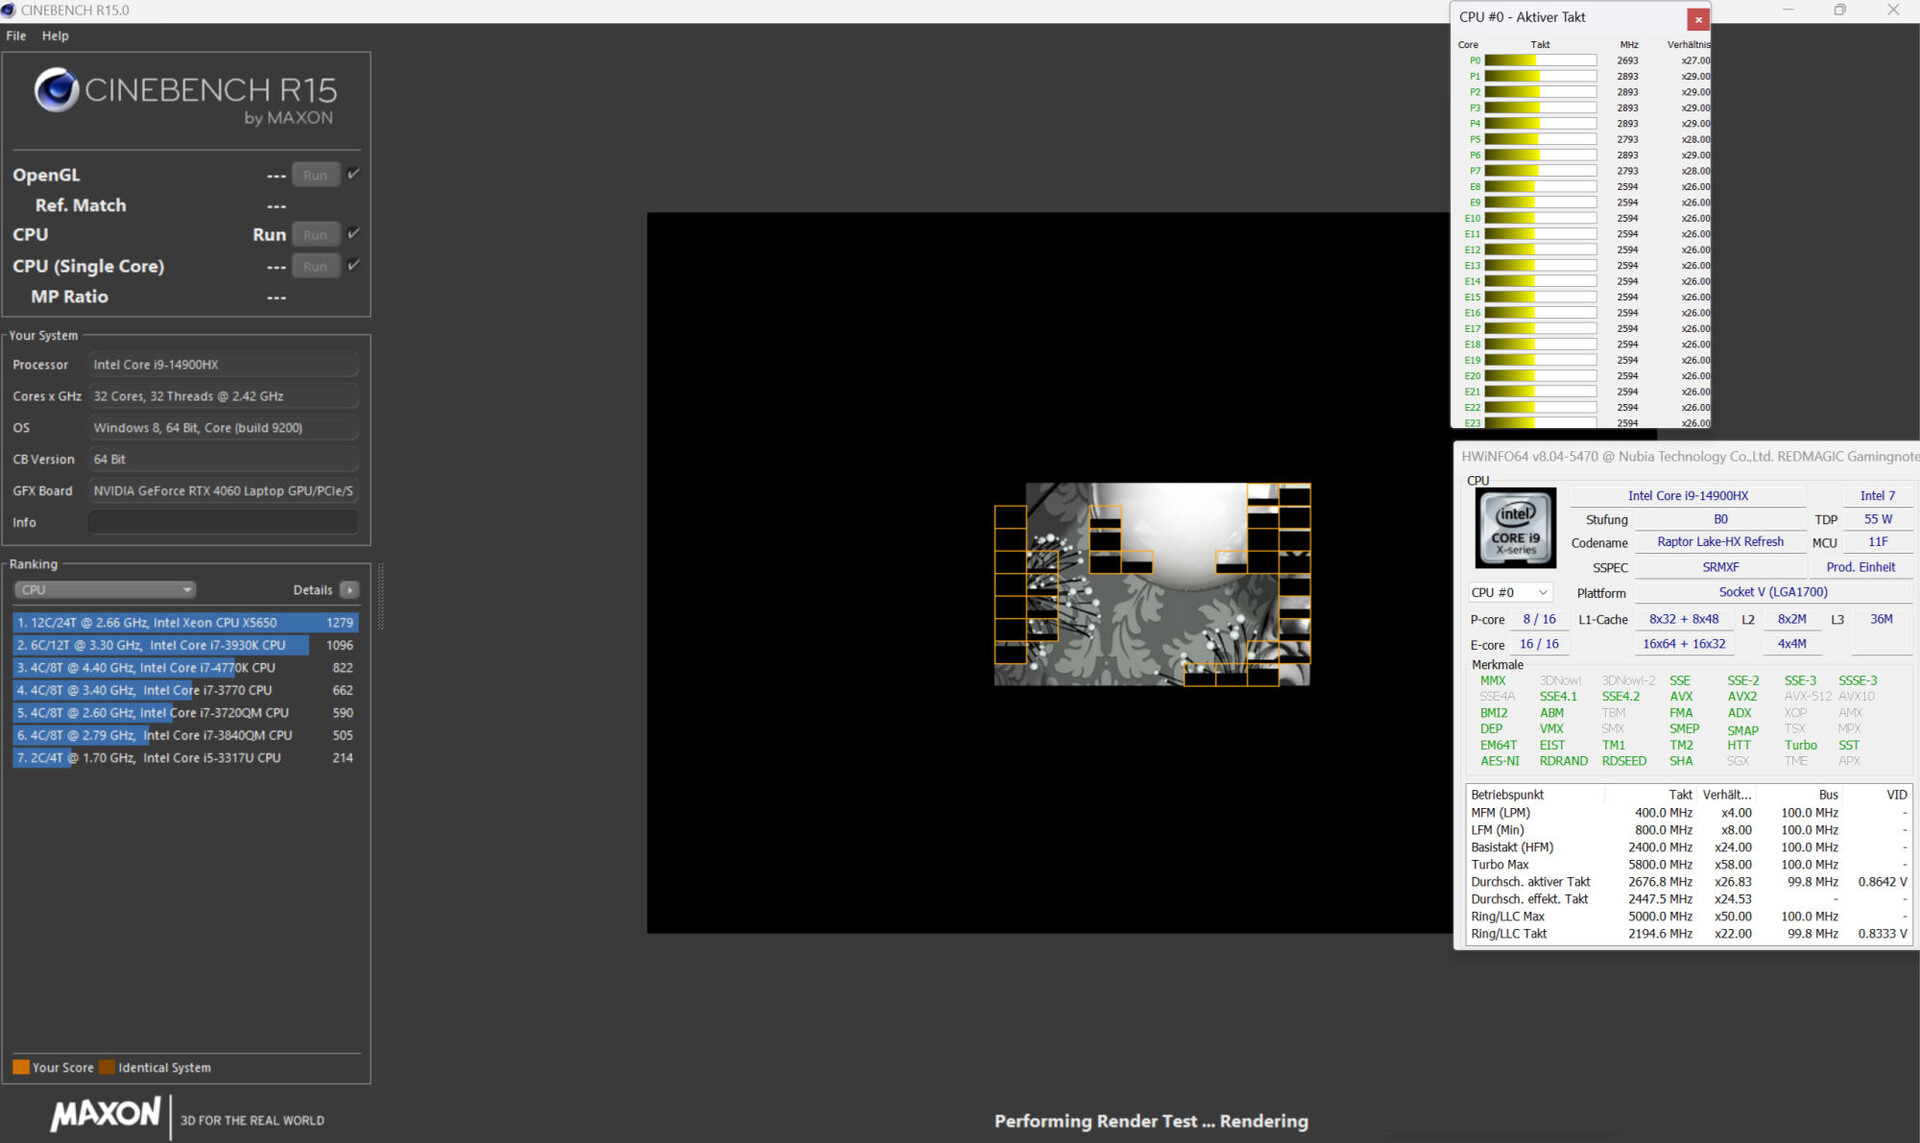
Procesor
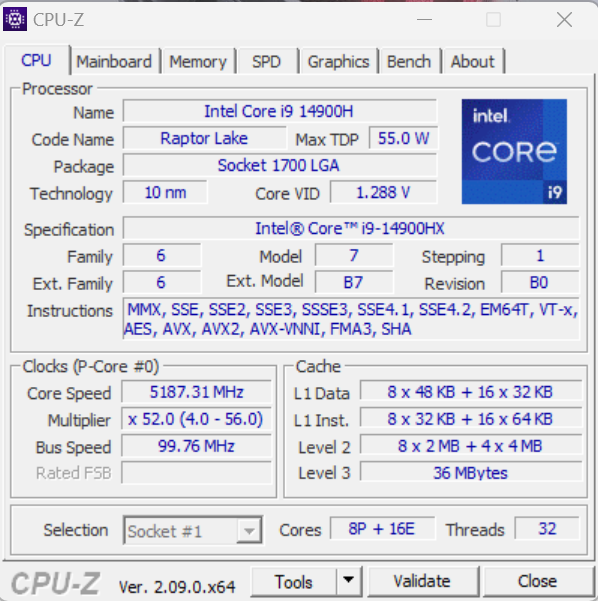
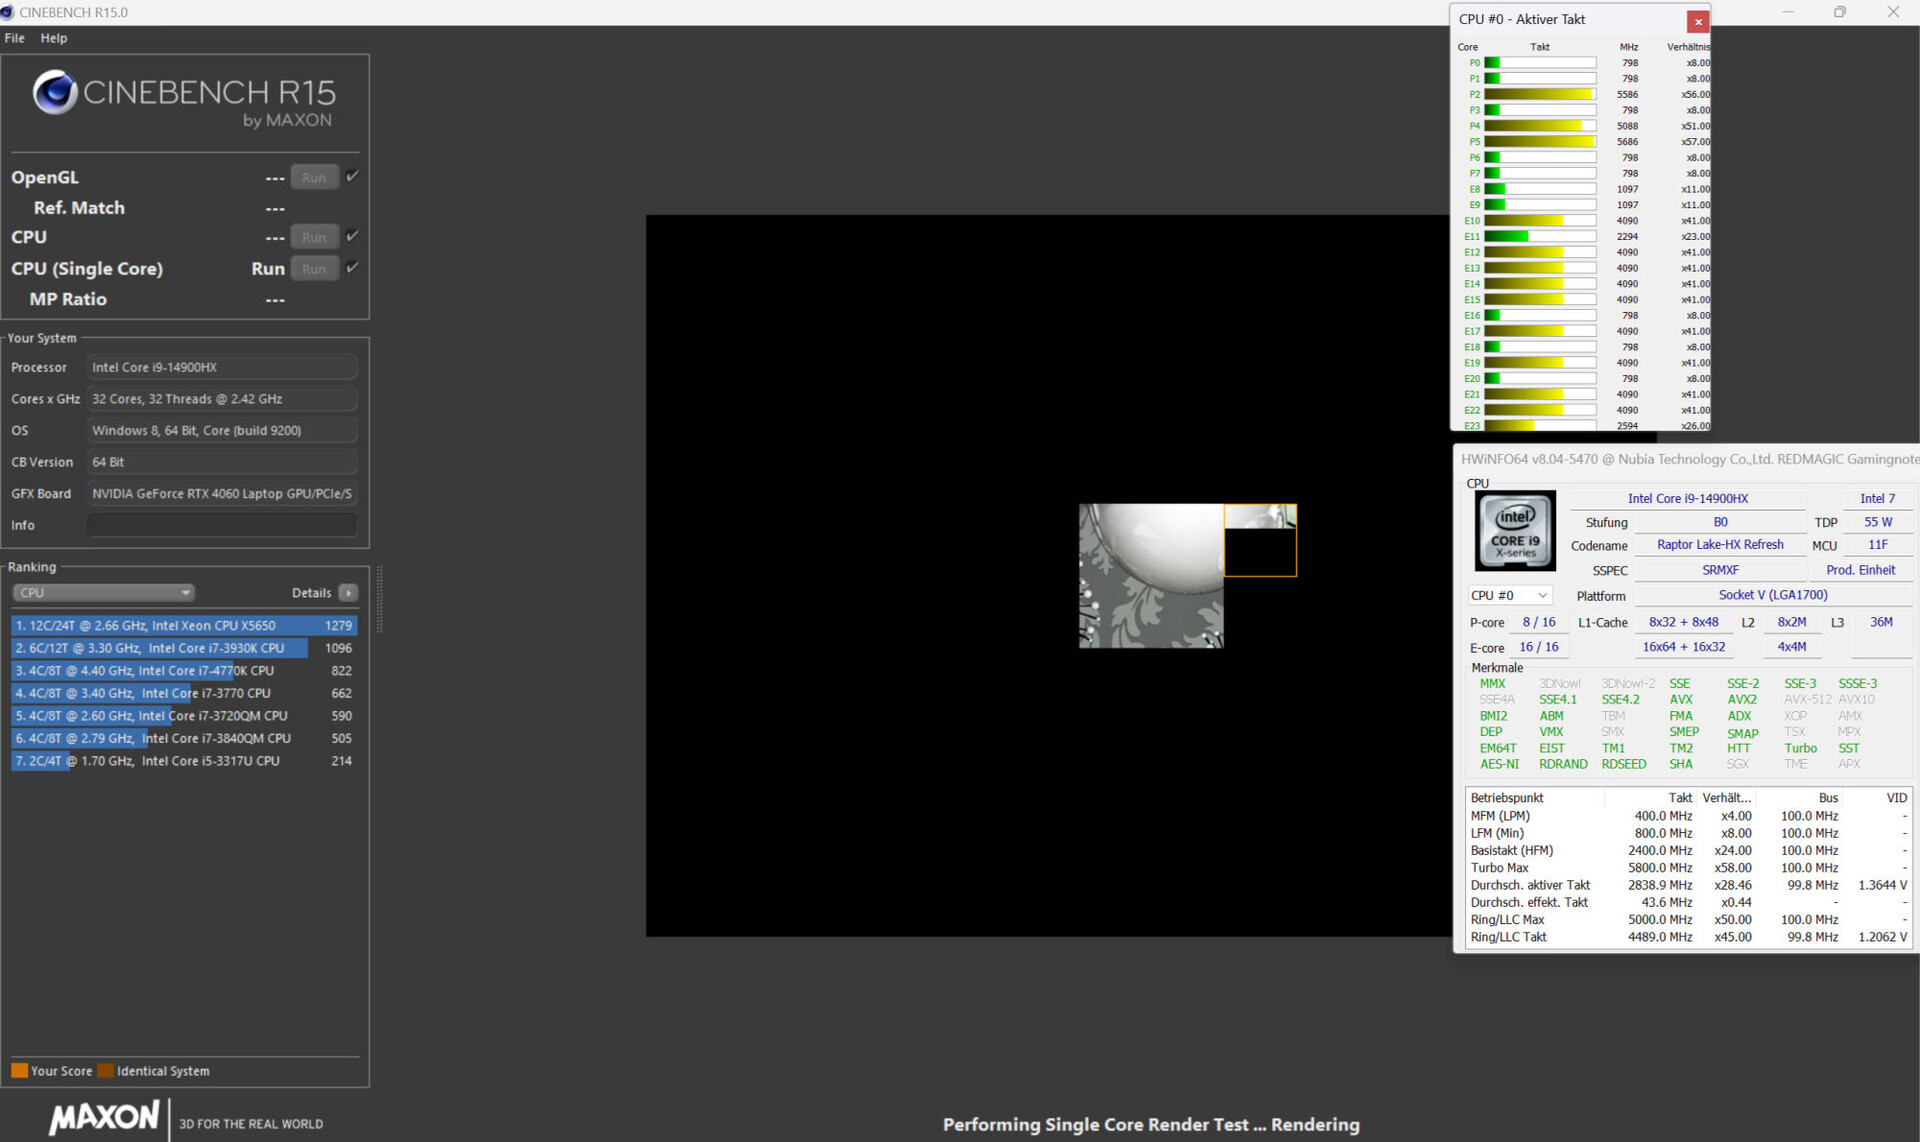
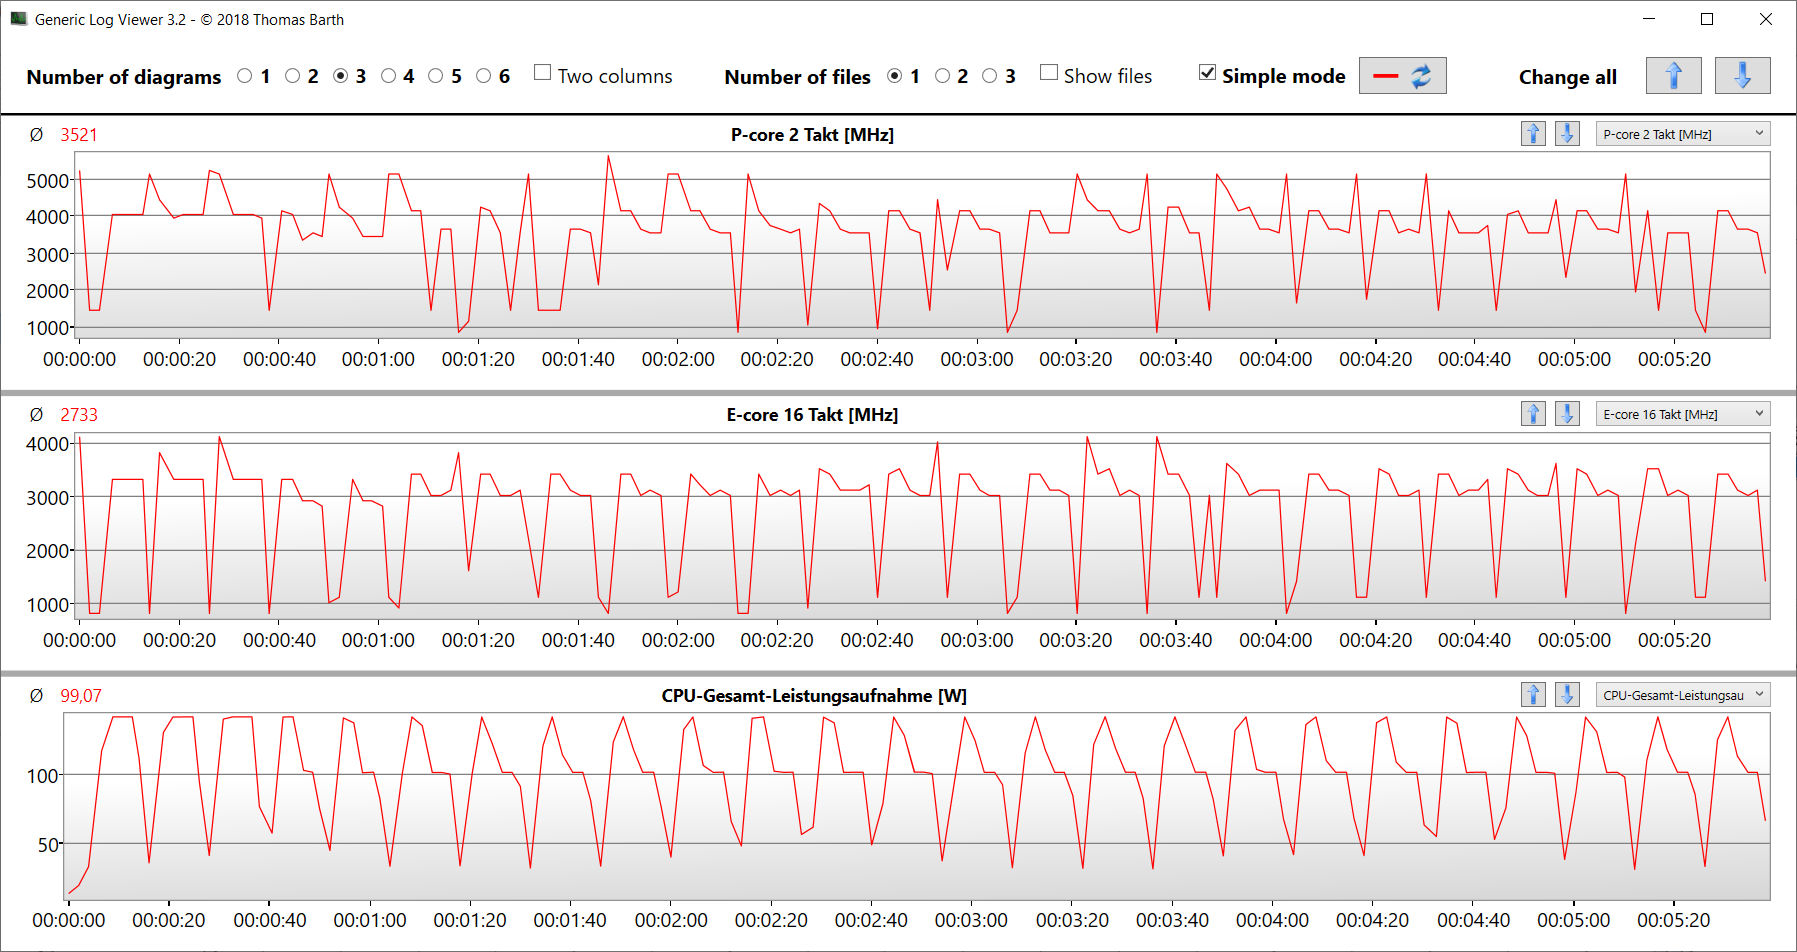
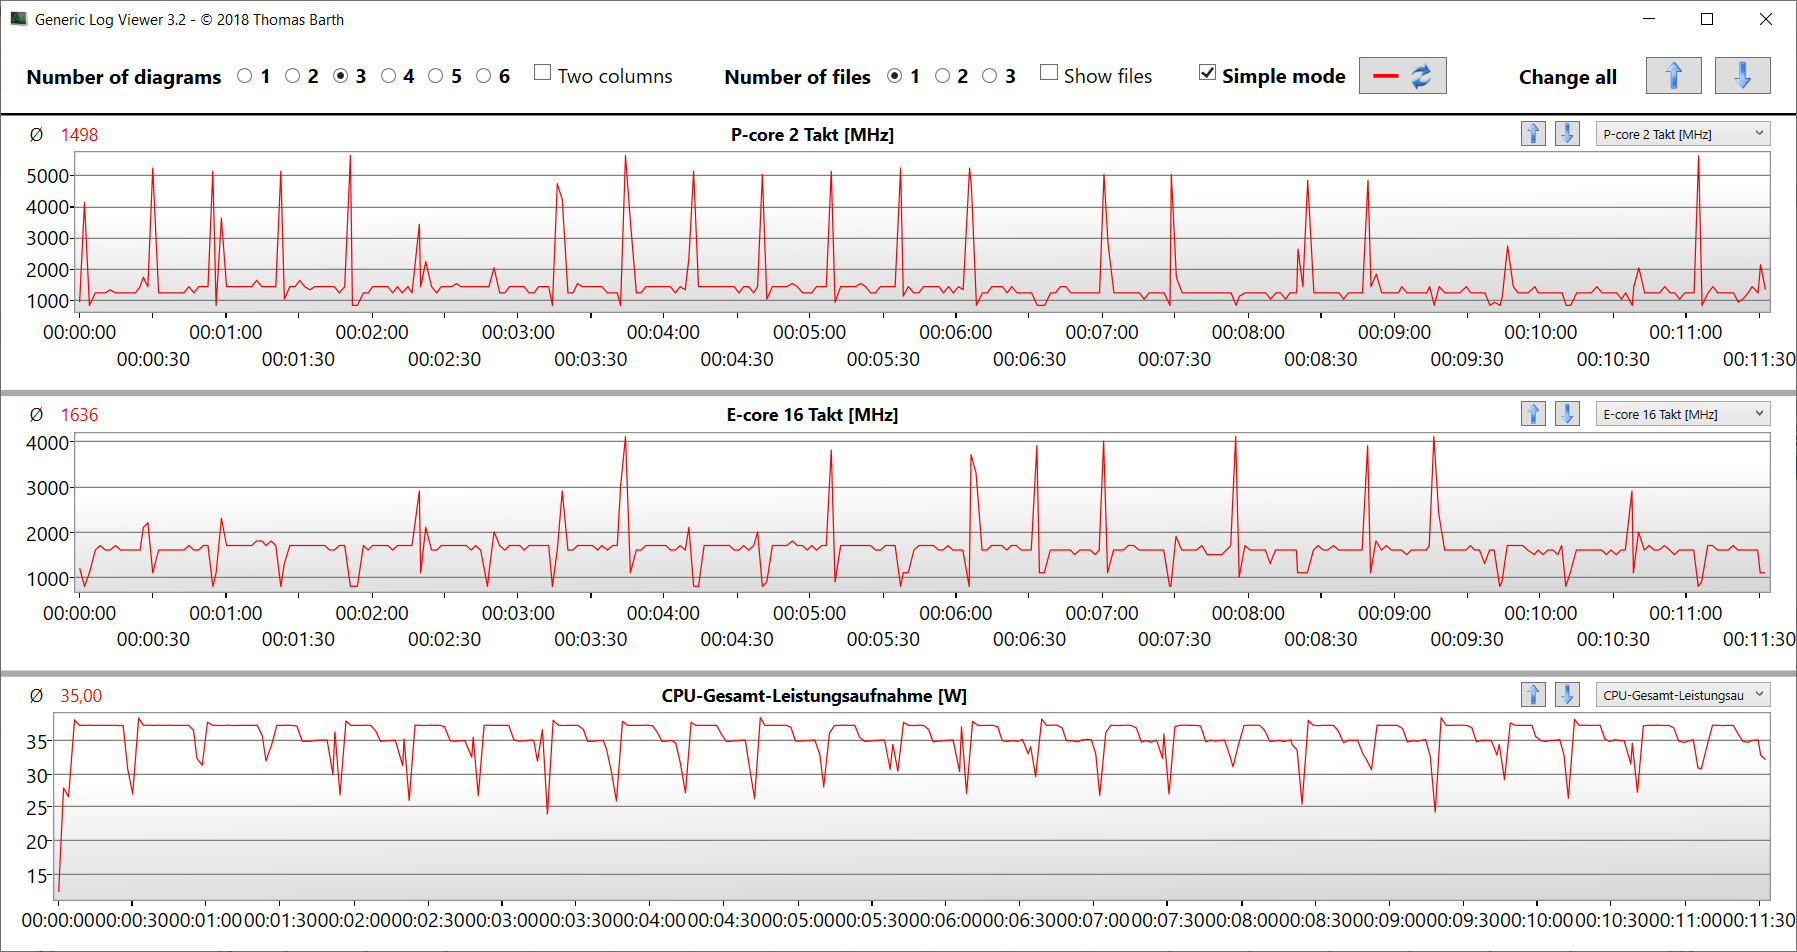
Titan ma dostępną tylko jedną opcję procesora, a mianowicie Core i9-14900HX (Raptor Lake). Jego 24 rdzenie CPU (8P + 16E = 32 wątki) osiągają maksymalne taktowanie na poziomie 5,8 GHz (P) i 4,1 GHz (E). Ciągłe obciążenie wielowątkowe (pętla CB15) spowodowało znaczny spadek taktowania CPU od pierwszego do trzeciego uruchomienia. Później utrzymywał się w miarę stały poziom. Profil trybu gamingowego zapewnia znacznie wyższy poziom wydajności.
Trzy tryby zasilania zapewniają bardzo podobną wydajność jednowątkową na mniej więcej tym samym poziomie co średnia CPU. Jego wydajność wielowątkowa różni się w znacznie większym stopniu: Tylko tryb gamingowy zaowocował wartościami na poziomie średniej CPU podczas naszego testu, podczas gdy pozostałe dwa tryby były znacznie niższe.
Więcej informacji na temat Core i9 znajdą Państwo w naszym artykule analitycznym.
Cinebench R15 Multi continuous test

| CPU Performance Rating - Percent | |
| Przeciętny Intel Core i9-14900HX | |
| Lenovo Legion Pro 5 16IRX9 G9 | |
| Nubia RedMagic Titan 16 Pro | |
| SCHENKER XMG Pro 16 Studio (Mid 24) | |
| Acer Predator Helios Neo 16 (2024) | |
| Nubia RedMagic Titan 16 Pro | |
| Średnia w klasie Gaming | |
| HP Victus 16 (2024) | |
| Gigabyte G6X 9KG (2024) | |
| Cinebench R20 | |
| CPU (Multi Core) | |
| Nubia RedMagic Titan 16 Pro (Gaming Mode) | |
| Przeciętny Intel Core i9-14900HX (6579 - 13832, n=37) | |
| Lenovo Legion Pro 5 16IRX9 G9 | |
| SCHENKER XMG Pro 16 Studio (Mid 24) | |
| HP Victus 16 (2024) | |
| Acer Predator Helios Neo 16 (2024) | |
| Średnia w klasie Gaming (2179 - 15517, n=151, ostatnie 2 lata) | |
| Gigabyte G6X 9KG (2024) | |
| Nubia RedMagic Titan 16 Pro | |
| CPU (Single Core) | |
| Nubia RedMagic Titan 16 Pro | |
| Przeciętny Intel Core i9-14900HX (657 - 859, n=37) | |
| Lenovo Legion Pro 5 16IRX9 G9 | |
| Nubia RedMagic Titan 16 Pro (Gaming Mode) | |
| Acer Predator Helios Neo 16 (2024) | |
| SCHENKER XMG Pro 16 Studio (Mid 24) | |
| Średnia w klasie Gaming (439 - 866, n=151, ostatnie 2 lata) | |
| Gigabyte G6X 9KG (2024) | |
| HP Victus 16 (2024) | |
| Cinebench R15 | |
| CPU Multi 64Bit | |
| Nubia RedMagic Titan 16 Pro (Gaming Mode) | |
| Przeciętny Intel Core i9-14900HX (3263 - 5589, n=38) | |
| SCHENKER XMG Pro 16 Studio (Mid 24) | |
| Lenovo Legion Pro 5 16IRX9 G9 | |
| HP Victus 16 (2024) | |
| Acer Predator Helios Neo 16 (2024) | |
| Nubia RedMagic Titan 16 Pro | |
| Średnia w klasie Gaming (905 - 6074, n=154, ostatnie 2 lata) | |
| Gigabyte G6X 9KG (2024) | |
| CPU Single 64Bit | |
| Nubia RedMagic Titan 16 Pro | |
| Nubia RedMagic Titan 16 Pro (Gaming Mode) | |
| Przeciętny Intel Core i9-14900HX (247 - 323, n=37) | |
| Lenovo Legion Pro 5 16IRX9 G9 | |
| Acer Predator Helios Neo 16 (2024) | |
| SCHENKER XMG Pro 16 Studio (Mid 24) | |
| Średnia w klasie Gaming (191.9 - 343, n=151, ostatnie 2 lata) | |
| Gigabyte G6X 9KG (2024) | |
| HP Victus 16 (2024) | |
| Blender - v2.79 BMW27 CPU | |
| Gigabyte G6X 9KG (2024) | |
| Nubia RedMagic Titan 16 Pro | |
| Średnia w klasie Gaming (81 - 555, n=144, ostatnie 2 lata) | |
| HP Victus 16 (2024) | |
| Acer Predator Helios Neo 16 (2024) | |
| SCHENKER XMG Pro 16 Studio (Mid 24) | |
| Nubia RedMagic Titan 16 Pro (Gaming Mode) | |
| Lenovo Legion Pro 5 16IRX9 G9 | |
| Przeciętny Intel Core i9-14900HX (91 - 206, n=37) | |
| Geekbench 6.4 | |
| Multi-Core | |
| Lenovo Legion Pro 5 16IRX9 G9 (6.2.1) | |
| Przeciętny Intel Core i9-14900HX (13158 - 19665, n=37) | |
| Acer Predator Helios Neo 16 (2024) (6.2.1) | |
| SCHENKER XMG Pro 16 Studio (Mid 24) (6.2.1) | |
| HP Victus 16 (2024) (6.2.1) | |
| Nubia RedMagic Titan 16 Pro (6.2.1, Gaming Mode) | |
| Średnia w klasie Gaming (5340 - 21668, n=119, ostatnie 2 lata) | |
| Gigabyte G6X 9KG (2024) (6.2.1) | |
| Nubia RedMagic Titan 16 Pro (6.2.1) | |
| Single-Core | |
| Nubia RedMagic Titan 16 Pro (6.2.1) | |
| Nubia RedMagic Titan 16 Pro (6.2.1, Gaming Mode) | |
| Acer Predator Helios Neo 16 (2024) (6.2.1) | |
| Przeciętny Intel Core i9-14900HX (2419 - 3129, n=37) | |
| Lenovo Legion Pro 5 16IRX9 G9 (6.2.1) | |
| SCHENKER XMG Pro 16 Studio (Mid 24) (6.2.1) | |
| Średnia w klasie Gaming (1490 - 3219, n=119, ostatnie 2 lata) | |
| Gigabyte G6X 9KG (2024) (6.2.1) | |
| HP Victus 16 (2024) (6.2.1) | |
| HWBOT x265 Benchmark v2.2 - 4k Preset | |
| Nubia RedMagic Titan 16 Pro (Gaming Mode) | |
| Przeciętny Intel Core i9-14900HX (16.8 - 38.9, n=37) | |
| Lenovo Legion Pro 5 16IRX9 G9 | |
| SCHENKER XMG Pro 16 Studio (Mid 24) | |
| Acer Predator Helios Neo 16 (2024) | |
| Średnia w klasie Gaming (6.72 - 42.9, n=148, ostatnie 2 lata) | |
| HP Victus 16 (2024) | |
| Gigabyte G6X 9KG (2024) | |
| Nubia RedMagic Titan 16 Pro | |
| LibreOffice - 20 Documents To PDF | |
| HP Victus 16 (2024) (6.3.4.2) | |
| Lenovo Legion Pro 5 16IRX9 G9 (6.3.4.2) | |
| Średnia w klasie Gaming (19 - 96.6, n=147, ostatnie 2 lata) | |
| SCHENKER XMG Pro 16 Studio (Mid 24) (6.3.4.2) | |
| Przeciętny Intel Core i9-14900HX (19 - 85.1, n=37) | |
| Acer Predator Helios Neo 16 (2024) (6.3.4.2) | |
| Nubia RedMagic Titan 16 Pro (6.3.4.2, Gaming Mode) | |
| Gigabyte G6X 9KG (2024) (6.3.4.2) | |
| Nubia RedMagic Titan 16 Pro (6.3.4.2) | |
| R Benchmark 2.5 - Overall mean | |
| HP Victus 16 (2024) | |
| Średnia w klasie Gaming (0.3609 - 0.759, n=150, ostatnie 2 lata) | |
| Gigabyte G6X 9KG (2024) | |
| SCHENKER XMG Pro 16 Studio (Mid 24) | |
| Lenovo Legion Pro 5 16IRX9 G9 | |
| Przeciętny Intel Core i9-14900HX (0.3604 - 0.4859, n=37) | |
| Acer Predator Helios Neo 16 (2024) | |
| Nubia RedMagic Titan 16 Pro | |
| Nubia RedMagic Titan 16 Pro (Gaming Mode) | |
* ... im mniej tym lepiej
AIDA64: FP32 Ray-Trace | FPU Julia | CPU SHA3 | CPU Queen | FPU SinJulia | FPU Mandel | CPU AES | CPU ZLib | FP64 Ray-Trace | CPU PhotoWorxx
| Performance Rating | |
| Przeciętny Intel Core i9-14900HX | |
| Nubia RedMagic Titan 16 Pro | |
| Lenovo Legion Pro 5 16IRX9 G9 | |
| SCHENKER XMG Pro 16 Studio (Mid 24) | |
| Acer Predator Helios Neo 16 (2024) | |
| Średnia w klasie Gaming | |
| HP Victus 16 (2024) | |
| Nubia RedMagic Titan 16 Pro | |
| Gigabyte G6X 9KG (2024) | |
| AIDA64 / FP32 Ray-Trace | |
| Przeciętny Intel Core i9-14900HX (13098 - 33474, n=36) | |
| Nubia RedMagic Titan 16 Pro (v6.92.6600, Gaming Mode) | |
| Lenovo Legion Pro 5 16IRX9 G9 (v6.92.6600) | |
| Średnia w klasie Gaming (4986 - 81639, n=147, ostatnie 2 lata) | |
| Acer Predator Helios Neo 16 (2024) (v6.92.6600) | |
| SCHENKER XMG Pro 16 Studio (Mid 24) (v6.92.6600) | |
| HP Victus 16 (2024) (v6.92.6600) | |
| Gigabyte G6X 9KG (2024) (v6.92.6600) | |
| Nubia RedMagic Titan 16 Pro (v6.92.6600) | |
| AIDA64 / FPU Julia | |
| Przeciętny Intel Core i9-14900HX (67573 - 166040, n=36) | |
| Nubia RedMagic Titan 16 Pro (v6.92.6600, Gaming Mode) | |
| Lenovo Legion Pro 5 16IRX9 G9 (v6.92.6600) | |
| SCHENKER XMG Pro 16 Studio (Mid 24) (v6.92.6600) | |
| Acer Predator Helios Neo 16 (2024) (v6.92.6600) | |
| Średnia w klasie Gaming (25360 - 252486, n=147, ostatnie 2 lata) | |
| HP Victus 16 (2024) (v6.92.6600) | |
| Gigabyte G6X 9KG (2024) (v6.92.6600) | |
| Nubia RedMagic Titan 16 Pro (v6.92.6600) | |
| AIDA64 / CPU SHA3 | |
| Nubia RedMagic Titan 16 Pro (v6.92.6600, Gaming Mode) | |
| Przeciętny Intel Core i9-14900HX (3589 - 7979, n=36) | |
| SCHENKER XMG Pro 16 Studio (Mid 24) (v6.92.6600) | |
| Lenovo Legion Pro 5 16IRX9 G9 (v6.92.6600) | |
| Acer Predator Helios Neo 16 (2024) (v6.92.6600) | |
| Średnia w klasie Gaming (1339 - 10389, n=147, ostatnie 2 lata) | |
| HP Victus 16 (2024) (v6.92.6600) | |
| Nubia RedMagic Titan 16 Pro (v6.92.6600) | |
| Gigabyte G6X 9KG (2024) (v6.92.6600) | |
| AIDA64 / CPU Queen | |
| Lenovo Legion Pro 5 16IRX9 G9 (v6.92.6600) | |
| Acer Predator Helios Neo 16 (2024) (v6.92.6600) | |
| Nubia RedMagic Titan 16 Pro (v6.92.6600, Gaming Mode) | |
| Przeciętny Intel Core i9-14900HX (118405 - 148966, n=36) | |
| SCHENKER XMG Pro 16 Studio (Mid 24) (v6.92.6600) | |
| HP Victus 16 (2024) (v6.92.6600) | |
| Nubia RedMagic Titan 16 Pro (v6.92.6600) | |
| Średnia w klasie Gaming (50699 - 200651, n=147, ostatnie 2 lata) | |
| Gigabyte G6X 9KG (2024) (v6.92.6600) | |
| AIDA64 / FPU SinJulia | |
| Nubia RedMagic Titan 16 Pro (v6.92.6600, Gaming Mode) | |
| Przeciętny Intel Core i9-14900HX (10475 - 18517, n=36) | |
| Lenovo Legion Pro 5 16IRX9 G9 (v6.92.6600) | |
| SCHENKER XMG Pro 16 Studio (Mid 24) (v6.92.6600) | |
| Acer Predator Helios Neo 16 (2024) (v6.92.6600) | |
| Średnia w klasie Gaming (4800 - 32988, n=147, ostatnie 2 lata) | |
| HP Victus 16 (2024) (v6.92.6600) | |
| Nubia RedMagic Titan 16 Pro (v6.92.6600) | |
| Gigabyte G6X 9KG (2024) (v6.92.6600) | |
| AIDA64 / FPU Mandel | |
| Przeciętny Intel Core i9-14900HX (32543 - 83662, n=36) | |
| Nubia RedMagic Titan 16 Pro (v6.92.6600, Gaming Mode) | |
| Lenovo Legion Pro 5 16IRX9 G9 (v6.92.6600) | |
| Acer Predator Helios Neo 16 (2024) (v6.92.6600) | |
| Średnia w klasie Gaming (12321 - 134044, n=147, ostatnie 2 lata) | |
| SCHENKER XMG Pro 16 Studio (Mid 24) (v6.92.6600) | |
| HP Victus 16 (2024) (v6.92.6600) | |
| Gigabyte G6X 9KG (2024) (v6.92.6600) | |
| Nubia RedMagic Titan 16 Pro | |
| AIDA64 / CPU AES | |
| Nubia RedMagic Titan 16 Pro (v6.92.6600, Gaming Mode) | |
| Przeciętny Intel Core i9-14900HX (86964 - 241777, n=36) | |
| Nubia RedMagic Titan 16 Pro (v6.92.6600) | |
| Lenovo Legion Pro 5 16IRX9 G9 (v6.92.6600) | |
| SCHENKER XMG Pro 16 Studio (Mid 24) (v6.92.6600) | |
| Średnia w klasie Gaming (19065 - 328679, n=147, ostatnie 2 lata) | |
| Acer Predator Helios Neo 16 (2024) (v6.92.6600) | |
| HP Victus 16 (2024) (v6.92.6600) | |
| Gigabyte G6X 9KG (2024) (v6.92.6600) | |
| AIDA64 / CPU ZLib | |
| Nubia RedMagic Titan 16 Pro (v6.92.6600, Gaming Mode) | |
| Przeciętny Intel Core i9-14900HX (1054 - 2292, n=36) | |
| Lenovo Legion Pro 5 16IRX9 G9 (v6.92.6600) | |
| SCHENKER XMG Pro 16 Studio (Mid 24) (v6.92.6600) | |
| Acer Predator Helios Neo 16 (2024) (v6.92.6600) | |
| Średnia w klasie Gaming (373 - 2531, n=147, ostatnie 2 lata) | |
| HP Victus 16 (2024) (v6.92.6600) | |
| Gigabyte G6X 9KG (2024) (v6.92.6600) | |
| Nubia RedMagic Titan 16 Pro (v6.92.6600) | |
| AIDA64 / FP64 Ray-Trace | |
| Przeciętny Intel Core i9-14900HX (6809 - 18349, n=36) | |
| Lenovo Legion Pro 5 16IRX9 G9 (v6.92.6600) | |
| Nubia RedMagic Titan 16 Pro (v6.92.6600, Gaming Mode) | |
| Średnia w klasie Gaming (2540 - 43430, n=147, ostatnie 2 lata) | |
| SCHENKER XMG Pro 16 Studio (Mid 24) (v6.92.6600) | |
| Acer Predator Helios Neo 16 (2024) (v6.92.6600) | |
| HP Victus 16 (2024) (v6.92.6600) | |
| Gigabyte G6X 9KG (2024) (v6.92.6600) | |
| Nubia RedMagic Titan 16 Pro (v6.92.6600) | |
| AIDA64 / CPU PhotoWorxx | |
| Lenovo Legion Pro 5 16IRX9 G9 (v6.92.6600) | |
| SCHENKER XMG Pro 16 Studio (Mid 24) (v6.92.6600) | |
| Przeciętny Intel Core i9-14900HX (23903 - 54702, n=36) | |
| Acer Predator Helios Neo 16 (2024) (v6.92.6600) | |
| Średnia w klasie Gaming (10805 - 60161, n=147, ostatnie 2 lata) | |
| HP Victus 16 (2024) (v6.92.6600) | |
| Gigabyte G6X 9KG (2024) (v6.92.6600) | |
| Nubia RedMagic Titan 16 Pro (v6.92.6600) | |
| Nubia RedMagic Titan 16 Pro (v6.92.6600, Gaming Mode) | |
Wydajność systemu
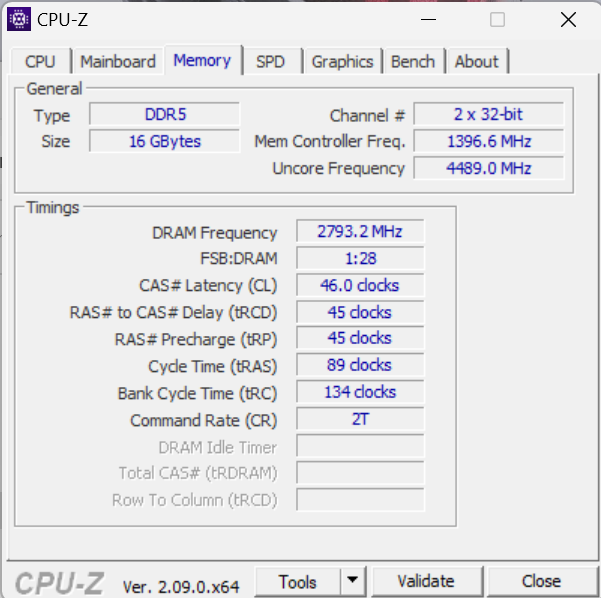
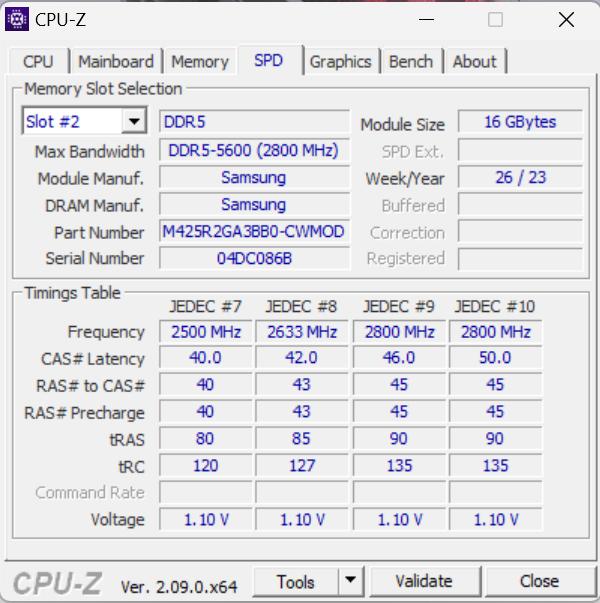
Płynnie działający system zapewnia wystarczającą moc dla wymagających aplikacji, takich jak gry, renderowanie i strumieniowanie. Część mocy obliczeniowej pozostaje jednak niewykorzystana, gdyż pamięć RAM (16 GB, DDR5-5600) działa tylko w trybie jednokanałowym - potwierdzają to niskie transfery pamięci laptopa w porównaniu do konkurencji. Zainstalowanie drugiego modułu pamięci (= aktywny tryb dwukanałowy) zapewniłoby rozwiązanie tego problemu.
CrossMark: Overall | Productivity | Creativity | Responsiveness
WebXPRT 3: Overall
WebXPRT 4: Overall
Mozilla Kraken 1.1: Total
| PCMark 10 / Score | |
| Acer Predator Helios Neo 16 (2024) | |
| Lenovo Legion Pro 5 16IRX9 G9 | |
| SCHENKER XMG Pro 16 Studio (Mid 24) | |
| Przeciętny Intel Core i9-14900HX, NVIDIA GeForce RTX 4060 Laptop GPU (7830 - 8322, n=2) | |
| Nubia RedMagic Titan 16 Pro | |
| Średnia w klasie Gaming (5776 - 9852, n=133, ostatnie 2 lata) | |
| Gigabyte G6X 9KG (2024) | |
| HP Victus 16 (2024) | |
| PCMark 10 / Essentials | |
| Acer Predator Helios Neo 16 (2024) | |
| Przeciętny Intel Core i9-14900HX, NVIDIA GeForce RTX 4060 Laptop GPU (11022 - 11413, n=2) | |
| Lenovo Legion Pro 5 16IRX9 G9 | |
| Nubia RedMagic Titan 16 Pro | |
| HP Victus 16 (2024) | |
| Średnia w klasie Gaming (9057 - 12600, n=133, ostatnie 2 lata) | |
| SCHENKER XMG Pro 16 Studio (Mid 24) | |
| Gigabyte G6X 9KG (2024) | |
| PCMark 10 / Productivity | |
| SCHENKER XMG Pro 16 Studio (Mid 24) | |
| Acer Predator Helios Neo 16 (2024) | |
| Gigabyte G6X 9KG (2024) | |
| Przeciętny Intel Core i9-14900HX, NVIDIA GeForce RTX 4060 Laptop GPU (9776 - 10558, n=2) | |
| HP Victus 16 (2024) | |
| Średnia w klasie Gaming (6662 - 14612, n=133, ostatnie 2 lata) | |
| Lenovo Legion Pro 5 16IRX9 G9 | |
| Nubia RedMagic Titan 16 Pro | |
| PCMark 10 / Digital Content Creation | |
| Lenovo Legion Pro 5 16IRX9 G9 | |
| Acer Predator Helios Neo 16 (2024) | |
| Przeciętny Intel Core i9-14900HX, NVIDIA GeForce RTX 4060 Laptop GPU (12091 - 12979, n=2) | |
| SCHENKER XMG Pro 16 Studio (Mid 24) | |
| Średnia w klasie Gaming (6807 - 18475, n=133, ostatnie 2 lata) | |
| Nubia RedMagic Titan 16 Pro | |
| Gigabyte G6X 9KG (2024) | |
| HP Victus 16 (2024) | |
| CrossMark / Overall | |
| Acer Predator Helios Neo 16 (2024) | |
| Przeciętny Intel Core i9-14900HX, NVIDIA GeForce RTX 4060 Laptop GPU (2103 - 2184, n=2) | |
| Lenovo Legion Pro 5 16IRX9 G9 | |
| Nubia RedMagic Titan 16 Pro | |
| SCHENKER XMG Pro 16 Studio (Mid 24) | |
| Gigabyte G6X 9KG (2024) | |
| HP Victus 16 (2024) | |
| Średnia w klasie Gaming (1247 - 2344, n=114, ostatnie 2 lata) | |
| CrossMark / Productivity | |
| Acer Predator Helios Neo 16 (2024) | |
| Nubia RedMagic Titan 16 Pro | |
| Przeciętny Intel Core i9-14900HX, NVIDIA GeForce RTX 4060 Laptop GPU (2040 - 2042, n=2) | |
| Lenovo Legion Pro 5 16IRX9 G9 | |
| SCHENKER XMG Pro 16 Studio (Mid 24) | |
| Gigabyte G6X 9KG (2024) | |
| Średnia w klasie Gaming (1299 - 2204, n=114, ostatnie 2 lata) | |
| HP Victus 16 (2024) | |
| CrossMark / Creativity | |
| Acer Predator Helios Neo 16 (2024) | |
| Lenovo Legion Pro 5 16IRX9 G9 | |
| SCHENKER XMG Pro 16 Studio (Mid 24) | |
| Przeciętny Intel Core i9-14900HX, NVIDIA GeForce RTX 4060 Laptop GPU (2240 - 2472, n=2) | |
| Nubia RedMagic Titan 16 Pro | |
| HP Victus 16 (2024) | |
| Średnia w klasie Gaming (1275 - 2660, n=114, ostatnie 2 lata) | |
| Gigabyte G6X 9KG (2024) | |
| CrossMark / Responsiveness | |
| Acer Predator Helios Neo 16 (2024) | |
| Gigabyte G6X 9KG (2024) | |
| Nubia RedMagic Titan 16 Pro | |
| Lenovo Legion Pro 5 16IRX9 G9 | |
| Przeciętny Intel Core i9-14900HX, NVIDIA GeForce RTX 4060 Laptop GPU (1849 - 1899, n=2) | |
| HP Victus 16 (2024) | |
| SCHENKER XMG Pro 16 Studio (Mid 24) | |
| Średnia w klasie Gaming (1030 - 2330, n=114, ostatnie 2 lata) | |
| WebXPRT 3 / Overall | |
| Przeciętny Intel Core i9-14900HX, NVIDIA GeForce RTX 4060 Laptop GPU (329 - 339, n=2) | |
| Nubia RedMagic Titan 16 Pro | |
| Acer Predator Helios Neo 16 (2024) | |
| SCHENKER XMG Pro 16 Studio (Mid 24) | |
| Gigabyte G6X 9KG (2024) | |
| Lenovo Legion Pro 5 16IRX9 G9 | |
| Średnia w klasie Gaming (215 - 480, n=127, ostatnie 2 lata) | |
| HP Victus 16 (2024) | |
| WebXPRT 4 / Overall | |
| Przeciętny Intel Core i9-14900HX, NVIDIA GeForce RTX 4060 Laptop GPU (309 - 319, n=2) | |
| Nubia RedMagic Titan 16 Pro | |
| Acer Predator Helios Neo 16 (2024) | |
| SCHENKER XMG Pro 16 Studio (Mid 24) | |
| Lenovo Legion Pro 5 16IRX9 G9 | |
| Średnia w klasie Gaming (176.4 - 335, n=115, ostatnie 2 lata) | |
| Gigabyte G6X 9KG (2024) | |
| HP Victus 16 (2024) | |
| Mozilla Kraken 1.1 / Total | |
| HP Victus 16 (2024) | |
| Gigabyte G6X 9KG (2024) | |
| Średnia w klasie Gaming (409 - 674, n=139, ostatnie 2 lata) | |
| Lenovo Legion Pro 5 16IRX9 G9 | |
| SCHENKER XMG Pro 16 Studio (Mid 24) | |
| Acer Predator Helios Neo 16 (2024) | |
| Nubia RedMagic Titan 16 Pro | |
| Przeciętny Intel Core i9-14900HX, NVIDIA GeForce RTX 4060 Laptop GPU (430 - 439, n=2) | |
* ... im mniej tym lepiej
| PCMark 10 Score | 7830 pkt. | |
Pomoc | ||
| AIDA64 / Memory Copy | |
| SCHENKER XMG Pro 16 Studio (Mid 24) | |
| Lenovo Legion Pro 5 16IRX9 G9 | |
| Acer Predator Helios Neo 16 (2024) | |
| Przeciętny Intel Core i9-14900HX (38028 - 83392, n=36) | |
| HP Victus 16 (2024) | |
| Średnia w klasie Gaming (21750 - 97515, n=147, ostatnie 2 lata) | |
| Gigabyte G6X 9KG (2024) | |
| Nubia RedMagic Titan 16 Pro | |
| AIDA64 / Memory Read | |
| Lenovo Legion Pro 5 16IRX9 G9 | |
| SCHENKER XMG Pro 16 Studio (Mid 24) | |
| Acer Predator Helios Neo 16 (2024) | |
| Przeciętny Intel Core i9-14900HX (43306 - 87568, n=36) | |
| HP Victus 16 (2024) | |
| Średnia w klasie Gaming (22956 - 102937, n=147, ostatnie 2 lata) | |
| Gigabyte G6X 9KG (2024) | |
| Nubia RedMagic Titan 16 Pro | |
| AIDA64 / Memory Write | |
| Lenovo Legion Pro 5 16IRX9 G9 | |
| SCHENKER XMG Pro 16 Studio (Mid 24) | |
| Przeciętny Intel Core i9-14900HX (37146 - 80589, n=36) | |
| Acer Predator Helios Neo 16 (2024) | |
| Średnia w klasie Gaming (22297 - 108954, n=147, ostatnie 2 lata) | |
| HP Victus 16 (2024) | |
| Gigabyte G6X 9KG (2024) | |
| Nubia RedMagic Titan 16 Pro | |
| AIDA64 / Memory Latency | |
| HP Victus 16 (2024) | |
| Średnia w klasie Gaming (59.5 - 259, n=147, ostatnie 2 lata) | |
| Acer Predator Helios Neo 16 (2024) | |
| Gigabyte G6X 9KG (2024) | |
| Przeciętny Intel Core i9-14900HX (76.1 - 105, n=36) | |
| SCHENKER XMG Pro 16 Studio (Mid 24) | |
| Lenovo Legion Pro 5 16IRX9 G9 | |
| Nubia RedMagic Titan 16 Pro | |
* ... im mniej tym lepiej
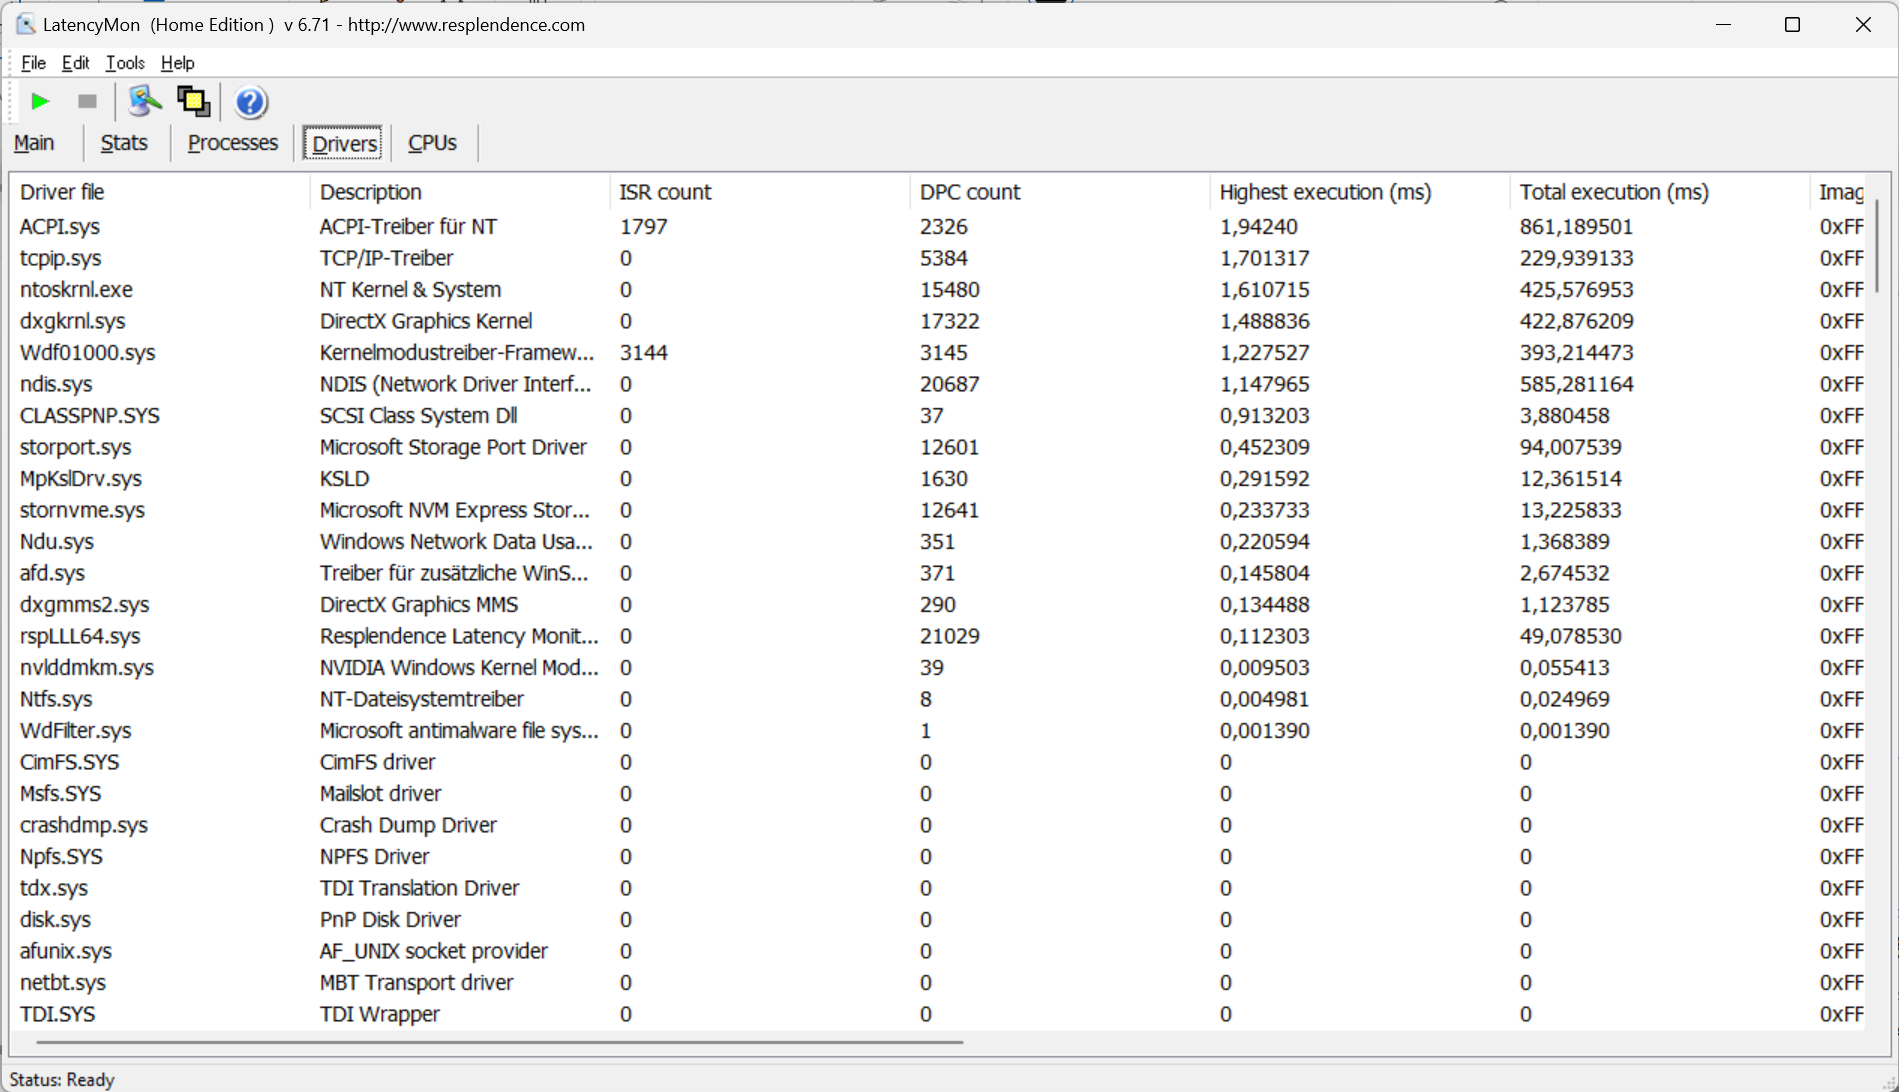
Opóźnienia DPC
Wysokie opóźnienia uniemożliwiają edycję wideo i audio w czasie rzeczywistym. Przyszłe aktualizacje oprogramowania mogą doprowadzić do poprawy lub nawet pogorszenia jakości.
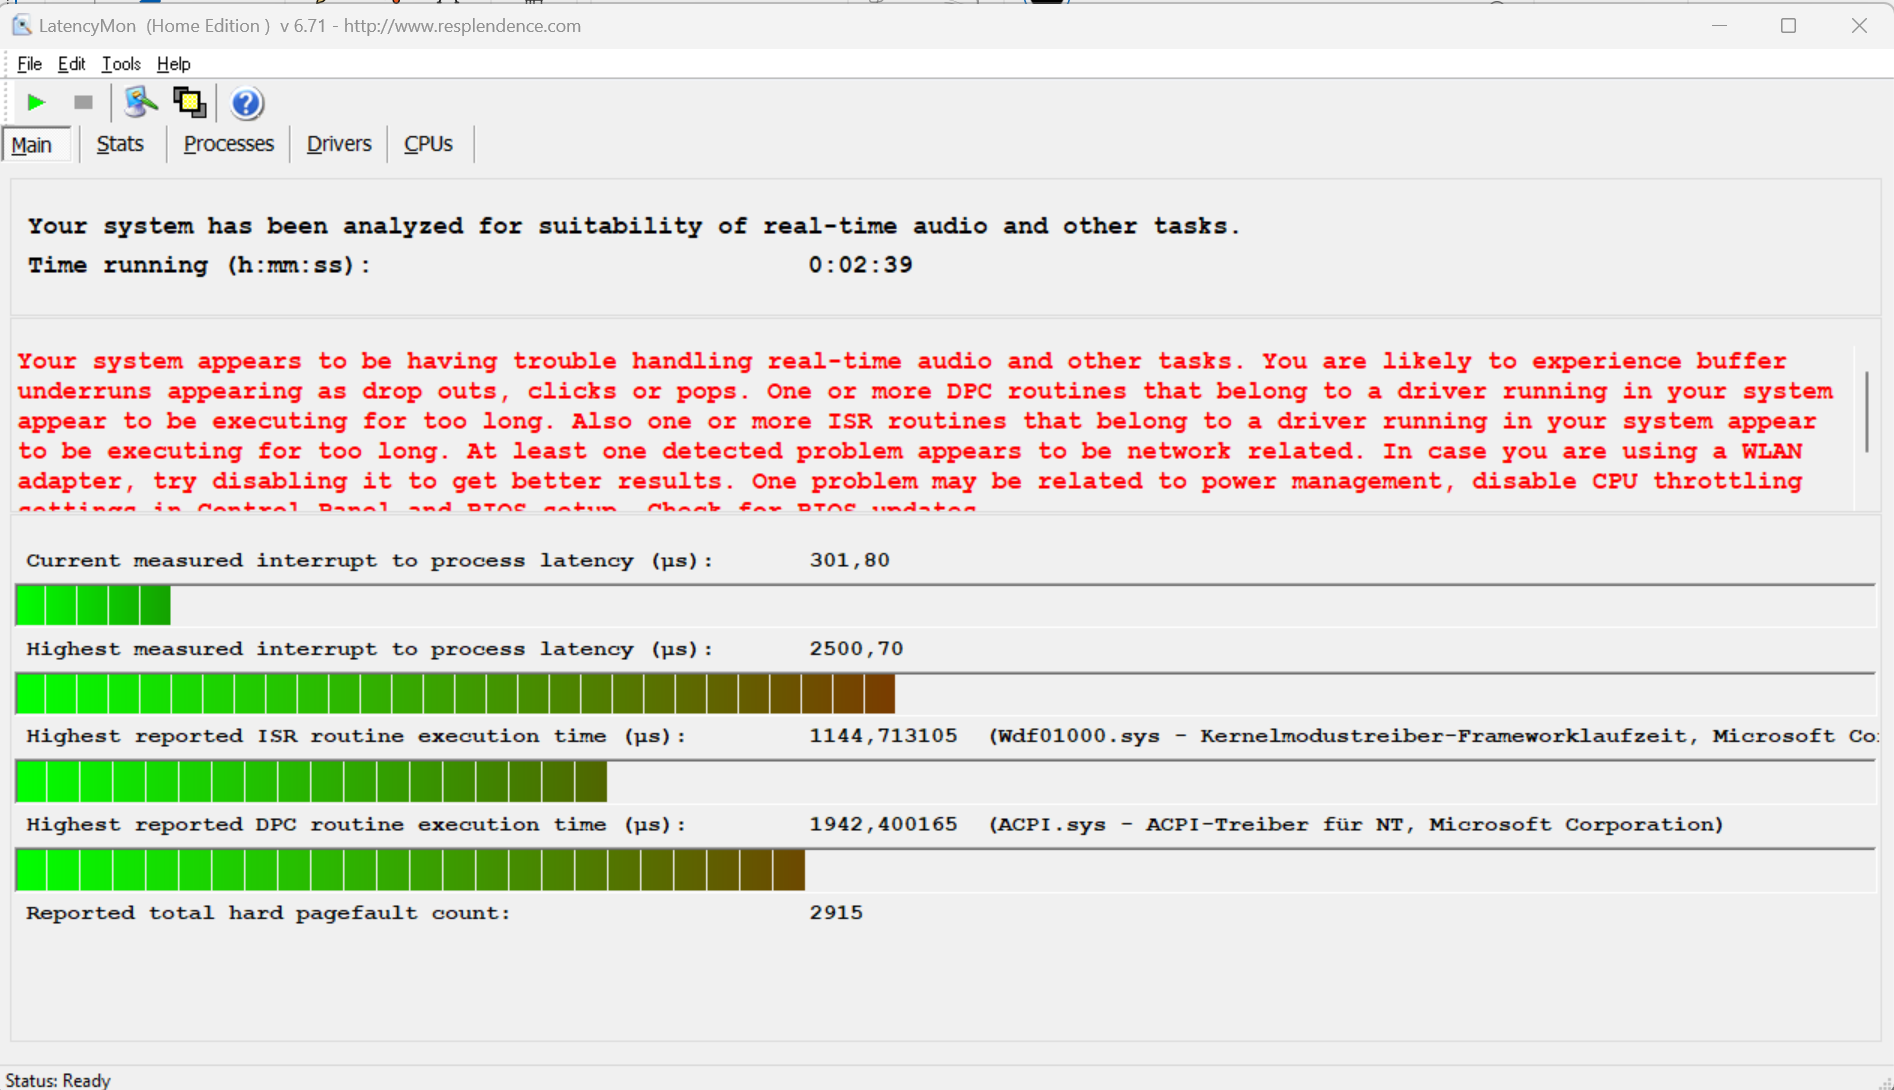
| DPC Latencies / LatencyMon - interrupt to process latency (max), Web, Youtube, Prime95 | |
| Nubia RedMagic Titan 16 Pro | |
| Gigabyte G6X 9KG (2024) | |
| SCHENKER XMG Pro 16 Studio (Mid 24) | |
| Acer Predator Helios Neo 16 (2024) | |
| Lenovo Legion Pro 5 16IRX9 G9 | |
| HP Victus 16 (2024) | |
* ... im mniej tym lepiej
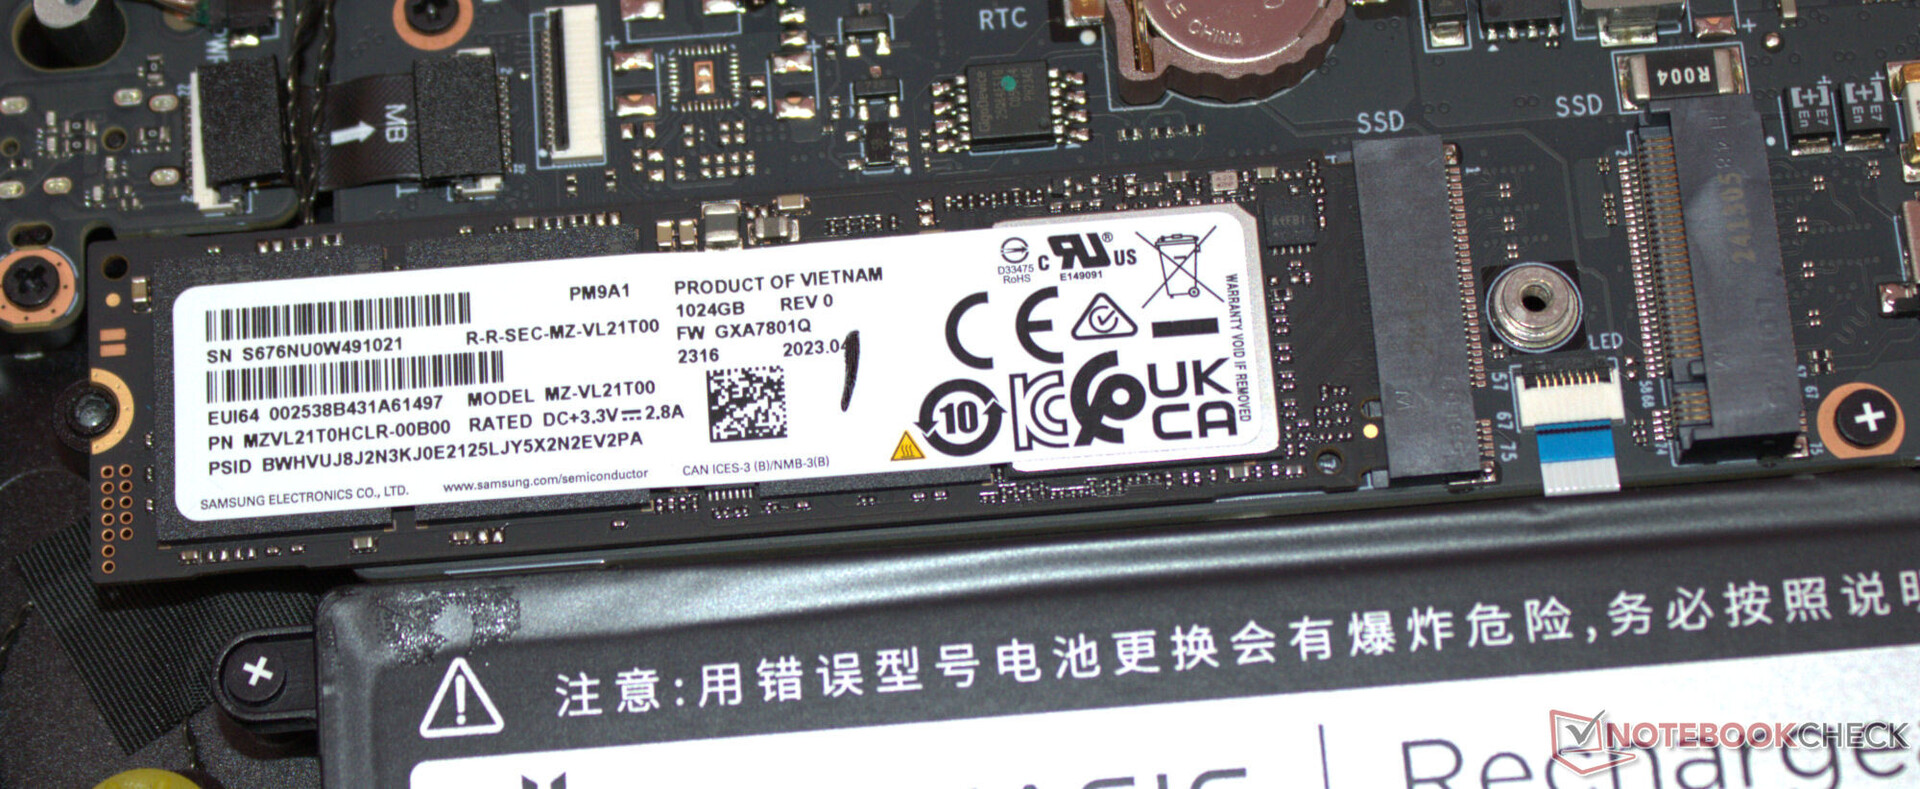
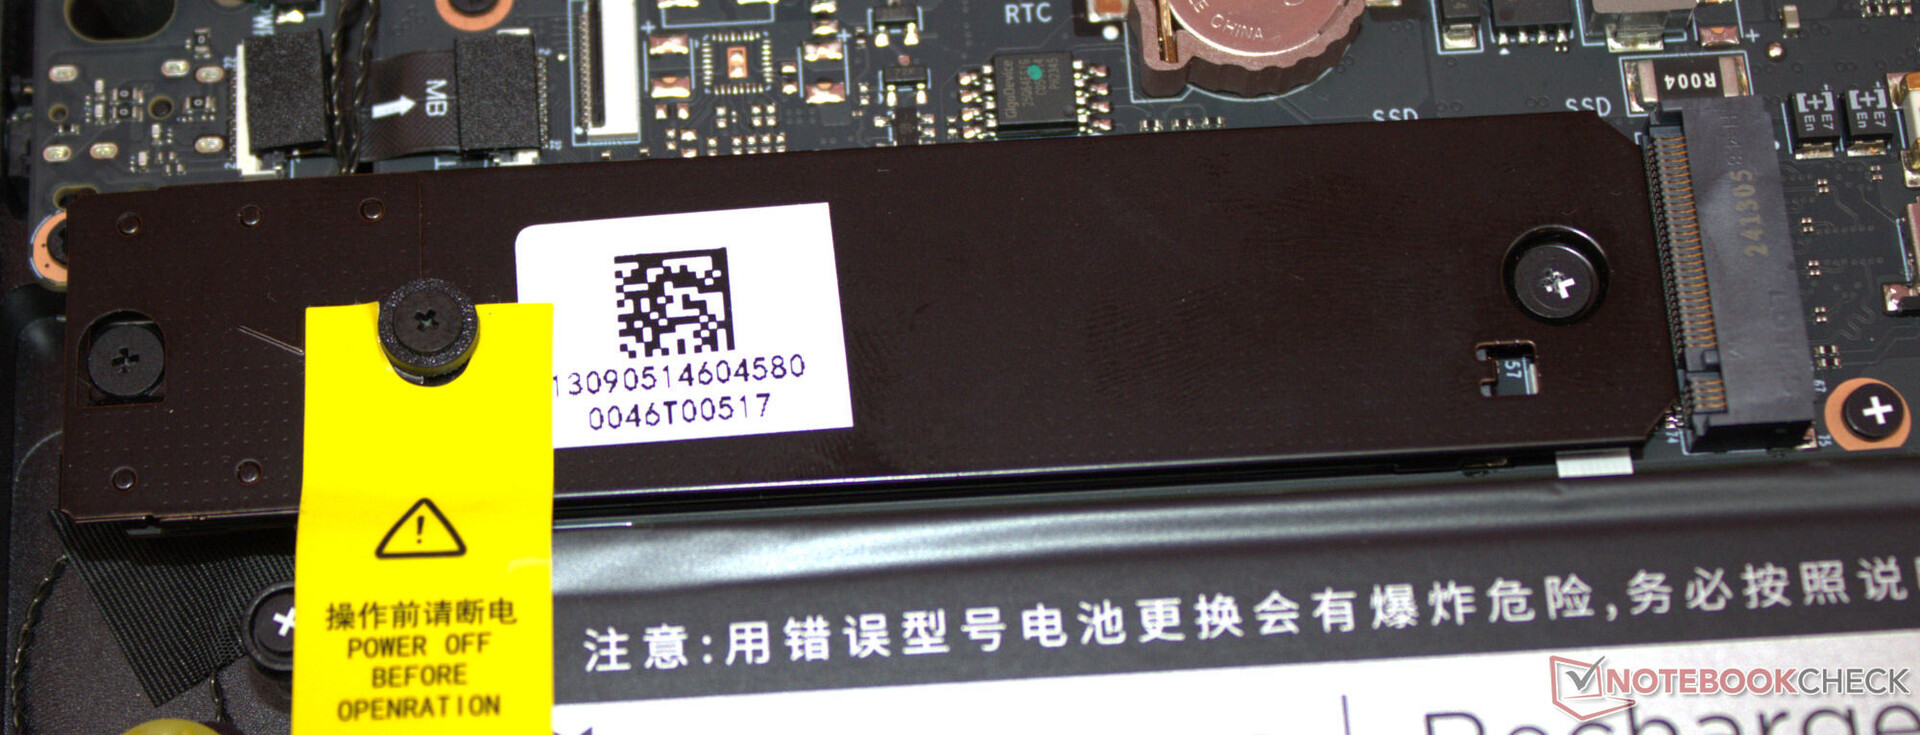
Urządzenia pamięci masowej
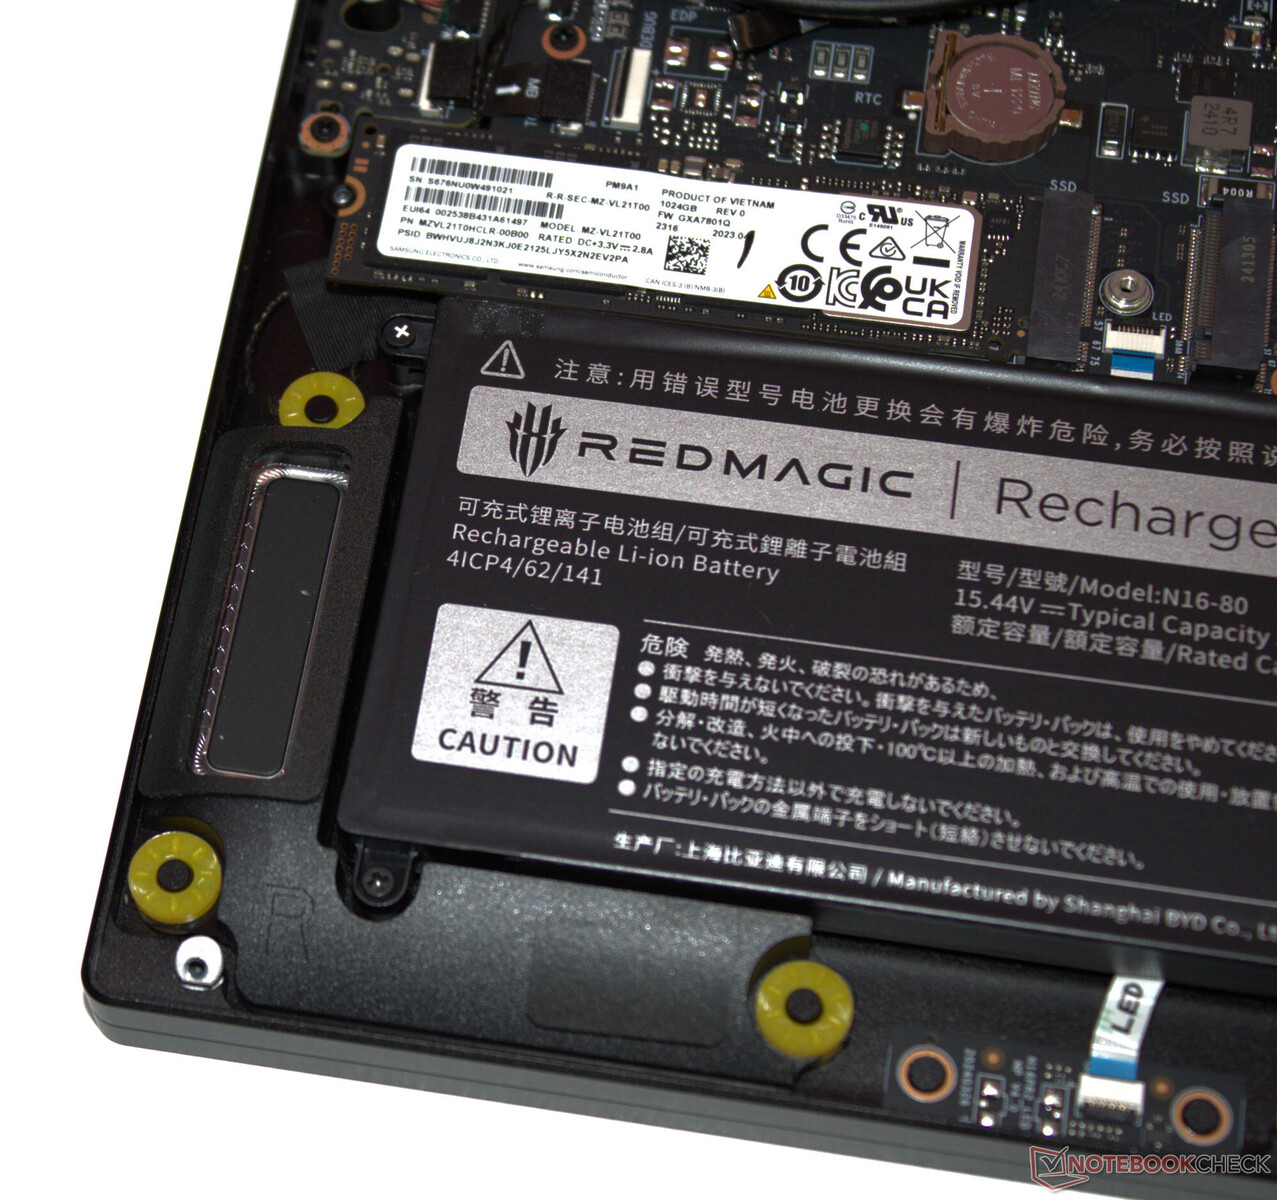
Dysk SSD PCIe 4 (M.2-2280) firmy Samsung oferuje pojemność 1 TB i zapewnia bardzo dobrą szybkość transmisji danych. Pozytywne: Nie zaobserwowaliśmy throttlingu indukowanego termicznie. Laptop posiada miejsce na drugi dysk SSD PCIe 4.

* ... im mniej tym lepiej
Reading continuous performance: DiskSpd Read Loop, Queue Depth 8
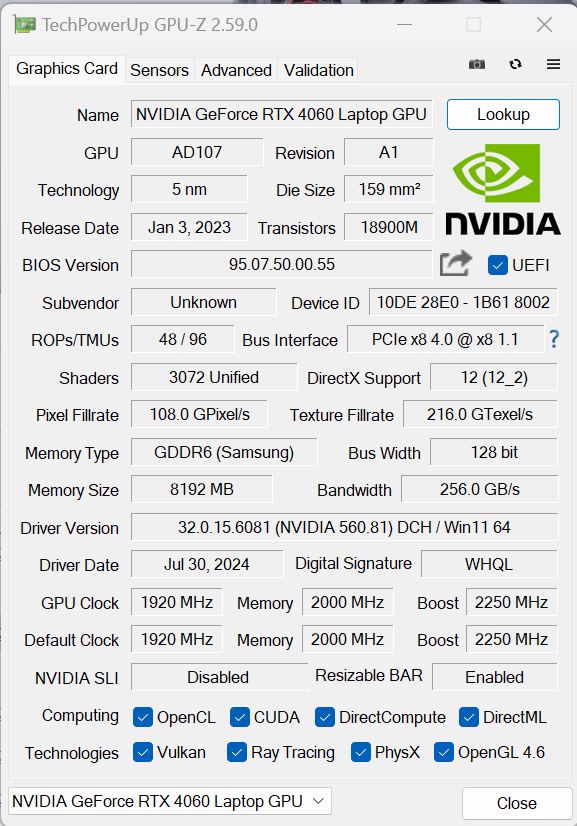
Karta graficzna
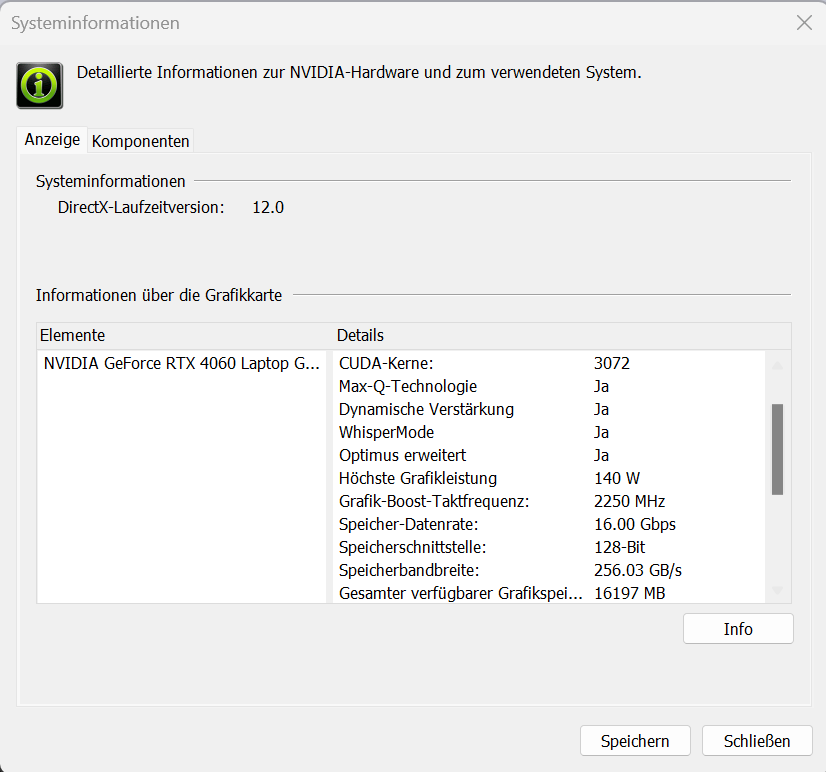
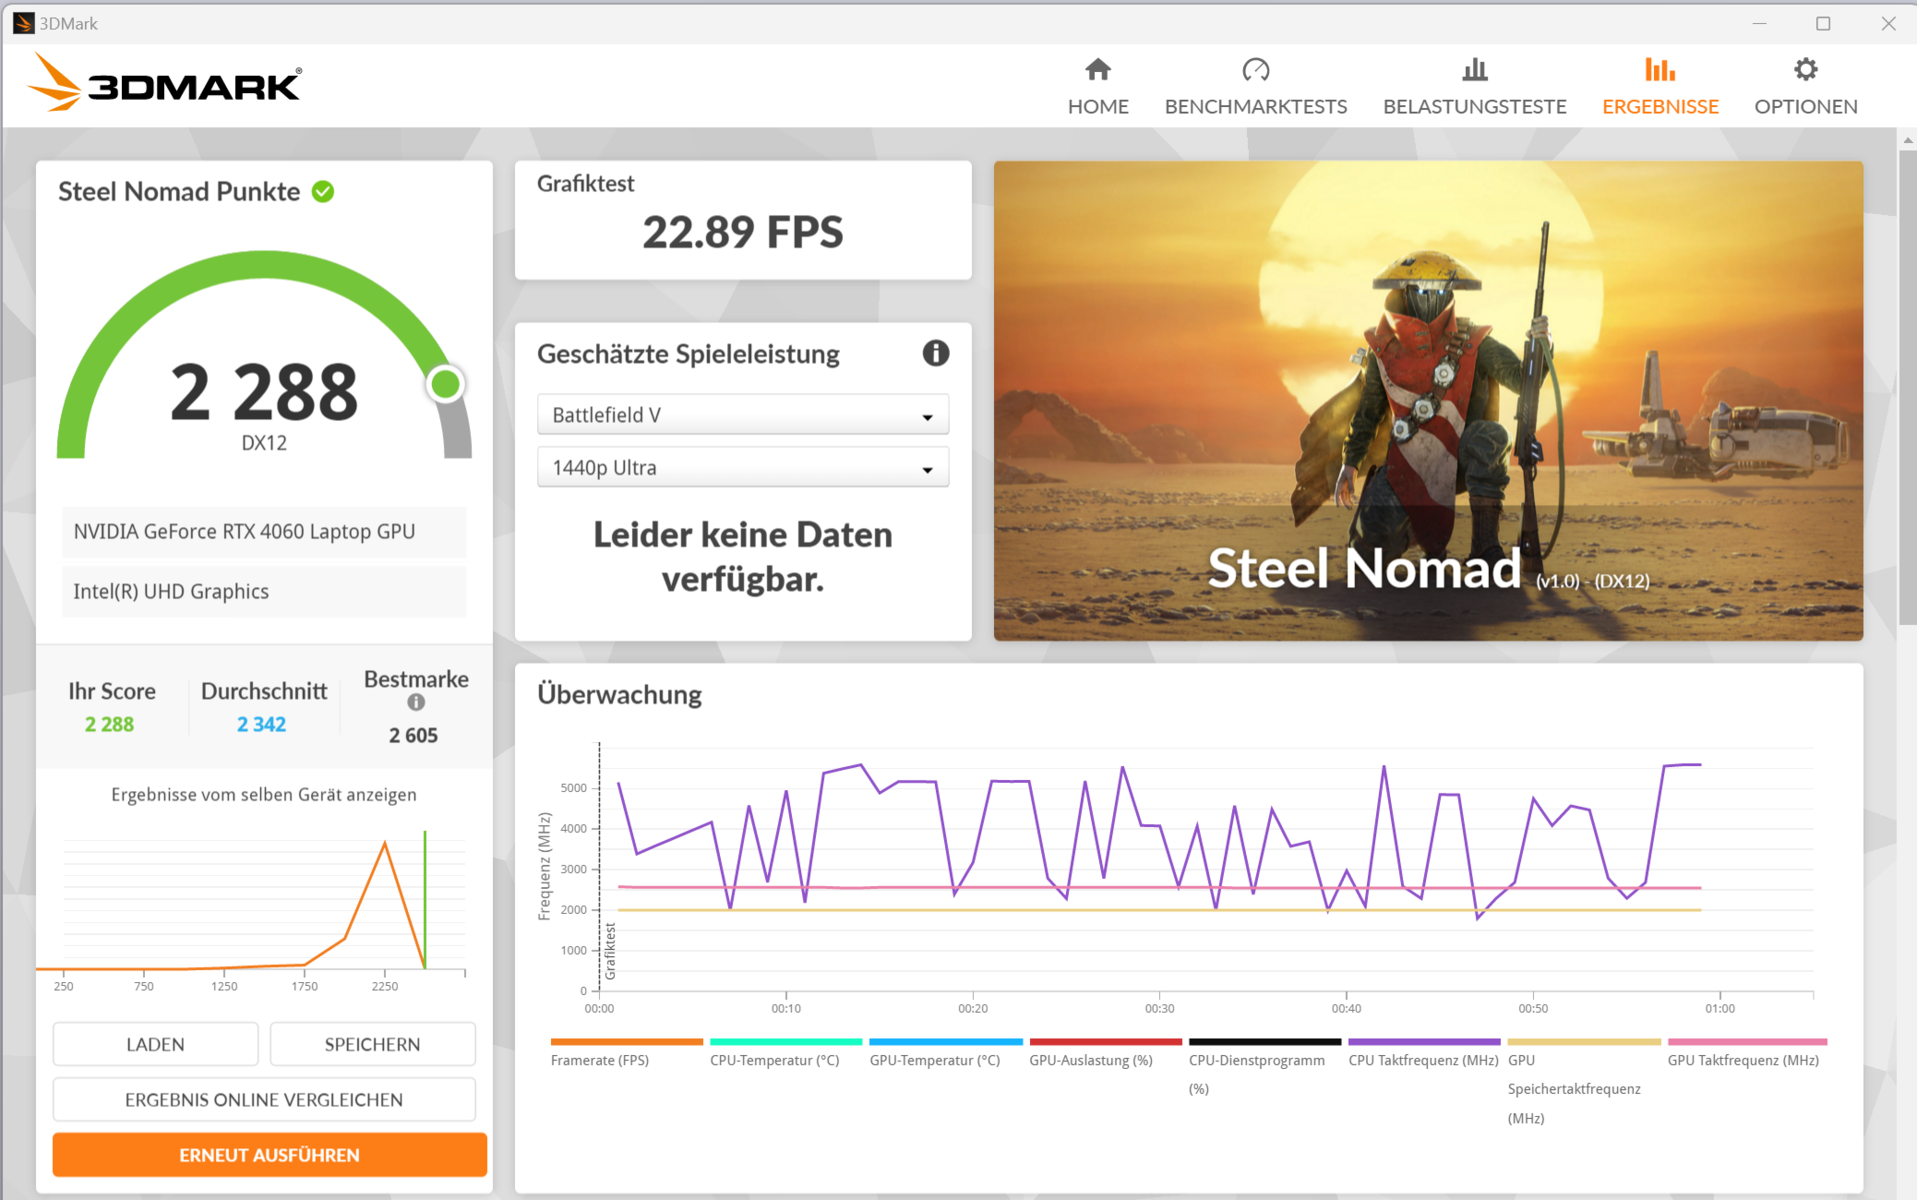
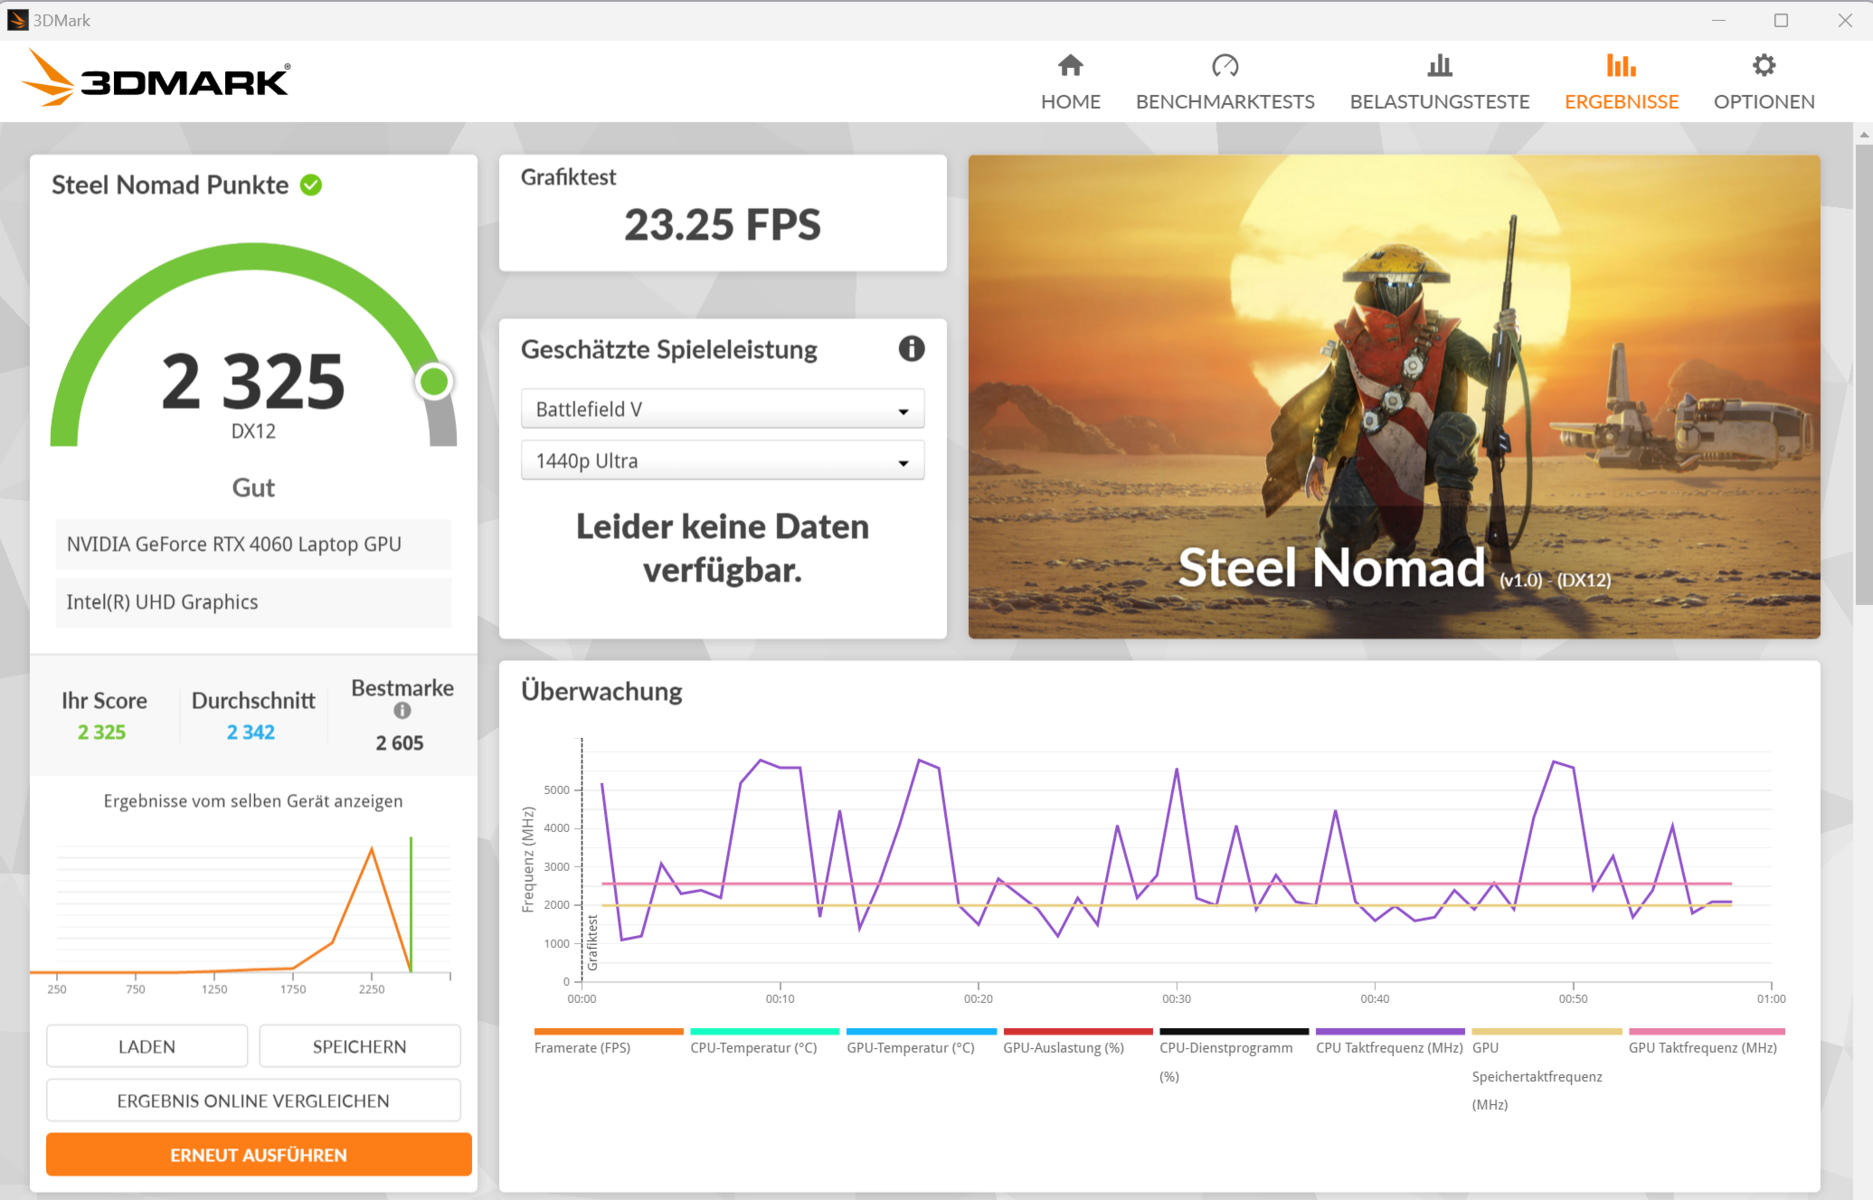
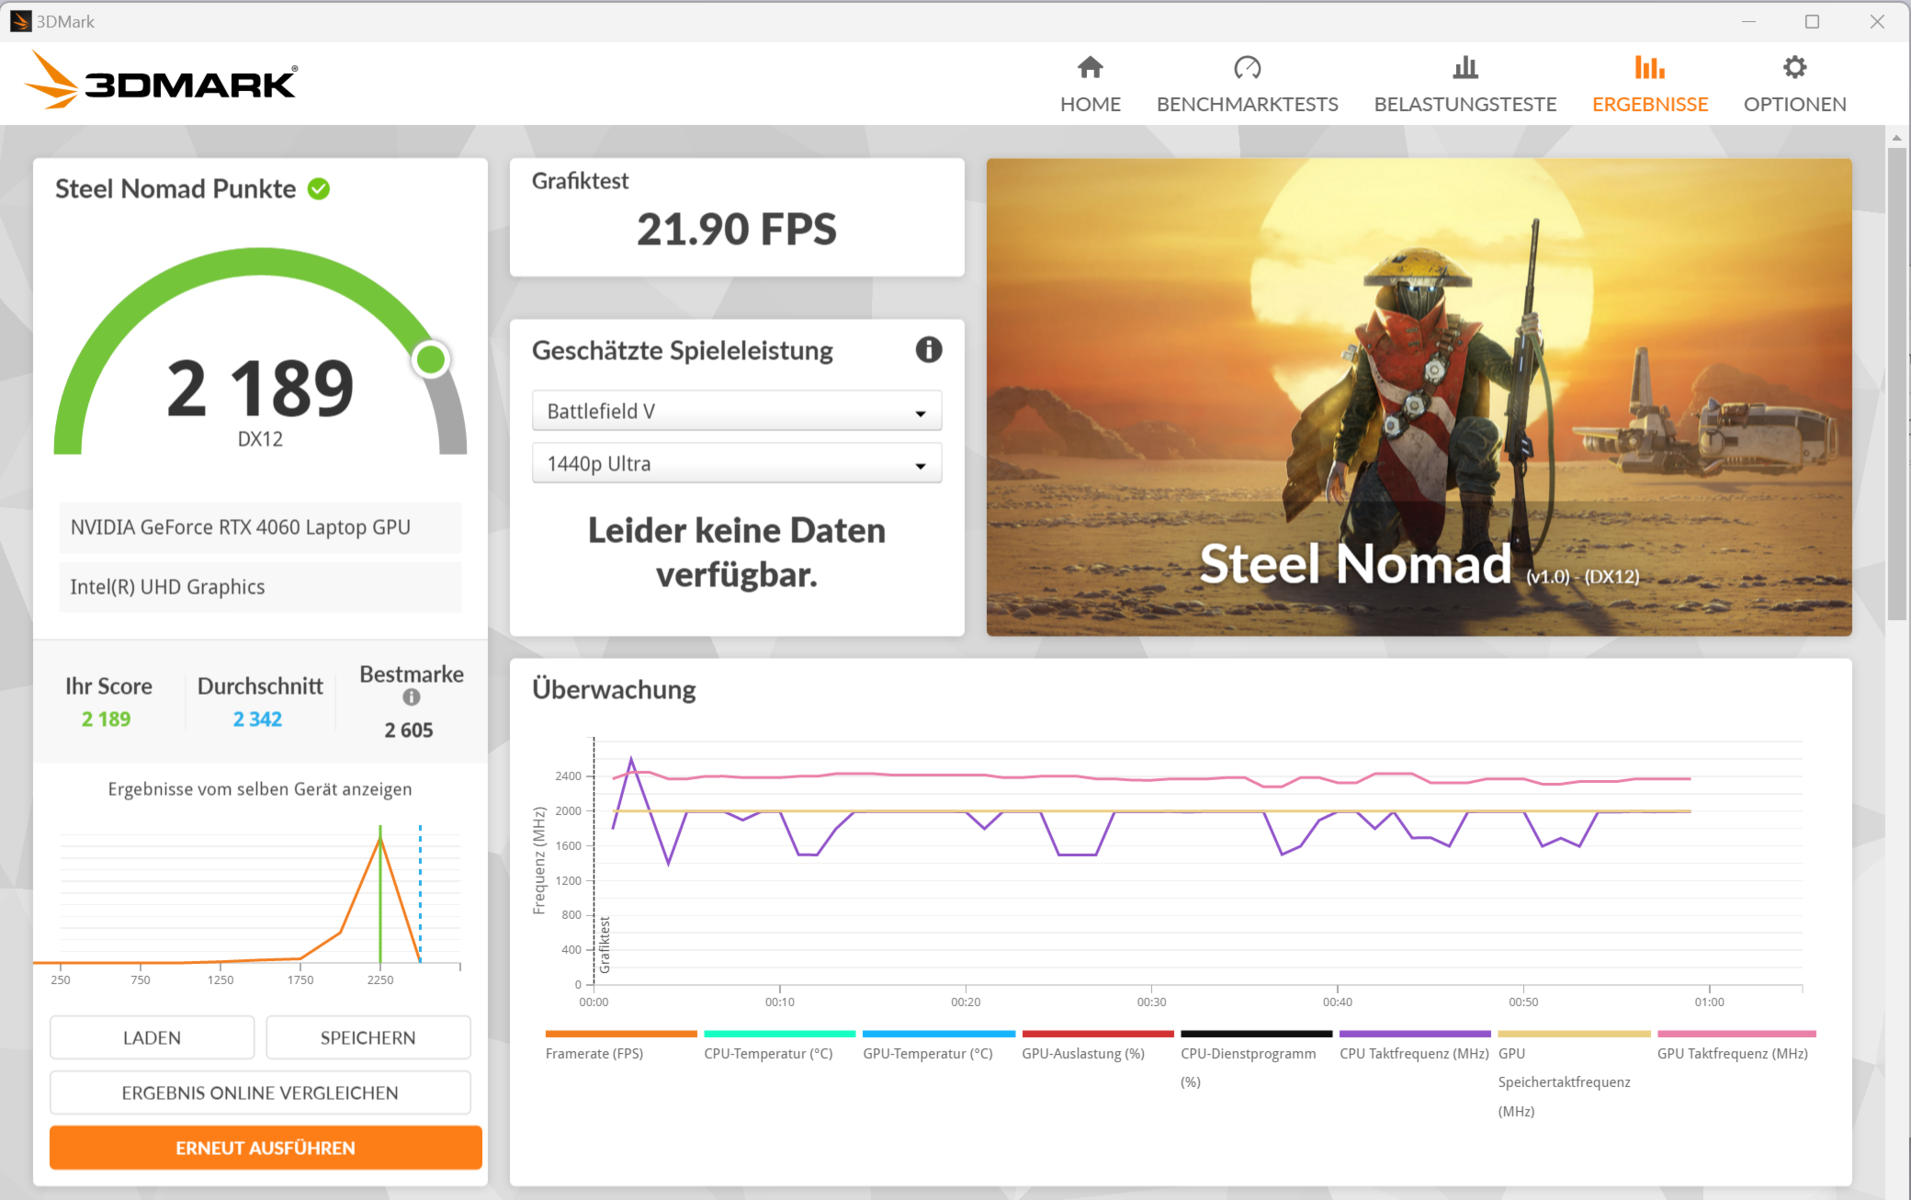
Karta graficzna GeForce RTX 4060 (3 072 jednostek cieniujących, 128-bitowa magistrala, 8 GB pamięci GDDR6) to obecnie GPU do gier (niższej) średniej klasy. Nubia przyznaje mu maksymalne TGP na poziomie 140 watów - więcej nie jest możliwe. Jego wyniki benchmarków są nieco powyżej średniej RTX-4060(tryb zrównoważony ). Tryb gamingowy nie powoduje wzrostu. Przełączanie między dGPU i Optimus nie wymaga restartu - obsługiwany jest zaawansowany Optimus.

| 3DMark Performance Rating - Percent | |
| Acer Predator Helios Neo 16 (2024) | |
| Średnia w klasie Gaming | |
| SCHENKER XMG Pro 16 Studio (Mid 24) | |
| Lenovo Legion Pro 5 16IRX9 G9 | |
| Nubia RedMagic Titan 16 Pro | |
| Nubia RedMagic Titan 16 Pro | |
| Gigabyte G6X 9KG (2024) | |
| HP Victus 16 (2024) | |
| Przeciętny NVIDIA GeForce RTX 4060 Laptop GPU | |
| 3DMark 11 - 1280x720 Performance GPU | |
| Acer Predator Helios Neo 16 (2024) | |
| Średnia w klasie Gaming (10741 - 72178, n=143, ostatnie 2 lata) | |
| SCHENKER XMG Pro 16 Studio (Mid 24) | |
| Lenovo Legion Pro 5 16IRX9 G9 | |
| Nubia RedMagic Titan 16 Pro (Gaming Mode) | |
| Nubia RedMagic Titan 16 Pro | |
| Gigabyte G6X 9KG (2024) | |
| HP Victus 16 (2024) | |
| Przeciętny NVIDIA GeForce RTX 4060 Laptop GPU (28136 - 38912, n=57) | |
| 3DMark | |
| 1920x1080 Fire Strike Graphics | |
| Acer Predator Helios Neo 16 (2024) | |
| Średnia w klasie Gaming (2913 - 56116, n=155, ostatnie 2 lata) | |
| SCHENKER XMG Pro 16 Studio (Mid 24) | |
| Lenovo Legion Pro 5 16IRX9 G9 | |
| Gigabyte G6X 9KG (2024) | |
| HP Victus 16 (2024) | |
| Nubia RedMagic Titan 16 Pro (Gaming Mode) | |
| Nubia RedMagic Titan 16 Pro | |
| Przeciętny NVIDIA GeForce RTX 4060 Laptop GPU (20533 - 29656, n=54) | |
| 2560x1440 Time Spy Graphics | |
| Acer Predator Helios Neo 16 (2024) | |
| Średnia w klasie Gaming (2295 - 24599, n=151, ostatnie 2 lata) | |
| SCHENKER XMG Pro 16 Studio (Mid 24) | |
| Lenovo Legion Pro 5 16IRX9 G9 | |
| Nubia RedMagic Titan 16 Pro (Gaming Mode) | |
| Nubia RedMagic Titan 16 Pro | |
| Przeciętny NVIDIA GeForce RTX 4060 Laptop GPU (7484 - 11451, n=56) | |
| HP Victus 16 (2024) | |
| Gigabyte G6X 9KG (2024) | |
| 3DMark 06 Standard Score | 55770 pkt. | |
| 3DMark 11 Performance | 28427 pkt. | |
| 3DMark Fire Strike Score | 22307 pkt. | |
| 3DMark Time Spy Score | 10789 pkt. | |
| 3DMark Steel Nomad Score | 2288 pkt. | |
Pomoc | ||
| Geekbench 6.4 | |
| GPU OpenCL | |
| Acer Predator Helios Neo 16 (2024) (6.2.1) | |
| Średnia w klasie Gaming (4321 - 234213, n=118, ostatnie 2 lata) | |
| SCHENKER XMG Pro 16 Studio (Mid 24) (6.2.1) | |
| Nubia RedMagic Titan 16 Pro (6.2.1, Gaming Mode) | |
| Nubia RedMagic Titan 16 Pro (6.2.1) | |
| Gigabyte G6X 9KG (2024) (6.2.1) | |
| HP Victus 16 (2024) (6.2.1) | |
| Przeciętny NVIDIA GeForce RTX 4060 Laptop GPU (4321 - 100831, n=40) | |
| Lenovo Legion Pro 5 16IRX9 G9 (6.2.1) | |
| GPU Vulkan | |
| SCHENKER XMG Pro 16 Studio (Mid 24) (6.2.1) | |
| Nubia RedMagic Titan 16 Pro (6.2.1, Gaming Mode) | |
| Gigabyte G6X 9KG (2024) (6.2.1) | |
| Acer Predator Helios Neo 16 (2024) (6.2.1) | |
| HP Victus 16 (2024) (6.2.1) | |
| Średnia w klasie Gaming (4286 - 231659, n=110, ostatnie 2 lata) | |
| Nubia RedMagic Titan 16 Pro (6.2.1) | |
| Lenovo Legion Pro 5 16IRX9 G9 (6.2.1) | |
| Przeciętny NVIDIA GeForce RTX 4060 Laptop GPU (4286 - 101001, n=36) | |
| V-Ray Benchmark Next 4.10 | |
| GPU | |
| Średnia w klasie Gaming (54 - 1317, n=122, ostatnie 2 lata) | |
| Lenovo Legion Pro 5 16IRX9 G9 (v4.10.07 ) | |
| Acer Predator Helios Neo 16 (2024) (v4.10.07 ) | |
| Gigabyte G6X 9KG (2024) (v4.10.07 ) | |
| Nubia RedMagic Titan 16 Pro (v4.10.07 ) | |
| Nubia RedMagic Titan 16 Pro (v4.10.07, Gaming Mode ) | |
| Przeciętny NVIDIA GeForce RTX 4060 Laptop GPU (483 - 715, n=46) | |
| HP Victus 16 (2024) (v4.10.07 ) | |
| SCHENKER XMG Pro 16 Studio (Mid 24) (v4.10.07 ) | |
| CPU | |
| Nubia RedMagic Titan 16 Pro (v4.10.07, Gaming Mode) | |
| Lenovo Legion Pro 5 16IRX9 G9 (v4.10.07 ) | |
| SCHENKER XMG Pro 16 Studio (Mid 24) (v4.10.07 ) | |
| Acer Predator Helios Neo 16 (2024) (v4.10.07 ) | |
| HP Victus 16 (2024) (v4.10.07 ) | |
| Średnia w klasie Gaming (5413 - 44129, n=122, ostatnie 2 lata) | |
| Przeciętny NVIDIA GeForce RTX 4060 Laptop GPU (12680 - 32360, n=46) | |
| Gigabyte G6X 9KG (2024) (v4.10.07 ) | |
| Nubia RedMagic Titan 16 Pro (v4.10.07 ) | |
* ... im mniej tym lepiej
Wydajność w grach
Titan jest przeznaczony do gier w rozdzielczości QHD przy ustawieniach od wysokich do maksymalnych. Zainstalowany sprzęt generuje liczbę klatek na sekundę nieco powyżej średniej RTX 4060(tryb zrównoważony ). Tryb gamingowy daje plus podczas uruchamiania gier, które korzystają z wyższej wydajności procesora - takich jak Dota 2 Reborn i X-Plane 11. Poza tym wydajność graficzna jest identyczna.
| Cyberpunk 2077 2.2 Phantom Liberty - 1920x1080 Ultra Preset (FSR off) | |
| Średnia w klasie Gaming (6.76 - 158, n=90, ostatnie 2 lata) | |
| Acer Predator Helios Neo 16 (2024) (2.02) | |
| SCHENKER XMG Pro 16 Studio (Mid 24) (2.12) | |
| Lenovo Legion Pro 5 16IRX9 G9 (2.12) | |
| Nubia RedMagic Titan 16 Pro (2.12, Gaming Mode) | |
| Nubia RedMagic Titan 16 Pro (2.12) | |
| Przeciętny NVIDIA GeForce RTX 4060 Laptop GPU (56.4 - 93.1, n=31) | |
| Gigabyte G6X 9KG (2024) (2.02) | |
| HP Victus 16 (2024) (2.02) | |
| Final Fantasy XV Benchmark - 1920x1080 High Quality | |
| Acer Predator Helios Neo 16 (2024) (1.3) | |
| SCHENKER XMG Pro 16 Studio (Mid 24) (1.3) | |
| Średnia w klasie Gaming (19.2 - 201, n=144, ostatnie 2 lata) | |
| Lenovo Legion Pro 5 16IRX9 G9 (1.3) | |
| Nubia RedMagic Titan 16 Pro (1.3) | |
| Nubia RedMagic Titan 16 Pro (1.3, Gaming Mode ) | |
| Gigabyte G6X 9KG (2024) (1.3) | |
| HP Victus 16 (2024) (1.3) | |
| Przeciętny NVIDIA GeForce RTX 4060 Laptop GPU (75.1 - 109.8, n=51) | |
| Strange Brigade - 1920x1080 ultra AA:ultra AF:16 | |
| Średnia w klasie Gaming (38.9 - 420, n=140, ostatnie 2 lata) | |
| Acer Predator Helios Neo 16 (2024) (1.47.22.14 D3D12) | |
| SCHENKER XMG Pro 16 Studio (Mid 24) (1.47.22.14 D3D12) | |
| Lenovo Legion Pro 5 16IRX9 G9 (1.47.22.14 D3D12) | |
| Nubia RedMagic Titan 16 Pro (1.47.22.14 D3D12, Gaming Mode ) | |
| Nubia RedMagic Titan 16 Pro (1.47.22.14 D3D12) | |
| Gigabyte G6X 9KG (2024) (1.47.22.14 D3D12) | |
| Przeciętny NVIDIA GeForce RTX 4060 Laptop GPU (135.3 - 210, n=50) | |
| HP Victus 16 (2024) (1.47.22.14 D3D12) | |
| Dota 2 Reborn - 1920x1080 ultra (3/3) best looking | |
| Lenovo Legion Pro 5 16IRX9 G9 | |
| Acer Predator Helios Neo 16 (2024) | |
| Nubia RedMagic Titan 16 Pro (Gaming Mode) | |
| SCHENKER XMG Pro 16 Studio (Mid 24) | |
| HP Victus 16 (2024) | |
| Średnia w klasie Gaming (65.1 - 220, n=148, ostatnie 2 lata) | |
| Nubia RedMagic Titan 16 Pro | |
| Przeciętny NVIDIA GeForce RTX 4060 Laptop GPU (115 - 183.8, n=53) | |
| Gigabyte G6X 9KG (2024) | |
| X-Plane 11.11 - 1920x1080 high (fps_test=3) | |
| Nubia RedMagic Titan 16 Pro (Gaming Mode) | |
| Lenovo Legion Pro 5 16IRX9 G9 | |
| Acer Predator Helios Neo 16 (2024) | |
| SCHENKER XMG Pro 16 Studio (Mid 24) | |
| Nubia RedMagic Titan 16 Pro | |
| Gigabyte G6X 9KG (2024) | |
| Średnia w klasie Gaming (32.8 - 166.2, n=151, ostatnie 2 lata) | |
| Przeciętny NVIDIA GeForce RTX 4060 Laptop GPU (60.7 - 141.1, n=54) | |
| HP Victus 16 (2024) | |
| Once Human | |
| 1920x1080 Very High Preset | |
| Nubia RedMagic Titan 16 Pro | |
| Przeciętny NVIDIA GeForce RTX 4060 Laptop GPU (88.7 - 94.2, n=2) | |
| Średnia w klasie Gaming (14.2 - 94.2, n=2, ostatnie 2 lata) | |
| 2560x1440 Very High Preset | |
| Nubia RedMagic Titan 16 Pro | |
| Średnia w klasie Gaming (n=1ostatnie 2 lata) | |
| Przeciętny NVIDIA GeForce RTX 4060 Laptop GPU (59.1 - 62.3, n=2) | |
| 2560x1440 Very High Preset + Quality FSR | |
| Nubia RedMagic Titan 16 Pro | |
| Przeciętny NVIDIA GeForce RTX 4060 Laptop GPU (n=1) | |
| Średnia w klasie Gaming (n=1ostatnie 2 lata) | |
| F1 24 | |
| 1920x1080 Ultra High Preset AA:T AF:16x | |
| Średnia w klasie Gaming (54.1 - 148, n=19, ostatnie 2 lata) | |
| SCHENKER XMG Pro 16 Studio (Mid 24) | |
| Lenovo Legion Pro 5 16IRX9 G9 | |
| Nubia RedMagic Titan 16 Pro | |
| Przeciętny NVIDIA GeForce RTX 4060 Laptop GPU (47.5 - 61.6, n=10) | |
| 2560x1440 Ultra High Preset AA:T AF:16x | |
| Średnia w klasie Gaming (36.7 - 100, n=16, ostatnie 2 lata) | |
| SCHENKER XMG Pro 16 Studio (Mid 24) | |
| Nubia RedMagic Titan 16 Pro | |
| Przeciętny NVIDIA GeForce RTX 4060 Laptop GPU (24.3 - 38.8, n=6) | |
| 2560x1440 Ultra High Preset + Quality DLSS AF:16x | |
| Średnia w klasie Gaming (59.2 - 150.4, n=12, ostatnie 2 lata) | |
| SCHENKER XMG Pro 16 Studio (Mid 24) | |
| Nubia RedMagic Titan 16 Pro | |
| Przeciętny NVIDIA GeForce RTX 4060 Laptop GPU (48.6 - 61, n=3) | |
| Ghost of Tsushima | |
| 1920x1080 Very High Preset AA:T | |
| SCHENKER XMG Pro 16 Studio (Mid 24) | |
| Nubia RedMagic Titan 16 Pro | |
| Przeciętny NVIDIA GeForce RTX 4060 Laptop GPU (55.6 - 63.4, n=5) | |
| Średnia w klasie Gaming (28.5 - 73.7, n=7, ostatnie 2 lata) | |
| 2560x1440 Very High Preset AA:T | |
| SCHENKER XMG Pro 16 Studio (Mid 24) | |
| Nubia RedMagic Titan 16 Pro | |
| Przeciętny NVIDIA GeForce RTX 4060 Laptop GPU (41.1 - 47.7, n=3) | |
| Średnia w klasie Gaming (22.7 - 56.1, n=5, ostatnie 2 lata) | |
| 2560x1440 Very High Preset + Quality DLSS | |
| SCHENKER XMG Pro 16 Studio (Mid 24) | |
| Średnia w klasie Gaming (63.6 - 74.2, n=3, ostatnie 2 lata) | |
| Nubia RedMagic Titan 16 Pro | |
| Przeciętny NVIDIA GeForce RTX 4060 Laptop GPU (n=1) | |
| The First Descendant | |
| 1920x1080 Ultra Preset | |
| SCHENKER XMG Pro 16 Studio (Mid 24) | |
| Nubia RedMagic Titan 16 Pro | |
| Przeciętny NVIDIA GeForce RTX 4060 Laptop GPU (67.6 - 69.4, n=3) | |
| Średnia w klasie Gaming (15.4 - 80, n=5, ostatnie 2 lata) | |
| 2560x1440 Ultra Preset | |
| SCHENKER XMG Pro 16 Studio (Mid 24) | |
| Średnia w klasie Gaming (43.7 - 51.2, n=3, ostatnie 2 lata) | |
| Nubia RedMagic Titan 16 Pro | |
| Przeciętny NVIDIA GeForce RTX 4060 Laptop GPU (43.5 - 43.7, n=2) | |
| 2560x1440 Ultra Preset + Ultra Ray Tracing + DLSS Quality | |
| SCHENKER XMG Pro 16 Studio (Mid 24) | |
| Średnia w klasie Gaming (43.3 - 51.8, n=2, ostatnie 2 lata) | |
| Nubia RedMagic Titan 16 Pro | |
| Przeciętny NVIDIA GeForce RTX 4060 Laptop GPU (n=1) | |
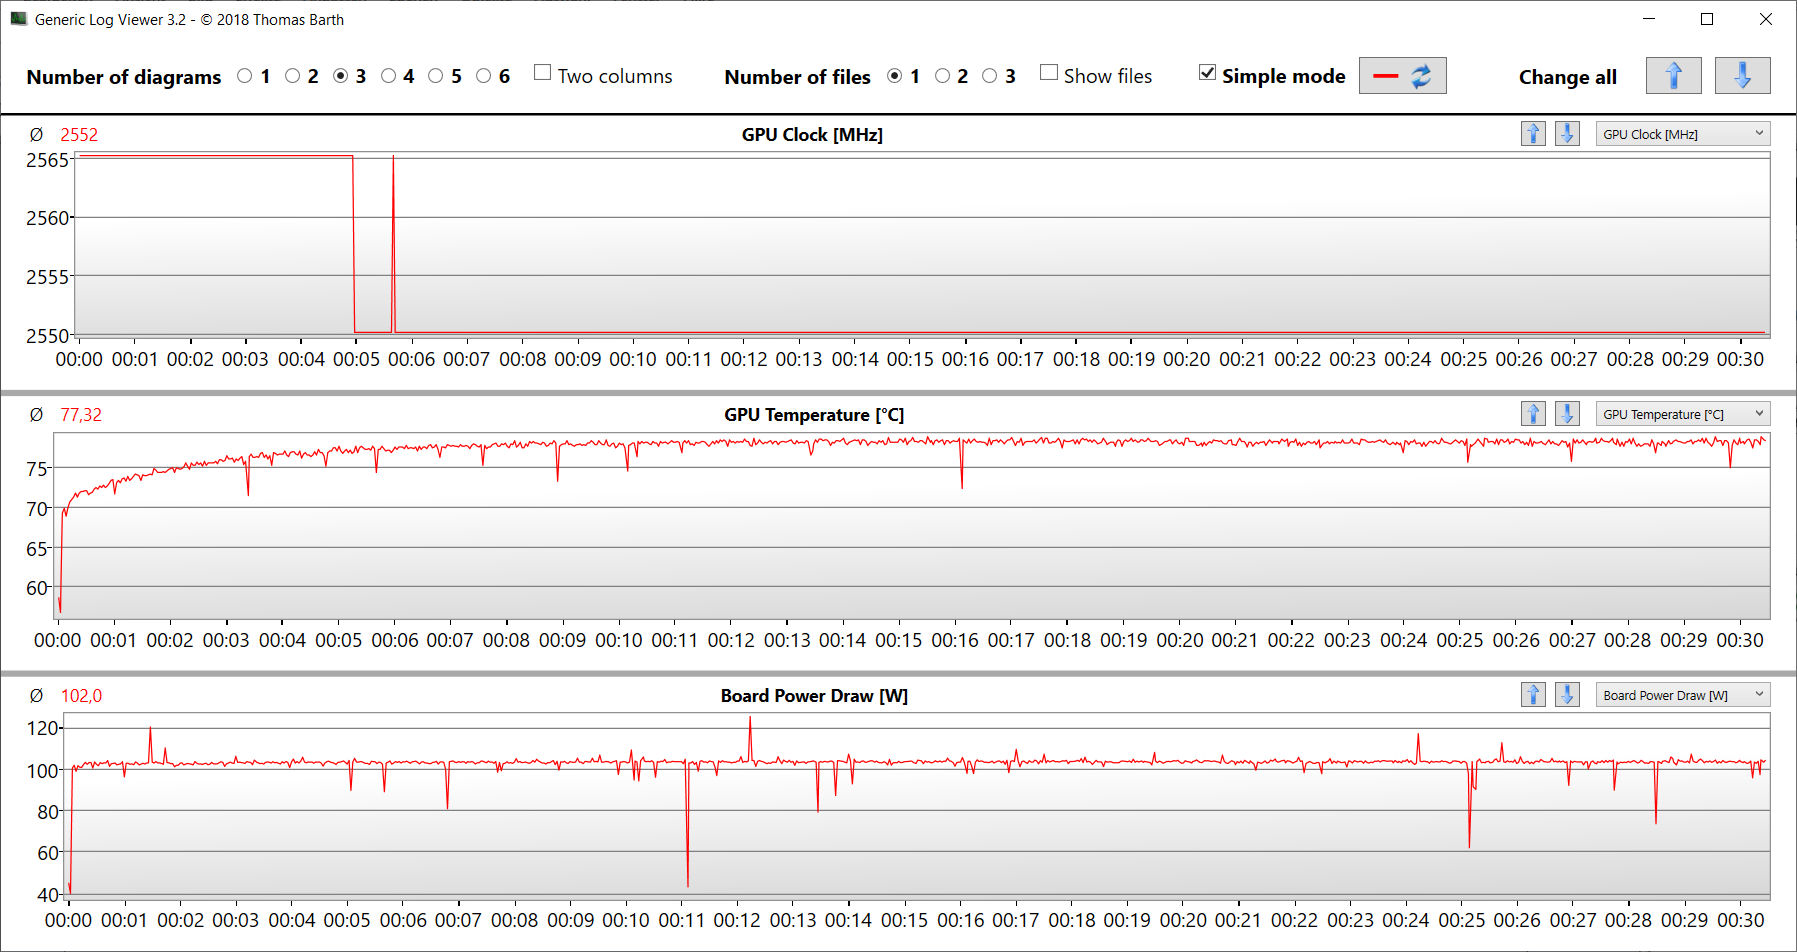
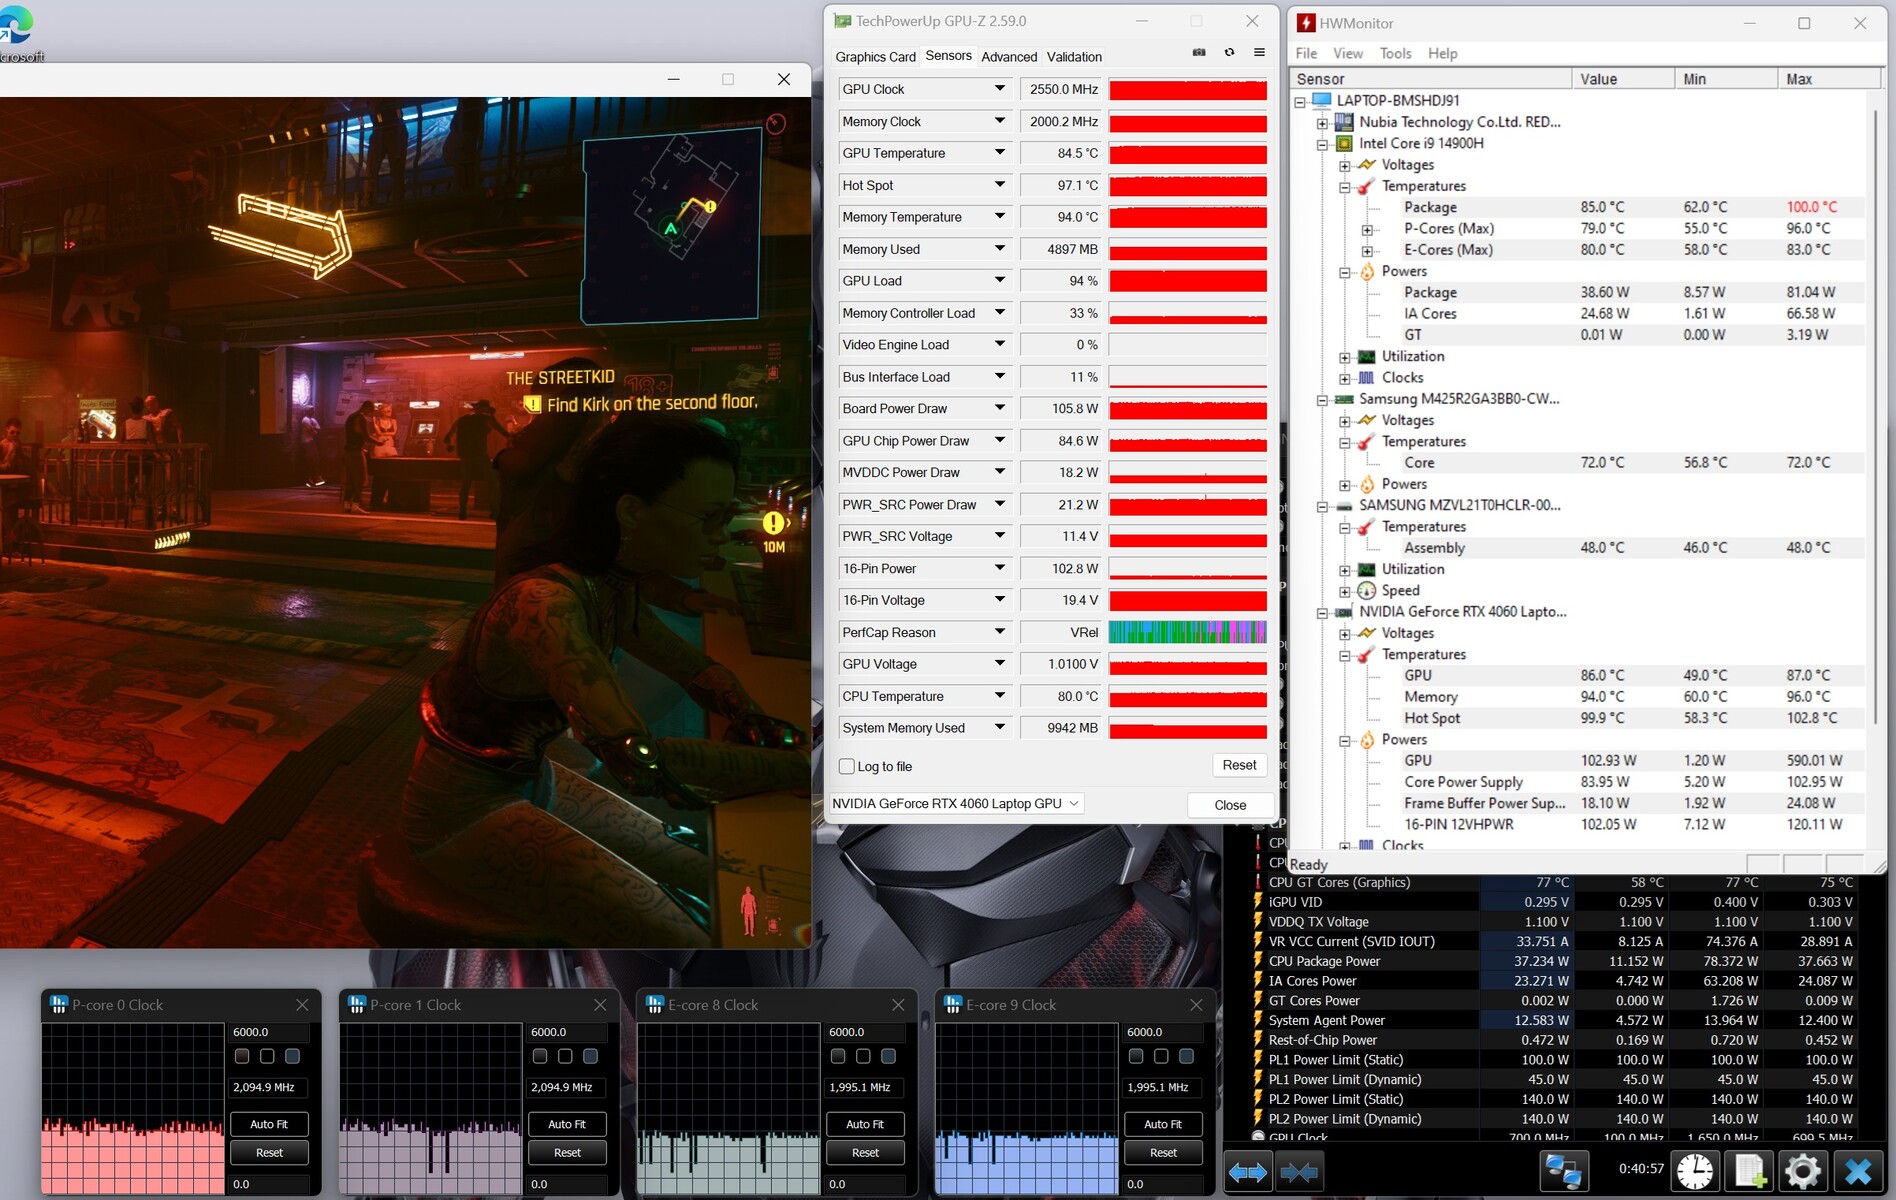
Cyberpunk 2077 Phantom Liberty zapewniał nieco zmienną liczbę klatek na sekundę na dość stabilnym poziomie podczas naszego 30-minutowego testu (maksymalne ustawienia, FHD). Nie odnotowaliśmy zauważalnego spadku wydajności.
Cyberpunk 2077 ultra FPS diagram
| low | med. | high | ultra | QHD DLSS | QHD FSR | QHD | |
|---|---|---|---|---|---|---|---|
| GTA V (2015) | 186.1 | 184 | 177.7 | 118.4 | 89.3 | ||
| Dota 2 Reborn (2015) | 206 | 170.9 | 160.2 | 146.9 | |||
| Final Fantasy XV Benchmark (2018) | 199.7 | 146 | 105.4 | 76.9 | |||
| X-Plane 11.11 (2018) | 167 | 142.8 | 117.2 | ||||
| Strange Brigade (2018) | 480 | 277 | 219 | 189.2 | 126.9 | ||
| Baldur's Gate 3 (2023) | 140.3 | 110.8 | 97.5 | 96.5 | 65.9 | ||
| Cyberpunk 2077 2.2 Phantom Liberty (2023) | 121.4 | 101.1 | 86.2 | 74.7 | 46.9 | ||
| Dragon's Dogma 2 (2024) | 71.9 | 67.7 | 52.9 | ||||
| Ghost of Tsushima (2024) | 91.3 | 86.8 | 78.2 | 63.4 | 63.6 | 47.7 | |
| F1 24 (2024) | 243 | 225 | 175.8 | 58.8 | 36.7 | ||
| The First Descendant (2024) | 159 | 100.9 | 80.6 | 69.4 | 43.7 | ||
| Once Human (2024) | 164.8 | 132.9 | 108.3 | 94.2 | 76.5 | 62.3 |
Emisje - za głośno, za gorąco
Emisja hałasu
Titan nie jest bynajmniej cicho pracującym laptopem. Nawet w trybie bezczynności dwa wentylatory są stale słyszalne. Cyberpunk sprawił, że poziom ten wzrósł do głośnych 50 dB(A)( trybzrównoważony ) lub jeszcze głośniejszych 53 dB(A)( trybgamingowy ). Tryb biurowy zaowocował tylko nieco bardziej umiarkowaną wartością 47 dB(A). Wentylatory są cichsze w trybie pracy na akumulatorze i od czasu do czasu stoją w miejscu.
Hałas
| luz |
| 35 / 36 / 40 dB |
| obciążenie |
| 49 / 52 dB |
 | ||
30 dB cichy 40 dB(A) słyszalny 50 dB(A) irytujący |
||
min: | ||
| Nubia RedMagic Titan 16 Pro NVIDIA GeForce RTX 4060 Laptop GPU, i9-14900HX, Samsung PM9A1 MZVL21T0HCLR | Lenovo Legion Pro 5 16IRX9 G9 NVIDIA GeForce RTX 4060 Laptop GPU, i7-14700HX, Samsung PM9A1 MZVL21T0HCLR | HP Victus 16 (2024) NVIDIA GeForce RTX 4060 Laptop GPU, i7-14700HX, Kioxia XG8 KXG80ZNV512G | Acer Predator Helios Neo 16 (2024) NVIDIA GeForce RTX 4070 Laptop GPU, i7-14700HX, Samsung PM9A1a MZVL21T0HDLU | SCHENKER XMG Pro 16 Studio (Mid 24) NVIDIA GeForce RTX 4070 Laptop GPU, i9-14900HX, Samsung 990 Pro 1 TB | Gigabyte G6X 9KG (2024) NVIDIA GeForce RTX 4060 Laptop GPU, i7-13650HX, Gigabyte AG450E1024-SI | |
|---|---|---|---|---|---|---|
| Noise | 17% | 13% | 10% | 5% | 5% | |
| wyłączone / środowisko * | 26 | 23 12% | 25 4% | 25.2 3% | 25 4% | 26 -0% |
| Idle Minimum * | 35 | 23 34% | 28 20% | 27.8 21% | 28 20% | 30 14% |
| Idle Average * | 36 | 23 36% | 29 19% | 32 11% | 31 14% | 32 11% |
| Idle Maximum * | 40 | 25 37% | 33 17% | 29.6 26% | 35 12% | 35 12% |
| Load Average * | 49 | 45.18 8% | 45 8% | 45.2 8% | 52 -6% | 51 -4% |
| Cyberpunk 2077 ultra * | 50 | 52.69 -5% | 53 -6% | |||
| Load Maximum * | 52 | 53.13 -2% | 48 8% | 55.8 -7% | 52 -0% | 54 -4% |
| Witcher 3 ultra * | 43 | 51 |
* ... im mniej tym lepiej
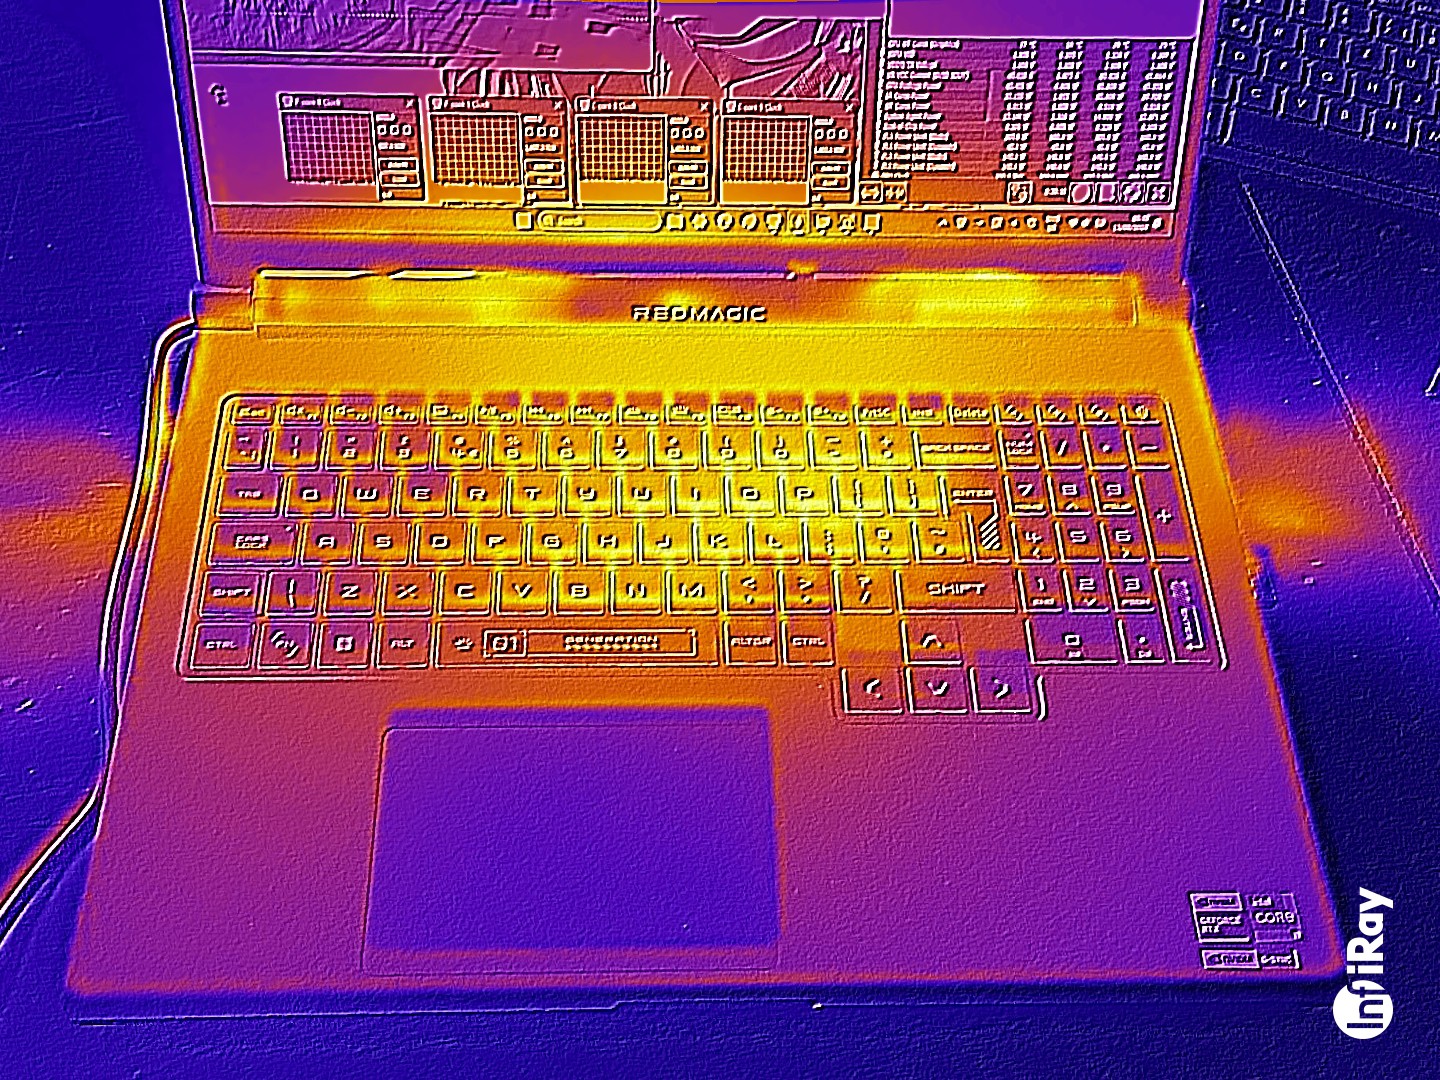
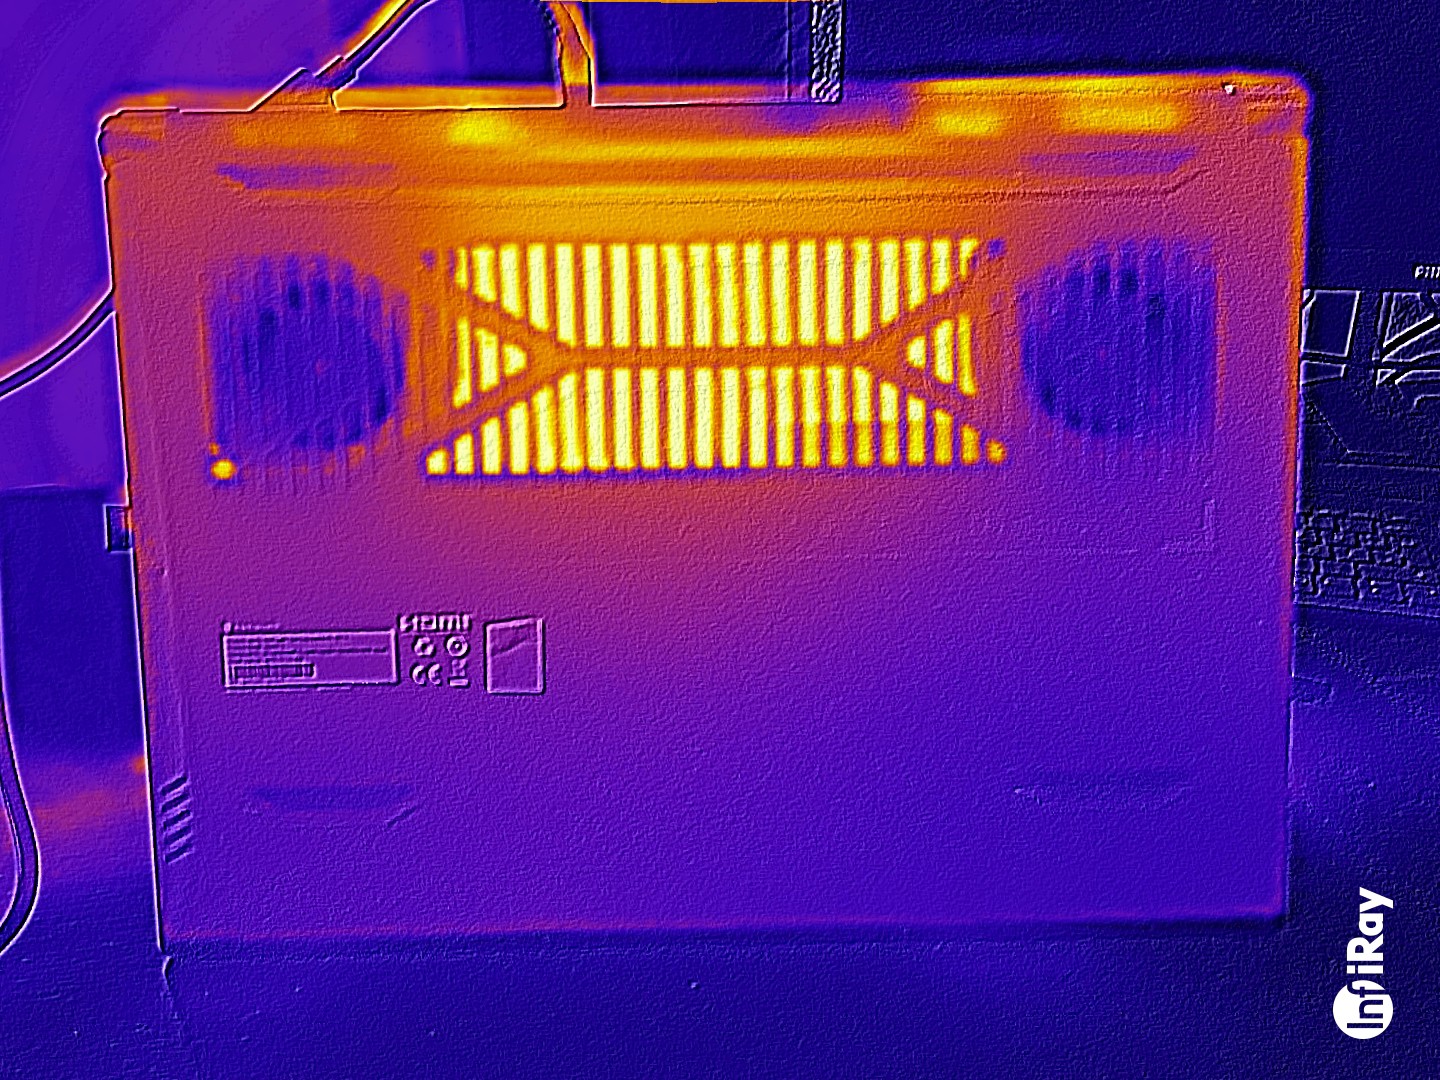
Temperatura
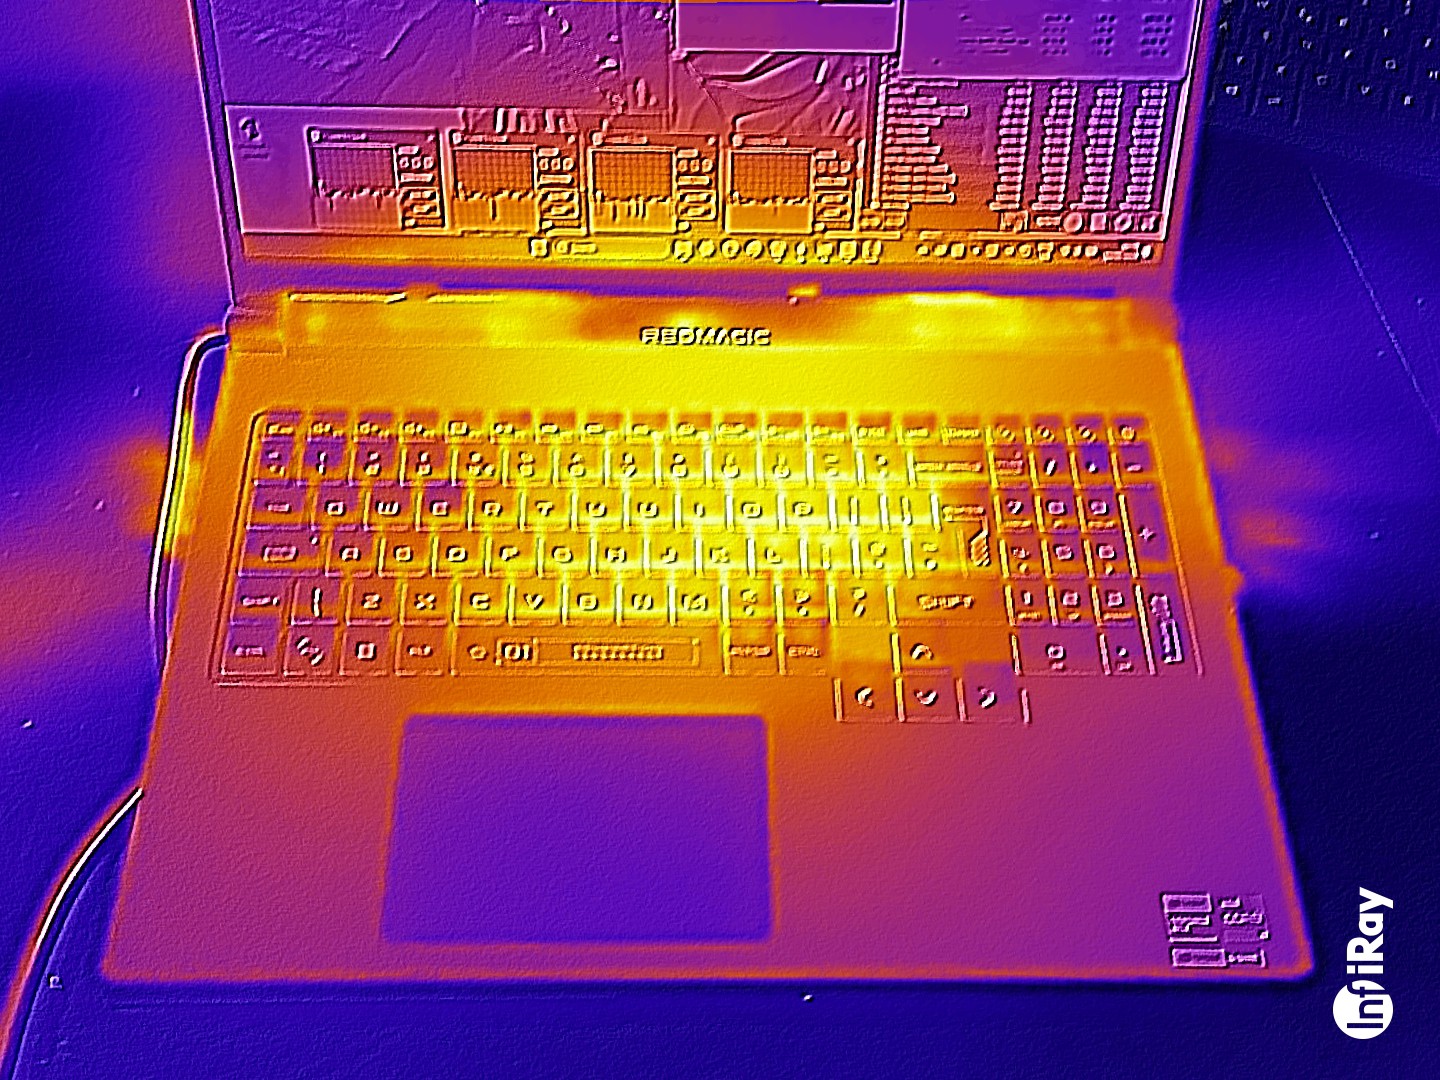
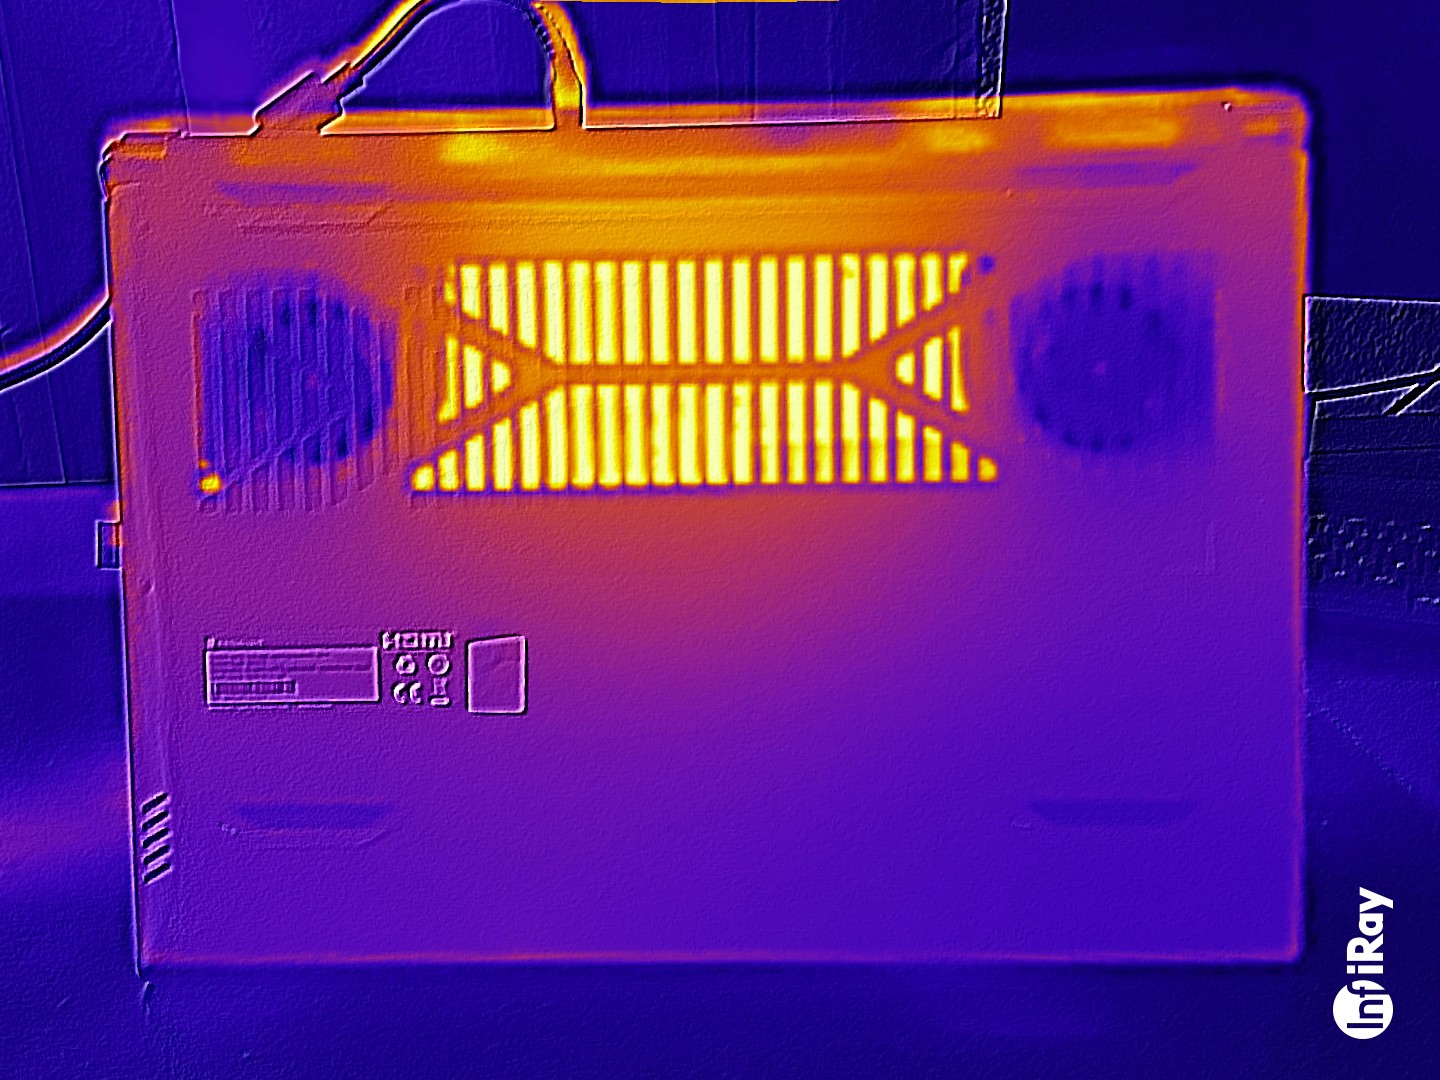
Laptop znacznie się nagrzewa pod obciążeniem: Cyberpunk 2077 i test warunków skrajnych spowodowały temperatury powyżej 50 stopni Celsjusza w niektórych momentach. Temperatury podpórki pod nadgarstki były czasami prawie zbyt wysokie. Odnotowaliśmy również wartości powyżej średniej w trybie bezczynności.
(-) Maksymalna temperatura w górnej części wynosi 50 °C / 122 F, w porównaniu do średniej 40.4 °C / 105 F , począwszy od 21.2 do 68.8 °C dla klasy Gaming.
(-) Dno nagrzewa się maksymalnie do 58 °C / 136 F, w porównaniu do średniej 43.2 °C / 110 F
(+) W stanie bezczynności średnia temperatura górnej części wynosi 30.4 °C / 87 F, w porównaniu ze średnią temperaturą urządzenia wynoszącą 33.9 °C / ### class_avg_f### F.
(-) 3: The average temperature for the upper side is 45.1 °C / 113 F, compared to the average of 33.9 °C / 93 F for the class Gaming.
(-) Podpórki pod nadgarstki i touchpad mogą się bardzo nagrzać w dotyku, maksymalnie do 40 °C / 104 F.
(-) Średnia temperatura obszaru podparcia dłoni w podobnych urządzeniach wynosiła 28.9 °C / 84 F (-11.1 °C / -20 F).
| Nubia RedMagic Titan 16 Pro Intel Core i9-14900HX, NVIDIA GeForce RTX 4060 Laptop GPU | Lenovo Legion Pro 5 16IRX9 G9 Intel Core i7-14700HX, NVIDIA GeForce RTX 4060 Laptop GPU | HP Victus 16 (2024) Intel Core i7-14700HX, NVIDIA GeForce RTX 4060 Laptop GPU | Acer Predator Helios Neo 16 (2024) Intel Core i7-14700HX, NVIDIA GeForce RTX 4070 Laptop GPU | SCHENKER XMG Pro 16 Studio (Mid 24) Intel Core i9-14900HX, NVIDIA GeForce RTX 4070 Laptop GPU | Gigabyte G6X 9KG (2024) Intel Core i7-13650HX, NVIDIA GeForce RTX 4060 Laptop GPU | |
|---|---|---|---|---|---|---|
| Heat | -9% | 13% | -3% | -13% | 6% | |
| Maximum Upper Side * | 50 | 50 -0% | 50 -0% | 58 -16% | 51 -2% | 41 18% |
| Maximum Bottom * | 58 | 57 2% | 50 14% | 45.2 22% | 66 -14% | 43 26% |
| Idle Upper Side * | 31 | 36 -16% | 25 19% | 31.1 -0% | 35 -13% | 32 -3% |
| Idle Bottom * | 32 | 39 -22% | 26 19% | 37.2 -16% | 39 -22% | 37 -16% |
* ... im mniej tym lepiej
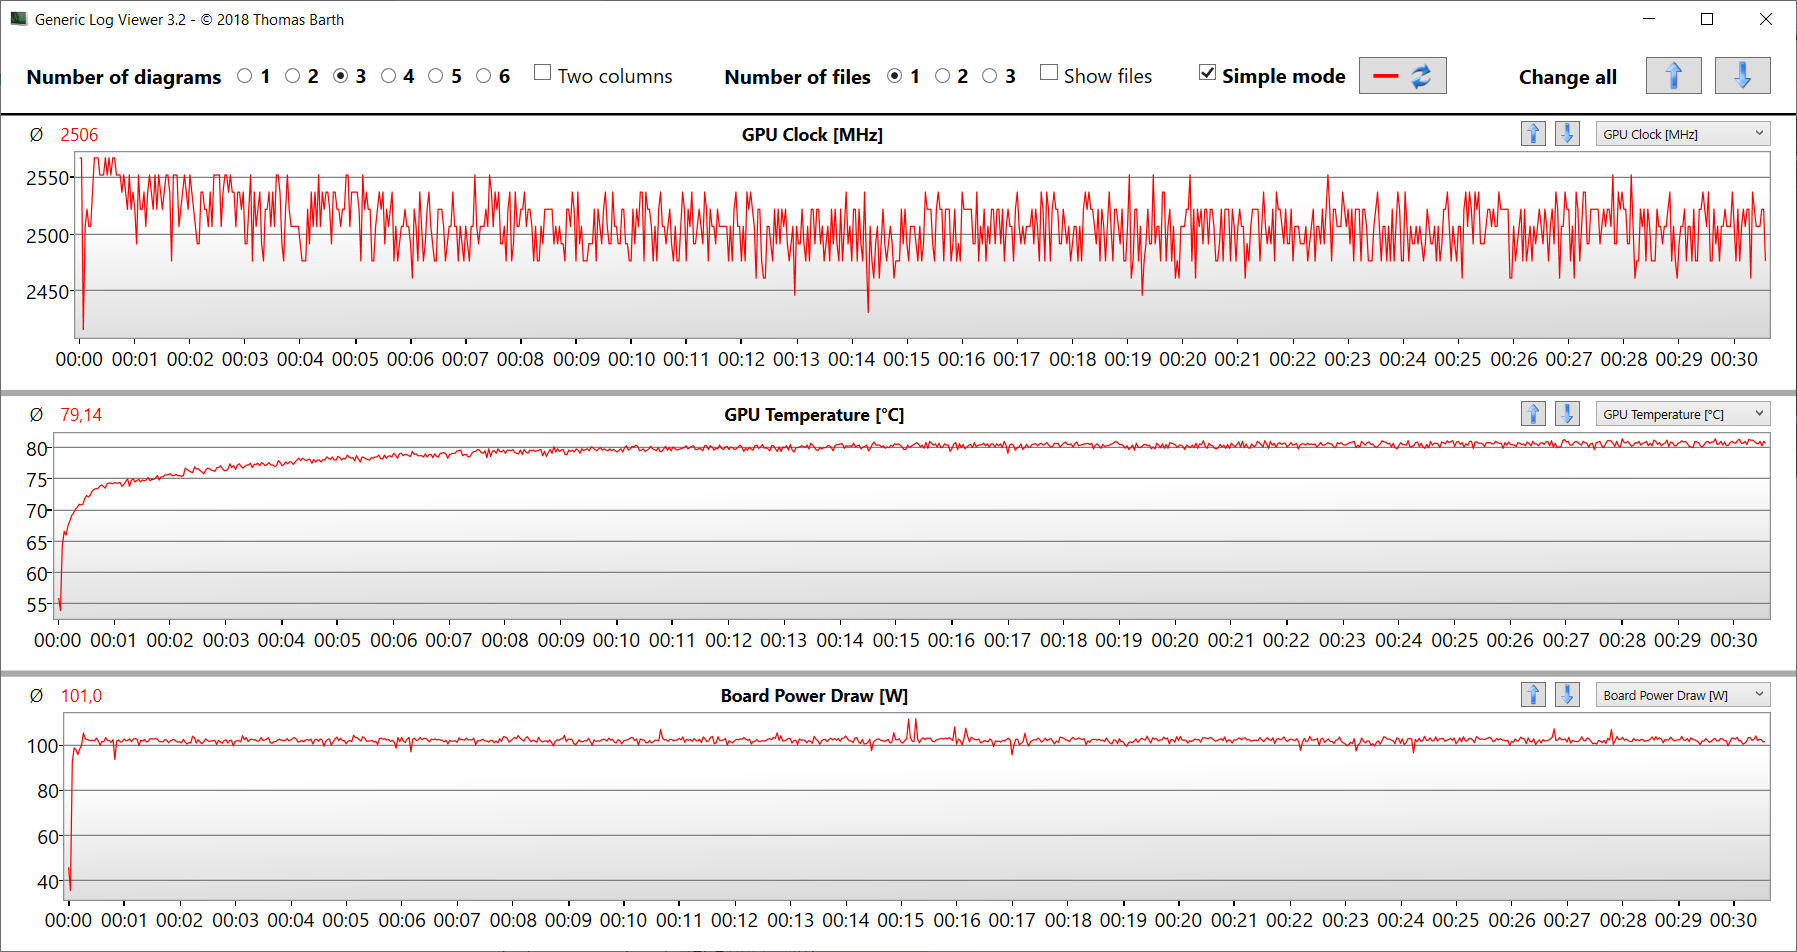
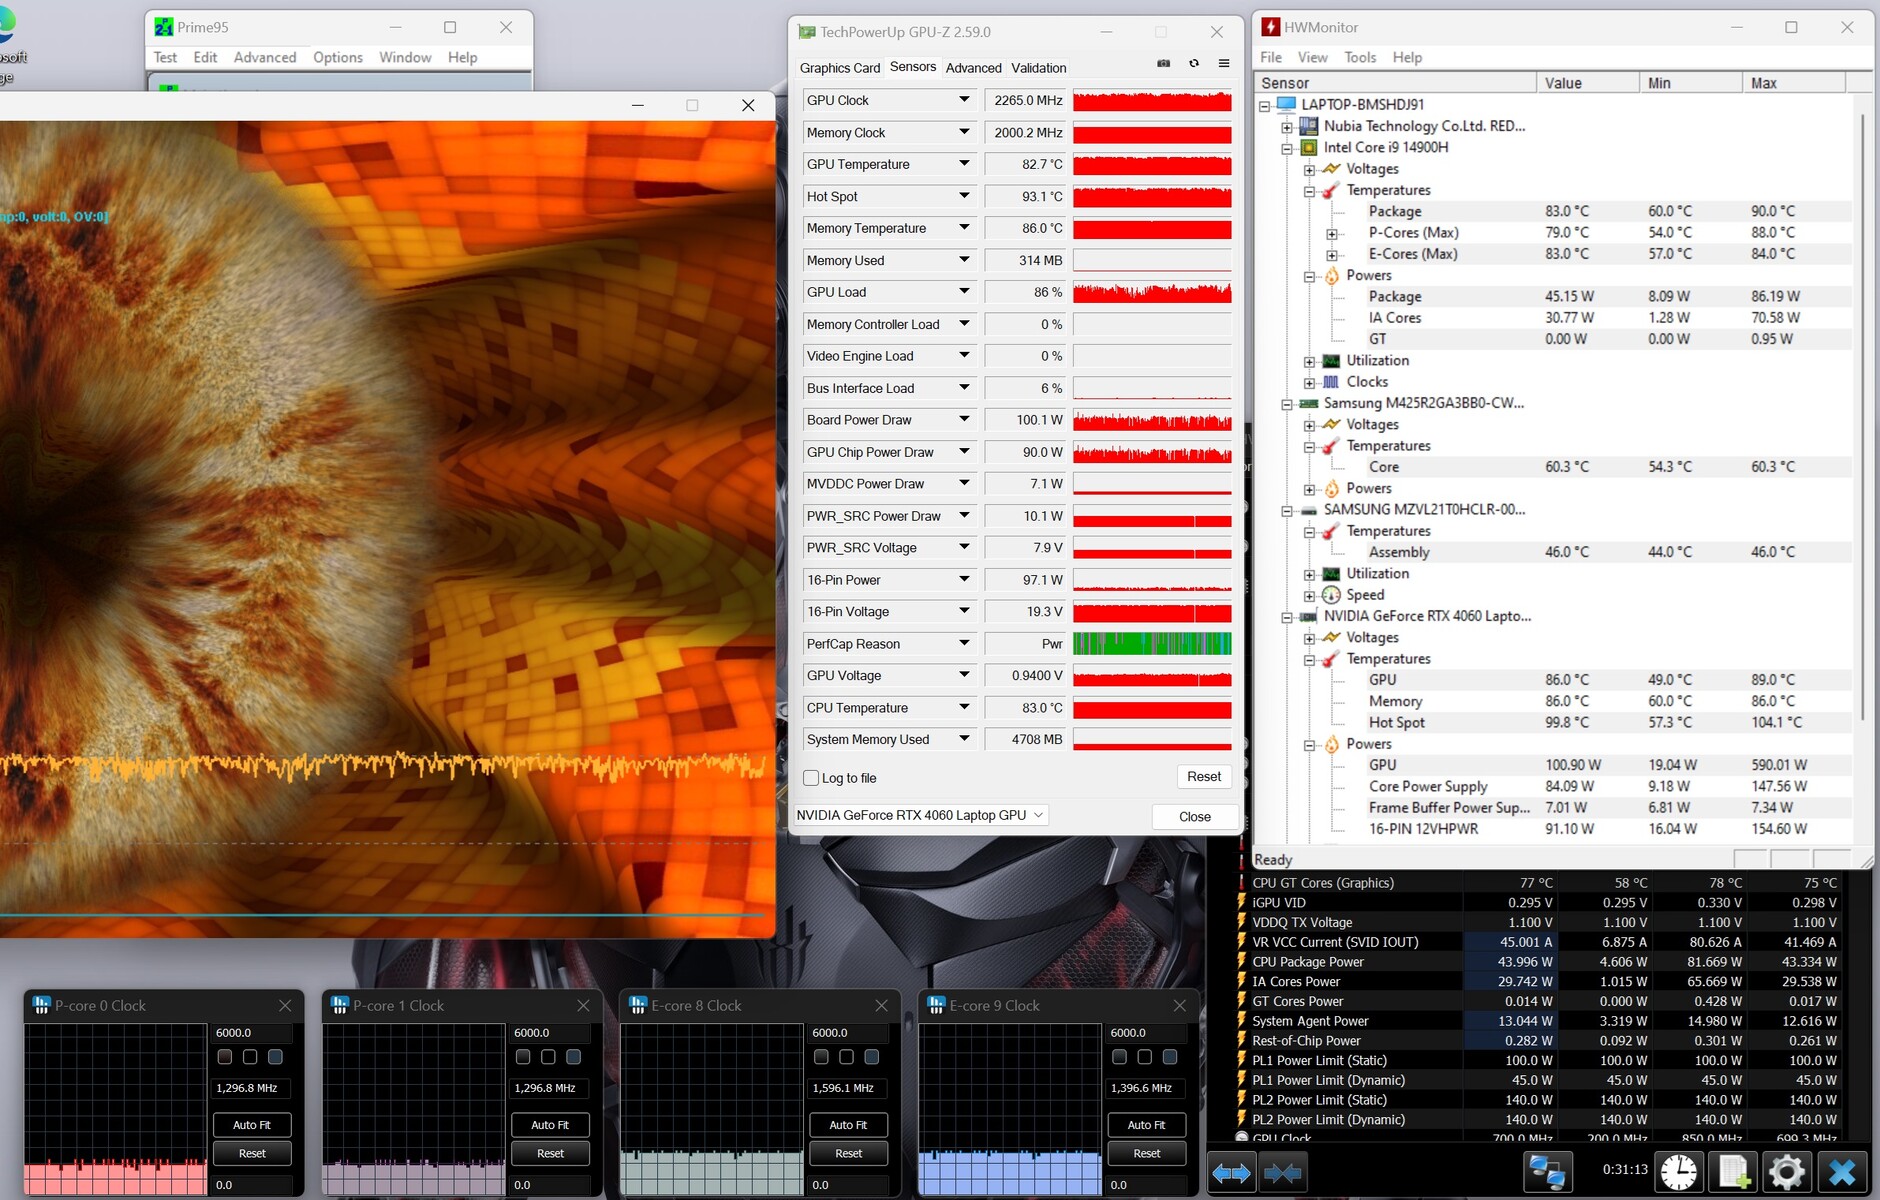
Test warunków skrajnych
Ekstremalny scenariusz testu obciążeniowego (Prime95 i Furmark w trybie ciągłym) sprawdził stabilność systemu pod pełnym obciążeniem. Procesor pracował z wysokim taktowaniem na początku testu, ale następnie był dławiony do wartości poniżej 2 GHz. GPU pracował z pełną mocą.
Głośniki
Głośniki stereo generują ogólnie całkiem przyzwoity dźwięk. Bas mógłby być nieco bardziej wyrazisty.
Nubia RedMagic Titan 16 Pro analiza dźwięku
(+) | głośniki mogą odtwarzać stosunkowo głośno (84 dB)
Bas 100 - 315 Hz
(±) | zredukowany bas - średnio 14.3% niższy od mediany
(±) | liniowość basu jest średnia (11.3% delta do poprzedniej częstotliwości)
Średnie 400 - 2000 Hz
(+) | zbalansowane środki średnie - tylko 1.8% od mediany
(+) | średnie są liniowe (4.9% delta do poprzedniej częstotliwości)
Wysokie 2–16 kHz
(+) | zrównoważone maksima - tylko 2.7% od mediany
(+) | wzloty są liniowe (5.4% delta do poprzedniej częstotliwości)
Ogólnie 100 - 16.000 Hz
(+) | ogólny dźwięk jest liniowy (11.5% różnicy w stosunku do mediany)
W porównaniu do tej samej klasy
» 9% wszystkich testowanych urządzeń w tej klasie było lepszych, 3% podobnych, 88% gorszych
» Najlepszy miał deltę 6%, średnia wynosiła ###średnia###%, najgorsza wynosiła 132%
W porównaniu do wszystkich testowanych urządzeń
» 6% wszystkich testowanych urządzeń było lepszych, 2% podobnych, 92% gorszych
» Najlepszy miał deltę 4%, średnia wynosiła ###średnia###%, najgorsza wynosiła 134%
Lenovo Legion Pro 5 16IRX9 G9 analiza dźwięku
(±) | głośność głośnika jest średnia, ale dobra (77.13 dB)
Bas 100 - 315 Hz
(-) | prawie brak basu - średnio 18.3% niższa od mediany
(±) | liniowość basu jest średnia (12% delta do poprzedniej częstotliwości)
Średnie 400 - 2000 Hz
(±) | wyższe średnie - średnio 6.9% wyższe niż mediana
(+) | średnie są liniowe (4.9% delta do poprzedniej częstotliwości)
Wysokie 2–16 kHz
(+) | zrównoważone maksima - tylko 4.5% od mediany
(±) | liniowość wysokich wartości jest średnia (9.5% delta do poprzedniej częstotliwości)
Ogólnie 100 - 16.000 Hz
(±) | liniowość ogólnego dźwięku jest średnia (21.6% różnicy w stosunku do mediany)
W porównaniu do tej samej klasy
» 76% wszystkich testowanych urządzeń w tej klasie było lepszych, 5% podobnych, 19% gorszych
» Najlepszy miał deltę 6%, średnia wynosiła ###średnia###%, najgorsza wynosiła 132%
W porównaniu do wszystkich testowanych urządzeń
» 58% wszystkich testowanych urządzeń było lepszych, 7% podobnych, 34% gorszych
» Najlepszy miał deltę 4%, średnia wynosiła ###średnia###%, najgorsza wynosiła 134%
Zarządzanie energią - Titan 16 zapewnia przeciętne czasy pracy
Zużycie energii
Pobór mocy jest normalny dla zainstalowanego sprzętu. Cyberpunk 2077 i test warunków skrajnych zostały uruchomione przy stałym zużyciu energii. Moc zasilacza (280 W) jest wystarczająca.
| wyłączony / stan wstrzymania | |
| luz | |
| obciążenie |
|
Legenda:
min: | |
| Nubia RedMagic Titan 16 Pro i9-14900HX, NVIDIA GeForce RTX 4060 Laptop GPU | Lenovo Legion Pro 5 16IRX9 G9 i7-14700HX, NVIDIA GeForce RTX 4060 Laptop GPU | HP Victus 16 (2024) i7-14700HX, NVIDIA GeForce RTX 4060 Laptop GPU | Acer Predator Helios Neo 16 (2024) i7-14700HX, NVIDIA GeForce RTX 4070 Laptop GPU | SCHENKER XMG Pro 16 Studio (Mid 24) i9-14900HX, NVIDIA GeForce RTX 4070 Laptop GPU | Gigabyte G6X 9KG (2024) i7-13650HX, NVIDIA GeForce RTX 4060 Laptop GPU | Przeciętny NVIDIA GeForce RTX 4060 Laptop GPU | Średnia w klasie Gaming | |
|---|---|---|---|---|---|---|---|---|
| Power Consumption | -4% | 16% | -23% | -35% | 17% | 21% | 7% | |
| Idle Minimum * | 16 | 13.7 14% | 9 44% | 26.7 -67% | 31 -94% | 12 25% | 11.5 ? 28% | 13.4 ? 16% |
| Idle Average * | 19 | 17.7 7% | 15 21% | 24.4 -28% | 33 -74% | 13 32% | 16 ? 16% | 18.9 ? 1% |
| Idle Maximum * | 27 | 18.5 31% | 23 15% | 32.7 -21% | 41 -52% | 27 -0% | 20.3 ? 25% | 26.3 ? 3% |
| Load Average * | 123 | 124 -1% | 123 -0% | 122.1 1% | 114 7% | 105 15% | 92.9 ? 24% | 102.7 ? 17% |
| Cyberpunk 2077 ultra external monitor * | 174.2 | 224 -29% | 196.8 -13% | |||||
| Cyberpunk 2077 ultra * | 184.3 | 229 -24% | 218 -18% | |||||
| Load Maximum * | 240 | 297 -24% | 241 -0% | 241 -0% | 250 -4% | 210 12% | 210 ? 12% | 244 ? -2% |
| Witcher 3 ultra * | 143.7 | 190.6 | 167.8 |
* ... im mniej tym lepiej
Power consumption Cyberpunk / stress test
Power consumption with external monitor
Czas trwania
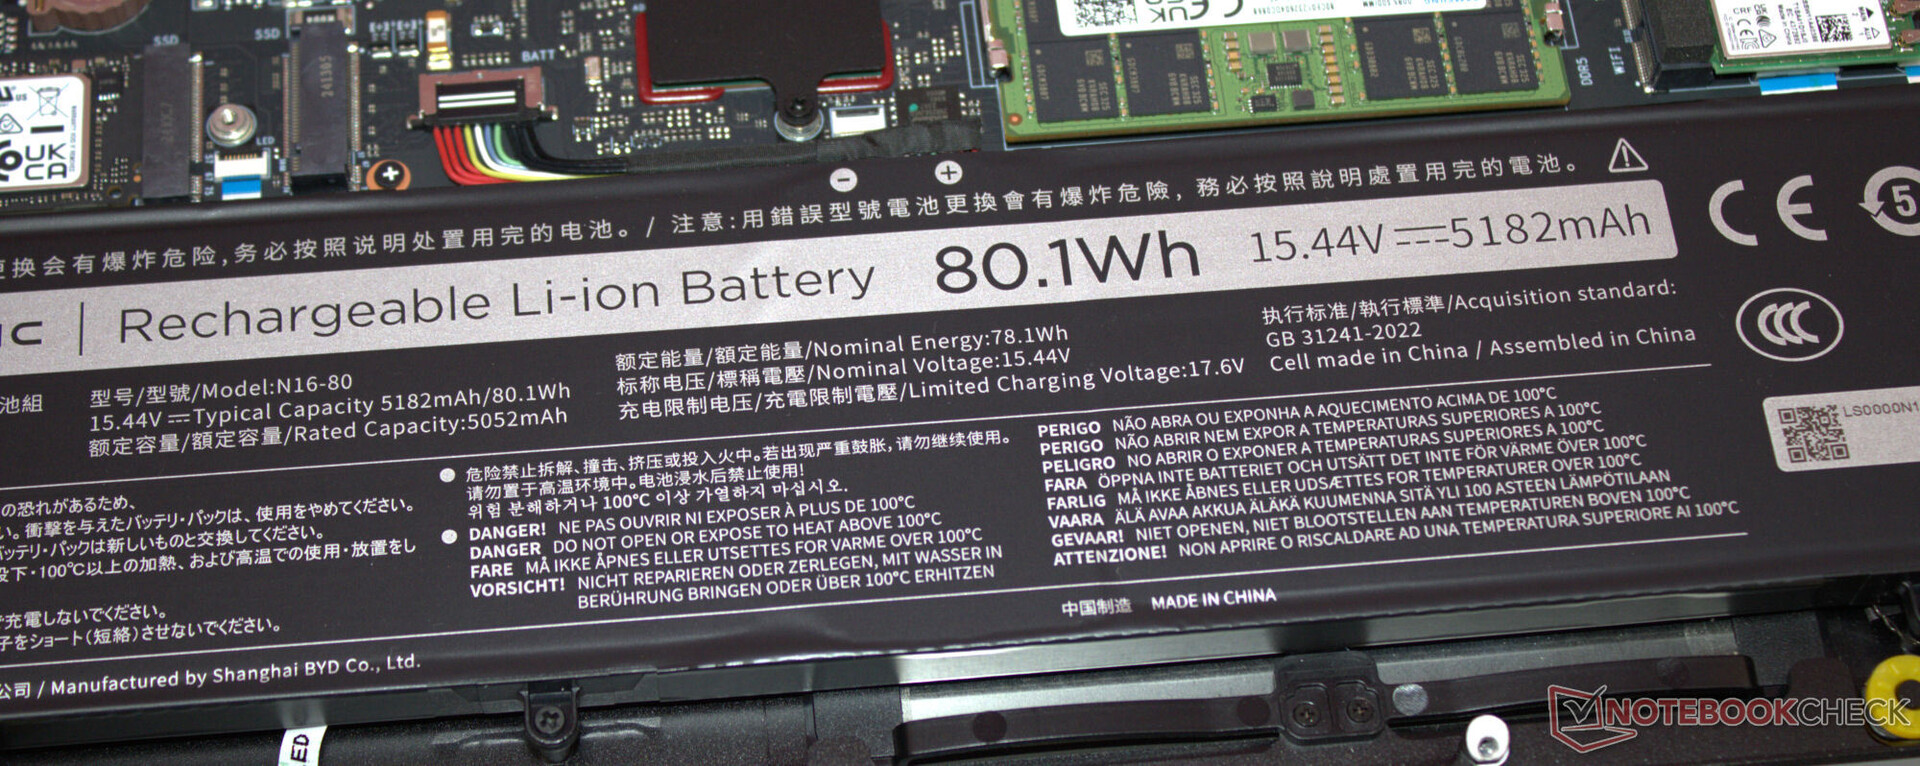
16-calowe urządzenie osiągnęło czasy pracy na poziomie 4:40 h podczas testu WiFi (dostęp do stron internetowych za pomocą skryptu) i 5:16 h podczas testu wideo (krótki film Big Buck Bunny (kodowanie H.264, FHD) w pętli) - nie są to rewelacyjne wartości. Niektórzy konkurenci działają znacznie dłużej.
| Nubia RedMagic Titan 16 Pro i9-14900HX, NVIDIA GeForce RTX 4060 Laptop GPU, 80.1 Wh | Lenovo Legion Pro 5 16IRX9 G9 i7-14700HX, NVIDIA GeForce RTX 4060 Laptop GPU, 80 Wh | HP Victus 16 (2024) i7-14700HX, NVIDIA GeForce RTX 4060 Laptop GPU, 83 Wh | Acer Predator Helios Neo 16 (2024) i7-14700HX, NVIDIA GeForce RTX 4070 Laptop GPU, 90.61 Wh | SCHENKER XMG Pro 16 Studio (Mid 24) i9-14900HX, NVIDIA GeForce RTX 4070 Laptop GPU, 73 Wh | Gigabyte G6X 9KG (2024) i7-13650HX, NVIDIA GeForce RTX 4060 Laptop GPU, 73 Wh | Średnia w klasie Gaming | |
|---|---|---|---|---|---|---|---|
| Czasy pracy | 16% | 83% | -16% | 20% | 69% | 28% | |
| Reader / Idle | 481 | 356 -26% | 585 ? 22% | ||||
| H.264 | 316 | 312 -1% | 242 -23% | 447 ? 41% | |||
| WiFi v1.3 | 280 | 308 10% | 511 83% | 227 -19% | 337 20% | 474 69% | 387 ? 38% |
| Load | 76 | 105 38% | 79 4% | 84.5 ? 11% |
Za
Przeciw
Werdykt - miejsce na poprawę
A Core i9-14900HX i GeForce RTX 4060 zapewniają rozgrywkę w rozdzielczości QHD przy ustawieniach od wysokich do maksymalnych. Zainstalowany sprzęt nie wykorzystuje w pełni swojego potencjału, gdyż pamięć RAM działa w trybie jednokanałowym. Zaleca się zainstalowanie drugiego modułu pamięci.
Debiutancki produkt Nubii robi to, do czego został zaprojektowany: Płynnie przenosi gry na ekran. Ale konkurencja nie musi mieć powodów do obaw.
Jego wartości emisyjne są niezwykle rozczarowujące: Laptop wytwarza (zbyt) dużo hałasu w całym zakresie obciążenia - a ponadto bardzo się nagrzewa. Z drugiej strony, jasny, wiernie odwzorowujący kolory ekran IPS (16 cali, 2560 x 1600 pikseli, 240 Hz, G-Sync, DCI-P3) o przyjaznych dla użytkownika proporcjach 16:10 zrobił na nas dobre wrażenie.
Żywotność baterii laptopa nie powali nikogo na kolana. Można by oczekiwać (nieco) więcej od laptopa do gier z baterią 80 Wh. Przynajmniej jego zainstalowany port USB-C (Thunderbolt 4) obsługuje Power Delivery (i tryb DP Alt). Oznacza to, że nie trzeba zawsze nosić ze sobą nieporęcznego, firmowego zasilacza.
Jeden fakt, który powinni Państwo wziąć pod uwagę przed zakupem urządzenia: W przeciwieństwie do uznanych producentów, takich jak Acer, Lenovo czy HP, Nubia tak naprawdę nie jest obecna na całym świecie. W rezultacie nie jest możliwe oszacowanie, jak będzie wyglądać sytuacja w zakresie dostaw części zamiennych, wsparcia i napraw.
Cena wynosząca 1699 USD z pewnością nie przemawia na korzyść laptopa: Dla przykładu, niemal identyczna konfiguracja Acer Predator Helios Neo 16 (z wyjątkiem pamięci RAM, która ma 32 GB zamiast 16 GB) kosztuje obecnie tylko 1350 USD. Inną alternatywą może być XMG Pro 16 Studio (Mid 24). Cena porównywalnej wersji tego urządzenia wynosi około 2000 USD (z Windows 11) lub 1950 USD (bez Windows jako systemu operacyjnego).
Cena i dostępność
Nubia RedMagic Titan 16 Pro jest dostępny od 29.08.2024 r. i można go kupić za 1 699 USD za pośrednictwem sklepu RedMagic.
Proszę zauważyć: Niedawno zaktualizowaliśmy nasz system oceny i wyniki wersji 8 nie są porównywalne z wynikami wersji 7. Więcej informacji znajdą Państwo na stronie http://www.notebookcheck.net/Our-new-rating-system-v8-explained-Lower-but-more-realistic-scores-together-with-sustainability-assessment.853123.0.html.
Nubia RedMagic Titan 16 Pro
- 21/08/2024 v8
Sascha Mölck
 Total Sustainability Score:
 Przezroczystość
Wyboru urządzeń do recenzji dokonuje nasza redakcja. Próbka testowa została udostępniona autorowi jako pożyczka od producenta lub sprzedawcy detalicznego na potrzeby tej recenzji. Pożyczkodawca nie miał wpływu na tę recenzję, producent nie otrzymał też kopii tej recenzji przed publikacją. Nie było obowiązku publikowania tej recenzji. Nigdy nie przyjmujemy rekompensaty ani płatności w zamian za nasze recenzje. Jako niezależna firma medialna, Notebookcheck nie podlega władzy producentów, sprzedawców detalicznych ani wydawców.
Tak testuje Notebookcheck
Każdego roku Notebookcheck niezależnie sprawdza setki laptopów i smartfonów, stosując standardowe procedury, aby zapewnić porównywalność wszystkich wyników. Od około 20 lat stale rozwijamy nasze metody badawcze, ustanawiając przy tym standardy branżowe. W naszych laboratoriach testowych doświadczeni technicy i redaktorzy korzystają z wysokiej jakości sprzętu pomiarowego. Testy te obejmują wieloetapowy proces walidacji. Nasz kompleksowy system ocen opiera się na setkach uzasadnionych pomiarów i benchmarków, co pozwala zachować obiektywizm.Price comparison

